University Committee on Planning and Budget Principal Authors: Christopher Newfield, Henning Bohn, Calvin Moore Current Budget Trends and The Future of the University of California May 2006 This report is available at http://www.universityofcalifornia.edu/senate/committees/ucpb/futures.report0506.pdf The Academic Council unanimously voted to receive this report for wide distribution to stimulate discussion of the issues it raises.

Welcome message from author
This document is posted to help you gain knowledge. Please leave a comment to let me know what you think about it! Share it to your friends and learn new things together.
Transcript

University Committee
on Planning and Budget
Principal Authors: Christopher Newfield, Henning Bohn, Calvin Moore
Current Budget Trends and
The Future of the University of California
May 2006
This report is available at http://www.universityofcalifornia.edu/senate/committees/ucpb/futures.report0506.pdfThe Academic Council unanimously voted to receive this report for wide distribution to stimulate discussion of the issues it raises.

FORWARD
The University Committee on Planning and Budget prepared this report because short-term decisions about the University budget are having long-term impacts, and yet we know of no detailed analysis of their long term implications for the University. The report evaluates the long-term implications of the Higher Education Compact that now defines the basic budgetary relationship between the University and the Governor, as well as those of three other scenarios, varying from one based on a move to-ward further major reductions in state funding and increased privatiza-tion to one in which state support for the University is returned to higher level of state support that existed in 1990. The report tries to avoid advocating for the university or suggesting tac-tics for doing so. We do hope, however, to provide a credible analysis of the implications of different futures for the University that the faculty, administration, Regents, public, and public policy makers can use as a benchmark for realistic discussions of the future of the University of California and the future of higher education in California.
Stanton Glantz, Chair Christopher Newfield, Vice Chair Calvin Moore (B) Patricia Conrad (D) Eric Stanbridge (I) Malcolm Gordon (LA) Roger Bales (M) Stephen Cullenberg (R) Stanley Mendoza (SD) Norm Oppenheimer (SF) Henning Bohn (SB) Paul Koch (SC)
UC “Futures”
i

TABLE OF CONTENTS
UC “Futures”
ii
page
Executive Summary 1
Background 3
The State Budget Context: A Long Term Funding Decline 4
UC Responds: From Cuts to the Compact 11
The Cuts 11
UC Responds 12
This Report’s Questions 14
Projecting the Compact 16
For Comparison: Holding Funding at 2001-2 Levels 16
General Fund Contribution Per Student 18
Student Fees 19
Financial Aid and Student Access 19
Student-Faculty Ratio 21
Graduate Education and Research 21
Employee Salaries 22
Fundraising Requirements 22
Summary 23
Alternative Scenarios 25
Scenario 2: Restored 2001 Pathway 25
Student Fees 25
Employee Salaries 26
Scenario 3: A Modified Master Plan 26
Student Fees 27
Graduate Education 27

UC “Futures”
iii
Page
Student-Faculty Ratios 28
Staff and Faculty Salaries 28
Private Fundraising 28
Scenario 4: A Public Funding Freeze 29
Revenue Shortfalls and Fundraising 30
Student Fees and Graduate Education 30
The Michigan Precedent 31
Conclusions 35
Appendices 37
Appendix A: Core UC Fund Model 37
Appendix B: The Master Plan of 1960 40
Appendix C: Comparative Charts 43
Endnotes 47
Enrollments and Quality 32
Employee Salaries 33
Page 1 Document Title Page 1 UC “Futures”
This report explores the implications of current state budget trends for the size and quality of UC’s programs and thus, by implication, for the University’s contribution to the state. At the Academic Senate’s Committee for Planning and Budget (UCPB), we have shared a perception that this financial decline is leading towards a reduction in the scope and quality of the University, that this reduction may soon be irreversible, and that this reduction has been neither chosen nor managed with an eye toward a recovery of the full range of resources appropriate to UC’s multiple public missions. After evaluating the budgetary implications of the Higher Education Compact, the report considers three alternative budget scenarios. This report has a limited scope. We are not making a case for the University’s value to the state or suggesting how that case should be made. We have restricted ourselves to depicting budgetary trends past, present, and to come. We evaluate the adequacy of the university’s budget in term of its historical levels of operation and not in relation to the state’s full range of funding priorities. UC’s budgetary situation raises the following questions.
• What are the implications of the Compact for Higher Education that the University agreed to with the Governor in May 2004 for UC’s near-term operations?
• If the Compact does not provide sufficient funding from the state for core operations, can the gap be filled in part by private funding? If so, what kinds of private funding would work? How much additional private funding would be required? What new combinations of public and private should be explored?
• Are there alternative budget scenarios that might sustain the university more effectively than our ostensible current choice between the Compact and continued decline?
The primary conclusions of our analysis are as follows: 1. The Compact does not stop the University’s financial decline or return its
condition to that prior to the most recent fiscal crisis in California. The Compact does not stop the consequent weakening of the University’s contribution to the people of California. The Compact freezes public funding of the University at its 2001-2004 recession levels. The state share of UC Core Funds stays at about 45% (down from about 60% in 2001-2. The Compact required regular tuition increases at least as fast as the rate of income growth in California and commits the University to expanded private fundraising in an effort to maintain current levels of quality—levels that, by the time the Compact went into effect, had already fallen from the levels of 2001.
Executive Summary
Page 2 UC “Futures”
To return to the 2001 pathway from the Compact via private fundraising would require an additional $1.35 billion per year in unrestricted private gifts (or nearly $30 billion in additional unrestricted endowment). Following the Compact will continue to put pressure on access, diversity, instructional quality, and graduate-based research. The Compact will not allow the Regents to achieve their goal of competitive faculty and staff salaries in a ten-year time frame. 2. The minimum pathway for a return to the University’s recent levels of quality and public function is a scenario in which UC receives the same share of state personal income that it received in 2001 (0.29%). Access and quality would recover to that level and the Regents’ goal of competitive salaries for faculty and staff would be realized. The costs of this scenario are within recent state budgetary parameters. 3. A scenario in which UC returns to the funding norms that supported its historic operations and hence service to California is one in which UC recovers its 1990 budgetary trajectory. The educational momentum generated by the earlier investment in UC fueled the economic growth in high tech industries in the 1990s; failing to renew that investment at appropriate levels may dampen or block economic growth to come. Though 1990 seems far removed in budgetary time, this does not change the fact that the other scenarios, which rely more heavily on private funds, cannot support the University’s historic scope, quality, and contribution to the people of the state. 4. The fourth scenario, the Public Funding Freeze, would alter the UC system beyond recognition. This scenario cannot be ruled out. The state continues to carry a structural deficit, remains politically polarized, has expensive needs in health and human services, and awaits new budgetary surprises such as unfunded health care obligations for retired state employees. These problems may encourage some to move UC toward a “high-tuition/high-aid” model in tandem with aggressive private fundraising, increased industry partnerships, and expanded sales and services. This fourth scenario, however, cannot actually be achieved with private fundraising: to obtain the billion dollars that will be lost by comparison with the Compact, and to obtain it in unrestricted payouts, the University would need to raise $25 billion in unrestricted gifts. To reach the 2001-02 funding level, more than $54 billion would be needed. Alternately, tuition increases big enough to fill the gap would shrink enrollments (?) and, at the same time, reduce the quality of the university’s student body. The overall UC system would continue in name but not in reality, as the most prestigious campuses draw on a national student pool and collect large amounts of non-resident tuition while other campuses struggle with diminished resources, fewer programs, and reduced research capacity. Wasteful intercampus competition may arise, in part in the form of the budgetary fragmentation that the Master Plan had in its time brought to a close. Since undergraduate instruction is disproportionately dependent on the state General Fund, such changes would seriously damage the assumption of a high-quality curriculum for all qualified students. The Public Funding Freeze would end the UC system as we know it.
Page 3 UC “Futures”
On October 26, 2005, the Academic Council endorsed University Committee on Planning and Budget’s (UCPB) “Resolution on Maintaining the Public Status of the University of California.” The resolution notes that the University was established as a public trust, but that both the University and its students are increasingly dependent on private funds to maintain quality instruction and research. It also observes that the Higher Education Compact commits the University to “continue to seek additional private sources and maximize other fund sources available to the University to support basic programs.” The Academic Council resolution asks that the University “evaluate the effects on the instructional, research and public service missions of increased reliance on private funds, including the long term implications of the Compact, and report the results of this evaluation to the Council and appropriate Senate committees.” As part of this larger University effort to assess budgetary prospects, UCPB, as the Academic Senate’s cognizant body on planning and budget matters, has developed this assessment of trends in University funding, with particular emphasis on the University’s Core Budget (Appendix A). UCPB’s overall purpose in undertaking this report is to encourage that these choices be made openly, consciously, and on the basis of a careful weighing of the evidence. Our study has coincided with a growing awareness that colleges and universities in the United States are at a crossroads. While the top level of higher education is wealthier and perhaps better than ever, broader educational achievement is faltering. One leading expert has summarized the situation as follows: “College participation rates have been stagnant since the mid 1990s, low income and minority students are increasingly excluded from 4-year institutions and are increasingly concentrated in public 2-year and proprietary institutions, the United States usually ranks last among the 30 OECD countries in gains in college participation rates since about 1990, and the gains in bachelor's degree attainment since 1980 have gone overwhelmingly to students born into the top quartile of family income (about $96,000 per year).” A recent report by a major higher education center concluded that “If current trends continue, the proportion of workers with high school diplomas and college degrees will decrease and the personal income of Americans will decline over the next 15 years.” California has typically seen itself as the great exception to such downward trends. After World War II, it developed a Master Plan for Higher Education which assumed, first, that talent was widely rather than narrowly distributed in the population and, second, that prosperity depended on educating everyone to the highest level they could manage. In recent years, however, California’s higher education system has been following rather than bucking national trends. For example, California is average among the states in rates of student persistence and completion of degrees, and is now 30th out of 50 in affordability.
Background
Page 4 UC “Futures”
This decline in funding and its accompanying threat to quality is occurring at a time when the state of California faces unprecedented social and economic challenges and is looking to higher education to provide many of the solutions. How the state will be able to maintain its stature as a world-leading knowledge economy is no longer clear to us. The University is at an important crossroads. Many observers believe that public universities must accept permanently reduced public provisions; they conclude that quality and perhaps even viability require permanent and steady increases in tuition charges, fundraising, and partnerships with the private sector. On the other hand, the costs of returning to the Master Plan’s vision of a low-fee university may be less than previously supposed, and the costs of moving further toward dependence on private funding may be difficult or even impossible to meet. UCPB does not treat any of these scenarios as foregone conclusions; this report assesses their relative implications for the university and, by implication, for the state. The State Budget Context: A Long-Term Funding Decline
The Master Plan for Higher Education of 1960 continues to define the basic relationships among California’s university systems (for an overview of the Master Plan, see Appendix B). But by the mid-2000s, when the University of California and the California State University system signed the Higher Education Compact with the Governor’s office, the parties had in practice set aside the Master Plan’s vision of nearly free higher education for all qualified citizens of the state. Much of this movement was caused by budgetary pressures, expressed in the following trends:
• The “tax revolt,” signaled most famously by Proposition 13 in 1978, had changed political attitudes towards public funding and reduced the proportion of per capital income that was available for public purposes. The share available for all systems of higher education, having risen from 0.4 percent of state personal income in 1960 to 1.3 percent in 1980, had fallen back to 0.75 percent by 2004.
• Other state services gained on higher education for a share of the reduced per capita general fund. As the size of California’s poor population grew, health and human services took a bigger slice of the government pie. K-12 education and some other programs were locked in through ballot measures, while tertiary education was not. Concerns about crime were used to support the unprecedented growth of the state prison system: by 2005, prisons consumed 8.2 percent of the state budget, or more than twice UC’s proportion of the general fund of just over 3.0 percent (all spending on higher education amounted to 11.5 percent of the general fund).
• Budgets reflected both polarization and gridlock stemming from structural problems with state government, including referendum-based budgetary lock-ins, term limits that reduced the experience level of the legislature, gerrymandering that increased the proportion of hard-liners in both parties, and a preponderance of wedge-issues served up to a racially, economically,
Page 5 UC “Futures”
and otherwise-fragmented electorate. • While well-organized political constituencies existed to support the growth
of K-12 education, health services, and prisons, the fragmented nature of the higher education systems (UC, CSU, and the community colleges) and their divided constituencies (students and their families, faculty, staff, administrators, the general public) prevented development of a strong lobby for higher education.
• The perception that UC’s fees were relatively low, and the well-established fact that a college education increases an individual’s lifetime earning potential, were accepted as reasons to use fee increases to make up for state support. At the same time, higher education’s ability to raise fees encouraged politicians to cut it more deeply than other functions that lacked this power.
• The University pursued a budget strategy of doing the best they could with whatever Governor was in power, accepting cuts in bad years and hoping to make them up in the good years. This was a rational strategy that has successfully minimized political risks. But in spite of the University’s best efforts, it may have created unrealistic expectations about the University’s capacity to absorb cuts and then never entirely make up for them.
• The University has also called for both solid public support and increased private funding without clarifying the extent to which private funding, including higher tuition, can replace public funding, or how a shift away from a high ratio of public funding has been affecting the quality and public impact of the University.
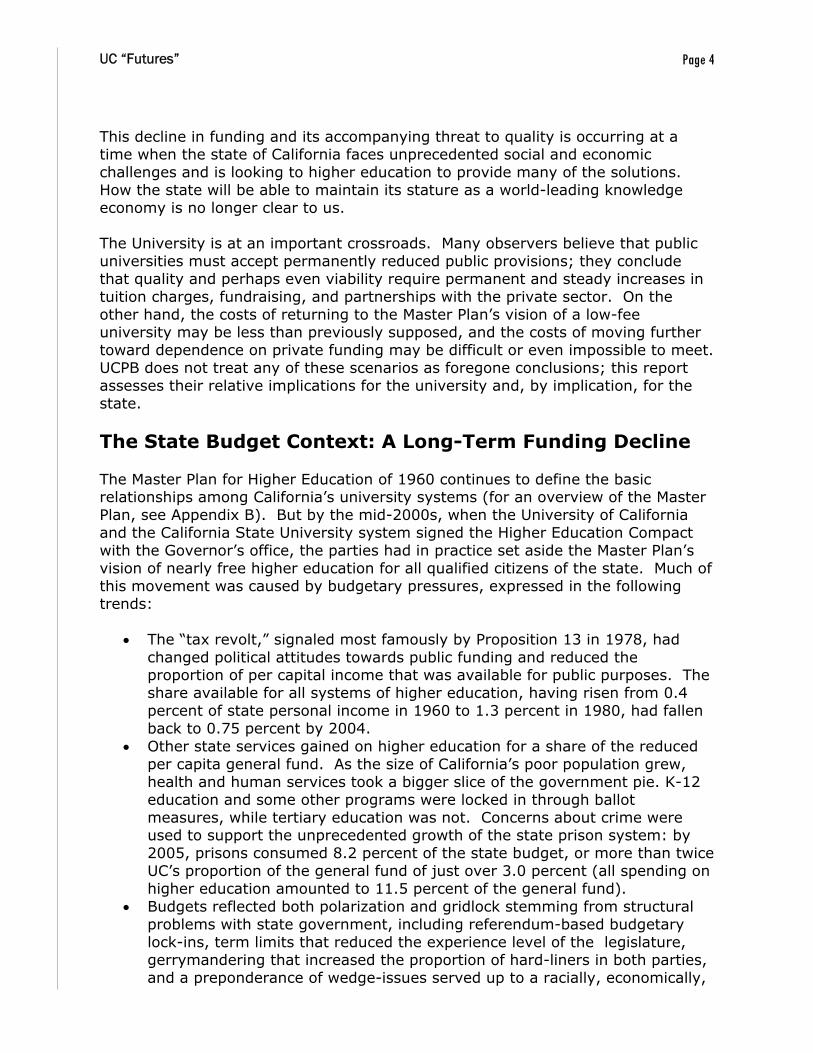
As a result of these budgetary, demographic, political, and analytical factors, higher education is the only major element of California’s public sector that has grown more slowly than the population, and where funding has declined (by 12% since 1984) on a per capita basis (Charts 1a and 1b). Such data offer useful information about the relative decline of funding for higher education. But how has this decline affected higher education’s day-to-day operations and
Chart 1a Chart 1b

Page 6 UC “Futures”
thus its contribution to the general public? In particular, how has this decline affected the University of California’s capacity to perform its functions? The following charts illustrate the extent of budgetary deterioration within the University itself. We have attempted to identify that portion of the UC budget that is available for general campus operations. We call this “UC Core Funds” (Appendix A; we will define this concept more precisely below.) State funding was about 70-80% of UC Core Funds as of 1985-86 (Chart 2a). Though it was not the first, a very substantial decline occurred during the economic recession of the early 1990s, when the state share of UC Core Funds fell below 60%. It is important to note that, despite some recovery, the state contribution as a share of UC Core Funds in the early 2000s did not recover to its level of the early 1990s. Though around the year 2000 full recovery did seem possible in the foreseeable future, it was at that point that state revenues suffered their second major downturn in a decade, as did the General Fund’s contribution to the UC budget. Since 2001-02, the state share of UC Core Funds has fallen below 50%, to 46% in 2005-06. As we will explain below, this is not 46% of UC’s overall budget (including health centers, contracts and grants, and national laboratories), but is 46% of that portion of the campus budgets that are directly concerned with the everyday educational mission.
State Funds for UC Operations as share of UC Core Funds
40.0%
50.0%
60.0%
70.0%
80.0%
1985-86 1987-88 1989-90 1991-92 1993-94 1995-96 1997-98 1999-00 2001-02 2003-04 2005-06
State Funds for UC Operations as share of UC Core Funds
Chart 2a: State Funds for UC Operations as Share of UC Core Funds
Page 7 UC “Futures”
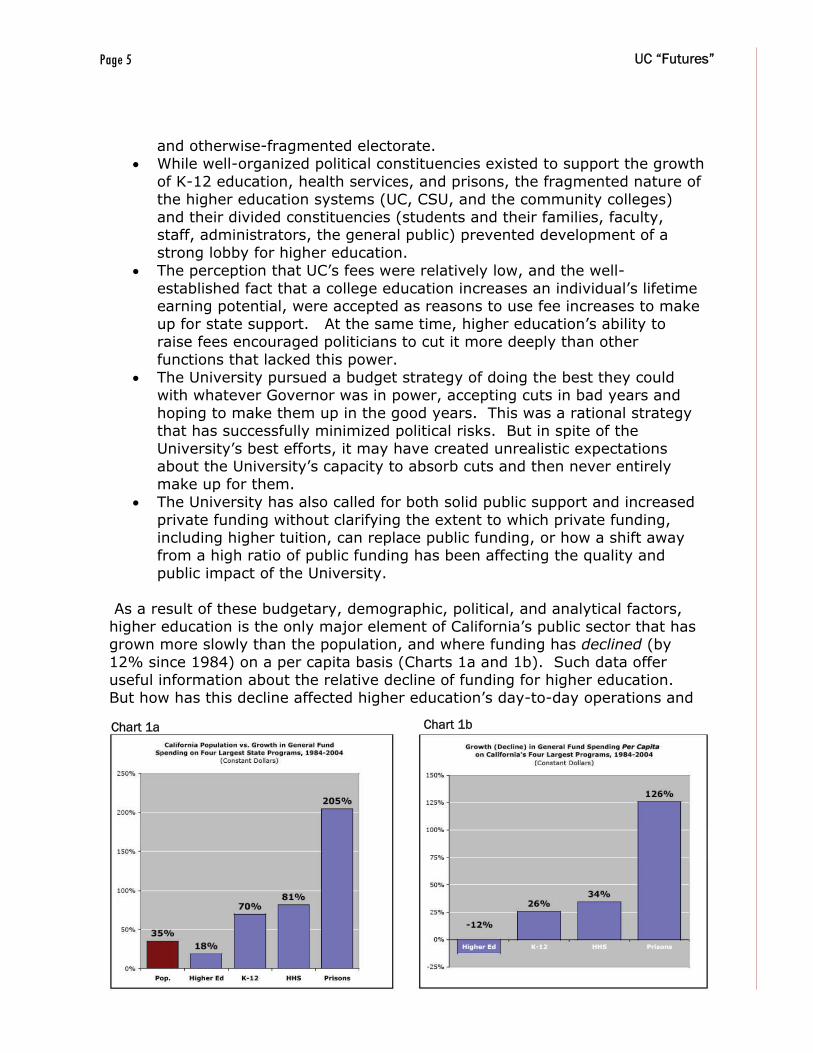
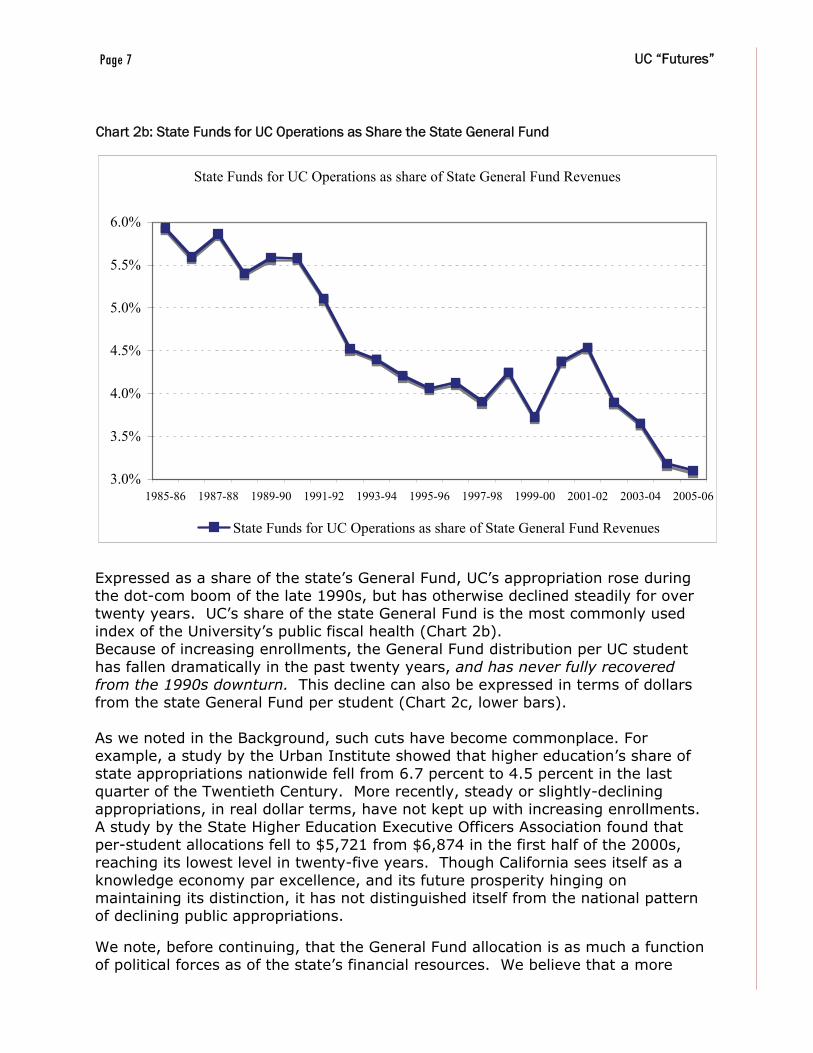
Expressed as a share of the state’s General Fund, UC’s appropriation rose during the dot-com boom of the late 1990s, but has otherwise declined steadily for over twenty years. UC’s share of the state General Fund is the most commonly used index of the University’s public fiscal health (Chart 2b). Because of increasing enrollments, the General Fund distribution per UC student has fallen dramatically in the past twenty years, and has never fully recovered from the 1990s downturn. This decline can also be expressed in terms of dollars from the state General Fund per student (Chart 2c, lower bars). As we noted in the Background, such cuts have become commonplace. For example, a study by the Urban Institute showed that higher education’s share of state appropriations nationwide fell from 6.7 percent to 4.5 percent in the last quarter of the Twentieth Century. More recently, steady or slightly-declining appropriations, in real dollar terms, have not kept up with increasing enrollments. A study by the State Higher Education Executive Officers Association found that per-student allocations fell to $5,721 from $6,874 in the first half of the 2000s, reaching its lowest level in twenty-five years. Though California sees itself as a knowledge economy par excellence, and its future prosperity hinging on maintaining its distinction, it has not distinguished itself from the national pattern of declining public appropriations. We note, before continuing, that the General Fund allocation is as much a function of political forces as of the state’s financial resources. We believe that a more
State Funds for UC Operations as share of State General Fund Revenues
3.0%
3.5%
4.0%
4.5%
5.0%
5.5%
6.0%
1985-86 1987-88 1989-90 1991-92 1993-94 1995-96 1997-98 1999-00 2001-02 2003-04 2005-06
State Funds for UC Operations as share of State General Fund Revenues
Chart 2b: State Funds for UC Operations as Share the State General Fund
Page 8 Document Title
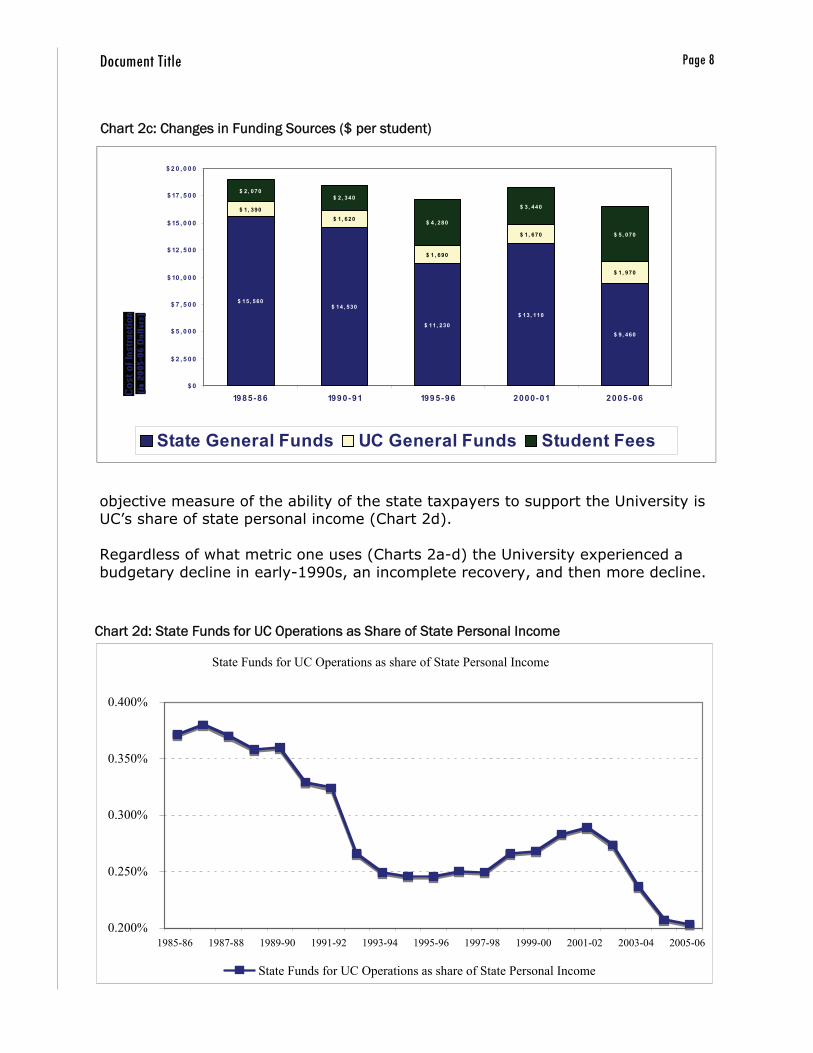
objective measure of the ability of the state taxpayers to support the University is UC’s share of state personal income (Chart 2d). Regardless of what metric one uses (Charts 2a-d) the University experienced a budgetary decline in early-1990s, an incomplete recovery, and then more decline.
State Funds for UC Operations as share of State Personal Income
0.200%
0.250%
0.300%
0.350%
0.400%
1985-86 1987-88 1989-90 1991-92 1993-94 1995-96 1997-98 1999-00 2001-02 2003-04 2005-06
State Funds for UC Operations as share of State Personal Income
$ 15, 560$ 14, 530
$ 11, 230
$ 13, 110
$ 9, 460
$ 1, 390$ 1, 620
$ 1, 690
$ 1, 670
$ 1, 970
$ 2, 070$ 2, 340
$ 4, 280
$ 3, 440
$ 5, 070
$ 0
$ 2 , 5 0 0
$ 5 , 0 0 0
$ 7 , 5 0 0
$ 10 , 0 0 0
$ 12 , 5 0 0
$ 15 , 0 0 0
$ 17 , 5 0 0
$ 2 0 , 0 0 0
1985-86 1990-91 1995-96 2000-01 2005-06
State General Funds UC General Funds Student Fees
Chart 2c: Changes in Funding Sources ($ per student)
Chart 2d: State Funds for UC Operations as Share of State Personal Income

Page 9 Document Title
The remainder of our analysis is based on calculations of UC’s budget in relation to state personal income, rather than in relation to the state General Fund. Two points in time (Chart 2d) will be particularly important to our exploration of alternative budget scenarios: the .29% UC share of state personal income that occurred in 2001-02 will serve as the starting point for Scenario 2, the “Restored 2001 Pathway” and the 0.36% UC share in 1987-88 will serve as the starting point for Scenario 3, the Modified Master Plan. California did enjoy a dot-com-related revenue boom in the late 1990s. UC’s budget began to grow again, and made up for some of the cuts suffered during the downturn of the early 1990s. There were three major areas of budgetary growth for UC: 1. windfall equity-related income taxes (via the state General Fund) 2. between 1990 and 2005, UC researchers increased their Contract and Grant
income by a factor of 2.3 in real dollars. 3. private philanthropy: annual pledges grew by a factor of 3.1 in real dollars.
We note two features of the late 1990s revenue streams. First, these three funding sources have different institutional effects. Private philanthropy and federal Contract and Grant funds are almost entirely earmarked for specific purposes: philanthropy is about 97% restricted, and C&G monies are available for general operations only in the form of a “tax” to support the indirect costs that the University incurs when it supports research, a tax known as Indirect Cost Recovery (ICR). (While we follow the general practice of treating ICR as unrestricted money, it is important to note that the grants that generate the ICR also generate costs that the ICR is supposed to pay.) This means that only General Fund revenues are fully available to fund campus operations. Secondly, state budgets expanded to absorb increased income tax revenues that were growing far more quickly than tax revenues in other states. Even the partial recovery from UC’s early 1990s budget cuts was supported by a tax revenue bubble. Without this bubble, UC would have experienced the relatively small increases typical of other states, where higher education’s share of state revenues barely budged. The downturn began in 2001-02, just as state general fund expenditures were approaching their 1990 levels. It also began not long after UC agreed to accommodate “Tidal Wave II” enrollment with only partial state funding of what amounted on several campuses to a greater than 40% increase in enrollments over a five year period. In the downturn, the first of the three sources of new UC money largely disappeared. By 2005, the second source, federal contracts and grants, had plateaued; as of this writing, all signs suggest that, with a few strategic exceptions, overall federal research funding will experience either steady state or a small decline in the coming years. Thus of the three major sources of the 1990s relative budgetary health, private philanthropy appeared to be sustainable over the long haul. But since only 3% of private giving is unrestricted, private philanthropy could not be used to replace a meaningful portion of the state general fund.

Page 10 UC “Futures”
Most discussions of California higher education focus on the boom-and-bust cycle of state revenues. Many observers conclude that what goes down will go up again, so that no real harm is done by short-term emergency-style cuts. Our analysis suggests that these budget cycles conceal a pronounced and unmistakable long-term decline in public support for the University of California in particular and public higher education in general. The recent cuts only add to a preexisting pattern: per-student General Fund expenditures have declined by about 35 percent since 1990, and by about 40 percent since 1985. In the period 1985-2005, the proportion of the overall UC budget that came from the state general fund was cut in half, from about 50% to about 25% of the overall university budget.

Page 11 UC “Futures”
The Cuts Budget cuts began mid-year in 2001-02, and continued through 2004-05. Overall the State appropriation to the University of California fell by 15% while enrollment grew by 19%. This means that state funding per UC student fell by approximately one-third in three years. The effect on the composition of UC revenues is in Chart 3.
Chart 3: Main Components of Core Funds ($mill)
Core Funds 2004-05
46.5%
27.4%
11.3%
4.5%
6.5% 3.8%
State Funds Fees & NRT ICR
Endowment Private Other
Core Funds 2001-02
61.8%16.0%
8.8%
4.7%
5.2%3.5%
State Funds Fees & NRT ICR
Endowment Private Other
Core Funds 2001-02
3279848
469
250275 187
State Funds Fees & NRT ICR
Endowment Private Other
Core Funds 2004-05
2615
1539
635
254365 214
State Funds Fees & NRT ICR
Endowment Private Other
Totals: $ 5,309 mill. $ 5,622 mill.
UC Responds: From Cuts to the Compact
Page 12 UC “Futures”
The components of UC Core Funds are:
State General Fund: this represents money appropriated to the University by the Legislature. It includes State General Fund appropriations (less any provision for revenue bond payments) and lottery funds. Core UC Funds: these include the State General Fund (as described above) plus • student fees (Education Fee, Registration Fee, Professional Degree Fee,
Summer session fees, nonresident tuition, but not campus based fees and health insurance fees),
• indirect cost recovery on grants and contracts (federal, state, and private ICR)
• endowment payout (including UC Regents and Campus Foundations), a portion of private support (excluding capital gifts, but including operations other than research)
• a miscellaneous category which includes some interest income on current accounts (STIP), endowment cost recovery, and administrative full cost recovery.
We have excluded extramurally funded research support. Although research is clearly a core function of the University, these funds were generated by individual faculty or groups of faculty and do not flow from the general fund. We also exclude income generated by Auxiliary Enterprises (e.g., housing and dining, intercollegiate athletics, University Extension, parking and transportation, etc.). We further exclude “other student fees” that are campus-specific, and, again, all hospital operations. See Appendix A for a full description of UC Core Funds. Chart 3 shows that changes in private funding, conventionally understood -- endowment payout (down slightly) and private gifts (up by one-fifth) -- did not come close to the scale of the shift from the General Fund to student fees. Instead, there was a direct trade-off between state funding declines and student fee increases. By 2004-05, the General Fund was paying for about three-quarters of what it had paid in 2001-02, while the share contributed by student fees had increased by one-third. UC Responds UC officials tried to reduce budgetary damage and restore at least some of the lost state funding through two major strategies. The first strategy, often described as “stop the bleeding,” came to be embodied in the Higher Education Compact between the Governor’s office, University of California, and California State University. Indeed, University leaders were convinced – reportedly by explicit threats from the Director of Finance -- that failure to make such an agreement with the Governor would lead to even larger
Page 13 UC “Futures”
cuts. The four most important features of the Compact are 1. acceptance of the large 2001-2004 cuts to the General Fund as the baseline
for future calculations (15 percent on a 19 percent enrollment growth, according to UCOP figures).
2. annual increases in state General Fund support for UC expenditures (3% in 2005-06 and 2006-07; 4% in 2007-08 through 2009-10)
3. funded enrollment growth (2.5% per year, or at least 5,000 additional students per year)
4. Student fee increases (with no corresponding reduction of state funds): undergraduate fees are to increase an average of 10% per year for 2004-07 (although the 2006-07 increase of 8% may be “bought out;” our scenarios assume that this buy out will take place); graduate fees are to increase an average of 13.3% per year for 2004-07; professional fees to rise to market comparisons (roughly doubled in nominal dollars from 2001-05).
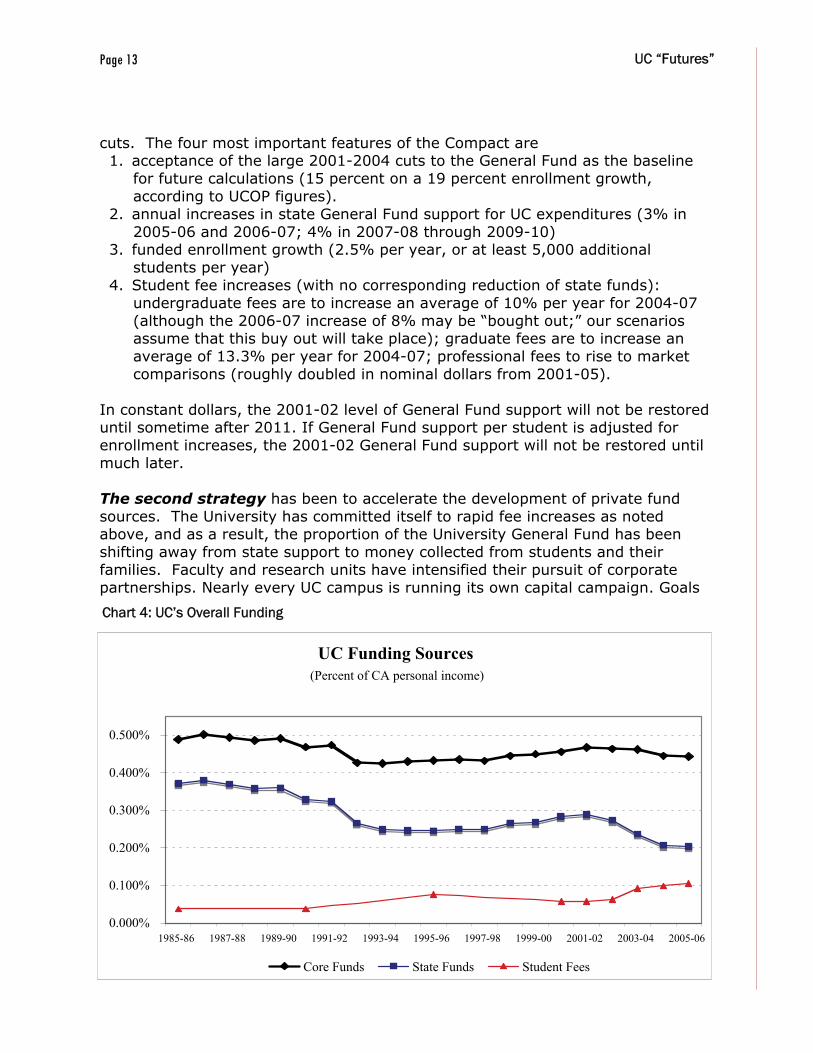
In constant dollars, the 2001-02 level of General Fund support will not be restored until sometime after 2011. If General Fund support per student is adjusted for enrollment increases, the 2001-02 General Fund support will not be restored until much later. The second strategy has been to accelerate the development of private fund sources. The University has committed itself to rapid fee increases as noted above, and as a result, the proportion of the University General Fund has been shifting away from state support to money collected from students and their families. Faculty and research units have intensified their pursuit of corporate partnerships. Nearly every UC campus is running its own capital campaign. Goals
UC Funding Sources (Percent of CA personal income)
0.000%
0.100%
0.200%
0.300%
0.400%
0.500%
1985-86 1987-88 1989-90 1991-92 1993-94 1995-96 1997-98 1999-00 2001-02 2003-04 2005-06
Core Funds State Funds Student Fees
Chart 4: UC’s Overall Funding

14
Page 14 UC “Futures”
range from $350 million at the Santa Barbara campus and $700 million at the San Diego campus to $2.6 billion at the Los Angeles campus (now approaching $3 billion in pledges). Efforts have been increased to attract donors to sponsored research, student financial aid, and many other areas of special needs. Chart 4’s top line, measuring “Core Funds,” shows that UC has managed to buffer much, but not all, of the decline in the share of the state’s financial resources (measured here as the overall personal income of the state’s residents) by replacing declining state General Funds (middle line) with student fees (lower line), as well as with other non-state sources not shown here. Even so, about 10% less of California’s personal income (0.45% vs. 0.50%) is devoted to supporting the University. This Report’s Questions As noted in the Background section, the budgetary situation we have been describing raise the following questions.
• What are the implications of the Compact for Higher Education for UC’s near-term operations?
• If the Compact does not provide sufficient funding from the state for core operations, can the gap be filled in part by private funding? If so, what kinds of private funding would work? How much additional private funding would be required? What new combinations of public and private should be explored?
• Are there alternative budget scenarios that might sustain the university more effectively than our ostensible current choice between the Compact and continued decline?
To address these questions, we have proceeded as follows: We exclude consideration of expenditures. Analysis of expenditure patterns could help answer the crucial question of what effect the Compact and other budgetary strategies will have on the University’s core mission of instruction and research and on the University as an integrated system of campuses. (These scenarios also have implications for the University’s public service mission, which we do not address.) There is significant research showing that reducing public revenues requires institutions to turn to private sources that are looking for specific returns on their investment; universities that do this appear to favor fields and activities that can solve particular funder-defined problems because they are “close to the market.” Such effects can also be mitigated or redirected through administrative intervention. Questions about changing patterns of expenditures are beyond our scope. We develop the concept of Core UC Funds (summarized above and in Appendix A) in which we track year-to-year changes in actual budgets for past years and project changes for future; identify changing ratios of private and public fund

15
Page 15 UC “Futures”
sources (excluding research and other revenues); establish the funding gap between continued public support at 2001 levels, the Compact, and other scenarios; and estimate the private replacement-funds required. We attend to those variables that have emerged over the last several years of UCPB discussions as of special budgetary concern, including: the impact of rising fees and other costs on undergraduate student finances; damage to graduate programs due to the loss of highly qualified graduate applicants -- including out-of-state and foreign students -- to competitive institutions as a result of higher fees; and the decline of faculty and staff salaries relative to peer institutions. We identify some major consequences of budgetary changes through a set of four narrative scenarios. The goal of this procedure is to compare the most familiar possibilities to alternative budget trajectories that have tended to be overlooked in standard policy debates about the “art of the possible.” By sketching their basic budgetary parameters, we evaluate the likely consequences of these alternatives. The four scenarios, summarized here, are described more fully at the beginning of each analysis.
1. The Compact Continues. This is the trajectory to which the University is currently committed.
2. Restored 2001 Pathway. This assumes that the state General Fund appropriation to the University is restored by the end of the decade of the 2000s. This trajectory would bring the University to public funding levels higher than those envisioned by the Compact.
3. A Modified Master Plan. As part of a new political consensus on the need to “rebuild California,” the Governor and the Legislature agree to benchmark the University of California to the support levels of 1990-1991, which was the last academic year before the two rounds of “emergency” cuts.
4. A Public Funding Freeze. In this model, the pursuit and use of private funds continues to accelerate. Higher education is considered more of a private good than a public good, and there are attendant reductions in public funding in tandem with increased reliance on tuition fees and other sources of private funds, a restoration of pension contributions, and similar changes.

Page 16 UC “Futures”
This scenario assumes that the Compact is followed to the letter for its five year duration (including the assumption that the State will fund the resumption of pension contributions that were announced after the Compact was signed). After being cut between 2001 and 2004, the General Fund contribution to UC’s budget rises in the annual increments anticipated by the Compact (3% in 2005-06 and 2006-07, and 4% from 2007-08 through 2009-10). Student fees increase steadily at the rate of income growth and the University is able to keep the revenue generated by these increases, rather than, as in past years, use it to offset cuts in state funds. Undergraduate fees increase an average of 10% per year for 2004-07 (though we have assumed a one-time 06-07 buy-out of that year’s 8% increase); graduate fees are to increase an average of 13.3% per year for 2004-07; professional fees will continue to rise along with those of other professional schools. The University receives funding for a minimum of 5000 additional students per year. Capital outlay funds are provided in the amount of $345 million per year, and in the last two years of the Compact, the University receives an additional 1% increment for Instructional Support (libraries, information technology, equipment and maintenance). For Comparison: Holding Funding at 2001-2 Levels During the late 1990s, cuts from earlier years were partially restored, with state support increasing until 2001-02 (Charts 2a-2d). We have thus estimated future budget figures for the Compact, and then compared these to what the budget would be if conditions remained as they were in 2001-02. Table 1 was generated by assuming that state funding remains a constant share of personal income (with slow growth), that student fees are constant in real terms and grow in nominal terms at the rate of inflation, and that other funds can be projected by matching actual values to 2006-07 and then increasing them at the rate of income growth. This model assumes that the Compact did not happen and provides a baseline against which to compare the cuts that accompanied the Compact. State funds remain at about 60% of the University’s core budget. Under the Compact, the proportion of UC Core Funds that derives from the state General Fund stabilizes at the relatively low level of about 46%, and does not recover (Table 1b and Chart 5). It is worth noting that core academic activities remain highly dependent on state General Funds. In a year like 2001-02, when campuses budgets were relatively healthy, the General Fund amounted to nearly two-thirds of core operations. The Compact’s reduced proportion of state funds thus has significant implications for the University’s educational mission.
Projecting the Compact

Page 17 UC “Futures”
The 2001-02 line in Chart 5 shows how state funding would have developed had cuts from before and the first year of the Compact been avoided and budgets increased to reflect personal income growth. The Compact line shows that after accepting a substantial additional drop in the state General Fund support, the Compact stopped further deterioration of the state General Fund support, without producing a restoration of lost public funds.
2001-2 2002-3 2003-4 2004-5 2005-6 2006-7 2007-8 2008-9 2009-10 2010-11
State
Funds 3,279 3,329 3,434 3,661 3,879 4,104 4,330 4,590 4,870 5,176
Core
Funds 5,309 5,503 5,786 6,148 6,477 6,786 7,155 7,575 8,027 8,519
Ratio 61.8% 60.5% 59.3% 59.6% 59.9% 60.5% 60.5% 60.6% 60.7% 60.8%
Table 1a: Stable 2001-02 Funding (Comparison Data)
Table 1b: Compact Funding Data
2001-2 2002-3 2003-4 2004-5 2005-6 2006-7 2007-8 2008-9 2009-10 2010-11
State
Funds 3,279 3,140 2,803 2,615 2,718 2,918 3,130 3,351 3,584 3,830
Core
Funds 5,309 5,321 5,474 5,622 5,926 6,196 6,654 7,151 7,686 8,264
Ratio 61.8% 59.0% 51.2% 46.5% 45.9% 47.1% 47.0% 46.9% 46.6% 46.3%
State Funding: The Compact vs. 2001-level Funding:
2,000
3,000
4,000
5,000
6,000
2001-2 2002-3 2003-4 2004-5 2005-6 2006-7 2007-8 2008-9 2009-10 2010-11
Actual Data & The Compact 2001-02 funding
Chart 5a: State Funding in Nominal Dollars (Millions)

Page 18 UC “Futures”
State General Fund Contribution Per Student During the 2000s, student enrollments increased substantially. The Compact provides for additional funding for 5000 students per year, and this provision helps per-student state funding climb part of the way back to its 2001 level. Even so, in 2011, in real dollars, per-student state funding will be a little more than two-thirds of its level ten years before (Table 2 and Chart 5c). The 2001-02 line in Chart 5c sags for several years to reflect an increase in the ratio of students to taxpayers in the state, and then starts to increase again. The University’s actual budget was cut more deeply. Under the Compact, the funding
State Funds / Core Funding
40.0%
50.0%
60.0%
70.0%
2001-2 2002-3 2003-4 2004-5 2005-6 2006-7 2007-8 2008-9 2009-10 2010-11
Actual Data & The Compact 2001-02 funding
Chart 5b: State Funding as Share of Core Funds
Table 2: State Funding Per Student Under the Compact
Real$ / Student FTE: 2001-2 2002-3 2003-4 2004-5 2005-6 2006-7 2007-8 2008-9 2009-10 2010-11
General only 18.281 16.109 13.642 12.448 12.152 12.327 12.588 12.814 13.019 13.215
Total 17.026 15.031 12.745 11.616 11.339 11.503 11.746 11.957 12.148 12.331
Weighted* 13.357 11.857 10.092 9.165 8.951 9.080 9.272 9.439 9.590 9.734
General only = State funds / General Campus Student FTE. Total = State funds / Total FTE; where Total FTE = General Campus FTE + Health Sciences Weighted = State funds / [General Campus FTE + 5 x Health Sciences]

Page 19 UC “Futures”
on which undergraduate instruction especially depends will not return to the levels of 2001-2002, and will remain significantly below those of 1990 ($14,530 in 2005 dollars). Student Fees State legislatures often feel more comfortable cutting funds for higher education than for other functions of state government because they believe tuition charges can make up for their cuts. California has not been an exception to this “user-fee” approach. As General Fund budgets were cut, fees have increased (Table 3). Fees for undergraduates will have nearly doubled in real dollars during the decade; about a third of this increase will occur under the Compact (Table 3a).
Likewise, fees for academic graduate students will have more than doubled during the decade with, again, a third of this increase coming during the Compact (Table 3b). No other good or service has been subject to this kind of sustained price inflation, with the partial exceptions of real estate and some forms of health care. Many analysts have suggested that these cost increases have done more than anything else to damage higher education’s reputation with the general public. Financial Aid and Student Access Substantial fee increases are a hardship for many UC students. In an effort to keep UC affordable for all eligible students, the administration maintains a relatively generous “return-to-aid” policy, meaning that a quarter, a third, or in
State Funding: Real-$ per Student(With Weighted health sciences FTE)
8000
10000
12000
14000
2001-2 2002-3 2003-4 2004-5 2005-6 2006-7 2007-8 2008-9 2009-10 2010-11
Actual Data & The Compact 2001-02 funding
Chart 5c State Funding Per Student

Page 20 UC “Futures”
some cases half of Education Fee increases are returned to students in the form of financial aid (USAP) (Table 4). The numbers in Table 4 will continue to grow under the Compact. They reflect the Compact’s move toward a relatively restrained version of the “high tuition-high aid” model, in which affluent students are charged high fees and a portion of these offset the lower fees charged to middle- and lower-income students. “High tuition-high aid” policies have been widely debated, and are seen by many as both more effective and more equitable ways of funding higher education. The positive argument is that in theory the higher tuition brings more money into the university and high return-to-aid discounts the total cost of attendance for poorer students. But, return-to-aid policies sometimes run into political opposition. They represent a transfer of fees from one set of students to another, generally from the more to the less affluent. These policies are a 25-50% tax on education for those families that do not qualify for financial aid, a tax that is folded into the overall educational fee. Although “public” and “private” can be complex categories, particularly in the world of higher education, we can nonetheless say that return-to-aid policies
Table 4 Return-to-Aid Estimates, 2001-07
UG USAP GR/PR USAP TOTAL USAP
2001-02 $127,786,776 $32,218,459 $160,005,235
2002-03 $119,797,280 $31,575,299 $151,372,579
mid-yr $6,610,052 $1,748,833 $8,358,885
2003-04 $202,044,777 $61,695,117 $263,739,894
2004-05 $218,942,019 $77,213,697 $296,155,716
2005-06 $241,617,667 $89,707,409 $331,325,076
2006-07 $243,509,709 $92,699,441 $336,209,150
Table 3: In-state Ed. & Reg. fees ($ per student)
2001-2 2002-3 2003-4 2004-5 2005-6 2006-7 2007-8 2008-9 2009-10 2010-11 Undergraduate Compact $ 3,429 3,564 4,984 5,684 6,141 * 6,141 6,632 7,163 7,736 8,355 Fixed Real $ 3,429 3,512 3,593 3,688 3,823 3,957 4,056 4,162 4,274 4,389 Difference 1.5% 38.7% 54.1% 60.6% * 55.2% 63.5% 72.1% 81.0% 90.3% Academic Graduate Compact $3,609 3,744 5,219 6,269 6,897 * 6,897 7,587 8,345 9,180 10,098 Fixed Real $3,609 3,696 3,782 3,881 4,024 4,165 4,269 4,380 4,498 4,620 Difference 1.3% 38.0% 61.5% 71.4% * 65.6% 77.7% 90.5% 104.1% 118.6%
*Reflects the 2006-07 fee buy-out. Treats the buy-out as one-time event. “fixed real” describes the nominal amount of fees that rise at the projected rate of inflation

Page 21 UC “Futures”
replace a portion of general public funding with a form of private cross-subsidy within the pool of families that have students at UC. Practically speaking, return-to-aid does not always compensate for the effect of tuition increases. In spite of efforts to increase financial aid in keeping with increase in tuition, high-tuition universities generally do not have student bodies as diverse as their less expensive public cousins. Studies that correct for socio-economic status, preparedness, and related factors find that students from underrepresented groups have college continuation rates as high as those of whites, suggesting that financial context remains a crucial component in college participation and continuation. Moreover, private colleges and universities wield financial aid resources far beyond the means of public universities in maintaining even their lower levels of diversity. (For additional discussion of access trends, see note 44 and its related text.) Universities that use tuition revenues to support financial aid must take funds away from other educational endeavors: this is one reason why, since the 1990s, colleges have in effect kept only 46 cents of every dollar received from tuition increases. There are additional obstacles to compensating lower-income students for tuition increases: as universities have increasingly competed for students and their tuition dollars, they have shifted financial aid towards higher- rather than lower-income students. In addition, the downturns in public finance that lead to tuition increases make additional financial aid less rather than more likely (though UC bucked this trend in recent years). Thus in spite of the University’s excellent intentions and unusual efforts to offset the negative effects of fee hikes, the Compact moves the University toward a high tuition-high aid model that may not be able to prevent reduced access. Student-Faculty ratio This ratio rose from about 14.5:1 to about 17.5:1 during the Reagan Administration (1967-1975), rose again to 19:1 during the downturn of the early 1990s, and was slated to worsen again during the Schwarzenegger Administration to 21:1. The Regents have set a goal of recovery to 17.6:1 by the end of the 2000s. The Compact does not provide funding for any such improvement. Graduate Education and Research It should also be noted that USAP financial aid competes with other uses of the funds involved. Money spent on undergraduate financial aid could otherwise be spent hiring faculty that would reduce student/faculty ratios, or hiring staff that would increase the efficiency of university operations. The same is true for graduate students. Much USAP money winds up paying increasing fees for teaching assistants, who are certainly performing a useful educational function and deserve support. At the same time, this funding is then unavailable for use as fellowships and research assistantships which attract the most qualified students that preserve or enhance the quality of graduate programs. The failure of UC to provide competitive graduate student support has been identified as a major threat to the quality of the University.
Page 22 UC “Futures”
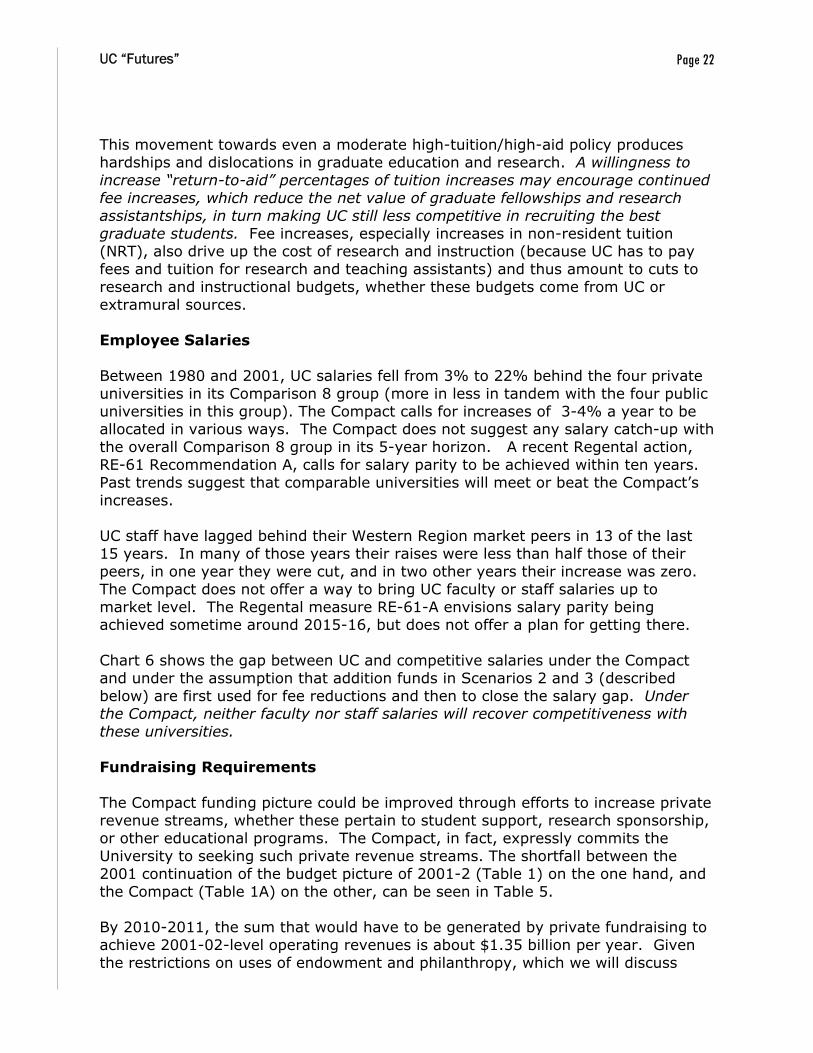
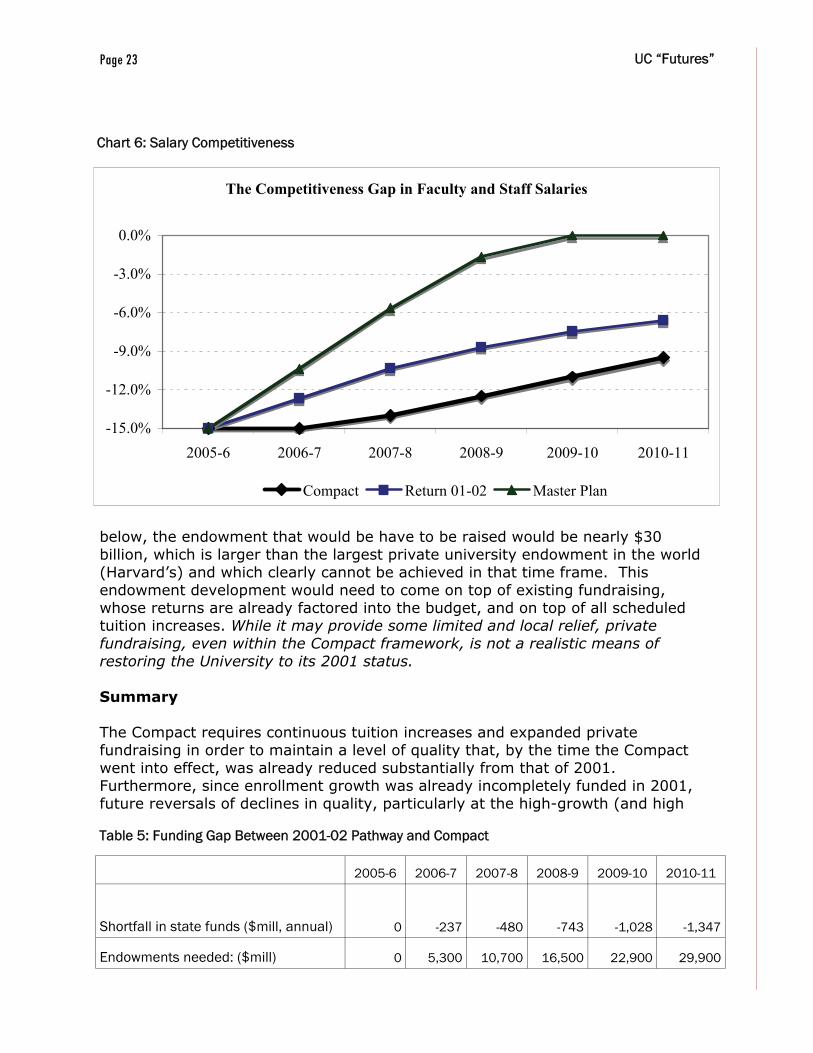
This movement towards even a moderate high-tuition/high-aid policy produces hardships and dislocations in graduate education and research. A willingness to increase “return-to-aid” percentages of tuition increases may encourage continued fee increases, which reduce the net value of graduate fellowships and research assistantships, in turn making UC still less competitive in recruiting the best graduate students. Fee increases, especially increases in non-resident tuition (NRT), also drive up the cost of research and instruction (because UC has to pay fees and tuition for research and teaching assistants) and thus amount to cuts to research and instructional budgets, whether these budgets come from UC or extramural sources. Employee Salaries Between 1980 and 2001, UC salaries fell from 3% to 22% behind the four private universities in its Comparison 8 group (more in less in tandem with the four public universities in this group). The Compact calls for increases of 3-4% a year to be allocated in various ways. The Compact does not suggest any salary catch-up with the overall Comparison 8 group in its 5-year horizon. A recent Regental action, RE-61 Recommendation A, calls for salary parity to be achieved within ten years. Past trends suggest that comparable universities will meet or beat the Compact’s increases. UC staff have lagged behind their Western Region market peers in 13 of the last 15 years. In many of those years their raises were less than half those of their peers, in one year they were cut, and in two other years their increase was zero. The Compact does not offer a way to bring UC faculty or staff salaries up to market level. The Regental measure RE-61-A envisions salary parity being achieved sometime around 2015-16, but does not offer a plan for getting there. Chart 6 shows the gap between UC and competitive salaries under the Compact and under the assumption that addition funds in Scenarios 2 and 3 (described below) are first used for fee reductions and then to close the salary gap. Under the Compact, neither faculty nor staff salaries will recover competitiveness with these universities. Fundraising Requirements The Compact funding picture could be improved through efforts to increase private revenue streams, whether these pertain to student support, research sponsorship, or other educational programs. The Compact, in fact, expressly commits the University to seeking such private revenue streams. The shortfall between the 2001 continuation of the budget picture of 2001-2 (Table 1) on the one hand, and the Compact (Table 1A) on the other, can be seen in Table 5. By 2010-2011, the sum that would have to be generated by private fundraising to achieve 2001-02-level operating revenues is about $1.35 billion per year. Given the restrictions on uses of endowment and philanthropy, which we will discuss
Page 23 UC “Futures”
below, the endowment that would be have to be raised would be nearly $30 billion, which is larger than the largest private university endowment in the world (Harvard’s) and which clearly cannot be achieved in that time frame. This endowment development would need to come on top of existing fundraising, whose returns are already factored into the budget, and on top of all scheduled tuition increases. While it may provide some limited and local relief, private fundraising, even within the Compact framework, is not a realistic means of restoring the University to its 2001 status. Summary The Compact requires continuous tuition increases and expanded private fundraising in order to maintain a level of quality that, by the time the Compact went into effect, was already reduced substantially from that of 2001. Furthermore, since enrollment growth was already incompletely funded in 2001, future reversals of declines in quality, particularly at the high-growth (and high
The Competitiveness Gap in Faculty and Staff Salaries
-15.0%
-12.0%
-9.0%
-6.0%
-3.0%
0.0%
2005-6 2006-7 2007-8 2008-9 2009-10 2010-11
Compact Return 01-02 Master Plan
Chart 6: Salary Competitiveness
Table 5: Funding Gap Between 2001-02 Pathway and Compact
2005-6 2006-7 2007-8 2008-9 2009-10 2010-11
Shortfall in state funds ($mill, annual) 0 -237 -480 -743 -1,028 -1,347
Endowments needed: ($mill) 0 5,300 10,700 16,500 22,900 29,900

Page 24 UC “Futures”
undergraduate-ratio campuses), will require still higher tuition increases and still greater fundraising efforts. The Regents’ goal of competitive salaries for faculty and staff will not be realized, which will likely also contribute to a decline in quality of the University. It will be difficult to maintain access for the full range of California’s economically and racially diverse student population, or maintain educational quality, or continue the rate of University-generated economic and social development to which Californians had been accustomed. It appears that the Compact does not in fact stop the University’s financial decline, or the weakening of its contributions to the people of California.
Page 25 UC “Futures”
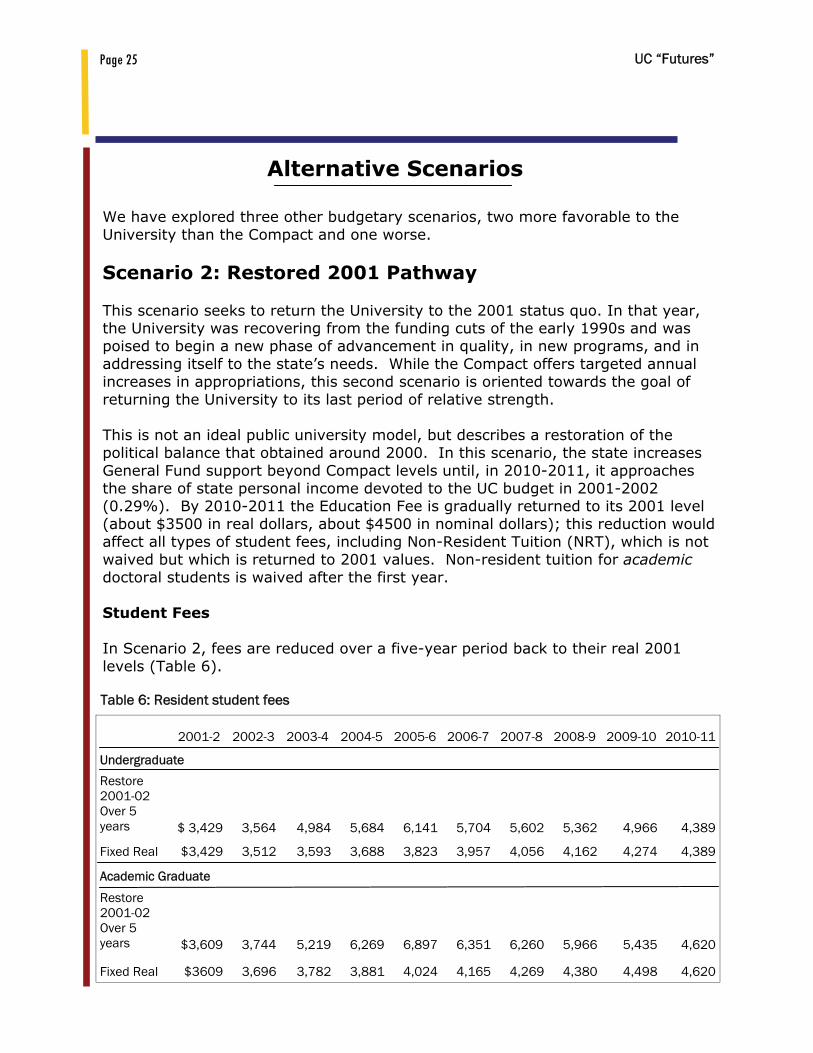
We have explored three other budgetary scenarios, two more favorable to the University than the Compact and one worse. Scenario 2: Restored 2001 Pathway This scenario seeks to return the University to the 2001 status quo. In that year, the University was recovering from the funding cuts of the early 1990s and was poised to begin a new phase of advancement in quality, in new programs, and in addressing itself to the state’s needs. While the Compact offers targeted annual increases in appropriations, this second scenario is oriented towards the goal of returning the University to its last period of relative strength. This is not an ideal public university model, but describes a restoration of the political balance that obtained around 2000. In this scenario, the state increases General Fund support beyond Compact levels until, in 2010-2011, it approaches the share of state personal income devoted to the UC budget in 2001-2002 (0.29%). By 2010-2011 the Education Fee is gradually returned to its 2001 level (about $3500 in real dollars, about $4500 in nominal dollars); this reduction would affect all types of student fees, including Non-Resident Tuition (NRT), which is not waived but which is returned to 2001 values. Non-resident tuition for academic doctoral students is waived after the first year. Student Fees In Scenario 2, fees are reduced over a five-year period back to their real 2001 levels (Table 6).
Table 6: Resident student fees
2001-2 2002-3 2003-4 2004-5 2005-6 2006-7 2007-8 2008-9 2009-10 2010-11
Undergraduate
Restore 2001-02 Over 5 years $ 3,429 3,564 4,984 5,684 6,141 5,704 5,602 5,362 4,966 4,389
Fixed Real $3,429 3,512 3,593 3,688 3,823 3,957 4,056 4,162 4,274 4,389
Restore 2001-02 Over 5 years $3,609 3,744 5,219 6,269 6,897 6,351 6,260 5,966 5,435 4,620
Fixed Real $3609 3,696 3,782 3,881 4,024 4,165 4,269 4,380 4,498 4,620
Academic Graduate
Alternative Scenarios

Page 26 UC “Futures”
Employee Salaries This scenario allows employee salaries to return to about 6% below Comparison 8 (Chart 6). This increased speed allows for rank-and-file UC salaries to recover at something closer to the rate of recovery enjoyed by executive salaries as mandated by Regental measure RE-61B. Table 7 shows that by 2010-11, the fee reduction has resulted in a significant loss of UC Core funds which is more than compensated by the increases in General Fund appropriations (as defined by the 2001-2002 UC share of state personal income) Under this scenario, the proportion of state to non-state funding returns to its 2001-02 level of about 60% of the total core, as does UC’s share of state personal income. In order to make this happen, however, the state restores the levels of state support achieved in 2001-02. This means that the University recovers well over a billion dollars in annual appropriations lost after 2001-2002. Although a billion dollars sounds like a lot of money, it amounts only to a restoration of money lost during the state’s budgetary crisis. The total sum required is small as a fraction of the entire state budget. The first increment would amount to 0.24% of the 2006-07 proposed Governor’s budget for the state of over $100 billion, approaching 0.5% in 07-08 and rising thereafter. Since in 2005-06 the UC share of the General Fund was down about 1.4% from its 2001-02 level, this series of increases would do no more than return the University to the funding levels of the recent past. Scenario 3: A Modified Master Plan As part of a new political consensus on the need to “rebuild California,” the Governor and the Legislature agree to benchmark the University of California to the support levels of 1990-1991, which was the last academic year prior to the two rounds of cuts of the last two major recessions. Noting that rebuilding California will require a return to funding levels closer to those sustained by the state's taxpayers during earlier building phases, and acknowledging that the next wave of California's knowledge economy will require efficient use of educational resources, Sacramento gradually returns General Fund support to an approximate average of UC's share of state personal income in the five years leading up to the last pre-recession year of 1990-1991, which is 0.36% of state personal income.
Table 7 State Funding Under the 2001 Pathway (see also Table 1 above)
Projection results: 2005-6 2006-7 2007-8 2008-9 2009-10 2010-11
State Funding vs. 2001 -1,161 -949 -756 -531 -281 0
Student Fees vs. 2001 611 476 419 326 189 0
State Funding/Core Funds 45.9% 50.0% 52.4% 55.1% 57.8% 60.8%
State Funds / Pers. Inc 0.203% 0.223% 0.239% 0.256% 0.273% 0.290%
Page 27 UC “Futures”
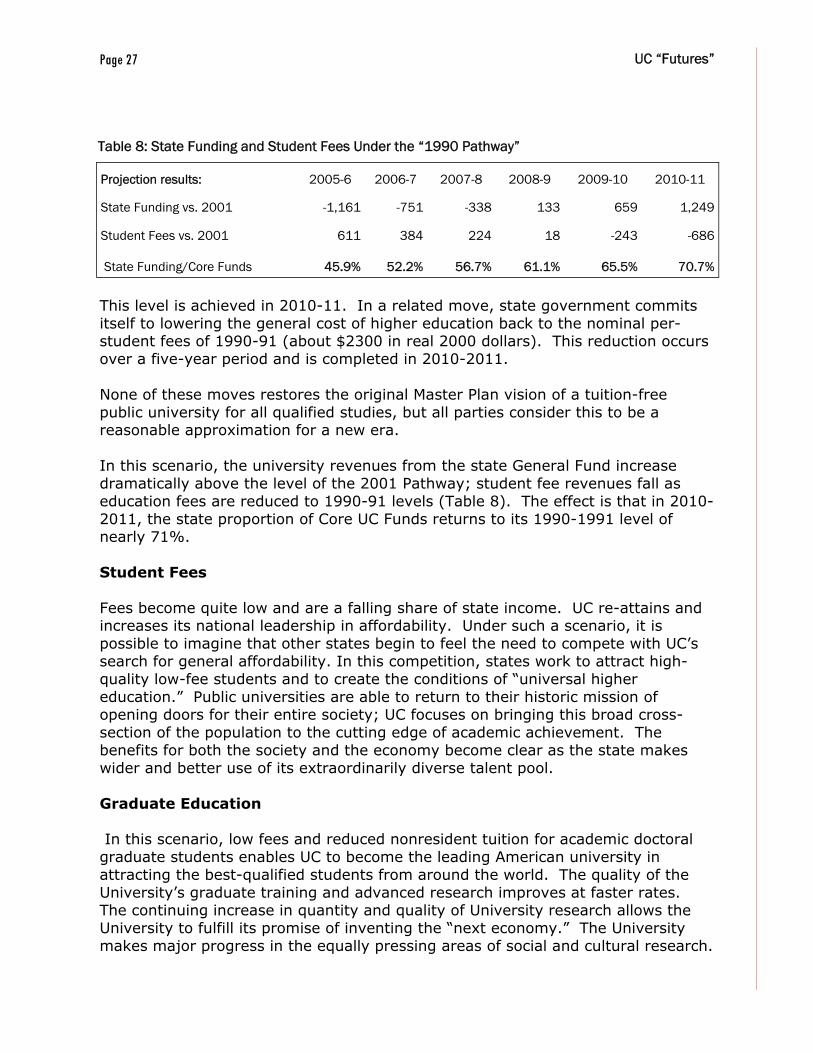
This level is achieved in 2010-11. In a related move, state government commits itself to lowering the general cost of higher education back to the nominal per-student fees of 1990-91 (about $2300 in real 2000 dollars). This reduction occurs over a five-year period and is completed in 2010-2011. None of these moves restores the original Master Plan vision of a tuition-free public university for all qualified studies, but all parties consider this to be a reasonable approximation for a new era. In this scenario, the university revenues from the state General Fund increase dramatically above the level of the 2001 Pathway; student fee revenues fall as education fees are reduced to 1990-91 levels (Table 8). The effect is that in 2010-2011, the state proportion of Core UC Funds returns to its 1990-1991 level of nearly 71%. Student Fees Fees become quite low and are a falling share of state income. UC re-attains and increases its national leadership in affordability. Under such a scenario, it is possible to imagine that other states begin to feel the need to compete with UC’s search for general affordability. In this competition, states work to attract high-quality low-fee students and to create the conditions of “universal higher education.” Public universities are able to return to their historic mission of opening doors for their entire society; UC focuses on bringing this broad cross-section of the population to the cutting edge of academic achievement. The benefits for both the society and the economy become clear as the state makes wider and better use of its extraordinarily diverse talent pool. Graduate Education In this scenario, low fees and reduced nonresident tuition for academic doctoral graduate students enables UC to become the leading American university in attracting the best-qualified students from around the world. The quality of the University’s graduate training and advanced research improves at faster rates. The continuing increase in quantity and quality of University research allows the University to fulfill its promise of inventing the “next economy.” The University makes major progress in the equally pressing areas of social and cultural research.
Table 8: State Funding and Student Fees Under the “1990 Pathway”
Projection results: 2005-6 2006-7 2007-8 2008-9 2009-10 2010-11
State Funding vs. 2001 -1,161 -751 -338 133 659 1,249
Student Fees vs. 2001 611 384 224 18 -243 -686
State Funding/Core Funds 45.9% 52.2% 56.7% 61.1% 65.5% 70.7%
Page 28 UC “Futures”
Student Faculty Ratios The University has the funding capacity to reduce this ratio to 14.5: 1, and does so. This eases the traditional tradeoff between (a) hiring ladder faculty and (b) using allocated but unfilled positions to hire teaching assistants and lecturers instead. Undergraduate access to faculty continues to improve. Staff and Faculty Salaries Shortfalls with the Comparison 8 are eliminated by 2010-2011. This success in turn eases campus retention efforts for its strongest faculty and improves faculty and staff morale, which in turn improves productivity. Private Fundraising Fundraising efforts continue to expand and evolve. At the same time, they are relieved of the burden of replacing a large amount of General Fund monies and of supporting a substantial portion of general undergraduate instruction. Instead, fundraising efforts are targeted to areas of special need, opportunity, and likely success, areas such as graduate student fellowships, research topics of strategic value for Californians, industry sponsorship of high-risk/high-reward research, unique capital projects, and so on. Academic administrators who had been devoting an increasingly large portion of their time to fundraising are able to restore much of that time to faculty and academic program development, which enhances academic quality in a way that feeds back into the success of fundraising efforts. The same is true for faculty: at least a portion of the time that faculty had been putting into solicitation of both private and public-sector contracts and grants is returned to supervising and conducting the research that the grants support. Some administrative funds (portions of ICR, for example) that, in bad years, had been diverted to fundraising, are returned to academic activities. This scenario, the 1990 Pathway, would allow the University to realize the desire, regularly expressed by California leaders, to keep the state at the forefront of solving the great economic and technological problems of the age; at present the University is asked to do this with public funding levels that are below average among the states. These funding levels are also well below those of only fifteen years ago, raising the prospect that the state is asking the University to live of the educational investment of prior generations rather than matching those investments with an adequate one of its own. The 1990 Pathway would most rapidly restore the state to one recent level of investment, and perhaps allow the University to recover its leadership position in national and international higher education.
Page 29 UC “Futures”
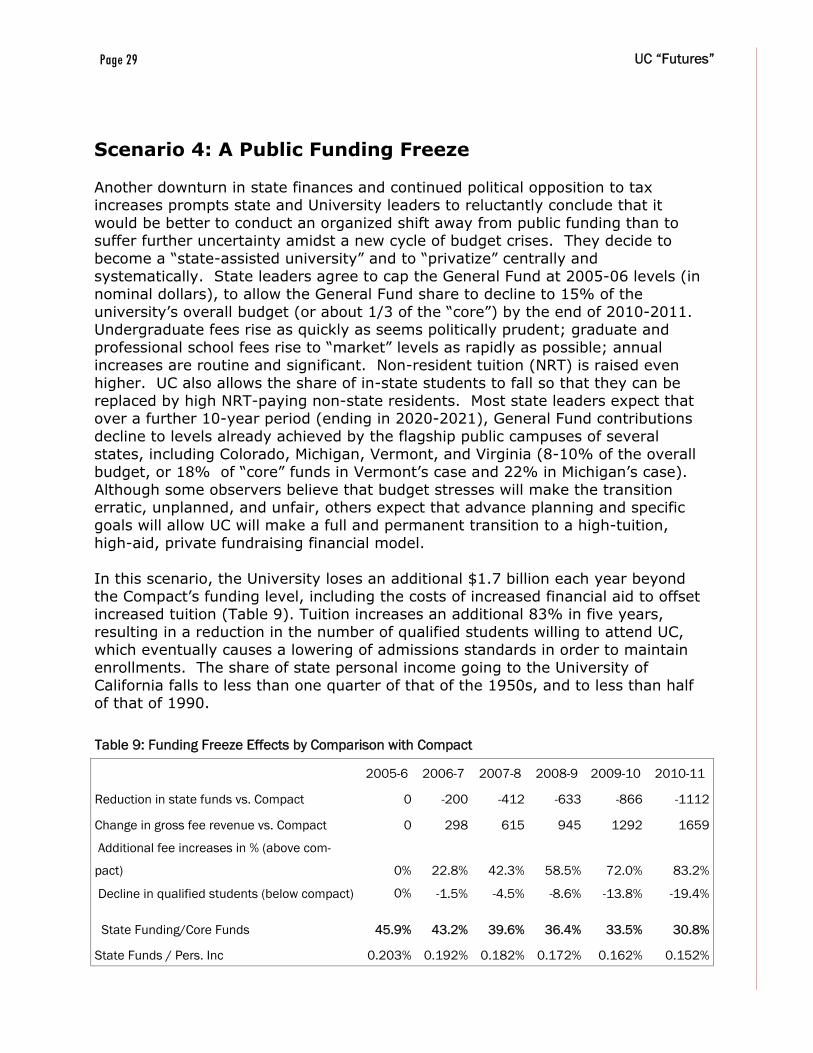
Scenario 4: A Public Funding Freeze Another downturn in state finances and continued political opposition to tax increases prompts state and University leaders to reluctantly conclude that it would be better to conduct an organized shift away from public funding than to suffer further uncertainty amidst a new cycle of budget crises. They decide to become a “state-assisted university” and to “privatize” centrally and systematically. State leaders agree to cap the General Fund at 2005-06 levels (in nominal dollars), to allow the General Fund share to decline to 15% of the university’s overall budget (or about 1/3 of the “core”) by the end of 2010-2011. Undergraduate fees rise as quickly as seems politically prudent; graduate and professional school fees rise to “market” levels as rapidly as possible; annual increases are routine and significant. Non-resident tuition (NRT) is raised even higher. UC also allows the share of in-state students to fall so that they can be replaced by high NRT-paying non-state residents. Most state leaders expect that over a further 10-year period (ending in 2020-2021), General Fund contributions decline to levels already achieved by the flagship public campuses of several states, including Colorado, Michigan, Vermont, and Virginia (8-10% of the overall budget, or 18% of “core” funds in Vermont’s case and 22% in Michigan’s case). Although some observers believe that budget stresses will make the transition erratic, unplanned, and unfair, others expect that advance planning and specific goals will allow UC will make a full and permanent transition to a high-tuition, high-aid, private fundraising financial model. In this scenario, the University loses an additional $1.7 billion each year beyond the Compact’s funding level, including the costs of increased financial aid to offset increased tuition (Table 9). Tuition increases an additional 83% in five years, resulting in a reduction in the number of qualified students willing to attend UC, which eventually causes a lowering of admissions standards in order to maintain enrollments. The share of state personal income going to the University of California falls to less than one quarter of that of the 1950s, and to less than half of that of 1990.
Table 9: Funding Freeze Effects by Comparison with Compact
2005-6 2006-7 2007-8 2008-9 2009-10 2010-11
Reduction in state funds vs. Compact 0 -200 -412 -633 -866 -1112
Change in gross fee revenue vs. Compact 0 298 615 945 1292 1659
Additional fee increases in % (above com-
pact) 0% 22.8% 42.3% 58.5% 72.0% 83.2%
Decline in qualified students (below compact) 0% -1.5% -4.5% -8.6% -13.8% -19.4%
State Funding/Core Funds 45.9% 43.2% 39.6% 36.4% 33.5% 30.8%
State Funds / Pers. Inc 0.203% 0.192% 0.182% 0.172% 0.162% 0.152%
Page 30 UC “Futures”
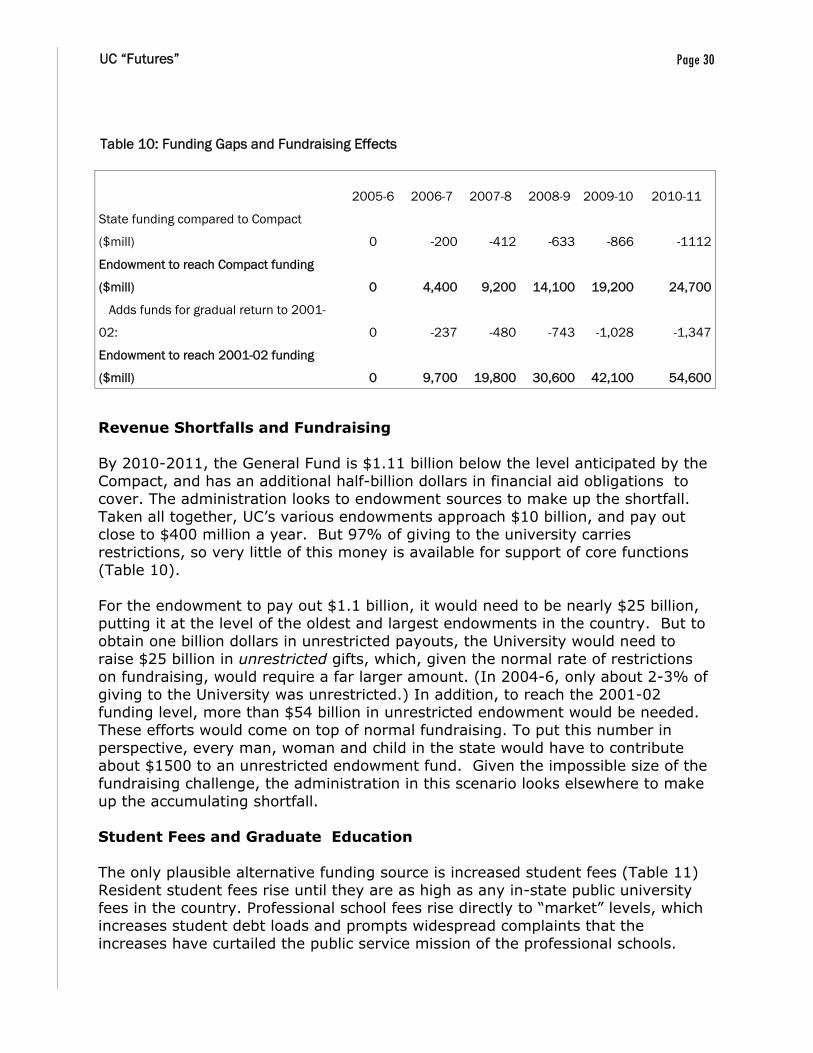
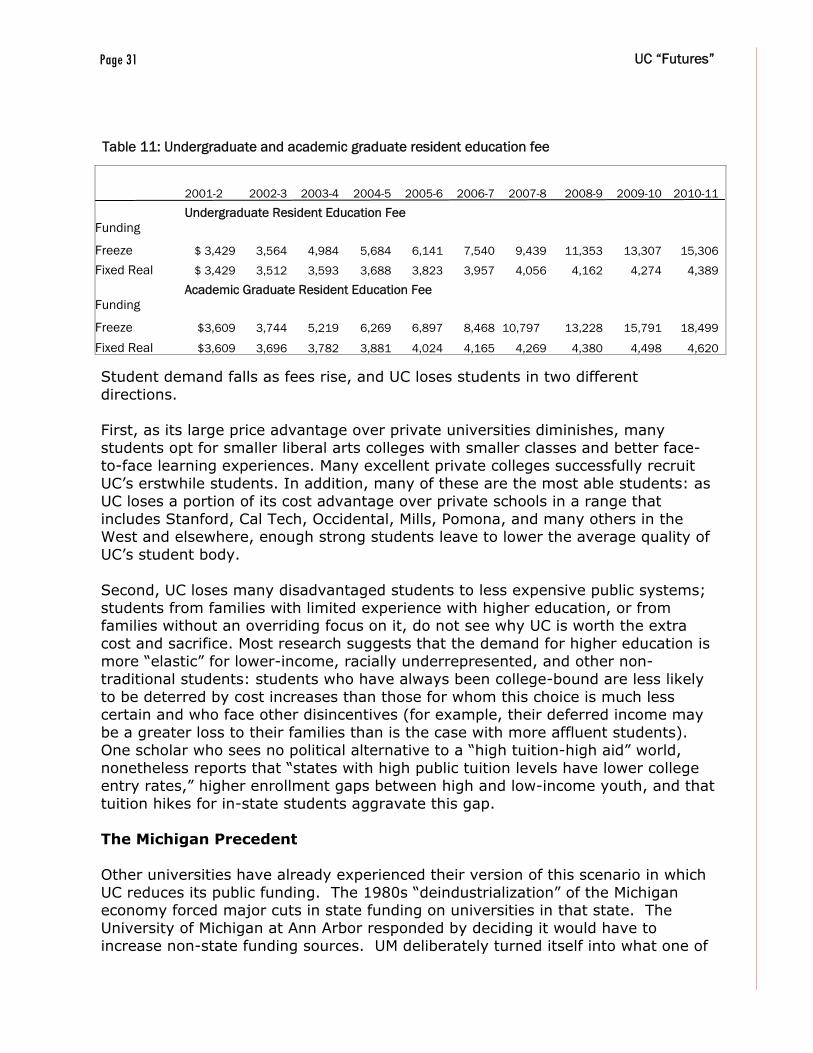
Revenue Shortfalls and Fundraising By 2010-2011, the General Fund is $1.11 billion below the level anticipated by the Compact, and has an additional half-billion dollars in financial aid obligations to cover. The administration looks to endowment sources to make up the shortfall. Taken all together, UC’s various endowments approach $10 billion, and pay out close to $400 million a year. But 97% of giving to the university carries restrictions, so very little of this money is available for support of core functions (Table 10). For the endowment to pay out $1.1 billion, it would need to be nearly $25 billion, putting it at the level of the oldest and largest endowments in the country. But to obtain one billion dollars in unrestricted payouts, the University would need to raise $25 billion in unrestricted gifts, which, given the normal rate of restrictions on fundraising, would require a far larger amount. (In 2004-6, only about 2-3% of giving to the University was unrestricted.) In addition, to reach the 2001-02 funding level, more than $54 billion in unrestricted endowment would be needed. These efforts would come on top of normal fundraising. To put this number in perspective, every man, woman and child in the state would have to contribute about $1500 to an unrestricted endowment fund. Given the impossible size of the fundraising challenge, the administration in this scenario looks elsewhere to make up the accumulating shortfall. Student Fees and Graduate Education The only plausible alternative funding source is increased student fees (Table 11) Resident student fees rise until they are as high as any in-state public university fees in the country. Professional school fees rise directly to “market” levels, which increases student debt loads and prompts widespread complaints that the increases have curtailed the public service mission of the professional schools.
Table 10: Funding Gaps and Fundraising Effects
2005-6 2006-7 2007-8 2008-9 2009-10 2010-11
State funding compared to Compact
($mill) 0 -200 -412 -633 -866 -1112
Endowment to reach Compact funding
($mill) 0 4,400 9,200 14,100 19,200 24,700
Adds funds for gradual return to 2001-
02: 0 -237 -480 -743 -1,028 -1,347
Endowment to reach 2001-02 funding
($mill) 0 9,700 19,800 30,600 42,100 54,600
Page 31 UC “Futures”
Student demand falls as fees rise, and UC loses students in two different directions. First, as its large price advantage over private universities diminishes, many students opt for smaller liberal arts colleges with smaller classes and better face-to-face learning experiences. Many excellent private colleges successfully recruit UC’s erstwhile students. In addition, many of these are the most able students: as UC loses a portion of its cost advantage over private schools in a range that includes Stanford, Cal Tech, Occidental, Mills, Pomona, and many others in the West and elsewhere, enough strong students leave to lower the average quality of UC’s student body. Second, UC loses many disadvantaged students to less expensive public systems; students from families with limited experience with higher education, or from families without an overriding focus on it, do not see why UC is worth the extra cost and sacrifice. Most research suggests that the demand for higher education is more “elastic” for lower-income, racially underrepresented, and other non-traditional students: students who have always been college-bound are less likely to be deterred by cost increases than those for whom this choice is much less certain and who face other disincentives (for example, their deferred income may be a greater loss to their families than is the case with more affluent students). One scholar who sees no political alternative to a “high tuition-high aid” world, nonetheless reports that “states with high public tuition levels have lower college entry rates,” higher enrollment gaps between high and low-income youth, and that tuition hikes for in-state students aggravate this gap. The Michigan Precedent Other universities have already experienced their version of this scenario in which UC reduces its public funding. The 1980s “deindustrialization” of the Michigan economy forced major cuts in state funding on universities in that state. The University of Michigan at Ann Arbor responded by deciding it would have to increase non-state funding sources. UM deliberately turned itself into what one of
Table 11: Undergraduate and academic graduate resident education fee
2001-2 2002-3 2003-4 2004-5 2005-6 2006-7 2007-8 2008-9 2009-10 2010-11
Undergraduate Resident Education Fee Funding
Freeze $ 3,429 3,564 4,984 5,684 6,141 7,540 9,439 11,353 13,307 15,306
Fixed Real $ 3,429 3,512 3,593 3,688 3,823 3,957 4,056 4,162 4,274 4,389
Academic Graduate Resident Education Fee Funding
Freeze $3,609 3,744 5,219 6,269 6,897 8,468 10,797 13,228 15,791 18,499
Fixed Real $3,609 3,696 3,782 3,881 4,024 4,165 4,269 4,380 4,498 4,620
Page 32 UC “Futures”
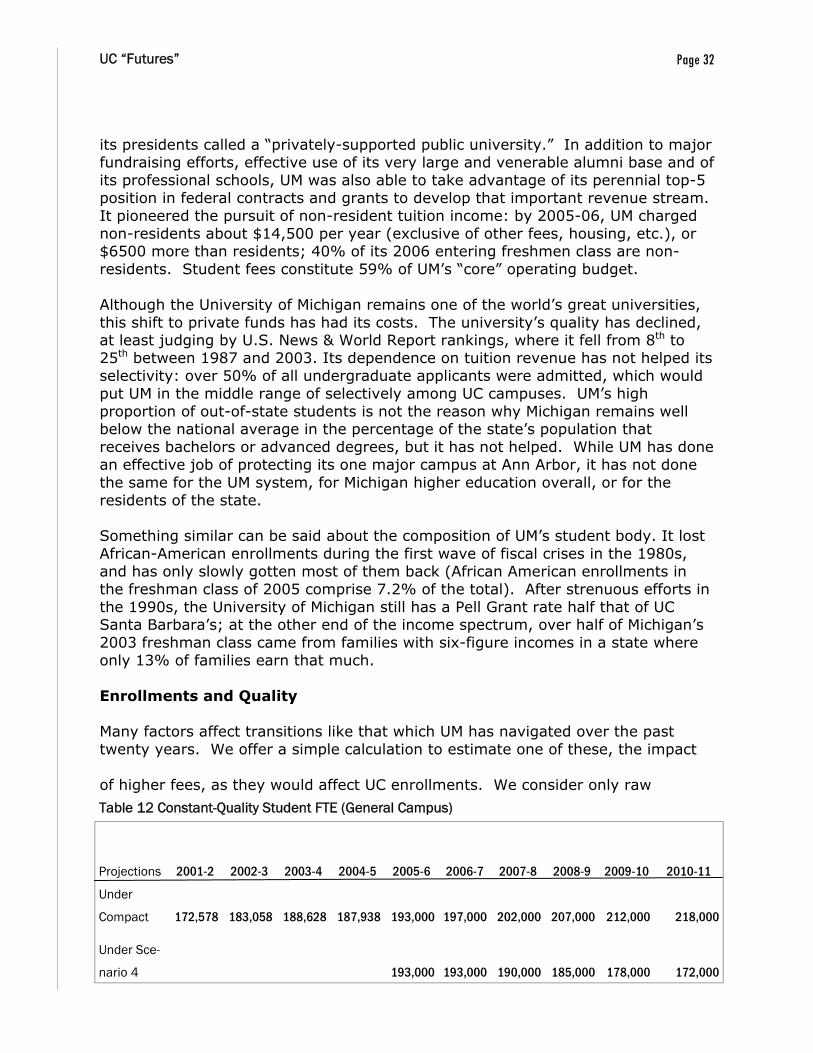
its presidents called a “privately-supported public university.” In addition to major fundraising efforts, effective use of its very large and venerable alumni base and of its professional schools, UM was also able to take advantage of its perennial top-5 position in federal contracts and grants to develop that important revenue stream. It pioneered the pursuit of non-resident tuition income: by 2005-06, UM charged non-residents about $14,500 per year (exclusive of other fees, housing, etc.), or $6500 more than residents; 40% of its 2006 entering freshmen class are non-residents. Student fees constitute 59% of UM’s “core” operating budget. Although the University of Michigan remains one of the world’s great universities, this shift to private funds has had its costs. The university’s quality has declined, at least judging by U.S. News & World Report rankings, where it fell from 8th to 25th between 1987 and 2003. Its dependence on tuition revenue has not helped its selectivity: over 50% of all undergraduate applicants were admitted, which would put UM in the middle range of selectively among UC campuses. UM’s high proportion of out-of-state students is not the reason why Michigan remains well below the national average in the percentage of the state’s population that receives bachelors or advanced degrees, but it has not helped. While UM has done an effective job of protecting its one major campus at Ann Arbor, it has not done the same for the UM system, for Michigan higher education overall, or for the residents of the state. Something similar can be said about the composition of UM’s student body. It lost African-American enrollments during the first wave of fiscal crises in the 1980s, and has only slowly gotten most of them back (African American enrollments in the freshman class of 2005 comprise 7.2% of the total). After strenuous efforts in the 1990s, the University of Michigan still has a Pell Grant rate half that of UC Santa Barbara’s; at the other end of the income spectrum, over half of Michigan’s 2003 freshman class came from families with six-figure incomes in a state where only 13% of families earn that much. Enrollments and Quality Many factors affect transitions like that which UM has navigated over the past twenty years. We offer a simple calculation to estimate one of these, the impact of higher fees, as they would affect UC enrollments. We consider only raw
Projections 2001-2 2002-3 2003-4 2004-5 2005-6 2006-7 2007-8 2008-9 2009-10 2010-11
Under
Compact 172,578 183,058 188,628 187,938 193,000 197,000 202,000 207,000 212,000 218,000
Under Sce-
nario 4 193,000 193,000 190,000 185,000 178,000 172,000
Table 12 Constant-Quality Student FTE (General Campus)

Page 33 UC “Futures”
numbers and bracket the impact on diversity. We assume that student demand declines 6% per $1000 increase in fees net of aid (see endnote 40), and that the University would decide to maintain its admissions standards rather than accept nominally unqualified students to keep seats filled (Table 12). As enrollments decline in the way predicted here, the University comes under great pressure to reduce standards to maintain them. In addition, different campuses begin to show different student body characteristics. The two or three largest campuses are able to follow Michigan in attracting a national student body and their non-resident tuition dollars. As they dig deeper into their applicant pools, however, they affect enrollments at other campuses, which in turn become increasingly less selective in order to maintain enrollments. Since most UC campuses had not yet become famous with the national population, regardless of their academic profiles and research successes, and since most had relatively young and small alumni pools to tap in fundraising efforts, they have little choice but to adapt to the students and the resources they have at their disposal. Graduate education at UC had been based on the view that the state creates a competitive advantage by maintaining eight or ten great research campuses rather than other states’ norm of one or two. In this scenario, budget cuts erode this particular vision. Graduate research assistantships are in short supply, and many very good but non-exceptional departments go wanting. Leading faculty in these non-leading departments began to move on to posts at other universities. The best graduate students cease applying or matriculating. Faculty workloads suffer as teaching and research come into unprecedented conflict, prompting higher rates of faculty departure. First individual departments on the newer campuses accept their fate, then larger parts of various campuses redefine their missions as primarily instructional. Much of the UC system becomes closer in mission and resources to the traditions of CSU. Different campuses come to have distinctly different student populations. Employee Salaries Salaries in this scenario are in permanent and intensified competition with student fee increases. General salary increases are put on indefinite hold. Merit increases for faculty are suspended for two years running, and in response to several class-action lawsuits the University decides to abandon the step-system in 2014-2015. Many of University’s strongest faculty seek and obtain outside offers, and the effect is to transform the salary scale into two increasingly unrelated systems, “off scale” for the more marketable faculty, and “on scale” for those who are less so. This increasingly two-tiered structure damages morale and increases the pursuit of outside offers, which had been increasing anyway because of the very high cost of housing. Campuses have become responsible for generating major portions of their operating revenue and hence for fundraising activities. Given the very different maturities, program structures, locations, and demographics of campuses that under the Master Plan had been developed as an ensemble, the campuses

Page 34 UC “Futures”
increasing go their separate ways, find different educational niches, and increasing different levels of quality.
By 2020 the UC system looks much like a large version of the University of Michigan system, the Texas system or the SUNY system: it has two and perhaps three flagship research campuses, and then an uneven assortment of differentiated campuses that range from research I doctoral institutions to state colleges with reduced facilities for students, higher teaching loads for faculty, and reduced knowledge output for the state. Looking back from 2020, a few educational leaders could be found saying on the record that such scenarios were “plausible.” But these warnings were not enough. No one in California in 2006 wanted to downsize the unparalleled research university system behind one of the world’s great knowledge economies. But then no one in Michigan in 1976 wanted to close most of the factories in one of the world’s great manufacturing economies. In California as in Michigan, it happened one step at a time.
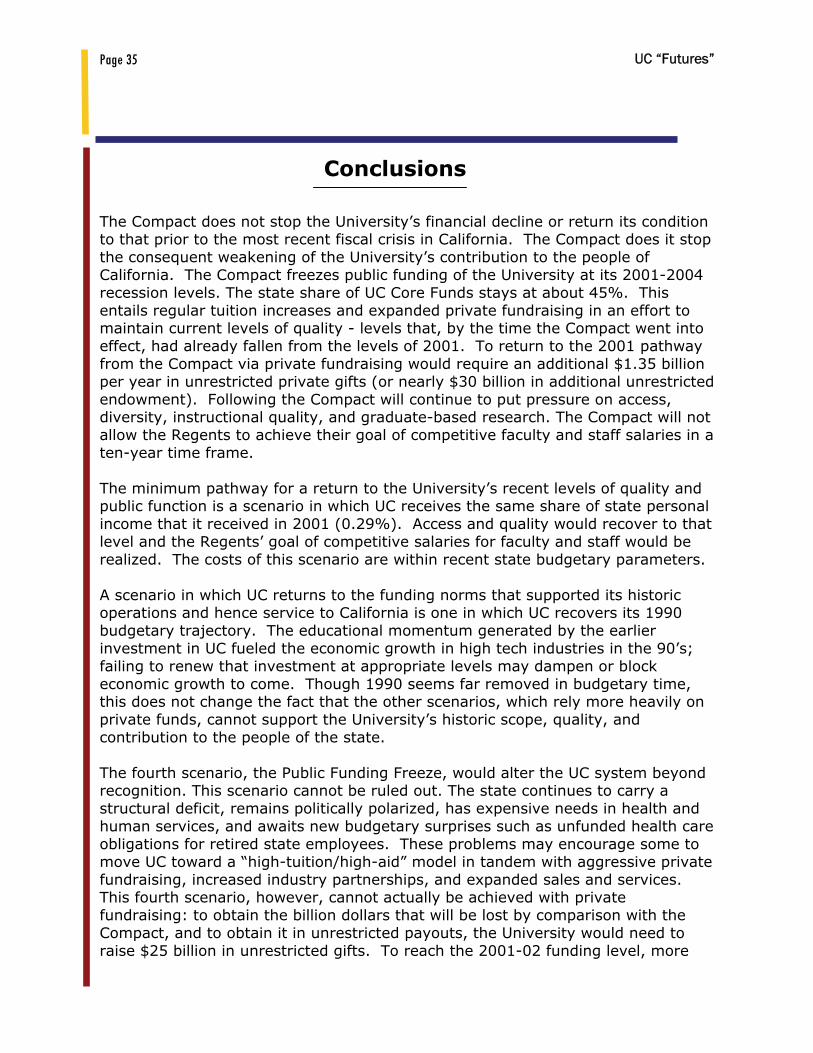
Page 35 UC “Futures”
The Compact does not stop the University’s financial decline or return its condition to that prior to the most recent fiscal crisis in California. The Compact does it stop the consequent weakening of the University’s contribution to the people of California. The Compact freezes public funding of the University at its 2001-2004 recession levels. The state share of UC Core Funds stays at about 45%. This entails regular tuition increases and expanded private fundraising in an effort to maintain current levels of quality - levels that, by the time the Compact went into effect, had already fallen from the levels of 2001. To return to the 2001 pathway from the Compact via private fundraising would require an additional $1.35 billion per year in unrestricted private gifts (or nearly $30 billion in additional unrestricted endowment). Following the Compact will continue to put pressure on access, diversity, instructional quality, and graduate-based research. The Compact will not allow the Regents to achieve their goal of competitive faculty and staff salaries in a ten-year time frame. The minimum pathway for a return to the University’s recent levels of quality and public function is a scenario in which UC receives the same share of state personal income that it received in 2001 (0.29%). Access and quality would recover to that level and the Regents’ goal of competitive salaries for faculty and staff would be realized. The costs of this scenario are within recent state budgetary parameters. A scenario in which UC returns to the funding norms that supported its historic operations and hence service to California is one in which UC recovers its 1990 budgetary trajectory. The educational momentum generated by the earlier investment in UC fueled the economic growth in high tech industries in the 90’s; failing to renew that investment at appropriate levels may dampen or block economic growth to come. Though 1990 seems far removed in budgetary time, this does not change the fact that the other scenarios, which rely more heavily on private funds, cannot support the University’s historic scope, quality, and contribution to the people of the state. The fourth scenario, the Public Funding Freeze, would alter the UC system beyond recognition. This scenario cannot be ruled out. The state continues to carry a structural deficit, remains politically polarized, has expensive needs in health and human services, and awaits new budgetary surprises such as unfunded health care obligations for retired state employees. These problems may encourage some to move UC toward a “high-tuition/high-aid” model in tandem with aggressive private fundraising, increased industry partnerships, and expanded sales and services. This fourth scenario, however, cannot actually be achieved with private fundraising: to obtain the billion dollars that will be lost by comparison with the Compact, and to obtain it in unrestricted payouts, the University would need to raise $25 billion in unrestricted gifts. To reach the 2001-02 funding level, more
Conclusions

Page 36 UC “Futures”
than $54 billion would be needed. Alternately, tuition increases big enough to fill the gap would shrink and, at the same time, reduce the quality of the university’s student body. The overall UC system would continue in name but not in reality, as the most prestigious campuses draw on a national student pool and collect large amounts of non-resident tuition while other campuses struggle with diminished resources, fewer programs, and reduced research capacity. Wasteful intercampus competition may arise, in part in the form of the budgetary fragmentation that the Master Plan had in its time brought to a close. Since undergraduate instruction is disproportionately dependent on the state General Fund, such changes would seriously damage the assumption of a high-quality curricula for all qualified students. The Public Funding Freeze would end the UC system as we know it.

Page 37 UC “Futures”
Appendix A: Core UC Fund Model In narrative terms, the “Core UC Fund” model factors to be included are as follows: We identify those income streams that are budgeted or are available for allocation by the President, Vice Presidents, Chancellors, Vice Chancellors, Deans, Department Chairs, and ORU Directors to carry out the core operational functions, including administrative support, of the University. In the first round of calculations, we exclude extramurally funded research projects: even though research is certainly a core function, these income streams were generated through the entrepreneurial efforts of faculty or small groups of faculty and are under their control and so do nor meet the criteria above. To better define the concept described we can begin with fund sources that are clearly included and some that are clearly excluded. What remains are some in the middle that should most likely be included, but are harder to define. We recognize that lines drawn are never going to exact but should be close enough so that the picture is reasonably accurate. First, certain funds are clearly included: State General Fund appropriations (less any provision for revenue bond payments) and lottery funds; student fees (the Education Fee, sometimes known as tuition, the Registration Fee, which is mandatory but smaller than the Ed Fee, Professional School Fee (PDF) income, Summer Session fees, and Non-Resident Tuition (NRT); and all indirect cost recovery on contracts and grants (federal, state, and private). We note that that financial aid from fees income will be treated as an expense and not as a discount to the fee income. Second, some fund sources are clearly excluded; income generated by Auxiliary Enterprises (e.g. housing and dining, intercollegiate athletics, UNEX, parking and transportation, public events such as art exhibitions and theatrical performances, etc). These are essentially non-core business operations where fees are charged to the public for services and are supposed to break even. (The "public" may include our own students for housing and dining, our own faculty students and staff for parking, etc.). We further exclude hospital operations as well as clinical patient care income. We note, however, that the latter of these has a case to be included as this income pays health science faculty salaries as well as some support costs for health science schools; we may revisit this issue in the second round. Also excluded are "other student fees" which are campus based fees plus health insurance fees. In the latter, students are essentially purchasing health insurance
Appendices
Page 38 UC “Futures”
from the University. The former are fees that the students approve by campus referenda and are used almost entirely for non core purposes. Third, there are several income streams in a middle ground that are included in our tabulation as meeting the criteria but that are more difficult to identify. One is endowment payout (including UC Regents and Campus Foundations). Then there is private support. Private support comes in four flavors:
1. Research gifts, which should be properly grouped with other extramural research support as they are gifts to support the research of a faculty member or a small group of faculty
2. Endowments (including FFE or funds functioning as endowment)-- this is not available for current use and its benefit will be reflected in future endowment income
3. Gifts for facilities, again not for operations 4. Gifts for operations other than research
It is only the fourth category that we want to include. (Even here, however, there are some parts that should not be included e.g. gifts to intercollegiate athletics.) These gifts normally carry donor restrictions to one degree or another-- say for use in the Law School or in the Mathematics Department, or could be restricted to graduate fellowships or undergraduate scholarships, or even further graduate fellowships in the English Department. But none of these is incompatible with the definition of which fund sources we wish to include above. If, for instance, a gift is restricted to use for the research of Professor X, then it is in category (1) above and is not included in the tabulation. Only a tiny fraction of gifts is totally unrestricted, but just including the unrestricted gifts seriously understates the extent of the University’s dependence on private giving. The university is currently changing its accounting system from accrual to a cash system, further complicating data retrieval. The numbers that are included in our tabulations are, in the absence of hard and fast numbers, the best estimates we can give for the amount of private giving that falls into this fourth category. Further work remains to refine these numbers. We have created a miscellaneous category that includes several sources. The first is STIP (Short term Investment Pool) interest that represents interest on various fund balances. The total of such interest in 2004-05 (according to University Financial Statements) was 210M; however not all of this can be credited to what we are calling Core UC Funds. A survey of the 2004-05 records leads to an estimate that about 61% of this interest can be included among Core UC funds, including 14% which represents STIP interest on general fund balances, which is usually classified as a component of general funds. On many campuses STIP interest is split in various ratios between the accounts that earn the interest and the Chancellor's office. The Chancellor's share is used for general support of the campus.

Page 39 UC “Futures”
The miscellaneous category also includes various "taxes" that are imposed by the campus on various funds with the balances used to support the campus and that are properly classed as Core UC funds. These include administrative full costing whereby funds flowing to Auxiliaries are taxed in order to recover the costs of administering and overseeing these funds. A rough estimate based on some campus enquiries indicates that $50M is a reasonable estimate, but this estimate needs to be refined. A second source is endowment cost recovery, currently at 15 basis points or $10M. A proposal is pending to increase the number of basis points. These funds are used to fund on going development functions and represent documented costs of administering endowment funds. Another source is gift taxes on donations, which we estimate at $30M, excluding gift taxes on gifts for operations other than research, which have already been included in the private support numbers. While we do not at present have exact numbers for some of the fund sources, the estimates we have used have seemed reasonable to several administrative officers whom we have consulted. While the remaining uncertainty needs to be eliminated to the greatest extent possible, the decentralized nature of our system may put this goal out of reach. In any case, the amount of uncertainty is relatively small compared to the overall total fund balances with which we are dealing. These uncertainties do not alter our general findings in any significant way.

Page 40 UC “Futures”
Appendix B: The Master Plan of 1960 The Master Plan for Higher Education in California (1960) continues to provide the basic foundation for the development of public higher education in California. Though all recognize that it is not written in stone, it retains influence because it has been a highly successful response to societal trends that remain in force today. Four of these have proven to be particularly important. The United States is justifiably proud of its record of college participation - usually defined as starting though not necessarily finishing college. But half of all college students at any given time are enrolled in 2-year community colleges. The Master Plan guaranteed continuation in the CSU or UC system for all such students who had performed at the appropriate academic level. It thus offered a virtually unprecedented mechanism of upward mobility for students of all racial and economic backgrounds. The Master Plan was a decisive defeat for the fragmented and divided state college system that prevailed in California through the 1950s, and that prevails in most other states to the present day. The CSU system was a hodge-podge of local colleges whose individual budgets were at the mercy of negotiations from year-to-year among the legislators that represented their districts. The University of California consisted of Berkeley, a “Southern Branch” that had become co-equal in theory only after World War II, a campus that had started as the “state college of the University of California” at Santa Barbara and whose faculty were not admitted to the academic senate until 1958, and a plan for some agricultural stations and an oceanographic institute near San Diego. In the decade that followed the Master Plan’s implementation, Cal State became a financially coordinated engine of education and development in nearly every region of the state. UC more than doubled in size, providing the state with not just one or two but eight general research campuses. Six of these are members of the select American Association of Universities; six of these occupy ranks number one through number 6 in their proportion of economically disadvantaged students as measured by Pell Grant statistics. CSU and UC form a public university network of a size, equity, efficiency, and quality that is unmatched anywhere in the United States, and arguably, anywhere in the world. The Master Plan was influenced by a first wave of awareness that the post-war United States was in the process of becoming a “knowledge society” in which higher education would pay a decisive role. One of the principal architects of the Master Plan, UC President Clark Kerr, wrote in the early 1960s that “the basic reality for the university is the widespread recognition that new knowledge is the most important factor in economic and social growth. We are just now perceiving that the university’s invisible product, knowledge, may be the most powerful single element in our culture, affecting the rise and fall of professions and even of social classes, of regions and even of nations.” This view placed a new urgency behind the quality of both graduate and undergraduate programs. A leading knowledge economy required a larger percentage of the population to be educated to higher

Page 41 UC “Futures”
levels of complex proficiency than had ever been the case in the past. The Master Plan recognized that the new post-war “knowledge factories” like UC had been built with public funding. Kerr’s generation of educational leaders remembered the very small research programs going forward at major universities prior to World War II. Stanford University’s entire research budget for 1935, funded wholly by the President’s office, was $5000. Research budgets multiplied tenfold in subsequent years, and then multiplied tenfold again. Having seen California transformed by federally-funded aerospace, electronics, communications, and early computer science, and noting the existence of a far larger middle-class than had ever existed before, educational leaders like Kerr, even when deeply concerned, as Kerr was, by the strings that came with public money, intended the Master Plan to protect the indispensable tie between research universities and public funds. In sum, the Master Plan can be regarded as an unusual attempt to synthesize excellence and access. The quality of the public university was to be as good as the best private universities; at the same time, the public system would offer at least some higher education to 100 percent of the state’s high school graduates. In detailing the requirements of such an educational system, the Master Plan confirmed several defining features of the University of California. Student Access: Financial In part because the “knowledge society” required the use of the full range of a population’s talents, a student’s financial position should not be considered a barrier to access to higher education. The Master Plan stated that “the two governing boards reaffirm the long established principle that state colleges and the University of California shall be tuition free to all residents of the state” (“tuition” being defined as “student charges for teaching expense”). The Survey Team suggested that “fees” could be raised “to cover the operating costs of services not directly related to instruction,” by which they meant health care, counseling, special laboratory costs, intercollegiate athletics, and the like (largely covered by the “Registration Fee”). All “ancillary” services like housing and parking were to be self-supporting. Student Access: Academic The Master Plan sought to reconcile open access with high standards of academic preparation. The community college system would be open to 100% of the state’s high school graduates, and would serve as a “proving ground” for those who had fallen short of college standards in high school. Direct access to the State Colleges and UC as first-year students would be limited to the top 33% and 12.5% of the high school graduate population (tightened from the de facto 50% and 15% eligibility rates of the time). All community college students who met basic performance standards could transfer to a State College or UC campus.

Page 42 UC “Futures”
Research and Graduate Programs Expenditures on research in California public higher education had more than tripled between 1948-49 and 1957-58 (from about $14.2 million to $50.5 million). The Sputnik-induced boom in federal expenditures was well under way, and no limit on research growth was envisioned in the report. Although graduate education was a source of conflict among the various parties to the Plan, no specific analyses or provisions were part of the final document. Faculty and Staff Salaries The Survey Team did not conduct a special analysis State Funding Levels The Master Plan noted that “expenditures for higher education have more than tripled during the decade 1948-49 through 1957-58,” and its authors were concerned about the public cost of a high-quality higher education system. (During the same period, expenditures for capital outlay in public universities had increased 481%). The report also stated that “State funds have provided more than half the costs of public higher education in California, comprising about 55 per cent of all current expenditures and 65 per cent of capital outlay expenditures” (152). Projections suggested that by 1975, two-thirds of the cost of higher education would need to be paid by the state (168). As for the state’s taxpayer “effort” toward funding higher education, the Plan’s technical committee found that California was 25th out of 48 states in “per capita expenditures on higher education” (at about two-thirds of 1 percent of per-capita income). “On the basis of the average per cent of total personal income spent for public higher education for the years 1952-58, California ranked thirty-fourth (187). Though “In 1957-58, 13.38 per cent of the General Fund expenditures were for the support of higher education” (187), the state’s comparative spending rate was not extravagant. The Plan did not always express confidence in the willingness of the state population of 1960 to sustain higher education expenditures. “Some states devote nearly three times as high a per cent of their incomes to public higher education as does California. Even though this state possesses the taxable wealth, a critical question concerns its willingness to use larger proportions of this wealth for its educational welfare” (191). The Plan’s final sentences declare that “California can and will, as in both the past and present, provide adequate support for an efficient program of public higher education designed to meet fully the rapidly changing needs of society” (196). But the Master Plan designers faced the same issue educational leaders face today: would a population accustomed to moderate rates of taxation be willing to pay for high-quality and quasi-universal access to higher education?
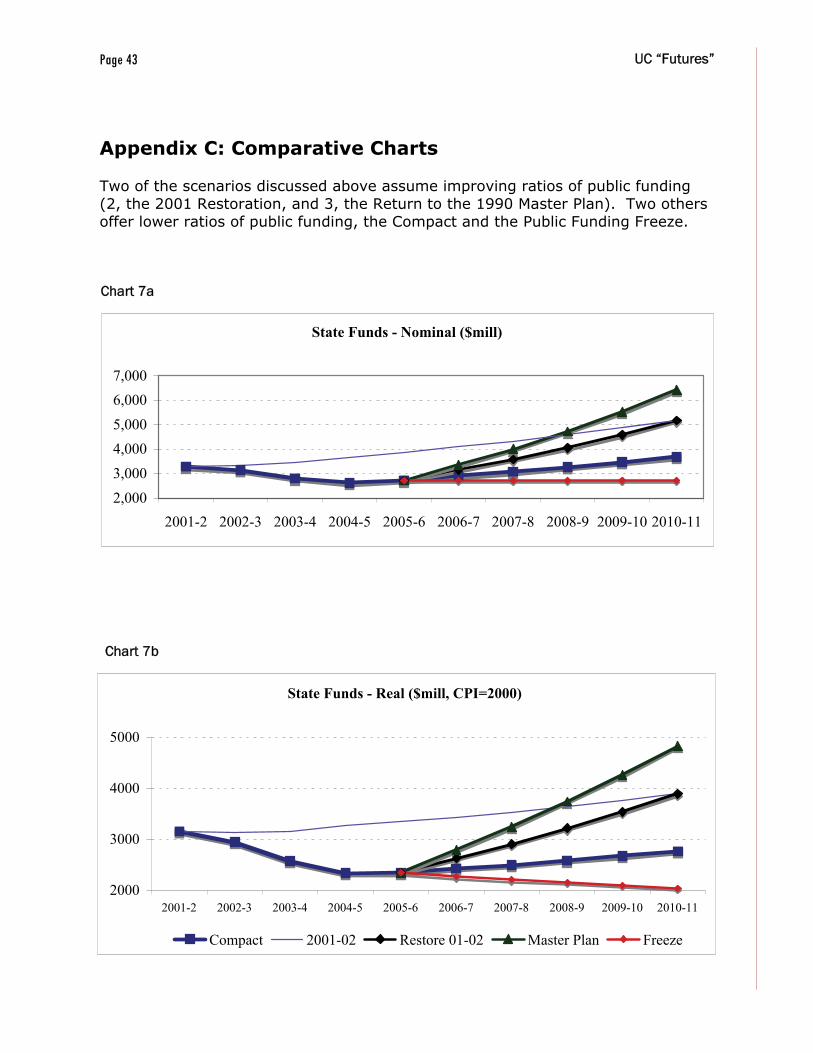
Page 43 UC “Futures”
Appendix C: Comparative Charts
Two of the scenarios discussed above assume improving ratios of public funding (2, the 2001 Restoration, and 3, the Return to the 1990 Master Plan). Two others offer lower ratios of public funding, the Compact and the Public Funding Freeze.
Chart 7a
Chart 7b
State Funds - Nominal ($mill)
2,0003,0004,0005,0006,0007,000
2001-2 2002-3 2003-4 2004-5 2005-6 2006-7 2007-8 2008-9 2009-10 2010-11
State Funds - Real ($mill, CPI=2000)
2000
3000
4000
5000
2001-2 2002-3 2003-4 2004-5 2005-6 2006-7 2007-8 2008-9 2009-10 2010-11
Compact 2001-02 Restore 01-02 Master Plan Freeze
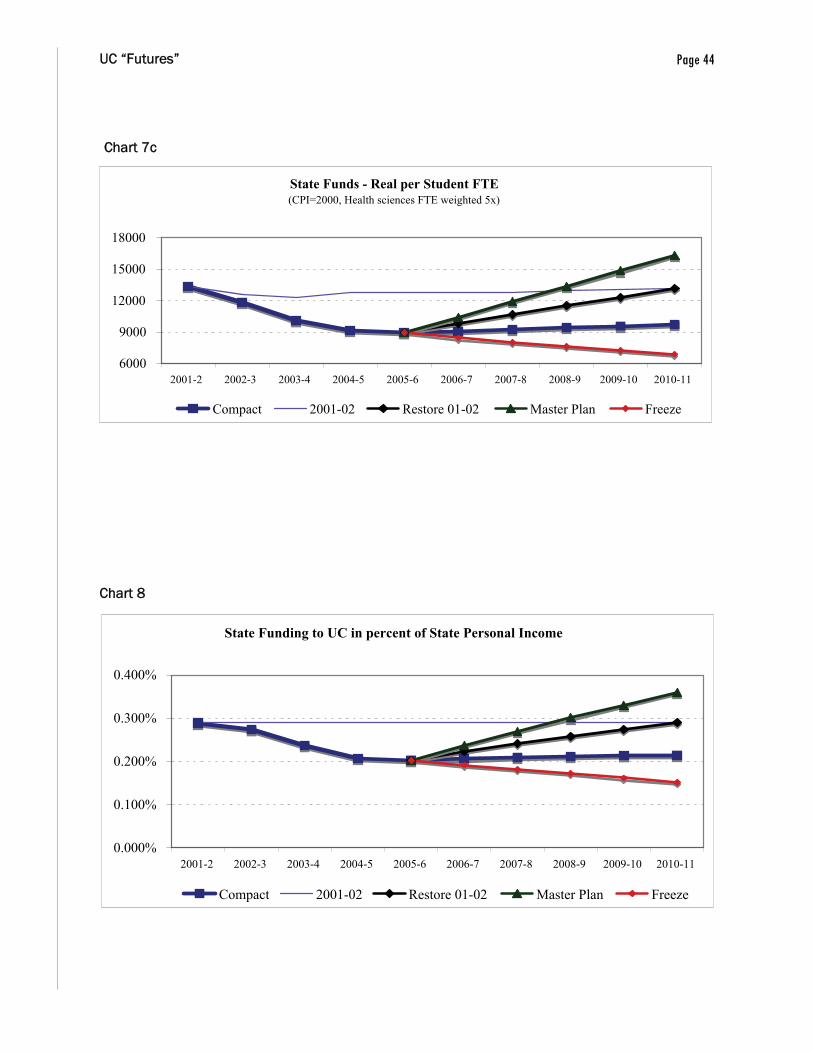
Page 44 UC “Futures”
Chart 7c
Chart 8
State Funds - Real per Student FTE (CPI=2000, Health sciences FTE weighted 5x)
6000
9000
12000
15000
18000
2001-2 2002-3 2003-4 2004-5 2005-6 2006-7 2007-8 2008-9 2009-10 2010-11
Compact 2001-02 Restore 01-02 Master Plan Freeze
State Funding to UC in percent of State Personal Income
0.000%
0.100%
0.200%
0.300%
0.400%
2001-2 2002-3 2003-4 2004-5 2005-6 2006-7 2007-8 2008-9 2009-10 2010-11
Compact 2001-02 Restore 01-02 Master Plan Freeze
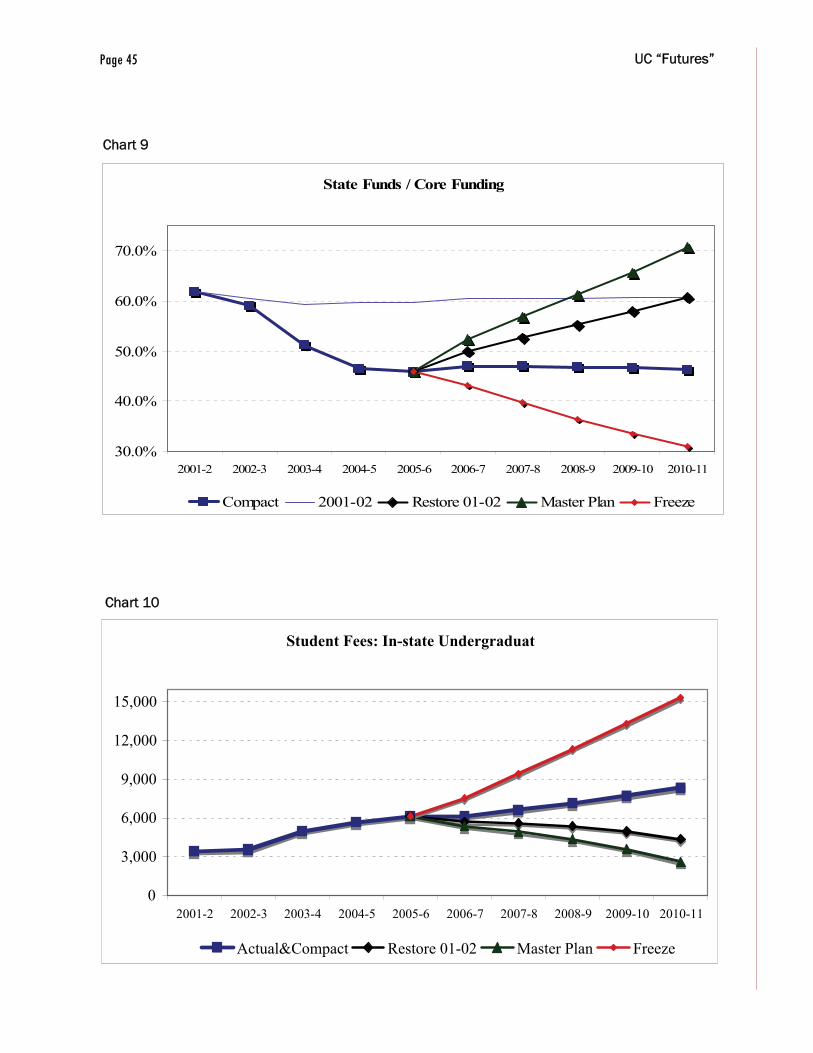
Page 45 UC “Futures”
Chart 9
State Funds / Core Funding
30.0%
40.0%
50.0%
60.0%
70.0%
2001-2 2002-3 2003-4 2004-5 2005-6 2006-7 2007-8 2008-9 2009-10 2010-11
Compact 2001-02 Restore 01-02 Master Plan Freeze
Student Fees: In-state Undergraduat
0
3,000
6,000
9,000
12,000
15,000
2001-2 2002-3 2003-4 2004-5 2005-6 2006-7 2007-8 2008-9 2009-10 2010-11
Actual&Compact Restore 01-02 Master Plan Freeze
Chart 10

46
Page 46 UC “Futures”
Blank Page
Page 47 UC “Futures”
NOTES 1. Available on line at http://www.universityofcalifornia.edu/senate/reports/
ac.uc.public.status.11.05.pdf 2. The Higher Education Compact is on line at http://budget.ucop.edu/2005-
11compactagreement.pdf, accessed February 28, 2006. 3. Tom Mortgensen, “Social Inclusion in Tertiary Education,” 27 January 2006, on
line at http://postsecondaryopportunity.blogspot.com/. 4. The National Center for Public Policy and Higher Education, “Income of U.S.
Workforce Projected to Decline if Education Doesn’t Improve,” Policy Alert November 2005: 1.
5. Nancy Shulock and Colleen Moore, “Diminished Access to the Baccalaureate for Low-Income and Minority Students in California: The Impact of Budget and Capacity Constraints on the Transfer Function, Educational Policy 19:2 (May 2005): 418-442; Tom Mortgensen and Nancy Brunt, “College Affordability Measures by State, Family Income and Sector for Full-time, Full-Year, Single Institution Dependent Undergraduate Students for State Residents 2004” (Postsecondary Education Opportunity, November 2005), at http://www.postsecondary.org; the Educational Policy Institute, “Beyond the 49th Parallel II: The Affordability of University Education” (Virginia Beach, VA: 2006): 5. Available on line at http://www.educationalpolicy.org.
6. See Gerald R. Kissler and Ellen Switkes, “The Effects of a Changing Financial Context on the University of California,” Center for Studies in Higher Education Research & Occasional Paper Series: CSHE.16.05 (December 2005).
7. This being said, however, the proportion of California’s population below age 22 was much higher (c.2x) during the Pat Brown and Reagan years than it is today. Despite (or perhaps because of) this fact the citizens were willing to spend c. 2x per UC student (in constant dollars) what it spends today, and UC accounted for c. 2x its present proportion of the total state budget.( If there is less support for UC now, it may be partially because voter participation has a different demographic than UC enrollment.)
8. Source for charts 1a and 1b: Department of Finance tables, on line at www.lao.ca.gov/LAOMenus/laomenueconomics.aspx, consulted 09/04; prepared by Jonathan Polansky.
9. This chart’s time path is slightly distorted by General Fund volatility, being affected by capital gains realizations among other unstable variables, and hence are not as suitable as scale variable as either State Personal Income or Core funding needs.
10. Thomas J. Kane and Peter R. Orszag, “Use of State General Revenue for Higher Education Declines,” Tax Policy Center and the Urban Institute, 2002; on-line at http://www.urban.org/UploadedPDF/1000462_education.pdf, accessed March, 2006.
11. SHEEO, “State Higher Education Finance Executive Overview, FY2004,” 5, on-line at http://www.sheeo.org/finance/cc_shef_sv05_v2.pdf, accessed March 2006.
Page 48 UC “Futures”
12. Kane and Orszag, op cit p. 281. Higher education budgets increased in nominal dollars during the late 1990s because national income increased during that period, not because of any significant increase in higher education’s share of tax revenues.
13. For each new student UC had received, during those relatively good years, a marginal increment to its budget of approximately half the average cost of educating existing students. (About $8800 per student FTE was reaching the campuses in the early 2000s [UCSB figures; Kissler and Switkes estimate $9120 per student FTE from the General Fund (p. 10)]. During that period, UC was estimating undergraduate instructional costs at about $18,000 per year in 2004 dollars. Even if this marginal increment had been fully funded after the downturn, the average state expenditure per student was bound to drop significantly as a result of rapid enrollment growth. It is likely that UC planners were aware that taking more students while at the same time accepting fractional state funding per student would require (and strengthen) the argument for higher tuition in the 2000s. The 2001-2002 downturn reinforced a trajectory toward higher tuition (that is, more private family funding of a UC education) that would appear to have been built into UC expansion.
14. Kissler and Switkes, op cit., p 8. 15. Long Range Planning Task Force, “Regents’ Benchmarks Update: Maintaining
Excellence During a Period of Exceptional Growth” (September 2005), slide 67.
16. Kissler and Switkes, op cit. 17. “HIGHER EDUCATION COMPACT: Agreement Between Governor
Schwarzenegger, the University of California, and the California State University, 2005-06 through 2010-11,” on line at http://www.universityofcalifornia.edu/news/compact/compact.pdf, accessed November 2005.
18. These calculations appear in the discussion of Scenario 1 below. 19. See for example Shelia Slaughter and Stuart Leslie, Academic Capitalism:
Politics, Policies, and the Entrepreneurial University (Johns Hopkins University Press, 1997); and Shelia Slaughter and Gary Rhoades, Academic Capitalism and the New Economy : Markets, State, and Higher Education (Baltimore: Johns Hopkins University Press, 2004).
20. On this topic see Academic Council Report, “The Decline of UC as a Great International University,” on line at http://www.universityofcalifornia.edu/senate/reports/ac.uc.decline.10.05.05.pdf, accessed February 28, 2006.
21. While these fees doubled, roughly speaking, in nominal dollars from 2001-05, administrators argued that they remained relatively low. This suggests that they will not be averse to continuing to raise professional school fees in the future.
22. Minor fluctuations should be ignored as too small to be meaningful. 23. Values in this table have changed from Version 2.01 due to the new inclusion
of UC Retirement Program charges.

Page 49 UC “Futures”
24. Table 2 is based on the following estimated enrollments:
25. Note that per-student funding would have dipped even if funding/personal income had stayed constant at 2001-02 funding levels.
26. This can be a self-fulfilling prophecy: The more often state legislatures force public universities to increase tuition, the higher will be the proportion of the student body that can afford to pay higher tuition. See Tom Mortenson’s estimates of the effect of tuition increases on participation rates. Morgenson has noted recently that the participation of Pell Grant students at public universities has been rising at about one-third the rate of Pell Grant increases in higher education as a whole, as public universities increasingly chase more affluent and out-of-state students (“College Participation Rates for Low-Income Students,” on line at http://postsecondaryopportunity.blogspot.com/2005/12/college-participation-rates-for-low.html, accessed March 2006.
27. The Legislative Analyst’s Office for the state of California projects that annual inflation will decline from around 3.5% now to 2.6% in 2011.
28. Many analysts now use a “net tuition” approach to calculate real college affordability, but such calculations do not have much impact on media coverage or public debate. The Department of Education’s Commission on the Future of Higher Education has assembled much testimony on the impact of increased costs on student experience and public perception; for one report, see “Public Hearings, Take 2, Inside Higher Ed March 21, 2006, on line at http://insidehighered.com/news/2006/03/21/commission.
29. We have not separated out either the non-tuition portion of USAP money or the portion that is used for TA fee remission.
30. One especially effective advocate of high tuition-high aid is James C. Garland, President of Miami University of Ohio. See his “How to Put College Back Within Reach: Better Uses for State Education Dollars,” Washington Post 30 December 2005: A27. Garland writes, “Imagine if there were, in its place, a food subsidy program by which the government paid that $27 billion directly to supermarkets. Under such a program needy families would benefit little, because most of the savings would be passed on to customers who didn't need help. That would be an inefficient use of public money. But this is precisely what happens in public higher education. When states pay their universities to hold down tuition charges, they are indirectly subsidizing wealthy and poor students alike.” For a supportive commentary from the President of the American Council on Education, see David C. Ward, “A Dramatic Step in Education Financing,” The Presidency Magazine. by Dr. David Ward, President,
Student FTE: 2001-2 2002-3 2003-4 2004-5 2005-6 2006-7 2007-8 2008-9 2009-10 2010-11
General Cam-
pus 173,000 183,000 189,000 188,000 193,000 197,000 202,000 207,000 212,000 218,000
Total (incl.
health) 185,000 196,000 202,000 201,000 207,000 211,000 217,000 222,000 228,000 233,000
Page 50 UC “Futures”
American Council on Education. 31. In the private universities where this policy has a substantial track record, it
appears to increase a university’s incentive to admit even more wealthy students (both wealthier students and more of them) in order to offset the costs of tuition discounting as they grow with increases in tuition. This may have the odd effect of making “how rich you are” a legitimate factor in admissions, since the tuition-capacity thus admitted subsidizes poorer students and thus student body diversity. How rich you are, if you are rich, can become as legitimate a factor in admissions decisions as is diversity in admitting the poor.
32. William G. Bowen, Martin A. Kurzweil, Eugene M. Tobin, Equity and Excellence in American Higher Education (Charlottesville, Va.: University of Virginia Press, 2005), 85. Some studies suggest that demand is relatively insensitive to price at the highest levels of preparedness - among students that are competing for admission to elite private universities as well as to public flagships. Price remains important to all other groups of students (Bowen et al, op cit. 87, discussing Caroline M. Hoxby, “Testimony Prepared for U.S. Senate, Committee on Governmental Affairs, Hearing on ‘The Rising Cost of College Tuition and the Effectiveness of Government Financial Aid,” February 9, 2000, in Senate Committee on Governmental Affairs).
33. Eric Gould, The University in a Corporate Culture (New Haven, Conn.: Yale University Press, 2003), 62.
34. As an example of the evidence, In public colleges “in 1995, the average per student institutional grant aid to dependent undergraduates with family incomes below $20,000 was three and a half times as large as the aid to students with incomes above $100,000, $836 compared to $239. By 1999, the lowest income students got only 35 percent more than the highest income students, $838 versus $619,” “Unintended Consequences of Tuition Discounting,” Lumina Foundation for Education 5: 1 (May 2003), on line at http://www.luminafoundation.org/publications/Tuitiondiscounting.pdf
35. On the general trend, the higher education authority Patrick Callan has noted that “ Because a state’s most pressing problem during a recession is lack of revenue, states are unlikely to make new or additional investments in student financial aid that will offset increases in tuition. Indeed, student aid may be reduced, exacerbating the problem. An example from the recent past: In California over the initial three years of the 1990s recession, state support for the University of California was reduced by 19%, for the California State University by 12%, and for the community colleges by 1%. The higher education institutions raised tuition, but state-funded student financial aid was reduced by 15%. One result of the financial aid cuts and related policies: California’s public institutions ended up serving some 200,000 fewer students” (Patrick M. Callan, “Coping with Recession Public Policy, Economic Downturns and Higher Education,” The National Center for Public Policy and Higher Education (February 2002), 21.
36. Studies at several campuses suggest that one result of poor general increases has been an increase in special raises for individuals. The recent increases contemplated for senior managers is one example. Increases in retention
Page 51 UC “Futures”
cases are another. Many personnel administrators have noted an increase in off-scale salaries, and the emergence of something like a two-tier system - the official scale with its specified step increases, and a significantly higher unofficial “scale” constituted by the large number of faculty “off-scale.” This latter number many on some campuses be as high as 50%. Thus a system of small general salary increases comes to devote increases proportions of its unallocated sub-0 funds to funding large numbers of exceptional salaries. The economy of small increases is partially defeated, basic equity is strained, threatening productivity and morale, and, since the only way to be sure to be stuck with zero or small increases is not to seek other positions, this system establishes a perverse non-reward for loyalty. The Compact does not resolve these challenges to the step system.
37. This figure is close to the average of the last half of the 1980s). UC’s share of state personal income in 1990-1991 was 0.33%.
38. This calculation is based on “Understanding the University of Michigan Budget,” on line at http://www.umich.edu/~urel/budget/understanding.html. Their chart shows the state contribution to be 26% of the budget indicated here, which excludes federal contracts and grants, health centers, and other sales and services. We add, very roughly about $250 million to what UM calls the General Fund ($ 1220 million in their chart) to take account of endowment income, STIP interest, and our definition of non-research gifts for operations, endowment cost recovery, etc., which brings the state share down from 26% to 22%. For un-disaggregated data on Vermont, see http://www.uvm.edu/~isis/uvmfs/uvmfs05.pdf.
39. We acknowledge that our assumption of regulated reductions in public funding is not entirely realistic. Such a scenario is more likely to arrive through a series of uneven crises and through a mélange of local and state-wide decisions, many of which will be at odds with each other and create new inefficiencies.
40. These calculations assume a 33% return-to-aid. 41. Actual average payout 2003-04 was 3.87% 42. By 2010-2011, other public universities may have followed Miami University of
Ohio’s decision to charge Ohio residents the same tuition as out of state students and then subtract $5000 to $6200 in the from of a state grant given to each Ohio student. In 2005-6, that common tuition charge was $19,718. Colorado has begun to experiment with a similar “voucher” policy but had not eliminated reduced tuition for state residents.
43. For a discussion of this issue in relation to the University of Virginia’s competition with peers such as Duke, Georgetown, and the University of North Carolina Hill, see Sarah E. Turner, “Higher Tuition, Higher Aid, and the Quest to Improve Opportunities For Low Income Students in Selective, Public Higher Education,” draft on line at http://www.ilr.cornell.edu/cheri/conf/chericonf2005/Turner%20Conference%20Paper.pdf
44. There is a substantial literature on student responses to rising fees. Much of the literature addresses the “macro” question of how a student’s decision to go to college (anywhere) responds to changes in cost. This differs from the question in this scenario, which is how many fewer students will attend UC

Page 52 UC “Futures”
when UC fees rise; much of the literature has debated this question in relation to the “high tuition high aid” model that in many cases is coupled with declining public funding for public universities. Notable discussions include a survey article by Larry Leslie and Paul Brinkman ( “Student price responses in higher education: the student demand studies”, Journal of Higher Education 58, 1987, 181-204) and a recent piece by Susan Dynarsky (“Does Aid Matter?” American Economic Review 93 March 2003, 279-288). Dynarsky summarizes the literature as predicting enrollment rates to decline by 3-5 percent per $1000 increase in net fees; her characterization is consistent with Leslie and Brinkman. Percentage changes in college enrollment are obtained by dividing change in enrollment rate by the enrollment level. Thus, since in California about 52% of high school students enroll in college, we can expect a 6%-10% decline in enrollment per $1000 increase in net fees. Our projections are based on the lower bound value of 6%. We feed this response into enrollment data for new students only, i.e., we abstract from responses by existing students (drop-out) and from responses to anticipated or announced future fee increases. We assume that the enrollment response would apply to the student body that would normally have enrolled at UC, i.e., students satisfying normal quality standards. The difference with respect to projected enrollment under the Compact is our measure of decline in quality enrollments.
45. Thomas J. Kane, “Rising Public College tuition and College Entry: How Well do Public Subsidies Promote Access to College?” National Bureau of Economic Research Working Paper no. 5164 (July 1995), 25.
46. Tuition charges are approximate as they vary across colleges and schools. “Admissions Related Policies and Statistics,” University of Michigan, data on line at http://sitemaker.umich.edu/obpinfo/files/umaa_freshprof.pdf
47. http://www.umich.edu/~urel/budget/understanding.html 48. Lance J. Weislak and Michael D. LaFaive, “Privatize the University of Michigan,”
Mackinac Center for Public Policy, March 2004, on line at http://www.mackinac.org/article.aspx?ID=6313. One report suggests that the University of Vermont, regarded as up-and-coming and even as a “public Ivy” in the 1980s, has not sustained that trajectory under its high tuition-high financial aid-low state support policy, sometimes called the Vermont Model. See Kevin Kelley, “Dollars for Scholars,” (2002), for United Professions of Vermont/AFT, on line at http://www.upvaft.org/articles/index.php?id=54
49. Kevin Bergquist, “Commission: Education Key to Michigan’s Economic Success,” The University Record 10 January 2005, on line at http://www.umich.edu/~urecord/0405/Jan10_05/05.shtml
50. http://sitemaker.umich.edu/obpinfo/files/umaa_freshprof.pdf 51. Based on a Detroit Free Press study of 2003, cited in Weislak and LaFaive, op
cit. 52. In 2006, the economist and President Emerita of the University of Wisconsin,
Katharine C. Lyall, co-authored the following observations: The financial and political trends driving privatization seem likely to continue for some years. There seems to be little appetite as yet among state legislators to tackle the basic structural budget problems they face. Moreover, the federal government continues to shift to the states the
Page 53 UC “Futures”
responsibility to meet domestic needs that are increasing at both ends of the age spectrum, from K-12 education to health care for the aged. . . . Meanwhile, growing demand for college admission (the U.S. Department of Education projects a 10 percent increase in the next five years) will pressure universities to expand enrollments without adequate funding to deliver successful student performance. Unless we can develop a new model of a “public-purpose institution,” some public universities will decline in quality, smaller ones will eventually close, and the nation will drop farther down the list of countries with college-educated populations, to the detriment of individual quality of life and our national economic future. This is not a remote fantasy. In the past few years, a number of small colleges have closed, and larger institutions have tightened admissions. Community colleges in California shut their doors to 175,000 students and Florida turned away 30,000 in fall 2003. Some other institutions are quietly closing admissions earlier, deferring the matriculation of some applicants who cannot be served immediately, or setting explicit enrollment caps based on declining staff and instructional capacity. In others, growing numbers of students are admitted but left to scramble for the courses they need in a stiff competition with other students. Flagship institutions will rebalance their roles between research and instruction to focus on those portions of their mission that can be self-sustaining, resulting in fewer and smaller first-quality public research universities. Meanwhile, two- and four-year comprehensive state universities that largely confine themselves to undergraduate instruction and have fewer, less affluent alumni will experience intensified enrollment pressures and quality erosion. This Darwinian approach to public higher education may save the institutions best adapted to the market, but it will weaken the array of affordable, high-quality postsecondary institutions and reduce the proportion of Americans with college opportunities. (Katherine C. Lyall and Kathleen R. Sell, “The De Facto Privatization of American Public Higher Education,” Change (January-February 2006)).
53. Clark Kerr, Uses, v-vi. Kerr relies on the pioneering research of Princeton economist Fritz Machlup in The Production and Distribution of Knowledge in the United States (Princeton, N.J.: Princeton University Press, 1962). Machlup estimated that “the production, distribution, and consumption of ‘knowledge’ in all its forms” accounted for “29 percent of gross national product . . .; and ‘knowledge production’ is growing at about twice the rate of the rest of the economy” (Uses, 88).
54. Stanton A. Glantz, et al, “D.O.D Sponsored Research at Stanford Vol II: Its Impact on the University”(1971).
55. “The plan for this study includes the following two questions pertaining to student fees. “How much of the costs of public higher education should be borne by the students? ” “Should the present fee structure be altered?” The important issue here is whether an increase in the cost to the students can be levied without depriving many able and qualified youth of educational opportunity and in so doing fail to meet the needs of society for trained
Page 54 UC “Futures”
personnel” (172). 56. A Master Plan for Higher Education in California, 1960-1975 (1960), p. 14.
Available on line at http://www.ucop.edu/acadinit/mastplan/MasterPlan1960.pdf, accessed January 8, 2005. Elsewhere the Plan stated, “Continuing a principle in the Organic Statutes of California in 1867-68, under which the University of California was created, public higher education institutions in California do not charge tuition to bona fide legal residents of the state” (172). The Survey Team also offered the following remarks: “The Survey Team believes that the traditional policy of nearly a century of tuition-free higher education is in the best interests of the state and should be continued. The team noted with interest an address given in May, 1958, by President James L. Morrill of the University of Minnesota, who commented as follows on the desire of some organizations and individuals to raise tuition and fees to meet the full operating costs of public institutions of higher education:
This notion is, of course, an incomprehensible repudiation of the whole philosophy of a successful democracy premised upon an educated citizenry. It negates the whole concept of wide-spread educational opportunity made possible by the state university idea. It conceives college training as a personal investment for profit instead of a social investment. No realistic and unrealizable counter-proposal for some vast new resource for scholarship aid and loans can compensate for a betrayal of the “American Dream” of equal opportunity to which our colleges and universities, both private and public, have been generously and far-sightedly committed. But the proposal persists as some kind of panacea, some kind of release from responsibility from the pocketbook burdens of the cherished American idea and tradition. It is an incredible proposal to turn back from the world-envied American accomplishment of more than a century. (cited 173)
57. “At the University of California, total expenditures increased during the ten-year period from 65 million to 173 million dollars, a 167 per cent increase. Current expenditures mounted from approximately 53 million to 145 million dollars, an increase of 175 per cent. At the same time the yearly capital outlay increased from 12 million to 28 million dollars, a 133 per cent increase” (153).
Related Documents