http://www.uem.br/acta ISSN printed: 1679-9283 ISSN on-line: 1807-863X Acta Scientiarum Doi: 10.4025/actascibiolsci.v35i2.14202 Acta Scientiarum. Biological Sciences Maringá, v. 35, n. 2, p. 219-231, Apr.-June, 2013 Current and historical climate signatures to deconstructed tree species richness pattern in South America Matheus de Souza Lima-Ribeiro 1,2* , Frederico Valtuille Faleiro 2 and Daniel Paiva Silva 2 1 Departamento de Ciências Biológicas, Universidade Federal de Goiás, Rua Riachuelo, 1530, Cx. Postal 3, 75804-020, Campus Jataí, Setor Samuel Graham, Jataí, Goiás, Brazil. 2 Programa de Pós-graduação em Ecologia e Evolução, Universidade Federal de Goiás, Cx. Postal 131, 74001-970, Goiânia, Goiás, Brazil. *Author for correspondence. E-mail: [email protected] ABSTRACT. The purpose of this study was to investigate the importance of present and historical climate as determinants of current species richness pattern of forestry trees in South America. The study predicted the distribution of 217 tree species using Maxent models, and calculated the potential species richness pattern, which was further deconstructed based on range sizes and modeled against current and historical climates predictors using Geographically Weighted Regressions (GWR) analyses. The current climate explains more of the wide-ranging species richness patterns than that of the narrow-ranging species, while the historical climate explained an equally small amount of variance for both narrow-and-wide ranging tree species richness patterns. The richness deconstruction based on range size revealed that the influences of current and historical climate hypotheses underlying patterns in South American tree species richness differ from those found in the Northern Hemisphere. Notably, the historical climate appears to be an important determinant of richness only in regions with marked climate changes and proved Pleistocenic refuges, while the current climate predicts the species richness across those Neotropical regions, with non- evident refuges in the Last Glacial Maximum. Thus, this study's analyses show that these climate hypotheses are complementary to explain the South American tree species richness. Keywords: climate changes, glacial refuges, water-energy availability, GWR analysis, spatial non-stationarity. Efeitos dos climas atual e histórico no padrão desconstruído de riqueza de espécies arbóreas na região Neotropical RESUMO. O objetivo deste estudo foi testar qual dos climas, atual ou histórico, é o principal preditor do padrão atual de riqueza de espécies arbóreas de interesse comercial. Nós modelamos a distribuição de 217 espécies usando Maxent e usamos esses mapas preditivos para obter o padrão de riqueza de espécies. A riqueza foi desconstruída em relação ao tamanho da distribuição geográfica das espécies e modelada contra os climas atual e histórico utilizando Regressões Geograficamente Ponderadas. O clima atual explicou melhor o padrão de riqueza das espécies com ampla distribuição geográfica do que de espécies com distribuição restrita, enquanto o clima histórico explicou a mesma variância na riqueza dos dois grupos de espécies. Nossas análises com plantas sul americanas mostram diferentes relações da riqueza de espécies ampla e restritamente distribuídas com os climas atual e histórico, quando comparado aos resultados encontrados no hemisfério norte. O clima histórico se mostra como importante preditor da riqueza somente em regiões com mudanças climáticas acentuadas e onde ocorreram refúgios Pleistocênicos, enquanto o clima atual é o melhor da riqueza nas regiões Neotropicais sem evidências de refúgios durante o máximo da ultima glaciação. Dessa maneira, nossos resultados indicam que essas hipóteses são complementares para explicar a riqueza predita de espécies arbóreas da América do Sul. Palavras-chave: mudanças climáticas, refúgios glaciais, disponibilidade hídrico-energética, análise GWR, não-estacionaridade espacial. Introduction The understanding on factors that affect species distributions in space and time is an essential issue in Ecology, Evolution, and Conservation Biology (SVENNING et al., 2008). It enables us to predict the consequences of human disturbances on global biodiversity, as well as their implications for future species’ conservation and endurance (BROOKS et al., 2006) variables on biodiversity patterns is an important focus of investigation in macroecology (WILLIG et al., 2003 for a deeper review). Climate, probably the most important factor determining broad-scale species distributions, influences species both directly, affecting their intrinsic physiological tolerances, and indirectly, by changing their interactions with other species. Although actual climate-related characteristics have an important role on contemporary species richness

Welcome message from author
This document is posted to help you gain knowledge. Please leave a comment to let me know what you think about it! Share it to your friends and learn new things together.
Transcript
http://www.uem.br/acta ISSN printed: 1679-9283 ISSN on-line: 1807-863X
Acta Scientiarum
Doi: 10.4025/actascibiolsci.v35i2.14202
Acta Scientiarum. Biological Sciences Maringá, v. 35, n. 2, p. 219-231, Apr.-June, 2013
Current and historical climate signatures to deconstructed tree species richness pattern in South America
Matheus de Souza Lima-Ribeiro1,2*, Frederico Valtuille Faleiro2 and Daniel Paiva Silva2
1Departamento de Ciências Biológicas, Universidade Federal de Goiás, Rua Riachuelo, 1530, Cx. Postal 3, 75804-020, Campus Jataí, Setor Samuel Graham, Jataí, Goiás, Brazil. 2Programa de Pós-graduação em Ecologia e Evolução, Universidade Federal de Goiás, Cx. Postal 131, 74001-970, Goiânia, Goiás, Brazil. *Author for correspondence. E-mail: [email protected]
ABSTRACT. The purpose of this study was to investigate the importance of present and historical climate as determinants of current species richness pattern of forestry trees in South America. The study predicted the distribution of 217 tree species using Maxent models, and calculated the potential species richness pattern, which was further deconstructed based on range sizes and modeled against current and historical climates predictors using Geographically Weighted Regressions (GWR) analyses. The current climate explains more of the wide-ranging species richness patterns than that of the narrow-ranging species, while the historical climate explained an equally small amount of variance for both narrow-and-wide ranging tree species richness patterns. The richness deconstruction based on range size revealed that the influences of current and historical climate hypotheses underlying patterns in South American tree species richness differ from those found in the Northern Hemisphere. Notably, the historical climate appears to be an important determinant of richness only in regions with marked climate changes and proved Pleistocenic refuges, while the current climate predicts the species richness across those Neotropical regions, with non-evident refuges in the Last Glacial Maximum. Thus, this study's analyses show that these climate hypotheses are complementary to explain the South American tree species richness. Keywords: climate changes, glacial refuges, water-energy availability, GWR analysis, spatial non-stationarity.
Efeitos dos climas atual e histórico no padrão desconstruído de riqueza de espécies arbóreas na região Neotropical
RESUMO. O objetivo deste estudo foi testar qual dos climas, atual ou histórico, é o principal preditor do padrão atual de riqueza de espécies arbóreas de interesse comercial. Nós modelamos a distribuição de 217 espécies usando Maxent e usamos esses mapas preditivos para obter o padrão de riqueza de espécies. A riqueza foi desconstruída em relação ao tamanho da distribuição geográfica das espécies e modelada contra os climas atual e histórico utilizando Regressões Geograficamente Ponderadas. O clima atual explicou melhor o padrão de riqueza das espécies com ampla distribuição geográfica do que de espécies com distribuição restrita, enquanto o clima histórico explicou a mesma variância na riqueza dos dois grupos de espécies. Nossas análises com plantas sul americanas mostram diferentes relações da riqueza de espécies ampla e restritamente distribuídas com os climas atual e histórico, quando comparado aos resultados encontrados no hemisfério norte. O clima histórico se mostra como importante preditor da riqueza somente em regiões com mudanças climáticas acentuadas e onde ocorreram refúgios Pleistocênicos, enquanto o clima atual é o melhor da riqueza nas regiões Neotropicais sem evidências de refúgios durante o máximo da ultima glaciação. Dessa maneira, nossos resultados indicam que essas hipóteses são complementares para explicar a riqueza predita de espécies arbóreas da América do Sul. Palavras-chave: mudanças climáticas, refúgios glaciais, disponibilidade hídrico-energética, análise GWR, não-estacionaridade espacial.
Introduction
The understanding on factors that affect species distributions in space and time is an essential issue in Ecology, Evolution, and Conservation Biology (SVENNING et al., 2008). It enables us to predict the consequences of human disturbances on global biodiversity, as well as their implications for future species’ conservation and endurance (BROOKS et al., 2006) variables on biodiversity patterns is an
important focus of investigation in macroecology (WILLIG et al., 2003 for a deeper review).
Climate, probably the most important factor determining broad-scale species distributions, influences species both directly, affecting their intrinsic physiological tolerances, and indirectly, by changing their interactions with other species. Although actual climate-related characteristics have an important role on contemporary species richness
220 Lima-Ribeiro et al.
Acta Scientiarum. Biological Sciences Maringá, v. 35, n. 2, p. 219-231, Apr.-June, 2013
patterns (FRASER; CURRIE, 1996), historic climate is also an important determinant of such patterns (ARAÚJO et al., 2008; HAWKINS et al., 2006; SVENNING; SKOV, 2007b; SVENNING et al., 2008). Once species are expected to track down suitable areas for their permanence (JETZ et al., 2004), climatically stable areas are expected to be richer in species than unstable ones (ARAÚJO et al., 2008; HAWKINS et al., 2006). Such pattern would be primarily caused by the physiological incapacity of many species to adapt to environmentally unstable places along the evolutionary time, which may imply that only a few species would be able to survive in areas of severe climatic conditions (FRASER; CURRIE, 1996).
Dispersal ability is also a very important factor affecting current species distribution (GASTON, 2003). Theoretically, in the absence of geographical (e.g. oceans, high mountain chains, wide rivers) and physiological (e.g. isotherms) barriers, species are expected to quite succeed on occupying the geographical space, expanding their distribution to areas with suitable characteristics for their requirements, and being widely distributed elsewhere (PITELKA et al., 1997). However, disregarding local and regional constraints, such expectations do not hold for many species, even in the lack of geographical barriers (SVENNING; SKOV, 2007b; SVENNING et al., 2008). Sometimes, species are not in equilibrium with current climatic and environmental characteristics, and those with low dispersal abilities are expected to occur in suitable areas that were climatically stable during the Last Glacial Maximum (LGM; i.e. glacial refuges; see ARAÚJO et al., 2008; GRAHAM et al., 2006; SVENNING; SKOV, 2007a and b; SVENNING et al., 2008 for some examples).
On the other hand, if considering species with good dispersal abilities only (among plants, amphibians, and reptiles; ARAÚJO et al., 2008; SVENNING; SKOV, 2007b), current climate seems to play a much more strong influence on the explanation of biodiversity patterns (HAWKINS et al., 2003). However, even after some attempts to relate historical climate to current species distributions (HAWKINS; PORTER, 2003; HAWKINS et al., 2006), the quantitative estimation of past climate effects is very difficult, due to the lack of reliable climatic data from past periods (ARAÚJO et al., 2008). Nevertheless, recent advances on coupled Atmosphere-Ocean Global Circulation Models (GCMs) enables now to simulate paleoclimatic scenarios from different
geological periods and to quantify historical effects of climate on biodiversity (e.g. ARAÚJO et al., 2008).
Regarding plant distributions, previous studies in Europe showed that historical climate is an important factor determining the current narrow distribution of some species, which are not distributed in areas previously occupied by glaciers in the LGM (i.e. areas where mean annual temperatures were constantly below freezing point; SKOV; SVENNING, 2004; SVENNING; SKOV, 2007b). Although the last glaciation certainly affected global climate with no exceptions, it is expected that these patterns found among narrow-ranging European plants would not be the same in tropical regions from the Southern Hemisphere. Overall, the Pleistocene climatic changes in the Southern hemisphere occurred as a response to cold temperatures in the Northern Hemisphere during the LGM (SALGADO-LABOURIAU, 1997). However, since ice sheets did not cover the Southern Hemisphere in that period (DELCOURT; DELCOURT, 1991), it is expected that the species did not isolate in glacial refuges in most part of this hemisphere (but see GRAHAM et al., 2006 for Australian Pleistocenic refugees).
Here, we applied the Marquet et al. (2004) deconstruction approach to investigate the effects of “current climate” vs. “historic climate” hypotheses on South American tree species gradients. More specifically, we ask if historical climate contribute to explain the current richness gradients considering tree species with contrasting dispersal abilities. Additionally, we investigate two alternative hypotheses for the South American pattern of tree species richness regarding historical and current climate: 1) if South America did not glaciate during the LGM and the lowland species did not isolate in Pleistocenic refuges (COLINVAUX et al., 1996, 2000), current climate will exert a much more stronger effect on species distributions patterns than historical one, independently of the species’ dispersal abilities; 2) We expect that narrow-ranging species richness in South America will be more affected by historical climate than wide-ranging species richness, since the most recent Ice Age caused climate changes worldwide.
Material and methods
Species richness
We organized a georeferenced data set of 14,563 occurrence points for 217 South American forestry tree species presented in Carvalho (2003, 2006, 2008), which were sampled from Species Link (http://www.splink.org.br) and Global Biodiversity
Current vs. historical climate hypotheses 221
Acta Scientiarum. Biological Sciences Maringá, v. 35, n. 2, p. 219-231, Apr.-June, 2013
Information Facility – GBIF (http://www.gbif.org). The occurrence points were mapped in a grid including 1,555 cells of 110 110 km of resolution. We used the maximum-entropy technique, implemented in MAXENT v. 3.3.3a (PHILLIPS; DUDIK, 2008; http://www.cs. princeton.edu/~schapire/maxent) to model the predictive distribution for all species individually, using three main climatic variables (mean temperature of the coldest month, mean temperature of the hottest month, and annual precipitation), and one topographic variable (mean altitude) from WorldClim interpolated map database (HIJMANS et al., 2005). In order to evaluate the strength of the SDM produced by MAXENT, we partitioned the occurrence records of each species in training (75%) and test (25%) data.
The model’s prediction accuracy was evaluated from the Area under the Receiver-Operating Characteristics curve (AUC from ROC curve), obtaining the binary presence-absence maps from continuous values of habitat suitability using the lower predicted suitability value corresponding to training data, as the criterion for cases classification (Minimum training presence threshold; PHILLIPS; DUDIK, 2008). From the species presence-absence matrix, all species present in each grid cell to generate the “predicted species richness” was added (only “species richness” hereafter). Moreover, out of the total species richness, the deconstructed richness of narrow and wide-ranging species for each grid cell was calculated (see Appendix S1 for deconstruction details). The geographical range sizes were based on the species distribution maps as predicted by MAXENT across all South America.
Species richness predictors
We used five potential explanatory variables of tree species richness in South America to test our contemporary and historical climate hypotheses. Four of these variables [mean annual temperature (MAT), annual precipitation (AP), annual actual evapotranspiration (AET) and annual potential evapotranspiration (PET)] describe environmental factors affecting species distributions in the current period and that have already been extensively used in other studies assessing broad-scale plant diversity gradients (see SVENNING; SKOV, 2007b; SVENNING et al., 2008; for additional examples). MAT and AP were compiled from the WorldClim database (HIJMANS et al., 2005; www.worldclim. org/current). The monthly temperature and precipitation values were used to calculate the PET and AET using AET calculator 1.0 (http://geography. uoregon.edu/envchange/pbl/software.html). Since our
analyses might be considered “biased” by the inclusion of many current variables (MAT, AP, AET and PET) that are highly collinear, they were reduced to the first axis of a Principal Component Analysis (PCA) (LEGENDRE; LEGENDRE, 1998), which was named as the “current climate predictor”.
The fifth variable represents the historical climate, which is associated with the climatic changes during the most recent Ice Age. The study estimated the climate stability according to the last inter-glacial period until the present (last 126 thousand years before the present – 126 ky) from the changes, in the minimum and maximum surface temperature and total precipitation, to obtain the “historical climate predictor”. It also estimated the climatic stability index according to the analogous climate envelope analysis proposed by Nogués-Bravo et al. (2010). The main idea of this index is to quantify, for each cell grid, the area and average distances of climatically analogous neighboring cells between two consecutive time periods. The study would consider the climate of two grid cells analogous (analogous climate envelopes) if the difference in all three climate variables (minimum and maximum surface temperature and total precipitation) between the cells would lie within the maximum tolerance described in Ohlemüller et al. (2006; 4ºC for maximum and minimum temperatures and 400 mm for precipitation).
Statistical analyses
We used a set of Geographically Weighted Regressions (GWR) analyses to test if the deconstructed patterns of tree species richness across South America support the predictions from the contemporary and historical climate hypotheses. The GWR analyses were used instead of global OLS-based analysis due to the quadratic relationship and the non-stationary pattern between species richness and current climate. Furthermore, the GWR analyses enables us to explore the spatial non-stationarity in the relationship between species richness and the two explanatory variables (i.e., “current climate” and “historical climate”) if compared with the global OLS model (FOTHERINGHAM et al., 2002). For this, the coefficient of determination (R2) and Akaike Information Criterion (AIC) was applied to compare the GWR and OLS models.
Finally, the study also partitioned the proportion of richness variance for each range size group that was explained by current climate, historical climate, and the proportion of unexplained variation (LEGENDRE; LEGENDRE, 1998). It also calculated a Spearman coefficient of correlation
222 Lima-Ribeiro et al.
Acta Scientiarum. Biological Sciences Maringá, v. 35, n. 2, p. 219-231, Apr.-June, 2013
between the partitioned R2 of each explanatory variable and the deconstructed species richness classified by geographical range size. All these statistical analyses were performed in SAM 4.0 - Spatial Analysis in Macroecology (RANGEL et al., 2010; http://www.ecoevol.ufg.br/sam).
Results
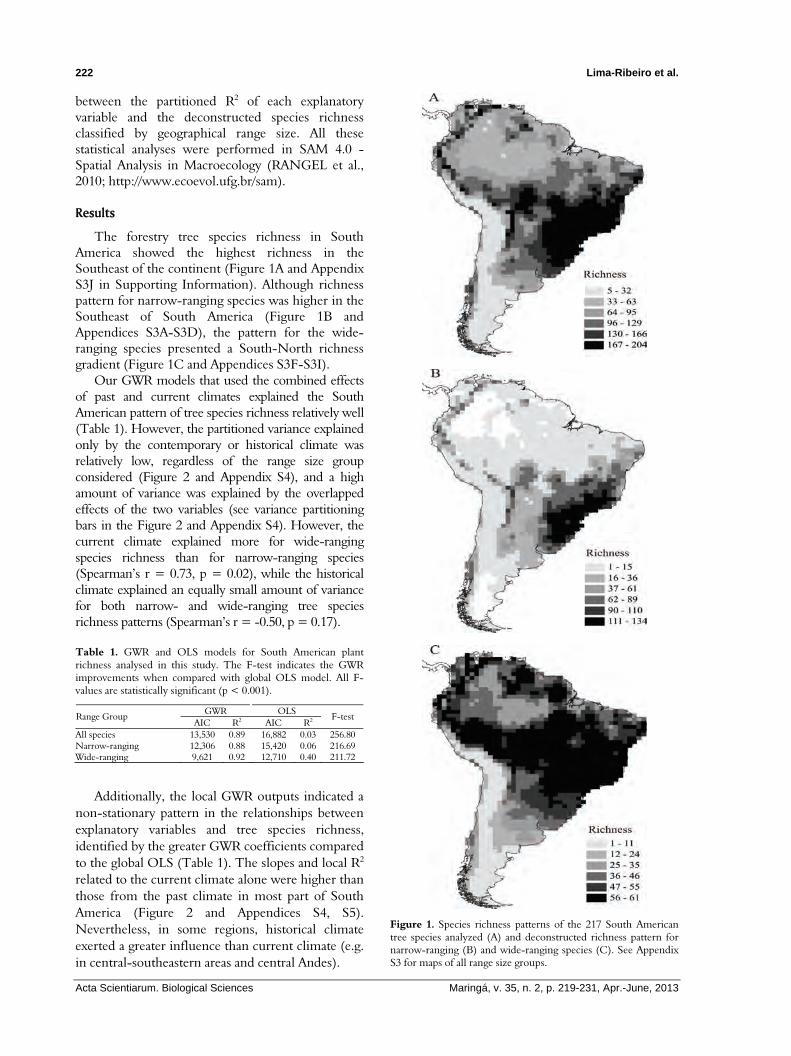
The forestry tree species richness in South America showed the highest richness in the Southeast of the continent (Figure 1A and Appendix S3J in Supporting Information). Although richness pattern for narrow-ranging species was higher in the Southeast of South America (Figure 1B and Appendices S3A-S3D), the pattern for the wide-ranging species presented a South-North richness gradient (Figure 1C and Appendices S3F-S3I).
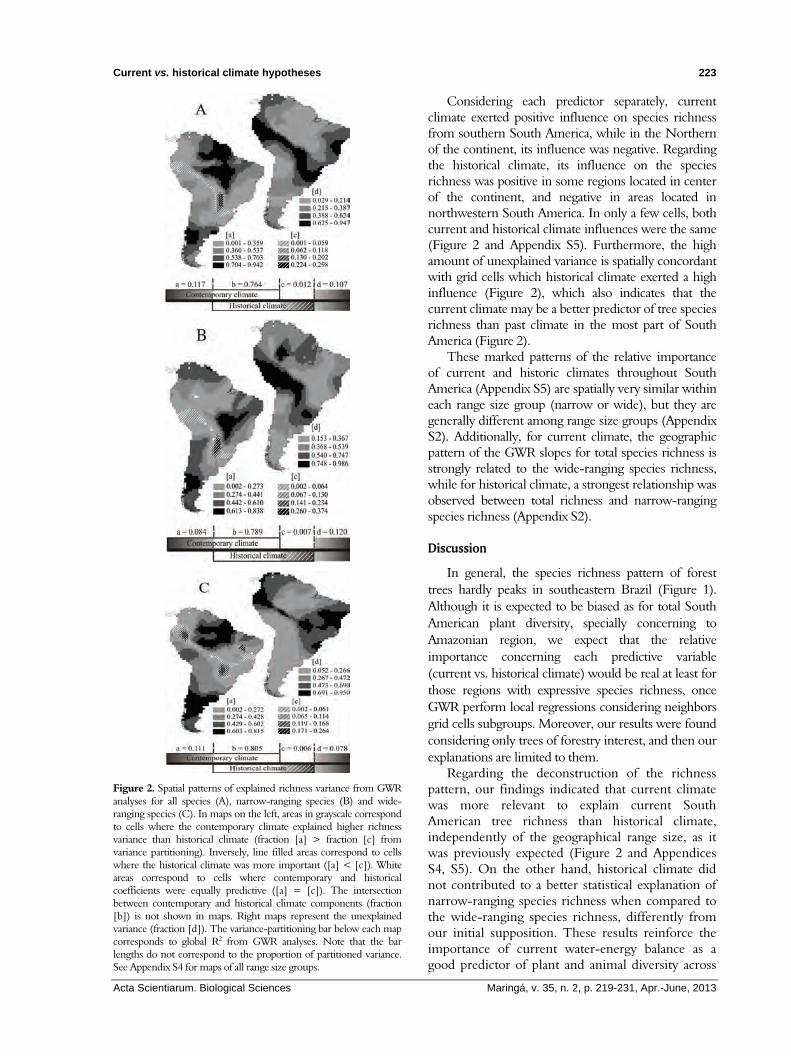
Our GWR models that used the combined effects of past and current climates explained the South American pattern of tree species richness relatively well (Table 1). However, the partitioned variance explained only by the contemporary or historical climate was relatively low, regardless of the range size group considered (Figure 2 and Appendix S4), and a high amount of variance was explained by the overlapped effects of the two variables (see variance partitioning bars in the Figure 2 and Appendix S4). However, the current climate explained more for wide-ranging species richness than for narrow-ranging species (Spearman’s r = 0.73, p = 0.02), while the historical climate explained an equally small amount of variance for both narrow- and wide-ranging tree species richness patterns (Spearman’s r = -0.50, p = 0.17).
Table 1. GWR and OLS models for South American plant richness analysed in this study. The F-test indicates the GWR improvements when compared with global OLS model. All F-values are statistically significant (p < 0.001).
GWR OLS Range Group AIC R2 AIC R2
F-test
All species 13,530 0.89 16,882 0.03 256.80 Narrow-ranging 12,306 0.88 15,420 0.06 216.69 Wide-ranging 9,621 0.92 12,710 0.40 211.72
Additionally, the local GWR outputs indicated a non-stationary pattern in the relationships between explanatory variables and tree species richness, identified by the greater GWR coefficients compared to the global OLS (Table 1). The slopes and local R2 related to the current climate alone were higher than those from the past climate in most part of South America (Figure 2 and Appendices S4, S5). Nevertheless, in some regions, historical climate exerted a greater influence than current climate (e.g. in central-southeastern areas and central Andes).
Figure 1. Species richness patterns of the 217 South American tree species analyzed (A) and deconstructed richness pattern for narrow-ranging (B) and wide-ranging species (C). See Appendix S3 for maps of all range size groups.
Current vs. historical climate hypotheses 223
Acta Scientiarum. Biological Sciences Maringá, v. 35, n. 2, p. 219-231, Apr.-June, 2013
Figure 2. Spatial patterns of explained richness variance from GWR analyses for all species (A), narrow-ranging species (B) and wide-ranging species (C). In maps on the left, areas in grayscale correspond to cells where the contemporary climate explained higher richness variance than historical climate (fraction [a] > fraction [c] from variance partitioning). Inversely, line filled areas correspond to cells where the historical climate was more important ([a] < [c]). White areas correspond to cells where contemporary and historical coefficients were equally predictive ([a] = [c]). The intersection between contemporary and historical climate components (fraction [b]) is not shown in maps. Right maps represent the unexplained variance (fraction [d]). The variance-partitioning bar below each map corresponds to global R2 from GWR analyses. Note that the bar lengths do not correspond to the proportion of partitioned variance. See Appendix S4 for maps of all range size groups.
Considering each predictor separately, current climate exerted positive influence on species richness from southern South America, while in the Northern of the continent, its influence was negative. Regarding the historical climate, its influence on the species richness was positive in some regions located in center of the continent, and negative in areas located in northwestern South America. In only a few cells, both current and historical climate influences were the same (Figure 2 and Appendix S5). Furthermore, the high amount of unexplained variance is spatially concordant with grid cells which historical climate exerted a high influence (Figure 2), which also indicates that the current climate may be a better predictor of tree species richness than past climate in the most part of South America (Figure 2).
These marked patterns of the relative importance of current and historic climates throughout South America (Appendix S5) are spatially very similar within each range size group (narrow or wide), but they are generally different among range size groups (Appendix S2). Additionally, for current climate, the geographic pattern of the GWR slopes for total species richness is strongly related to the wide-ranging species richness, while for historical climate, a strongest relationship was observed between total richness and narrow-ranging species richness (Appendix S2).
Discussion
In general, the species richness pattern of forest trees hardly peaks in southeastern Brazil (Figure 1). Although it is expected to be biased as for total South American plant diversity, specially concerning to Amazonian region, we expect that the relative importance concerning each predictive variable (current vs. historical climate) would be real at least for those regions with expressive species richness, once GWR perform local regressions considering neighbors grid cells subgroups. Moreover, our results were found considering only trees of forestry interest, and then our explanations are limited to them.
Regarding the deconstruction of the richness pattern, our findings indicated that current climate was more relevant to explain current South American tree richness than historical climate, independently of the geographical range size, as it was previously expected (Figure 2 and Appendices S4, S5). On the other hand, historical climate did not contributed to a better statistical explanation of narrow-ranging species richness when compared to the wide-ranging species richness, differently from our initial supposition. These results reinforce the importance of current water-energy balance as a good predictor of plant and animal diversity across
224 Lima-Ribeiro et al.
Acta Scientiarum. Biological Sciences Maringá, v. 35, n. 2, p. 219-231, Apr.-June, 2013
the world (HAWKINS et al., 2003), and indicate that climate changes in South America during the most recent Ice Age did not affect the current tree richness pattern largely, specially considering the narrow-ranging species as observed in Europe and North America (ARAÚJO et al., 2008; HAWKINS; PORTER, 2003; SVENNING; SKOV, 2007a and b; SVENNING et al., 2008).
The Northern hemisphere, particularly Nearctic and Palearctic regions, was extensively covered by ice sheets during the LGM, and species were forced to migrate to climatically stable regions in the southern Europe and North America, where they remained isolated in small areas (i.e. glacial refuges) (ARAÚJO et al., 2008; HAWKINS; PORTER, 2003; SVENNING; SKOV, 2007a and b; SVENNING et al., 2008). From the glaciers retreatment during post-Pleistocene global warming until present, many narrow-ranging species were not able to recolonize large parts of their climatically suitable potential ranges due to their relative poor dispersal ability (ARAÚJO et al., 2008; HAWKINS; PORTER, 2003; SVENNING; SKOV, 2007a and b; SVENNING et al., 2008). Thus, historical effects on biodiversity patterns have been hypothesized to be most important for taxa with limited dispersal abilities (ARAÚJO et al., 2008; HAWKINS; PORTER, 2003; SVENNING; SKOV, 2007a and b; SVENNING et al., 2008). Nevertheless, in the Southern hemisphere, the climatic changes during the Pleistocene occurred as a response to the cooling of Northern regions in the last glacial period (SALGADO-LABOURIAU, 1997), but South America was not covered by ice sheets in the LGM (DELCOURT; DELCOURT, 1991). Then, if dispersal-limited species are likely to have smaller geographical range sizes because they have not been able to adjust to current climate conditions in Northern hemisphere (ARAÚJO et al., 2008), there are certainly other factors than historical climate itself causing range constraints among tree species in the South America (such as fine-scale environmental features [WISZ et al., 2007], or community assembly processes [RAHBECK et al., 2007]).
On the other hand, Graham et al. (2006) demonstrated that species richness patterns of low dispersal animals from Australia are also better explained by historical habitat stability, while the richness patterns of species with high dispersal capacity are best predicted by current environmental parameters. Once ice sheets did not occur in Australia during the LGM, this historical effect on the Australian faunas are contrasting with our findings from the South American tree species richness. However, palynological evidence indicates
substantial climate-induced contractions and shifts of upland Australian rainforest vegetation during the Quaternary period, with replacement of extensive moist rainforest by open eucalypt woodland in northeast Australia (KERSHAW, 1994). This caused habitat fragmentation and the forest-dependent animals were restricted to localized refuges (GRAHAM et al., 2006). In the South America, the available palaeoecological evidence suggests that ‘‘habitat tracking’’ was a more influential phenomenon in the biota than ‘‘biome replacement’’ (BUSH; DE OLIVEIRA, 2006; COLINVAUX et al., 1996, 2000), contrasting Haffer and Prance’s (2001) Amazonian Pleistocenic refuges hypothesis. Thus, if dispersal ability was not limiting the post glacial distribution of tree species in South America (as revealed by the low effects of the historical climate on species richness), and if contemporary climate is a better predictor of tree richness for of all range size groups, we would expect that most of 217 tree species analyzed in this study are likely to be at equilibrium with current climate conditions.
For these reasons our results permit us to infer that historical climate must have little influence on current species richness in regions without glacial-induced refuges, since the climate changes occurred worldwide during that time. If climate changes themselves were an important control of the species distributions in the present, such as previously shown for European, North American and Australian species, the effects of historical climate should also hold for Neotropical narrow-ranging tree species richness. Additionally, the studies from regions with marked climate changes along time and where glacial-induced refuges were formed have already shown that historical climate still exerts an important influence on current geographical patterns of plant and animal species richness (ARAÚJO et al., 2008; GRAHAM et al., 2006; HAWKINS; PORTER, 2003; SVENNING; SKOV, 2007a and b; SVENNING et al., 2008). Thus, this prediction, which the historical climate seems to exert an important influence on narrower species current distributions that have been observed by Hawkins and Porter (2003), Graham et al. (2006), Araújo et al. (2008) and Svenning et al. (2008) may have been caused by a biased selection of the regions studied (i.e. regions with marked climate changes along time and where glacial-induced refuges were formed during LGM), and such pattern probably have been different of other regions during LGM.
Such inference is also supported by non-stationary local GWR pattern in the relationships between explanatory variables and tree species richness (Figure 1 and Appendices S4, S5). Although
Current vs. historical climate hypotheses 225
Acta Scientiarum. Biological Sciences Maringá, v. 35, n. 2, p. 219-231, Apr.-June, 2013
the historical climate did not exert a big influence in tree species richness from many of South American cells, the regions where its influence was meaningful are spatially concordant with those ones where primary vegetation replacement and refuges development were observed in the last glaciation. The palynological records from Southern Brazil indicate that Araucaria forest, a small coniferous forest with one dominant species (Araucaria angustifolia) that currently occur on the Brazilian Southern highlands (between 500-1800 m elevation), Northeastern Argentina and Eastern Paraguay (HUECK, 1953), was restricted to scattered areas associated to deep and protected valleys during the glacial times, while the campos vegetation (e.g. grassland) was much more abundant in highlands than today (BEHLING, 1997). Yet, Ledru et al. (1996) related the vast occurrence of Araucaria pollen records in southeastern Brazil (latitude ~18o S) to its northward migration in that period, during the cold phase of LGM. Only in the late Holocene, when the annual dry period has become shorter, that Araucaria forests expanded to the South Brazilian highlands (BEHLING, 1997). As a consequence of this vegetational dynamic, many Pleistocenic refuges were formed in this small region at central-southeastern South American continent. Not surprisingly, this small region is just one where historical climate presents better predictive performance for and positively related with tree species richness (Figure 1 and Appendices S4, S5), supporting our inference.
On the other Brazilian biomes, this vegetational assemblage-based contraction and expansion dynamic was not observed (i.e. no others refuges were formed) and the current climate was the most important predictor of the tree species richness. Therefore, what may really have occurred in the other biomes was only migration of many isolated plant species without primary vegetation replacement and Pleistocenic refuges (see LEDRU et al., 1996 for Atlantic Forest history; see LEDRU, 1993; SALGADO-LABOURIAU, 1997; and BARBERI et al., 2000 for Cerrado history; see DE OLIVEIRA et al., 1999 for Caatinga history; see COLINVAUX et al., 1996, 2000 for Amazon history and full explanation against the biome replacement in Amazonian lowlands).
Moreover, the central Andes in the western South American coast were other important region with higher predictive performance of the historical climate, but here it was negatively related with tree species richness (Figure 1 and Appendices S4, S5). The Andean Cordillera is a special case of glacial
advances in the South America during the Late Quaternary glaciation (ZECH et al., 2008). Although the glacial dynamic was restricted to high altitudes (ice sheets reached down to 2000 m in many areas of central Andes, the glacial-induced replacement of paleovegetation was clearly observed from palynological records (SALGADO-LABOURIAU, 1979). This vertical migration on the mountain slope is similar to that latitudinal migration reported for high northern latitudes (ARAÚJO et al., 2008; HAWKINS; PORTER, 2003; SVENNING; SKOV, 2007a and b; SVENNING et al., 2008), forcing the species to step down for climatic suitable altitudes (SALGADO-LABOURIAU, 1979), which is very similar to European and North American glacial refuges. Indeed, the Andean vegetation dynamic in glacial times and the consequent effect of the historical climate on tree species richness is similar to that reported by Graham et al. (2006) for Australian faunas.
Although our study presents novelty predictions from the complementary contemporary vs. historical climate hypotheses on the current species richness patterns, these findings have two important caveats. First, a circular approach might occur in our analyses because the climatic variables were used either to model the predictive geographical distribution of each individual species (i.e. in MAXENT) as to investigate the overall patterns of species richness (i.e. in GWR analyses). According to Wisz et al. (2007), this circular approach do not occur because the overall pattern of species richness is a composite of many individually generated distributions and should therefore be somewhat independent of the variables that helped to generate the individual distributions (see also TERRIBILE et al., 2009). Moreover, although the climatic variables are all collinear, we did not use the same descriptors of the current climate to model the species distributions and spatial analyses. Although we have used minimum and maximum temperature, annual precipitation and altitude in the SDMs, in the spatial analyses we used the first PCA axis, which reduced the dimensions of MAT, AP, AET and PET, and also increases the independence of our results. Second, one basic theoretical assumption of the SDM approach to generate fine predictive distribution maps is the equilibrium between species distribution and the climate. If this occurs, theoretically the SDM algorithms should be able to indicate all climatically suitable areas for each individual species into the study area. Thus, our findings regarding the contemporary climate as better predictor of species richness than historical
226 Lima-Ribeiro et al.
Acta Scientiarum. Biological Sciences Maringá, v. 35, n. 2, p. 219-231, Apr.-June, 2013
climate for all geographical range size groups might be considered as only a modeling artifact. However, the effects of current climate are as low as those found for the historical climate when compared with the shared factor (see variance partitioning bars in the Figure 2 and Appendix S4). If our findings were merely an artifact of this assumption, then the current climate should have shown a bigger influence on the South American tree species richness than that we found.
Once South America did not glaciate during the LGM, the species were not forced to migrate to specific areas and/or specific routes (e.g. refuges) as observed in North American and European species. However, this condition do not give us any assurance that the species migration occurred randomly throughout South American continent, but ensure that the species migrated only for suitable regions through last glaciation, according to its physiological requirements (see COLINVAUX et al., 2000 for more details about the plant migration during the LGM in the South American lowlands). Thus, is plausible to accept that the South American tree species only migrated if they were in equilibrium with climate. Finally, the predictive species richness (from SDM distributions sums) was considerably and significantly correlated with observed species richness (from point-records sums; r = 0.561, d.f. = 22.67, p = 0.004) in geographic space, indicating that predictive species richness is a fine measure of the true species richness. However, we opted to use the SDM species richness approach because the point-records data from atlas may be biased due to sampling effort. Nonetheless, we expect that these predictions offer the most conservative spatial extrapolation of the tree species distributions that can be made with the available data. So, apparently our results concerning the predictions of South American tree species richness are acceptable, even using the SDM approach to obtain the species distributions used in the spatial analyses.
On the other hand, we encourage further studies to explore the questions raised in our study, especially those related to underlying circular approaches and its possible effects on spatial analyses of richness patterns, and how the assumption of species-climate equilibrium affect our inferences. We believe that an ideal, but ambitious approach, is to compare the predictive performance between completely simulated species distributions (and consequently its predictive species richness) from Mechanistic Models (MM) with niche-based SDM algorithms (see HIJMANS; GRAHAM, 2006 for more details about this framework). In MMs, the distribution of species is modeled based on the
knowledge of the species’ physiology, assuring independence from climate point records sampling and, principally, of the species-climate equilibrium assumption.
Conclusion
Our results suggest that contemporary climate based on the water-energy availability is the best determinant of geographical patterns of tree species richness in South America, independently of the species’ dispersal abilities. However, the relative importance of contemporary and historical climate, as well as their fitting with tree species richness, shifts across South America indicating non-stationarity in these relationships and, consequently, complementarities between contemporary and historical climate hypotheses to explain tree species richness. Notably, the historical climate appears to be an important determinant of richness in regions of marked climate changes and Pleistocene refuges, while the contemporary climate predicts the species richness across those regions with non-evident refuges in glacial times.
Acknowledgements
We would like to thank José Alexandre F. Diniz-Filho, Thiago Fernando L.V.B. Rangel and Levi Carina Terrible for precious discussion on the analyses and careful readings on previous versions of the manuscript that enhanced the quality of the study. MSLR is supported by FAPEG and FAMVF and DPS are supported by CNPq graduate fellowships.
References
ARAÚJO, M.; NOGUES-BRAVO, D.; DINIZ-FILHO, J. A. F.; HAYWOOD, A. L. Quaternary climate changes explain diversity among reptiles and amphibians. Ecography, v. 3, n. 1, p. 8-15, 2008. BARBERI, M.; SALGADO-LABOURIAU, M. L.; SUGUIO, K. Paleovegetation and paleoclimate of ''Vereda de Águas Emendadas'', central Brazil. Journal of South American Earth Sciences, v. 13, n. 3, p. 241-254, 2000. BEHLING, H. Late Quaternary vegetation, climate and fire history of the Araucaria forest and campos region from Serra Campos Gerais, Paraná State (South Brazil). Review of Paleobotany and Palynology, v. 97, n. 1-2, p. 109-121, 1997. BROOKS, T. M.; MITTERMEIER, R. A.; DA FONSECA, G. A. B.; GERLACH, J.; HOFFMAN, M.; LAMOREUX, J. F.; MITTERMEIER, C. G.; PILGRIM, J.; RODRIGUES, A. S. L. Global biodiversity conservation priorities. Science, v. 313, n. 5783, p. 58-61, 2006. BUSH, M. B.; DE OLIVEIRA, P. The rise and fall of the Refugial Hypothesis of Amazonian speciation:a paleoecological perspective. Biota Neotropica, v. 6, n. 1, p. 1-17, 2006.
Current vs. historical climate hypotheses 227
Acta Scientiarum. Biological Sciences Maringá, v. 35, n. 2, p. 219-231, Apr.-June, 2013
CARVALHO, P. E. R. Espécies arbóreas brasileiras. 1. ed. Brasília: Emprapa Informação Tecnológica, 2003. CARVALHO, P. E. R. Espécies arbóreas brasileiras. 1. ed. Brasília: Embrapa Informações Tecnológicas, 2006. CARVALHO, P. E. R. Espécies arbóreas brasileiras. 1. ed. Brasília: Embrapa Informações Tecnológicas, 2008. COLINVAUX, P. A.; DE OLIVEIRA, P. E.; BUSH, M. B. A long pollen record from Lowland Amazonia: forest and cooling in glacial times. Science, v. 274, n. 5284, p. 85-88, 1996. COLINVAUX, P. A.; DE OLIVEIRA, P. E.; BUSH, M. B. Amazonian and neotropical plant communities on glacial time-scales: the failure of the aridity and refuge hypothesis. Quaternary Science Reviews, v. 19, n. 1-5, p. 141-169, 2000. DE OLIVEIRA, P. E.; BARRETO, A. M. F.; SUGUIO, K. Late Pleistocene Holocene climatic and vegetational history of the Brazilian Caatinga: the fossil dunes of the middle São Francisco River. Palaeogeography, Palaeoclimatology, Palaeoecology, v. 145, n. 3, p. 319-337, 1999.
DELCOURT, H. R.; DELCOURT, P. A. Quaternary ecology: a paleoecological perspective. 1st ed. London: Chapman and Hall, 1991. FOTHERINGHAM, A. S.; BRUNSDON, C.; CHARLTON, M. Geographically weighted regression: the analysis of spatially varying relationships 1st ed. Chichester: John Wiley and Sons, 2002. FRASER, R. H.; CURRIE, D. J. The species richness-energy hypothesis in a system where historical factors are thought to prevail. The American Naturalist, v. 148, n. 1, p. 138-159, 1996. GASTON, K. J. The structure and dynamics of geographic ranges. Oxford: Oxford University Press, 2003. GRAHAM, C. H.; MORITZ, C.; WILLIAMS, S. E. Habitat history improves prediction of biodiversity in rainforest fauna. Proceedings of the National Academy of Sciences of the United States of America, v. 103, n. 3, p. 632-636, 2006. HAFFER, J.; PRANCE, G. T. Climatic forcing of evolution in Amazonia during the Cenozoic: on the refuge theory of biotic differentiation. Amazoniana, v. 16, n. 3-4, p. 579-607, 2001. HAWKINS, B. A.; PORTER, E. E. Relative influences of current and historical factors on mammal and bird diversity patterns in deglaciated North America. Global Ecology and Biogeography, v. 12, n. 6, p. 475-481, 2003. HAWKINS, B. A.; DINIZ-FILHO, J. A. F.; JARAMILLO, C. A.; SOELLER, S. A. Post-Eocene climate change, niche conservatism, and the latitudinal diversity gradient of New World birds. Journal of Biogeography, v. 33, n. 5, p. 770-780, 2006. HAWKINS, B. A.; FIELD, R.; CORNELL, H. V.; CURRIE, D. J.; GUEGAN, J. F.; KAUFMAN, D. M.; KERR, J. T.; MITTELBACH, G. G.; OBERDORFF, T.; PORTER, E. E.; TURNER, J. R. G. Energy, water, and broad-scale geographic patterns of species richness. Ecology, v. 84, n. 12, p. 3105-3117, 2003.
HIJMANS, R. J.; GRAHAM, C. H. The ability of climate envelope models to predict the effect of climate change on species distributions. Global Change Biology, v. 12, n. 12 , p. 2272-2281, 2006. HIJMANS, R. J.; CAMERON, S. E.; PARRA, J. L.; JONES, P. G.; JARVIS, A. Very high resolution interpolated climate surfaces for global land areas. International Journal of Climatology, v. 25, n. 15, p. 1965-1978, 2005. HUECK, K. Distribuição e habitat natural do Pinheiro do Paraná (Araucaria angustifolia). Boletim da Faculdade de Filosofia e Ciências da Universidade de São Paulo, v. 10, p. 1-24, 1953. HUTCHINSON, G. E. Concluding remarks. Cold Spring Harbor Symposium of Quantitative Biology, v. 22, p. 415-427, 1957. JETZ, W.; RAHBECK, C.; COLWELL, R. K. The coincidence of rarity and richness and the potential signature of history in centres of endemism. Ecology Letters, v. 7, n. 12, p. 1180-1191, 2004.
KERSHAW, A. P. Pleistocene vegetation of the humid tropics of northeastern Queensland, Australia. Paleogeography, Paleoclimatology, Paleoecology, v. 109, n. 2-4, p. 399-412, 1994. LEDRU, M. P. Late Quaternary environmental and climatic changes in Central Brazil. Quaternary Research, v. 39, n. 1, p. 90-98, 1993. LEDRU, M. P.; SOARES BRAGA, P. I.; SOUBIÉS, F.; FOURNIER, M.; MARTIN, L.; SUGUIO, K.; TURK, B. The last 50,000 years in the Neotropics (Southern Brazil): evolution of vegetation and climate. Palaeogeography, Palaeoclimatology, Palaeoecology, v. 123, n. 1-4, p. 239-257, 1996. LEGENDRE, P.; LEGENDRE, L. Numerical ecology. 2nd ed. New York: Elsevier, 1998. MARQUET, P. A.; FERNÁDEZ, M.; NAVARRETE, S. A.; VALDOVINOS, C. Diversity emerging: toward a deconstruction of biodiversity patterns. In: LOMOLINO, M. V.; HEANEY, L. R. (Ed.). Frontiers of biogeography: new directions in the geography of nature. Sutherland: Sinauer Associates, 2004. p. 191-209. NOGUÉS-BRAVO, D.; OHLEMÜLLER, R.; BATRA, P.; ARAÚJO, M. B. Climate predictors of Late Quaternary extinctions. Evolution, v. 64, p. 2442-2448, 2010. OHLEMÜLLER, R.; GRITTI, E. S.; SYKES, M. T.; THOMAS, C. D. Towards european climate risk surfaces: the extent and distribution of analogous and non-analogous climates. Global Ecology and Biogeography, v. 15, p. 395-405, 2006. PHILLIPS, S. J.; DUDIK, M. Modeling of species distributions with Maxent: new extensions and a comprehensive evaluation. Ecography, v. 31, p. 161-175, 2008. PITELKA, L. F.; GARDNER, R. H.; ASH, J.; BERRY, S.; GITAY, H.; NOBLE, I. R.; SAUNDERS, A.; BRADSHAW, R. H. W.; BRUBAKER, L.; CLARK, J. S.; DAVIS, M. B.; SUGITA, S.; DYER, J. M.; HENGEVELD, R.; HOPE, G.; HUNTLEY, B.; KING,
228 Lima-Ribeiro et al.
Acta Scientiarum. Biological Sciences Maringá, v. 35, n. 2, p. 219-231, Apr.-June, 2013
G. A.; MCGLONE, M. S.; PRENTICE, I. C.; REJMANEK, M. Plant migration and climate change. American Scientist, v. 85, n. 5, p. 464-473, 1997. RAHBECK, C.; GOTELLI, N. J.; COLWELL, R. K.; ENTSMINGER, G. L.; RANGEL, T. F. L. V. B.; GRAVES, G. R. Predicting continental-scale patterns of bird species richness with spatially explicit models. Proceedings of the Royal Society B-Biological Sciences, v. 274, n. 1607, p. 165-174, 2007. RANGEL, T. F. L. V. B.; DINIZ-FILHO, J. A. F.; BINI, L. M. SAM: a comprehensive application for Spatial Analysis in Macroecology. Ecography, v. 33, n. 1, p. 46-50, 2010. SALGADO-LABOURIAU, M. L. El media ambiente páramo. 1st ed. Caracas: IVIC-Unesco, 1979. SALGADO-LABOURIAU, M. L. Late quaternary palaeoclimate in the savannas of South America. Journal of Quaternary Science, v. 12, n. 5, p. 371-379, 1997. SKOV, F.; SVENNING, J. C. Potential impact of climatic change on the distribution of forest herbs in Europe. Ecography, v. 27, n. 3, p. 366-380, 2004.
SVENNING, J. C.; SKOV, C. Could the tree diversity pattern in Europe be generated by postglacial dispersal limitation? Ecology Letters, v. 10, n. 6, p. 453-460, 2007a.
SVENNING, J. C.; SKOV, F. Ice age legacies in the geographical distribution of tree species richness in Europe. Global Ecology and Biogeography, v. 16, n. 2, p. 234-245, 2007b.
SVENNING, J. C.; NORMAND, S.; SKOV, F. Postglacial dispersal limitation of widespread forest plant species in nemoral Europe. Ecography, v. 31, n. 3, p. 316-326, 2008. TERRIBILE, L. C.; DINIZ-FILHO, J. A. F.; RODRIGUEZ, M. A.; RANGEL, T. F. Richness patterns, species distributions and the principle of extreme deconstruction. Global Ecology and Biogeography, v. 18, n. 2, p. 123–136, 2009. WILLIG, M. R.; KAUFMAN, R. D.; STEVENS, R. D. Latitudinal gradients of biodiversity: pattern, process, scale, and synthesis. Annual Review of Ecology, Evolution and Systematics, v. 34, p. 273-309, 2003. WISZ, M. S.; WALTHER, B. A.; RAHBECK, C. Using potential distributions to explore determinants of Western Palaearctic migratory songbird species richness in sub-Saharan Africa. Journal of Biogeography, v. 34, n. 5, p. 828-841, 2007. ZECH, R.; MAY, J. H.; KULL, C.; ILGNER, J. Timing of the late Quaternary glaciation in the Andes from ~15 to 40o S. Journal of Quaternary Science, v. 23, n. 6-7, p. 635-647, 2008.
Received on July 25 2011. Accepted on November 18, 2011.
License information: This is an open-access article distributed under the terms of the Creative Commons Attribution License, which permits unrestricted use, distribution, and reproduction in any medium, provided the original work is properly cited.
Current vs. historical climate hypotheses 229
Acta Scientiarum. Biological Sciences Maringá, v. 35, n. 2, p. 219-231, Apr.-June, 2013
APPENDIX
Supplementary Material
Additional Supporting Information may be found in the online version of this article:
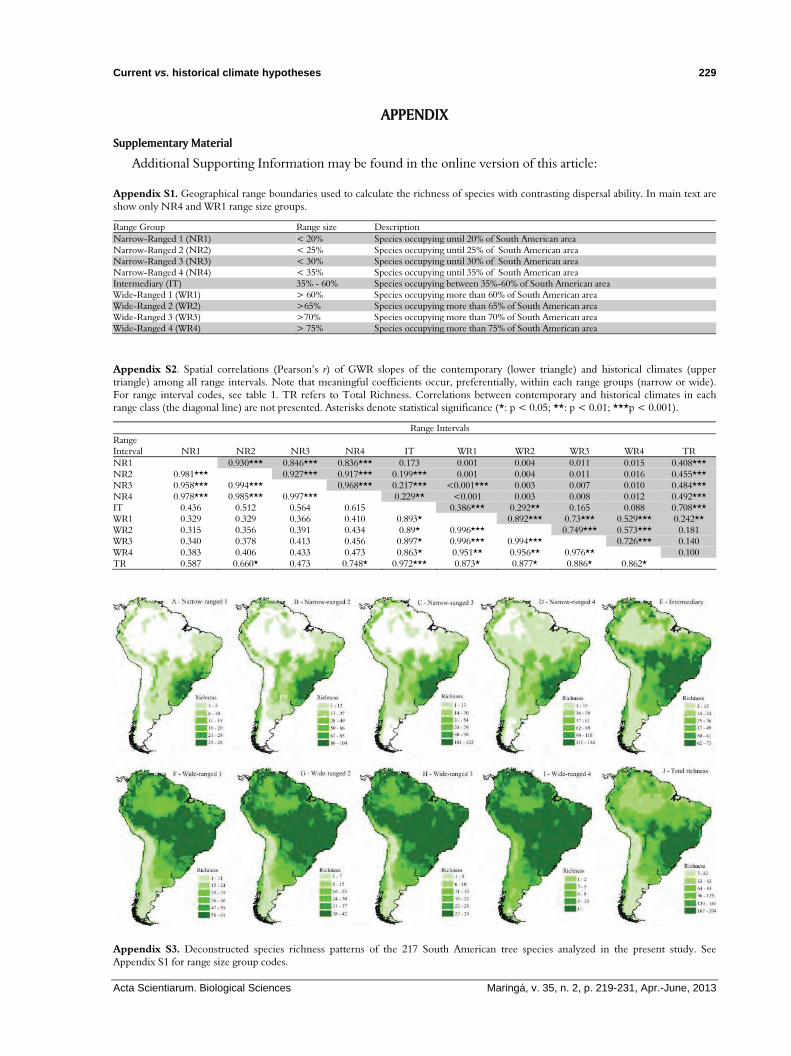
Appendix S1. Geographical range boundaries used to calculate the richness of species with contrasting dispersal ability. In main text are show only NR4 and WR1 range size groups.
Range Group Range size Description Narrow-Ranged 1 (NR1) < 20% Species occupying until 20% of South American area Narrow-Ranged 2 (NR2) < 25% Species occupying until 25% of South American area Narrow-Ranged 3 (NR3) < 30% Species occupying until 30% of South American area Narrow-Ranged 4 (NR4) < 35% Species occupying until 35% of South American area Intermediary (IT) 35% - 60% Species occupying between 35%-60% of South American area Wide-Ranged 1 (WR1) > 60% Species occupying more than 60% of South American area Wide-Ranged 2 (WR2) >65% Species occupying more than 65% of South American area Wide-Ranged 3 (WR3) >70% Species occupying more than 70% of South American area Wide-Ranged 4 (WR4) > 75% Species occupying more than 75% of South American area
Appendix S2. Spatial correlations (Pearson’s r) of GWR slopes of the contemporary (lower triangle) and historical climates (upper triangle) among all range intervals. Note that meaningful coefficients occur, preferentially, within each range groups (narrow or wide). For range interval codes, see table 1. TR refers to Total Richness. Correlations between contemporary and historical climates in each range class (the diagonal line) are not presented. Asterisks denote statistical significance (*: p < 0.05; **: p < 0.01; ***p < 0.001).
Range Intervals Range Interval NR1 NR2 NR3 NR4 IT WR1 WR2 WR3 WR4 TR NR1 0.930*** 0.846*** 0.836*** 0.173 0.001 0.004 0.011 0.015 0.408*** NR2 0.981*** 0.927*** 0.917*** 0.199*** 0.001 0.004 0.011 0.016 0.455*** NR3 0.958*** 0.994*** 0.968*** 0.217*** <0.001*** 0.003 0.007 0.010 0.484*** NR4 0.978*** 0.985*** 0.997*** 0.229** <0.001 0.003 0.008 0.012 0.492*** IT 0.436 0.512 0.564 0.615 0.386*** 0.292** 0.165 0.088 0.708*** WR1 0.329 0.329 0.366 0.410 0.893* 0.892*** 0.73*** 0.529*** 0.242** WR2 0.315 0.356 0.391 0.434 0.89* 0.996*** 0.749*** 0.573*** 0.181 WR3 0.340 0.378 0.413 0.456 0.897* 0.996*** 0.994*** 0.726*** 0.140 WR4 0.383 0.406 0.433 0.473 0.863* 0.951** 0.956** 0.976** 0.100 TR 0.587 0.660* 0.473 0.748* 0.972*** 0.873* 0.877* 0.886* 0.862*
Appendix S3. Deconstructed species richness patterns of the 217 South American tree species analyzed in the present study. See Appendix S1 for range size group codes.
230 Lima-Ribeiro et al.
Acta Scientiarum. Biological Sciences Maringá, v. 35, n. 2, p. 219-231, Apr.-June, 2013
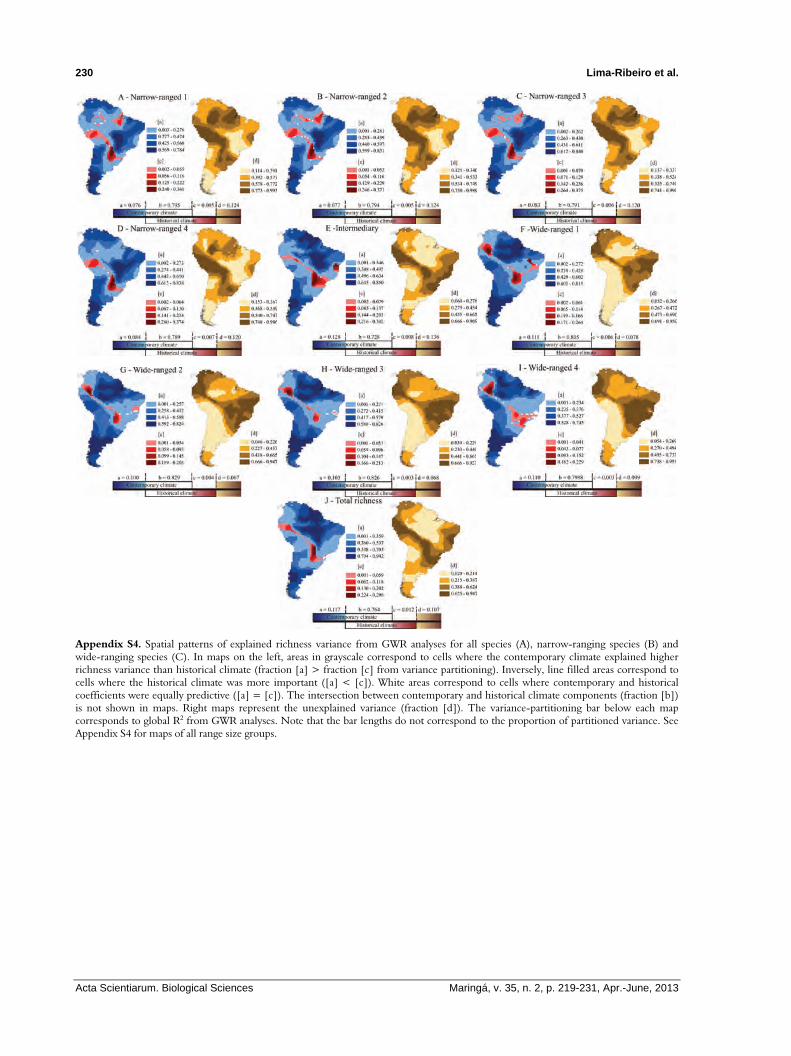
Appendix S4. Spatial patterns of explained richness variance from GWR analyses for all species (A), narrow-ranging species (B) and wide-ranging species (C). In maps on the left, areas in grayscale correspond to cells where the contemporary climate explained higher richness variance than historical climate (fraction [a] > fraction [c] from variance partitioning). Inversely, line filled areas correspond to cells where the historical climate was more important ([a] < [c]). White areas correspond to cells where contemporary and historical coefficients were equally predictive ([a] = [c]). The intersection between contemporary and historical climate components (fraction [b]) is not shown in maps. Right maps represent the unexplained variance (fraction [d]). The variance-partitioning bar below each map corresponds to global R2 from GWR analyses. Note that the bar lengths do not correspond to the proportion of partitioned variance. See Appendix S4 for maps of all range size groups.
Current vs. historical climate hypotheses 231
Acta Scientiarum. Biological Sciences Maringá, v. 35, n. 2, p. 219-231, Apr.-June, 2013
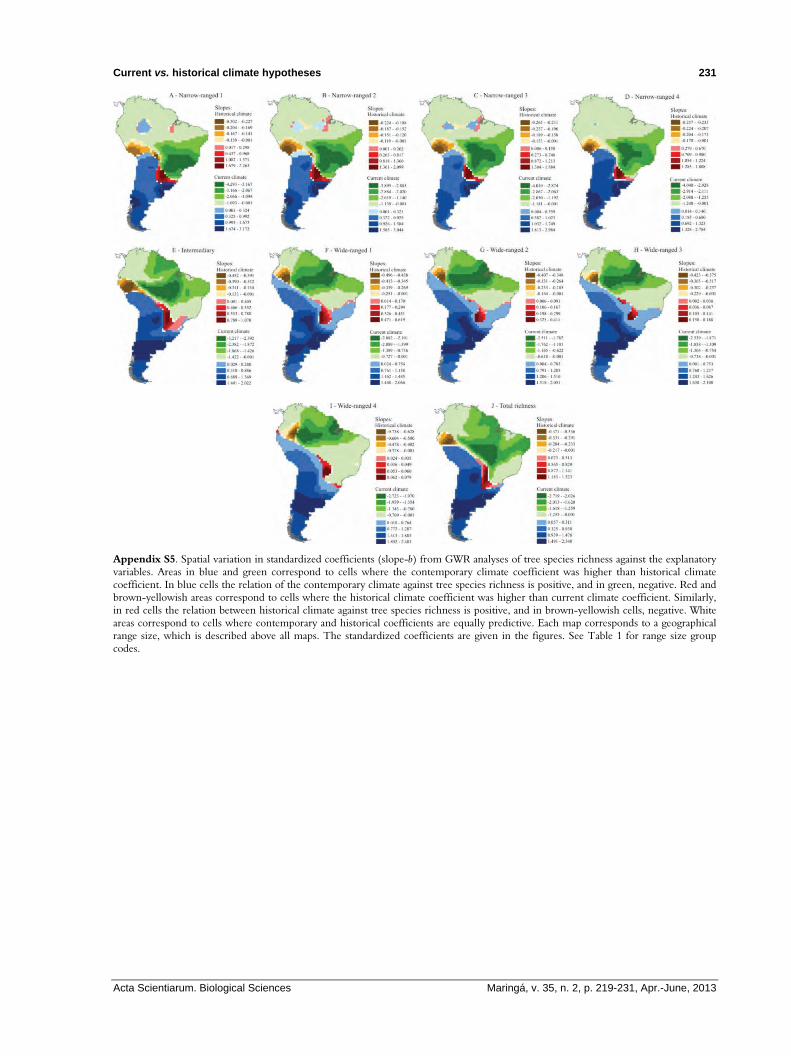
Appendix S5. Spatial variation in standardized coefficients (slope-b) from GWR analyses of tree species richness against the explanatory variables. Areas in blue and green correspond to cells where the contemporary climate coefficient was higher than historical climate coefficient. In blue cells the relation of the contemporary climate against tree species richness is positive, and in green, negative. Red and brown-yellowish areas correspond to cells where the historical climate coefficient was higher than current climate coefficient. Similarly, in red cells the relation between historical climate against tree species richness is positive, and in brown-yellowish cells, negative. White areas correspond to cells where contemporary and historical coefficients are equally predictive. Each map corresponds to a geographical range size, which is described above all maps. The standardized coefficients are given in the figures. See Table 1 for range size group codes.
Related Documents


