CURRENCIES Currency Market Monitor 1 st Quarter2014 APRIL 3, 2014 John W. Labuszewski Sandra Ro Bluford Putnam Managing Director Executive Director Chief Economist Fin’l Research & Product Development 312-466-7469 [email protected] FX Research & Product Development 011 (44) 203-379-3789 [email protected] Research & Product Development 212-299--2302 bluford.putnam@cmegroup.com

Welcome message from author
This document is posted to help you gain knowledge. Please leave a comment to let me know what you think about it! Share it to your friends and learn new things together.
Transcript

CURRENCIES
Currency Market Monitor 1st Quarter 2014
APRIL 3, 2014
John W. Labuszewski Sandra Ro Bluford Putnam
Managing Director Executive Director Chief Economist
Fin’l Research & Product Development
312-466-7469
FX Research & Product Development
011 (44) 203-379-3789
Research & Product Development
212-299--2302
1 | Currency Market Monitor 1st Quarter 2014 | April 3, 2014 | © CME GROUP
An ongoing debate has long persisted in the global
currency or FX markets – is FX an “asset class” akin
to stocks and bonds? While practitioners and
academics may debate this point at length, perhaps
the most practical answer is – does it really matter
provided that investors may draw a return from
currency investments?
The performance of the currency or FX markets is
found in the exchange rates and cross-rates
associated with the world’s myriad currencies. The
total return associated with a currency is driven by
interest income associated with fixed income
instrument investment in the particular currency; as
well as pure price performance.
Many fundamental factors, including national
economic conditions, monetary and policies, current
and capital account flows, to name just a few,
impact the returns associated with the world’s
currencies.
This document represents a review of these factors
as they played out in the most recently completed
calendar quarter. We include consideration of the
so-called “carry trade” as well as a look at the
theory of “purchasing power parity” as it impacts FX
markets.
While we cover activity in a broad spectrum of
currencies, we focus on the currencies underlying
some of the most liquid of CME Group FX futures.
This includes the U.S. dollar (USD), Euro (EUR),
Japanese yen (JPY), British pound (GBP), Swiss
franc (CHF), Canadian dollar (CAD), Australian dollar
(AUD) and Mexican peso (MXN).
In addition, we have special interest in the
currencies of significant emerging market economies
including the Brazilian real (BRL), Russian ruble
(RUB), Indian rupee (INR) and Chinese yuan or
renminbi (CNY) – the so-called “BRIC” nations.
Finally, we highlight several CME Group FX Indexes
including a USD Index, a Carry Trade Index,
Commodity Country Index and BRIC Index.
Market Fundamentals
As a general rule, FX analysts will evaluate the
fundamental value of any particular currency by
reference to a number of national economic factors.
These factors including growth and inflation
prospects; monetary and fiscal policies; and, current
and capital account balances.
To illustrate, we include a brief discussion of the
economic situation prevailing in the United States as
of the conclusion of the most recently completed
calendar quarter. Of course, the U.S. dollar (USD)
may be just one side of any currency pair that may
be traded using CME FX futures.
A brief summary of economic conditions in various
nations, organized along similar lines, is included in
Appendix 1 of our document below. One may
compare and contrast these conditions as they exist
in the two countries whose currency pairing one may
be interested in to draw an appreciation of the
fundamental factors that impact currency markets.
Growth and Employment
The 1st calendar quarter of 2014 was marked by
mixed economic results. On the one hand, economic
growth appears to have slowed as a result of
seasonally inclement weather. The housing market
seems to be in a stall pattern while fiscal policy may
be putting on the brakes. On the other hand, labor
markets show signs of improvement while consumer
spending is reasonably strong.
Concerns regarding tensions in the Crimea and a
general slowdown in the emerging markets likewise
played a role in shaping the character of 1st quarter
results.
The Fed summarizes the domestic situation nicely …
“growth in economic activity slowed during the
winter months, in part reflecting adverse weather
conditions. Labor market indicators were mixed but
on balance showed further improvement. The
unemployment rate, however, remains elevated.
Household spending and business fixed investment
continued to advance, while the recovery in the
housing sector remained slow. Fiscal policy is
restraining economic growth, although the extent of
restraint is diminishing. Inflation has been running
below the Committee’s longer-run objective, but
longer-term inflation expectations have remained
stable.” 1
1 Federal Reserve Press Release dated March 19, 2014.
2 | Currency Market Monitor 1st Quarter 2014 | April 3, 2014 | © CME GROUP
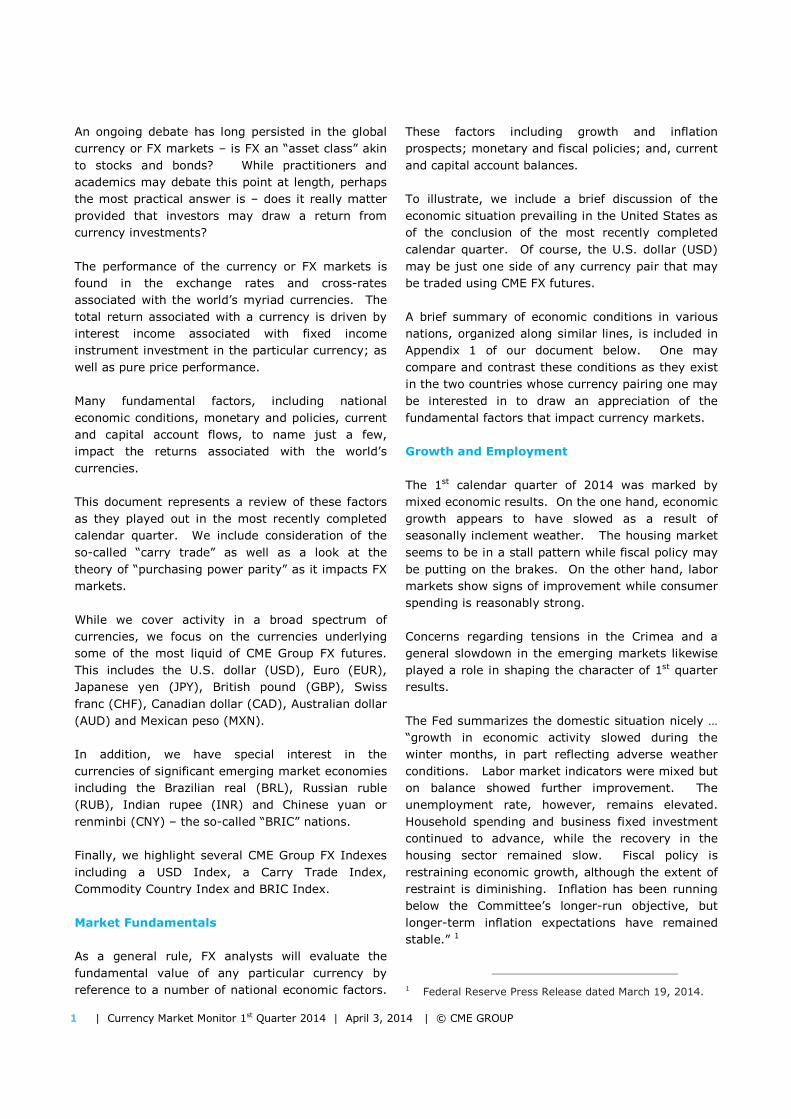
GDP was reported at +2.6% in the 4th quarter but
slipped from the 3rd quarter’s recent peak at +4.1%.
This growth drove the February unemployment rate
down to 6.7%, an uptick from January’s 6.6% but a
1% improvement from the 7.7% reported a year
earlier in February 2013. These levels are
approaching the 6.5% rate cited in the Fed’s
previous forward guidance regarding the trigger for
a tighter monetary policy.
While this represents improvement, labor force
participation remains at anemic levels of only 63.0%
in February 2014 and at levels not seen since the
late 1970s.
Further, the total number of employed at 137.699
million as of February 2014 remains less than the
pre-financial crisis peak of 138.056 million seen in
January 2008. This means that we have now seen
73 months pass by without recovering to exceed
pre-crisis levels. This represents the most extended
recovery from recession by a wide margin during the
past 35 years.
Still, the Fed is encouraged and “expects that, with
appropriate policy accommodation, economic activity
will expand at a moderate pace and labor conditions
will continue to improve gradually, moving toward
those the Committee judges consistent with its dual
mandate” of fostering maximum employment and
price stability. 2
The Fed’s most recent statement alluded to
advances in household spending. However, this is
not borne out by an examination of data regarding
either retail sales or light vehicle sales.
Retail sales slipped 1.2% to $181.651 billion during
February 2014 from a November 2013 peak of
$183.779 billion. Similarly, sales of cars and light
trucks fell 6.3% to 15.275 million units in February
2014 from the November peak of 16.309 million
units. Still, the longer-term trend has been steadily
pushing upwards since the major trough seen in
early 2009.
A general propensity to loosen the purse strings is
reflected in the personal savings rate. The rate
appears generally to be drifting downwards and was
reported at 4.3% in February 2014 after drifting up
in the wake of the financial crisis. Note, however,
that this does not fully reflect the complete winter
2 Ibid.
4%
5%
6%
7%
8%
9%
10%
11%
-10%
-8%
-6%
-4%
-2%
0%
2%
4%
6%
Q1 0
5
Q4 0
5
Q3 0
6
Q2 0
7
Q1 0
8
Q4 0
8
Q3 0
9
Q2 1
0
Q1 1
1
Q4 1
1
Q3 1
2
Q2 1
3
Q1 1
4
Unem
plo
ym
ent
Rate
Qtr
ly C
hange in G
DP
Growth and Employment
Real GDP (SA) Unemployment Rate
Source: Bureau of Economic Analysis (BEA) & Bureau of Labor Statistics (BLS)
62%
63%
64%
65%
66%
67%
68%
4%
5%
6%
7%
8%
9%
10%
11%
Jan-0
2
Jan-0
3
Jan-0
4
Jan-0
5
Jan-0
6
Jan-0
7
Jan-0
8
Jan-0
9
Jan-1
0
Jan-1
1
Jan-1
2
Jan-1
3
Jan-1
4
Labor
Forc
e P
art
icip
ation
Unem
plo
ym
ent
Rate
Employment Statistics
Unemployment Rate Labor Force Partcipation
Source: Bureau of Labor Statistics (BLS)
93%
94%
95%
96%
97%
98%
99%
100%
101%
1 5 9
13
17
21
25
29
33
37
41
45
49
53
57
61
65
69
73
NFPs a
s %
of Peak
Months Since Peak NFP
NFP Recovery from Recession
Apr - Dec-80 Aug-81 - Oct-83Jul-90 - Jan-93 Mar-01 - Jan-05Feb-08 -

3 | Currency Market Monitor 1st Quarter 2014 | April 3, 2014 | © CME GROUP
weather experience, which has certainly diminished
or possibly just deferred consumer spending.
While consumer spirits seem to have been
dampened by unseasonably cold weather, the
industrial sector has shown further advances. The
Index of Industrial Production was reported at
101.6276 in February 2014. This is 2.8% above the
February 2013 mark and represents a new peak,
advancing above pre-crisis levels.
Similarly, capacity utilization is on the upswing,
reported at 78.8% in February 2014. This is just a
bit off of the 78.9% from November 2013 but
decidedly above the 78.2% reported a year earlier in
February 2013. The figure is rising but remains a bit
below the key 80% mark at which point many
economists believe that inflationary pressures may
be expected to be observed.
This activity is reflected in domestic corporate
profitability which is deep into all-time high territory.
The Department of Commerce reported $1,904.5
billion in 4th quarter profitability or +6.0% on a
year-on-year basis. Some analysts suggest that this
profitability is primarily responsible for the new all-
time highs recorded in equities – while others point
to low rates held in place by QE programs.
The Fed further remarked upon slowness in the
housing markets. This is underscored by slight dips
in housing values in Chicago, Boston and Los
Angeles in January 2014 from the prior month. Still,
gains were shown in Miami, Washington and San
Francisco. Further, the S&P/Case-Shiller 10-City
Composite index held its ground in January and as
advanced 13.54% on a year-on-year basis and
22.96% since the trough of March 2012.
9
10
11
12
13
14
15
16
17
$155
$160
$165
$170
$175
$180
$185
$190
Jan-0
7
Aug-0
7
Mar-
08
Oct-
08
May-0
9
Dec-0
9
Jul-
10
Feb-1
1
Sep-1
1
Apr-
12
Nov-1
2
Jun-1
3
Jan-1
4
Vehic
le S
ale
s
Reta
il S
ale
s (
Bil $
)
Consumer Sector Activity
Real Retail Sales SA Light Vehicle Sales
Source: U.S. Census Bureau and Dept.of Commerce
0%
1%
2%
3%
4%
5%
6%
7%
8%
9%
Jan-0
7
Jul-
07
Jan-0
8
Jul-
08
Jan-0
9
Jul-
09
Jan-1
0
Jul-
10
Jan-1
1
Jul-
11
Jan-1
2
Jul-
12
Jan-1
3
Jul-
13
Jan-1
4
% o
f D
isposable
Incom
e
Personal Savings Rate
Source: St. Louis Federal Reserve FRED Database
66%
68%
70%
72%
74%
76%
78%
80%
82%
80
85
90
95
100
105
Jan-0
7
Aug-0
7
Mar-
08
Oct-
08
May-0
9
Dec-0
9
Jul-
10
Feb-1
1
Sep-1
1
Apr-
12
Nov-1
2
Jun-1
3
Jan-1
4
Capacity U
tilization
Industr
ial Pro
duction I
ndex
Industrial Sector Activity
Index of Industrial Production Capacity Utilization
Source: St. Louis Federal Reserve FRED Database
$600
$800
$1,000
$1,200
$1,400
$1,600
$1,800
$2,000
-60%
-40%
-20%
0%
20%
40%
60%
80%
100%
120%
Q1 0
4
Q4 0
4
Q3 0
5
Q2 0
6
Q1 0
7
Q4 0
7
Q3 0
8
Q2 0
9
Q1 1
0
Q4 1
0
Q3 1
1
Q2 1
2
Q1 1
3
Q4 1
3
Pre
-Tax P
rofits
(Billions)
Annualized C
hange
U.S. Corporate Profitability
Annual Change Corporate Profits (Bil)
Source: Department of Commerce
4 | Currency Market Monitor 1st Quarter 2014 | April 3, 2014 | © CME GROUP
But building permits, housing starts and housing
completions continue to hover in the vicinity of 900
thousand to 1 million units. This is a little less than
half of the peak pre-crisis era figures near 2.2
million units.
Inflation
The Fed concedes that inflation is well below their
long-term objectives. It further “recognizes that
inflation persistently below its 2 percent objective
could pose risks to economic performance, and it is
monitoring inflation developments carefully for
evidence that inflation will move back toward its
objective over the medium term.” 3
3 Ibid.
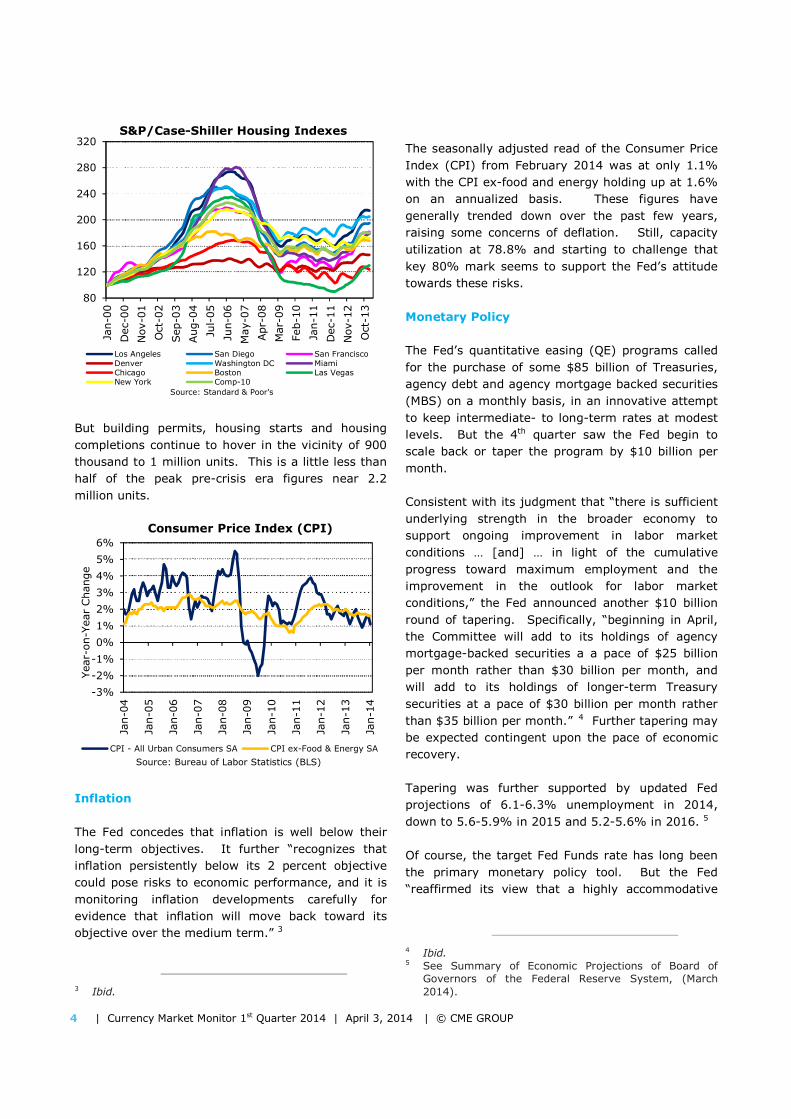
The seasonally adjusted read of the Consumer Price
Index (CPI) from February 2014 was at only 1.1%
with the CPI ex-food and energy holding up at 1.6%
on an annualized basis. These figures have
generally trended down over the past few years,
raising some concerns of deflation. Still, capacity
utilization at 78.8% and starting to challenge that
key 80% mark seems to support the Fed’s attitude
towards these risks.
Monetary Policy
The Fed’s quantitative easing (QE) programs called
for the purchase of some $85 billion of Treasuries,
agency debt and agency mortgage backed securities
(MBS) on a monthly basis, in an innovative attempt
to keep intermediate- to long-term rates at modest
levels. But the 4th quarter saw the Fed begin to
scale back or taper the program by $10 billion per
month.
Consistent with its judgment that “there is sufficient
underlying strength in the broader economy to
support ongoing improvement in labor market
conditions … [and] … in light of the cumulative
progress toward maximum employment and the
improvement in the outlook for labor market
conditions,” the Fed announced another $10 billion
round of tapering. Specifically, “beginning in April,
the Committee will add to its holdings of agency
mortgage-backed securities a a pace of $25 billion
per month rather than $30 billion per month, and
will add to its holdings of longer-term Treasury
securities at a pace of $30 billion per month rather
than $35 billion per month.” 4 Further tapering may
be expected contingent upon the pace of economic
recovery.
Tapering was further supported by updated Fed
projections of 6.1-6.3% unemployment in 2014,
down to 5.6-5.9% in 2015 and 5.2-5.6% in 2016. 5
Of course, the target Fed Funds rate has long been
the primary monetary policy tool. But the Fed
“reaffirmed its view that a highly accommodative
4 Ibid. 5 See Summary of Economic Projections of Board of
Governors of the Federal Reserve System, (March 2014).
80
120
160
200
240
280
320
Jan-0
0
Dec-0
0
Nov-0
1
Oct-
02
Sep-0
3
Aug-0
4
Jul-
05
Jun-0
6
May-0
7
Apr-
08
Mar-
09
Feb-1
0
Jan-1
1
Dec-1
1
Nov-1
2
Oct-
13
S&P/Case-Shiller Housing Indexes
Los Angeles San Diego San FranciscoDenver Washington DC MiamiChicago Boston Las VegasNew York Comp-10
Source: Standard & Poor's
-3%
-2%
-1%
0%
1%
2%
3%
4%
5%
6%
Jan-0
4
Jan-0
5
Jan-0
6
Jan-0
7
Jan-0
8
Jan-0
9
Jan-1
0
Jan-1
1
Jan-1
2
Jan-1
3
Jan-1
4
Year-
on-Y
ear
Change
Consumer Price Index (CPI)
CPI - All Urban Consumers SA CPI ex-Food & Energy SA
Source: Bureau of Labor Statistics (BLS)

5 | Currency Market Monitor 1st Quarter 2014 | April 3, 2014 | © CME GROUP
stance of monetary policy remains appropriate. In
determining how long to maintain the current 0 to ¼
percent target range for the federal funds rate, the
Committee will assess progress—both realized and
expected—toward its objectives of maximum
employment and 2 percent inflation … The
Committee continues to anticipate … that it likely will
be appropriate to maintain the current target range
for the federal funds rate for a considerable time
after the asset purchase program ends, especially if
projected inflation continues to run below the
Committee’s 2 percent longer-run goal, and
provided that longer-term inflation expectations
remain well anchored.” 6
Note that the Fed’s longer-run projection for PCE
inflation is reported at 2.0%.7 It is further
noteworthy that the Fed has backed away from
previous suggestions that it would consider more
aggressive action when unemployment reached
6.5% … “[w]ith the unemployment rate nearing 6-
1/2 percent, the Committee has updated its forward
guidance.” 8 Still, this is consistent with the Fed’s
indications from December 2013 to the effect “that it
likely will be appropriate to maintain the current
target range for the federal funds rate well past the
time that unemployment rate declines to 6-1/2
percent, especially if projected inflation continues to
run below the Committee’s 2 percent longer-term
goal.” 9
6 Op. cit., Fed Statement of March 19, 2014. 7 Op. cit., Summary of Economic Projections. 8 Op. cit., Fed Statement of March 19, 2014. 9 Ibid.
Fiscal Policy
Once more, the Fed acknowledges that “[f]iscal
policy is restraining economic growth, although the
extent of restraint is diminishing.”10 This is
underscored when we consider that Federal fiscal
deficits of $1.4, $1.3, $1.3 and $1.1 trillion in 2009-
12, respectively, shrunk to just $680 billion 2013.
Washington was able to avert another in a string of
chronic debt ceiling crises. Specifically, the Senate
approved a House measure on February 12th that
provides funding for Federal activities through March
2015.
It was hailed by President Obama who was “pleased
that Republicans and Democrats in Congress have
come together to pay for what they’ve already
spent, and remove the threat of default form our
economy once and for all.” He further expressed
hope that “this puts an end to politics by
brinkmanship.”
But this represented something of a blow to fiscal
conservatives including the Tea Party. House
Speaker John Boehner criticized the measure,
suggesting that “[i]t’s the President driving up the
debt and the President wanted to do nothing about
the debt that’s occurring … so, let his party give him
the debt ceiling increase that he wants.”
In further fiscal news, the deadline for signing up for
Obamacare was marked on Monday, March 31,
2014. An extension into April has been granted to
those who have experienced difficulty accessing the
10 Ibid.
0%
1%
2%
3%
4%
5%
6%
Jan-0
7
Jul-
07
Jan-0
8
Jul-
08
Jan-0
9
Jul-
09
Jan-1
0
Jul-
10
Jan-1
1
Jul-
11
Jan-1
2
Jul-
12
Jan-1
3
Jul-
13
Jan-1
4
Benchmark U.S. Rates
Target Fed Funds 2-Yr Treasury5-Yr Treasury 10-Yr Treasury30-Yr Treasury
-$1,600
-$1,400
-$1,200
-$1,000
-$800
-$600
-$400
-$200
$0
$200
$400
1992
1993
1994
1995
1996
1997
1998
1999
2000
2001
2002
2003
2004
2005
2006
2007
2008
2009
2010
2011
2012
2013
Federal Surplus/Deficit(Billions USD)
Source: Office of Management and Budget (OMB)
6 | Currency Market Monitor 1st Quarter 2014 | April 3, 2014 | © CME GROUP
websites and signing up. Still, a reported 6 million
Americas have acquired health insurance since
October 1st through the Federal and State
exchanges. Still, we may expect debate on this
issue to be ongoing.
Current & Capital Account Flows
The 4th quarter 2013 current account deficit
improved further, reported at only $81.1 billion and
15.9% less than the $96.4 billion reported in the 3rd
quarter. This is less than the $86.982 billion deficit
reported in the 2nd quarter 2009 at the height of the
sub-prime crisis.
The total 2013 current account balance was reported
at only $360.7 billion and 2.2% of estimated 2013
GDP of $16.72 trillion. This is the most optimistic
figure seen for well over a decade.
Another interesting source of flow of funds data may
be found in the U.S. Treasury Department’s
Treasury International Capital (or “TIC”) database.
This database tracks flows into and out of the U.S.
The data is broken into foreign stocks, foreign
bonds, U.S. stocks, U.S. corporate bonds, U.S.
government agencies and U.S. Treasuries.
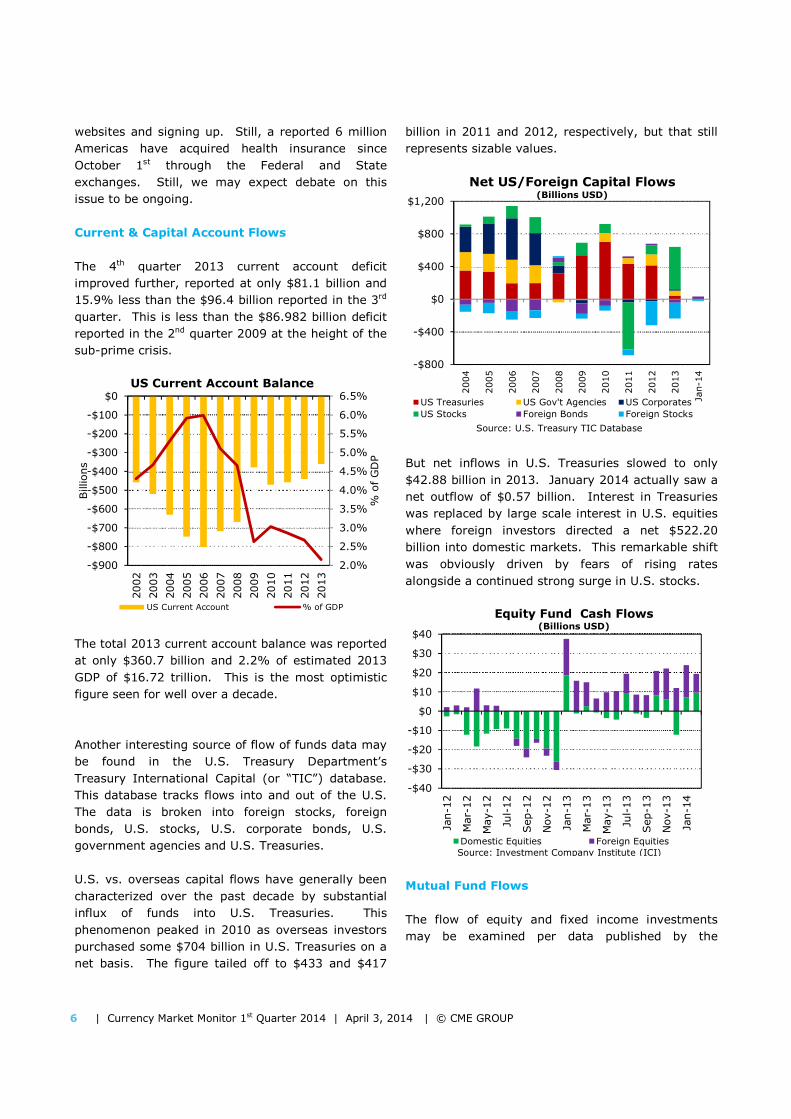
U.S. vs. overseas capital flows have generally been
characterized over the past decade by substantial
influx of funds into U.S. Treasuries. This
phenomenon peaked in 2010 as overseas investors
purchased some $704 billion in U.S. Treasuries on a
net basis. The figure tailed off to $433 and $417
billion in 2011 and 2012, respectively, but that still
represents sizable values.
But net inflows in U.S. Treasuries slowed to only
$42.88 billion in 2013. January 2014 actually saw a
net outflow of $0.57 billion. Interest in Treasuries
was replaced by large scale interest in U.S. equities
where foreign investors directed a net $522.20
billion into domestic markets. This remarkable shift
was obviously driven by fears of rising rates
alongside a continued strong surge in U.S. stocks.
Mutual Fund Flows
The flow of equity and fixed income investments
may be examined per data published by the
2.0%
2.5%
3.0%
3.5%
4.0%
4.5%
5.0%
5.5%
6.0%
6.5%
-$900
-$800
-$700
-$600
-$500
-$400
-$300
-$200
-$100
$0
2002
2003
2004
2005
2006
2007
2008
2009
2010
2011
2012
2013
% o
f G
DP
Billions
US Current Account Balance
US Current Account % of GDP
-$800
-$400
$0
$400
$800
$1,200
2004
2005
2006
2007
2008
2009
2010
2011
2012
2013
Jan-1
4
Net US/Foreign Capital Flows (Billions USD)
US Treasuries US Gov't Agencies US Corporates
US Stocks Foreign Bonds Foreign Stocks
Source: U.S. Treasury TIC Database
-$40
-$30
-$20
-$10
$0
$10
$20
$30
$40
Jan-1
2
Mar-
12
May-1
2
Jul-
12
Sep-1
2
Nov-1
2
Jan-1
3
Mar-
13
May-1
3
Jul-
13
Sep-1
3
Nov-1
3
Jan-1
4
Equity Fund Cash Flows (Billions USD)
Domestic Equities Foreign EquitiesSource: Investment Company Institute (ICI)

7 | Currency Market Monitor 1st Quarter 2014 | April 3, 2014 | © CME GROUP
Investment Company Institute (ICI) which tracks
activity in the mutual fund industry. 11
Investors added some $159.8 billion into equity
funds during the 2013. But only a scant $17.7
billion was directed into domestic equity funds,
despite their generally strong performance while
another $142.1 billion was added to foreign equity
funds. This trend continued in January through
February 2014 with another $43.3 flowing into
equity funds.
Funds had generally been flowing into bond funds
through May 2013. But June saw the reversal of
this trend as investors began to believe that interest
rate advances, fueled by economic growth and
expectations of tapering of Fed easing programs. By
the conclusion of 2013, some $80.5 billion had been
withdrawn from bond funds. But some $8.9 billion
flowed back into these markets in January through
February 2014.
Global Economic Performance
Emerging market (EM) economies have been the
stars of the investment world for some years now.
Still, it was the developed market (DM) economies
that provided some of the most positive growth
surprises in 2013. While the EM countries generally
exhibit higher growth rates than DM countries, that
11 These indicators are often highly correlated with price
action as retail investors may “chase” the market by buying in response to a bull trend. Or, they may exhibit a “herd mentality” by liquidating investments in response to significant market breaks.
growth has generally decelerated relative to DM
economies in recent years.
Actual and Forecast GDP Growth
2011 2012 2013
2014
(f)
2014
-19
(f)
2020
-25
(f)
Developed Markets (DMs)
Australia 3.4% 3.7% 2.7% 2.6% 2.3% 2.2%
Canada 2.5% 1.7% 1.4% 2.1% 2.0% 1.8%
France 2.0% 0.0% 0.2% 0.9% 1.4% 0.9%
Germany 3.3% 0.7% 0.4% 1.7% 1.6% 1.4%
Japan -.06% 1.9% 1.8% 1.5% 1.0% 0.6%
UK 1.1% 0.1% 1.3% 1.9% 1.9% 1.1%
US 1.8% 2.8% 1.9% 3.0% 2.4% 1.7%
Emerging Markets (DMs)
Brazil 2.7% 0.9% 2.0% 2.3% 2.9% 2.8%
Mexico 3.9% 3.8% 1.5% 3.1% 2.9% 3.1%
Russia 4.3% 3.4% 1.5% 2.5% 1.8% 1.2%
India 6.2% 5.0% 4.2% 4.4% 4.8% 2.6%
China 9.3% 7.7% 7.5% 7.0% 5.9% 3.5%
Source: The Conference Board Global Economic
Outlook 2014 (February 2014)
NOTE: (f) = forecast data
According to the Conference Board’s Global
Economic Outlook, growth in Germany is expected
to run at a very moderate +1.6% on an annual basis
from 2014-19. Similarly modest growth is expected
in much of the developed world including Japan
(+1.0%), the United Kingdom (+1.9%) and the
United States (+2.4%).
While GDP growth has slowed in many of the
emerging economies, such growth has nonetheless
generally surpassed that of the DMs. This is
expected to continue, according to Conference Board
forecasts, albeit the gaps may narrow.
Note that the trade surpluses that have supported
many emerging market economies are shrinking
along with trade deficits in the U.S. and Europe. As
discussed above, the U.S. current account deficit
shrank to 2.2% of GDP in 2013 from a peak deficit
of 5.76% in 2006. The Chinese trade surplus
similarly shrank from a peak of 11.00% of GDP in
2007 to 2.30% in 2013.
Arguably, these trade imbalances have been a
fundamental driving engine behind much emerging
market growth over the past several decades.
-$80
-$60
-$40
-$20
$0
$20
$40
Jan-1
2
Mar-
12
May-1
2
Jul-
12
Sep-1
2
Nov-1
2
Jan-1
3
Mar-
13
May-1
3
Jul-
13
Sep-1
3
Nov-1
3
Jan-1
4
Equity & Bond Fund Cash Flows (Billions USD)
Equity Funds Bond Funds
Source: Investment Company Institute (ICI)

1 | Currency Market Monitor 1st Quarter 2014 | April 3, 2014 | © CME GROUP
Price Performance
The factors discussed above exert an obvious impact
upon the price performance of the U.S. dollar vis-à-
vis other world currencies. In order to monitor this
price impact, CME Group has developed the “CME
USD Index” as one in a family of similarly
constructed FX Indexes. 12
The CME USD Index ended calendar year 2013 at a
value of 1,042.66 and remained virtually unchanged
over the course of the 1st quarter to end at
12 The CME USD Index represents a basket of equally
weighted positions (as of December 31, 2010) of the USD vs. the Euro (EUR), Japanese yen (JPY), British pound (GBP), Swiss franc (CHF), Canadian dollar (CAD), Australian dollar (AUD) and Chinese yuan (CNY). It is (arbitrarily) established at a value of 1,000.00 as of December 31, 2010.
1,0401.10. As such, the 1st quarter proved to be a
relatively quiet market in terms of price or spot
return performance.
The Euro generated a spot return of +0.25% vs. the
USD; the British pound (GBP) posted a return of
+0.76%; while the Japanese yen (JPY) was seen
+2.04% for the quarter, bouncing back a bit from its
-17.62% plunge during the course of 2013.
Mixed and more dramatic movements were seen
amongst emerging market currencies where the
Brazilian real (BRL) posted a spot return of +6.62%;
the Russian ruble weighed down by tensions in the
Crimea saw a spot return of -4.86%; the Indian
rupee (INR) was seen +9.25%; while the onshore
Chinese yuan or renminbi (CNY) posted a spot
return of -2.62%.
-1%
0%
1%
2%
3%
4%
5%
2010
2011
2012
2013
2014
14-1
9
20-2
5
Annual GDP Growth (Mature Economies)
Germany Japan UK US
Source: The Conference Board
-6%
-4%
-2%
0%
2%
4%
6%
2006
2007
2008
2009
2010
2011
2012
2013
Current Acct Balance (% GDP)(Mature Economies)
US Euro Area UK Japan
0%
2%
4%
6%
8%
10%
12%
2010
2011
2012
2013
2014
14-1
9
20-2
5
Annual GDP Growth(BRIC Economies)
Brazil Russia India China
Source: The Conference Board
-6%
-4%
-2%
0%
2%
4%
6%
8%
10%
12%
2006
2007
2008
2009
2010
2011
2012
2013
Current Acct Balance (% GDP)(BRIC Economies)
Brazil Russia India China

2 | Currency Market Monitor 1st Quarter 2014 | April 3, 2014 | © CME GROUP
Note that we may distinguish the “spot return” of a
currency, or the outright price movements, from the
“total return” inclusive of price movements plus
interest accrual considerations, as discussed in more
detail below.
Total Return
One of the most popular long-term FX trading
strategies over the past decade is known simply as
the “carry trade.” This practice simply suggests
that one might exploit “cost of carry” by borrowing
in countries with low nominal interest rates to invest
in countries with high nominal interest rates. Thus,
one might sell the “low-rate” currency and buy the
“high-rate” currency.
Carry trade � Sell low-rate currency & buy high-rate currency
By so doing, one hopes to capitalize on discrepant
interest rates, and by implication, divergent
investment opportunities, in the two countries. This
strategy further recognizes that total currency return
consists of 2 components, specifically, exchange rate
or price movement plus the accrual of interest.
The implicit assumption is that these interest rate
relationships will endure. As such, carry traders
implicitly discount classical exchange rate theories
by assuming that the interest rate relationships may
endure over extended periods of time. This
suggests that low-yielding currencies that are sold
will not advance; and, that high-yielding currencies
that are purchased will not decline.
Total Currency Return
= Price Movement
+ Interest
Historically, such relationships have been known to
endure for extended periods of time, reinforcing
interest in the carry trade. In particular, vast sums
of money totaling in the trillions of U.S. dollars were
invested in the carry trade prior to the outbreak of
the subprime crisis, specifically by shorting the
Japanese yen (JPY) and investing in other currencies
including the Icelandic krona (ISK).
Appendix 2 depicts the total return associated with
various currencies, relative to the U.S. dollar, during
the most recently completed calendar quarter.
Amongst the mature economies, the EUR generated
a total return of +0.25% for the quarter; the GBP at
+0.76%; and, the JPY was at +2.04%. To the
extent that interest rates remain at near zero levels
in these mature economies, the total returns are not
much different than spot returns as reported above.
But interest accruals may exert a much greater
influence in less mature economies. The BRL posted
a total return of +6.62% for the 1st quarter; the RUB
was seen at -4.86%; the INR at +5.57%; and, the
CNY at -2.33%.
The Argentine peso (ARS) generated a spot return of
-18.53% for the quarter. But the total return was
much more muted at -7.57% as a result of the
extremely high prevailing 3-month rate of 29.20%.
Because the carry trade has become such an
important and widely followed transaction in the
900
950
1,000
1,050
1,100
1,150
1,200
1,250
Jan-0
7
Jul-
07
Jan-0
8
Jul-
08
Jan-0
9
Jul-
09
Jan-1
0
Jul-
10
Jan-1
1
Jul-
11
Jan-1
2
Jul-
12
Jan-1
3
Jul-
13
Jan-1
4
CME USD Index
Long Short14.3% EUR 100% USD14.3% JPY14.3% GBP 14.3% CHF 14.3% CAD14.3% AUD14.3% CNY
-8%
-6%
-4%
-2%
0%
2%
4%
6%
8%
USD-ARSUSD-RUBUSD-CADUSD-CLPUSD-CNYUSD-TWDUSD-COPUSD-KRW
USDEUR-USDUSD-MXNUSD-ZARGBP-USDUSD-CHFUSD-JPYUSD-TRYUSD-ISK
AUD-USDUSD-INRNZD-USDUSD-BRL
Carry Return (Q1 2014)
3 | Currency Market Monitor 1st Quarter 2014 | April 3, 2014 | © CME GROUP
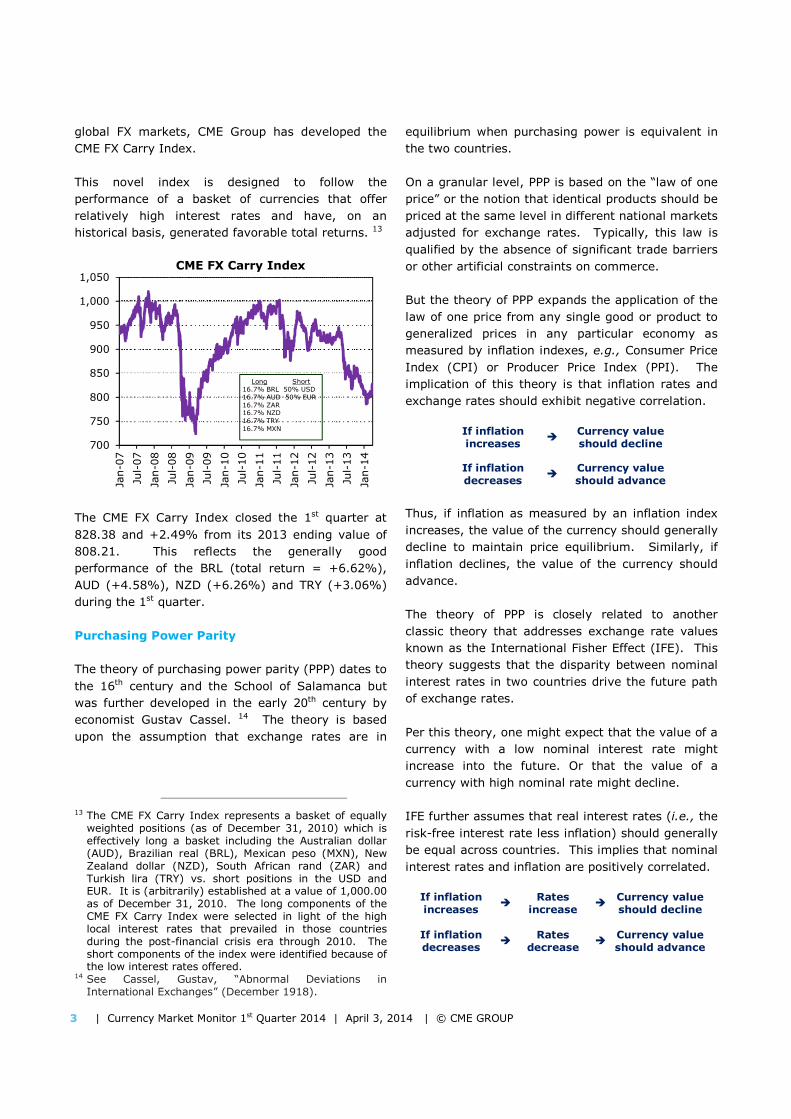
global FX markets, CME Group has developed the
CME FX Carry Index.
This novel index is designed to follow the
performance of a basket of currencies that offer
relatively high interest rates and have, on an
historical basis, generated favorable total returns. 13
The CME FX Carry Index closed the 1st quarter at
828.38 and +2.49% from its 2013 ending value of
808.21. This reflects the generally good
performance of the BRL (total return = +6.62%),
AUD (+4.58%), NZD (+6.26%) and TRY (+3.06%)
during the 1st quarter.
Purchasing Power Parity
The theory of purchasing power parity (PPP) dates to
the 16th century and the School of Salamanca but
was further developed in the early 20th century by
economist Gustav Cassel. 14 The theory is based
upon the assumption that exchange rates are in
13 The CME FX Carry Index represents a basket of equally
weighted positions (as of December 31, 2010) which is effectively long a basket including the Australian dollar (AUD), Brazilian real (BRL), Mexican peso (MXN), New Zealand dollar (NZD), South African rand (ZAR) and Turkish lira (TRY) vs. short positions in the USD and EUR. It is (arbitrarily) established at a value of 1,000.00 as of December 31, 2010. The long components of the CME FX Carry Index were selected in light of the high local interest rates that prevailed in those countries during the post-financial crisis era through 2010. The short components of the index were identified because of the low interest rates offered.
14 See Cassel, Gustav, “Abnormal Deviations in International Exchanges” (December 1918).
equilibrium when purchasing power is equivalent in
the two countries.
On a granular level, PPP is based on the “law of one
price” or the notion that identical products should be
priced at the same level in different national markets
adjusted for exchange rates. Typically, this law is
qualified by the absence of significant trade barriers
or other artificial constraints on commerce.
But the theory of PPP expands the application of the
law of one price from any single good or product to
generalized prices in any particular economy as
measured by inflation indexes, e.g., Consumer Price
Index (CPI) or Producer Price Index (PPI). The
implication of this theory is that inflation rates and
exchange rates should exhibit negative correlation.
If inflation increases
� Currency value should decline
If inflation decreases
� Currency value should advance
Thus, if inflation as measured by an inflation index
increases, the value of the currency should generally
decline to maintain price equilibrium. Similarly, if
inflation declines, the value of the currency should
advance.
The theory of PPP is closely related to another
classic theory that addresses exchange rate values
known as the International Fisher Effect (IFE). This
theory suggests that the disparity between nominal
interest rates in two countries drive the future path
of exchange rates.
Per this theory, one might expect that the value of a
currency with a low nominal interest rate might
increase into the future. Or that the value of a
currency with high nominal rate might decline.
IFE further assumes that real interest rates (i.e., the
risk-free interest rate less inflation) should generally
be equal across countries. This implies that nominal
interest rates and inflation are positively correlated.
If inflation increases
� Rates
increase �
Currency value should decline
If inflation decreases
� Rates
decrease �
Currency value should advance
700
750
800
850
900
950
1,000
1,050
Jan-0
7
Jul-
07
Jan-0
8
Jul-
08
Jan-0
9
Jul-
09
Jan-1
0
Jul-
10
Jan-1
1
Jul-
11
Jan-1
2
Jul-
12
Jan-1
3
Jul-
13
Jan-1
4
CME FX Carry Index
Long Short16.7% BRL 50% USD16.7% AUD 50% EUR16.7% ZAR 16.7% NZD16.7% TRY16.7% MXN
4 | Currency Market Monitor 1st Quarter 2014 | April 3, 2014 | © CME GROUP
The IFE suggests interest rates and exchange
negatively correlated. Similarly, PPP suggests
inflation and exchange rates are negatively
correlated. As such, the IFE theory is generally
consistent with the PPP theory.
Putting the classic theory of purchasing power parity
into practice requires a measurement of inflation in
order to calculate the proportion by which any
particular currency is (theoretically) over- or under-
valued relative to the norm. There are three popular
methodologies that have been referenced in this
regard.
• OECD - The Organization for Economic Co-
operation and Development (OECD) provides data
that is useful in this regard by comparing price
changes in a representative basket of goods in
various countries.
• Bloomberg - Bloomberg offers an analytical tool
that is grounded in a very long-term assessment
of inflation, as measured by either CPI or PPI in
various countries extending from January 1982
through June 2000.
• Big Mac - Finally, the Economist’s “Big Mac PPP”
methodology compares the price of a (almost)
universally available product with verifiable pricing
in the form of the McDonald’s Big Mac hamburger
in various countries.
All three methodologies may readily be referenced
on Bloomberg quotation devices. Appendix 3 below
provides data from all three methods. Further, we
have taken the average of the three assessments
(where available) for a variety of national currencies
and rank-ordered the set from most over-valued to
most under-valued.
The Norwegian krone (NOK) stands out as the most
over-valued currency per this analysis at +31.79%.
The NOK is followed by the Swiss franc (CHF) at
+31.22%; the New Zealand dollar (NZD) at
+23.30%; the Danish krone (DKK) at +19.57%;
and, the Icelandic krona (ISK) at +18.23%.
Under-valued currencies, per our analysis, include
the Turkish lira (TRY) at -59.85%; the Polish zloty
(PLN) at -53.00%; the Malaysian ringgit (MYR) at -
52.91%; the Mexican peso (MXN) at -52.83%; and,
the Hong Kong dollar (HKD) at -51.93%.
One might generally recommend creating “baskets”
of several currencies to buy and sell on the basis of
this analysis in order to diversify risks to a certain
extent. However, it is important to recognize that
currencies might remain in apparent states of over-
or under-valuation for extended periods of time. In
fact, the carry trade, as discussed above, takes a
completely opposite approach to the classic PPP
theory by buying high-rate currencies and shorting
low-rate currencies.
Impact of Commodities
As a general rule, the nations whose currencies have
remained top performers over the past decade may
be identified as those whose national income is tied
heavily to commodity production.
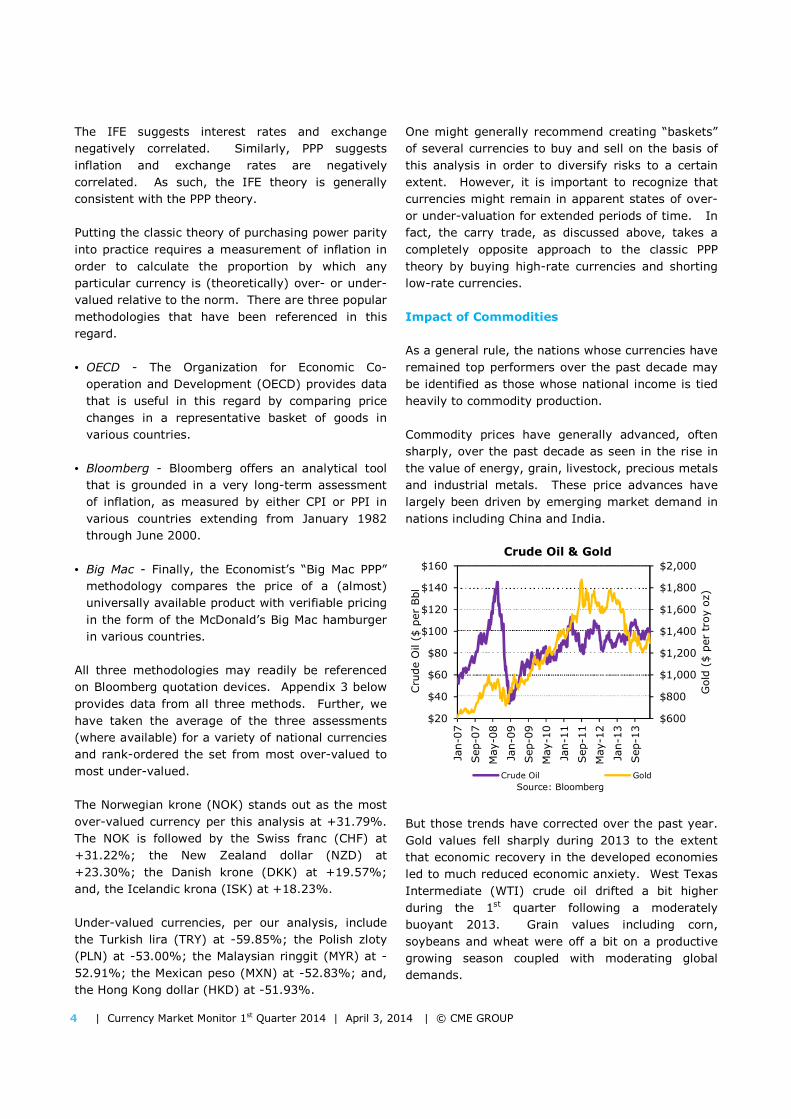
Commodity prices have generally advanced, often
sharply, over the past decade as seen in the rise in
the value of energy, grain, livestock, precious metals
and industrial metals. These price advances have
largely been driven by emerging market demand in
nations including China and India.
But those trends have corrected over the past year.
Gold values fell sharply during 2013 to the extent
that economic recovery in the developed economies
led to much reduced economic anxiety. West Texas
Intermediate (WTI) crude oil drifted a bit higher
during the 1st quarter following a moderately
buoyant 2013. Grain values including corn,
soybeans and wheat were off a bit on a productive
growing season coupled with moderating global
demands.
$600
$800
$1,000
$1,200
$1,400
$1,600
$1,800
$2,000
$20
$40
$60
$80
$100
$120
$140
$160
Jan-0
7
Sep-0
7
May-0
8
Jan-0
9
Sep-0
9
May-1
0
Jan-1
1
Sep-1
1
May-1
2
Jan-1
3
Sep-1
3
Gold
($ p
er
troy o
z)
Cru
de O
il (
$ p
er
Bbl
Crude Oil & Gold
Crude Oil Gold
Source: Bloomberg

5 | Currency Market Monitor 1st Quarter 2014 | April 3, 2014 | © CME GROUP
CME Group has developed the CME FX Commodity
Country Index to follow the performance of a basket
of currencies from nations that rely heavily upon the
exportation of commodities and other raw materials.
To the extent that commodities have been in great
demand over much of the past decade, these
currencies have, on a historical basis, generated
favorable total returns. 15
The CME FX Commodity Country Index drifted up
2.01% to 875.19 by the conclusion of the 1st quarter
from the year-end 2013 value of 857.91.
CME Group has further developed the CME FX BRIC
Index to follow the performance of select “emerging
market” economies and their national currencies,
namely the Brazilian real (BRL), Russian ruble
(RUB), Indian rupee (INR) and Chinese yuan (CNY),
that have created much of the demand for
commodities in the world today. 16
15 The CME Commodity Country Index is constructed to be
effectively long Australian dollar (AUD), Brazilian real (BRL), Canadian dollar (CAD), Norwegian krone (NOK), New Zealand dollar (NZD) and South African rand (ZAR) vs. a short position in the U.S. dollar (USD). It is (arbitrarily) established at a value of 1,000.00 as of December 31, 2010.
16 The CME BRIC Index is constructed of equal weightings of long Brazilian real (BRL), Russian ruble (RUB), Indian rupee (INR) and Chinese yuan (CNY) vs. a short position in the U.S. dollar (USD). Like other CME FX indexes discussed above, the BRIC Index was equally weighted and calibrated to equal an arbitrary 1,000.00 as of December 31, 2010.
The CME FX BRIC Index ended the 1st quarter at
852.35 and virtually unchanged from the year-end
2013 mark at 858.26.
Conclusion
CME offers a broad array of currency futures and
option contracts covering a wide range of currency
pairings (where one side is the U.S. dollar) and
cross-rate pairings (which do not involve the U.S.
dollar). These products provide facile and liquid
vehicles with which one may express a view on
prospective market movements. Or, to manage the
risks associated with currency holdings or
international investments during turbulent times.
For more information please visit our website at
www.cmegroup.com/trading/fx.
$2
$4
$6
$8
$10
$12
$14
$16
$18
Jan-0
7
Jul-
07
Jan-0
8
Jul-
08
Jan-0
9
Jul-
09
Jan-1
0
Jul-
10
Jan-1
1
Jul-
11
Jan-1
2
Jul-
12
Jan-1
3
Jul-
13
Jan-1
4
$ p
er
Bushel
Grains
Corn Soybeans Wheat
Source: Bloomberg
650
700
750
800
850
900
950
1,000
1,050
1,100
Jan-0
7
Jul-
07
Jan-0
8
Jul-
08
Jan-0
9
Jul-
09
Jan-1
0
Jul-
10
Jan-1
1
Jul-
11
Jan-1
2
Jul-
12
Jan-1
3
Jul-
13
Jan-1
4
CME FX Commodity Country Index
Long Short16.7% AUD 100% USD16.7% BRL 16.7% CAD 16.7% NOK16.7% NZD16.7% ZAR
800
840
880
920
960
1,000
1,040
1,080
1,120
Jan-0
7
Jul-
07
Jan-0
8
Jul-
08
Jan-0
9
Jul-
09
Jan-1
0
Jul-
10
Jan-1
1
Jul-
11
Jan-1
2
Jul-
12
Jan-1
3
Jul-
13
Jan-1
4
CME FX BRIC Index
Long Short25% BRL 100% USD25% RUB 25% INR 25% CNY

6 | Currency Market Monitor 1st Quarter 2014 | April 3, 2014 | © CME GROUP
Appendix 1: Summary of World Economic Conditions
Australia Brazil Canada
Growth,
Inflation
& Fiscal
Policy
Australia’s economy may suffer from further deceleration of growth in China and by
potential problems in China’s shadow banking system.
Economic growth has been slow in Brazil, but there are signs of incremental improvement.
Water shortages, especially around Sao Paulo, though, may be a risk to growth.
Canada is benefiting from the continued jobs expansion in the US. On the negative side, the domestic oil sector has some challenges
and delays in the US decision on the Keystone pipeline are not helping economic confidence.
Monetary
Policy
Monetary policy now appears to be on hold in Australia. Short-term interest rates offer a small premium to the near-zero rates in the
US, Europe, and Japan.
Short-term interest rates around 10% now provide solid support for the currency. As
emerging market currency pressures abate, there may be room for rate cuts later in 2014.
Canada’s rates are low. There are no inflation pressures. The Bank of Canada seems
comfortable with the current set of policies, at least so long as the US keeps its federal funds
rate near zero.
Special
Factors
The Australian dollar managed a small appreciation in Q1/2014, even with uncertainties relating to China and
commodities prices.
Brazil hosts the World Cup in 2014 and the Olympics in 2016. A successful World Cup
has the potential to give the markets a boost of confidence in the Brazilian real.
Rate differentials with the US are too small to support the Canadian dollar. The big risks are in the energy sector. Weaker oil prices or a US decision against the Keystone pipeline
would probably hurt the currency.
China European Union India
Growth,
Inflation
& Fiscal
Policy
China may decelerate further to around 6.5% to 7% real GDP growth in 2014. The
economy is likely to avoid a hard landing but continues to face challenges in its shadow
banking system.
Europe is likely to post some small gains in economic growth in 2014. The rise in the
euro over the past 12 months of a little more than 7%, however, appears to be contributing to a risk of slipping into deflationary territory.
India’s economy is growing at only about half the pace it once did. At the same time,
monetary policy was tightened to defend the currency in 2013.
Monetary
Policy
Monetary policy remains in flux. The central bank has to decide how much support to give a struggling shadow banking system. Also,
the weaker RMB means that China is unlikely to be a buyer of US Treasuries, as it was in periods of upward pressure on the currency.
The ECB faces two big policy challenges (a) supervising banks and completing a round of
stress tests, and (b) deciding how to deal with deflationary pressures. Some form of
expanded policy accommodation is possible.
Short-term interest rates above 8% worked to stabilize the currency in Q1/2014. A
prolonged period of currency stability could potentially allow for rate cuts down the road.
Special
Factors
China has widened the bands for currency volatility, and the RMB weakened during
Q1/2014, joining the ranks of other emerging market currencies that had previously
experienced weakness.
The EU Parliamentary elections in May 2014 could prove very interesting. Fringe parties appear to be gaining ground, such as the UK Independence Party and the National Front in
France.
The India has parliamentary election in 2014 that could bring a shift of power. Despite
election uncertainties, though, stability at the central bank is likely to mitigate any market
concerns.

7 | Currency Market Monitor 1st Quarter 2014 | April 3, 2014 | © CME GROUP
Appendix 1: Summary of World Economic Conditions, cont.
Japan Mexico Russia
Growth,
Inflation
& Fiscal
Policy
Japan’s hike in its national sales tax is expected to lead to weaker real GDP for a few quarters. There is possibility of Prime Minister
Abe bringing forward more fiscal stimulus if economic growth is too depressed by the sales
tax hike.
Mexico is benefiting from improved growth in the United States. Mexico has also increased its imports of relatively inexpensive natural
gas through its pipeline link with Texas.
Russia’s annexation of the Crimea will come at a price of expanded spending and potential
sanctions. Slower economic growth and even possibly a recession seem quite possible.
Monetary
Policy
The Bank of Japan may also consider expanding its quantitative easing (asset
purchase) program if real GDP shrinks in the April-June quarter.
The Bank of Mexico has been able to allow for small rate reductions as the currency has
stabilized.
The political uncertainties over the Crimea takeover have led to a weaker Ruble and higher
interest rates.
Special
Factors
A 2% inflation target by the Bank of Japan is not likely to be achieved in a short time frame unless there is further yen depreciation toward
the 120-140 yen/dollar rate. There is the possibility the government and central bank
would welcome another round of yen weakness.
In the emerging market currency sell-off in 2013, the Mexican peso did not lose as much ground as many of its peers. And now that pressures have abated, the peso is poised to
regain some lost ground.
Russia’s annexation of the Crimea has dominated the headlines in Q1/2014. And, Russia is likely to put more pressure on the Ukraine through higher
natural gas prices.
Switzerland United Kingdom United States
Growth,
Inflation
& Fiscal
Policy
Switzerland is seeing some benefits from Europe’s stabilization. Moreover, stronger growth in the US may also help exports.
The UK’s growth prospects are steadily improving. The budget deficit as a percent of
GDP is also declining.
The US economy suffered through a tough winter in midwest and northeast, but a bounce back seems in progress as spring has arrived. And,
surprising to many, the Federal budget deficit is on track to be balanced on an operating basis in
FY2015.
Monetary
Policy
As the EU debt crisis has morphed into a long-term banking capital adequacy problem, the
Swiss have little flexibility, and they are likely continue to keep a lid on the Swiss franc
relative to the euro.
The Bank of England has indicated it plans to keep rates low and focus its efforts on financial
supervision. A stronger economy than expected by the BoE could change that
guidance later in 2014.
The Yellen-led Federal Reserve immediately moved to alter its forward guidance process at its first FOMC meeting after Bernanke’s retirement. Indicator-based guidance is out, replaced by a
more nuanced view of labor market conditions and potential inflation pressures. QE is on track to
end in Q4/2014.
Special
Factors
The post-2008 financial crisis has led to increased regulation of financial institutions all
over the world. On net, this increased regulation poses additional challenges for the
traditional model of Swiss secrecy and the overall role of Switzerland in the world’s
financial system.
The vote in Scotland on independence in September is starting to cast a shadow over the British pound. The outcome will depend on the tug of war between the pocket book
and the heart strings. Economics says independence would hurt Scotland and the UK. But Scots can achieve at the ballot box what
eluded Robert Bruce and William Wallace.
The US dollar may hold the key to whether inflation pressures emerge in the US. The 1970s
saw a weak dollar and rising inflation, and the early 1980s saw dramatic declines in inflation with
a strong dollar. During 2013, a weak yen and weak emerging market currencies contributed to
deflationary pressures in the US.

8 | Currency Market Monitor 1st Quarter 2014 | April 3, 2014 | © CME GROUP
Appendix 2: Select Currency Performance (1st Quarter 2014)
Currency Ticker Spot Quote
(3/31/14) Quote
Convention 3-Mth Rates
(3/31/14)
1st Quarter 2014 2014 Year-to-Date
Total
Return1
Spot
Return2
Interest
Return3
Total
Return1
Spot
Return2
Interest
Return3
Argentine Peso USD-ARS 8.0014 USD per 1 ARS 29.20% -7.57% -18.53% 13.46% -7.57% -18.53% 13.46%
Australian Dollar AUD-USD 0.9264 AUD per 1 USD 2.70% 4.58% 3.89% 0.67% 4.58% 3.89% 0.67%
Brazilian Real USD-BRL 2.2720 USD per 1 BRL 6.62% 3.97% 2.55% 6.62% 3.97% 2.55%
British Pound GBP-USD 1.6662 GBP per 1 USD 0.50% 0.76% 0.63% 0.12% 0.76% 0.63% 0.12%
Canadian Dollar USD-CAD 1.1050 USD per 1 CAD 1.08% -3.59% -3.86% 0.28% -3.59% -3.86% 0.28%
Chilean Peso USD-CLP 548.50 USD per 1 CLP -3.39% -4.37% 1.02% -3.39% -4.37% 1.02%
China Renminbi USD-CNY 6.2181 USD per 1 CNY 4.75% -2.33% -2.62% 0.29% -2.33% -2.62% 0.29%
Colombian Peso USD-COP 1,971.94 USD per 1 COP -1.43% -2.11% 0.70% -1.43% -2.11% 0.70%
Euro EUR-USD 1.3770 EUR per 1 USD 0.26% 0.25% 0.19% 0.06% 0.25% 0.19% 0.06%
Icelandic Krona USD-ISK 112.79 USD per 1 ISK 5.85% 3.62% 2.12% 1.47% 3.62% 2.12% 1.47%
Indian Rupee USD-INR 0.0167 USD per 1 INR 9.25% 5.57% 3.19% 2.31% 5.57% 3.19% 2.31%
Japanese Yen USD-JPY 103.23 USD per 100 JPY 0.04% 2.04% 2.01% 0.02% 2.04% 2.01% 0.02%
Mexico Peso USD-MXN 13.0585 USD per 1 MXN 3.81% 0.58% -0.16% 0.74% 0.58% -0.16% 0.74%
New Zealand Dollar NZD-USD 0.8671 NZD per 1 USD 3.19% 6.26% 5.47% 0.75% 6.26% 5.47% 0.75%
Russian Ruble USD-RUB 35.0653 USD per 1 RUB 8.38% -4.86% -6.55% 1.81% -4.86% -6.55% 1.81%
South Africa Rand USD-ZAR 10.5807 USD per 1 ZAR 6.05% 0.61% -0.37% 0.99% 0.61% -0.37% 0.99%
South Korean Won USD-KRW 1,064.24 USD per 1 KRW -0.82% -1.40% 0.59% -0.82% -1.40% 0.59%
Swiss Franc USD-CHF 0.8851 USD per 1 CHF -0.05% 0.93% 0.94% -0.01% 0.93% 0.94% -0.01%
Taiwanese Dollar USD-TWD 30.471 USD per 1 TWN 0.87% -2.02% -2.23% 0.21% -2.02% -2.23% 0.21%
Turkish Lira USD-TRY 2.1407 USD per 1 TRY 11.48% 3.06% 0.35% 2.70% 3.06% 0.35% 2.70%
United States Dollar USD 1.0000 USD 0.23% 0.06% 0.06% 0.06% 0.06%
Notes
(1) Return from price movement and interest (2) Return from currency price movement vs. USD as “base currency”
(3) Return from interest at prevailing 3-month rates or implied NDF rate
Source: Bloomberg

9 | Currency Market Monitor 1st Quarter 2014 | April 3, 2014 | © CME GROUP
Appendix 3: Purchasing Power Parity (“PPP”) Analysis (as of 3/31/14)
% Over/Under Valued
Currency ISO
Code Average OECD
Bloomberg
(CPI)
Bloomberg
(PPI) Big Mac
Norwegian Krone NOK 31.79% 31.98% 10.58% 52.80%
Swiss Franc CHF 31.22% 35.45% 24.58% 10.88% 53.95%
New Zealand Dollar NZD 23.30% 21.19% 33.57% 40.70% -2.25%
Danish Krone DKK 19.57% 29.06% 19.58% 18.06% 11.56%
Icelandic Krona ISK 18.23% 18.23%
Australian Dollar AUD 15.57% 26.71% 26.74% 19.38% -10.54%
Swedish Krona SEK 13.00% 25.05% -5.08% -3.35% 35.36%
Euro EUR 11.15% 6.02% 18.66% 14.04% 5.86%
British Pound GBP 7.11% 13.46% 17.25% 5.66% -7.95%
Canadian Dollar CAD 4.50% 10.48% 7.36% -3.47% 3.62%
Brazilian Real BRL 3.59% 3.59%
Colombian Peso COP -11.76% -11.76%
Japanese Yen JPY -17.84% -0.60% -17.60% -13.75% -39.39%
Singapore Dollar SGD -20.97% -20.97%
South Korean Won KRW -25.14% -25.78% -24.50%
Chilean Peso CLP -25.61% -25.61%
Czech Koruna CZK -26.22% -26.22%
Thai Baht THB -42.09% -42.09%
South African Rand ZAR -42.39% -25.78% -59.00%
Chinese Renminbi CNY -42.69% -42.69%
Hungarian Forint HUF -46.95% -75.58% -18.32%
Phillipines Peso PHP -47.11% -47.11%
Argentina Peso ARS -47.36% -47.36%
Indonesian Rupiah IDR -47.88% -47.88%
Russian Ruble RUB -50.02% -50.02%
Hong Kong Dollar HKD -51.93% -51.93%
Mexican Peso MXN -52.83% -66.67% -38.99%
Malaysian Ringgit MYR -52.91% -52.91%
Polish Zloty PLN -53.00% -67.66% -38.34%
Turkish Lira TRY -59.85% -98.51% -21.19%
Notes
Please note that data regarding all countries is not generally available.
Source: Bloomberg
10 | Currency Market Monitor 1st Quarter 2014 | April 3, 2014 | © CME GROUP
Futures and options trading is not suitable for all investors, and involves the risk of loss. Futures are leveraged investments, and because only a percentage of a contract’s value is required to
trade, it is possible to lose more than the amount of money initially deposited for a futures position. Therefore, traders should only use funds that they can afford to lose without affecting
their lifestyles. And only a portion of those funds should be devoted to any one trade because they cannot expect to profit on every trade. All matters pertaining to rules and specifications
herein are made subject to and are superseded by official CME rules. Current rules should be consulted in all cases concerning contract specifications.
The information within this presentation has been compiled by CME Group for general purposes only. Although every attempt has been made to ensure the accuracy of the information within
this presentation, CME Group assumes no responsibility for any errors or omissions. All data is sourced by CME Group unless otherwise stated.
CME Group is a trademark of CME Group Inc. The Globe logo, E-mini, E-micro, Globex, CME and Chicago Mercantile Exchange are trademarks of Chicago Mercantile Exchange Inc. All other
trademarks are the property of their respective owners.
Copyright © 2014 CME Group. All rights reserved.
Related Documents