Cultured phototrophic biofilms for phosphorus removal in wastewater treatment Antonella Guzzon a , Andreas Bohn b , Marco Diociaiuti c , Patrizia Albertano a, * a Department of Biology, University of Rome ‘‘Tor Vergata’’, Via della Ricerca scientifica 1, 00173 Rome, Italy b Instituto de Tecnologia Quı´mica e Biolo ´gica, Universidade Nova de Lisboa, Avenida da Repu ´blica - EAN, 2780-157 Oeiras, Portugal c Dipartimento di Tecnologie e Salute, Istituto Superiore di Sanita `, Viale Regina Elena 299, 00161 Rome, Italy article info Article history: Received 10 December 2007 Received in revised form 6 June 2008 Accepted 22 July 2008 Available online 3 August 2008 Keywords: Phototrophic biofilms Biomass production Phosphorus removal Wastewater Energy Filtered-Transmission Electron Microscopy (EF-TEM) Electron Spectroscopy Imaging (ESI) abstract Culture experiments with phototrophic biofilms taken from the sedimentation tank of the wastewater treatment plant at the Fiumicino Airport in Rome, Italy were carried out in a prototype continuous flow incubator. Biofilms grown at varying photosynthetic photon flux density (PPFD), temperature and flow velocity were sampled at three developmental stages to quantify biofilm dry weight, chlorophyll a concentration and total cellular phosphorus content. While no coherent significant effects by flow and temperature were evidenced, maximum biofilm dry weight and phosphorous concentration significantly increased across all featured PPFDs. Maximum chlorophyll a concentration was saturated above 60 mmol m 2 s 1 . A highly significant association between organic biomass and phosphorous content was observed for most light conditions, including a larger propor- tional increase of phosphorus concentration with respect to chlorophyll a at high PPFD. Up to 112 mg P m 2 d 1 maximal phosphorous removal rates were achieved. Elemental anal- ysis by energy filtering transmission electron microscopy showed subcellular localization of phosphorus, confirming the accumulation in phototrophic microorganisms in biofilms grown in high light conditions. ª 2008 Elsevier Ltd. All rights reserved. 1. Introduction Wastewater treatment provides optimal conditions for bacterial growth and decomposition of organic material by water mixing and oxygenation (Gerba, 2000); however, it has little capacity to remove inorganic nutrients (Davis et al., 1990a). Among these, phosphorus (P) is the element normally responsible for eutrophication of freshwater ecosystems (Adey et al., 1993). Therefore, additional physical and/or chemical tertiary wastewater treatment is needed before release back into natural watercourses, but often too costly to be implemented (Graham and Wilcox, 2000). One solution to this problem is to capitalize on the nutrient removal capacity of algae as a cost effective and environ- mentally sound option for tertiary treatment of effluents (Hoffmann, 1998; Oswald, 2003). Phosphorus is vital for algal growth and stored when it is in excess (Graham and Wilcox, 2000). Efforts to integrate algal cultures in biological waste- water treatment have been increasing over the last few decades (Oswald, 1988; De la Nou ¨ e et al., 1992; Chevalier et al., 2000; Martı ´nez et al., 2000; Kebede-Westhead et al., 2003). Hoffmann (1998) reviewed the use of suspended algae (mixed or monocultures) for wastewater purification in high rate algal ponds and pinpointed the challenges involved with the * Corresponding author. Fax: þ39 06 2023500. E-mail address: [email protected] (P. Albertano). Available at www.sciencedirect.com journal homepage: www.elsevier.com/locate/watres 0043-1354/$ – see front matter ª 2008 Elsevier Ltd. All rights reserved. doi:10.1016/j.watres.2008.07.029 water research 42 (2008) 4357–4367

Welcome message from author
This document is posted to help you gain knowledge. Please leave a comment to let me know what you think about it! Share it to your friends and learn new things together.
Transcript
w a t e r r e s e a r c h 4 2 ( 2 0 0 8 ) 4 3 5 7 – 4 3 6 7
Avai lab le a t www.sc iencedi rec t .com
journa l homepage : www.e lsev ie r . com/ loca te /wat res
Cultured phototrophic biofilms for phosphorus removal inwastewater treatment
Antonella Guzzona, Andreas Bohnb, Marco Diociaiutic, Patrizia Albertanoa,*aDepartment of Biology, University of Rome ‘‘Tor Vergata’’, Via della Ricerca scientifica 1, 00173 Rome, ItalybInstituto de Tecnologia Quımica e Biologica, Universidade Nova de Lisboa, Avenida da Republica - EAN, 2780-157 Oeiras, PortugalcDipartimento di Tecnologie e Salute, Istituto Superiore di Sanita, Viale Regina Elena 299, 00161 Rome, Italy
a r t i c l e i n f o
Article history:
Received 10 December 2007
Received in revised form
6 June 2008
Accepted 22 July 2008
Available online 3 August 2008
Keywords:
Phototrophic biofilms
Biomass production
Phosphorus removal
Wastewater
Energy Filtered-Transmission
Electron Microscopy (EF-TEM)
Electron Spectroscopy Imaging (ESI)
* Corresponding author. Fax: þ39 06 2023500E-mail address: [email protected] (P
0043-1354/$ – see front matter ª 2008 Elsevidoi:10.1016/j.watres.2008.07.029
a b s t r a c t
Culture experiments with phototrophic biofilms taken from the sedimentation tank of the
wastewater treatment plant at the Fiumicino Airport in Rome, Italy were carried out in
a prototype continuous flow incubator. Biofilms grown at varying photosynthetic photon
flux density (PPFD), temperature and flow velocity were sampled at three developmental
stages to quantify biofilm dry weight, chlorophyll a concentration and total cellular
phosphorus content. While no coherent significant effects by flow and temperature were
evidenced, maximum biofilm dry weight and phosphorous concentration significantly
increased across all featured PPFDs. Maximum chlorophyll a concentration was saturated
above 60 mmol m�2 s�1. A highly significant association between organic biomass and
phosphorous content was observed for most light conditions, including a larger propor-
tional increase of phosphorus concentration with respect to chlorophyll a at high PPFD. Up
to 112 mg P m�2 d�1 maximal phosphorous removal rates were achieved. Elemental anal-
ysis by energy filtering transmission electron microscopy showed subcellular localization
of phosphorus, confirming the accumulation in phototrophic microorganisms in biofilms
grown in high light conditions.
ª 2008 Elsevier Ltd. All rights reserved.
1. Introduction One solution to this problem is to capitalize on the nutrient
Wastewater treatment provides optimal conditions for
bacterial growth and decomposition of organic material by
water mixing and oxygenation (Gerba, 2000); however, it has
little capacity to remove inorganic nutrients (Davis et al.,
1990a). Among these, phosphorus (P) is the element normally
responsible for eutrophication of freshwater ecosystems
(Adey et al., 1993). Therefore, additional physical and/or
chemical tertiary wastewater treatment is needed before
release back into natural watercourses, but often too costly to
be implemented (Graham and Wilcox, 2000).
.. Albertano).er Ltd. All rights reserved
removal capacity of algae as a cost effective and environ-
mentally sound option for tertiary treatment of effluents
(Hoffmann, 1998; Oswald, 2003). Phosphorus is vital for algal
growth and stored when it is in excess (Graham and Wilcox,
2000). Efforts to integrate algal cultures in biological waste-
water treatment have been increasing over the last few
decades (Oswald, 1988; De la Noue et al., 1992; Chevalier et al.,
2000; Martınez et al., 2000; Kebede-Westhead et al., 2003).
Hoffmann (1998) reviewed the use of suspended algae (mixed
or monocultures) for wastewater purification in high rate algal
ponds and pinpointed the challenges involved with the
.
w a t e r r e s e a r c h 4 2 ( 2 0 0 8 ) 4 3 5 7 – 4 3 6 74358
harvesting of the biomass as one of the major drawbacks of
that system.
An alternative approach to suspended algae is the use of
attached algal communities such as phototrophic biofilms
that naturally colonise the surfaces of ponds in wastewater
treatment plants (WWTPs), thus leading to easier biomass
harvesting (Hoffmann, 1998). In addition, they also exhibit
higher growth rates and therefore improved nutrient removal
capabilities (Chevalier et al., 2000). Phototrophic biofilms are
multilayered consortia of photoautotrophs (cyanobacteria
and microalgae) and heterotrophs (bacteria, fungi and
protozoa). Their layers are embedded in a common exopoly-
meric matrix, secreted by the community, that mediates the
adhesion of photo and heterotrophs, as well as gas and
nutrients fluxes (Sutherland, 2001). These communities are
ubiquitous in any aquatic environment and fulfil numerous
important environmental functions (Battin et al., 2003),
among them nutrient cycling (Wetzel, 2001), and play a key
role in the self-purification of aquatic ecosystems (Sabater
et al., 2002).
Nevertheless, the application of phototrophic biofilms in
the tertiary step of wastewater remediation is still uncommon
(Hoffmann, 1998). Previously, benthic algae were grown in
algal turf scrubber units (ATS) to remove nutrients from dairy
manure (Kebede-Westhead et al., 2003), agricultural runoff
(Adey et al., 1993) and domestic sewage (Craggs et al., 1996).
The effectiveness of ATS depends on the optimisation of the
conditions that primarily limit growth and nutrient removal
potential of biofilms, such as light, temperature and water
current (Sabater et al., 2002; Kebede-Westhead et al., 2003).
In the present work, we aim to assess the nutrient retention
capacity of phototrophic biofilms using a laboratory photo-
bioreactor specifically designed for the cultivation of
phototrophic biofilms. This system is convenient to test the
effectiveness of nutrient removal by phototrophic biofilms,
prior to field application, because it allows the simultaneous
control of the external parameters and therefore to mimic the
seasonal variations of environmental conditions occurring in
outdoor wastewater treatment plants. In particular, we
quantify the phosphorus status and maximal phosphorous
removal rate and their correlation with the phototrophic
biomass production of biofilms sampled from an Italian
WWTP and grown in cultures at varying irradiance, tempera-
ture and medium flow rate. As P uptake at community level
crucially depends on the diversity of nutrient storage capacity
of the algal species in the biofilm (Sabater et al., 2002), we
also address the relative contribution of the different
phototrophic components to P retention using Energy Filtered-
Transmission Electron Microscopy (EF-TEM) and Electron
Spectroscopy Imaging (ESI) techniques to localize cellular P
reserves of the phototrophic species dominating the biofilm.
2. Materials and methods
2.1. Study site
The sample site was a sedimentation tank (ST) of the waste-
water treatment plant (WWTP) that serves the ‘‘Leonardo da
Vinci’’ Airport in Fiumicino (Rome, Italy) (41�470N, 12�150E).
The plant is an outdoor system and receives domestic sewage
at an estimated through-flow of 6000 m3 d�1. Water treatment
involves oxygen injections in the primary tank and constant
stirring in the secondary tank to reduce biochemical oxygen
demand (B.O.D.). The ST is located above ground and is fully
exposed to sunlight. Standard water treatment procedures
involved weekly scrubbing of tank walls to avoid excessive
biomass accumulation.
Due to the constant water flow and the high concentra-
tions of inorganic nutrients, the Fiumicino WWTP could be
classified as an artificial hypertrophic lotic system (OECD,
1982). In situ variables have been previously reported by the
authors, in brief; temperature, 15–25 �C; irradiance, 690–
1550 mmol m�2 s�1; pH, 6.5–7.7; TP, 0.6–3.0 mg l�1; NO3, 0.2–
8.2 mg l�1; NH4, 1.6–20 mg l�1 (Albertano et al., 1999; Guzzon
and Albertano, in press).
2.2. Biofilm sampling
Phototrophic biofilm samples were taken from the sedimen-
tation tank (ST) on two occasions in both spring 2004 (April,
May) and summer 2004 (July and September). Around 70 g
(fresh weight) of biofilm were scraped off a vertical ledge in the
ST walls the day before the weekly tank cleaning. The samples
were placed in plastic bottles, stored in a cool box with ice and
transported to the laboratory. Before the samples were used
they were pre-treated to obtain a safe-to-handle and homo-
geneous inoculum. To do this the samples were washed in 2%
sodium hypochlorite for 15 min to kill zoobenthos and path-
ogens and then rinsed in a modified BG11 medium (Stanier
et al., 1971). Modifications included adding vitamins and sili-
cates to support microalgal growth (40 mg l�1 and 57 mg l�1,
respectively, according to Beakes et al., 1988), using only
nitrate (NO3�) as the sole nitrogen source and increasing the
concentration of orthophosphate (PO43�) to obtain a final
nitrogen:phosphorus (N:P) ratio of 15 (P 3.64 mg l�1), thus
ensuring balanced conditions for algal growth. Thereafter,
biofilm biomass was homogenised using a blender, allowed to
settle for 1 h and the final suspension was frozen in fresh
medium (�20 �C for 24 h) to remove grazers (Guzzon et al.,
2005).
2.3. Setup of biofilm cultures
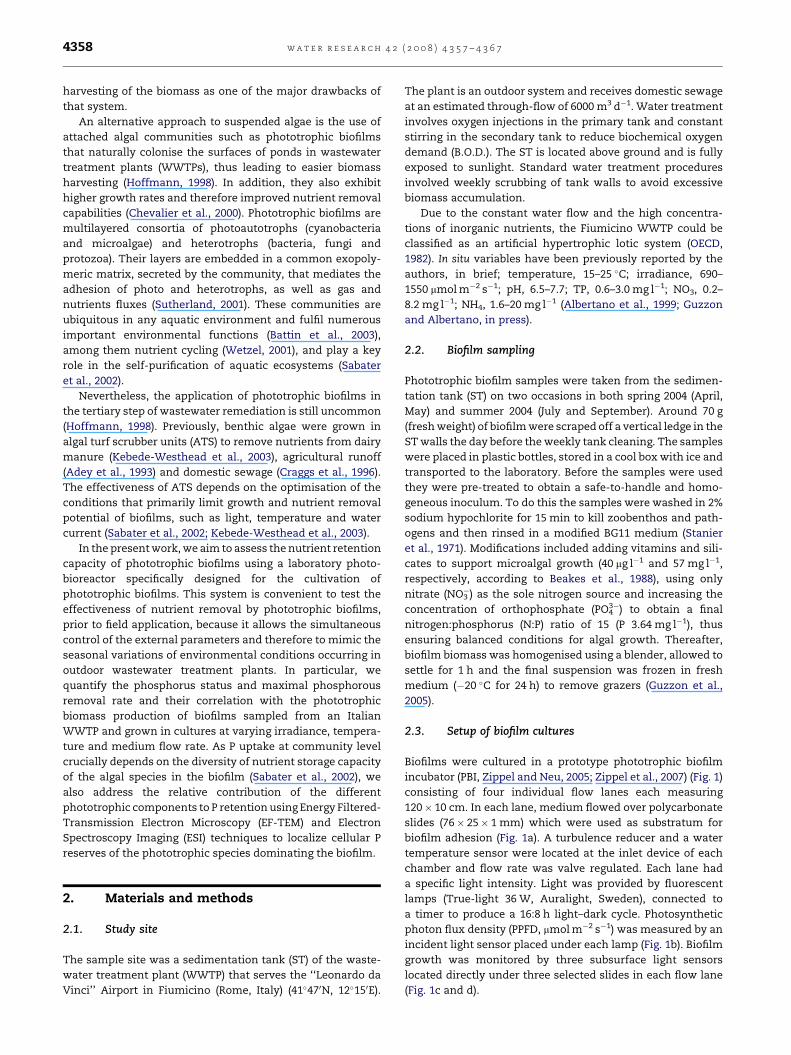
Biofilms were cultured in a prototype phototrophic biofilm
incubator (PBI, Zippel and Neu, 2005; Zippel et al., 2007) (Fig. 1)
consisting of four individual flow lanes each measuring
120� 10 cm. In each lane, medium flowed over polycarbonate
slides (76� 25� 1 mm) which were used as substratum for
biofilm adhesion (Fig. 1a). A turbulence reducer and a water
temperature sensor were located at the inlet device of each
chamber and flow rate was valve regulated. Each lane had
a specific light intensity. Light was provided by fluorescent
lamps (True-light 36 W, Auralight, Sweden), connected to
a timer to produce a 16:8 h light–dark cycle. Photosynthetic
photon flux density (PPFD, mmol m�2 s�1) was measured by an
incident light sensor placed under each lamp (Fig. 1b). Biofilm
growth was monitored by three subsurface light sensors
located directly under three selected slides in each flow lane
(Fig. 1c and d).
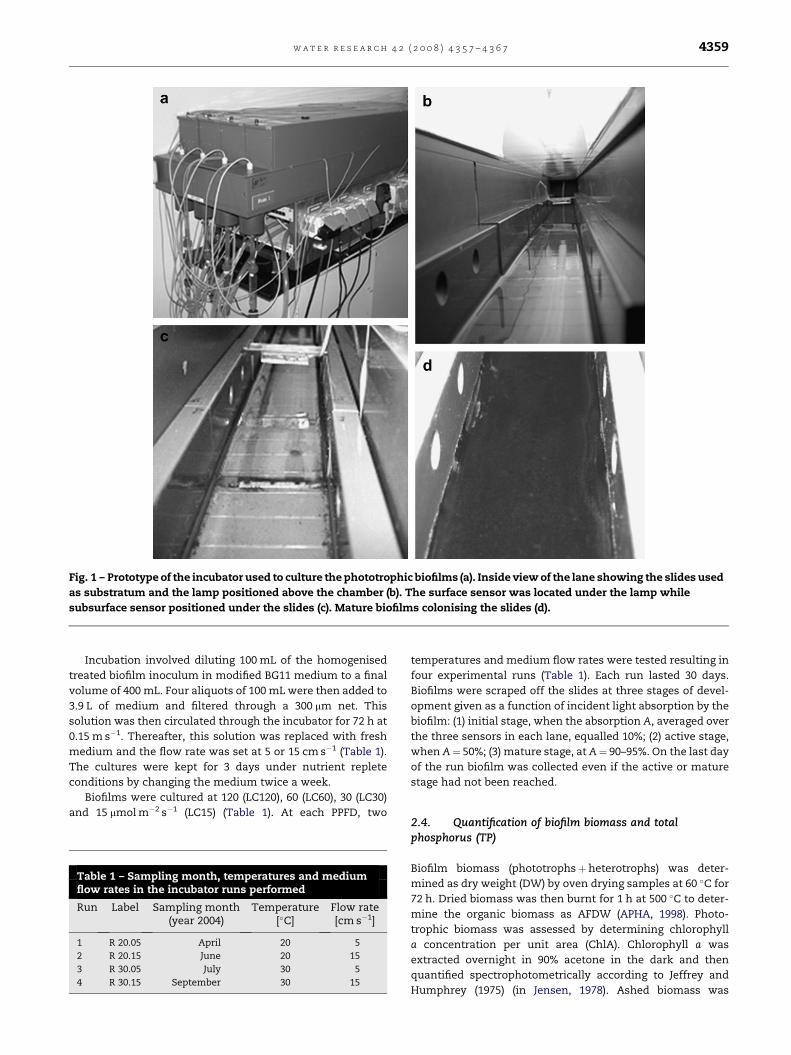
Fig. 1 – Prototype of the incubator used to culture the phototrophic biofilms (a). Inside view of the lane showing the slides used
as substratum and the lamp positioned above the chamber (b). The surface sensor was located under the lamp while
subsurface sensor positioned under the slides (c). Mature biofilms colonising the slides (d).
w a t e r r e s e a r c h 4 2 ( 2 0 0 8 ) 4 3 5 7 – 4 3 6 7 4359
Incubation involved diluting 100 mL of the homogenised
treated biofilm inoculum in modified BG11 medium to a final
volume of 400 mL. Four aliquots of 100 mL were then added to
3.9 L of medium and filtered through a 300 mm net. This
solution was then circulated through the incubator for 72 h at
0.15 m s�1. Thereafter, this solution was replaced with fresh
medium and the flow rate was set at 5 or 15 cm s�1 (Table 1).
The cultures were kept for 3 days under nutrient replete
conditions by changing the medium twice a week.
Biofilms were cultured at 120 (LC120), 60 (LC60), 30 (LC30)
and 15 mmol m�2 s�1 (LC15) (Table 1). At each PPFD, two
Table 1 – Sampling month, temperatures and mediumflow rates in the incubator runs performed
Run Label Sampling month(year 2004)
Temperature[�C]
Flow rate[cm s�1]
1 R 20.05 April 20 5
2 R 20.15 June 20 15
3 R 30.05 July 30 5
4 R 30.15 September 30 15
temperatures and medium flow rates were tested resulting in
four experimental runs (Table 1). Each run lasted 30 days.
Biofilms were scraped off the slides at three stages of devel-
opment given as a function of incident light absorption by the
biofilm: (1) initial stage, when the absorption A, averaged over
the three sensors in each lane, equalled 10%; (2) active stage,
when A¼ 50%; (3) mature stage, at A¼ 90–95%. On the last day
of the run biofilm was collected even if the active or mature
stage had not been reached.
2.4. Quantification of biofilm biomass and totalphosphorus (TP)
Biofilm biomass (phototrophsþheterotrophs) was deter-
mined as dry weight (DW) by oven drying samples at 60 �C for
72 h. Dried biomass was then burnt for 1 h at 500 �C to deter-
mine the organic biomass as AFDW (APHA, 1998). Photo-
trophic biomass was assessed by determining chlorophyll
a concentration per unit area (ChlA). Chlorophyll a was
extracted overnight in 90% acetone in the dark and then
quantified spectrophotometrically according to Jeffrey and
Humphrey (1975) (in Jensen, 1978). Ashed biomass was
w a t e r r e s e a r c h 4 2 ( 2 0 0 8 ) 4 3 5 7 – 4 3 6 74360
analysed for TP by means of the ascorbic acid method (APHA,
1998). All analyses of biomasses and TP were performed in
triplicate.
2.5. Estimation of the maximal phosphorousremoval rate
The maximal removal rate for phosphorous (MRP) per surface
unit between two time points t1< t2 was estimated by multi-
plying the production rate (dry weight, DW) with the average
percentual phosphorous content, according to Davis et al.
(1990b).
MRPt1/t2¼ DW2 �DW1
t2 � t1
PCont1 þ PCont2
2
2.6. Electron microscopy observations
Biofilm samples were fixed in 2.5% glutaraldehyde in caco-
dylate buffer 0.2 M pH 7.2, post-fixed in 1% osmium tetraoxide
in the same buffer, dehydrated in ethanol series and
embedded in an 812 Resin� Kit. Thin sections of 60 nm were
assembled on copper grids of 300 mesh, double stained with
2% uranyl acetate and 1% lead citrate (Reynolds, 1963) and
observed by a Zeiss EM 902 electron microscope operating at
80 keV, equipped with an electron energy loss filter at 80 kV in
conventional mode. Species composition of the phototrophic
biofilms colonising the ST of Fiumicino WWTP has been
previously reported (Albertano et al., 1999; Congestri et al.,
2003, 2005).
For Electron Spectroscopy Imaging (ESI), ultrathin sections
(<40 nm) were placed on 600-mesh copper grids and observed
without staining. Images were acquired filtering the elastic
electrons (DE¼ 0 eV) to enhance both contrast and resolution
(Diociaiuti, 2005). The image acquisition was performed by
a digital CCD camera model HSC2, 1 k for 1 k pixels (Proscan
GMBH, Germany), thermostatted by a Peltier cooler model
WKL 230 (LAUDA GMBH, Germany). Image analysis and
quantification were performed by a digital analyser analysis
3.0 (SIS GMBH, Germany). Subcellular localization of P in the
specimen was obtained according to the so-called ‘‘three-
window methods’’ (Egerton, 1986). Briefly, a reference image
with high contrast was acquired filtering at 250 eV. In order to
obtain the P net distribution, after the acquisition of two pre-
edge images (at 110 and 130 eV) the software calculated the
intensity of the background image to be subtracted from the
post-edge image (at 153 eV). Finally, the net image was con-
verted to a binary image by a grey-level discrimination
threshold.
2.7. Statistical analyses
Statistical analyses were carried out using the R language,
version 2.6.2 for Mac OS X (R Development Core Team, 2008)
and Aabel software, version 2.4.2 (Gigawiz Ltd. Co., Tulsa, OK)
for graphical representations. Log-transformed data were
used where necessary. Correlations were quantified by Pear-
son’s r. The effects of the factors run (temperature and flow
velocity) and lane (light intensity) on the 30-day maxima of
PConc, AFDW, and ChlA were assessed by two-way ANOVA and
post-hoc testing for differences of means using Tukey’s
Honest Significant Difference (Tukey’s HSD) method (Yandell,
1997). Elasticity analysis (De Kroon et al., 2000) was applied to
compare the percent changes of two variables: given a relation
between the two variables x and y, the elasticity e, i.e. the ratio
of the percent changes of x and y, can be estimated by the
slope of the linear regression of log( y) vs. log(x).
e ¼ dy=ydx=x
¼ d logðyÞd logðxÞ
If e> 1 the proportional change of y is larger than the cor-
responding proportional change in x, and vice versa for e< 1.
In the present case, we interpret e> 1 as a relative accumu-
lation of y in comparison to x. Values around e¼ 1 indicate
similar proportional growth. Computationally, e was esti-
mated by standardised major axis estimation (Warton et al.,
2006), using the R package smatr (Warton and Ormerod, 2007),
which includes statistical testing of the null hypothesis of
e¼ 1.
3. Results
3.1. Biomass accumulation, phosphorus contents andremoval rate
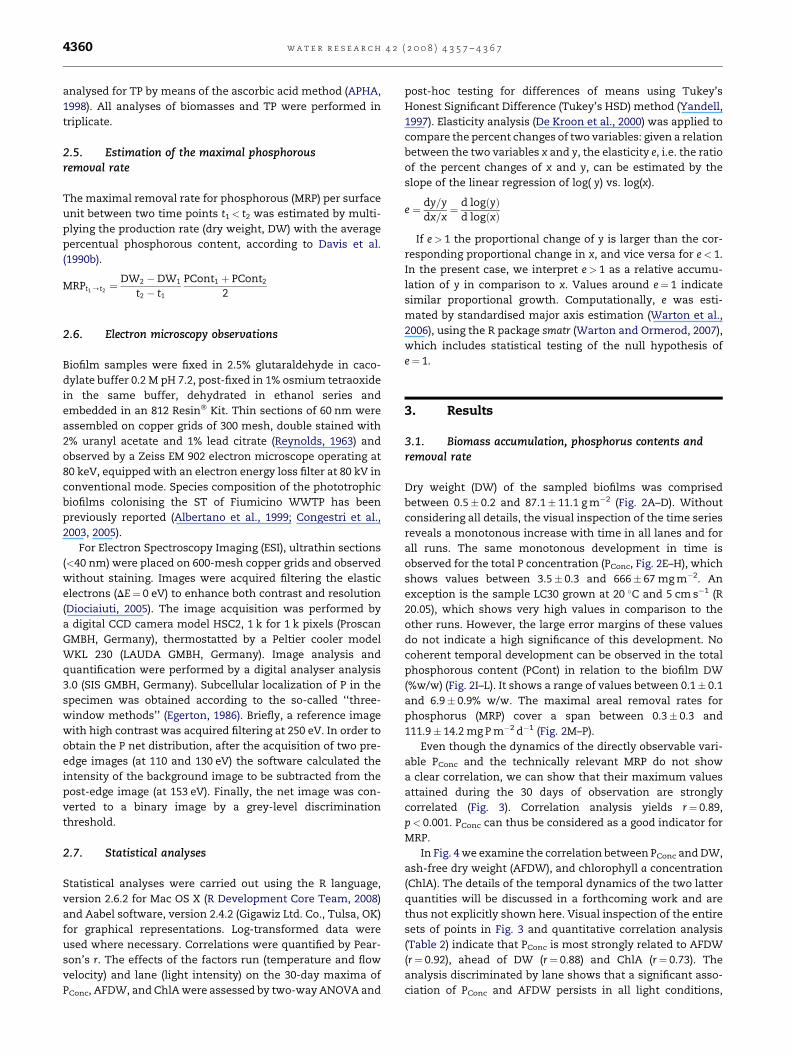
Dry weight (DW) of the sampled biofilms was comprised
between 0.5� 0.2 and 87.1� 11.1 g m�2 (Fig. 2A–D). Without
considering all details, the visual inspection of the time series
reveals a monotonous increase with time in all lanes and for
all runs. The same monotonous development in time is
observed for the total P concentration (PConc, Fig. 2E–H), which
shows values between 3.5� 0.3 and 666� 67 mg m�2. An
exception is the sample LC30 grown at 20 �C and 5 cm s�1 (R
20.05), which shows very high values in comparison to the
other runs. However, the large error margins of these values
do not indicate a high significance of this development. No
coherent temporal development can be observed in the total
phosphorous content (PCont) in relation to the biofilm DW
(%w/w) (Fig. 2I–L). It shows a range of values between 0.1� 0.1
and 6.9� 0.9% w/w. The maximal areal removal rates for
phosphorus (MRP) cover a span between 0.3� 0.3 and
111.9� 14.2 mg P m�2 d�1 (Fig. 2M–P).
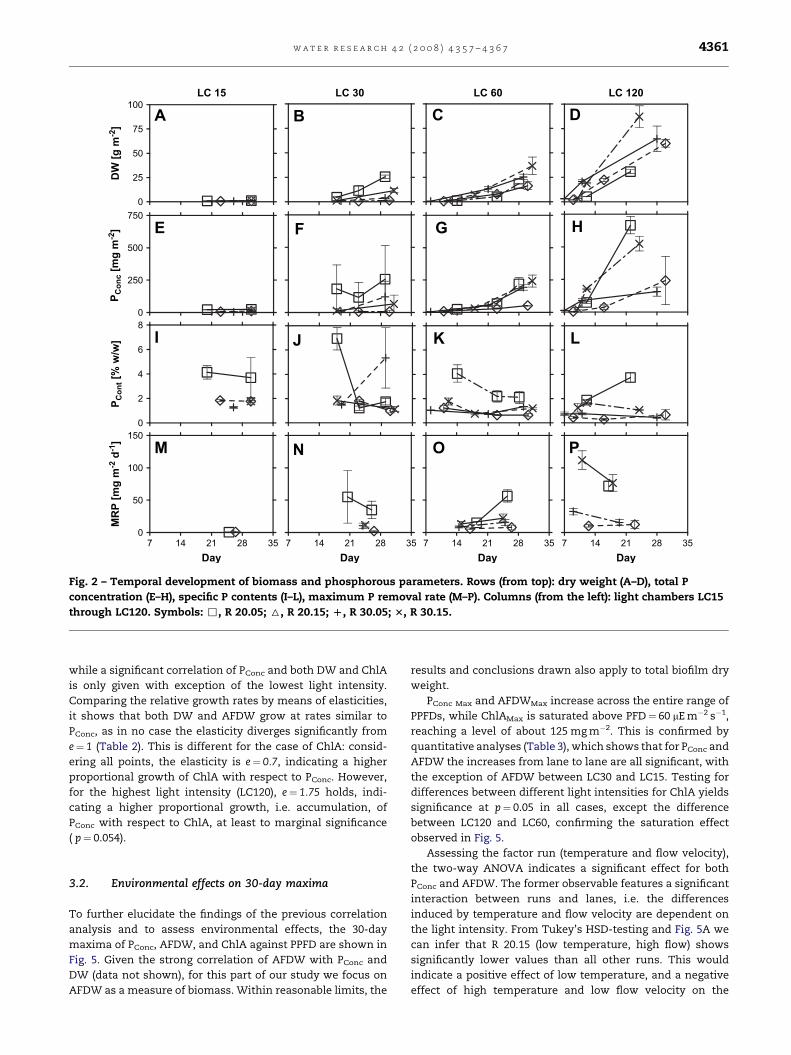
Even though the dynamics of the directly observable vari-
able PConc and the technically relevant MRP do not show
a clear correlation, we can show that their maximum values
attained during the 30 days of observation are strongly
correlated (Fig. 3). Correlation analysis yields r¼ 0.89,
p< 0.001. PConc can thus be considered as a good indicator for
MRP.
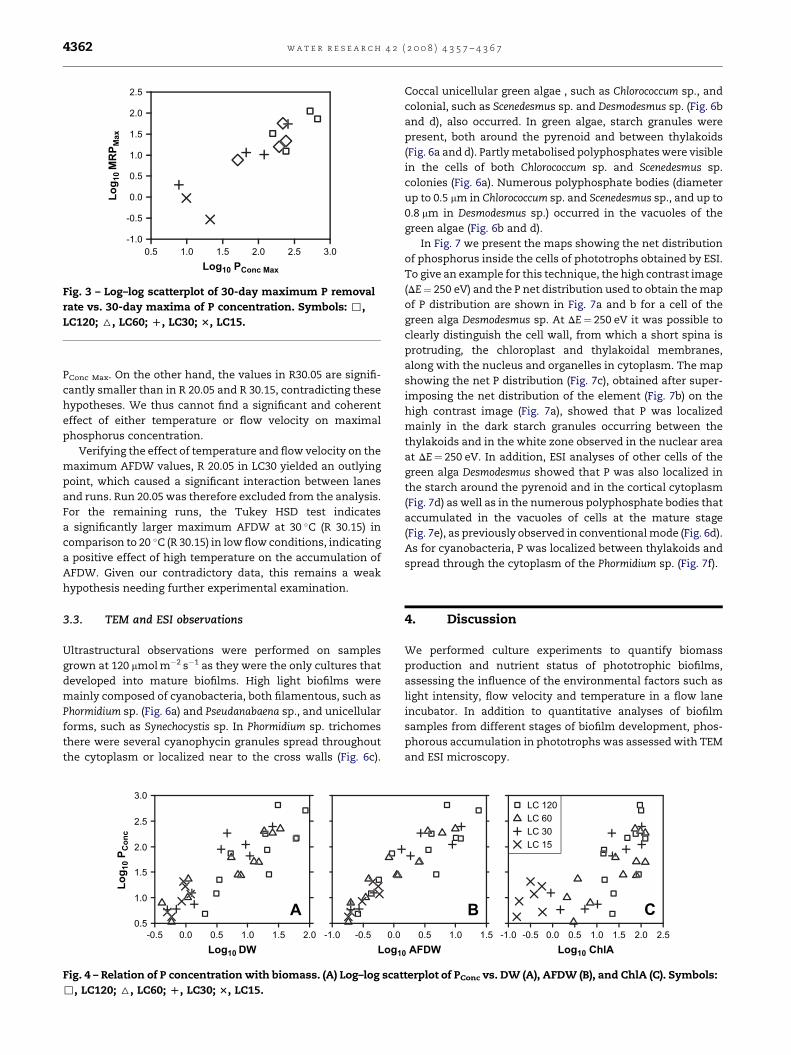
In Fig. 4 we examine the correlation between PConc and DW,
ash-free dry weight (AFDW), and chlorophyll a concentration
(ChlA). The details of the temporal dynamics of the two latter
quantities will be discussed in a forthcoming work and are
thus not explicitly shown here. Visual inspection of the entire
sets of points in Fig. 3 and quantitative correlation analysis
(Table 2) indicate that PConc is most strongly related to AFDW
(r¼ 0.92), ahead of DW (r¼ 0.88) and ChlA (r¼ 0.73). The
analysis discriminated by lane shows that a significant asso-
ciation of PConc and AFDW persists in all light conditions,
0
250
500
750
PC
on
c [m
g m
-2]
0
2
4
6
8
PC
on
t [%
w
/w
]
0
25
50
75
100D
W [g
m
-2]
DayDayDay
7 14 21 28 35 7 14 21 28 35 7 14 21 28 35 7 14 21 28 35Day
0
50
100
150
MR
P [m
g m
-2 d
-1]
A B C D
E F G
I J K
M N O P
LC 15 LC 30 LC 60 LC 120
H
L
Fig. 2 – Temporal development of biomass and phosphorous parameters. Rows (from top): dry weight (A–D), total P
concentration (E–H), specific P contents (I–L), maximum P removal rate (M–P). Columns (from the left): light chambers LC15
through LC120. Symbols: ,, R 20.05; 6, R 20.15; D, R 30.05; 3, R 30.15.
w a t e r r e s e a r c h 4 2 ( 2 0 0 8 ) 4 3 5 7 – 4 3 6 7 4361
while a significant correlation of PConc and both DW and ChlA
is only given with exception of the lowest light intensity.
Comparing the relative growth rates by means of elasticities,
it shows that both DW and AFDW grow at rates similar to
PConc, as in no case the elasticity diverges significantly from
e¼ 1 (Table 2). This is different for the case of ChlA: consid-
ering all points, the elasticity is e¼ 0.7, indicating a higher
proportional growth of ChlA with respect to PConc. However,
for the highest light intensity (LC120), e¼ 1.75 holds, indi-
cating a higher proportional growth, i.e. accumulation, of
PConc with respect to ChlA, at least to marginal significance
( p¼ 0.054).
3.2. Environmental effects on 30-day maxima
To further elucidate the findings of the previous correlation
analysis and to assess environmental effects, the 30-day
maxima of PConc, AFDW, and ChlA against PPFD are shown in
Fig. 5. Given the strong correlation of AFDW with PConc and
DW (data not shown), for this part of our study we focus on
AFDW as a measure of biomass. Within reasonable limits, the
results and conclusions drawn also apply to total biofilm dry
weight.
PConc Max and AFDWMax increase across the entire range of
PPFDs, while ChlAMax is saturated above PFD¼ 60 mE m�2 s�1,
reaching a level of about 125 mg m�2. This is confirmed by
quantitative analyses (Table 3), which shows that for PConc and
AFDW the increases from lane to lane are all significant, with
the exception of AFDW between LC30 and LC15. Testing for
differences between different light intensities for ChlA yields
significance at p¼ 0.05 in all cases, except the difference
between LC120 and LC60, confirming the saturation effect
observed in Fig. 5.
Assessing the factor run (temperature and flow velocity),
the two-way ANOVA indicates a significant effect for both
PConc and AFDW. The former observable features a significant
interaction between runs and lanes, i.e. the differences
induced by temperature and flow velocity are dependent on
the light intensity. From Tukey’s HSD-testing and Fig. 5A we
can infer that R 20.15 (low temperature, high flow) shows
significantly lower values than all other runs. This would
indicate a positive effect of low temperature, and a negative
effect of high temperature and low flow velocity on the
0.5 1.0 1.5 2.0 2.5 3.0Log
10 P
Conc Max
-1.0
-0.5
0.0
0.5
1.0
1.5
2.0
2.5
Lo
g1
0 M
RP
Max
Fig. 3 – Log–log scatterplot of 30-day maximum P removal
rate vs. 30-day maxima of P concentration. Symbols: ,,
LC120; 6, LC60; D, LC30; 3, LC15.
w a t e r r e s e a r c h 4 2 ( 2 0 0 8 ) 4 3 5 7 – 4 3 6 74362
PConc Max. On the other hand, the values in R30.05 are signifi-
cantly smaller than in R 20.05 and R 30.15, contradicting these
hypotheses. We thus cannot find a significant and coherent
effect of either temperature or flow velocity on maximal
phosphorus concentration.
Verifying the effect of temperature and flow velocity on the
maximum AFDW values, R 20.05 in LC30 yielded an outlying
point, which caused a significant interaction between lanes
and runs. Run 20.05 was therefore excluded from the analysis.
For the remaining runs, the Tukey HSD test indicates
a significantly larger maximum AFDW at 30 �C (R 30.15) in
comparison to 20 �C (R 30.15) in low flow conditions, indicating
a positive effect of high temperature on the accumulation of
AFDW. Given our contradictory data, this remains a weak
hypothesis needing further experimental examination.
3.3. TEM and ESI observations
Ultrastructural observations were performed on samples
grown at 120 mmol m�2 s�1 as they were the only cultures that
developed into mature biofilms. High light biofilms were
mainly composed of cyanobacteria, both filamentous, such as
Phormidium sp. (Fig. 6a) and Pseudanabaena sp., and unicellular
forms, such as Synechocystis sp. In Phormidium sp. trichomes
there were several cyanophycin granules spread throughout
the cytoplasm or localized near to the cross walls (Fig. 6c).
-0.5Log
10 DW
0.5
1.0
1.5
2.0
2.5
3.0
Lo
g10 P
Co
nc
Log1
0.0 0.5 1.0 1.5 2.0 -1.0 -0.5 0.0
A
Fig. 4 – Relation of P concentration with biomass. (A) Log–log scat
,, LC120; 6, LC60; D, LC30; 3, LC15.
Coccal unicellular green algae , such as Chlorococcum sp., and
colonial, such as Scenedesmus sp. and Desmodesmus sp. (Fig. 6b
and d), also occurred. In green algae, starch granules were
present, both around the pyrenoid and between thylakoids
(Fig. 6a and d). Partly metabolised polyphosphates were visible
in the cells of both Chlorococcum sp. and Scenedesmus sp.
colonies (Fig. 6a). Numerous polyphosphate bodies (diameter
up to 0.5 mm in Chlorococcum sp. and Scenedesmus sp., and up to
0.8 mm in Desmodesmus sp.) occurred in the vacuoles of the
green algae (Fig. 6b and d).
In Fig. 7 we present the maps showing the net distribution
of phosphorus inside the cells of phototrophs obtained by ESI.
To give an example for this technique, the high contrast image
(DE¼ 250 eV) and the P net distribution used to obtain the map
of P distribution are shown in Fig. 7a and b for a cell of the
green alga Desmodesmus sp. At DE¼ 250 eV it was possible to
clearly distinguish the cell wall, from which a short spina is
protruding, the chloroplast and thylakoidal membranes,
along with the nucleus and organelles in cytoplasm. The map
showing the net P distribution (Fig. 7c), obtained after super-
imposing the net distribution of the element (Fig. 7b) on the
high contrast image (Fig. 7a), showed that P was localized
mainly in the dark starch granules occurring between the
thylakoids and in the white zone observed in the nuclear area
at DE¼ 250 eV. In addition, ESI analyses of other cells of the
green alga Desmodesmus showed that P was also localized in
the starch around the pyrenoid and in the cortical cytoplasm
(Fig. 7d) as well as in the numerous polyphosphate bodies that
accumulated in the vacuoles of cells at the mature stage
(Fig. 7e), as previously observed in conventional mode (Fig. 6d).
As for cyanobacteria, P was localized between thylakoids and
spread through the cytoplasm of the Phormidium sp. (Fig. 7f).
4. Discussion
We performed culture experiments to quantify biomass
production and nutrient status of phototrophic biofilms,
assessing the influence of the environmental factors such as
light intensity, flow velocity and temperature in a flow lane
incubator. In addition to quantitative analyses of biofilm
samples from different stages of biofilm development, phos-
phorous accumulation in phototrophs was assessed with TEM
and ESI microscopy.
0 AFDW
LC 120LC 60LC 30LC 15
0.5 1.0 1.5 -1.0 -0.5 0.0 0.5 1.0 1.5 2.0 2.5Log
10 ChlA
B C
terplot of PConc vs. DW (A), AFDW (B), and ChlA (C). Symbols:
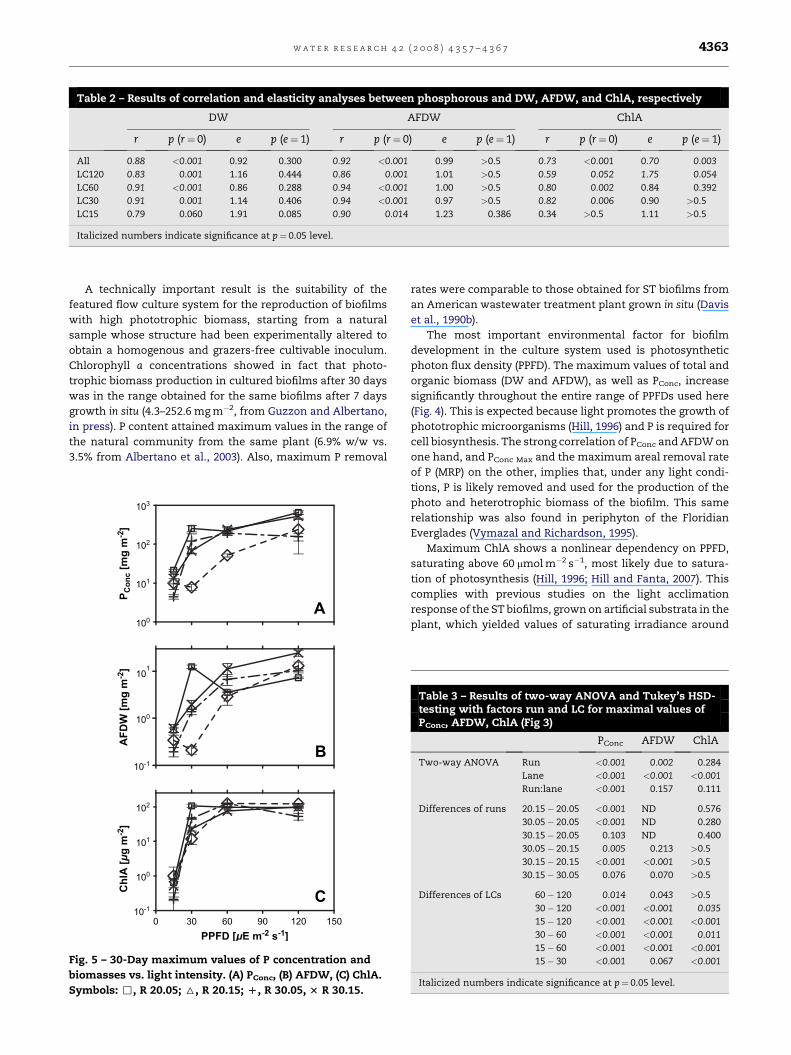
Table 2 – Results of correlation and elasticity analyses between phosphorous and DW, AFDW, and ChlA, respectively
DW AFDW ChlA
r p (r¼ 0) e p (e¼ 1) r p (r¼ 0) e p (e¼ 1) r p (r¼ 0) e p (e¼ 1)
All 0.88 <0.001 0.92 0.300 0.92 <0.001 0.99 >0.5 0.73 <0.001 0.70 0.003
LC120 0.83 0.001 1.16 0.444 0.86 0.001 1.01 >0.5 0.59 0.052 1.75 0.054
LC60 0.91 <0.001 0.86 0.288 0.94 <0.001 1.00 >0.5 0.80 0.002 0.84 0.392
LC30 0.91 0.001 1.14 0.406 0.94 <0.001 0.97 >0.5 0.82 0.006 0.90 >0.5
LC15 0.79 0.060 1.91 0.085 0.90 0.014 1.23 0.386 0.34 >0.5 1.11 >0.5
Italicized numbers indicate significance at p¼ 0.05 level.
w a t e r r e s e a r c h 4 2 ( 2 0 0 8 ) 4 3 5 7 – 4 3 6 7 4363
A technically important result is the suitability of the
featured flow culture system for the reproduction of biofilms
with high phototrophic biomass, starting from a natural
sample whose structure had been experimentally altered to
obtain a homogenous and grazers-free cultivable inoculum.
Chlorophyll a concentrations showed in fact that photo-
trophic biomass production in cultured biofilms after 30 days
was in the range obtained for the same biofilms after 7 days
growth in situ (4.3–252.6 mg m�2, from Guzzon and Albertano,
in press). P content attained maximum values in the range of
the natural community from the same plant (6.9% w/w vs.
3.5% from Albertano et al., 2003). Also, maximum P removal
10-1
100
101
AF
DW
[m
g m
-2]
0 30 60 90 120 150PPFD [µE m
-2 s
-1]
10-1
100
101
102
Ch
lA
[µ
g m
-2]
100
101
102
103
PC
on
c [m
g m
-2]
A
B
C
Fig. 5 – 30-Day maximum values of P concentration and
biomasses vs. light intensity. (A) PConc, (B) AFDW, (C) ChlA.
Symbols: ,, R 20.05; 6, R 20.15; D, R 30.05, 3 R 30.15.
rates were comparable to those obtained for ST biofilms from
an American wastewater treatment plant grown in situ (Davis
et al., 1990b).
The most important environmental factor for biofilm
development in the culture system used is photosynthetic
photon flux density (PPFD). The maximum values of total and
organic biomass (DW and AFDW), as well as PConc, increase
significantly throughout the entire range of PPFDs used here
(Fig. 4). This is expected because light promotes the growth of
phototrophic microorganisms (Hill, 1996) and P is required for
cell biosynthesis. The strong correlation of PConc and AFDW on
one hand, and PConc Max and the maximum areal removal rate
of P (MRP) on the other, implies that, under any light condi-
tions, P is likely removed and used for the production of the
photo and heterotrophic biomass of the biofilm. This same
relationship was also found in periphyton of the Floridian
Everglades (Vymazal and Richardson, 1995).
Maximum ChlA shows a nonlinear dependency on PPFD,
saturating above 60 mmol m�2 s�1, most likely due to satura-
tion of photosynthesis (Hill, 1996; Hill and Fanta, 2007). This
complies with previous studies on the light acclimation
response of the ST biofilms, grown on artificial substrata in the
plant, which yielded values of saturating irradiance around
Table 3 – Results of two-way ANOVA and Tukey’s HSD-testing with factors run and LC for maximal values ofPConc, AFDW, ChlA (Fig 3)
PConc AFDW ChlA
Two-way ANOVA Run <0.001 0.002 0.284
Lane <0.001 <0.001 <0.001
Run:lane <0.001 0.157 0.111
Differences of runs 20.15� 20.05 <0.001 ND 0.576
30.05� 20.05 <0.001 ND 0.280
30.15� 20.05 0.103 ND 0.400
30.05� 20.15 0.005 0.213 >0.5
30.15� 20.15 <0.001 <0.001 >0.5
30.15� 30.05 0.076 0.070 >0.5
Differences of LCs 60� 120 0.014 0.043 >0.5
30� 120 <0.001 <0.001 0.035
15� 120 <0.001 <0.001 <0.001
30� 60 <0.001 <0.001 0.011
15� 60 <0.001 <0.001 <0.001
15� 30 <0.001 0.067 <0.001
Italicized numbers indicate significance at p¼ 0.05 level.
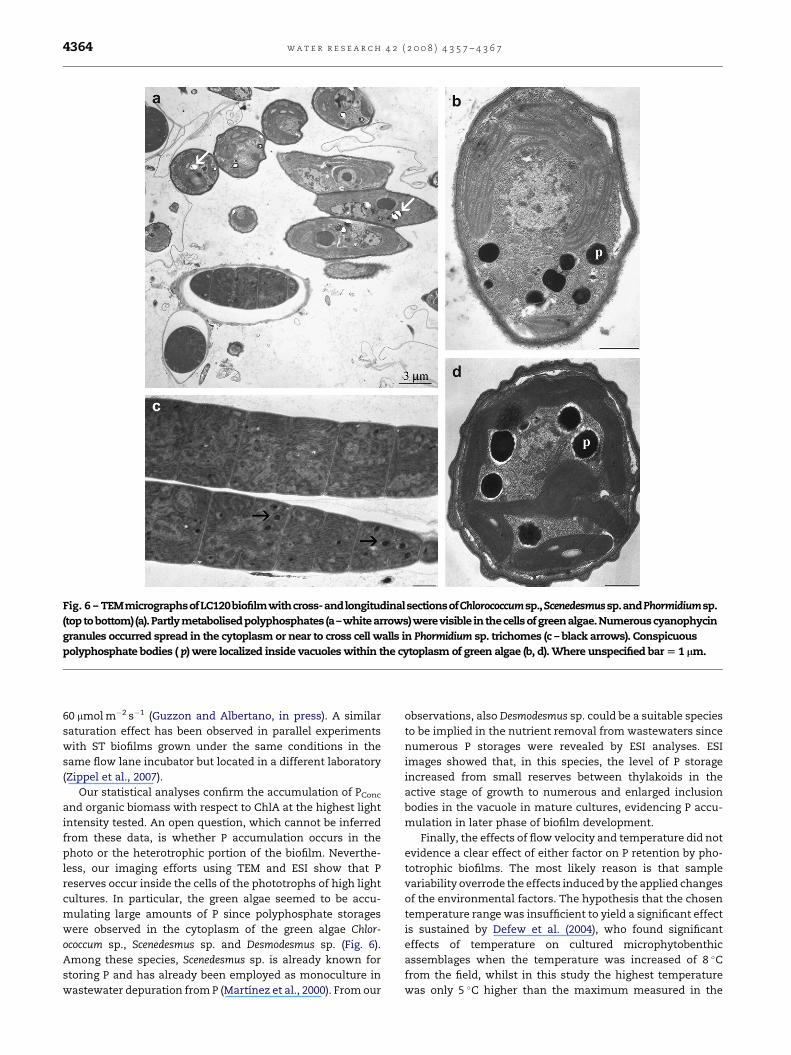
Fig. 6 – TEMmicrographsofLC120biofilmwithcross-andlongitudinalsectionsofChlorococcumsp.,Scenedesmussp.andPhormidiumsp.
(top tobottom) (a).Partly metabolisedpolyphosphates (a–white arrows)werevisible inthecellsofgreenalgae.Numerouscyanophycin
granules occurred spread in the cytoplasm or near to cross cell walls in Phormidium sp. trichomes (c – black arrows). Conspicuous
polyphosphate bodies ( p) were localized inside vacuoles within the cytoplasm of green algae (b, d). Where unspecified bar [ 1 mm.
w a t e r r e s e a r c h 4 2 ( 2 0 0 8 ) 4 3 5 7 – 4 3 6 74364
60 mmol m�2 s�1 (Guzzon and Albertano, in press). A similar
saturation effect has been observed in parallel experiments
with ST biofilms grown under the same conditions in the
same flow lane incubator but located in a different laboratory
(Zippel et al., 2007).
Our statistical analyses confirm the accumulation of PConc
and organic biomass with respect to ChlA at the highest light
intensity tested. An open question, which cannot be inferred
from these data, is whether P accumulation occurs in the
photo or the heterotrophic portion of the biofilm. Neverthe-
less, our imaging efforts using TEM and ESI show that P
reserves occur inside the cells of the phototrophs of high light
cultures. In particular, the green algae seemed to be accu-
mulating large amounts of P since polyphosphate storages
were observed in the cytoplasm of the green algae Chlor-
ococcum sp., Scenedesmus sp. and Desmodesmus sp. (Fig. 6).
Among these species, Scenedesmus sp. is already known for
storing P and has already been employed as monoculture in
wastewater depuration from P (Martınez et al., 2000). From our
observations, also Desmodesmus sp. could be a suitable species
to be implied in the nutrient removal from wastewaters since
numerous P storages were revealed by ESI analyses. ESI
images showed that, in this species, the level of P storage
increased from small reserves between thylakoids in the
active stage of growth to numerous and enlarged inclusion
bodies in the vacuole in mature cultures, evidencing P accu-
mulation in later phase of biofilm development.
Finally, the effects of flow velocity and temperature did not
evidence a clear effect of either factor on P retention by pho-
totrophic biofilms. The most likely reason is that sample
variability overrode the effects induced by the applied changes
of the environmental factors. The hypothesis that the chosen
temperature range was insufficient to yield a significant effect
is sustained by Defew et al. (2004), who found significant
effects of temperature on cultured microphytobenthic
assemblages when the temperature was increased of 8 �C
from the field, whilst in this study the highest temperature
was only 5 �C higher than the maximum measured in the
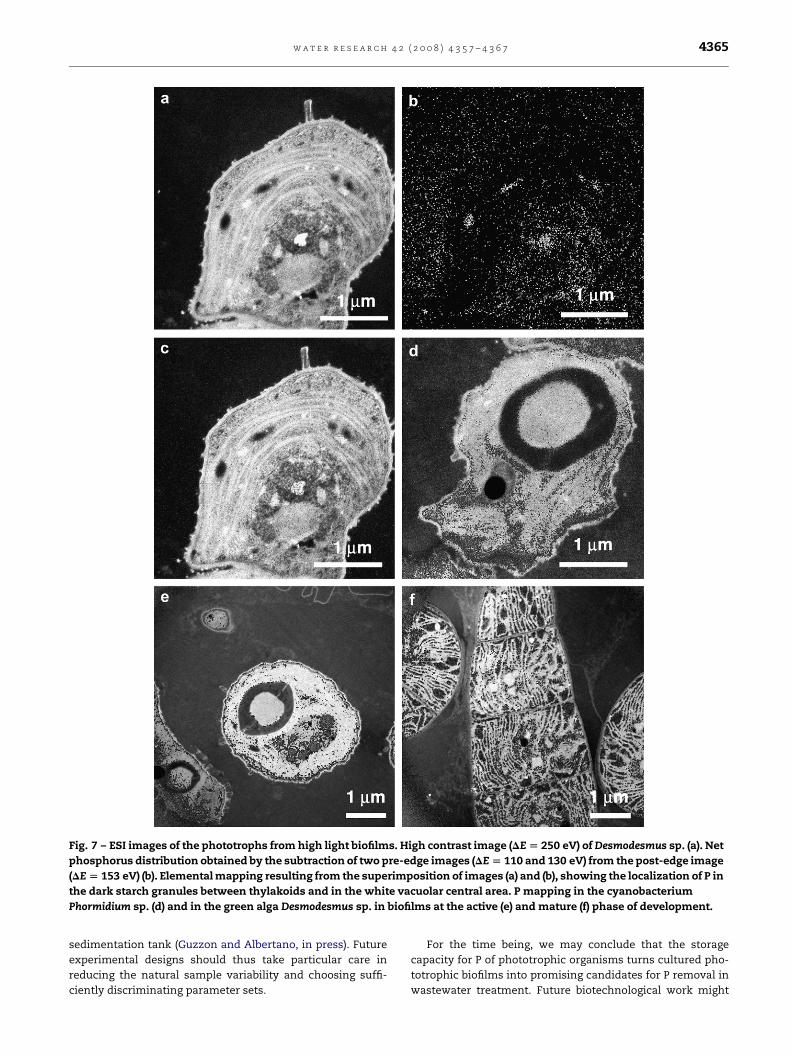
Fig. 7 – ESI images of the phototrophs from high light biofilms. High contrast image (DE [ 250 eV) of Desmodesmus sp. (a). Net
phosphorus distribution obtained by the subtraction of two pre-edge images (DE [ 110 and 130 eV) from the post-edge image
(DE [ 153 eV) (b). Elemental mapping resulting from the superimposition of images (a) and (b), showing the localization of P in
the dark starch granules between thylakoids and in the white vacuolar central area. P mapping in the cyanobacterium
Phormidium sp. (d) and in the green alga Desmodesmus sp. in biofilms at the active (e) and mature (f) phase of development.
w a t e r r e s e a r c h 4 2 ( 2 0 0 8 ) 4 3 5 7 – 4 3 6 7 4365
sedimentation tank (Guzzon and Albertano, in press). Future
experimental designs should thus take particular care in
reducing the natural sample variability and choosing suffi-
ciently discriminating parameter sets.
For the time being, we may conclude that the storage
capacity for P of phototrophic organisms turns cultured pho-
totrophic biofilms into promising candidates for P removal in
wastewater treatment. Future biotechnological work might
w a t e r r e s e a r c h 4 2 ( 2 0 0 8 ) 4 3 5 7 – 4 3 6 74366
depart from our hypothesis that high light intensity is the
most crucial factor for achieving high P retention rates, and
elucidate the precise effects of temperature and flow velocity
on nutrient retention by phototrophic biofilms.
5. Conclusions
� Biofilm dry weight and total P concentration increase with
the increase of the featured light intensities. Maximum
chlorophyll a concentration increases up to 60 mmol m�2 s�1
and is saturated above this level. Optimal illumination and
avoidance of saturation of photosynthesis are thus essential
for the optimized application of phototrophic biofilms in
wastewater treatment.
� Total P concentration is strongly related with organic
biomass throughout all light conditions. The maximum P
concentration observed during an incubator run is a good
estimator for the maximum P removal rate of the biofilm.
� At the highest light intensity (120 mmol m�2 s�1) phosphorus
and organic biomass are accumulated with respect to ChlA.
TEM and ESI observations show that phosphorus is accumu-
lated insidethecellsofphototrophs,mainly inthecytoplasmof
the green algae. Coupling TEM–ESI techniques to the quantifi-
cation of nutrient removal is therefore useful to screen and
select the phototrophic speciesmost suitable to be cultivated in
sewage plants for the tertiary treatment of wastewaters.
� Effects of changes in environmental parameters, in our case
temperature and flow velocity, can be masked by natural
sample variability.
Acknowledgements
We gratefully acknowledge the Agency for Environmental
Protection of the ‘‘Aeroporti di Roma’’, Fiumicino (Italy) for the
fruitful collaboration and the granted access to the plant.
This work was supported by the EU-Programme Quality of Life,
in the frame of PHOBIA Project, contract QLK3-CT2002-01938. The
incubator prototype was realized by the Department of Inland
Water Research, UFZ Centre for Environmental Research (Mag-
deburg,Germany) intheframeworkof theEU-projectPHOBIA.A.B.
acknowledges support by the Fundacao para a Ciencia e a Tecno-
logia (Portugal) through fellowship SFRH/BPD/25967/2005. We
thank Nuno Sepulveda for fruitful discussions. Dr Neil T.W. Ell-
wood revised the manuscript providing many useful comments.
r e f e r e n c e s
Adey,W.,Luckett,C., Jensen,K., 1993.Phosphorusremoval fromnaturalwaters using controlled algal production. Restor. Ecol., 29–39.
Albertano, P., Congestri, R., Shubert, L.E., 1999. Cyanobacterialbiofilms in sewage treatment plants along the Tyrrheniancoast (Mediterranean Sea), Italy. Algol. Stud. 94, 13–24.
Albertano, P., Guzzon, A., Di Pippo, F., Congestri R., 2003. Potentialuse of phototrophic biofilms for N and P removal. In: Book ofAbstracts of the 5th European Workshop ‘‘Biotechnology ofMicroalgae’’, Bergholz-Renbrucke, Germany, June 23–24.
APHA, 1998. Standard Methods for the Examination of Waterand Wastewater. In: Clesceri, L.S., Geenberg, A.E., Eaton, A.D. (Eds.), 20th ed. APHA, AWWA, WEF, Washington, D.C.
Battin, T.J., Kaplan, L.A., Newbold, J.D., Hansen, C.M.E., 2003.Contributions of microbial biofilms to ecosystem processes instream mesocosm. Nature 426, 439–442.
Beakes, G., Canter, H.M., Jaworski, G.H.M., 1988. Zoosporesultrastructure of Zygorhizidium affluens Canter and Z.planktonicum Canter, two chytrids parasitizing the diatomAsterionella formosa Hassall. Can. J. Bot. 66 (6), 1054–1067.
Chevalier, P., Proulx, D., Lessard, P., Vincent, W.F., de la Noue, J.,2000. Nitrogen and phosphorus removal by high latitude mat-forming cyanobacteria for potential use in tertiary wastewatertreatment. J. Appl. Phycol. 12, 105–112.
Congestri, R., Sangiorgi, V.C., Albertano, P., 2003. Cytomorphologyand distribution of periphytic cyanobacteria in one ItalianWWTP. Arch. Hydrobiol., Algol. Stud. 109, 185–195.
Congestri, R., Cox, J.E., Cavacini, P., Albertano, P., 2005. Diatoms(Bacillariophyta) in phototrophic biofilms colonising anItalian wastewater treatment plant. Diatom Res. 20 (2),241–255.
Craggs, R.J., Adey, W.H., Jenson, K.R., St. John, M.S., Green, F.B.,Oswald, W.J., 1996. Phosphorus removal from wastewater usingan algal turf scrubber. Water Sci. Technol. 33 (7), 191–198.
Davis, L.S., Hoffmann, J.P., Cook, P.W., 1990a. Seasonalsuccession of algal periphyton from a wastewater treatmentfacility. J. Phycol. 26, 611–617.
Davis, L.S., Hoffmann, J.P., Cook, P.W., 1990b. Production andnutrient accumulation by periphyton in a wastewatertreatment facility. J. Phycol. 26, 617–623.
De la Noue, J., Laliberte, G., Proulx, D., 1992. Algae andwastewater. J. Appl. Phycol. 4, 247–254.
Defew, E.C., Perkins, R.G., Paterson, D.M., 2004. The influence oflight and temperature interactions on a natural estuarinemicrophytobenthic assemblage. Biofilms 1, 21–30.
De Kroon,H., van Groenendaal, J., Ehrlen, J., 2000. Elasticities: a reviewof methods and model limitations. Ecology 81 (3), 607–618.
Diociaiuti, M., 2005. Electron energy loss spectroscopymicroanalysis and imaging in the transmission electronmicroscope: example of biological applications. J. ElectronSpectrosc. Relat. Phenom. 143, 189–203.
Egerton, R.F., 1986. Electron Energy Loss Spectroscopy in theElectron Microscope. Plenum Press, New York.
Gerba, C.P., 2000. Domestic wastes and waste treatment. In:Maier, R.M., Pepper, I.L., Gerba, C.P. (Eds.), EnvironmentalMicrobiology. Academic Press, Canada, pp. 505–534.
Graham, L.E., Wilcox, L.W., 2000. Algae. In: Ryu, T. (Ed.). PrenticeHall, NJ, pp. 1–640.
Guzzon, A., Albertano, P. Annual photosynthetic response ofphototrophic biofilms from an Italian wastewater treatmentplant. Algol. Stud., in press.
Guzzon, A., Congestri, R., Albertano, P., 2005. Light-inducedchanges in photosynthesis and structure of cyanobacteriacultured biofilms from an Italian wastewater treatment plant.Arch. Hydrobiol., Algol. Stud. 117, 223–228.
Hill, W.R., 1996. Effects of light. In: Stevenson, R.J., Bothwell, M.L.,Lowe, R.L. (Eds.), Algal Ecology – Freshwater BenthicEcosystems. Academic Press, USA, pp. 121–148.
Hill, W.R., Fanta, S.E., 2007. Phosphorus and light colimitperiphyton growth at subsaturating irradiances. Freshw. Biol.doi:10.1111/j.1365-2427.2007.01885.x.
Hoffmann, J.P., 1998. Wastewater treatment with suspended andnonsuspended algae. J. Phycol. 34, 757–763.
Jensen, A., 1978. Physiological & biochemical methods. In:Hellebust, J.A., Craigie, J.S. (Eds.), Handbook of PhycologicalMethods. Cambridge University Press, Cambridge.
Kebede-Westhead, E., Pizarro, C., Mulbry, W.W., 2003. Productionand nutrient removal by periphyton grown under different

w a t e r r e s e a r c h 4 2 ( 2 0 0 8 ) 4 3 5 7 – 4 3 6 7 4367
loading rates of anaerobically manure digested flushed dairy.J. Phycol. 39, 1275–1282.
Martınez, M.E., Sanchez, S., Jimenez, J.M., El Yousfi, F., Munoz, L.,2000. Nitrogen and phosphorus removal from urbanwastewater by the microalga Scenedesmus obliquus. Bioresour.Technol. 73, 263–272.
Organisation of Economic Co-operation and Development,1982. Eutrophication of Waters: Monitoring andAssessment. OECD, Paris.
Oswald, W.J., 1988. Micro-algae and waste-water treatment. In:Borowitzka, M.A., Borowitzka, L.J. (Eds.), MicroalgalBiotechnology. Cambridge University Press, Cambridge, pp.305–328.
Oswald, W.J., 2003. My sixty years in applied algology. J. Appl.Phycol. 15, 99–106.
Reynolds, C.S., 1963. The use of lead citrate at high pH as anelectronopaque stain in electron microscopy. J. Cell. Biol. 17,208–212.
R Development Core Team, 2008. R: a Language and Environmentfor Statistical Computing. R Foundation for StatisticalComputing, Vienna, Austria. Available from: http://www.R-project.org.
Sabater, S., Guasch, H., Romanı, A., Munoz, I., 2002. The effect ofbiological factors on the efficiency of river biofilms inimproving water quality. Hydrobiologia 469, 149–156.
Stanier, R.Y., Kunisawa, R., Mandel, M., Cohen-Bazire, G., 1971.Purification and properties of unicellular blue-green algae(Order Chroococcales). Bacteriol. Rev. 35, 171–205.
Sutherland, I.W., 2001. Biofilm exopolysaccharides: a strong andsticky framework. Microbiology 147, 3–9.
Vymazal, J., Richardson, C.J., 1995. Species composition, biomassand nutrient content of periphyton in the Florida Everglades.J. Phycol. 31, 343–354.
Warton, D.I., Wright, I.J., Falster, D.S., Westoby, M., 2006. Bivariateline-fitting methods for allometry. Biol. Rev. 81, 259–291.
Warton, D.I., Ormerod, J., 2007. smatr: (Standardised) Major AxisEstimation and Testing Routines. R Package Version 2.1.Available from: http://web.maths.unsw.edu.au/wdwarton.
Wetzel, R.G., 2001. Land–water interfaces: attachedmicroorganisms, littoral algae, and zooplankton. In:Limnology: Lake and River Ecosystems. Academic Press, SanDiego, pp. 577–623.
Yandell, B.S., 1997. Practical Data Analysis for DesignedExperiments. Chapman & Hall.
Zippel, B., Neu, T.R., 2005. Growth and structure of phototrophicbiofilms under controlled light conditions. Water Sci. Technol.52 (7), 203–209.
Zippel, B., Rijstenbil, J., Neu, T.R., 2007. A flow-lane incubatorfor studying freshwater and marine phototrophic biofilms.J. Microbiol. Methods 70, 336–345.
Related Documents