Via Po, 53 – 10124 Torino (Italy) Tel. (+39) 011 6704917 - Fax (+39) 011 6703859 URL: http://www.eblacenter.unito.it/ WORKING PAPER NEW SERIES CULTURE, HERITAGE AND ECONOMIC DEVELOPMENT - EMPOWERING DEVELOPING COUNTRIES Donatella Saccone e Enrico Bertacchini Dipartimento di Economia “S. Cognetti de Martiis” International Centre for Research on the Economics of Culture, Institutions, and Creativity (EBLA) Centro Studi Silvia Santagata (CSS) Working paper No. 2/2011 Università di Torino

Welcome message from author
This document is posted to help you gain knowledge. Please leave a comment to let me know what you think about it! Share it to your friends and learn new things together.
Transcript

Via Po, 53 – 10124 Torino (Italy) Tel. (+39) 011 6704917 - Fax (+39) 011 6703859
URL: http://www.eblacenter.unito.it/
WORKING PAPER NEW SERIES
CULTURE, HERITAGE AND ECONOMIC DEVELOPMENT - EMPOWERING DEVELOPING COUNTRIES
Donatella Saccone e Enrico Bertacchini
Dipartimento di Economia “S. Cognetti de Martiis”
International Centre for Research on the Economics of Culture, Institutions, and Creativity
(EBLA)
Centro Studi Silvia Santagata (CSS)
Working paper No. 2/2011
Università di Torino

1
Title: Culture, Heritage and Economic Development - Empowering
Developing Countries
Donatella Saccone, Researcher
Department of Economics “Cognetti De Martiis”, University of Torino
Enrico Bertacchini, Researcher
Department of Economics “Cognetti De Martiis”, University of Torino
Short title: Culture and Economic Development
Corresponding author: Saccone Donatella
Address: Via po 53, 10124, Torino, Italy
Telephone number: 0039 3381378719
E-mail address: [email protected]
2
Abstract
The paper provides new insights into the relationship between heritage preservation and the
economic, social and institutional factors expressing countries’ level of development. While
investments in heritage preservation are increasingly recognized as a strategy for development and
poverty reduction, little research has been conducted to understand which conditions trigger the
valorization of cultural resources.
Using panel data and focusing on World Heritage, we find that poor countries can be affected
by a vicious circle, in which the low level of development hinders culture promotion, while the failed
exploitation of national heritage in turn hinders the possibility of culture-based development strategies.
Finally, we stress the importance of new international policies improving the representativeness
of poor countries in UNESCO political institutions to avoid their marginalization in culture promotion,
increase their empowerment and stimulate sensibility on the importance of culture as a development
strategy.
Keywords: World Heritage Sites, UNESCO, Economic Development, Development Strategies
JEL Codes: Z10, C23, C82

3
Introduction
In the last decade a sizable literature has documented the role of culture as a factor promoting
economic development. While many studies have focused on the anthropological notion of culture (e.g.
Guiso, Sapienza and Zingales 2006; Tabellini 2010), less attention has been devoted to its functional
interpretation, that is to analyze how cultural production and the valorization of cultural resources may
foster economic development.
For instance, contributions in cultural economics have introduced the concept of cultural
capital as a means towards understanding the economic dimension of cultural activities in relation to
other forms of capital inputs. Cultural capital may be viewed as a stock of tangible and intangible
cultural expressions of a society (Throsby 2001). In particular, the stock of tangible cultural capital
exists in heritage goods such as buildings, structures, sites and locations endowed with cultural
significance. The main implication of this concept is that cultural activities and heritage goods may be
introduced in a broader framework of development assessing investment opportunities and economic
impacts.
The preservation and valorization of historic heritage and local cultural resources has been
particularly adopted as a strategy of local development and poverty reduction since the 90’s (Pagiola
1996; Cernea 2001). In this view, local cultural resources and heritage are considered as assets that may
generate, directly or indirectly, positive economic effects. The direct effects refer to the creation of
employment and economic activities in the cultural sector and heritage services, while the indirect
effects encompass the emergence of heritage related services, such as restoration and preservation
activities, and the enhancement of the tourist sector (Greffe 2004). However, the preservation of
heritage goods and the valorization of cultural activities present also an opportunity cost (Peacock and
Rizzo, 2008). Investing in heritage preservation may be at the expense of deploying resources on other
capital inputs that provide a higher return and can foster economic development. Further, the
provision of heritage is usually based on regulations apt to preserve the cultural goods, which in turn
restrict or hinder the emergence of potential economic opportunities and businesses.
At the international level UNESCO World Heritage system represents the main
4
mechanism for heritage preservation and valorization. World Heritage Sites are defined since the
adoption of the international Convention Concerning the Protection of the World Cultural and Natural
Heritage in 1972 (UNESCO 2005). Its objective is to encourage the identification, protection and
preservation of cultural and natural heritage around the world considered to be of outstanding value to
humanity. The World Heritage Convention is today the most successful international legal instrument
for the protection of immovable heritage. It has since been ratified by 186 countries, which have placed
890 sites under its protection. The inscription of many sites on the list is a testimony to their universal
recognition as important sources of tourism affluence. It is also a powerful boost to the attractiveness
of an area. This potential for tourism attractiveness can create conditions for local and national
development.
However, as the initiative to submit new properties in the List lies with individual countries, not
unexpectedly this may be influenced by several nation-specific factors. Interestingly, this means that at
any one time the pattern of world heritage may be a reflection of economic, institutional and political
factors specific to each country. As a result, some states may be more active in preserving their national
heritage endowments or have more influence than others in the world heritage selection process. The
risk is that countries with low resources on heritage preservation be excluded from this mechanism of
development.
The World Heritage List has been already recognized to be unbalanced in the type of inscribed
properties and in the geographical areas of the world that are represented (Rakic 2007). As shown in
Table 1, the great majority of inscribed properties are cultural sites and most of world heritage is
located in developed regions of the world, in particular in Europe and North America.
TABLE 1 ABOUT HERE
Crucially, our paper aims to provide new insights into the relationship between heritage
preservation activities and the economic, social and institutional factors expressing level of countries’
development. We use panel data covering the whole period of activity of the World Heritage. Because

5
states have entered in the World Heritage Convention at different periods and sites are added yearly to
the List, an empirical analysis based on longitudinal data is better suited to unveil this relationship.
The paper is divided as follows: section 2 describes the World Heritage Convention and the
process of inscription of sites in the World Heritage List; section 3 presents the main determinants
affecting the World Heritage Listing; section 4 describes the data and the empirical results; Section 5
concludes.
World Heritage Sites: selection process and incentives for preservation
Originally, the UNESCO World Heritage Convention of 1972 is rooted in the international
recognition that protection of cultural and natural heritage of outstanding universal interest often
remains incomplete at the national level, as countries lack the economic, scientific, and technological
resources for preservation. The implementing mechanism adopted by the Convention for identifying
heritage sites of world status is based on the formulation of the World Heritage List.
The List consists of cultural, natural and mixed properties of “outstanding universal value”, but
in order to define such ambiguous concept ten criteria have been devised. Sites can be included in the
list if satisfy at least one of the criteria. Six criteria refer to Cultural, and four to Natural Sites. The
former address “masterpiece of human creative genius” or reflect exceptional testimony of cultures and
civilizations such as human settlement, building, architectural ensemble or landscape, or events and
living traditions related to immovable heritage. The latter refer to “superlative natural phenomena or
areas of exceptional natural beauty and aesthetic importance”, the most important and significant
natural habitats for in-situ conservation of biological diversity and outstanding examples of major
stages of earth's history or ecological and biological processes.
The nomination process lasts at least eighteen months and relies on the initiative of the state
parties, which submit proposals for their heritage sites to be included in the World Heritage List.
Experts of two advisory bodies, respectively ICOMOS for Cultural Properties and IUCN for Natural
Properties, then evaluate the nomination report, which is eventually sent to the World Heritage
Committee for the final decision of inclusion of the heritage site in the List. Rejection can occur
6
because the site does not meet the outstanding universal value condition, lacks sufficient protection of
the heritage site by the national authority, or there have been procedural reasons in the nomination
process (Van der Aa 2005).
The use of World Heritage Designation represents a useful proxy for a country’s heritage
preservation activity. For instance, having national heritage sites with World Heritage recognition does
not guarantee greater protection of or additional resources to the enlisted properties. The World
Heritage Fund is about US$4 million per year, a sum insufficient to cope with the growing needs and
international assistance requests (UNESCO 2008). As a result, the protection of World Heritage
properties mainly rests on national conservation programs and the benefits of having sites with world
heritage status only accrue in forms similar to those of collective quality mark. Countries may benefit
from World Heritage by signaling the quality of their cultural and natural properties, attracting further
resources for heritage protection or marketing their world heritage sites as tourism destinations (Van
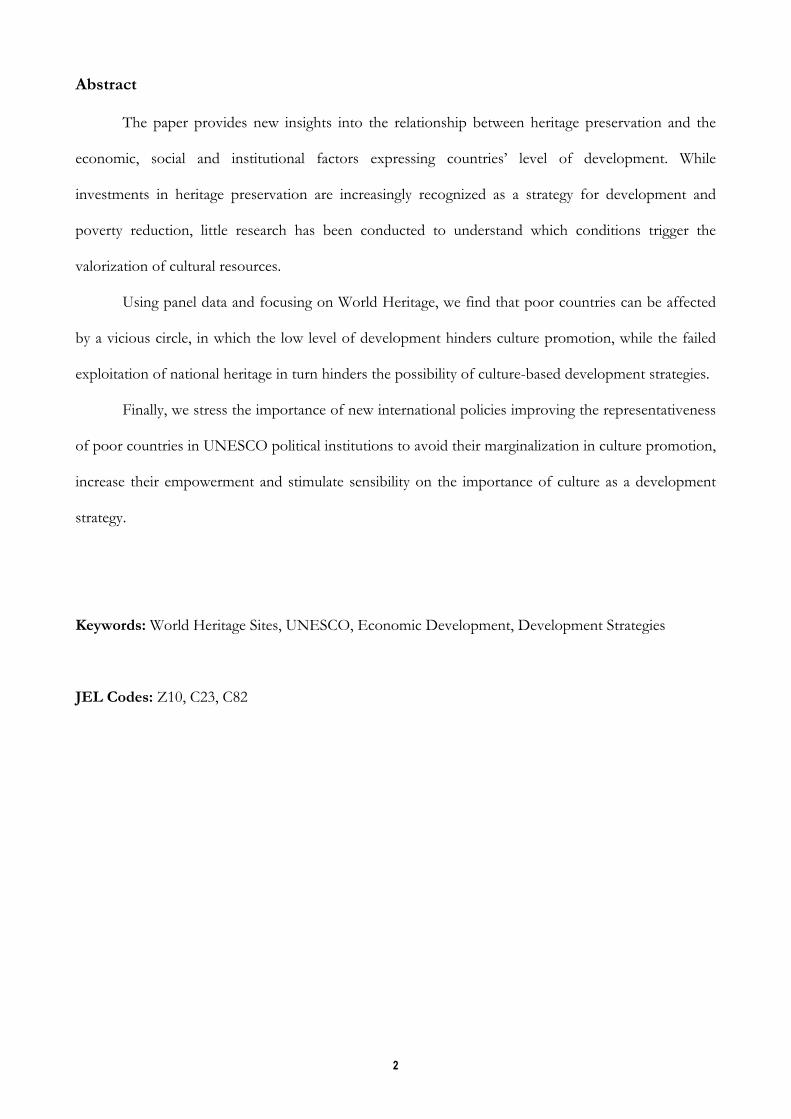
der Aa 2005). Indeed, Figure 1 suggests that there exists a positive relationship between tourism
attractiveness and heritage preservation through the World Heritage system.
INSERT FIGURE 1
Recent works in the economic literature have extended this line of inquiry. For instance, Yang,
Lin and Han (2010) show for China that World Heritage Sites are found to be significant in explaining
the numbers of international tourists and have a greater tourist-enhancing effect than other heritage
destinations. Further, investigating the causal relationship between tourism specialization and economic
growth of countries, Arezki, Cherif and Piotrowski (2009) show that the number of heritage sites per
100.000 inhabitants is a robust and positive instrument for tourist specialization. While their robustness
analysis suggests that the instrument is not correlated with the quality of social, cultural, and political
institutions of modern period (last 2 to 5 centuries) less clear is the role of economic and social
conditions of countries in providing opportunities for heritage preservation and consequently for
inclusion of sites in the World Heritage List. Interestingly, Frey and Pamini (2010), using cross section

7
data, have analyzed how the influences of country size, population and income level affect the actual
distribution of World Heritage Sites. Their findings suggest that the three factors play a significant role
in explaining the number of Sites in the World Heritage List.
Unveiling the determinants of World Heritage Listing
In order to explain the different number of World Heritage sites across countries we focus on a
set of determinants related to both country’s development level and activity in the World Heritage
system. While the selected factors do not fit into a comprehensive model, they nevertheless provide
useful insights for inferring on both the availability of heritage worth to be inscribed in every country
and on the way in which development-related characteristics can foster or hinder the participation to
culture promotion.
Availability and quality of heritage
As the locations of heritage sites are the chance products of history and geography, the stock of
cultural and natural heritage endowments should be the leading factor to determine the concentration
of World Heritage sites within a country. In principle, it could be argued that the more the heritage in a
region, the higher the probability for having it inscribed in the World Heritage List. However,
identifying the stock of heritage sites worth of inscription across countries faces two main problems.
First, especially for cultural properties, it is difficult to have an objective and shared definition
of heritage, which it makes hard the comparison across countries. This shortcoming is also evident in
the concerns raised by the World Heritage Committee about the risk of western-centric criteria for the
inscription of heritage sites. For instance, using history as an indicator of cultural production and
heritage, Van der Aa (2005) notices a strong correlation between the distribution of world heritage sites
according to regions and time of construction, on one hand, and the attention to periods and regions
by western history books, on the other hand.
Second, lack of data on the quality of heritage endowments lead to more difficult estimates on
8
the stock of heritage worth of inscription in the World Heritage List. For instance, while quantity of
heritage is important, quality and the condition of its preservation are crucial. Authenticity and integrity
are indeed two essential requirements for World Heritage inscription. In order to consider the size of
cultural and natural heritage, we will use fixed effects regressions, as better described in the next
session. Moreover, because of the lack of reliable and objective measures of the stock of heritage
endowments worth to be inscribed in the List, the population size could be an indicators that
significantly affects the number of World Heritage Sites per state. Population should be particularly
relevant for cultural sites, as the greater the concentration of humans in a region, the higher the chance
of cultural production in the past and heritage in that area.
Country’s development level
As already observed, the level of development can influence the extent at which a country
promotes culture preservation (in our case through the World Heritage system), in its turn important
for economic development. This could happen both directly, since poor countries could have other
priorities rather than culture promotion, and indirectly, given that the level of economic development
could influence the bargaining power within international institutions as UNESCO. As noted by Frey
and Pamini (2010), economic conditions may express the political power of countries, used to lobby for
inclusion of their own sites, regardless any objective evaluation of the quality and outstanding universal
value of heritage. For this reason, we control also for country’s economic size, expressed by GDP.
In order to typify these effects, we use indicators of both economic and social development.
We measure economic development level by using country’s per-capita income in PPP at constant price
(World Development Indicators, World Bank). Social development is measured both by country’s
average years of education, provided by the Barro-Lee dataset (Barro and Lee 2010), and the indexes of
political and civil freedom calculated by Freedom House; these indexes range from 1 to 7 and the
higher is the value of the index, the lower is the level of freedom. The level of education reflects human
capital in a country and may influence the importance given to cultural goods and consequently to
heritage preservation. For instance, it could be argued that the higher is the level of education, the

9
greater is the interest for a country to propose sites in the List. Moreover, the quality of political
systems and national institutions may affect the number of world heritage sites inscribed by a country.
Indeed, it could be expected that states with the most illiberal and repressive regimes may be less
interested in allocating resources to heritage preservation and taking actively part to the World Heritage
system.
Factors within the World Heritage System
Finally, there are some factors intrinsic to the activity of a country within the World heritage
systems that may affect the distribution of World Heritage sites. First, since member states can propose
each year new inscriptions of cultural and natural properties, the length of membership in the World
Heritage Convention increase both directly and indirectly the probability of nominating and having
inscribed sites. Directly, because older state members have more opportunities to nominate sites as
compared to younger members. Indirectly, because the inherent learning process improves the ability
of countries in dealing with the nomination procedures.
Second, countries that actively participate in the World Heritage Convention are often also
represented on the World Heritage Committee, which comprises twenty-one member countries, in
charge for about 4 years. Since the World Heritage Committee decides each year the sites to be
inscribed or referred back, being member of this board may signal an active participation of the country
to the World Heritage System or even influence the selection process. For instance, between 1978 and
2009, countries that are represented on the committee get on average 0,54 sites per year on the World
Heritage List, as compared to the average of 0,15 sites listed per year by countries that were not in the
Committee (Van Der Aa 2005).
Empirical Evidence
The empirical analysis is based on an unbalanced panel data of 131 countries, of which 34
developed and 97 developing, in the period 1978-2007. Unlike the cross-country estimation, the panel

10
data form allows us to indirectly take into account the heritage endowment of each country. Since this
is difficult to measure and to model as an independent variable, we typify its effect by considering it an
unobserved variable differing between-country but constant within-country; in other words, the effects
of the regressors are considered keeping constant cultural and natural endowment. This is carried out
by using fixed-effects estimations
The dependent variable, country’s cumulative number of World Heritage sites, is regressed on
six independent variables: per-capita income and, alternatively, GDP in PPP at constant prices;
country’s population size; number of year since the country joined the World Heritage Convention;
cumulative number of years the country has been member of the World Heritage Committee; country’s
political rights and, alternatively, civil freedom ratings; country’s average years of education.
TABLE 2 AND 3 AROUND HERE
Since the cumulative number of World Heritage sites is a count variable, we estimate a negative-
binomial regression1. The results are showed in tables 2 and 3. As expected, the per-capita income has a
positive and significant effect on the number of World Heritage sites. This suggests that the lower the
development level of a country, the lower is the extent at which it internationally promotes and protects
its heritage. As discussed above, there are various reasons behind this relationship. First of all, a country
with a low development level and then scarce economic resources could have other political priorities
rather than the promotion of cultural and natural heritage. Second, also the protection, management,
authenticity and integrity of properties are taken into account by the selection process; however,
heritage sites in poor countries often do not match these requirements. Furthermore, the weakness of
institutions and the scarcity of social capital could prevent the capacity to convincingly propose new
sites to enlist. Finally, this relationship could reflect the geographical distribution of the World Heritage
sites and the possible Western-centric idea of what is or is not culture.
The GDP coefficient is positive and highly significant, revealing that the economic size of a
1 We also estimated a Poisson regression. Results were all confirmed.

11
country influences its active participation to the World Heritage System: countries with a greater
economic size could have a higher influence on international organizations; at the same time, the
national resources available for the promotion of culture could be larger.
With regard to social development indicators, education and freedom, their effect is weak and
with an unexpected sign. Both political and civil freedoms have a significant and positive coefficient,
revealing that countries with less freedom are more represented in the World Heritage. This result is
counter-intuitive for two reasons. First, from the cultural point of view, it is reasonable that free
populations have greater possibilities to express themselves and then to produce culture. Second, less
democratic regimes often are closed toward the international community and not willing to actively
participate to international organizations’ activities, even when they are members. However, this result
can be explained by considering the over-representation of developing countries, usually less free with
respect to developed economies. Moreover, among developing countries, many African states with a
low degree of freedom joined the Convention in the first years after its declaration. Results then
suggest that countries actively contribute to the World Heritage in spite of their level of democracy.
The average level of education of a country seems to have a significant but unexpected effect:
the higher the education level, the lower is the number of World Heritage sites. On the one hand, this
can be caused by the within country time-effect: since the average years of education have constantly
and rapidly increased in the most part of countries (Thomas, Wang and Fan 2000), it is possible that
their rate of growth has been sharper than the rate of growth of enlisted World Heritage sites. On the
other hand, the growth of the education level was higher for developing countries, because of the
younger and new-educated population, than for developed countries, with an average education level
kept down by an important presence of old-aged people; in some cases developing countries, even if
with notable disparities, reached and surpassed the average education level of developed countries (see
Barro-Lee dataset, Barro and Lee 2010).
Also the demographic size has an unexpected effect: the larger the population of a country, the
lower the number of sites enlisted in the World Heritage. Even if counterintuitive, this result can be
interpreted in three ways. First, countries with a similar economic size (for example Portugal and

12
Bangladesh) but with a very different demographic size will have also different per-capita income; this
implies that, ceteris paribus, the country with a larger population will have a lower number of World
Heritage sites because of the per-capita income effect. Second, this can reflect the over-representation
of developing countries in the sample, usually characterized by large population and high fertility rate,
and the over-representation of developed countries in the World Heritage list, usually characterized by
smaller population and lower fertility rate. Third, as in the case of education sign, by looking at the
within country time-effect it is presumable that the growth rate of population has been higher than the
growth rate of the World Heritage sites, especially for developing countries.
With regard to the influencing factors within the World Heritage System, i.e. the length of the
membership in the World Heritage Convention and the number of years with a seat in the Committee,
we find that both the coefficients are positive and highly significant. As expected, countries that are
members of the World Heritage System for longer time had more possibilities of proposing their sites;
moreover, it is probable that a process of learning-by-doing occurs and improves the ability of dealing
with the application process. At the same time, countries with a higher experience in the Committee
can absorb the necessary skills to deal with the selection process and have a direct influence on it.
Developed vs. developing countries
Table 4 shows the results of the negative binomial panel regression separately for developing
and developed countries. Interestingly, we find very different results between the two groups of
countries. Looking at developed countries, it seems that the only two significant factors are those
within the World Heritage System: the length of the membership and Committee delegation, the
former with positive and the latter with negative sign. It reveals that the more a developed country seats
on the Committee, the less is its impact on the number of enlisted sites; in other words, it seems that
the bargaining activity occurs in the first years of participation to the Committee and decreases over
time. The economic and social variables, on the contrary, have not a significant impact on the extent at
which developed countries are represented in the World Heritage list. Of course, developed countries
are a more homogeneous group from an economic and social point of view, so that the great difference

13
is made by the active participation within the World Heritage System.
TABLE 4 AROUND HERE
Results for developing countries on the contrary reveal that for this group all the variables we
take into account play a fundamental and significant role in determining the number of a country’s
World Heritage sites. The impact of the economic variables is strong and significant, suggesting that
developing countries with a larger economic size and a middle level of development are more involved
in the World Heritage than very poor countries. Moreover, also for developing countries it is important
to participate to the World Heritage activities and to be member of the Convention from a longer time.
The statistically positive effect of political and civil freedom, although not significant, is confirmed. The
only two coefficients which negatively affect the number of World Heritage sites are those of
population size and average level of education, probably reflecting the fact that both registered a rate of
growth greater than that of the number of World Heritage sites in developing countries.
Empowering developing countries
In our analysis, we find a positive effect of both economic development and economic size,
revealing that poor countries can be excluded by international promotion of culture. On the contrary,
social development indicators play an ambiguous role, since results suggest that there is no positive
relation between social progress, in terms of education diffusion and political and civil freedom, and
number of World Heritage sites. More interestingly, the active participation to the World Heritage
Committee seems to have a strong influence in increasing the number of enlisted sites, above all in
developing countries.
In the light of these results, it is interesting to better investigate the joint role of economic
development and participation to the Committee for two main reasons. First, the separate estimations
for developed and developing countries suggest that the participation to the Committee plays a role just
for developing countries. Second, among variables positively acting on the number of sites (per-capita

14
income, GDP, duration of membership and presence in the Committee), participation to the
Committee is the only factor on which UNESCO policy can be built to improve developing countries’
involvement.
In order to test the joint impact of development level and participation to the Committee, we
re-run the model by adding an interaction variable between per-capita income and cumulative number
of years the country has been member of the World Heritage Committee. Results are reported in table
5. Previous results are confirmed. With regard to the interaction variable, we notice that its sign is
negative, revealing that even if the direct effect of the presence in the Committee has a positive impact
on the number of enlisted sites, this impact weakens as the development level grows until a threshold
of per-capita income above which it is completely nullified.
TABLE 5 ABOUT HERE
In order to calculate this threshold in 2007, we have to compute the marginal effect of
Committee participation on the number of sites:
[1]
where y is the number of sites, x4 the cumulative number of years in the Committee, 4 the coefficient
of the latter, 5 the coefficient of the interaction variable and x1 the per-capita GDP. When the
marginal effect is equal to 0, the value of the per-capita income is 22818 US$ in PPP. This point can be
better understood by looking to figure 2. It shows the relationship between additional number of sites
and per-capita income under the scenario of one additional year in the Committee in 2007. The shape
of the curve reveals that the highest the per-capita income, the highest is the absolute number of WH
sites; however, for low income countries the benefits of one additional year in the Committee are
maximum (slope), while for high income countries with a per-capita income higher than 22818US$ in

15
PPP they are null. In other words, the more the country is poor, the more an additional year in the
Committee is effective and useful to enlist new sites.
INSERT FIGURE 2
These findings can help to individuate policy actions improving the active participation of poor
countries in culture promotion. A viable policy could be to reserve a number of Committee seats to
countries which would more benefit from it. Figure 3 displays the number of additional sites (marginal
effect) per-country after one additional year in the Committee in 2007; they range from Democratic
Republic of The Congo, the greatest beneficiary, to Trinidad and Tobago. Of course, this policy alone
is not sufficient to help developing countries to preserve culture and foster culture-based development
strategies. More action is required to international institutions to avoid marginalization of developing
economies in culture promotion. However, a greater participation of poor countries to the UNESCO
Committee, besides its direct impact on the number of sites, could increase the sensibility on the
importance of culture as a development strategy and encourage international policies in this direction.
INSERT FIGURE 3
Conclusions
The aim of this paper has been to provide evidence of the way in which the development level
can influence the extent of international culture promotion through the UNESCO World Heritage
system, in turn important as a development strategy. According to our results, the economic level of
development and the economic size positively affect the number of sites a country has inscribed in the
World Heritage list; on the contrary, this does not hold for other social development indicators, such as
the level of education and the quality of the political system and national institutions. The importance
of economic development in influencing the active participation in culture promotion can be explained
by two main reasons. First, poor countries could have other priorities rather than culture promotion.

16
Second, the level of economic development and size could influence countries’ political power within
international institutions as UNESCO, used to lobby for inclusion of their own sites regardless any
objective evaluation of the quality and outstanding universal value of heritage.
These results suggest that poor countries can be affected by a vicious circle, in which the low
level of development hinders culture promotion because of high opportunity costs of such activity and
weak bargaining power in international institutions, while the failed exploitation of national heritage in
turn hinders the possibility of culture-based development strategies. However, we find that a precious
factor increasing the number of World Heritage sites is to have a seat in the World Heritage
Committee: the more a country participates to the World Heritage Committee, the higher is the
number of enlisted sites. This can be explained by a sort of learning by doing in effectively proposing new
sites and, more important, by the increase in political influence. We find also that this mechanism is
more effective the lower is the economic development level of a country. In other words, it seems that
a seat in the Committee is more precious for poor than rich countries.
These findings suggest the possibility of new international policies improving the
representativeness of poor countries in UNESCO political institutions to avoid their marginalization in
culture promotion, increase their empowerment and stimulate sensibility on the importance of culture
as a development strategy.

17
References
Arezki, Rabah, Cherif Reda, and Piotrowski John. 2009. “Tourism specialization and economic
development: Evidence from the UNESCO World Heritage List.” IMF working paper, no. 09/176.
Barro, Robert J., and Lee Jong-Wha. 2010. “A New Data Set of Educational Attainment in the World,
1950-2010.”, NBER Working Paper, no. 15902.
Cernea, Michael M. 2001. “Cultural Heritage and Development: a framework for action in the Middle
East and North Africa.” Washington: World Bank Publications.
Frey, Bruno S., and Pamini Paolo. 2010. “ World Heritage: Where are We? An Empirical Analysis.”
IEW Working Paper N. 462.
Greffe, Xavier. 2004. “ Is heritage an asset or a liability?” Journal of Cultural Heritage 5: 301-309.
Guiso, Luigi, Sapienza Paola, and Zingales Luigi. 2006. “Does Culture affect Economic Outcomes?”
The Journal of Economic Perspectives 20(2): 23-48.
Pagiola, Stefano. 1996. “Economic Analysis of Investments in Cultural Heritage: Insights from
Environmental Economics.” Washington: World Bank (Processed).
Peacock, Alan T., and Rizzo Ilde. 2008. The Heritage Game. Economics, Politics, and Practice. Oxford:
Oxford University Press.
Rakic, Tijana 2007. “World Heritage: Issues and debates.” Tourism 55(2): 209-219.
Tabellini, Guido. 2010. “Culture and Institutions: Economic Development in the Regions of Europe.”

18
Journal of the European Economic Association 8(4): 677-716.
Thomas, Vinod, Wang Yan, and Fan Xibo. 2000. “Measuring Education Inequality: Gini Coefficients
of Education.” World Bank Policy Research Working Paper, no. WPS2525.
Throsby, David. 2001. Economics and Culture. Cambridge: Cambridge University Press.
UNESCO. 2005. World Heritage Information Kit. Paris: UNESCO World Heritage Centre.
UNESCO. 2008. World Heritage: Millenium Challenges. Paris: UNESCO World Heritage Centre.
Van der Aa, Bart J.M. 2005. “Preserving the Heritage of Humanity? Obtaining World Heritage Status
and the Impacts of Listing.” PhD Diss., Netherlands Organization for Scientific Research, Amsterdam.
Yang, Chih-Hai, Lin Hui-Lin, and Han Chia-Chun. 2009. “Analysis of international tourist arrivals in
China: The role of World Heritage Sites.” Tourism Management 31(6): 827-837.
World Bank. “World Development Indicators, Various Years.” http://www.worldbank.org.

19
Figure legends
Figure 1. World Heritage sites and International Tourism Flows (data 2008).
Source: Unesco and UNWTO.
Figure 2. Effects of an additional year in the Committee on the cumulative number of WH sites by
income-level.

20
Figure 3. Marginal effects of the participation to the Committee per-country in 2007.

21
Tables
Table 1: The World Heritage List according to type of Heritage and Regions
Regions Cultural Natural Mixed Total % Africa 42 33 3 78 9
Arab States 60 4 1 65 7
Asia and the Pacific 129 48 9 186 21
Europe and North America 375 56 9 440 49
Latin America and the Caribbean 83 35 3 121 14
TOTAL 689 176 25 890 100

20
Table 2: Results – Negative Binomial regressions. Dependent variable: number of sites.
PC 1.713198*** 0.3738224*** 0.1334333 0.1239063 0.1082869 0.1845038 0.115781 0.197644
(0.0526064) (0.0677493) (0.0826339) (0.081525) (0.0821168) (0.1558996) (0.0821903) (0.1547787)
MEMBER 0.0492581*** 0.067519*** 0.0617435*** -1.107904*** -1.512056*** -1.148767*** -1.499817***
(0.0018621) (0.0028837) (0.003469) (0.1327068) (0.2446909) (0.1340741) (0.2421474)
POP -1.160881*** -1.08749*** 0.0632055*** 0.089005*** 0.0656155*** 0.0875814***
(0.1314924) (0.1320965) (0.0035616) (0.0073361) (0.003706) (0.0071655)
COMM 0.0128892*** 0.01207*** 0.0011207 0.0104275* 0.0006838
(0.0044454) (0.0044687) (0.0072713) (0.004528) (0.0072919)
PFREE 0.0228271 0.0412592**
(0.0122709) (0.0176502) CFREE 0.0489394*** 0.0552664**
(0.0155165) (0.0216386) EDU -0.040635 -0.0310807
(0.0549138) (0.0547031) CONSTANT -6.951677*** 11.99123 2.013268*** 15.91754*** 16.19359*** 20.54279*** 16.48666*** 20.14561***
(1.274291) (99.79144) (2.013268) (1.983027) (1.993835) (3.641718) (2.012822) (3.598653)
Observations 2848 2848 2848 2848 2848 1349 2848 1349
N= 130 130 130 130 130 80 130 80
T= 32 32 32 32 32 32 32 32
Log-Likelihood -4620.9585 -4252.4711 -4214.7689 -4210.5608 -4208.8397 -2096.5688 -4205.6028 -2096.0364
Notes: Values of standard errors in brackets. *, ** and *** mean coefficients are significant respectively at 95%, 99% and 99.9%. The variables PC and POP
are expressed in natural logarithms.

21
Table 3: Results – Negative Binomial regressions. Dependent variable: number of sites.
GDP 1.349614*** 0.046088 0.0993062 0.0955684 0.0811484 0.2201812 0.0900198 0.2313694
(0.0352269) (0.0691679) (0.0831709) (0.0820018) (0.0824762) (0.157892) (0.0825739) (0.1570238)
MEMBER 0.0552774*** 0.068283*** 0.0622933*** -1.198959*** -1.708812*** -1.247489*** -1.707798***
(0.0025785) (0.0029658) (0.0035604) (0.127111) (0.2535976) (0.1282972) (0.2508959)
POP -1.274026*** -1.192689*** 0.0637695*** 0.0882483*** 0.0661317*** 0.0868517***
(0.125012) (0.1268672) (0.0036483) (0.0073804) (0.0037855) (0.0072155)
COMM 0.0130574*** 0.0122021*** 0.0010925 0.0105701** 0.0006734
(0.0044488) (0.0044729) (0.0072581) (0.0045315) (0.0072787)
PFREE 0.0233131 0.0410678**
(0.0122677) (0.0175929) CFREE 0.0492528*** 0.0550956**
(0.0155224) (0.0216025) EDU -0.0415855 -0.0320125
(0.0548471) (0.0546359) CONSTANT -17.4129 13.78526 16.40074*** 15.55773*** 15.92648*** 18.48068*** 16.13505*** 18.01866***
(25.40355) (118.7752) (2.447621) (2.404622) (2.41683) (4.348208) (2.435184) (4.307358)
Observations 2854 2854 2854 2854 2854 1349 2854 1349
N= 131 131 131 131 131 80 131 80
T= 32 32 32 32 32 32 32 32
Log-Likelihood -4514.0412 -4273.3493 -4221.3557 -4217.0463 -4215.2506 -2096.2943 -4212.0293 -2095.7634
Notes: Values of standard errors in brackets. *, ** and *** mean coefficients are significant respectively at 95%, 99% and 99.9%. The variables GDC and
POP are expressed in natural logarithms.

22
Table 4: Results –Negative Binomial regressions. Dependent variable: number of sites.
SAMPLE: DEVELOPED COUNTRIES SAMPLE: DEVELOPING COUNTRIES
PC -0.483457 -0.4339143 0.3178788* 0.3285764*
(0.5160684) (0.5173407) (0.1576175) (0.1586447)
GDP -0.2741555 -0.3047055 0.359664* 0.3696593**
(0.461592) (0.46794) (0.1580691) (0.1589947)
MEMBER 0.0991126*** 0.1039951*** 0.1286012*** 0.1321871*** 0.0773794*** 0.075125*** 0.0764367*** 0.0741685***
(0.0150211) (0.0144501) (0.014286) (0.0139237) (0.0094095) (0.0091815) (0.0094152) (0.0091943)
POP 0.0244447 -0.0202458 -3.90618*** -4.057014*** -0.8772681*** -0.8478768*** -1.201476*** -1.180702***
(0.2670216) (0.2741589) (0.6389445) (0.6220158) (0.2847024) (0.2840036) (0.292815) (0.2903154)
COMM -0.0378328*** -0.0409852*** -0.0289753** -0.0294223*** 0.0525018*** 0.0532321*** 0.0525753*** 0.0533607***
(0.0128413) (0.0126774) (0.0113994) (0.0113333) (0.0113493) (0.0114219) (0.0113257) (0.0113994)
PFREE -0.1771437 -0.100012 0.0339776 0.0337936
(0.1113689) (0.104587) (0.0181676) (0.0181164)
CFREE 0.0679195 0.019181 0.0327296 0.032365
(0.0687966) (0.0635853) (0.0238472) (0.0237765)
EDU 0.174388 0.14372 0.0110792 0.0058276 -0.2861661*** -0.2783631*** -0.2884939*** -0.2808852***
(0.0906839) (0.0912999) (0.0912788) (0.0909705) (0.075976) (0.0764998) (0.0757608) (0.0763543)
CONSTANT 5.876862 5.755155 61.04321*** 63.88969*** 13.14071*** 12.62915*** 9.949821* 9.367691*
(4.928618) (4.983973) (8.053131) (7.710929) (3.88998) (3.833897) (4.530828) (4.496749)
Observations 420 420 420 420 929 929 929 929
N= 27 27 27 27 53 53 53 53
T= 32 32 32 32 32 32 32 32
Log-Likelihood -794.26543 -795.03568 -771.00281 -763.18714 -1285.884 -1286.6897 -1285.3656 -1286.1774
Notes: Values of standard errors in brackets. *, ** and *** mean coefficients are significant respectively at 95%, 99% and 99.9%. The variables PC, GDP and
POP are expressed in natural logarithms.

23
Table 5: Results – Negative Binomial regressions. Dependent variable: number of sites.
PC 0.0000256* 0.0000287** (0.0000144) (0.0000142)
MEMBER 0.1017923*** 0.0987388*** (0.0084037) (0.0081088)
POP -2.044793*** -1.982755*** (0.285762) (0.280455)
COMM 0.0606949*** 0.0606059*** (0.0124813) (0.0125959)
INTERACTION (PC*COMM)
-0.0000027*** (0.00000048)
-0.0000027*** (0.0000005)
PFREE 0.0486617*** - (0.0178589)
CFREE - 0.0588422*** (0.0218339)
EDU -0.1769298*** -0.164739*** (0.0606165) (0.0604563)
CONSTANT 30.78544*** 29.64586*** (4.133202) (3.982386)
Observations 1349 1349 N= 80 80 T= 32 32
Log-Likelihood -2079.8962 -2079.9651
Notes: Values of standard errors in brackets. *, ** and *** mean coefficients are significant
respectively at 90%, 95% and 99%. The variable POP IS expressed in natural logarithms.
Related Documents