Cultivation of a perennial grass for bioenergy on a boreal organic soil – carbon sink or source? NARASINHA J. SHURPALI *, NIINA P. HYVO ¨ NEN *, JARI T. HUTTUNEN *, ROBERT J. CLEMENT w , MARKUS REICHSTEIN z, HANNU NYKA ¨ NEN *, CHRISTINA BIASI * and PERTTI J. MARTIKAINEN * *Department of Environmental Science, University of Kuopio, PO Box 1627, FIN-70211 Kuopio, Finland, wRoom No. 202 Crew Building, West Mains Road, Edinburgh, EH9 3JN, UK, zBiogeochemical Model-Data Integration Group, Max-Planck-Institute for Biogeochemistry, Hans-Kno ¨ll-Strasse 10, D-07745 Jena, Germany Abstract The area under the cultivation of perennial bioenergy crops on organic soils in the northern countries is fast increasing. To understand the impact of reed canary grass (RCG, Phalaris arundinaceae L.) cultivation on the carbon dioxide (CO 2 ) balance of an organic soil, net ecosystem CO 2 exchange (NEE) was measured for four years in a RCG cultivated cutover peatland in eastern Finland using the eddy covariance technique. There were striking differences among the years in the annual precipitation. The annual precipitation was higher during 2004 and 2007 and lower during 2005 and 2006 than the 1971–2000 regional mean. During wet growing seasons, moderate temperatures, high surface soil moisture and low evaporative demand favoured high CO 2 uptake. During dry seasons, owing to soil moisture and atmospheric stress, photosynthetic activity was severely restricted. The CO 2 uptake [gross primary productivity (GPP)] was positively correlated with soil moisture, air temperature and inversely with vapour pressure deficit. Total ecosystem respiration (TER) increased with increasing soil temperature but decreased with increasing soil moisture. The relative responses of GPP and TER to moisture stress were different. While changes in TER for a given change in soil moisture were moderate, variations in GPP were drastic. Also, the seasonal variations in TER were not as conspicuous as those in GPP implying that GPP is the primary regulator of the interannual variability in NEE in this ecosystem. The ecosystem accumulated a total of 398 g C m 2 from the beginning of 2004 until the end of 2007. It retained some carbon during a wet year such as 2004 even after accounting for the loss of carbon in the form of harvested biomass. Based on this CO 2 balance analysis, RCG cultivation is found to be a promising after-use option on an organic soil. Keywords: bioenergy, carbon balance, drained peatlands, eddy covariance, greenhouses gases, net ecosystem exchange, organic soil, perennial crop, Phalaris arundinaceae, reed canary grass Received 14 November 2008; revised version received 15 December 2008 and accepted 20 December 2008 Introduction Carbon dioxide (CO 2 ) is the principal greenhouse gas driving global warming. Current CO 2 levels in the atmosphere stand at 387 ppm, up almost 40% since the industrial revolution and are the highest for at least the last 650 000 years. From 1970 to 2000, the concentra- tion rose by about 1.5 ppm each year, but since 2000 the annual rise has surged to an average 2.1 ppm. The annual mean CO 2 growth rate for 2007 was 2.14 ppm. According to IPCC (2007), this increase is anthropo- genic and is brought about primarily by the combustion of fossils fuels and deforestation. It is mandatory, there- fore, for all signatory members of the Kyoto Protocol to reduce their CO 2 emissions by at least 5% below the 1990 levels by the 2008–2012 commitment period. One of the strategies to reduce these emissions is to increase the use of renewable energy. Bioenergy production from biomass has been proposed to be one of the ways to increase the share of renewable energy in the total energy consumption. Bioenergy is considered to pro- duce ‘carbon neutral’ energy, as the biomass releases the Correspondence: Narasinha J. Shurpali, tel. 1 358 17 163 321, fax 1 358 17 163 750, e-mail: narasinha.shurpali@uku.fi GCB Bioenergy (2009) 1, 35–50, doi: 10.1111/j.1757-1707.2009.01003.x r 2009 The Authors Journal compilation r 2009 Blackwell Publishing Ltd 35

Welcome message from author
This document is posted to help you gain knowledge. Please leave a comment to let me know what you think about it! Share it to your friends and learn new things together.
Transcript
Cultivation of a perennial grass for bioenergy on a borealorganic soil – carbon sink or source?
N A R A S I N H A J . S H U R PA L I *, N I I N A P. H Y V O N E N *, J A R I T . H U T T U N E N *, R O B E R T J .
C L E M E N T w , M A R K U S R E I C H S T E I N z, H A N N U N Y K A N E N *, C H R I S T I N A B I A S I * and
P E R T T I J . M A R T I K A I N E N *
*Department of Environmental Science, University of Kuopio, PO Box 1627, FIN-70211 Kuopio, Finland, wRoom No. 202 Crew
Building, West Mains Road, Edinburgh, EH9 3JN, UK, zBiogeochemical Model-Data Integration Group, Max-Planck-Institute for
Biogeochemistry, Hans-Knoll-Strasse 10, D-07745 Jena, Germany
Abstract
The area under the cultivation of perennial bioenergy crops on organic soils in the
northern countries is fast increasing. To understand the impact of reed canary grass
(RCG, Phalaris arundinaceae L.) cultivation on the carbon dioxide (CO2) balance of an
organic soil, net ecosystem CO2 exchange (NEE) was measured for four years in a RCG
cultivated cutover peatland in eastern Finland using the eddy covariance technique.
There were striking differences among the years in the annual precipitation. The annual
precipitation was higher during 2004 and 2007 and lower during 2005 and 2006 than the
1971–2000 regional mean. During wet growing seasons, moderate temperatures, high
surface soil moisture and low evaporative demand favoured high CO2 uptake. During
dry seasons, owing to soil moisture and atmospheric stress, photosynthetic activity was
severely restricted. The CO2 uptake [gross primary productivity (GPP)] was positively
correlated with soil moisture, air temperature and inversely with vapour pressure deficit.
Total ecosystem respiration (TER) increased with increasing soil temperature but
decreased with increasing soil moisture. The relative responses of GPP and TER to
moisture stress were different. While changes in TER for a given change in soil moisture
were moderate, variations in GPP were drastic. Also, the seasonal variations in TER were
not as conspicuous as those in GPP implying that GPP is the primary regulator of the
interannual variability in NEE in this ecosystem. The ecosystem accumulated a total of
398 g C m�2 from the beginning of 2004 until the end of 2007. It retained some carbon
during a wet year such as 2004 even after accounting for the loss of carbon in the form of
harvested biomass. Based on this CO2 balance analysis, RCG cultivation is found to be a
promising after-use option on an organic soil.
Keywords: bioenergy, carbon balance, drained peatlands, eddy covariance, greenhouses gases, net
ecosystem exchange, organic soil, perennial crop, Phalaris arundinaceae, reed canary grass
Received 14 November 2008; revised version received 15 December 2008 and accepted 20 December 2008
Introduction
Carbon dioxide (CO2) is the principal greenhouse gas
driving global warming. Current CO2 levels in the
atmosphere stand at 387 ppm, up almost 40% since
the industrial revolution and are the highest for at least
the last 650 000 years. From 1970 to 2000, the concentra-
tion rose by about 1.5 ppm each year, but since 2000 the
annual rise has surged to an average 2.1 ppm. The
annual mean CO2 growth rate for 2007 was 2.14 ppm.
According to IPCC (2007), this increase is anthropo-
genic and is brought about primarily by the combustion
of fossils fuels and deforestation. It is mandatory, there-
fore, for all signatory members of the Kyoto Protocol to
reduce their CO2 emissions by at least 5% below the
1990 levels by the 2008–2012 commitment period. One
of the strategies to reduce these emissions is to increase
the use of renewable energy. Bioenergy production from
biomass has been proposed to be one of the ways to
increase the share of renewable energy in the total
energy consumption. Bioenergy is considered to pro-
duce ‘carbon neutral’ energy, as the biomass releases theCorrespondence: Narasinha J. Shurpali, tel. 1 358 17 163 321,
fax 1 358 17 163 750, e-mail: [email protected]
GCB Bioenergy (2009) 1, 35–50, doi: 10.1111/j.1757-1707.2009.01003.x
r 2009 The AuthorsJournal compilation r 2009 Blackwell Publishing Ltd 35
same amount of carbon upon combustion as the
amount of atmospheric CO2 captured during the photo-
synthetic process. Furthermore, bioenergy use contri-
butes to the security of energy supply and enhances the
goals of local employment.
Northern wetlands store vast amounts of carbon. In
their natural state, they have been shown to be sinks for
atmospheric CO2 (Turunen et al., 2002) and sources of
methane on a long-term basis. However, when they are
drained for forestry, agriculture or peat extraction, the
thickness of their aerobic soil layer increases. This leads
to an increase in the rate of organic matter decomposi-
tion. As a result, peatlands, which were once a sink for
carbon, are turned into atmospheric carbon sources
after drainage (Minkkinen et al., 2002).
Irrespective of being cultivated with agricultural
crops such as barley, wheat or potato or grasses, organic
soils in the boreal region have been reported to be
emitting large amounts of CO2 (2.9–30.4 ton CO2 ha�1
yr�1) into the atmosphere (Nykanen et al., 1995; Kasi-
mir-Klemedtsson et al., 1997; Maljanen et al., 2002, 2003,
2004; Lohila et al., 2004). Drainage of peatlands for peat
extraction for energy is a common practice in the Fenno-
Scandinavian region, Canada and Russia. These peat-
land areas abandoned after peat extraction are a threat
to the environment (Silvola et al., 1996; Sundh et al.,
2000; Waddington et al., 2002). Significant CO2 emis-
sions have been reported also from afforested organic
soils (Makiranta et al., 2007). Therefore, organic soils in
general have been included among the areas with high
risk of significant soil carbon losses and hence have
been recommended to be kept out of biomass produc-
tion for bioenergy (OECD, 2007).
In the boreal region, the area under the cultivation of
reed canary grass (RCG) (Phalaris arundinacea L.) as a
bioenergy crop is fast increasing. For example, the area
under RCG in Finland during 2008 was about 19 000 ha
and it is projected to increase to 100 000 ha by 2012.
Although RCG can be grown on most soil types, hu-
mus-rich, wet soils have been recommended for its
cultivation. The crop thrives well with the highest
biomass yields on such soil types (Venendaal et al.,
1997; Lewandowski et al., 2003). As a result, RCG is
generally cultivated in the region (e.g., in Finland and
Sweden) on organic soils (e.g., on cutover peatlands
abandoned after peat extraction). While several studies
have documented the carbon balance of forage grasses
and cereal crops on organic soils, there is hardly any
information on the carbon balance of a perennial bioe-
nergy crop such as RCG on these risky soil types. Most
of the studies on RCG cultivation conducted so far have
focussed mainly on quantifying the yield potential,
genetic characters and fuel quality aspects of RCG as
a bioenergy crop (Venendaal et al., 1997; Sahramaa, 2004;
Finell & Nilsson, 2005; Larson, 2006). However, the green-
house gas dynamics and overall benefits of RCG cultiva-
tion for bioenergy use are yet unknown. As discussed
above, there is a risk that organic soils lose large amounts
of CO2 to the atmosphere thereby reducing the benefits of
bioenergy production. However, the data on perennial
crops on organic soils are lacking. With this in view, we
measured carbon balance of RCG cultivation on an
organic soil (a cutover peatland) in eastern Finland over
four growing seasons (2004–2007) employing the eddy
covariance (EC) technique. The main objectives of this
paper are to quantify the net ecosystem CO2 exchange
during 4 years with varying climatic conditions and
investigate the variables controlling CO2 exchange from
RCG cultivation on an organic soil.
Materials and methods
The site
The study site (referred to as the Linnansuo cutover
peatland site – 621300N, 301300E) located in eastern
Finland lies on the border of southern and mid boreal
climatic zones. It is 15 ha in area and is cultivated with
RCG, a perennial grassland crop. Based on the 30-year
normal (1971–2000) climatic data, the mean annual
temperature and precipitation in the region are 2.1 1C
and 669 mm, respectively (Drebs et al., 2002). The max-
imum and minimum temperatures of �10.6 and 16.0 1C
occur in January and July, respectively. July and August
are the wettest months with 80–90 mm of rainfall.
February, March and April, on an average, receive the
lowest amount of precipitation mostly in the form of
snow with about 35 mm during each month.
The preparation of the site for peat extraction, includ-
ing its drainage by ditching, was initiated in 1976. Peat
extraction began in 1978 (Vapo Ltd. Energy, 2003). In
2001, however, when the residual peat thickness ranged
between 20 and 85 cm, peat extraction ceased and
cultivation of bioenergy crops began. The drainage
ditches divide the area into 20-m-wide strips. The strips
with the residual peat layer were tilled, limed and
fertilized with a per hectare surface application of
59.5 kg N, 14.0 kg P and 45.5 kg K. These strips were
then sown with the seeds of a low-alkaloid, hardy
RCG variety ‘Palaton’. As a part of the agronomic
practice in the region, the cultivation of RCG on such
organic soils generally follows a 10-year rotation cycle.
Except in the beginning of the rotation cycle, the soil is
not tilled at all. Fertilizers are applied every year.
Whether the soil needs additional lime is decided
depending upon the soil pH and crop performance in
the preceding year. The general RCG cultivation practice
in the Fenno-Scandinavian region is to harvest the crop in
36 N . J . S H U R PA L I et al.
r 2009 The AuthorsJournal compilation r 2009 Blackwell Publishing Ltd, GCB Bioenergy, 1, 35–50
the spring of the following year. According to Landstrom
et al. (1996) and Burvall (1997), harvesting RCG in the
following spring, as opposed to autumn harvesting,
improves its fuel quality for both combustion and gasi-
fication. The fresh weight crop yield during 2004, 2005,
2006 and 2007 was 3.7, 2.0, 3.6 and 4.7 t ha�1, respectively.
Micrometeorological measurements
The EC measurements of CO2, momentum, latent and
sensible heat fluxes initiated in late March of 2004 are
still continuing. The EC system consists of a 3D sonic
anemometer (Model CSAT-3: Campbell Scientific,
Logan, UT, USA) and an open path infrared CO2/H2O
analyzer (Model LI-7500: LI-Cor Inc., Lincoln, NE, USA).
The instruments are mounted on a tower at a height of
3.7 m above the ground and aligned at an angle of 2251.
The predominant winds in the region are from south-
west and northeast. Constrained by the size of the site,
the instrument tower is located on the northern border
of the site with the instruments pointing towards the
south-westerly direction so that the fetch within the
acceptable range of sonic wind angles (225 � 851) is
representative of the RCG cultivation site. The EC
signals are measured at a frequency of 10 Hz using a
datalogger (Model CR5000: Campbell Scientific) and the
raw data are stored in a binary format on 1 Gb PCMCA
cards. Real-time flux calculations are performed to ob-
tain 30 min averaged flux estimates.
Postprocessing of the raw data was performed using
the ‘EDIRE’ software (available at http://www.geos.ed.
ac.uk/abs/research/micromet/EdiRe) developed at
the University of Edinburgh (Mauder et al., 2007). To
begin with, sonic tilt correction was applied to the data
to orient the vertical axis of the sonic anemometer to the
‘true’ vertical direction. The signals were then despiked
with an upper limit of 20 SDs of the differential of the
raw signal within a signal width of eight scans. Rele-
vant statistics such as means, SDs, variances and covar-
iances were calculated. Finally, frequency response
corrections were applied to account for sensor separa-
tion and high frequency flux losses due to poor instru-
mental responses (Moore, 1986) and density (WPL)
corrections for simultaneous transfer of heat and water
vapour (Webb et al., 1980). Initial quality of the 30 min
averaged flux values and associated micrometeorologi-
cal data was performed using the ‘EDIVAQ’ data quality
control software package developed at the University of
Edinburgh. The various quality control tests such as
range test, despiking, stasis and difference tests were
used to set the bad quality data apart. The data were
then further quality controlled to include only those data
collection periods during when the prevailing winds
were from an acceptable range. Missing or rejected data
amounted to nearly 46% of the data measured during
periods with favourable wind directions.
EC data gap filling and flux partitioning
Data gaps were filled with the marginal distribution
sampling method described in Reichstein et al. (2005)
and further evaluated in Moffat et al. (2007). In this
approach, the gap filling of the EC and meteorological
data is performed through methods that consider both
the covariation of fluxes with meteorological variables
[global radiation, temperature and vapour pressure def-
icit (VPD)] and the temporal autocorrelation of the fluxes.
The gap filling results are more reliable if there are no
gaps in the supporting micrometeorological data. There-
fore, to ensure that we had a complete set of supporting
data to begin with, we first filled the gaps in these data
(u* not included) with the relevant meteorological data
monitored at Mekrijarvi Research Station, University of
Joensuu, situated within 30 km of our study site.
Only original data (not gap filled) were used for flux
partitioning according to Reichstein et al. (2005). The
underlying assumption employed here is that at night,
in the absence of gross primary productivity (GPP), net
ecosystem CO2 exchange (NEE) values as measured by
the EC technique represent total ecosystem respiration
(TER). With this assumption we examined the relation-
ship between night-time NEE and u* within and outside
the growing season in different measurement years. We
found that NEE was apparently not correlated with u*
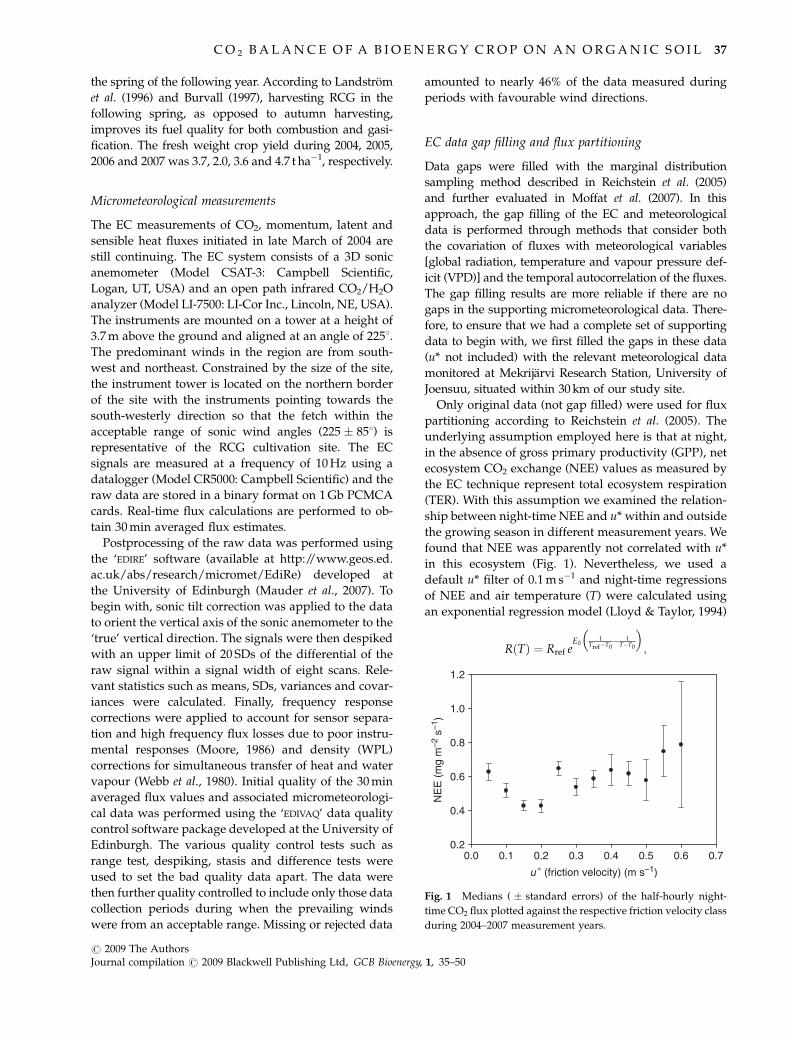
in this ecosystem (Fig. 1). Nevertheless, we used a
default u* filter of 0.1 m s�1 and night-time regressions
of NEE and air temperature (T) were calculated using
an exponential regression model (Lloyd & Taylor, 1994)
R Tð Þ ¼ Rref eE0
1Tref�T0
� 1T�T0
� �;
u ∗ (friction velocity) (m s–1)
0.0 0.1 0.2 0.3 0.4 0.5 0.6 0.7
NE
E (
mg
m–2
s–1
)
0.2
0.4
0.6
0.8
1.0
1.2
Fig. 1 Medians ( � standard errors) of the half-hourly night-
time CO2 flux plotted against the respective friction velocity class
during 2004–2007 measurement years.
C O 2 B A L A N C E O F A B I O E N E R G Y C R O P O N A N O R G A N I C S O I L 37
r 2009 The AuthorsJournal compilation r 2009 Blackwell Publishing Ltd, GCB Bioenergy, 1, 35–50

where T0 5�46.021, Tref 5 10 1C, and Rref, the tempera-
ture-independent respiration rate and temperature sen-
sitivity, E0, were free parameters. The temperature
sensitivity E0 was estimated on a 15-day time scale,
but then averaged and assumed to be constant in time.
A temporally varying estimate of Rref was generated
thus linking variation in NEE between shorter and
longer time scales. Once Rref(T) and E0 were deter-
mined, half-hourly daytime TER was estimated from
measured air temperature, and GPP was calculated as
the difference between NEE and TER. For further
details (http://www.bgc-jena.mpg.de/bgc-mdi/html/
eddyproc/index.html), refer to Reichstein et al. (2005).
Supporting measurements
Aboveground plant and root biomass of RCG were
sampled twice a month during the growing season.
The plants were completely harvested from 25 cm�25 cm plots (n 5 9) by clipping at the stem base, and
separated into living, green biomass and dead standing
biomass. From six out of the nine plots a soil core was
additionally taken for belowground root biomass de-
termination. The soil core was sampled to a depth of
15 cm depth, thus up to the maximum rooting depth of
the plants (in general, roots from the 10 to 15 cm deep
layer contributed o2% to the total (0–15 cm depth) root
biomass, by using a metal soil corer (of 7 cm diameter).
In the laboratory, roots were collected and carefully
washed over a 0.2 mm sieve. Only the white, living
roots were sampled. Both aboveground plant parts
and roots were then oven dried at 60 1C for 24 h to
obtain a constant weight.
Other supporting meteorological measurements
include air temperature and relative humidity
(Model MP101A: Rotronic Instruments UK Ltd, West
Sussex, UK), net radiation and its components (Model
CNR1: Campbell Scientific, Leicestershire, UK), solar
(Model LI-200SA: LI-Cor Inc.) and photosynthetically
active radiation (Model LI-190SA: Li-Cor Inc.), wind
speed and direction (Model QMV101: Vaisala
Oyj, Vantaa, Finland), soil heat flux (Model HFP01SC,
Campbell Scientific), soil temperature profile
(Model 107: Campbell Scientific), precipitation (MOD-
EL 52202/52203: Campbell Scientific), soil moisture
profile (Model CS616: Campbell Scientific) and snow
depth (Model SR 50A: Campbell Scientific). We used
MATLAB [Version 7.5.0.0342 (R2007b)] and associated
Curve Fitting Toolbox 1.2 for curve fitting and other
data analysis requirements, SPSS package (SPSS for
Windows, Release 14.0.1, 18 November 2005) for statis-
tical analyses.
Results and discussion
Climatic conditions during the measurement period
The climatic conditions during May, June and July are
crucial for the growth and phenology of the RCG crop.
The final crop yield is primarily dependent upon how
vigorous is the growth during these months as they
represent the RCG linear growth phase. Compared with
a 30-year regional average (1971–2000), monthly mean
air temperatures in May and June in 2004, May 2005,
June 2007 were lower than normal and higher in June
2005, May and June 2006 and May 2007. Except in 2005,
July monthly mean temperatures were similar to the
30-year average in all other years. August and Septem-
ber experienced temperatures warmer than the normal
in all years (Fig. 2).
Striking differences existed in the amount of rainfall
received during the various growing seasons (Fig. 2).
The growing season in 2004 was the wettest (554 mm
during 1 May–30 September), relatively drier in 2007
(423 mm) and the driest during 2005 and 2006 (246 and
249 mm, respectively). Compared with a regional 30-
year (1971–2000) average value (338 mm), the May–
September rain amount was higher by 64% in 2004, by
25% in 2007 and 26% lower in 2005 and 2006. Thus, 2004
and 2007 growing seasons were wetter and 2005 and
2006 seasons were drier than normal.
The volumetric soil water content at 30 cm depth (y30
was consistently high and it showed little variation
among the years. The volumetric soil water content
Mon
thly
air
tem
pera
ture
devi
atio
n fr
om th
e no
rmal
(°C
)
–10
0
10
2004200520062007
Mon
thly
pre
cipi
tatio
n de
viat
ion
from
the
norm
al r
ainf
all (
mm
)
–60
0
60
(a)
(b)
Fig. 2 Monthly patterns of deviations from the normal in (a) air
temperature and (b) precipitation at the study site in eastern
Finland during the 2004–2007 measurement period.
38 N . J . S H U R PA L I et al.
r 2009 The AuthorsJournal compilation r 2009 Blackwell Publishing Ltd, GCB Bioenergy, 1, 35–50

measured at 2.5 cm below the surface (y2.5) being the
most sensitive to the changes in surface energy balance
and peatland hydrology varied the most, followed by
the water content at 10 cm soil depth (y). The effect of
frequent rain events during 2004 and 2007 and longer,
frequent dry spells during 2005 and 2006 is clearly
evident in the upper layer soil moisture patterns (Fig. 3).
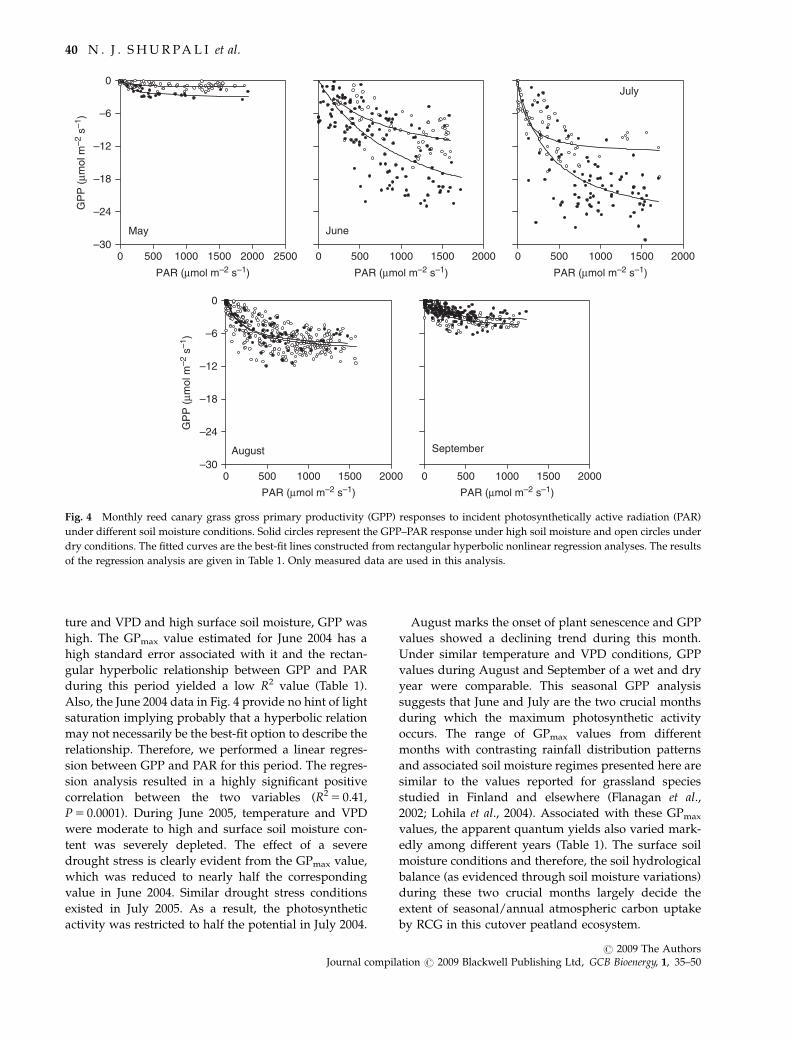
GPP: photosynthetically active radiation (PAR) andseasonality
As photosynthesis is driven by light and the structure
and function of the RCG cultivation changes markedly
over the growing season, we have examined in the
following the relation between GPP and PAR (Fig. 4)
over two types of growing seasons – one over a wet
growing season (May–September 2004) and the other
over a dry season (similar period in 2005). The response
of GPP to PAR during each month is fitted with a
rectangular hyperbolic model. The results of the non-
linear regression analysis along with prevailing air
temperature, VPD and soil moisture conditions are
shown in Table 1.
During May, the GPP was low (Fig. 4). Under similar
conditions of air temperature, VPD and soil moisture,
GPP values during May 2004 were higher than during
May 2005. GPmax estimated from the May relationship
was nearly twice higher during 2004 than during 2005
(Table 1). GPP increased from May to July. June marks
the period with a linear increase in the RCG plant
growth. Peak vegetation growth occurs during late June
to mid July. During June 2004, with moderate tempera-
Pre
cipi
tatio
n (m
m)
0
30
60
90
120
150
0.0
0.2
0.4
0.6
0.8
Precipitation�2.5
�10
Pre
cipi
tatio
n (m
m)
0
30
60
90
120
150
0.0
0.2
0.4
0.6
0.8
Pre
cipi
tatio
n (m
m)
0
30
60
90
120
150
0.0
0.2
0.4
0.6
0.8
1/1/07 1/3/07 1/5/07 1/7/07 1/9/07 1/11/07 1/1/08
1/1/06 1/3/06 1/5/06 1/7/06 1/9/06 1/11/06 1/1/07
1/1/05 1/3/05 1/5/05 1/7/05 1/9/05 1/11/05 1/1/06
1/1/04 1/3/04 1/5/04 1/7/04 1/9/04 1/11/04 1/1/05P
reci
pita
tion
(mm
)
0
30
60
90
120
150
Vol
umet
ric w
ater
con
tent
(m
3 m
–3)
Vol
umet
ric w
ater
con
tent
(m
3 m
–3)
Vol
umet
ric w
ater
con
tent
(m
3 m
–3)
Vol
umet
ric w
ater
con
tent
(m
3 m
–3)
0.0
0.2
0.4
0.6
0.8
(a)
(b)
(c)
(d)
Fig. 3 Growing season daily distribution of volumetric soil moisture content measured at 2.5 and 10 cm below the soil surface and
precipitation during (a) 2004, (b) 2005, (c) 2006 and (d) 2007.
C O 2 B A L A N C E O F A B I O E N E R G Y C R O P O N A N O R G A N I C S O I L 39
r 2009 The AuthorsJournal compilation r 2009 Blackwell Publishing Ltd, GCB Bioenergy, 1, 35–50
ture and VPD and high surface soil moisture, GPP was
high. The GPmax value estimated for June 2004 has a
high standard error associated with it and the rectan-
gular hyperbolic relationship between GPP and PAR
during this period yielded a low R2 value (Table 1).
Also, the June 2004 data in Fig. 4 provide no hint of light
saturation implying probably that a hyperbolic relation
may not necessarily be the best-fit option to describe the
relationship. Therefore, we performed a linear regres-
sion between GPP and PAR for this period. The regres-
sion analysis resulted in a highly significant positive
correlation between the two variables (R2 5 0.41,
P 5 0.0001). During June 2005, temperature and VPD
were moderate to high and surface soil moisture con-
tent was severely depleted. The effect of a severe
drought stress is clearly evident from the GPmax value,
which was reduced to nearly half the corresponding
value in June 2004. Similar drought stress conditions
existed in July 2005. As a result, the photosynthetic
activity was restricted to half the potential in July 2004.
August marks the onset of plant senescence and GPP
values showed a declining trend during this month.
Under similar temperature and VPD conditions, GPP
values during August and September of a wet and dry
year were comparable. This seasonal GPP analysis
suggests that June and July are the two crucial months
during which the maximum photosynthetic activity
occurs. The range of GPmax values from different
months with contrasting rainfall distribution patterns
and associated soil moisture regimes presented here are
similar to the values reported for grassland species
studied in Finland and elsewhere (Flanagan et al.,
2002; Lohila et al., 2004). Associated with these GPmax
values, the apparent quantum yields also varied mark-
edly among different years (Table 1). The surface soil
moisture conditions and therefore, the soil hydrological
balance (as evidenced through soil moisture variations)
during these two crucial months largely decide the
extent of seasonal/annual atmospheric carbon uptake
by RCG in this cutover peatland ecosystem.
PAR (μmol m–2 s–1)
0 500 1000 1500 2000 2500
GP
P (
μmol
m–2
s–1
)
GP
P (
μmol
m–2
s–1
)
–30
–24
–18
–12
–6
0
PAR (μmol m–2 s–1)
0 500 1000 1500 2000
PAR (μmol m–2 s–1)
0 500 1000 1500 2000
PAR (μmol m–2 s–1)
0 500 1000 1500 2000–30
–24
–18
–12
–6
0
PAR (μmol m–2 s–1)
0 500 1000 1500 2000
May June
July
August September
Fig. 4 Monthly reed canary grass gross primary productivity (GPP) responses to incident photosynthetically active radiation (PAR)
under different soil moisture conditions. Solid circles represent the GPP–PAR response under high soil moisture and open circles under
dry conditions. The fitted curves are the best-fit lines constructed from rectangular hyperbolic nonlinear regression analyses. The results
of the regression analysis are given in Table 1. Only measured data are used in this analysis.
40 N . J . S H U R PA L I et al.
r 2009 The AuthorsJournal compilation r 2009 Blackwell Publishing Ltd, GCB Bioenergy, 1, 35–50

GPP: temperature, VPD and soil moisture
Among the environmental variables, temperature, VPD
and soil moisture constitute an important group of
factors governing CO2 exchange, in addition to incident
PAR. It is difficult to assess the impact of these indivi-
dual factors on GPP as these explaining variables are
often found to exhibit collinearity under field condi-
tions. Therefore, we examined the impact of air tem-
perature and VPD on GPP separately under different
soil moisture classes. For the purpose, we subdivided
the GPP and controlling variable data from each grow-
ing season into May to September monthly datasets,
monthly data were further grouped into four moisture
classes covering a 0.0–0.8 m3 m�3 range in volumetric
surface layer moisture content. Finally, the various
responses presented in Figs 5 and 6 are from periods
when PAR exceeded 1000 mmol m�2 s�1. Note that the
statistically significant GPP–temperature response
curves presented in Fig. 5 are from periods when GPP
did not correlate with VPD. Similarly, VPD–GPP re-
sponse curves in Fig. 6 are from periods when GPP did
not correlate significantly with air temperature.
GPP increased with increasing temperatures. The
relationship between temperature and GPP was ex-
plained by linear and quadratic functions. When soil
moisture was not limiting, GPP increased linearly with-
in a narrower range of temperature variation. However,
when soil moisture was limiting, the air temperature
varied over a wider range. Under these circumstances,
GPP was related to air temperature in a quadratic
relationship, hinting at a peak in GPP at optimum
temperatures within 20–25 1C range. GPP tended to
decrease with any further increase in temperature
above the optimum range (Fig. 6). GPP is known to
decrease with increasing VPD (note the negative sign
convention used for GPP throughout this paper). With
increasing VPD, the plants attempt to restrict moisture
loss through transpiration, especially under soil moist-
ure stress, by closing their stomata. As CO2 also uses the
same pathway for diffusion into the leaves, the rate of
CO2 uptake is drastically reduced. The GPP–VPD re-
sponse curves shown in Fig. 6 show this classical
phenomenon in action in this ecosystem. Similar GPP,
temperature, VPD and soil moisture interactions have
been reported in several ecosystems in previous inves-
tigations [e.g., Wang et al. (2004) in a larch forest in
Japan, Luyssaert et al. (2007) in European pine forests].
TER: temperature, soil moisture, GPP
Although soil temperature is a good indicator of annual
ecosystem respiration, the parameter values derived
from an analysis involving the complete annual data
may not represent the true response to temperature.
TER, which shows large seasonal variations, is a func-
tion of not only temperature but also of plant photo-
synthetic activity, leaf area development, root biomass
and, soil moisture conditions, substrate quality and
other unknown variables. Therefore, with an intention
to examine TER responses to governing variables and
minimize the influence of confounding factors, we
subdivided the annual night-time TER data (estimated
from measured NEE values only) of each year into
growing season (May–September) data and data
outside the growing season (January–April and
October–December). The growing season data were
further subdivided into monthly subsets from May to
Table 1 Seasonal variation in the responses of gross primary productivity (GPP) of reed canary grass on an organic soil to incident
photosynthetically active radiation (PAR) during a wet (2004) and a dry (2005) year
Year Month T VPD y2.5 GPmax a R2
2004 (wet) May 10–15 0.2–1.2 0.6–0.8 �3.1 (0.4) �0.02 (0.06) 0.51
June 15–20 0.1–1.6 0.3–0.7 �29.4 (5.9) �0.03 (0.05) 0.35
July 15–20 0.1–1.0 0.6–0.8 �26.4 (1.9) �0.07 (0.01) 0.56
August 10–15 0.1–0.7 0.5–0.6 �7.1 (0.5) �0.06 (0.02) 0.51
September 10–15 0.1–0.6 0.4–0.6 �5.1 (0.7) �0.03 (0.01) 0.62
2005 (dry) May 10–15 0.1–1.1 0.5–0.7 �1.2 (0.1) �0.08 (0.003) 0.33
June 20–25 1.0–2.0 0.1–0.2 �16.1 (2.9) �0.02 (0.05) 0.40
July 15–20 0.1–1.5 0.0–0.2 �13.5 (0.9) �0.13 (0.03) 0.66
August 10–16 0.1–0.7 0.2–0.4 �6.3 (0.9) �0.08 (0.024) 0.27
September 10–15 0.1–1.2 0.2–0.4 �5.2 (0.4) �0.02 (0.004) 0.60
Results of the nonlinear regression between GPP and PAR are presented. GPP was related to PAR in a rectangular hyperbolic
relation of the form: GPP 5 (GPmax�PAR� a/(GPmax 1 PAR� a)), where GPmax (mmol m�2 s�1) and a are the fitted parameters. Also
shown are the relevant prevalent ranges in environmental variables such as air temperature (T, 1C), vapour pressure deficit (VPD,
kPa) and soil moisture measured at 2.5 cm below the soil surface (Y2.5, m3 m�3). Standard errors of the fitted parameters are shown
brackets. All relationships were statistically significant at Po0.001. Adjusted R2 of regressions are also presented.
C O 2 B A L A N C E O F A B I O E N E R G Y C R O P O N A N O R G A N I C S O I L 41
r 2009 The AuthorsJournal compilation r 2009 Blackwell Publishing Ltd, GCB Bioenergy, 1, 35–50

September and within each month, TER response to soil
temperature (measured at 2 cm) was examined with the
Q10 model within different soil moisture classes (four
classes with a class interval of 0.2 m3 m�3 covering a soil
moisture range of 0–0.8 m3 m�3). Subdividing the data
and parameterising the Q10 model separately for each
subset did reveal a large variation in both Q10 and R10
values (Fig. 7 and Table 2). The monthly Q10 values
VPD (kPa)0.5 1.0 1.5 2.0 0.5 1.0 1.5 2.0
GP
P (
μmol
m–2
s–1
)
–3
–2
–1
0
Wet
VPD (kPa)0.0 0.5 1.0 1.5 2.0 2.5
–30
–20
–10
0
DryWet
VPD (kPa)
–18
–15
–12
–9
Wet
Fig. 6 Monthly reed canary grass gross primary productivity (GPP) responses to vapour pressure deficit (VPD) under different soil moisture
conditions. Solid circles represent the GPP–VPD response under high soil moisture and open circles under dry conditions. The fitted curves are
the best-fit lines constructed from linear regressions between GPP and VPD. See text for more details. The data used in this analysis are from
periods when air temperature had no significant relation with GPP and photosynthetically active radiation values were 41000mmol m�2 s�1.
Temperature (°C)0 5 10 15
GP
P (
μmol
m–2
s–1
)
GP
P (
μmol
m–2
s–1
)
–5
–4
–3
–2
–1
0
WetDry
10 15 20 25 30 10 15 20 25 30–25
–20
–15
–10
–5
0WetDry
–20
–15
–10
–5
0
Dry
–20
–15
–10
–5
DryWet
10 15 20 25 5 10 15 20–10
–8
–6
–4
–2
0
WetDry
Temperature (°C) Temperature (°C)
May Jun
Jul
Aug Sep
Temperature (°C) Temperature (°C)
Fig. 5 Monthly reed canary grass gross primary productivity (GPP) responses to air temperature under different soil moisture
conditions. Solid circles represent the GPP–air temperature response under high soil moisture and open circles under dry conditions. The
fitted curves are the best-fit lines constructed from different regression analyses (linear, exponential and quadratic). See text for more
details. The data used in this analysis are from periods when vapour pressure deficit (VPD) had no significant relation with GPP and
photosynthetically active radiation values were 41000mmol m�2 s�1.
42 N . J . S H U R PA L I et al.
r 2009 The AuthorsJournal compilation r 2009 Blackwell Publishing Ltd, GCB Bioenergy, 1, 35–50
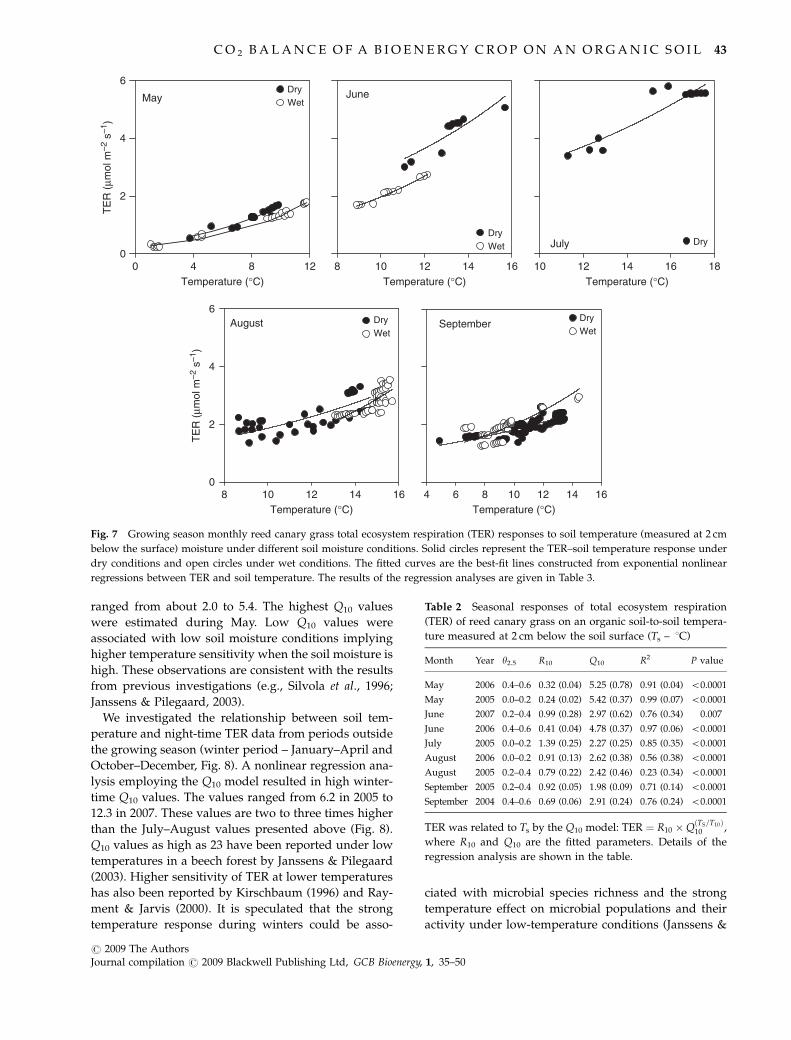
ranged from about 2.0 to 5.4. The highest Q10 values
were estimated during May. Low Q10 values were
associated with low soil moisture conditions implying
higher temperature sensitivity when the soil moisture is
high. These observations are consistent with the results
from previous investigations (e.g., Silvola et al., 1996;
Janssens & Pilegaard, 2003).
We investigated the relationship between soil tem-
perature and night-time TER data from periods outside
the growing season (winter period – January–April and
October–December, Fig. 8). A nonlinear regression ana-
lysis employing the Q10 model resulted in high winter-
time Q10 values. The values ranged from 6.2 in 2005 to
12.3 in 2007. These values are two to three times higher
than the July–August values presented above (Fig. 8).
Q10 values as high as 23 have been reported under low
temperatures in a beech forest by Janssens & Pilegaard
(2003). Higher sensitivity of TER at lower temperatures
has also been reported by Kirschbaum (1996) and Ray-
ment & Jarvis (2000). It is speculated that the strong
temperature response during winters could be asso-
ciated with microbial species richness and the strong
temperature effect on microbial populations and their
activity under low-temperature conditions (Janssens &
Temperature (°C)0 4 8 12
TE
R (
μmol
m–2
s–1
)
TE
R (
μmol
m–2
s–1
)
0
2
4
6DryWet
8 10 12 14 16
DryWet
10 12 14 16 18
Dry
0
2
4
6DryWet
8 10 12 14 16 4 6 8 10 12 14 16
DryWet
Temperature (°C) Temperature (°C)
JuneMay
July
August September
Temperature (°C) Temperature (°C)
Fig. 7 Growing season monthly reed canary grass total ecosystem respiration (TER) responses to soil temperature (measured at 2 cm
below the surface) moisture under different soil moisture conditions. Solid circles represent the TER–soil temperature response under
dry conditions and open circles under wet conditions. The fitted curves are the best-fit lines constructed from exponential nonlinear
regressions between TER and soil temperature. The results of the regression analyses are given in Table 3.
Table 2 Seasonal responses of total ecosystem respiration
(TER) of reed canary grass on an organic soil-to-soil tempera-
ture measured at 2 cm below the soil surface (Ts – 1C)
Month Year y2.5 R10 Q10 R2 P value
May 2006 0.4–0.6 0.32 (0.04) 5.25 (0.78) 0.91 (0.04) o0.0001
May 2005 0.0–0.2 0.24 (0.02) 5.42 (0.37) 0.99 (0.07) o0.0001
June 2007 0.2–0.4 0.99 (0.28) 2.97 (0.62) 0.76 (0.34) 0.007
June 2006 0.4–0.6 0.41 (0.04) 4.78 (0.37) 0.97 (0.06) o0.0001
July 2005 0.0–0.2 1.39 (0.25) 2.27 (0.25) 0.85 (0.35) o0.0001
August 2006 0.0–0.2 0.91 (0.13) 2.62 (0.38) 0.56 (0.38) o0.0001
August 2005 0.2–0.4 0.79 (0.22) 2.42 (0.46) 0.23 (0.34) o0.0001
September 2005 0.2–0.4 0.92 (0.05) 1.98 (0.09) 0.71 (0.14) o0.0001
September 2004 0.4–0.6 0.69 (0.06) 2.91 (0.24) 0.76 (0.24) o0.0001
TER was related to Ts by the Q10 model: TER ¼ R10 �QðTS=T10Þ10 ,
where R10 and Q10 are the fitted parameters. Details of the
regression analysis are shown in the table.
C O 2 B A L A N C E O F A B I O E N E R G Y C R O P O N A N O R G A N I C S O I L 43
r 2009 The AuthorsJournal compilation r 2009 Blackwell Publishing Ltd, GCB Bioenergy, 1, 35–50

Pilegaard, 2003). The amount of microbial biomass
carbon in the surface (0–5 cm) soil layer was found to
be significantly higher during spring than during the
rest of the growing season at this study site (N. Pekkar-
inen, personal communication).
Ecosystem respiration as measured by the EC techni-
que includes autotrophic and heterotrophic respiration.
The autotrophic respiration in turn is a combined
process resulting from respiratory losses associated
with aboveground plant parts, roots and rhizosphere.
Gross primary production which is responsible for the
growth and development of plant structural elements
has been hypothesized to be one of the factors driving
ecosystem respiration (Janssens et al., 2002). With this in
view, we examined how the daily rates of TER and GPP
correlate with each other in this ecosystem during
different measurement years. A highly significant
(Po0.0001) positive correlation existed between TER
and GPP during each of the four measurement years.
GPP explained 70% or more of the variation in TER
during 2005, 2006 and 2007, while it could explain only
45% of the variation during 2004. These results seem to
suggest that TER is closely coupled to GPP during drier
years, whereas under high soil moisture conditions, the
two processes are decoupled. This could be attributed
to the differences in how the two processes respond to
soil moisture and temperature. As explained in the
sections above, high photosynthetic rates are favoured
and respiration is inhibited under high soil moisture
conditions. On the contrary, respiratory losses are high-
er and uptake is restricted during drier and warmer
conditions. The relative responses of the individual
processes to the prevailing environmental conditions
are different. The change in respiration rates to a given
variation in moisture level in this ecosystem is moder-
ate. However, change in GPP to a similar change in
moisture level is drastic.
Diurnal patterns of net ecosystem CO2 exchange
In an attempt to understand the interannual variation in
CO2 exchange patterns on a diurnal scale from the RCG
cultivation system, we generated mean diurnal patterns
during peak RCG photosynthetic activity in each mea-
surement year (2004–2007). A uniform averaging period
(from June 15 to July 20) to encompass the maximum
uptake and loss rates from different years was consid-
ered for the purpose. There were large differences
among years in mean diurnal NEE patterns (Fig. 9).
The mean maximum NEE value in 2004 was about
�18.0 mmol m�2 s�1, while it was �8.8, �11.1 and �15.0
mmol m�2 s�1 in 2005, 2006 and 2007, respectively. Also,
the timing of peak NEE during the day was different in
different years. On a mean diurnal basis, NEE peaked at
midday in 2004, around 1400 h in 2007 and at 800 and
900 h in 2005 and 2006, respectively (Fig. 9). There were
no clear differences among years in the mean maximum
night-time NEE values. On an average, the mean max-
imum CO2 losses during 2004–2007 ranged from 3.9 to
7.2mmol m�2 s�1.
Lohila et al. (2004) measured using EC technique CO2
exchange from perennial forage grasses on peat soils in
southern Finland. They reported maximum C uptake
and loss values of approximately �17 and 8mmol m�2
s�1, respectively, during the active growing season in
2002. Multiyear C exchange data from a Canadian
grassland reported by Flanagan et al. (2002) are within
the range of values observed in this study. The mean
maximum NEE values reported by them ranged from
�14 mmol m�2 s�1 in a wet year to �5 mmol m�2 s�1 in a
dry year. While the maximum ecosystem respiration
(7 mmol m�2 s�1) measured using chamber method by
Maljanen et al. (2001) from a grassland on an organic
soil in eastern Finland is comparable to peak TER rates
at our study site, the peak uptake rate (2.5mmol m�2 s�1)
reported in their study is lower compared with RCG
peak daytime NEE ported above. Nieveen et al. (2005)
measured carbon exchange from a grazed pasture on a
drained peat soil in New Zealand and recorded a peak
uptake of �17.2mmol m�2 s�1 and a maximum night-
time respiration value of 8mmol m�2 s�1 during the 2002
growing season. Compared with an agroecosystem, the
uptake and respiration rates measured at our study site
are substantially smaller (e.g., irrigated and rain fed
Temperature (°C)–2 0 2 4 6 8 10 12
Win
ter
TE
R (
μmol
m–2
s–1
)
0.0
0.5
1.0
1.5
2.0
2.5
2004200520062007
Fig. 8 Winter time (January–April and October–December)
reed canary grass total ecosystem respiration (TER) responses
to soil temperature (measured at 2 cm below the surface) during
2004, 2005, 2006 and 2007. The fitted curves are the best-fit lines
constructed from nonlinear regressions between TER and soil
temperature: TER ¼ R10 �QðTS=T10Þ10 , where R10 and Q10 are the
fitted parameters. Details of the regression analysis are also
shown in the figure. The presented regression analysis were
significant at Po0.0001.
44 N . J . S H U R PA L I et al.
r 2009 The AuthorsJournal compilation r 2009 Blackwell Publishing Ltd, GCB Bioenergy, 1, 35–50

Net
eco
syst
em C
O2
exch
ange
(NE
E)
(mg
m–2
s–1
)
–20
–10
0
10
2004200520062007
Pho
tosy
nthe
tical
ly a
ctiv
e ra
diat
ion
(PA
R)
(μm
ol m
–2 s
–1)
0
400
800
1200
1600
Air
tem
pera
ture
(°C
)
0
5
10
15
20
25
Time of the day0 4 8 12 16 20 24
Vap
or p
ress
ure
defic
it (k
Pa)
0.0
0.4
0.8
1.2
1.6
Fig. 9 Interannual variation in the mean diurnal pattern of net ecosystem CO2 exchange (NEE) during peak photosynthetic activity
(June 15–July 20) of reed canary grass cultivated on a cutover peatland in eastern Finland. Also shown are the prevalent environmental
variables when the NEE measurements were made. Values represent the mean � SE, n 5 35.
C O 2 B A L A N C E O F A B I O E N E R G Y C R O P O N A N O R G A N I C S O I L 45
r 2009 The AuthorsJournal compilation r 2009 Blackwell Publishing Ltd, GCB Bioenergy, 1, 35–50

maize-based cropping systems studied by Verma et al.,
2005). The peak day and night-time NEE values pre-
sented in this paper are comparable to CO2 uptake and
loss rates from spruce forests on podzols in Sweden
(Lindroth et al., 2008).
The interannual variations in diurnal patterns are
associated with changes in precipitation, soil moisture,
air temperature, PAR levels and VPD during 06:00 and
18:00 hours. During wet years, due to sustained cloudy
conditions and well-distributed rain events during the
growing season, the soil moisture was generally non-
limiting, the PAR levels were low, air temperatures
were moderate and the evaporative demand was low
(Figs 2 and 3). These conditions seemed to have fa-
voured a high C uptake by RCG. RCG is known to be a
flood and cold tolerant species capable of accumulating
large biomass on organic soils. Coops et al. (1996) found
in a water-depth gradient experiment that RCG grew
well when the water table was close to the surface and
that the biomass of RCG was significantly reduced
when the water table was 30 cm below the soil surface.
Kellogg et al. (2003) observed a high rate of RCG
germination under flooded conditions than under other
hydrological treatments (leading to lower soil moisture
conditions) in their experiment. They also found that
the RCG seedling mass was higher in soils with high
organic content.
In contrast, due to long dry spells and generally clear
sky conditions during dry years, soil moisture was
limiting, PAR levels, air temperature and VPD after
late-morning hours were generally higher. Soil moisture
at both 2.5 and 10 cm depths were low during the peak
growing seasons in 2005 and 2006 (Fig. 3). As RCG
prefers high soil moisture conditions, it develops a
shallow root system. Based on RCG biomass measure-
ments made at our site during 2006 and 2007 seasons,
we found that nearly 95% of the RCG roots are found in
the upper 15 cm soil depth. Therefore, owing to a
shallow root system and higher evaporative demand
during most of the daytime in dry years, RCG closes its
stomata to restrict the excessive water loss and in the
process, C uptake is drastically reduced. The peak
NEE during 2005 was less than half the peak rate in
2004 (Fig. 10). The soil moisture at 30 cm below the soil
Date (d/m/yy)1/1/04 1/7/04 1/1/05 1/7/05 1/1/06 1/7/06 1/1/07 1/7/07 1/1/08
Net
eco
syst
em C
O2
exch
ange
(NE
E, g
C m
–2 d
ay–1
)
–12
–8
–4
0
4
CO
2 ex
chan
ge (
g C
m–2
day
–1)
–20
–15
–10
–5
0
5
10
GPPTER
(a)
(b)
Fig. 10 Daily distribution of (A) gross primary productivity (GPP) and total ecosystem respiration (TER) and (B) net ecosystem CO2
exchange (NEE) during 2004–2007 from reed canary grass cultivation on a cutover peatland in eastern Finland.
46 N . J . S H U R PA L I et al.
r 2009 The AuthorsJournal compilation r 2009 Blackwell Publishing Ltd, GCB Bioenergy, 1, 35–50
surface was near saturation even during dry years.
However, it appears that the water at this depth re-
mained inaccessible to the shallow roots of RCG.
Daily, seasonal and annual CO2 exchange
The daily variation in CO2 exchange during the grow-
ing season was regulated by variations in soil moisture
in the uppermost soil layers as affected by rainfall
amount and its distribution, incident light, air and soil
temperature and VPD (see the sections above for a
discussion on the factors controlling C exchange). The
number of days during which the ecosystem was a net
sink for atmospheric CO2 varied from year to year. It
was 71 days in 2004, 88 days in 2005, 66 days in 2006
and 96 days in 2007. Despite the smaller number of days
of sink strength in 2004, the net uptake during this
season was the highest. This is indicative of the high
potential of RCG as a bioenergy crop in fixing the
atmospheric C, given the high soil moisture regime
and proper atmospheric conditions (such as low to
moderate temperatures, low VPD and high PAR levels).
Peak daily rates of GPP were high during wet years
than during drier ones. The maximum daily GPP value
in 2004 was�15.8,�11.9 g C m�2 day�1 in 2007, whereas
the peak values were �8.5, �9.8 g C m�2 day�1 in 2005
and 2006, respectively (Fig. 10). The peak GPP occurred
during mid July in 2004, early July in 2005 and 2007 and
late June in 2006. Maximum daily ecosystem respiration
(TER) rates in 2004, 2005, 2006 and 2007 were 7.6, 7.1, 5.3
and 6.3 g C m�2 day�1, respectively (Fig. 10). Corre-
sponding peak NEE rates were �9.6, �4.5, �5.5 and
�7.5 g C m�2 day�1. Maximum NEE occurred during
mid July in 2004, early July in 2005 and 2007 and late
June in 2006. Flanagan et al. (2002) observed in their
study that the year with peak daytime NEE was also the
year with peak night-time NEE. However, we did not
find such consistent pattern in CO2 uptake and its loss.
While the peak daytime NEE was the highest in 2004,
the maximum night-time NEE was the highest in 2006.
This might be a typical characteristic of cultivations on
organic soils, because a lot of respiration might come
from old carbon, not related to recent assimilation.
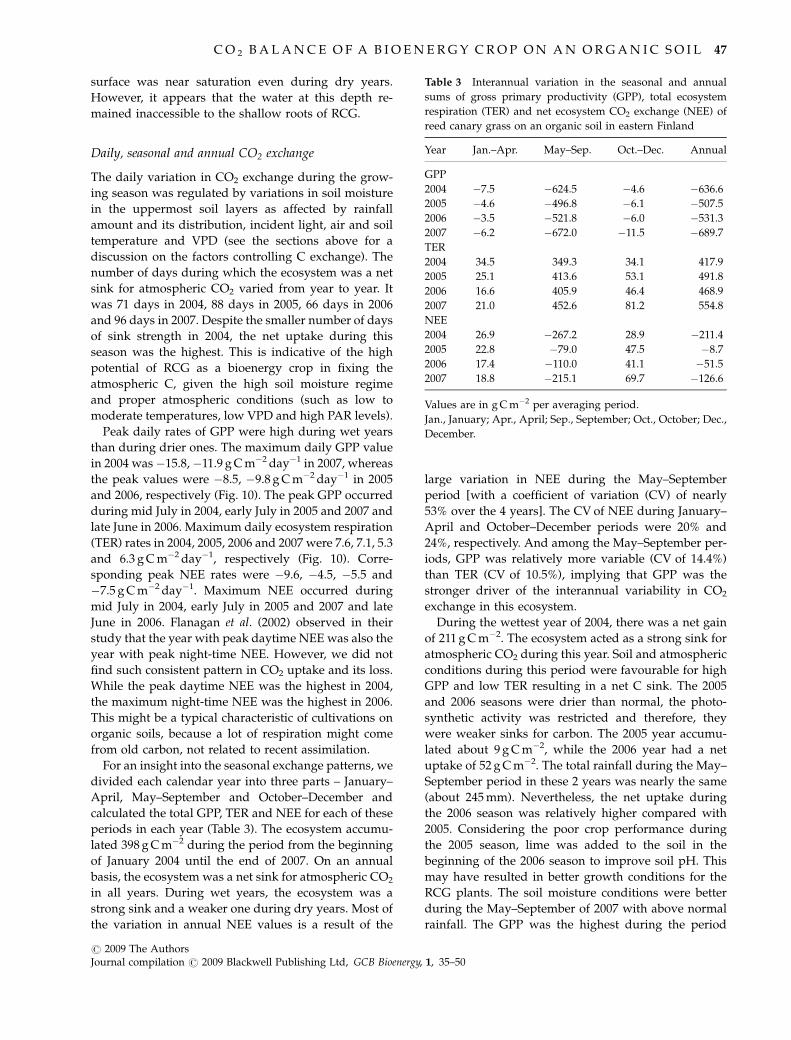
For an insight into the seasonal exchange patterns, we
divided each calendar year into three parts – January–
April, May–September and October–December and
calculated the total GPP, TER and NEE for each of these
periods in each year (Table 3). The ecosystem accumu-
lated 398 g C m�2 during the period from the beginning
of January 2004 until the end of 2007. On an annual
basis, the ecosystem was a net sink for atmospheric CO2
in all years. During wet years, the ecosystem was a
strong sink and a weaker one during dry years. Most of
the variation in annual NEE values is a result of the
large variation in NEE during the May–September
period [with a coefficient of variation (CV) of nearly
53% over the 4 years]. The CV of NEE during January–
April and October–December periods were 20% and
24%, respectively. And among the May–September per-
iods, GPP was relatively more variable (CV of 14.4%)
than TER (CV of 10.5%), implying that GPP was the
stronger driver of the interannual variability in CO2
exchange in this ecosystem.
During the wettest year of 2004, there was a net gain
of 211 g C m�2. The ecosystem acted as a strong sink for
atmospheric CO2 during this year. Soil and atmospheric
conditions during this period were favourable for high
GPP and low TER resulting in a net C sink. The 2005
and 2006 seasons were drier than normal, the photo-
synthetic activity was restricted and therefore, they
were weaker sinks for carbon. The 2005 year accumu-
lated about 9 g C m�2, while the 2006 year had a net
uptake of 52 g C m�2. The total rainfall during the May–
September period in these 2 years was nearly the same
(about 245 mm). Nevertheless, the net uptake during
the 2006 season was relatively higher compared with
2005. Considering the poor crop performance during
the 2005 season, lime was added to the soil in the
beginning of the 2006 season to improve soil pH. This
may have resulted in better growth conditions for the
RCG plants. The soil moisture conditions were better
during the May–September of 2007 with above normal
rainfall. The GPP was the highest during the period
Table 3 Interannual variation in the seasonal and annual
sums of gross primary productivity (GPP), total ecosystem
respiration (TER) and net ecosystem CO2 exchange (NEE) of
reed canary grass on an organic soil in eastern Finland
Year Jan.–Apr. May–Sep. Oct.–Dec. Annual
GPP
2004 �7.5 �624.5 �4.6 �636.6
2005 �4.6 �496.8 �6.1 �507.5
2006 �3.5 �521.8 �6.0 �531.3
2007 �6.2 �672.0 �11.5 �689.7
TER
2004 34.5 349.3 34.1 417.9
2005 25.1 413.6 53.1 491.8
2006 16.6 405.9 46.4 468.9
2007 21.0 452.6 81.2 554.8
NEE
2004 26.9 �267.2 28.9 �211.4
2005 22.8 �79.0 47.5 �8.7
2006 17.4 �110.0 41.1 �51.5
2007 18.8 �215.1 69.7 �126.6
Values are in g C m�2 per averaging period.
Jan., January; Apr., April; Sep., September; Oct., October; Dec.,
December.
C O 2 B A L A N C E O F A B I O E N E R G Y C R O P O N A N O R G A N I C S O I L 47
r 2009 The AuthorsJournal compilation r 2009 Blackwell Publishing Ltd, GCB Bioenergy, 1, 35–50

among all years. However, TER was also the highest
during this period. Higher rates of CO2 uptake were
offset by high rates of CO2 loss and therefore, this
period in 2007 accumulated less C than the 2004 season.
While TER is more or less similar during January–April
and October–December period over the years, TER
during the May–September period showed an increas-
ing trend from 2004 to 2007. RCG is cultivated in the
region as a perennial crop and therefore has the ten-
dency to develop increasing rootstocks over the succes-
sive cultivation years. Autotrophic respiration and root
respiration, in particular, seems to be a dominant com-
ponent in TER at our study. In view of this, increasing
TER trend from 2004 to 2007 is not unexpected.
To our knowledge, this is the first study that reports
interannual variations in C exchange from a perennial
bioenergy crop cultivation. Therefore, we are not aware
of any other studies with which we could compare our
observed C exchange rates. Nevertheless, we can com-
pare the values reported in this paper with C exchange
rates from grasslands, for example on organic and other
soil types in Finland and elsewhere. Lohila et al. (2004)
made EC measurements of CO2 exchange from barley
and perennial grass on an organic soil in southern
Finland and reported net annual CO2 losses of the order
of 210 and 79 g C m�2, respectively. Maljanen et al. (2004)
measured NEE using chambers in organic agricultural
soils in western Finland cultivated with forage grass
and barley with a fertilization rate of 100 kg N ha�1 (and
an additional application of farmyard manure for the
grassland site). They found that both sites were net
sources of CO2 to the atmosphere (830 and 330 g C m�2
ha�1). Such high net emissions on an annual basis as
opposed to net C uptake by RCG at our study site could
be attributed to high fertilizer input, regular soil tillage
and lower photosynthetic capacity of the vegetation at
their site. It is noteworthy that for a complete green-
house gas balance of the RCG cultivation system, not
only is the quantification of CO2 balance necessary but
also of the CH4 and N2O emissions.
Net biome productivity (NBP)
NBP in the context of this study refers to the net
ecosystem CO2 exchange after the CO2 losses due to
removal of the biomass from the ecosystem in harvest
have been accounted for. The RCG crop yield for the
2004 season (harvested in spring of 2005) was 3.7 tonne
ha�1. The yield values for the 2005, 2006 and 2007
seasons were 2.0, 3.6 and 4.7 tonne ha�1, respectively.
Accounting for an average moisture content of 17.5%
and carbon content of 45.8% (Vapo Ltd. Energy, 2003),
the corresponding seasonal biomass yields amount to
140, 76, 136 and 181 g C m�2. An annual NEE of �211 g
C m�2 in 2004 reduces to an NBP of �71 g C m�2 after
subtracting the biomass yield value of 140 g C m�2 from
the NEE value (Fig. 11). Similarly, NBP values for the
2005, 2006 and 2007 seasons were estimated to be 56, 85
and 31 g C m�2, respectively. It is interesting to note that
NBP in 2004 is negative. This implies that even after
accounting for the carbon in the harvested biomass,
there is still some amount of fixed C left in the ecosys-
tem and is sequestered in the soil during a wet year
such as 2004. NBP values are positive during 2005, 2006
and 2007 seasons. During such dry years, the ecosystem
becomes a source of carbon to the atmosphere after
accounting for the C losses due to biomass harvest.
Based on the NBP analysis, 2005 was a smaller source
compared with 2006. NEE was less negative during
2005 and the harvested biomass was also low during
this season. Despite a high net uptake during 2006, it
was a bigger C source because of the high biomass
yield.
Concluding remarks
On the one hand, global organic soils have been con-
sidered to be too risky to grow bioenergy crops. And on
the other, in the northern countries such as Sweden and
Finland, perennial grass species are recommended to be
cultivated on drained organic soils for biomass produc-
tion with clear advantages. Therefore, our objective in
initiating this pioneering study was to understand how
the cultivation of a perennial bioenergy crop such as
RCG impacts the net CO2 balance of a drained organic
soil (a cutover peatland site abandoned after peat
extraction). Based on the four years of continuous CO2
balance measurements, we conclude that during wet
years, the RCG cultivation system acts as a distinct sink
Year2004 2004 2005 2005 2006 2006 2007 2007 2008
C e
xcha
nge
(kg
ha–1
a–1
)
–6000
–4000
–2000
0
2000
4000
GPPTERNEEYieldNBP
Fig. 11 Interannual variation in the annual carbon uptake
(GPP), loss (TER), net ecosystem CO2 exchange, economic yield
and net biome productivity (NBP) of reed canary grass cultiva-
ted on an organic soil in eastern Finland during 2004–2007. GPP,
gross primary productivity; TER, total ecosystem respiration.
48 N . J . S H U R PA L I et al.
r 2009 The AuthorsJournal compilation r 2009 Blackwell Publishing Ltd, GCB Bioenergy, 1, 35–50

for atmospheric C. During dry years, however, the
ecosystem acts as a weaker sink bordering the sink-
source line (considering a general uncertainty level of
� 50 g C m�2 in EC measurements – Baldocchi, 2003).
We also found that the net carbon balance after account-
ing for the harvested biomass was still a net carbon sink
during wet years, implying that a part of the captured
carbon is left over in the ecosystem. Thus, the RCG
cultivation was more than a ‘carbon-neutral’ system.
According to the 2007 IPCC report, regions in the high
latitudes have been projected to receive over 20% higher
annual precipitation and therefore, a higher frequency
of wet years under the changed climate (Meehl et al.,
2007). Therefore, the capacity of the RCG cultivation to
act as a carbon sink would increase in future climatic
conditions.
The results from this study have positive implications
for the use of RCG as a bioenergy crop on organic soils.
The results based on the net CO2 balance alone provide
a strong evidence to suggest that the cultivation of RCG
on such problematic soils is a promising land use
option. The annual NEE of the peat soil growing RCG
during the entire study period ranged from �9 to �211
g Cm�2yr�1. Furthermore, during wet years, the eco-
system was still a C sink even after accounting for the
harvested biomass C. These results highlight for the
first time that a perennial bioenergy crop such as reed
canary grass can be cultivated successfully on an or-
ganic soil to mitigate CO2 loss.
Acknowledgements
We dedicate this article to the fond memory of Jari T. Huttu-nen (3 April 1970–28 December 2008) who was not only acolleague but also a great friend. He will be ever rememberedfor his keen sense of observation, attention to detail and a greatsense of humour. This work was made possible by the fundingfrom the Finnish Funding Agency for Technology and Innova-tion (Tekes) and Eastern Finland University. Excellent supportfrom Alpo Hassinen and Matti Lemettinen of Mekrijarvi Re-search Station, Ilomantsi, eastern Finland is highly appreciated.We thank Jorma Nuutinen and many other field staff for theirhelp in field data collection. Finally, we express our thanks to thetwo anonymous reviewers and editor for an expeditious reviewprocess.
References
Baldocchi DD (2003) Assessing ecosystem carbon balance: pro-
blems and prospects of the eddy covariance technique. Global
Change Biology, 9, 479–492.
Burvall J (1997) Influence of harvest time and soil type on fuel
quality in reed canary grass (Phalaris arundinacea L.). Biomass
and Bioenergy, 12, 149–154.
Coops H, van den Brink FWB, van der Velde G (1996) Growth
and morphological responses of four helophyte species in an
experimental water-depth gradient. Aquatic Botany, 54, 11–24.
Drebs A, Nordlund A, Karlsson P, Helminen J, Rissanen P (2002)
Climatological Statistics of Finland 1971–2000 (pp. 1–95. Meteor-
ological Research and Basic Weather Services, Finnish Meteor-
ological Institute, Helsinki.
Finell M, Nilsson C (2005) Variations in ash content, pulp yield,
and fibre properties of reed canarygrass. Industrial Crops and
Products, 22, 157–167.
Flanagan LB, Wever LA, Carson PJ (2002) Seasonal and inter-
annual variation in carbon dioxide exchange and carbon
balance in a northern temperate grassland. Global Change
Biology, 8, 599–615.
IPCC (2007) Climate change 2007: the physical science basis. In:
Contribution of Working Group I to the Fourth Assessment Report
of the Intergovernmental Panel on Climate Change (eds Solomon S,
Qin D, Manning M, Chen Z, Marquis M, Averyt KB, Tignor M,
Miller HL), Cambridge University Press, Cambridge, UK,
pp. 1–996.
Janssens IA, Lankreijer H, Matteucci G et al. (2002) Productivity
overshadows temperature in determining soil and ecosystem
respiration across European forests. Global Change Biology, 7,
269–278.
Janssens IA, Pilegaard K (2003) Large seasonal changes in Q10 of
soil respiration in a beech forest. Global Change Biology, 9, 911–
918.
Kasimir-Klemedtsson A, Klemedtsson L, Berglund K, Martikai-
nen PJ, Silvola J, Oenema O (1997) Greenhouse gas emissions
from farmed organic soils: a review. Soil Use and Management,
13, 245–250.
Kellogg CH, Bridgham SD, Leicht SA (2003) Effects of water
level, shade and time on germination and growth of fresh-
water marsh plants along a simulated successional gradient.
Journal of Ecology, 91, 274–282.
Kirschbaum MUF (1996) The temperature dependence of soil
organic matter decomposition, and the effect of global warm-
ing on soil organic C storage. Soil Biology and Biochemistry, 27,
753–760.
Landstrom S, Lomakka L, Andersson S (1996) Harvest in spring
improves yield and quality of reed canary grass as a bioenergy
crop. Biomass and Bioenergy, 11, 333–341.
Larson ED (2006) A review of life-cycle analysis studies on liquid
biofuel systems for the transport sector. Energy for Sustainable
Development, 10, 109–126.
Lewandowski I, Scurlock JMO, Lindvall E, Christou M (2003)
The development and current status of perennial rhizomatous
grasses as energy crops in the US and Europe. Biomass and
Bioenergy, 25, 335–361.
Lindroth A, Klemedtsson A, Grelle A, Weslien P, Langvall O
(2008) Measurement of net ecosystem exchange, productivity
and respiration in three spruce forests in Sweden shows
unexpectedly large soil carbon losses. Biogeochemistry, 89,
43–60.
Lloyd J, Taylor JA (1994) On the temperature dependence of soil
respiration. Functional Ecology, 8, 315–323.
Lohila A, Aurela M, Tuovinen JP, Laurila T (2004) Annual CO2
exchange of a peat field growing spring barleys or perennial
C O 2 B A L A N C E O F A B I O E N E R G Y C R O P O N A N O R G A N I C S O I L 49
r 2009 The AuthorsJournal compilation r 2009 Blackwell Publishing Ltd, GCB Bioenergy, 1, 35–50

forage grass. Journal of Geophysical Research, 109, D18116,
doi: 10.1029/2004JD004715.
Luyssaert S, Janssens IA, Sulkava M et al. (2007) Photosynthesis
drives anomalies in net carbon-exchange of pine forests at
different latitudes. Global Change Biology, 13, 2110–2127.
Makiranta P, Hytonen J, Aro L et al. (2007) Soil greenhouse gas
emissions from afforested organic soil croplands and cutaway
peatlands. Boreal Environmental Research, 12, 159–175.
Maljanen M, Komulainen V-M, Hytonen J, Martikainen PJ, Laine
J (2004) Carbon dioxide, nitrous oxide and methane dynamics
in boreal organic agricultural soils with different soil manage-
ment. Soil Biology and Biochemistry, 36, 1801–1808.
Maljanen M, Liikanen A, Silvola J, Martikainen PJ (2003) Mea-
suring N2O emissions from organic soils with closed chamber
or soil/snow N2O gradient methods. European Journal of Soil
Science, 54, 625–631.
Maljanen M, Martikainen PJ, Aaltonen H, Silvola J (2002) Short-
term variation in fluxes of carbon dioxide, nitrous oxide and
methane in cultivated and forested organic boreal soils. Soil
Biology and Biochemistry, 34, 577–584.
Maljanen M, Martikainen PJ, Walden J, Silvola J (2001) CO2
exchange in an organic field growing barley or grass in eastern
Finland. Global Change Biology, 7, 679–692.
Mauder M, Foken T, Bernhofer C et al. (2007) Quality control of
CarboEurope-IP flux data. Part II: intercomparison of eddy-
covariance software. Biogeosciences Discussion, 4, 4067–4099.
Meehl GA, Stocker TF, Collins WD et al. (2007) Global climate
projections. In: Climate Change 2007: The Physical Science Basis.
Contribution of Working Group I to the Fourth Assessment Report
of the Intergovernmental Panel on Climate Change (eds Solomon S,
Qin D, Manning M, Chen Z, Marquis M, Averyt KB, Tignor M,
Miller HL), Cambridge University Press, Cambridge, United
Kingdom and New York, NY, USA.
Minkkinen K, Korhonen R, Savolainen T, Laine J (2002) Carbon
balance and radiative forcing of Finnish peatlands 1900–2100 – the
impact of forestry drainage. Global Change Biology, 8, 785–799.
Moffat AM, Papale D, Reichstein M et al. (2007) Comprehensive
comparison of gap filling techniques for eddy covariance net
carbon fluxes. Agricultural and Forest Meteorology, 147, 209–232.
Moore CJ (1986) Frequency response corrections for eddy corre-
lation systems. Boundary-Layer Meteorology, 37, 17–35.
Nieveen JP, Campbell DI, Schipper LA, Blair IJ (2005) Carbon
exchange of grazed pasture on a drained peat soil. Global
Change Biology, 11, 607–618.
Nykanen H, Alm J, Lang K, Silvola J, Martikainen PJ (1995) Emis-
sions of CH4, N2O and CO2 from a virgin fen and a fen drained for
grassland in Finland. Journal of Biogeography, 22, 351–357.
OECD (2007) Biofuels: Is the Cure Worse than the Disease? OECD
Sustainable Development Studies. OECD Publications, Paris.
Rayment MB, Jarvis PG (2000) Temporal and spatial variation of
soil CO2 efflux in a Canadian boreal forest. Soil Biology and
Biochemistry, 32, 35–45.
Reichstein M, Falge E, Baldocchi D et al. (2005) On the separation
of net ecosystem exchange into assimilation and ecosystem
respiration: review and improved algorithm. Global Change
Biology, 11, 1–16.
Sahramaa M (2004) Evaluating germplasm of reed canarygrass,
Phalaris arundinacea L. Unpublished PhD thesis, University of
Helsinki, Helsinki, 47 pp.
Silvola J, Alm J, Ahlholm U, Nykanen H, Martikainen PJ (1996)
The contribution of plant roots to CO2 fluxes from organic
soils. Biology and Fertility of Soils, 23, 126–131.
Sundh I, Nilsson M, Mikkela C, Granberg G, Svensson BH (2000)
Fluxes of methane and carbon dioxide on peat-mining areas in
Sweden. Ambio, 29, 499–503.
Turunen J, Tomppo E, Tolonen K, Reinikainen A (2002) Estimat-
ing carbon accumulation rates of undrained mires in Finland:
application to boreal and subarctic regions. Holocene, 12, 69–80.
Vapo Ltd. Energy (2003) Monitoring programme for the use, treat-
ment and leaching of elements from peat extraction areas of the
North Karelian Regional Environment Centre, Vapo Ltd. Energy,
Eastern Finland, 19 pp. (in Finnish).
Venendaal R, J�rgensen U, Foster CA (1997) European energy
crops: a synthesis. Biomass and Bioenergy, 13, 147–185.
Verma SB, Dobermann A, Cassman KG et al. (2005) Annual
carbon dioxide exchange in irrigated and rainfed maize-based
agroecosystems. Agricultural and Forest Meteorology, 131,
77–96.
Waddington JM, Warner KD, Kennedy GW (2002) Cutover peat-
lands: a persistent source of atmospheric CO2. Global Biogeo-
chemical Cycles, 16, doi: 10.1029/2001GB001398.
Wang H, Saigusa N, Yamamoto S, Kondo H, Horano T, Toriyamo
A, Fujinuma Y (2004) Net ecosystem CO2 exchange over a
larch forest in Hokkaido, Japan. Atmospheric Environment, 38,
7021–7032.
Webb EK, Pearman GI, Leuning R (1980) Correction of flux
measurements for density effects due to heat and water
vapour transfer. Quarterly Journal of Royal Meteorological
Society, 106, 85–100.
50 N . J . S H U R PA L I et al.
r 2009 The AuthorsJournal compilation r 2009 Blackwell Publishing Ltd, GCB Bioenergy, 1, 35–50
Related Documents


