CTC 475 Review CTC 475 Review Time Value of Money Time Value of Money Cash Flow Diagrams/Tables Cash Flow Diagrams/Tables Cost Definitions: Cost Definitions: Life-Cycle Costs Life-Cycle Costs Past and Sunk Costs Past and Sunk Costs Future & Opportunity costs Future & Opportunity costs Direct and Indirect Costs Direct and Indirect Costs Average and Marginal Costs Average and Marginal Costs Fixed and Variable Costs Fixed and Variable Costs

CTC 475 Review Time Value of Money Cash Flow Diagrams/Tables Cost Definitions: Life-Cycle Costs Life-Cycle Costs Past and Sunk Costs Past and Sunk.
Jan 02, 2016
Welcome message from author
This document is posted to help you gain knowledge. Please leave a comment to let me know what you think about it! Share it to your friends and learn new things together.
Transcript
CTC 475 Review CTC 475 Review
Time Value of MoneyTime Value of Money Cash Flow Diagrams/TablesCash Flow Diagrams/Tables Cost Definitions:Cost Definitions:
Life-Cycle CostsLife-Cycle Costs Past and Sunk CostsPast and Sunk Costs Future & Opportunity costsFuture & Opportunity costs Direct and Indirect CostsDirect and Indirect Costs Average and Marginal CostsAverage and Marginal Costs Fixed and Variable CostsFixed and Variable Costs
CTC 475 CTC 475
Breakeven AnalysesBreakeven Analyses
ObjectivesObjectives
Know how to recognize and solve Know how to recognize and solve breakeven analysis problems:breakeven analysis problems:
Maximize profitMaximize profit Minimize costsMinimize costs Maximize revenuesMaximize revenues Determine breakeven valuesDetermine breakeven values Determine average costsDetermine average costs

Fixed and Variable Costs Fixed and Variable Costs
Fixed costs Fixed costs do notdo not vary in proportion to the vary in proportion to the quantity of output:quantity of output: InsuranceInsurance Building depreciationBuilding depreciation Some utilities Some utilities
Variable costs vary in proportion to quantity of Variable costs vary in proportion to quantity of outputoutput Direct LaborDirect Labor Direct MaterialDirect Material

Fixed & Variable CostsFixed & Variable Costs
Fixed costs are expressed as one numberFixed costs are expressed as one number $200 $200
Variable costs are expressed as an Variable costs are expressed as an amount per unitamount per unit $10 per unit$10 per unit

Total Costs (TC)Total Costs (TC)
Total Costs (TC) at a unit of production = Total Costs (TC) at a unit of production =
Fixed Costs (FC) + Fixed Costs (FC) +
Variable Costs (VC) * # of Units ProducedVariable Costs (VC) * # of Units Produced
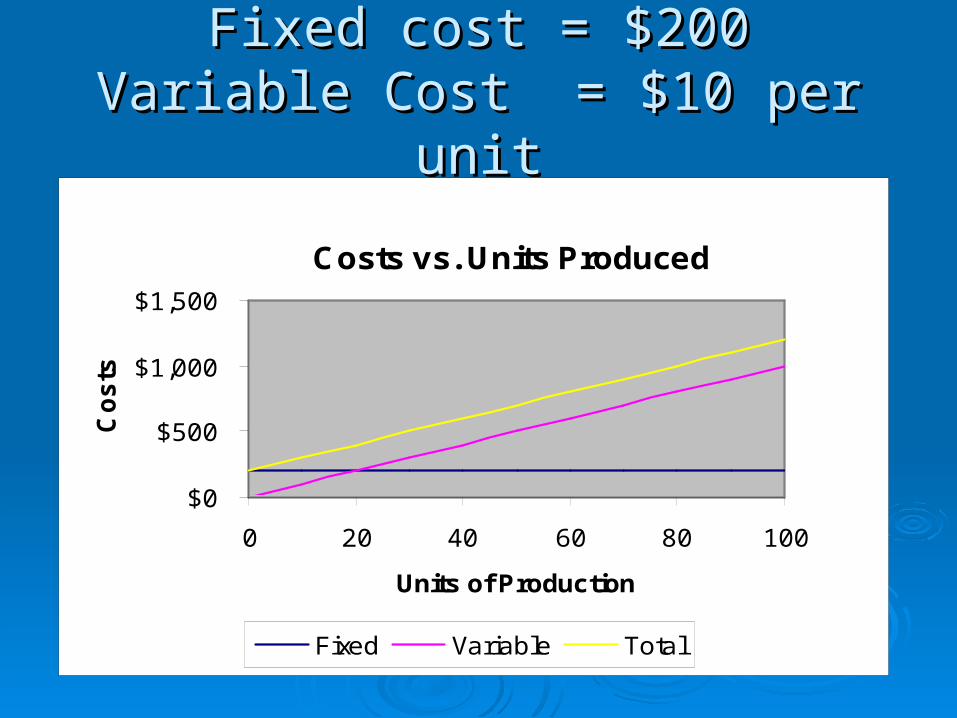
Fixed cost = $200Fixed cost = $200Variable Cost = $10 per unitVariable Cost = $10 per unit
Costs vs. Units Produced
$0
$500
$1,000
$1,500
0 20 40 60 80 100
Units of Production
Co
sts
Fixed Variable Total

Total CostsTotal Costs
As currently defined total costs are linear As currently defined total costs are linear with respect to units producedwith respect to units produced
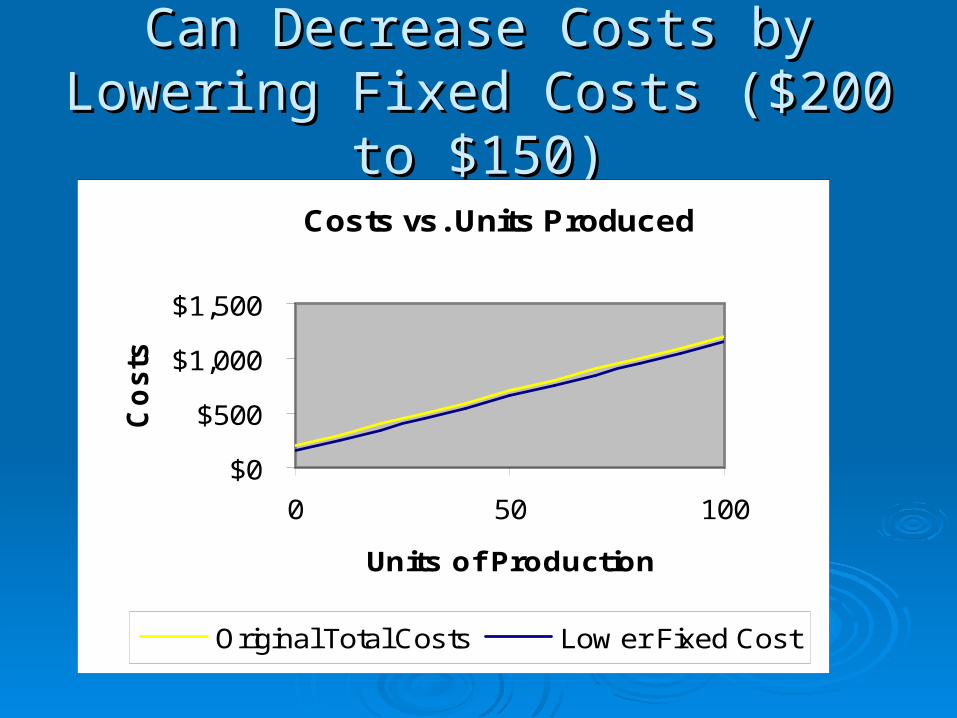
Can Decrease Costs by Lowering Can Decrease Costs by Lowering Fixed Costs ($200 to $150)Fixed Costs ($200 to $150)
Costs vs. Units Produced
$0
$500
$1,000
$1,500
0 50 100
Units of Production
Co
sts
Original Total Costs Low er Fixed Cost

Can Decrease Total Costs by Lowering Variable Cost Can Decrease Total Costs by Lowering Variable Cost ($10 to $8)($10 to $8)
Costs vs. Units Produced
$0
$500
$1,000
$1,500
0 50 100
Units of Production
Co
sts
Original Total Costs
Low er Variable Cost

Total Revenue (Linear)Total Revenue (Linear)
Total Revenues = price (p) times number Total Revenues = price (p) times number of units sold (D)of units sold (D)
If I sell 100 units at $20 per unit then total If I sell 100 units at $20 per unit then total revenue = $2000revenue = $2000

Total Revenues / CostsTotal Revenues / Costs
Costs vs. Units Produced
$0
$500
$1,000
$1,500
$2,000
$2,500
0 20 40 60 80 100
Units of Production
Co
sts
Total Costs Total Revenues

BreakevenBreakeven
Breakeven occurs at the point where Breakeven occurs at the point where TR=TCTR=TC
If a company can sell more than the If a company can sell more than the breakeven point then the company makes breakeven point then the company makes a net profit (NP)a net profit (NP)
If a company sells less than the breakeven If a company sells less than the breakeven point then the company loses moneypoint then the company loses money
NP=TR-TCNP=TR-TC

Breakeven PointBreakeven Point
Ways to lower the Ways to lower the breakeven point:breakeven point:
Reduce fixed cost Reduce fixed cost Reduce variable Reduce variable
costcost Increase revenue Increase revenue
per unitper unit
Costs vs. Units Produced
$0
$500
$1,000
$1,500
$2,000
$2,500
0 20 40 60 80 100
Units of Production
Co
sts
Total Costs Total Revenues
Linear Breakeven ExampleLinear Breakeven Example
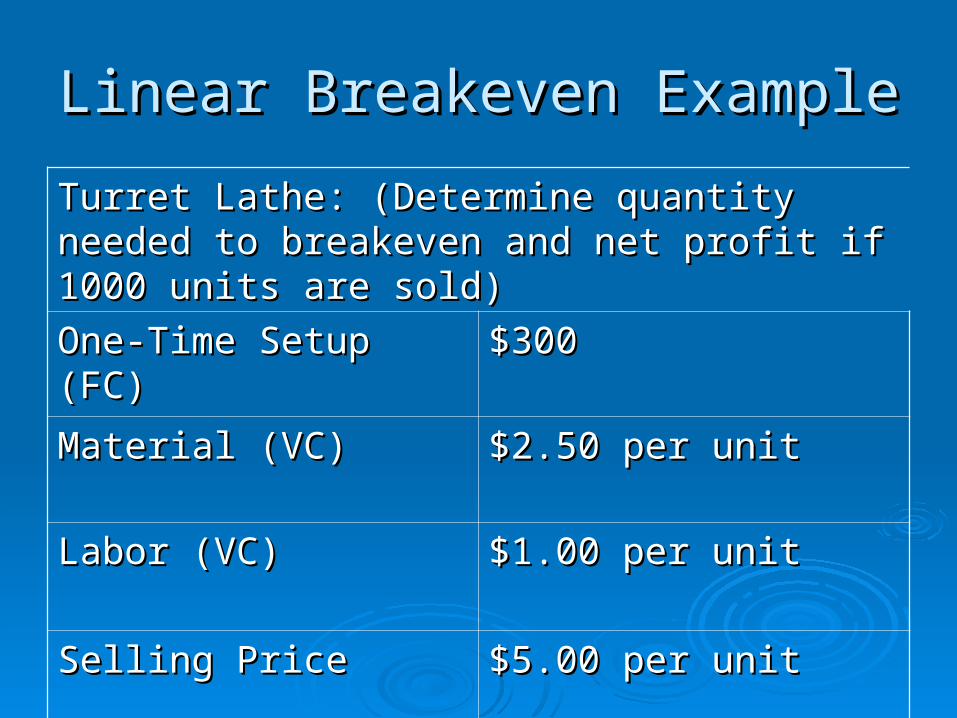
Turret Lathe: (Determine quantity needed to Turret Lathe: (Determine quantity needed to breakeven and net profit if 1000 units are sold)breakeven and net profit if 1000 units are sold)
One-Time Setup (FC)One-Time Setup (FC) $300$300
Material (VC)Material (VC) $2.50 per unit$2.50 per unit
Labor (VC)Labor (VC) $1.00 per unit$1.00 per unit
Selling PriceSelling Price $5.00 per unit$5.00 per unit

Linear BreakevenLinear Breakeven
Let D = # of Units that can be soldLet D = # of Units that can be sold TR = $5DTR = $5D TC = $300 + $3.50DTC = $300 + $3.50D
Set TR=TC and solve for D to find the Set TR=TC and solve for D to find the breakevenbreakeven
D=200 unitsD=200 units

Linear Breakeven-ExampleLinear Breakeven-Example
Costs vs. Units Produced
$0
$1,000
$2,000
$3,000
$4,000
$5,000
$6,000
0 200 400 600 800 1000
Units of Production
Co
sts
Total Costs Total Revenues

Linear Breakeven ExampleLinear Breakeven ExampleDetermine net profit (D=1000)Determine net profit (D=1000)
NP = TR-TCNP = TR-TC
TR=$5*1000 = $5000TR=$5*1000 = $5000
TC=$300+$3.5*1000 = $3800TC=$300+$3.5*1000 = $3800
NP=$1200 ($5000-$3800)NP=$1200 ($5000-$3800)

Nonlinear BreakevenNonlinear Breakeven
Usually there is a relationship between Usually there is a relationship between price (p) and number of units that can be price (p) and number of units that can be sold (D-for demand)sold (D-for demand)
If price is high demand is lowIf price is high demand is low If price is low demand is highIf price is low demand is high
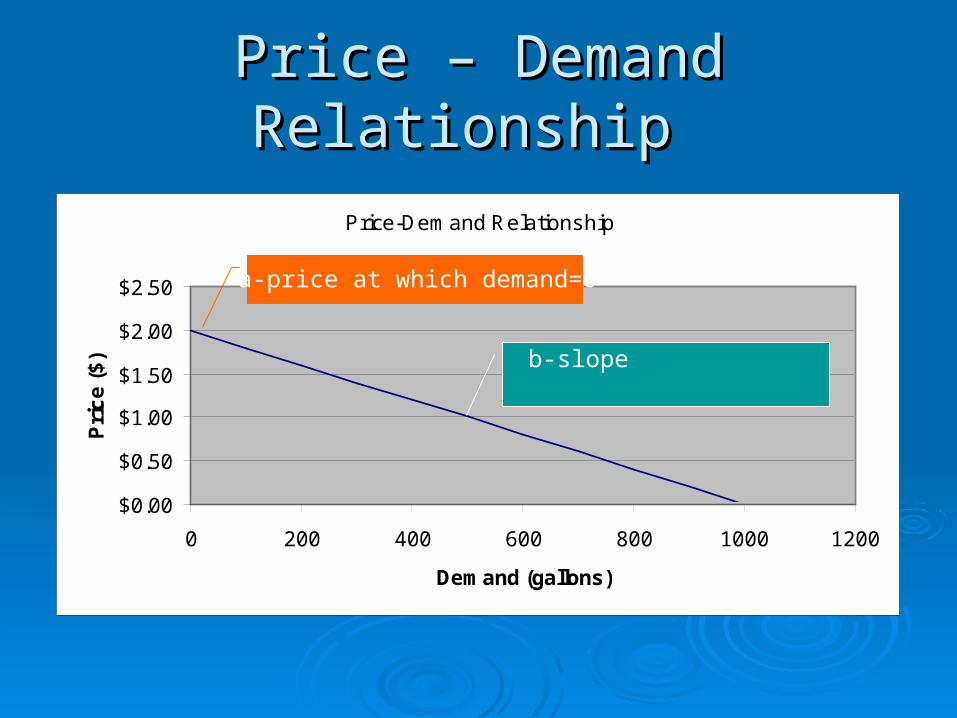
Price – Demand Relationship Price – Demand Relationship
Price-Demand Relationship
$0.00
$0.50
$1.00
$1.50
$2.00
$2.50
0 200 400 600 800 1000 1200
Demand (gallons)
Pri
ce
($
)
a-price at which demand=0
b-slope

Price-Demand EquationPrice-Demand Equation
Price (p) = a – b *DPrice (p) = a – b *D Now let’s take a look at the TR equation:Now let’s take a look at the TR equation:
TR=pDTR=pD But p=a-bD (price and demand are related)But p=a-bD (price and demand are related) Therefore TR=(a-bD)(D) orTherefore TR=(a-bD)(D) or TR=aD-bDTR=aD-bD22

Total Revenue-Nonlinear
0
100
200
300
400
500
600
0 200 400 600 800 1000
Demand (gallons)
Tota
l Rev
enue
($)
D high; p lowSell many
Don’t make much revenue
D low; p highDon’t sell manyDon’t make much revenue
Max. Revenue
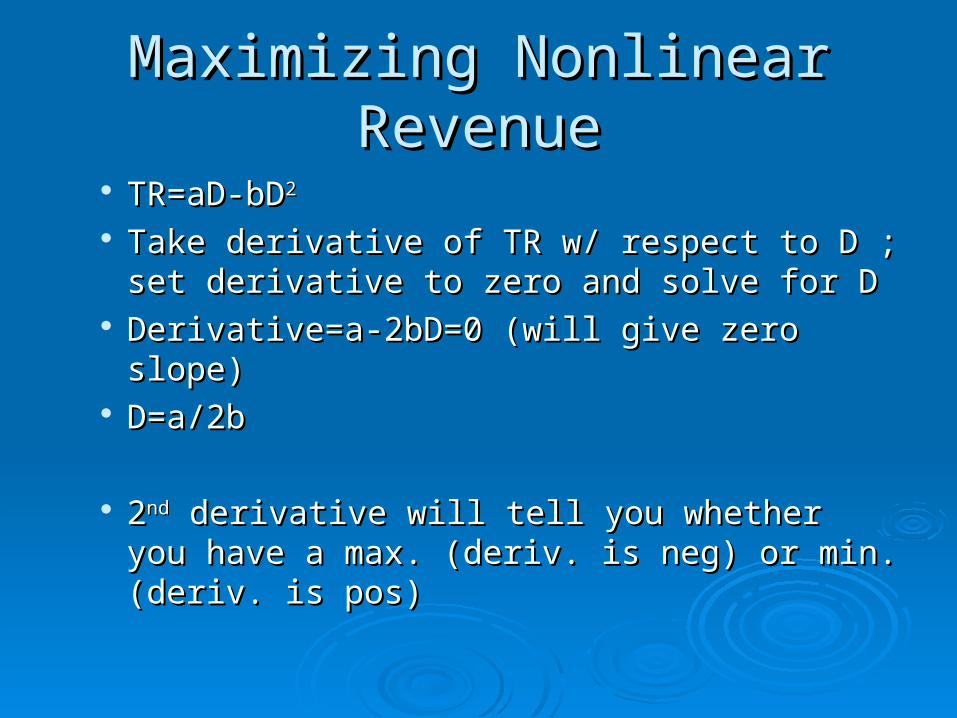
Maximizing Nonlinear RevenueMaximizing Nonlinear Revenue
TR=aD-bDTR=aD-bD22
Take derivative of TR w/ respect to D ; set Take derivative of TR w/ respect to D ; set derivative to zero and solve for Dderivative to zero and solve for D
Derivative=a-2bD=0 (will give zero slope)Derivative=a-2bD=0 (will give zero slope) D=a/2bD=a/2b
22ndnd derivative will tell you whether you have a derivative will tell you whether you have a max. (deriv. is neg) or min. (deriv. is pos) max. (deriv. is neg) or min. (deriv. is pos)

Breakeven Example - NonlinearBreakeven Example - Nonlinear
Given:Given: t is the number of tons sold per seasont is the number of tons sold per season Selling Price = $800-0.8t Selling Price = $800-0.8t TC=$10,000+$400tTC=$10,000+$400t Maximize revenue and profit; find breakeven pts.Maximize revenue and profit; find breakeven pts.
Calculations:Calculations: TR=Selling Price *t = $800t-0.8tTR=Selling Price *t = $800t-0.8t22
NP=TR-TC=-0.8tNP=TR-TC=-0.8t22+400t-10,000+400t-10,000
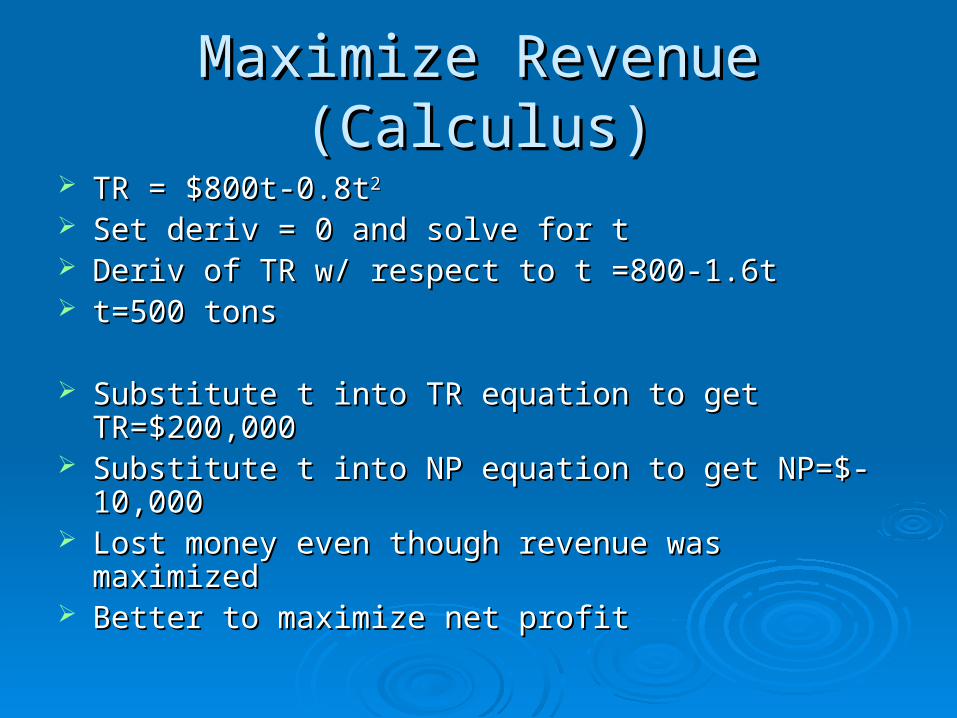
Maximize Revenue (Calculus)Maximize Revenue (Calculus) TR = $800t-0.8tTR = $800t-0.8t22
Set deriv = 0 and solve for t Set deriv = 0 and solve for t Deriv of TR w/ respect to t =800-1.6tDeriv of TR w/ respect to t =800-1.6t t=500 tonst=500 tons
Substitute t into TR equation to get TR=$200,000Substitute t into TR equation to get TR=$200,000 Substitute t into NP equation to get NP=$-10,000 Substitute t into NP equation to get NP=$-10,000 Lost money even though revenue was maximizedLost money even though revenue was maximized Better to maximize net profitBetter to maximize net profit

Maximize Revenue (Spreadsheet)Maximize Revenue (Spreadsheet) TR = $800t-0.8t TR = $800t-0.8t22
Total Revenue-Nonlinear
0
50,000
100,000
150,000
200,000
250,000
0 200 400 600 800 1000
Demand (tons)
To
tal
Rev
enu
e ($
)

Maximize Profit (Calculus)Maximize Profit (Calculus)
NP=-0.8tNP=-0.8t22+400t-10,000+400t-10,000 Set deriv = 0 and solve for t Set deriv = 0 and solve for t Deriv of NP w/ respect to t =-1.6t+400Deriv of NP w/ respect to t =-1.6t+400 t=250 tonst=250 tons
Substitute t into NP equation to get NP=$40,000Substitute t into NP equation to get NP=$40,000 Avg profit/ton=$40,000/250tons=$160 per tonAvg profit/ton=$40,000/250tons=$160 per ton
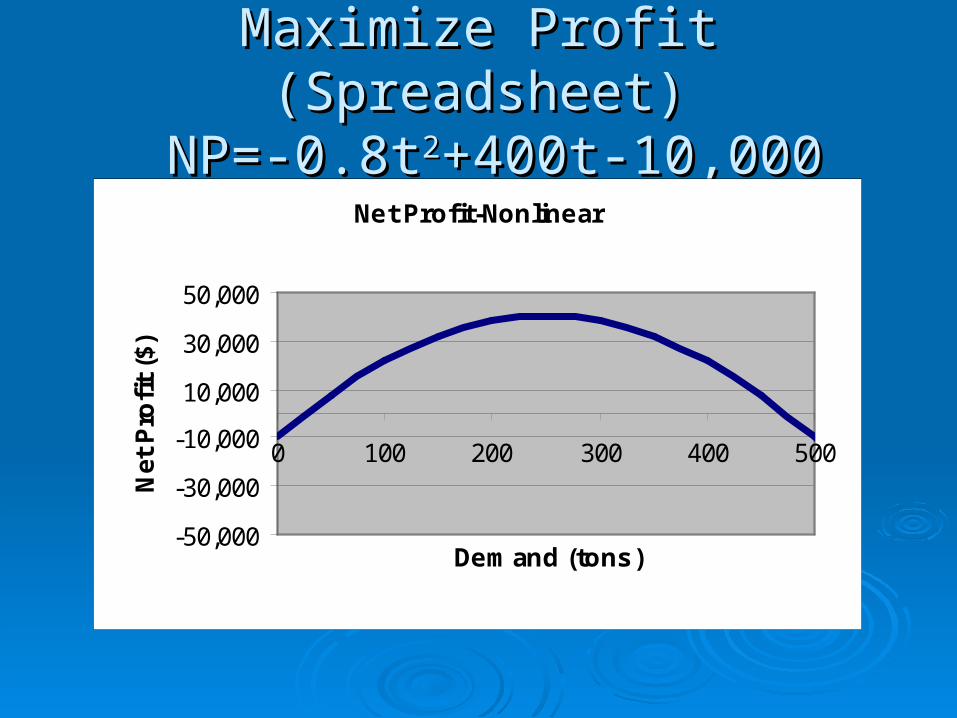
Maximize Profit (Spreadsheet)Maximize Profit (Spreadsheet) NP=-0.8t NP=-0.8t22+400t-10,000+400t-10,000
Net Profit-Nonlinear
-50,000
-30,000
-10,000
10,000
30,000
50,000
0 100 200 300 400 500
Demand (tons)
Net
Pro
fit
($)
Breakeven (Algebra)Breakeven (Algebra)
Set TC=TR and solve for tSet TC=TR and solve for t -0.8t-0.8t22+400t-10,000=0+400t-10,000=0 Must use quadratic equationMust use quadratic equation T=26 and 474 (if you sell within this range T=26 and 474 (if you sell within this range
you’ll make a net profit)you’ll make a net profit)

Breakeven (Spreadsheet)Breakeven (Spreadsheet)t=26 & 474 t=26 & 474
Breakeven Pts-Nonlinear
$0
$50,000
$100,000
$150,000
$200,000
$250,000
$300,000
0 200 400 600 800 1000
Demand (tons)
($
)
Total Revenue Total Costs

Tips to solve any type of breakeven Tips to solve any type of breakeven problem problem
TC=FC+VC (usually linear but could possibly be TC=FC+VC (usually linear but could possibly be nonlinear)nonlinear)
TR=p*D (may be linear or nonlinear)TR=p*D (may be linear or nonlinear) NP=TR-TCNP=TR-TC Breakeven pt(s) occur when TC=TRBreakeven pt(s) occur when TC=TR Maximize (or minimize) nonlinear equations by Maximize (or minimize) nonlinear equations by
finding derivative and setting equal to zerofinding derivative and setting equal to zero Maximize ProfitMaximize Profit Maximize RevenuesMaximize Revenues Minimize Costs Minimize Costs

Next lectureNext lecture
EstimatesEstimates Accounting PrinciplesAccounting Principles
Related Documents