CTA Common Denominator Index An investible benchmark index for the CTA and managed futures industry Tillmann Sachs, Robert L.K. Tiong 1 This draft: 4 September 2014 Tillmann Sachs J8 Capital Management LLP 3 Charlotte Close Ashtead KT21 2RH United Kingdom [email protected] +44 13 7227 0975 ____________ 1 Robert L.K. Tiong: Nanyang Technological University, Singapore. Tillmann Sachs: J8 Capital Management LLP, London. We thank Vitali Sakovic, Matthew Jones, Tan Chong It and Hui Yu Chen for their contribution.

Welcome message from author
This document is posted to help you gain knowledge. Please leave a comment to let me know what you think about it! Share it to your friends and learn new things together.
Transcript
CTA Common Denominator Index
An investible benchmark index for the CTA and managed futures
industry
Tillmann Sachs, Robert L.K. Tiong1
This draft: 4 September 2014
Tillmann Sachs J8 Capital Management LLP 3 Charlotte Close Ashtead KT21 2RH United Kingdom [email protected] +44 13 7227 0975
____________
1 Robert L.K. Tiong: Nanyang Technological University, Singapore. Tillmann Sachs: J8 Capital Management LLP,
London. We thank Vitali Sakovic, Matthew Jones, Tan Chong It and Hui Yu Chen for their contribution.
Abstract
The objective of this paper is to develop an investible index which is a fair
representation of the CTA and managed futures industry. For this purpose, we have
conducted an international survey among practitioners to establish common
denominators in the CTA and managed futures industry. We use the survey findings
as input parameters in the index construction to provide a "democratic
representation" of the industry.
The paper first discusses the nature of investible indices. Secondly, the new index is
constructed by using standard methodologies for calculating investible indices and
drawing on the survey results for parameter selection. Thirdly, all index parameters
are tested for their sensitivity. Finally, the resulting new index is compared against
existing CTA and managed futures benchmark indices. We use three indices for in-
depth comparison but show statistics for a total of 19 indices.
The CTACDI mimics popular CTA and managed futures benchmark indices with
statistical significance shows higher risk adjusted returns and shorter and lower
drawdown periods than its peers.
Investible and non-investible benchmark indices
Investible indices are commonly referred to being replicable by trading their
underlying constituents in the markets. For example, a trader can replicate the S&P
500 index by buying and selling the stocks of those companies which are included in
the S&P 500. Investible indices allows for sufficient time for trade execution between
determining the underlying constituents and weights and their effective inclusion in
the index. The rules or methodology to calculate investible indices are often
published and any trader can start trading according to these rules and replicate the
index to get exposure to the index. The S&P 500 is an investible index and because
of its popularity it is used as a benchmark index for US equities. Another example is
the S&P Goldman Sachs Commodity Index which follows a predefined index
methodology, is often referred to as benchmark for the commodity markets, and can
be replicated by traders.
Non-investible indices are commonly referred to as indices which cannot be
replicated by trading their underlying constituents. Often, such indices either cover a
very wide universe which is not practical to trade, or in their construction
methodology, they do not allow for enough time between calculation and trade
execution. For example, the Case-Shiller property indices measure the change in
property prices across US cities. To replicate the index in trading and to offer the
index as investor product, one would need to physically buy and sell all the
underlying properties included in the index calculation, which is impossible for the
illiquid nature of properties, and also for the sheer number to be included.
Most CTA and managed futures benchmark indices are non-investible. Their
calculation methodologies do not allow for sufficient time to transact in the underlying
funds and their effective inclusion in the index calculation. Another practical obstacle
arises from minimum investment amounts per manager as well as the number of
funds included which may lead to a very large cash amount needed to trade the
underlying constituents with sufficient granularity to replicate the benchmark indices.
The CTA Common Denominator Index (CTACDI) is investible. First, the index trades
few core futures only which require less capital than subscribing to funds. Second,
the index methodology allows for enough time between trading signal calculation and
execution of the trades in the markets. Finally, the methodology draws on the most
commonly used and applied techniques within the CTA and managed futures
industry.
Application of summary survey results in index construction -
common denominators in the CTA and managed futures industry
Together with the researchers from Nanyang Technological University (NTU) in
Singapore, we designed a survey to determine the common denominators in the
CTA and managed futures industry. The survey was conducted from 17th June 2014
until 11th July 2014 by NTU. The online questionnaire was sent to over 3,500
practitioners globally and we collected 51 responses. The full survey results are
published in the Journal of Index Investing, forthcoming (Chen et al. 2014).
In summary, the survey found that the CTA and managed futures industry may be
generalized in trading a risk weighted momentum portfolio of global core futures
markets managed to a target volatility and applying a 2/20 fee structure.
1) The most common markets traded by CTAs and managed futures managers are:
S&P 500, EURO FX, Gold, Copper, WTI Crude Oil, Eurodollar, and 10yr US
Treasury. We use these top seven markets in our index, because they represent the
five key global markets of equity indices, currencies, commodities, interest rates, and
government bonds. Within the commodities, WTI Crude Oil, Gold, and Copper also
represent the top three most popular sectors of energy, precious metals, and
industrial metals.
2) The most common return engine is "Momentum or Trend Following" before carry
trades, relative value trades, term structure arbitrage, or fundamental or value
trades. In annex 2, we demonstrate, why the widely referred to 12 months
momentum is in fact a good choice of parameter, and we use a 12 month
momentum signal for the index.
3) The most common risk or asset allocation technique is risk parity followed by
equal notional weights, minimum variance, Sharpe ratio weighted, or full
distribution/Omega portfolios. For the risk parity calculation in the index, we will use
90 week days as look back period with monthly portfolio rebalancing only.
4) The most common money management technique is target volatility, followed by
drawdown limits, value-at-risk, or unconstrained techniques. For the target volatility
mechanism, the index will use 90 week days as look-back period for the volatility
measure and a target volatility of 5% per annum with monthly leverage adjustments.
5) The most common fee structure was a management fee of between 1.5 to 2% per
annum and a high watermark performance fee of 15 to 20%. We chose a 2/20 fee
structure with daily accruals for our index calculation.
We ignore hurdle rates in the fee structure but we assume brokerage costs and
slippage per underlying market. We also apply US T-Bill returns on cash.
Annex 2 shows sensitivity analysis performed on the parameters chosen for the
index construction.
The CTA Common Denominator Index - a new CTA benchmark
The CTA Common Denominator Index (CTACDI) is created to serve investors as an
investible and fair representation of the CTA and managed futures industry and to
gain exposure to CTA-like returns. We show that the CTACDI mimics popular CTA
and managed futures benchmark indices. The CTACDI is a "democratic", investable,
liquid, and scalable benchmark index, derived from survey results on the common
denominators in the CTA and managed futures industry. The objective is not to
outperform the industry or to introduce other enhancements or optimizations but to
deliver a fair representation.
EXISTING CTA AND MANAGED FUTURES BENCHMARK INDICES
There are a number of CTA indices provided by financial service providers. Most
benchmark indices are not investible. They track performance of managers and
some select managers in hindsight. Many benchmark indices include and exclude
managers based on size and/or performance which may lead to a size or
performance bias.
We initially compare our CTACDI against three popular CTA and managed futures
indices to see if the survey results are broadly in line with the industry. We select
three indices which include a wide number of CTA or managed futures programmes,
and which are net of costs and fees:
Barclay CTA Index
Newedge CTA Index
Credit Suisse Managed Futures Hedge Fund Index
The Barclay CTA Index was launched in 1987. It currently includes 551 programmes
which are selected on an annual basis. To be included in the index an advisor must
have a 4 year track record, and any new programs run by an already included
advisor are not taken into account until their second year. The Barclay CTA Index
rebalances and selects constituents annually.
The Newedge CTA Index has been tracking the industry since 2000. In 2007 the
selection criteria for the index changed to include the 20 largest CTAs by AUM only.
The index is equal weighted and the index constituents are confirmed and
rebalanced annually. All included funds must be open to new investments and report
returns daily.
The Credit Suisse Managed Futures Hedge Fund Index is an AUM weighted index
and currently consists of 31 managers, each with a minimum of USD 50 million
AUM, and at least a 1 year trading record. The Credit Suisse Managed Futures
Hedge Fund Index aims to represents more than 85% of total AUM in the managed
futures space. The index rebalances monthly, and constituents are confirmed
quarterly.
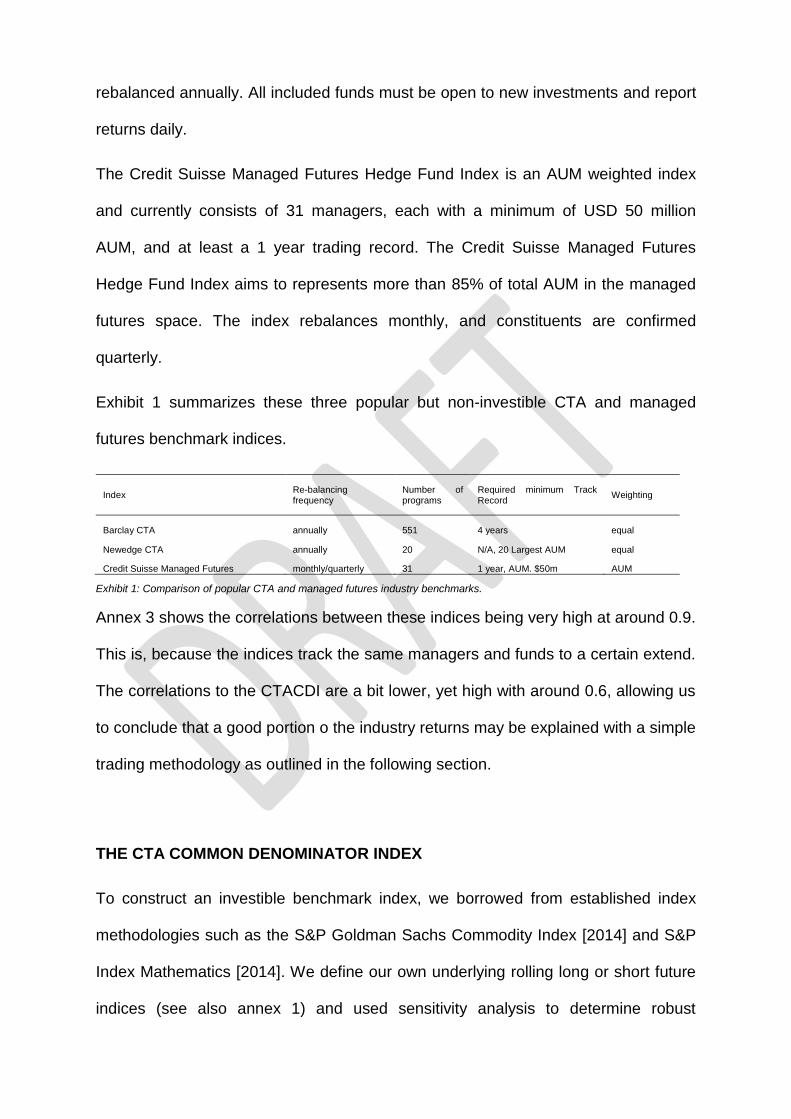
Exhibit 1 summarizes these three popular but non-investible CTA and managed
futures benchmark indices.
Index Re-balancing frequency
Number of programs
Required minimum Track Record
Weighting
Barclay CTA annually 551 4 years equal
Newedge CTA annually 20 N/A, 20 Largest AUM equal
Credit Suisse Managed Futures monthly/quarterly 31 1 year, AUM. $50m AUM
Exhibit 1: Comparison of popular CTA and managed futures industry benchmarks.
Annex 3 shows the correlations between these indices being very high at around 0.9.
This is, because the indices track the same managers and funds to a certain extend.
The correlations to the CTACDI are a bit lower, yet high with around 0.6, allowing us
to conclude that a good portion o the industry returns may be explained with a simple
trading methodology as outlined in the following section.
THE CTA COMMON DENOMINATOR INDEX
To construct an investible benchmark index, we borrowed from established index
methodologies such as the S&P Goldman Sachs Commodity Index [2014] and S&P
Index Mathematics [2014]. We define our own underlying rolling long or short future
indices (see also annex 1) and used sensitivity analysis to determine robust
parameterization (see annex 2) for: momentum look-back period, the signal
observation frequency, portfolio rebalancing frequency, the look-back period of
volatilities used in risk parity and target volatility calculations, and portfolio weighting
mechanism. We did not perform sensitivity analysis on the target volatility level and
fee structure as they affect risks and return linearly only.
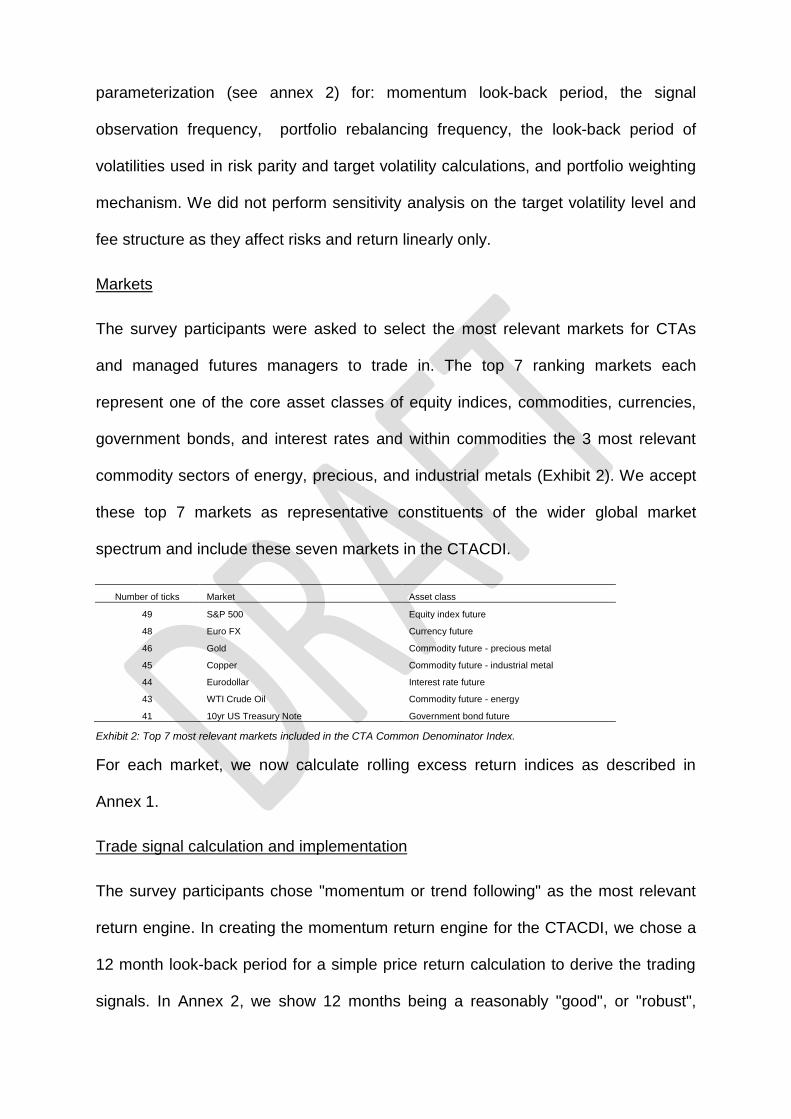
Markets
The survey participants were asked to select the most relevant markets for CTAs
and managed futures managers to trade in. The top 7 ranking markets each
represent one of the core asset classes of equity indices, commodities, currencies,
government bonds, and interest rates and within commodities the 3 most relevant
commodity sectors of energy, precious, and industrial metals (Exhibit 2). We accept
these top 7 markets as representative constituents of the wider global market
spectrum and include these seven markets in the CTACDI.
Number of ticks Market Asset class
49 S&P 500 Equity index future
48 Euro FX Currency future
46 Gold Commodity future - precious metal
45 Copper Commodity future - industrial metal
44 Eurodollar Interest rate future
43 WTI Crude Oil Commodity future - energy
41 10yr US Treasury Note Government bond future
Exhibit 2: Top 7 most relevant markets included in the CTA Common Denominator Index.
For each market, we now calculate rolling excess return indices as described in
Annex 1.
Trade signal calculation and implementation
The survey participants chose "momentum or trend following" as the most relevant
return engine. In creating the momentum return engine for the CTACDI, we chose a
12 month look-back period for a simple price return calculation to derive the trading
signals. In Annex 2, we show 12 months being a reasonably "good", or "robust",
parameter, using literature review and a new method derived from discussions on
robust system designs by Faith [2007] and Narang [2012].
The trading signal S(t) is calculated daily on the close of the markets. The signal is
then implemented on that close and becomes effective for the next day's return.
The signal takes the form
Equation 1
where M is the 12 month momentum, calculated as
Equation 2
The daily returns ri(t) are calculated as
Equation 3
where P is the underlying long-only index closing price of the long-only underlying
index on that day.
The long/short returns, ri(t)LS, is calculated by
. Equation 4
The index is always invested in the markets and zero or neutral positions are not
possible.
Portfolio construction
The survey confirmed risk parity as the most common "risk or asset allocation"
method among CTAs and managed futures programmes.
The concept of risk parity stems from Bridgewater’s All Weather allocation principles
first established in 1996. It allocates more capital to less volatile and less capital to
more volatile markets. It is inverse volatility weighted.
In risk parity, we first calculate the inverse volatilities of the underlying markets by
Equation 5
where σi is the 90-week-day volatility, calculated as the annualized standard
deviation of the returns of the previous 90 week days.
Equation 6
where µ is the mean of the previous 90 day returns.
The weights are calculated as follows:
Equation 7
where n is the number of underlying markets in the portfolio.
The portfolio return, rT, is calculated the by sum of the weights multiplied by the
underlying's returns.
Equation 8
K is the leverage factor and described below. The portfolio rebalances monthly.
Money management
The survey found that using a target volatility mechanism is the most common way
to manage money in the CTA and managed futures industry. Leverage in the
portfolio is decreased in volatile markets and increased in less volatile markets as
measured by realized volatility versus target volatility.
The CTACDI employs a target volatility mechanism as described in S&P Index
Mathematics [2014]. The leverage factor, K, is calculated by
Equation 9
where Kmax is the maximum leverage permitted. For the CTACDI, K is unconstrained.
The realized volatility for the portfolio is calculated as above on the unleveraged
index returns, and the target volatility for the CTACDI is set at 5% for a good mimic
of CTA benchmark indices.
Embedded interest, costs and fees
The survey set the band for the most common management fee between 1.5 and 2%
per annum and for the high water mark performance fee between 15 and 20%. For
the CTACDI, we calculate the embedded fees daily accruing with management of
fee 2% per annum and a high water mark performance fee of 20%.
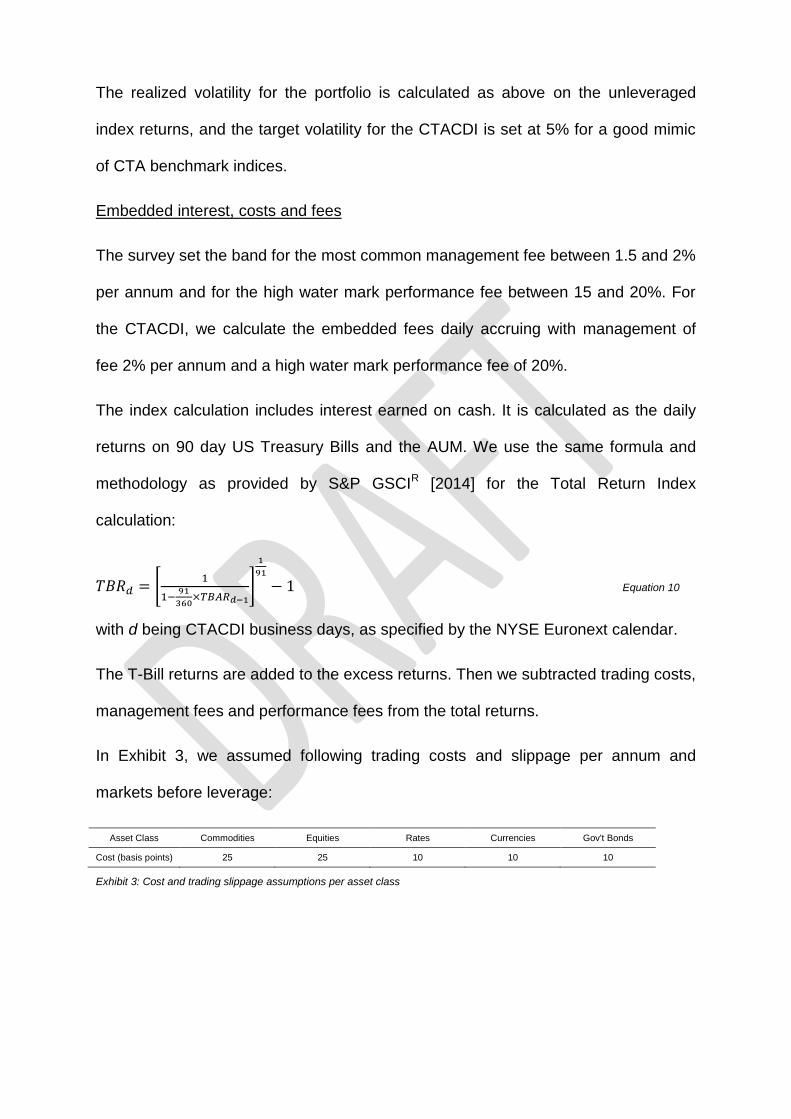
The index calculation includes interest earned on cash. It is calculated as the daily
returns on 90 day US Treasury Bills and the AUM. We use the same formula and
methodology as provided by S&P GSCIR [2014] for the Total Return Index
calculation:
Equation 10
with d being CTACDI business days, as specified by the NYSE Euronext calendar.
The T-Bill returns are added to the excess returns. Then we subtracted trading costs,
management fees and performance fees from the total returns.
In Exhibit 3, we assumed following trading costs and slippage per annum and
markets before leverage:
Asset Class Commodities Equities Rates Currencies Gov't Bonds
Cost (basis points) 25 25 10 10 10
Exhibit 3: Cost and trading slippage assumptions per asset class
Performance comparison to other benchmark indices
In determining if the resultant index is a "good and fair" representation of the CTA
and futures industry, we primarily compare the time series against three popular
benchmark indices as described above.
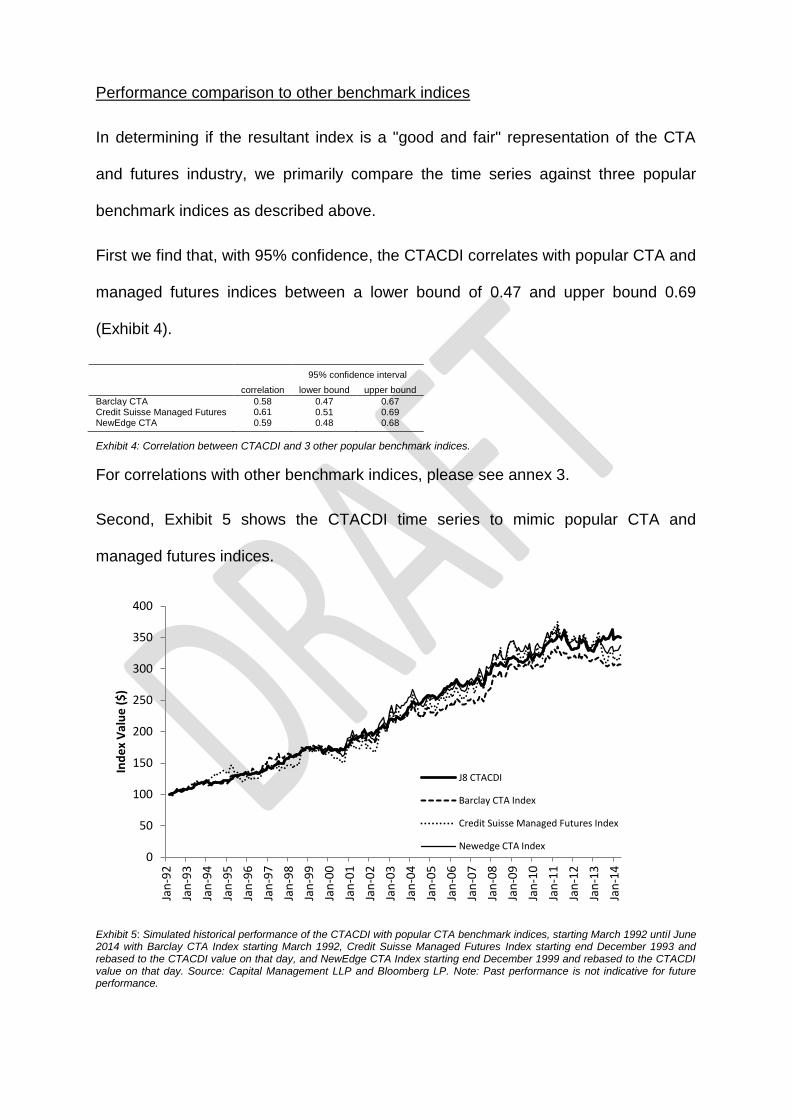
First we find that, with 95% confidence, the CTACDI correlates with popular CTA and
managed futures indices between a lower bound of 0.47 and upper bound 0.69
(Exhibit 4).
95% confidence interval
correlation lower bound upper bound
Barclay CTA 0.58 0.47 0.67 Credit Suisse Managed Futures 0.61 0.51 0.69 NewEdge CTA 0.59 0.48 0.68
Exhibit 4: Correlation between CTACDI and 3 other popular benchmark indices.
For correlations with other benchmark indices, please see annex 3.
Second, Exhibit 5 shows the CTACDI time series to mimic popular CTA and
managed futures indices.
Exhibit 5: Simulated historical performance of the CTACDI with popular CTA benchmark indices, starting March 1992 until June 2014 with Barclay CTA Index starting March 1992, Credit Suisse Managed Futures Index starting end December 1993 and rebased to the CTACDI value on that day, and NewEdge CTA Index starting end December 1999 and rebased to the CTACDI value on that day. Source: Capital Management LLP and Bloomberg LP. Note: Past performance is not indicative for future performance.
0
50
100
150
200
250
300
350
400
Jan
-92
Jan
-93
Jan
-94
Jan
-95
Jan
-96
Jan
-97
Jan
-98
Jan
-99
Jan
-00
Jan
-01
Jan
-02
Jan
-03
Jan
-04
Jan
-05
Jan
-06
Jan
-07
Jan
-08
Jan
-09
Jan
-10
Jan
-11
Jan
-12
Jan
-13
Jan
-14
Ind
ex
Val
ue
($
)
J8 CTACDI
Barclay CTA Index
Credit Suisse Managed Futures Index
Newedge CTA Index
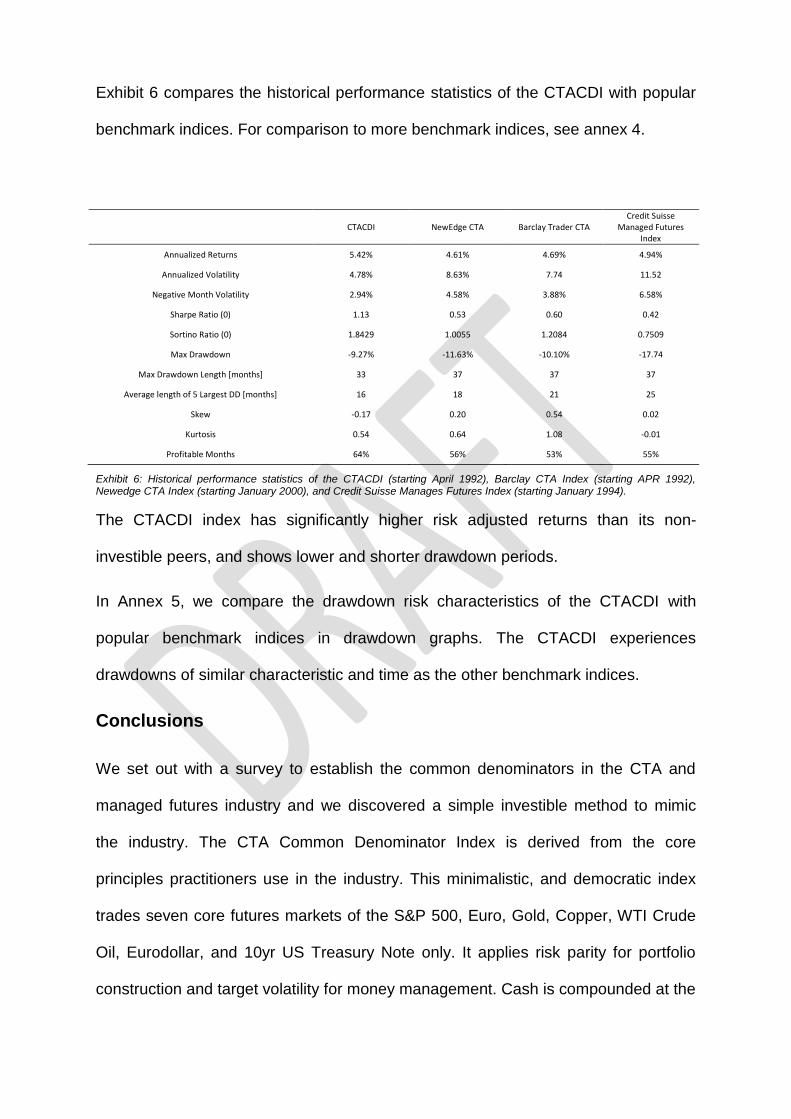
Exhibit 6 compares the historical performance statistics of the CTACDI with popular
benchmark indices. For comparison to more benchmark indices, see annex 4.
CTACDI NewEdge CTA Barclay Trader CTA
Credit Suisse Managed Futures
Index
Annualized Returns 5.42% 4.61% 4.69% 4.94%
Annualized Volatility 4.78% 8.63% 7.74 11.52
Negative Month Volatility 2.94% 4.58% 3.88% 6.58%
Sharpe Ratio (0) 1.13 0.53 0.60 0.42
Sortino Ratio (0) 1.8429 1.0055 1.2084 0.7509
Max Drawdown -9.27% -11.63% -10.10% -17.74
Max Drawdown Length [months] 33 37 37 37
Average length of 5 Largest DD [months] 16 18 21 25
Skew -0.17 0.20 0.54 0.02
Kurtosis 0.54 0.64 1.08 -0.01
Profitable Months 64% 56% 53% 55%
Exhibit 6: Historical performance statistics of the CTACDI (starting April 1992), Barclay CTA Index (starting APR 1992), Newedge CTA Index (starting January 2000), and Credit Suisse Manages Futures Index (starting January 1994).
The CTACDI index has significantly higher risk adjusted returns than its non-
investible peers, and shows lower and shorter drawdown periods.
In Annex 5, we compare the drawdown risk characteristics of the CTACDI with
popular benchmark indices in drawdown graphs. The CTACDI experiences
drawdowns of similar characteristic and time as the other benchmark indices.
Conclusions
We set out with a survey to establish the common denominators in the CTA and
managed futures industry and we discovered a simple investible method to mimic
the industry. The CTA Common Denominator Index is derived from the core
principles practitioners use in the industry. This minimalistic, and democratic index
trades seven core futures markets of the S&P 500, Euro, Gold, Copper, WTI Crude
Oil, Eurodollar, and 10yr US Treasury Note only. It applies risk parity for portfolio
construction and target volatility for money management. Cash is compounded at the
risk-free rate of 90 day US T-Bills and it embeds trading costs and slippage and a
common 2/20 fee structure.
The findings lead us to conclude that the CTA and managed futures industry by far
and large may be described as a low-to-medium frequency momentum or trend
following industry, trading global liquid markets only in a risk weighted portfolio,
managed to a target volatility.
Coincidentally, we found that the CTACDI also seems to mimic the movements of
those popular but non-investible CTA and managed futures benchmark indices.
Therefore, the CTACDI may not only serve as a new benchmark index for the
industry but also be used in investment products to gain exposure to CTA like
returns.
References
Baltas, A.-N., Kosowski, R. “Momentum Strategies in Futures Markets and Trend-
following Funds.” Imperial College Business School, 2012
Bridgewater. “The All Weather Story”
http://www.bwater.com/Uploads/FileManager/research/All-Weather/All-Weather-
Story.pdf
Chen, Hui Yi. Sachs, Tillmann. Tiong, L.K. Robert. "Common denominators in the
CTA and managed futures industry - a survey report." Journal of Index Investing,
Institutional Investor Journals, 2014 forthcoming.
Faith, Curtis M. The Way of the Turtle. McGrawn-Hill, 2007.
Gorton, Gary B. Hayashi, Fumio. Rouwenhorst, K. Geert. "The Fundamentals of
Commodity Futures Returns." 2012.
Gorton, Gary B. Rouwenhorst, K. Geert. "Facts and Fantasies about Commodity
Futures." Yale ICF Working Paper No. 04-20, 2005.
Moskowitz, Tobias. Ooi, Yao Hua., Lasse H. Pedersen. "Time Series Momentum."
[2010]
Narang, Rishi K. Inside the black box. John Wiley & Sons, Inc., 2013.
Du Plessis, Johan. Demystifying Momentum: Time-series and cross-sectional
momentum, volatility and dispersion. Master’s thesis. University of Amsterdam,
Amsterdam, 2013
S&P Dow Jones Indices. S&P GSCIR Methodology. McGraw Hill Financial. May
2014.
S&P Dow Jones Indices. Index Mathematics, Methodology. McGraw Hill Financial.
March 2014
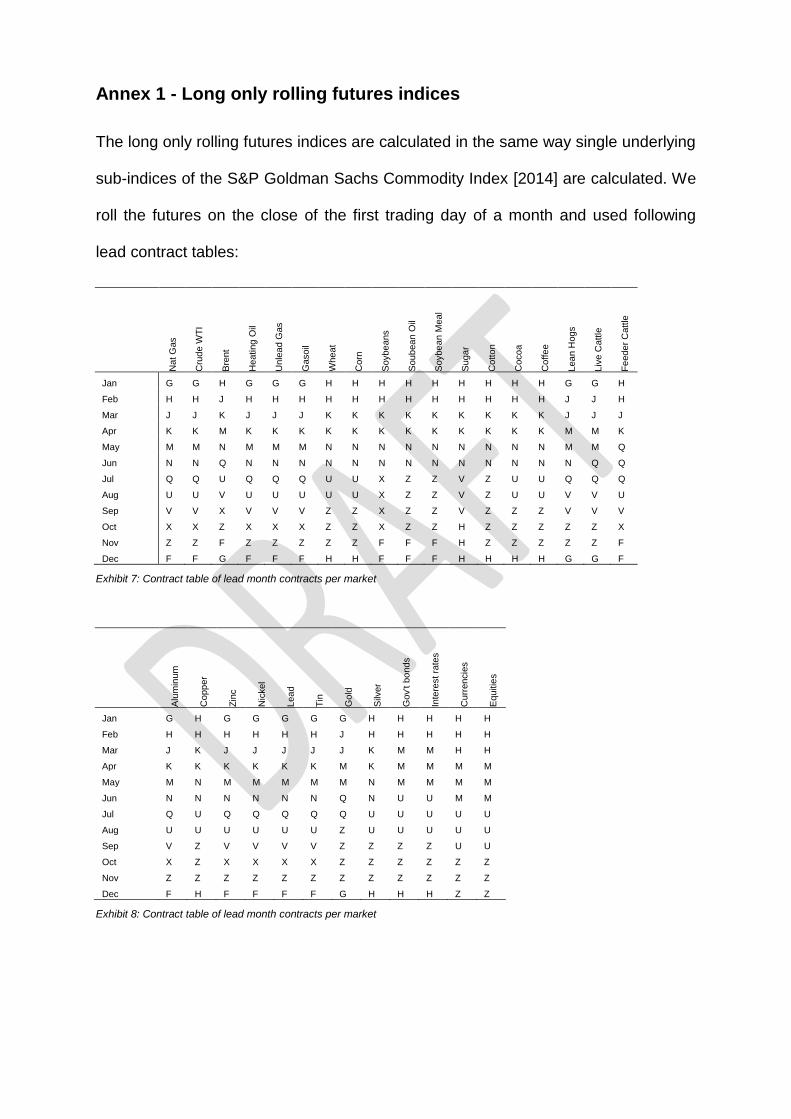
Annex 1 - Long only rolling futures indices
The long only rolling futures indices are calculated in the same way single underlying
sub-indices of the S&P Goldman Sachs Commodity Index [2014] are calculated. We
roll the futures on the close of the first trading day of a month and used following
lead contract tables:
Nat G
as
Cru
de W
TI
Bre
nt
Heating O
il
Unle
ad G
as
Gasoil
Whea
t
Corn
Soybe
ans
Soub
ea
n O
il
Soybe
an
Meal
Suga
r
Cotto
n
Coco
a
Coffe
e
Lea
n H
ogs
Liv
e C
attle
Fe
ede
r C
attle
Jan G G H G G G H H H H H H H H H G G H
Feb H H J H H H H H H H H H H H H J J H
Mar J J K J J J K K K K K K K K K J J J
Apr K K M K K K K K K K K K K K K M M K
May M M N M M M N N N N N N N N N M M Q
Jun N N Q N N N N N N N N N N N N N Q Q
Jul Q Q U Q Q Q U U X Z Z V Z U U Q Q Q
Aug U U V U U U U U X Z Z V Z U U V V U
Sep V V X V V V Z Z X Z Z V Z Z Z V V V
Oct X X Z X X X Z Z X Z Z H Z Z Z Z Z X
Nov Z Z F Z Z Z Z Z F F F H Z Z Z Z Z F
Dec F F G F F F H H F F F H H H H G G F
Exhibit 7: Contract table of lead month contracts per market
Alu
min
um
Copp
er
Zin
c
Nic
kel
Lea
d
Tin
Gold
Silv
er
Gov't b
onds
Inte
rest ra
tes
Curr
encie
s
Equitie
s
Jan G H G G G G G H H H H H
Feb H H H H H H J H H H H H
Mar J K J J J J J K M M H H
Apr K K K K K K M K M M M M
May M N M M M M M N M M M M
Jun N N N N N N Q N U U M M
Jul Q U Q Q Q Q Q U U U U U
Aug U U U U U U Z U U U U U
Sep V Z V V V V Z Z Z Z U U
Oct X Z X X X X Z Z Z Z Z Z
Nov Z Z Z Z Z Z Z Z Z Z Z Z
Dec F H F F F F G H H H Z Z
Exhibit 8: Contract table of lead month contracts per market
Annex 2: Sensitivity analysis of index parameters
Five parameters in the index had to be established and set to fixed values. To
determine a "robust" parameterization, we conducted for each parameter a
sensitivity analysis to changes in the parameter's value on statistical performance
measures. We evaluated the results based on robustness considerations propagated
by Faith [2007] and Narang [2012].
We discuss "robust" parameterization in the first sensitivity analysis on the
momentum look-back period and apply same principles for the remaining four
parameters.
TWELVE MONTHS MOMENTUM
A 12 months look-back period is popular in academic literature on commodity futures
returns and time series analysis (see Moskowitz, et al. [2010]; Baltas, et al. [2013];
Plessis [2013], Gorton et al. [2012]). We confirm and show in this section that
choosing 12 month momentum one robust parameter by taking a different approach
based on robustness considerations propagated by Faith [2007] and Narang [2012].
What is "robust"?
It is sometimes conducive to choose a trading parameter which may produce
exciting results in time series back-test. However, in live trading, it may produce
disappointing results.
We try to avoid such optimistic parameterization and demonstrate our approach to
robust parameterization with the following methodology. Here, it is to determine or
confirm a "robust" momentum look-back period in 57 global markets. The 57 markets
included 20 commodity markets, 10 government bond markets, 9 currency markets,
6 interest rate markets, and 12 equity indices.
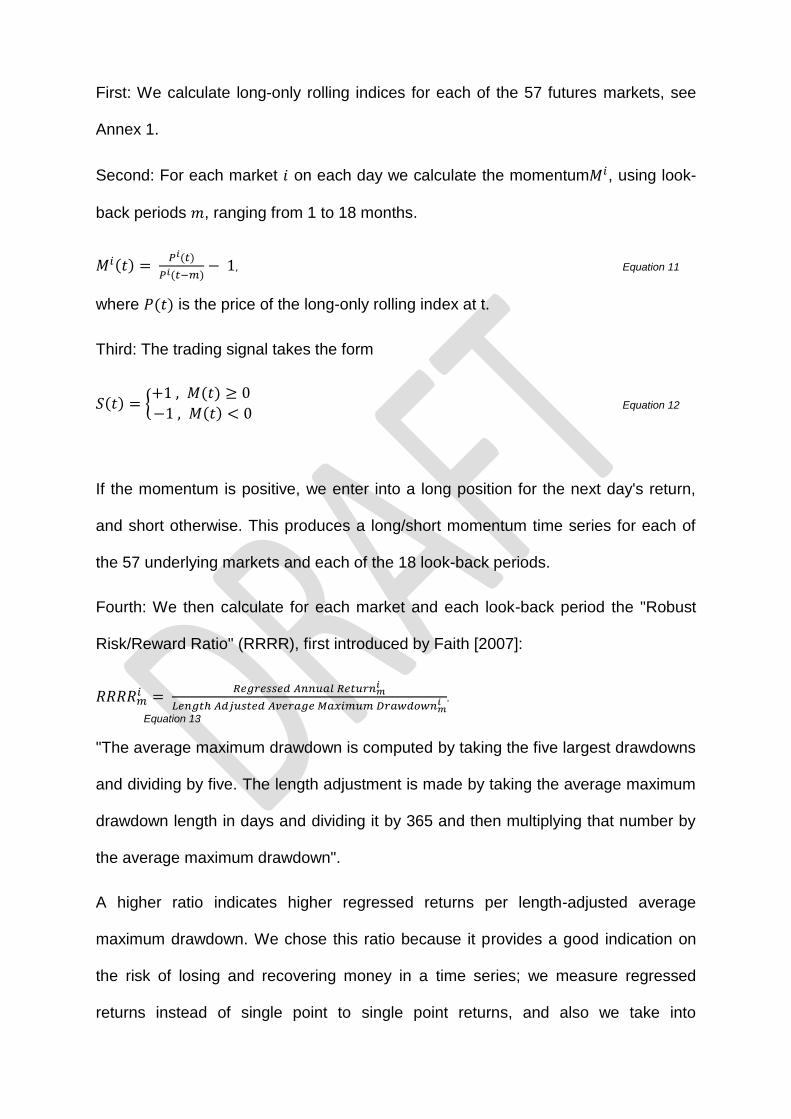
First: We calculate long-only rolling indices for each of the 57 futures markets, see
Annex 1.
Second: For each market on each day we calculate the momentum , using look-
back periods , ranging from 1 to 18 months.
, Equation 11
where is the price of the long-only rolling index at t.
Third: The trading signal takes the form
Equation 12
If the momentum is positive, we enter into a long position for the next day's return,
and short otherwise. This produces a long/short momentum time series for each of
the 57 underlying markets and each of the 18 look-back periods.
Fourth: We then calculate for each market and each look-back period the "Robust
Risk/Reward Ratio" (RRRR), first introduced by Faith [2007]:
.
Equation 13
"The average maximum drawdown is computed by taking the five largest drawdowns
and dividing by five. The length adjustment is made by taking the average maximum
drawdown length in days and dividing it by 365 and then multiplying that number by
the average maximum drawdown".
A higher ratio indicates higher regressed returns per length-adjusted average
maximum drawdown. We chose this ratio because it provides a good indication on
the risk of losing and recovering money in a time series; we measure regressed
returns instead of single point to single point returns, and also we take into
consideration multiple draw-downs and draw-down lengths instead of, for example,
only the single largest maximum draw-down.
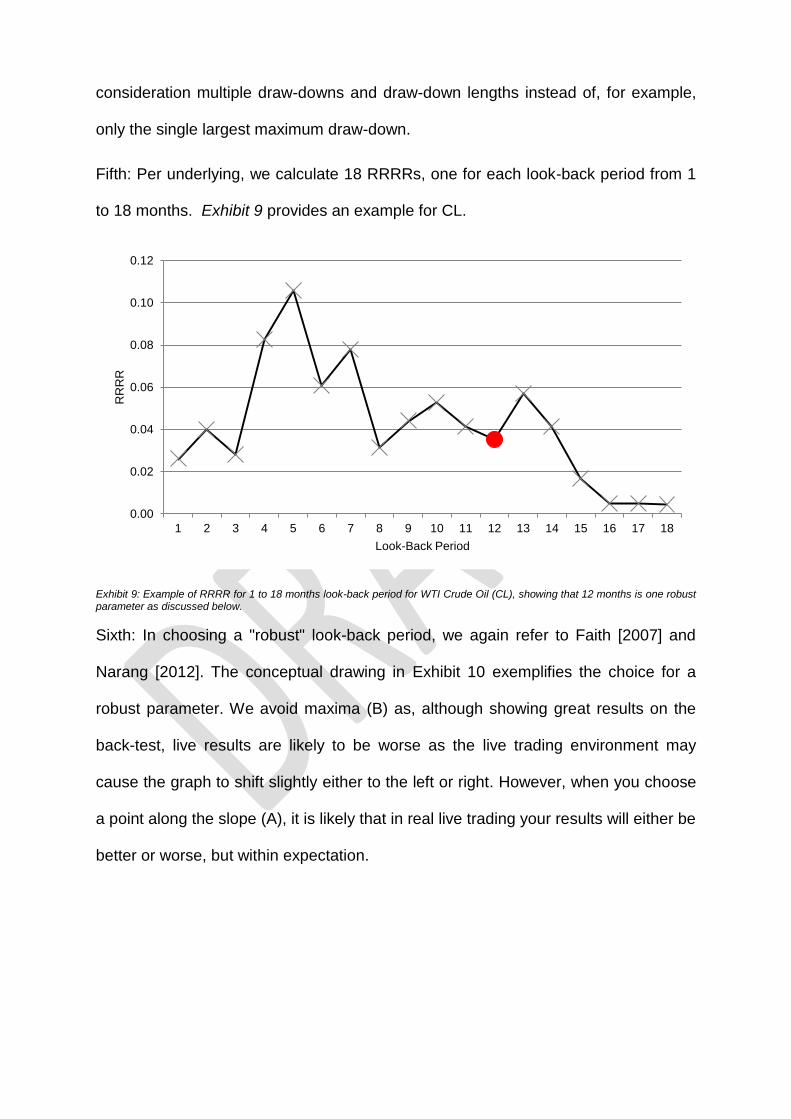
Fifth: Per underlying, we calculate 18 RRRRs, one for each look-back period from 1
to 18 months. Exhibit 9 provides an example for CL.
Exhibit 9: Example of RRRR for 1 to 18 months look-back period for WTI Crude Oil (CL), showing that 12 months is one robust parameter as discussed below.
Sixth: In choosing a "robust" look-back period, we again refer to Faith [2007] and
Narang [2012]. The conceptual drawing in Exhibit 10 exemplifies the choice for a
robust parameter. We avoid maxima (B) as, although showing great results on the
back-test, live results are likely to be worse as the live trading environment may
cause the graph to shift slightly either to the left or right. However, when you choose
a point along the slope (A), it is likely that in real live trading your results will either be
better or worse, but within expectation.
0.00
0.02
0.04
0.06
0.08
0.10
0.12
1 2 3 4 5 6 7 8 9 10 11 12 13 14 15 16 17 18
RR
RR
Look-Back Period
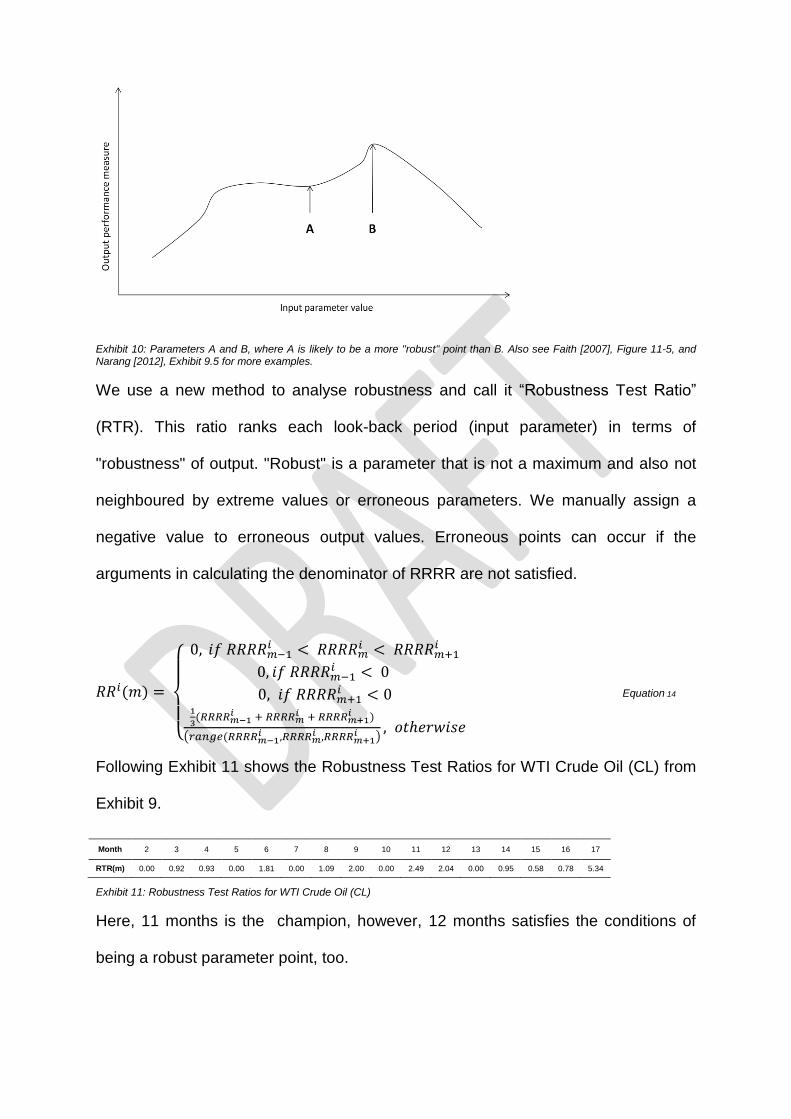
Exhibit 10: Parameters A and B, where A is likely to be a more "robust" point than B. Also see Faith [2007], Figure 11-5, and Narang [2012], Exhibit 9.5 for more examples.
We use a new method to analyse robustness and call it “Robustness Test Ratio”
(RTR). This ratio ranks each look-back period (input parameter) in terms of
"robustness" of output. "Robust" is a parameter that is not a maximum and also not
neighboured by extreme values or erroneous parameters. We manually assign a
negative value to erroneous output values. Erroneous points can occur if the
arguments in calculating the denominator of RRRR are not satisfied.
Equation 14
Following Exhibit 11 shows the Robustness Test Ratios for WTI Crude Oil (CL) from
Exhibit 9.
Month 2 3 4 5 6 7 8 9 10 11 12 13 14 15 16 17
RTR(m) 0.00 0.92 0.93 0.00 1.81 0.00 1.09 2.00 0.00 2.49 2.04 0.00 0.95 0.58 0.78 5.34
Exhibit 11: Robustness Test Ratios for WTI Crude Oil (CL)
Here, 11 months is the champion, however, 12 months satisfies the conditions of
being a robust parameter point, too.
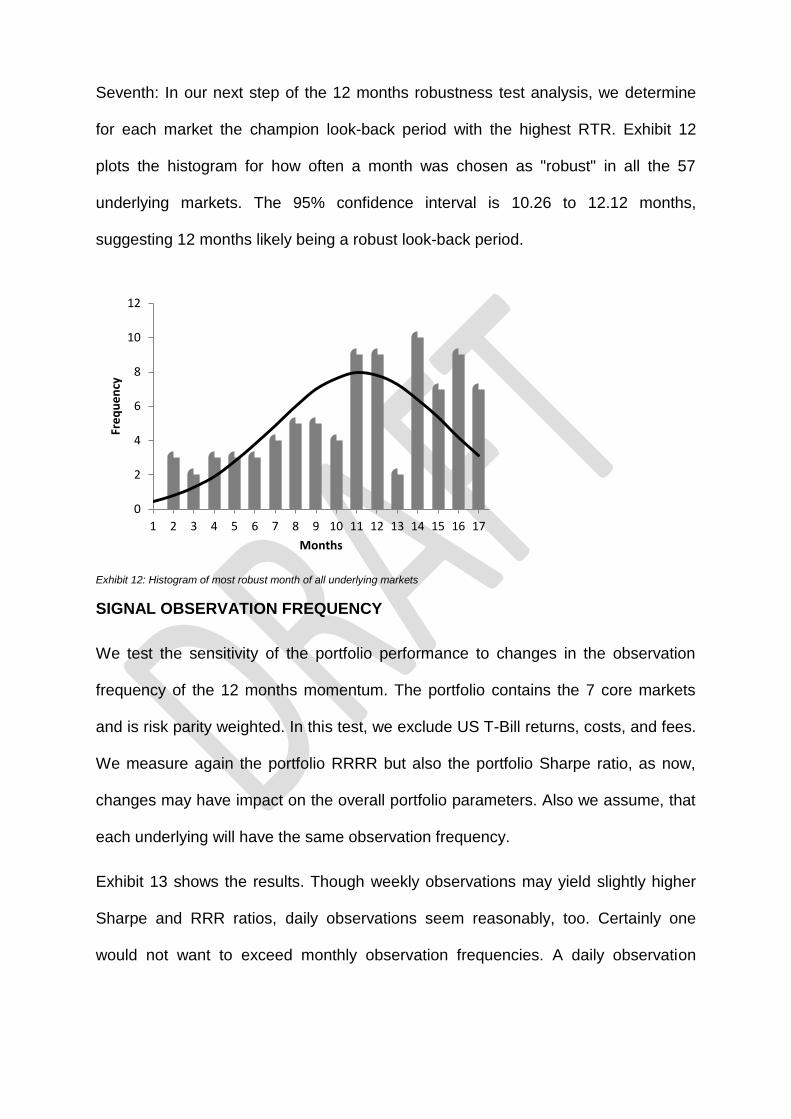
Seventh: In our next step of the 12 months robustness test analysis, we determine
for each market the champion look-back period with the highest RTR. Exhibit 12
plots the histogram for how often a month was chosen as "robust" in all the 57
underlying markets. The 95% confidence interval is 10.26 to 12.12 months,
suggesting 12 months likely being a robust look-back period.
Exhibit 12: Histogram of most robust month of all underlying markets
SIGNAL OBSERVATION FREQUENCY
We test the sensitivity of the portfolio performance to changes in the observation
frequency of the 12 months momentum. The portfolio contains the 7 core markets
and is risk parity weighted. In this test, we exclude US T-Bill returns, costs, and fees.
We measure again the portfolio RRRR but also the portfolio Sharpe ratio, as now,
changes may have impact on the overall portfolio parameters. Also we assume, that
each underlying will have the same observation frequency.
Exhibit 13 shows the results. Though weekly observations may yield slightly higher
Sharpe and RRR ratios, daily observations seem reasonably, too. Certainly one
would not want to exceed monthly observation frequencies. A daily observation
0
2
4
6
8
10
12
1 2 3 4 5 6 7 8 9 10 11 12 13 14 15 16 17
Fre
qu
en
cy
Months
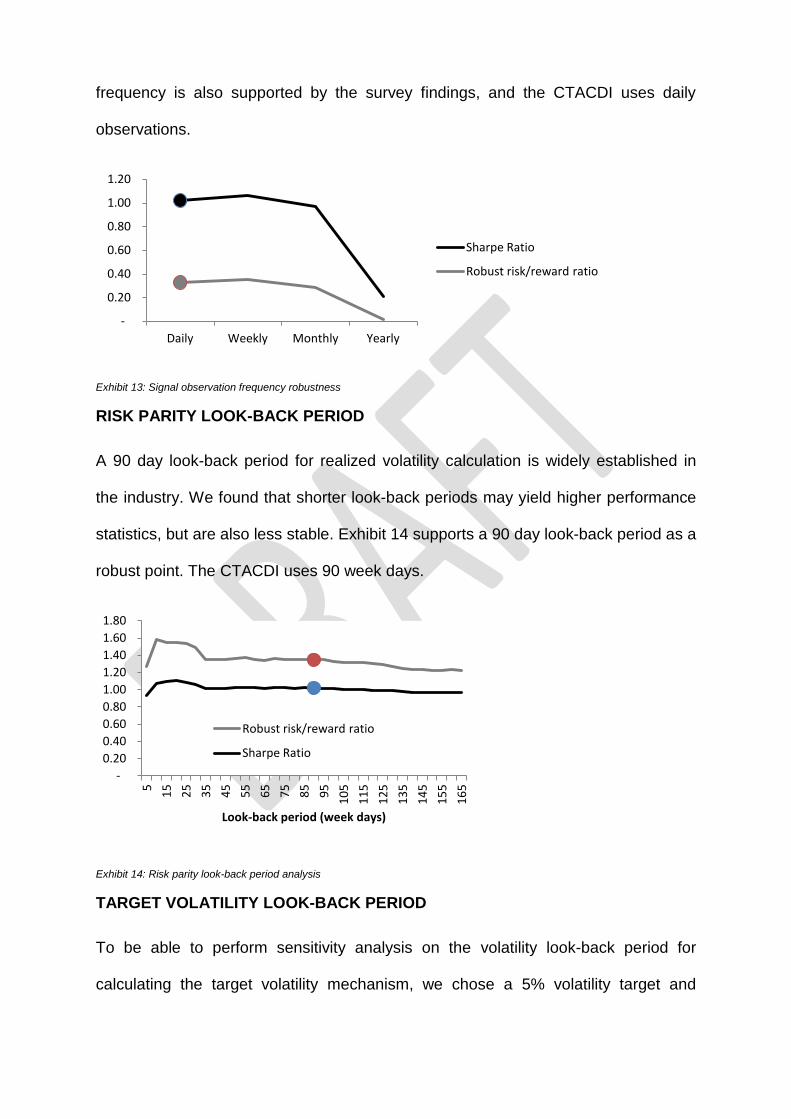
frequency is also supported by the survey findings, and the CTACDI uses daily
observations.
Exhibit 13: Signal observation frequency robustness
RISK PARITY LOOK-BACK PERIOD
A 90 day look-back period for realized volatility calculation is widely established in
the industry. We found that shorter look-back periods may yield higher performance
statistics, but are also less stable. Exhibit 14 supports a 90 day look-back period as a
robust point. The CTACDI uses 90 week days.
Exhibit 14: Risk parity look-back period analysis
TARGET VOLATILITY LOOK-BACK PERIOD
To be able to perform sensitivity analysis on the volatility look-back period for
calculating the target volatility mechanism, we chose a 5% volatility target and
-
0.20
0.40
0.60
0.80
1.00
1.20
Daily Weekly Monthly Yearly
Sharpe Ratio
Robust risk/reward ratio
-
0.20
0.40
0.60
0.80
1.00
1.20
1.40
1.60
1.80
5
15
25
35
45
55
65
75
85
95
10
5
11
5
12
5
13
5
14
5
15
5
16
5
Look-back period (week days)
Robust risk/reward ratio
Sharpe Ratio
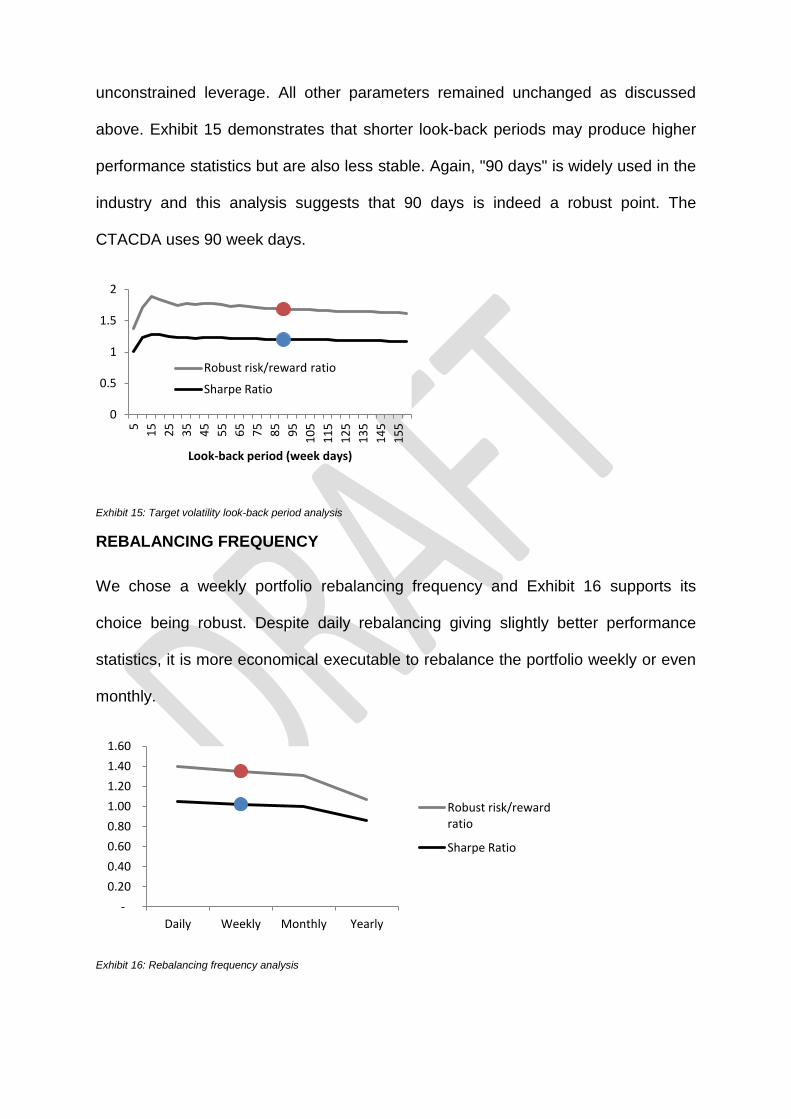
unconstrained leverage. All other parameters remained unchanged as discussed
above. Exhibit 15 demonstrates that shorter look-back periods may produce higher
performance statistics but are also less stable. Again, "90 days" is widely used in the
industry and this analysis suggests that 90 days is indeed a robust point. The
CTACDA uses 90 week days.
Exhibit 15: Target volatility look-back period analysis
REBALANCING FREQUENCY
We chose a weekly portfolio rebalancing frequency and Exhibit 16 supports its
choice being robust. Despite daily rebalancing giving slightly better performance
statistics, it is more economical executable to rebalance the portfolio weekly or even
monthly.
Exhibit 16: Rebalancing frequency analysis
0
0.5
1
1.5
2
5
15
25
35
45
55
65
75
85
95
10
5
11
5
12
5
13
5
14
5
15
5
Look-back period (week days)
Robust risk/reward ratio
Sharpe Ratio
-
0.20
0.40
0.60
0.80
1.00
1.20
1.40
1.60
Daily Weekly Monthly Yearly
Robust risk/reward ratio
Sharpe Ratio
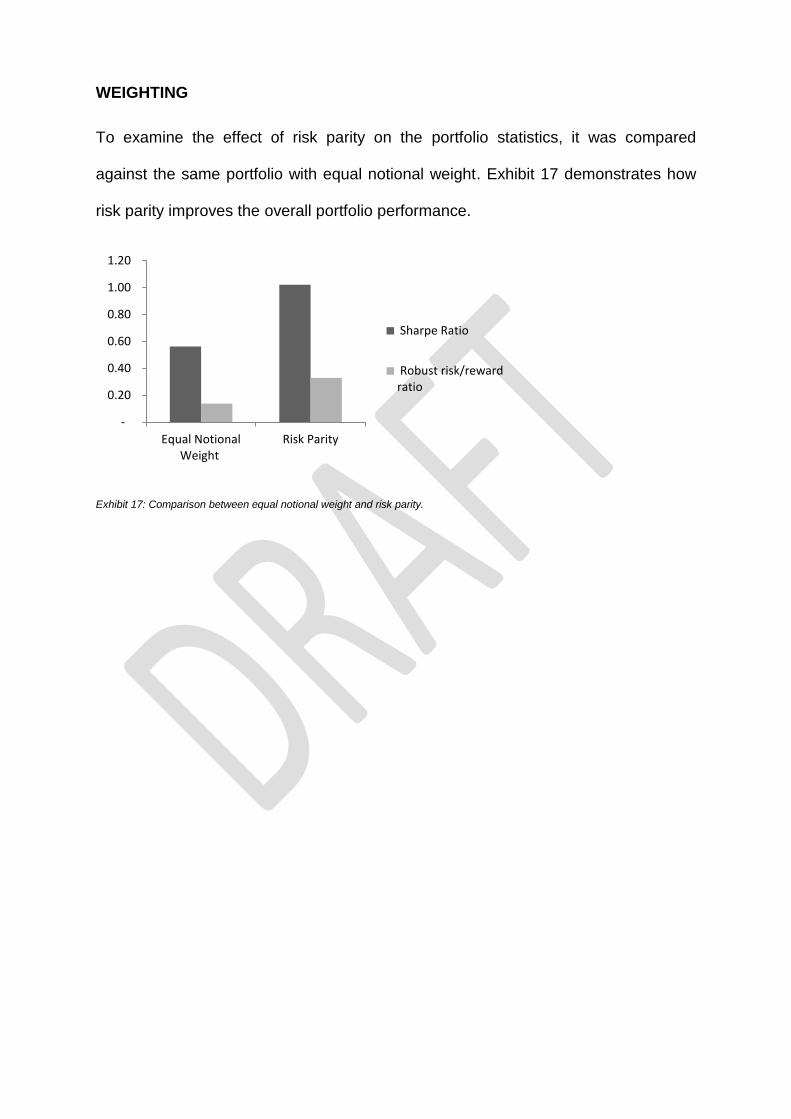
WEIGHTING
To examine the effect of risk parity on the portfolio statistics, it was compared
against the same portfolio with equal notional weight. Exhibit 17 demonstrates how
risk parity improves the overall portfolio performance.
Exhibit 17: Comparison between equal notional weight and risk parity.
-
0.20
0.40
0.60
0.80
1.00
1.20
Equal Notional Weight
Risk Parity
Sharpe Ratio
Robust risk/reward ratio
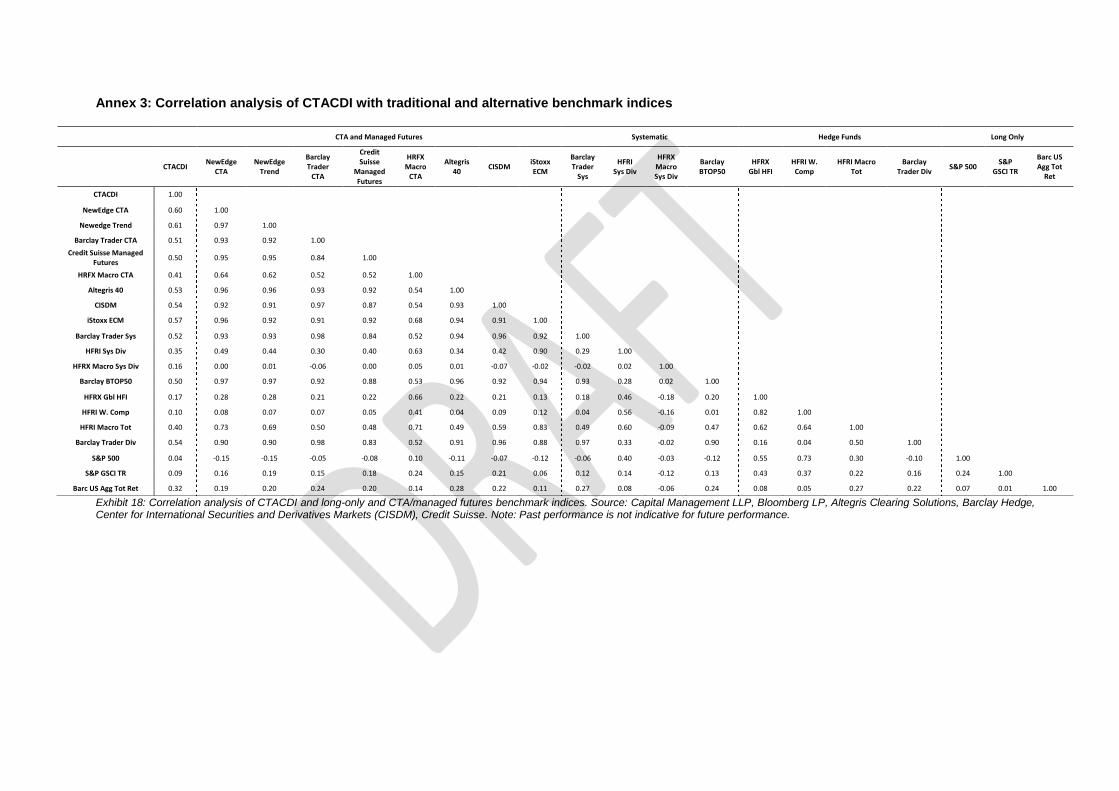
Annex 3: Correlation analysis of CTACDI with traditional and alternative benchmark indices
Exhibit 18: Correlation analysis of CTACDI and long-only and CTA/managed futures benchmark indices. Source: Capital Management LLP, Bloomberg LP, Altegris Clearing Solutions, Barclay Hedge, Center for International Securities and Derivatives Markets (CISDM), Credit Suisse. Note: Past performance is not indicative for future performance.
CTA and Managed Futures Systematic Hedge Funds Long Only
CTACDI
NewEdge CTA
NewEdge Trend
Barclay Trader
CTA
Credit Suisse
Managed Futures
HRFX Macro
CTA
Altegris 40
CISDM iStoxx ECM
Barclay Trader
Sys
HFRI Sys Div
HFRX Macro Sys Div
Barclay BTOP50
HFRX Gbl HFI
HFRI W. Comp
HFRI Macro Tot
Barclay Trader Div
S&P 500 S&P
GSCI TR
Barc US Agg Tot
Ret
CTACDI 1.00
NewEdge CTA 0.60 1.00
Newedge Trend 0.61 0.97 1.00
Barclay Trader CTA 0.51 0.93 0.92 1.00
Credit Suisse Managed Futures
0.50 0.95 0.95 0.84 1.00
HRFX Macro CTA 0.41 0.64 0.62 0.52 0.52 1.00
Altegris 40 0.53 0.96 0.96 0.93 0.92 0.54 1.00
CISDM 0.54 0.92 0.91 0.97 0.87 0.54 0.93 1.00
iStoxx ECM 0.57 0.96 0.92 0.91 0.92 0.68 0.94 0.91 1.00
Barclay Trader Sys 0.52 0.93 0.93 0.98 0.84 0.52 0.94 0.96 0.92 1.00
HFRI Sys Div 0.35 0.49 0.44 0.30 0.40 0.63 0.34 0.42 0.90 0.29 1.00
HFRX Macro Sys Div 0.16 0.00 0.01 -0.06 0.00 0.05 0.01 -0.07 -0.02 -0.02 0.02 1.00
Barclay BTOP50 0.50 0.97 0.97 0.92 0.88 0.53 0.96 0.92 0.94 0.93 0.28 0.02 1.00
HFRX Gbl HFI 0.17 0.28 0.28 0.21 0.22 0.66 0.22 0.21 0.13 0.18 0.46 -0.18 0.20 1.00
HFRI W. Comp 0.10 0.08 0.07 0.07 0.05 0.41 0.04 0.09 0.12 0.04 0.56 -0.16 0.01 0.82 1.00
HFRI Macro Tot 0.40 0.73 0.69 0.50 0.48 0.71 0.49 0.59 0.83 0.49 0.60 -0.09 0.47 0.62 0.64 1.00
Barclay Trader Div 0.54 0.90 0.90 0.98 0.83 0.52 0.91 0.96 0.88 0.97 0.33 -0.02 0.90 0.16 0.04 0.50 1.00
S&P 500 0.04 -0.15 -0.15 -0.05 -0.08 0.10 -0.11 -0.07 -0.12 -0.06 0.40 -0.03 -0.12 0.55 0.73 0.30 -0.10 1.00
S&P GSCI TR 0.09 0.16 0.19 0.15 0.18 0.24 0.15 0.21 0.06 0.12 0.14 -0.12 0.13 0.43 0.37 0.22 0.16 0.24 1.00
Barc US Agg Tot Ret 0.32 0.19 0.20 0.24 0.20 0.14 0.28 0.22 0.11 0.27 0.08 -0.06 0.24 0.08 0.05 0.27 0.22 0.07 0.01 1.00
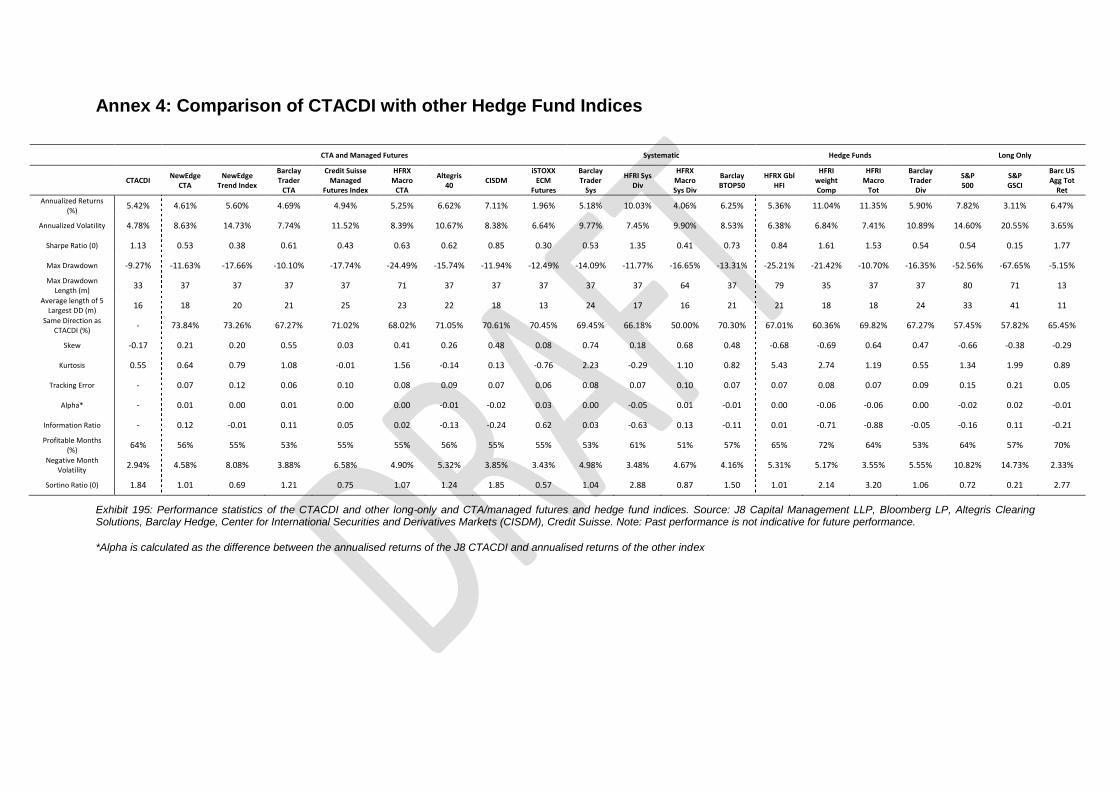
Annex 4: Comparison of CTACDI with other Hedge Fund Indices
CTA and Managed Futures Systematic Hedge Funds Long Only
CTACDI
NewEdge CTA
NewEdge Trend Index
Barclay Trader
CTA
Credit Suisse Managed
Futures Index
HFRX Macro
CTA
Altegris 40
CISDM iSTOXX
ECM Futures
Barclay Trader
Sys
HFRI Sys Div
HFRX Macro Sys Div
Barclay BTOP50
HFRX Gbl HFI
HFRI weight Comp
HFRI Macro
Tot
Barclay Trader
Div
S&P 500
S&P GSCI
Barc US Agg Tot
Ret
Annualized Returns (%)
5.42% 4.61% 5.60% 4.69% 4.94% 5.25% 6.62% 7.11% 1.96% 5.18% 10.03% 4.06% 6.25% 5.36% 11.04% 11.35% 5.90% 7.82% 3.11% 6.47%
Annualized Volatility 4.78% 8.63% 14.73% 7.74% 11.52% 8.39% 10.67% 8.38% 6.64% 9.77% 7.45% 9.90% 8.53% 6.38% 6.84% 7.41% 10.89% 14.60% 20.55% 3.65%
Sharpe Ratio (0) 1.13 0.53 0.38 0.61 0.43 0.63 0.62 0.85 0.30 0.53 1.35 0.41 0.73 0.84 1.61 1.53 0.54 0.54 0.15 1.77
Max Drawdown -9.27% -11.63% -17.66% -10.10% -17.74% -24.49% -15.74% -11.94% -12.49% -14.09% -11.77% -16.65% -13.31% -25.21% -21.42% -10.70% -16.35% -52.56% -67.65% -5.15%
Max Drawdown Length (m)
33 37 37 37 37 71 37 37 37 37 37 64 37 79 35 37 37 80 71 13
Average length of 5 Largest DD (m)
16 18 20 21 25 23 22 18 13 24 17 16 21 21 18 18 24 33 41 11
Same Direction as CTACDI (%)
- 73.84% 73.26% 67.27% 71.02% 68.02% 71.05% 70.61% 70.45% 69.45% 66.18% 50.00% 70.30% 67.01% 60.36% 69.82% 67.27% 57.45% 57.82% 65.45%
Skew -0.17 0.21 0.20 0.55 0.03 0.41 0.26 0.48 0.08 0.74 0.18 0.68 0.48 -0.68 -0.69 0.64 0.47 -0.66 -0.38 -0.29
Kurtosis 0.55 0.64 0.79 1.08 -0.01 1.56 -0.14 0.13 -0.76 2.23 -0.29 1.10 0.82 5.43 2.74 1.19 0.55 1.34 1.99 0.89
Tracking Error - 0.07 0.12 0.06 0.10 0.08 0.09 0.07 0.06 0.08 0.07 0.10 0.07 0.07 0.08 0.07 0.09 0.15 0.21 0.05
Alpha* - 0.01 0.00 0.01 0.00 0.00 -0.01 -0.02 0.03 0.00 -0.05 0.01 -0.01 0.00 -0.06 -0.06 0.00 -0.02 0.02 -0.01
Information Ratio - 0.12 -0.01 0.11 0.05 0.02 -0.13 -0.24 0.62 0.03 -0.63 0.13 -0.11 0.01 -0.71 -0.88 -0.05 -0.16 0.11 -0.21
Profitable Months (%)
64% 56% 55% 53% 55% 55% 56% 55% 55% 53% 61% 51% 57% 65% 72% 64% 53% 64% 57% 70%
Negative Month Volatility
2.94% 4.58% 8.08% 3.88% 6.58% 4.90% 5.32% 3.85% 3.43% 4.98% 3.48% 4.67% 4.16% 5.31% 5.17% 3.55% 5.55% 10.82% 14.73% 2.33%
Sortino Ratio (0) 1.84 1.01 0.69 1.21 0.75 1.07 1.24 1.85 0.57 1.04 2.88 0.87 1.50 1.01 2.14 3.20 1.06 0.72 0.21 2.77
Exhibit 195: Performance statistics of the CTACDI and other long-only and CTA/managed futures and hedge fund indices. Source: J8 Capital Management LLP, Bloomberg LP, Altegris Clearing Solutions, Barclay Hedge, Center for International Securities and Derivatives Markets (CISDM), Credit Suisse. Note: Past performance is not indicative for future performance.
*Alpha is calculated as the difference between the annualised returns of the J8 CTACDI and annualised returns of the other index
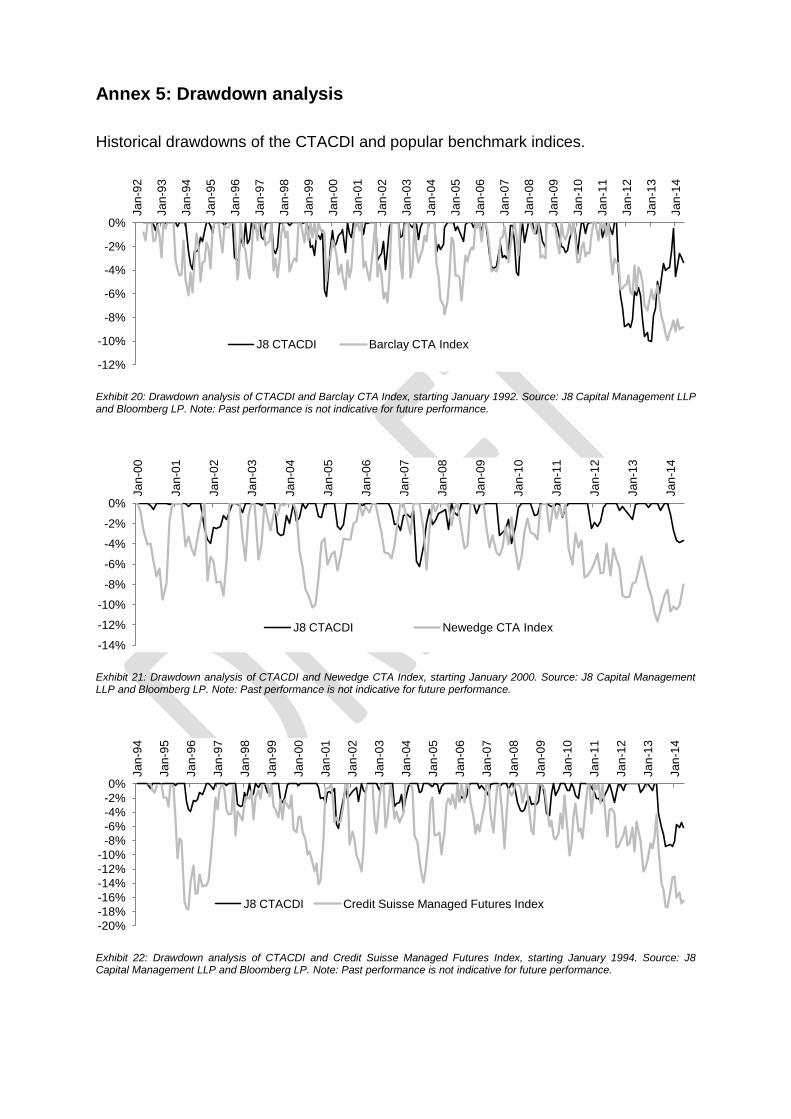
Annex 5: Drawdown analysis
Historical drawdowns of the CTACDI and popular benchmark indices.
Exhibit 20: Drawdown analysis of CTACDI and Barclay CTA Index, starting January 1992. Source: J8 Capital Management LLP and Bloomberg LP. Note: Past performance is not indicative for future performance.
Exhibit 21: Drawdown analysis of CTACDI and Newedge CTA Index, starting January 2000. Source: J8 Capital Management LLP and Bloomberg LP. Note: Past performance is not indicative for future performance.
Exhibit 22: Drawdown analysis of CTACDI and Credit Suisse Managed Futures Index, starting January 1994. Source: J8 Capital Management LLP and Bloomberg LP. Note: Past performance is not indicative for future performance.
-12%
-10%
-8%
-6%
-4%
-2%
0%
Ja
n-9
2
Ja
n-9
3
Ja
n-9
4
Ja
n-9
5
Ja
n-9
6
Ja
n-9
7
Ja
n-9
8
Ja
n-9
9
Ja
n-0
0
Ja
n-0
1
Ja
n-0
2
Ja
n-0
3
Ja
n-0
4
Ja
n-0
5
Ja
n-0
6
Ja
n-0
7
Ja
n-0
8
Ja
n-0
9
Ja
n-1
0
Ja
n-1
1
Ja
n-1
2
Ja
n-1
3
Ja
n-1
4
J8 CTACDI Barclay CTA Index
-14%
-12%
-10%
-8%
-6%
-4%
-2%
0%
Ja
n-0
0
Ja
n-0
1
Ja
n-0
2
Ja
n-0
3
Ja
n-0
4
Ja
n-0
5
Ja
n-0
6
Ja
n-0
7
Ja
n-0
8
Ja
n-0
9
Ja
n-1
0
Ja
n-1
1
Ja
n-1
2
Ja
n-1
3
Ja
n-1
4
J8 CTACDI Newedge CTA Index
-20%
-18%
-16%
-14%
-12%
-10%
-8%
-6%
-4%
-2%
0%
Ja
n-9
4
Ja
n-9
5
Ja
n-9
6
Ja
n-9
7
Ja
n-9
8
Ja
n-9
9
Ja
n-0
0
Ja
n-0
1
Ja
n-0
2
Ja
n-0
3
Ja
n-0
4
Ja
n-0
5
Ja
n-0
6
Ja
n-0
7
Ja
n-0
8
Ja
n-0
9
Ja
n-1
0
Ja
n-1
1
Ja
n-1
2
Ja
n-1
3
Ja
n-1
4
J8 CTACDI Credit Suisse Managed Futures Index
Related Documents
![INDEX [products.thomsonreuters.ca] · CTA see Clinical Trial Application CTA-As see Clinical Trial Application Amendments Canada-United States Free Trade Agreement Canadian obligationsprior](https://static.cupdf.com/doc/110x72/5e7214a38b4de178ac4e68d0/index-cta-see-clinical-trial-application-cta-as-see-clinical-trial-application.jpg)