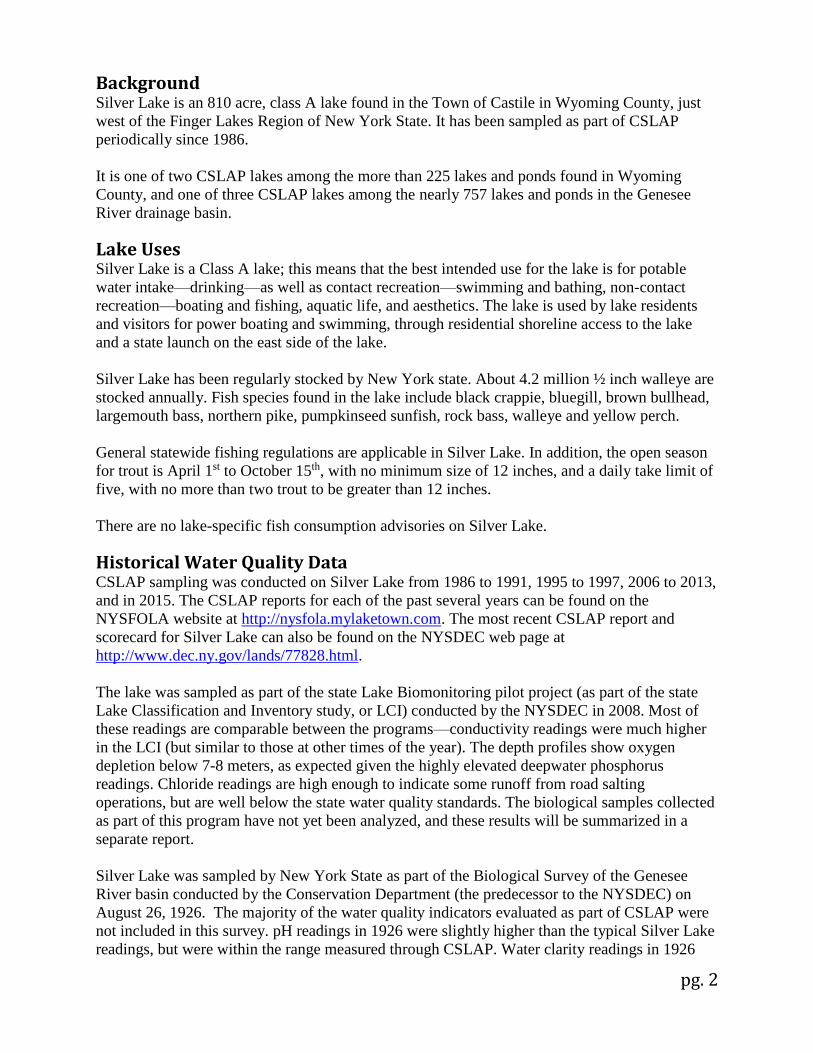
pg. 1 CSLAP 2015 Lake Water Quality Summary: Silver Lake General Lake Information Location Town of Perry County Wyoming Basin Genesee River Size 328.9 hectares (812.4 acres) Lake Origins Natural Watershed Area 5,230 hectares (12,918 acres) Retention Time 1.2 years Mean Depth 7.2 meters Sounding Depth 11.6 meters Public Access? cartop launch Major Tributaries Silver Lake Inlet Lake Tributary To… Silver Lake outlet to Genesee River to Lake Ontario WQ Classification A (potable water) Lake Outlet Latitude 42.716 Lake Outlet Longitude -78.020 Sampling Years 1986-1991, 1995-1997, 2006-2013, 2015 2015 Samplers Frank V. Bright Main Contact Frank V. Bright Lake Map

Welcome message from author
This document is posted to help you gain knowledge. Please leave a comment to let me know what you think about it! Share it to your friends and learn new things together.
Transcript

pg. 1
CSLAP 2015 Lake Water Quality Summary: Silver Lake
General Lake Information Location Town of Perry
County Wyoming
Basin Genesee River
Size 328.9 hectares (812.4 acres)
Lake Origins Natural
Watershed Area 5,230 hectares (12,918 acres)
Retention Time 1.2 years
Mean Depth 7.2 meters
Sounding Depth 11.6 meters
Public Access? cartop launch
Major Tributaries Silver Lake Inlet
Lake Tributary To… Silver Lake outlet to Genesee River to Lake Ontario
WQ Classification A (potable water)
Lake Outlet Latitude 42.716
Lake Outlet Longitude -78.020
Sampling Years 1986-1991, 1995-1997, 2006-2013, 2015
2015 Samplers Frank V. Bright
Main Contact Frank V. Bright
Lake Map
pg. 2
Background Silver Lake is an 810 acre, class A lake found in the Town of Castile in Wyoming County, just
west of the Finger Lakes Region of New York State. It has been sampled as part of CSLAP
periodically since 1986.
It is one of two CSLAP lakes among the more than 225 lakes and ponds found in Wyoming
County, and one of three CSLAP lakes among the nearly 757 lakes and ponds in the Genesee
River drainage basin.
Lake Uses Silver Lake is a Class A lake; this means that the best intended use for the lake is for potable
water intake—drinking—as well as contact recreation—swimming and bathing, non-contact
recreation—boating and fishing, aquatic life, and aesthetics. The lake is used by lake residents
and visitors for power boating and swimming, through residential shoreline access to the lake
and a state launch on the east side of the lake.
Silver Lake has been regularly stocked by New York state. About 4.2 million ½ inch walleye are
stocked annually. Fish species found in the lake include black crappie, bluegill, brown bullhead,
largemouth bass, northern pike, pumpkinseed sunfish, rock bass, walleye and yellow perch.
General statewide fishing regulations are applicable in Silver Lake. In addition, the open season
for trout is April 1st to October 15th, with no minimum size of 12 inches, and a daily take limit of
five, with no more than two trout to be greater than 12 inches.
There are no lake-specific fish consumption advisories on Silver Lake.
Historical Water Quality Data CSLAP sampling was conducted on Silver Lake from 1986 to 1991, 1995 to 1997, 2006 to 2013,
and in 2015. The CSLAP reports for each of the past several years can be found on the
NYSFOLA website at http://nysfola.mylaketown.com. The most recent CSLAP report and
scorecard for Silver Lake can also be found on the NYSDEC web page at
http://www.dec.ny.gov/lands/77828.html.
The lake was sampled as part of the state Lake Biomonitoring pilot project (as part of the state
Lake Classification and Inventory study, or LCI) conducted by the NYSDEC in 2008. Most of
these readings are comparable between the programs—conductivity readings were much higher
in the LCI (but similar to those at other times of the year). The depth profiles show oxygen
depletion below 7-8 meters, as expected given the highly elevated deepwater phosphorus
readings. Chloride readings are high enough to indicate some runoff from road salting
operations, but are well below the state water quality standards. The biological samples collected
as part of this program have not yet been analyzed, and these results will be summarized in a
separate report.
Silver Lake was sampled by New York State as part of the Biological Survey of the Genesee
River basin conducted by the Conservation Department (the predecessor to the NYSDEC) on
August 26, 1926. The majority of the water quality indicators evaluated as part of CSLAP were
not included in this survey. pH readings in 1926 were slightly higher than the typical Silver Lake
readings, but were within the range measured through CSLAP. Water clarity readings in 1926
pg. 3
were about 4.9 meters, higher than in all but a single CSLAP sampling session in 1989 (and
much higher than in recent years in late summer). The lake was thermally stratified, with the
transition from warm water to cold water occurring at a depth of about 20-25 feet. Deepwater
oxygen levels were depressed near the lake bottom (readings about 1.7 ppm, versus about 8.4
ppm at the lake surface). The field notes from this survey indicated the following:
“Silver Lake is a typical, shallow, brown water lake characterized by a fair amount of muddy
shoreline, an abundance of vegetation and a rich bottom of mud.... The lake apparently falls in the
class of typical, brown water, non-bass (small mouthed) lakes."
"Silver Lake, in Wyoming County, lies in a shallow valley with very gradual slopes. The
surrounding hills rise only a few hundred feet above the lake, which is 1,356 feet above sea level.
The lake is about three miles long and about three-quarters of a mile wide in its widest place. Its
shores are mostly stony or gravelly, except that at the north and south ends, where swamps occur,
the shore and bottom are muddy. The lake is fed by springs. A small inlet and the outlet of Silver
Lake both occur at the north end.
The lake is shallow and the flat bottom is mostly about 25-35 feet deep. The deepest bottom
found in the lake was 37 feet. The transparency of the water in Silver Lake is low as compared
to Conesus Lake and may be termed "brown water". A white disc 10cm. in diameter lowered
into the water at noon, August 26, 1926, disappeared from view 16 feet from the surface. On
account of its shallowness and the low transparency of the water, Silver Lake shows no
stratification in its plankton life. Rooted plants occur only in the shallow water near the shore
and at the ends of the lake; none were observed below the 15-foot depth”.
The lake was surveyed in 1976 and 1979 as part of a DEC statewide water quality study. These
data indicate conditions similar to those measured in the mid-1980s through CSLAP. Water
quality monitoring has been conducted as part of state fisheries stocking activities; the results
indicate slightly higher water clarity in the fisheries dataset, but the other data appeared to be
comparable.
The lake has also been studied in the past by the Community College of the Finger Lakes (Dr.
Bruce Gilman), SUNY Geneseo (Dr. Herman Forest) and others.
Neither the Silver Lake inlet nor outlet has been monitored through the NYSDEC Rotating
Intensive Basins (RIBS) program. The outlet was sampled downstream of Perry (about 6 km
downstream from the lake) through the state stream macroinvertebrate monitoring program in
1995 and 1999. The summary of this sampling was as follows:
“Based on macroinvertebrate sampling downstream of Perry in 1999, water quality was
assessed as moderately impacted. The sample was dominated by filtering caddisfly larvae. The
impact was likely a combination of impoundment effect and enrichment from the Perry sewage
treatment facility. The stream was previously sampled in 1995, and was also determined to be
slightly impacted”.
Lake Association and Management History Silver Lake is served by the Silver Lake Association. The lake association is involved in a
number of lake improvement and social activities.

pg. 4
The lake association maintains a web site at http://www.silverlakeassociation.org/
Summary of 2015 CSLAP Sampling Results
Evaluation of 2015 Annual and Monthly Results Relative to 2006-2013 The summer (mid-June through mid-September) average readings are compared to historical
averages for all CSLAP sampling seasons in the “Lake Condition Summary” table, and are
compared to individual historical CSLAP sampling seasons in the “Long Term Data Plots –
Silver Lake” section in Appendix C.
Evaluation of Eutrophication Indicators Water quality conditions in Silver Lake were probably close to normal in 2015, recognizing that
these conditions vary from year to year. Water clarity was slightly higher than usual, consistent
with lower than usual (open water) algae (chlorophyll a) levels. However, nutrient (phosphorus)
readings were higher than usual, and phosphorus levels have increased over the last 15-20 years,
although these readings decreased from the mid-1980s to the mid-1990s. Neither water clarity
nor chlorophyll a has exhibited any clear long-term trends.
Lake productivity usually increases from mid-summer into early fall, as manifested in decreasing
water clarity and increasing nutrient and algae levels, and then decreases in the fall. In 2015, the
drop in lake productivity occurred in mid-summer.
The lake can be characterized as mesoeutrophic, or moderately to highly productive, based on
water clarity (typical of mesotrophic lakes), total phosphorus and chlorophyll a readings (both
typical of eutrophic lakes). The trophic state indices (TSI) evaluation suggests that water clarity
and phosphorus readings are usually higher than expected given the chlorophyll a readings in the
lake. This discrepancy may be due to the effect of zebra mussels. Overall trophic conditions are
summarized on the Lake Scorecard and Lake Condition Summary Table.
Evaluation of Potable Water Indicators Algae levels are frequently high enough to render the lake susceptible to taste and odor
compounds or elevated DBP (disinfection by product) compounds that could affect the potability
of the water, although it is not known if this results in any actual impacts to drinking water.
Deepwater phosphorus, ammonia, iron, manganese, and arsenic readings are higher than those
measured at the lake surface, and these manganese levels exceed the state water quality
standards, so deepwater intakes may not support potable water use (although these deepwater
indicators have not been sampled in recent years). Potable water conditions, at least as
measurable through CSLAP, are summarized in the Lake Scorecard and Lake Condition
Summary Table.
Evaluation of Limnological Indicators Each of the nitrogen indicators (NOx, ammonia and total nitrogen) were higher than usual in
2015, and NOx and total nitrogen have generally increased since the late 1990s. Color readings
were higher after the change in laboratories in 2002, but have varied since then. Each of the other
limnological indicators was close to normal in 2015, although conductivity has decreased over
the last two decades.

pg. 5
Chloride levels in the 2015 samples, conducted for the first time through CSLAP and cited in
Appendix A, ranged from 33 to 88 mg/l. These values are within the range of “moderate” to
“major” road salt runoff levels cited by the New Hampshire DES. These readings are well below
the state potable water quality standard of 250 mg/l but above the range of values found in a
number of NYS lakes.
Overall limnological conditions are summarized in the Lake Scorecard and Lake Condition
Summary Table.
Evaluation of Biological Condition Limited macrophyte surveys have been conducted through CSLAP at Silver Lake. At least 5
aquatic plant species have been found, including at least one exotic plant species (Myriophyllum
spicatum, Eurasian watermilfoil). The biological survey of the lake conducted by the
Conservation Department in 1926 found at least 27 aquatic plant species, including at least one
other exotic plant species (Potamogeton crispus, curly-leafed pondweed) and at least one
protected plant species (Megalodonta beckii, water marigold). The modified floristic quality
index (FQI) for the lake based on CSLAP data indicates that the quality of the aquatic plant
community is “poor,” while the FQI based on the 1926 data indicates that the quality of the
aquatic plant community is “fair.”
The 2008 macroinvertebrate survey of the lake found few macroinvertebrates, probably due to an
incomplete collection of organisms rather than the lack of macroinvertebrates in the lake. The
limited data indicate taxa mostly sensitive to water quality changes (typical of high water quality
lakes) but no organisms associated with good water quality. Additional work will be required to
fully evaluate these apparently contradictory results.
The composition of the fish community is comprised of at least five warmwater fish species, and
at least four coolwater fish species. This suggests that the lake can most likely be characterized
as a coolwater fishery.
Zooplankton have not been evaluated through CSLAP in Silver Lake. The fluoroprobe screening
samples analyzed by SUNY ESF in previous years found relatively low algae levels and a low
percentage of blue green algae, with higher readings in the fall in response to higher phosphorus
readings. The higher algae levels and blue green algae levels in the fall are dominated by
Microcystis, a blue green algae species capable of producing toxins. In 2015, both open water
and shoreline blue green algae blooms were reported, with elevated toxin levels in some late July
samples.
Biological conditions in the lake are summarized in the Lake Scorecard and Lake Condition
Summary Table.
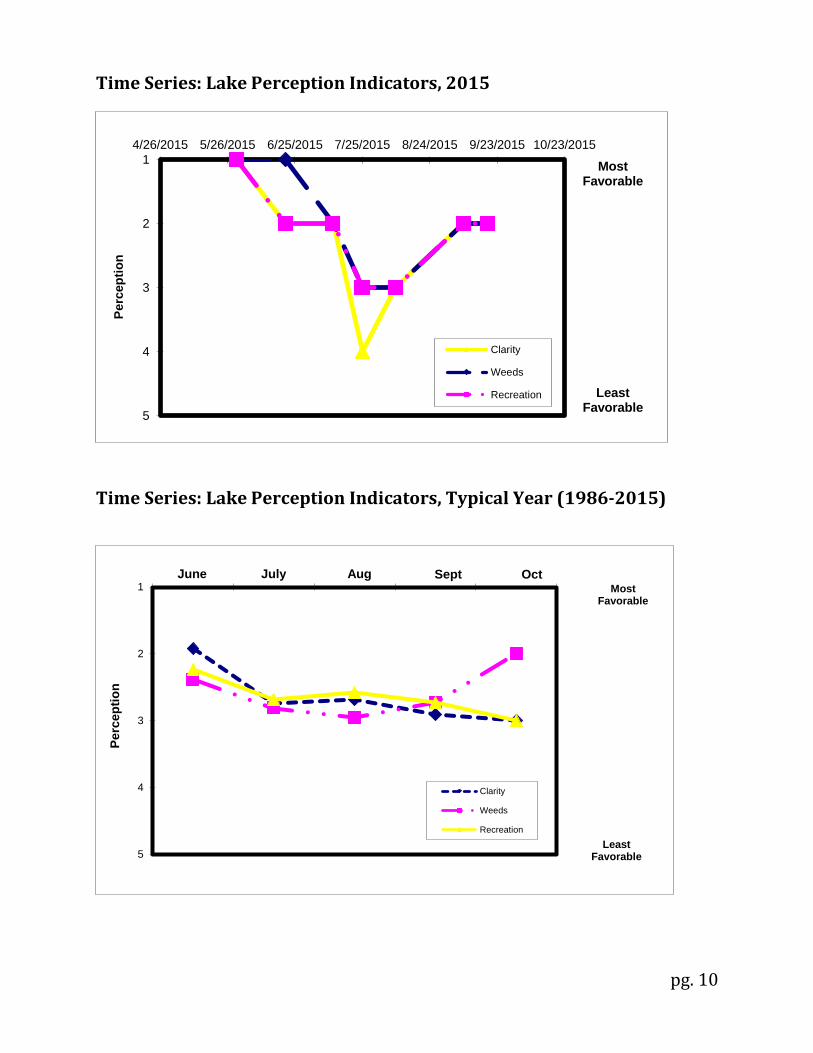
Evaluation of Lake Perception Water quality and recreational conditions were close to normal in 2015, perhaps consistent with
lower algae levels and lower water clarity. Plant coverage was lower than usual in 2015; it is not
known if this is due to active management or if it is associated with reduced growth of native or
exotic plants. Recreational assessments are affected by both weeds and algae, and have improved
slightly since the mid-1990s. Water quality and recreational assessments degrade over the typical
summer, consistent with the seasonally increasing lake productivity and weed coverage
pg. 6
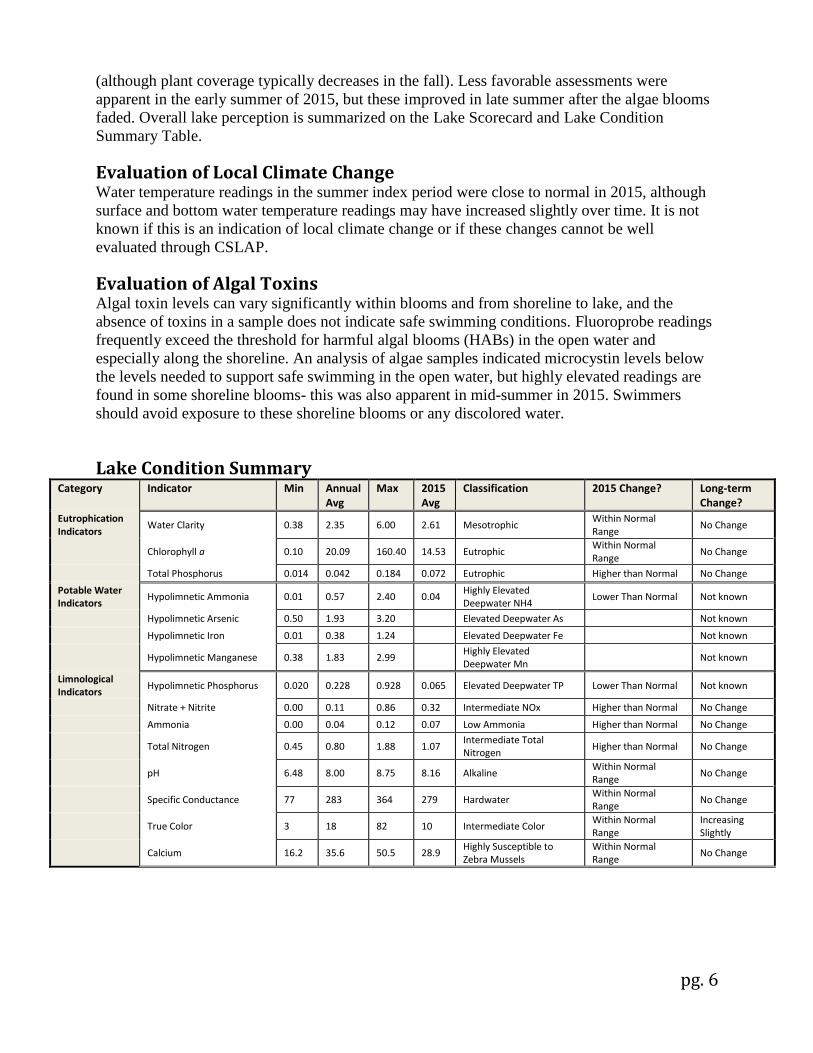
(although plant coverage typically decreases in the fall). Less favorable assessments were
apparent in the early summer of 2015, but these improved in late summer after the algae blooms
faded. Overall lake perception is summarized on the Lake Scorecard and Lake Condition
Summary Table.
Evaluation of Local Climate Change Water temperature readings in the summer index period were close to normal in 2015, although
surface and bottom water temperature readings may have increased slightly over time. It is not
known if this is an indication of local climate change or if these changes cannot be well
evaluated through CSLAP.
Evaluation of Algal Toxins Algal toxin levels can vary significantly within blooms and from shoreline to lake, and the
absence of toxins in a sample does not indicate safe swimming conditions. Fluoroprobe readings
frequently exceed the threshold for harmful algal blooms (HABs) in the open water and
especially along the shoreline. An analysis of algae samples indicated microcystin levels below
the levels needed to support safe swimming in the open water, but highly elevated readings are
found in some shoreline blooms- this was also apparent in mid-summer in 2015. Swimmers
should avoid exposure to these shoreline blooms or any discolored water.
Lake Condition Summary Category Indicator Min Annual
Avg Max 2015
Avg Classification 2015 Change? Long-term
Change?
Eutrophication Indicators
Water Clarity 0.38 2.35 6.00 2.61 Mesotrophic Within Normal Range
No Change
Chlorophyll a 0.10 20.09 160.40 14.53 Eutrophic Within Normal Range
No Change
Total Phosphorus 0.014 0.042 0.184 0.072 Eutrophic Higher than Normal No Change
Potable Water Indicators
Hypolimnetic Ammonia 0.01 0.57 2.40 0.04 Highly Elevated Deepwater NH4
Lower Than Normal Not known
Hypolimnetic Arsenic 0.50 1.93 3.20 Elevated Deepwater As Not known
Hypolimnetic Iron 0.01 0.38 1.24 Elevated Deepwater Fe Not known
Hypolimnetic Manganese 0.38 1.83 2.99 Highly Elevated Deepwater Mn
Not known
Limnological Indicators
Hypolimnetic Phosphorus 0.020 0.228 0.928 0.065 Elevated Deepwater TP Lower Than Normal Not known
Nitrate + Nitrite 0.00 0.11 0.86 0.32 Intermediate NOx Higher than Normal No Change
Ammonia 0.00 0.04 0.12 0.07 Low Ammonia Higher than Normal No Change
Total Nitrogen 0.45 0.80 1.88 1.07 Intermediate Total Nitrogen
Higher than Normal No Change
pH 6.48 8.00 8.75 8.16 Alkaline Within Normal Range
No Change
Specific Conductance 77 283 364 279 Hardwater Within Normal Range
No Change
True Color 3 18 82 10 Intermediate Color Within Normal Range
Increasing Slightly
Calcium 16.2 35.6 50.5 28.9 Highly Susceptible to Zebra Mussels
Within Normal Range
No Change

pg. 7
Category Indicator Min Annual Avg
Max 2015 Avg
Classification 2015 Change? Long-term Change?
Lake Perception
WQ Assessment 1 2.5 5 2.3 Not Quite Crystal Clear Within Normal Range
No Change
Aquatic Plant Coverage 1 2.6 4 2.0 Surface Plant Growth Less Coverage Than Normal
Slightly Improving
Recreational Assessment 1 2.5 4 2.1 Excellent Within Normal Range
Slightly Improving
Biological Condition
Phytoplankton Not measured through CSLAP
Not known Not known
Macrophytes Poor quality of the aquatic plant community
Not known Not known
Zooplankton Not measured through CSLAP
Not known Not known
Macroinvertebrates Contradictory results Not known Not known
Fish Coolwater fishery Not known Not known
Invasive Species Zebra mussels, rudd, Eurasian watermilfoil, curly-leafed pondweed
Not known Not known
Local Climate Change
Air Temperature 10 21.9 37 25.4 Higher Than Normal No Change
Water Temperature 10 21.0 27 21.3 Within Normal Range
No Change
Harmful Algal Blooms
Open Water Phycocyanin 3 117 700 93 Most readings indicate high risk of BGA
Not known Not known
Open Water FP Chl.a 1 14 99 26 Few readings indicate high algae levels
Not known Not known
Open Water FP BG Chl.a 0 7 75 17 Few readings indicate high BGA levels
Not known Not known
Open Water Microcystis <DL 0.5 7.2 <DL Mostly undetectable open water MC-LR
Not known Not known
Open Water Anatoxin a <DL <DL <DL <DL Open water Anatoxin-a consistently not detectable
Not known Not known
Shoreline Phycocyanin No shoreline blooms sampled for PC
Not known Not known
Shoreline FP Chl.a 7.3 3944 10569 3944 Most readings indicate high algae levels
Not known Not known
Shoreline FP BG Chl.a 4.1 3316 9375 3316 Most readings indicate high BGA levels
Not known Not known
Shoreline Microcystis <DL 151 815 <DL Very high shoreline bloom MC-LR
Not known Not known
Shoreline Anatoxin a <DL <DL <DL <DL Shoreline bloom Anatoxin-a consistently not detectable
Not known Not known
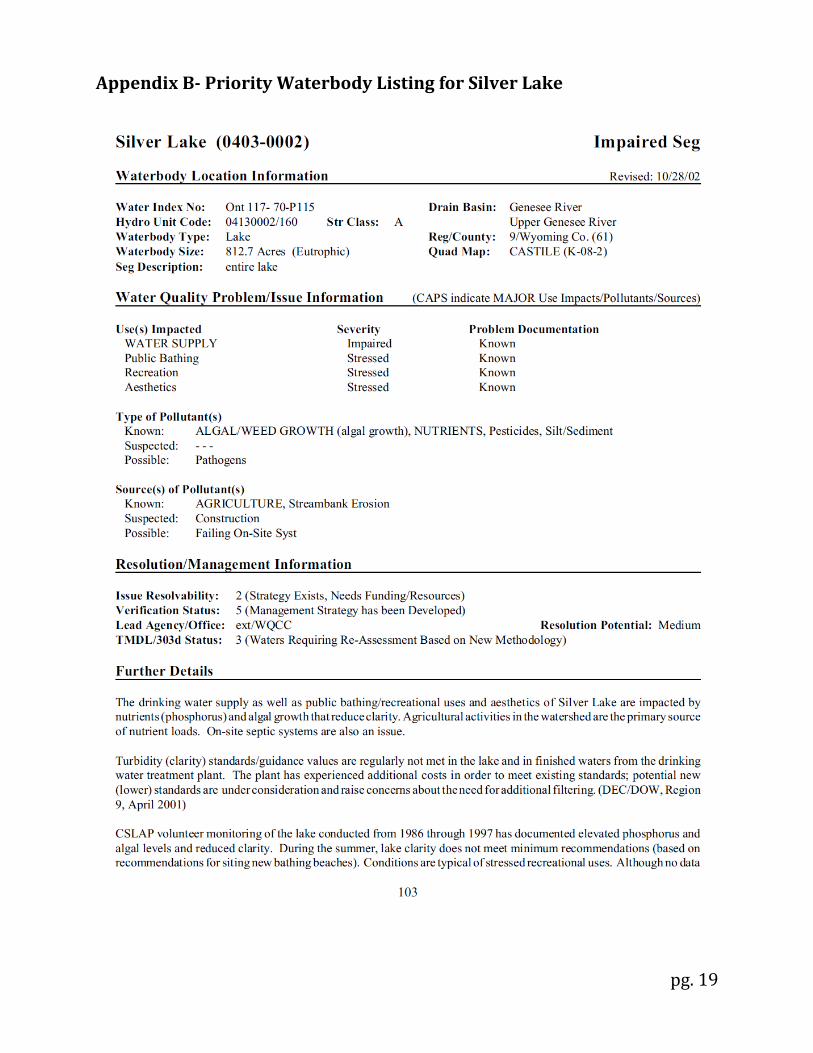
Evaluation of Lake Condition Impacts to Lake Uses Silver Lake is presently among the lakes listed on the Genesee River Basin Priority Waterbody
List (2002). Water supply is identified as impaired, and public bathing, recreation, and aesthetics
are listed as stressed. The PWL listing for Silver Lake is listed in Appendix B.
Potable Water (Drinking Water) The CSLAP dataset at Silver Lake, including water chemistry data, physical measurements, and
volunteer samplers’ perception data, is inadequate to evaluate the use of the lake for potable
water. The moderate to high algae levels indicate that potable water use from the surface waters
of the lake may be id, and elevated deepwater manganese readings may stress potable water use
of the lake through deep intakes.

pg. 8
Public Bathing The CSLAP dataset at Silver Lake, including water chemistry data, physical measurements, and
volunteer samplers’ perception data, suggests that public bathing, if conducted at a public
swimming beach, may be stressed by excessive algae, shoreline algae blooms, and poor water
clarity. Additional information about bacterial levels is needed to evaluate the safety of the water
for swimming.
Recreation (Swimming and Non-Contact Uses) The CSLAP dataset on Silver Lake, including water chemistry data, physical measurements, and
volunteer samplers’ perception data, suggest that recreation may be impaired by excessive algae
and shoreline blooms.
Aquatic Life The CSLAP dataset on Silver Lake, including water chemistry data, physical measurements, and
volunteer samplers’ perception data, suggest that aquatic life may be stressed by hypolimnetic
hypoxia (depressed deepwater oxygen readings) and threatened by road salt runoff. Additional
data are needed to evaluate the food and habitat conditions for aquatic organisms in the lake.
Aesthetics and Habitat The CSLAP dataset on Silver Lake, including water chemistry data, physical measurements, and
volunteer samplers’ perception data, suggest that aesthetics may be poor due to poor perception
from excessive algae, particularly the presence of shoreline blue green algae blooms. Habitat
may be fair due to invasive plants (Eurasian watermilfoil).
Fish Consumption There are no fish consumption advisories posted for Silver Lake.
Additional Comments and Recommendations Additional aquatic plant survey data may help to determine if the aquatic plant community is
dominated by exotic plants, or if the occasional management of the nuisance weed problems in
the lake has resulted in a shift to dominance by native plant species. Lake residents should report
and avoid exposure to any shoreline algae blooms.
Aquatic Plant IDs-2015 None submitted for identification in 2015.

pg. 9
Time Series: Trophic Indicators, 2015
Time Series: Trophic Indicators, Typical Year (1986-2015)
0
1
2
3
4
50
20
40
60
80
100
120
140
160
180
200
4/26/2015 5/26/2015 6/25/2015 7/25/2015 8/24/2015 9/23/2015 10/23/2015
Zsd
, m
TP
an
d C
hl.
a, µ
g/l
TotalP
Chl.a
Zsd
0
0.5
1
1.5
2
2.5
3
3.50
10
20
30
40
50
60
70
80
Zsd
(m
)
TP
an
d C
hl.
a (
µg
/l)
TP
Chl.a
Zsd
June July Aug Sept Oct
pg. 10
Time Series: Lake Perception Indicators, 2015
Time Series: Lake Perception Indicators, Typical Year (1986-2015)
1
2
3
4
5
4/26/2015 5/26/2015 6/25/2015 7/25/2015 8/24/2015 9/23/2015 10/23/2015
Perc
ep
tio
n
Clarity
Weeds
Recreation
Most Favorable
Least Favorable
1
2
3
4
5
Clarity
Weeds
Recreation
June July Aug Sept OctMost
Favorable
Least Favorable
Perc
ep
tio
n
pg. 11
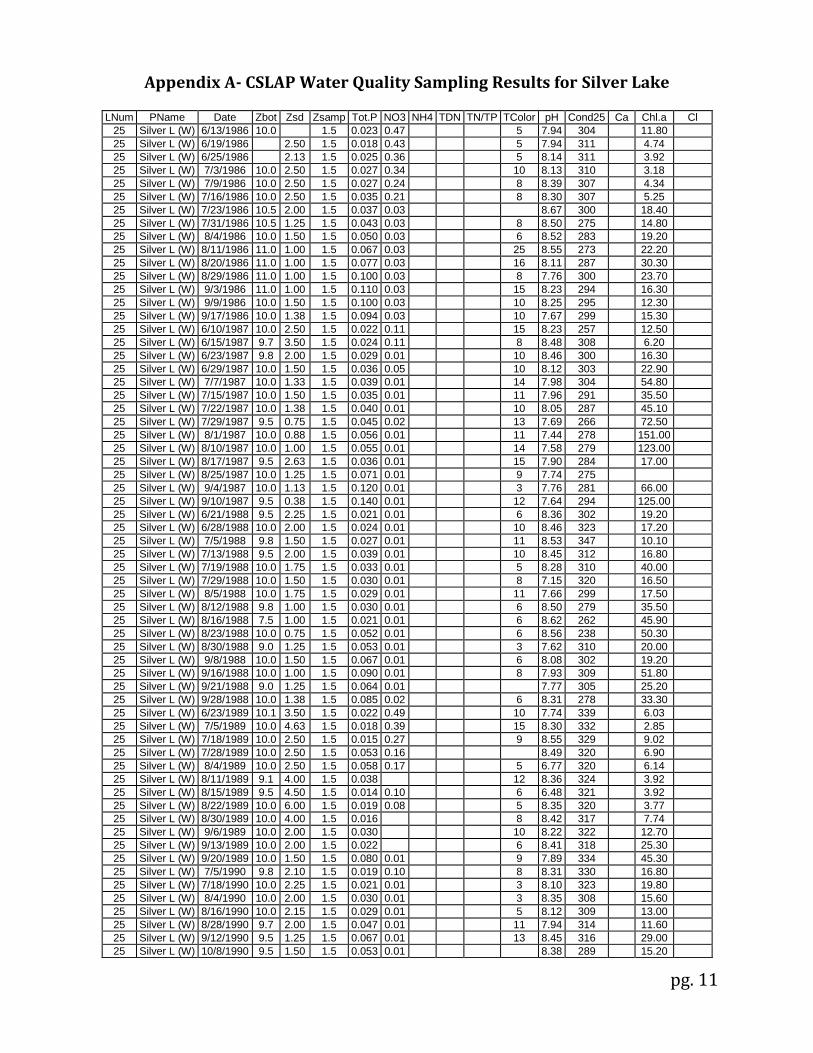
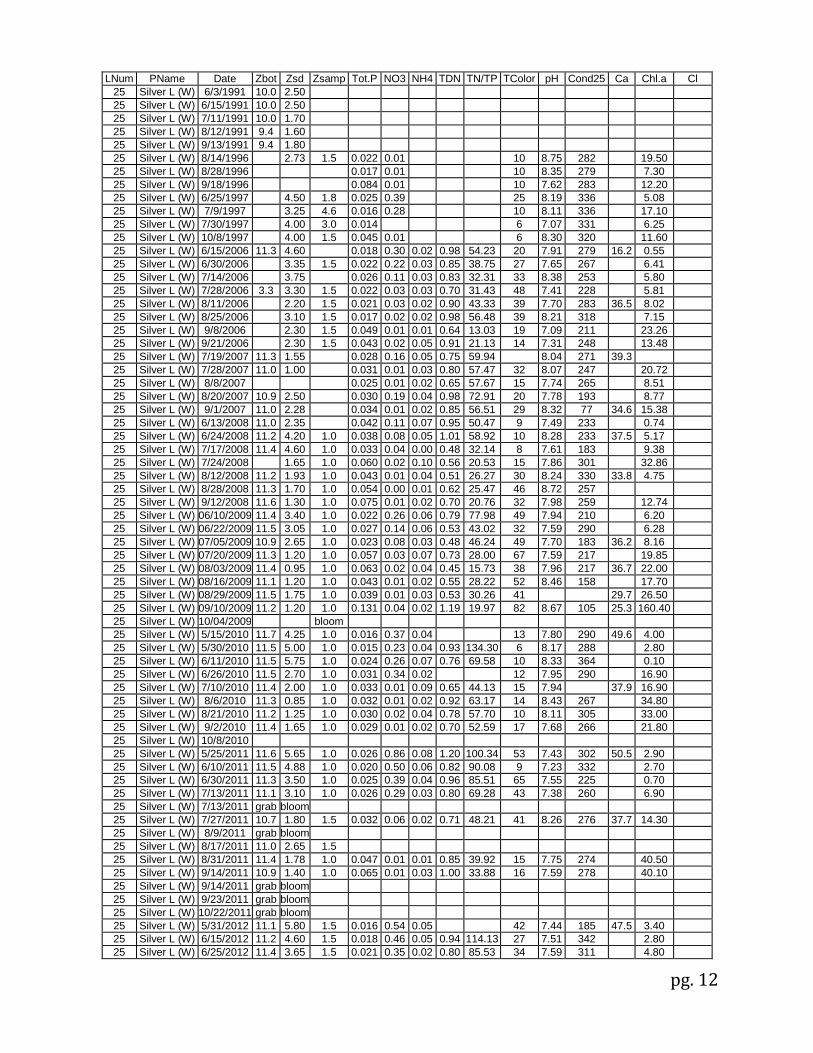
Appendix A- CSLAP Water Quality Sampling Results for Silver Lake
LNum PName Date Zbot Zsd Zsamp Tot.P NO3 NH4 TDN TN/TP TColor pH Cond25 Ca Chl.a Cl
25 Silver L (W) 6/13/1986 10.0 1.5 0.023 0.47 5 7.94 304 11.80
25 Silver L (W) 6/19/1986 2.50 1.5 0.018 0.43 5 7.94 311 4.74
25 Silver L (W) 6/25/1986 2.13 1.5 0.025 0.36 5 8.14 311 3.92
25 Silver L (W) 7/3/1986 10.0 2.50 1.5 0.027 0.34 10 8.13 310 3.18
25 Silver L (W) 7/9/1986 10.0 2.50 1.5 0.027 0.24 8 8.39 307 4.34
25 Silver L (W) 7/16/1986 10.0 2.50 1.5 0.035 0.21 8 8.30 307 5.25
25 Silver L (W) 7/23/1986 10.5 2.00 1.5 0.037 0.03 8.67 300 18.40
25 Silver L (W) 7/31/1986 10.5 1.25 1.5 0.043 0.03 8 8.50 275 14.80
25 Silver L (W) 8/4/1986 10.0 1.50 1.5 0.050 0.03 6 8.52 283 19.20
25 Silver L (W) 8/11/1986 11.0 1.00 1.5 0.067 0.03 25 8.55 273 22.20
25 Silver L (W) 8/20/1986 11.0 1.00 1.5 0.077 0.03 16 8.11 287 30.30
25 Silver L (W) 8/29/1986 11.0 1.00 1.5 0.100 0.03 8 7.76 300 23.70
25 Silver L (W) 9/3/1986 11.0 1.00 1.5 0.110 0.03 15 8.23 294 16.30
25 Silver L (W) 9/9/1986 10.0 1.50 1.5 0.100 0.03 10 8.25 295 12.30
25 Silver L (W) 9/17/1986 10.0 1.38 1.5 0.094 0.03 10 7.67 299 15.30
25 Silver L (W) 6/10/1987 10.0 2.50 1.5 0.022 0.11 15 8.23 257 12.50
25 Silver L (W) 6/15/1987 9.7 3.50 1.5 0.024 0.11 8 8.48 308 6.20
25 Silver L (W) 6/23/1987 9.8 2.00 1.5 0.029 0.01 10 8.46 300 16.30
25 Silver L (W) 6/29/1987 10.0 1.50 1.5 0.036 0.05 10 8.12 303 22.90
25 Silver L (W) 7/7/1987 10.0 1.33 1.5 0.039 0.01 14 7.98 304 54.80
25 Silver L (W) 7/15/1987 10.0 1.50 1.5 0.035 0.01 11 7.96 291 35.50
25 Silver L (W) 7/22/1987 10.0 1.38 1.5 0.040 0.01 10 8.05 287 45.10
25 Silver L (W) 7/29/1987 9.5 0.75 1.5 0.045 0.02 13 7.69 266 72.50
25 Silver L (W) 8/1/1987 10.0 0.88 1.5 0.056 0.01 11 7.44 278 151.00
25 Silver L (W) 8/10/1987 10.0 1.00 1.5 0.055 0.01 14 7.58 279 123.00
25 Silver L (W) 8/17/1987 9.5 2.63 1.5 0.036 0.01 15 7.90 284 17.00
25 Silver L (W) 8/25/1987 10.0 1.25 1.5 0.071 0.01 9 7.74 275
25 Silver L (W) 9/4/1987 10.0 1.13 1.5 0.120 0.01 3 7.76 281 66.00
25 Silver L (W) 9/10/1987 9.5 0.38 1.5 0.140 0.01 12 7.64 294 125.00
25 Silver L (W) 6/21/1988 9.5 2.25 1.5 0.021 0.01 6 8.36 302 19.20
25 Silver L (W) 6/28/1988 10.0 2.00 1.5 0.024 0.01 10 8.46 323 17.20
25 Silver L (W) 7/5/1988 9.8 1.50 1.5 0.027 0.01 11 8.53 347 10.10
25 Silver L (W) 7/13/1988 9.5 2.00 1.5 0.039 0.01 10 8.45 312 16.80
25 Silver L (W) 7/19/1988 10.0 1.75 1.5 0.033 0.01 5 8.28 310 40.00
25 Silver L (W) 7/29/1988 10.0 1.50 1.5 0.030 0.01 8 7.15 320 16.50
25 Silver L (W) 8/5/1988 10.0 1.75 1.5 0.029 0.01 11 7.66 299 17.50
25 Silver L (W) 8/12/1988 9.8 1.00 1.5 0.030 0.01 6 8.50 279 35.50
25 Silver L (W) 8/16/1988 7.5 1.00 1.5 0.021 0.01 6 8.62 262 45.90
25 Silver L (W) 8/23/1988 10.0 0.75 1.5 0.052 0.01 6 8.56 238 50.30
25 Silver L (W) 8/30/1988 9.0 1.25 1.5 0.053 0.01 3 7.62 310 20.00
25 Silver L (W) 9/8/1988 10.0 1.50 1.5 0.067 0.01 6 8.08 302 19.20
25 Silver L (W) 9/16/1988 10.0 1.00 1.5 0.090 0.01 8 7.93 309 51.80
25 Silver L (W) 9/21/1988 9.0 1.25 1.5 0.064 0.01 7.77 305 25.20
25 Silver L (W) 9/28/1988 10.0 1.38 1.5 0.085 0.02 6 8.31 278 33.30
25 Silver L (W) 6/23/1989 10.1 3.50 1.5 0.022 0.49 10 7.74 339 6.03
25 Silver L (W) 7/5/1989 10.0 4.63 1.5 0.018 0.39 15 8.30 332 2.85
25 Silver L (W) 7/18/1989 10.0 2.50 1.5 0.015 0.27 9 8.55 329 9.02
25 Silver L (W) 7/28/1989 10.0 2.50 1.5 0.053 0.16 8.49 320 6.90
25 Silver L (W) 8/4/1989 10.0 2.50 1.5 0.058 0.17 5 6.77 320 6.14
25 Silver L (W) 8/11/1989 9.1 4.00 1.5 0.038 12 8.36 324 3.92
25 Silver L (W) 8/15/1989 9.5 4.50 1.5 0.014 0.10 6 6.48 321 3.92
25 Silver L (W) 8/22/1989 10.0 6.00 1.5 0.019 0.08 5 8.35 320 3.77
25 Silver L (W) 8/30/1989 10.0 4.00 1.5 0.016 8 8.42 317 7.74
25 Silver L (W) 9/6/1989 10.0 2.00 1.5 0.030 10 8.22 322 12.70
25 Silver L (W) 9/13/1989 10.0 2.00 1.5 0.022 6 8.41 318 25.30
25 Silver L (W) 9/20/1989 10.0 1.50 1.5 0.080 0.01 9 7.89 334 45.30
25 Silver L (W) 7/5/1990 9.8 2.10 1.5 0.019 0.10 8 8.31 330 16.80
25 Silver L (W) 7/18/1990 10.0 2.25 1.5 0.021 0.01 3 8.10 323 19.80
25 Silver L (W) 8/4/1990 10.0 2.00 1.5 0.030 0.01 3 8.35 308 15.60
25 Silver L (W) 8/16/1990 10.0 2.15 1.5 0.029 0.01 5 8.12 309 13.00
25 Silver L (W) 8/28/1990 9.7 2.00 1.5 0.047 0.01 11 7.94 314 11.60
25 Silver L (W) 9/12/1990 9.5 1.25 1.5 0.067 0.01 13 8.45 316 29.00
25 Silver L (W) 10/8/1990 9.5 1.50 1.5 0.053 0.01 8.38 289 15.20
pg. 12
LNum PName Date Zbot Zsd Zsamp Tot.P NO3 NH4 TDN TN/TP TColor pH Cond25 Ca Chl.a Cl
25 Silver L (W) 6/3/1991 10.0 2.50
25 Silver L (W) 6/15/1991 10.0 2.50
25 Silver L (W) 7/11/1991 10.0 1.70
25 Silver L (W) 8/12/1991 9.4 1.60
25 Silver L (W) 9/13/1991 9.4 1.80
25 Silver L (W) 8/14/1996 2.73 1.5 0.022 0.01 10 8.75 282 19.50
25 Silver L (W) 8/28/1996 0.017 0.01 10 8.35 279 7.30
25 Silver L (W) 9/18/1996 0.084 0.01 10 7.62 283 12.20
25 Silver L (W) 6/25/1997 4.50 1.8 0.025 0.39 25 8.19 336 5.08
25 Silver L (W) 7/9/1997 3.25 4.6 0.016 0.28 10 8.11 336 17.10
25 Silver L (W) 7/30/1997 4.00 3.0 0.014 6 7.07 331 6.25
25 Silver L (W) 10/8/1997 4.00 1.5 0.045 0.01 6 8.30 320 11.60
25 Silver L (W) 6/15/2006 11.3 4.60 0.018 0.30 0.02 0.98 54.23 20 7.91 279 16.2 0.55
25 Silver L (W) 6/30/2006 3.35 1.5 0.022 0.22 0.03 0.85 38.75 27 7.65 267 6.41
25 Silver L (W) 7/14/2006 3.75 0.026 0.11 0.03 0.83 32.31 33 8.38 253 5.80
25 Silver L (W) 7/28/2006 3.3 3.30 1.5 0.022 0.03 0.03 0.70 31.43 48 7.41 228 5.81
25 Silver L (W) 8/11/2006 2.20 1.5 0.021 0.03 0.02 0.90 43.33 39 7.70 283 36.5 8.02
25 Silver L (W) 8/25/2006 3.10 1.5 0.017 0.02 0.02 0.98 56.48 39 8.21 318 7.15
25 Silver L (W) 9/8/2006 2.30 1.5 0.049 0.01 0.01 0.64 13.03 19 7.09 211 23.26
25 Silver L (W) 9/21/2006 2.30 1.5 0.043 0.02 0.05 0.91 21.13 14 7.31 248 13.48
25 Silver L (W) 7/19/2007 11.3 1.55 0.028 0.16 0.05 0.75 59.94 8.04 271 39.3
25 Silver L (W) 7/28/2007 11.0 1.00 0.031 0.01 0.03 0.80 57.47 32 8.07 247 20.72
25 Silver L (W) 8/8/2007 0.025 0.01 0.02 0.65 57.67 15 7.74 265 8.51
25 Silver L (W) 8/20/2007 10.9 2.50 0.030 0.19 0.04 0.98 72.91 20 7.78 193 8.77
25 Silver L (W) 9/1/2007 11.0 2.28 0.034 0.01 0.02 0.85 56.51 29 8.32 77 34.6 15.38
25 Silver L (W) 6/13/2008 11.0 2.35 0.042 0.11 0.07 0.95 50.47 9 7.49 233 0.74
25 Silver L (W) 6/24/2008 11.2 4.20 1.0 0.038 0.08 0.05 1.01 58.92 10 8.28 233 37.5 5.17
25 Silver L (W) 7/17/2008 11.4 4.60 1.0 0.033 0.04 0.00 0.48 32.14 8 7.61 183 9.38
25 Silver L (W) 7/24/2008 1.65 1.0 0.060 0.02 0.10 0.56 20.53 15 7.86 301 32.86
25 Silver L (W) 8/12/2008 11.2 1.93 1.0 0.043 0.01 0.04 0.51 26.27 30 8.24 330 33.8 4.75
25 Silver L (W) 8/28/2008 11.3 1.70 1.0 0.054 0.00 0.01 0.62 25.47 46 8.72 257
25 Silver L (W) 9/12/2008 11.6 1.30 1.0 0.075 0.01 0.02 0.70 20.76 32 7.98 259 12.74
25 Silver L (W) 06/10/2009 11.4 3.40 1.0 0.022 0.26 0.06 0.79 77.98 49 7.94 210 6.20
25 Silver L (W) 06/22/2009 11.5 3.05 1.0 0.027 0.14 0.06 0.53 43.02 32 7.59 290 6.28
25 Silver L (W) 07/05/2009 10.9 2.65 1.0 0.023 0.08 0.03 0.48 46.24 49 7.70 183 36.2 8.16
25 Silver L (W) 07/20/2009 11.3 1.20 1.0 0.057 0.03 0.07 0.73 28.00 67 7.59 217 19.85
25 Silver L (W) 08/03/2009 11.4 0.95 1.0 0.063 0.02 0.04 0.45 15.73 38 7.96 217 36.7 22.00
25 Silver L (W) 08/16/2009 11.1 1.20 1.0 0.043 0.01 0.02 0.55 28.22 52 8.46 158 17.70
25 Silver L (W) 08/29/2009 11.5 1.75 1.0 0.039 0.01 0.03 0.53 30.26 41 29.7 26.50
25 Silver L (W) 09/10/2009 11.2 1.20 1.0 0.131 0.04 0.02 1.19 19.97 82 8.67 105 25.3 160.40
25 Silver L (W) 10/04/2009 bloom
25 Silver L (W) 5/15/2010 11.7 4.25 1.0 0.016 0.37 0.04 13 7.80 290 49.6 4.00
25 Silver L (W) 5/30/2010 11.5 5.00 1.0 0.015 0.23 0.04 0.93 134.30 6 8.17 288 2.80
25 Silver L (W) 6/11/2010 11.5 5.75 1.0 0.024 0.26 0.07 0.76 69.58 10 8.33 364 0.10
25 Silver L (W) 6/26/2010 11.5 2.70 1.0 0.031 0.34 0.02 12 7.95 290 16.90
25 Silver L (W) 7/10/2010 11.4 2.00 1.0 0.033 0.01 0.09 0.65 44.13 15 7.94 37.9 16.90
25 Silver L (W) 8/6/2010 11.3 0.85 1.0 0.032 0.01 0.02 0.92 63.17 14 8.43 267 34.80
25 Silver L (W) 8/21/2010 11.2 1.25 1.0 0.030 0.02 0.04 0.78 57.70 10 8.11 305 33.00
25 Silver L (W) 9/2/2010 11.4 1.65 1.0 0.029 0.01 0.02 0.70 52.59 17 7.68 266 21.80
25 Silver L (W) 10/8/2010
25 Silver L (W) 5/25/2011 11.6 5.65 1.0 0.026 0.86 0.08 1.20 100.34 53 7.43 302 50.5 2.90
25 Silver L (W) 6/10/2011 11.5 4.88 1.0 0.020 0.50 0.06 0.82 90.08 9 7.23 332 2.70
25 Silver L (W) 6/30/2011 11.3 3.50 1.0 0.025 0.39 0.04 0.96 85.51 65 7.55 225 0.70
25 Silver L (W) 7/13/2011 11.1 3.10 1.0 0.026 0.29 0.03 0.80 69.28 43 7.38 260 6.90
25 Silver L (W) 7/13/2011 grab bloom
25 Silver L (W) 7/27/2011 10.7 1.80 1.5 0.032 0.06 0.02 0.71 48.21 41 8.26 276 37.7 14.30
25 Silver L (W) 8/9/2011 grab bloom
25 Silver L (W) 8/17/2011 11.0 2.65 1.5
25 Silver L (W) 8/31/2011 11.4 1.78 1.0 0.047 0.01 0.01 0.85 39.92 15 7.75 274 40.50
25 Silver L (W) 9/14/2011 10.9 1.40 1.0 0.065 0.01 0.03 1.00 33.88 16 7.59 278 40.10
25 Silver L (W) 9/14/2011 grab bloom
25 Silver L (W) 9/23/2011 grab bloom
25 Silver L (W) 10/22/2011 grab bloom
25 Silver L (W) 5/31/2012 11.1 5.80 1.5 0.016 0.54 0.05 42 7.44 185 47.5 3.40
25 Silver L (W) 6/15/2012 11.2 4.60 1.5 0.018 0.46 0.05 0.94 114.13 27 7.51 342 2.80
25 Silver L (W) 6/25/2012 11.4 3.65 1.5 0.021 0.35 0.02 0.80 85.53 34 7.59 311 4.80

pg. 13
LNum PName Date Zbot Zsd Zsamp Tot.P NO3 NH4 TDN TN/TP TColor pH Cond25 Ca Chl.a Cl
25 Silver L (W) 7/19/2012 11.2 2.30 1.5 0.030 0.01 0.02 0.59 43.12 31 8.00 300 5.10
25 Silver L (W) 8/1/2012 11.1 2.20 1.5 0.027 0.01 0.01 0.49 39.99 22 8.23 279 33.8 3.90
25 Silver L (W) 8/19/2012 11.2 3.55 1.5 0.029 0.01 0.01 0.50 38.42 6 7.93 284 7.10
25 Silver L (W) 8/30/2012 11.2 3.10 1.5 0.021 0.01 0.03 0.47 50.14 10 7.59 256 6.00
25 Silver L (W) 9/13/2012 11.2 2.30 1.5 0.045 0.01 0.04 0.61 29.62 8 8.04 253 8.80
25 Silver L (W) 7/4/2013 11.4 3.00 1.5 0.031 0.50 0.02 1.12 78.58 31 7.95 309
25 Silver L (W) 7/22/2013 11.4 1.45 1.5 0.026 0.77 64.55 27 8.10 232
25 Silver L (W) 8/3/2013 10.8 1.60 1.5 0.036 0.01 0.02 0.58 35.70 22 7.50 302 8.60
25 Silver L (W) 8/14/2013 11.3 1.40 1.5 0.046 0.74 35.34 59 7.58 229 8.20
25 Silver L (W) 8/30/2013 11.0 1.75 1.0 0.033 0.01 0.04 0.65 43.33 29 8.24 285 17.70
25 Silver L (W) 9/27/2013 11.2 1.80 1.0 0.093 0.76 18.03 22 7.79 306 12.60
25 Silver L (W) 5/30/2015 10.7 2.50 1.5 0.052 0.41 0.12 0.75 14.38 8 7.42 316 33.0 1.40
25 Silver L (W) 6/21/2015 11.0 3.00 1.5 0.040 1.52 38.46 10 8.33 358 5.40
25 Silver L (W) 7/12/2015 11.3 4.00 1.5 0.024 0.71 0.06 1.36 56.50 14 7.69 255 26.50 88.30
25 Silver L (W) 7/25/2015 11.0 1.50 1.5 0.184 1.88 10.24 9 8.27 273 33.20
25 Silver L (W) 8/9/2015 11.0 2.20 1.5 0.050 0.14 0.07 0.78 15.72 11 8.39 228 24.8 12.50
25 Silver L (W) 9/8/2015 11.0 2.50 1.5 0.037 0.67 18.02 8 8.68 252 2.00
25 Silver L (W) 7/24/2015 bloom
25 Silver L (W) 8/12/2015 bloom
25 Silver L (W) 8/12/2015 bloom
25 Silver L (W) 9/6/2015 bloom
25 Silver L (W) 9/6/2015 bloom
25 Silver L (W) 9/19/2015 11.0 2.60 1.5 0.119 0.00 0.02 0.54 4.54 9 8.32 270 20.70 33.10
LNum PName Date Zbot Zsd Zsamp Tot.P NO3 NH4 Fe Mn As NO2
25 Silver L (W) 6/15/2006 11.3 9.5 0.045
25 Silver L (W) 6/30/2006 9.5 0.020
25 Silver L (W) 7/14/2006 9.5 0.273
25 Silver L (W) 7/28/2006 3.3 9.5 0.379
25 Silver L (W) 8/11/2006 9.5 0.261
25 Silver L (W) 8/25/2006 9.5 0.622
25 Silver L (W) 9/8/2006 9.0 0.335
25 Silver L (W) 9/21/2006 9.5 0.044
25 Silver L (W) 7/19/2007 11.3 11.0 0.407
25 Silver L (W) 7/28/2007 11.0 10.4 0.131
25 Silver L (W) 8/8/2007 0.442
25 Silver L (W) 8/20/2007 10.9 10.7 0.730
25 Silver L (W) 9/1/2007 11.0 11.0 0.590
25 Silver L (W) 6/13/2008 11.0 11.0 0.093
25 Silver L (W) 6/24/2008 11.2 11.0 0.042
25 Silver L (W) 7/17/2008 11.4 11.4 0.280
25 Silver L (W) 7/24/2008 10.0 0.245
25 Silver L (W) 8/12/2008 11.2 10.0 0.404
25 Silver L (W) 8/28/2008 11.3 10.0 0.505
25 Silver L (W) 9/12/2008 11.6 10.0 0.216
25 Silver L (W) 06/10/2009 11.0 11.0 0.114 0.30
25 Silver L (W) 06/22/2009 10.5 10.5 0.057 0.28
25 Silver L (W) 07/05/2009 10.0 10.0 0.083 0.31
25 Silver L (W) 07/20/2009 10.0 10.0 0.269 0.68
25 Silver L (W) 08/03/2009 10.0 10.0 0.269 0.60 0.26 1.65 2.30
25 Silver L (W) 08/16/2009 10.0 10.0 0.531 0.81 0.56 2.06
25 Silver L (W) 08/29/2009 10.5 10.5 0.703 1.67 1.08 2.16 3.20
25 Silver L (W) 09/10/2009 10.0 10.0 0.807 0.01
25 Silver L (W) 5/15/2010 11.7 11.0 0.036 0.03
25 Silver L (W) 5/30/2010 11.5 10.5 0.033 0.08
25 Silver L (W) 6/11/2010 11.5 10.5 0.097 0.19
25 Silver L (W) 6/26/2010 11.5 10.5 0.067 0.29
25 Silver L (W) 7/10/2010 11.4 10.0 0.104 0.41 0.03 1.06
25 Silver L (W) 8/6/2010 11.3 10.5 0.164 0.70 0.31 1.63 1.90
25 Silver L (W) 8/21/2010 11.2 10.0 0.415 2.35 0.27 2.00 2.50
25 Silver L (W) 9/2/2010 11.4 10.5 0.177 0.86 0.26 2.36
25 Silver L (W) 5/25/2011 11.6 10.5 0.045 0.19
25 Silver L (W) 6/10/2011 11.5 10.5 0.082 0.40
25 Silver L (W) 6/30/2011 11.3 10.5 0.255 0.56
25 Silver L (W) 7/11/2011 10.7 10.0 0.045 0.37
25 Silver L (W) 7/13/2011 11.1 10.0 0.049 0.41 0.01 1.14 0.01

pg. 14
LNum PName Date Zbot Zsd Zsamp Tot.P NO3 NH4 Fe Mn As NO2
25 Silver L (W) 8/17/2011 11.0 10.0 0.727 1.72 1.24 2.99 1.00 0.01
25 Silver L (W) 8/31/2011 11.4 10.0 0.154 0.56 0.01 1.78 0.01
25 Silver L (W) 9/14/2011 10.9 10.0 0.135 0.50 0.15 1.02 2.00 0.01
25 Silver L (W) 5/31/2012 10.0 0.027 0.16 0.16 0.03 0.38
25 Silver L (W) 7/19/2012 10.0 0.49 1.95
25 Silver L (W) 8/1/2012 10.0 0.425 1.23
25 Silver L (W) 8/19/2012 9.5 0.49 2.81 2.00
25 Silver L (W) 8/30/2012 10.0 0.928 2.40
25 Silver L (W) 9/13/2012 10.0 0.60 2.51 0.50
25 Silver L (W) 7/4/2013 10.0 0.060 0.29
25 Silver L (W) 7/22/2013 10.0 0.020
25 Silver L (W) 8/3/2013 9.0 0.044 0.55
25 Silver L (W) 8/14/2013 10.0 0.042
25 Silver L (W) 8/30/2013 10.0 0.088 0.26
25 Silver L (W) 9/27/2013 10.5 0.091
25 Silver L (W) 5/30/2015 9.0 0.023 0.06
25 Silver L (W) 6/21/2015 10.0 0.038
25 Silver L (W) 7/12/2015 9.8 0.081 0.06
25 Silver L (W) 7/25/2015 9.5 0.165
25 Silver L (W) 8/9/2015 9.5 0.028 0.04
25 Silver L (W) 9/6/2015 9.5 0.037
25 Silver L (W) 9/19/2015 9.5 0.081 0.02
LNum PName Date Site TAir TH20 QA QB QC QD QF QG AQ-PC
AQ-Chla
MC-LR Ana-a Cylin
FP-Chl FP-BG
HAB form
Shore HAB
25 Silver L (W) 6/13/1986 epi
25 Silver L (W) 6/19/1986 epi 20 18
25 Silver L (W) 6/25/1986 epi 12 17
25 Silver L (W) 7/3/1986 epi 17 20
25 Silver L (W) 7/9/1986 epi 23 22
25 Silver L (W) 7/16/1986 epi 19 21
25 Silver L (W) 7/23/1986 epi 21 23
25 Silver L (W) 7/31/1986 epi 18 22
25 Silver L (W) 8/4/1986 epi 20 22
25 Silver L (W) 8/11/1986 epi 15 19
25 Silver L (W) 8/20/1986 epi 15 20
25 Silver L (W) 8/29/1986 epi 13 17
25 Silver L (W) 9/3/1986 epi 19 17
25 Silver L (W) 9/9/1986 epi 17 16
25 Silver L (W) 9/17/1986 epi 12 15
25 Silver L (W) 6/10/1987 epi 13 15
25 Silver L (W) 6/15/1987 epi 22 18
25 Silver L (W) 6/23/1987 epi 22 20
25 Silver L (W) 6/29/1987 epi 21 19
25 Silver L (W) 7/7/1987 epi 23 21
25 Silver L (W) 7/15/1987 epi 12 20
25 Silver L (W) 7/22/1987 epi 21 22
25 Silver L (W) 7/29/1987 epi 15 17
25 Silver L (W) 8/1/1987 epi 22 21
25 Silver L (W) 8/10/1987 epi 21 21
25 Silver L (W) 8/17/1987 epi 24 26
25 Silver L (W) 8/25/1987 epi 18 19
25 Silver L (W) 9/4/1987 epi 17 17
25 Silver L (W) 9/10/1987 epi 22 20
25 Silver L (W) 6/21/1988 epi 28 22
25 Silver L (W) 6/28/1988 epi 15 19
25 Silver L (W) 7/5/1988 epi 29 22
25 Silver L (W) 7/13/1988 epi 22 24
25 Silver L (W) 7/19/1988 epi 22 23
25 Silver L (W) 7/29/1988 epi 24 23
25 Silver L (W) 8/5/1988 epi 23 24
25 Silver L (W) 8/12/1988 epi 28 25
25 Silver L (W) 8/16/1988 epi 25 25

pg. 15
LNum PName Date Site TAir TH20 QA QB QC QD QF QG AQ-PC
AQ-Chla
MC-LR Ana-a Cylin
FP-Chl FP-BG
HAB form
Shore HAB
25 Silver L (W) 8/23/1988 epi 19 22
25 Silver L (W) 8/30/1988 epi 19 19
25 Silver L (W) 9/8/1988 epi 22 19
25 Silver L (W) 9/16/1988 epi 17 17
25 Silver L (W) 9/21/1988 epi 14 12
25 Silver L (W) 9/28/1988 epi 12 10
25 Silver L (W) 6/23/1989 epi 22 19
25 Silver L (W) 7/5/1989 epi 21 22
25 Silver L (W) 7/18/1989 epi 21 22
25 Silver L (W) 7/28/1989 epi 18 22
25 Silver L (W) 8/4/1989 epi 25 22
25 Silver L (W) 8/11/1989 epi 17 20
25 Silver L (W) 8/15/1989 epi 29 22
25 Silver L (W) 8/22/1989 epi 24 22
25 Silver L (W) 8/30/1989 epi 23 20
25 Silver L (W) 9/6/1989 epi 24 20
25 Silver L (W) 9/13/1989 epi 20 19
25 Silver L (W) 9/20/1989 epi 21 19
25 Silver L (W) 7/5/1990 epi 21 19
25 Silver L (W) 7/18/1990 epi 23 21
25 Silver L (W) 8/4/1990 epi 20 22
25 Silver L (W) 8/16/1990 epi 19 21
25 Silver L (W) 8/28/1990 epi 25 22
25 Silver L (W) 9/12/1990 epi 24 20
25 Silver L (W) 10/8/1990 epi 13 13
25 Silver L (W) 6/3/1991 epi 25 22
25 Silver L (W) 6/15/1991 epi 24 20
25 Silver L (W) 7/11/1991 epi 20 22
25 Silver L (W) 8/12/1991 epi 19 20
25 Silver L (W) 9/13/1991 epi 22 20
25 Silver L (W) 8/14/1996 epi 27 24 3 3 4 346
25 Silver L (W) 6/25/1997 epi 29 17
25 Silver L (W) 7/9/1997 epi 17 21
25 Silver L (W) 7/30/1997 epi 27 20
25 Silver L (W) 10/8/1997 epi 24 17 3 2 3 13
25 Silver L (W) 6/15/2006 epi 16 14 2 2 2 2
25 Silver L (W) 6/30/2006 epi 21 22 2 2 2 2
25 Silver L (W) 7/14/2006 epi 22 24 3 3 3 2
25 Silver L (W) 7/28/2006 epi 24 25 3 3 2 25
25 Silver L (W) 8/11/2006 epi 22 25 3 3 2 2
25 Silver L (W) 8/25/2006 epi 18 22 3 3 2 2
25 Silver L (W) 9/8/2006 epi 16 20 3 3 3 2
25 Silver L (W) 9/21/2006 epi 10 17 3 3 3 12
25 Silver L (W) 6/13/2008 epi 24 15 3 1 2 0
25 Silver L (W) 6/24/2008 epi 21 21 2 2 2 0
25 Silver L (W) 7/17/2008 epi 32 25 2 3 3 25
25 Silver L (W) 7/24/2008 epi 27 25 4 3 4 123
25 Silver L (W) 8/12/2008 epi 20 22 2 2 3 258
25 Silver L (W) 8/28/2008 epi 18 16 3 4 4 24
25 Silver L (W) 9/12/2008 epi 18 20 3 3 4 125
25 Silver L (W) 06/10/2009 epi 21 19 1 2 1 0
25 Silver L (W) 06/22/2009 epi 22 21 2 1 2 0
25 Silver L (W) 07/05/2009 epi 23 22 2 2 2 0
25 Silver L (W) 07/20/2009 epi 28 22 3 3 3 13
25 Silver L (W) 08/03/2009 epi 26 23 3 3 3 0
25 Silver L (W) 08/16/2009 epi 30 26 3 3 2 7 0.22
25 Silver L (W) 08/29/2009 epi 25 23 3 3 2 0
25 Silver L (W) 09/10/2009 epi 23 22 3 3 3 1 328.3 0.25
25 Silver L (W) 10/04/2009 epi 0.24
25 Silver L (W) 5/15/2010 epi 14 13 1 1 1 5 0 0
25 Silver L (W) 5/30/2010 epi 30 22 1 2 2 6 5 0

pg. 16
LNum PName Date Site TAir TH20 QA QB QC QD QF QG AQ-PC
AQ-Chla
MC-LR Ana-a Cylin
FP-Chl FP-BG
HAB form
Shore HAB
25 Silver L (W) 6/11/2010 epi 33 22 1 3 2 2 0 0
25 Silver L (W) 6/26/2010 epi 21 22 2 4 3 234 0 0
25 Silver L (W) 7/10/2010 epi 37 27 2 3 2 2 0 0
25 Silver L (W) 8/6/2010 epi 23 25 4 2 3 15 7 0 182.50
25 Silver L (W) 8/21/2010 epi 24 24 428.30
25 Silver L (W) 9/2/2010 epi 32 26 3 3 2 0 0 0 533.80
25 Silver L (W) 10/8/2010 700.00 0.34
25 Silver L (W) 5/25/2011 epi 25 19 2 1 2 0 5 5
25 Silver L (W) 6/10/2011 epi 26 23 2 2 2 0 0 0 16.70 3.00
25 Silver L (W) 6/30/2011 epi 20 22 2 3 4 2 0 5 12.20 2.10
25 Silver L (W) 7/13/2011 epi 26 26 2 4 4 2 0 0 31.60 4.80 0.63 <0.5 <0.1
25 Silver L (W) 7/13/2011 bloom 1.43 <440 0.00
25 Silver L (W) 7/27/2011 epi 24 26 3 3 3 2 0 0 38.50 11.20 0.41 <0.4 <0.1
25 Silver L (W) 8/9/2011 bloom 158.53 <0.8 <0.1
25 Silver L (W) 8/17/2011 epi 25 25 2 3 3 2 0 0
25 Silver L (W) 8/31/2011 epi 24 22 2 3 2 0 0 0 183.80 4.50 0.46 <0.4 <0.1
25 Silver L (W) 9/14/2011 epi 19 22 3 3 3 2 0 0 382.70 9.70 2.62
25 Silver L (W) 9/14/2011 bloom 59.82 <0.8 0.00
25 Silver L (W) 9/23/2011 bloom 101.63
25 Silver L (W) 10/22/2011 bloom
25 Silver L (W) 5/31/2012 epi 15 21 1 2 1 0 0 0 3.80 0.20 <0.30 <0.417 0.9 0.5
25 Silver L (W) 6/15/2012 epi 27 22 2 4 2 2 0 0 3.40 0.50 <0.30 <0.413 1.1 0.3
25 Silver L (W) 6/25/2012 epi 26 22 2 4 3 2 7 7 7.40 0.40 0.43 <0.392 6.1 2.2
25 Silver L (W) 7/19/2012 epi 28 26 3 3 2 2 0 0 13.50 0.90 <0.30 <0.292 6.4 0.9
25 Silver L (W) 8/1/2012 epi 30 26 2 3 2 2 0 0 34.80 0.60 <0.30 <0.330 3.9 0.7
25 Silver L (W) 8/19/2012 epi 27 24 2 3 2 0 0 6.60 0.90 <0.30 <0.552 4.6 1.3
25 Silver L (W) 8/30/2012 epi 23 23 2 3 2 2 0 0 16.70 2.10 <0.30 <0.725 8.2 1.7
25 Silver L (W) 9/13/2012 epi 28 23 2 3 2 0 4 0 56.90 0.70 0.47 <3.299 7.6 5.2
25 Silver L (W) 7/4/2013 epi 25 24 2 3 2 0 0 0 26.80 3.90 <0.30 <0.510 6.5 0.5
25 Silver L (W) 7/22/2013 epi 27 27 3 3 4 12 4 4 21.70 2.80 <0.30 <0.400 7.1 1.6
25 Silver L (W) 8/3/2013 epi 21 23 3 3 2 0 0 0 35.40 15.20 0.62 <0.390 15.0 0.0
25 Silver L (W) 8/14/2013 epi 21 23 3 3 2 5 0 0 55.60 4.20 <0.30 <0.390 9.6 4.1
25 Silver L (W) 8/30/2013 epi 23 24 2 2 2 1 0 0 94.60 4.40 <0.30 <1.100 21.8 13.4
25 Silver L (W) 9/27/2013 epi 20 19 3 2 2 0 0 0 42.20 3.90 <0.30 <10.600 9.3 3.3
25 Silver L (W) 5/30/2015 epi 27 18 1 1 1 0 7 0 5.20 1.10 <0.45 <0.089 <0.199 2.0 0.0 F I
25 Silver L (W) 6/21/2015 epi 25 20 2 1 2 0 0 0 5.00 0.80 <0.55 <0.004 <0.001 2.0 0.0 I I
25 Silver L (W) 7/12/2015 epi 27 19 2 2 2 0 0 0 14.50 2.20 <0.76 <0.003 <0.011 14.2 2.1 I I
25 Silver L (W) 7/25/2015 epi 30 26 4 3 3 1348 4 4 388.30 2.50 <0.30 <0.002 <0.014 98.9 74.6 DE DE
25 Silver L (W) 8/9/2015 epi 19 19 3 3 3 38 0 0 43.70 1.10 <1.13 <0.003 <0.013 28.1 16.8 B B
25 Silver L (W) 9/8/2015 epi 28 26 2 2 2 0 0 0 <0.39 <0.004 <0.012 8.5 5.2 I I
25 Silver L (W) 7/24/2015 bloom 55.08 <0.007 <0.037 10569 9375 ed
25 Silver L (W) 8/12/2015 bloom 15.42 <0.007 <0.025 3176 2544
25 Silver L (W) 8/12/2015 bloom 30.35 <0.007 <0.025 5963 4653
25 Silver L (W) 9/6/2015 bloom <0.43 <0.020 <0.058 7.3 4.1
25 Silver L (W) 9/6/2015 bloom <0.43 <0.020 <0.058 7.7 4.2
25 Silver L (W) 9/19/2015 bloom 22 21 2 2 2 0 0 0 100.20 0.90 <0.74 <0.010 <0.075 24.9 21.2 I I
25 Silver L (W) 7/28/2006 hypo 16
25 Silver L (W) 8/11/2006 hypo 15
25 Silver L (W) 7/28/2007 hypo 18
25 Silver L (W) 9/1/2007 hypo 17
25 Silver L (W) 6/24/2008 hypo 13
25 Silver L (W) 7/17/2008 hypo 15
25 Silver L (W) 7/24/2008 hypo 16
25 Silver L (W) 8/12/2008 hypo 16
25 Silver L (W) 8/28/2008 hypo 21
25 Silver L (W) 9/12/2008 hypo 19
25 Silver L (W) 06/10/2009 hypo 16
25 Silver L (W) 06/22/2009 hypo 17
25 Silver L (W) 07/05/2009 hypo 18
25 Silver L (W) 07/20/2009 hypo 18
25 Silver L (W) 08/03/2009 hypo 19

pg. 17
LNum PName Date Site TAir TH20 QA QB QC QD QF QG AQ-PC
AQ-Chla
MC-LR Ana-a Cylin
FP-Chl FP-BG
HAB form
Shore HAB
25 Silver L (W) 08/16/2009 hypo 19
25 Silver L (W) 08/29/2009 hypo 19
25 Silver L (W) 09/10/2009 hypo 18
25 Silver L (W) 5/15/2010 hypo 12
25 Silver L (W) 5/30/2010 hypo 14
25 Silver L (W) 6/11/2010 hypo 15
25 Silver L (W) 6/26/2010 hypo 15
25 Silver L (W) 7/10/2010 hypo 15
25 Silver L (W) 8/6/2010 hypo 17
25 Silver L (W) 8/21/2010 hypo 16
25 Silver L (W) 9/2/2010 hypo 21
25 Silver L (W) 5/25/2011 hypo 13
25 Silver L (W) 6/10/2011 hypo 14
25 Silver L (W) 6/30/2011 hypo 14
25 Silver L (W) 7/11/2011 hypo 19
25 Silver L (W) 7/13/2011 hypo 17
25 Silver L (W) 8/17/2011 hypo 16
25 Silver L (W) 8/31/2011 hypo 20
25 Silver L (W) 9/14/2011 hypo 20
25 Silver L (W) 5/31/2012 hypo 14
25 Silver L (W) 7/19/2012 hypo 16
25 Silver L (W) 8/1/2012 hypo 15
25 Silver L (W) 8/19/2012 hypo 18
25 Silver L (W) 8/30/2012 hypo 16
25 Silver L (W) 9/13/2012 hypo 19
25 Silver L (W) 7/4/2013 hypo 19
25 Silver L (W) 7/22/2013 hypo 20
25 Silver L (W) 8/3/2013 hypo 19
25 Silver L (W) 8/14/2013 hypo 22
25 Silver L (W) 8/30/2013 hypo 21
25 Silver L (W) 9/27/2013 hypo 19
25 Silver L (W) 5/30/2015 hypo 16
25 Silver L (W) 6/21/2015 hypo 17
25 Silver L (W) 7/12/2015 hypo 16
25 Silver L (W) 7/25/2015 hypo 22
25 Silver L (W) 8/9/2015 hypo 17
25 Silver L (W) 9/6/2015 hypo 20
25 Silver L (W) 9/19/2015 hypo 18

pg. 18
Legend Information Indicator Description Detection
Limit Standard (S) / Criteria (C)
General Information
Lnum lake number (unique to CSLAP)
Lname name of lake (as it appears in the Gazetteer of NYS Lakes)
Date sampling date
Field Parameters
Zbot lake depth at sampling point, meters (m)
Zsd Secchi disk transparency or clarity 0.1m 1.2m ( C)
Zsamp water sample depth (m) (epi = epilimnion or surface; bot = bottom) 0.1m none
Tair air temperature ( C) -10C none
TH20 water temperature ( C) -10C none
Laboratory Parameters
Tot.P total phosphorus (mg/l) 0.003 mg/l 0.020 mg/l ( C)
NOx nitrate + nitrite (mg/l) 0.01 mg/l 10 mg/l NO3 (S), 2 mg/l NO2 (S)
NH4 total ammonia (mg/l) 0.01 mg/l 2 mg/l NH4 (S)
TN total nitrogen (mg/l) 0.01 mg/l none
TN/TP nitrogen to phosphorus (molar) ratio, = (TKN + NOx)*2.2/TP none
TCOLOR true (filtered) color (ptu, platinum color units) 1 ptu none
pH powers of hydrogen (S.U., standard pH units) 0.1 S.U. 6.5, 8.5 S.U. (S)
Cond25 specific conductance, corrected to 25C (umho/cm) 1 umho/cm none
Ca, Cl calcium, chloride (mg/l) 1 mg/l none
Chl.a chlorophyll a (ug/l) 0.01 ug/l none
Fe iron (mg/l) 0.1 mg/1 1.0 mg/l (S)
Mn manganese (mg/l) 0.01 mg/l 0.3 mg/l (S)
As arsenic (ug/l) 1 ug/l 10 ug/l (S)
AQ-PC Phycocyanin (aquaflor) (unitless) 1 unit none
AQ-Chl Chlorophyll a (aquaflor) (ug/l) 1 ug/l none
MC-LR Microcystis-LR (ug/l) 0.01 ug/l 1 ug/l potable (C) 20 ug/l swimming (C)
Ana Anatoxin-a (ug/l) variable none
Cyl Cylindrospermposin (ug/l) 0.1 ug/l none
FP-Chl, FP-BG Fluoroprobe total chlorophyll, fluoroprobe blue-green chlorophyll (ug/l) 0.1 ug/l none
Lake Assessment
QA water quality assessment; 1 = crystal clear, 2 = not quite crystal clear, 3 = definite algae greenness, 4 = high algae levels, 5 = severely high algae levels
QB aquatic plant assessment; 1 = no plants visible, 2 = plants below surface, 3 = plants at surface, 4 = plants dense at surface, 5 = surface plant coverage
QC recreational assessment; 1 = could not be nicer, 2 = excellent, 3 = slightly impaired, 4 = substantially impaired, 5 = lake not usable
QD reasons for recreational assessment; 1 = poor water clarity, 2 = excessive weeds, 3 = too much algae, 4 = lake looks bad, 5 = poor weather, 6 = litter/surface debris, 7 = too many lake users, 8 = other
QF, QG Health and safety issues today (QF) and past week (QG); 0 = none, 1 = taste/odor, 2 = GI illness humans/animals, 3 = swimmers itch, 4 = algae blooms, 5 = dead fish, 6 = unusual animals, 7 = other
HAB form, Shore HAB
HAB evaluation; A = spilled paint, B = pea soup, C = streaks, D = green dots, E = bubbling scum, F = green/brown tint, G = duckweed, H = other, I = no bloom
pg. 19
Appendix B- Priority Waterbody Listing for Silver Lake

pg. 20

pg. 21
Appendix C- Long Term Trends: Silver Lake
Long Term Trends: Water Clarity No trends apparent; variable year to year
Most readings typical of mesotrophic to
eutrophic lakes
Long Term Trends: Phosphorus No trends apparent; higher since late 90s
after decrease mid-80s to late 90s
Most readings typical of eutrophic lakes
Long Term Trends: Chlorophyll a No trends apparent; less variability after ‘87
Most readings typical of eutrophic lakes
Long Term Trends: Lake Perception Recreational and WQ perceptions improving
Recreational perception linked to both
excessive algae and excessive weeds
Long Term Trends: Bottom Phosphorus Deepwater TP > surface TP, but lower 2015
2013 deepwater TP readings indicates weak
significant internal nutrient loading
Long Term Trends: N:P Ratio No trends apparent, but lower 2015
Most readings indicate phosphorus limits
algae growth
0
1
2
3
4
5
6
1985 1990 1995 2000 2005 2010 2015
Avg
Su
mm
er
Wat
er
Cla
rity
(m
)
Eutrophic
Oligotrophic
Mesotrophic
0.000
0.010
0.020
0.030
0.040
0.050
0.060
0.070
0.080
1985 1990 1995 2000 2005 2010 2015
Avg
Su
mm
er
TP (
mg/
l)
Eutrophic
Mesotrophic
Oligotrophic
0
10
20
30
40
50
60
70
1985 1990 1995 2000 2005 2010 2015
Avg
Su
mm
er
Ch
l.a
(u
g/l)
Eutrophic
Mesotrophic
1985 1990 1995 2000 2005 2010 2015
Avg
Su
mm
er
Lake
Pe
rce
pti
on
Clarity
Plant Coverage
Recreation
Favorable/Subsurface
Weeds
Unfavorable / Dense Weeds
Slightly Impaired/ Surface Weeds
0.01
0.10
1.00
1985 1990 1995 2000 2005 2010 2015
Avg
Su
mm
er
TP (
mg/
l)
Surface
Bottom
1
10
100
1985 1990 1995 2000 2005 2010 2015
Avg
Su
mm
er
TN/T
P
Phosphorus Limited
Nitrogen Limited
N or P Limited

pg. 22
Long Term Trends: Nitrogen NOx highly variable; TN and NOx ↑?
Elevated total nitrogen usually associated
with elevated algae levels
Long Term Trends: pH No trends apparent
Most readings typical of slightly alkaline
lakes with occasionally high readings
Long Term Trends: Conductivity No trends apparent, though recently lower
Most readings typical of hardwater to
intermediate hardness lakes
Long Term Trends: Color Color > lab change 2002 but ↓ after 2010
Most readings typical of weakly colored to
highly colored lakes
Long Term Trends: Calcium No trends apparent, but lower in 2015
Data indicates high susceptibility to zebra
mussels, which have been found in lake
Long Term Trends: Water Temperature Slightly increasing surface and bottom T
Bottom temperatures indicate thermal
stratification usually weak
0.01
0.10
1.00
10.00
1985 1990 1995 2000 2005 2010 2015
Avg
Su
mm
er
Nit
roge
n (
mg/
l)
NOx NH4
TN
5
6
7
8
9
1985 1990 1995 2000 2005 2010 2015
Avg
Su
mm
er
pH
Highly Alkaline (Above NYS WQ standard)
Circumneutral (Acceptable)
Acidic (Below NYS WQ standard)
Slightly Alkaline (Acceptable)
0
50
100
150
200
250
300
350
400
1985 1990 1995 2000 2005 2010 2015
Avg
Su
mm
er
Co
nd
(u
mh
o/c
m) Hardwater
Softwater
0
5
10
15
20
25
30
35
40
45
50
1985 1990 1995 2000 2005 2010 2015
Avg
Su
mm
er
Co
lor
(ptu
) Colored
Weakly Colored
Uncolored
0
5
10
15
20
25
30
35
40
45
1985 1990 1995 2000 2005 2010 2015
Avg
Su
mm
er
Cal
ciu
m (
mg/
l)Highly Susceptible to Zebra Mussels
Not Susceptible to Zebra Mussels
May Be Susceptible to Zebra Mussels
0
5
10
15
20
25
30
1985 1990 1995 2000 2005 2010 2015
Avg
Su
mm
er
Wat
er
Tem
p (
C)
SurfaceBottom

pg. 23
Appendix D: Algae Testing Results from SUNY ESF Study
Most algae are harmless, naturally present, and an important part of the food web. However
excessive algae growth can cause health, recreational, and aesthetic problems. Some algae can
produce toxins that can be harmful to people and animals. High quantities of these algae are
called harmful algal blooms (HABs). CSLAP lakes have been sampled for a variety of HAB
indicators since 2008. This was completed on selected lakes as part of a NYS DOH study from
2008-2010. In 2011, enhanced sampling on all CSLAP lakes was initiated through an EPA-
funded project that has continued through the current sampling season. This study has evaluated
a number of HAB indicators as follows:
Algae types - blue green, green, diatoms, and "other"
Algae densities
Microscopic analysis of bloom samples
Algal toxin analysis
Some of these results are reported in other portions of these reports. This appendix the seasonal
change in blue green algae, other algae types, and the primary algal toxin (microcystin-LR, a
liver toxin). Analysis was completed on open water samples and, for some lakes, shoreline
samples that were collected when visual evidence of blooms were apparent. Results are
compared to the DEC criteria of 25-30 ug/l blue green chlorophyll a and 20 ug/l microcystin-LR
(based on the World Health Organization (WHO) threshold for unsafe swimming conditions) and
the WHO provisional criteria for long-term protection of treated water supplies (= 1 ug/l
microcystin-LR). The data for algae types are drawn from a high end fluorometer used by SUNY
ESF. While these results are useful for timely approximation of lake conditions, they are not as
accurate as the total chlorophyll results measured as a regular part of CSLAP since 1986 in all
open water samples. Therefore these results are used judiciously in the assessment of sampled
waterbodies.
Two separate samples are evaluated. A sample is taken at the CSLAP sample point at the deepest
point of the lake at every sample session. In addition, shoreline samples can be taken when a
bloom is visible. It should be noted that shoreline conditions can vary significantly over time and
from one location to another. The shoreline bloom sampling results summarized below are not
collected as routinely as open water samples, and therefore represent snapshots in time. It is
assumed that sampling results showing high blue green algae and/or toxin levels indicate that
algae blooms may be common and/or widespread on these lakes. However, the absence of
elevated blue green algae and toxin levels does not assure the lack of shoreline blooms on these
lakes. Elevated open water readings may indicate a higher likelihood of shoreline blooms, but in
some lakes, these shoreline blooms have not been (well) documented.
The results from these samples are summarized within the CSLAP report for the lake.

pg. 24
Figure D1:
2013 Open Water Total and BGA Chl.a
Figure D3:
2013 Shoreline Total and BGA Chl.a
Figure D5:
2013 Open Water Algae Types
Figure D2:
2013 Open Water Microcystin-LR
Figure D4:
2013 Shoreline Microcystin-LR
Figure D6:
2013 Shoreline Algae Types
0
5
10
15
20
25
30
35
40
45
50
6/1 6/16 7/1 7/16 7/31 8/15 8/30 9/14 9/29
Ch
loro
ph
yll a
(u
g/l)
2013 Open Water Algae Levels
Open Total Chl.a
Open BG Chl.a BGA Bloom Criteria
1
10
100
6/1 6/16 7/1 7/16 7/31 8/15 8/30 9/14 9/29
Ch
loro
ph
yll a
(u
g/l)
2013 Shoreline Algae Levels
Shore Total Chl.a
Shore BG Chl.a
BGA Bloom Criteria
0
5
10
15
20
25
7/4 7/22 8/3 8/14 8/30 9/27
Ch
loro
ph
yll a
(u
g/l)
2013 Open Water Algae Samples
BG Algae
Green Algae
Diatoms
Other Algae
0.1
1
10
100
6/1 6/16 7/1 7/16 7/31 8/15 8/30 9/14 9/29
Mic
rocy
stis
-LR
(u
g/l)
2013 Open Water Toxin Levels
Open MC-LR
WHO Hi Risk Swimming Criteria
WHO Lo Risk Drinking Criteria
0.1
1
10
100
6/1 6/16 7/1 7/16 7/31 8/15 8/30 9/14 9/29
Mic
rocy
stis
-LR
(u
g/l)
2013 Shoreline Toxin Levels
Shore MC-LR
WHO Hi Risk Swimming Criteria
WHO Lo Risk Drinking Criteria
0
1
10
7/4 7/22 8/3 8/14 8/30 9/27
Ch
loro
ph
yll a
(u
g/l)
2013 Shoreline Algae Samples
BG Algae
Green Algae
Diatoms
Other Algae

pg. 25
Figure D7:
2015 Open Water Total and BGA Chl.a
Figure D9:
2015 Shoreline Total and BGA Chl.a
Figure D11:
2015 Open Water Algae Types
Figure D8:
2015 Open Water Microcystin-LR
Figure D10:
2015 Shoreline Microcystin-LR
Figure D12:
2015 Shoreline Algae Types
0
20
40
60
80
100
120
5/1 5/26 6/20 7/15 8/9 9/3 9/28 10/23
Ch
loro
ph
yll a
(u
g/l)
2015 Open Water Algae Levels
Open Total Chl.a
Open BG Chl.a
BGA Bloom Criteria
1
10
100
1000
10000
100000
5/1 5/26 6/20 7/15 8/9 9/3 9/28 10/23
Ch
loro
ph
yll a
(u
g/l)
2015 Shoreline Algae Levels
Shore Total Chl.a
Shore BG Chl.a
BGA Bloom Criteria
0
20
40
60
80
100
120
5/30 6/21 7/12 7/25 8/9 9/8 9/19
Ch
loro
ph
yll a
(u
g/l)
2015 Open Water Algae Samples
BG Algae
Green Algae
Diatoms
Other Algae
0.1
1
10
100
5/1 5/26 6/20 7/15 8/9 9/3 9/28 10/23
Mic
rocy
stis
-LR
(u
g/l)
2015 Open Water Toxin Levels
Open MC-LR
WHO Hi Risk Swimming Criteria
WHO Lo Risk Drinking Criteria
0.1
1
10
100
5/1 5/26 6/20 7/15 8/9 9/3 9/28 10/23
Mic
rocy
stis
-LR
(u
g/l)
2015 Shoreline Toxin Levels
Shore MC-LR
WHO Hi Risk Swimming Criteria
WHO Lo Risk Drinking Criteria
0
1
10
100
1,000
10,000
100,000
5/30 6/21 7/24 8/12 8/12 9/6 9/6
Ch
loro
ph
yll a
(u
g/l)
2015 Shoreline Algae Samples
BG Algae
Green Algae
Diatoms
Other Algae
pg. 26
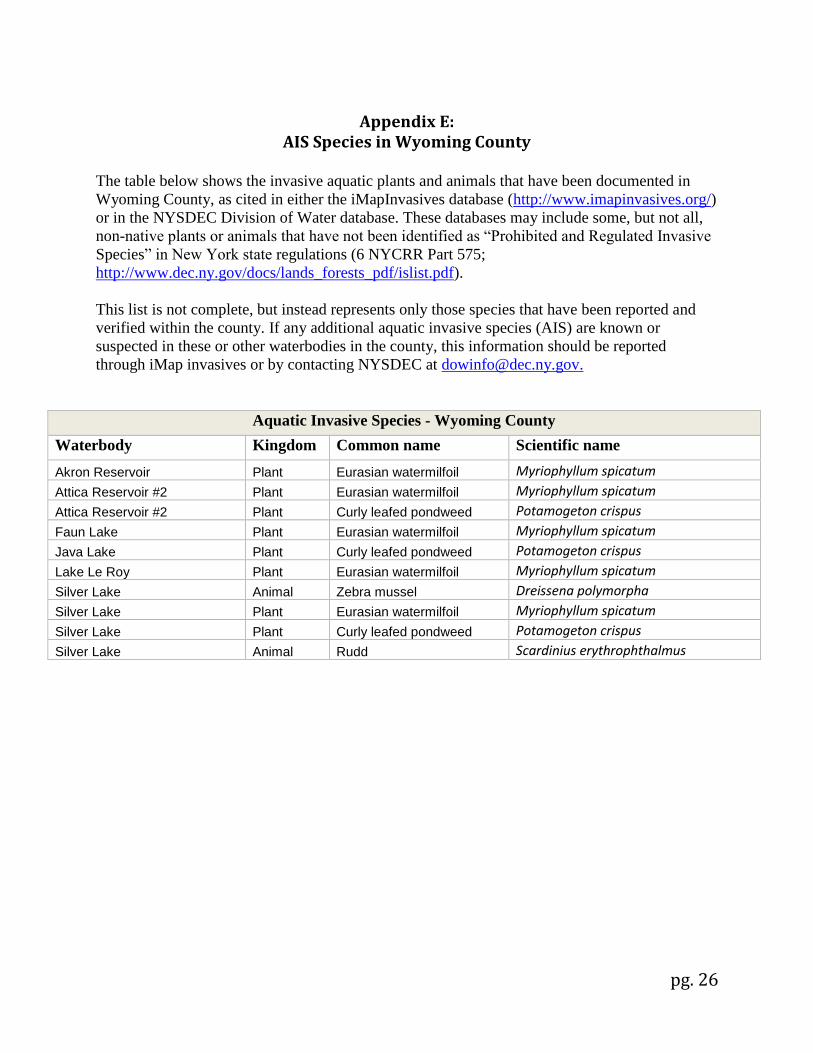
Appendix E: AIS Species in Wyoming County
The table below shows the invasive aquatic plants and animals that have been documented in
Wyoming County, as cited in either the iMapInvasives database (http://www.imapinvasives.org/)
or in the NYSDEC Division of Water database. These databases may include some, but not all,
non-native plants or animals that have not been identified as “Prohibited and Regulated Invasive
Species” in New York state regulations (6 NYCRR Part 575;
http://www.dec.ny.gov/docs/lands_forests_pdf/islist.pdf).
This list is not complete, but instead represents only those species that have been reported and
verified within the county. If any additional aquatic invasive species (AIS) are known or
suspected in these or other waterbodies in the county, this information should be reported
through iMap invasives or by contacting NYSDEC at [email protected].
Aquatic Invasive Species - Wyoming County
Waterbody Kingdom Common name Scientific name
Akron Reservoir Plant Eurasian watermilfoil Myriophyllum spicatum
Attica Reservoir #2 Plant Eurasian watermilfoil Myriophyllum spicatum
Attica Reservoir #2 Plant Curly leafed pondweed Potamogeton crispus
Faun Lake Plant Eurasian watermilfoil Myriophyllum spicatum
Java Lake Plant Curly leafed pondweed Potamogeton crispus
Lake Le Roy Plant Eurasian watermilfoil Myriophyllum spicatum
Silver Lake Animal Zebra mussel Dreissena polymorpha
Silver Lake Plant Eurasian watermilfoil Myriophyllum spicatum
Silver Lake Plant Curly leafed pondweed Potamogeton crispus
Silver Lake Animal Rudd Scardinius erythrophthalmus

pg. 27
Appendix F: Current Year vs. Prior Averages for Silver Lake
Current Year Water Temperatures vs. Prior Average
This year's shallow water sample temperatures are tending to be higher than normal when
compared to the average of readings collected from 1986 to 2013. This year's deep water sample
temperatures are tending to be higher than normal when compared to the average of readings
collected from 2006 to 2013.
Current Year Secchi Readings vs. Prior Average
This year's session Secchi readings are tending to be higher than normal when compared to the
average of readings collected from 1986 to 2013
pg. 28
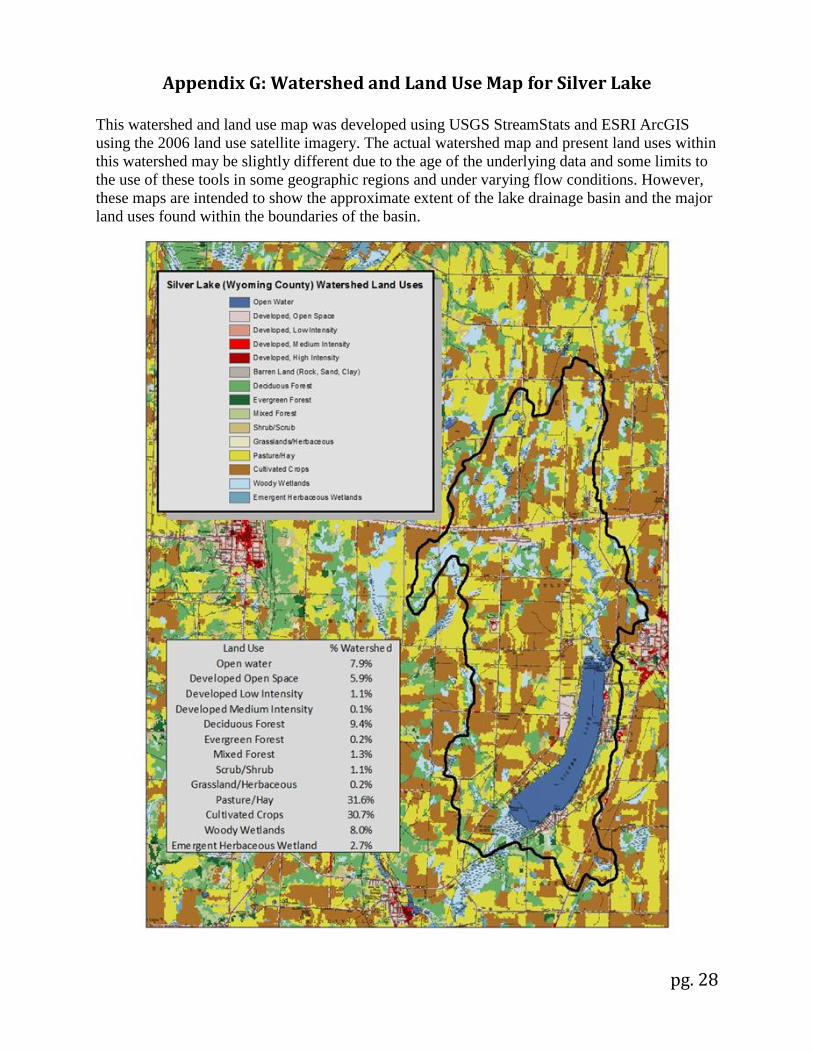
Appendix G: Watershed and Land Use Map for Silver Lake This watershed and land use map was developed using USGS StreamStats and ESRI ArcGIS
using the 2006 land use satellite imagery. The actual watershed map and present land uses within
this watershed may be slightly different due to the age of the underlying data and some limits to
the use of these tools in some geographic regions and under varying flow conditions. However,
these maps are intended to show the approximate extent of the lake drainage basin and the major
land uses found within the boundaries of the basin.
Related Documents