CS RIOT CONTROL AGENT EXPOSURE IN US ARMY MASK CONFIDENCE TRAINING: ASSOCIATION BETWEEN EXPOSURE TO O-CHLOROBENZYLIDENE MALONONITRILE AND URINARY METABOLITE 2-CHLOROHIPPURIC ACID by Lieutenant Maccon A. Buchanan Industrial Hygienist United States Navy Thesis submitted to the Faculty of the Department of Preventive Medicine and Biostatistics Uniformed Services University of the Health Sciences In partial fulfillment of the requirements for the degree of Masters of Science in Public Health 2016

Welcome message from author
This document is posted to help you gain knowledge. Please leave a comment to let me know what you think about it! Share it to your friends and learn new things together.
Transcript

CS RIOT CONTROL AGENT EXPOSURE IN US ARMY MASK CONFIDENCE
TRAINING: ASSOCIATION BETWEEN EXPOSURE TO
O-CHLOROBENZYLIDENE MALONONITRILE AND URINARY METABOLITE
2-CHLOROHIPPURIC ACID
by
Lieutenant Maccon A. Buchanan
Industrial Hygienist
United States Navy
Thesis submitted to the Faculty of the
Department of Preventive Medicine and Biostatistics
Uniformed Services University of the Health Sciences
In partial fulfillment of the requirements for the degree of
Masters of Science in Public Health 2016

UNIFORMED SERVICES UNIVERSITY, SCHOOL OF MEDICINE GRADUATE PROGRAMS
Graduate Education Office (A 1045), 4301 Jones Bridge Road, Bethesda, MD 20814
DISSERTATION A PPROVA L FOR TH E M ASTER IN SCIENCE IN PUBLIC HEA LTH DISSERTAT ION IN THE DEPA RTMENT OF PREVENTI VE MEDICINE AND BIOSTATISTICS
T itle of Thesis: ' ·Cs Riot Control Agent Exposure in US Army Mask Confidence Training: Association Between Exposure to 0-Chlorobenzy lidene Malononitrile (CS) and Urinary Metabol i te 2-Chlorophippuric Acid"
Name of Candidate: LT Maccon A. Buchanan Master of Science in Public Health Degree Apri l 5, 20 16
THESIS AND ABSTRACT APPROVED:
DATE:
ex H. Stubner, PhD DEPARTMENT OF PREVENTIVE MEDICINE & BIOSTATISTICS Committee Chairperson
HOUT.JOSEPH.JER ~:~ ..... -OME.1151639980 ~~~~~E::-~::-.:.c
Joseph J . Hout, PhD ARMY M EDICAL DEPA RTM ENT CENTER AND SCHOOL Thesis Advisor
'1£( ~ ~ ~ <>C ir,, Mary T. Brueggln~ PH DEPARTMENT OF PREVENTIVE M EDICINE & BIOSTATISTICS Committee Member
Gregory P. Mueller, Ph.D., Associate Dean II www.usuhs.mil/ graded II [email protected] Toll Free: 800-772-1747 II Commercial : 301-295-3913 I 9474 II DSN : 295-9474 II Fax: 301-295-6772
UNIFORMED SERVICES UNIVERSITY, SCHOOL OF MEDICINE GRADUATE PROGRAMS
Graduate Education Office (A 1045), 4301 Jones Bridge Road, Bethesda, MD 20814
FINAL EXAMINATION/ PRIVATE DEFENSE FOR THE DEGREE OF MASTER OF SCIENCE IN PUBLIC HEALTH IN THE DEPARTMENT OF PREVENTIVE MEDICINE AND BIOSTATISTICS
Name of Student: LT Maccon A. Buchanan
Date of Examination: April 5, 2016
Time: 8:00 AM
Place: AFRRI SRO Conference Room
DECISION OF EXAM INATION COMM ITTEE MEMBERS:
PASS FAIL
A lex H. Stubner, PhD DEPARTM ENT OF PREVENTIVE MEDICINE & BIOSTATISTICS Committee Chairperson
Joseph J. Hout, PhD ARMY MEDICAL DEPARTM ENT CENTER AND SCHOOL Thesis Advisor
Mary T. Brueggemeyer, MD, MPH DEPARTMENT OF PREVENTIVE M EDICINE & BIOSTATISTICS Committee Member
Gregory P. Mueller, Ph.D., Associate Dean II www.usuhs.mi l/graded II graduateprogram @usuhs.edu Toll Fr ee : 800-772-1747 II Commercial: 301-295-3913 / 9474 II DSN : 295-9474 II Fax: 301-295-6772

ACKNOWLEDGMENTS
I would like to thank my research advisor, MAJ Joe Hout, for his wisdom,
guidance, and coordination of resources for a successful sampling endeavor. Thank you
to committee chair LTC Alex Stubner and committee member COL Mary Brueggemeyer
for your feedback, recommendations, support, and dedication to the program. I also could
not have had a successful exposure assessment without my colleague CPT Matt Holuta
and the AMEDD C&S IH technicians. Dr. Tomoko Hooper and Dr. Gary Gackstetter of
the USU Office of Research were instrumental in providing direction to help navigate my
project through the IRB approval process. William Bragg at the CDC and Helen Penn at
the CIHL led the way in providing laboratory services and technical support. I very much
appreciate Dr. Cara Olsen’s guidance in statistical analyses. I will be forever grateful for
all of your assistance on this project and what you do for the University, the Department
of Defense, and our great nation. There are not enough words to thank my beautiful wife
for her feedback and encouragement. I am eternally grateful for her being at my side and
keeping my spirits up. Finally, and most importantly, I would like thank my savior Jesus
Christ for redirecting my path and reminding me daily that “I can do all things through
Him who strengthens me”.

iv
DEDICATION
To my daughter, Perri. Born July 3, 2015.
v
COPYRIGHT STATEMENT
The author hereby certifies that the use of any copyrighted material in the thesis
manuscript entitled: CS Riot Control Agent Exposure in US Army Mask Confidence
Training: Association Between Exposure to O-Chlorobenzylidene Malononitrile (CS) and
Urinary Metabolite 2-Chlorohippuric Acid is appropriately acknowledged and, beyond
brief excerpts, is with the permission of the copyright owner.
_________________________________
Buchanan, Maccon Alexander
20 May 2016
Maccon A Buchanan

vi
ABSTRACT
CS Riot Control Agent Exposure in US Army Mask Confidence Training: Association
between Exposure to o-Chlorobenzylidene Malononitrile (CS) and Urinary Metabolite 2-
Chlorohippuric Acid
Lieutenant Maccon A. Buchanan, Masters of Science in Public Health, 2016
Thesis directed by: Major Joseph J. Hout, PhD, Environmental Science and Engineering
Officer, United States Army and Adjunct Assistant Professor, Uniformed Services
University of the Health Science, Department of Preventive Medicine and Biostatistics.
Abstract
This study was conducted among US Army trainees at Fort Sam Houston, Texas
to evaluate the association between exposure to 2-chlorobenzylidene malononitrile (CS
riot control agent) and metabolite 2-chlorohippuric acid (CHA) measured in urine of test
subjects (n=87) after completion of the Mask Confidence Training chamber exercise.
This is the first study to apply personal monitoring and the CDC’s CLIA approved CS
Metabolites method (Code ERB-253) for sensitive analysis of CHA to explore the
association between exposure and metabolite in a prospective, observational cohort.
Exposure assessment was conducted using OSHA modified P&CAM 304. GC/ECD was
used to quantify CS exposure concentrations. Solid phase extraction and HPLC/MS was
used to quantify CHA metabolite in urine at pre-exposure, 2, 8, 24, and 30-hour post-

vii
exposure time intervals. Urine samples were creatinine corrected to reduce variation in
subject Glomerular filtration rates. CS exposure concentrations ranged from 0.086 –
4.900 mg/m³ (�̅�=2.741 mg/m³). Correcting CHA levels for creatinine at the 2-hour time
interval resulted in a range of 94.6 – 1121.6 µg/g-cr (�̅�=389.46 µg/g-cr). Correcting CHA
levels for creatinine at the 8-hour time interval resulted in a range of 15.80 – 1170.20
µg/g-cr (�̅�=341.13 µg/g-cr). Correcting CHA levels for creatinine at the 24-hour time
interval resulted in a range of 4.00 – 53.1 µg/g-cr (�̅�=19.3 µg/g-cr). Correcting CHA
levels for creatinine at the 30-hour time interval resulted in a range of 1.99 – 28.4 µg/g-cr
(�̅�=10.63 µg/g-cr). Based on a skewed distribution, all CHA levels were natural log
transformed for statistical analysis. Utilizing time as a continuous variable, Spearman’s
correlation revealed lnCHA (corrected) levels were strongly correlated with time sampled
(r = -0.748, p<0.01) and weakly correlated with CS concentration (r = 0.270, p<0.01). A
linear relationship was observed between lnCHA, CS concentration, and time of urine
sample according to the following regression equation: ln(CHA, µg/g-cr) = 5.423 + 0.316
(CS conc., mg/m³) – 0.002 (time sampled), (R = 0.910, R² = 0.827, p<0.01). This
relationship suggests that CHA has the potential to be an effective retrospective predictor
of CS exposure in future biomarker developments.
Keywords CS riot control agent, o-chlorobenzylidene malononitrile, CS, CS gas, tear gas,
chlorohippuric acid, sensitive method, retrospective analysis, high performance liquid
chromatography, HPLC, gas chromatography, mass spectrometry, GCMS

viii
TABLE OF CONTENTS
ACKNOWLEDGMENTS ................................................................................................. iii
DEDICATION ................................................................................................................... iv
COPYRIGHT STATEMENT ............................................................................................. v
ABSTRACT ....................................................................................................................... vi
TABLE OF CONTENTS ................................................................................................. viii
LIST OF TABLES .............................................................................................................. x
LIST OF FIGURES ........................................................................................................... xi
CHAPTER 1: Introduction ................................................................................................. 1
Background .................................................................................................................... 1
Study Overview .............................................................................................................. 3 Application ..................................................................................................................... 6
CHAPTER 2: Literature Review ........................................................................................ 7
O-chlorobenzylidene malononitrile ................................................................................ 7
Background .................................................................................................................... 7
Toxicology ...................................................................................................................... 8 Exposure Limits ........................................................................................................... 11
Sampling CS ................................................................................................................. 13 Quantification of CS Concentration ............................................................................. 14 Previous MCT Sampling Study .................................................................................... 15 Previous Biomarker Study ............................................................................................ 16
CHAPTER 3: Methodology .............................................................................................. 18
Research Goal ............................................................................................................... 18 Hypotheses ................................................................................................................... 18 Research Objectives ..................................................................................................... 19
Specific Aims ............................................................................................................... 19 Study Population .......................................................................................................... 20
Base and Chamber Characteristics ............................................................................... 21 MCT Training ............................................................................................................... 23 Exposure Assessment ................................................................................................... 25 Urine Collection ........................................................................................................... 28 Urinalysis ...................................................................................................................... 29 Statistical Analysis ....................................................................................................... 30

ix
CHAPTER 4: Results ....................................................................................................... 31
General Results ............................................................................................................. 31
Exposure Assessment and CS Concentration Results .................................................. 32 CHA Metabolite Analysis and CS Exposure Correlations ........................................... 36
2-hour Time Interval ............................................................................................. 40 8-hour Time Interval ............................................................................................. 42 24-hour Time Interval ........................................................................................... 43
30-hour Time Interval ........................................................................................... 45 Time as a Continuous Variable ............................................................................. 49
Chapter 5: Discussion ....................................................................................................... 52
General Study Completion and Exposure Assessment ................................................ 52
Spatial Variation Inside MCT Chamber ....................................................................... 54 Exposure Hypotheses ................................................................................................... 56
Association Hypothesis ................................................................................................ 56
CHA vs. CS Concentration ................................................................................... 56 CHA vs. CS Concentration & Time Sampled ...................................................... 57
Previous Studies ........................................................................................................... 58
Project Implications and Limitations ........................................................................... 60 Pre-exposure CHA Baseline Levels...................................................................... 60
Inhalation vs. Dermal Exposure ............................................................................ 62 Post-MCT Residual Exposure............................................................................... 63 Creatinine Concentrations ..................................................................................... 64
Chapter 6: Conclusion....................................................................................................... 66
Future Research ............................................................................................................ 67
Disclaimer .................................................................................................................... 67
Appendix ........................................................................................................................... 68
Appendix A: Results from personal monitoring for all study subjects. ....................... 69
Appendix B: IRB Authorization Letter ........................................................................ 70 Appendix C: Information Sheet and Consent Form ..................................................... 71 Appendix D: Pre-exposure Questionnaire .................................................................... 74
References ......................................................................................................................... 79

x
LIST OF TABLES
Table 1. Demographics of Study Sample ......................................................................... 32 Table 2. CS Concentration Exposure Assessment ............................................................ 34
Table 3. Summary of CS Exposures and CHA Levels in US Army Trainees .................. 48 Table 4. Summary of time interval regressions of CHA and CS concentration ............... 57 Table 5. Association of CHA, CS exposure, and time of sample among test subjects..... 58

xi
LIST OF FIGURES
Figure 1. Molecular structure of CS (41) ............................................................................ 7 Figure 2. Acute site-specific toxicity of riot control agents (30) ........................................ 9 Figure 3. Major and Minor Metabolic Pathway of CS in the Body (37) .......................... 11
Figure 4. OSHA Versatile Sampler (OVS-Tenax) (22) .................................................... 14 Figure 5. Camp Bullis MCT Chamber .............................................................................. 22 Figure 6. MCT CS Heating Operation .............................................................................. 23 Figure 7. BOLC MCT Chamber Layout. .......................................................................... 24 Figure 8. MS/ECD Calibration Curve for CS Concentration ........................................... 28
Figure 9. Example chromatogram of CS detection utilizing GC/ECD ............................. 33 Figure 10. Personal Monitoring of CS Concentration for Three-Day MCT Event .......... 36
Figure 11. Example chromatogram of CHA LC/MS analysis. ......................................... 37 Figure 12. CHA concentrations box-whisker plots for all study subjects ........................ 38 Figure 13. CHA levels corrected for creatinine versus time collected ............................. 39 Figure 14. Natural log transformed CHA levels corrected for creatinine ......................... 39
Figure 15. Relationship between CS exposure (mg/m³) and CHA levels corrected for
creatinine (µg/g-cr) at the two-hour sample interval ................................................ 41 Figure 16. Relationship between CS exposure (mg/m³) and CHA levels corrected for
creatinine (µg/g-cr) at the eight-hour sample interval .............................................. 43 Figure 17. Relationship between CS exposure (mg/m³) and CHA levels corrected for
creatinine (µg/g-cr) at the 24-hour sample interval .................................................. 45 Figure 18. Relationship between CS exposure (mg/m³) and CHA levels corrected for
creatinine (µg/g-cr) at the 30-hour sample interval .................................................. 47
Figure 19. lnCHA corrected for creatinine versus post-exposure time sampled ............ 50
Figure 20. BOLC MCT Chamber Layout. ........................................................................ 55

1
CHAPTER 1: Introduction
BACKGROUND
O-chlorobenzylidene malononitrile (CS), commonly referred to as OCBM, CS
gas, CS riot control agent (RCA), or tear gas, is the most common RCA used by military
and law enforcement around the world (17). Its popularity of use over other RCAs is
attributed to its potency, ease of manufacture, pyrotechnic dissemination, and its quick
rate of action (ability to cause immediate incapacitating effects) (37). Law enforcement’s
use of CS to disperse crowds during violent or destructive protests has garnered more
attention during recent civil uprising such as the 2014 – 2015 Ferguson, Missouri unrest,
the 2015 Baltimore, Maryland protests, as well as overseas such as in the 2014 Hong
Kong protests and the 2014 Kurdish riots in Turkey. During investigations of CS
deployment cases, governmental agencies have been limited in analytical methods for
retrospective quantification through urinary metabolites, which could provide evidence to
support allegations of its use during wartime operations.
Over the past half century, extensive research through laboratory analysis and
animal testing, as well as clinical observations of CS exposure effects on human health,
has contributed extensively to the data existing in literature. There is no evidence to date
that supports causality between CS exposure and chronic illness, cancer, reproductive
effects, or death (40). However, research has shown that exposure to CS increases
relative risk of acute respiratory illnesses during US Army Basic Combat Training in the
week following exposure when compared to the week preceding exposure (21). Health
effects of CS are commonly associated with symptoms of skin erythema, coughing,

2
mucosal irritation, runny nose, itchy eyes, and sensation of burning lungs in the majority
of exposed populations (16). Dimitroglou et al. (2015) provides a comprehensive,
systematic review of literature associated with potential health effects from exposure to
CS (16).
Other studies were conducted to advance the forensic science and the ability to
determine the use of CS in international warfare, a violation of the 1993 Chemical
Warfare Convention (CWC) (42). The use of CS during wartime settings has created
controversy over the years. The CWC recognizes that RCAs may be used in domestic law
enforcement for riot control purposes (42). The US stance on using RCAs in wartime
settings follows Executive Order 11850, signed by President Ford in 1975 and still in
effect today. This order allows the US military to use RCAs in specific defensive military
modes, such as the control of rioting prisoners of war, in situations where civilians are
being used by the enemy as a screen, rescue missions, or to protect convoys from civil
disturbances, terrorists, or paramilitary organizations (18).
In the US Armed Forces, the requirement for personnel to complete the Mask
Confidence Training (MCT) exercise, either in basic training or during preparations for
deployment, is common. In this event, soldiers, sailors, marines and airmen experience
CS exposure with a goal of garnering trust in chemical warfare protective equipment
issued to them for use in the event of chemical, biological, radiological, or nuclear attack.
US Army soldiers, often attached to deployable units, are also required to complete this
training annually and prior to deployment.
The Centers for Disease Control and Prevention (CDC) Division of Laboratory
Science developed a method of quantification (Method Code ERB-2537) of 2-

3
chlorohippuric acid (CHA), the primary metabolite of CS in the body (8). This study will
utilize Method ERB-2537 for quantification of CHA levels in exposed test subjects. This
method successfully used solid phase extraction combined with high performance liquid
chromatography (HPLC) and mass spectrometry (MS) to measure CHA and determined
the lower level of detection (LOD). The LOD was determined by calculating the standard
deviation at each standard concentration following repeated measurements of the four
low concentration standards in urine (8). The CDCs method has been effective in animal
testing, however, no accessibility to exposed groups in controlled situations as well as
limitations on testing human subjects have resulted in the lack of a comprehensive
analysis in human specimens. The CDC, in association with the Army Medical
Department Center and School (AMEDD C&S), has solicited research assistance from
the Uniformed Services University of the Health Science’s (USUHS) Department of
Preventive Medicine and Biostatistics in an attempt to advance the science in sensitive
analytical methods for urinary metabolites of CS. Completing this study at AMEDD
Basic Officers Leadership Course (BOLC) provides a target of opportunity in a
controlled training environment that can be monitored throughout the MCT event and
would be accessible for urine specimen collection in the days following exposure to
provide to the CDC for subsequent analysis.
STUDY OVERVIEW
This observational, prospective cohort study sampled individual exposure to CS and
measured urinary metabolite levels from a selected population of US Army personnel during
regularly scheduled MCT events of the BOLC held at Joint Base San Antonio (Fort Sam
Houston/Camp Bullis), TX. The overarching goal of this study was to assess the relationship

4
between CS exposure and CHA found in urine to test the following hypothesis: a statistically
significant correlation exists between CHA metabolite level in urine and CS exposure
concentration in an observational US Army training cohort.
The objectives of this study were to:
1) Determine CS exposure concentrations during US Army BOLC MCT exercise.
2) Determine CHA metabolite levels in urine of test subjects.
3) Assess the association between CS concentration and CHA metabolite
concentration.
This study required sample analysis of volunteers enrolled in the three-day BOLC
MCT event scheduled for 13-16 July 2015. At no time did the researchers attempt to alter the
standing MCT exercise protocol. Regularly assigned BOLC active duty cadre and
Department of Defense (DOD) civilian instructors implemented Army approved MCT
procedures for completion of the event. Investigators of this study were present only to
sample CS concentration from a fixed point inside the chamber, place sample pumps on each
test subject, observe the MCT exercise, record out-of-mask and stay-times (time in chamber),
and collect urine samples. Personally Identifiable Information (PII) from study volunteers
was obtained to track subjects through the urine collection process and was destroyed upon
completion of this study. The USU Office of Research deemed this study as testing on human
research subjects and forwarded this study’s protocol to the Institutional Review Board (IRB)
for evaluation. The USU IRB approved this study on July 2, 2015 citing this study to be “No
More Than Minimal Risk” human subjects’ research and assigned protocol no. TO-87-3516.
Funding for this project was awarded through the Henry M. Jackson Foundation for the
Advancement of Military Research.
5
A sample size calculation determined that 85 personnel would be sufficient to find
significant statistical results in this study. Test subjects provided a urine sample prior to CS
exposure to establish urinary metabolic baselines and at three time intervals upon completion
of the MCT event. If 85 subjects enrolled in the study, completed the MCT chamber exercise,
and provided all four urine samples, a total of 340 specimens would have been submitted to
the CDC for analysis.
The test subject’s CS exposure concentrations were assessed using Occupational
Safety and Health Administration (OSHA) modified National Institute of Occupational
Safety and Health (NIOSH) Physical and Chemical Analytical Method (P&CAM) 304 with
laboratory analysis completed by the US Navy Comprehensive Industrial Hygiene
Laboratory (CHIL) in Norfolk, Virginia. Laboratory analysis of CHA metabolite and
creatinine levels were completed by the CDC Division of Laboratory Sciences in Atlanta,
Georgia using CS Metabolites CILA (method code: ERB-2537) and Enzymatic Urinary
Creatinine Assay (method code: 1003).
Laboratory analysis for creatinine levels in urine samples was important for
completion of urine creatinine corrections. Creatinine is the metabolite of creatine, a
nitrogenous organic acid and metabolic intermediate that serves as a source of high energy in
skeletal muscle and the brain (38). Creatine is produced in the body, can be consumed
through foods such as fish and meat, or can be taken as a supplement produced in a
laboratory. Biosynthesis of creatine produces the metabolite creatinine, which is excreted in
the urine. Creatinine levels in the urine can be used to represent glomerular filtration rate as
excretion occurs almost exclusively in the kidneys (13). Variation in renal efficiency is
attributed to a variety of factors, such as hydration level and fluid balance, in test subjects

6
and could alter CHA metabolite levels after exposure to CS. Therefore, creatinine corrections
are performed by dividing the concentration of analyte by the concentration of creatinine in
the specimen. This provides a standardization between test subjects to account for variation
in renal efficiency.
This project utilized IBM Statistical Package for the Social Sciences (SPSS) software
and Microsoft Excel to analyze the data. Materials and methods are discussed in detail in
Chapter 3.
APPLICATION
This research aimed to determine the association of CS exposure and CHA during
US Army MCT exercises to provide future researchers data, statistical results, and
interpretations to help advance the science in sensitive analytical methods and, possibly,
the future development of a biomarker to investigate alleged exposures to CS. The public
health significance is that contributions from this project to the development of biomarker
for CS exposure could minimize the likelihood of an organization deploying CS in
wartime operations.
The use of human subjects as research volunteers is imperative to provide the
CDC a large sample pool for validating the method for sensitive analysis of CHA levels
from CS. A validated urinary biomarker could assist medical, occupational health,
emergency response, forensic science, and law enforcement professionals in better
performing their duties in CS exposure cases.

7
CHAPTER 2: Literature Review
O-CHLOROBENZYLIDENE MALONONITRILE
Background
CS was first synthesized by chemists Ben Corson and Roger Stoughton at
Middlebury College while working with the RCA bromobenzylcyanide (CA) in the
1920’s (30). It was not until after World War II, however, that CS saw much use in riot
control events or other law enforcement situations. The molecular formula for CS is
C10H5ClN2 and has a molecular mass of 188.6 g/mol. At standard conditions, CS is a
solid, appearing as a white crystalline power with a melting point of 93°C and a boiling
point of 310°C. It has a pepper-like odor, is insoluble in water, and converts into a vapor
and particulates when burned (26).
Figure 1. Molecular structure of CS (41)
CS is considered a lachrymatory agent or lacrimator (derived from the Latin word
“lacrima” which translates to the English word “tear”) that is widely referred to as “tear
gas” and is the most commonly used RCA worldwide (28). CS became the RCA of

8
choice due to its rapid time of onset of effects (seconds to several minutes), a relatively
brief duration of effects (15-30 min) once the victim has escaped the contaminated
atmosphere, and a high safety ratio (the ratio of the lethal dose [estimated] to the effective
dose) compared to its predecessor chloroacetophenone (CN) (41). The irritancy threshold
for CS is 0.004 mg/m³ (19). This is also the point at which symptomatic health effects
can be sensed, beginning with itchy, watery eyes, and a stinging sensation in the mucous
membranes. The intolerable concentration is estimated to be 3.6 mg/m³ based on a study
of exposure to military trainees (6). The minimal lethal concentration to humans is
estimated to be 2,500 mg/m³ based on animal studies, a concentration many times higher
than the estimated incapacitating level (30).
Toxicology
The toxicity for CS is generally regarded as low. CS is sparingly soluble in water
and will absorb into most porous surfaces (30). In its raw form at room temperature, the
crystalline powder form of CS is often packaged in pill-sized capsules for ease of
handling. For the purposes of the Army’s MCT exercise, CS capsules are heated on either
a hot plate or on a combination of coffee can over a candle or, more commonly, “canned
heat” (jellied alcohol fuel in an aluminum can) such as a Sterno® used in heating
chaffing dishes (3). Heating releases CS in to the MCT chamber in vapor form, creating a
CS rich atmosphere which condenses to form an aerosol, a colloidal suspension of
particulates in air. Trainees exposed to CS intake the substance through the dermal route
of exposure as well as through inhalation during the mask removal portion of the
exercise.

9
Figure 2. Acute site-specific toxicity of riot control agents (30)
CS is also absorbed through the eyes, which causes an immediate itching and
stinging sensation as well as blepharospasms (uncontrollable blinking). Animal studies
and observations in exposure human groups provide no evidence for ocular injury
involving the cornea (30). Exposure to the powder, vapor, or aerosol form of CS results
in some dermal absorption with possible erythema, vesiculation, and skin lesions at high
concentration levels (30). Typically, trainees are not exposed to CS during the MCT
exercise for more than a few minutes and may not experience persistent erythema or skin
lesions. CS vapor especially targets soft mucous membranes and moist areas of the body.
Aerosolized CS is absorbed primarily through the respiratory tract then distributed
throughout the body via the blood. Biotransformation occurs mostly in the blood and to a
small extent, in the liver. CS can be swallowed inadvertently or in a few cases, large
amounts were purposefully ingested in suicide attempts. Health effects associated with

10
CS ingestion have been reported to be abdominal cramping, diarrhea, and vomiting,
however, these symptoms could have also been attributed to medical treatment. No
deaths have been reported to have occurred from ingestion of solid form of CS. Evidence
from animal studies have shown that at lethal concentrations, inhalation of CS causes
damage to lungs, leading to death from asphyxiation or failure of the circulatory system
(30). Past research has suggested that mortality in CS-caused animal deaths were
attributed to metabolic production of cyanide, a result of CS hydrolysis to malononitrile.
However, post mortem examination shows lung damage was adequate to cause death and,
in addition, the time of death was not consistent with cyanide poisoning (41).
CS is metabolized primarily in the blood and predominantly excreted in urine at a
rate of 82-95% within 96 hours of exposure (8). Results from exposure studies to rodent
species determined that CS is metabolized to 2-chlorobenzyl malononitrile (CSH2) and
2-chlorobenzaldehyde (oCB) (30). Further bioconversion through glycine conjugation or
reduction yielded 2-chlorobenzyl alcohol and 2-chlorobenzyl acetyl cysteine or 1-o-2-
chlorobenzyl glucuronic acid (30). Finally, the principal urinary metabolites of CS were
found to be 2-chlorohippuric acid, glucuronic acid, 2-chlorobenzyl cysteine, and 2-
chlorobenzonic acid (30). Findings from animal studies indicate that the majority of the
administered CS dose is eliminated through urine. Elimination of CS follows first-order
kinetics as rate of enzyme reaction is proportional to the concentration of CS absorbed in
the body (19).

11
Figure 3. Major and minor metabolic pathway of CS in the body (37)
1) 2-chlorobenzaldehyde 6) N-acetylcystenine conjugate
2) 2-chlorobenzoic acid 7) dihydro-CS
3) 2-chlorohippuric acid 8) glycine conjugate
4) 2-chlorobenzyl alcohol 9) carboxamide
5) glucuronide 10) carboxylic acid
Exposure Limits
The American Conference of Governmental Industrial Hygienists (ACGIH)
develops and publishes exposure limit guidelines based on scientific research in the form
of Threshold Limit Values (TLVs). These values are intended for use in the practice of
industrial hygiene to assist in the control of workplace health hazards (2). They are not
intended to be used as legal standards, however, ACGIH recognizes that some local, state
or federal agencies may implement them into occupational safety and health programs.
The TLV Time Weighted Average (TWA) of a chemical substance is the maximum
average airborne concentration that a healthy adult can be exposed to working 8 hours per

12
day, 40 hours per week over a lifetime without experiencing significant adverse health
effects (2). The TLV-ceiling (C) value is the concentration of a hazardous substance in
air the ACGIH recommends should not be exceeded at any time during the workday. The
ACGIH TLV-C[skin] for CS is 0.39 mg/m³. OSHA, a branch of the US Department of
Labor, in collaboration with NIOSH, a branch of the US Department of Health and
Human Services, release Permissible Exposure Limits (PEL) and Recommended
Exposure Limits (REL) for exposure to CS respectively. The current OSHA PEL is 0.4
mg/m³ as an 8-hour time weighted average concentration (36). This limit legally
mandates an employer to ensure their worker’s average airborne exposure to CS in any 8-
hour workshift of a 40-hour workweek is not exceeded. Concurrently, the NIOSH REL
for exposure to CS is also 0.39 mg/m³ (36). This value, based on best available human
and/or animal health effect data, is a maximum recommended exposure from NIOSH to
employers to maintain a safe and healthy working environment for all employees.
ACGIH TLV-C and NIOSH REL include skin notations in their exposure limits
for CS. Skin notations are included to signify that a potential significant contribution of
overall exposure is by the cutaneous route, including mucous membranes and eyes, from
airborne exposure to gases, vapor, or liquid or by direct skin contact. In addition, dermal
application studies show significant absorption or systemic effects and acute animal
toxicity studies show low dermal lethal dose 50 (LD50) < 1000mg/kg (24).
As defined by OSHA and NIOSH, the Immediately Dangerous to Life or Health
(IDLH) value for exposure to CS is 2.0 mg/m³ (11). This limit was based on a 1961 US
Army report of a study of a 2-minute CS exposure to 15 human volunteers at
concentrations between 2 and 10 mg/m³ (11). Six of the 15 subjects reported this range to
13
be “intolerable” (11). IDLH levels are set to values of toxic substances that would be
likely to cause death or immediate or delayed permanent adverse health effects or prevent
escape from such environment (27). OSHA defines IDLH as “an atmosphere that poses
an immediate threat to life, would cause irreversible adverse health effects, or would
impair an individual’s ability to escape from a dangerous atmosphere” (33). The US
Army has determined that the more stringent OSHA or ACGIH TLVs shall apply to its
occupational environments. In the absence of limits set forth by OSHA and ACGIH, the
US Army applies OEL guidance including American Industrial Hygiene Association
(AIHA) Workplace Emergency Exposure Levels (WEEL) and NIOSH RELs (4).
Sampling CS
This study will utilize OSHA protocol for sampling and quantification of CS
exposure. In 1979, the CDC published method number P&CAM 304, developed by
NIOSH’s Measurements Research Branch as an analytical method for sampling and
quantification of airborne o-chlorobenzylidene malononitrile. This method prescribed use
of filter/sorbent collection and extraction with 20% methylene chloride in hexane using
HPLC (9). The method was calibrated to a range of 0.147 – 0.82 mg/m³ at a precision of
0.102. The method also called for use of a polytetrafluoroethylene membrane filter
followed by a Tenax-GC sorbent tube to gather vapors and particulates present in the
sample environment. In order to draw the sample into the filter and sorbent tube, this
method recommended use of a common industrial hygiene sampling pump with an
accuracy of ±5%, drawing 90 liters of air at recommended flowrate of 1.5 liters per
minute (9). P&CAM 304 is the operational basis for CS sampling and quantification used
by US Army industrial hygiene workers and US Navy industrial hygiene laboratories.
14
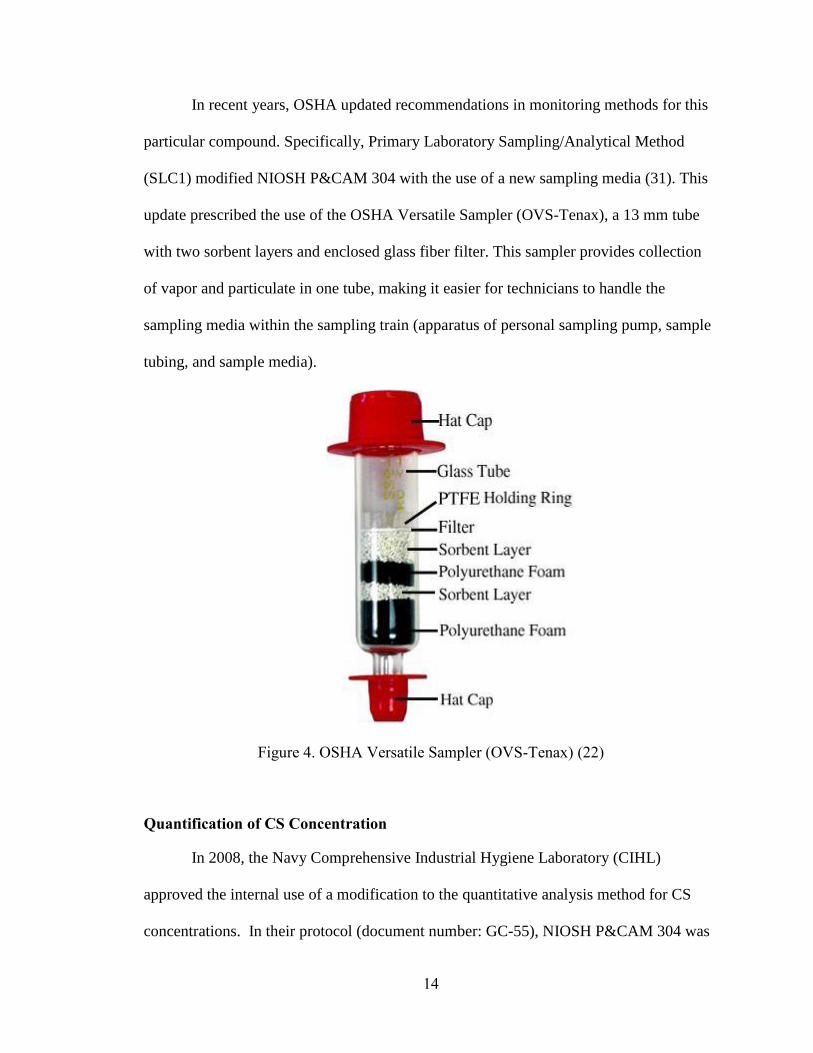
In recent years, OSHA updated recommendations in monitoring methods for this
particular compound. Specifically, Primary Laboratory Sampling/Analytical Method
(SLC1) modified NIOSH P&CAM 304 with the use of a new sampling media (31). This
update prescribed the use of the OSHA Versatile Sampler (OVS-Tenax), a 13 mm tube
with two sorbent layers and enclosed glass fiber filter. This sampler provides collection
of vapor and particulate in one tube, making it easier for technicians to handle the
sampling media within the sampling train (apparatus of personal sampling pump, sample
tubing, and sample media).
Figure 4. OSHA Versatile Sampler (OVS-Tenax) (22)
Quantification of CS Concentration
In 2008, the Navy Comprehensive Industrial Hygiene Laboratory (CIHL)
approved the internal use of a modification to the quantitative analysis method for CS
concentrations. In their protocol (document number: GC-55), NIOSH P&CAM 304 was
15
modified with alternative desorption and chromatography techniques (12). Desorption of
CS within the sample media using 20% methylene chloride/hexane in P&CAM 304 was
substituted with toluene in the GC-55 method and high pressure liquid chromatography in
P&CAM 304 was substituted with gas chromatography (GC) combined with an electron
capture detector (ECD) (12).
PREVIOUS MCT SAMPLING STUDY
Hout, et al. (2013) quantified CS exposures of over 6,000 trainees and seven
chamber instructors during US Army basic combat training at Fort Jackson, South
Carolina in August-September of 2012. The exposure assessment was determined by
taking area samples from fixed locations to represent exposure to multiple trainees (21).
This study also implemented personal sampling equipment on the seven chamber
instructors. Results indicated that CS concentrations in the chamber ranged from 0.4 to
53.3 mg/m³ (mean = 10.4 mg/m³). Analysis concluded that trainees received an average
of 9.9 mg/m³ with exposure durations ranging from 5.0 – 15.0 minutes. 98% of trainee’s
exposure exceeded CS IDLH level (2.0 mg/m³). All trainees’ exposure exceeded the
ACGIH TLV-C[skin] (0.39 mg/m³). 11% of trainees were exposed to levels exceeding
OSHA PEL (0.4 mg/m³). Analysis of personal air sampling determined that chamber
instructors received an average of 10.3 mg/m³ (longer duration in chamber but outfitted
with Mission Oriented Protective Posture (MOPP) level 4 equipment). All instructors
were exposed to levels exceeding both IDLH and ACGIH TLV-C[skin] while 32 of 33
samples exceeded the OSHA PEL (21). This study concluded that it is plausible that CS
concentrations experienced during basic training may have caused damage to respiratory
epithelium and increased risk of acute respiratory infections by 2.44. It also found that CS

16
distributes even in the MCT chamber, which allows for estimation of individual exposure
by sampling from a general area or fixed point inside the chamber (21).
Based on the results, All Army Activities (ALARACT) message 051/2013 was
released as an attempt to minimize exposure at MCT events Army-wide (29). It lowered
the number of CS capsules used to establish initial concentration, reduced out-of-mask
times to a maximum of 15 seconds, mandated semiannual industrial hygiene surveys of
all MCT chambers, and called for periodic wet cleaning of MCT chambers (29). A
follow-up study completed by Hout et al. (2014) evaluated the ALARACT 051/2013
intervention to reduce tear gas exposures and associated acute respiratory illnesses in a
US Army basic combat training cohort. The data indicated a ten-fold reduction (p<0.01)
in CS exposure concentrations (21). This study revealed a successful decrease in the
percentage of trainees and chamber instructors exposed to CS concentrations greater than
IDLH levels and a reduction in ARI rates from 2.44 to 1.79. None of the trainees or
instructors during this follow-up study were exposed to CS levels exceeding 8-hour
OSHA PEL (21).
PREVIOUS BIOMARKER STUDY
The Journal of Chromatography B published a study completed by Riches, et al.
in 2012 in the United Kingdom that attempted to develop an analytical method for
urinary metabolites of CS riot control agent. The researchers understood the importance
of developing an analytical method for retrospective identification of exposure as
evidence in cases of alleged use of chemical warfare agents (CWA) on the battlefield
(37). The Riches et al. study evaluated the analysis method for two suspected urinary
metabolites of CS riot control agent: 2-chlorohippuric acid and 2-chlorobenzyl-N-

17
acetylcysteine (37). Lab analysis utilized liquid chromatography/mass spectrometry
(LC/MS) to identify 2-chlorophippuric acid (CHA) in all two-hour post-exposure samples
from a set of urine samples taken from army recruits exposed to thermally dispersed CS.
The metabolite 2-chlorobenzyl-N-acetylcysteine was not found in any of the urine
samples (37).
The study determined the lower limit of detection (LOD) to be 1.0 ng/ml and
detected CHA in 89% of the samples 20 hours after exposure. Results from analysis of
the urine samples revealed a CHA concentration range from 3 – 135 ng/ml with a mean
of 29 ng/ml and a median of 12 ng/ml (n=19) (37). Objectives of this study focused more
on development of an analytical method of CHA metabolites than validation of a
biomarker. This study did not include active or passive CS air particulate or vapor
sampling and analysis nor correlation of personal CS exposure to CHA concentration in
urine samples. This study also had a particularly small sample size (n=19). During the
study, the concentration in the chamber was not controlled and there was no attempt to
sample the atmosphere. CS exposure was estimated based on the chamber volume at 55
m³ to be between 5 and 15 mg/m³ (37). The details of how this range of concentration
was estimated was not presented in the article.

18
CHAPTER 3: Methodology
RESEARCH GOAL
The goal of this study was to evaluate the association between CHA metabolite
and personal exposure to CS riot control agent in US Army soldiers during the MCT
exercise at the BOLC in Fort Sam Houston, TX. This study was performed in
collaboration with a separate study being completed by a USU graduate student
researcher that further followed this cohort to investigate CS exposure and subsequent
acute respiratory outcomes (P.I - CPT M. Holuta, USA. Protocol number: TO-87-3564).
Both studies utilized the same sampling and exposure assessment methodology and
shared exposure concentration results.
There have been numerous studies researching CS exposure concentrations, acute
and chronic health effects, MCT training protocol, and urinary metabolite analysis.
Unlike previous studies, however, this research project intends to obtain a pre-exposure
CHA metabolite baseline, measure individual CS exposure concentration through
personal air sampling, analyze post-exposure urinary metabolite levels, and perform data
analysis to find the significance of this association. A better understanding of the
relationship between exposure and excreted metabolite would assist medical,
occupational health, emergency response, forensic science, and law enforcement
professionals to more effectively perform their duties in CS exposure cases.
HYPOTHESES
This research will test the following hypotheses:

19
1) Personal CS exposures exceed ACGIH TLV-C[skin] during MCT post
ALARACT 051/2013 implementation
2) Personal CS exposures exceed NIOSH IDLH during MCT using post
ALARACT 051/2013 implementation
3) A statistically significant relationship exists between exposure to CS and
concentration of CHA biomarker metabolite excreted in urine after US
Army MCT exercises
RESEARCH OBJECTIVES
1) Determine CS exposure concentrations during US Army BOLC MCT exercises.
2) Determine CHA metabolite levels in urine of test subjects.
3) Explore the association between CS concentration and CHA metabolite
SPECIFIC AIMS
1) Sample for CS vapor and particulate concentration inside MCT chamber using
personal sampling pumps and fix-point general area sampling apparatus.
2) Sample and quantify individual CS exposure levels for MCT trainees.
3) Obtain urine samples from subjects prior to exposure for baseline analysis of CHA.
4) Obtain urine samples from subjects at intervals of 2, 8, and 24 hours post-
exposure.
5) Quantify CHA metabolite levels at pre-exposure and post-exposure intervals.
6) Correct CHA metabolite levels for creatinine (an indicator of renal efficiency)
using a mathematical equation to reduce variability in urine output.
7) Compare CHA metabolite levels of this study cohort to that of a randomly selected
convenience sample population with no known CS exposure

20
8) Determine association between CS exposure concentration and CHA metabolite
levels in this US Army trainee cohort.
STUDY POPULATION
The population for this study was a male and female cohort of US Army trainees
enrolled at the AMEDD BOLC titled HPSP-Basic Officer Leader (course no. 6-8-C20B).
This course included 486 students attending various medical education institutions
throughout the country under the Health Professional Scholarship Program (HSPS) as
well as 60 students enrolled in medical programs at USU. This iteration of BOLC was
scheduled from 12 June – 25 July 2015, with the MCT portion scheduled for 14-17 July
during the two-week field phase at Camp Bullis, TX. BOLC staff divided trainees into
one of four companies, A through D, with approximately 140 students per company.
Researchers solicited volunteers for this study from both groups at the same time, one
day before the MCT exercises began.
Utilizing techniques from Designing Clinical Research, 3rd edition by Hulley and
Cummings and Biostatistics, 8th edition by Daniels, sample size testing estimated that
enrollment of 85 volunteers in this study would provide 80% power to detect correlation of
0.3 or greater at α = 0.05 level of significance. This would allow the estimation of a mean
with a margin of error of 0.2 standard deviations based on a 95% confidence interval.
Calculations also revealed that as few as 50 volunteers would provide significant results.
Solicitation efforts attempted to enroll 120 volunteers in the study to allow the removal of a
small number of subjects from the study who dropped on request, experienced an adverse
event, failed to complete the MCT exercise, or were lost during follow-up.

21
During the solicitation and enrollment period on 13 July, volunteers were given
further information on the study and signed an IRB approved consent form (Appendix C).
Researchers also asked volunteers to complete a pre-exposure questionnaire, which asked for
current health status and basic demographic information (Appendix D). Upon receiving
consent, test subjects were issued a “unique study identification (ID) number” which was free
of any PII. Researchers affixed this ID number to each volunteer’s uniform prior to entering
the MCT chamber and used it to track and record chamber stay-times, out-of-mask times, and
urine specimen collection. After the enrollment period, 91 test subjects volunteered for this
study, signed a consent form and completed the pre-exposure survey for demographics and
current health status.
BASE AND CHAMBER CHARACTERISTICS
Camp Bullis provides over 27,000 acres of base operations support and training
support to Joint Base San Antonio mission partners in order to sustain their operational
and institutional training requirements. The camp also offers the armed services state-of-
the-art training facilities including firing ranges, simulation facilities, maneuvering lands,
and other training support services. For the two-week field phase of BOLC, trainees
inhabited a cordoned off camp area which was used as a simulation for overseas
operations in a forward operating base (FOB). The FOB is a six-acre, fenced-in
compound, outfitted with tents for sleeping, training shelters, modular office space,
portable toilets and showers, a tent with a gym, and mobile trailers housing BOLC
instructors and staff.
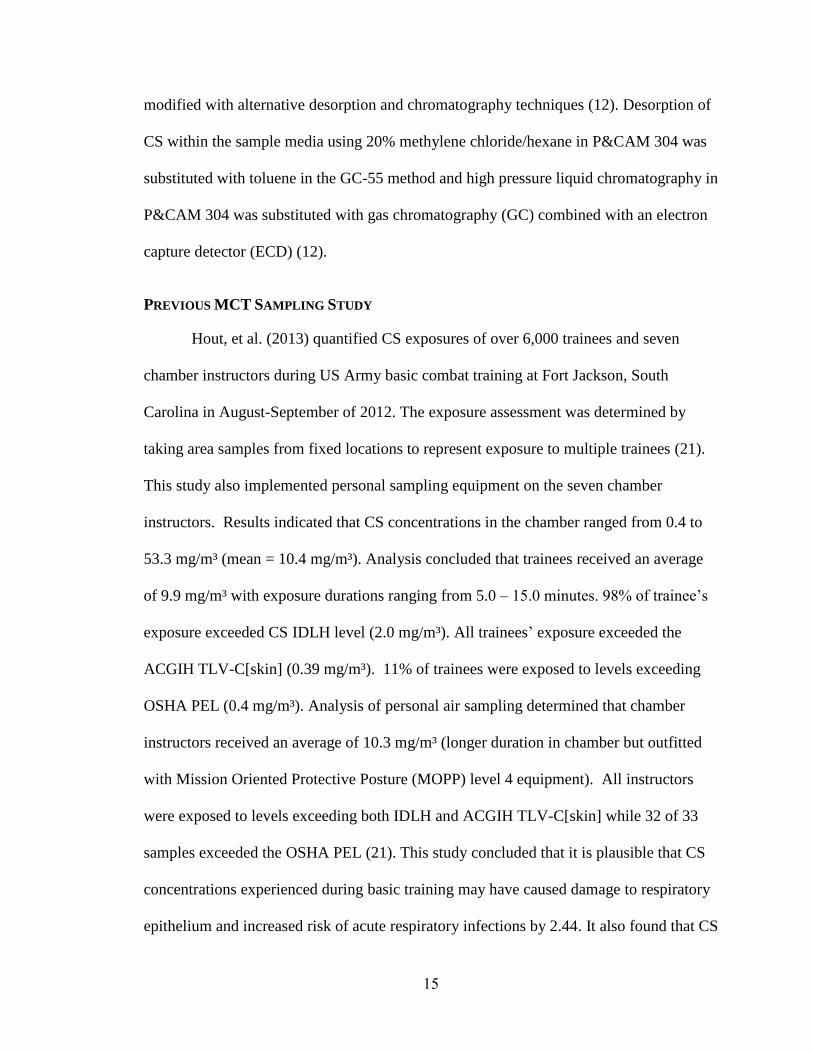
The BOLC MCT chamber is a stand-alone, painted cinder block structure in a
remote area of Camp Bullis, approximately two miles away from the FOB. A picture of
22
the chamber is provided in Figure 5. The area adjacent to the chamber has outdoor
bleachers covered with a canopy and portable toilets for staff and student use during the
MCT event. The chamber dimensions are 15 ft x 10 ft x 11 ft with a total volume of
1,650 ft³ (46.72 m³). The chamber has one entrance and one exit on opposite sides of the
structure. There is a ventilation fan vent (approx. 1 ft x 1 ft in size) located just under the
peak of the roof at one end of the structure, however, the associated fan was not
operational during the MCT event and airflow through the vent was negligible. The
interior of the structure is a bare concrete floor and painted cinder block walls. There is
no furniture or other items in the chamber other than one folding chair used by the MCT
instructor, a fire extinguisher, and an improvised CS generator. The CS generator
consisted of a combination of tin can over “canned heat” (jellied alcohol fuel in a can)
such as a Sterno® used in heating chaffing dishes (Figure 6).
Figure 5. Camp Bullis MCT chamber

23
Figure 6. MCT CS heating operation
MCT TRAINING
The MCT exercise for BOLC trainees was conducted in accordance with US
Army guidance and locally generated operational orders. This event was intended to
allow participants the opportunity to have a hands-on experience donning and doffing the
M40 full-face chemical protective mask, as well as to experience the mask’s reliability in
a hazardous atmosphere. Entering the CS-rich chamber provided the trainee immediate
warning of mask leaks. This experience was designed to allow the student to gain trust
and confidence in his/her chemical protective gear. For the MCT event, trainees wore
their general issue Army Combat Uniform (ACU) with addition of the M40 mask and the
C2A1 filter canister. Participants were not issued any chemical protective garments. This
resulted in completion of the exercises with skin exposed at the wrist, hands, neck, and
head.
Instructors divided trainees into seven or eight exposure groups per day over the
three days of the BOLC MCT with no more than twenty trainees per group. Students
24
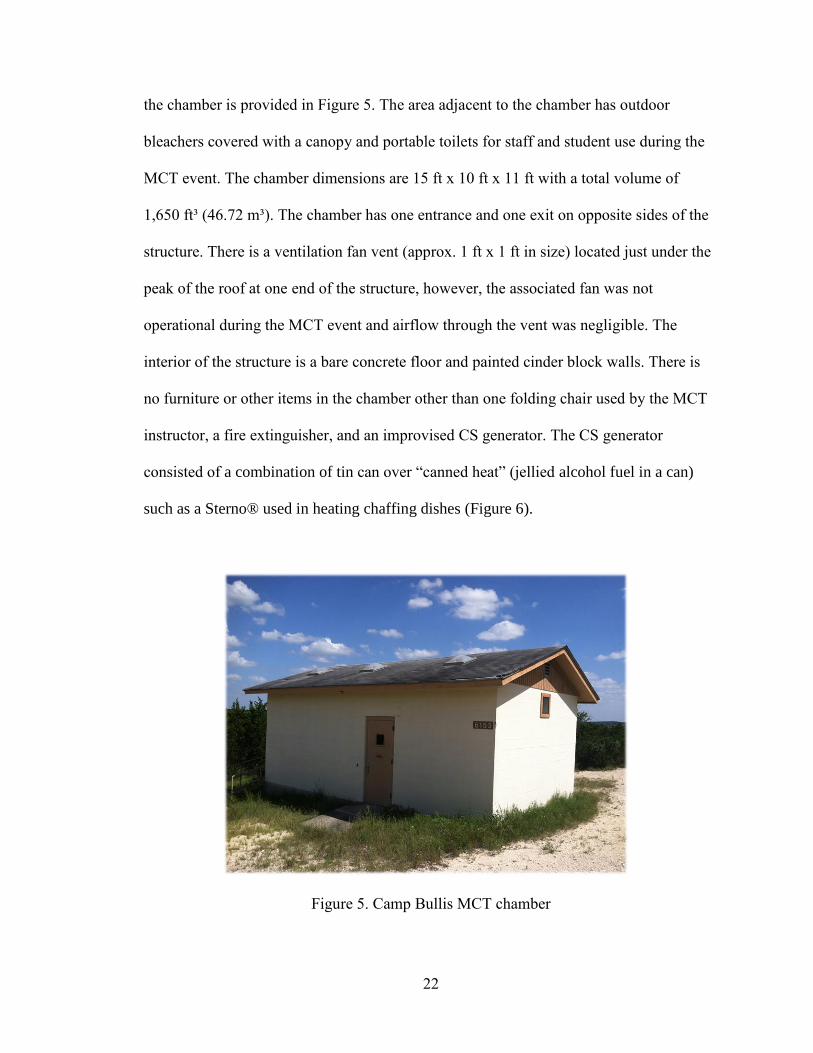
were provided an extensive training brief and assembled in the staging area in two rows
of ten trainees each. Exposure groups were instructed to don their M40 masks and enter
the chamber as a unit. Once inside, the two rows were diverted to the left and right of the
entrance and stopped once all trainees in the group were inside of the chamber. This
progression created a circle-like formation of trainees, with the two chamber instructors
in the middle of the circle. One instructor, seated in the lone chair in center of the room,
was responsible for heating CS capsules on the overturned coffee can to create a CS-rich
atmosphere. A chamber diagram with trainees, instructors, CS generation, and fixed-
sampling apparatus is included in Figure 7.
Figure 7. BOLC MCT chamber layout.

25
Upon heating, the CS was converted from a powder to vapor and particulates,
which ascended in to the chamber atmosphere. Periodically, the instructor wafted the CS
plume toward each side of the room in an attempt to more evenly distribute CS.
Meanwhile, the second chamber instructor led trainees through a series of movements
and exercises to test the fit of their M40 mask. If any trainee experienced respiratory
effects of CS from an improper seal or defective mask, they exited the chamber
immediately on their own accord or were instructed to exit the chamber, thus concluding
the individual’s MCT exercise without repercussion or reprocessing. To complete the
exercise as prescribed, MCT instructors directed trainees (typically in groups of two) to
remove masks, state their names and ranks, and provide a random identification number.
Once completed with this task, instructors motioned for the pair of trainees to exit the
chamber, concluding their event.
EXPOSURE ASSESSMENT
Exposure assessment was conducted in accordance with OSHA modified NIOSH
P&CAM 304. A single fixed-point sampling train for general area concentration and a
sampling train for personal monitoring characterized exposure during the BOLC MCT
exercises. Both techniques are considered active sampling as they are means of collecting
an airborne substance that employs a mechanical device such as an air sampling pump to
draw the air/contaminant mixture into or through the sampling media (5). This study
utilized the OVS, described extensively in Chapter 2. The OVS tube combines a
particulate filter with vapor sorbent media within one device for easier handling and lab
analysis. For fixed-point sampling, two sampling trains were fastened to one tripod at a
height of 1.32 m and a distance of 3.15 m from the source and placed in a corner of the

26
room as to not disrupt the training event. One of the fixed-point sampling trains was
designated as “long-area” sample and the other was designated as “short-area” sample. At
the start of the MCT training each day, the long-area sample OVS was uncapped and,
within seconds, pump was activated and was allowed to run for the entire event. The
short-area samples included an OVS for each exposure group that entered the chamber.
OVS for the short-area samples were changed each time a new exposure group entered
the chamber (except for the last day due to exhaustion of OVS tubes). Long and short-
area samples were obtained for backup and comparison to personal monitoring samples.
Each study volunteer was equipped with a sampling train while staged at the
entrance to the chamber with their respective exposure group, here on referred to as a
similar exposure group (SEG). Researchers assigned each SEG a two digit number (XY),
X representing the day of their event (1, 2, or 3) and Y representing the number of the
group that completed the event chronologically (1 - 8). (For example, if a test subject was
assigned SEG 23, he/she completed the event on the second day and was in the third
group to enter the chamber that day). Personal sampling trains consisted of a waist
mounted AirCheck pump (XR5000 or 224-44XR, SKC Inc.) calibrated to 1.5 liters per
minute (L/min), 1 meter of ¼ inch Tygon® sample tubing, and the OVS media clipped
within 6-8 inches of the individual’s breathing zone. On the morning of the MCT,
technicians started all sampling pumps, allowed them to run for a ten-minute warm-up
period, and calibrated them using a BIOS Defender Drycal. When the MCT began,
technicians activated pumps and uncapped OVS tubes within approximately 10-15
seconds preceding each SEG’s entry into the MCT chamber. As test subjects completed

27
the event, technicians deactivated pumps within 10-15 seconds, capped and individually
packaged OVS tubes, and verified pump flowrates using the aforementioned calibrator.
The chamber exposure assessment phase of this study took three days and
required a team eight individuals to complete the evolution; two researchers and six
industrial hygiene technicians. Two individuals served as pump calibrators, one as a
sampling train assembler, two as sampling train outfitters, one as a recorder inside the
chamber, one as a recorder outside the chamber, and one as a pump deactivator near the
exit of the chamber. Upon completion of the MCT exercise, researchers capped, labeled,
individually packaged, and shipped all sample media to the CIHL in Norfolk, VA. Nine
field blanks and six media blanks were included in the shipment.
Laboratory equipment and processes were calibrated in advance in preparation for
laboratory analysis. Recovery analysis and creation of a calibration curve using MS/ECD
was completed at the CIHL on 20 May 2015 using 5 grams of CS (CAS: 2698-41-1)
obtained from Santa Cruz Biotechnology, INC. Recovery analysis concluded that an
average of 92% of the CS was desorbed from the OVS media. Calibration found a
correlation of 0.99934 (R²) and a curve equation of y = 198487.45213x -5012.47625
(figure 8).

28
Figure 8. MS/ECD calibration curve for CS analysis
URINE COLLECTION
The CDC provided guidance for urine specimen collection, packaging, and
shipment in accordance with Shipping Instructions for Specimens Collected from People
Who May Have Been Exposed to Chemical-Terrorism Agents (10). Urine collection for
study volunteers was completed in four phases: pre-exposure (within 24 hours of their
scheduled MCT exercise) and at time intervals of approximately 2, 8, and 24 hours post-
exposure. These times were used only as guidelines, as participants were not encouraged
to hold or provide urine if they were not naturally ready to do so. Subjects were given a
50 mL urine bottle and asked to provide at least 25 mL of urine without supervision in
the designated portable toilet facility located on the FOB or near the MCT chamber (for
the two-hour samples). Once urine specimens were received, researchers recorded sample
times, labeled bottles with study ID numbers and time, and placed bottles in large
shipping coolers with 10-15 lbs of dry ice. All samples froze within two hours of

29
excretion and all specimens were subsequently shipped to the CDC for laboratory
analysis.
URINALYSIS
All urine specimens were analyzed by the CDC Division of Laboratory Sciences
in Atlanta, GA. The CDC utilized their recently developed procedures for quantification
of o-chlorohippuric acid, CLIA protocol 2537 CS Metabolites (8). This method employed
LC/MS/MS for analyte separation and detection. General procedures included the
following: technicians began by adding 25 µL of CHA internal standard, 100 µL of urine,
and 100 µL of formic acid to a 96-well Nunc plate. The Nunc plate was centrifuged to
collect all liquid then vortexed to ensure mixing of all components. Samples were then
placed in a Turbovap® concentration evaporator, dried down, and reconstituted with
methanol/water in the sample plate. Once sealed with foil, samples were ran through LC,
detector, and values were displayed on computer software chromatograms (8).
The CDC laboratories also completed quantification of creatinine levels in all
urine specimens submitted for analysis of CHA. The CDC utilized Creatinine Plus testing
procedures, an assay for the quantitative determination of creatinine in human urine on a
Roche automated clinical chemistry analyzer. This method was based on the conversion
of creatinine with the aid of creatininase, creatinase, and sarcosine oxidase to glycine,
formaldehyde and hydrogen peroxide. The liberated hydrogen peroxide reacted with
aminophenazone to form a quinon imine chromogen, whose color intensity was directly
proportional to the creatine concentration in the reaction mixture (1).
30
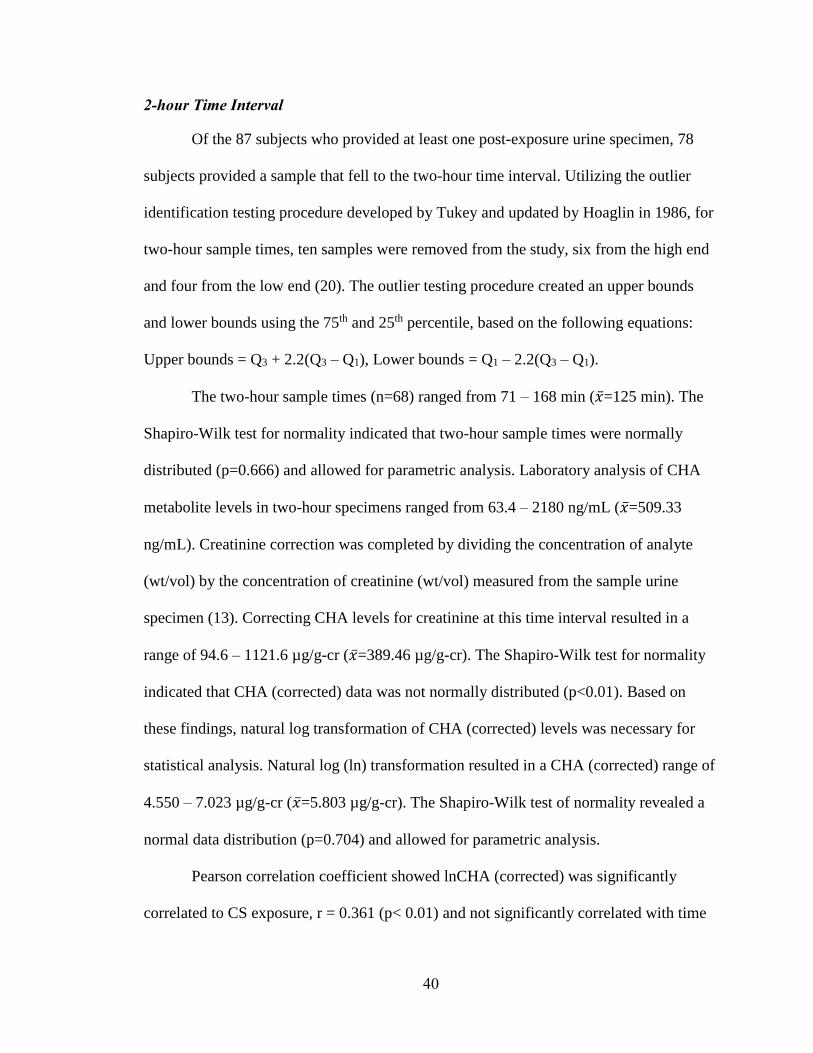
STATISTICAL ANALYSIS
All statistical analyses were performed using IBM SPSS software using a two-
tailed significance level of 0.05. The correlation among exposure categories and CHA
was tested using Pearson and Spearman coefficients. Because of the highly skewed
distributions of CHA, the following analysis was carried out using natural logarithmic
transformation. Multiple regression was conducted to evaluate the impact of gender, BMI
and age on CHA levels after adjusting for CS exposure and time sampled. Due to
potential lack of independence among repeated measurements on the same subjects, a
mixed-model was used to fit separate slopes and intercepts over time for each subject.
This model showed no within-subject correlation, therefore, multiple linear regression
was sufficient for all statistical analyses.

31
CHAPTER 4: Results
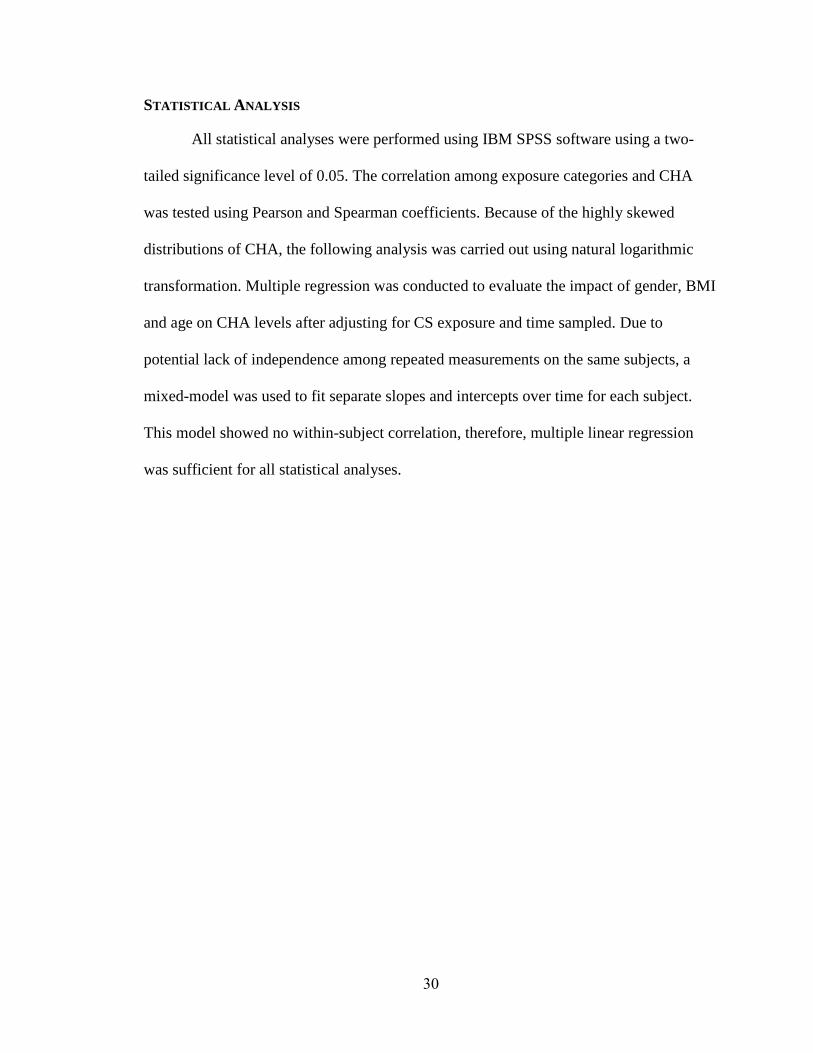
GENERAL RESULTS
Of the 91 test subjects who enrolled in the study and signed a consent form, 87
subjects completed the MCT exercise and provided at least one post-exposure urine
specimen. The gender distribution of volunteers who completed this study was 39 male
and 48 female. The sample as a whole was relatively young with a non-normal
distribution range of 20 to 47 years of age (�̅�=26.4 years). The Body Mass Index (BMI)
of this cohort of US Army trainees ranged from 18.24 – 32.69 kg/m² (�̅�=24.37 kg/m²).
None of the study subjects identified themselves as a current smoker. A demographic
summary is provided in Table 1. Chamber stay-times for study participants (n=87) ranged
from 23 – 441 s (0.38 – 7.35 min) (�̅�=340.5 s (5.68 min), 95% CI [332, 349]). Four of the
87 test subjects left the chamber before the 200 s mark due to apparent mask seal leaks.
Subject out-of-mask times ranged from 4 – 19 s (�̅�=8 s; 95% CI [8, 9]).
32
Table 1. Demographics of Study Sample
Mean ± SD Number Percent
Total Enrolled 91 Completed Study 87 95.6
Age (years) 26.4 ± 5.22
20-22 8 8.8 23-25 48 52.7 26-30 19 20.9 31-35 4 4.4 35-39 5 5.5 40-49 3 3.3
Gender
Male 39 42.9 Female 48 52.7
BMI 24.37 ± 2.82
< 18.5 1 1.1 18.5-24.9 50 54.9 25.0-29.9 32 35.2
>30.0 4 4.4 Male 25.51 ± 2.90
Female 23.44 ± 2.41
Smokers 0
Exposure Assessment and CS Concentration Results
CS exposure assessment utilized two methods for sampling: general (fixed) area
monitoring and personal monitoring. Both methods utilized OVS tubes and sampling
pumps set at 1.5 L/min. Fixed-area samples were further segregated into long-area
samples and short-area samples. Long-area samples were drawn from one OVS tube at a
fixed location in the corner of the chamber, activated to sample over the entire duration of
a day’s MCT exercise (all 7-8 SEGs for that day). Short-area samples were drawn from
one OVS tube at the same fixed location which was replaced for each SEG (except for
day three exercises due to exhaustion of OVS tubes). Short and long-area sample results

33
were not included in the statistical analysis for this project. They were taken as a back-up
to personal monitoring and used only as a reference for comparison.
All OVS tubes were analyzed by the CIHL in Norfolk, VA. The laboratory
utilized protocol Document no. GC-55: Analysis of o-Chlorobenzylidene Malononitrile
(OCBM). CS was desorbed from the OVS filter and sorbent layer using Toluene and sent
through a HP-1 5m x 530µm x 2.65µm film thickness separation column. The analyte
then entered the electron capture detector and peak areas were displayed on a
chromatogram for quantification. An example chromatogram of CS concentration is
included in Figure 9, recorded during standardization and development of the calibration
curve.
Figure 9. Example chromatogram of CS quantification utilizing GC/ECD
Lab analysis calculated CS concentrations for the long-area sample of each of
the three day sampling events: MCT Day 1 – 2.088 mg/m³, Day 2 – 3.617 mg/m³, and
Day 3 – 5.209 mg/m³. Short-area samples for CS concentration exposure to SEGs 11-27
(Day 1 and 2) (n=14) ranged from 1.104 – 4.773 mg/m³ (�̅�=2.779 mg/m³). The Shapiro-

34
Wilk test indicated that short-area sample data were normally distributed (p=0.074).
Table 2 provides a summary of long and short-area samples and, for comparison,
personal monitoring SEG means.
Table 2. CS Concentration Exposure Assessment
Day
of
MCT
Similar
Exposure
Group
(SEG)
Long-area CS
Concentration
(mg/m³)
Short-area CS
Concentration
(mg/m³)
Short-
area
Mean
(mg/m³)
Personal
Monitoring
(Mean of
SEG,
mg/m³)
Mean
of SEG
Means
(mg/m³)
1
11
2.088
1.104
1.886
1.060
1.757
12 1.536 1.655
13 2.137 2.181
14 2.132 2.039
15 2.237 1.773
16 2.052 1.809
17 2.003 1.783
2
21
3.617
2.651
3.671
3.366
2.875
22 4.773 3.058
23 1.897 1.884
24 3.786 2.842
25 3.445 3.387
26 4.773 2.315
27 4.373 3.275
3
31
5.209
--
--
2.193
3.536
32 -- 3.781
33 -- 4.277
34 -- 3.28
35 -- 3.792
36 -- 3.486
37 -- 4.653
38 -- 2.886
-- Samples not taken due to exhaustion of OVS tubes
Concentration calculations for individual CS exposure from personal monitoring
were based on total mass of CS desorbed from OVS tube (µg) divided by the total air
volume (m³) sampled during an individual’s time in the chamber (min). Total sampling
time was measured from the time the subject entered the chamber to the time they exited

35
the chamber. This project assumed that CS concentration during lead and lag times from
starting/stopping pumps during time entering/exiting chamber and deactivating pumps
was negligible due to the subject being outside, in an open-air atmosphere. Total air
volume (m³) sampled was calculated by multiplying total sampling time (min) by the
average flow rate (L/min) of pre and post-exposure pump flowrate readings.
Personal monitoring results for CS concentration to subjects from Day 1 MCT
exercises (n=25) ranged from 0.960 – 2.463 mg/m³ (�̅�=1.763 mg/m³). The Shapiro-Wilk
test indicated that the data were normally distributed (p=0.383) and allowed for
parametric analysis. CS concentrations from Day 2 MCT exercises (n=36) ranged from
0.086 – 3.792 mg/m³ (�̅�=2.833 mg/m³). The Shapiro-Wilk test indicated that the data
were not normally distributed (p<0.01) and required non-parametric analysis. CS
Concentrations from Day 3 MCT exercises (n=26) ranged from 1.953 – 4.900 mg/m³
(�̅�=3.553 mg/m³). The Shapiro-Wilk test indicated that the data were normally distributed
(p=0.121) and allowed for parametric analysis. The total of CS concentrations from all
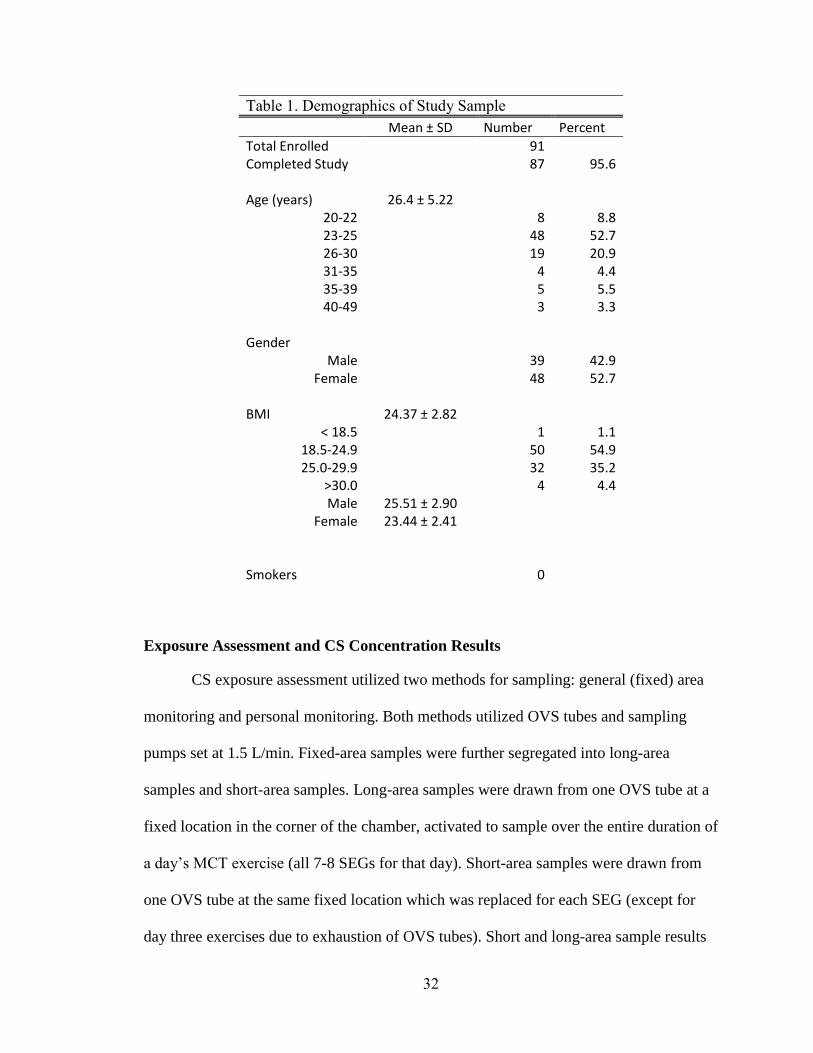
three MCT exercise days (n=87) ranged from 0.086 – 4.900 mg/m³ (�̅�=2.741 mg/m³, 95%
CI [2.66, 2.87]); the Shapiro-Wilk test indicated that all personal monitoring data were
normally distributed (p=0.403) and allowed for parametric analysis. Due to the normality
of the CS exposure data overall, logarithmic conversion of CS concentrations was not
necessary for statistical analysis. Personal monitoring results in the form of box and
whisker plots over the three-day exercise period is provided in Figure 10 with the IDLH
limit shown at 2.0 mg/m³ and TLV-C[skin] shown at 0.4 mg/m³. Study number 59 in
Figure 10 had a low CS concentration exposure, consistent with a chamber stay-time of
36
only 23 s, due to an apparent mask seal leak and immediate evacuation of the chamber. A
table of all individual personal monitoring results is included in Appendix A.
Figure 10. Personal monitoring of CS concentration for three-day MCT event
CHA Metabolite Analysis and CS Exposure Correlations
Analysis of all urine samples for creatinine and CHA were completed by the CDC
Division of Laboratory Science in Atlanta, GA. An example chromatogram is provided in
Figure 11. A convenience sample taken from the Tennessee Blood Service was analyzed
for CHA for use as randomly selected, reference sample group. These individuals
(n=108) should not have been exposed to CS. Laboratory analysis revealed the presence
of CHA above the lowest calibrator (LOD = 1.00 ng/mL) in 23 out of the 108 samples
(21%) in the comparison group. The baseline CHA values above LOD ranged from 1.36

37
to 32.5 ng/mL. The convenience sample from Tennessee was used only for a reference of
comparison and not included in the statistical analysis of the BOLC trainee cohort.
Figure 11. Example chromatogram of CHA LC/MS analysis
Note: Column: Acquity UPLC PFP 1.8 µm, 2.1 x 50 mm; Inj. 15 µL; Flow rate: 200
µL/min; Solvent A: Water, 0.1% Formic acid, Solvent B: Acetonitrile, 0.1% Formic acid,
Gradient: 90/10 A/B to 60/40 A/B over five minutes, return to 90/10 A/B for another 5 minutes to
re-equilibrate the column; MS: Positive mode MRM transitions CHA 214.2 -> 138.7, CHA_C
214.2 -> 111.1, CHA IS 217.2 -> 140
Of the 91 subjects enrolled in this study, 72 subjects provided a pre-exposure
urine specimen for analysis of baseline CHA levels no greater than 24 hours prior to the
individual’s MCT exercise. Of the 72 individuals who provided pre-exposure urine, 60
subjects had CHA levels below the limit of detection (<LOD, 1 ng/mL) and 12 subjects
(17%) had CHA levels ranging from 1.02 – 8.27 ng/mL (�̅�=3.56 ng/mL), which was
within four percent of those with baseline CHA levels in the convenience sample from
the Tennessee Blood Service. The summary of CHA levels for pre-exposed and exposed

38
test subjects in this study over all sampling periods is provided in Figure 12. A summary
of CHA levels corrected for creatinine is provided in Figure 13. Creatinine corrections
were conducted by dividing CHA in the specimen by creatinine concentration in the same
specimen. A summary of natural log transformed (lnCHA) levels is provided in Figure
14.
Figure 12. CHA concentrations box-whisker plots for all study subjects
Note: The original design of this project included urine specimen draws at
approximately 2, 8, and 24-hours post-exposure. However, the sample times of the 76
samples provided at the 24-hour post0expousre were highly skewed, with 22 subjects
submitting a specimen after 30 hours post-exposure. Based on the highly skewed
distribution of these data, two sample time intervals were created from the 24-hour
samples. Specimens in this range were placed in either the 24-hour (n=46) or 30-hour
(n=30) sample time intervals. The arrangement of data points in this manner allowed for
normal distributions around the sample time means at the 24 and 30-hour interval.

39
Figure 13. CHA levels corrected for creatinine versus time collected
Figure 14. Natural log transformed CHA levels corrected for creatinine
40
2-hour Time Interval
Of the 87 subjects who provided at least one post-exposure urine specimen, 78
subjects provided a sample that fell to the two-hour time interval. Utilizing the outlier
identification testing procedure developed by Tukey and updated by Hoaglin in 1986, for
two-hour sample times, ten samples were removed from the study, six from the high end
and four from the low end (20). The outlier testing procedure created an upper bounds
and lower bounds using the 75th and 25th percentile, based on the following equations:
Upper bounds = Q3 + 2.2(Q3 – Q1), Lower bounds = Q1 – 2.2(Q3 – Q1).
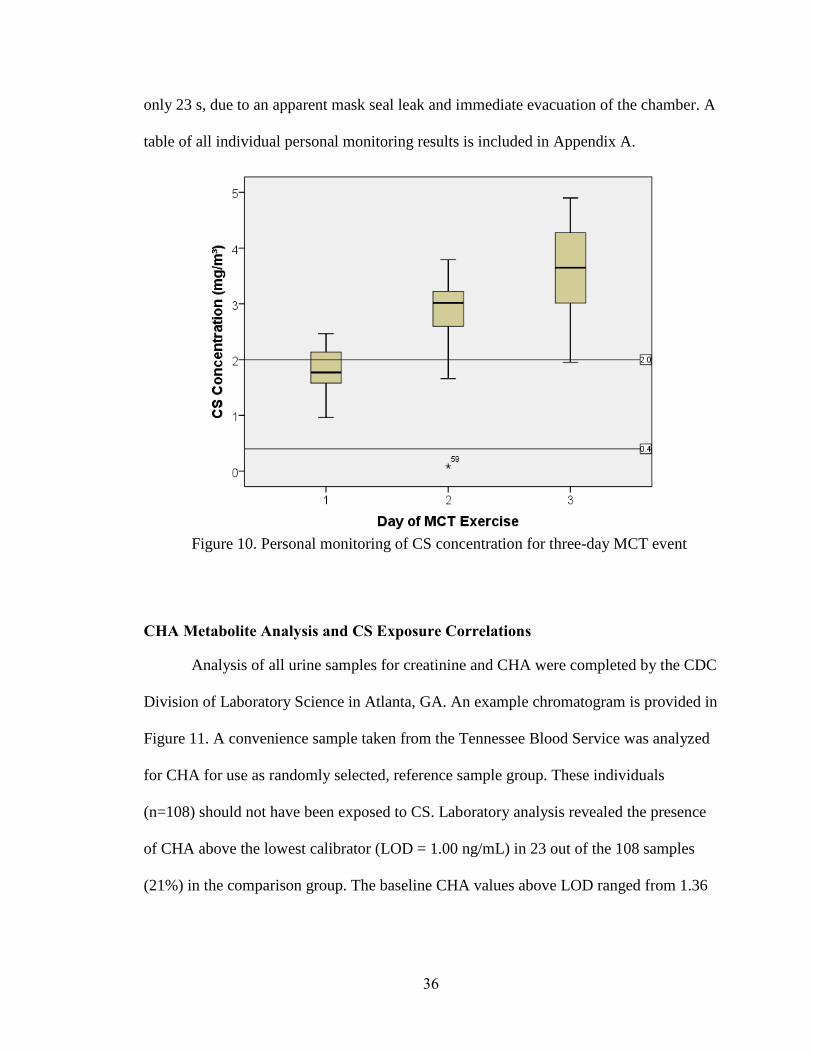
The two-hour sample times (n=68) ranged from 71 – 168 min (�̅�=125 min). The
Shapiro-Wilk test for normality indicated that two-hour sample times were normally
distributed (p=0.666) and allowed for parametric analysis. Laboratory analysis of CHA
metabolite levels in two-hour specimens ranged from 63.4 – 2180 ng/mL (�̅�=509.33
ng/mL). Creatinine correction was completed by dividing the concentration of analyte
(wt/vol) by the concentration of creatinine (wt/vol) measured from the sample urine
specimen (13). Correcting CHA levels for creatinine at this time interval resulted in a
range of 94.6 – 1121.6 µg/g-cr (�̅�=389.46 µg/g-cr). The Shapiro-Wilk test for normality
indicated that CHA (corrected) data was not normally distributed (p<0.01). Based on
these findings, natural log transformation of CHA (corrected) levels was necessary for
statistical analysis. Natural log (ln) transformation resulted in a CHA (corrected) range of
4.550 – 7.023 µg/g-cr (�̅�=5.803 µg/g-cr). The Shapiro-Wilk test of normality revealed a
normal data distribution (p=0.704) and allowed for parametric analysis.
Pearson correlation coefficient showed lnCHA (corrected) was significantly
correlated to CS exposure, r = 0.361 (p< 0.01) and not significantly correlated with time

41
of sample (p>0.05). The scatter plot of two-hour lnCHA (corrected) versus CS
concentration is shown in Figure 15. Simple linear regression revealed the following
relationship:
ln(CHA-2hr, µg/g-cr) = 5.182 + 0.219 (CS conc., mg/m³)
Multiple regression analysis showed that age and gender did not significantly
affect the levels of lnCHA (corrected) (p>0.05). BMI was significantly correlated with
levels of lnCHA (corrected) (p<0.05), however, adjusting for CS exposure and BMI,
there was no significant correlation (p=0.669) between BMI and lnCHA (corrected) at
this time interval.
Figure 15. Relationship between CS exposure (mg/m³) and CHA levels corrected
for creatinine (µg/g-cr) at the two-hour sample interval
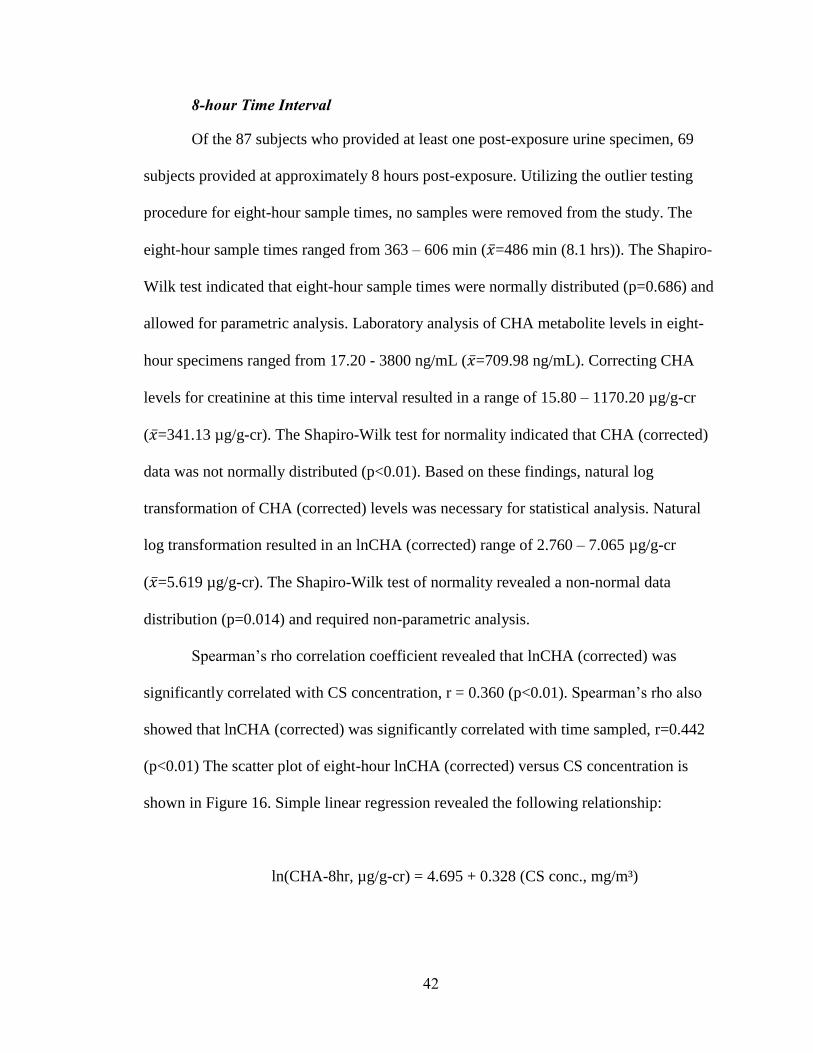
42
8-hour Time Interval
Of the 87 subjects who provided at least one post-exposure urine specimen, 69
subjects provided at approximately 8 hours post-exposure. Utilizing the outlier testing
procedure for eight-hour sample times, no samples were removed from the study. The
eight-hour sample times ranged from 363 – 606 min (�̅�=486 min (8.1 hrs)). The Shapiro-
Wilk test indicated that eight-hour sample times were normally distributed (p=0.686) and
allowed for parametric analysis. Laboratory analysis of CHA metabolite levels in eight-
hour specimens ranged from 17.20 - 3800 ng/mL (�̅�=709.98 ng/mL). Correcting CHA
levels for creatinine at this time interval resulted in a range of 15.80 – 1170.20 µg/g-cr
(�̅�=341.13 µg/g-cr). The Shapiro-Wilk test for normality indicated that CHA (corrected)
data was not normally distributed (p<0.01). Based on these findings, natural log
transformation of CHA (corrected) levels was necessary for statistical analysis. Natural
log transformation resulted in an lnCHA (corrected) range of 2.760 – 7.065 µg/g-cr
(�̅�=5.619 µg/g-cr). The Shapiro-Wilk test of normality revealed a non-normal data
distribution (p=0.014) and required non-parametric analysis.
Spearman’s rho correlation coefficient revealed that lnCHA (corrected) was
significantly correlated with CS concentration, r = 0.360 (p<0.01). Spearman’s rho also
showed that lnCHA (corrected) was significantly correlated with time sampled, r=0.442
(p<0.01) The scatter plot of eight-hour lnCHA (corrected) versus CS concentration is
shown in Figure 16. Simple linear regression revealed the following relationship:
ln(CHA-8hr, µg/g-cr) = 4.695 + 0.328 (CS conc., mg/m³)
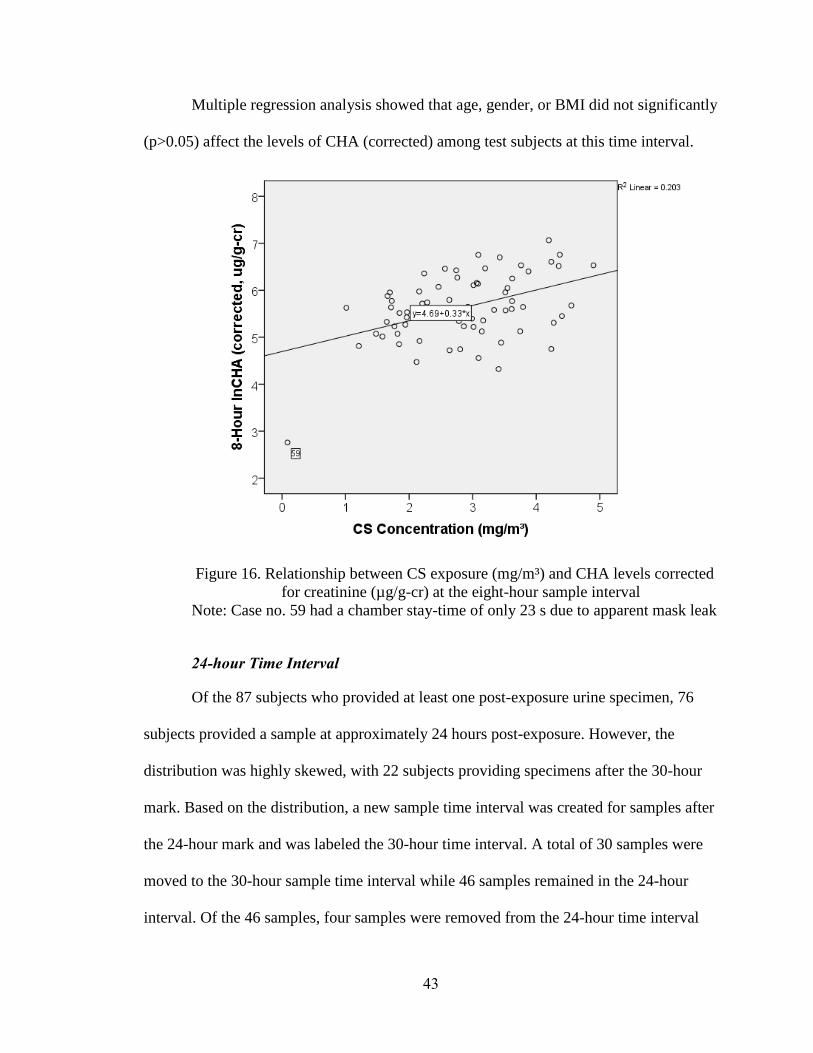
43
Multiple regression analysis showed that age, gender, or BMI did not significantly
(p>0.05) affect the levels of CHA (corrected) among test subjects at this time interval.
Figure 16. Relationship between CS exposure (mg/m³) and CHA levels corrected
for creatinine (µg/g-cr) at the eight-hour sample interval
Note: Case no. 59 had a chamber stay-time of only 23 s due to apparent mask leak
24-hour Time Interval
Of the 87 subjects who provided at least one post-exposure urine specimen, 76
subjects provided a sample at approximately 24 hours post-exposure. However, the
distribution was highly skewed, with 22 subjects providing specimens after the 30-hour
mark. Based on the distribution, a new sample time interval was created for samples after
the 24-hour mark and was labeled the 30-hour time interval. A total of 30 samples were
moved to the 30-hour sample time interval while 46 samples remained in the 24-hour
interval. Of the 46 samples, four samples were removed from the 24-hour time interval

44
for having extremely high CHA levels, as identified by the outlier testing procedure. The
extremely high CHA can be attributed to a combination of long chamber stay-time, high
CS exposure concentration, short time sampled, and high BMI. The 24-hr sample times
ranged from 20.4 – 23.9 hrs (�̅�=21.9 hrs). Laboratory analysis of CHA metabolite levels
in 24-hr specimens ranged from 1.350 – 131.0 ng/mL (�̅�=40.91 ng/mL). Correcting CHA
levels for creatinine at this time interval resulted in a range of 4.00 – 53.1 µg/g-cr
(�̅�=19.3 µg/g-cr). The Shapiro-Wilk test for normality indicated that CHA (corrected)
data was not normally distributed (p<0.01). Based on these findings, natural log
transformation of CHA (corrected) levels was necessary for statistical analysis. Natural
log transformation resulted in an lnCHA (corrected) range of 1.378 – 4.116 µg/g-cr
(�̅�=2.814 µg/g-cr). The Shapiro-Wilk test of normality revealed a normal data
distribution (p=0.609) and allowed for parametric analysis.
Pearson correlation coefficient revealed lnCHA (corrected) was significantly
correlated CS concentration, r = 0.442 (P<0.05). The scatter plot of 24-hr lnCHA
(corrected) versus CS concentration is shown in Figure 17. Simple linear regression
showed the following relationship:
ln(CHA 24-hr, µg/g-cr) = 1.957 + 0.305 (CS conc., mg/m³)
Multiple regression analysis showed that age, gender, or BMI did not
significantly affect the levels of CHA (corrected) among test subjects at this time interval.

45
Figure 17. Relationship between CS exposure (mg/m³) and CHA levels corrected
for creatinine (µg/g-cr) at the 24-hour sample interval
30-hour Time Interval
Of the 87 subjects who provided at least one post-exposure urine specimen, 30
subjects provided a sample approximately 30 hours post-exposure. Utilizing the outlier
testing procedure for 30-hour sample times, no samples were removed from the study due
to sample time alone. Two samples from this time interval were removed for high CHA
(corrected) values based on the outlier testing procedure. After removing outliers, the 30-
hour interval sample times ranged from 28.1 – 34.4 hrs (�̅�=31.5 hrs). The Shapiro-Wilk
test indicated that 30-hour sample times were normally distributed (p=0.256) and allowed
for parametric analysis. Laboratory analysis of CHA metabolite levels in 30-hour
specimens ranged from <LOD – 65.00 ng/mL. CHA levels below the LOD were
accounted for by dividing the LOD (1 ng/mL) by the square root of two, resulting in a
46
CHA range of 0.71 – 65.00 ng/mL (�̅�=27.10 ng/mL) (35). Correcting CHA levels for
creatinine at this time interval resulted in a range of 1.99 – 28.4 µg/g-cr (�̅�=10.63 µg/g-
cr). The Shapiro-Wilk test for normality indicated that CHA (corrected) data was not
normally distributed (p<.05). Based on these findings, natural log transformation of CHA
(corrected) levels was necessary for statistical analysis. Natural log transformation
resulted in an lnCHA (corrected) range of 0.69 – 3.35 µg/g-cr (�̅�=2.185 µg/g-cr). The
Shapiro-Wilk test of normality revealed a normal data distribution (p=0.266) and allowed
for parametric analysis.
Pearson correlation coefficient revealed that lnCHA (corrected) was significantly
correlated with CS concentration, r = 0.626 (p<0.01). The scatter plot of 30-hour lnCHA
(corrected) versus CS concentration is shown in Figure 18. Simple linear regression
revealed the following relationship:
ln(CHA, µg/g-cr) = 1.084 + 0.437 (CS conc., mg/m³)
Multiple regression analysis showed that age, gender, or BMI did not significantly
affect the levels of CHA (corrected) among test subjects at this time interval.

47
Figure 18. Relationship between CS exposure (mg/m³) and CHA levels corrected
for creatinine (µg/g-cr) at the 30-hour sample interval
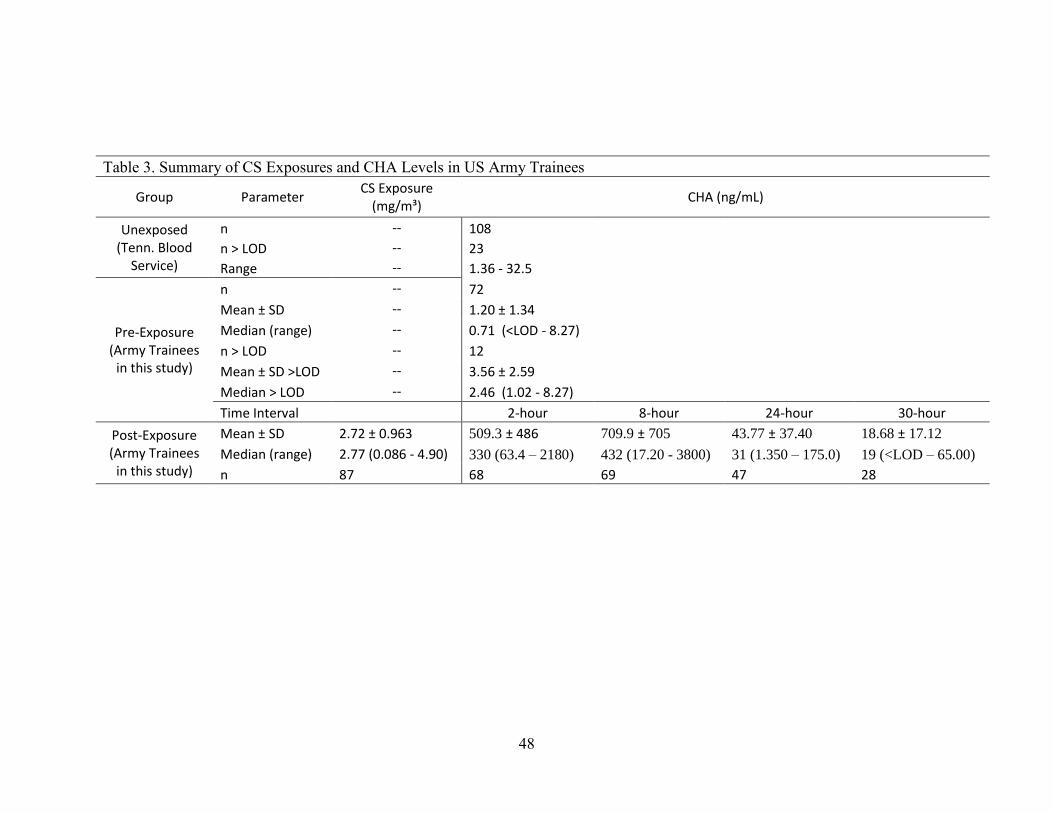
48
Table 3. Summary of CS Exposures and CHA Levels in US Army Trainees
Group Parameter CS Exposure
(mg/m³) CHA (ng/mL)
Unexposed (Tenn. Blood
Service)
n -- 108
n > LOD -- 23
Range -- 1.36 - 32.5
Pre-Exposure (Army Trainees
in this study)
n -- 72
Mean ± SD -- 1.20 ± 1.34
Median (range) -- 0.71 (<LOD - 8.27)
n > LOD -- 12
Mean ± SD >LOD -- 3.56 ± 2.59
Median > LOD -- 2.46 (1.02 - 8.27)
Time Interval 2-hour 8-hour 24-hour 30-hour
Post-Exposure (Army Trainees
in this study)
Mean ± SD 2.72 ± 0.963 509.3 ± 486 709.9 ± 705 43.77 ± 37.40 18.68 ± 17.12
Median (range) 2.77 (0.086 - 4.90) 330 (63.4 – 2180) 432 (17.20 - 3800) 31 (1.350 – 175.0) 19 (<LOD – 65.00)
n 87 68 69 47 28

49
Time as a Continuous Variable
The following analysis accounted for time as a continuous variable over the 34-
hour sampling period. No samples were removed from the study based on sample time
deviation from the mean. The 87 test subjects who provided at least one post-exposure
urine specimen provided a total of 212 post-exposure samples. Four samples were
removed using the outlier labeling procedure for excessively high CHA levels. The high
CHA levels outside the normal distribution are likely a result of a combination of one of
the following factors: high chamber stay-time, high CS concentration, short sample time,
and high BMI. Sample times ranged from 1.18 – 34.4 hours. Five of the 87 (5.7%) test
subject’s final sample returned CHA levels <LOD, suggesting that these individuals
metabolized virtually all CS during the sample period.
CHA levels for all samples ranged from 0.71 – 3800 ng/mL (�̅�=406.62 ng/mL).
CHA corrected for creatinine levels for all samples ranged from 1.986 – 1170.2 µg/g-cr
(�̅�=241.92 µg/g-cr). The Shapiro-Wilk test for normality revealed the CHA (corrected)
data was not normally distributed (p<0.01). Based on these findings CHA (corrected)
levels required natural log transformation for statistical analysis. Natural log
transformation of CHA (corrected) data revealed an lnCHA (corrected) range of 0.6861 –
7.064 µg/g-cr (�̅�=4.620 µg/g-cr). The Shapiro-Wilk test of normality revealed a non-
normal distribution (p<0.01) and required non-parametric analysis.
Utilizing Spearman’s rho non-parametric correlations, lnCHA (corrected) was
strongly correlated (negatively) with time sampled, r = -0.750 (p<0.01). LnCHA
(corrected), was weakly correlated with CS concentration, r = 0.243 (p<0.01). CS
concentration was not correlated with time sampled, as expected. Multiple regression was

50
applied to account for multi-variable analysis. Regression analysis resulted in a
significantly strong association between lnCHA (corrected), CS concentration and time
of urine sample, R = 0.910 (R² = 0.829, p<0.01). The relationship was determined to be:
ln(CHA, µg/g-cr) = 5.519 + 0.279 (CS conc., mg/m³) – 0.002 (time sampled)
Multiple regression analysis showed that age, gender, or BMI did not significantly
affect the levels of CHA (corrected) among test subjects when time was considered as a
continuous variable.
Figure 19. lnCHA corrected for creatinine versus post-exposure time sampled
The following analysis excluded all subjects who had pre-existing CHA levels to
determine the association without pre-exposure as a potential confounder. Removing the

51
12 subjects from the study removed 33 total specimens from this analysis. Utilizing
Spearman’s rho non-parametric correlations, lnCHA (corrected) was strongly correlated
with time sampled, r = -0.741 (p<0.01) and was weakly correlated with CS concentration,
r = 0.290 (p<0.01). Multiple regression was applied to account for multi-variable
analysis. Regression analysis of this model resulted in a significantly strong association,
R = 0.912 (R² = 0.831, p<0.01). The relationship was determined to be:
ln(CHA, µg/g-cr) = 5.289 + 0.366 (CS conc., mg/m³) – 0.002 (time sampled)
Consequently, the removal of individuals from this study who had a baseline CHA level
>LOD (1 ng/mL) increased the strength of association between lnCHA (corrected), CS
concentration, and time sampled by only 0.2%.

52
Chapter 5: Discussion
This research tested the following hypotheses:
1) Personal CS exposures exceed ACGIH TLV-C[skin] during MCT post
ALARACT 051/2013 implementation
2) Personal CS exposures exceed NIOSH IDLH during MCT post ALARACT
051/2013 implementation
3) A statistically significant relationship exists between exposure to CS and
concentration of CHA metabolite excreted in urine after US Army MCT
exercises
Research objectives of this study included determining CS exposure
concentration, determining CHA metabolite levels in urine of test subjects pre and post-
exposure, and using inferential statistics to assess the strength of association between CS
concentration and post-exposure CHA metabolite level. All specific aims were carried
out and research objectives were accomplished.
GENERAL STUDY COMPLETION AND EXPOSURE ASSESSMENT
Of the 91 subjects who volunteered for this study and signed a consent form, four
subjects self-dropped from this study after the MCT exercise and prior to providing urine
specimens. Of the four subjects who dropped, two subjects voluntarily stated that they
would not provide samples due to the onset of menstruation. The other two subjects did
not return to provide urine for reasons unknown. Of the 87 subjects who provided at least
one post-exposure urine sample, 86 wore personal monitoring during the MCT event.
One test subject was overlooked by researchers during event staging and completed the
event without being issued a personal monitoring sampling train. This subject, however,

53
remained in the study and provided post-exposure urine specimens. CS exposure for this
subject was estimated using the mean of his/her exposure group, SEG 26, which was not
significantly different from the mean of the day’s SEGs.
During the MCT, four of the 87 test subjects who provided post-exposure urine
specimens left the chamber before the 200 s (�̅�=341 s) mark due to apparent mask seal
leaks. Three of the four subjects’ data was removed from the study based on CHA levels
significant deviation from the mean based on the outlier testing procedure. One subject
had low CS concentration and low CHA levels associated with his/her low chamber stay-
time but was included in the normal distribution and was retained in the dataset. Subject
out-of-mask times ranged from 4 – 19 s (�̅�=8 s; 95% CI [8, 9]). Statistical analysis
revealed that subject out-of-mask times were not statistically different from one another
(p=0.53) nor was lnCHA correlated with out-of-mask times at any time interval or using
time as a continuous variable. This data suggests that variation in urinary CHA output
was not associated with variation in time out-of-mask during this evolution or that the
actual dose the subjects received was not related to uptake through inhalation.
Seventeen test subjects had pre-post pump calibration greater than the industrial
hygiene industry acceptable ±5% (32). Of the 17 subjects with greater than acceptable
pump calibration difference, 11 subjects had pre-post calibration difference less than 1%
greater than acceptable, two subjects had less than 2% greater than acceptable, two were
less than 3% greater, and one was less than 5% greater. For flow rate pre-calibration and
post-use check reporting, US Army TG 141 guidance states that if the difference between
pre-calibration flow rate and the post-use check is equal to or less than 5%, report the
average of the two (14). The manual also states that if the difference is greater than 5%,
54
to use the lower flow rate to ensure overestimate of airborne concentration in the
sampling environment (14). This study, however, was not performed to determine
conservative exposure profiles for reducing hazard severity in occupational settings. This
study sought obtain most accurate exposure levels possible for the purpose of association
evaluation between exposure and metabolite. Therefore, pre and post-use sampling pump
flow rates were averaged for all samples except one. The results of CS concentration
were not significantly different from their respective SEG and the averages of pre and
post-flowrates were used in the total air volume calculation. For the one exception, the
subject had a pre-post pump calibration difference of >200% and spent over seven
minutes in the chamber, however, this participant’s exposure measured only 0.004
mg/m³. These results indicate this subject had an apparent critical pump malfunction,
which in other settings, would require pump repair or replacement and retesting (25).
With CHA urine level data in the normal distribution range however, and the infeasibility
of repeating the MCT event, this subject’s CS exposure was categorized using the mean
for SEG 11 and his/her data remained in this study.
SPATIAL VARIATION INSIDE MCT CHAMBER
Due to the assembly of the test subjects in the chamber and the local procedures
used by MCT instructors, participants were arranged in a circle-like formation around the
point of CS generation located in the middle of the room. Because of this, test subjects
were located approximately equidistant from the exposure source while performing drills
and during the mask removal portion of the exercise. The BOLC MCT chamber layout
drawing is included in Figure 20. In a chamber with little air movement, the CS “plume”
was observed to distribute throughout the chamber in a relatively even manner as the

55
instructor wafted to the vapor each side. Also, as two test subjects removed his/her masks
and evacuated the chamber, the next two participants in line to remove their masks
moved into the position vacated by the exiting trainees. OSHA allows area samples to be
taken in a fixed location and results may represent the potential risk from airborne
contaminants or physical agents to workers in that area (34). However, for evaluation of
the association between exposure and metabolite in this study, personal monitoring
allowed a more subject-specific exposure profile to be used in statistical analysis. From
these observations and OSHA sampling guidance, spatial variation inside the chamber
played a small role, if any, in CS exposure concentration and was considered negligible
during this study.
Figure 20. BOLC MCT Chamber Layout.

56
EXPOSURE HYPOTHESES
Results of this study showed that CS exposure concentrations from all test
subjects enrolled in the study (n=91) ranged from 0.086 – 4.900 mg/m³ (�̅�=2.741 mg/m³).
89 of the 91 participants (98%) received an exposure concentration greater than the
ACGIH TLV-C[skin] (0.39 mg/m³). The two subjects who were exposed to less than the
TLV-C[skin] had chamber stay-times of less than 70 s due to apparent mask seal leaks.
Based on these results, researchers fail to reject hypothesis number one as personal
exposures exceeded ACGIH TLV-C[skin]. Furthermore, 25 of 91 participants (27%)
received an exposure concentration greater than NIOSH IDLH (2.0 mg/m³). Based on
these results, researchers fail to reject hypothesis number two as CS concentration levels
and stay-times resulted in exposure above the IDLH limit. These findings suggest that
there was insufficient implementation of ALARACT 051/2013 to reduce CS
concentration during MCT events at BOLC (29).
ASSOCIATION HYPOTHESIS
CHA vs. CS Concentration
After review of urine and CS exposure data, two main analyses of association
between lnCHA and CS exposure were explored. The following analysis placed urine
sample times into one of four time intervals. After removal of outliers, subjects provided
urine samples close enough to the 2, 8, 24, and 30-hour post-exposure sample time means
that differences in time were not significant. Categorizing sample times into one of the
four time intervals did not account for the specific time the urine sample was provided,
therefore, lnCHA (corrected) levels were not significantly associated with time within the
individual sample time intervals.
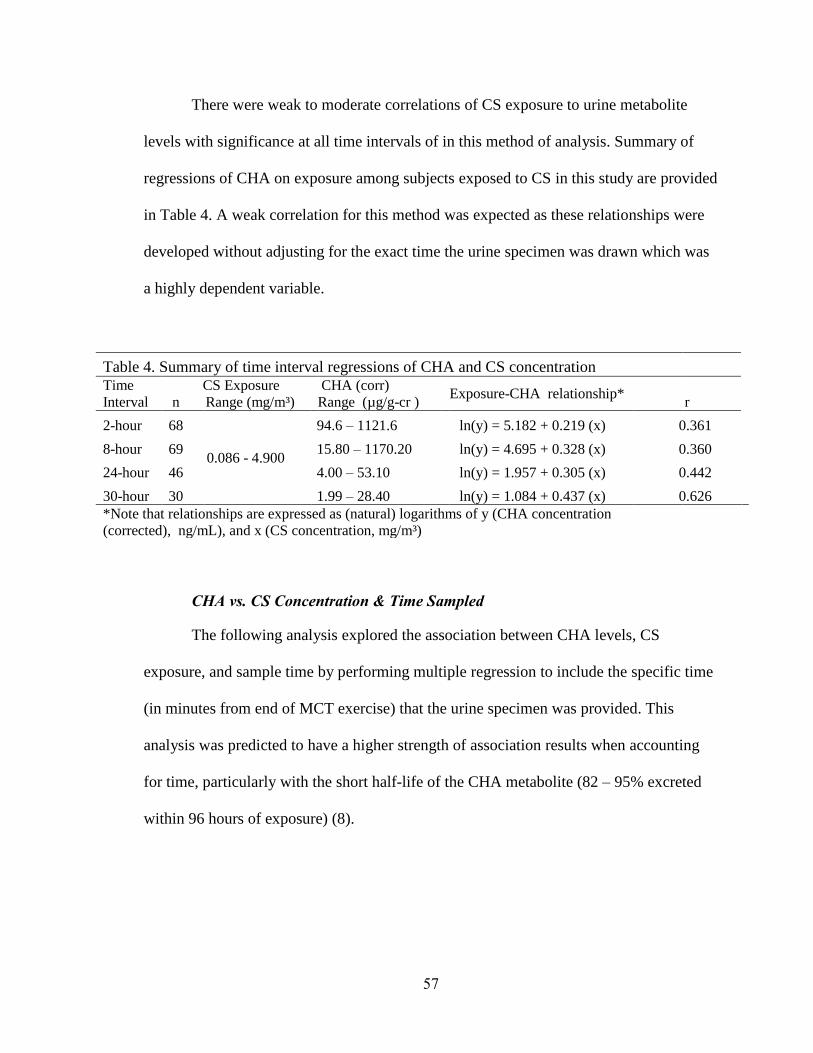
57
There were weak to moderate correlations of CS exposure to urine metabolite
levels with significance at all time intervals of in this method of analysis. Summary of
regressions of CHA on exposure among subjects exposed to CS in this study are provided
in Table 4. A weak correlation for this method was expected as these relationships were
developed without adjusting for the exact time the urine specimen was drawn which was
a highly dependent variable.
Table 4. Summary of time interval regressions of CHA and CS concentration
Time
Interval n
CS Exposure
Range (mg/m³)
CHA (corr)
Range (µg/g-cr ) Exposure-CHA relationship*
r
2-hour 68
0.086 - 4.900
94.6 – 1121.6 ln(y) = 5.182 + 0.219 (x) 0.361
8-hour 69 15.80 – 1170.20 ln(y) = 4.695 + 0.328 (x) 0.360
24-hour 46 4.00 – 53.10 ln(y) = 1.957 + 0.305 (x) 0.442
30-hour 30 1.99 – 28.40 ln(y) = 1.084 + 0.437 (x) 0.626
*Note that relationships are expressed as (natural) logarithms of y (CHA concentration
(corrected), ng/mL), and x (CS concentration, mg/m³)
CHA vs. CS Concentration & Time Sampled
The following analysis explored the association between CHA levels, CS
exposure, and sample time by performing multiple regression to include the specific time
(in minutes from end of MCT exercise) that the urine specimen was provided. This
analysis was predicted to have a higher strength of association results when accounting
for time, particularly with the short half-life of the CHA metabolite (82 – 95% excreted
within 96 hours of exposure) (8).
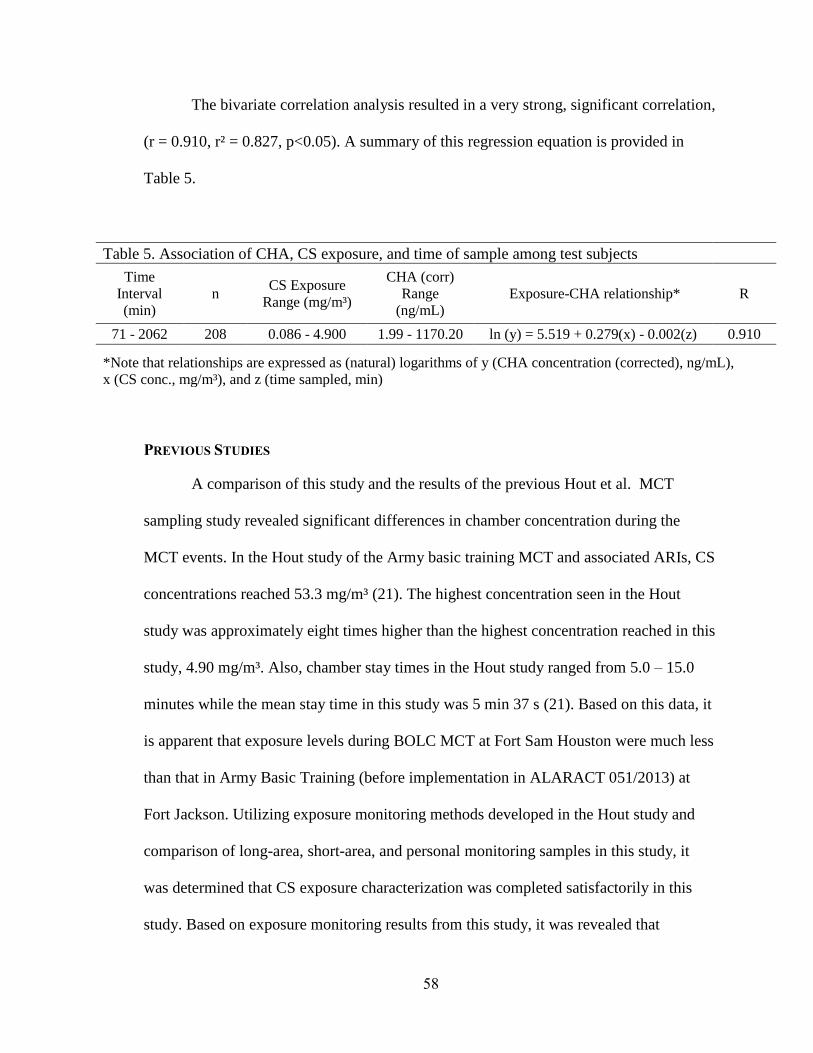
58
The bivariate correlation analysis resulted in a very strong, significant correlation,
(r = 0.910, r² = 0.827, p<0.05). A summary of this regression equation is provided in
Table 5.
Table 5. Association of CHA, CS exposure, and time of sample among test subjects
Time
Interval
(min)
n CS Exposure
Range (mg/m³)
CHA (corr)
Range
(ng/mL)
Exposure-CHA relationship* R
71 - 2062 208 0.086 - 4.900 1.99 - 1170.20 ln (y) = 5.519 + 0.279(x) - 0.002(z) 0.910
*Note that relationships are expressed as (natural) logarithms of y (CHA concentration (corrected), ng/mL),
x (CS conc., mg/m³), and z (time sampled, min)
PREVIOUS STUDIES
A comparison of this study and the results of the previous Hout et al. MCT
sampling study revealed significant differences in chamber concentration during the
MCT events. In the Hout study of the Army basic training MCT and associated ARIs, CS
concentrations reached 53.3 mg/m³ (21). The highest concentration seen in the Hout
study was approximately eight times higher than the highest concentration reached in this
study, 4.90 mg/m³. Also, chamber stay times in the Hout study ranged from 5.0 – 15.0
minutes while the mean stay time in this study was 5 min 37 s (21). Based on this data, it
is apparent that exposure levels during BOLC MCT at Fort Sam Houston were much less
than that in Army Basic Training (before implementation in ALARACT 051/2013) at
Fort Jackson. Utilizing exposure monitoring methods developed in the Hout study and
comparison of long-area, short-area, and personal monitoring samples in this study, it
was determined that CS exposure characterization was completed satisfactorily in this
study. Based on exposure monitoring results from this study, it was revealed that

59
implementation of ALARACT 051/2013 into the BOLC MCT resulted in lower mean
exposures than recorded in the Hout et al. study, however, implementation was not
successful overall as 64 of the 87 test subjects (74%) were exposed to CS concentration
levels above the IDLH limit of 2.0 mg/m³ (36). While evaluation of the implementation
of ALARACT 051/2013 or thermal dispersion techniques was not a goal of this study,
the higher range of exposure was helpful to evaluate a potential biomarker using CHA
metabolite for retrospective quantification of CS exposure in this cohort.
A comparison of this study to the Riches et al. study of the development of an
analytical method for urinary metabolites revealed a significant difference in two-hour
CHA levels measured between the two studies. In the Riches study, two-hour post-
exposure CHA (non-corrected) ranged from 3 – 135 ng/mL (�̅�=29.2 ng/mL) and
creatinine concentration mean was 256 mg/dL (37). Creatine concentration in the Riches
study was considerably higher than the reference values for randomly collected urine of
155 mg/dL and 172 mg/dL (388 non-Hispanic white US subjects and US Navy recruits,
respectively) (15; 39). However, quantitative measurements for CHA in the Riches study
were not creatinine corrected prior to analysis. In this study, two-hour post-exposure
CHA (non-corrected) ranged from 63.4 – 2180 ng/mL (�̅�=509.33 ng/mL) and the mean
creatinine for two-hour samples was 143 mg/dL, a value much closer to the mean
creatinine reference values. It is important to note that all exposures measured in this
study were lower than the lowest estimate of exposure in the Riches study. Based on
these results and the lack of CS sampling in the Riches study, evidence suggests that the
CS concentration estimate between 5 and 15 mg/m³ based on volume of chamber (55m³)
in the Riches study may have been considerably over-estimated, LC/MS laboratory
60
analysis for post-exposure CHA levels insufficiently captured metabolite levels in urine
specimens, and/or lack of creatinine correction for quantitative measurement of 2-CHA
may have negatively impacted their method development. The Riches study did conclude
that a sensitive method for analysis of CHA could not be developed.
PROJECT IMPLICATIONS AND LIMITATIONS
The recent deployment of RCAs during periods of civil unrest in the US and
around the world has motivated the development of analytical methods of quantification
of CHA detection and analysis of a potential biomarker for exposure to CS. Previous
studies have attempted to create a sensitive method for analysis of CHA but were
unsuccessful, likely in part due to concentrated urinary creatinine levels (37). While
creatinine levels in this study were slightly outside of the ACGIH recommended range
for analysis (30 – 300mg/dL), the mean concentration of creatinine in this study was 143
mg/ dL, not considerably different from the reference values for randomly collected urine
of 155 mg/ dL (388 non-Hispanic US subjects) and 172 mg/ dL (US Navy recruits) (15;
39).
Pre-exposure CHA Baseline Levels
According to the CDC, background levels of CHA that are not attributed to
exposure to CS are caused by either biotransformation of prescription medication or
exposure to 2-chlorobenzoic acid, which is also a precursor in the metabolic pathway of
CS to CHA (8). Chlorobenzoic acid is an anthropogenic compound not known to occur in
nature. It is used in the manufacturing of glues, paints, dyes, fungicide and other
agricultural chemicals (43). It has also been found to be a by-product of some municipal
wastewater chlorination processes (7). Pharmaceuticals containing chlorobenzoic acid

61
include ticlopidine (a platelet drug), isoprophenamine (a bronchodilator), bupropion (an
anti-depressant also used for smoking cessation), chlormezanon (a muscle relaxant), 4-
chlorobenzotrichloride (pharmaceutical intermediate), and lofepramine (an
antidepressant) (8). The possibility of pre-exposure to these products were not screened
in this study. Future research could design a study that determines potential pre-exposure
from occupation or medical treatment sources.
It is currently unknown how CS exposure affects CHA metabolism for individuals
who had pre-existing CHA levels from previous exposures of pharmaceuticals or using
products containing 2-chlorobenzoic acid. This study performed statistical analysis with
the pre-exposure CHA baseline included and excluded. Results indicate that exclusion of
subjects with pre-exposure CHA increased strength of association by only 0.2%.
Therefore, final correlations and associations did not exclude participants with a CHA
baseline from suspected pre-exposure for three reasons: 1) there was statistically no
difference between subjects with pre-exposure CHA baseline and those without 2) the
percentage of subjects in this study with baseline exposure was within four percent of the
percentage of the non-exposed random convenience sample group provided by the
Tennessee Blood Service and 3) practical use of the retrospective regression equation
would include the suspected portion of the population having pre-exposure CHA
baseline. Based upon this, it appears this association applies to individuals whether or not
they had pre-exposure to 2-chlorobenzoic acid.
Of the 12 subjects in this study who had baseline CHA, five subjects provided
pre-exposure urine samples prior to any trainees in this BOLC iteration being exposed to
CS in the MCT chamber. This reduced the suspicion that elevated baseline CHA levels in
62
this population could be due to secondary or indirect exposure from uniforms of
classmates who completed the MCT exercise earlier in the day. In addition, one BOLC
student reported sensing CS in the mats of the gymnasium tent of the FOB at some point
after MCT exercises began during the sampling week. The potential indirect exposure
effect on this study’s participants is unknown but this report reveals that the possibility
exists that, while unlikely, baseline urine CHA levels for day two and three MCT
exercise participants were attributed to secondary pre-MCT exposure.
Inhalation vs. Dermal Exposure
There are several other limitations and implications associated with this
observational study. This study evaluated participants of an MCT exercise that spent their
majority of time in the chamber while exposed to CS wearing a M40 chemical protection
mask and filter. The range of out-of-mask times were 4 – 19 s (�̅� = 8 s). Based on this
evidence, an average of greater than 97% of an individual’s time in the chamber was
spent being exposed via the dermal route only. Consequently, an average of only 3% of
an individual’s time in the chamber was spent being exposed through both dermal and
inhalation routes. This study did not attempt to distinguish the portion of the absorbed
dose attributed to CS uptake through the skin as opposed to the CS uptake was through
respiration. OSHA P&CAM 304 and Army TG 141 prescribes sampling pump flow rates
to be set at 1.5 L/min for CS sampling (14). However, evidence shows that individual
respiration rates may have varied during the out-of-mask portion of the exercises. In the
post-exposure survey, 6% of the subject population admitted to taking no breaths during
the out-of-mask portion. 41% reported only taking one breath and 48% report taking
more than one breath. Regardless of whether an individual did or did not take breaths

63
during the out-of-mask portion of the exercise, elevated CHA levels found in all urine
samples in 2, 8, and 24-hour samples indicate CS uptake and metabolism in all subjects.
This study did not attempt to account for self-reported breathing rates in statistical
analysis these reports are subjective, and shallow and erratic breathing in a CS rich
atmosphere may vary widely from person to person. This study relies upon the OSHA
and US Army industrial sampling guidance for a sampling rate of 1.5 L/min, which is
based upon the chemical, sample media, and analysis platform.
Post-MCT Residual Exposure
Another limitation of this study and likely confounder is the potential for
continued exposure after completing the MCT chamber exercise from residual CS
emanating from the participant’s body. Trainees completed the event wearing the general
issue ACU without additional MOPP gear, except for the M40 mask and filter. Wearing
only the ACU left the subjects’ hands, wrists, neck, and head exposed to the CS rich
atmosphere. In addition, the ACU blouse and trousers are made of a 50/50 cotton/nylon
blend, which may allow permeation and absorption of CS into uniform and
underclothing. This is supported by participants that reported the ability to sense CS
emanating from their own clothing as well as from their fellow trainee’s clothing for a
period after the event. This absorption into clothing, skin, and hair create a secondary
exposure source that likely results in a relatively small exposure for a period of time after
completion of the chamber event. In previous research, evidence suggests that secondary
exposure to CS could be a notable occupational hazard for health care workers
(emergency department personnel, and anesthetists) (16). It is unknown whether the
subjects showered or changed clothing within the 34 hours after exposure during urine

64
specimen collection. This study did not account for CS exposure from residual “off-
gassing” from uniform, hair, skin or a receiving a secondary exposure from a fellow
MCT trainee. Future research may include a study that quantifies residual exposure
giving future CHA metabolite studies the ability to account for post-chamber residual
exposure.
Creatinine Concentrations
Even though mean creatinine levels in this study were closer to the reference
values, a limitation and possible confounder in this study was the range of measured
creatinine levels used in statistical analysis, 17.40 – 507.80 mg/dL. According to ACGIH
guidelines, urine specimens that are highly dilute or highly concentrated are generally not
suitable for biological monitoring and suggests utilizing urine specimens with creatinine
concentrations only within the range of 30 – 300 mg/dL (2; 13). In order to avoid repeat
testing due to improper creatinine concentration, it has been suggested that the collection
site perform a specific gravity screen of urine prior to shipment and to accept samples
only within the range of 1.015 – 1.030 (23). The infeasibility to efficiently perform on-
site measurements of specific gravity in this austere environment in urine specimens prior
to freezing and shipment resulted in numerous samples being outside the recommended
creatinine range. This variation would affect creatinine corrections, and could have
possibly lowered the precision of CHA (corrected) levels used in regression analysis.
The presence of CHA background levels found in 17-21% of the combined
population of this study and the Tennessee Blood Service randomly selected unexposed
convenience sample group reflects implications in the use of CHA metabolite levels as a
potential biomarker for CS exposure. Obtaining medical history with prescription drug

65
use or occupational exposure records would be necessary to account for possible
confounders or false positives in individuals during investigations of alleged chemical
agent use during international warfare. However, further research could possibly
determine a CHA value that distinguishes occupational exposure to 2-chlorbenzoic acid
or CHA from medications from that of exposure to CS riot control agent.
66
Chapter 6: Conclusion
This is the first study to use personal monitoring to sample CS concentration and
the CDC’s DLS Method Code: 2437, CS Metabolite: 2-chlorohippuric acid (CHA), to
quantify urinary metabolite levels for the purpose of finding the association of exposure
to CS Riot Control Agent and the primary metabolite, CHA. The application of the
CDC’s method for sensitive analysis of CHA measured in urine by HPLC/MS, which
was used in statistical analysis for association testing is reported here, and resulted in a
limit of detection of 1.0 ng/mL for CHA. The method was applied to samples from an all
Army volunteer population during the BOLC MCT (n=87) with urine specimens taken
approximately of 2, 8, 24 and 30 hours post-exposure. The detection of elevated CHA
levels above LOD for all subjects at the 2-hour and 8-hour time intervals and in 80 of 85
subjects at the 24-hour and 30-hour time intervals reveals the potential for this assay to be
used successfully to monitor for CS exposure.
A significant correlation was found in all time intervals and using urine collection
time as a continuous variable. A strong and significant association in the analysis of CHA
over time and CS concentration (R = 0.910, R² = 0.827, p<0.01) allowed for the
development of a regression equation that could potentially be used for retrospective
analysis of exposure to CS with a urine specimen drawn within 34 hours of exposure
quantified levels of CHA and creatinine. Accounting for an exposed individual’s
potential baseline CHA levels from specific pharmaceuticals or exposure to certain glues,
paints, or dyes containing 2-benzoic acid (a precursor in the biotransformation of CS to
CHA), these regression equations have the potential to identify an individual’s exposure
to CS.

67
FUTURE RESEARCH
Future research is recommended to better understand the proportion of absorbed
dose of a CS exposed individual that is attributed to the inhalation versus the dermal
routes of exposure. This could perhaps be conducted by CHA metabolite analysis from
chamber operators who only wear M40 masks and no chemical protective garments.
MCT events limit trainee inhalation times to less than 15 s. In practical application
scenarios, it is unlikely for exposed individuals to wear chemical protection respirators
during the time of exposure. In addition, the CS concentration range measured in this
study was low and narrow compared to previous studies, 0.086 – 4.900 mg/m³. A similar
study conducted during an MCT event where CS concentrations significantly exceed the
maximum concentrations measured in this study could broaden the range predictability of
a retrospective regression equation to higher levels. Future research that carried out urine
specimen draws over 34 hours, possibly to 96 hours, may help researchers better
understand the metabolism of CS in exposed populations and how elimination is affected
by various personal characteristics. Studies may also be conducted to quantify potential
exposure from residual “off-gassing” from clothing, hair, and skin to an individual who
had spent time in a CS rich atmosphere with no personal decontamination.
DISCLAIMER
The views expressed in this article are those of the authors and do not reflect the
official policies or positions of the Uniformed Services University of the Health Sciences,
Department of the Navy, Department of the Army, Department of Defense, or the US
Government.

68
Appendix
A. Results from personal monitoring for all study subjects
B. IRB Authorization Letter
C. Information Sheet and Consent Form
D. Pre-exposure questionnaire

69
APPENDIX A: RESULTS FROM PERSONAL MONITORING FOR ALL STUDY SUBJECTS.

70
APPENDIX B: IRB AUTHORIZATION LETTER
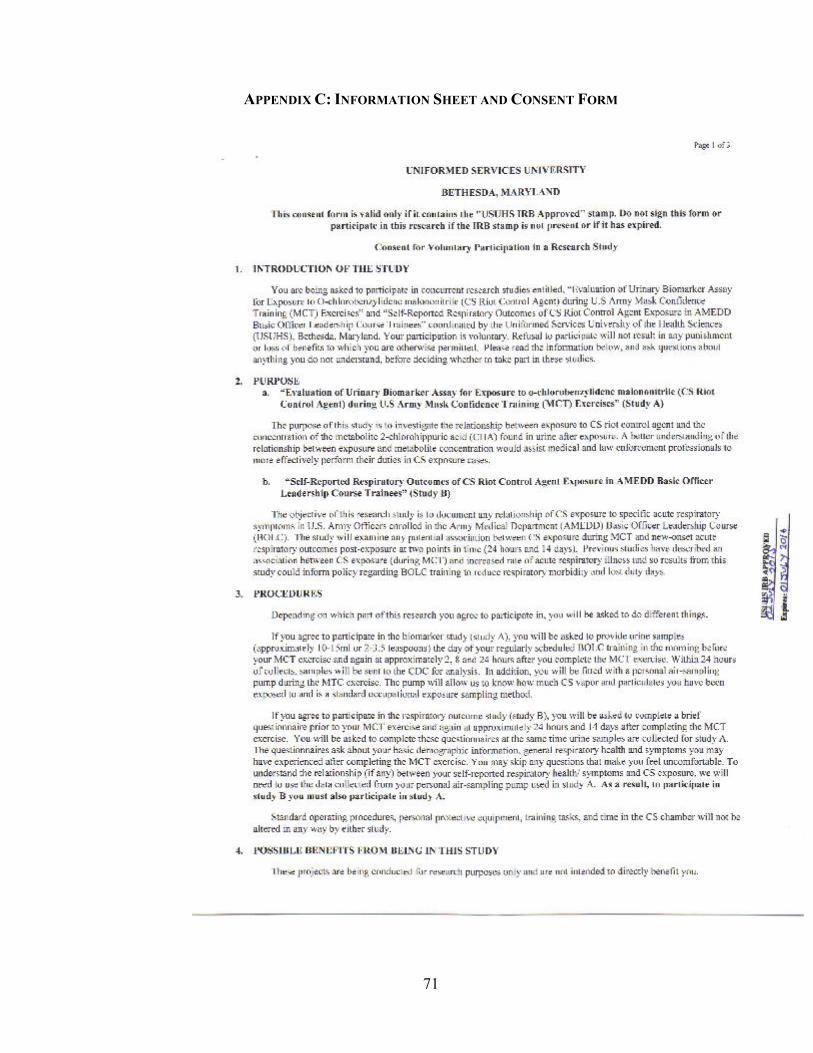
71
APPENDIX C: INFORMATION SHEET AND CONSENT FORM

72
73

74
APPENDIX D: PRE-EXPOSURE QUESTIONNAIRE
Pre-Mask Confidence Training Questionnaire
1. Use the scale below to rate the average severity of your symptoms over
the last three (3) days:
(please mark one circle for each symptom) Mild
Symptoms
Moderate Symptom
s
Severe Symptom
s
Do not have
this symptom
Sneezing ⃝ ⃝ ⃝ ⃝
Runny Nose ⃝ ⃝ ⃝ ⃝
Stuffy Nose ⃝ ⃝ ⃝ ⃝
Sore Throat ⃝ ⃝ ⃝ ⃝
Cough ⃝ ⃝ ⃝ ⃝
Headache ⃝ ⃝ ⃝ ⃝
Feeling Tired ⃝ ⃝ ⃝ ⃝
Chills ⃝ ⃝ ⃝ ⃝
2. Do you think that you have a cold or may be getting a cold? (choose one)
□ Yes
□ No
□ Don’t know
3. In the past three (3) days, have you taken medication for any of the
following reasons?
Yes No □ □ A cold
□ □ Cough
□ □ Fever
□ □ Runny nose
4. In the past three (3) days, have you gone to sick call for any of the
following reasons?
Yes No □ □ A cold
□ □ Cough
□ □ Fever
□ □ Runny nose
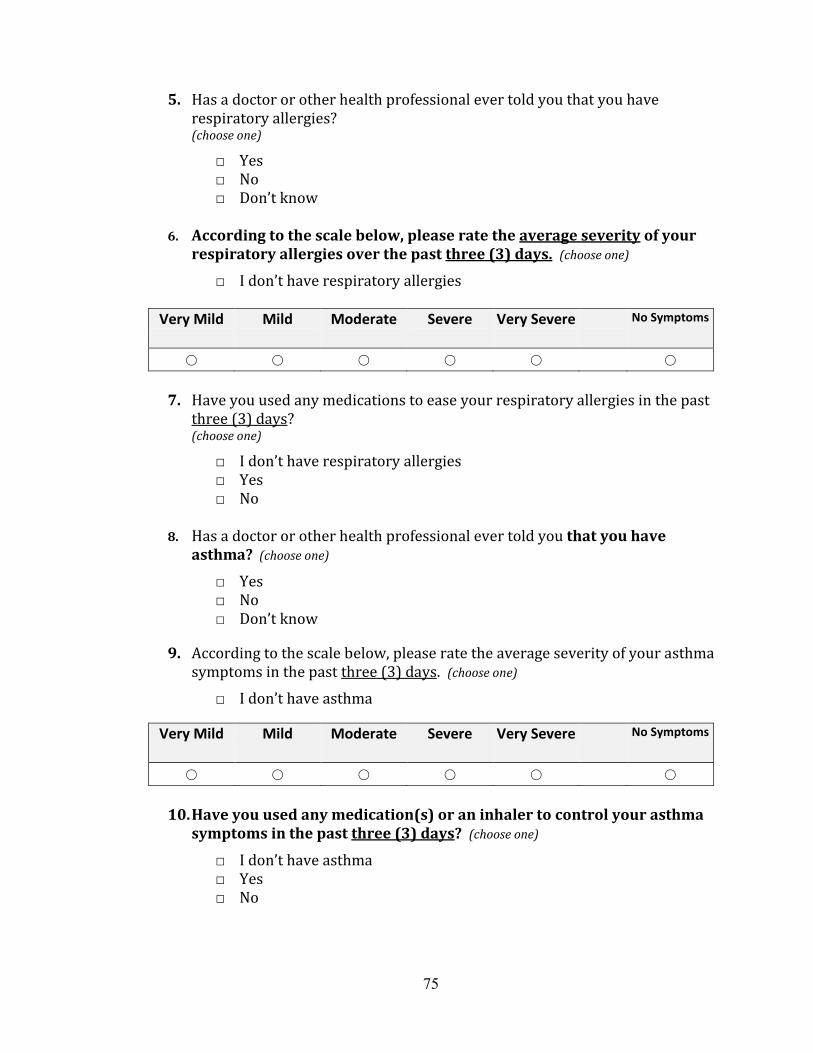
75
5. Has a doctor or other health professional ever told you that you have respiratory allergies? (choose one)
□ Yes □ No □ Don’t know
6. According to the scale below, please rate the average severity of your respiratory allergies over the past three (3) days. (choose one)
□ I don’t have respiratory allergies
Very Mild
Mild
Moderate
Severe
Very Severe
No Symptoms
⃝ ⃝ ⃝ ⃝ ⃝ ⃝
7. Have you used any medications to ease your respiratory allergies in the past
three (3) days? (choose one)
□ I don’t have respiratory allergies □ Yes □ No
8. Has a doctor or other health professional ever told you that you have
asthma? (choose one)
□ Yes □ No □ Don’t know
9. According to the scale below, please rate the average severity of your asthma symptoms in the past three (3) days. (choose one)
□ I don’t have asthma
Very Mild
Mild
Moderate
Severe
Very Severe
No Symptoms
⃝ ⃝ ⃝ ⃝ ⃝ ⃝
10. Have you used any medication(s) or an inhaler to control your asthma
symptoms in the past three (3) days? (choose one)
□ I don’t have asthma □ Yes □ No

76
11. In the past year, how many days did you miss work or school due to respiratory illness? (choose one)
□ No days missed □ 1 or 2 days missed □ 3 or more days missed
12. In the past week, has your roommate had any of the following: a cold, cough, fever, or runny nose? (choose one)
□ Yes □ No □ Don’t know □ No Roommate
13. In the past week, has anybody in your platoon had any of the following: a cold, cough, fever, or runny nose? (choose one)
□ Yes □ No □ Don’t know
14. Since arriving at Camp Bullis, has anybody staying in your tent had any of the following: a cold, cough, fever, or runny nose? (choose one)
□ Yes □ No □ Don’t know
15. On average, about how many hours of sleep per night did you get in the past two weeks? (choose one) [Seep is defined from the time you laid down until the time you got out of bed, minus any time intentionally spent awake (example: watching TV)]
□ Less than 7 hours of sleep □ 7 hours of sleep or more
16. Have you smoked at least 100 cigarettes in your entire life? (choose one)
□ Yes □ No □ Don’t know
17. Do you now smoke cigarettes every day, some days or not at all? (choose
one)
□ Every day □ Some Days □ Not at all

77
18. Have you ever been exposed to CS gas during a military mask confidence training exercise? (choose one)
□ Yes, more than one time □ Yes, one time □ No, I have never completed Mask Confidence Training
19. Age __________
20. Gender
□ Male □ Female
21. Height: __________ feet __________ inches
22. Weight: __________ pounds
23. What was your most recent Army Physical Fitness Test (APFT) Score?
(choose one)
□ Less than 180 □ 180 - 269 □ 270 or greater □ I have not taken an APFT
24. What is your branch of service in the Army Medical Department
(AMEDD)?
□ Dental Corps (DC) □ Medical Corps (MC) □ Medical Service Corps (MS) □ Medical Specialist Corps (SP) □ Nurse Corps (AN) □ Veterinary Corps (VC) □ Other___________
25. To which Company are you assigned while completing BOLC? (choose one)
(This refers to your BOLC Company (not A Co. 187th Med BN).
□ A Company □ B Company □ C Company □ D Company □ Other_______

78
26. To which Platoon are you assigned while completing the BOLC? (choose one)
□ 1st Platoon □ 2nd Platoon □ 3rd Platoon □ 4th Platoon □ Other_______

79
References
1. 2014. Creatinine Plus Laboratory Test. Cobas
2. ACGIH. 2016. TLV-BEI Guidlines: Biological Exposure Indices Introduction.
http://www.acgih.org/tlv-bei-guidelines/biological-exposure-indices-introduction
3. Army Dot. 1994. Training Circular (TC) 3-8, Chemical Training, Washington,
D.C.
4. Army U. 2014. Deriving and Documenting Army Specific OELs TWAs.
Gunpowder, MD: US Army Public Health Center
5. Association AIH. 2011. The Occupational Environment - Its Evaluation, Control,
and Management. 1&2
6. Blain PG. 2003. Tear Gases and Irritant Incapacitants. Toxicological Review
22:103-10
7. Borquin AW GD. 1978. Water Chlorination Environmental Impacts & Health
Effects. pp 253-64. Ann Arbor, MI: Ann Arbor Science
8. Bragg W. 2013. CDC Division of Laboratory Sciences Laboratory Protocol for
CS Metabolite: 2-Chlorohippuric Acid. CDC Emergency Response Branch
Laboratory Protocol:1-21
9. Branch CMR. 1979. Analytical Method P&CAM 394; o-Chlorobenzylidene
Malononitrile. ed. CDC, pp. 304-1 - -10
10. CDC. 2007. CDC Shipping Instructions for Specimens Collected from People
Who May Have Been Exposed to Chemical-Terrorism Agents. CT Clinical
Specimen Handling Guidelines CSH Guidelines
11. CDC. 2014. o-Chlorobenzylidene Malononitrile. NIOSH Publications and
Products Chemical Listing and Documentation
12. CIHL UN. 2008. GC-55 o-Chlorobenzylidene Malononitrile.2
13. Cocker J. 2011. Creatinine Adjustment of Biological Monitoring Results.
Occupational Medicine, UK 61:349-53
14. Command USAPH. 2012. Industrial Hygiene Sampling Guide. Technical Guide
141
15. DB Barr LW, SP Caudill, AJ Gonzalez, LL Deedham, JL Pirkle. 2005. Urinary
creatinine concentrations in the U.S. population: implications for uriary biologic
monitoring measurements. Environ Health Perspect 113:192-200
16. Dimitroglou Y. 2015. Exposure to the Riot Control Agent CS and Potential
Health Effects: A systematic Review of the Evidence. International Journal of
Environmental Research and Public Health 12:1397-411
17. Fraunfelder F. 2000. Is CS gas dangerous? BMJ 320:458-9
18. Giovanello SP. 2012. Riot Control Agents and Chemical Weapons Arms Control
in the United States. Journal of Strategic Security 5:1-18
19. Gupta. 2015. Handbook of Toxicology of Chemical Warfare Agents. Academic
Press. 1198 pp.
20. Hoaglin DC, Iglewicz, B., and Tukey, J.W. 1986. Performance of Some Resistant
Rules for Outlier Labeling. Journal of American Statistical Association 81:991-9

80
21. Hout JJ. 2014. O-Chlorobenzylidene Malononitrile (CS Riot Control Agent)
Exposures and Associated Acute Respiratory Illnesses in a United States Army
Basic Combat Training Cohort.
22. Inc. S. 2016. Sorbent tubes, Tenax TA OVS.
https://www.skcinc.com/catalog/product_info.php?products_id=707
23. Laboratories PT. 2016. Urine Creatinine Corrections.
http://www.pactox.com/library/article.php?articleID=18
24. Lowry LK. 2004. Definitions and Interpretations of Skin Notations and Use of
Biological Monitoring to Assess Total Exposure. ACGIH
25. Navy U. 2015. Industrial Hygiene Field Operations Manual. ed. N Medicine, pp.
3-11
26. NIOSH. 1995. Occupational Safety and Health Guideline for o-chlorobenzylidene
malononitrile.
27. NIOSH. 2014. Immediately Dangerous to Life or Health Concentration. NIOSH
Publications and Products
28. Niyousha MR PY, Golzari S. 2015. Acute and Chronic Effects of Disturbance
Control Factors, Complications and Treatment Method. Environmental Analytical
Chemistry 2:1-10
29. Office USAS. 2013. ALARACT 051/2013: Safety Alert on Mask Condfidence
Training (MCT) Procedures Using O-Chlorobenzylidene Malononitrile (CS)
Capsules. pp. 1-2
30. Olajos EJ. 2001. Riot Control Agents; pharmacology, toxicology, biochemistry
and chemistry. Journal of Applied Toxicology 21:355-91
31. OSHA. o-Chlorobenzylidene Malononitrile.
https://www.osha.gov/dts/chemicalsampling/data/CH_227100.html
32. OSHA. Personal Sampling for Air Contaminants. OSHA Technical Manual
2:Appendix F
33. OSHA. 2011. Personal Protective Equipment; Respiratory Protection. In Standard
29 CFR 1910.134, ed. OSHA: Department of Labor
34. OSHA. 2013. Chemical Exposure Health Data.
http://www.osha.gov/opengov/healthsamples.html
35. PA Succop SC, M. Chen, W. Galke. 2004. Imputation of Data Values that are
Less than a Detection Limit. Journal of Occupational and Environmental Hygiene
1:436-41
36. Prevention CfDCa. 1995. Occupational Safety and Health Guideline for o-
Chlorobenzylidene Malononitrile.1-7
37. Riches JR. 2013. The Development of an Analytical Method for Urinary
Metabolites of the Riot Control Agent 2-Chlorobenxylidene Malononitrile.
Journal of Chromatography B 928:125-30
38. Robert H. Powers DED. 2015. Forensic Toxicology: Mechanisms and Pathology.
CRC Press. 263 pp.
39. S.B. Needleman MP, D. Ander. 1992. Creatinine Analysis in Single Collection
Urine Specimens. Journal of Forensic Sciences 37:1125-33
40. Services NJDoHaS. 2000. o-chlorobenzylidene malononitrile Hazardous
Substance Fact Sheet.6
41. Sidell FR. Riot Control Agents. Medical Aspects of Chemical and Biological
Warfare:307-24

81
42. Weapons OftPoC. 2005. Convention on the Prohibition of the Development,
Production, Stockpiling, and Use of Chemical Weapons and on their Destruction
(English-Language Version).
43. Williams A. 1978. Kirk-Othmer Encycl Chem Tech 3rd ed. 3:778-90
Related Documents