UNIT 2 Ch. 1 1 2 3 4 5 6 Ch. 2 7 8 9 10 11 12 13 14 15 Big Questions Are the ways in which digital information is encoded more laws of nature or man made? What kinds of limitations does the binary encoding of information impose on what can be represented inside a computer? How accurately can human experience and perception be captured or reflected in digital information? Enduring Understandings 1.1 Creative development can be an essential process for creating computational artifacts. 1.3 Computing can extend traditional forms of human expression and experience. 2.1 A variety of abstractions built upon binary sequences can be used to represent all digital data. 3.3 There are trade offs when representing information as digital data. Unit 2 - Digital Information This unit further explores the ways that digital information is encoded, represented and manipulated. In this unit students will look at and generate data, clean it, manipulate it, and create and use visualizations to identify patterns and trends. Many of the lessons that follow have worksheets and student guides associated with activities. Those worksheets are listed in the relevant lesson plan, or you can check out all unit 2 student-facing activity guides here. You can access a flat pdf of all the lessons in unit 2 here. Chapter 1: Encoding and Compressing Complex Information Week 1 Lesson 1: Bytes and File Sizes Research Students are introduced to the standard units for measuring the sizes of digital files: bytes, kilobytes, megabytes, gigabytes, etc. and research the sizes of files they make use of every day.

Welcome message from author
This document is posted to help you gain knowledge. Please leave a comment to let me know what you think about it! Share it to your friends and learn new things together.
Transcript
UNIT
2Ch. 1 1 2 3 4 5 6 Ch. 2 7 8 9 10 11
12 13 14 15
Big Questions
Are the ways in which digital information isencoded more laws of nature or man made?What kinds of limitations does the binary encodingof information impose on what can be representedinside a computer?How accurately can human experience andperception be captured or reflected in digitalinformation?
Enduring Understandings
1.1 Creative development can be an essentialprocess for creating computational artifacts.1.3 Computing can extend traditional forms ofhuman expression and experience.2.1 A variety of abstractions built upon binarysequences can be used to represent all digital data.3.3 There are trade offs when representinginformation as digital data.
Unit 2 - Digital InformationThis unit further explores the ways that digital information is encoded, represented and manipulated. In this unitstudents will look at and generate data, clean it, manipulate it, and create and use visualizations to identify patternsand trends.
Many of the lessons that follow have worksheets and student guides associated with activities. Those worksheets arelisted in the relevant lesson plan, or you can check out all unit 2 student-facing activity guides here. You can accessa flat pdf of all the lessons in unit 2 here.
Chapter 1: Encoding and CompressingComplex Information
Week 1
Lesson 1: Bytes and File SizesResearch
Students are introduced to the standard units for measuring thesizes of digital files: bytes, kilobytes, megabytes, gigabytes, etc.and research the sizes of files they make use of every day.
Lesson 2: Text CompressionWidget - Text Compression | Individual and Group Discovery
At some point we reach a physical limit of how fast we can send bits and ifwe want to send a large amount of information faster, we have to find a wayto represent the same information with fewer bits - we must compress thedata.
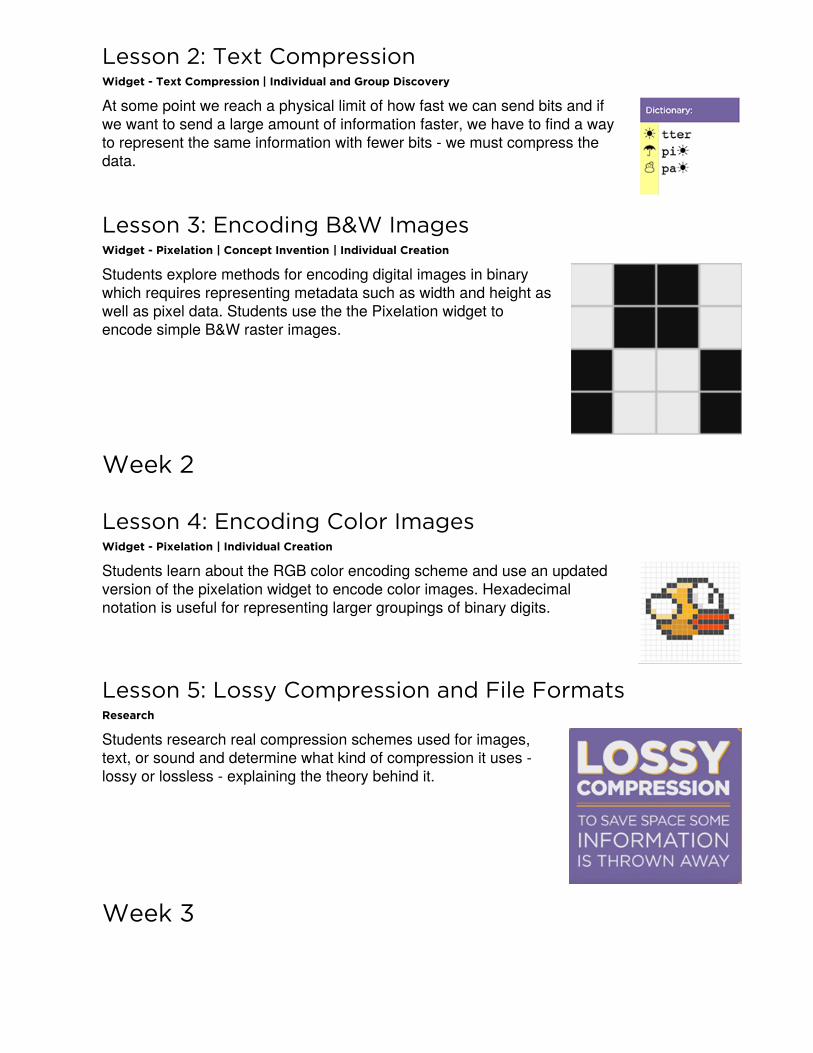
Lesson 3: Encoding B&W ImagesWidget - Pixelation | Concept Invention | Individual Creation
Students explore methods for encoding digital images in binarywhich requires representing metadata such as width and height aswell as pixel data. Students use the the Pixelation widget toencode simple B&W raster images.
Week 2
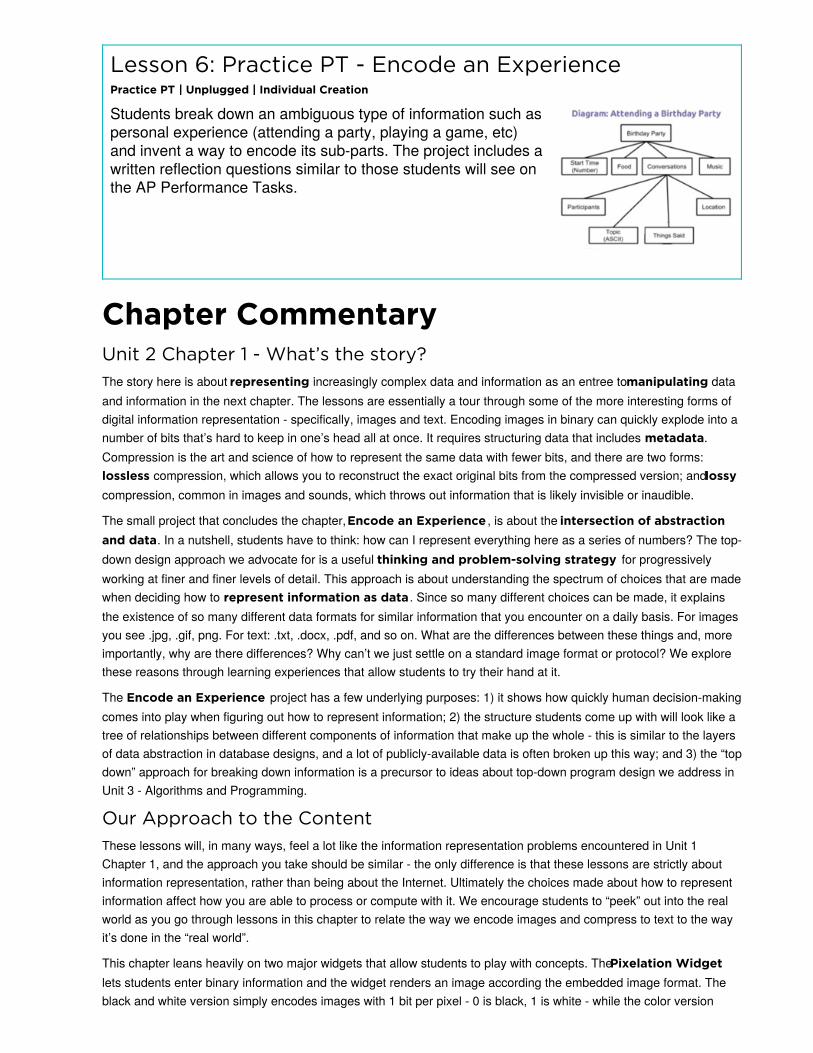
Lesson 4: Encoding Color ImagesWidget - Pixelation | Individual Creation
Students learn about the RGB color encoding scheme and use an updatedversion of the pixelation widget to encode color images. Hexadecimalnotation is useful for representing larger groupings of binary digits.
Lesson 5: Lossy Compression and File FormatsResearch
Students research real compression schemes used for images,text, or sound and determine what kind of compression it uses -lossy or lossless - explaining the theory behind it.
Week 3
Lesson 6: Practice PT - Encode an ExperiencePractice PT | Unplugged | Individual Creation
Students break down an ambiguous type of information such aspersonal experience (attending a party, playing a game, etc)and invent a way to encode its sub-parts. The project includes awritten reflection questions similar to those students will see onthe AP Performance Tasks.
Chapter CommentaryUnit 2 Chapter 1 - What’s the story?The story here is about representing increasingly complex data and information as an entree to manipulating dataand information in the next chapter. The lessons are essentially a tour through some of the more interesting forms ofdigital information representation - specifically, images and text. Encoding images in binary can quickly explode into anumber of bits that’s hard to keep in one’s head all at once. It requires structuring data that includes metadata.Compression is the art and science of how to represent the same data with fewer bits, and there are two forms:lossless compression, which allows you to reconstruct the exact original bits from the compressed version; and lossycompression, common in images and sounds, which throws out information that is likely invisible or inaudible.
The small project that concludes the chapter, Encode an Experience , is about the intersection of abstractionand data. In a nutshell, students have to think: how can I represent everything here as a series of numbers? The top-down design approach we advocate for is a useful thinking and problem-solving strategy for progressivelyworking at finer and finer levels of detail. This approach is about understanding the spectrum of choices that are madewhen deciding how to represent information as data . Since so many different choices can be made, it explainsthe existence of so many different data formats for similar information that you encounter on a daily basis. For imagesyou see .jpg, .gif, png. For text: .txt, .docx, .pdf, and so on. What are the differences between these things and, moreimportantly, why are there differences? Why can’t we just settle on a standard image format or protocol? We explorethese reasons through learning experiences that allow students to try their hand at it.
The Encode an Experience project has a few underlying purposes: 1) it shows how quickly human decision-makingcomes into play when figuring out how to represent information; 2) the structure students come up with will look like atree of relationships between different components of information that make up the whole - this is similar to the layersof data abstraction in database designs, and a lot of publicly-available data is often broken up this way; and 3) the “topdown” approach for breaking down information is a precursor to ideas about top-down program design we address inUnit 3 - Algorithms and Programming.
Our Approach to the ContentThese lessons will, in many ways, feel a lot like the information representation problems encountered in Unit 1Chapter 1, and the approach you take should be similar - the only difference is that these lessons are strictly aboutinformation representation, rather than being about the Internet. Ultimately the choices made about how to representinformation affect how you are able to process or compute with it. We encourage students to “peek” out into the realworld as you go through lessons in this chapter to relate the way we encode images and compress to text to the wayit’s done in the “real world”.
This chapter leans heavily on two major widgets that allow students to play with concepts. The Pixelation Widgetlets students enter binary information and the widget renders an image according the embedded image format. Theblack and white version simply encodes images with 1 bit per pixel - 0 is black, 1 is white - while the color version

Big Questions
What is the relationship between data, informationand knowledge?What are the best ways to find, see, and extractmeaningful trends and patterns from raw data?Where and how does human bias affect thecollection, processing and interpretation of data?
Enduring Understandings
1.3 Computing can extend traditional forms ofhuman expression and experience.3.1 People use computer programs to processinformation to gain insight and knowledge.3.2 Computing facilitates exploration and thediscovery of connections in information.3.3 There are trade offs when representinginformation as digital data.7.1 Computing enhances communication,interaction, and cognition.7.3 Computing has a global affect -- both beneficialand harmful -- on people and society.
requires students to understand how the RGB color scheme works and why hexadecimal representation is so usefulfor looking at long strings of binary values. In the widget students must also include metadata about the image(width, height, amount of color information), which mimics the “real world” uncompressed image encoding schemeknown as bitmap (bmp).
The Text Compression Widget lets students play with a text encoding/compression scheme that mimics what’sknown as LZW or ZIP compression. It works by identifying repeated patterns in the original text and storing them in a“dictionary” of patterns for later recall. The challenge is to see how much students can compress an a piece of text -the catch is that there is no way to actually know what the “best” is. Compression is a type of computationally hardproblem, and the best solution is to experiment, and come up a heuristic - a process that is likely to lead to a good-enough solution.
Chapter 2: Manipulating and VisualizingData
Week 4
Lesson 7: Introduction to DataUnplugged | External Tools | Individual and Group Discovery
Students examine sources of data in the world around them howthat data is collected. The Class Data Tracker project isintroduced, and students predict what they will find after all thedata has been collected.

Lesson 8: Finding Trends with VisualizationsExternal Tools | Research | Presentation
Students use the Google Trends tool in order to identifyingpatterns in historical search data. Students present their findings,differentiating between explanations of what the data showsversus plausible explanations for discovered patterns.
Lesson 9: Check Your AssumptionsResearch | Class Discussion
Students examine the assumptions they make when interpretingdata and visualizations by first reading a report about the "DigitalDivide" which challenges the assumption that data collected onlineis representative of the population at large. Students also evaluatea series of scenarios in which data-driven decisions are madebased on flawed assumptions.
Lesson 10: Good and Bad Data VisualizationsAnalyzing Artifacts | Group Discovery | Class Discussion
As a precursor to creating their own data visualizations, studentsexamine collections of (mostly bad) data visualizations, rate themand discuss the characteristics of good v. bad visualizations.
Week 5
Lesson 11: Making Data VisualizationsExternal Tools | Individual Skill Building | Tutorial
Students follow a guide to learn how to make scatter, bar, andline charts out of provided data using a spreadsheet tool (suchas Google sheets or MS Excel).
Lesson 12: Discover a Data StoryExternal Tools | Collaborative Artifact Creation | Writing
Students collaboratively investigate some datasets (provided) to“discover a data story.” Students choose one dataset, create avisualization, identify a trend, and accurately write about it.
Week 6
Lesson 13: Cleaning DataExternal Tools | Analyzing | Group Skill Building
Students begin working with the data that they have been collectingfor the Class Data Tracker project by first "cleaning" it to prepare itfor visualization and other analyses. Each team makes their owncopy of the data to examine, correct errors, categorize ambiguousitems, and perform other cleaning tasks.
Lesson 14: Creating Summary TablesExternal Tools | Artifact Creation | Analyzing
Students learn how create summary tables (also known as pivottables) from some raw datasets provided in a spreadsheet tool. Thenstudents create and use summary tables to investigate data they’vecollected as a class.

Lesson 15: Practice PT - Tell a Data StoryPractice PT | External Tools | Artifact Creation
Students continue to analyze their class tracker project data todiscover, visualize, write about and present a trend or patternthey find. The writing prompts are reflective of prompts from theAP Explore Performance Task.
Chapter CommentaryUnit 2 Chapter 2 - What’s the story?The story of this chapter is about how data can be manipulated to extract or reveal new information. Up to this pointwe have been focused primarily on bits and what they can be used to represent. Now we’re taking a big step back todo the inverse: we want to use tools meant for viewing, manipulating, and visualizing data in order to extract or findnew information.
The lessons in this chapter often have two things going on at once. In the background, the class is daily collectingsome data about themselves (the “Class Data Tracker project”) in order to accumulate data to process later on. In theinterim, students are learning about and developing skills with spreadsheet and visualization tools. The goal is forstudents to learn a few basic skills, see lots of examples, and then apply what they know to the Tell A Data Storyproject at the end of the chapter.
A big part of the story here is for students to understand the computer scientist’s role in working with data, whichmeans emphasizing how to use tools to manipulate, compute, and visualize the data. We look at things like makingsure that data type choices support the way we intend to process it later (e.g. don’t collect text when you need anumber). Data inevitably gets “dirty” during collection and needs to be cleaned. Computers are really useful for doingsome aggregations and visualizations to look for patterns. Along the way, we need to understand how human bias canbe introduced at each step so that we can accurately convey what patterns in the data are or are not telling us. Theseactivities help build toward the enduring understanding that there are trade offs when representing information asdigital data.
Our Approach to the ContentThe lessons in this chapter lean heavily on external tools, especially spreadsheets. The benefit is that students willgain experience with real tools and real data for the first time. The pitfall is that, because the tools are external,they are not scaffolded or designed for learning. We have tried to provide tutorials and curated data sets to ease theburden as much as possible, but ultimately you’re operating in the real world. While confined to the world of yourclassroom, the Class Data Tracker project should provide some authentic examples, scenarios, and sometimesheadaches related to data collection and processing in the real world.
As the teacher it’s important to keep in mind the goals of CS Principles because it can be enticing with these lessonsto dig into “hardcore” data analysis techniques and statistics. While these are important, they are beyond the scope ofCS Principles. Thus, we treat data analysis and statistics a bit like an electric fence: get close, but don’t touch.Students should be able to extract interesting things as the result of letting the tools do the work. We provide somelarge sets of curated data that came from real sources. The data is big enough that you have to apply somecomputation to make sense of it. We show how to use spreadsheets to do basic aggregations (such as grouping,

counting, clustering) and computations (such as average, median, etc.), without turning it into a lesson on statisticsand data analysis. We want to build toward the enduring understanding that computing facilitates exploration and thediscovery of connections in information.
The idea behind the Class Data Tracker project is that we have found that when students work with data that theycollected themselves it is easier and intrinsically motivating for students to dig in. To accumulate enough data, wecollect it in increments during the time they’re building up other skills with data tools. You should connect the skillsstudents are learning in the exercises to similar things they might do with the class tracker data for the Tell a DataStory project.

If you are interested in licensing Code.org materials for commercial purposes, contact us.
UNIT
2Ch. 1 1 2 3 4 5 6 Ch. 2 7 8 9 10 11
12 13 14 15
Lesson 1: Bytes and File SizesResearch
OverviewIn this lesson students are introduced to the standard units formeasuring the sizes of digital files, from a single byte, all the wayup to terabytes and beyond. Students begin the lesson bycomparing the size of a plain text file containing “hello” to a Worddocument with the same contents. Students are introduced to theunits kilobyte, megabyte, gigabyte, and terabyte, and research thesizes of files they make use of every day, using the appropriateterminology. This lesson foreshadows an investigation ofcompression as a means for combatting the rapid growth of digitaldata.
PurposeThe simple purposes of this lesson are:
1. Get terminology out in the open2. Become somewhat conversant with file types and sizes3. Grapple with orders-of-magnitude differences between things.
The 8-bit byte has become the de-facto fundamental unit withwhich we measure the “size” of data on computers, and in fact,today most computers only let you save data as combinations ofwhole bytes; even if you only want to store 1 bit of information, youhave to use a whole byte to do it. And many computer systems willrequire you store even more than that. Messages sent over theInternet are also typically structured as messages with byte-offsets.
Paralleling the explosion of computing power and speed, the sheersize of the digital data now created and consumed every day isstaggering. Units of measure (terabytes) that previously seemedunfathomably large are now making their way into personalcomputing. This rapid growth of digital data presents many newopportunities and also poses new challenges to engineers andprogrammers. The implications of so-called Big Data will not beinvestigated until later in the course, but it's good and interesting tobe thinking about the size of things now.
AgendaGetting Started (10 mins)
Terminology - ByteCompare sizes of plain text v. MS Word doc
Activity (30 mins)
ObjectivesStudents will be able to:
Use appropriate terminology whendescribing the size of digital files.Identify and compare the size of familiardigital media.Solve small word problems that requirereasoning about file sizes.
PreparationYou should verify that you know how to
look at the sizes of files on computers thatyour students are using (see activity).
For the getting started activity might wanta Word processing program (such as MSWord) and plain text editor (such asNotepad or TextEdit) open and ready.
The teaching remarks and contentcorners in this lesson contain lots of littlebits of history that you might choose toshare at various points in the lesson.
LinksHeads Up! Please make a copyof any documents you plan toshare with students.
For the Teacher
Activity Guide KEY - Bytes and FileSizes - Answer Key
For the Students
Bytes and File Sizes - Activity Guide
Unit 2 on Code StudioMake a Copy

Rapid Research: Bytes and File Sizes
Wrap-up
Review worksheetForeshadow Compression
Assessment

Teaching Tip
If you wish, it might be more fun to create these files infront of your students, saving them on the desktop fora quick demo. To make a plain ASCII text file you’llneed to use the correct program:
PC/Windows: use NotepadMac: use TextEdit (Note: TextEdit needs to beswitched into plain text mode from rich text. Go toFormat → Make Plain Text)
Content Corner
Why is a Byte 8 bits?
The 8-bit byte was not always standard. Computersused many different "byte" sizes over the course ofhistory, depending on hardware and how addressablememory worked. However, much of the early computingworld relied on representing data and computerinstructions encoded in ASCII text where everycharacter is 8 bits. Thus, 8-bits was such a commonchunk-size for representing information that it stuck andthey gave it its own name - byte.
There are various accounts about why it was called a“byte” but most point to early days at IBM where “bite”was used to to refer to groups of 8-bits that a computerwas processing, as in it could “bite” off 8 bits at time.The spelling was changed to “byte” to avoid confusionwith “bit”.
Bytes became the fundamental unit with which wemeasure the “size” of data on computers, and in fact,today most computers only let you save data ascombinations of whole bytes; even if you only want tostore 1 bit of information, you have to use a whole byteto do it.
Teaching GuideGetting Started (10 mins)
Remarks
As we embark on a new unit about Data and DigitalInformation we need to get familiar with terminologyabout data and different types of data files.
Terminology - ByteRecall that a single character of ASCII text requires8 bits. The technical term for 8 bits of data is a Byte.
A byte is the standard fundamental unit (or “chunksize”) underlying most computing systems today.You may have heard "megabyte", "kilobyte","gigabyte", etc. which are all different amounts of abytes. We're going to learn more about them today.
Compare sizes of plain text v.MS Word doc
Introduction:
Recall In a previous lesson (Unit 1 - SendingFormatted Text) we learned that in addition to theactual text of a document, it is usually necessary tostore the formatting information that allows the textto be displayed correctly. We might wonder just howmuch extra information, i.e. how many extra bytes,we need to store when we include all of this formatting. Let's find out!
If a single ASCII character is one byte then if we were to store the word “hello” in a plain ASCII text file in acomputer, we would expect it to require 5 bytes (or 40 bits) of memory.
What about a Microsoft Word document that contains the single word "hello"?
Predict: "How many more bytes will a Word document require to store the word “hello” than a plaintext document?"
Give students a chance to write down a prediction or ask for predictions and write them on the board.
Demonstrate or lead students through discovering for themselves the size of a word-processing document.
Here are some files you can download to use.
Plain text document hello.txtMS word document hello.docx
To find the actual size of a file on your computer, doone of the following:
PC/Windows: Right-click and choose “Properties”Mac: Ctrl+click and choose “Get Info”
In general, the Word Doc should be thousands oftimes larger than the plain text. For the files above:
hello.txt - 5 byteshello.docx = 21,969 bytes
Content Corner
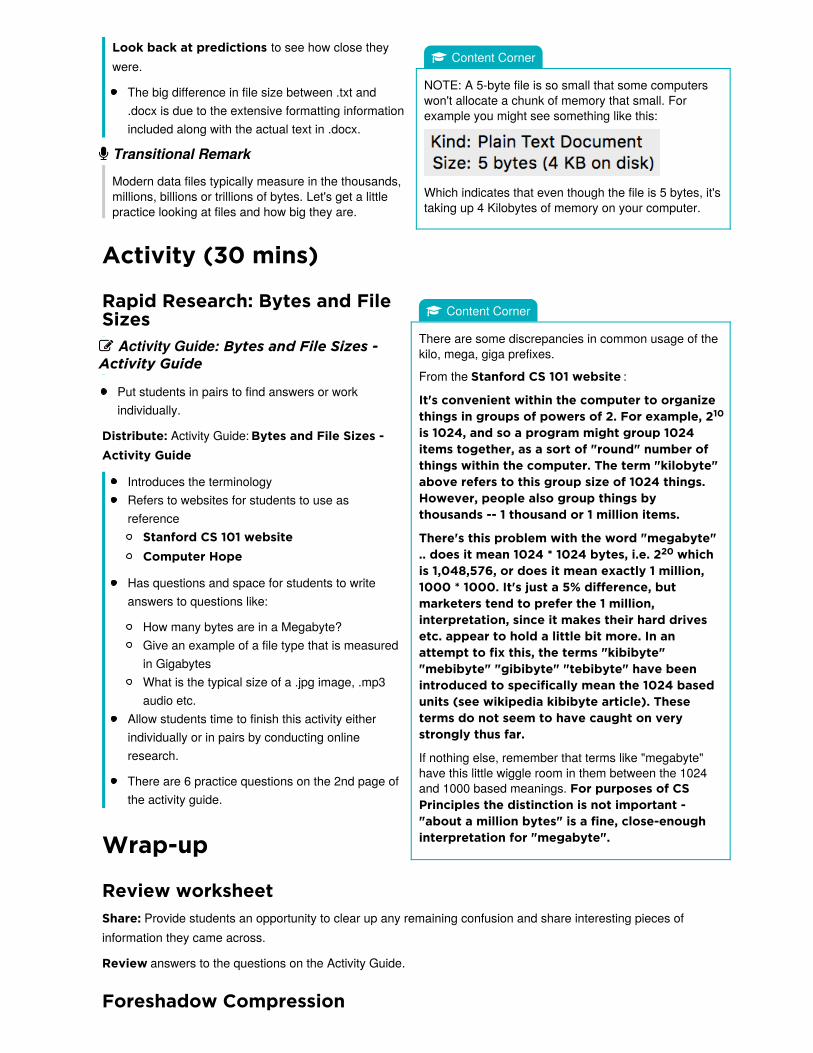
NOTE: A 5-byte file is so small that some computerswon't allocate a chunk of memory that small. Forexample you might see something like this:
Which indicates that even though the file is 5 bytes, it'staking up 4 Kilobytes of memory on your computer.
Content Corner
There are some discrepancies in common usage of thekilo, mega, giga prefixes.
From the Stanford CS 101 website :
It's convenient within the computer to organizethings in groups of powers of 2. For example, 2is 1024, and so a program might group 1024items together, as a sort of "round" number ofthings within the computer. The term "kilobyte"above refers to this group size of 1024 things.However, people also group things bythousands -- 1 thousand or 1 million items.
There's this problem with the word "megabyte".. does it mean 1024 * 1024 bytes, i.e. 2 whichis 1,048,576, or does it mean exactly 1 million,1000 * 1000. It's just a 5% difference, butmarketers tend to prefer the 1 million,interpretation, since it makes their hard drivesetc. appear to hold a little bit more. In anattempt to fix this, the terms "kibibyte""mebibyte" "gibibyte" "tebibyte" have beenintroduced to specifically mean the 1024 basedunits (see wikipedia kibibyte article). Theseterms do not seem to have caught on verystrongly thus far.
If nothing else, remember that terms like "megabyte"have this little wiggle room in them between the 1024and 1000 based meanings. For purposes of CSPrinciples the distinction is not important -"about a million bytes" is a fine, close-enoughinterpretation for "megabyte".
Look back at predictions to see how close theywere.
The big difference in file size between .txt and.docx is due to the extensive formatting informationincluded along with the actual text in .docx.
Transitional Remark
Modern data files typically measure in the thousands,millions, billions or trillions of bytes. Let's get a littlepractice looking at files and how big they are.
Activity (30 mins)
Rapid Research: Bytes and FileSizes Activity Guide: Bytes and File Sizes -Activity Guide
Put students in pairs to find answers or workindividually.
Distribute: Activity Guide: Bytes and File Sizes -Activity Guide
Introduces the terminologyRefers to websites for students to use asreference
Stanford CS 101 websiteComputer Hope
Has questions and space for students to writeanswers to questions like:
How many bytes are in a Megabyte?Give an example of a file type that is measuredin GigabytesWhat is the typical size of a .jpg image, .mp3audio etc.
Allow students time to finish this activity eitherindividually or in pairs by conducting onlineresearch.
There are 6 practice questions on the 2nd page ofthe activity guide.
Wrap-up
Review worksheetShare: Provide students an opportunity to clear up any remaining confusion and share interesting pieces ofinformation they came across.
Review answers to the questions on the Activity Guide.
Foreshadow Compression
10
20
Teaching Tip
Note that answers to 3 of the 6 questions on the activityguide can be found on the Stanford CS 101 page linkedto in the activity guide.
Perfect accuracy is not important for some sections inthis activity, but using the correct terminology andachieving a rough estimate of size (one million bytes vs.one billion) is important. Encourage students to practiceusing terms like megabyte, gigabyte, and terabyte togain comfort with them.
Teaching Tip
Time permitting you could do the warm up activity fromthe next lesson (Text Compression) here. That warmup activity asks students to write down commonabbreviations they use when sending text messages tofriends and family, and then asks why they do that. Theanswer is compression: to save time and space.
Remarks
As you have seen data file size can grow veryquickly in size. In the modern world there is a lot ofdata around us and usually we want it transmittedover the internet.
There is a problem though : If you want totransmit a lot of data you are limited by the speed ofyour internet connection. Even if you have a fastInternet connection there is a physical limit to howfast you can transmit bits.
What if the data you want to send is big enough thatit takes an unreasonable amount of time to transmitit, even with a really fast internet connection.Assuming you can't make the Internet connectionany faster, could you still transmit the data fastersomehow?
The answer is yes and it's probably somethingyou've done, or do every day!
Assessment
Use the last 3 questions on the activity guide for assessment.
Standards AlignmentCSTA K-12 Computer Science Standards (2011)
CT - Computational Thinking
Computer Science Principles
2.1 - A variety of abstractions built upon binary sequences can be used to represent all digital data.
3.3 - There are trade offs when representing information as digital data.
If you are interested in licensing Code.org materials for commercial purposes, contact us.
UNIT
2Ch. 1 1 2 3 4 5 6 Ch. 2 7 8 9 10 11
12 13 14 15
Lesson 2: Text CompressionWidget - Text Compression | Individual and Group Discovery
OverviewAt some point we reach a physical limit of how fast we can sendbits and if we want to send a large amount of information faster,we have to find a way to represent the same information withfewer bits - we must compress the data.
In this lesson, students will use the Text Compression Widget tocompress segments of English text by looking for patterns andsubstituting symbols for larger patterns of text. After someexperimentation students are asked to come up with a process (oralgorithm) for arriving at a "good" amount of compression despitethe fact that there is no way to know what is best or optimal. Indeveloping a so-called "heuristic approach" to this problem,students will grapple with the tradeoffs in compressing data andbegin to develop a sense of computing problems that are “hard” tosolve.
PurposeThis is a big lesson that covers a lot of bases. It should easily take2 or more days of class. First and foremost it covers two or threetopics directly from the CSP framework.
1. lossless compression
The basic principle behind compression is to develop a method orprotocol for using fewer bits to represent the original information.The way we represent compressed data in this lesson, with a“dictionary” of repeated patterns is similar to the LZWcompression scheme, but it should be noted that LZW is slightlydifferent from what students do in this lesson. Students invent theirown way here. LZW is used not only for text (zip files), but alsowith the GIF image file format.
2. heuristics
The lesson touches on computationally hard problems andheuristics but please note that computationally hard problemsand heuristics will be revisited later on. A general "hand-wavy" understanding is all that's needed from this lesson.
We do want students to see, however, that there is no singlecorrect way to compress text using the method we use in thislesson because a) there is no known algorithm for finding anoptimal solution, and b) we don’t even know a way to verifywhether a given solution is optimal. There is no way to prove it or
ObjectivesStudents will be able to:
Collaborate with a peer to find a solution toa text compression problem using the TextCompression Widget (lossless compressionscheme).Explain why the optimal amount ofcompression is impossible or “hard” toidentify.Explain some factors that makecompression challenging.Develop a strategy (heuristic algorithm) forcompressing text.Describe the purpose and rationale forlossless compression.
PreparationTest out the Text Compression WidgetReview the teaching tips to decide which
options you want to use
LinksHeads Up! Please make a copyof any documents you plan toshare with students.
For the Teacher
Activity Recap - Decode this Message- Activity Recap
For the Students
Decode this message - Activity Guide
Activity Guide - Text Compression -Activity Guide Video: Text Compression with AloeBlacc - Video (download)Activity Guide - Text CompressionHeuristics - Activity Guide
Unit 2 on Code Studio
Make a Copy
Make a Copy
Make a Copy
Make a Copy
derive it beyond trying all possibilities by brute force. This is anexample of an algorithm that cannot run in a “reasonableamount of time” - one of the CSP learning objectives.
3. Foreshadowing programming behaviors
Lastly, the Text Compression Activity is an important lesson torefer back to when students start programming. Theactivity engages students in thinking and problem solvingbehaviors that foreshadow skills that are particularly useful forprogramming later down the line. In particular, when studentsrecognize patterns that repeat, and then represent those patternsas abstract symbols, and then further recognize patterns withinthose patterns, it is very similar to the kinds of abstractions wedevelop when writing functions and procedures whenprogramming. Decoding the message in the warm-up activity isvery similar to tracing a sequence of function calls in a program.
AgendaGetting Started (5-7 mins)
Warm up: Abbr In Ur Txt Msgs (5-7 mins)
Activity (45 mins)
Decode this Mystery Text (10-15 mins)Use theText Compression WidgetDiscuss properties and challenges withcompression.
Activity 2 (30 mins)
Develop a heuristic for doing compressionWhat's best?
Wrap-up (20 mins)
Recap QuestionsCompression in the Real World (.zip)
AssessmentExtended Learning
VocabularyHeuristic - a problem solving approach(algorithm) to find a satisfactory solutionwhere finding an optimal or exact solutionis impractical or impossible.Lossless Compression - a datacompression algorithm that allows theoriginal data to be perfectly reconstructedfrom the compressed data.
DiscussionGoal
As a warm up to thinking about Text Compression,connect to ways that most people already compresstext in their lives, through abbreviations and acronymswith which most people have some experience in textmessages.
Motivate some ideas about why someone would wantto compress text.
Teaching GuideGetting Started (5-7 mins)
Warm up: Abbr In Ur Txt Msgs (5-7 mins)Prompt:
"When you send text messages to a friend,do you spell every word correctly?"
Do you use abbreviations for common words?List as many as you can.Write some examples of things you might see ina text message that are not proper English.
Give students a minute to write, and to share with aneighbor?
"Why do you use these abbreviations? What is the benefit?"Possible answers:
to save characters/keystrokesto hide from parents/teachersto be cool, clever, funnyto “speak in code”to say the same thing in less space
What's this about? - Compression: Same Data, Fewer Bits
Today's class is about compressionWhen you abbreviate or use coded language to shorten the original text, you are “compressing text.” Computersdo this too, in order to save time and space.
The art and science of compression is about figuring out how to represent the SAME DATA with FEWER BITS.
Why is this important? One reason is that storage space is limited and you'd always prefer to use fewer bits if youcould. A much more compelling reason is that there is an upper limit to how fast bits can be transmitted over theInternet.
What if we need to send a large amount of text faster over the Internet, but we’ve reached the physical limit ofhow fast we can send bits? Our only choice is to somehow capture the same information with fewer bits; we callthis compression.
Transition:
Let's look at an example of a text message that's been compressed in a clever way.
Activity (45 mins)
Decode this Mystery Text (10-15 mins)Distribute or Display the Activity guide: Decode this message - Activity GuidePut students into partners or work individually.Task: What was the original text?Give students a few minutes to decode the text. The text should be a short poem (see activity recap below)
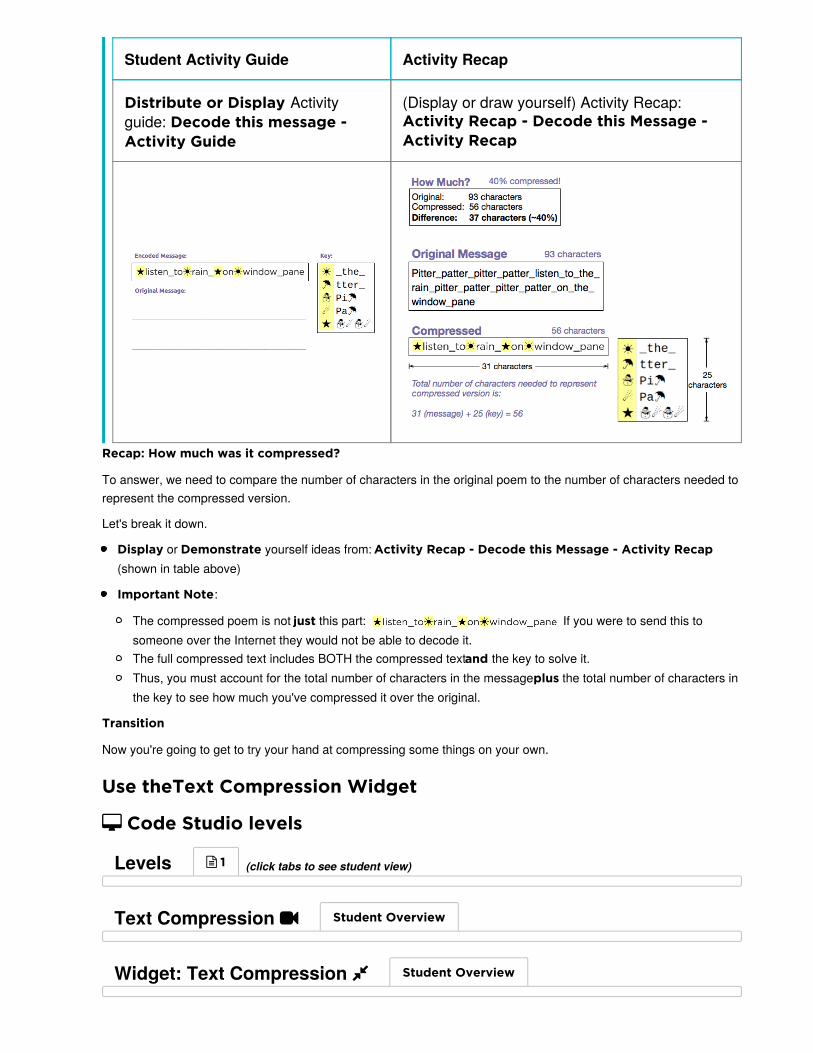
Student Activity Guide Activity Recap
Distribute or Display Activityguide: Decode this message -Activity Guide
(Display or draw yourself) Activity Recap:Activity Recap - Decode this Message -Activity Recap
Recap: How much was it compressed?
To answer, we need to compare the number of characters in the original poem to the number of characters needed torepresent the compressed version.
Let's break it down.
Display or Demonstrate yourself ideas from: Activity Recap - Decode this Message - Activity Recap(shown in table above)
Important Note:
The compressed poem is not just this part: If you were to send this tosomeone over the Internet they would not be able to decode it.The full compressed text includes BOTH the compressed text and the key to solve it.Thus, you must account for the total number of characters in the message plus the total number of characters inthe key to see how much you've compressed it over the original.
Transition
Now you're going to get to try your hand at compressing some things on your own.
Use theText Compression Widget
Code Studio levels
Levels 1 (click tabs to see student view)
Text Compression Student Overview
Widget: Text Compression Student Overview
Content Corner
The video explains a little bit about compression ingeneral - the difference between lossless compressionand lossy compression. Todays class is about losslesscompression we'll do lossy compression in a class ortwo after looking at image encoding.
Teaching Tip
Teacher's Choice whether to show the video to thewhole class or let students watch it from within CodeStudio. There are benefits and drawbacks to each.
Option to Consider: Get students into the textcompression tool BEFORE showing the video. Youmight find students are more receptive to some of theinformation in the video if they have tried to use the toolfirst.
Communication and Collaboration: To developcommunication and collaboration between students,include one of the following scenarios in class:
Have students who were assigned the same poemcompare results, or seat them in the same area ofthe room.Have a little friendly competition - but be careful notto let “bad” competition seep in - to see which paircan compress a poem the most. Use a poem thatnone of the students have compressed yet.For each poem, have the group(s) who did it figureout the best in the class, and record it on the boardor somewhere that people can see.
Have a class goal of getting the compressionpercentages for the four poems as high aspossible.The groups with the best compressionpercentages may be asked to share their strategywith the class.
Students may be reluctant to share if they feel theydon’t have the best results, but students should seeothers’ work and offer advice and strategies.
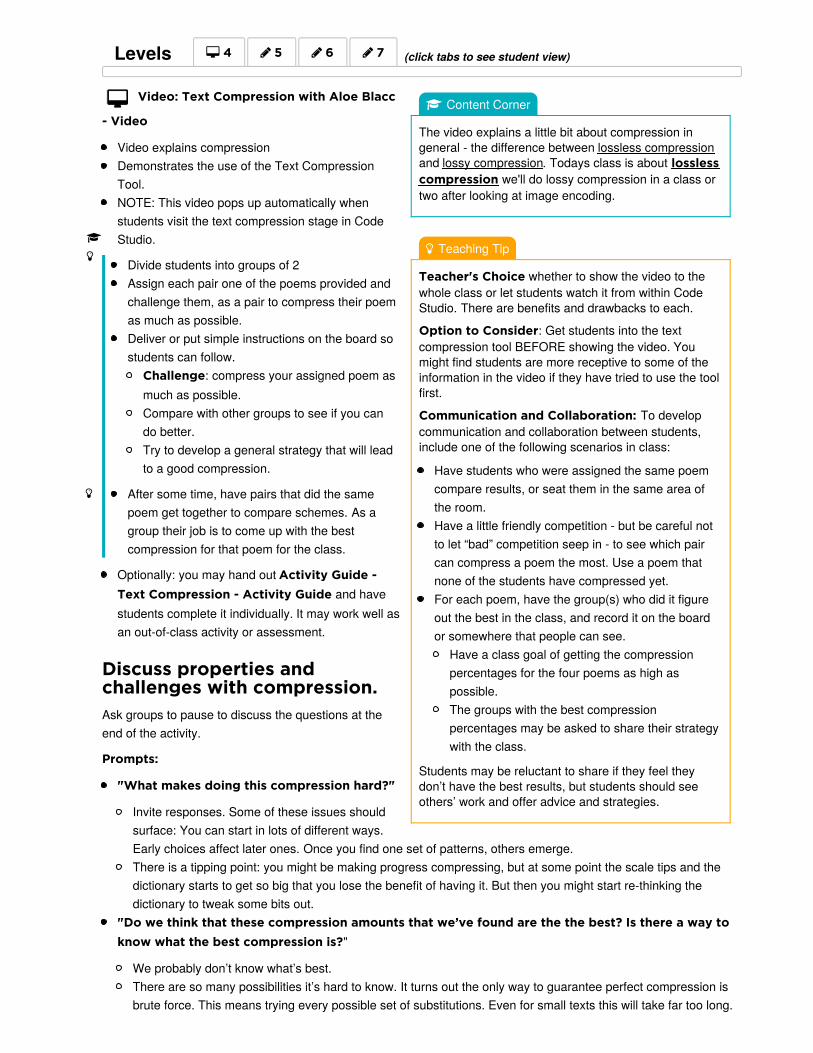
Video: Text Compression with Aloe Blacc
- Video
Video explains compressionDemonstrates the use of the Text CompressionTool.NOTE: This video pops up automatically whenstudents visit the text compression stage in CodeStudio.
Divide students into groups of 2Assign each pair one of the poems provided andchallenge them, as a pair to compress their poemas much as possible.Deliver or put simple instructions on the board sostudents can follow.
Challenge: compress your assigned poem asmuch as possible.Compare with other groups to see if you cando better.Try to develop a general strategy that will leadto a good compression.
After some time, have pairs that did the samepoem get together to compare schemes. As agroup their job is to come up with the bestcompression for that poem for the class.
Optionally: you may hand out Activity Guide -Text Compression - Activity Guide and havestudents complete it individually. It may work well asan out-of-class activity or assessment.
Discuss properties andchallenges with compression.Ask groups to pause to discuss the questions at theend of the activity.
Prompts:
"What makes doing this compression hard?"
Invite responses. Some of these issues shouldsurface: You can start in lots of different ways.Early choices affect later ones. Once you find one set of patterns, others emerge.There is a tipping point: you might be making progress compressing, but at some point the scale tips and thedictionary starts to get so big that you lose the benefit of having it. But then you might start re-thinking thedictionary to tweak some bits out.
"Do we think that these compression amounts that we’ve found are the the best? Is there a way toknow what the best compression is?"
We probably don’t know what’s best.There are so many possibilities it’s hard to know. It turns out the only way to guarantee perfect compression isbrute force. This means trying every possible set of substitutions. Even for small texts this will take far too long.
Levels 4 5 6 7 (click tabs to see student view)
Teaching Tip
You may elect to not do this heuristic activity andinstead get the key take-aways (see Activity Goalbelow) across through discussion following the previousactivity.
ActivityGoal
The point here is to establish:
There is no real way to determine for sure thatyou've got the best compression besides tryingeverything possible by brute force.Heuristics are techniques for at least makingprogress toward a "good enough" solution.Following the same heuristic might lead to differentresults.
The “best” is really just the best we’ve found so far."But is there a process a person can follow to find the best (or a pretty good) compression for apiece of text?"
Yes, but it’s imprecise -- you might leave this as a lingering question that leads to the next student task.
Activity 2 (30 mins)
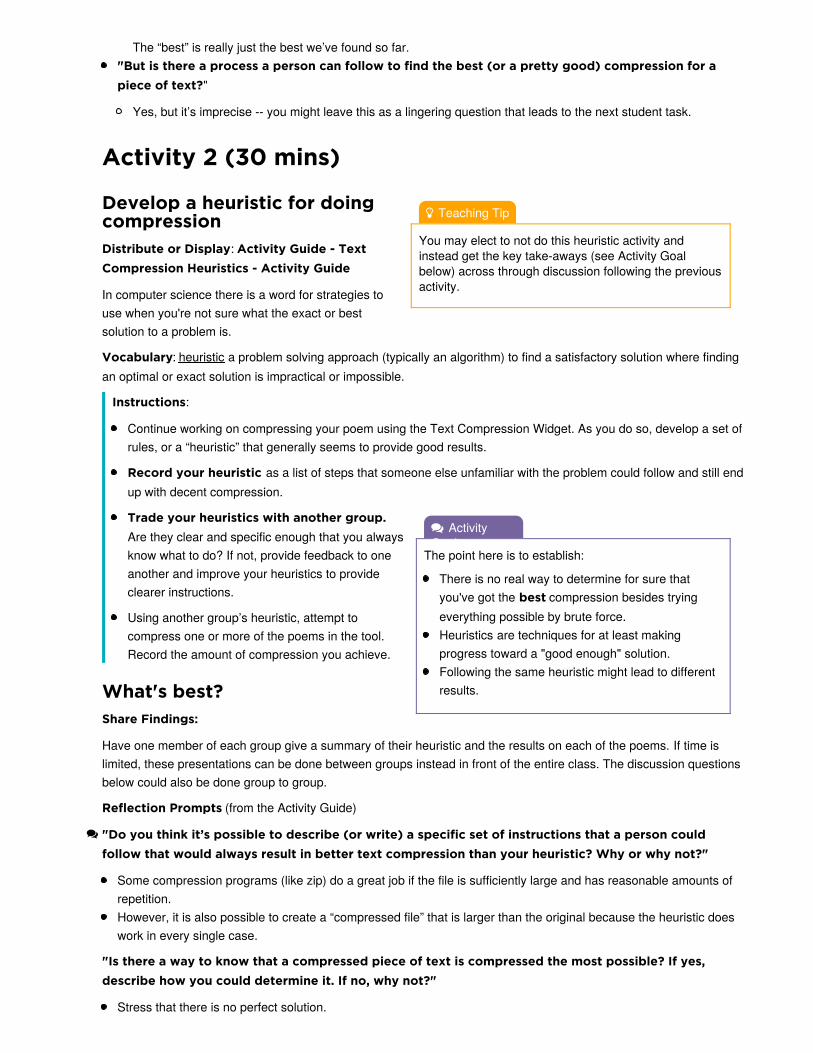
Develop a heuristic for doingcompressionDistribute or Display: Activity Guide - TextCompression Heuristics - Activity Guide
In computer science there is a word for strategies touse when you're not sure what the exact or bestsolution to a problem is.
Vocabulary: heuristic a problem solving approach (typically an algorithm) to find a satisfactory solution where findingan optimal or exact solution is impractical or impossible.
Instructions:
Continue working on compressing your poem using the Text Compression Widget. As you do so, develop a set ofrules, or a “heuristic” that generally seems to provide good results.
Record your heuristic as a list of steps that someone else unfamiliar with the problem could follow and still endup with decent compression.
Trade your heuristics with another group.Are they clear and specific enough that you alwaysknow what to do? If not, provide feedback to oneanother and improve your heuristics to provideclearer instructions.
Using another group’s heuristic, attempt tocompress one or more of the poems in the tool.Record the amount of compression you achieve.
What's best?Share Findings:
Have one member of each group give a summary of their heuristic and the results on each of the poems. If time islimited, these presentations can be done between groups instead in front of the entire class. The discussion questionsbelow could also be done group to group.
Reflection Prompts (from the Activity Guide)
"Do you think it’s possible to describe (or write) a specific set of instructions that a person couldfollow that would always result in better text compression than your heuristic? Why or why not?"
Some compression programs (like zip) do a great job if the file is sufficiently large and has reasonable amounts ofrepetition.However, it is also possible to create a “compressed file” that is larger than the original because the heuristic doeswork in every single case.
"Is there a way to know that a compressed piece of text is compressed the most possible? If yes,describe how you could determine it. If no, why not?"
Stress that there is no perfect solution.
Teaching Tip
You do not have to review or demo LZWcompression in depth here. It is an interesting real-world application of the activity done in class.
While details of LZW compression are not part of theAP course content, but the idea of losslesscompression is.
Recommendation: demonstrate zip quickly.
Have a large text file at the ready, such as theplaintext version of HamletUse the .zip utility on your computer to compress intoa zip file and then compare the file size to theoriginal. (We learned how to do this in the previouslesson).
The size and shape of the data will determine what the “best” answer is and we often cannot even be sure it is thebest answer (only that it is better than other answers we have tried.)
Wrap-up (20 mins)
Recap Questions"What did all groups’ processes for compression have in common?"
Pattern RecognitionAbstraction (patterns referring to other patterns)
"Will following this process always lead to the same compression? (i.e. two people following theprocess for the same poem, will result in the same compression?)"
No. It’s imprecise, but still OK. The text still gets compressed, no matter what.Since there is no way to know what’s best, all we need is a process that comes up with some solution, and a wayto make progress.
Terminology: Verify students know or use an *exit ticket on this vocabulary:
lossless compression v. lossy compressionheuristic
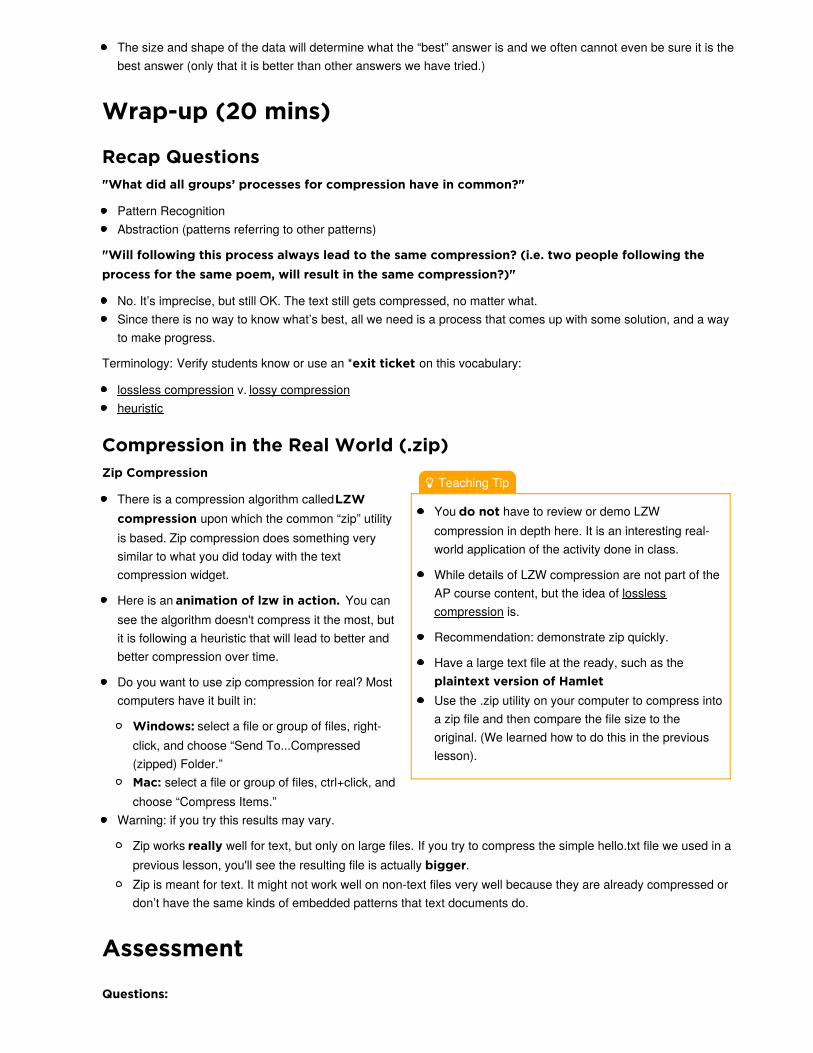
Compression in the Real World (.zip)Zip Compression
There is a compression algorithm called LZWcompression upon which the common “zip” utilityis based. Zip compression does something verysimilar to what you did today with the textcompression widget.
Here is an animation of lzw in action. You cansee the algorithm doesn't compress it the most, butit is following a heuristic that will lead to better andbetter compression over time.
Do you want to use zip compression for real? Mostcomputers have it built in:
Windows: select a file or group of files, right-click, and choose “Send To...Compressed(zipped) Folder.”Mac: select a file or group of files, ctrl+click, andchoose “Compress Items.”
Warning: if you try this results may vary.
Zip works really well for text, but only on large files. If you try to compress the simple hello.txt file we used in aprevious lesson, you'll see the resulting file is actually bigger.Zip is meant for text. It might not work well on non-text files very well because they are already compressed ordon’t have the same kinds of embedded patterns that text documents do.
Assessment
Questions:
If you send the compressed poem, would your friend will be able to read it? Why is the dictionary important?Your friend would only be able to read it if she knew how it was encoded. The dictionary is necessary because ittells her how to decompress the information that she has.
Why do you want to compress anything? What’s the point?It is useful for sending things faster or for smaller storage. It allows for optimization of limited resources.
For a piece of text, what is a “good” amount of compression? Is there a way to know when you’ve compressed itthe most? Explain how you would know, or why you can’t know.
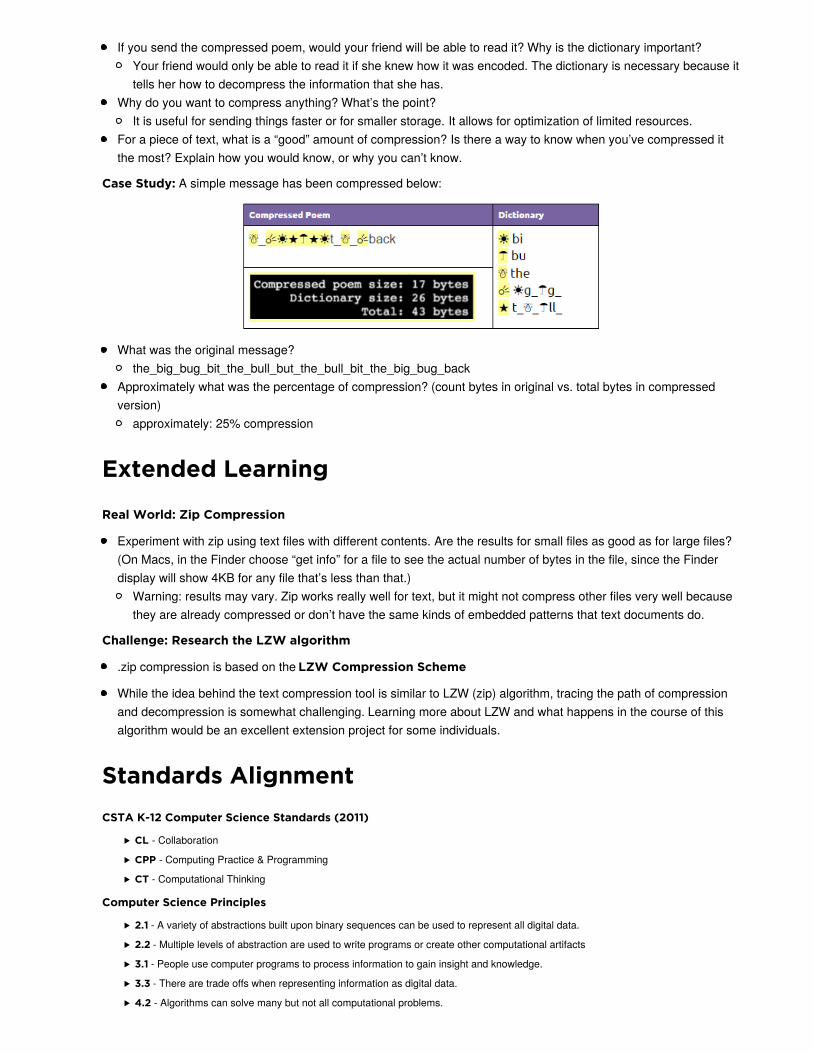
Case Study: A simple message has been compressed below:
What was the original message?the_big_bug_bit_the_bull_but_the_bull_bit_the_big_bug_back
Approximately what was the percentage of compression? (count bytes in original vs. total bytes in compressedversion)
approximately: 25% compression
Extended Learning
Real World: Zip Compression
Experiment with zip using text files with different contents. Are the results for small files as good as for large files?(On Macs, in the Finder choose “get info” for a file to see the actual number of bytes in the file, since the Finderdisplay will show 4KB for any file that’s less than that.)
Warning: results may vary. Zip works really well for text, but it might not compress other files very well becausethey are already compressed or don’t have the same kinds of embedded patterns that text documents do.
Challenge: Research the LZW algorithm
.zip compression is based on the LZW Compression Scheme
While the idea behind the text compression tool is similar to LZW (zip) algorithm, tracing the path of compressionand decompression is somewhat challenging. Learning more about LZW and what happens in the course of thisalgorithm would be an excellent extension project for some individuals.
Standards AlignmentCSTA K-12 Computer Science Standards (2011)
CL - Collaboration
CPP - Computing Practice & Programming
CT - Computational Thinking
Computer Science Principles
2.1 - A variety of abstractions built upon binary sequences can be used to represent all digital data.
2.2 - Multiple levels of abstraction are used to write programs or create other computational artifacts
3.1 - People use computer programs to process information to gain insight and knowledge.
3.3 - There are trade offs when representing information as digital data.
4.2 - Algorithms can solve many but not all computational problems.

If you are interested in licensing Code.org materials for commercial purposes, contact us.
UNIT
2Ch. 1 1 2 3 4 5 6 Ch. 2 7 8 9 10 11
12 13 14 15
Lesson 3: Encoding B&W ImagesWidget - Pixelation | Concept Invention | Individual Creation
OverviewIn this lesson, students will begin to explore the way digital imagesare encoded in binary. The class begins by asking students toinvent their own image encoding protocol in order to familiarizethemselves with some of the subtle complications of encodingimages, namely the need for other data, called metadata, thatdescribes properties of the image necessary for rendering it.Students will learn about pixels, raster images, and what an imagefile format is. Students will encode binary image data using awidget in Code Studio.
PurposeThe main purpose of this lesson is for students to exhibit somecreativity while getting some hands-on experience manipulatingbinary data that represents something other than plain numbers ortext. Connections to abstraction in data can be made here.Connections can be made back to file sizes and file formats hereas well - e.g. how many bytes does it take to store an image v.text? If you want to broach the subject, the concept of datacompression can come in here too - it is interesting to think abouthow a black and white image might be compressed. You shouldbe aware that this lesson largely acts a stepping stone to the nextlesson which addresses how RGB colors are represented inbinary.
Image file types have some similarities to data packets we saw inthe Internet unit -- because images must include metadata, or dataabout the data. The data of a black-and-white image is the list ofbits that represent whether each pixel is on or off. To create theimage, however, we must also know how wide and tall the image isin order to recreate it accurately. This necessitates the creation of afile format which clearly defines how this metadata will beencoded, since it is crucial for interpreting the subsequent data ofthe image. It is similar to how an internet packet doesn't onlycontain the data you need to send, but must also include metadatalike the to and from addresses and packet number.
Digital images can be stored in many formats, but one of the mostcommon formats is "raster". Raster images store the image as anarray of individual pixels, each of which has a particular color.Higher-quality images can be obtained by decreasing the size ofthe pixels (resolution). While full color will be addressed in the nextlesson, an important idea here is that images on computer screens
ObjectivesStudents will be able to:
Explain how images are encoded with pixeldata.Describe a pixel as an element of a digitalimage.Encode a B&W image in binaryrepresenting both the pixel data (intensity)and metadata (width, height).Create the necessary metadata torepresent the width and height of a digitalimage, using a computational tool.Explain why image width and height aremetadata for a digital image.
Preparation(Optional) Graph or grid paper for
drawing pixel images by hand
LinksHeads Up! Please make a copyof any documents you plan toshare with students.
For the Teacher
Activity Guide KEY - Encode a B&WImage - Answer KeyU1L14 - Teaching Tips & Tricks Video -Video (download)
For the Students
B&W Pixelation Widget - Activity Guide
Extension: Magnify an Image(optional) - Activity Guide
B&W Pixelation Tutorial - Video(download)Invent a B&W image encodingscheme - Activity Guide Unit 2 on Code Studio
Make a Copy
Make a Copy
Make a Copy
are created with light by illuminating pixels on the screen. This iswhy it is typical in a black and white image for the value 1 torepresent white - it means turn the light on - and 0 represents black- light off. If you were drawing on paper you might do the inverse.
AgendaGetting Started (10 mins)
Invent An Encoding Scheme for B&W Images
Activity (40 mins)
Video: The Pixelation widgetUse the Pixelation Widget
Wrap-up (10 mins)AssessmentExtended Learning
VocabularyImage - A type of data used for graphics orpictures.metadata - is data that describes otherdata. For example, a digital image myinclude metadata that describe the size ofthe image, number of colors, or resolution.Pixel - short for "picture element", thefundamental unit of a digital image, typicallya tiny square or dot that contains a singlepoint of color of a larger image.

ActivityGoal
The purpose of this little concept invention activity is tobe creative and to get the mind moving. There is noexact right answer that we're going for here.
There are many clever and interesting ways this couldbe done. Most students will likely end up saying thateach pixel should be represented with either a 0 or a 1.
But what we really want to draw out is the idea of"metadata". Simply encoding the pixel data is notenough. We also need to encode the width and heightof the image, or the image could not be recreated -other than through trial and error
Content Corner
There is some mystery about the etymology of the word"pixel". You can read more about it on the Wikipedia:pixel page
Teaching GuideGetting Started (10 mins)
Remarks
Back in the Internet Unit you encoded a line-drawing image as a list of numbers that made up the coordinates of thepoints in the image. That works for line drawings, but how might you encode a different kind of image? Today we’regoing to consider how you might use bits to encode a photographic image, or if you like: how could I encode vision?
Today, we're going to start to learn about images, but we're going to start simple, with black and white images.
Invent An Encoding Scheme for B&W ImagesDistribute Invent a B&W image encodingscheme - Activity GuideSeparate students into pairs, and hand eachstudent a copy of the activity guide.Students should work the first two pagesGive groups time to work
Discuss:
Ask students to share-out their file format to identifycommonalities and patterns. (Use: TeachingStrategies for the CS Classroom - Resource forideas about how to share out.)
As a class, address students’ questions that arisefrom the concept invention activity.Use the questions below to spur conversation. If the concept of metadata, or data about data, arises naturally,then address it here.
Prompts:
How have you encoded white and black portions of your image, what do 0 and 1 stand for in your encoding?Are your encodings flexible enough to accommodate images of any size? * How do they accomplish this?Is your encoding intuitive and easy to use?Is your encoding efficient?
Remarks
Vocabulary: each little dot that makes up apicture like this is called a pixel. Where did thisword pixel come from? It turns out that originallythe dots were referred to as "picture elements",that got shortened to "pict-el" and eventually"pixel".
What we've discovered is that the data for our image file must contain more than just a 0 or 1 for every pixel. Itmust contain other data that describes the pixel data.
This is called metatdata. In this case the metadata encodes the width and height of the image.
We've seen forms of metadata before. For example: an internet packet. The packet contains the data that needsto be sent, but also other data like the to and from address, and packet number.
Activity (40 mins)
Teaching Tip
You may not need or want to use the first page ofthe activity guide. It is a reference for students, butthe tasks for students are given in Code Studio.Similarly for the second page, if you don't intend tocollect it for assessment purposes, you can use thequestions as group discussion or wrap-upquestions.
Introduction
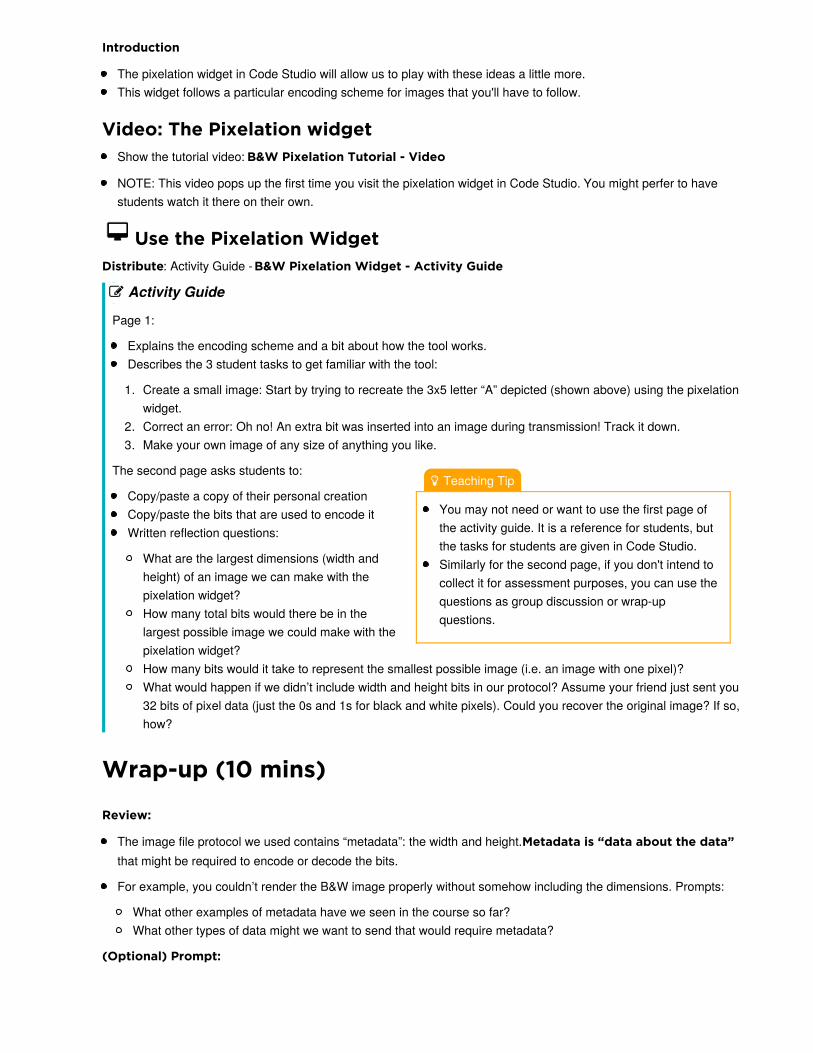
The pixelation widget in Code Studio will allow us to play with these ideas a little more.This widget follows a particular encoding scheme for images that you'll have to follow.
Video: The Pixelation widgetShow the tutorial video: B&W Pixelation Tutorial - Video
NOTE: This video pops up the first time you visit the pixelation widget in Code Studio. You might perfer to havestudents watch it there on their own.
Use the Pixelation WidgetDistribute: Activity Guide - B&W Pixelation Widget - Activity Guide
Activity Guide
Page 1:
Explains the encoding scheme and a bit about how the tool works.Describes the 3 student tasks to get familiar with the tool:
1. Create a small image: Start by trying to recreate the 3x5 letter “A” depicted (shown above) using the pixelationwidget.
2. Correct an error: Oh no! An extra bit was inserted into an image during transmission! Track it down.3. Make your own image of any size of anything you like.
The second page asks students to:
Copy/paste a copy of their personal creationCopy/paste the bits that are used to encode itWritten reflection questions:
What are the largest dimensions (width andheight) of an image we can make with thepixelation widget?How many total bits would there be in thelargest possible image we could make with thepixelation widget?How many bits would it take to represent the smallest possible image (i.e. an image with one pixel)?What would happen if we didn’t include width and height bits in our protocol? Assume your friend just sent you32 bits of pixel data (just the 0s and 1s for black and white pixels). Could you recover the original image? If so,how?
Wrap-up (10 mins)
Review:
The image file protocol we used contains “metadata”: the width and height. Metadata is “data about the data”that might be required to encode or decode the bits.
For example, you couldn’t render the B&W image properly without somehow including the dimensions. Prompts:
What other examples of metadata have we seen in the course so far?What other types of data might we want to send that would require metadata?
(Optional) Prompt:
"Did you think about compression at all while doing this exercise? Can you think of a way that youmight represent an image of pixel data with fewer bits? What would have to change about theencoding strategy?"
For an answer to this see the "Color by Numbers" Activity from CS Unplugged (csunplugged.org).It uses something called "run-length encoding"
Assessment
Check students responses on: B&W Pixelation Widget - Activity Guide
Check to make sure that the bits they submitted actually produce the image as claimed.Score the digital artifact as you see fit, with points for creativity and perceived effort.The following questions can be found in the Activity Guide and also appear on Code StudioAnswers these questions can be found here: Activity Guide KEY - Encode a B&W Image - Answer Key
Using the B&W file format from the pixelation widgetWhat are the largest dimensions (width and height) of an image we can make with the pixelation widget?How many total bits would there be in the largest possible image we could make with the pixelation widget?How many bits would it take to represent the smallest possible image (i.e. an image with one pixel)?
What would happen if we didn’t include width and height bits in our protocol? Assume your friend just sent you32 bits of pixel data (just the 0s and 1s for black and white pixels). Could you recover the original image? If so,how?
Extended Learning
Check out the "Color by Numbers" from CS Unplugged (csunplugged.org) which uses a different cleverencoding scheme for B&W images.
Do the Extension: Magnify an Image (optional) - Activity Guide activity (double the size of an image onthe Pixelation Tool).
Have students research raster graphics in anticipation of the subsequent lesson.Attempting to communicate with possible intelligent life beyond our solar system has been a dream for humans andthe goal of scientists for many years. Questions about messages to send, as well as how to send messages deepinto space to unknown recipients have been debated. In 1974, scientists sent the Arecibo message to the starcluster M13 some 25,000 light years away. Read about the message they sent using 1,679 binary digits(https://en.m.wikipedia.org/wiki/Arecibo_message).
How would you change the content of the message? What would you delete and add? Why would your changebe significant in a communication to other intelligent beings?Sketch the segment of the design you would alter. Remember, you must retain the original number of bits.List the details in this article that you understand more deeply because of what you have learned in this class upto this point.
Standards AlignmentCSTA K-12 Computer Science Standards (2011)
CL - Collaboration
CPP - Computing Practice & Programming
CT - Computational Thinking
Computer Science Principles
1.1 - Creative development can be an essential process for creating computational artifacts.
1.2 - Computing enables people to use creative development processes to create computational artifacts for creative expression or to

solve a problem.
1.3 - Computing can extend traditional forms of human expression and experience.
2.1 - A variety of abstractions built upon binary sequences can be used to represent all digital data.
2.3 - Models and simulations use abstraction to generate new understanding and knowledge.
3.1 - People use computer programs to process information to gain insight and knowledge.
3.2 - Computing facilitates exploration and the discovery of connections in information.
3.3 - There are trade offs when representing information as digital data.
If you are interested in licensing Code.org materials for commercial purposes, contact us.
UNIT
2Ch. 1 1 2 3 4 5 6 Ch. 2 7 8 9 10 11
12 13 14 15
Lesson 4: Encoding Color ImagesWidget - Pixelation | Individual Creation
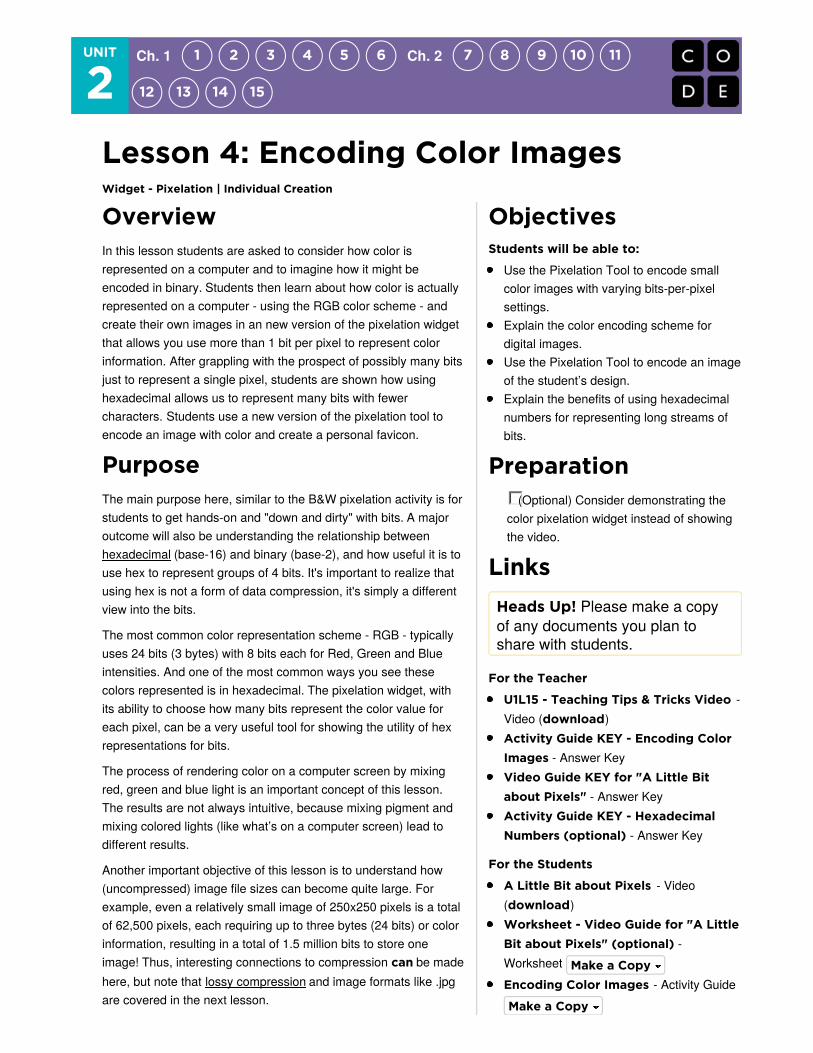
OverviewIn this lesson students are asked to consider how color isrepresented on a computer and to imagine how it might beencoded in binary. Students then learn about how color is actuallyrepresented on a computer - using the RGB color scheme - andcreate their own images in an new version of the pixelation widgetthat allows you use more than 1 bit per pixel to represent colorinformation. After grappling with the prospect of possibly many bitsjust to represent a single pixel, students are shown how usinghexadecimal allows us to represent many bits with fewercharacters. Students use a new version of the pixelation tool toencode an image with color and create a personal favicon.
PurposeThe main purpose here, similar to the B&W pixelation activity is forstudents to get hands-on and "down and dirty" with bits. A majoroutcome will also be understanding the relationship betweenhexadecimal (base-16) and binary (base-2), and how useful it is touse hex to represent groups of 4 bits. It's important to realize thatusing hex is not a form of data compression, it's simply a differentview into the bits.
The most common color representation scheme - RGB - typicallyuses 24 bits (3 bytes) with 8 bits each for Red, Green and Blueintensities. And one of the most common ways you see thesecolors represented is in hexadecimal. The pixelation widget, withits ability to choose how many bits represent the color value foreach pixel, can be a very useful tool for showing the utility of hexrepresentations for bits.
The process of rendering color on a computer screen by mixingred, green and blue light is an important concept of this lesson.The results are not always intuitive, because mixing pigment andmixing colored lights (like what’s on a computer screen) lead todifferent results.
Another important objective of this lesson is to understand how(uncompressed) image file sizes can become quite large. Forexample, even a relatively small image of 250x250 pixels is a totalof 62,500 pixels, each requiring up to three bytes (24 bits) or colorinformation, resulting in a total of 1.5 million bits to store oneimage! Thus, interesting connections to compression can be madehere, but note that lossy compression and image formats like .jpgare covered in the next lesson.
ObjectivesStudents will be able to:
Use the Pixelation Tool to encode smallcolor images with varying bits-per-pixelsettings.Explain the color encoding scheme fordigital images.Use the Pixelation Tool to encode an imageof the student’s design.Explain the benefits of using hexadecimalnumbers for representing long streams ofbits.
Preparation(Optional) Consider demonstrating the
color pixelation widget instead of showingthe video.
LinksHeads Up! Please make a copyof any documents you plan toshare with students.
For the Teacher
U1L15 - Teaching Tips & Tricks Video -Video (download)Activity Guide KEY - Encoding ColorImages - Answer KeyVideo Guide KEY for "A Little Bitabout Pixels" - Answer KeyActivity Guide KEY - HexadecimalNumbers (optional) - Answer Key
For the Students
A Little Bit about Pixels - Video(download)Worksheet - Video Guide for "A LittleBit about Pixels" (optional) -Worksheet Encoding Color Images - Activity Guide
Make a Copy
Make a Copy
AgendaGetting Started (5 mins)
Prompt: How might you encode colors?
Activity (40 mins)
Video: A Little Bit about PixelsColor Pixelation Widget
Activity 2 (30-40 mins)
Personal Favicon Project
Wrap-up
Submit FaviconGallery Walk
AssessmentExtended Learning
Hexadecimal Numbers (optional) -Activity Guide Personal Favicon Project - ActivityGuide Rubric - Personal Favicon Project -Rubric Unit 2 on Code Studio
VocabularyHexadecimal - A base-16 number systemthat uses sixteen distinct symbols 0-9 andA-F to represent numbers from 0 to 15.Pixel - short for "picture element", thefundamental unit of a digital image, typicallya tiny square or dot that contains a singlepoint of color of a larger image.RGB - the RGB color model uses varyingintensities of (R)ed, (G)reen, and (B)luelight are added together in to reproduce abroad array of colors.
Make a Copy
Make a Copy
Make a Copy

DiscussionGoal
It is likely that many students will come up with an idealike making a list of colors and just assigning a numberto each one. That is fine and reasonable.
Some students may already be aware of a numericRGB color scheme. If they can describe that here, thatis fine as well.
Regardless of their encoding, students should bethinking about the number of bits they will allocate to theencoding and how that will affect the number of colorsthat can be encoded.
Teaching GuideGetting Started (5 mins)
Prompt: How might you encode colors?Use a getting started strategy to address thesequestions (for ideas consult: Teaching Strategiesfor the CS Classroom - Resource)
In the previous lesson we came up with a simpleencoding scheme for B&W images. What if wewanted to have color?Devise an encoding scheme for color in an imagefile. How would you represent color for each pixel?How many different colors could you represent? Doyou have a particular order to the colors?
Pair and share ideas
Discuss some of the difficulties of representing colorCompare and contrast the different schemes students come up with.
Activity (40 mins)
Remarks
The way color is represented in a computer is different from the ways we represented text or numbers. With text, wejust made a list of characters and assigned a number to each one. As you are about to see, with color, we actuallyuse binary to encode the physical phenomenon of LIGHT. You saw this a little bit in the previous lesson, but todaywe will see how to make colors by mixing different amounts of colored light.
Video: A Little Bit about PixelsShow the video: A Little Bit about Pixels - VideoKevin Systrom, founder of Instagram, explains pixels and RGB color.(Optional) complete the video worksheet: Video Guide KEY for "A Little Bit about Pixels" - Answer Key
Discuss:
Following the video, you might address any questions (or give students time to complete the video worksheet)
Important ideas from this video include:
Image sharing services are a universal and powerful way of communicating all over the world.Digital images are just data (lots of data) composed of layers of abstraction: pixels, RGB, binary.The RGB color scheme is composed of red, green, and blue components that have a range of intensities from 0 to255.Screen resolution is the number of pixels and how they are arranged vertically and horizontally, and density is thenumber of pixels per a given area.Digital photo filters are not magic! Math is applied to RGB values to create new ones.
Color Pixelation WidgetDistribute the Activity Guide: Encoding Color Images - Activity GuideDirect students to work in Code Studio.
Teaching Tip
If you are comfortable you might considerdemonstrating the pixelation tool for each of the 3steps in the activity guide rather than having studentswatch the tutorial video. Demonstrating might be a moreefficient and interactive/engaging way bring studentsthrough each step.
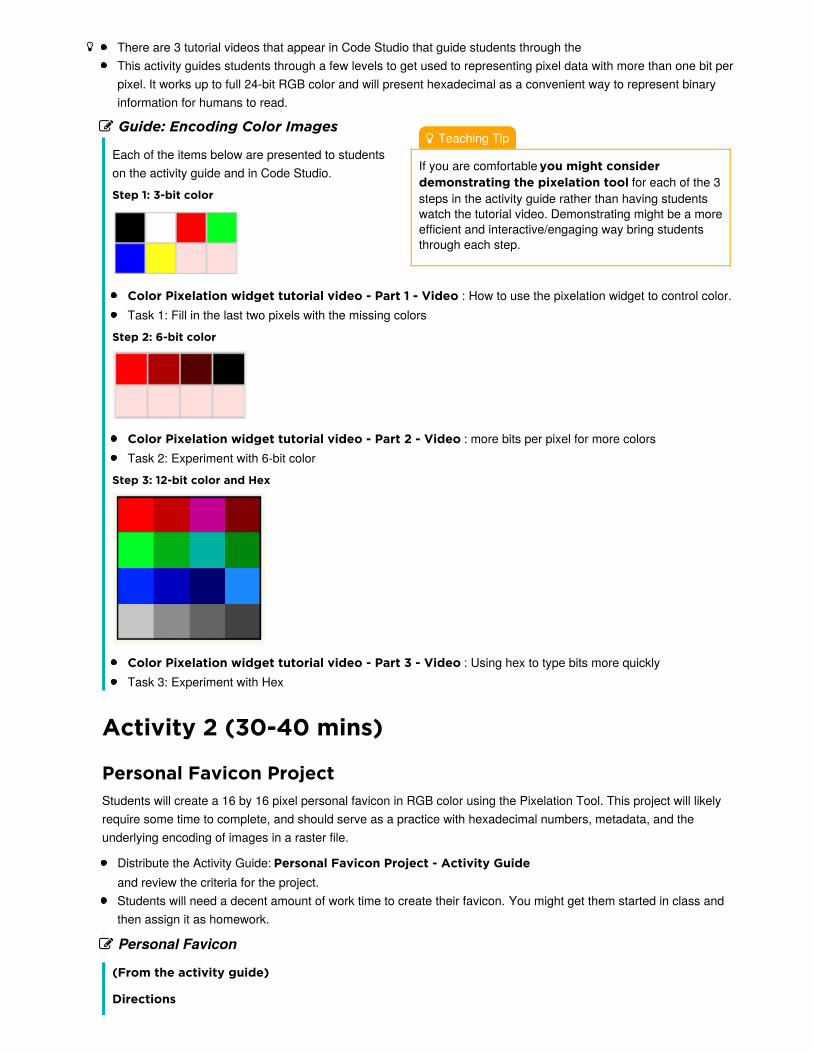
There are 3 tutorial videos that appear in Code Studio that guide students through theThis activity guides students through a few levels to get used to representing pixel data with more than one bit perpixel. It works up to full 24-bit RGB color and will present hexadecimal as a convenient way to represent binaryinformation for humans to read.
Guide: Encoding Color Images
Each of the items below are presented to studentson the activity guide and in Code Studio.Step 1: 3-bit color
Color Pixelation widget tutorial video - Part 1 - Video : How to use the pixelation widget to control color.Task 1: Fill in the last two pixels with the missing colors
Step 2: 6-bit color
Color Pixelation widget tutorial video - Part 2 - Video : more bits per pixel for more colorsTask 2: Experiment with 6-bit color
Step 3: 12-bit color and Hex
Color Pixelation widget tutorial video - Part 3 - Video : Using hex to type bits more quicklyTask 3: Experiment with Hex
Activity 2 (30-40 mins)
Personal Favicon ProjectStudents will create a 16 by 16 pixel personal favicon in RGB color using the Pixelation Tool. This project will likelyrequire some time to complete, and should serve as a practice with hexadecimal numbers, metadata, and theunderlying encoding of images in a raster file.
Distribute the Activity Guide: Personal Favicon Project - Activity Guide and review the criteria for the project.Students will need a decent amount of work time to create their favicon. You might get them started in class andthen assign it as homework.
Personal Favicon
(From the activity guide)
Directions

Content Corner
RGB color model - Additive Light
Computer screens emit light, so when you mix RGBcolors, you are really mixing light together. This iscounterintuitive for many students who have grown upmixing paints in school. When you mix paint it absorbslight.
It is illustrative to look at how you make black and whitewith paint vs. light:
To make black: with paint, mix a full spectrum ofcolors together; with light, turn off all the lights.To make white: with paint, don’t use any paint(assuming canvas is white); with light, turn on alllights for a full spectrum of color.
This can make mixing colors a little bizarre too:
With paint, mix full red and full blue to make PurpleWith light, mix full red and full blue to make Pink
The Pixelation Tool is in RGB mode, as long as thenumber of bits per pixel is a multiple of 3 (3, 6, 9, 12,etc.) This allows for the same number of bits to beallocated to each color channel. Other bits-per-pixelsettings will set the image to grayscale, with more bitsallowing finer control over the shade of gray.
Hexadecimal Numbers:
When working through the Activity Guide for the colorversion of the Pixelation Tool, students will beintroduced to the concept of hexadecimal numbers, so-called because there are 16 unique symbols that canappear in each place value, 0-9, A, B, C, D, E, and F.
MISCONCEPTION ALERT
It is important to note that hexadecimalnumbers are used to aid humans in readinglonger strings of bits, but they in no way changethe underlying data being represented. Instead,they allow us to read 4 bits at a time rather than1, and so allow us to more easily parse binaryinformation. Hexadecimal representation is NOTa form of compression, since the underlyingbinary representation is not changing at all.Rather it is a more convenient way ofrepresenting that binary information whenhumans need to read and interact with it.
You may wish to separately address this topic as aclass. Students can practice with the HexadecimalOdometer and can complete this HexadecimalNumbers (optional) - Activity Guide if you deemmore practice necessary.
Create a personal 16x16 favicon and encode itusing the Pixelation Widget on the final level ofthis lesson in Code Studio.The image you make should represent yourpersonality in some distinctive way. You will beusing this favicon in future lessons and web sitesthat you make, so be creative and thoughtful.After you have finished your favicon, share it withothers in the class by sending them the bits withthe Internet Simulator Widget!
Requirements
The icon must be 16x16 pixels.You must use the Pixelation Widget to encode thebits of color information.The image must be encoded with at least 12 bitsper pixel.
Things to think about
A simple design with a few basic colors isprobably the best solution. How could you usemore colors?Plan ahead: Sketch your design before starting toencode the bits. You might want to use a tool tohelp you draw small images. Suggestions:
Favicon Maker: http://www.favicon.cc/Make Pixel Art:http://makepixelart.com/free/
Wrap-up
Submit FaviconYou should ask students to submit a .png version oftheir favicon, blown up to a larger size. And ask themto send you the bits that made up the image.
Gallery WalkWith the images you can make a class favicon “quilt” by printing them out.And you can copy/paste the bits into the pixelation tool to verify that image is correct.
Assessment
Questions:
How many bits (or bytes) are required to encode an image that is 25 pixels wide and 50 pixels tall, if you encode itwith 24 bits per pixel?
To help students understand how quickly the bit size of images expands as the image is enlarged, start withsmaller numbers (5 X 10) and then incrementally increase the width and height to illustrate the concept.
Imagine that you have an image that is too dark or too bright. Describe how you would alter the RGB settings tobrighten or darken it. Give an example.
Extended Learning
If you had to send your favicon using the sending bits widget, it would probably take a long time. Could youcompress your image? How? Describe in broad strokes the kinds of things you could do.Read Blown to Bits (www.bitsbook.com), Chapter 3 , Ghosts in the Machine, pp. 95-99 (Hiding Informationin Images), then answer the following questions:
Besides hiding information sent to others, what other uses can steganography have for everyday users? Forexample, what uses would steganography have for an American businessman in China?
Standards AlignmentCSTA K-12 Computer Science Standards (2011)
CL - Collaboration
CPP - Computing Practice & Programming
CT - Computational Thinking
Computer Science Principles
1.1 - Creative development can be an essential process for creating computational artifacts.
1.2 - Computing enables people to use creative development processes to create computational artifacts for creative expression or to
solve a problem.
1.3 - Computing can extend traditional forms of human expression and experience.
2.1 - A variety of abstractions built upon binary sequences can be used to represent all digital data.
2.2 - Multiple levels of abstraction are used to write programs or create other computational artifacts
2.3 - Models and simulations use abstraction to generate new understanding and knowledge.
3.1 - People use computer programs to process information to gain insight and knowledge.
3.2 - Computing facilitates exploration and the discovery of connections in information.
3.3 - There are trade offs when representing information as digital data.
If you are interested in licensing Code.org materials for commercial purposes, contact us.

UNIT
2Ch. 1 1 2 3 4 5 6 Ch. 2 7 8 9 10 11
12 13 14 15
Lesson 5: Lossy Compression and FileFormatsResearch
OverviewThis lesson is mostly an investigation of different kinds of fileformats that exist in the real world. The lesson begins withstudents exploring a mock “lossy” text compression scheme as away to learn about “lossy” compression. Then we do a jigsaw“rapid research” activity in which pairs of student research a realimage, text, or sound encoding file format and determine what kindof compression it uses and the theory behind it. This lesson alsosets the stage for the practice Performance Task (Encode aComplex Thing) that follows this lesson.
PurposeThe main purpose of this lesson is straightforward: understandwhat lossy compression is and when/why it might be used. It'smostly used in visual or audio formats where a loss in precision isundetectable to human eyes and ears. Beyond that we, want tocontinue to build students' skills and comfort with rapidly doingresearch online, reporting back, and verifying that the informationthey got was good. This is good life skill but will also servestudents well for the Explore Performance task. The hope with thislesson is that students will have greater insight into these technicalarticles that they know a bit about the binary make up of things --many of the image file format articles actually show the binary fileformat and what bits mean what.
In particular, students might discover, or you might point out thatthe BMP image format is basically the image encoding format usedin a previous lesson, and that the GIF image format and ZIPcompression scheme are versions of the text compression schemewe used as well. In the case of GIF, it uses a dictionary of up to255 different colors and each pixel is stored as small number thatrefers to the dictionary.
AgendaGetting Started (10 mins)
Quick Discovery: Lossy Text CompressionLossless vs. Lossy compression
Activity
Jigsaw research.Share results.
Wrap-up (5 mins)
ObjectivesStudents will be able to:
Explain the difference between lossy andlossless compression.Identify common computer file types andwhether they are compressed or not, andwhether compression is lossy or lossless.Read a technical article on the web and siftits contents for targeted information.
PreparationCopies of File Formats Rapid Research
worksheet for students
LinksHeads Up! Please make a copyof any documents you plan toshare with students.
For the Teacher
KEY - File Formats Rapid Research -Answer Key
For the Students
File Formats Rapid Research -Worksheet Lossy Text Compression App - App LabUnit 2 on Code StudioText Compression - Video (lossy insecond half)
VocabularyLossless Compression - a datacompression algorithm that allows theoriginal data to be perfectly reconstructedfrom the compressed data.Lossy Compression - (or irreversiblecompression) a data compression methodthat uses inexact approximations,
Make a Copy

Assessment
Assessment Posibilities
Extended Learning
discarding some data to represent thecontent. Most commonly seen in imageformats like .jpg.
Teaching GuideGetting Started (10 mins)
Quick Discovery: Lossy Text CompressionWith a partner, go to the Lossy Text Compression App - App Lab .Answer the following questions:
What is happening in the app?Should this “count” as text compression? Why or why not?What do you think “lossy” refers to?
Group discussion (brief)
Verify that students saw the text was being reduced by keeping the first letter of every word and throwing out allthe vowels.Get some opinions about whether it should count as text compression.
Opinions might vary, but it is true that the amount of text was reduced.However, the work of reconstructing was left to human intelligence and intuition.
Lossless vs. Lossy compression Remarks
When we did text compression a few lessons ago, that kind of compression is known as “lossless” compressionbecause in doing the compression, and in reconstructing the original text, nothing was lost; every character thatwas part of the original text could be recovered.“Lossy” compression -- yes, that’s the official word -- does something else. Lossy compression schemes areones in which “useless” or less-than-totally-necessary information is thrown out in order to reduce the size of thedata.
The lossy text compression app did that, and for the most part, you could probably make out what the text wassupposed to say.But it’s not perfect. If you saw the word “fd” it could be “food”, “feed”, “feud”, or “fad”. By reading it in context,you might know what it was supposed to be, but there’s no real way to know what the original word was. Theoriginal word is lost.
Transition:
We’ve been looking at image file formats. And we’ve also seen text compression. Both of those attempted to renderperfectly every piece of information.
Both the image file format and the text compression scheme we used were lossless. Lossy compression schemesusually take advantage of the fact that a human is supposed to interpret the data at the other end, and human brainsare good at filling the gaps when information is missing.
Activity
Today you and a partner will do some rapid research and reporting on some of the most common file formats. Use theweb as your research tool.
Optional:
The Text Compression - Video (lossy in second half) video from a previous lesson also discusses lossy v.lossless.You might show that part of the video here before diving in.

Content Corner
Students might discover, or you might point out, thatthe BMP image format is basically the imageencoding format used in a previous lesson.The GIF image format and ZIP compression schemeare versions of the text compression scheme weused as well. In the case of GIF, it uses a dictionaryof up to 255 different colors and each pixel is storedas small number that refers to the dictionary.The bit layouts of BMP and GIF should beunderstandable for students.
Teaching Tip
You can use any sharing strategy you like. The goal isfor every student to have her file format table filled in forthe first two columns (data type and compression type).Knowing how they work is also good, but some arerather complicated. It might have to be left a mystery.
Content Corner
The file extension you often see on a file (for example:myPhoto.jpg) is really just an indicator to the computerof how the underlying bits are organized, so thecomputer can interpret them. If you change the name ofthe file to myPhoto.gif, that does not magically changethe underlying bits; all you’ve done is confuse thecomputer. It won’t be able to open the file because it willattempt to interpret the file as a GIF when really the bitsare in JPG format.
Jigsaw research.Distribute File Formats Rapid Research -Worksheet.Assign pairs or small groups one of the file formattypes listed in the table. It’s OK if two groupsresearch the same type.Each pair/group should research the file formatassigned to it and fill in one row of the table.
Share results.Ask for a volunteer to read what he found for the filetype he was assigned. Ask if anyone else whoresearched that type has anything to add (or clarify)about what the first person said. Do this for each of thefile types.
Wrap-up (5 mins)
There was a question at the bottom of theworksheet that asked if you had ever heard ofany other file type that you were curious about.What were those?
Do a whip around and write what students say onthe board. Types might include: .doc, .pdf, .docx,.mp4, .mov, .html, etc.All of these are specialized file formats in whichsome person or group decided how to organize (andin some cases, compress) the bits that make up thefile type. There is nothing magical about them.
Assessment
Assessment PosibilitiesMatching: Match the encoding type with the data type and compression. (In Code Studio.)
Extended Learning
GIF and PNG are both lossless image compression formats. Which one is better?Read Blown to Bits (www.bitsbook.com), Chapter 3 , Ghosts in the Machine, pp. 88-90 (Reducing Data,Sometimes Without Losing Information), then answer the following question:
Do you think the need for file compression will always be needed, considering the advances in data storage, thespeed of computers, and speed of the Internet?
Read Blown to Bits (www.bitsbook.com), Chapter 3 , Ghosts in the Machine, pp. 90-94 (Technological Birthand Death), then answer the following questions:
Data formats are constantly changing. What challenges does this present for historians? For a given document,movie, or audio file, what are all the component pieces that need to be preserved along with it?There is concern about Microsoft’s de-facto “.doc” format. Do similar concerns exist for cloud services such asCloud Data formats and Cloud APIs? What are some such APIs and what will the dangers be if those de-factostandards are adopted?
Standards AlignmentCSTA K-12 Computer Science Standards (2011)
CD - Computers & Communication Devices
CL - Collaboration
CT - Computational Thinking
Computer Science Principles
3.3 - There are trade offs when representing information as digital data.
If you are interested in licensing Code.org materials for commercial purposes, contact us.
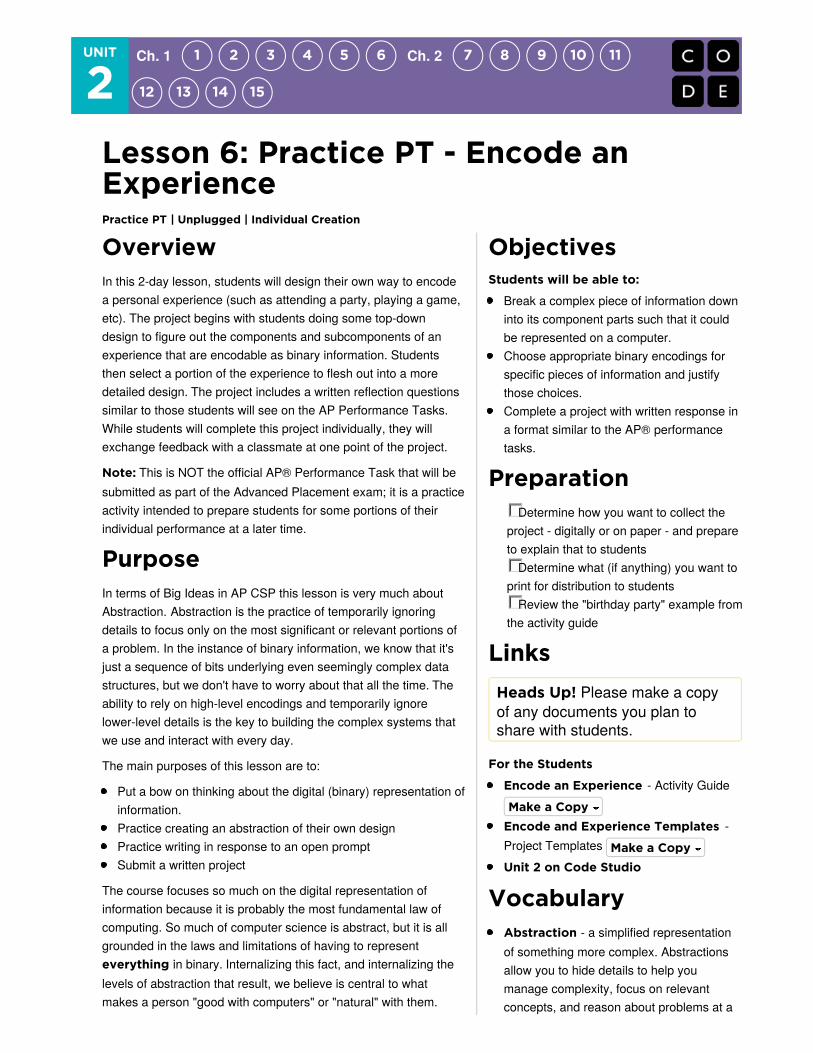
UNIT
2Ch. 1 1 2 3 4 5 6 Ch. 2 7 8 9 10 11
12 13 14 15
Lesson 6: Practice PT - Encode anExperiencePractice PT | Unplugged | Individual Creation
OverviewIn this 2-day lesson, students will design their own way to encodea personal experience (such as attending a party, playing a game,etc). The project begins with students doing some top-downdesign to figure out the components and subcomponents of anexperience that are encodable as binary information. Studentsthen select a portion of the experience to flesh out into a moredetailed design. The project includes a written reflection questionssimilar to those students will see on the AP Performance Tasks.While students will complete this project individually, they willexchange feedback with a classmate at one point of the project.
Note: This is NOT the official AP® Performance Task that will besubmitted as part of the Advanced Placement exam; it is a practiceactivity intended to prepare students for some portions of theirindividual performance at a later time.
PurposeIn terms of Big Ideas in AP CSP this lesson is very much aboutAbstraction. Abstraction is the practice of temporarily ignoringdetails to focus only on the most significant or relevant portions ofa problem. In the instance of binary information, we know that it'sjust a sequence of bits underlying even seemingly complex datastructures, but we don't have to worry about that all the time. Theability to rely on high-level encodings and temporarily ignorelower-level details is the key to building the complex systems thatwe use and interact with every day.
The main purposes of this lesson are to:
Put a bow on thinking about the digital (binary) representation ofinformation.Practice creating an abstraction of their own designPractice writing in response to an open promptSubmit a written project
The course focuses so much on the digital representation ofinformation because it is probably the most fundamental law ofcomputing. So much of computer science is abstract, but it is allgrounded in the laws and limitations of having to representeverything in binary. Internalizing this fact, and internalizing thelevels of abstraction that result, we believe is central to whatmakes a person "good with computers" or "natural" with them.
ObjectivesStudents will be able to:
Break a complex piece of information downinto its component parts such that it couldbe represented on a computer.Choose appropriate binary encodings forspecific pieces of information and justifythose choices.Complete a project with written response ina format similar to the AP® performancetasks.
PreparationDetermine how you want to collect the
project - digitally or on paper - and prepareto explain that to students
Determine what (if anything) you want toprint for distribution to students
Review the "birthday party" example fromthe activity guide
LinksHeads Up! Please make a copyof any documents you plan toshare with students.
For the Students
Encode an Experience - Activity Guide
Encode and Experience Templates -Project Templates Unit 2 on Code Studio
VocabularyAbstraction - a simplified representationof something more complex. Abstractionsallow you to hide details to help youmanage complexity, focus on relevantconcepts, and reason about problems at a
Make a Copy
Make a Copy
Similarly, being able to take a high-level, human idea and break itdown into something that could be computed on is thefundamental essence of what it means to do computing work.
Certainly, it helps a person explain and grapple with abstractcomputing ideas later on this course. For example, whenprogramming you have to manage complexity in code by breakingthings down into smaller procedures and routines. You have tomake many choices about how to represent and store theinformation your program needs. The person who implicitlyunderstands the difference between choosing to use the number 5instead of the character "5" is more likely to make the right choice.
It's useful to practice the mechanics of producing a project like thison a tight timeline, especially one that includes both design andwritten elements. It's up to you how much you want to mimic theAP Performance Task process, but this relatively small-scopedproject would be a very useful barometer for you and yourstudents to see what it takes to take a project from initialunderstanding to actual submission of an artifact.
AgendaGetting StartedActivity (2 days)
Introduce the Project: Encode an ExperienceDistribute Activity Guide and Project TemplatesDay 1Day 2
Wrap-upAssessmentExtended Learning
higher level.

DiscussionGoal
Introduce the term “abstraction” (see paragraph below),and frame the coming project as an opportunity forstudents to develop their own layers of abstraction.
Teaching Tip
You do not have to give all of these examples if youthink students get it, or you have already covered theseideas with some detail. The point is to convey thecentral importance that developing abstractions andunderstanding the effects and trade-offs that result fromhaving to represent all information in binary has onpretty much anything having to do with computers.
Teaching GuideGetting Started
Remarks
Throughout this unit, we have been building layers ofencodings on top of the foundation of bits.
First we learned to develop binary numbers, thenASCII text, then formatted text, and finally colorimages. High-level encodings are actually quiteremoved from the underlying bits from which theyare made.
In the world of computer science, we call thisabstraction - a mental tool that allows us to ignorelow-level details when they are unnecessary. Thisability to ignore small details is what allows us todevelop complex encodings and protocols.
For example, the encoding for an image doesn’tneed to know that the RGB values in each pixel areactually 8-bit numbers, and an encoding forformatted text does not care how the ASCII symbolsthat comprise it are actually represented. As long as there is some way to encode numbers and characters, thesehigh-level encodings will function.
We also do this with the layers of Internet Protocols that we designed. The DNS protocol doesn't need to care orknow how the bits are physically being transmitted to and from it, or even how the request is routed to it. That all hasto happen of course, but DNS only has to focus on the the higher-level task of mapping a domain name to anumber.
Activity (2 days)
Introduce the Project: Encode an ExperienceToday we are starting a project in which you are going to apply this idea of abstraction as you set out to build yourown encoding and layers of abstraction for a complex piece of information.
The Big Question is: How can you take something complex like a human experience, and break it downso that it could be represented in a computer?
For example: how might you digitally encode the experience of attending a birthday party?
Distribute Activity Guide andProject Templates
Distribute the Activity Guide: Encode anExperience - Activity Guide. The activity guidecontains:
A description of the projectAn example of encoding a birthday partySubmission guidelines and Rubric
(Optional) Distribute the Encode and ExperienceTemplates - Project Templates. You can collectstudent work on paper, or digitally free form, or usethese templates. This document contains:
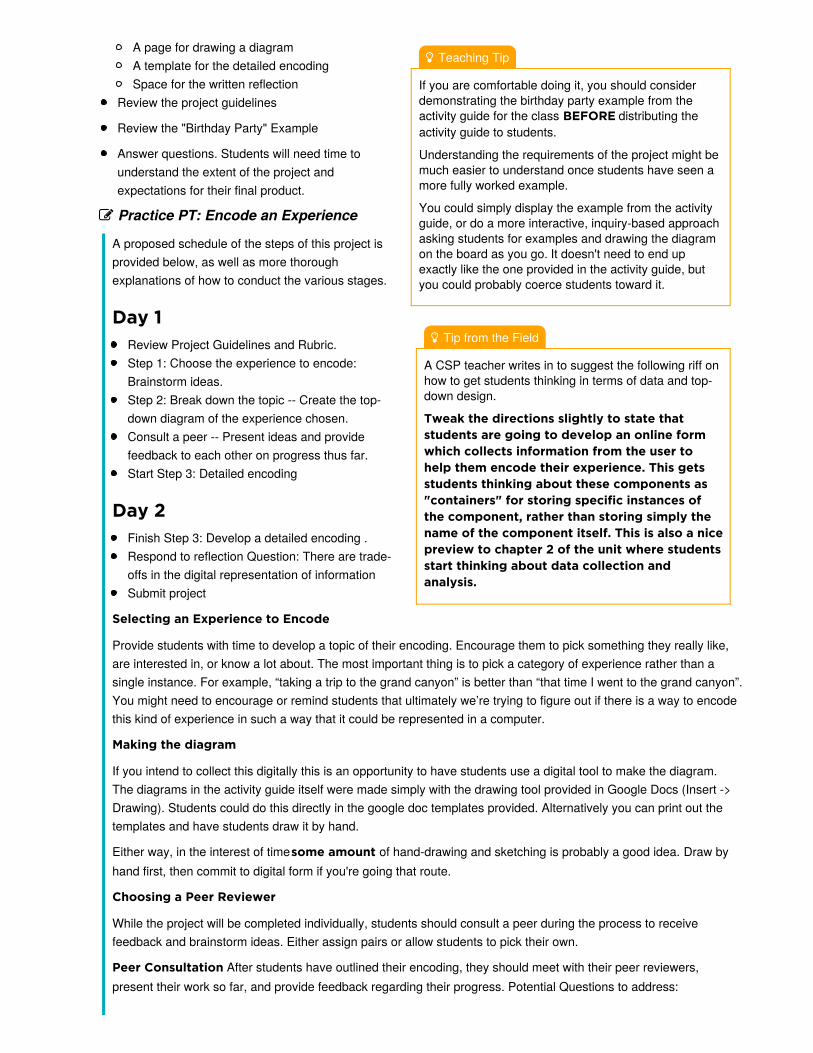
Tip from the Field
A CSP teacher writes in to suggest the following riff onhow to get students thinking in terms of data and top-down design.
Tweak the directions slightly to state thatstudents are going to develop an online formwhich collects information from the user tohelp them encode their experience. This getsstudents thinking about these components as"containers" for storing specific instances ofthe component, rather than storing simply thename of the component itself. This is also a nicepreview to chapter 2 of the unit where studentsstart thinking about data collection andanalysis.
Teaching Tip
If you are comfortable doing it, you should considerdemonstrating the birthday party example from theactivity guide for the class BEFORE distributing theactivity guide to students.
Understanding the requirements of the project might bemuch easier to understand once students have seen amore fully worked example.
You could simply display the example from the activityguide, or do a more interactive, inquiry-based approachasking students for examples and drawing the diagramon the board as you go. It doesn't need to end upexactly like the one provided in the activity guide, butyou could probably coerce students toward it.
A page for drawing a diagramA template for the detailed encodingSpace for the written reflection
Review the project guidelines
Review the "Birthday Party" Example
Answer questions. Students will need time tounderstand the extent of the project andexpectations for their final product.
Practice PT: Encode an Experience
A proposed schedule of the steps of this project isprovided below, as well as more thoroughexplanations of how to conduct the various stages.
Day 1Review Project Guidelines and Rubric.Step 1: Choose the experience to encode:Brainstorm ideas.Step 2: Break down the topic -- Create the top-down diagram of the experience chosen.Consult a peer -- Present ideas and providefeedback to each other on progress thus far.Start Step 3: Detailed encoding
Day 2Finish Step 3: Develop a detailed encoding .Respond to reflection Question: There are trade-offs in the digital representation of informationSubmit project
Selecting an Experience to Encode
Provide students with time to develop a topic of their encoding. Encourage them to pick something they really like,are interested in, or know a lot about. The most important thing is to pick a category of experience rather than asingle instance. For example, “taking a trip to the grand canyon” is better than “that time I went to the grand canyon”.You might need to encourage or remind students that ultimately we’re trying to figure out if there is a way to encodethis kind of experience in such a way that it could be represented in a computer.
Making the diagram
If you intend to collect this digitally this is an opportunity to have students use a digital tool to make the diagram.The diagrams in the activity guide itself were made simply with the drawing tool provided in Google Docs (Insert ->Drawing). Students could do this directly in the google doc templates provided. Alternatively you can print out thetemplates and have students draw it by hand.
Either way, in the interest of time some amount of hand-drawing and sketching is probably a good idea. Draw byhand first, then commit to digital form if you're going that route.
Choosing a Peer Reviewer
While the project will be completed individually, students should consult a peer during the process to receivefeedback and brainstorm ideas. Either assign pairs or allow students to pick their own.
Peer Consultation After students have outlined their encoding, they should meet with their peer reviewers,present their work so far, and provide feedback regarding their progress. Potential Questions to address:
Teaching Tip
If students are having difficulty developing theirencoding, or with any part of the project, encouragethem to talk with their peer reviewer. Develop theexpectation that prior to asking you for help, studentswill have consulted one another.
Teaching Tip
Gallery Walk: If students create visual representationsof their encodings, then you may want to provide timeto present their work to their classmates in a gallerywalk. Students should hopefully appreciate the diversityof interests and encodings created.
Feel free to exclude the wrap-up activity in the interestof time. Neither is an essential portion of thePerformance Tasks and they are included only toprovide a more natural conclusion to the project withinyour class.
Do you think this experience is a good choice?Why or why not?Have I identified the basic elements correctly? DidI miss any?Do you think I will be able to encode this data?What challenges do you think I will have?Do you have any suggestions for the next steps?
Creating the Detailed Encoding Studentsincorporate feedback from their peer reviewer to develop their encoding. This project can be completed entirelydigitally, using the templates provided, but if students will be visually arranging their tables on a poster or on paper,they should be given access to needed supplies.
Written reflection and submission It is likely students will need a decent amount of time to write a response forthe written portion of the project.
Communicate to students how they will be submitting their projects and ensure they have the tools necessary toproduce and submit their projects.
Wrap-up
Self-assess: It can be a useful exercise to havestudents briefly assess themselves using the rubricthey were provided at the beginning of the project. Askthem to identify points where they could improve, andremind them that this rubric is very similar in structureto the one that will be used on the actual APPerformance Tasks they will see later in the year.
Assessment
Rubric: Use the provided rubric in the activityguide, or one of your own creation, to assessstudents’ submissions.
Extended Learning
Ask students to each examine a classmate’s submission and identify potential additions or improvements to theencoding.Locate the most recent Performance Task Descriptions: http://media.collegeboard.com/digitalServices/pdf/ap/ap-computer-science-principles-performance-assessment.pdfLocate the most recent Performance Task Rubrics: http://www.csprinciples.org/home/about-the-project
Standards AlignmentCSTA K-12 Computer Science Standards (2011)
CL - Collaboration
CT - Computational Thinking
Computer Science Principles
2.1 - A variety of abstractions built upon binary sequences can be used to represent all digital data.

2.2 - Multiple levels of abstraction are used to write programs or create other computational artifacts
If you are interested in licensing Code.org materials for commercial purposes, contact us.
UNIT
2Ch. 1 1 2 3 4 5 6 Ch. 2 7 8 9 10 11
12 13 14 15
Lesson 7: Introduction to DataUnplugged | External Tools | Individual and Group Discovery
OverviewIn this kickoff to the Data Unit, students begin thinking about howdata is collected and what can be learned from it. To begin thelesson, students will take a short online quiz that supposedlydetermines something interesting or funny about their personality.Afterwards they will brainstorm other sources of data in the worldaround them, leading to a discussion of how that data is collected.This discussion motivates the introduction of the Class DataTracker project that will run through the second half of this unit.Students will take the survey for the first time and be shown whatthe results will look like. To close the class, students will makepredictions of what they will find when all the data has beencollected in a couple weeks.
PurposeThis lesson introduces many of the lessons and themes that willrun through the unit. Students are introduced to the Class DataTracker and the fact that they will be collecting and analyzing theirown data in a couple weeks. They also begin thinking about themany ways data impacts their lives and how it can be used. Whilethe primary goal of this lesson is to get ideas and processes inplace for the rest of the unit, there are many places wherestudents can start asking interesting questions about where andhow data is collected, who is collecting it, and how they are usingit.
AgendaTeacher Setup (10 mins)
Teacher Setup Guide for Data Tracker Project
Getting Started (20 mins)
Pop “Quiz"
Activity (25 mins)
Introduce Class Data Tracker survey.
Wrap-upAssessmentExtended Learning
ObjectivesStudents will be able to:
Develop a hypothesis about studentbehavior over time, based on a smallsample of data.Describe sources of data appropriate forperforming computations.
PreparationReview the Data Tools Resources for
this lesson (including Excel support)Teacher Setup for Google Forms (see
Teacher Setup in Teaching Guide)
LinksHeads Up! Please make a copyof any documents you plan toshare with students.
For the Teacher
Class Data Tracker Setup Guide -Google Form Setup (includes template)
For the Students
How Much of a Left and Right-BrainedPerson Are You? - LinkUnit 2 on Code Studio
Make a Copy

DiscussionGoal
Get students to start thinking about where they interactwith and produce data in their lives, by looking at theirpast experiences with online quizzes and surveys, tobridge the gap to a long-term class data collectionactivity.
Teaching GuideTeacher Setup (10 mins)
Teacher Setup Guide for Data Tracker ProjectThis lesson requires a one-time special setup in order to create a form for data collection with the students in yourclass. Once you have it setup you will use it for several weeks.
Please use: Class Data Tracker Setup Guide - Google Form Setup (includes template)
Please click the link to see the full Class Data Tracker Setup Guide - Google Form Setup (includestemplate).
In a nutshell the guide has you:
1. Make a copy of a Google Form (short link to template )
2. Share a link to the form with your students
There are also notes on editing the survey questions if you want to -- we chose the questions so that certainproperties would emerge later on. If you want to change the questions just ensure that you'll get the sameproperties or later lessons might not work.
After the setup you should have:
A copy of a Google form in your Google DriveA spreadsheet that will collect responses from the form in your Google DriveA link that students should use to fill out the survey
Students fill out this form every day or as frequently as possible over the next few weeks. We will look at the resultsmore fully in Unit 2 Lesson 12. You can place the form and spreadsheet documents wherever you like in your GoogleDrive. They are yours now.
Getting Started (20 mins)
Opening Remarks
Transitioning to a new chapter. These remarks are meant to help you make a bridge between the Encodeand Experience activity and this chapter about manipulating and visualizing data.
The last project you did (Encoding an Experience) was about organizing and structuring digital data to representcomplex information.You did it by thinking about bits.In reality we typically don't have to break digital data down all the way to bits in order to work with it, butunderstanding that digital data at its root is just bits gives you insights into working with larger data sets.We are about to embark on a new series of lessons where you will work with real data sets and learn how to useto tools to explore and extract information and knowledge from the data.One way we think about it is learning how tell stories with data . We start today!
Pop “Quiz"Before saying anything, point students to this onlinequiz and have them complete it: How Much of a Leftand Right-Brained Person Are You? - Link
DiscussionGoal
Make sure to point out that, for most of theseexamples, people are generating the data throughtheir own actions, though sometimes they might notbe aware of it.In most cases this data is stored somewhere else,and by someone else.The point to make is not necessarily a concern forprivacy (yet) but simply the fact that there is lots ofdata gathered by individuals and organizations,which makes it possible to compute with/on.Some knowledge could be extracted from that data.
ActivityGoal
Introduce the class data tracker project. The class willcollect data about themselves so that students can seetrends and patterns in the class’s behavior over time.
Share Results: Allow students to share and compare their percentages of left and right-brainedness. It should bemildly amusing. The point of this little exercise will be revealed after the discussion.
Remarks
This unit will address the topic of data more deeply. In computing, we’re interested in where data comes from, whatstructure or formats it comes in, and most importantly, what kind of knowledge or information we can extract fromthat data using computational tools.
Prompt:
"People say there is data all around us. What do you think that means? Brainstorm as many examplesof data as you can think of."
For each one, try to answer:
Who is generating the data?Where is the data being stored or saved? Who owns it?
Discussion
Give students 2 minutes to jot down ideas beforesharing with a neighbor.
Do a whip-around to get ideas out in the air,perhaps writing them on the board.Student responses will vary widely and may berelated to:
cell phone data plansscience experimentsGPS trackingonline shopping datataxes or accounting infosports data
Transitional Remarks
Good, you identified all kinds of places that data comes from. In this unit we’ll be looking at lots of those sameexamples and learning a bit about how to use, manipulate and visualize data with computational tools.
In Computer Science, sometimes we can have the computer itself generate data for us. Later in the course when weget to programming, we'll write programs that generate a lot of data.
But there are other kinds of data that can’t be generated by the computer. In particular, data about people and howthey act in the real world is hard to capture without just asking them. So that’s what a lot of tools online do. They tryto capture people’s responses to things because the data, in aggregate, might contain useful information that couldbe extracted.
That “dumb” online quiz you took at the beginning of class is an example. These quizzes ask people to reveal thingsabout themselves, their preferences, likes and dislikes. This is data! While these online quizzes are probablyinnocuous, some interesting things about people could probably be discovered if the data were analyzed.
As a class, we’re going to do something similar...
Activity (25 mins)
Setup Reminder: Make sure you have prepared theGoogle form, and have the share link ready ahead oftime. See notes above.
Remarks
As our first adventure into data, each of you is going to complete a short survey. Surveys are one of the best ways

Teaching Tip
If necessary, introduce (or review) the term hypothesiswith your students. The CSP Framework has a learningobjective that reads: 3.1.1 Find patterns, and testhypotheses about digitally processed information togain insight and knowledge. [P4] We will come back tothese hypotheses when we look at the data in earnest afew lessons down the line.
Many will have probably seen the word in a scienceclass. The Merriam-Webster Dictionary says ahypothesis is “an idea or theory that is not proven butthat leads to further study or discussion.”
As our first adventure into data, each of you is going to complete a short survey. Surveys are one of the best waysto collect data from people, and they are functionally no different from an online poll, funny quiz, or anything elsethat asks you for your opinion. We’re going to use our own survey, so that we can collect and see all the data.
Introduce Class Data Tracker survey.Distribute: Share the survey link with your students and have them complete it once.
Display the Initial Responses: Once everyone hasfilled out the survey, show them a glimpse of the results.You can find the results from your survey by clicking theResponses tab next to the Questions tab at the top ofthe form you made.
Display the responses on the board. Scroll through them, giving students a chance to see the data. Try not to gethung up on issues of formatting, like a student who responded “seven hours” instead of “7” or “7 hours.”
You may want to show the raw spreadsheet view instead of, or in addition to, the default “dump” of responses shownin the form.
Briefly Discuss: Have students look at the results from the survey and discuss what they notice.
What do you notice?What was surprising?What do the results tell you about you and your answers?What other information would you like?What kind of questions would we need to ask to find out more information?
Explain:
You are going to complete this survey every day inclass for the next several weeks. By the end, weshould have several hundred entries. You’ve seen thequestions and have taken a quick glimpse at theresults. What do you think we might be able to find outin a few weeks?
Prompt:
"Write down one or two hypotheses(predictions) about what we might be able tofind out about our class, assuming thateveryone fills out this survey every day for afew weeks."
Transition to wrap up.
Wrap-up
Share:
Do a quick share-out of students’ hypotheses about what the class data will show in a few weeks."What kinds of predictions did you make?"
Student responses will focus on different aspects of the data.Anything related to time spent doing things outside of school and how it makes you feel is fair game.
Remarks
Those are all interesting ideas.Many of them will require us to perform some computations on the results to find the answers, or spot other
DiscussionGoal
Foreshadow the class data tracker project and the restof the Unit.
In student's hypotheses: try to focus on hypotheses thathinge on a relationship between two elements of thedata For example:
people who get more sleep tend to feel betterpredictions about trends or other patterns (e.g., Ithink most people will go to the movies to relax, butonly on weekends).
trends or patterns.Over the coming weeks, we’ll collect this data,and over that time, you’ll learn some things abouthow to process and visualize data like this, so youcan see for yourself what kinds of knowledge thedata holds.
Welcome to data.
Assessment
TBD
Extended Learning
TBD
Standards AlignmentComputer Science Principles
3.1 - People use computer programs to process information to gain insight and knowledge.
3.2 - Computing facilitates exploration and the discovery of connections in information.
7.3 - Computing has a global affect -- both beneficial and harmful -- on people and society.
If you are interested in licensing Code.org materials for commercial purposes, contact us.

UNIT
2Ch. 1 1 2 3 4 5 6 Ch. 2 7 8 9 10 11
12 13 14 15
Lesson 8: Finding Trends withVisualizationsExternal Tools | Research | Presentation
OverviewStudents use the Google Trends tool in order to visualize historicalsearch data. They will need to identify interesting trends orpatterns in their findings and will attempt to explain those trends,based on their own experience or through further research online.Afterwards, students will present their findings to ensure they arecorrectly identifying patterns in a visualization and are providingplausible explanations of those patterns.
PurposeThe two main purposes of this lesson are:
1. Navigating and using a real data tool (Google Trends, seebelow) that is external to the course
2. Getting acquainted with talking and writing about data. Inparticular we want to:
Draw a distinction between describing what the data showsand describing why it might be that wayIn other words: describe connections and trends in dataseparate from drawing conclusions.We want students to get in the habit of separating the whatfrom the why when it comes to talking and writing about data
As a bit of foreshadowing, the next lesson looks deeper intoassumptions that people make about data that can lead tounintentional consequences and even exacerbate some ofsociety's divisions.
AgendaGetting Started (5 mins)
Survey ReminderIntroduce: Data Stories
Activity (30 mins)
Exploring Google Trends
Wrap-up (5-20 mins)
Share Data Stories
Assessment
Assessment Posibilities
ObjectivesStudents will be able to:
Use Google Trends to identify and exploreconnections and patterns within a datavisualization.Accurately describe what a datavisualization of a trend is showing.Provide plausible explanations of trendsand patterns observed within a datavisualization.
PreparationUse the Google Trends tool to
familiarize yourself.
LinksHeads Up! Please make a copyof any documents you plan toshare with students.
For the Students
Exploring Trends - Activity Guide
Google Trends - LinkUnit 2 on Code Studio
Make a Copy
DiscussionGoal
Quickly connect today’s activity to previous day(collecting data about ourselves) but then move intoactually using Google Trends.
Content Corner
Search trends are used in a variety of fields in order tounderstand what topics are most popular across thecountry and world.
Search trends are also powerful predictors.Medical professionals may use this information totrace an outbreak of the flu.Businesses, media outlets, and advertisers keep aclose eye on trending topics in order to understandhow potential customers are thinking.
The fact that a global "conversation" is now happeningonline and computational tools exist to capture andvisualize that conversation enables entirely new ways ofidentifying, understanding, and predicting patterns inculture and society at large.
Teaching GuideGetting Started (5 mins)
Survey ReminderSurvey Reminder: Give students a few minutes to fill out the class tracker survey that you started in Lesson 7 -Introduction to Data.
Introduce: Data Stories Remarks
Yesterday we started to collect data about ourselvesso that we could learn about trends and patterns inour behavior. Today we’re going to look at anothertool that has collected a lot more data about you, me, and everyone else in this room. We’re going to start thinkingabout how to tell stories with data , what data we need, and how best to use and present it.
Activity (30 mins)
Exploring Google TrendsDistribute: Activity Guide - Exploring Trends -Activity Guide
As a class or individually students should read thesummary at the top of the activity guide, whichexplains what information they will be looking at andhow to use the Google Trends tool.
Students will use Google Trends a tool whichvisualizes data taken from Google search historiesall around the world from the past several years.
Students will work individually or in pairs toidentify topics they wish to examine in greaterdetail.They should spend some time just exploring thetool, but eventually they will need to choose asingle topic or set of topics that they will use toanswer the questions that appear on the bottom of the activity guide.
Tell a Story
Students should find a trend or set of trends they think is particularly interesting or personally relevant and try to tella story from the data they see. Students will write down:
A description of what they were trying to look forAn accurate description of what the visualization is showingA plausible explanation of why that trend might have happened.
Wrap-up (5-20 mins)
Share Data Stories
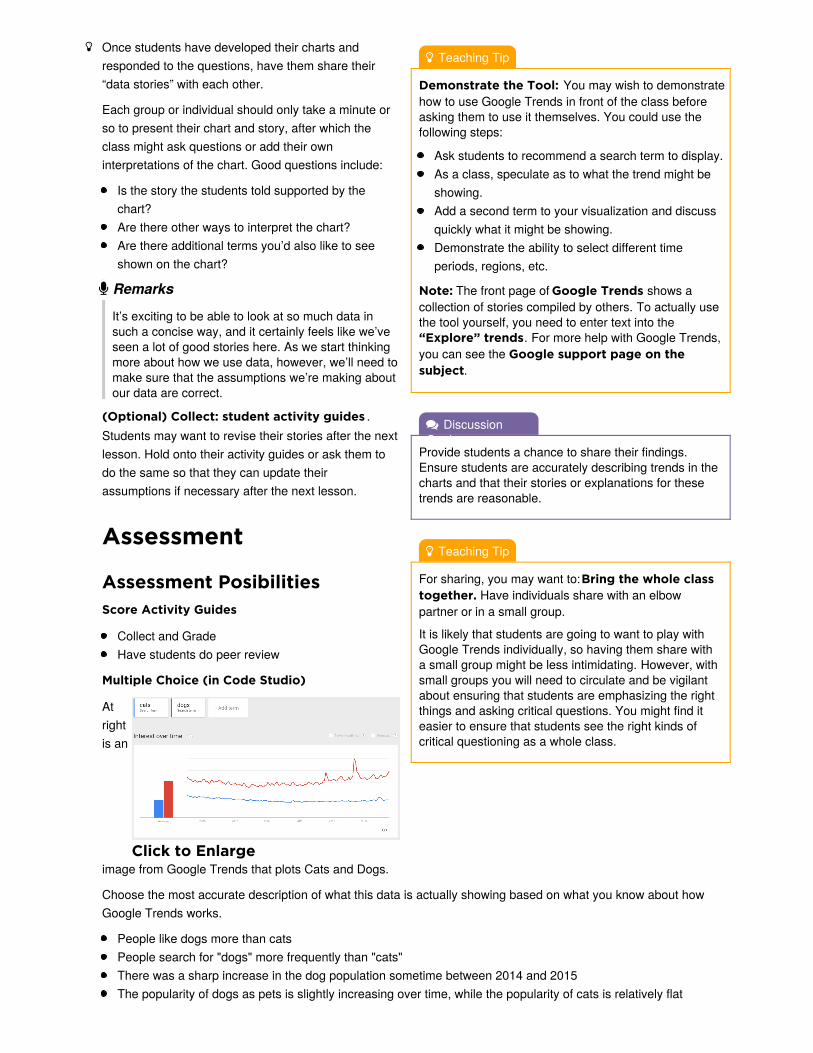
Click to Enlarge
Teaching Tip
Demonstrate the Tool: You may wish to demonstratehow to use Google Trends in front of the class beforeasking them to use it themselves. You could use thefollowing steps:
Ask students to recommend a search term to display.As a class, speculate as to what the trend might beshowing.Add a second term to your visualization and discussquickly what it might be showing.Demonstrate the ability to select different timeperiods, regions, etc.
Note: The front page of Google Trends shows acollection of stories compiled by others. To actually usethe tool yourself, you need to enter text into the“Explore” trends. For more help with Google Trends,you can see the Google support page on thesubject.
DiscussionGoal
Provide students a chance to share their findings.Ensure students are accurately describing trends in thecharts and that their stories or explanations for thesetrends are reasonable.
Teaching Tip
For sharing, you may want to: Bring the whole classtogether. Have individuals share with an elbowpartner or in a small group.
It is likely that students are going to want to play withGoogle Trends individually, so having them share witha small group might be less intimidating. However, withsmall groups you will need to circulate and be vigilantabout ensuring that students are emphasizing the rightthings and asking critical questions. You might find iteasier to ensure that students see the right kinds ofcritical questioning as a whole class.
Once students have developed their charts andresponded to the questions, have them share their“data stories” with each other.
Each group or individual should only take a minute orso to present their chart and story, after which theclass might ask questions or add their owninterpretations of the chart. Good questions include:
Is the story the students told supported by thechart?Are there other ways to interpret the chart?Are there additional terms you’d also like to seeshown on the chart?
Remarks
It’s exciting to be able to look at so much data insuch a concise way, and it certainly feels like we’veseen a lot of good stories here. As we start thinkingmore about how we use data, however, we’ll need tomake sure that the assumptions we’re making aboutour data are correct.
(Optional) Collect: student activity guides .Students may want to revise their stories after the nextlesson. Hold onto their activity guides or ask them todo the same so that they can update theirassumptions if necessary after the next lesson.
Assessment
Assessment PosibilitiesScore Activity Guides
Collect and GradeHave students do peer review
Multiple Choice (in Code Studio)
Atrightis an
image from Google Trends that plots Cats and Dogs.
Choose the most accurate description of what this data is actually showing based on what you know about howGoogle Trends works.
People like dogs more than catsPeople search for "dogs" more frequently than "cats"There was a sharp increase in the dog population sometime between 2014 and 2015The popularity of dogs as pets is slightly increasing over time, while the popularity of cats is relatively flat

Free Response:
What would you investigate further?
For the graph above, give a plausible explantion or hypothesis for the spike in dog searches that occured between2014 and 2015 that would lead to further investigation or research.
Standards AlignmentComputer Science Principles
3.1 - People use computer programs to process information to gain insight and knowledge.
3.2 - Computing facilitates exploration and the discovery of connections in information.
If you are interested in licensing Code.org materials for commercial purposes, contact us.
UNIT
2Ch. 1 1 2 3 4 5 6 Ch. 2 7 8 9 10 11
12 13 14 15
Lesson 9: Check Your AssumptionsResearch | Class Discussion
OverviewThis lesson asks students to consider carefully the assumptionsthey make when interpreting data and data visualizations. Theclass begins by examining how the Google Flu Trends project triedand failed to use search trends to predict flu outbreaks. They willthen read a report on the Digital Divide which highlights howaccess to technology differs widely by personal characteristics likerace and income. This report challenges a widespread assumptionthat data collected online is representative of the population atlarge. To practice identifying assumptions in data analysis,students are provided a series of scenarios in which data-drivendecisions are made based on flawed assumptions. They will needto identify the assumptions being made (most notably thoserelated to the digital divide) and explain why these assumptionslead to incorrect conclusions.
PurposeIn this lesson we look deeper into why we separate the what fromthe why when looking at data. The main purpose here is to raiseawareness of the assumptions that we (all people) make whenlooking at data and try to call them out. Some of theseassumptions lie hidden beneath the surface and we want to shedsome light on them by looking at some examples from the news.This is a useful mode of reflection that will serve students wellwhen doing reflective writing on the performance tasks.
Analyzing and interpreting data will typically require someassumptions to be made about the accuracy of the data and thecause of the relationships observed within it. When decisions aremade based on a collection of data, they will often rest just asmuch on that set of assumptions about the data as the data itself.Identifying and validating (or disproving) assumptions is thereforean important part of data analysis. Furthermore, clearcommunication about how data was interpreted should alsoinclude an account of the assumptions made along the way.
AgendaGetting Started (15 mins)
Survey ReminderVideo: Google Flu TrendsGoogle Flu Trends Failure
Activity (25 mins)
ObjectivesStudents will be able to:
Define the digital divide as the variation inaccess or use of technology by variousdemographic characteristics.Identify assumptions made when drawingconclusions from data and datavisualizations
LinksHeads Up! Please make a copyof any documents you plan toshare with students.
For the Teacher
KEY - Digital Divide and CheckingAssumptions - Answer Key
For the Students
Digital Divide and CheckingAssumptions - Activity Guide
Google Trends Video - VideoUnit 2 on Code Studio
Make a Copy

The Digital Divide and Checking Your AssumptionsPart 1: The digital DividePart 2: Checking Your Assumptions
Wrap-up (15 mins)Assessment
Assessment Posibilities
Extended Learning
DiscussionGoal
Introduce the idea that incorrect assumptions about adataset can lead to faulty conclusions.Earlier prediction of flu outbreaks could limit thenumber of people who get sick or die from the flueach year.More accurate and earlier detection of flu outbreakscan ensure resources for combating outbreaks areallocated and deployed earlier (e.g., clinics could bedeployed to affected neighborhoods).
Teaching Tip
Reading Strategy: Most of these articles aresomewhat more sophisticated in their analysis of theproblems with Google Trends than is necessary fordiscussion. You may wish to read one of these articlestogether as a class and just touch on the key pointsoutlined below.
Teaching GuideGetting Started (15 mins)
Survey ReminderSurvey Reminder: Give students a few minutes to fill out the class tracker survey that you started in Lesson 7 -Introduction to Data.
Video: Google Flu TrendsShow this Google Trends Video - Video video,which describes how Google used the trending datastudents saw earlier in the unit to predict outbreaks ofthe flu.
Thinking Prompt: What are the potential beneficialeffects of using a tool like Google Flu Trends?
Discuss: Students should share their responses insmall groups or as a class. In general, responsesshould be centered around the following ideas.
Google Flu Trends FailureDistribute:
Share one or more of these articles with the class. They detail why Google Flu Trends eventually failed and shouldserve as a basis of discussion for some of the potential negative effects of large-scale data analysis.
Wired - What Can We Learn from the Epic Failure of Google Flu Trends?NYTimes - Google Flu Trends: The Limits of Big DataNature - When Google got flu wrongTime - Google’s Flu Project Shows the Failings of Big DataHarvard Business Review - Google Flu Trends’ Failure Shows Good Data > Big Data
Thinking Prompt:
"Why did Google Flu Trends eventually fail?What assumptions did they make about theirdata or their model that ultimately proved notto be true?"
Discuss:
Once students have read one of the articles, reviewthe key points from your article. The most importantpoints about Google Flu trends can be found below:
Google Flu Trends worked well in some instances but often over-estimated, under-estimated, or entirely missed fluoutbreaks. A notable example occurred when Google Flu Trends largely missed the outbreak of the H1N1 flu virus.
Just because someone is reading about the flu doesn’t mean they actually have it.
Some search terms like “high school basketball” might be good predictors of the flu one year but clearly shouldn’tbe used to measure whether someone has the flu.
In general, many terms may have been good predictors of the flu for a while only because, like high schoolbasketball, they are more searched in the winter when more people get the flu.
DiscussionGoal
Students should practice identifying when data is beinginterpreted and what assumptions are made to do so,by sharing their work from the activity guide.
Google began recommending searches to users, which skewed what terms people searched for. As a result, thetool was measuring Google-generated suggested searches as well, which skewed results.
Transitional Remarks
The amount of data now available makes it very tempting to draw conclusions from it. There are certainly manybeneficial results of analyzing this data, but we need to be very careful. To interpret data usually means making keyassumptions. If those assumptions are wrong, our entire analysis may be wrong as well. Even when you’re notconducting the analysis yourself, it’s important to start thinking about what assumptions other people are makingwhen they analyze data, too.
Activity (25 mins)
The Digital Divide and Checking Your AssumptionsDistribute: Activity Guide - Digital Divide and Checking Assumptions - Activity Guide
Part 1: The digital DivideThis activity guide begins with a link to a report from Pew Research which examines the “digital divide.” Studentsshould look through the visualizations in this report and record responses to the questions found in the activityguide.
Discuss:
In small groups or as a class, students should discuss the answers they have recorded in their activity guides. Keypoints for the following discussion include:
Access and use of the Internet differs by income, race, education, age, disability, and geography.As a result, some groups are over- or under-represented when looking at activity online.When we see behavior on the Internet, like search trends, we may be tempted to assume that access to theInternet is universal and so we are taking a representative sample of everyone.In reality, a “digital divide” leads to some groups being over- or under-represented. Some people may not be onthe Internet at all.
Part 2: Checking Your AssumptionsStudents should complete the second half of the activity guide. They are presented a set of scenarios in which datawas used to make a decision. Students will be asked to examine and critique the assumptions used to make thesedecisions. Then they will suggest additional data they would like to collect or other ways their decision could bemade more reliably.
Wrap-up (15 mins)
Discuss: In small groups or as a class, studentsshould share their responses on the activity guide.Use this opportunity to reinforce a groupunderstanding of what kinds of assumptions are beingmade to interpret the data. Some possible types ofassumptions are listed below.
The data collected is representative of the population at large (e.g., ignoring the “digital divide”).Activity online will lead to activity in the real world (e.g., people expressing interest in a candidate online meansthey will vote for him or her in real life).Data is being collected in the manner intended (e.g., ratings are generated by actual customers, instead ofbusiness owners or robots).Many other assumptions regarding data are possible.
Teaching Tip
Leading the Discussion:
The answer key to the activity guide contains possibleassumptions that could be made in each data scenariopresented. In most instances, there will be many otherpossible assumptions. The focus here should beprimarily on building a habit of checking assumptionsbefore jumping to conclusions about trends in data.
Closing Remarks
Would anyone like to revise the explanationthey gave for their google trends research inthe previous lesson?
Has what you’ve learned today changed yourperspective on the “story” you thought thedata was telling?
In this course, we will be looking at a lot of data, so itis important early on to get in the habit of recognizingwhat assumptions we are making when we interpretthat data.
In general, it is a good idea to call out explicitly your assumptions and think critically about whatassumptions other people are making when they interpret data.
We may not become expert data analysts in this class, and even organizations like Google can make mistakeswhen interpreting data. Sometimes, the best we can do is just be honest with ourselves and other people aboutwhat assumptions we’re making, correct our wrong assumptions where we can, and keep an eye out for theassumptions other people are making when they try to tell us “what the data is saying.”
Assessment
Assessment PosibilitiesScore or peer review the activity guide
There is an answer key to the questions listed in the activity guide.Multiple Choice (also in Code Studio)
Which of the following is the most accurate description of what is known as the "digital divide".
The digital divide is about how...
...people's access to computing and digital technology increases over time through a process of dividing andgrowing quickly - it is often likened to the biological processes of cell growth...people's access to computing and the Internet differs based on socioeconomic or geographic characteristics....people's access to computing technology is affected by the fact that newer devices that use new protocols makesit more difficult for them to communicate with older devices and technology...the amount of data on the Internet is growing so fast that the amount computing power and time we have toprocess it is lagging behind
Performance Task-style reflection question (also in Code Studio)
Consider the following statement from the CS Principles course framework: 7.4.1C The globaldistribution of computing resources raises issues of equity, access, and power. Briefly describe
one of these issues that you learned about in the lesson and how it affects your life or the lives ofpeople you know. Keep your response to about 100 words (about 3-5 sentences).
Extended Learning
Share this article with students criticizing inaccurate or misleading ways of using Google Trends to write news stories.https://medium.com/@dannypage/stop-using-google-trends-a5014dd32588#.dd7bifrl5
Standards AlignmentComputer Science Principles

3.1 - People use computer programs to process information to gain insight and knowledge.
3.2 - Computing facilitates exploration and the discovery of connections in information.
7.4 - Computing innovations influence and are influenced by the economic, social, and cultural contexts in which they are designed
and used.
If you are interested in licensing Code.org materials for commercial purposes, contact us.
UNIT
2Ch. 1 1 2 3 4 5 6 Ch. 2 7 8 9 10 11
12 13 14 15
Lesson 10: Good and Bad DataVisualizationsAnalyzing Artifacts | Group Discovery | Class Discussion
OverviewThis is a pretty fun lesson that has two main parts. First studentswarm up by reflecting on the reasons data visualizations are usedto communicate about data. This leads to the main activity in whichstudents look at some collections of (mostly bad) datavisualizations, rate them, explain why a good one is effective, andalso suggest a fix for a bad one.
In the second part of class students compare their experiencesand create a class list of common faults and best practices forcreating data visualizations. Finally, students review and read thefirst few pages of Data Visualization 101: How to designcharts and graphs to see some basic principles of good datavisualizations and see how they compare with the list the classcame up with.
PurposeAn important skill is the ability to critically evaluate information. Asour world is increasingly filled with data, more and more theinformation from that data is conveyed through visualizations.Visualization is useful for both discovery of connections andtrends and also communication - both are potentially aspects ofthe Explore Performance Task. In this lesson we will focus on thecommunication aspects of visualization.
Interpreting data visualizations is not typically thought of as a corecomputer science skill, but it is certainly an important one in anage of digital data. Computing has enabled massive amounts ofinformation to be automatically collected, aggregated, analyzed,and visualized. Visualizations are useful in helping humansunderstand large amounts of data quickly, and they are usefulcommunication tools when presenting findings about a collection ofdata. Not all visualizations are created equal, however, and inmany cases the type of visualization used may distract or evenmislead the reader.
As both creators and consumers of data visualizations, studentsneed to be on the lookout for these common pitfalls. This will allowthem to be savvier readers of data visualizations, and moreeffective communicators when creating visualizations of their own.
Agenda
ObjectivesStudents will be able to:
Identify an effective data visualization andgive justification.Collaborate to investigate and evaluate adata visualization.Suggest an appropriate visualization forsome data.Evaluate a data visualization foreffectiveness of communication.Identify a poor data visualization and givejustification.
PreparationPrint a copy of Data Visualization
Scorecard - Worksheet for eachstudent.
LinksHeads Up! Please make a copyof any documents you plan toshare with students.
For the Students
Data Visualization 101: How to designcharts and graphs - LinkData Visualization Scorecard -Worksheet Data Visualization Collection A & B (inCode Studio)Unit 2 on Code Studio
Make a Copy
Getting Started (10 mins)
Fill out class tracker surveyThink-Pair-Share: Why Make Visualizations?
Activity (25 mins)
Review and Rate Data VisualizationsDebrief: What makes a good/bad datavisualization?Make a table of good v. bad visualizationcharacteristics
Wrap-up (15 mins)
Data Visualization 101 discussion
Assessment
Assessment Posibilities
Extended Learning

DiscussionGoal
The goal here is to do a quick thinking prompt toactivate prior knowledge about visualizations. There aretwo key points to draw out:
Visualization is about communication. The goal ofany data visualization is to transform data into usefulinformation.
There are both advantages and disadvantages todata visualizations - some of the disadvantagesmight not be as clear at this point but they will beafter this lesson. The disadvantages mostly stemfrom the fact that human error and bias can beintroduced when trying to communicate.
Teaching GuideGetting Started (10 mins)
Fill out class tracker surveySurvey Reminder: Give students a few minutes to fill out the class tracker survey that you started in Lesson 7 -Introduction to Data.
Think-Pair-Share: Why Make Visualizations? Remarks
Yesterday you looked at a bunch of data from the Pew Research Center that was all presented visually in graphsand charts. The question is: why? Why did they choose to make a bunch of charts and graphs rather than justshowing the raw data itself?
Prompts:
Here are two related prompts to respond to:
"Why did Pew Research choose to make a bunch of charts and graphs rather than just showing theraw data itself?"
"List a few advantages and disadvantages (at least 2 for each) of using visualizations tocommunicate data"
Pair: Have students share with an elbow part.
Share: Draw out responses from the a whole class togenerate common themes.
Here are a few notes to help guide the discussion:
Why visualize?"
Student responses should focus oncommunication. You choose to make a chartbecause you think it's a better or more effectiveway to communicate information than using rawdata.
Advantages / Disadvantages
Advantages: pictures allow you to compare thingsmore easily, easier to see trends or patterns, canfocus on, or highlight, particular aspects of the datathat are importantDisadvantages: easy to mislead or miscommunicate, removes details that might be important or valuable,sometimes very dense - takes a while to study to understand what it means.
Activity (25 mins)
Teaching Tip
Compare with Different Groups: Collection A andCollection B have different sets of visualizations. Thereare benefits to discussing with both a group that usedthe same collection of visualizations and with a groupthat used a different one. Time allowing, encouragegroups to share their findings with groups who usedboth collections of visualizations.
Teaching Tip
To be creative with the share-out, you could:
Have students vote publicly on each one in somewayHave the groups that looked at Collection A all gettogether and figure out a best/worst to show to theother group(s) that looked at Collection B, and viceversa.
Remarks
Making even a small visualization may have been surprisingly challenging and varied.
In fact, even experienced data analysts can end up obscuring their message when they make data visualizations.
To better understand some of the skills we just read about, we are going to evaluate a collection of datavisualizations to determine how well they communicate their message.
Review and Rate Data VisualizationsPair: Partner students who will work through the worksheet together.
Assign: There are two different collections of data visualizations. Each pair of students should be assigned toevaluate one of either:
Data Visualization Collection A
or
Data Visualization Collection B
Links to the separate collections can be found in Code Studio
Distribute: Worksheet - Data Visualization Scorecard - Worksheet(There is a link to the worksheet in Code Studio, but this is one you probably want printed out.)
Transition to Good and Bad Visualizations on Code Studio
The worksheet asks pairs of students to collaborate in reviewing the data visualizations :
Give a rating from “Great” to “Horrible” for 15 different data visualizations.Choose the best (or favorite one) and explain why it effectively tells a story or communicates some data.Choose the worst (or a bad one) and explain why it’s ineffective.
Optional: Suggest (via a sketch) a better visual that could represent the same data.
Share:
After completing the worksheet, have each group sharethe best and worst image from their set with anothergroup. Groups should focus on how they would fix theworst visualization they chose. Share and exchangeideas about different ways to visualize the data.
Debrief: What makes agood/bad data visualization?Have a discussion with two main parts...
Part one: Share out best/worst
Ask student pairs to share the graphic they ratedthe worst and best.Focus on one or two and have all students look at it(bring up on a projector or have all students bring itup on screen).Ask students to justify or give reasons why theyrated the graphic highly or poorly.
Part 2: Discuss graphic number 5 - TheChanging Face of America
Graphic number 5 in both collections are twodifferent displays of the same data. For reference, here are snapshots of both graphics.
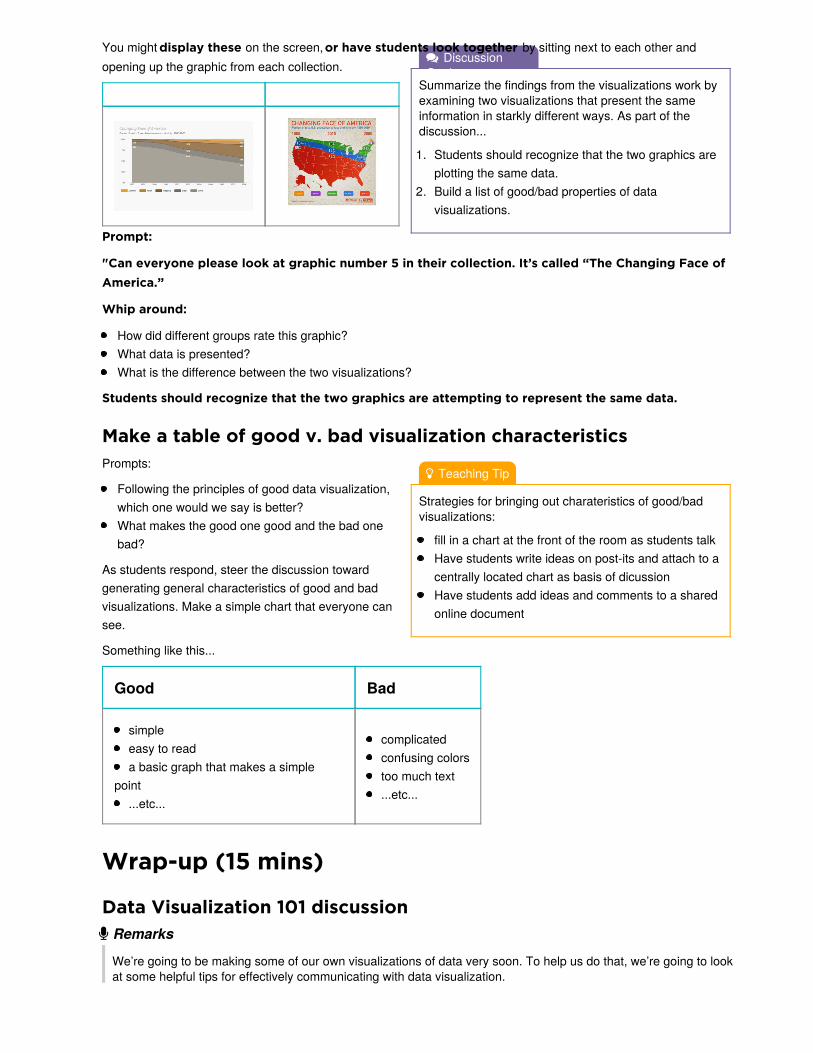
DiscussionGoal
Summarize the findings from the visualizations work byexamining two visualizations that present the sameinformation in starkly different ways. As part of thediscussion...
1. Students should recognize that the two graphics areplotting the same data.
2. Build a list of good/bad properties of datavisualizations.
Teaching Tip
Strategies for bringing out charateristics of good/badvisualizations:
fill in a chart at the front of the room as students talkHave students write ideas on post-its and attach to acentrally located chart as basis of dicussionHave students add ideas and comments to a sharedonline document
You might display these on the screen, or have students look together by sitting next to each other andopening up the graphic from each collection.
Prompt:
"Can everyone please look at graphic number 5 in their collection. It’s called “The Changing Face ofAmerica.”
Whip around:
How did different groups rate this graphic?What data is presented?What is the difference between the two visualizations?
Students should recognize that the two graphics are attempting to represent the same data.
Make a table of good v. bad visualization characteristicsPrompts:
Following the principles of good data visualization,which one would we say is better?What makes the good one good and the bad onebad?
As students respond, steer the discussion towardgenerating general characteristics of good and badvisualizations. Make a simple chart that everyone cansee.
Something like this...
Good Bad
simpleeasy to reada basic graph that makes a simple
point...etc...
complicatedconfusing colorstoo much text...etc...
Wrap-up (15 mins)
Data Visualization 101 discussion Remarks
We’re going to be making some of our own visualizations of data very soon. To help us do that, we’re going to lookat some helpful tips for effectively communicating with data visualization.
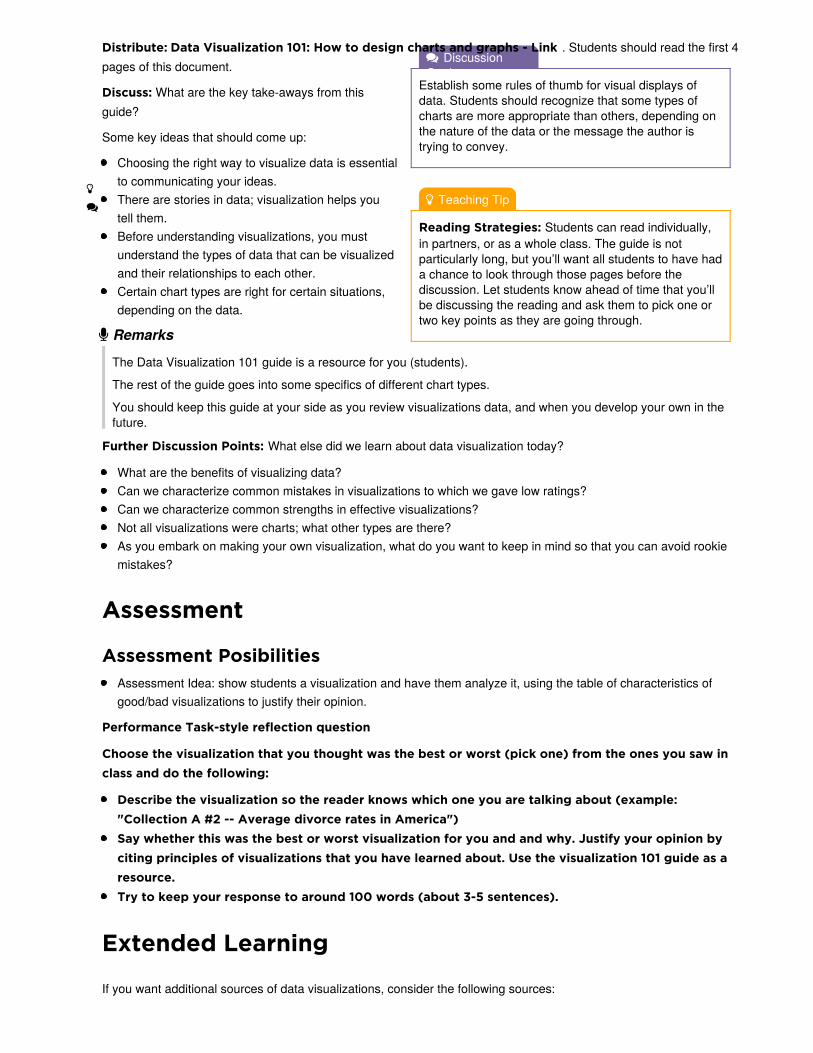
DiscussionGoal
Establish some rules of thumb for visual displays ofdata. Students should recognize that some types ofcharts are more appropriate than others, depending onthe nature of the data or the message the author istrying to convey.
Teaching Tip
Reading Strategies: Students can read individually,in partners, or as a whole class. The guide is notparticularly long, but you’ll want all students to have hada chance to look through those pages before thediscussion. Let students know ahead of time that you’llbe discussing the reading and ask them to pick one ortwo key points as they are going through.
Distribute: Data Visualization 101: How to design charts and graphs - Link . Students should read the first 4pages of this document.
Discuss: What are the key take-aways from thisguide?
Some key ideas that should come up:
Choosing the right way to visualize data is essentialto communicating your ideas.There are stories in data; visualization helps youtell them.Before understanding visualizations, you mustunderstand the types of data that can be visualizedand their relationships to each other.Certain chart types are right for certain situations,depending on the data.
Remarks
The Data Visualization 101 guide is a resource for you (students).
The rest of the guide goes into some specifics of different chart types.
You should keep this guide at your side as you review visualizations data, and when you develop your own in thefuture.
Further Discussion Points: What else did we learn about data visualization today?
What are the benefits of visualizing data?Can we characterize common mistakes in visualizations to which we gave low ratings?Can we characterize common strengths in effective visualizations?Not all visualizations were charts; what other types are there?As you embark on making your own visualization, what do you want to keep in mind so that you can avoid rookiemistakes?
Assessment
Assessment PosibilitiesAssessment Idea: show students a visualization and have them analyze it, using the table of characteristics ofgood/bad visualizations to justify their opinion.
Performance Task-style reflection question
Choose the visualization that you thought was the best or worst (pick one) from the ones you saw inclass and do the following:
Describe the visualization so the reader knows which one you are talking about (example:"Collection A #2 -- Average divorce rates in America")Say whether this was the best or worst visualization for you and and why. Justify your opinion byciting principles of visualizations that you have learned about. Use the visualization 101 guide as aresource.Try to keep your response to around 100 words (about 3-5 sentences).
Extended Learning
If you want additional sources of data visualizations, consider the following sources:
Daily Infographic: http://www.dailyinfographic.com/Infographics Archive: http://www.infographicsarchive.com/
Standards AlignmentComputer Science Principles
1.2 - Computing enables people to use creative development processes to create computational artifacts for creative expression or to
solve a problem.
3.1 - People use computer programs to process information to gain insight and knowledge.
If you are interested in licensing Code.org materials for commercial purposes, contact us.
UNIT
2Ch. 1 1 2 3 4 5 6 Ch. 2 7 8 9 10 11
12 13 14 15
Lesson 11: Making Data VisualizationsExternal Tools | Individual Skill Building | Tutorial
OverviewNow that students have had the chance to see and evaluatevarious data visualizations, they will learn to make visualizations oftheir own. This lesson teaches students how to build visualizationsfrom provided datasets. The levels in Code Studio provide adetailed walkthrough of how to use Google Sheets to createseveral different kinds of charts. While this lesson focuses on theGoogle Sheets tool, other tools may be substituted at the teacher’sdiscretion, and MS Excel support is coming soon to the lesson.
The main activity teaches students to build different chart types(scatter, line, and bar charts) from a single data set. It should beemphasized to students that the purpose of this lesson is toexplore and experiment with creating different types ofvisualizations, not to build the perfect chart. Students will have achance to create and customize their own charts. At the end ofclass, students compare their custom visualizations with those oftheir classmates.
PurposeBeing able to create meaningful data visualizations is extremelyimportant in order to effectively communicate information aboutlarge data sets. It's also important to be able to use visualizationsto simply “look” at data that is too complex to make sense of bylooking at the raw data alone. Any computer scientist working withdata should have some skills and facility with producingvisualizations of the data to get a sense of what it contains.Visualizing the data allows you to see patterns, trends orrelationships you might otherwise not.
The most important piece of this lesson is not learning to createthe prettiest chart; it’s about using charts to “tell the story” of what’sreally going on in the data. Different charts are more or lessappropriate for communicating this story, depending on the data.The point of having students explore different chart types is to helpthem build visualizations that reveal trends or connections in thedata that are too hard to see by just looking at a data table in aspreadsheet.
AgendaGetting Started
Survey ReminderUsing visualization to discover connections and
ObjectivesStudents will be able to:
Select the appropriate type of datavisualization to discover trends and patternswithin a dataset.Create a bar, line, and scatter chart from adataset using a computational tool.Use the settings of a data visualization toolto manipulate and refine the features of adata visualization.
PreparationData Tools Resources (including
Excel support)
LinksHeads Up! Please make a copyof any documents you plan toshare with students.
For the Teacher
KEY - Making Data VisualizationsTarget Charts - Answer Key
For the Students
Data Visualization 101: How to designcharts and graphs - LinkMovieRating_avgRatingByAgeByGender.csv - Data Set (download)Unit 2 on Code Studio

patternsMake a Quick Visualization
Activity
Make scatter, line, bar, and custom charts
Wrap-up (10 mins)
Compare with a partner
Assessment
Assessment Possibilities
Extended Learning
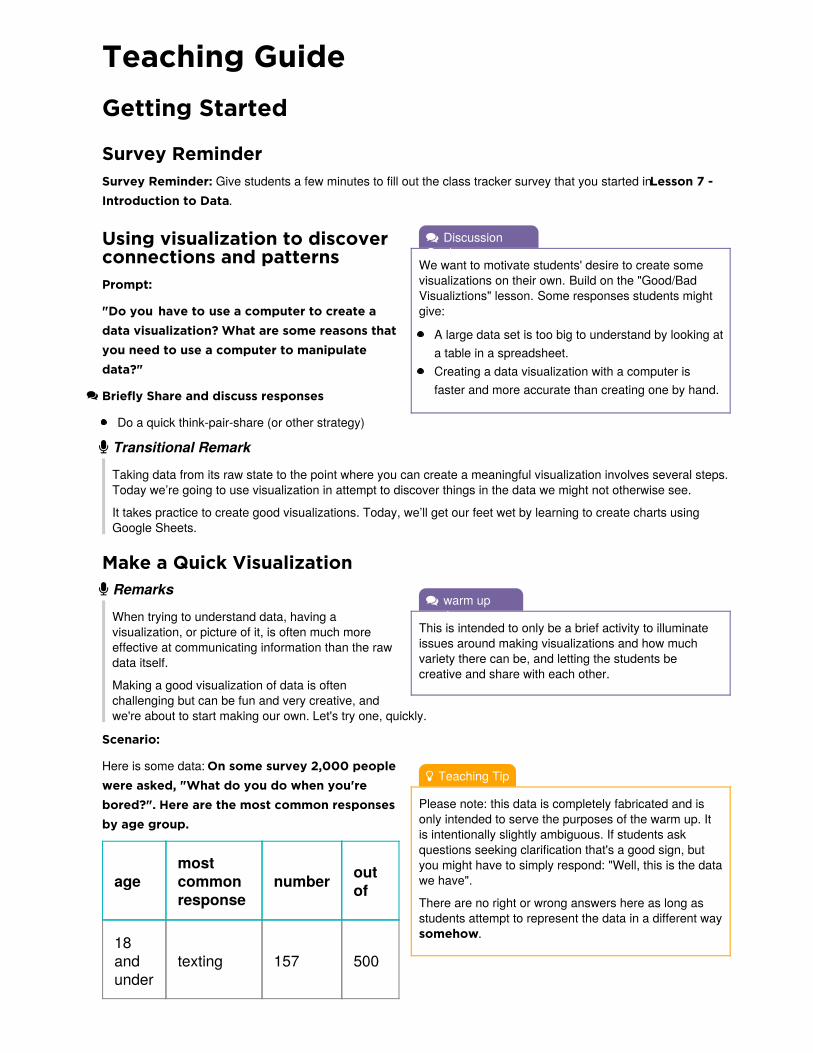
DiscussionGoal
We want to motivate students' desire to create somevisualizations on their own. Build on the "Good/BadVisualiztions" lesson. Some responses students mightgive:
A large data set is too big to understand by looking ata table in a spreadsheet.Creating a data visualization with a computer isfaster and more accurate than creating one by hand.
warm upgoal
This is intended to only be a brief activity to illuminateissues around making visualizations and how muchvariety there can be, and letting the students becreative and share with each other.
Teaching Tip
Please note: this data is completely fabricated and isonly intended to serve the purposes of the warm up. Itis intentionally slightly ambiguous. If students askquestions seeking clarification that's a good sign, butyou might have to simply respond: "Well, this is the datawe have".
There are no right or wrong answers here as long asstudents attempt to represent the data in a different waysomehow.
Teaching GuideGetting Started
Survey ReminderSurvey Reminder: Give students a few minutes to fill out the class tracker survey that you started in Lesson 7 -Introduction to Data.
Using visualization to discoverconnections and patternsPrompt:
"Do you have to use a computer to create adata visualization? What are some reasons thatyou need to use a computer to manipulatedata?"
Briefly Share and discuss responses
Do a quick think-pair-share (or other strategy)
Transitional Remark
Taking data from its raw state to the point where you can create a meaningful visualization involves several steps.Today we’re going to use visualization in attempt to discover things in the data we might not otherwise see.
It takes practice to create good visualizations. Today, we’ll get our feet wet by learning to create charts usingGoogle Sheets.
Make a Quick Visualization Remarks
When trying to understand data, having avisualization, or picture of it, is often much moreeffective at communicating information than the rawdata itself.
Making a good visualization of data is oftenchallenging but can be fun and very creative, andwe're about to start making our own. Let's try one, quickly.
Scenario:
Here is some data: On some survey 2,000 peoplewere asked, "What do you do when you'rebored?". Here are the most common responsesby age group.
agemostcommonresponse
number outof
18andunder
texting 157 500
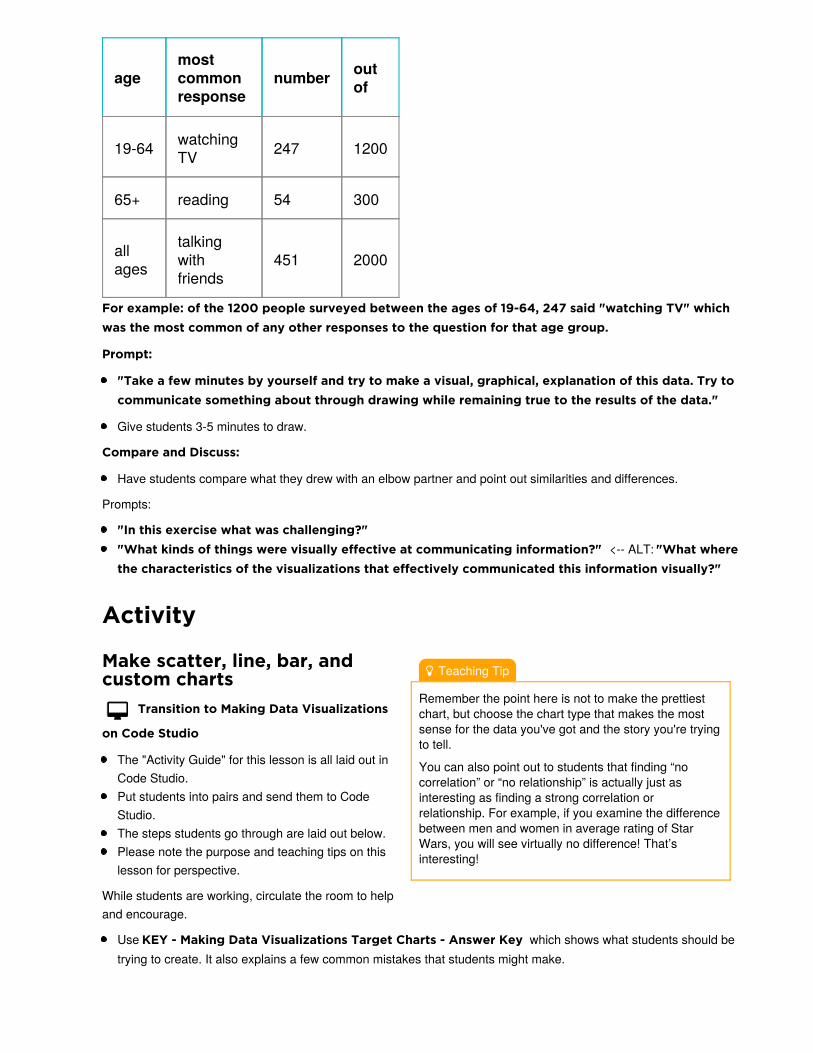
Teaching Tip
Remember the point here is not to make the prettiestchart, but choose the chart type that makes the mostsense for the data you've got and the story you're tryingto tell.
You can also point out to students that finding “nocorrelation” or “no relationship” is actually just asinteresting as finding a strong correlation orrelationship. For example, if you examine the differencebetween men and women in average rating of StarWars, you will see virtually no difference! That’sinteresting!
19-64 watchingTV 247 1200
65+ reading 54 300
allages
talkingwithfriends
451 2000
agemostcommonresponse
number outof
For example: of the 1200 people surveyed between the ages of 19-64, 247 said "watching TV" whichwas the most common of any other responses to the question for that age group.
Prompt:
"Take a few minutes by yourself and try to make a visual, graphical, explanation of this data. Try tocommunicate something about through drawing while remaining true to the results of the data."
Give students 3-5 minutes to draw.
Compare and Discuss:
Have students compare what they drew with an elbow partner and point out similarities and differences.
Prompts:
"In this exercise what was challenging?""What kinds of things were visually effective at communicating information?" <-- ALT: "What wherethe characteristics of the visualizations that effectively communicated this information visually?"
Activity
Make scatter, line, bar, andcustom charts
Transition to Making Data Visualizations
on Code Studio
The "Activity Guide" for this lesson is all laid out inCode Studio.Put students into pairs and send them to CodeStudio.The steps students go through are laid out below.Please note the purpose and teaching tips on thislesson for perspective.
While students are working, circulate the room to helpand encourage.
Use KEY - Making Data Visualizations Target Charts - Answer Key which shows what students should betrying to create. It also explains a few common mistakes that students might make.
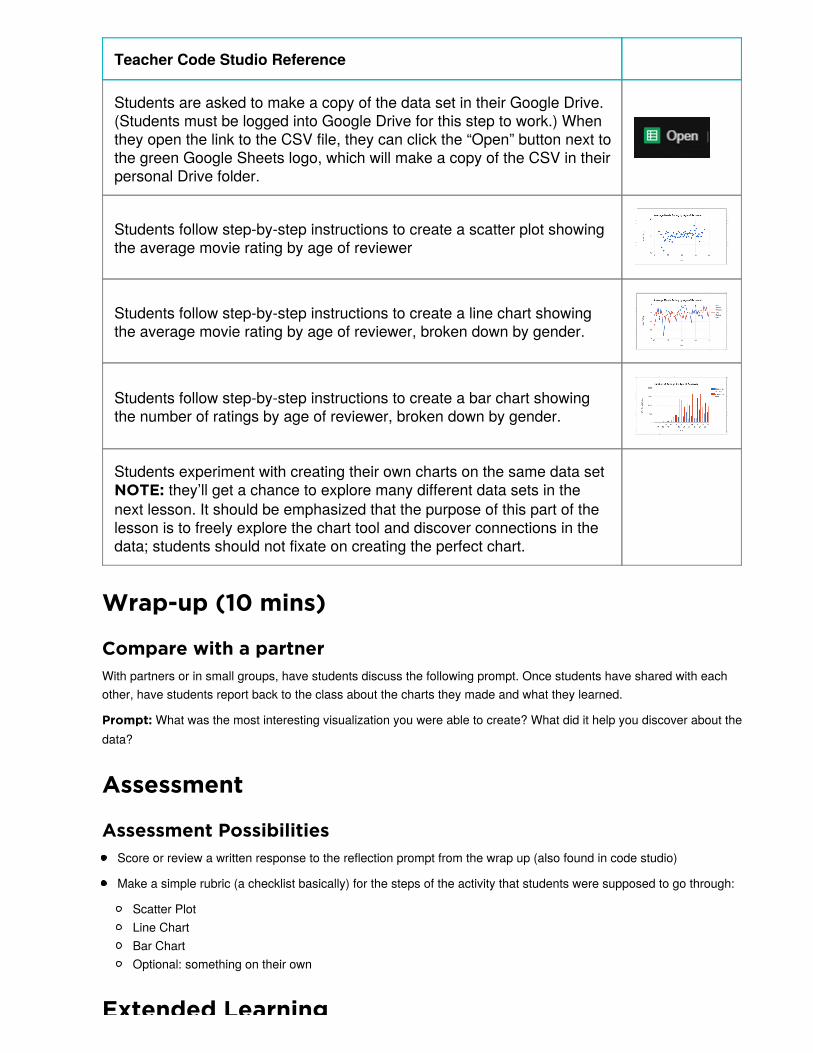
Teacher Code Studio Reference
Students are asked to make a copy of the data set in their Google Drive.(Students must be logged into Google Drive for this step to work.) Whenthey open the link to the CSV file, they can click the “Open” button next tothe green Google Sheets logo, which will make a copy of the CSV in theirpersonal Drive folder.
Students follow step-by-step instructions to create a scatter plot showingthe average movie rating by age of reviewer
Students follow step-by-step instructions to create a line chart showingthe average movie rating by age of reviewer, broken down by gender.
Students follow step-by-step instructions to create a bar chart showingthe number of ratings by age of reviewer, broken down by gender.
Students experiment with creating their own charts on the same data set NOTE: they’ll get a chance to explore many different data sets in thenext lesson. It should be emphasized that the purpose of this part of thelesson is to freely explore the chart tool and discover connections in thedata; students should not fixate on creating the perfect chart.
Wrap-up (10 mins)
Compare with a partnerWith partners or in small groups, have students discuss the following prompt. Once students have shared with eachother, have students report back to the class about the charts they made and what they learned.
Prompt: What was the most interesting visualization you were able to create? What did it help you discover about thedata?
Assessment
Assessment PossibilitiesScore or review a written response to the reflection prompt from the wrap up (also found in code studio)
Make a simple rubric (a checklist basically) for the steps of the activity that students were supposed to go through:
Scatter PlotLine ChartBar ChartOptional: something on their own
Extended Learning
Extended Learning
If you want additional sources of data visualizations, consider the following sources:
Daily Infographic: http://www.dailyinfographic.com/Infographics Archive: http://www.infographicsarchive.com/
Standards AlignmentComputer Science Principles
1.2 - Computing enables people to use creative development processes to create computational artifacts for creative expression or to
solve a problem.
3.1 - People use computer programs to process information to gain insight and knowledge.
If you are interested in licensing Code.org materials for commercial purposes, contact us.

UNIT
2Ch. 1 1 2 3 4 5 6 Ch. 2 7 8 9 10 11
12 13 14 15
Lesson 12: Discover a Data StoryExternal Tools | Collaborative Artifact Creation | Writing
OverviewIn this lesson, students will collaboratively investigate somedatasets and use visualization tools to “discover a data story.” Thelesson assumes that students know how to use some kind ofvisualization tool - in the previous lesson we used the chartingtools of a basic spreadsheet program. Students should be workingwith a partner but without much teacher hand-holding. Most of thetime should be spent with students poking around the data andtrying to discover connections and trends using data visualizationtools. It is up to them to discover a trend, make a chart, andaccurately write about it.
PurposeBeing able to look at large sets of data and use visualization as atool for discovery is a common task that many people who workwith data do on a daily basis. A computer scientist should havedecent facility with using tools opening and browsing largedatasets, and doing some cursory exploration to see what’s there.The computer scientist should be familiar enough with the tools to,over time, develop some instincts about data, how it’s collected,the kinds of formats it comes in, and how that affects what can orcannot be done to visualize it.
AgendaGetting Started (10 mins)
Fill out class tracker surveyVisualization as a discovery toolQuick Investigation of a sample dataset
Activity (40 mins)
Discover a Data Story
Wrap Up (10 mins)
Share your data stories
Assessment
Assessment Posibilities
ObjectivesStudents will be able to:
Collaboratively investigate a dataset.Create a visualization (chart) from provideddata.Identify possible trends or connections in adata set by creating visualizations of it.Accurately communicate about avisualization of their own creation.
PreparationPrint a copy of Activity Guide -
Discover a Data Story - ActivityGuide for each student (or provide link)
Print a copy of Data Visualization 101:How to design charts and graphs -Link for each student (or provide link)NOTE: this may have already been printedfor lesson 10
LinksHeads Up! Please make a copyof any documents you plan toshare with students.
For the Students
Activity Guide - Discover a Data Story- Activity Guide Data Visualization 101: How to designcharts and graphs - LinkRubric - Discover a Data Story - Rubric
Data sets folder - FolderUnit 2 on Code Studio
Make a Copy
Make a Copy
Teaching GuideGetting Started (10 mins)
Fill out class tracker surveySurvey Reminder: Give students a few minutes to fill out the class tracker survey that you started in Lesson 7 -Introduction to Data.
Visualization as a discovery tool Remarks
In the previous lesson, we learned how to use a data visualization tool to create a visualization. Sometimes data inits raw state is simply too big to be able to look at and derive any meaning. Even when the data is summarized in atable, it can be difficult to “see” what the data shows.
Today we're going to see how visualizing data can be a useful tool for discovery. In today’s activity, you and apartner will investigate some sets of data on your own and use visualization to discover a connection or trend.
Quick Investigation of a sample datasetFor today's work there are several datasets for you to choose from.
We’re going to take 5 minutes to poke around in one of the datasets to see how it’s structured.Then we’ll come back together to get some terms straight before discovering further.
Go to Code Studio
1. Find the link to the “Personality” dataset and open the folder.2. Find and open the README file.3. Find and open the rawData.csv file.4. Find and open one other .csv file - there are a few.
Discuss: What's in the folder for a dataset?
After students have had a few minutes to poke around, make sure the group understands what these files are.
You can use a think-pair-share or a simple whole group discussion to get the details out.
Ask the questions below, explanations are provided for you
"What’s the README file?"
Most datasets, when you download them, contain a README file.The README file is just a plain text document that gives some background information about the dataset, how itwas collected, and what the column headings mean.The README is a good first stop when trying to understand exactly what a dataset contains.
"What’s the rawData.csv file?"
For the datasets we provide, each folder contains a "raw" dataset, which is the original data, as it was collected.Recall that .csv stands for “comma-separated values.” CSV is a common, plain text format for distributingdatasets.
"What’s in the other CSV files? "
The other files are what we call "summary tables. "These are tables that were created by running some computations on the raw data to do things like count,average, sum, compare, and categorize the data in interesting ways.It is likely that these summary tables will be the data you use to create your visualizations.
Teaching Tip
A Note on distributing the Activity Guide
The first section of the activity guide contains theinstructions above. It’s suggested that students startexploring the datasets before you distribute theactivity guide so they don’t lose momentum.
You might choose to assign the datasets to groups .This cuts down on student choice, but might save timeif students are taking a while to settle on which datasetthey want to use.
While students are working:
Remind students of the existence of the guide: DataVisualization 101: How to design charts andgraphs - Link.Most of the students’ time should be spent onworking collaboratively to visualize data in differentways.Encourage and remind students that an “interesting”finding doesn’t necessarily mean finding somethingworld-changing or mind-blowing. The data is so bigand hard to “see" that simply making a clearchart that gives some kind of view into thedata is interesting
Teaching Tip
For student sharing, there are a number of differentthings you could do, depending on your needs andclassroom dynamic. Here are a few suggestions.
Have groups that used the same dataset share witheach other.Have each group share with one or two groups whoused a different dataset.Highlight one or two pairs’ work by asking them topresent to the whole class.
Activity (40 mins)
Discover a Data StoryPair: Put students in pairs or small groups to explorethe datasets
Remarks
With your partner explore the datasets and chooseone you'd like to learn more about. Make sure you
Read the README to understand the raw datathat was collectedLook at the summary tables provided for yourdataset.Repeat these steps with additional datasetsChoose one to explore more deeply.
Discover a Data Story
Distribute: Activity Guide - Activity Guide -Discover a Data Story - Activity Guide
There is a link to this guide in Code Studio.
You may choose to have students make their owndigital copies of this document and work on it there aswell.
The activity guide asks students to:
Pick a dataset
Use visualization tools to “discover a data story”
Prepare one (or two) to present
Respond to prompts
Wrap Up (10 mins)
Share your data storiesHave students share their data stories with each otheror with the whole class. A pair should:
Show the visualization they made.Explain what it shows.Explain the possible story it tells.
Assessment
Assessment PosibilitiesUse the rubric to score the activity guide
You may choose to collect the second page of theActivity Guide and score it using the Rubric - Discover a Data Story - Rubric provided.
Note: Collecting and scoring the Activity Guide is optional.
The intent of this activity is NOT to make a huge project out of it.The goal is simply to come away with some artifact that you might assess.It might be sufficient for students to share what they created in class rather than submitting the worksheet.
Personal Reflection: Collaboration
This prompt is also provided on Code Studio
(NOTE: The following is modification of one of the prompts given on the AP Create Performance task.)
Prompt: Describe the development process of discovering your data story and creating a visualization.Describe the difficulties and/or opportunities you encountered along the way, and describe thecollaborative process between you and your partner.
Please limit your response to about 200 words.
Standards AlignmentComputer Science Principles
1.1 - Creative development can be an essential process for creating computational artifacts.
1.2 - Computing enables people to use creative development processes to create computational artifacts for creative expression or to
solve a problem.
1.3 - Computing can extend traditional forms of human expression and experience.
3.1 - People use computer programs to process information to gain insight and knowledge.
If you are interested in licensing Code.org materials for commercial purposes, contact us.

UNIT
2Ch. 1 1 2 3 4 5 6 Ch. 2 7 8 9 10 11
12 13 14 15
Lesson 13: Cleaning DataExternal Tools | Analyzing | Group Skill Building
OverviewIn this lesson, students begin working with the data that they havebeen collecting since the first lesson of the chapter in the class"data tracker." They are introduced to the first step in analyzingdata: cleaning the data. Students will follow a guide in CodeStudio, which demonstrates the common techniques of filtering andsorting data to familiarize themselves with its contents. Then theywill correct errors they find in the data by either hand-correctinginvalid values or deleting them. Finally they will categorize anyfree-text columns that were collected to prepare them for analysis.This lesson introduces many new skills with spreadsheets andreveals the sometimes subjective nature of data analysis.
PurposeThe main purpose here is have students independently applysome of the data manipulation skills (in spreadsheets) that they'velearned over the past few lessons, to a new dataset that isrelatively uncurated. This is the beginning of the process of"extracting knowledge from data": look at the data and clean it upso that you can process it using computational tools.
Using computational tools to analyze data has made it mucheasier to find trends and patterns in large datasets. Whenpreparing data for this kind of analysis, however, it’s important toremember that the computer is much less “intelligent” than wemight imagine. Small discrepancies in the data may preventaccurate interpretation of trends and patterns or can even make itimpossible to use the data in computation in the first place.Cleaning data is therefore an important step in analyzing it, and inmany contexts, it may actually take the largest amount of time.
AgendaGetting Started (5 mins)
Survey Reminder - Last one!Discuss: Why we need to clean data
Activity (40 mins)
Clean Your Data
Wrap Up (5 mins)
Reflection: Is data analysis objective?
Assessment
Assessment Posibilities
ObjectivesStudents will be able to:
Filter and sort a dataset using aspreadsheet tool.Identify and correct invalid values in adataset with the aid of computational toolsJustify the need to clean data prior toanalyzing it with computational tools.
PreparationPrepare data collected from survey to
share with students. Ensure that a“Teacher only” master copy is kept safelysomewhere.
Student partners will carry through thenext lesson and Practice PT. You maywish to select these pairs beforehand.
Review the Data Tools Resources forthis lesson (including Excel support)
LinksHeads Up! Please make a copyof any documents you plan toshare with students.
For the Students
Unit 2 on Code Studio
Teaching Tip
If you need to prepare the data ahead of time, youmight not be able to squeeze in one last entry.
DiscussionGoal
Introduce the activity of the day and motivate the needto clean data before using it for analysis.
Teaching GuideGetting Started (5 mins)
Survey Reminder - Last one!Survey Reminder: Do one more entry in the classdata tracker. You'll be using this data today. Givestudents a few minutes to fill out the class trackersurvey that you started in Lesson 7 - Introductionto Data.
Discuss: Why we need to clean data Remarks
We have been collecting data about ourselves forseveral days. Now it’s time to look at that data andsee if we can find any interesting patterns or trendswithin it.
Prompt:
"Before we get started, what challenges do you think we’ll encounter as we begin to peek into thedata we've been collecting?"
Discuss:
Ask students to share their ideas with small groups or as a class.
While there are presumably many challenges that will be mentioned, likely some of the comments will be related tothe state of the data that was collected - in other words, how “clean” it is for analysis.
Transitional Remarks
There are many challenges associated with analyzing data. Today we’re going to look at one that a lot of peopledon’t often think about. When we collect data, it’s usually “dirty,” which means that, for one reason or another, it’snot ready for analysis. We’re going to investigate what this looks like and learn to use some tools to help us look atand “clean” the data.
Activity (40 mins)
Clean Your DataPlace Students in Pairs:
Students will clean and categorize their data in pairs. They will be using this data that they cleaned later in the unit forthe practice PT.
Sharing the Data:
Pairs are going to need their own copy of the data collected from the survey. You should make your own master copythat will not be changed. To share the data with students, you can:
Send a copy by email.Post a link to a Google Spreadsheet (make sure it’s “View Only”).Note: Instructions in Code Studio explain to students how they can “Make a copy” of a Google Sheet forthemselves. If you are using a different spreadsheet tool, you should still share a copy.
Transition to Code Studio: Cleaning Data
Teaching Tip
You may wish to work through these set of activitiesas a class.When using Google Sheets or other onlinespreadsheet tools, it is possible for two students toclean the same dataset at the same time.Students should consult with their partners as theymake their categorizations. Remind them that thegoal is to have something they could analyze orchart later.
DiscussionGoal
Students should reflect on the often subjective nature ofcleaning data. Even as data is being cleaned to beused by computers, there will often be a “humanelement” to how it is cleaned.
Students will be guided through a series of activities that walk them through filtering, sorting, cleaning, andcategorizing data.
The activity should be done in three parts.
1. Familiarizing Yourself with the Data:
Students learn how to sort and filter in a spreadsheettool. There is no need yet to actually change any ofthe values. They simply should learn how these toolswork in the spreadsheet tool you are using. Studentscan move on when they know how to filter and sortdata.
2. Cleaning the Data:
Ignore “freeform text” responses for now -- forexample, the “What did you do to relax?” column --and focus attention on values that should be numericor single words. Students will using sorting andfiltering to find invalid values and will either fix or delete them. Students can move on when they have cleaned all“non-freeform” columns.
3. Categorizing Data:
Now focus attention on “freeform text” columns. Students will need to manually create new columns that categorizethe inputs. This is a necessary step in order to perform computation with the data but it won’t feel very “algorithmic.”They will need to make choices, which is fine and will be addressed in the wrap up. Students can move on whenthey have cleaned all “freeform” columns by creating new columns of categories.
Wrap Up (5 mins)
Reflection: Is data analysis objective?Prompt: (Also found on Code Studio)
"In order to analyze data with a computer, weneed to clean the data first. Based on yourexperience today, would you say that dataanalysis is a perfectly objective process? Whyor why not?"
Discuss:
Students should share their ideas in small groups before discussing as a class. The key ideas to touch on are:
Data cleaning usually requires a human to make decisions about the data.There often will not be one “right” way to clean the data and different people will do it differently.Any categorizing in particular is quite subjective.
NOTE: Make sure to save the cleaned up data:
Pairs should save their data somewhere they can both access it. They will be using it in the following lesson.
Assessment
Assessment Posibilities

Score or review a written response to the reflection prompt from the wrap up "Is data analysis objective?" (alsofound in code studio)
Make a simple rubric (a checklist basically) for the steps of the activity that students were supposed to go through:
Used sorting in a spreadsheetUsed filtering to help identify outliers for cleaningAdded a column to categorize some form of free form text.
Multiple Choice (also on code studio)
Which of the following is the most accurate statement about cleaning and filtering data?
Using computing tools to filter and clean raw data makes it impossible to analyze or draw accurate conclusionsFiltering and cleaning data is a fully automated process that should not require human input or interventionFiltering and cleaning data is a human process that does not require the use of computersFiltering and cleaning data is necessary to ensure that data is in a form that is better for computers to process
Standards AlignmentComputer Science Principles
1.2 - Computing enables people to use creative development processes to create computational artifacts for creative expression or to
solve a problem.
3.1 - People use computer programs to process information to gain insight and knowledge.
3.2 - Computing facilitates exploration and the discovery of connections in information.
7.1 - Computing enhances communication, interaction, and cognition.
If you are interested in licensing Code.org materials for commercial purposes, contact us.

UNIT
2Ch. 1 1 2 3 4 5 6 Ch. 2 7 8 9 10 11
12 13 14 15
Lesson 14: Creating Summary TablesExternal Tools | Artifact Creation | Analyzing
OverviewIn this lesson students learn how create their own summary tablesfrom raw data. A summary table typically represents one or moreaggregations (groupings of items) and computations that areperformed on the raw dataset. In most spreadsheet programs, asummary table is called a pivot table. In the lesson, students learnhow to make pivot tables in Google Sheets using a provideddataset. Then students turn to the data they’ve collected as a classand, with their partner, use pivot tables to investigate it further.
PurposeMaking a summary (pivot) table is often considered an advancedtechnique. Once you get used to it, however, it's an extremelypowerful computational tool that is available in most spreadsheetsoftware. The purpose here is to acquaint students with usingsuch a tool and to expose this power. Also creating summarytables is a direct tie to the CSP Framework essential knowledgestatement: 3.1.3C Summaries of data analyzedcomputationally can be effective in communicatinginsight and knowledge gained from digitally representedinformation.
The other purpose here is that creating a summary table is a goodexample of making a computational artifact for the ExplorePerformance Task. For that performance task students mightfind some raw data while doing research and might create a newartifact that is a summary table of the data that reveals someinteresting aspect of it. Using a tool like a spreadsheet to makesummary tables let's you explore data in deep ways, quickly andeasily.
Being able to manipulate data is an important skill for computerscientists. Being able to create summary tables from largerdatasets represents a form of computational thinking. To make agood summary table, one must have a good sense of the data, beable to hypothesize about what might be interesting to look at, andthen have the skills to use a computational tool to create it. Whileseemingly mundane, a spreadsheet is an extremely powerful toolfor working with data. Understanding the features of a spreadsheettool, and what kinds of computations it can perform, can save youa lot of time and energy from either doing such things “by hand” orwriting your own program to do it.
ObjectivesStudents will be able to:
Create a pivot table with at least oneaggregation and one calculation when givena set of data.Describe the benefits a summary table hasover a raw dataset.Collaboratively investigate a dataset bycreating summary tables.Explain the meaning of a summary tablethey created.
PreparationReview Data Tools Resources
(including Excel support)Familiarize yourself with the tutorials
about making pivot tables in Code Studio.Ensure sutudents have access to the
dataset they cleaned in the previouslesson.
LinksHeads Up! Please make a copyof any documents you plan toshare with students.
For the Students
Unit 2 on Code Studio
VocabularyAggregation - a computation in whichrows from a data set are grouped togetherand used to compute a single value of moresignificant meaning or measurement.Common aggregations include: Average,Count, Sum, Max, Median, etc.Pivot Table - in most spreadsheetsoftware it is the name of the tool used tocreate summary tables.Summary Table - a table that shows the
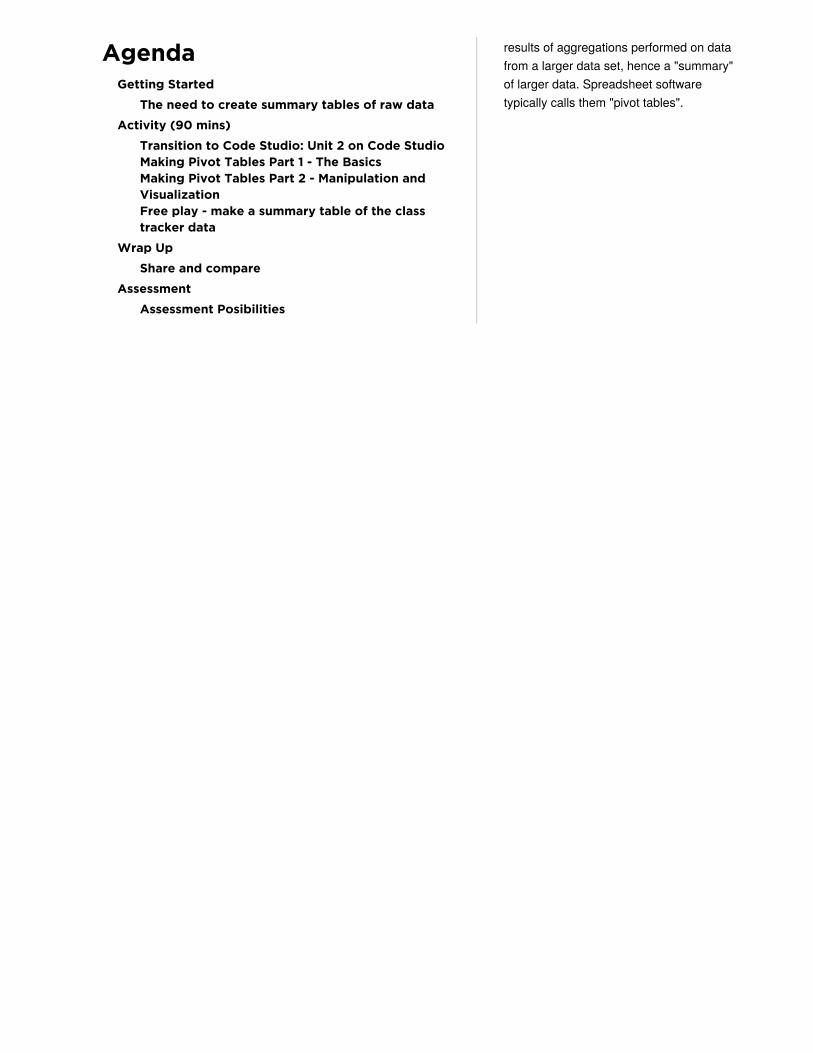
AgendaGetting Started
The need to create summary tables of raw data
Activity (90 mins)
Transition to Code Studio: Unit 2 on Code StudioMaking Pivot Tables Part 1 - The BasicsMaking Pivot Tables Part 2 - Manipulation andVisualizationFree play - make a summary table of the classtracker data
Wrap Up
Share and compare
Assessment
Assessment Posibilities
results of aggregations performed on datafrom a larger data set, hence a "summary"of larger data. Spreadsheet softwaretypically calls them "pivot tables".
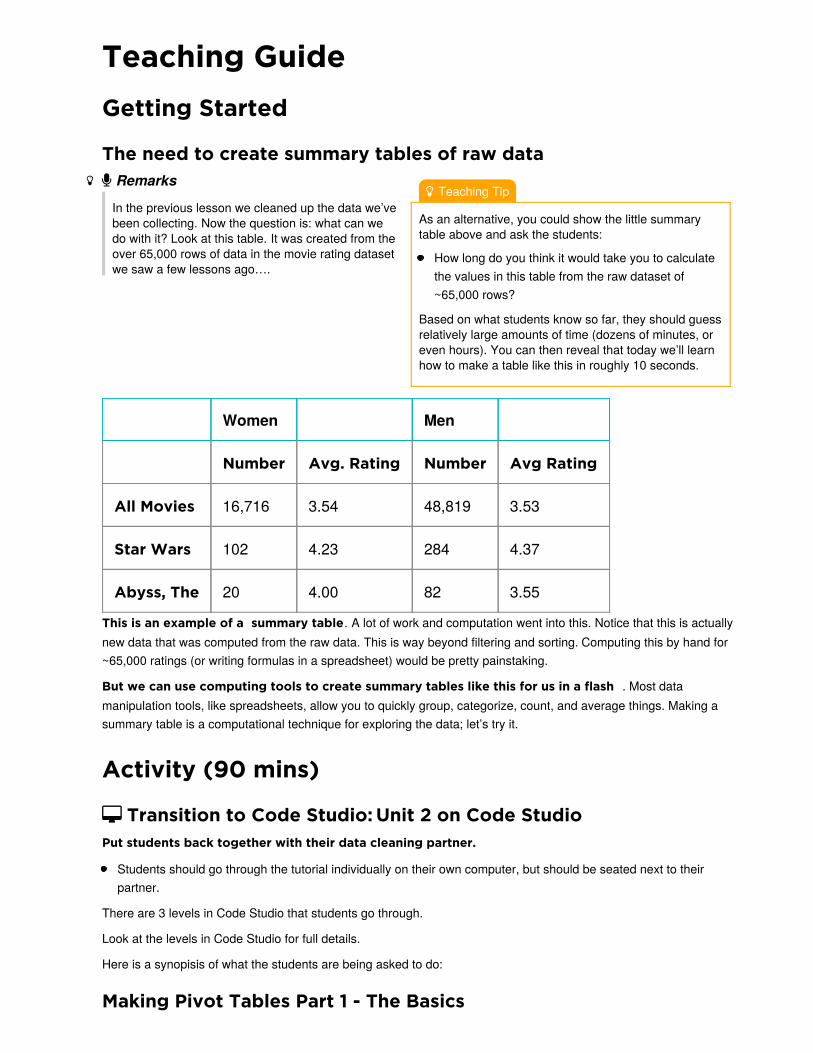
Teaching Tip
As an alternative, you could show the little summarytable above and ask the students:
How long do you think it would take you to calculatethe values in this table from the raw dataset of~65,000 rows?
Based on what students know so far, they should guessrelatively large amounts of time (dozens of minutes, oreven hours). You can then reveal that today we’ll learnhow to make a table like this in roughly 10 seconds.
Teaching GuideGetting Started
The need to create summary tables of raw data Remarks
In the previous lesson we cleaned up the data we’vebeen collecting. Now the question is: what can wedo with it? Look at this table. It was created from theover 65,000 rows of data in the movie rating datasetwe saw a few lessons ago….
Women Men
Number Avg. Rating Number Avg Rating
All Movies 16,716 3.54 48,819 3.53
Star Wars 102 4.23 284 4.37
Abyss, The 20 4.00 82 3.55
This is an example of a summary table. A lot of work and computation went into this. Notice that this is actuallynew data that was computed from the raw data. This is way beyond filtering and sorting. Computing this by hand for~65,000 ratings (or writing formulas in a spreadsheet) would be pretty painstaking.
But we can use computing tools to create summary tables like this for us in a flash . Most datamanipulation tools, like spreadsheets, allow you to quickly group, categorize, count, and average things. Making asummary table is a computational technique for exploring the data; let’s try it.
Activity (90 mins)
Transition to Code Studio: Unit 2 on Code StudioPut students back together with their data cleaning partner.
Students should go through the tutorial individually on their own computer, but should be seated next to theirpartner.
There are 3 levels in Code Studio that students go through.
Look at the levels in Code Studio for full details.
Here is a synopisis of what the students are being asked to do:
Making Pivot Tables Part 1 - The Basics
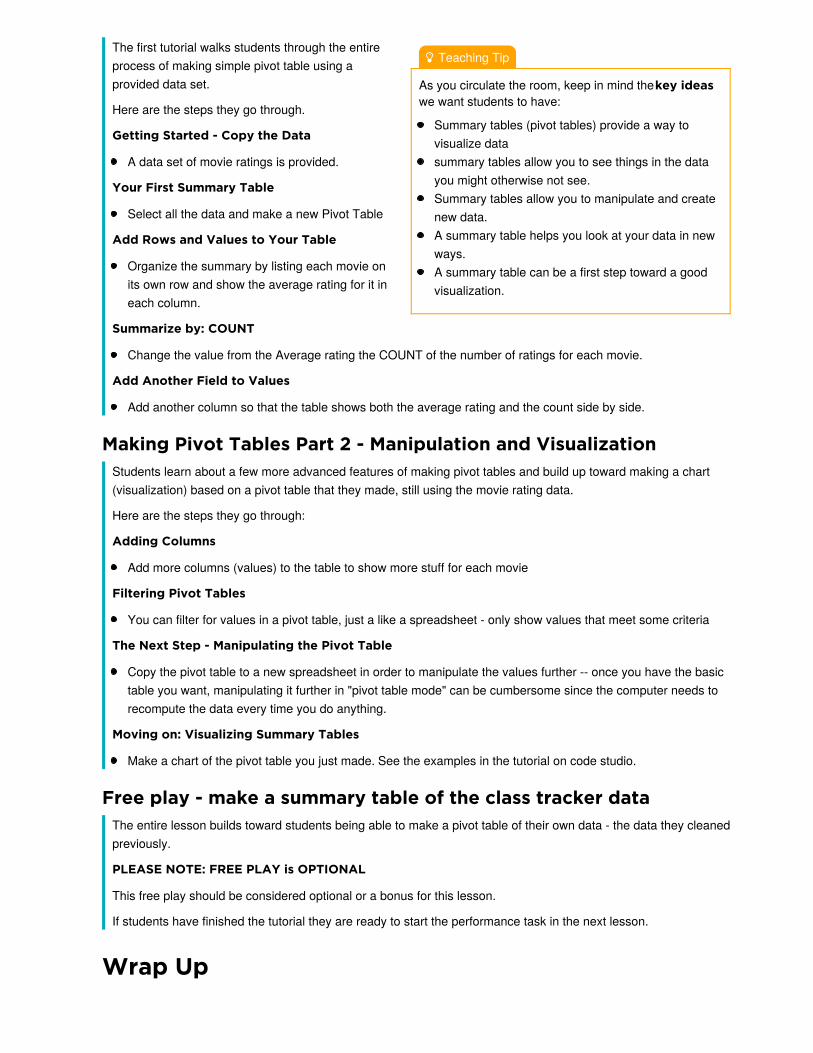
Teaching Tip
As you circulate the room, keep in mind the key ideaswe want students to have:
Summary tables (pivot tables) provide a way tovisualize datasummary tables allow you to see things in the datayou might otherwise not see.Summary tables allow you to manipulate and createnew data.A summary table helps you look at your data in newways.A summary table can be a first step toward a goodvisualization.
The first tutorial walks students through the entireprocess of making simple pivot table using aprovided data set.
Here are the steps they go through.
Getting Started - Copy the Data
A data set of movie ratings is provided.
Your First Summary Table
Select all the data and make a new Pivot Table
Add Rows and Values to Your Table
Organize the summary by listing each movie onits own row and show the average rating for it ineach column.
Summarize by: COUNT
Change the value from the Average rating the COUNT of the number of ratings for each movie.
Add Another Field to Values
Add another column so that the table shows both the average rating and the count side by side.
Making Pivot Tables Part 2 - Manipulation and VisualizationStudents learn about a few more advanced features of making pivot tables and build up toward making a chart(visualization) based on a pivot table that they made, still using the movie rating data.
Here are the steps they go through:
Adding Columns
Add more columns (values) to the table to show more stuff for each movie
Filtering Pivot Tables
You can filter for values in a pivot table, just a like a spreadsheet - only show values that meet some criteria
The Next Step - Manipulating the Pivot Table
Copy the pivot table to a new spreadsheet in order to manipulate the values further -- once you have the basictable you want, manipulating it further in "pivot table mode" can be cumbersome since the computer needs torecompute the data every time you do anything.
Moving on: Visualizing Summary Tables
Make a chart of the pivot table you just made. See the examples in the tutorial on code studio.
Free play - make a summary table of the class tracker dataThe entire lesson builds toward students being able to make a pivot table of their own data - the data they cleanedpreviously.
PLEASE NOTE: FREE PLAY is OPTIONAL
This free play should be considered optional or a bonus for this lesson.
If students have finished the tutorial they are ready to start the performance task in the next lesson.
Wrap Up
Question: Did anyone find the potential makings of a data story today?
Share and compareHave pairs of students share the pivot tables that they made with another pair, or with you, or with the whole class.This might be an opportunity for them to do peer-review of other groups’ tables (see assessment below).Students should be able to describe what their table is showing, and preferably point out some insight they had.
Recall the key ideas of summary tables:
Summary tables (pivot tables) provide a way to visualize data.Yes, it's still a table, but by aggregating and summarizing information from a large dataset, summary tablesallow you to see things in the data you might otherwise not see.
Summary tables allow you to manipulate and create new data.Even for our simple movies example here, the raw data didn't contain the average rating for every movie, orcount how many ratings there were. We had to compute it, and the pivot table let us do that quickly and easily.
A summary table helps you look at your data in new ways.Think: how could data be grouped? What could be calculated? Once you know how to make a summary tableyou can begin to look at raw data and ask questions that you know might be possible to answer.
A summary table can be a first step toward a good visualizationOften it's difficult to make a meaningful chart or graphic out of raw data. You often want to summarize it first,then chart it!
Foreshadow:
In the next lesson, you and your partner will dig deeper into the data to find your own data story and makevisualizations to tell it!
Assessment
Assessment PosibilitiesNote: Formally assessing the pivot tables that come from this lesson should be considered optional. These partnerswill be making more pivot tables and charts from them for the Practice Performance Task in the next lesson.
Multiple Choice: (Also found in code studio)
Which of the following statements are true about pivot tables?
Select two answers.
Pivot tables are used to quickly remove errors and inconsistencies from a dataset.Pivot tables are used to quickly perform aggregate computations and groupings on a set of raw dataPivot tables are used because they automatically detect and highlight potential trends or patterns in the underlyingraw dataPivot tables are used to generate a summarized view of a large dataset which is helpful for gaining insight
Standards AlignmentComputer Science Principles
1.1 - Creative development can be an essential process for creating computational artifacts.
1.2 - Computing enables people to use creative development processes to create computational artifacts for creative expression or to
solve a problem.
3.1 - People use computer programs to process information to gain insight and knowledge.
3.2 - Computing facilitates exploration and the discovery of connections in information.

If you are interested in licensing Code.org materials for commercial purposes, contact us.
UNIT
2Ch. 1 1 2 3 4 5 6 Ch. 2 7 8 9 10 11
12 13 14 15
Lesson 15: Practice PT - Tell a Data StoryPractice PT | External Tools | Artifact Creation
OverviewFor this Practice PT students will analyze the data that they havebeen collecting as a class in order to demonstrate their ability todiscover, visualize, and present a trend or pattern they find in thedata. Leading up to this lesson, students will have been working inpairs to clean and summarize their data. Students should completethis project individually but can get feedback on their ideas fromtheir data-cleaning partner.
Note: This is NOT the official AP® Performance Task that will besubmitted as part of the Advanced Placement exam; it is a practiceactivity intended to prepare students for some portions of theirindividual performance at a later time.
PurposeStudents in this lesson will be telling their own story with a set ofdata about themselves. The hope is that using personal data willboth motivate the exploration of the dataset and provide studentswith intuitions about the kinds of patterns or trends to explore. ThisPractice PT reflects many of the practices students will need touse on the actual AP® Performance Tasks, in particular theExplore PT. On that PT, students will need to create an artifactwith a computational tool and explain both how it was created andwhat it is showing.
While students will not be required to create a chart or evennecessarily visualize data for the PT, creating a data visualizationwould make for a strong computational artifact. This activity isdesigned to provide practice with one way to complete that aspectof the PT. Additionally students should leave this Practice PTfamiliar with many of the Learning Objectives related to thechallenges of manipulating and analyzing data, as they will havenow gone through the lifecycle of collecting, cleaning, analyzing,and visualizing data themselves.
AP® is a trademark registered and/or owned by theCollege Board, which was not involved in the productionof, and does not endorse, this curriculum.
AgendaGetting Started
Introduce the aims and goals of the Practice PT.
Activity (up to 3 days)
ObjectivesStudents will be able to:
Create summaries of a dataset using apivot table.Manipulate and clean data in order toprepare it for analysis.Explain the process used to create avisualization.Design a visualization that clearly presentsa trend, pattern, or relationship within adataset.Create visualizations of a dataset in orderto discover trends and patterns.Draw conclusions from the contents of adata visualization.
LinksHeads Up! Please make a copyof any documents you plan toshare with students.
For the Students
Practice PT - Tell a Data Story - Rubric
Unit 2 on Code StudioMake a Copy

Create Individual Copies of the DataIdentify a StoryVisualize Your StoryComplete Written Responses
Wrap Up
Submit Practice PTSharing Work
Assessment
Rubric
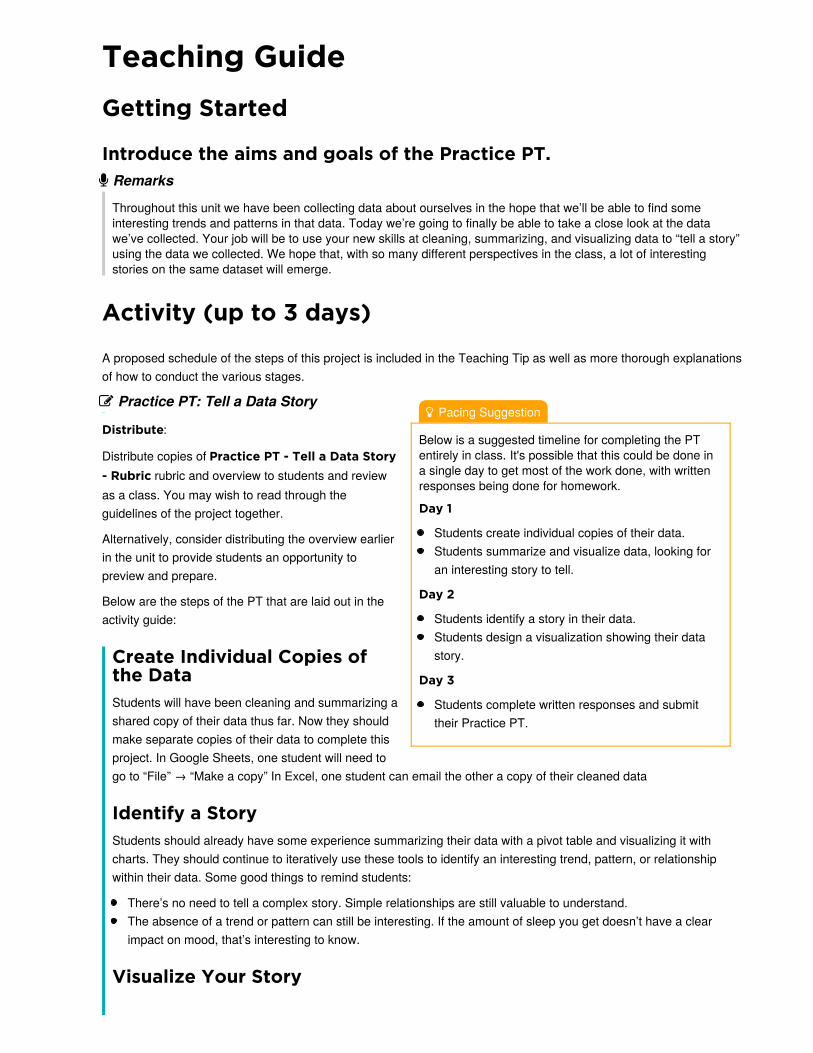
Pacing Suggestion
Below is a suggested timeline for completing the PTentirely in class. It's possible that this could be done ina single day to get most of the work done, with writtenresponses being done for homework.
Day 1
Students create individual copies of their data.Students summarize and visualize data, looking foran interesting story to tell.
Day 2
Students identify a story in their data.Students design a visualization showing their datastory.
Day 3
Students complete written responses and submittheir Practice PT.
Teaching GuideGetting Started
Introduce the aims and goals of the Practice PT. Remarks
Throughout this unit we have been collecting data about ourselves in the hope that we’ll be able to find someinteresting trends and patterns in that data. Today we’re going to finally be able to take a close look at the datawe’ve collected. Your job will be to use your new skills at cleaning, summarizing, and visualizing data to “tell a story”using the data we collected. We hope that, with so many different perspectives in the class, a lot of interestingstories on the same dataset will emerge.
Activity (up to 3 days)
A proposed schedule of the steps of this project is included in the Teaching Tip as well as more thorough explanationsof how to conduct the various stages.
Practice PT: Tell a Data Story
Distribute:
Distribute copies of Practice PT - Tell a Data Story- Rubric rubric and overview to students and reviewas a class. You may wish to read through theguidelines of the project together.
Alternatively, consider distributing the overview earlierin the unit to provide students an opportunity topreview and prepare.
Below are the steps of the PT that are laid out in theactivity guide:
Create Individual Copies ofthe DataStudents will have been cleaning and summarizing ashared copy of their data thus far. Now they shouldmake separate copies of their data to complete thisproject. In Google Sheets, one student will need togo to “File” → “Make a copy” In Excel, one student can email the other a copy of their cleaned data
Identify a StoryStudents should already have some experience summarizing their data with a pivot table and visualizing it withcharts. They should continue to iteratively use these tools to identify an interesting trend, pattern, or relationshipwithin their data. Some good things to remind students:
There’s no need to tell a complex story. Simple relationships are still valuable to understand.The absence of a trend or pattern can still be interesting. If the amount of sleep you get doesn’t have a clearimpact on mood, that’s interesting to know.
Visualize Your Story

Students should once again refer to the Data Visualization 101 guide for tips on how to make clear visualizations.Their chart will have accompanying explanations, but it should be able to “stand on its own” to communicate thestory students have found. Some good things to remind students of:
A fancy chart may actually be worse than a simple and clear one.Creating multiple charts is totally appropriate if they will better communicate the story.Experiment with different chart types. The chart type used to discover the story may not actually be the best onefor visualizing the story.
Complete Written ResponsesIn the Practice PT, students will find responses modeled after those that will appear in the actual AP® PerformanceTasks.
Wrap Up
Submit Practice PTStudents will need to submit their visualization and written responses. Direct students to check the rubric prior tosubmission to ensure they have all the necessary components.
Sharing WorkAs an optional addition to this project, have students share their findings. The visualizations can be placed around theroom for a gallery walk, added to a single shared folder, or presented to the class. This is a good opportunity to seehow different groups cleaned and interpreted the same dataset.
Assessment
RubricUse the provided Practice PT - Tell a Data Story - Rubric rubric, or one of your own creation, to assess students’submissions.
Standards AlignmentComputer Science Principles
1.2 - Computing enables people to use creative development processes to create computational artifacts for creative expression or to
solve a problem.
3.1 - People use computer programs to process information to gain insight and knowledge.
7.3 - Computing has a global affect -- both beneficial and harmful -- on people and society.
If you are interested in licensing Code.org materials for commercial purposes, contact us.
Related Documents