CS 128/ES 228 - Lecture 1 3b 1 Surface Analysis

Welcome message from author
This document is posted to help you gain knowledge. Please leave a comment to let me know what you think about it! Share it to your friends and learn new things together.
Transcript

CS 128/ES 228 - Lecture 13b 1
Surface Analysis
CS 128/ES 228 - Lecture 13b 2
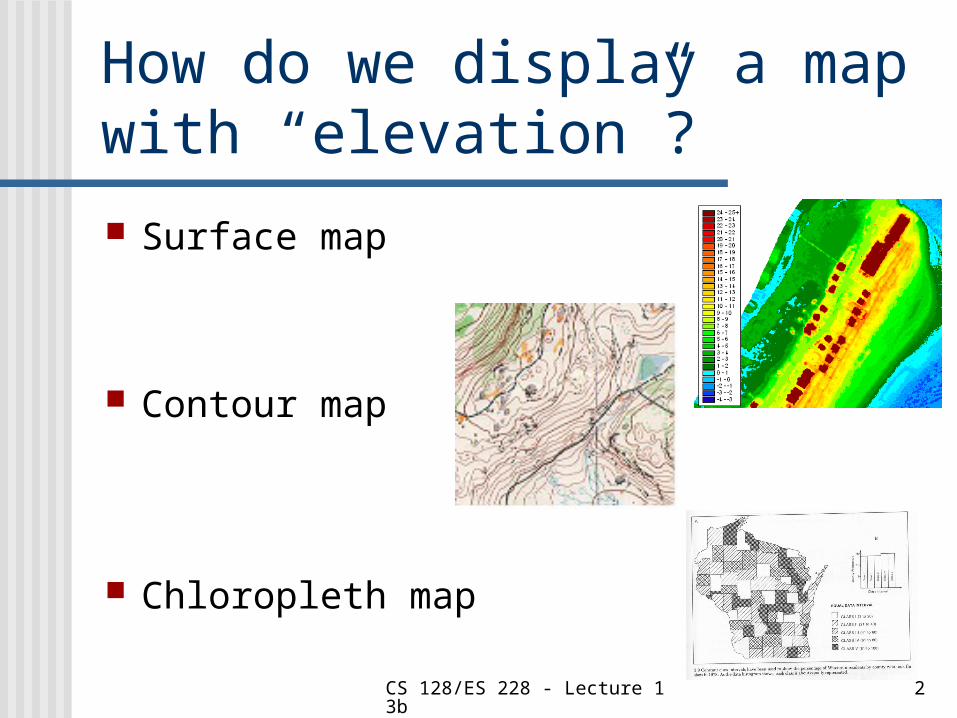
How do we display a map with “elevation”?
Chloropleth map
Contour map
Surface map

CS 128/ES 228 - Lecture 13b 3
Chloropleth maps Show areas of equal “elevation” in a
uniform manner
Are usually “exact” approximations (through aggregation)
Subject to classification issues
Often intimately connected to queries

CS 128/ES 228 - Lecture 13b 4
Simple uses of chloropleths
Ordinal
Population
Per capita income
Crop yield
Categorical
Soil type
Political party control
Primary industry

CS 128/ES 228 - Lecture 13b 5
Display issues for chloropleths Classification
Type
Number of intervals
Colors
CS 128/ES 228 - Lecture 13b 6
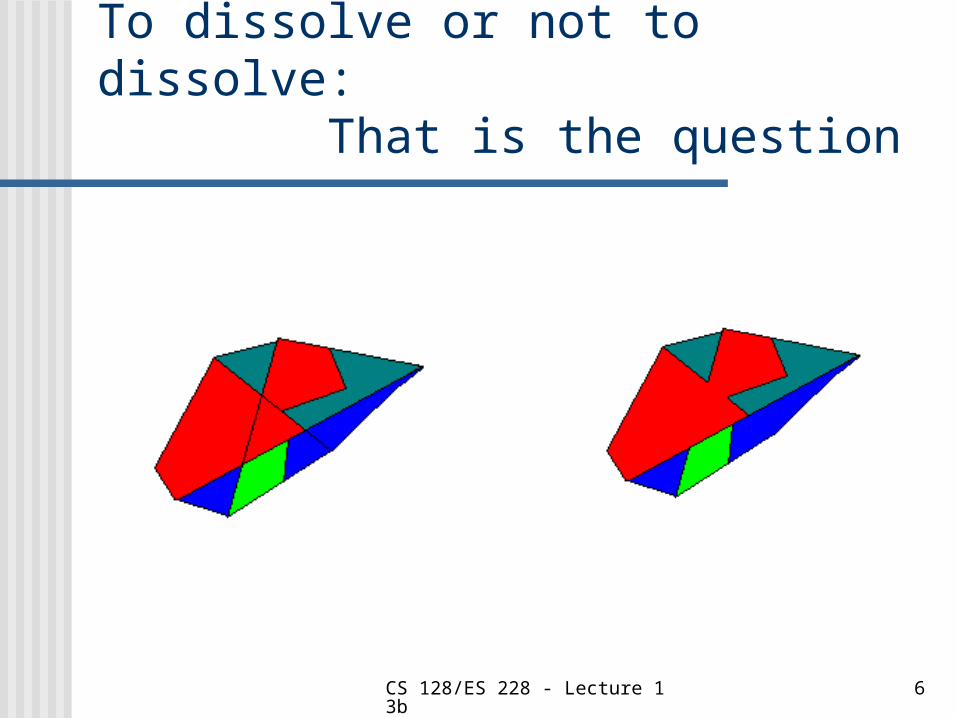
To dissolve or not to dissolve: That is the question

CS 128/ES 228 - Lecture 13b 7
More complex queries using chloropleths Time series data
Population change % of land in agricultural use
Computation driven Total spending power = Average income x population Average wheat yield = Total yield / Number of farms

CS 128/ES 228 - Lecture 13b 8
Basic model for “computed chloropleths” Use a query to create new attribute
data
Set the display to use that new data for computation
Choose remaining display options

CS 128/ES 228 - Lecture 13b 9
A riddle (sans funny punch line) What is the difference between a
chloropleth map and a 2-D query such as “how many points are in this polygon”?
A fine (boundary) line
In truth, it is a matter of style of output.

CS 128/ES 228 - Lecture 13b 10
Voronoi (Theissen) polygons – An important type of chloropleth
Each point is “credited” with the region of points closer to it than to any other point

CS 128/ES 228 - Lecture 13b 11
Dulaunay Triangulation By testing
adjacent regions of the Voronoi diagram, interesting questions can be answered.

CS 128/ES 228 - Lecture 13b 12
“Voronoi” queries Where is the nearest “facility”, e.g.
fire house, hospital, Denny’s restaurant?
Which is the “second best” facility?
What is the largest empty region (to put new store, or toxic dump)

CS 128/ES 228 - Lecture 13b 13
Continuous fields
Requires approximating
Often involves slope and aspect
Commonly used for shading maps
CS 128/ES 228 - Lecture 13b 14
Building “shade” Shaded maps intrinsically include a
“camera” and a “direction”
For “perspective”, color is determined using the dot product of the value of the normal (aspect) and the camera vector (line of sight)
CS 128/ES 228 - Lecture 13b 15
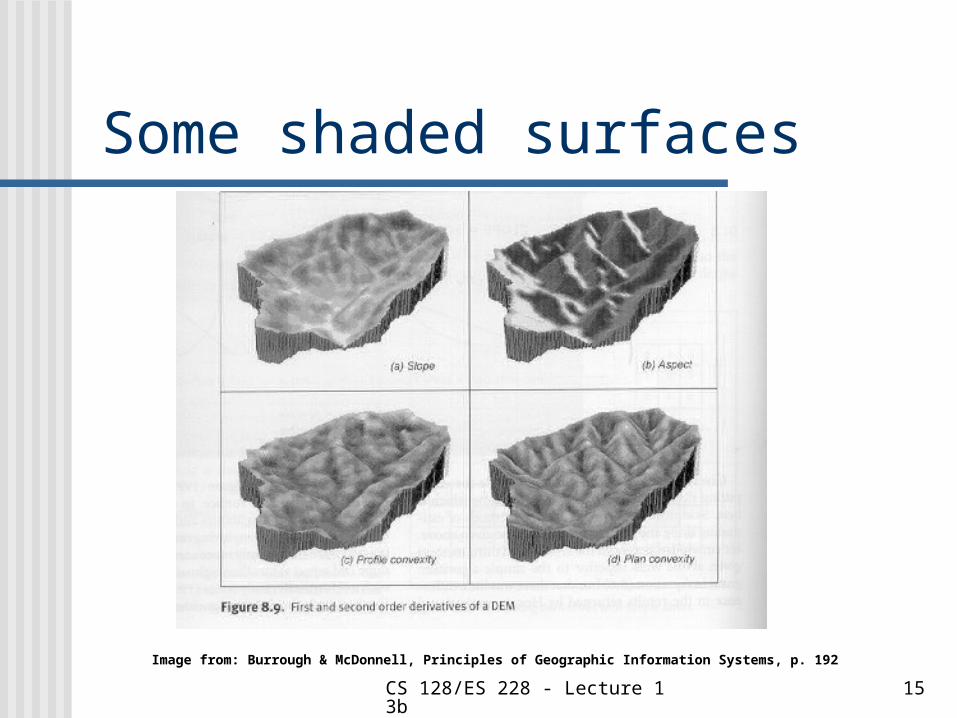
Some shaded surfaces
Image from: Burrough & McDonnell, Principles of Geographic Information Systems, p. 192

CS 128/ES 228 - Lecture 13b 16
Where has all the rainfall gone?
Image from: Burrough & McDonnell, Principles of Geographic Information Systems, p. 194

CS 128/ES 228 - Lecture 13b 17
It’s not calculus Much analysis is done through “cellular”
computation
Conway’s game of Life is an example
http://www.bitstorm.org/gameoflife/
CS 128/ES 228 - Lecture 13b 18
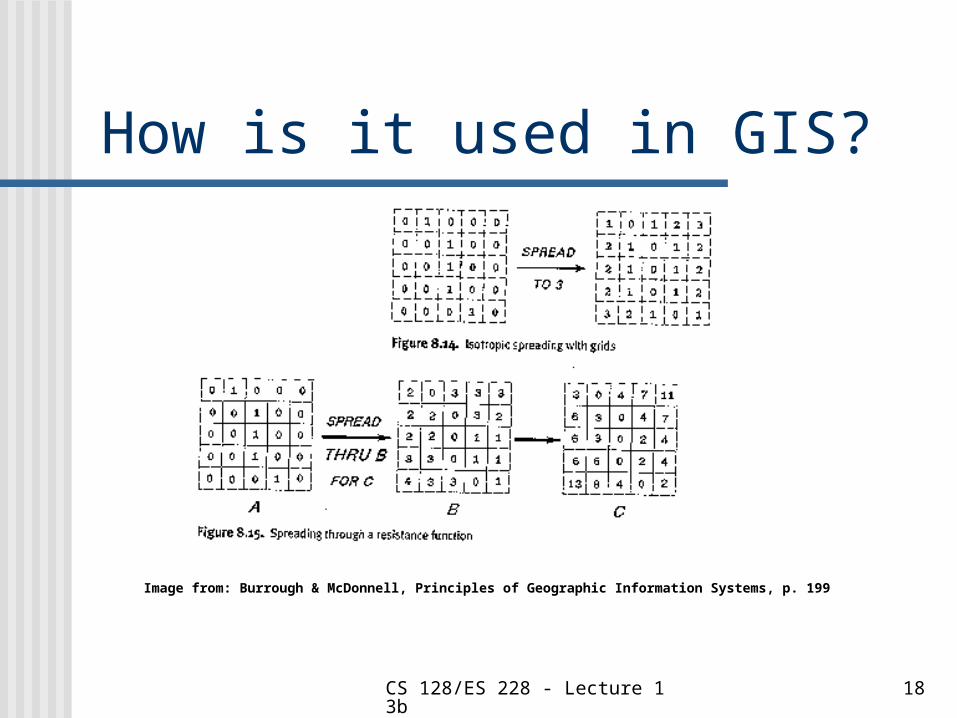
How is it used in GIS?
Image from: Burrough & McDonnell, Principles of Geographic Information Systems, p. 199
CS 128/ES 228 - Lecture 13b 19
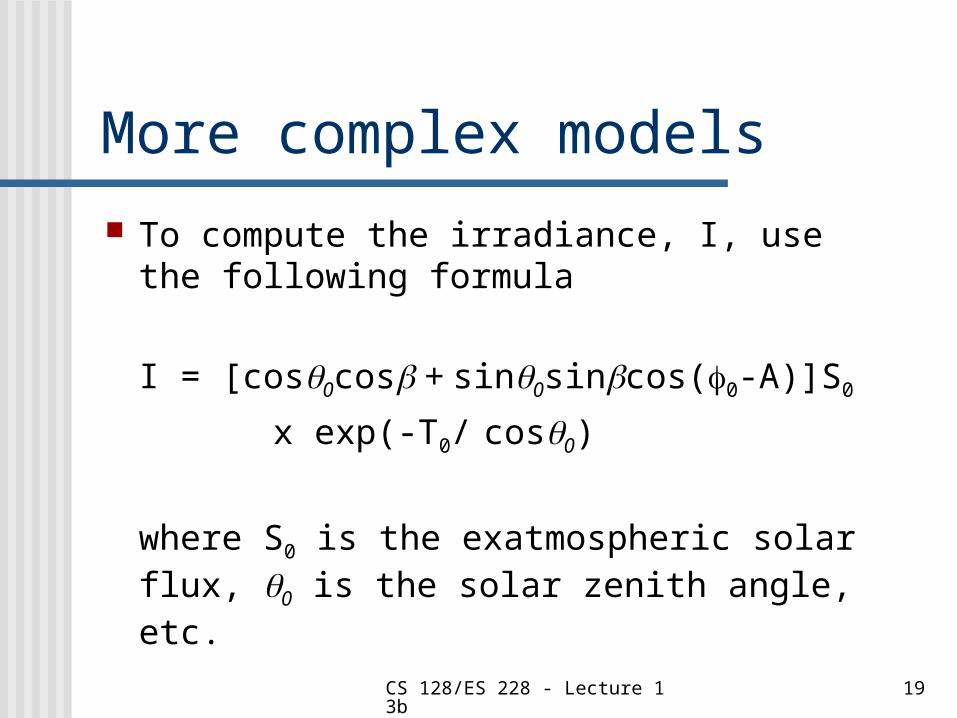
More complex models
To compute the irradiance, I, use the following formula
I = [cos0cos + sin0sincos(0-A)]S0
x exp(-T0/ cos0)
where S0 is the exatmospheric solar flux, 0 is the solar zenith angle, etc.

CS 128/ES 228 - Lecture 13b 20
Conclusions Surface analysis is handy, but
requires Moderately complex database queries,
or Moderately complex mathematics
Fortunately, much of this is “built-in” through wizards (e.g. buffer wizard)

CS 128/ES 228 - Lecture 13b 21
Final thoughts
There is no pithy thought today
Related Documents