Crystal–melt partitioning of noble gases (helium, neon, argon, krypton, and xenon) for olivine and clinopyroxene Veronika S. Heber a, * , Richard A. Brooker b,1 , Simon P. Kelley a , Bernard J. Wood b,2 a Department of Earth Sciences, The Open University, Walton Hall, Milton Keynes MK7 6AA, UK b Department of Earth Sciences, University of Bristol, Wills Memorial Building, Queens Road, Bristol BS8 1RJ, UK Received 24 February 2006; accepted in revised form 1 November 2006 Abstract Mineral–melt partition coefficients of all noble gases ( min/melt D i ) have been obtained for olivine (ol) and clinopyroxene (cpx) by UV laser ablation (213 nm) of individual crystals grown from melts at 0.1 GPa mixed noble gas pressure. Experimental techniques were developed to grow crystals virtually free of melt and fluid inclusions since both have been found to cause profound problems in previous work. This is a particularly important issue for the analysis of noble gases in crystals that have very low partition coefficients relative to coexisting melt and fluid phases. The preferred partitioning values obtained for the ol–melt system for He, Ne, Ar, Kr, and Xe are 0.00017(13), 0.00007(7), 0.0011(6), 0.00026(16), and 0:0006 ðþ9Þ ð6Þ , respectively. The respective cpx–melt partition coefficients are 0.0002(2), 0.00041(35), 0.0011(7), 0.0002(2), and 0:0002 ðþ3Þ ð2Þ . The data confirm the incompatible behaviour of noble gases for both olivine and clinopyroxene but unlike other trace elements these values show little variation for a wide range of atomic radius. The lack of depen- dence of partitioning on atomic radius is, however, consistent with the partitioning behaviour of other trace elements which have been found to exhibit progressively lower dependence of min/melt D i on radius as the charge decreases. As all noble gases appear to exhibit sim- ilar min/melt D i values we deduce that noble gases are not significantly fractionated from each other by olivine and clinopyroxene during melting and fractional crystallisation. Although incompatible, the partitioning values for noble gases also suggest that significant amounts of primordial noble gases may well have been retained in the mantle despite intensive melting processes. The implication of our data is that high primordial/radiogenic noble gas ratios ( 3 He/ 4 He, 22 Ne/ 21 Ne, and 36 Ar/ 40 Ar) characteristic of plume basalt sources can be achieved by recycling a previously melted (depleted) mantle source rather than reflecting an isolated, non-degassed primordial mantle region. Ó 2006 Elsevier Inc. All rights reserved. 1. Introduction Noble gases are among the most important trace ele- ments used by Earth scientists as tools for investigating the geochemical evolution of the earth. Their inertness, their scarcity, and the combination of both radiogenic or nucleogenic, respectively ( 4 He, 21 Ne from 235,238 U, 232 Th; 40 Ar from 40 K and 129 Xe from 129 I) and non-radiogenic (primordial, e.g., 3 He and 36 Ar) isotopes make noble gases ideal tracers for quantifying geochemical and geodynami- cal processes in the mantle, the crust, and the atmosphere (e.g., Porcelli and Wasserburg, 1995; Farley and Neroda, 1998; Kamijo et al., 1998; Ozima and Igarashi, 2000; Por- celli et al., 2001; van Keken et al., 2002; Ballentine et al., 2003). Noble gases are central in a vivid debate concerning the mode(s) of mantle convection over geological timescales. Noble gas isotopic ratios of mantle-derived materials show systematic variations that support large-scale mantle 0016-7037/$ - see front matter Ó 2006 Elsevier Inc. All rights reserved. doi:10.1016/j.gca.2006.11.010 * Corresponding author. Present address: Institute for Isotope Geology and Mineral Resources, ETH Zu ¨rich, 8092 Zu ¨rich, Switzerland. Fax: +41 44 6321179. E-mail address: [email protected] (V.S. Heber). 1 Present address: Department of Earth Sciences, University College London, Gower Street, London WC1E 6BT, UK. 2 Present address: Department of Earth and Planetary Sciences, Macquarie University, NSW 2109, Australia. www.elsevier.com/locate/gca Geochimica et Cosmochimica Acta xxx (2007) xxx–xxx ARTICLE IN PRESS Please cite this article in press as: Heber, V.S. et al., Crystal–melt partitioning of noble gases (helium, neon, argon, ..., Geochim. Cos- mochim. Acta (2007), doi:10.1016/j.gca.2006.11.010

Welcome message from author
This document is posted to help you gain knowledge. Please leave a comment to let me know what you think about it! Share it to your friends and learn new things together.
Transcript
ARTICLE IN PRESS
www.elsevier.com/locate/gca
Geochimica et Cosmochimica Acta xxx (2007) xxx–xxx
Crystal–melt partitioning of noble gases (helium, neon, argon,krypton, and xenon) for olivine and clinopyroxene
Veronika S. Heber a,*, Richard A. Brooker b,1, Simon P. Kelley a, Bernard J. Wood b,2
a Department of Earth Sciences, The Open University, Walton Hall, Milton Keynes MK7 6AA, UKb Department of Earth Sciences, University of Bristol, Wills Memorial Building, Queens Road, Bristol BS8 1RJ, UK
Received 24 February 2006; accepted in revised form 1 November 2006
Abstract
Mineral–melt partition coefficients of all noble gases (min/meltDi) have been obtained for olivine (ol) and clinopyroxene (cpx) by UVlaser ablation (213 nm) of individual crystals grown from melts at 0.1 GPa mixed noble gas pressure. Experimental techniques weredeveloped to grow crystals virtually free of melt and fluid inclusions since both have been found to cause profound problems in previouswork. This is a particularly important issue for the analysis of noble gases in crystals that have very low partition coefficients relative tocoexisting melt and fluid phases. The preferred partitioning values obtained for the ol–melt system for He, Ne, Ar, Kr, and Xe are0.00017(13), 0.00007(7), 0.0011(6), 0.00026(16), and 0:0006ðþ9Þ
ð�6Þ, respectively. The respective cpx–melt partition coefficients are0.0002(2), 0.00041(35), 0.0011(7), 0.0002(2), and 0:0002ðþ3Þ
ð�2Þ. The data confirm the incompatible behaviour of noble gases for both olivineand clinopyroxene but unlike other trace elements these values show little variation for a wide range of atomic radius. The lack of depen-dence of partitioning on atomic radius is, however, consistent with the partitioning behaviour of other trace elements which have beenfound to exhibit progressively lower dependence of min/meltDi on radius as the charge decreases. As all noble gases appear to exhibit sim-ilar min/meltDi values we deduce that noble gases are not significantly fractionated from each other by olivine and clinopyroxene duringmelting and fractional crystallisation. Although incompatible, the partitioning values for noble gases also suggest that significantamounts of primordial noble gases may well have been retained in the mantle despite intensive melting processes. The implication ofour data is that high primordial/radiogenic noble gas ratios (3He/4He, 22Ne/21Ne, and 36Ar/40Ar) characteristic of plume basalt sourcescan be achieved by recycling a previously melted (depleted) mantle source rather than reflecting an isolated, non-degassed primordialmantle region.� 2006 Elsevier Inc. All rights reserved.
1. Introduction
Noble gases are among the most important trace ele-ments used by Earth scientists as tools for investigatingthe geochemical evolution of the earth. Their inertness,
0016-7037/$ - see front matter � 2006 Elsevier Inc. All rights reserved.
doi:10.1016/j.gca.2006.11.010
* Corresponding author. Present address: Institute for Isotope Geologyand Mineral Resources, ETH Zurich, 8092 Zurich, Switzerland. Fax: +4144 6321179.
E-mail address: [email protected] (V.S. Heber).1 Present address: Department of Earth Sciences, University College
London, Gower Street, London WC1E 6BT, UK.2 Present address: Department of Earth and Planetary Sciences,
Macquarie University, NSW 2109, Australia.
Please cite this article in press as: Heber, V.S. et al., Crystal–melt pamochim. Acta (2007), doi:10.1016/j.gca.2006.11.010
their scarcity, and the combination of both radiogenic ornucleogenic, respectively (4He, 21Ne from 235,238U, 232Th;40Ar from 40K and 129Xe from 129I) and non-radiogenic(primordial, e.g., 3He and 36Ar) isotopes make noble gasesideal tracers for quantifying geochemical and geodynami-cal processes in the mantle, the crust, and the atmosphere(e.g., Porcelli and Wasserburg, 1995; Farley and Neroda,1998; Kamijo et al., 1998; Ozima and Igarashi, 2000; Por-celli et al., 2001; van Keken et al., 2002; Ballentine et al.,2003). Noble gases are central in a vivid debate concerningthe mode(s) of mantle convection over geologicaltimescales.
Noble gas isotopic ratios of mantle-derived materialsshow systematic variations that support large-scale mantle
rtitioning of noble gases (helium, neon, argon, ..., Geochim. Cos-
2 V.S. Heber et al. xxx (2007) xxx–xxx
ARTICLE IN PRESS
heterogeneities. Indeed, basalts erupted along mid-oceanridges (MORB) appear to define a limited variation inthe isotopic composition of helium. Lavas and fluids asso-ciated with mantle plume domains (such as ocean islandbasalts—OIB) present much more variable 3He/4He valuesand have been interpreted as representing a mantle domainless degassed than the convective mantle feeding mid-oceanridge magmatism and, because of its association with man-tle plumes, located at a greater depth than the MORBsource. This view is consistent with geochemical modelsadvocating a convectively layered mantle over much ofthe Earth’s history (e.g., Kaneoka, 1983; O’Nions, 1987;Allegre et al., 1987; Farley and Neroda, 1998; Allegreand Moreira, 2004). However, recent advances in seismictomography indicate that plates can be subducted well be-low the 670 km discontinuity down to the core-mantleboundary (e.g., van der Hilst et al., 1997; Bijwaard andSpakman, 1998; Fukao et al., 2001), and numerical model-ling of mantle convection patterns (van Keken and Ballen-tine, 1999) cast doubt upon the likelihood of maintaining adeep region of the mantle isolated over geological time-scales. An additional observation challenging the view ofa less degassed mantle domain isolated from a degassedupper mantle is that plume-related samples containgenerally lower noble gas concentrations than MORB(e.g., Farley and Neroda, 1998; Ozima and Igarashi, 2000).
In order to reconcile these apparently contradictoryviews, it has been proposed that noble gases might be frac-tionated from other trace elements during melt extractionfrom the mantle (e.g., Albarede, 1998; Ballentine et al.,2002; Meibom et al., 2003; Class and Goldstein, 2005). Inthis way, noble-gas/radioactive isotope ratios (e.g., 3He/(235,238U + 232Th)) may fractionate to produce low3He/4He ratios in MORB compared to OIB values whenintegrated over long times. In this scenario, high 3He/4Heratios in plume-related basalts might reflect the influenceof a recycled, previously depleted mantle in the source(Graham et al., 1990; Brooker et al., 2003b). A preferentialdepletion in U and Th compared to the depletion of noblegases would result in relatively unradiogenic He isotopiccomposition associated with low He abundances observedin OIB.
Available data for noble gas partition coefficients(min/meltDi, expressed as the ratio of weight concentrationof a noble gas i in the mineral and in the melt) allow theexploration of these scenarios quantitatively. Estimatesbased on the analysis of noble gases in coexisting mineralphases and glass of MORB suggested that these elementsare very incompatible (Kurz et al., 1982; Marty and Lus-siez, 1993; Valbracht et al., 1994), the upper limits forol/meltDHe and ol/meltDAr measured in natural olivine/basaltic melt being 0.008 and 0.003, respectively (Martyand Lussiez, 1993). In contrast, pioneering experiments todetermine noble gas partition coefficients between syntheticmineral phases and silicate melt yielded variable and frac-tionated min/meltDi values suggestive of slightly incompati-ble or even compatible behaviour for all noble gases
Please cite this article in press as: Heber, V.S. et al., Crystal–melt pamochim. Acta (2007), doi:10.1016/j.gca.2006.11.010
(Hiyagon and Ozima, 1986; Broadhurst et al., 1992; Shiba-ta et al., 1994). In several of these experiments compatibil-ity was observed to increase with increasing noble gasatomic radii. However, these results are now generally be-lieved to have been affected by experimental artefacts suchas adsorption of heavy noble gases on powdered samples,contamination of separated mineral phases by residualglass, and trapping of noble gases in fluid inclusions duringmineral growth (Ozima and Podosek, 2002). The develop-ment of ‘in situ’ analysis by UV laser ablation (Kelley et al.,1994) has provided a technique to circumvent many ofthese problems. This technique was successfully appliedto determine partition coefficients of Ne to Xe betweenclinopyroxene and melt and Ar between olivine and melt(Brooker et al., 1998, 2003a; Chamorro et al., 2002). Thesestudies have suggested low D values between 10�4 and 10�2
over a range of clinopyroxene compositions, pressure (0.1–8 GPa) and temperature (1200–1665 �C). Recent experi-ments by Parman et al. (2005) measuring the He solubilityin olivines appear to support the incompatible behaviourfor He (ol/meltDHe: 0.0025–0.006).
Here, we report results of new experiments on olivine–silicate melt partitioning of noble gases and provide newgas analyses of the clinopyroxene and glass (RB586) previ-ously analysed by Brooker et al. (2003a) but now includingdata for He. We present here for the first time a completedata set of olivine–melt (ol/meltDi) and clinopyroxene–melt(cpx/meltDi) partition coefficients for all noble gases obtainedby UV laser ablation, and provide noble gas D values fortwo major crystalline phases of the Earth’s mantle thatare important to reveal bulk noble gas partitioning coeffi-cients as function of mantle composition. Since the studyof Brooker et al. (2003a), we have further developed theUV laser technique by introducing a 213 nm laser equippedwith a new optical system leading to a more precise controlon ablation, and a detailed characterisation of individualcrystals prior to and during analysis. Compared to previ-ous UV laser ablation studies (Brooker et al., 1998,2003a; Chamorro et al., 2002), this system allows a morerigorous spatial control on the ablated phase, preventingaccidental ablation of glass or fluid and melt inclusions.These developments allow us to measure very low Heabundances and low partition coefficients that are charac-teristic of mantle mineral phases. In summary, the parti-tioning data enable us to characterise the absolute andrelative degree of fractionation of light and heavy noblegases (He, Ar, and Xe) as well as their radioactive parents(U, Th, and K).
2. Experimental and analytical techniques
2.1. Starting materials and experimental techniques
General experimental techniques are described here. Details are givenin Section 2.1.1 for the olivine (N2SFo) and in Section 2.1.2 for theclinopyroxene (Di60Ab40) experiment. A discussion of the approach toreach equilibrium conditions for both crystals and melts is given inAppendix A.1.
rtitioning of noble gases (helium, neon, argon, ..., Geochim. Cos-
Crystal–melt partitioning of noble gases for olivine and cpx 3
ARTICLE IN PRESS
Starting materials for experiments were glasses prepared from reagentgrade oxides (SiO2, MgO, and Al2O3) and carbonate (CaCO3, Na2CO3)for the clinopyroxene experiment (RB586, RB585) or spec-pure grade forthree olivine experiments (RB587, RB588, and RB589). These mixtureswere decarbonated and then melted in a vertical tube furnace. Startingmaterials have a nominal composition of 60:40 mol% diopside: albite(Di60Ab40) for the clinopyroxene experiment and 66.6:33.3 mol% sodiumdisilicate (Na2Si2O5): forsterite (Mg2SiO4) (N2SFo) for the three olivineexperiments. The Di60Ab40 glass was doped with a cocktail of trace ele-ments in order to compare the experiments with earlier work on traceelement partitioning in olivine and clinopyroxene, then remelted and re-ground through a number of cycles. Further, the spec-pure N2SFo glasswas split into three aliquots, RB588 was doped with 200 ppm Sc, RB589with 200 ppm Ti and RB587 left undoped. Sc and Ti were added toinvestigate the possibility that a charge-balancing cation mechanism couldhave a significant effect on the partitioning values (see Brooker et al.,2003a). Major and trace elements measured by electron microprobeanalysis (EMPA) for the Di60Ab40 starting material (RB585) and theN2SFo run products after �10% crystallisation are presented in Table 1.The trace element partition coefficients of RB586 were reported byBrooker et al. (2003a).
Starting materials were loaded into platinum capsules that were leftopen to the noble gas pressure medium. Crystals were grown by coolingslowly from above the liquidus in a high-pressure noble gas atmosphereusing a TZM (titanium–zirconium–molybdenum) rapid quench cold-sealvessel (University of Bristol). Temperature was controlled using a Euro-therm programmable controller. The measured composition of the gasphase was 24.6–23.2–25.0–22.2–5.0 mol% for He–Ne–Ar–Kr–Xe, respec-tively. At the end of the experiments the samples were quenched (>200 �C/s) by rapidly lowering the sample into the water-cooled section of thevessel using an external magnet.
Selected fragments of quenched samples containing both crystal andmelt phases were mounted in dental resin and �0.5 mm thick doublypolished sections were prepared (Brooker et al., 1998). Thus, we avoidedthe standard practice of using heated glue to mount/demount sections onglass sides. As will be shown below heating would have caused significantdiffusive He loss from the glass phase. As a consequence, all preparationtechniques were undertaken at room temperature. Several fragments were
Table 1Electron microprobe analyses of starting materials and run products
Starting mix Run products
Di60Ab40 N2SFoa RB586 RB
Glass Cpx Gl
No. of analyses 30 7 12 7
wt%
SiO2 63.9(6) 59.50 64.6(7) 55.0(5) 61Al2O3 11.5(1) 13.5(4) 0.91(13) n.aFeO b.d. n.a. n.a. b.dMgO 6.7(2) 15.95 4.45(4) 19.2(3) 14CaO 10.4(3) 8.3(3) 24.9(3) n.aNa2O 7.1(1) 24.50 8.1(3) 0.36(6) 23K2O 0.06(1) b.d. b.d. n.aTotal 99.64 99.66 100.31 99
ppm
Sc n.a. b.d. b.d. n.aTi n.a. b.d. b.d. b.d
Numbers in parentheses given here and in following tables represent 1 � r uncand run products (N2SFo) were analysed using Cameca SX100 at Open UnivGlass analyses: 20 keV, 20 nA, beam size 30 lm, 5 s on each Na, Mg, Si; 15 sCrystal analyses: 20 keV, 20 nA, beam size 10 lm, 10 s on each Na, Mg, Si; 3
n.a., not analysed; b.d., below detection.a Nominal composition.
Please cite this article in press as: Heber, V.S. et al., Crystal–melt pamochim. Acta (2007), doi:10.1016/j.gca.2006.11.010
selected from a given experiment, each containing reasonably-sized crys-tals (�100 lm) for laser ablation. The samples were ultrasonically cleanedin acetone, methanol and finally deionised water.
As with other attempts to experimentally determine noble gas min/
meltDi (Hiyagon and Ozima, 1986; Brooker et al., 1998; Chamorro et al.,2002), there are several challenges that needed to be overcome in order toachieve reproducible results. In particular, the presence of fluid and/ormelt inclusions was a major problem for analysis, whether in the crystals(see below), or in the melt where larger bubbles leaked He and Ne con-tinuously into the vacuum system. It was also necessary to test foradsorption and absorption on mineral surfaces that could have lead toenhanced min/meltDi values. Finally, the size and shape of crystals is criticalfor the laser ablation technique. On the one hand crystals need to be largeenough to allow ablation of volumes that release measurable amounts ofgas, while on the other they have to be grown sufficiently slowly to remainin equilibrium with the melt. As a result, a number of experimental pro-tocols were developed to improve the accuracy of the experimental data.
2.1.1. N2SFo experiments
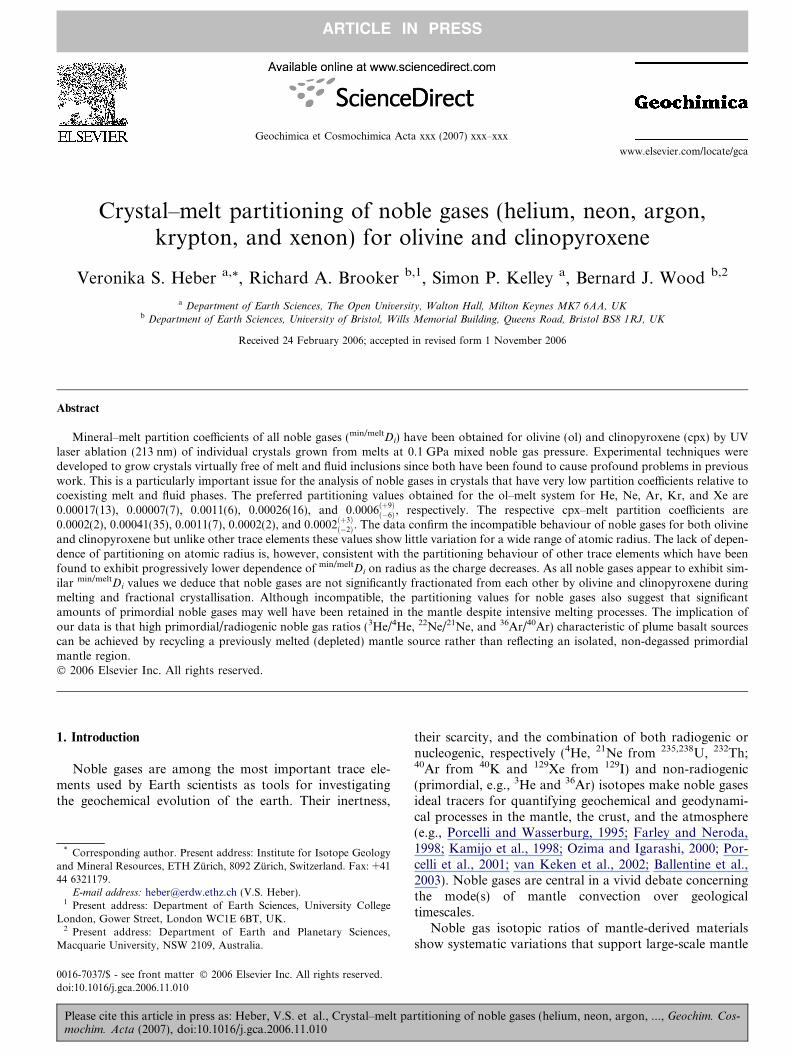
The sodium disilicate–forsterite system (N2SFo) was selected for theolivine growth experiment because alkali-rich melts tend to have very lowviscosities (Dingwell et al., 1998) allowing bubbles to escape more easilythan from melts of high viscosity. Furthermore, the liquidus temperaturefor the selected starting composition is low (approximately 1035 �C, andthus comfortably below the limit of the operating range of the TZMvessel). This material was loaded as a powder (grain size <25 lm) andmelted in a noble gas atmosphere of �101 MPa. This procedure has theadvantage that the noble gas pressure medium is distributed throughoutthe sample as it melts, reducing the time required for equilibration of themelt. Since for analyses of noble gases bubbles are problematic, wedeveloped a method which we found minimised the bubble content of themelt and the coexisting olivine crystals. Glasses quenched from melts thathad been held for 5 h above the liquidus did not contain any bubbles.However, as samples were cooled below the liquidus at constant pressure,bubbles developed within or on the surface of the growing crystals asshown in Fig. 1 for an earlier sample (RB571, not considered in thisstudy), even though the rest of the glass appeared to be bubble-free.RB571 was held above the liquidus for 7 h, then cooled isobarically from
587 RB588 RB589
ass Olivine Glass Olivine Glass Olivine
8 16 9 14 4
.2(6) 42.6(4) 60.5(7) 42.9(1.4) 57.7(8) 42.8(1.5). n.a. n.a. n.a. n.a. n.a.. b.d. b.d. b.d. b.d. b.d.
.6(2) 56.7(2) 15.5(1) 57.0(7) 15.6(2) 55.5(1.4). n.a. n.a. n.a. n.a. n.a.
.4(2) 0.008(5) 24.3(2) 0.027(11) 23.3(3) 0.003(3). n.a. n.a. n.a. n.a. n.a.
.18 99.33 100.37 100.11 96.61 98.3
. n.a. 234(35) 624(243) n.a. n.a.
. b.d. n.a. n.a. 199(71) 30(35)
ertainties in units of the least significant digit. Starting material (Di60An40)ersity. Composition of RB586 run products from Brooker et al. (2003a).on Ti or Sc and Fe.0 s on Ti or Sc and Fe.
rtitioning of noble gases (helium, neon, argon, ..., Geochim. Cos-
Fig. 1. Optical microscope image of RB571. Bubbles seen around theolivine (ol) edge with trails extending into the crystal interior. Acomparison with Fig. 3 shows the success of the different experimentalapproach for the RB587–589 samples in producing bubble-free olivinecrystals.
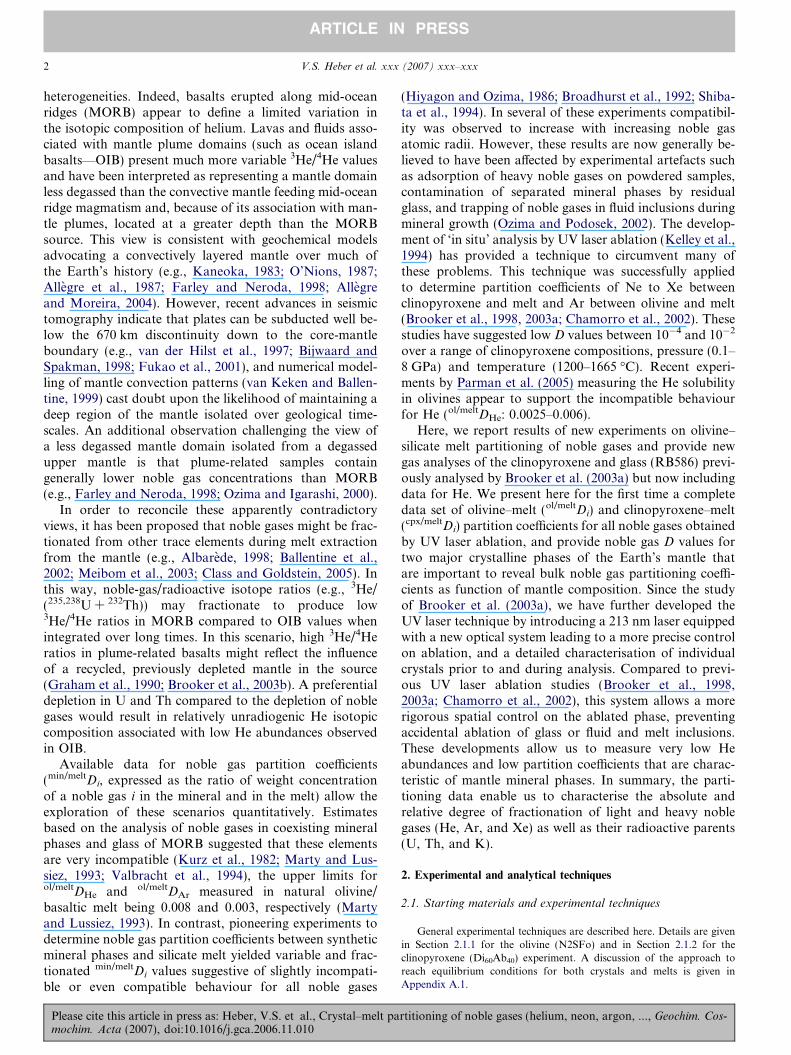
Fig. 2. Optical microscope image in reflected light of RB588A (A) andRB586A (B), showing the different morphologies of the olivine (ol) and theclinopyroxene (cpx) crystals.
4 V.S. Heber et al. xxx (2007) xxx–xxx
ARTICLE IN PRESS
1040 to 1005 �C at 0.6 �C/h. Such a temperature decrease might have re-duced the solubility of noble gases in the melt, resulting in preferentialbubble nucleation along the mineral surfaces. Many bubbles were ob-served around the edges of crystals with trails extending into the crystalinterior (Fig. 1), suggesting that the bubbles were formed during an earlystage of growth. To minimise bubble growth subsequent experimentsemployed an increase of pressure by 10% at the initial stages of crystalgrowth. This significantly reduced bubble formation (see Figs. 2 and 3).The RB587–589 samples were run together and held at 1165 �C for 1 h thencooled over 3 h to 1045 �C, while maintaining the gas pressure of�101 MPa.The pressure was then increased to 111.2 MPa and the samples cooled at0.6 �C/h to 990 �C ensuring that the pressure was not allowed to drop below109 MPa. Finally, the samples were left at these conditions for 6 h. Thisprocess produced very equant crystals almost free of melt or fluid inclusions(Figs. 2 and 3). Occasional gas bubbles identified in the olivine crystals weregenerally around 5 lm in diameter, but we cannot exclude the possibilitythat smaller, sub-microscopic bubbles existed.
2.1.2. Di60Ab40 experiments
Pilot clinopyroxene growth experiments were undertaken using pow-dered glass as starting material, which was loaded into the Pt capsule andmelted at pressure to introduce noble gases into the resulting liquid. At thechosen run conditions, the quenched glasses always contained bubblesranging in size from <5 to 200 lm. It may be that such bubbles were re-tained from the initial voids in the starting powder and were capturedduring crystal growth. The concentration of bubbles was greater if sampleswere taken directly to the final temperature rather than cooled from abovethe liquidus, and in addition, the crystals were smaller or non-euhedral inthe former cases. To counteract the bubble problem, the glass powder wasloaded into the capsule and heated to 1530 �C, above the liquidus in a1 atm tube furnace (i.e., in air) for 1 h. This procedure removed nearly allbubbles due to the low viscosity (and/or low gas pressure). The melt wasquenched to a glass and retained in the capsule. Two samples prepared thisway were then loaded into the TZM vessel and subjected to a noble gaspressure of 102 MPa at a super-liquidus temperature of 1285 �C. Thecapsules of RB585 and RB586 were 12 and 3 mm long, respectively (thelength of RB585 was intended as a diffusion test). A time of 9 h was al-lowed for the noble gases to diffuse into the melt from the surface. Theexperiment was quenched at this point and RB585 was removed todetermine noble gas diffusion rates (see Appendix A.1). The sample RB586was then reloaded into the TZM vessel and taken back to 1290 �C at aslightly higher gas pressure of 112 (±1) MPa for the crystal growthexperiment. Although this requires a slight re-equilibration for the fluid, it
Please cite this article in press as: Heber, V.S. et al., Crystal–melt pamochim. Acta (2007), doi:10.1016/j.gca.2006.11.010
assures that any remaining bubbles dissolve and any bubble nucleation orgrowth during the initial cooling stage is inhibited. RB586 was heated to1290 �C for 30 min, then cooled in a series of steps to 1272 �C (still abovethe liquidus) over a 1 h period. The temperature was then decreased at arate of 1.2 �C/h to the approximate liquidus temperature of 1260 �C, andsubsequently cooled from 1260 to 1200 �C at a cooling rate of 0.6 �C/h togrow the crystals. The melt was held at these final conditions for 6 h.Crystals grown by this method were generally bubble-free (Fig. 2B).
2.2. Noble gas analyses and data processing
All UV laser ablation analyses were carried out at the Open University.The NewWave UP213 combined laser/microscope system uses a pulsedquintupled Nd:Yag laser (k = 213 nm) with a pulse duration of 4 ns, arepetition rate of 10 Hz, and rastering velocity of 10 or 20 lm/s. The laserenergy used in these experiments depended upon the analysed material andvaried between 3 J/cm2 for glass and 10–15 J/cm2 for crystals. A laserbeam of 8 lm in diameter was used to produce precisely targeted, rect-angular raster areas, about 5 lm deep, that were positioned in regionsdevoid of fluid and melt inclusions (Fig. 3C). The duration of laserablation varied depending on the area of a raster (ranging from 1500 up toabout 4000 lm2) and depth from 6 min for glass to 3–10 min for crystals.Further details regarding the UV laser technique can be found in Kelleyet al. (1994).
The extracted gas was cleaned using three SAES AP-10 getters to re-move active gases before analysing noble gases with a MAP 215-50 noblegas mass spectrometer. Noble gas isotopes 4He, 22Ne, 40Ar, 84Kr, 132Xe, aswell as 44CO2 were analysed in one measurement series using a multipliercollector, as abundances were low and similar for all gases and hence nolinearity problems were encountered. Mass 22 was corrected for interfer-
rtitioning of noble gases (helium, neon, argon, ..., Geochim. Cos-
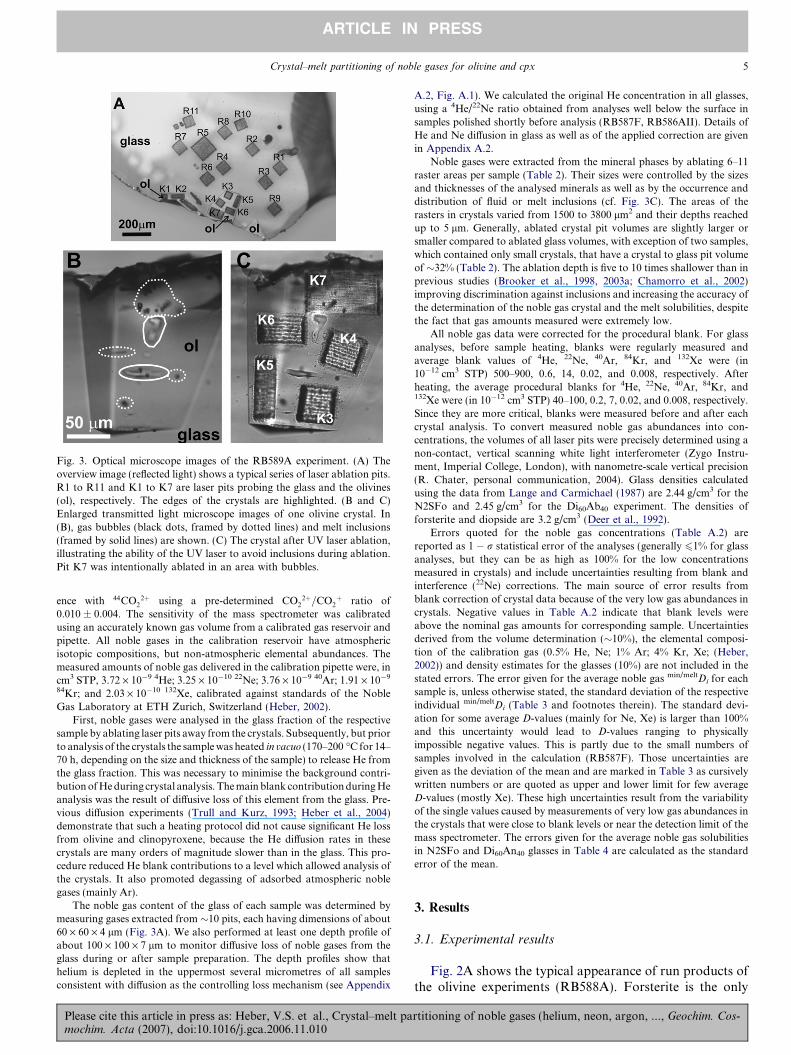
Fig. 3. Optical microscope images of the RB589A experiment. (A) Theoverview image (reflected light) shows a typical series of laser ablation pits.R1 to R11 and K1 to K7 are laser pits probing the glass and the olivines(ol), respectively. The edges of the crystals are highlighted. (B and C)Enlarged transmitted light microscope images of one olivine crystal. In(B), gas bubbles (black dots, framed by dotted lines) and melt inclusions(framed by solid lines) are shown. (C) The crystal after UV laser ablation,illustrating the ability of the UV laser to avoid inclusions during ablation.Pit K7 was intentionally ablated in an area with bubbles.
Crystal–melt partitioning of noble gases for olivine and cpx 5
ARTICLE IN PRESS
ence with 44CO22þ using a pre-determined CO2
2þ=CO2þ ratio of
0.010 ± 0.004. The sensitivity of the mass spectrometer was calibratedusing an accurately known gas volume from a calibrated gas reservoir andpipette. All noble gases in the calibration reservoir have atmosphericisotopic compositions, but non-atmospheric elemental abundances. Themeasured amounts of noble gas delivered in the calibration pipette were, incm3 STP, 3.72 · 10�9 4He; 3.25 · 10�10 22Ne; 3.76 · 10�9 40Ar; 1.91 · 10�9
84Kr; and 2.03 · 10�10 132Xe, calibrated against standards of the NobleGas Laboratory at ETH Zurich, Switzerland (Heber, 2002).
First, noble gases were analysed in the glass fraction of the respectivesample by ablating laser pits away from the crystals. Subsequently, but priorto analysis of the crystals the sample was heated in vacuo (170–200 �C for 14–70 h, depending on the size and thickness of the sample) to release He fromthe glass fraction. This was necessary to minimise the background contri-bution of He during crystal analysis. The main blank contribution during Heanalysis was the result of diffusive loss of this element from the glass. Pre-vious diffusion experiments (Trull and Kurz, 1993; Heber et al., 2004)demonstrate that such a heating protocol did not cause significant He lossfrom olivine and clinopyroxene, because the He diffusion rates in thesecrystals are many orders of magnitude slower than in the glass. This pro-cedure reduced He blank contributions to a level which allowed analysis ofthe crystals. It also promoted degassing of adsorbed atmospheric noblegases (mainly Ar).
The noble gas content of the glass of each sample was determined bymeasuring gases extracted from �10 pits, each having dimensions of about60 · 60 · 4 lm (Fig. 3A). We also performed at least one depth profile ofabout 100 · 100 · 7 lm to monitor diffusive loss of noble gases from theglass during or after sample preparation. The depth profiles show thathelium is depleted in the uppermost several micrometres of all samplesconsistent with diffusion as the controlling loss mechanism (see Appendix
Please cite this article in press as: Heber, V.S. et al., Crystal–melt pamochim. Acta (2007), doi:10.1016/j.gca.2006.11.010
A.2, Fig. A.1). We calculated the original He concentration in all glasses,using a 4He/22Ne ratio obtained from analyses well below the surface insamples polished shortly before analysis (RB587F, RB586AII). Details ofHe and Ne diffusion in glass as well as of the applied correction are givenin Appendix A.2.
Noble gases were extracted from the mineral phases by ablating 6–11raster areas per sample (Table 2). Their sizes were controlled by the sizesand thicknesses of the analysed minerals as well as by the occurrence anddistribution of fluid or melt inclusions (cf. Fig. 3C). The areas of therasters in crystals varied from 1500 to 3800 lm2 and their depths reachedup to 5 lm. Generally, ablated crystal pit volumes are slightly larger orsmaller compared to ablated glass volumes, with exception of two samples,which contained only small crystals, that have a crystal to glass pit volumeof �32% (Table 2). The ablation depth is five to 10 times shallower than inprevious studies (Brooker et al., 1998, 2003a; Chamorro et al., 2002)improving discrimination against inclusions and increasing the accuracy ofthe determination of the noble gas crystal and the melt solubilities, despitethe fact that gas amounts measured were extremely low.
All noble gas data were corrected for the procedural blank. For glassanalyses, before sample heating, blanks were regularly measured andaverage blank values of 4He, 22Ne, 40Ar, 84Kr, and 132Xe were (in10�12 cm3 STP) 500–900, 0.6, 14, 0.02, and 0.008, respectively. Afterheating, the average procedural blanks for 4He, 22Ne, 40Ar, 84Kr, and132Xe were (in 10�12 cm3 STP) 40–100, 0.2, 7, 0.02, and 0.008, respectively.Since they are more critical, blanks were measured before and after eachcrystal analysis. To convert measured noble gas abundances into con-centrations, the volumes of all laser pits were precisely determined using anon-contact, vertical scanning white light interferometer (Zygo Instru-ment, Imperial College, London), with nanometre-scale vertical precision(R. Chater, personal communication, 2004). Glass densities calculatedusing the data from Lange and Carmichael (1987) are 2.44 g/cm3 for theN2SFo and 2.45 g/cm3 for the Di60Ab40 experiment. The densities offorsterite and diopside are 3.2 g/cm3 (Deer et al., 1992).
Errors quoted for the noble gas concentrations (Table A.2) arereported as 1 � r statistical error of the analyses (generally 61% for glassanalyses, but they can be as high as 100% for the low concentrationsmeasured in crystals) and include uncertainties resulting from blank andinterference (22Ne) corrections. The main source of error results fromblank correction of crystal data because of the very low gas abundances incrystals. Negative values in Table A.2 indicate that blank levels wereabove the nominal gas amounts for corresponding sample. Uncertaintiesderived from the volume determination (�10%), the elemental composi-tion of the calibration gas (0.5% He, Ne; 1% Ar; 4% Kr, Xe; (Heber,2002)) and density estimates for the glasses (10%) are not included in thestated errors. The error given for the average noble gas min/meltDi for eachsample is, unless otherwise stated, the standard deviation of the respectiveindividual min/meltDi (Table 3 and footnotes therein). The standard devi-ation for some average D-values (mainly for Ne, Xe) is larger than 100%and this uncertainty would lead to D-values ranging to physicallyimpossible negative values. This is partly due to the small numbers ofsamples involved in the calculation (RB587F). Those uncertainties aregiven as the deviation of the mean and are marked in Table 3 as cursivelywritten numbers or are quoted as upper and lower limit for few averageD-values (mostly Xe). These high uncertainties result from the variabilityof the single values caused by measurements of very low gas abundances inthe crystals that were close to blank levels or near the detection limit of themass spectrometer. The errors given for the average noble gas solubilitiesin N2SFo and Di60An40 glasses in Table 4 are calculated as the standarderror of the mean.
3. Results
3.1. Experimental results
Fig. 2A shows the typical appearance of run products ofthe olivine experiments (RB588A). Forsterite is the only
rtitioning of noble gases (helium, neon, argon, ..., Geochim. Cos-
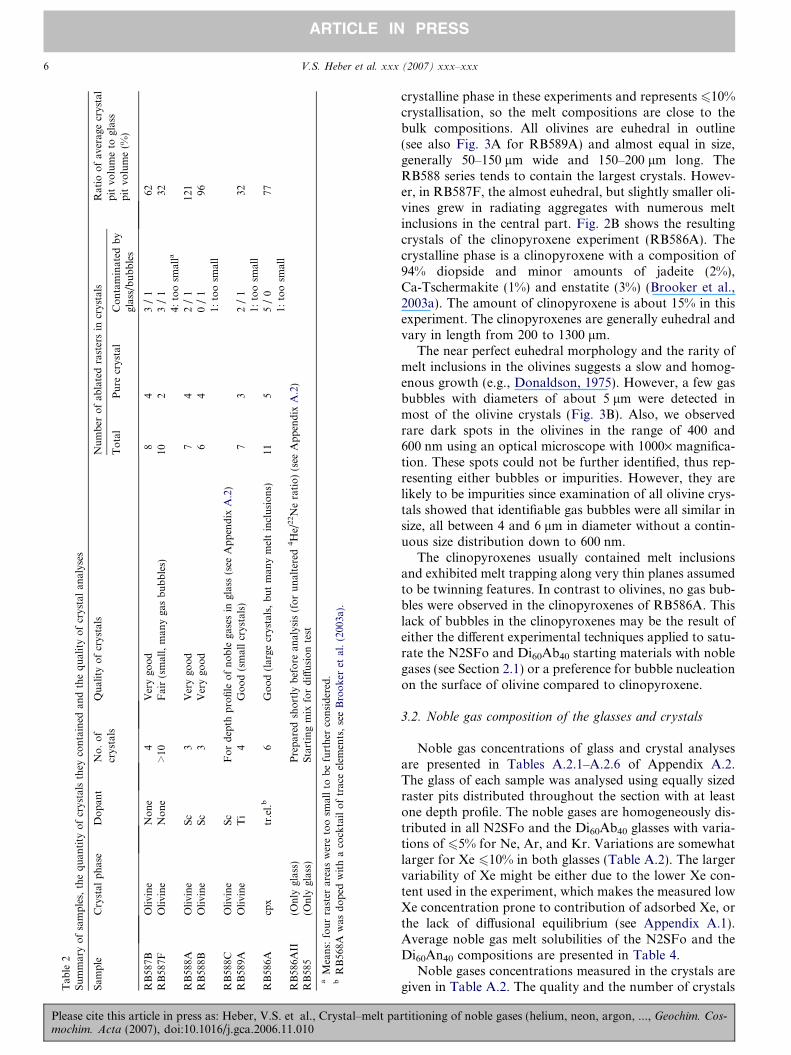
Tab
le2
Su
mm
ary
of
sam
ple
s,th
eq
uan
tity
of
crys
tals
they
con
tain
edan
dth
eq
ual
ity
of
crys
tal
anal
yses
Sam
ple
Cry
stal
ph
ase
Do
pan
tN
o.
of
crys
tals
Qu
alit
yo
fcr
ysta
lsN
um
ber
of
abla
ted
rast
ers
incr
ysta
lsR
atio
of
aver
age
crys
tal
pit
volu
me
togl
ass
pit
volu
me
(%)
To
tal
Pu
recr
ysta
lC
on
tam
inat
edb
ygl
ass/
bu
bb
les
RB
587B
Oli
vin
eN
on
e4
Ver
ygo
od
84
3/
162
RB
587F
Oli
vin
eN
on
e>
10F
air
(sm
all,
man
yga
sb
ub
ble
s)10
23
/1
324:
too
smal
la
RB
588A
Oli
vin
eS
c3
Ver
ygo
od
74
2/
112
1R
B58
8BO
livi
ne
Sc
3V
ery
goo
d6
40
/1
961:
too
smal
lR
B58
8CO
livi
ne
Sc
Fo
rd
epth
pro
file
of
no
ble
gase
sin
glas
s(s
eeA
pp
end
ixA
.2)
RB
589A
Oli
vin
eT
i4
Go
od
(sm
all
crys
tals
)7
32
/1
321:
too
smal
lR
B58
6Acp
xtr
.el.
b6
Go
od
(lar
gecr
ysta
ls,
bu
tm
any
mel
tin
clu
sio
ns)
115
5/
077
1:to
osm
all
RB
586A
II(O
nly
glas
s)P
rep
ared
sho
rtly
bef
ore
anal
ysis
(fo
ru
nal
tere
d4H
e/22N
era
tio
)(s
eeA
pp
end
ixA
.2)
RB
585
(On
lygl
ass)
Sta
rtin
gm
ixfo
rd
iffu
sio
nte
st
aM
ean
s:fo
ur
rast
erar
eas
wer
eto
osm
all
tob
efu
rth
erco
nsi
der
ed.
bR
B56
8Aw
asd
op
edw
ith
aco
ckta
ilo
ftr
ace
elem
ents
,se
eB
roo
ker
etal
.(2
003a
).
6 V.S. Heber et al. xxx (2007) xxx–xxx
ARTICLE IN PRESS
Please cite this article in press as: Heber, V.S. et al., Crystal–memochim. Acta (2007), doi:10.1016/j.gca.2006.11.010
lt pa
crystalline phase in these experiments and represents 610%crystallisation, so the melt compositions are close to thebulk compositions. All olivines are euhedral in outline(see also Fig. 3A for RB589A) and almost equal in size,generally 50–150 lm wide and 150–200 lm long. TheRB588 series tends to contain the largest crystals. Howev-er, in RB587F, the almost euhedral, but slightly smaller oli-vines grew in radiating aggregates with numerous meltinclusions in the central part. Fig. 2B shows the resultingcrystals of the clinopyroxene experiment (RB586A). Thecrystalline phase is a clinopyroxene with a composition of94% diopside and minor amounts of jadeite (2%),Ca-Tschermakite (1%) and enstatite (3%) (Brooker et al.,2003a). The amount of clinopyroxene is about 15% in thisexperiment. The clinopyroxenes are generally euhedral andvary in length from 200 to 1300 lm.
The near perfect euhedral morphology and the rarity ofmelt inclusions in the olivines suggests a slow and homog-enous growth (e.g., Donaldson, 1975). However, a few gasbubbles with diameters of about 5 lm were detected inmost of the olivine crystals (Fig. 3B). Also, we observedrare dark spots in the olivines in the range of 400 and600 nm using an optical microscope with 1000· magnifica-tion. These spots could not be further identified, thus rep-resenting either bubbles or impurities. However, they arelikely to be impurities since examination of all olivine crys-tals showed that identifiable gas bubbles were all similar insize, all between 4 and 6 lm in diameter without a contin-uous size distribution down to 600 nm.
The clinopyroxenes usually contained melt inclusionsand exhibited melt trapping along very thin planes assumedto be twinning features. In contrast to olivines, no gas bub-bles were observed in the clinopyroxenes of RB586A. Thislack of bubbles in the clinopyroxenes may be the result ofeither the different experimental techniques applied to satu-rate the N2SFo and Di60Ab40 starting materials with noblegases (see Section 2.1) or a preference for bubble nucleationon the surface of olivine compared to clinopyroxene.
3.2. Noble gas composition of the glasses and crystals
Noble gas concentrations of glass and crystal analysesare presented in Tables A.2.1–A.2.6 of Appendix A.2.The glass of each sample was analysed using equally sizedraster pits distributed throughout the section with at leastone depth profile. The noble gases are homogeneously dis-tributed in all N2SFo and the Di60Ab40 glasses with varia-tions of 65% for Ne, Ar, and Kr. Variations are somewhatlarger for Xe 610% in both glasses (Table A.2). The largervariability of Xe might be either due to the lower Xe con-tent used in the experiment, which makes the measured lowXe concentration prone to contribution of adsorbed Xe, orthe lack of diffusional equilibrium (see Appendix A.1).Average noble gas melt solubilities of the N2SFo and theDi60An40 compositions are presented in Table 4.
Noble gases concentrations measured in the crystals aregiven in Table A.2. The quality and the number of crystals
rtitioning of noble gases (helium, neon, argon, ..., Geochim. Cos-
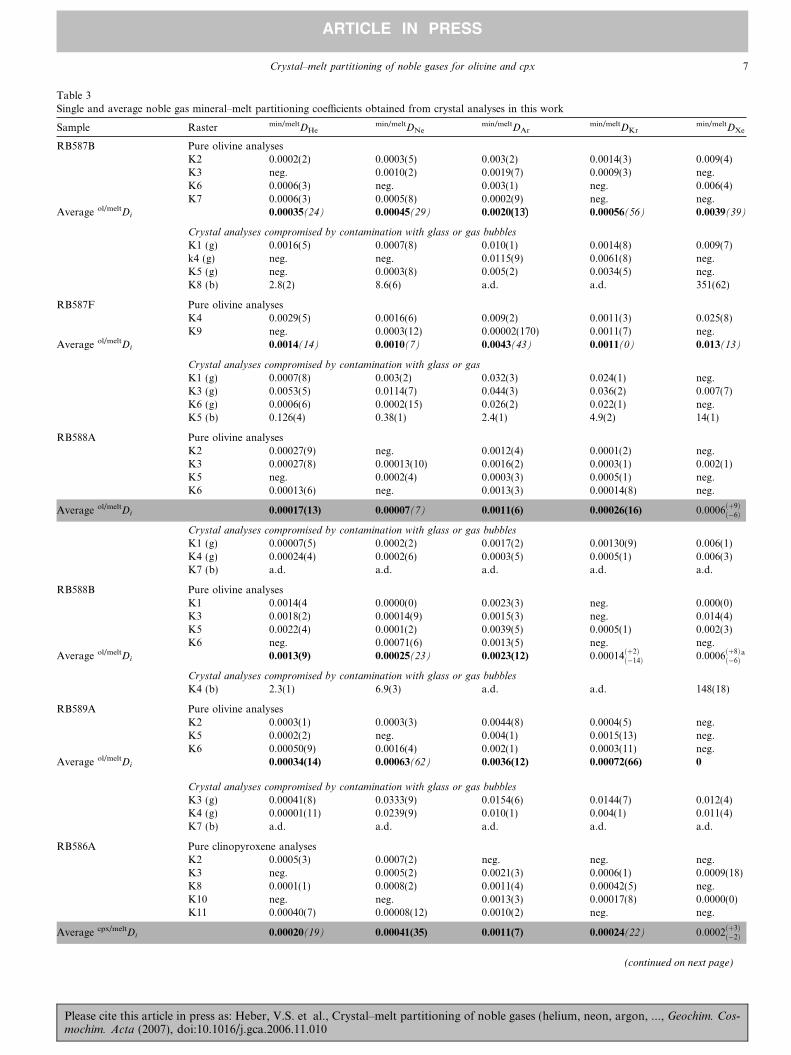
Table 3Single and average noble gas mineral–melt partitioning coefficients obtained from crystal analyses in this work
Crystal–melt partitioning of noble gases for olivine and cpx 7
ARTICLE IN PRESS
Please cite this article in press as: Heber, V.S. et al., Crystal–melt partitioning of noble gases (helium, neon, argon, ..., Geochim. Cos-mochim. Acta (2007), doi:10.1016/j.gca.2006.11.010
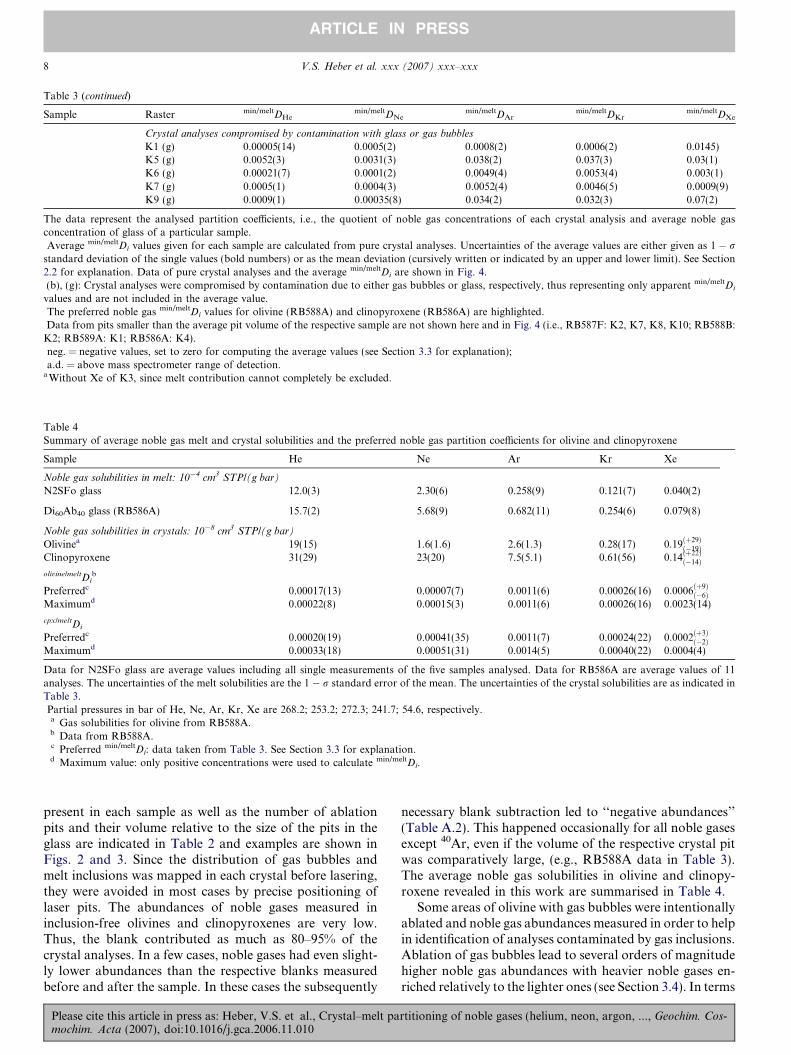
Table 4Summary of average noble gas melt and crystal solubilities and the preferred noble gas partition coefficients for olivine and clinopyroxene
Sample He Ne Ar Kr Xe
Noble gas solubilities in melt: 10�4 cm3 STP/(g bar)
N2SFo glass 12.0(3) 2.30(6) 0.258(9) 0.121(7) 0.040(2)
Di60Ab40 glass (RB586A) 15.7(2) 5.68(9) 0.682(11) 0.254(6) 0.079(8)
Noble gas solubilities in crystals: 10�8 cm3 STP/(g bar)
Olivinea 19(15) 1.6(1.6) 2.6(1.3) 0.28(17) 0:19ðþ29Þð�19Þ
Clinopyroxene 31(29) 23(20) 7.5(5.1) 0.61(56) 0:14ðþ22Þð�14Þ
olivine/meltDib
Preferredc 0.00017(13) 0.00007(7) 0.0011(6) 0.00026(16) 0:0006ðþ9Þð�6Þ
Maximumd 0.00022(8) 0.00015(3) 0.0011(6) 0.00026(16) 0.0023(14)
cpx/meltDi
Preferredc 0.00020(19) 0.00041(35) 0.0011(7) 0.00024(22) 0:0002ðþ3Þð�2Þ
Maximumd 0.00033(18) 0.00051(31) 0.0014(5) 0.00040(22) 0.0004(4)
Data for N2SFo glass are average values including all single measurements of the five samples analysed. Data for RB586A are average values of 11analyses. The uncertainties of the melt solubilities are the 1 � r standard error of the mean. The uncertainties of the crystal solubilities are as indicated inTable 3.Partial pressures in bar of He, Ne, Ar, Kr, Xe are 268.2; 253.2; 272.3; 241.7; 54.6, respectively.a Gas solubilities for olivine from RB588A.b Data from RB588A.c Preferred min/meltDi: data taken from Table 3. See Section 3.3 for explanation.d Maximum value: only positive concentrations were used to calculate min/meltDi.
The data represent the analysed partition coefficients, i.e., the quotient of noble gas concentrations of each crystal analysis and average noble gasconcentration of glass of a particular sample.Average min/meltDi values given for each sample are calculated from pure crystal analyses. Uncertainties of the average values are either given as 1 � r
standard deviation of the single values (bold numbers) or as the mean deviation (cursively written or indicated by an upper and lower limit). See Section2.2 for explanation. Data of pure crystal analyses and the average min/meltDi are shown in Fig. 4.(b), (g): Crystal analyses were compromised by contamination due to either gas bubbles or glass, respectively, thus representing only apparent min/meltDi
values and are not included in the average value.The preferred noble gas min/meltDi values for olivine (RB588A) and clinopyroxene (RB586A) are highlighted.Data from pits smaller than the average pit volume of the respective sample are not shown here and in Fig. 4 (i.e., RB587F: K2, K7, K8, K10; RB588B:
K2; RB589A: K1; RB586A: K4).neg. = negative values, set to zero for computing the average values (see Section 3.3 for explanation);a.d. = above mass spectrometer range of detection.
a Without Xe of K3, since melt contribution cannot completely be excluded.
8 V.S. Heber et al. xxx (2007) xxx–xxx
ARTICLE IN PRESS
present in each sample as well as the number of ablationpits and their volume relative to the size of the pits in theglass are indicated in Table 2 and examples are shown inFigs. 2 and 3. Since the distribution of gas bubbles andmelt inclusions was mapped in each crystal before lasering,they were avoided in most cases by precise positioning oflaser pits. The abundances of noble gases measured ininclusion-free olivines and clinopyroxenes are very low.Thus, the blank contributed as much as 80–95% of thecrystal analyses. In a few cases, noble gases had even slight-ly lower abundances than the respective blanks measuredbefore and after the sample. In these cases the subsequently
Please cite this article in press as: Heber, V.S. et al., Crystal–melt pamochim. Acta (2007), doi:10.1016/j.gca.2006.11.010
necessary blank subtraction led to ‘‘negative abundances’’(Table A.2). This happened occasionally for all noble gasesexcept 40Ar, even if the volume of the respective crystal pitwas comparatively large, (e.g., RB588A data in Table 3).The average noble gas solubilities in olivine and clinopy-roxene revealed in this work are summarised in Table 4.
Some areas of olivine with gas bubbles were intentionallyablated and noble gas abundances measured in order to helpin identification of analyses contaminated by gas inclusions.Ablation of gas bubbles lead to several orders of magnitudehigher noble gas abundances with heavier noble gases en-riched relatively to the lighter ones (see Section 3.4). In terms
rtitioning of noble gases (helium, neon, argon, ..., Geochim. Cos-
Crystal–melt partitioning of noble gases for olivine and cpx 9
ARTICLE IN PRESS
of accidental inclusion of melt the main problem arose fromthe difficulty in estimating the thicknesses of the crystals andin ensuring that the ablation did not continue into underly-ing glass, a problem which resulted in several contaminatedanalyses as indicated in Table 2. As shown in Fig. 4A the con-tamination of crystal material by adjacent glass or melt inclu-sions enhances all noble gas abundances from He to Xe andsimply increases the resultant min/meltDi values towards unityparallel to the correct trend and without significant fraction-ation of the lighter from the heavier noble gases.
3.3. Derivation of noble gas mineral–melt partition
coefficients
Individual noble gas min/meltDi values were determinedfor each crystal analysis using the average noble gas abun-dance of the glass and are given in Table 3. An averagemin/meltDi value was calculated for each noble gas for eachsample, excluding those analyses that were contaminatedby glass or fluid inclusions or where the ablated crystal ras-
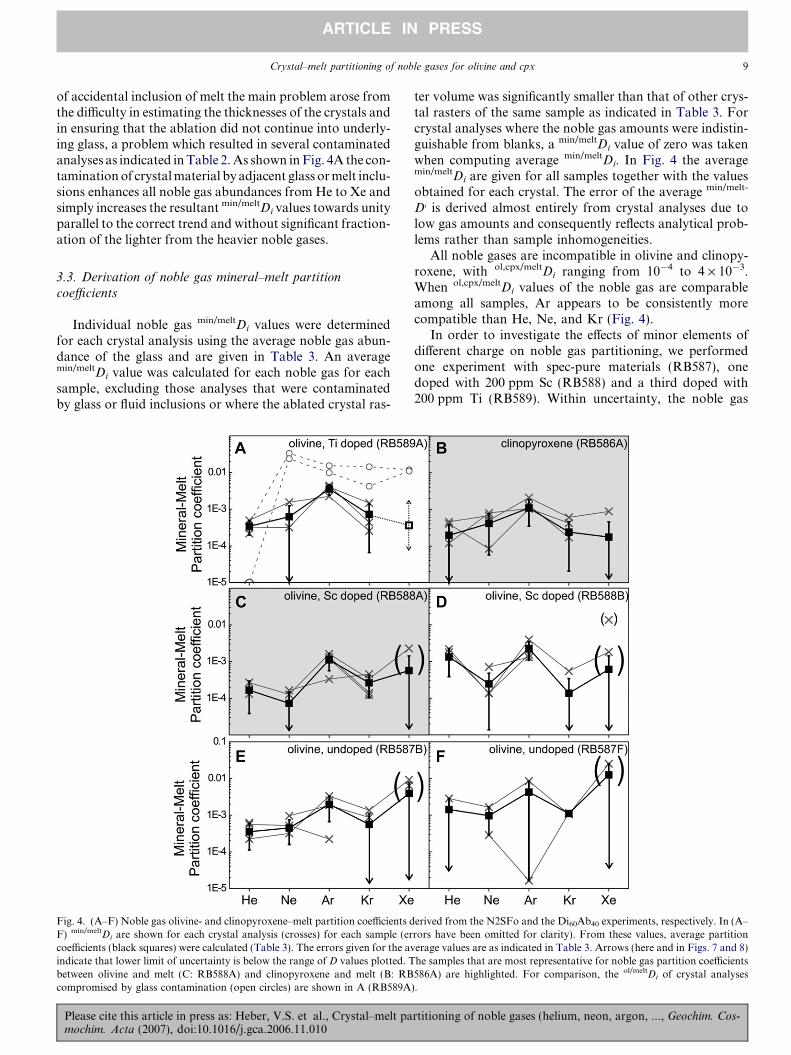
Fig. 4. (A–F) Noble gas olivine- and clinopyroxene–melt partition coefficients dF) min/meltDi are shown for each crystal analysis (crosses) for each sample (ercoefficients (black squares) were calculated (Table 3). The errors given for the avindicate that lower limit of uncertainty is below the range of D values plotted. Tbetween olivine and melt (C: RB588A) and clinopyroxene and melt (B: RBcompromised by glass contamination (open circles) are shown in A (RB589A
Please cite this article in press as: Heber, V.S. et al., Crystal–melt pamochim. Acta (2007), doi:10.1016/j.gca.2006.11.010
ter volume was significantly smaller than that of other crys-tal rasters of the same sample as indicated in Table 3. Forcrystal analyses where the noble gas amounts were indistin-guishable from blanks, a min/meltDi value of zero was takenwhen computing average min/meltDi. In Fig. 4 the averagemin/meltDi are given for all samples together with the valuesobtained for each crystal. The error of the average min/melt-
Di is derived almost entirely from crystal analyses due tolow gas amounts and consequently reflects analytical prob-lems rather than sample inhomogeneities.
All noble gases are incompatible in olivine and clinopy-roxene, with ol,cpx/meltDi ranging from 10�4 to 4 · 10�3.When ol,cpx/meltDi values of the noble gas are comparableamong all samples, Ar appears to be consistently morecompatible than He, Ne, and Kr (Fig. 4).
In order to investigate the effects of minor elements ofdifferent charge on noble gas partitioning, we performedone experiment with spec-pure materials (RB587), onedoped with 200 ppm Sc (RB588) and a third doped with200 ppm Ti (RB589). Within uncertainty, the noble gas
erived from the N2SFo and the Di60Ab40 experiments, respectively. In (A–rors have been omitted for clarity). From these values, average partitionerage values are as indicated in Table 3. Arrows (here and in Figs. 7 and 8)he samples that are most representative for noble gas partition coefficients586A) are highlighted. For comparison, the ol/meltDi of crystal analyses).
rtitioning of noble gases (helium, neon, argon, ..., Geochim. Cos-
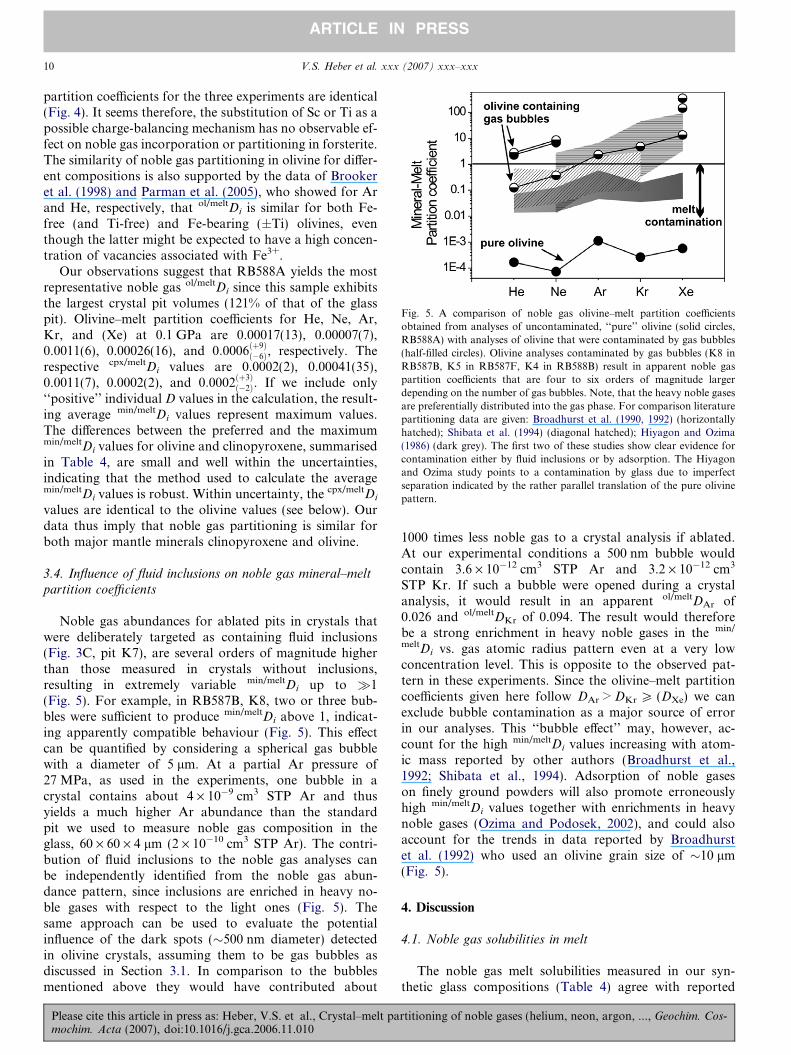
Fig. 5. A comparison of noble gas olivine–melt partition coefficientsobtained from analyses of uncontaminated, ‘‘pure’’ olivine (solid circles,RB588A) with analyses of olivine that were contaminated by gas bubbles(half-filled circles). Olivine analyses contaminated by gas bubbles (K8 inRB587B, K5 in RB587F, K4 in RB588B) result in apparent noble gaspartition coefficients that are four to six orders of magnitude largerdepending on the number of gas bubbles. Note, that the heavy noble gasesare preferentially distributed into the gas phase. For comparison literaturepartitioning data are given: Broadhurst et al. (1990, 1992) (horizontallyhatched); Shibata et al. (1994) (diagonal hatched); Hiyagon and Ozima(1986) (dark grey). The first two of these studies show clear evidence forcontamination either by fluid inclusions or by adsorption. The Hiyagonand Ozima study points to a contamination by glass due to imperfectseparation indicated by the rather parallel translation of the pure olivinepattern.
10 V.S. Heber et al. xxx (2007) xxx–xxx
ARTICLE IN PRESS
partition coefficients for the three experiments are identical(Fig. 4). It seems therefore, the substitution of Sc or Ti as apossible charge-balancing mechanism has no observable ef-fect on noble gas incorporation or partitioning in forsterite.The similarity of noble gas partitioning in olivine for differ-ent compositions is also supported by the data of Brookeret al. (1998) and Parman et al. (2005), who showed for Arand He, respectively, that ol/meltDi is similar for both Fe-free (and Ti-free) and Fe-bearing (±Ti) olivines, eventhough the latter might be expected to have a high concen-tration of vacancies associated with Fe3+.
Our observations suggest that RB588A yields the mostrepresentative noble gas ol/meltDi since this sample exhibitsthe largest crystal pit volumes (121% of that of the glasspit). Olivine–melt partition coefficients for He, Ne, Ar,Kr, and (Xe) at 0.1 GPa are 0.00017(13), 0.00007(7),0.0011(6), 0.00026(16), and 0:0006ðþ9Þ
ð�6Þ, respectively. Therespective cpx/meltDi values are 0.0002(2), 0.00041(35),0.0011(7), 0.0002(2), and 0:0002ðþ3Þ
ð�2Þ. If we include only‘‘positive’’ individual D values in the calculation, the result-ing average min/meltDi values represent maximum values.The differences between the preferred and the maximummin/meltDi values for olivine and clinopyroxene, summarisedin Table 4, are small and well within the uncertainties,indicating that the method used to calculate the averagemin/meltDi values is robust. Within uncertainty, the cpx/meltDi
values are identical to the olivine values (see below). Ourdata thus imply that noble gas partitioning is similar forboth major mantle minerals clinopyroxene and olivine.
3.4. Influence of fluid inclusions on noble gas mineral–meltpartition coefficients
Noble gas abundances for ablated pits in crystals thatwere deliberately targeted as containing fluid inclusions(Fig. 3C, pit K7), are several orders of magnitude higherthan those measured in crystals without inclusions,resulting in extremely variable min/meltDi up to �1(Fig. 5). For example, in RB587B, K8, two or three bub-bles were sufficient to produce min/meltDi above 1, indicat-ing apparently compatible behaviour (Fig. 5). This effectcan be quantified by considering a spherical gas bubblewith a diameter of 5 lm. At a partial Ar pressure of27 MPa, as used in the experiments, one bubble in acrystal contains about 4 · 10�9 cm3 STP Ar and thusyields a much higher Ar abundance than the standardpit we used to measure noble gas composition in theglass, 60 · 60 · 4 lm (2 · 10�10 cm3 STP Ar). The contri-bution of fluid inclusions to the noble gas analyses canbe independently identified from the noble gas abun-dance pattern, since inclusions are enriched in heavy no-ble gases with respect to the light ones (Fig. 5). Thesame approach can be used to evaluate the potentialinfluence of the dark spots (�500 nm diameter) detectedin olivine crystals, assuming them to be gas bubbles asdiscussed in Section 3.1. In comparison to the bubblesmentioned above they would have contributed about
Please cite this article in press as: Heber, V.S. et al., Crystal–melt pamochim. Acta (2007), doi:10.1016/j.gca.2006.11.010
1000 times less noble gas to a crystal analysis if ablated.At our experimental conditions a 500 nm bubble wouldcontain 3.6 · 10�12 cm3 STP Ar and 3.2 · 10�12 cm3
STP Kr. If such a bubble were opened during a crystalanalysis, it would result in an apparent ol/meltDAr of0.026 and ol/meltDKr of 0.094. The result would thereforebe a strong enrichment in heavy noble gases in the min/
meltDi vs. gas atomic radius pattern even at a very lowconcentration level. This is opposite to the observed pat-tern in these experiments. Since the olivine–melt partitioncoefficients given here follow DAr > DKr P (DXe) we canexclude bubble contamination as a major source of errorin our analyses. This ‘‘bubble effect’’ may, however, ac-count for the high min/meltDi values increasing with atom-ic mass reported by other authors (Broadhurst et al.,1992; Shibata et al., 1994). Adsorption of noble gaseson finely ground powders will also promote erroneouslyhigh min/meltDi values together with enrichments in heavynoble gases (Ozima and Podosek, 2002), and could alsoaccount for the trends in data reported by Broadhurstet al. (1992) who used an olivine grain size of �10 lm(Fig. 5).
4. Discussion
4.1. Noble gas solubilities in melt
The noble gas melt solubilities measured in our syn-thetic glass compositions (Table 4) agree with reported
rtitioning of noble gases (helium, neon, argon, ..., Geochim. Cos-
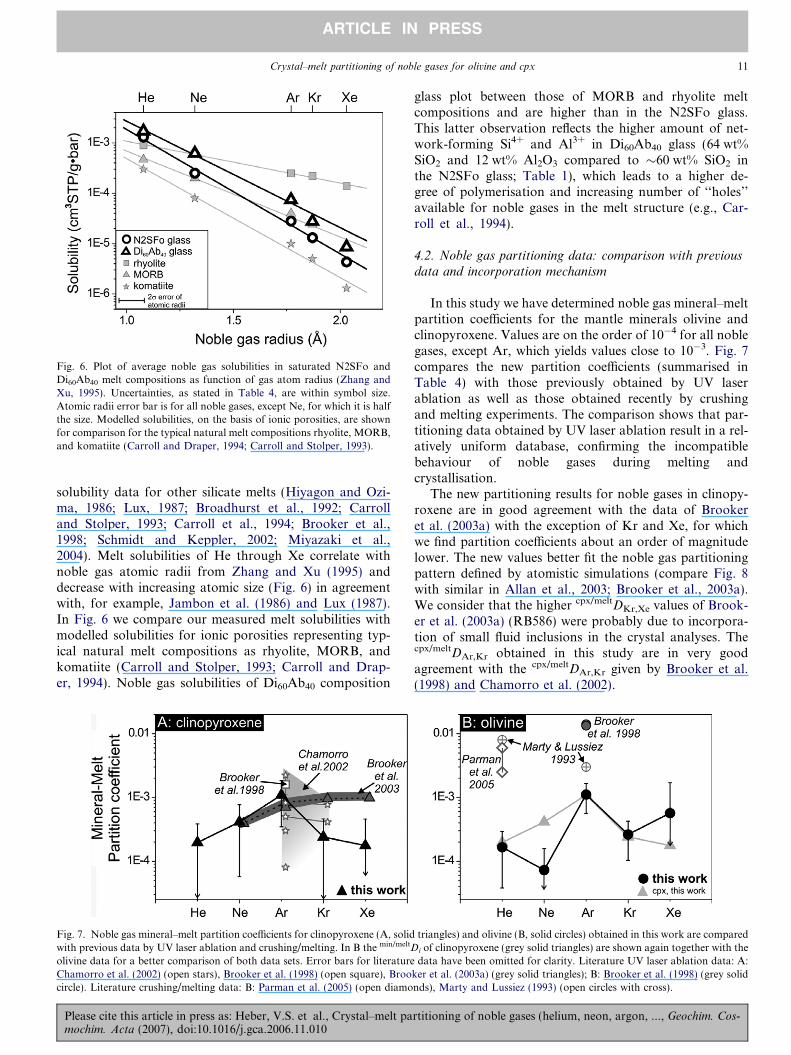
Fig. 6. Plot of average noble gas solubilities in saturated N2SFo andDi60Ab40 melt compositions as function of gas atom radius (Zhang andXu, 1995). Uncertainties, as stated in Table 4, are within symbol size.Atomic radii error bar is for all noble gases, except Ne, for which it is halfthe size. Modelled solubilities, on the basis of ionic porosities, are shownfor comparison for the typical natural melt compositions rhyolite, MORB,and komatiite (Carroll and Draper, 1994; Carroll and Stolper, 1993).
Crystal–melt partitioning of noble gases for olivine and cpx 11
ARTICLE IN PRESS
solubility data for other silicate melts (Hiyagon and Ozi-ma, 1986; Lux, 1987; Broadhurst et al., 1992; Carrolland Stolper, 1993; Carroll et al., 1994; Brooker et al.,1998; Schmidt and Keppler, 2002; Miyazaki et al.,2004). Melt solubilities of He through Xe correlate withnoble gas atomic radii from Zhang and Xu (1995) anddecrease with increasing atomic size (Fig. 6) in agreementwith, for example, Jambon et al. (1986) and Lux (1987).In Fig. 6 we compare our measured melt solubilities withmodelled solubilities for ionic porosities representing typ-ical natural melt compositions as rhyolite, MORB, andkomatiite (Carroll and Stolper, 1993; Carroll and Drap-er, 1994). Noble gas solubilities of Di60Ab40 composition
Fig. 7. Noble gas mineral–melt partition coefficients for clinopyroxene (A, solidwith previous data by UV laser ablation and crushing/melting. In B the min/meltD
olivine data for a better comparison of both data sets. Error bars for literatureChamorro et al. (2002) (open stars), Brooker et al. (1998) (open square), Broocircle). Literature crushing/melting data: B: Parman et al. (2005) (open diamo
Please cite this article in press as: Heber, V.S. et al., Crystal–melt pamochim. Acta (2007), doi:10.1016/j.gca.2006.11.010
glass plot between those of MORB and rhyolite meltcompositions and are higher than in the N2SFo glass.This latter observation reflects the higher amount of net-work-forming Si4+ and Al3+ in Di60Ab40 glass (64 wt%SiO2 and 12 wt% Al2O3 compared to �60 wt% SiO2 inthe N2SFo glass; Table 1), which leads to a higher de-gree of polymerisation and increasing number of ‘‘holes’’available for noble gases in the melt structure (e.g., Car-roll et al., 1994).
4.2. Noble gas partitioning data: comparison with previous
data and incorporation mechanism
In this study we have determined noble gas mineral–meltpartition coefficients for the mantle minerals olivine andclinopyroxene. Values are on the order of 10�4 for all noblegases, except Ar, which yields values close to 10�3. Fig. 7compares the new partition coefficients (summarised inTable 4) with those previously obtained by UV laserablation as well as those obtained recently by crushingand melting experiments. The comparison shows that par-titioning data obtained by UV laser ablation result in a rel-atively uniform database, confirming the incompatiblebehaviour of noble gases during melting andcrystallisation.
The new partitioning results for noble gases in clinopy-roxene are in good agreement with the data of Brookeret al. (2003a) with the exception of Kr and Xe, for whichwe find partition coefficients about an order of magnitudelower. The new values better fit the noble gas partitioningpattern defined by atomistic simulations (compare Fig. 8with similar in Allan et al., 2003; Brooker et al., 2003a).We consider that the higher cpx/meltDKr,Xe values of Brook-er et al. (2003a) (RB586) were probably due to incorpora-tion of small fluid inclusions in the crystal analyses. Thecpx/meltDAr,Kr obtained in this study are in very goodagreement with the cpx/meltDAr,Kr given by Brooker et al.(1998) and Chamorro et al. (2002).
triangles) and olivine (B, solid circles) obtained in this work are compared
i of clinopyroxene (grey solid triangles) are shown again together with thedata have been omitted for clarity. Literature UV laser ablation data: A:
ker et al. (2003a) (grey solid triangles); B: Brooker et al. (1998) (grey solidnds), Marty and Lussiez (1993) (open circles with cross).
rtitioning of noble gases (helium, neon, argon, ..., Geochim. Cos-
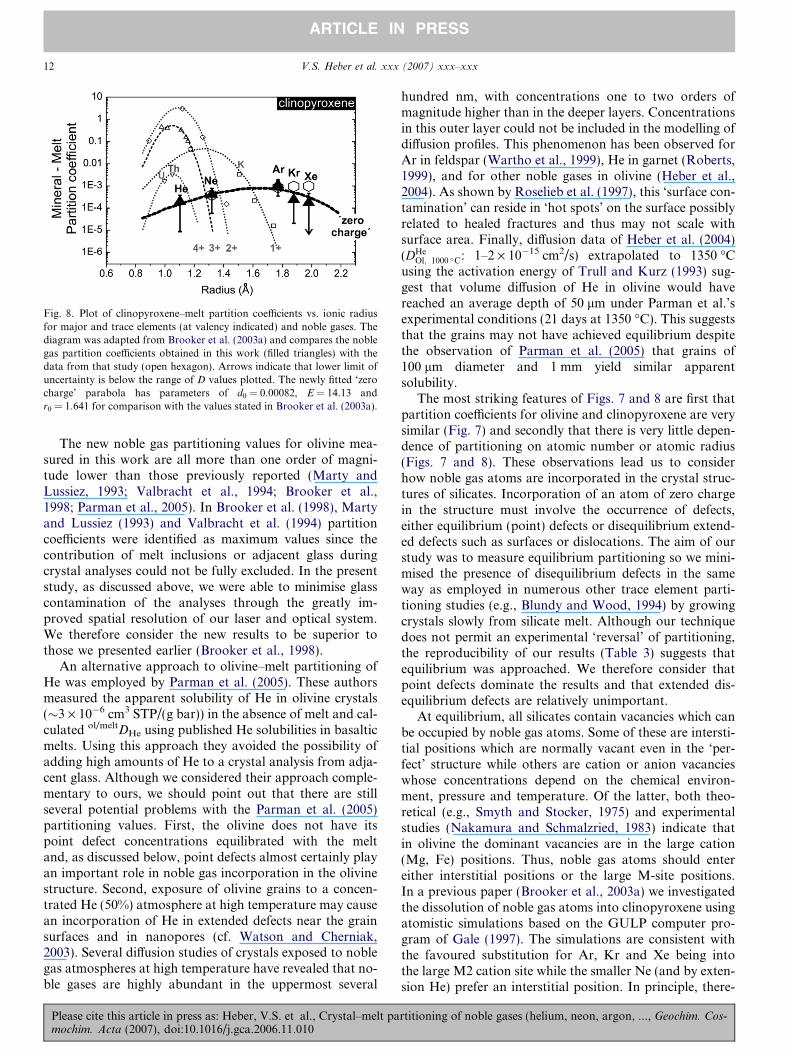
Fig. 8. Plot of clinopyroxene–melt partition coefficients vs. ionic radiusfor major and trace elements (at valency indicated) and noble gases. Thediagram was adapted from Brooker et al. (2003a) and compares the noblegas partition coefficients obtained in this work (filled triangles) with thedata from that study (open hexagon). Arrows indicate that lower limit ofuncertainty is below the range of D values plotted. The newly fitted ‘zerocharge’ parabola has parameters of d0 = 0.00082, E = 14.13 andr0 = 1.641 for comparison with the values stated in Brooker et al. (2003a).
12 V.S. Heber et al. xxx (2007) xxx–xxx
ARTICLE IN PRESS
The new noble gas partitioning values for olivine mea-sured in this work are all more than one order of magni-tude lower than those previously reported (Marty andLussiez, 1993; Valbracht et al., 1994; Brooker et al.,1998; Parman et al., 2005). In Brooker et al. (1998), Martyand Lussiez (1993) and Valbracht et al. (1994) partitioncoefficients were identified as maximum values since thecontribution of melt inclusions or adjacent glass duringcrystal analyses could not be fully excluded. In the presentstudy, as discussed above, we were able to minimise glasscontamination of the analyses through the greatly im-proved spatial resolution of our laser and optical system.We therefore consider the new results to be superior tothose we presented earlier (Brooker et al., 1998).
An alternative approach to olivine–melt partitioning ofHe was employed by Parman et al. (2005). These authorsmeasured the apparent solubility of He in olivine crystals(�3 · 10�6 cm3 STP/(g bar)) in the absence of melt and cal-culated ol/meltDHe using published He solubilities in basalticmelts. Using this approach they avoided the possibility ofadding high amounts of He to a crystal analysis from adja-cent glass. Although we considered their approach comple-mentary to ours, we should point out that there are stillseveral potential problems with the Parman et al. (2005)partitioning values. First, the olivine does not have itspoint defect concentrations equilibrated with the meltand, as discussed below, point defects almost certainly playan important role in noble gas incorporation in the olivinestructure. Second, exposure of olivine grains to a concen-trated He (50%) atmosphere at high temperature may causean incorporation of He in extended defects near the grainsurfaces and in nanopores (cf. Watson and Cherniak,2003). Several diffusion studies of crystals exposed to noblegas atmospheres at high temperature have revealed that no-ble gases are highly abundant in the uppermost several
Please cite this article in press as: Heber, V.S. et al., Crystal–melt pamochim. Acta (2007), doi:10.1016/j.gca.2006.11.010
hundred nm, with concentrations one to two orders ofmagnitude higher than in the deeper layers. Concentrationsin this outer layer could not be included in the modelling ofdiffusion profiles. This phenomenon has been observed forAr in feldspar (Wartho et al., 1999), He in garnet (Roberts,1999), and for other noble gases in olivine (Heber et al.,2004). As shown by Roselieb et al. (1997), this ‘surface con-tamination’ can reside in ‘hot spots’ on the surface possiblyrelated to healed fractures and thus may not scale withsurface area. Finally, diffusion data of Heber et al. (2004)(DHe
Ol; 1000 �C: 1–2 · 10�15 cm2/s) extrapolated to 1350 �Cusing the activation energy of Trull and Kurz (1993) sug-gest that volume diffusion of He in olivine would havereached an average depth of 50 lm under Parman et al.’sexperimental conditions (21 days at 1350 �C). This suggeststhat the grains may not have achieved equilibrium despitethe observation of Parman et al. (2005) that grains of100 lm diameter and 1 mm yield similar apparentsolubility.
The most striking features of Figs. 7 and 8 are first thatpartition coefficients for olivine and clinopyroxene are verysimilar (Fig. 7) and secondly that there is very little depen-dence of partitioning on atomic number or atomic radius(Figs. 7 and 8). These observations lead us to considerhow noble gas atoms are incorporated in the crystal struc-tures of silicates. Incorporation of an atom of zero chargein the structure must involve the occurrence of defects,either equilibrium (point) defects or disequilibrium extend-ed defects such as surfaces or dislocations. The aim of ourstudy was to measure equilibrium partitioning so we mini-mised the presence of disequilibrium defects in the sameway as employed in numerous other trace element parti-tioning studies (e.g., Blundy and Wood, 1994) by growingcrystals slowly from silicate melt. Although our techniquedoes not permit an experimental ‘reversal’ of partitioning,the reproducibility of our results (Table 3) suggests thatequilibrium was approached. We therefore consider thatpoint defects dominate the results and that extended dis-equilibrium defects are relatively unimportant.
At equilibrium, all silicates contain vacancies which canbe occupied by noble gas atoms. Some of these are intersti-tial positions which are normally vacant even in the ‘per-fect’ structure while others are cation or anion vacancieswhose concentrations depend on the chemical environ-ment, pressure and temperature. Of the latter, both theo-retical (e.g., Smyth and Stocker, 1975) and experimentalstudies (Nakamura and Schmalzried, 1983) indicate thatin olivine the dominant vacancies are in the large cation(Mg, Fe) positions. Thus, noble gas atoms should entereither interstitial positions or the large M-site positions.In a previous paper (Brooker et al., 2003a) we investigatedthe dissolution of noble gas atoms into clinopyroxene usingatomistic simulations based on the GULP computer pro-gram of Gale (1997). The simulations are consistent withthe favoured substitution for Ar, Kr and Xe being intothe large M2 cation site while the smaller Ne (and by exten-sion He) prefer an interstitial position. In principle, there-
rtitioning of noble gases (helium, neon, argon, ..., Geochim. Cos-
Crystal–melt partitioning of noble gases for olivine and cpx 13
ARTICLE IN PRESS
fore the important defects in clinopyroxene and olivine arethe same, interstitial vacancies and M-site cation vacancies.
Brooker et al. (2003a) went a step further in the interpre-tation of their simulations and experimental (noble gas)data by relating the results to the lattice strain model ofBlundy and Wood (1994) for trace element partitioning.This predicts that ions substituting into a given cation sitewill have crystal–melt partition coefficients which, for eachcation charge, define a parabola as a function of ionic radi-us. Fig. 8 shows such parabolae for 1+, 2+, 3+ and 4+ions substituting into the large cation site in clinopyroxenefrom experiment RB586. Empirically, Blundy and Wood(1994) observed that, for fixed cation–oxygen distance d
(A) the curvature of the parabola, as defined by E, theapparent Young’s Modulus of the site, is an approximatelylinear function of the charge on the trace ion Zc:
E � 1125Zc
d3GPa
Thus, ions of progressively lower charge should exhibitlower and lower E more and more ‘open’ parabolae asshown in Fig. 8. Wood and Blundy (2001) used this empir-ical observation to propose that ‘ions’ of charge zero, suchas the noble gases should substitute with E close to zeroand should hence have partitioning which is essentiallyindependent of ionic radius i.e., the ‘parabola’ opens outto a straight line. Figs. 7 and 8 show that this is essentiallywhat is observed for olivine and clinopyroxene (see alsoBrooker et al., 2003a).
The lack of dependence of noble gas partition coefficienton atomic radius (Figs. 7 and 8) was taken by Brookeret al. (2003a) to support the idea that noble gases partitionas if they were trace ions of zero charge. This was proposedin the context of noble gases entering vacancies in the M2site of clinopyroxene, but should also apply in the case ofsubstitution at interstitial vacancies since these must relaxaround the substituent atoms in a similar manner to thecation vacancies. Two of our experiments (RB588 andRB589) were aimed at discriminating the nature of thedefect which incorporates noble gas atoms in olivine. Byadding Sc3+, an ion of virtually the same size as Mg2+, toolivine (RB588) we should have created vacancies in themagnesium positions because charge balance requires thatthe substitution be as follows:
3Mg2þ $ 2Sc3þ þ V Mg
where VMg denotes a magnesium vacancy. If noble gaseswere to preferentially enter magnesium vacancies then wewould expect that this experiment (RB588) would producehigher partition coefficients than the spec-pure experimentRB587. In fact, there is no detectable difference in partitioncoefficients (Table 3). Assuming the starting materials forRB587 were ‘spec-pure’, this implies that noble gases donot enter substitutional (extrinsic) cation vacancies in theolivine structure. The result is supported by experimentRB589 in which Ti4+ was added. No detectable change in
Please cite this article in press as: Heber, V.S. et al., Crystal–melt pamochim. Acta (2007), doi:10.1016/j.gca.2006.11.010
partition coefficients was observed. Our data thereforeare most consistent with noble gases entering interstitial,normally vacant, positions in the olivine structure. Theimplication is that noble gases enter positions which arepresent in all olivines independent of composition and thatsimilar partitioning behaviour should be observed for allolivines. This is consistent with the observations of Parmanet al. (2005) who found no difference in He solubility be-tween pure forsterite and Mg90 olivine under similar condi-tions. Clinopyroxene, for which we have a wider range ofdata, behaves in a similar fashion. Clinopyroxenes alongthe join diopside-jadeite exhibit virtually identical crystal–melt partition coefficients for noble gases (Brooker et al.,2003a). Addition of Fe makes no apparent differenceaccording to the data of Brooker et al. (1998) and Chamo-rro et al. (2002), supporting the hypothesis that partition-ing is into sites which are vacant in all clinopyroxenes.
4.3. Implications for noble gas compositions of
mantle-derived melts
The low min/meltDi values for noble gases indicate thatthey all behave in a strongly incompatible fashion. Despitethis, the partition coefficients for noble gases into clinopy-roxene are similar to those of the strongly lithophileelements U, Th, and K (Fig. 8). For olivine, our measuredpartition coefficients for the noble gases are one to twoorders of magnitude greater than the observed publishedvalues for U, Th, and K (Beattie, 1993; Hart and Brooks,1974; Wood et al., 1999). Preliminary ion probe data forolivine and melt in sample RB571 (grown at the same con-ditions as olivines in this study; see Section 2.1.1) also sug-gest low ol/meltDK of <1.6 · 10�4 and ol/meltDTh of 9 · 10�6.The data support the suggestion that a small but significantamount of primordial noble gases must have been preferen-tially retained in the mantle during crustal extraction, espe-cially if this involved batch rather than fractional meltingand cpx is exhausted from the mantle assemblage. Majordifferences between asthenosphere- and plume-derived bas-alts (MORB and OIB, respectively) are generally the abun-dance ratios of primordial to radiogenic noble gas isotopes,e.g., 3He/4He, 22Ne/21Ne and 36Ar/40Ar, which are higherin OIB than in MORB. The common interpretation thatOIB derive from a largely non-degassed, relatively isolatedmantle source, is, however, the subject of considerable de-bate due to the low He abundances in OIB samples com-pared to MORB (e.g., Albarede, 1998; Farley andNeroda, 1998; Ozima and Igarashi, 2000; Meibom et al.,2003) and the growing evidence of whole mantle mixing(e.g., van der Hilst et al., 1997; Bijwaard and Spakman,1998; Fukao et al., 2001). Key to this debate is the generalassumption that noble gases are more incompatible thanthe parent elements of their radiogenic isotopes (U, Th,and K), such that primordial 3He, 22Ne, and 36Ar are com-pletely stripped from the mantle during melt extraction,leaving a source dominated by the residual radioactive par-ents, U, Th, and K. These radioactive elements should, in
rtitioning of noble gases (helium, neon, argon, ..., Geochim. Cos-
14 V.S. Heber et al. xxx (2007) xxx–xxx
ARTICLE IN PRESS
this model, subsequently decay to produce high ratios of4He/3He, 21Ne/22Ne and 40Ar/36Ar. In practical terms, thisrequires noble gas partition coefficients less than around10�6, far lower than measured in this study. Our new datasuggest that the noble gases are less incompatible than theirradioactive parents during mantle melting, leading to are-evaluation of the geochemical relationships between par-ent and daughter isotopes.
Brooker et al. (2003b) and Parman et al. (2005) have usedthe measured partition coefficients for noble gases andradioactive parents to show that the ‘‘primordial’’ He signa-ture in OIB could result from re-melting of a previouslymelted, recycled, and degassed lithosphere. If we make thereasonable assumption that noble gas partitioning intoorthopyroxene is similar to that observed forclinopyroxene and olivine, partial melting of the mantleshould lead to preferential extraction of K, U and Th rela-tive to the noble gases. The residual depleted reservoirwould have a relatively undisturbed primordial/radiogenic3He/4He ratio and, with time, due to preferential extractionof the U and Th parents, a lower integrated 4He ingrowth.The resulting, relatively weak ingrowth of radiogenic 4He,21Ne, and 40Ar in dunitic and harzburgitic residue will pre-serve a noble gas isotope signature high in the primordialisotopes relative to the radiogenic isotopes. Recycling ofthis previously depleted residual lithosphere into source re-gions of OIB provides an alternative explanation for theapparently high primordial 3He/4He signatures in OIBand also explains the low noble gas abundances. The samemodel can equally be applied to argon isotope ratios. Theisotopic signature in OIB is characterised by a less radiogen-ic ingrowth compared to MORB (40Ar/36Ar up to about40,000 in MORB and up to 8000 in OIB (Graham, 2002)),in agreement with an OIB source that is depleted in radio-active K compared to primordial Ar and lower in totalAr. Many trace element and isotopic features of OIB sug-gest that recycling of oceanic crust and lithosphere playsan important role in the creation of mantle heterogeneities(Hofmann, 1997; van Keken et al., 2002; Class and Gold-stein, 2005). Our noble gas partitioning data indicate thatrecycling of depleted ancient lithosphere is also able to gen-erate the ‘undegassed’ noble gas isotope signature of OIB.
5. Conclusion
We have shown that UV laser ablation is capable ofanalysing noble gases in laboratory grown coexisting crys-tals and melt to obtain partition coefficients. Most impor-tant in this respect, since crystal/melt partitioncoefficients of noble gases are very low, has been the devel-opment of techniques to grow crystals virtually free of meltand fluid inclusions. Mineral–melt partition coefficients ob-tained for the olivine–melt system for He, Ne, Ar, Kr, and(Xe) are 0.00017(13), 0.00007(7), 0.0011(6), 0.00026(16),and 0:0006
ðþ9Þð�6Þ and the clinopyroxene–melt system
0.0002(2), 0.00041(35), 0.0011(7), 0.0002(2), and0:0002ðþ3Þ
ð�2Þ, respectively. The data confirm the incompatible
Please cite this article in press as: Heber, V.S. et al., Crystal–melt pamochim. Acta (2007), doi:10.1016/j.gca.2006.11.010
behaviour of noble gases for both olivine and clinopyrox-ene. Although the noble gases are incompatible, our dataindicate that significant amounts of all noble gases can beretained in the mantle during partial melting. The data alsoshow that the noble gases are likely to have similar incom-patibilities in many major upper mantle phases and are notfractionated (relative to each other) during melting andcrystallization involving olivine, clinopyroxene and (proba-bly) orthopyroxene. A comparison of relative partitioningbehaviour of noble gases and their radioactive parents dur-ing partial melting indicates that the noble gas isotopic sig-natures of OIB can be achieved by recycling of previouslymelted (depleted) mantle source.
Acknowledgments
This manuscript was greatly improved by commentsfrom referees Steve Parman, Pete Burnard and an anony-mous reviewer. We thank Rainer Wieler enabling us to cal-ibrate our calibration bottle and Bernard Marty fordiscussion and correction of the manuscript. We acknowl-edge Richard Chater from the Imperial College for accessto the interferometer. V.S. Heber acknowledges the finan-cial support provided through the European Community’sHuman Potential Programme under contract HPRN-CT-2002-000211 (EUROMELT) and the EUROMELT net-work coordinator Kevin W. Burton. R. Brooker, S. Kelleyand B. Wood acknowledge the financial support providedby the NERC (NER/A/S/2001/00464).
Associate editor: Jun-ichi Matsuda
Appendix A
A.1. Achievement of equilibrium
Equilibration of noble gases between crystal and meltrequires: (i) noble gases to be homogeneously distributedin the starting melt at the initiation of crystal growth,and (ii) equilibrium growth of crystals under a carefullycontrolled T path (Brooker et al., 1998). The first criterionwas particularly important in our case because of the rela-tively low temperatures we used (1165 �C, 1285 �C) com-pared to previous experiments (Brooker et al., 1998,2003a; Chamorro et al., 2002) that would have preventeddiffusive equilibration over long distances (see below).
Initially, equilibration times were calculated using Ardiffusion coefficients (DAr) estimated from the work ofLux (1987). Accordingly, Ar would have diffused about4.5 mm into the Di60Ab40 melt column after 9 h at1285 �C (computed as x ¼
ffiffiffiffiffiDtp
where x is the average dif-fusive length scale and t is the run duration in seconds).However, recent DAr data for a glass of comparable com-position from Nowak et al. (2004) suggest that Ar wouldonly have diffused into the upper 0.5 mm under these con-ditions (DAr, andesitic,1285�C 7 · 10�8 cm/s2). To investigatethe noble gas diffusion in the Di60Ab40 melt we ran the test
rtitioning of noble gases (helium, neon, argon, ..., Geochim. Cos-
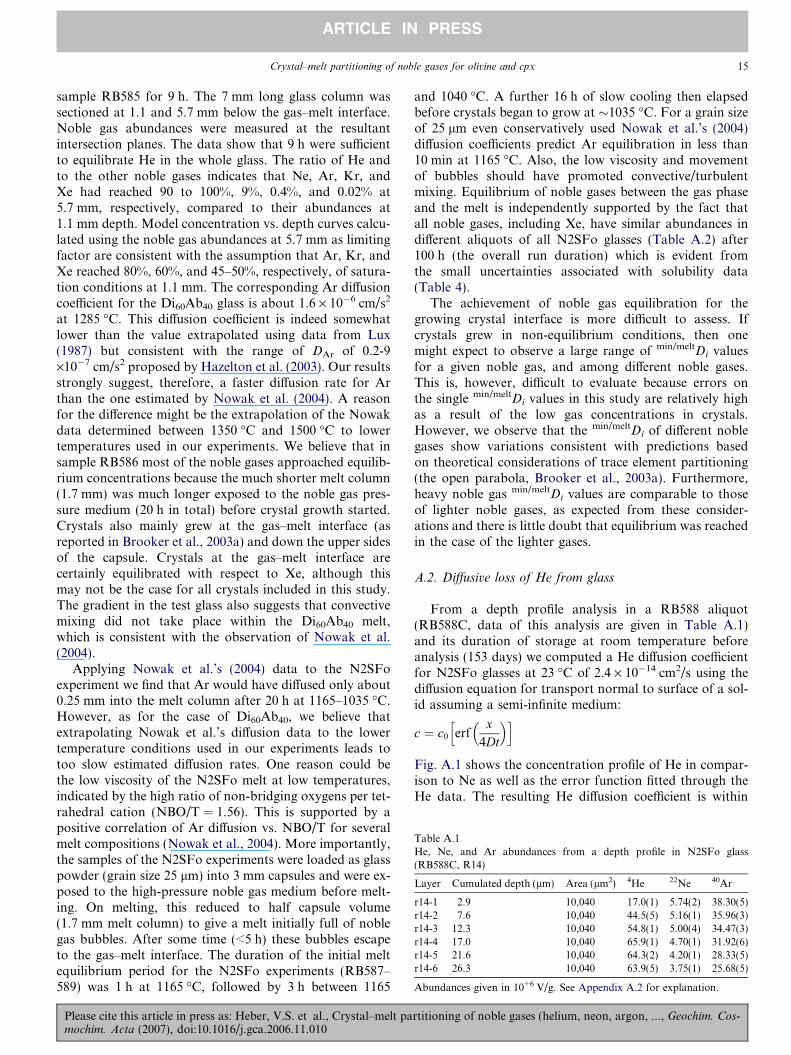
Table A.1He, Ne, and Ar abundances from a depth profile in N2SFo glass(RB588C, R14)
Layer Cumulated depth (lm) Area (lm2) 4He 22Ne 40Ar
r14-1 2.9 10,040 17.0(1) 5.74(2) 38.30(5)r14-2 7.6 10,040 44.5(5) 5.16(1) 35.96(3)r14-3 12.3 10,040 54.8(1) 5.00(4) 34.47(3)r14-4 17.0 10,040 65.9(1) 4.70(1) 31.92(6)r14-5 21.6 10,040 64.3(2) 4.20(1) 28.33(5)r14-6 26.3 10,040 63.9(5) 3.75(1) 25.68(5)
Abundances given in 10+6 V/g. See Appendix A.2 for explanation.
Crystal–melt partitioning of noble gases for olivine and cpx 15
ARTICLE IN PRESS
sample RB585 for 9 h. The 7 mm long glass column wassectioned at 1.1 and 5.7 mm below the gas–melt interface.Noble gas abundances were measured at the resultantintersection planes. The data show that 9 h were sufficientto equilibrate He in the whole glass. The ratio of He andto the other noble gases indicates that Ne, Ar, Kr, andXe had reached 90 to 100%, 9%, 0.4%, and 0.02% at5.7 mm, respectively, compared to their abundances at1.1 mm depth. Model concentration vs. depth curves calcu-lated using the noble gas abundances at 5.7 mm as limitingfactor are consistent with the assumption that Ar, Kr, andXe reached 80%, 60%, and 45–50%, respectively, of satura-tion conditions at 1.1 mm. The corresponding Ar diffusioncoefficient for the Di60Ab40 glass is about 1.6 · 10�6 cm/s2
at 1285 �C. This diffusion coefficient is indeed somewhatlower than the value extrapolated using data from Lux(1987) but consistent with the range of DAr of 0.2-9·10�7 cm/s2 proposed by Hazelton et al. (2003). Our resultsstrongly suggest, therefore, a faster diffusion rate for Arthan the one estimated by Nowak et al. (2004). A reasonfor the difference might be the extrapolation of the Nowakdata determined between 1350 �C and 1500 �C to lowertemperatures used in our experiments. We believe that insample RB586 most of the noble gases approached equilib-rium concentrations because the much shorter melt column(1.7 mm) was much longer exposed to the noble gas pres-sure medium (20 h in total) before crystal growth started.Crystals also mainly grew at the gas–melt interface (asreported in Brooker et al., 2003a) and down the upper sidesof the capsule. Crystals at the gas–melt interface arecertainly equilibrated with respect to Xe, although thismay not be the case for all crystals included in this study.The gradient in the test glass also suggests that convectivemixing did not take place within the Di60Ab40 melt,which is consistent with the observation of Nowak et al.(2004).
Applying Nowak et al.’s (2004) data to the N2SFoexperiment we find that Ar would have diffused only about0.25 mm into the melt column after 20 h at 1165–1035 �C.However, as for the case of Di60Ab40, we believe thatextrapolating Nowak et al.’s diffusion data to the lowertemperature conditions used in our experiments leads totoo slow estimated diffusion rates. One reason could bethe low viscosity of the N2SFo melt at low temperatures,indicated by the high ratio of non-bridging oxygens per tet-rahedral cation (NBO/T = 1.56). This is supported by apositive correlation of Ar diffusion vs. NBO/T for severalmelt compositions (Nowak et al., 2004). More importantly,the samples of the N2SFo experiments were loaded as glasspowder (grain size 25 lm) into 3 mm capsules and were ex-posed to the high-pressure noble gas medium before melt-ing. On melting, this reduced to half capsule volume(1.7 mm melt column) to give a melt initially full of noblegas bubbles. After some time (<5 h) these bubbles escapeto the gas–melt interface. The duration of the initial meltequilibrium period for the N2SFo experiments (RB587–589) was 1 h at 1165 �C, followed by 3 h between 1165
Please cite this article in press as: Heber, V.S. et al., Crystal–melt pamochim. Acta (2007), doi:10.1016/j.gca.2006.11.010
and 1040 �C. A further 16 h of slow cooling then elapsedbefore crystals began to grow at �1035 �C. For a grain sizeof 25 lm even conservatively used Nowak et al.’s (2004)diffusion coefficients predict Ar equilibration in less than10 min at 1165 �C. Also, the low viscosity and movementof bubbles should have promoted convective/turbulentmixing. Equilibrium of noble gases between the gas phaseand the melt is independently supported by the fact thatall noble gases, including Xe, have similar abundances indifferent aliquots of all N2SFo glasses (Table A.2) after100 h (the overall run duration) which is evident fromthe small uncertainties associated with solubility data(Table 4).
The achievement of noble gas equilibration for thegrowing crystal interface is more difficult to assess. Ifcrystals grew in non-equilibrium conditions, then onemight expect to observe a large range of min/meltDi valuesfor a given noble gas, and among different noble gases.This is, however, difficult to evaluate because errors onthe single min/meltDi values in this study are relatively highas a result of the low gas concentrations in crystals.However, we observe that the min/meltDi of different noblegases show variations consistent with predictions basedon theoretical considerations of trace element partitioning(the open parabola, Brooker et al., 2003a). Furthermore,heavy noble gas min/meltDi values are comparable to thoseof lighter noble gases, as expected from these consider-ations and there is little doubt that equilibrium was reachedin the case of the lighter gases.
A.2. Diffusive loss of He from glass
From a depth profile analysis in a RB588 aliquot(RB588C, data of this analysis are given in Table A.1)and its duration of storage at room temperature beforeanalysis (153 days) we computed a He diffusion coefficientfor N2SFo glasses at 23 �C of 2.4 · 10�14 cm2/s using thediffusion equation for transport normal to surface of a sol-id assuming a semi-infinite medium:
c ¼ c0 erfx
4Dt
� �h i
Fig. A.1 shows the concentration profile of He in compar-ison to Ne as well as the error function fitted through theHe data. The resulting He diffusion coefficient is within
rtitioning of noble gases (helium, neon, argon, ..., Geochim. Cos-
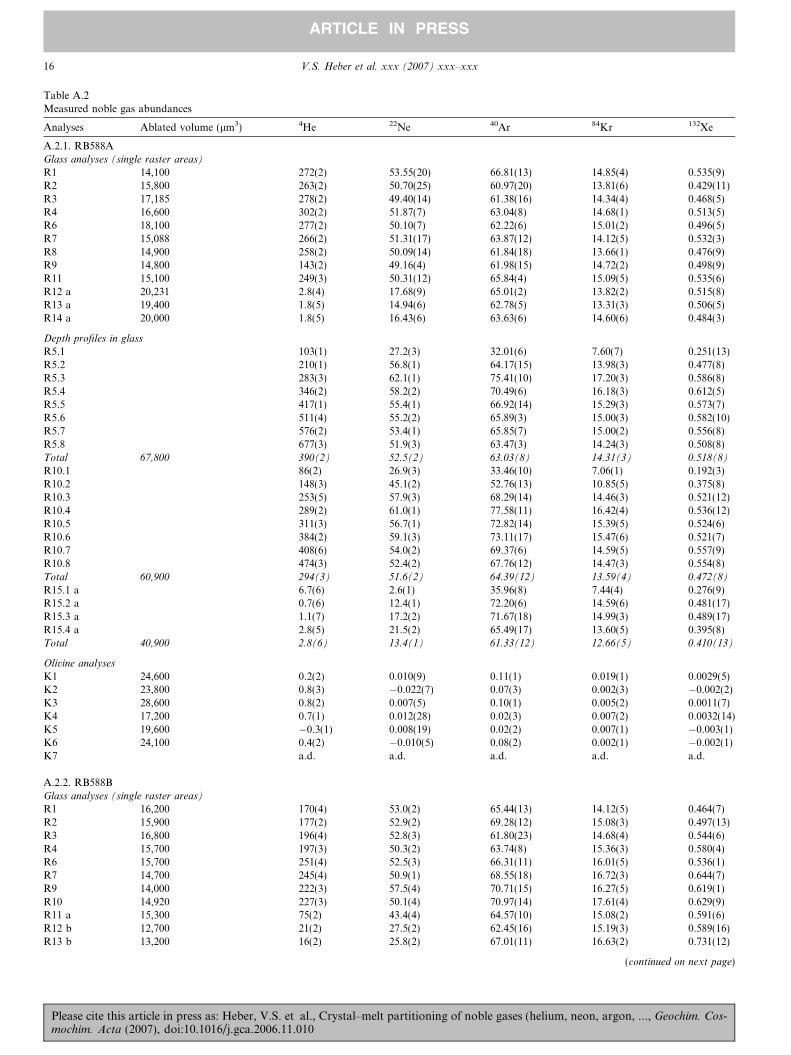
Table A.2Measured noble gas abundances
Analyses Ablated volume (lm3) 4He 22Ne 40Ar 84Kr 132Xe
A.2.1. RB588AGlass analyses (single raster areas)
R1 14,100 272(2) 53.55(20) 66.81(13) 14.85(4) 0.535(9)R2 15,800 263(2) 50.70(25) 60.97(20) 13.81(6) 0.429(11)R3 17,185 278(2) 49.40(14) 61.38(16) 14.34(4) 0.468(5)R4 16,600 302(2) 51.87(7) 63.04(8) 14.68(1) 0.513(5)R6 18,100 277(2) 50.10(7) 62.22(6) 15.01(2) 0.496(5)R7 15,088 266(2) 51.31(17) 63.87(12) 14.12(5) 0.532(3)R8 14,900 258(2) 50.09(14) 61.84(18) 13.66(1) 0.476(9)R9 14,800 143(2) 49.16(4) 61.98(15) 14.72(2) 0.498(9)R11 15,100 249(3) 50.31(12) 65.84(4) 15.09(5) 0.535(6)R12 a 20,231 2.8(4) 17.68(9) 65.01(2) 13.82(2) 0.515(8)R13 a 19,400 1.8(5) 14.94(6) 62.78(5) 13.31(3) 0.506(5)R14 a 20,000 1.8(5) 16.43(6) 63.63(6) 14.60(6) 0.484(3)
Depth profiles in glass
R5.1 103(1) 27.2(3) 32.01(6) 7.60(7) 0.251(13)R5.2 210(1) 56.8(1) 64.17(15) 13.98(3) 0.477(8)R5.3 283(3) 62.1(1) 75.41(10) 17.20(3) 0.586(8)R5.4 346(2) 58.2(2) 70.49(6) 16.18(3) 0.612(5)R5.5 417(1) 55.4(1) 66.92(14) 15.29(3) 0.573(7)R5.6 511(4) 55.2(2) 65.89(3) 15.00(3) 0.582(10)R5.7 576(2) 53.4(1) 65.85(7) 15.00(2) 0.556(8)R5.8 677(3) 51.9(3) 63.47(3) 14.24(3) 0.508(8)Total 67,800 390(2) 52.5(2) 63.03(8) 14.31(3) 0.518(8)
R10.1 86(2) 26.9(3) 33.46(10) 7.06(1) 0.192(3)R10.2 148(3) 45.1(2) 52.76(13) 10.85(5) 0.375(8)R10.3 253(5) 57.9(3) 68.29(14) 14.46(3) 0.521(12)R10.4 289(2) 61.0(1) 77.58(11) 16.42(4) 0.536(12)R10.5 311(3) 56.7(1) 72.82(14) 15.39(5) 0.524(6)R10.6 384(2) 59.1(3) 73.11(17) 15.47(6) 0.521(7)R10.7 408(6) 54.0(2) 69.37(6) 14.59(5) 0.557(9)R10.8 474(3) 52.4(2) 67.76(12) 14.47(3) 0.554(8)Total 60,900 294(3) 51.6(2) 64.39(12) 13.59(4) 0.472(8)
R15.1 a 6.7(6) 2.6(1) 35.96(8) 7.44(4) 0.276(9)R15.2 a 0.7(6) 12.4(1) 72.20(6) 14.59(6) 0.481(17)R15.3 a 1.1(7) 17.2(2) 71.67(18) 14.99(3) 0.489(17)R15.4 a 2.8(5) 21.5(2) 65.49(17) 13.60(5) 0.395(8)Total 40,900 2.8(6) 13.4(1) 61.33(12) 12.66(5) 0.410(13)
Olivine analyses
K1 24,600 0.2(2) 0.010(9) 0.11(1) 0.019(1) 0.0029(5)K2 23,800 0.8(3) �0.022(7) 0.07(3) 0.002(3) �0.002(2)K3 28,600 0.8(2) 0.007(5) 0.10(1) 0.005(2) 0.0011(7)K4 17,200 0.7(1) 0.012(28) 0.02(3) 0.007(2) 0.0032(14)K5 19,600 �0.3(1) 0.008(19) 0.02(2) 0.007(1) �0.003(1)K6 24,100 0.4(2) �0.010(5) 0.08(2) 0.002(1) �0.002(1)K7 a.d. a.d. a.d. a.d. a.d.
A.2.2. RB588BGlass analyses (single raster areas)
R1 16,200 170(4) 53.0(2) 65.44(13) 14.12(5) 0.464(7)R2 15,900 177(2) 52.9(2) 69.28(12) 15.08(3) 0.497(13)R3 16,800 196(4) 52.8(3) 61.80(23) 14.68(4) 0.544(6)R4 15,700 197(3) 50.3(2) 63.74(8) 15.36(3) 0.580(4)R6 15,700 251(4) 52.5(3) 66.31(11) 16.01(5) 0.536(1)R7 14,700 245(4) 50.9(1) 68.55(18) 16.72(3) 0.644(7)R9 14,000 222(3) 57.5(4) 70.71(15) 16.27(5) 0.619(1)R10 14,920 227(3) 50.1(4) 70.97(14) 17.61(4) 0.629(9)R11 a 15,300 75(2) 43.4(4) 64.57(10) 15.08(2) 0.591(6)R12 b 12,700 21(2) 27.5(2) 62.45(16) 15.19(3) 0.589(16)R13 b 13,200 16(2) 25.8(2) 67.01(11) 16.63(2) 0.731(12)
(continued on next page)
16 V.S. Heber et al. xxx (2007) xxx–xxx
ARTICLE IN PRESS
Please cite this article in press as: Heber, V.S. et al., Crystal–melt partitioning of noble gases (helium, neon, argon, ..., Geochim. Cos-mochim. Acta (2007), doi:10.1016/j.gca.2006.11.010
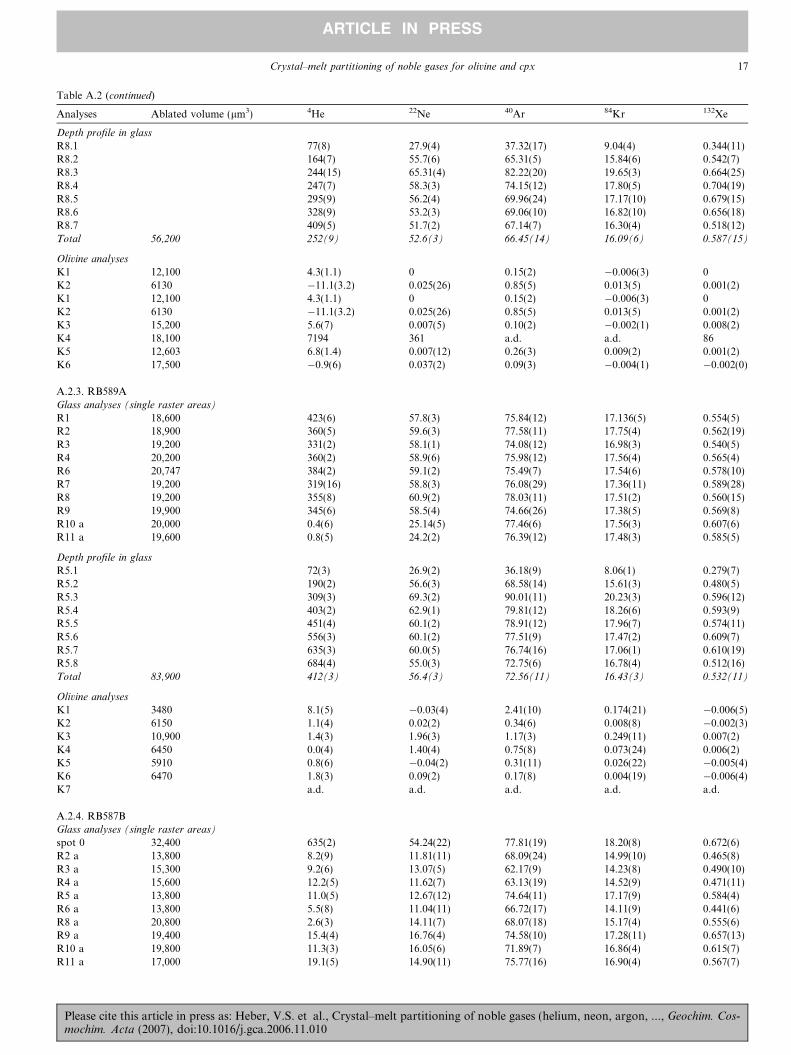
Table A.2 (continued)
Analyses Ablated volume (lm3) 4He 22Ne 40Ar 84Kr 132Xe
Depth profile in glass
R8.1 77(8) 27.9(4) 37.32(17) 9.04(4) 0.344(11)R8.2 164(7) 55.7(6) 65.31(5) 15.84(6) 0.542(7)R8.3 244(15) 65.31(4) 82.22(20) 19.65(3) 0.664(25)R8.4 247(7) 58.3(3) 74.15(12) 17.80(5) 0.704(19)R8.5 295(9) 56.2(4) 69.96(24) 17.17(10) 0.679(15)R8.6 328(9) 53.2(3) 69.06(10) 16.82(10) 0.656(18)R8.7 409(5) 51.7(2) 67.14(7) 16.30(4) 0.518(12)Total 56,200 252(9) 52.6(3) 66.45(14) 16.09(6) 0.587(15)
Olivine analyses
K1 12,100 4.3(1.1) 0 0.15(2) �0.006(3) 0K2 6130 �11.1(3.2) 0.025(26) 0.85(5) 0.013(5) 0.001(2)K1 12,100 4.3(1.1) 0 0.15(2) �0.006(3) 0K2 6130 �11.1(3.2) 0.025(26) 0.85(5) 0.013(5) 0.001(2)K3 15,200 5.6(7) 0.007(5) 0.10(2) �0.002(1) 0.008(2)K4 18,100 7194 361 a.d. a.d. 86K5 12,603 6.8(1.4) 0.007(12) 0.26(3) 0.009(2) 0.001(2)K6 17,500 �0.9(6) 0.037(2) 0.09(3) �0.004(1) �0.002(0)
A.2.3. RB589AGlass analyses (single raster areas)
R1 18,600 423(6) 57.8(3) 75.84(12) 17.136(5) 0.554(5)R2 18,900 360(5) 59.6(3) 77.58(11) 17.75(4) 0.562(19)R3 19,200 331(2) 58.1(1) 74.08(12) 16.98(3) 0.540(5)R4 20,200 360(2) 58.9(6) 75.98(12) 17.56(4) 0.565(4)R6 20,747 384(2) 59.1(2) 75.49(7) 17.54(6) 0.578(10)R7 19,200 319(16) 58.8(3) 76.08(29) 17.36(11) 0.589(28)R8 19,200 355(8) 60.9(2) 78.03(11) 17.51(2) 0.560(15)R9 19,900 345(6) 58.5(4) 74.66(26) 17.38(5) 0.569(8)R10 a 20,000 0.4(6) 25.14(5) 77.46(6) 17.56(3) 0.607(6)R11 a 19,600 0.8(5) 24.2(2) 76.39(12) 17.48(3) 0.585(5)
Depth profile in glass
R5.1 72(3) 26.9(2) 36.18(9) 8.06(1) 0.279(7)R5.2 190(2) 56.6(3) 68.58(14) 15.61(3) 0.480(5)R5.3 309(3) 69.3(2) 90.01(11) 20.23(3) 0.596(12)R5.4 403(2) 62.9(1) 79.81(12) 18.26(6) 0.593(9)R5.5 451(4) 60.1(2) 78.91(12) 17.96(7) 0.574(11)R5.6 556(3) 60.1(2) 77.51(9) 17.47(2) 0.609(7)R5.7 635(3) 60.0(5) 76.74(16) 17.06(1) 0.610(19)R5.8 684(4) 55.0(3) 72.75(6) 16.78(4) 0.512(16)Total 83,900 412(3) 56.4(3) 72.56(11) 16.43(3) 0.532(11)
Olivine analyses
K1 3480 8.1(5) �0.03(4) 2.41(10) 0.174(21) �0.006(5)K2 6150 1.1(4) 0.02(2) 0.34(6) 0.008(8) �0.002(3)K3 10,900 1.4(3) 1.96(3) 1.17(3) 0.249(11) 0.007(2)K4 6450 0.0(4) 1.40(4) 0.75(8) 0.073(24) 0.006(2)K5 5910 0.8(6) �0.04(2) 0.31(11) 0.026(22) �0.005(4)K6 6470 1.8(3) 0.09(2) 0.17(8) 0.004(19) �0.006(4)K7 a.d. a.d. a.d. a.d. a.d.
A.2.4. RB587BGlass analyses (single raster areas)
spot 0 32,400 635(2) 54.24(22) 77.81(19) 18.20(8) 0.672(6)R2 a 13,800 8.2(9) 11.81(11) 68.09(24) 14.99(10) 0.465(8)R3 a 15,300 9.2(6) 13.07(5) 62.17(9) 14.23(8) 0.490(10)R4 a 15,600 12.2(5) 11.62(7) 63.13(19) 14.52(9) 0.471(11)R5 a 13,800 11.0(5) 12.67(12) 74.64(11) 17.17(9) 0.584(4)R6 a 13,800 5.5(8) 11.04(11) 66.72(17) 14.11(9) 0.441(6)R8 a 20,800 2.6(3) 14.11(7) 68.07(18) 15.17(4) 0.555(6)R9 a 19,400 15.4(4) 16.76(4) 74.58(10) 17.28(11) 0.657(13)R10 a 19,800 11.3(3) 16.05(6) 71.89(7) 16.86(4) 0.615(7)R11 a 17,000 19.1(5) 14.90(11) 75.77(16) 16.90(4) 0.567(7)
Crystal–melt partitioning of noble gases for olivine and cpx 17
ARTICLE IN PRESS
Please cite this article in press as: Heber, V.S. et al., Crystal–melt partitioning of noble gases (helium, neon, argon, ..., Geochim. Cos-mochim. Acta (2007), doi:10.1016/j.gca.2006.11.010
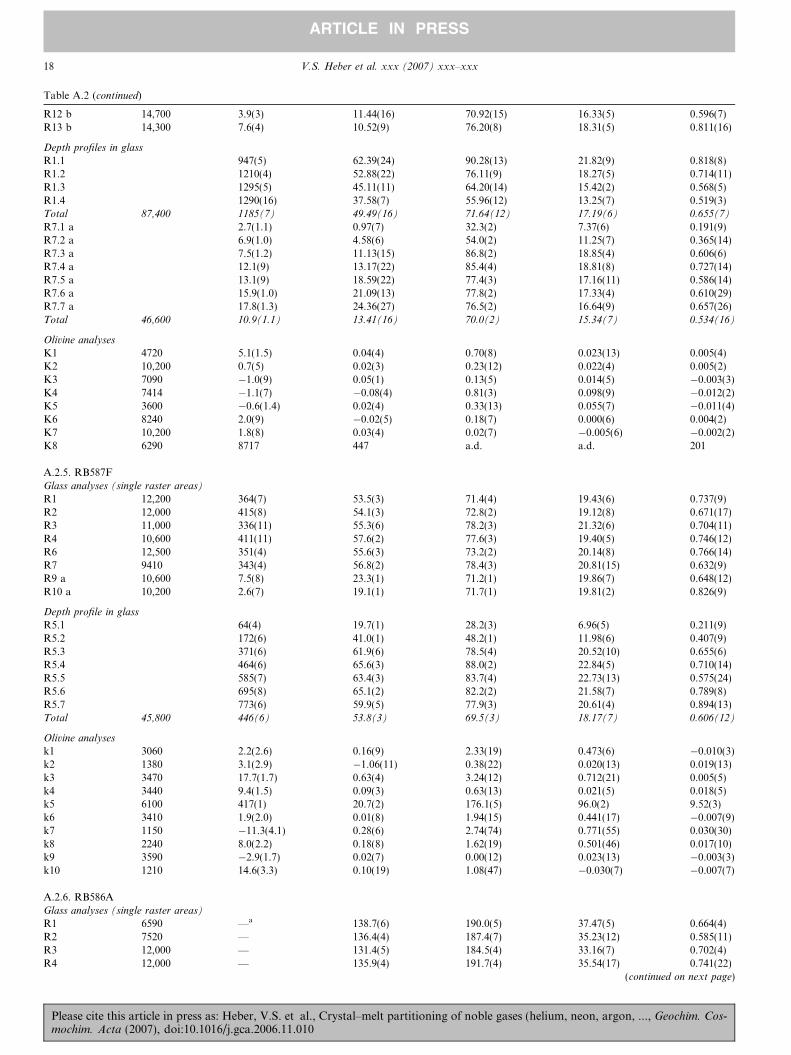
Table A.2 (continued)
R12 b 14,700 3.9(3) 11.44(16) 70.92(15) 16.33(5) 0.596(7)R13 b 14,300 7.6(4) 10.52(9) 76.20(8) 18.31(5) 0.811(16)
Depth profiles in glass
R1.1 947(5) 62.39(24) 90.28(13) 21.82(9) 0.818(8)R1.2 1210(4) 52.88(22) 76.11(9) 18.27(5) 0.714(11)R1.3 1295(5) 45.11(11) 64.20(14) 15.42(2) 0.568(5)R1.4 1290(16) 37.58(7) 55.96(12) 13.25(7) 0.519(3)Total 87,400 1185(7) 49.49(16) 71.64(12) 17.19(6) 0.655(7)
R7.1 a 2.7(1.1) 0.97(7) 32.3(2) 7.37(6) 0.191(9)R7.2 a 6.9(1.0) 4.58(6) 54.0(2) 11.25(7) 0.365(14)R7.3 a 7.5(1.2) 11.13(15) 86.8(2) 18.85(4) 0.606(6)R7.4 a 12.1(9) 13.17(22) 85.4(4) 18.81(8) 0.727(14)R7.5 a 13.1(9) 18.59(22) 77.4(3) 17.16(11) 0.586(14)R7.6 a 15.9(1.0) 21.09(13) 77.8(2) 17.33(4) 0.610(29)R7.7 a 17.8(1.3) 24.36(27) 76.5(2) 16.64(9) 0.657(26)Total 46,600 10.9(1.1) 13.41(16) 70.0(2) 15.34(7) 0.534(16)
Olivine analyses
K1 4720 5.1(1.5) 0.04(4) 0.70(8) 0.023(13) 0.005(4)K2 10,200 0.7(5) 0.02(3) 0.23(12) 0.022(4) 0.005(2)K3 7090 �1.0(9) 0.05(1) 0.13(5) 0.014(5) �0.003(3)K4 7414 �1.1(7) �0.08(4) 0.81(3) 0.098(9) �0.012(2)K5 3600 �0.6(1.4) 0.02(4) 0.33(13) 0.055(7) �0.011(4)K6 8240 2.0(9) �0.02(5) 0.18(7) 0.000(6) 0.004(2)K7 10,200 1.8(8) 0.03(4) 0.02(7) �0.005(6) �0.002(2)K8 6290 8717 447 a.d. a.d. 201
A.2.5. RB587FGlass analyses (single raster areas)
R1 12,200 364(7) 53.5(3) 71.4(4) 19.43(6) 0.737(9)R2 12,000 415(8) 54.1(3) 72.8(2) 19.12(8) 0.671(17)R3 11,000 336(11) 55.3(6) 78.2(3) 21.32(6) 0.704(11)R4 10,600 411(11) 57.6(2) 77.6(3) 19.40(5) 0.746(12)R6 12,500 351(4) 55.6(3) 73.2(2) 20.14(8) 0.766(14)R7 9410 343(4) 56.8(2) 78.4(3) 20.81(15) 0.632(9)R9 a 10,600 7.5(8) 23.3(1) 71.2(1) 19.86(7) 0.648(12)R10 a 10,200 2.6(7) 19.1(1) 71.7(1) 19.81(2) 0.826(9)
Depth profile in glass
R5.1 64(4) 19.7(1) 28.2(3) 6.96(5) 0.211(9)R5.2 172(6) 41.0(1) 48.2(1) 11.98(6) 0.407(9)R5.3 371(6) 61.9(6) 78.5(4) 20.52(10) 0.655(6)R5.4 464(6) 65.6(3) 88.0(2) 22.84(5) 0.710(14)R5.5 585(7) 63.4(3) 83.7(4) 22.73(13) 0.575(24)R5.6 695(8) 65.1(2) 82.2(2) 21.58(7) 0.789(8)R5.7 773(6) 59.9(5) 77.9(3) 20.61(4) 0.894(13)Total 45,800 446(6) 53.8(3) 69.5(3) 18.17(7) 0.606(12)
Olivine analyses
k1 3060 2.2(2.6) 0.16(9) 2.33(19) 0.473(6) �0.010(3)k2 1380 3.1(2.9) �1.06(11) 0.38(22) 0.020(13) 0.019(13)k3 3470 17.7(1.7) 0.63(4) 3.24(12) 0.712(21) 0.005(5)k4 3440 9.4(1.5) 0.09(3) 0.63(13) 0.021(5) 0.018(5)k5 6100 417(1) 20.7(2) 176.1(5) 96.0(2) 9.52(3)k6 3410 1.9(2.0) 0.01(8) 1.94(15) 0.441(17) �0.007(9)k7 1150 �11.3(4.1) 0.28(6) 2.74(74) 0.771(55) 0.030(30)k8 2240 8.0(2.2) 0.18(8) 1.62(19) 0.501(46) 0.017(10)k9 3590 �2.9(1.7) 0.02(7) 0.00(12) 0.023(13) �0.003(3)k10 1210 14.6(3.3) 0.10(19) 1.08(47) �0.030(7) �0.007(7)
A.2.6. RB586AGlass analyses (single raster areas)
R1 6590 —a 138.7(6) 190.0(5) 37.47(5) 0.664(4)R2 7520 — 136.4(4) 187.4(7) 35.23(12) 0.585(11)R3 12,000 — 131.4(5) 184.5(4) 33.16(7) 0.702(4)R4 12,000 — 135.9(4) 191.7(4) 35.54(17) 0.741(22)
(continued on next page)
18 V.S. Heber et al. xxx (2007) xxx–xxx
ARTICLE IN PRESS
Please cite this article in press as: Heber, V.S. et al., Crystal–melt partitioning of noble gases (helium, neon, argon, ..., Geochim. Cos-mochim. Acta (2007), doi:10.1016/j.gca.2006.11.010
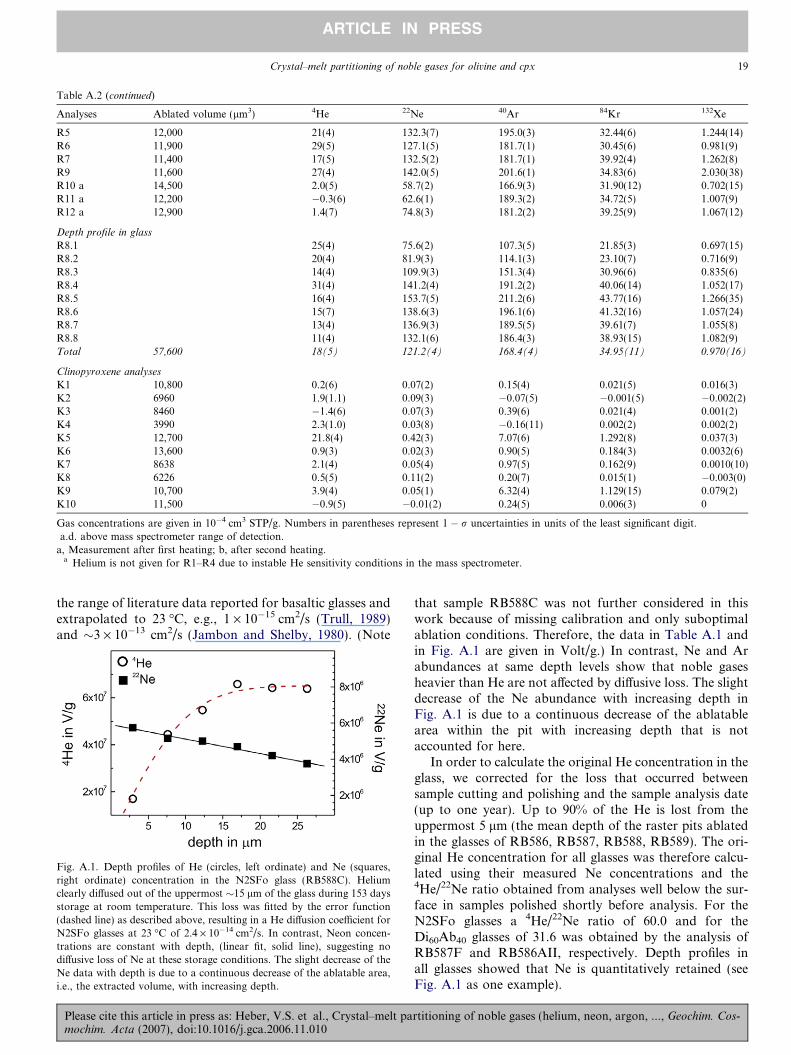
Table A.2 (continued)
Analyses Ablated volume (lm3) 4He 22Ne 40Ar 84Kr 132Xe
R5 12,000 21(4) 132.3(7) 195.0(3) 32.44(6) 1.244(14)R6 11,900 29(5) 127.1(5) 181.7(1) 30.45(6) 0.981(9)R7 11,400 17(5) 132.5(2) 181.7(1) 39.92(4) 1.262(8)R9 11,600 27(4) 142.0(5) 201.6(1) 34.83(6) 2.030(38)R10 a 14,500 2.0(5) 58.7(2) 166.9(3) 31.90(12) 0.702(15)R11 a 12,200 �0.3(6) 62.6(1) 189.3(2) 34.72(5) 1.007(9)R12 a 12,900 1.4(7) 74.8(3) 181.2(2) 39.25(9) 1.067(12)
Depth profile in glass
R8.1 25(4) 75.6(2) 107.3(5) 21.85(3) 0.697(15)R8.2 20(4) 81.9(3) 114.1(3) 23.10(7) 0.716(9)R8.3 14(4) 109.9(3) 151.3(4) 30.96(6) 0.835(6)R8.4 31(4) 141.2(4) 191.2(2) 40.06(14) 1.052(17)R8.5 16(4) 153.7(5) 211.2(6) 43.77(16) 1.266(35)R8.6 15(7) 138.6(3) 196.1(6) 41.32(16) 1.057(24)R8.7 13(4) 136.9(3) 189.5(5) 39.61(7) 1.055(8)R8.8 11(4) 132.1(6) 186.4(3) 38.93(15) 1.082(9)Total 57,600 18(5) 121.2(4) 168.4(4) 34.95(11) 0.970(16)
Clinopyroxene analyses
K1 10,800 0.2(6) 0.07(2) 0.15(4) 0.021(5) 0.016(3)K2 6960 1.9(1.1) 0.09(3) �0.07(5) �0.001(5) �0.002(2)K3 8460 �1.4(6) 0.07(3) 0.39(6) 0.021(4) 0.001(2)K4 3990 2.3(1.0) 0.03(8) �0.16(11) 0.002(2) 0.002(2)K5 12,700 21.8(4) 0.42(3) 7.07(6) 1.292(8) 0.037(3)K6 13,600 0.9(3) 0.02(3) 0.90(5) 0.184(3) 0.0032(6)K7 8638 2.1(4) 0.05(4) 0.97(5) 0.162(9) 0.0010(10)K8 6226 0.5(5) 0.11(2) 0.20(7) 0.015(1) �0.003(0)K9 10,700 3.9(4) 0.05(1) 6.32(4) 1.129(15) 0.079(2)K10 11,500 �0.9(5) �0.01(2) 0.24(5) 0.006(3) 0
Gas concentrations are given in 10�4 cm3 STP/g. Numbers in parentheses represent 1 � r uncertainties in units of the least significant digit.a.d. above mass spectrometer range of detection.
a, Measurement after first heating; b, after second heating.a Helium is not given for R1–R4 due to instable He sensitivity conditions in the mass spectrometer.
Crystal–melt partitioning of noble gases for olivine and cpx 19
ARTICLE IN PRESS
the range of literature data reported for basaltic glasses andextrapolated to 23 �C, e.g., 1 · 10�15 cm2/s (Trull, 1989)and �3 · 10�13 cm2/s (Jambon and Shelby, 1980). (Note
Fig. A.1. Depth profiles of He (circles, left ordinate) and Ne (squares,right ordinate) concentration in the N2SFo glass (RB588C). Heliumclearly diffused out of the uppermost �15 lm of the glass during 153 daysstorage at room temperature. This loss was fitted by the error function(dashed line) as described above, resulting in a He diffusion coefficient forN2SFo glasses at 23 �C of 2.4 · 10�14 cm2/s. In contrast, Neon concen-trations are constant with depth, (linear fit, solid line), suggesting nodiffusive loss of Ne at these storage conditions. The slight decrease of theNe data with depth is due to a continuous decrease of the ablatable area,i.e., the extracted volume, with increasing depth.
Please cite this article in press as: Heber, V.S. et al., Crystal–melt pamochim. Acta (2007), doi:10.1016/j.gca.2006.11.010
that sample RB588C was not further considered in thiswork because of missing calibration and only suboptimalablation conditions. Therefore, the data in Table A.1 andin Fig. A.1 are given in Volt/g.) In contrast, Ne and Arabundances at same depth levels show that noble gasesheavier than He are not affected by diffusive loss. The slightdecrease of the Ne abundance with increasing depth inFig. A.1 is due to a continuous decrease of the ablatablearea within the pit with increasing depth that is notaccounted for here.
In order to calculate the original He concentration in theglass, we corrected for the loss that occurred betweensample cutting and polishing and the sample analysis date(up to one year). Up to 90% of the He is lost from theuppermost 5 lm (the mean depth of the raster pits ablatedin the glasses of RB586, RB587, RB588, RB589). The ori-ginal He concentration for all glasses was therefore calcu-lated using their measured Ne concentrations and the4He/22Ne ratio obtained from analyses well below the sur-face in samples polished shortly before analysis. For theN2SFo glasses a 4He/22Ne ratio of 60.0 and for theDi60Ab40 glasses of 31.6 was obtained by the analysis ofRB587F and RB586AII, respectively. Depth profiles inall glasses showed that Ne is quantitatively retained (seeFig. A.1 as one example).
rtitioning of noble gases (helium, neon, argon, ..., Geochim. Cos-
20 V.S. Heber et al. xxx (2007) xxx–xxx
ARTICLE IN PRESS
References
Albarede, F., 1998. Time-dependent models of U–Th–He and K–Arevolution and the layering of mantle convection. Chem. Geol. 145, 413–429.
Allan, N.L., Du, Z., Lavrentiev, M.Y., Blundy, J.D., Purton, J.A.,van Westrenen, W., 2003. Atomistic simulation of mineral–melttrace-element partitioning. Phys. Earth Planet. Interiors 139, 93–111.
Allegre, C., Hamelin, B., Provost, A., Dupre, B., 1987. Topology inisotopic multispace and origin of mantle chemical heterogeneities.
Earth Planet. Sci. Lett. 81, 319–337.Allegre, C., Moreira, M., 2004. Rare gas systematics and the origin of
oceanic islands: the key role of entrainment at the 670 km boundarylayer. Earth Planet. Sci. Lett. 228, 85–92.
Ballentine, C.J., van Keken, P.E., Porcelli, D., Hauri, E.H., 2002.Numerical models, geochemistry and the zero-paradox noble gasmantle. Philos. Trans. R. Soc. Lond. A 360, 2611–2631.
Ballentine, C.J., van Keken, P.E., Porcelli, D., Hauri, E.H., 2003. Noblegases and changing models of mantle evolution. Geophys. Res. Abstr.
5, 14588.Beattie, P., 1993. The generation of uranium series disequilibria by partial
melting of spinel peridotite: constraints from partitioning studies.
Earth Planet. Sci. Lett. 117 (3–4), 379–391.Bijwaard, H., Spakman, W., 1998. Closing gap between regional and global
travel time tomography. J. Geophys. Res. 103 (B12), 30055–30078.Blundy, J., Wood, B., 1994. Prediction of crystal–melt partition coeffi-
cients from elastic moduli. Nature 372, 452–454.Broadhurst, C.L., Drake, M.J., Hagee, B.E., Bernatowicz, T.J., 1990.
Solubility and partitioning of Ar in anorthite, diopside, forsterite,spinel, and synthetic basaltic liquids. Geochim. Cosmochim. Acta 54,299–309.
Broadhurst, C.L., Drake, M.J., Hagee, B.E., Bernatowicz, T.J., 1992.Solubility and partitioning of Ne, Ar, Kr and Xe in minerals andsynthetic basaltic melts. Geochim. Cosmochim. Acta 56, 709–723.
Brooker, R.A., Du, Z., Blundy, J., Kelley, S.P., Allan, N.L., Wood, B.,Chamorro, E.M., Wartho, J.-A., Purton, J.A., 2003a. The ‘zerocharge’ partitioning behaviour of noble gases during mantle melting.
Nature 423, 738–741.Brooker, R.A., Heber, V.S., Kelley, S.P., Wood, B., 2003b. Noble gas
partitioning behaviour during mantle melting: a possible explanationfor ‘The He paradox’? EOS Trans. AGU, Fall meet. Suppl.
Brooker, R.A., Wartho, J.-A., Carroll, M.R., Kelley, S.P., Draper, D.S.,1998. Preliminary UVLAMP determinations of argon partitioncoefficient for olivine and clinopyroxene grown from silicate melts.
Chem. Geol. 147, 185–200.Carroll, M.R., Draper, D.S., 1994. Noble gases as trace elements in
magmatic processes. Chem. Geol. 117, 37–56.Carroll, M.R., Draper, D.S., Brooker, R.A., Kelley, S.P., 1994. Noble gas
solubilities in melt and crystals. In: Matsuda, J. (Ed.), Noble Gas
Geochemistry and Cosmochemistry. Terra Scientific Publishing Com-pany, pp. 325–341.
Carroll, M.R., Stolper, E.M., 1993. Noble gas solubilities in silicate meltsand glasses—new experimental results for argon and the relationshipbetween solubility and ionic porosity. Geochim. Cosmochim. Acta 57
(23–24), 5039–5051.Chamorro, E.M., Brooker, R.A., Wartho, J.-A., Wood, B.J., Kelley, S.P.,
Blundy, J.D., 2002. Ar and K partitioning between clinopyroxene andsilicate melt to 8 GPa. Geochim. Cosmochim. Acta 66 (3), 507–519.
Class, C., Goldstein, S.L., 2005. Evolution of helium isotopes in theEarth’s mantle. Nature 436, 1107–1112.
Deer, W.A., Howie, R.A., Zussmann, J., 1992. An Introduction to the
Rock-Forming Minerals. Longman, London.Dingwell, D.B., Hess, K.U., Romano, C., 1998. Extreme fluid behaviour
of hydrous peralkaline rhyolites. Earth Planet. Sci. Lett. 158, 31–38.Donaldson, C.H., 1975. An experimental investigation of olivine mor-
phology. Contrib. Mineral. Petrol. 57, 187–213.
Please cite this article in press as: Heber, V.S. et al., Crystal–melt pamochim. Acta (2007), doi:10.1016/j.gca.2006.11.010
Farley, K.A., Neroda, E., 1998. Noble gases in the Earth’s mantle. Annu.
Rev. Earth Planet. Sci. 26, 189–218.Fukao, Y., Widiyantoro, S., Obayashi, M., 2001. Stagnant slabs in the upper
and lower mantle transition region. Rev. Geophys. 39 (3), 291–323.Gale, J.D., 1997. GULP: A computer program for the symmetry-adapted
simulation of solids. J. Chem. Soc. Faraday Trans. 93, 629–637.Graham, D., 2002. Noble gas isotope geochemistry of MORBs and OIBs.
In: Porcelli, D., Ballentine, C.J., Wieler, R. (Eds.), Noble Gases in
Geochemistry and Cosmochemistry. Rev. Min. Geochem., vol. 46, pp.247–317.
Graham, D., Lupton, J., Albarede, F., Condomines, M., 1990. Extremetemporal homogeneity of helium isotopes at Piton de la Fournaise,Reunion Island. Nature 347, 545–548.
Hart, S.R., Brooks, C., 1974. Clinopyroxene-matrix partitioning of K,Rb, Cs, Sr and Ba. Geochim. Cosmochim. Acta 38 (12), 1799–1806.
Hazelton, G.B., Axen, G., Lovera, O., 2003. Argon retention properties ofsilicate glasses and implications for 40Ar/39Ar age and noble gasdiffusion. Contrib. Mineral. Petrol. 145, 1–14.
Heber, V.S., 2002. Ancient solar wind noble gases in lunar and meteoriticarchives and tests for modern solar wind collection with the GENESISmission. PhD Thesis. ETH Zurich, Switzerland.
Heber, V.S., Brooker, R.A., Kelley, S.P., Wood, B.J., 2004. Diffusionbehaviour of noble gases in mantle minerals: high resolution UV laserdepth profiling. In: 10th Symposium on Experimental Mineralogy,
Petrology and Geochemistry, Lithos 73, S49.Hiyagon, H., Ozima, M., 1986. Partitioning of noble gases between
olivine and basalt melt. Geochim. Cosmochim. Acta 50, 2045–2057.
Hofmann, A.W., 1997. Mantle geochemistry: the message from oceanicvolcanism. Nature 385, 219–229.
Jambon, A., Shelby, J.E., 1980. Helium diffusion and solubility inobsidians and basaltic glass in the range 200–300 �C. Earth Planet.
Sci. Lett. 51, 206–214.Jambon, A., Weber, H.W., Braun, O., 1986. Solubility of He, Ne, Ar, Kr,
and Xe in a basalt melt in the range 1250–1600 �C. Geochemicalimplications. Geochim. Cosmochim. Acta 50, 401–408.
Kamijo, K., Hashizume, K., Matsuda, J., 1998. Noble gas constraints onthe evolution of the atmosphere-mantle system. Geochim. Cosmochim.
Acta 62 (13), 2311–2321.Kaneoka, I., 1983. Noble gas constraints on the layered structure of the
mantle. Nature 302, 698–700.Kelley, S.P., Arnaud, N.O., Turner, S.P., 1994. High spatial resolution
40Ar/39Ar investigations using an ultra-violet laser probe extractiontechnique. Geochim. Cosmochim. Acta 58 (16), 3519–3525.
Kurz, M.D., Jenkins, W.J., Schilling, J.G., Hart, S.R., 1982. Heliumisotopic variations in the mantle beneath the central North AtlanticOcean. Earth Planet. Sci. Lett. 58, 1–14.
Lange, R.M., Carmichael, I.S.E., 1987. Densities of Na2O–K2O–CaO–MgO–FeO–Fe2O3–Al2O3–TiO2–SiO2 liquids: new measurements andderived partial molar properties. Geochim. Cosmochim. Acta 51, 1549–1560.
Lux, G., 1987. The behaviour of noble gases in silicate liquids: solution,diffusion, bubbles and surface effects, with applications to naturalsamples. Geochim. Cosmochim. Acta 51, 1549–1560.
Marty, B., Lussiez, P., 1993. Constraints on rare gas partitioningcoefficients from analysis of olivine-glass from a picritic mid-oceanicridge basalt. Chem. Geol. 106, 1–7.
Meibom, A., Anderson, D.L., Sleep, N.H.R.F., Chamberlain, C.P., Hren,M.T., Wooden, J.L., 2003. Are high He-3/He-4 ratios in oceanicbasalts an indicator of deep-mantle plume components? Earth Planet.
Sci. Lett. 208 (3–4), 197–204.Miyazaki, A., Hiyagon, H., Sugiura, N., Hirose, K., Takahashi, E., 2004.
Solubilities of nitrogen and noble gases in silicate melts under variousoxygen fugacities: implications for the origin and degassing history ofnitrogen and noble gases in the Earth. Geochim. Cosmochim. Acta 68
(2), 387–401.
rtitioning of noble gases (helium, neon, argon, ..., Geochim. Cos-
Crystal–melt partitioning of noble gases for olivine and cpx 21
ARTICLE IN PRESS
Nakamura, A., Schmalzried, H., 1983. On the nonstoichiometry andpoint-defects of olivine. Phys. Chem. Miner. 10, 27–37.
Nowak, M., Schreen, D., Spickenbom, K., 2004. Argon and CO2 on therace track in silicate melts: a tool for the development of a CO2
speciation and diffusion model. Geochim. Cosmochim. Acta 68 (24),5127–5138.
O’Nions, R.K., 1987. Relationships between chemical and convectivelayering in the Earth. J. Geol. Soc. Lond. 144, 259–274.
Ozima, M., Igarashi, G., 2000. The primordial noble gases in the Earth: akey constraint on Earth evolution models. Earth Planet. Sci. Lett. 176,219–232.
Ozima, M., Podosek, F.A., 2002. Noble Gas Geochemistry. CambridgeUniversity Press, Cambridge.
Parman, S.W., Kurz, M.D., Hart, S.R., Grove, T.L., 2005. Heliumsolubility in olivine and implications for high 3He/4He in ocean islandbasalts. Nature 437, 1140–1143.
Porcelli, D., Wasserburg, G.J., 1995. Mass transfer of helium, neon,argon, and xenon through a steady-state upper mantle. Geochim.
Cosmochim. Acta 59 (23), 4921–4937.Porcelli, D., Woolum, D., Cassen, P., 2001. Deep Earth rare gases: initial
inventories, capture from the solar nebula, and losses during Moonformation. Earth Planet. Sci. Lett. 193 (1–2), 237–251.
Roberts, H.J., 1999. An investigation of a polymetamorphic terrain using40Ar–39Ar geochronology. PhD Thesis. The Open University, MiltonKeynes, UK.
Roselieb, K., Blanc, P., Buttner, H., Jambon, A., Rammensee, W.,Rosenhauer, M., Vielzeuf, D., Walter, H., 1997. Experimental study ofargon sorption in quartz: evidence for argon solubility. Geochim.
Cosmochim. Acta 61, 533–542.Schmidt, B.C., Keppler, H., 2002. Experimental evidence for high noble
gas solubilities in silicate melts under mantle pressures. Earth Planet.
Sci. Lett. 195, 277–290.Shibata, T., Takahashi, E., Ozima, M., 1994. Noble gas partition between
basaltic melt and olivine crystals at high pressures. In: Matsuda, J.(Ed.), Noble Gas Geochemistry and Cosmochemistry. Terrapub, pp.343–354.
Please cite this article in press as: Heber, V.S. et al., Crystal–melt pamochim. Acta (2007), doi:10.1016/j.gca.2006.11.010
Smyth, D.M., Stocker, R.L., 1975. Point defects and nonstoichiometry inforsterite. Phys. Earth Planet. Int. 10, 183–192.
Trull, T.W., 1989. Diffusion of helium isotopes in silicate glasses andminerals; implications for petrogenesis and geochronology. Thesis,PhD Thesis. MIT, Cambridge, MA, USA.
Trull, T.W., Kurz, M.D., 1993. Experimental measurements of 3He and4He mobility in olivine and clinopyroxene at magmatic temperatures.
Geochim. Cosmochim. Acta 57, 1313–1324.Valbracht, P.J., Honda, M., Staudigel, H., McDougall, I., Trost, A.P.,
1994. Noble gas partitioning in natural samples: results from coexis-ting glass and olivine phenocrysts in four Hawaiian submarine basalts.In: Matsuda, J. (Ed.), Noble Gas Geochemistry and Cosmochemistry.Terrapub, pp. 373–381.
van der Hilst, R.D., Widiyantoro, S., Engdahl, E.R., 1997. Evidence fordeep mantle circulation from global tomography. Nature 386, 578–585.
van Keken, P.E., Ballentine, C.J., 1999. Dynamical models of mantlevolatile evolution and the role of phase transitions and temperature-dependent rheology. J. Geophys. Res. 104 (B4), 7137–7151.
van Keken, P.E., Hauri, E.H., Ballentine, C.J., 2002. Mantle mixing: thegeneration, preservation and destruction of chemical heterogeneity.
Annu. Rev. Earth Planet. Sci. 30, 493–525.Wartho, J.-A., Kelley, S.P., Brooker, R.A., Carroll, M.R., Villa, I.M.,
Lee, R.L., 1999. Direct measurement of Ar diffusion profiles in a gem-quality Madagascar K-feldspar using the ultra-violet laser ablationmicroprobe (UVLAMP). Earth Planet. Sci. Lett. 170, 141–153.
Watson, E.B., Cherniak, D.J., 2003. Lattice diffusion of Ar in quartz, withconstraints on Ar solubility and evidence of nanopores. Geochim.
Cosmochim. Acta 67 (11), 2043–2062.Wood, B.J., Blundy, J.D., 2001. The effect of cation charge on crystal–melt
partitioning of trace elements. Earth Planet. Sci. Lett. 188 (1–2), 59–71.Wood, B.J., Blundy, J.D., Robinson, J.A.C., 1999. The role of clinopy-
roxene in generating U-series disequilibrium during mantle melting.
Geochim. Cosmochim. Acta 63 (10), 1613–1620.Zhang, Y., Xu, Z., 1995. Atomic radii of noble gas elements in condensed
phases. Am. Mineral. 80, 670–675.
rtitioning of noble gases (helium, neon, argon, ..., Geochim. Cos-
Related Documents


