Crystalline phase characterization of glass-ceramic glazes M.G. Rasteiro a, * , Tiago Gassman b , R. Santos c , E. Antunes a a Chemical Engineering Department, Coimbra University, Po ´lo II, Pinhal de Marrocos, 3030-290 Coimbra, Portugal b Colorobbia Portugal, Anadia, Portugal c Centro Tecnolo ´gico da Cera ˆmica e do Vidro, Coimbra, Portugal Received 6 May 2005; received in revised form 2 September 2005; accepted 3 October 2005 Available online 18 January 2006 Abstract The firing process of five raw crystalline frits was investigated by means of DTA, XRD, heating microscopy and dilatometry. The chemical composition of the frits was determined by FAAS, to define the main glass-ceramic system of each frit. The final crystalline structure detected for the sintered frits conformed to the temperatures for which transformations were obtained during heating. The existence of a relationship between the crystallization process and sintering behaviour was confirmed. During devitrification, the sintering process stops, confirming that crystalline formation affects the sintering behaviour of the frits. In this case, the thermal properties of the final product are not only dependent on oxide composition but also on the crystalline phases. It was established that the addition of adequate compounds could induce the formation of crystalline phases on some glass-ceramic frits. # 2005 Elsevier Ltd and Techna Group S.r.l. All rights reserved. Keywords: A. Sintering; D. Glass-ceramics; D. Glass; Crystallization 1. Introduction In recent years there have been changes in the properties of everyday ceramic products, because of the need of improving the resistance of ceramic tiles due to its use, for instance, on floors of large commercial areas. In these applications the traditional glaze has a too low abrasive resistance and loses its surface characteristics such as brightness, colour and superficial texture very easily [1]. Thus, it became necessary to develop new products to satisfy the requirements of the ceramic tile industry and the demand of coatings with specific properties. These features can be achieved using suitable glass-ceramic compositions [2]. Glass-ceramic materials are polycrystalline solids with a residual glassy matrix leading to a polycrystalline microstructure that allows achievement of a better performance to abrasiveness and an increased resistance compared to traditional glasses [2]. This microstructure can be obtained by a sintering process where crystallization and densification of glass particles occurs during firing. Glazes are commonly applied on surfaces as aqueous suspensions of frits and other additives, also called enamels [2]. Frits are particles of pre-melted glass and, in the case of glass- ceramic glazes these frits show a glass-ceramic system. However, it is necessary to control the crystallisation process to obtain a product with appropriate technical properties and adequate aesthetics [3]. In fact, it has been shown that to get a well-crystallized product with minimum porosity, glass particles must densify before crystallization starts. Therefore, it is necessary to choose an adequate frit composition for the glass-ceramic to sinter in the right moment and to devitrify the desired percentage of crystals. Moreover, it is necessary to keep a sufficient open porosity to allow the escape of the reaction gases formed during firing [2,3]. The final formulation of the enamel depends also on several other factors such as a proper maturation time, required thermal expansion coefficient and on the reactivity with the ceramic support. Indeed, to apply the enamel as a coating, on ceramic body surfaces, it must have a thermal expansion coefficient close to the thermal expansion coefficient of the body (in most cases around 70 10 7 8C 1 ) to avoid strains on the tile [4]. What has been said shows that to formulate new glazes from glass-ceramic systems is a complex process since a lot of factors must be considered simultaneously. Thus, to guarantee www.elsevier.com/locate/ceramint Ceramics International 33 (2007) 345–354 * Corresponding author. Fax: +351 239 798 703. E-mail address: [email protected] (M.G. Rasteiro). 0272-8842/$32.00 # 2005 Elsevier Ltd and Techna Group S.r.l. All rights reserved. doi:10.1016/j.ceramint.2005.10.002

Welcome message from author
This document is posted to help you gain knowledge. Please leave a comment to let me know what you think about it! Share it to your friends and learn new things together.
Transcript
www.elsevier.com/locate/ceramint
Ceramics International 33 (2007) 345–354
Crystalline phase characterization of glass-ceramic glazes
M.G. Rasteiro a,*, Tiago Gassman b, R. Santos c, E. Antunes a
a Chemical Engineering Department, Coimbra University, Polo II,
Pinhal de Marrocos, 3030-290 Coimbra, Portugalb Colorobbia Portugal, Anadia, Portugal
c Centro Tecnologico da Ceramica e do Vidro, Coimbra, Portugal
Received 6 May 2005; received in revised form 2 September 2005; accepted 3 October 2005
Available online 18 January 2006
Abstract
The firing process of five raw crystalline frits was investigated by means of DTA, XRD, heating microscopy and dilatometry. The chemical
composition of the frits was determined by FAAS, to define the main glass-ceramic system of each frit. The final crystalline structure detected for
the sintered frits conformed to the temperatures for which transformations were obtained during heating. The existence of a relationship between
the crystallization process and sintering behaviour was confirmed. During devitrification, the sintering process stops, confirming that crystalline
formation affects the sintering behaviour of the frits. In this case, the thermal properties of the final product are not only dependent on oxide
composition but also on the crystalline phases. It was established that the addition of adequate compounds could induce the formation of crystalline
phases on some glass-ceramic frits.
# 2005 Elsevier Ltd and Techna Group S.r.l. All rights reserved.
Keywords: A. Sintering; D. Glass-ceramics; D. Glass; Crystallization
1. Introduction
In recent years there have been changes in the properties of
everyday ceramic products, because of the need of improving
the resistance of ceramic tiles due to its use, for instance, on
floors of large commercial areas. In these applications the
traditional glaze has a too low abrasive resistance and loses its
surface characteristics such as brightness, colour and superficial
texture very easily [1]. Thus, it became necessary to develop
new products to satisfy the requirements of the ceramic tile
industry and the demand of coatings with specific properties.
These features can be achieved using suitable glass-ceramic
compositions [2]. Glass-ceramic materials are polycrystalline
solids with a residual glassy matrix leading to a polycrystalline
microstructure that allows achievement of a better performance
to abrasiveness and an increased resistance compared to
traditional glasses [2]. This microstructure can be obtained by a
sintering process where crystallization and densification of
glass particles occurs during firing.
* Corresponding author. Fax: +351 239 798 703.
E-mail address: [email protected] (M.G. Rasteiro).
0272-8842/$32.00 # 2005 Elsevier Ltd and Techna Group S.r.l. All rights reserve
doi:10.1016/j.ceramint.2005.10.002
Glazes are commonly applied on surfaces as aqueous
suspensions of frits and other additives, also called enamels [2].
Frits are particles of pre-melted glass and, in the case of glass-
ceramic glazes these frits show a glass-ceramic system.
However, it is necessary to control the crystallisation process
to obtain a product with appropriate technical properties and
adequate aesthetics [3]. In fact, it has been shown that to get a
well-crystallized product with minimum porosity, glass
particles must densify before crystallization starts. Therefore,
it is necessary to choose an adequate frit composition for the
glass-ceramic to sinter in the right moment and to devitrify the
desired percentage of crystals. Moreover, it is necessary to keep
a sufficient open porosity to allow the escape of the reaction
gases formed during firing [2,3]. The final formulation of the
enamel depends also on several other factors such as a proper
maturation time, required thermal expansion coefficient and on
the reactivity with the ceramic support. Indeed, to apply the
enamel as a coating, on ceramic body surfaces, it must have a
thermal expansion coefficient close to the thermal expansion
coefficient of the body (in most cases around 70 � 10�7 8C�1)
to avoid strains on the tile [4].
What has been said shows that to formulate new glazes from
glass-ceramic systems is a complex process since a lot of
factors must be considered simultaneously. Thus, to guarantee
d.

M.G. Rasteiro et al. / Ceramics International 33 (2007) 345–354346
Table 1
Chemical composition of the frits (wt.%)
Sample SiO2 Al2O3 Fe2O3 Na2O Li2O B2O3 K2O CaO MgO PbO ZnO BaO ZrO2
A 46.00 21.00 0.11 0.48 0.00 0.00 0.73 20.00 9.10 0.06 0.29 0.72 0.57
B 45.00 31.00 0.11 0.44 1.60 0.00 1.40 1.50 16.00 0.91 0.30 0.13 1.20
C 39.00 14.00 0.03 0.54 1.20 0.00 0.49 0.62 0.04 0.11 1.70 38.00 2.40
D 56.00 15.00 0.18 0.40 0.00 0.00 1.10 21.00 0.57 1.20 0.11 0.04 2.20
E 41.00 27.00 0.10 19.00 0.16 1.80 0.23 0.91 0.12 0.36 0.11 0.18 7.00
that the required product is obtained, a systematic research must
be performed at lab scale. The first part of this work was aimed
at the physical and chemical characterization of some
commercial glass-ceramic frits. The combination of several
techniques allowed the understanding and description of the
behaviour of glass-ceramic frits during firing. In the second part
of the work the influence of some additives on glaze properties
was studied for two of the commercial glass-ceramic frits
characterized previously. Furthermore, the behaviour of the
new glass-ceramic frits studied was compared with the
behaviour of traditional frits with similar composition (same
oxides).
2. Experimental methodology
Five commercial glass-ceramic frits (named A to E) with
different composition were studied, as shown in Table 1. After
drying at 100 8C, the glass was ground in a ball mill with
water (approximately 40%, w/w), during 55 min, to obtain a
residue less than 2% in the 325 mesh sieve. The residue
was measured in a Bayer measuring sieve and the density
of the aqueous suspension was determined using a pycnometer.
After drying the suspension at 100 8C a fine powder was
obtained and sequently characterized according to the
following techniques.
The chemical composition of frits was determined using
Flame Atomic Absorption Spectroscopy-FAAS and gravi-
metric analysis. The characteristic glass transition temperature
(Tg) and the crystallization temperature (Tc) were determined
by differential thermal analysis (DTA; heating rate of 10 8C/
min in air). The heat treatment was carried out in an alumina
crucible and using Al2O3 as the reference material.
Crystalline phases formed during firing were detected and
identified by X-ray diffraction (XRD). Samples were prepared
Table 2
Maximum firing temperatures for XRD sample preparation
Samples Maximum firing temperatures (8C)
A 0 800 920 1050
B 0 850 940 1100
C 0 790 810 860
D 0 840 1000 1200
E 0 700 750 800
M 0 690 1100 –
N 0 750 900 1100
by firing quenched glass-ceramics powders at several tem-
peratures. The temperatures selected (Table 2) corresponded to
temperatures just before and after the exothermic peak of
crystallization detected by DTA. This way, it was possible to
characterize, by XRD, the devitrification behaviour of the frits.
The raw material was also investigated by XRD to confirm the
non-crystalline structure of the initial frits. Before sintering the
samples in a laboratory furnace, with a heating rate of 10 8C/
min, the powders were pressed in a steel mould of rectangular
section (50 mm � 5 mm � 5 mm). The sintered samples were
ground in a ring mill and sieved through a 75 mm sieve. The X-
ray diffractometer was operated using a 2u range from 08 to 608at a scanning speed of 1 8/min.
In addition, the sintering behaviour was characterized by
heating microscopy. The glass-ceramics powders were
pressed in a cubic mould (3 mm � 3 mm � 3 mm) and
heated from room temperature to 1400 8C at a heating rate
of 10 8C/min. The change of shape of the probe, during
heating was registered by a camera and the characteristic
points were determined on the basis of modifications of the
shape of the probe leading to changes on the height and on the
contact angle with the sample holder. The characteristic
temperatures were:
- s
intering point (S): the temperature corresponding to 5%contraction of the sample initial height;
- s
oftening point (M): temperature for which round edges werevisible;
- b
all point (B): temperature for which the probe appeared like asphere;
- h
alf ball point (HB): temperature for which the height is halfof the base;
- fl
ow point (F): temperature for which the sample is melteddown to 1/3 of its initial height.
The record also allowed obtaining the sintering curve (height
of sample versus temperature).
The thermal properties of the final products (thermal
expansion coefficient, a, transformation point, Td and dilato-
metric softening point, Ts) were measured in a dilatometer
using a heating rate of 10 8C/min. The powder was previously
pressed, in the same way as for the XRD analysis. For these
tests, the glass-ceramic powder tablet was fired until ball point
using a heating rate of 10 8C/min, followed by a cooling cycle
with the same rate (10 8C/min).

M.G. Rasteiro et al. / Ceramics International 33 (2007) 345–354 347
Table 3
Chemical composition of the additivated samples (wt.%)
Sample SiO2 Al2O3 Fe2O3 Na2O Li2O B2O3 K2O CaO MgO PbO ZnO BaO ZrO2
M 46.00 21.00 0.11 0.48 0.00 0.00 0.73 20.00 9.10 0.06 0.29 0.72 0.57
N 51.22 21.71 0.04 0.16 2.05 0.00 0.60 2.45 7.34 0.34 0.11 0.05 8.85
3. Results and discussion
3.1. Chemical characterization
The chemical composition of the frits studied in this work
has been shown previously in Table 1. Additionally, two frits
with additives were also studied: sample M, made of frit D with
5% of alumina and sample N, a composed enamel containing
37% of frit B. Their chemical composition is shown in Table 3.
Regarding the composition of frits A to E, they have the
same elements but in different concentrations, exception made
for frits B and C that do also contain Li2O and for frit E that
contains both B2O3 and Li2O.
In the frits composition there are always predominant
elements describing a glass-ceramic system. Except for frit A,
that shows a quaternary system, all frits presented a ternary
system. If we refer to the phase diagram of each glass-ceramic
system [5] and using the chemical composition in Table 1, we
may predict which is the crystalline phase that will devitrificate
during the heat treatment. In Table 4, the glass-ceramic system
Table 4
Glass-ceramic systems and most probable crystalline phases
Frit Glass-ceramic system Crystalline phase
A CMAS (CaO–MgO–Al2O3–SiO2) Anorthite–Diopside
B MAS (MgO–Al2O3–SiO2) Cordierite–Indialite
C BAS (BaO–Al2O3–SiO2) Celsian
D CAS (CaO–Al2O3–SiO2) Anorthite
E NAS (Na2O–Al2O3–SiO2) Nepheline
Fig. 1. DTA curv
for each frit and the corresponding crystalline phase that will
be, most probably, formed during firing, are shown.
3.2. Thermal properties
The DTA results are given in Figs. 1–5. Table 5
summarises the temperatures measured by DTA and heating
microscopy. From these values, only one exothermic peak
relating to the formation of crystalline phases is observed,
exception made for frits B and D. In frit B there are two
crystallization peaks (see Fig. 2) whereas in frit D there is no
peak (Fig. 4). Additionally, frit D is the only frit presenting a
ball temperature (B).
From the analysis of the results given above it is possible to
establish a relationship between the sintering behaviour and the
crystallization process, for each frit. Indeed, considering
Table 5, one can see that the glass transition temperature
(Tg) always occurs before the sintering temperature (S) while
the softening temperature (M) always happens after the
crystallization event. To better visualize this correlation, we
plotted the characteristic temperatures given in Table 5 on the
graphic of sample height versus firing temperature. Figs. 6–8
show some examples of this representation for frits A–C.
From these figures it is also evident that sinterization finishes
when the crystallization process occurs. That is, during
crystallization the characteristic sample shrinkage, due to the
sintering process stops. On the other hand, softening occurs
only once the crystallization process is finished. Therefore,
these results prove that crystal formation interferes with the
sintering process of a crystalline frit. For frit D it was not
e for frit A.

M.G. Rasteiro et al. / Ceramics International 33 (2007) 345–354348
Fig. 2. DTA curve for frit B.
Fig. 3. DTA curve for frit C.
Fig. 4. DTA curve for frit D.

M.G. Rasteiro et al. / Ceramics International 33 (2007) 345–354 349
Fig. 5. DTA curve for frit E.
Table 5
Characteristic temperatures determined by DTA and heating microscopy
Sample DTA Heating microscopy
Tg (8C) Tc (8C) S (8C) M (8C) B (8C) HB (8C) F (8C)
A 750 954 830 1247 – 1256 1300
B 700 889/980 850 1295 – 1314 1380
C 750 830 750 1050 – 1291 1340
D 780 – 890 955 1041 1188 1214
E 710 767 680 1010 – 1280 1370
Fig. 6. Sample height and characteristic temperatures as a function of firing
temperature for frit A.
Fig. 7. Sample height and characteristic temperatures as a function of firing
temperature for frit B.
possible to establish this type of correlation. In fact, it was
explained before that this frit did not exhibit an exothermic
reaction, probably because there was no devitrification of a
crystalline phase. That is the reason why, for frit D, the
softening temperature and the other temperatures measured by
heating microscopy occurred earlier, the sintering behaviour
showing the existence of a ball temperature.
3.3. Crystalline structure
The glassy systems investigated presented a crystalline
phase after the thermal treatment, exception made for frit D.
Fig. 8. Sample height and characteristic temperatures as a function of firing
temperature for frit C.

M.G. Rasteiro et al. / Ceramics International 33 (2007) 345–354350
Fig. 9. X-ray diffraction patterns of the sintered frit B.
Fig. 10. X-ray patterns of the sintered frit D.
Figs. 9 and 10 show the XRD patterns, after sintering, for frits B
and D, respectively. We can see there the amorphous structure
of the raw frit D (0 8C). In the case of the raw frit B, as well as
for raw frits C and E (patterns not shown here), a crystalline
structure already existed in the raw frit. The peaks at 38,5 and
44,88 2u refer to the aluminium in the sample support.
In the case of frit A, the results have shown that it remains
amorphous until 800 8C and only after that it starts to form
anorthite and diopside. At 920 8C, the sample exhibits a high
amount of crystalline phase but, at 1050 8C, it is possible to
notice a small decrease of the anorthite peak intensity,
benefiting the growth of diopside. The final product also
contains residual gehlenite.
The final product X-ray patterns for frit B are given in
Fig. 11. It has been shown previously, in Fig. 9, that the raw
sample contains spinel. Between 850 and 940 8C (first
exothermic peak), the frit devitrificates leading to the formation
of spodumene and a magnesium aluminosilicate (MgAl2-
Si3O10). For this temperature, cordierite also crystallizes
though in a very small amount. During the second crystal-
lization peak, XRD continues to detect spodumene indicating,
however, the additional production of cordierite and indialite
which are, now, the main crystalline phases. Therefore,
MgAl2Si3O10, formed during the first peak, was converted to
form cordierite and indialite.
The XRD results for frit C show that the raw material contains
vestigial celsian and baric orthoclase (K,Ba)(Si,Al)4O8. Celsian
continues to form during the exothermic event (810–860 8C)
becoming the principal crystalline structure. Banalsite formation
is also detected during the exothermic peak.
The X-ray patterns of frit D for the different temperatures
(see Fig. 10) are very similar. In fact, the raw material is strictly
amorphous until 840 8C. After that, the sample crystallizes only
vestiges of anorthite and diopside exhibiting no significant
alterations, with temperature. This information agrees with the
DTA results where no exothermic reaction was identified.
Indeed, if we report to the CAS phase diagram, we can notice
that the mixture equilibrium point is on the limit of the anorthite
formation area. Thus, it is expected that only if alumina is added
to the system it will be possible to move the mixture point into
the area of anorthite formation, leading then to a higher degree
of anorthite crystallization. Therefore, only in this condition it
will be possible to say that frit D behaves as a glass-ceramic frit,
as will be discussed later.
In the case of raw frit E it has been detected that it possesses,
in its structure, vestigial amounts of sodium aluminosilicate
M.G. Rasteiro et al. / Ceramics International 33 (2007) 345–354 351
Fig. 11. X-ray pattern of sintered frit B at 1100 8C.
(NaAlSiO4). The formation of this mineral continues until the
exothermic peak, being converted, after that, to hexagonal
nepheline. Thus, at 750 8C, it is detected by XRD a small
amount of sodium aluminosilicate and nepheline, while at
800 8C, only hexagonal nepheline is identified.
Generally speaking, it is possible to state that the main
crystalline phases detected by XRD correspond to the
crystalline phases foreseen by the ternary phase diagrams.
3.4. Dilatometry results
Table 6 indicates the dilatometry results for the five frits
studied. The results in Table 6 show that the frits presented
thermal expansion coefficients quite different from the typical
values of the ceramic substrates. As a consequence, these frits
cannot be applied, on its own, as coating agents, and it is
necessary to add other compounds to the frit to increase or
decrease the enamel thermal expansion coefficient. In order to
investigate if there is a relationship between a and the chemical
composition of the frit, we have also calculated, for each frit, the
theoretical value of a using the additivity law Eq. (1) [6]. This law
admits that each oxide has a different contribution to the final a
value. This contribution is described by an oxide characteristic
coefficient (ai) and, thus, a can be estimated by Eq. (1):
a ¼ 1
100
Xai pi � 10�7 (1)
Table 6
Dilatometric parameters for the frits studied
Sample Dilatometric parameter
a � 107 (8C�1)a a � 107 (8C�1)b Td (8C) Ts (8C)
A 72.1 85.6 – 1125.2
B 29.8 74.7 – –
C 55.7 77.9 549.5 926.5
D 55.4 81.1 736.4 1122.8
E 142.3 122.3 500.4 –
a Evaluated by dilatometry between 50 and 400 8C.b Calculated values Eq. (1).
where ai is the coefficient of oxide i (8C�1) and pi is the wt.% of
oxide i in the sample.
However, for non-homogeneous glasses, as in the case of the
glazes or enamels where phase separation or crystallization
occurs, the values of a calculated by Eq. (1) may be
considerably different from the experimental values [6]. For
the frits tested and using the Winkelmann–Schott oxide
coefficient values [6], the thermal expansion coefficients
determined by Eq. (1) are also given in Table 6.
It can be noticed that the calculated values in Table 6 show
some deviations from the experimental values, as could be
expected, since these glasses are not homogeneous (a crystal-
line phase is present). However, these results allow us to verify
some tendencies. The smallest a value is obtained for frit B that
has shown two crystallization events, while the highest one is
for frit E that corresponds to a lower degree of crystallization.
Therefore, it seems that this correlation can be useful to identify
and anticipate the thermal behaviour of a glaze when its
composition is manipulated, though it has to be used with
caution when dealing with glass-ceramic frits. In fact, in this
case, the thermal expansion coefficient is conditioned by the
presence and extent of crystallization and may be quite
different from the theoretical value.
3.5. Comparison of the properties of glass-ceramic and
traditional frits
Non-crystalline frits with similar oxide elements as in the
glass-ceramic frits studied in this work have also been tested.
Table 7 shows the composition of the non-crystalline frits
comparable to frit A (frits 1–3). Table 8 shows the thermal
properties of those non-crystalline frits, which are compared
with frit A properties.
Table 7
Chemical composition of the non-crystalline frits (wt.%)
Frit SiO2 Al2O3 Na2O B2O3 K2O CaO MgO BaO ZrO2
1 59.0 5.0 7.0 11.0 1.0 4.0 2.0 0 11.0
2 55.0 6.0 1.0 14.0 3.0 5.0 3.0 1.0 12.0
3 57.0 8.0 2.0 9.0 4.0 8.0 3.0 0 9.0
M.G. Rasteiro et al. / Ceramics International 33 (2007) 345–354352
Table 8
Physical data of both non-crystalline frits and frit A
Frit Dilatometric parameters Heating microscopy
a � 107 (8C�1) Td (8C) Ts (8C) M (8C) B (8C) HB (8C)
1 61 590 665 910 1020 1085
2 65 625 700 905 1025 1085
3 62 645 735 990 1060 1150
A 72 – 1125 1247 – 1256
In general, it was verified that the values for the thermal
expansion coefficients of the traditional frits group were very
close to each other, in clear opposition with the discrepancies
found on the a values for the glass-ceramic frits. Since the a
value of a non-homogeneous glaze depends also on the
crystalline phases formed, a relationship between the a values
of the glass-ceramics frits and of the traditional frits cannot be
established considering only the oxide composition. Concern-
ing the other properties, the dilatometric and heating
microscopy temperatures of the crystalline frits are, in general,
higher than the temperatures for traditional frits. This fact
supports the previous conclusion about the influence of the
crystalline phase on the thermal properties of the final product
Fig. 12. X-ray patte
Fig. 13. X-ray pattern of sin
and also that crystalline phase formation, during firing, affects
the sintering process.
The composition of the traditional frits studied suggests that
crystals can also appear in these frits, namely ZrSiO4 crystals. In
order to check this possibility we have conducted DRX analysis
for frit 2 (higher ZrO2 content), both with the raw frit and after
submitting the frit to heat treatment up to 1050 8C. These results
are shown in Figs. 12 and 13, respectively. It is evident that for frit
2 thecrystallinephasealreadyexisted in therawfrit, itsmagnitude
increasing slightly after heat treatment. Thus, in this case, we
cannot speak of a real crystallization process during firing but
rather of a growthof the original grains. In fact the ZrSiO4 crystals
are usually very small being easily dispersed in the liquid matrix
of the frit during processing and acting mainly as opacifying
agent, without leading to a substantial increase of the enamel
resistance as happens with the crystalline frits. This agrees with
the difference in thermal properties between frits 2 and A.
3.6. Influence of additives on the crystalline structure of
frits
The influence of additives on the crystalline structures
formed during firing was studied for frits B and D, using DTA
rn of raw frit 2.
tered frit 2 at 1050 8C.
M.G. Rasteiro et al. / Ceramics International 33 (2007) 345–354 353
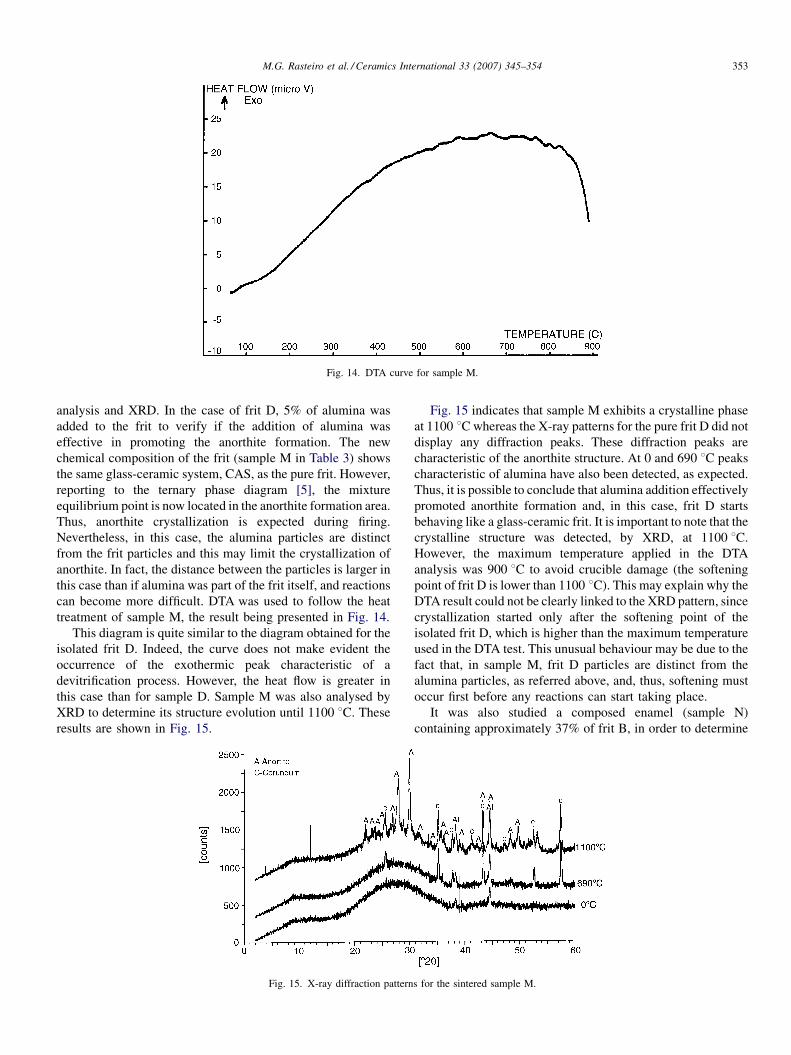
Fig. 14. DTA curve for sample M.
analysis and XRD. In the case of frit D, 5% of alumina was
added to the frit to verify if the addition of alumina was
effective in promoting the anorthite formation. The new
chemical composition of the frit (sample M in Table 3) shows
the same glass-ceramic system, CAS, as the pure frit. However,
reporting to the ternary phase diagram [5], the mixture
equilibrium point is now located in the anorthite formation area.
Thus, anorthite crystallization is expected during firing.
Nevertheless, in this case, the alumina particles are distinct
from the frit particles and this may limit the crystallization of
anorthite. In fact, the distance between the particles is larger in
this case than if alumina was part of the frit itself, and reactions
can become more difficult. DTA was used to follow the heat
treatment of sample M, the result being presented in Fig. 14.
This diagram is quite similar to the diagram obtained for the
isolated frit D. Indeed, the curve does not make evident the
occurrence of the exothermic peak characteristic of a
devitrification process. However, the heat flow is greater in
this case than for sample D. Sample M was also analysed by
XRD to determine its structure evolution until 1100 8C. These
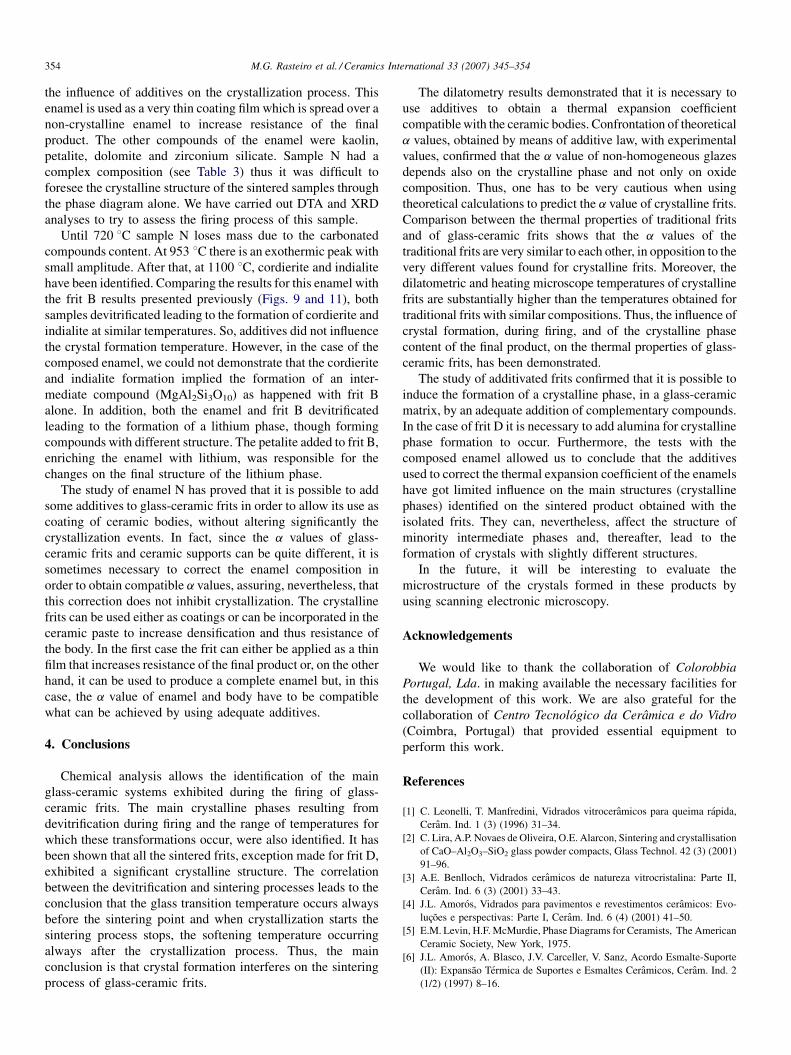
results are shown in Fig. 15.
Fig. 15. X-ray diffraction pattern
Fig. 15 indicates that sample M exhibits a crystalline phase
at 1100 8C whereas the X-ray patterns for the pure frit D did not
display any diffraction peaks. These diffraction peaks are
characteristic of the anorthite structure. At 0 and 690 8C peaks
characteristic of alumina have also been detected, as expected.
Thus, it is possible to conclude that alumina addition effectively
promoted anorthite formation and, in this case, frit D starts
behaving like a glass-ceramic frit. It is important to note that the
crystalline structure was detected, by XRD, at 1100 8C.
However, the maximum temperature applied in the DTA
analysis was 900 8C to avoid crucible damage (the softening
point of frit D is lower than 1100 8C). This may explain why the
DTA result could not be clearly linked to the XRD pattern, since
crystallization started only after the softening point of the
isolated frit D, which is higher than the maximum temperature
used in the DTA test. This unusual behaviour may be due to the
fact that, in sample M, frit D particles are distinct from the
alumina particles, as referred above, and, thus, softening must
occur first before any reactions can start taking place.
It was also studied a composed enamel (sample N)
containing approximately 37% of frit B, in order to determine
s for the sintered sample M.
M.G. Rasteiro et al. / Ceramics International 33 (2007) 345–354354
the influence of additives on the crystallization process. This
enamel is used as a very thin coating film which is spread over a
non-crystalline enamel to increase resistance of the final
product. The other compounds of the enamel were kaolin,
petalite, dolomite and zirconium silicate. Sample N had a
complex composition (see Table 3) thus it was difficult to
foresee the crystalline structure of the sintered samples through
the phase diagram alone. We have carried out DTA and XRD
analyses to try to assess the firing process of this sample.
Until 720 8C sample N loses mass due to the carbonated
compounds content. At 953 8C there is an exothermic peak with
small amplitude. After that, at 1100 8C, cordierite and indialite
have been identified. Comparing the results for this enamel with
the frit B results presented previously (Figs. 9 and 11), both
samples devitrificated leading to the formation of cordierite and
indialite at similar temperatures. So, additives did not influence
the crystal formation temperature. However, in the case of the
composed enamel, we could not demonstrate that the cordierite
and indialite formation implied the formation of an inter-
mediate compound (MgAl2Si3O10) as happened with frit B
alone. In addition, both the enamel and frit B devitrificated
leading to the formation of a lithium phase, though forming
compounds with different structure. The petalite added to frit B,
enriching the enamel with lithium, was responsible for the
changes on the final structure of the lithium phase.
The study of enamel N has proved that it is possible to add
some additives to glass-ceramic frits in order to allow its use as
coating of ceramic bodies, without altering significantly the
crystallization events. In fact, since the a values of glass-
ceramic frits and ceramic supports can be quite different, it is
sometimes necessary to correct the enamel composition in
order to obtain compatible a values, assuring, nevertheless, that
this correction does not inhibit crystallization. The crystalline
frits can be used either as coatings or can be incorporated in the
ceramic paste to increase densification and thus resistance of
the body. In the first case the frit can either be applied as a thin
film that increases resistance of the final product or, on the other
hand, it can be used to produce a complete enamel but, in this
case, the a value of enamel and body have to be compatible
what can be achieved by using adequate additives.
4. Conclusions
Chemical analysis allows the identification of the main
glass-ceramic systems exhibited during the firing of glass-
ceramic frits. The main crystalline phases resulting from
devitrification during firing and the range of temperatures for
which these transformations occur, were also identified. It has
been shown that all the sintered frits, exception made for frit D,
exhibited a significant crystalline structure. The correlation
between the devitrification and sintering processes leads to the
conclusion that the glass transition temperature occurs always
before the sintering point and when crystallization starts the
sintering process stops, the softening temperature occurring
always after the crystallization process. Thus, the main
conclusion is that crystal formation interferes on the sintering
process of glass-ceramic frits.
The dilatometry results demonstrated that it is necessary to
use additives to obtain a thermal expansion coefficient
compatible with the ceramic bodies. Confrontation of theoretical
a values, obtained by means of additive law, with experimental
values, confirmed that the a value of non-homogeneous glazes
depends also on the crystalline phase and not only on oxide
composition. Thus, one has to be very cautious when using
theoretical calculations to predict the a value of crystalline frits.
Comparison between the thermal properties of traditional frits
and of glass-ceramic frits shows that the a values of the
traditional frits are very similar to each other, in opposition to the
very different values found for crystalline frits. Moreover, the
dilatometric and heating microscope temperatures of crystalline
frits are substantially higher than the temperatures obtained for
traditional frits with similar compositions. Thus, the influence of
crystal formation, during firing, and of the crystalline phase
content of the final product, on the thermal properties of glass-
ceramic frits, has been demonstrated.
The study of additivated frits confirmed that it is possible to
induce the formation of a crystalline phase, in a glass-ceramic
matrix, by an adequate addition of complementary compounds.
In the case of frit D it is necessary to add alumina for crystalline
phase formation to occur. Furthermore, the tests with the
composed enamel allowed us to conclude that the additives
used to correct the thermal expansion coefficient of the enamels
have got limited influence on the main structures (crystalline
phases) identified on the sintered product obtained with the
isolated frits. They can, nevertheless, affect the structure of
minority intermediate phases and, thereafter, lead to the
formation of crystals with slightly different structures.
In the future, it will be interesting to evaluate the
microstructure of the crystals formed in these products by
using scanning electronic microscopy.
Acknowledgements
We would like to thank the collaboration of Colorobbia
Portugal, Lda. in making available the necessary facilities for
the development of this work. We are also grateful for the
collaboration of Centro Tecnologico da Ceramica e do Vidro
(Coimbra, Portugal) that provided essential equipment to
perform this work.
References
[1] C. Leonelli, T. Manfredini, Vidrados vitroceramicos para queima rapida,
Ceram. Ind. 1 (3) (1996) 31–34.
[2] C. Lira, A.P. Novaes de Oliveira, O.E. Alarcon, Sintering and crystallisation
of CaO–Al2O3–SiO2 glass powder compacts, Glass Technol. 42 (3) (2001)
91–96.
[3] A.E. Benlloch, Vidrados ceramicos de natureza vitrocristalina: Parte II,
Ceram. Ind. 6 (3) (2001) 33–43.
[4] J.L. Amoros, Vidrados para pavimentos e revestimentos ceramicos: Evo-
lucoes e perspectivas: Parte I, Ceram. Ind. 6 (4) (2001) 41–50.
[5] E.M. Levin, H.F. McMurdie, Phase Diagrams for Ceramists, The American
Ceramic Society, New York, 1975.
[6] J.L. Amoros, A. Blasco, J.V. Carceller, V. Sanz, Acordo Esmalte-Suporte
(II): Expansao Termica de Suportes e Esmaltes Ceramicos, Ceram. Ind. 2
(1/2) (1997) 8–16.
Related Documents