Table of Contents Pages Solutions for Crystal Growth Crystal Growth 101 1 - 3 Introduction 4 - 6 Sample Preparation for Crystallization 7 - 14 Crystallization Screening 15 - 17 Sitting Drop Vapor Diffusion 18 - 19 Hanging Drop Vapor Diffusion 20 - 21 Microbatch Crystallization 22 - 23 Microdialysis Crystallization 24 - 25 Viewing Crystallization Experiments 26 - 27 Salt or Protein Crystals 28 - 43 Optimization 44 - 45 Drop Ratio 46 - 47 Temperature as a Crystallization Variable 48 - 55 Seeding 56 - 57 Buffer Table 58 Buffer Formulation 59 Phosphate Buffer Dilution Table 60 Using Volatile Buffers to Adjust Drop pH and Induce Crystallization 61 - 66 Reagent Formulation and Handling 67 - 68 Solubility Table 69 Halides for Phasing

Welcome message from author
This document is posted to help you gain knowledge. Please leave a comment to let me know what you think about it! Share it to your friends and learn new things together.
Transcript
Table of Contents
Pages
Solutions for Crystal Growth
Crystal Growth 101
1 - 3 Introduction
4 - 6 Sample Preparation for Crystallization
7 - 14 Crystallization Screening
15 - 17 Sitting Drop Vapor Diffusion
18 - 19 Hanging Drop Vapor Diffusion
20 - 21 Microbatch Crystallization
22 - 23 Microdialysis Crystallization
24 - 25 Viewing Crystallization Experiments
26 - 27 Salt or Protein Crystals
28 - 43 Optimization
44 - 45 Drop Ratio
46 - 47 Temperature as a Crystallization Variable
48 - 55 Seeding
56 - 57 Buffer Table
58 Buffer Formulation
59 Phosphate Buffer Dilution Table
60 Using Volatile Buffers to Adjust Drop pH and Induce Crystallization
61 - 66 Reagent Formulation and Handling
67 - 68 Solubility Table
69 Halides for Phasing
1
Introduction to the Crystallization of Biological MacromoleculesThe Crystal Growth 101 series prepared by Hampton Research presents an overview of the preparation of the sample, methods, screening, optimiza-tion, reagent formulation, and other aspects of protein crystallization. We hope Crystal Growth 101 will prove a useful resource and inspiration in your crystal quest. Best of success with your crystals!
The First Protein Crystal & BeyondThe first record of crystals of biological macromolecules were those of hemoglobin, reported by Hunefeld around 1840.1,2 During the 1880s, crystallization moved from being a mere curiosity to a method for purifi-cation.3,4 During the 1920s and 1930s crystallization grew in popularity, with the crystallization of insulin by John Jacob Abel and colleagues, as well as work by James B. Sumner, demonstrating enzymes could be obtained as crystalline proteins, alongside the work with a number of important crystal-line enzymes by John Northrop and colleagues.5-7 It was not until the late 1930s that crystalline proteins were introduced to X-rays, beginning a torrid affair that shines bright to this day.8
Much has changed with how biological macromolecules are sourced. Early on, and to a small extent today, samples were obtained by protein chemists through extraction and purification from natural sources, including plants, as well as various organs and tissues of pigs, cows, and other animals. In the 1980s, with the near cataclysmic death of heavy metal and the fortuitous end of disco, geneticists and molecular biologist rose above the fog and hair spray, allowing DNA technology to integrate with structural biology, totally accelerating and transforming the field of structural biology.
It’s Simple, But ComplicatedAlthough much change, and the numerous advancements in molecular biology and crystallography has reduced many of the arduous, laborious, math and physics infused tasks to, in some cases, the mere push of a but-ton, crystallization remains at the crossroads where science meets art. The growth and optimization of crystals of biological macromolecules remains largely empirical in nature. There is no comprehensive theory to guide ef-forts and experiments related to the crystallization of proteins, nucleic ac-ids, and other biological macromolecules. Although much knowledge and experience has been accumulated, the crystallization of a protein involves collected wisdom, intuition, creativity, patience, and perseverance.
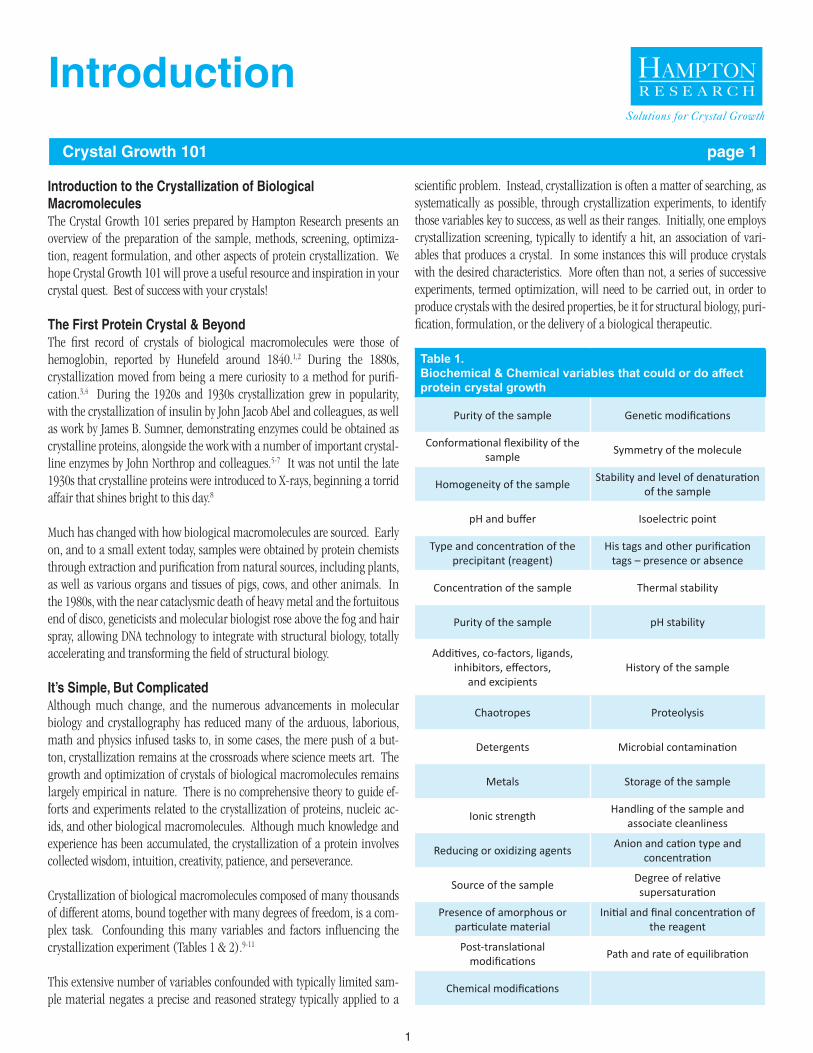
Crystallization of biological macromolecules composed of many thousands of different atoms, bound together with many degrees of freedom, is a com-plex task. Confounding this many variables and factors influencing the crystallization experiment (Tables 1 & 2).9-11
This extensive number of variables confounded with typically limited sam-ple material negates a precise and reasoned strategy typically applied to a
scientific problem. Instead, crystallization is often a matter of searching, as systematically as possible, through crystallization experiments, to identify those variables key to success, as well as their ranges. Initially, one employs crystallization screening, typically to identify a hit, an association of vari-ables that produces a crystal. In some instances this will produce crystals with the desired characteristics. More often than not, a series of successive experiments, termed optimization, will need to be carried out, in order to produce crystals with the desired properties, be it for structural biology, puri-fication, formulation, or the delivery of a biological therapeutic.
Solutions for Crystal Growth
Table 1. Biochemical & Chemical variables that could or do affect protein crystal growth
Purity of the sample Genetic modifications
Conformational flexibility of the sample Symmetry of the molecule
Homogeneity of the sample Stability and level of denaturation of the sample
pH and buffer Isoelectric point
Type and concentration of the precipitant (reagent)
His tags and other purification tags – presence or absence
Concentration of the sample Thermal stability
Purity of the sample pH stability
Additives, co-factors, ligands, inhibitors, effectors,
and excipientsHistory of the sample
Chaotropes Proteolysis
Detergents Microbial contamination
Metals Storage of the sample
Ionic strength Handling of the sample and associate cleanliness
Reducing or oxidizing agents Anion and cation type andconcentration
Source of the sample Degree of relativesupersaturation
Presence of amorphous orparticulate material
Initial and final concentration of the reagent
Post-translational modifications Path and rate of equilibration
Chemical modifications
Introduction
Crystal Growth 101 page 1
2
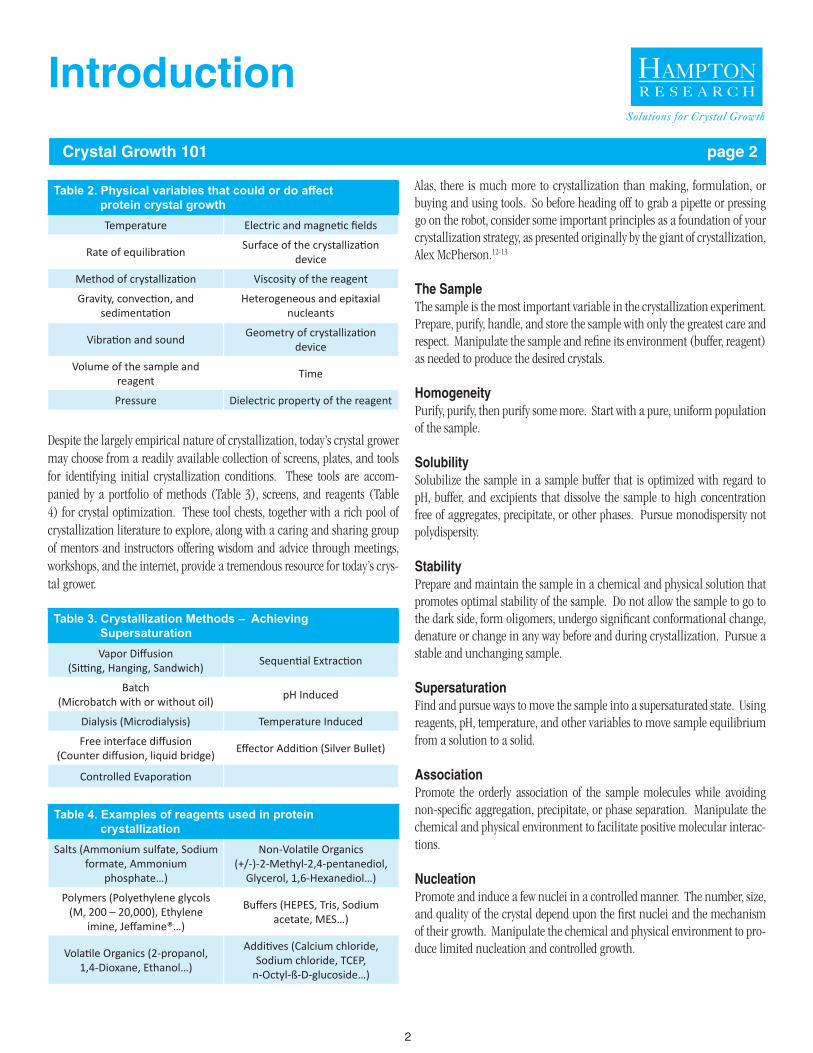
Despite the largely empirical nature of crystallization, today’s crystal grower may choose from a readily available collection of screens, plates, and tools for identifying initial crystallization conditions. These tools are accom-panied by a portfolio of methods (Table 3), screens, and reagents (Table 4) for crystal optimization. These tool chests, together with a rich pool of crystallization literature to explore, along with a caring and sharing group of mentors and instructors offering wisdom and advice through meetings, workshops, and the internet, provide a tremendous resource for today’s crys-tal grower.
Alas, there is much more to crystallization than making, formulation, or buying and using tools. So before heading off to grab a pipette or pressing go on the robot, consider some important principles as a foundation of your crystallization strategy, as presented originally by the giant of crystallization, Alex McPherson.12-13
The SampleThe sample is the most important variable in the crystallization experiment. Prepare, purify, handle, and store the sample with only the greatest care and respect. Manipulate the sample and refine its environment (buffer, reagent) as needed to produce the desired crystals.
HomogeneityPurify, purify, then purify some more. Start with a pure, uniform population of the sample.
SolubilitySolubilize the sample in a sample buffer that is optimized with regard to pH, buffer, and excipients that dissolve the sample to high concentration free of aggregates, precipitate, or other phases. Pursue monodispersity not polydispersity.
StabilityPrepare and maintain the sample in a chemical and physical solution that promotes optimal stability of the sample. Do not allow the sample to go to the dark side, form oligomers, undergo significant conformational change, denature or change in any way before and during crystallization. Pursue a stable and unchanging sample.
SupersaturationFind and pursue ways to move the sample into a supersaturated state. Using reagents, pH, temperature, and other variables to move sample equilibrium from a solution to a solid.
AssociationPromote the orderly association of the sample molecules while avoiding non-specific aggregation, precipitate, or phase separation. Manipulate the chemical and physical environment to facilitate positive molecular interac-tions.
NucleationPromote and induce a few nuclei in a controlled manner. The number, size, and quality of the crystal depend upon the first nuclei and the mechanism of their growth. Manipulate the chemical and physical environment to pro-duce limited nucleation and controlled growth.
Solutions for Crystal Growth
Table 2. Physical variables that could or do affect protein crystal growth
Temperature Electric and magnetic fields
Rate of equilibration Surface of the crystallization device
Method of crystallization Viscosity of the reagent
Gravity, convection, and sedimentation
Heterogeneous and epitaxial nucleants
Vibration and sound Geometry of crystallization device
Volume of the sample and reagent Time
Pressure Dielectric property of the reagent
Table 3. Crystallization Methods – Achieving Supersaturation
Vapor Diffusion (Sitting, Hanging, Sandwich) Sequential Extraction
Batch (Microbatch with or without oil) pH Induced
Dialysis (Microdialysis) Temperature Induced
Free interface diffusion (Counter diffusion, liquid bridge) Effector Addition (Silver Bullet)
Controlled Evaporation
Table 4. Examples of reagents used in protein crystallizationSalts (Ammonium sulfate, Sodium
formate, Ammoniumphosphate…)
Non-Volatile Organics (+/-)-2-Methyl-2,4-pentanediol,
Glycerol, 1,6-Hexanediol…)
Polymers (Polyethylene glycols (Mr 200 – 20,000), Ethylene
imine, Jeffamine®…)
Buffers (HEPES, Tris, Sodium acetate, MES…)
Volatile Organics (2-propanol, 1,4-Dioxane, Ethanol…)
Additives (Calcium chloride, Sodium chloride, TCEP,
n-Octyl-ß-D-glucoside…)
Introduction
Crystal Growth 101 page 2
3
VarietyPursue everything. Explore as many chemical, biochemical, and physical options and opportunities as possible for the growth and optimization of the crystal. Be thorough and relentless.
ControlMaintain control of the experimental system, at an optimal state, free of unknowns, perturbations, and fluctuations, from start to finish.
ImpuritiesKeep it clean. Avoid and discourage the presence, inclusion, and formation of impurities in the sample, reagent, and containers. This can minimize the incorporation of impurities into the crystal lattice, as well as minimize problems with reproducing experimental results.
PreservationTake care of the crystal, protect them from shock, as well as chemical, bio-chemical, and physical change or disruption.
References and Readings1. Der Chemismus in der tierescher Organization, Hunefeld, F. L. (1840).
p. 160. Leipzig University, Germany.2. A brief history of protein crystal growth, McPherson, A. (1991). J. Cryst.
Growth, 110, 1–10.3. Über die Eiweisskorper verschiedenen Oelsamen, Ritthausen, H. (1880).
Pfluegers Arch. 21, 81–104.4. The proteins of the Brazil nut, Osborne T. (1891). Am. Chem. J. 13,
212–218.5. Crystalline insulin., Abel, J. J., Geiling, E. M. K., Roultier, O. A., Bell, F. M.
& Wintersteiner, O. (1927). J. Pharmacol. Exp. Ther. 31, 65–85.6. The Enzymes, Sumner, J. B. & Somers, G. F. (1943). New York: Aca-
demic Press.7. Crystalline enzymes, Northrop, M., Kunitz, M. & Herriott, R. M. (1948).
New York: Columbia University Press.8. Present at the flood: How structural molecular biology came about,
Dickerson, R. E. (2005). FASEB J. 20, 809–810.9. Preparation and Analysis of Protein Crystals, McPherson, A. (1982).
New York: John Wiley & Sons.10. Current approaches to macromolecular crystallization. McPherson, A.
(1990). Eur. J. Biochem. 189, 1-23.11. Crystallization of Biological Macromolecules, McPherson, A. (1999).
Cold Spring Harbor: Cold Spring Harbor Laboratory Press.12. Introduction to protein crystallization, McPherson, A. and Gavira, J.A.
(2014) Acta Crystallographica F, Volume 70, Part 1, 2-20.13. Some Words of Advice from an Old Hand, Alexander McPherson, pages
1-9, in Protein Crystallization, Second Edition, Edited by Terese Berg-fors. International University Line, 2009.
Solutions for Crystal Growth
Introduction
Crystal Growth 101 page 3
4
Crystal Growth 101 page 1
The SampleThe sample is the single most important variable in the crystallization ex-periment.9,10 Begin with a pure, homogeneous, stable, active sample. The sample should be as pure as possible, 95 to 98%, assayed by Coomassie stained SDS-PAGE. A homogeneous, active sample, free of contaminants, aggregates, and minimal conformational flexibility is desired. Dynamic Light Scattering (DLS) can be used as a diagnostic for sample homogeneity, measuring the polydispersity of the sample, pointing out aggregation, which can be a deterrent to crystallization.1-4, 10 DLS can be also used to screen and identify sample buffer components such as buffer, pH, ionic strength, excipients, additives, and other chemical variables, as well as temperature, towards optimization of the sample buffer formulation to maximize sample homogeneity. Differential Scanning Fluorimetry (DSF or Thermofluor®) can be used as a diagnostic for sample stability, measuring the temperature stability of the sample in the presence of chemical variables such as pH, buf-fer, ionic strength, excipients, and additives.5-7
Homogeneity Not HeterogeneityAbsolute homogeneity is essential for optimal crystallization as well as crys-tallographic analysis. An awareness of possible heterogeneity combined with methods and efforts to avoid and remove heterogeneity in the sample preparation should be a priority. Possible sources of sample heterogeneity include the following.16
• Presence, absence, or variation in a bound prosthetic group, ligand, cofactor, or metal ion• Variation in composition of carbohydrate on a glycoprotein• Unintentional proteolytic modification• Oxidation of sulfhydryl groups• Reaction with heavy metals• Presence, absence, or variation in post-translational side chain modification (methylation, amidation, phosphorylation, glycosylation, or lipidation)• Variation in amino of carboxy terminus, or modification of the terminus• Variation in aggregation or oligomer state• Conformational flexibility or instability due to the dynamic nature of the sample• Incomplete or incorrect refolding or partial denaturation• Combining different preps or purifications
BufferThe sample buffer should be the simplest formulation possible that main-tains the solubility, stability, activity, and homogeneity of the sample. Of-ten times the selected sample buffer is the purification buffer or a “because that’s what we’ve always used before” buffer. The best buffer for purification may not be the best buffer for crystallization. Using diagnostic tools such as
DLS and DSF, the sample buffer formulation, with regard to buffer, pH, ionic strength, excipients, and additives can be refined to promote sample stability, solubility, homogeneity, and crystallization.
Choose a buffer such that the desired sample pH falls well within the effective buffering capacity of the buffer. A review of the literature, Protein Data Bank, and Biological Macromolecule Crystallization Database will reveal Good’s Buffers and organic acids are frequently used sample buffers with good suc-cess in crystallization experiments.11-15 The buffer molecule itself can be a significant sample variable. For example, at pH 7.0, Phosphate, Cacodylate, MES, Bis-Tris, ADA, Imidazole, BIS-TRIS propane, MOPS, and HEPES are reasonable buffers to consider. But one or more buffers may perform better than the others with regard to sample stability, solubility, and homogeneity, again, assayable by DLS (solubility & homogeneity) and DSF (stability).
Ionic strength, often in the form of Sodium chloride, should be of high enough concentration for optimal sample solubility, stability & homogene-ity, and no more, as excessive salt and ionic strength can be an issue with crystallization and cryo preservation of the protein. Again, assayable by DLS and DSF.
Additives or excipients such as ligands, substrates, co-factors, inhibitors, metals, polyols, sugars, detergents, salts, polyamines, linkers, chaotropes, and other small molecules should be considered, evaluated and assayed for possible inclusion in the sample buffer. These can also be added at a later time to the crystallization experiment during optimization.
Reducing agents (anti-oxidants) may be included to protect free cysteines. Free cysteines can form intra- or intermolecular disulfide bridges that can lead to sample heterogeneity or aggregation. In general, the volatile Beta-mercaptoethanol (BME) is the shortest lived (hours to 3 days), Dithiothreitol (DTT) of intermediate (up to 7 days), and Tri (2-carboxyethyl) phosphine hydrochloride (TCEP) longest lived (weeks) anti-oxidant. The stability of the reducing agent can change with pH and temperature. The anti-oxidant L-cysteine can precipitate in the presence of oxygen, as well as form hexago-nal crystals in crystallization reagents and should likely be avoided.
CharacterizationThere are plenty of advantages to cloning, expressing and purifying the pro-tein yourself, including the knowledge, control, and documentation of the experimental variables. One can also learn a great deal about the sample’s behavior, solubility, and stability doing the work. However, it is often the case where someone else does the work leading up to and including the purifica-tion, and one might be handed the sample for crystallization. Either way, it is a good idea to characterize the protein before crystallization screening. Some variables to consider if you’re handed a sample for crystallization in-clude the following.
Solutions for Crystal Growth
Sample Preparation for Crystallization
5
Crystal Growth 101 page 2
• What is the sample buffer?• Was phosphate used at any time during the prep and purification?• Are there disulfides or free cysteines?• What ligands, substrates, co-factors, inhibitors, or metals are present or needed• Are protease inhibitors present, is the sample sensitive to proteolysis?• Has the protein or a similar protein previously been crystallized?• At what pH range is the sample stable and unstable?• At what temperature range is the sample stable or unstable?• Is the protein glycosylated, methylated, phosphorylated?• Are detergents present and if yes, what concentration?• Is the sample a complex, dimer, trimer or …?• Is the sample membrane associated or a membrane protein?
Be sure to not only ask questions, but also document the answers and any-thing you learn about the protein, before and after you begin experiments.
Measure the concentration of the protein, run an SDS-PAGE, consider run-ning a native PAGE if the protein has been refolded, and if sample and time permits, add isoelectric focusing (IEF), analytical gel filtration, dynamic light scattering, and mass spectroscopy. Such characterization can provide insight following crystallization screening and optimization, especially when crystallization does not occur or optimization of crystals, for size, X-ray diffraction, or other metric, results in less than desired results.
ConcentrationThe range of concentration in which proteins have been crystallized has been quite wide (1 - 300 mg/ml). For most soluble proteins, 5 to 25 mg/ml in a sample buffer that promotes the sample stability, homogeneity and monodispersity is a reasonable starting point for an initial crystallization screen. A pre-crystallization test such as the PCT (HR2-140 or HR2-142) can be used to better determine the appropriate protein concentration for crystallization screening. A dilute sample can be concentrated using cen-trifugation filter devices, or in a dialysis device against 30% w/v Polyethylene glycol 20,000.
To remove amorphous material and large aggregates, the protein can be filtered using a 0.22 micron, low protein binding filter or centrifugation at 15,000 RCF for 15 minutes. Some prefer not to filter or centrifuge the sample prior to screening, believing amorphous material might promote nucleation.
HandlingUse care when handling the protein; be kind and gentle. Do not shake or vortex the protein and avoid doing anything that might foam the protein. When experiment time calls, thaw the small sample aliquot promptly, in
warm hands, and place the thawed sample in an ice bath. Avoid expos-ing the protein to unnecessary temperature fluctuations. Unless the protein is stable at room temperature, maintain the protein in an ice batch once thawed.
StorageProteins can be stored at 4°C, -20°C, or -80°C, but the stability, homogene-ity, and activity of the protein must be assayed to ensure the optimal stor-age temperature. Repeated freeze thawing of the sample should be avoided. Store the protein in multiple, small aliquots. Rapid, flash cooling by pi-petting 20 to 50 µl of protein into liquid nitrogen will generate small pel-lets that can be collected and stored individually in small (PCR) tubes.4,6 Glycerol in the sample may help the protein tolerate freezing but should be avoided when possible for crystallization samples. Glycerol can be difficult to remove by dialysis and the glycerol can be a crystallization variable, in-fluencing sample solubility and homogeneity.
Label samples clearly with the identification, batch identification, and date of storage. For easy organization and identification, nest the sample, stor-ing the sample in batches of PCR tubes in 10 ml or 50 ml centrifuge tubes and organize them by batch or sample. It is prudent to document and hold onto detailed notes concerning the purification, storage, and handling of the sample.
Combining BatchesAvoid combining different preps and purifications of the sample. Expres-sion, purification, and concentration conditions and procedures are never identical so each batch should be screened separately for crystallization.
Ammonium Sulfate PrecipitationPerhaps less utilized today than during the primordial days of protein crys-tallization, avoid using Ammonium sulfate precipitation as a final purifi-cation and/or concentration step. It can be difficult to completely remove all the Ammonium sulfate by a desalting column or dialysis. The remain-ing trace amounts of ammonium sulfate can interfere with crystallization screening results, create reproducibility problems, and in some reagents lead to false positive salt crystals. It is not uncommon for trace amounts of am-monium sulfate in the sample to cause precipitation or excessive nucleation in screen conditions containing Polyethylene glycol and salt.
LyophilizationAvoid lyophilization. Even though there are many examples of proteins which crystallize after lyophilization (lysozyme, thaumatin, and catalase), lyophilization is to be avoided when possible. If the protein is lyophilized, the sample should be dialyzed before crystallization to remove buffers, salts, and excipients that may have been added prior to lyophilization.
Solutions for Crystal Growth
Sample Preparation for Crystallization
6
Crystal Growth 101 page 3
To Azide or NotDon’t, but if you must, read on. Sodium azide (NaN
3) is an anti-microbial
preservative that is sometimes used to protect samples and crystallization reagents from microbial contamination. Sodium azide is toxic and should be handled with care. Typical Sodium azide concentrations are around 1 mM (0.02% - 0.1% w/v). If you choose to use Sodium azide remember that it is toxic to humans and critters, as well as microbes, it is an inhibitor for some proteins and may become an unintentional ligand for your sample, it can interfere with heavy atom derivatization, some metal azides are explo-sive, and there are reports where eliminating sodium azide from the experi-ment improved crystallization. Alternatives to Sodium azide include thymol and Thimerosal.
An alternative to the use of antimicrobials is the use of proper sterile tech-nique and materials. Sterile filter all samples and reagents into sterile con-tainers. Store samples and reagents at 4 degrees Celsius or colder. Use sterile pipet tips. Keep your work area clean. Develop a sterile technique with your crystallization set ups. With common sense, sterile reagents and sample, good technique, and sterile pipet tips, one can successfully avoid the use of chemical antimicrobials in the crystallization lab.
References and Readings1. How to Use Dynamic Light Scattering to Improve the Likelihood of
Growing Macromolecular Crystals. Gloria E. O. Borgstahl. Methods in Molecular Biology, vol. 363: Macromolecular Crystallography Pro-tocols: Volume 1: Preparation and Crystallization of Macromolecules, Pages 109-129, Edited by: S. Doublié© Humana Press Inc., Totowa, NJ.
2. Light scattering of proteins as a criterion for crystallization. Zulauf, M. and D’Arcy, A. (1992), J. Cryst. Growth 122, 102–106.
3. Dynamic light scattering in evaluating crystallizability of macromol-ecules. Ferré-D’Amaré, A. R. and Burley, S. K. (1997) Meth. Enzymol. 276, 157–166.
4. Protein Crystallization Techniques, Strategies and, Tips. Bergfors, T. M. (1999) International University Line, La Jolla, CA.
5. Thermofluor-based high-throughput stability optimization of pro-teins for structural studies. Ericsson, U.B., Hallberg, M.B., DeTitta, G.T., Dekker, N. & Nordlund, P. Anal. Biochem. 357, 289–298 (2006).
6. High-density miniaturized thermal shift assays as a general strategy for drug discovery. Pantoliano, M.W. et al. Journal of Bimolecular Screen-ing, Volume 6, Number 6, 2001.
7. The use of differential scanning fluorimetry to detect ligand interac-tions that promote protein stability. Niesen, F.H. et al. Nature Protocols, 2212-2221, Volume 2, No. 9, 2007.
8. An improved protocol for rapid freezing of protein samples for long-term storage. Hol, W.G.J. et al, Acta Cryst. (2004). D60, 203-204.
9. The protein as a variable in protein crystallization. Dale GE, Oefner C, D’Arcy A. J Struct Biol. 2003 Apr;142(1):88-97.
10. D’Arcy, A., 1994. Crystallising proteins - A rational approach. Acta Crys-tallogr. D 50, 469–471.
11. Hydrogen Ion Buffers for Biological Research. Good, Norman E.,Winget, G. Douglas, Winter, Wilhelmina,Connolly, Thomas N.,Izawa, Seikichi, Singh, Raizada M. M. (1966). Biochemistry. 5 (2): 467–477.
12. Hydrogen ion buffers. Good, Norman E.; Izawa, Seikichi (1972). Meth-ods Enzymol. 24: 53–68.
13. Hydrogen Ion Buffers for Biological Research. Ferguson, W. J.,Braunschweiger, K. I., Braunschweiger, W. R., Smith, J. R.; McCor-mick, J. J., Wasmann, C. C., Jarvis, N. P., Bell, D. H.; Good, N. E. (1980). Anal. Biochem. 104 (2): 300–310.
14. The Biomolecular Crystallization Database version 4: expanded con-tent and new features. Tung, M and Gallagher, DT. 2009 Acta Crystal-lographica D65, 18-23.
15. Nature Structural Biology 10, 980 (2003).16. Preparation and analysis of protein crystals. Alexander McPherson.
1982. 75-81. John Wiley & Sons.
Related ProductsHR2-140 PCT 50 ml bottles (4 ea), cover slides (1 pk)
HR2-142 PCT (with plates) 30 ml bottles (4 ea), cover slides (1 pk), VDX Plates with sealant (5 ea)
HR2-072 Solubility & Stability Screen 0.5 ml, Deep Well block format
HR2-413 Solubility & Stability Screen 2 0.5 ml, Deep Well block format
HR2-070 Slice pH 0.5 ml, Deep Well block format
ThermoFluor® is a registered trademark of Johnson & Johnson.
Solutions for Crystal Growth
Sample Preparation for Crystallization
7
Crystal Growth 101 page 1
Crystallization ScreeningCrystallization screening is the process of evaluating methods, reagents, and other chemical and physical variables with the objective of producing crystals and/or identifying the variables which are positively or negatively associated with crystallization of the sample.
At the time of this writing, up to 40% of samples screened for crystallization will produce some kind of crystalline result and 10% of samples will pro-duce a crystal suitable for X-ray diffraction analysis. About 75% of proteins screened require optimization. Optimization is the systematic manipula-tion and evaluation of variables which influence the crystallization of the sample.
Primary ScreenPrimary screens are front line screens used for initial screening. If one does not have the knowledge or desire for a specific bias or focus on a reagent class, one may choose a sparse matrix screen composed of salts, polymer, or-ganics, buffers at various pH levels, and mixtures thereof. Or one may have knowledge that a specific reagent class or mixture is desired and choose a screen biased for salt, polymer, polymer and salt, or other formulations.
Secondary ScreenSecondary screens are follow up screens to primary screens. The score from a primary screen such as Index may indicate crystals or promising results in polymer and polymer – salt mixtures. In such an instance, one may choose a secondary screen such as PEGRx 1 and PEGRx 2, as well as PEG/Ion and PEG/Ion 2. Or, primary screens may show promising scores in salt based reagents, where secondary screens such as SaltRx 1 and SaltRx 2 would be appropriate for follow up screening.
Grid ScreenGrid Screens are simple, logical methods for systematically screening on a pH versus precipitant (reagent) grid.1 For example, the pH range 4 to 9 might be screened in 1 pH increments across the 6 wells of the X-axis of a 24 well crystallization plate, while a reagent, such as Polyethylene glycol 6,000 might be screened in 4 concentrations (5, 10, 20, 30% w/v) across the 4 wells of the Y-axis of a 24 well crystallization plate. The method depends on the ability to identify preliminary crystallization conditions while coarsely or finely sampling two variables, typically pH and reagent concentration. Grid Screening can be used as a primary or secondary screen strategy and is most often employed in optimization of initial crystallization conditions (hits). Grid Screens can be designed to cover a broad range of pH and reagent con-centration in big steps, casting a broad net to identify an initial promising pH and reagent concentration (hit). Subsequently, successively finer grids can be generated to identify the optimal pH and reagent concentration for crystallization. The Grid Screen strategy was an original approach to pro-tein crystallization, prior to the development and popularization of sparse matrix screening.
Sparse Matrix ScreenSparse Matrix Screens are composed of a sampling of reagent formulations that have previously crystallized a protein.2 The formulations found in a Sparse Matrix Screen have emerged over time from the accumulated wis-dom and experience of generations of many crystal growers. Initial ideas are assembled, formulated, and tested against previously crystallized and not yet crystallized proteins. Duds are dropped and winners move onto subse-quent rounds of testing. Testing also employs formulations from the litera-ture as well as databases, such as the Protein Data Bank (PDB)3, Biological Macromolecule Crystallization Database (BMCD)4-6, in house data, or data shared through centers and collaborators. When data mining, one must carefully review the data, as screens have existed long enough now that they themselves are within the database, and one must avoid getting caught in some local minima; one should also avoid cherry picking formulations to create a screen that, while looking good on paper, produces redundant hits, rather than sample an appropriate and balanced chemical space of home run conditions as well as singles; one needs both to win the crystallization game. And though one should appreciate and respect data mining, one must also remind oneself to look outside the box, for new chemicals and for-mulations. The unprecedented success of polyethylene glycols, detergents, salt libraries (Tacsimate), small molecular libraries, and numerous other reagents would not have happened had it not been from looking outside the box, and a bit of dumb luck.7-11
Sparse Matrix Screens can be broad, sampling many different salts, poly-mers, organics, buffers, pH, and mixtures thereof. They can also be biased towards a specific reagent class, such as Polyethylene glycols or Salts, or focused on mixtures. In developing a novel Sparse Matrix Screen, one first chooses the number of conditions in the screen (24, 48, 96, 192… 1,536). Second, one defines the intention of the screen, for example, a focus on poly-mers, polymer salt mixtures, and pH. Third, the appropriate concentration of the reagents must be determined and tested, paying particular attention to matching reagent pH with buffer pH, chemical compatibility, solubility, and stability. Finally, the Sparse Matrix Screen must be thoroughly tested with a portfolio of proteins, both previously and not previously crystallized, and the results compared to existing screens. Care should be taken to avoid redundancy of reagent formulation within the new screen and between ex-isting screens, to prevent unnecessary oversampling of chemical space and wasting of the sample.
Development & History of Hampton Research Screens
PCT Pre-Crystallization TestPCT is based on work done by Jarmila Jancarik and offers a quick, con-venient, effective way to achieve the appropriate sample concentration for screening, using a minimal amount of sample.
Solutions for Crystal Growth
Crystallization Screening
8
Crystal Growth 101 page 2
GRAS ScreensGRAS Screens were developed by Hampton Research for the crystallization of proteins, including monoclonal antibodies. The screens utilize GRAS re-agents that promote crystallization of biotherapeutics for bioprocess, bio-formulation, and continuous flow manufacturing applications as well as crystallization of proteins for X-ray crystallography. Each of the chemicals in the GRAS Screens have been used under one or more of the following categories. As (1) a Generally Recognized As Safe (GRAS) substance, (2) a pharmaceutical excipient, (3) a normal physiological constituent, (4) a metabolic byproduct, and/or (5) a Everything Added to Food in the United States (EAFUS) substance. Formulation is based on a) data mining data-bases such as the Protein Data Bank (PDB), BMCD, and in house Hampton Research data, b) review and analysis of the patent and scientific literature, c) input from academic and pharma colleagues, and d) in house testing.
The primary crystallization reagents in GRAS Screen 1 and 2 are Polyeth-ylene glycol 300, 400, MME 550, 600, 1,000, MME 2,000, 3,350 and 4,000 (high concentration) versus 24 unique secondary salts (low concentration), sampling pH 4 to 9 without an added buffer. The screens can be considered an extension to the PEG/Ion screens, albeit with a focus on GRAS reagents.
The primary crystallization reagent in GRAS Screen 3 and 4 are 24 unique salts (high concentration), versus Polyethylene glycol 300, 400, MME 550, 600, 1,000, MME 2,000, 3,350 and 4,000 as secondary reagents (low concen-tration), sampling pH 4 to 9 without an added buffer.
The primary crystallization reagents in GRAS Screen 5 and 6 are Polyethyl-ene glycol 300, 400, MME 550, 600, 1,000, MME 2,000, 3,350 and 4,000, each sampled at 3 concentrations versus pH 4.5 to 10 sampling 8 unique buffers.
The primary crystallization reagents in GRAS Screen 7 and 8 are Ammo-nium - acetate, chloride, citrate, formate, phosphate, sulfate, tartrate, Potas-sium phosphate, Sodium acetate, Sodium - chloride, citrate, formate, phos-phate, and tartrate, each sampled at 4 concentrations versus pH 4.5 to 10 sampling 8 unique buffers.
Index (Index HT)Index is a primary, diverse reagent system crystallization screen for proteins, complexes, peptides, nucleic acids, and water soluble small molecules. The screen is a data-driven biased sparse matrix and grid screen. Index is based on a collaboration between Hampton Research and Allan D’Arcy. The ob-jective of the collaboration was to develop a chemically balanced screen composed of 96 reagents. Both grid and sparse matrix based reagents were conceived, formulated and tested in an iterative process over a period of time utilizing a portfolio of pharma, academic, and standard biological macro-molecular samples. The final formulation, a chimera of grid and sparse matrix, is one of the most frequent front line screens used at this time.
Index, as the name implies, efficiently samples a series of specially formu-lated reagent zones to identify which reagent class or classes and pH are effective in producing crystals or limiting sample solubility. Results from Index can be used to design optimization experiments and to identify fol-low up screens by reagent class. For example, positive results with salt based reagents in Index may be followed up with further screening using SaltRx and Grid Screen Salt HT. Success with polymer based reagents in Index may be followed up with further screening using PEGRx and PEG/Ion.
Index utilizes a broad, yet refined portfolio of crystallization reagent sys-tems. These include the following: (1) traditional salts such as Ammonium sulfate and Sodium chloride versus pH; (2) neutralized organic acids such as Sodium malonate and Tacsimate; (3) High salt concentration mixed with low polymer concentration as well as high polymer concentration mixed with low salt concentration and; (4) Low ionic strength using polymers such as PEG, MPD, and Pentaerythritol versus pH. These reagent systems are for-mulated across a sparse matrix and incomplete factorial of concentration ranges, sampling a pH range of 3 to 9.12
Crystal Screen & Crystal Screen 2 (Crystal Screen HT)Crystal Screen and Crystal Screen 2 are primary sparse matrix screens for proteins, soluble peptides, nucleic acids, and water soluble small molecules. Crystal Screen is based on the publication by Jarmila Jancarik and Sung Ho Kim2, which was the first appearance of a sparse matrix crystallization screen in the literature.
The formulation was an iterative process, with input from crystallographers in pharma and academia, including planning, testing, and advice from Marcos Hatada. Crystal Screen was the world’s first crystallization kit offered for purchase by the research community and was first offered by Hampton Research in 1991. The Crystal Screen formulation has had a tremendous impact on the structural biology community, that continues to this day, with more than 2,000 citations to the original publication, and remains one of the most popular crystallization screens today.
Crystal Screen 2 was developed by Hampton Research as an extension to the original 50 conditions in Crystal Screen.19 The formulation is of a reduced reagent relative supersaturation, to balance the higher relative supersatura-tion in Crystal Screen, along with exploring then novel reagents such as Jeffamine, Polyethylene glycol monomethyl ether, and mixed component precipitant systems such as [High Salt]/[Low Salt], [High Salt]/[Low PEG], [High PEG]/[Low PEG], and [High PEG]/[Low Salt]. Formulation is based on a) data mining of the BMCD, in house data at Hampton Research, and data supplied by a pharma partner, and b) testing of novel reagents with a portfolio of proteins.
Solutions for Crystal Growth
Crystallization Screening
9
Crystal Growth 101 page 3
Crystal Screen Cryo & Crystal Screen 2 Cryo(Crystal Screen Cryo HT)Crystal Screen Cryo and Crystal Screen 2 Cryo are primary biased sparse ma-trix screens with cryo for proteins, soluble peptides, nucleic acids, and water soluble small molecules. Crystal Screen Cryo and Crystal Screen 2 Cryo are based on the original Crystal Screen and Crystal Screen 2 formulation, with added glycerol for the growth of cryo ready crystals. The optimal glycerol concentrations were described by Elspeth Garman13 and Eddie Snell14.
PEGRx 1 & PEGRx 2 (PEGRx HT)PEGRx 1 and PEGRx 2 are primary and secondary, polymer and pH based crystallization screens for biological macromolecules. Both screens were de-veloped at Hampton Research. The screens are designed to evaluate polymer based crystallization reagents and pH in low (PEGRx 1) to medium (PEGRx 2) ionic strength. Both screens are designed for use as primary screens, or as secondary screens to follow the Hampton Research Index screen and other screens when low to medium ionic strength polymer based reagents produce hits and interesting solubility leads. Chemical selection, buffer, pH, and for-mulation were based on the literature, public databases (PDB, BMCD), and in house data as well as the creation and sampling of novel polymers and formulations. Formulations were tested against previously crystallized and not yet crystallized samples, and an iterative process of removing, replacing, and retesting carried out until screen performance criteria were met.
PEG/Ion & PEG/Ion 2 (PEG/Ion HT)PEG/Ion and PEG/Ion 2 are primary or secondary, polymer, salt and pH matrix crystallization screens for biological macromolecules. Both screens were developed at Hampton Research. PEG/Ion is a sparse matrix profile of anions and cations in the presence of monodisperse Polyethylene glycol (PEG) 3,350 over pH 4.5 - 9.2. The screen is designed to evaluate monodis-perse, high purity PEG 3,350 and 48 unique salts representing a very com-plete range of anions and cations frequently used in the crystallization of biological macromolecules. The primary screening variables are PEG, ion type, ionic strength, and pH. More than 60% of the published crystallizations utilize PEG as a primary crystallization reagent and in approximately 50% of those reports, the PEG was combined with an ion as a secondary crystal-lization reagent. PEG/Ion reagents are formulated without a buffer and are not pH titrated, yet the formulation encompasses a broad pH range of 4.5 to 9.2 due to the diverse inclusion of 0.2 M salt in the presence of PEG.
PEG/Ion 2 is designed as an extension to PEG/Ion in order to generate a 96 reagent screen. PEG/Ion 2 screens a complete profile of titrated organic acids at varying pH levels (3.7 - 8.8), metals and Tryptone in the presence of monodisperse PEG 3,350 at varying concentrations.
Both screens are designed for use as primary screens or as secondary screens to follow the Hampton Research Index and other screens when polymer –
salt based reagents in PEG 3,350 and similar Mr PEGs (3,000 to 8,000) pro-duce hits and interesting solubility leads.
SaltRx 1 and SaltRx 2 (SaltRx HT)SaltRx and SaltRx 2 are primary or secondary, salt and pH matrix crystal-lization screens for biological macromolecules. Both screens were developed at Hampton Research. Salt is the only primary crystallization reagent (pre-cipitant) utilized. Based on a design of 96 conditions, the screen evaluates a broad portfolio of crystallization salts of varying concentration and pH. The selection, concentration, and pH of the salts were determined by data mining the BMCD and PDB, crystallization reports in the literature, as well as in house data at Hampton Research. Based on this analysis, up to 35% of protein crystallizations involve salt as the primary crystallization reagent.
SaltRx 1 and SaltRx 2 can be used as a primary crystallization screen when salt, ionic strength and pH are desired or suspected as appropriate crystal-lization variables. The screens are also used as secondary screens when salt based reagents from Index, Crystal Screen, and Grid Screen produce crystals and when further screening for additional salt conditions or optimization is desired.
MembFac & Crystal Screen Lite (MembFac HT)MembFac and Crystal Screen Lite are primary sparse matrix crystalliza-tion screens for membrane proteins and hydrophobic samples with limited solubility. The MembFac formulation is based on the research of Michael Stowell. Crystal Screen Lite is based upon Crystal Screen, with the primary precipitant concentration halved, while the secondary salts, ions, and buf-fers remain at the original concentration. Testing of the Crystal Screen Lite formulation was performed in collaboration between Jarmila Jancarik and Hampton Research utilizing a portfolio of membrane proteins, proteins of limited solubility, and soluble proteins.
Natrix & Natrix 2 (Natrix HT)Natrix and Natrix 2 are primary biased sparse matrix crystallization screens for nucleic acids & protein/nucleic acid complexes. Natrix is based on pub-lished formulations, including the sparse matrix formulation first described by William Scott in 1995.15 Natrix 2 is based upon published reagent for-mulations for the crystallization of nucleic acids and protein-nucleic acid complexes. A variety of hammerhead ribozymes and other ribozymes, RNAs, DNAs, RNA-drug complexes, and RNA-protein complexes have been crystal-lized using the Natrix and Natrix 2 formulations.
Natrix screens are unique in that rather than relying solely or heavily on the traditional nucleic acid precipitant (+/-)-2-Methyl-2,4-pentanediol (MPD), Natrix screens also utilize Polyethylene glycols (PEGs) in a vari-ety of molecular weights (200, 400, 4,000, 8,000) as well as 2-Propanol,
Solutions for Crystal Growth
Crystallization Screening
10
Crystal Growth 101 page 4
Polyethylene glycol monomethyl ether (PEG MME), and 1,6-Hexanediol. Many of the polymeric and low molecular weight organic precipitants are combined with various monovalent salts as precipitating agents. This com-bination of salts and low molecular weight organics and polyalcohols, as well as the utilization of varying chain length PEGs, has proven to be a successful combination for producing nucleic acid and protein-nucleic acid complex crystals.
Grid ScreensThe Grid Screens are premised on the simple, logical methods for systemati-cally screening on a pH versus precipitant (reagent) grid.1 The method de-pends on the ability to identify preliminary crystallization conditions while coarsely or finely sampling two variables, typically pH and reagent concen-tration. The Grid Screening strategy can be used as a primary crystallization screen when Ammonium sulfate or Sodium chloride, or Sodium malonate, or Sodium potassium phosphate, or middleweight PEG, or MPD and pH are desired or suspected as appropriate crystallization variables. It is also useful as a secondary screen when these same reagents from screens such as Index, Crystal Screen or similar screen produce crystals and further screening for additional conditions or optimization is desired.
The Grid Screens, save for Grid Screen Salt HT (96 reagents), are 24 reagent screens varying precipitant concentration versus pH. Chemical selection, buffer, pH, and formulation were based on the literature, public databases (PDB, BMCD), and in house data. Formulations were tested against previ-ously crystallized and not yet crystallized samples, and an iterative process of removing, replacing, and retesting carried out until screen performance criteria were met.
Nucleic Acid Mini ScreenNucleic Acid Mini Screen is a crystallization screen for nucleic acid frag-ments. The formulation is based upon the publication, “A Highly Efficient 24 Condition Matrix for the Crystallization of Nucleic Acid Fragments” where the preliminary crystallization conditions of 35 nucleic acids were determined.16 The unique formulation consists of separated reagents for the sample drop and for the reagent well (common dehydrant). Samples include DNA, DNA-Drug complexes, C-Tetrad and G-Quartet Motifs, RNA oligomers, and other nucleic acids.
Low Ionic Strength ScreenThe Low Ionic Strength Screen is a crystallization screen for intact mono-clonal antibodies, monoclonal antibody fragments, & proteins less soluble at low ionic strength. The formulation is based upon the publication, “Crys-tallization of intact monoclonal antibodies”.17 The format of the screen is unique from other screens offered by Hampton Research in that the reagent Polyethylene glycol 3,350 and buffers are supplied as separate solutions al-lowing one to customize the number of conditions, concentration, and pH
covered to their liking. The unique formulation also consists of separated reagents for the sample drop and for the reagent well (common dehydrant).
Selecting the Screen(s)If the protein, a similar protein, or a family member of a related protein has been previously crystallized, one may initially look to pursuing similar methods, reagents, and screens for the crystallization of the new sample.
Screens for Soluble Proteins• Index • Crystal Screen, Crystal Screen 2• PEGRx 1, PEGRx 2 • PEG/Ion 1, PEG/Ion 2• SaltRx 1, SaltRx 2 • Grid Screens• GRAS Screens
Screens for Membrane Proteins• MembFac • Crystal Screen Lite• GRAS 1 • GRAS 2
Screens for Protein Complexes• PEGRx 1 • PEGRx 2• PEG/Ion 1 • PEG/Ion 2• GRAS 1 • GRAS 2
Screens for Nucleic Acids & Protein Nucleic Acid Complexes, Ribozymes, RNAs, DNAs, RNA-Drug Complexes, and RNA-Protein Complexes• Natrix 1 • Natrix 2
Screen for Nucleic Acid Fragments, DNA, DNA-Drug complexes, C-Tetrad and G-Quartet Motifs, and RNA Oligomers• Nucleic Acid Mini Screen (NAM)
Screens for Biological Therapeutics, including Monoclonal Antibodies• GRAS Screens
Interpreting the ScreenClear drops indicate that either the relative supersaturation of the sample and reagent is too low or the drop has not yet completed equilibration. If the drop remains clear after 3 to 4 weeks, consider repeating the screen condition and doubling the sample concentration. If more than 70 of the 96 drops are clear, then consider doubling the sample concentration and repeating the entire screen.
Drops containing precipitate indicate either the relative supersaturation of the sample and reagent is too high, the sample has denatured, or the sample
Solutions for Crystal Growth
Crystallization Screening
11
Crystal Growth 101 page 5
is heterogeneous. To reduce the relative supersaturation, dilute the sample twofold with sample buffer and repeat the screen condition. If more than 70 of the 96 drops contain precipitate and no crystals are present, then consider diluting the sample concentration in half by adding an equal volume of sample buffer to the sample and repeating the entire screen. If sample denaturation is suspected, take measures to stabilize the sample (add reduc-ing agent, ligands, additives, salt, or other stabilizing agents). If the sample is impure, aggregated, or heterogeneous take measures to pursue increased purity and homogeneity. It is possible to obtain crystals from precipitate so do not discard nor ignore a drop containing precipitate. If possible, examine drops containing precipitate under polarizing or UV optics to differentiate precipitate from microcrystals. If the drop contains a macro-molecular crystal the relative supersaturation of the sample and reagent is appropriate for crystal nucleation and growth.
The next step is to optimize the preliminary conditions by varying the re-agent concentration, screen pH, vary temperature between 4 and 30°C, screen additives, and evaluate other crystallization variables including sample construct, purity, stability, and homogeneity in order to achieve the desired crystal size and quality. See CG101 Optimization for further infor-mation.
When sample quantity permits, set screens in duplicate (4°C and 25°C) or triplicate (10°C and 20°C and 30°C) to evaluate the effect of temperature on crystallization. Compare the observations between the different tem-peratures to determine the effect of temperature on sample solubility. Different results in the same drops at different temperatures indicate that sample solubility is temperature dependent and that one should include temperature as a variable in subsequent screens and optimization experi-ments.
When sample quantity permits, set screens using multiple drops and drop ratios, such as 1:2, 1:1, and 2:1. See Hampton Research Crystal Growth 101: Drop Ratio for details.
Getting Down to Business - Performing the ScreenToday, most screening is performed using either the sitting or hanging drop vapor diffusion method. Other methods such as microbatch, dialysis, and free interface diffusion are also used for screening.
Screening by sitting or hanging drop vapor diffusion may be accomplished using manual and automated sample handling and pipetting. Manual methods can be employed using an adjustable 0.1 to 2 µl or a 1 to 10 µl for the drops, and an adjustable 1,000 µl pipette for the reagent well (reservoir). A 1 to 2 µl drop composed of sample and reagent is set in vapor equilibra-tion with a reagent volume of 500 to 1,000 µl. Automated methods can be used to set a 50 to 400 nl drop composed of sample and reagent in vapor
equilibration with a reagent volume of 50 to 100 µl. See CG101 Sitting Drop Vapor Diffusion Crystallization and CG101 Hanging Drop Vapor Diffusion Crystallization for details on these methods.
The SampleOnce the sample of interest is isolated in a pure, homogenous, stable, active, and concentrated form, it is time to commence screening methods and re-agents towards producing crystals of the sample. For screening, the sample should be in the concentration range of 1 to 25 mg/ml in dilute, 5 to 25 mM buffer, and the salt concentration below 200 mM.
Other additives essential for sample homogeneity, stability, and activity should be present in the lowest effective concentration.
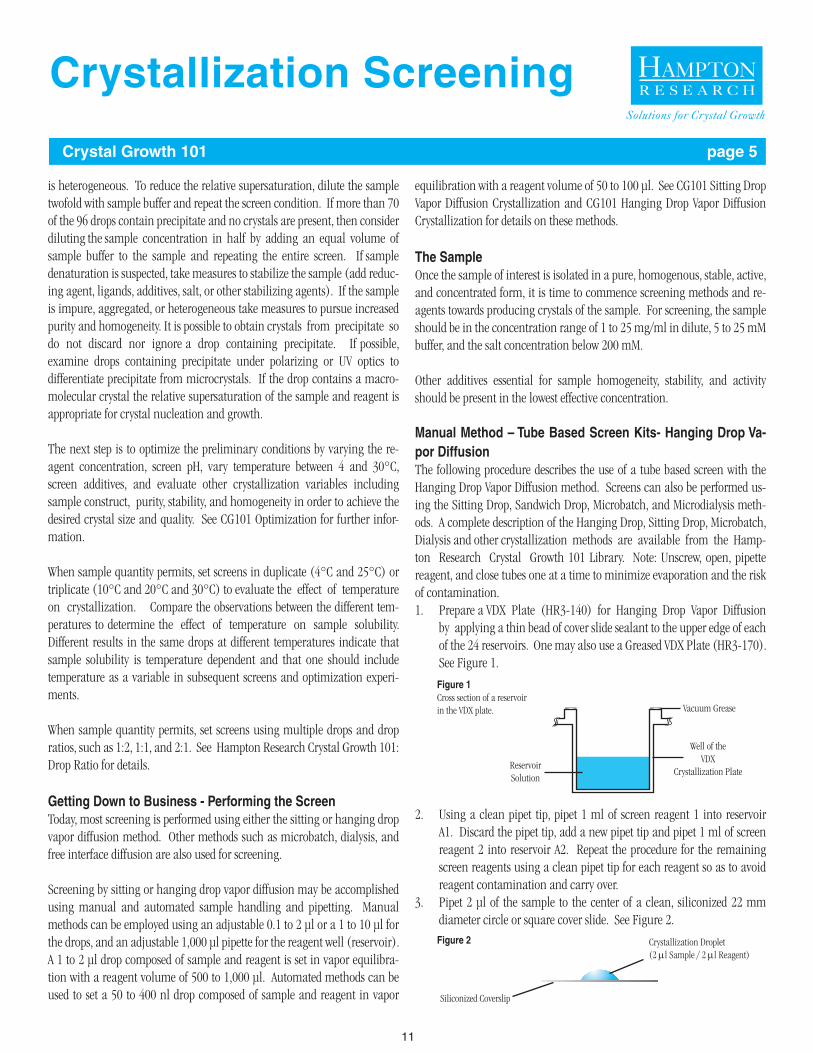
Manual Method – Tube Based Screen Kits- Hanging Drop Va-por DiffusionThe following procedure describes the use of a tube based screen with the Hanging Drop Vapor Diffusion method. Screens can also be performed us-ing the Sitting Drop, Sandwich Drop, Microbatch, and Microdialysis meth-ods. A complete description of the Hanging Drop, Sitting Drop, Microbatch, Dialysis and other crystallization methods are available from the Hamp-ton Research Crystal Growth 101 Library. Note: Unscrew, open, pipette reagent, and close tubes one at a time to minimize evaporation and the risk of contamination.1. Prepare a VDX Plate (HR3-140) for Hanging Drop Vapor Diffusion
by applying a thin bead of cover slide sealant to the upper edge of each of the 24 reservoirs. One may also use a Greased VDX Plate (HR3-170). See Figure 1.
2. Using a clean pipet tip, pipet 1 ml of screen reagent 1 into reservoir A1. Discard the pipet tip, add a new pipet tip and pipet 1 ml of screen reagent 2 into reservoir A2. Repeat the procedure for the remaining screen reagents using a clean pipet tip for each reagent so as to avoid reagent contamination and carry over.
3. Pipet 2 μl of the sample to the center of a clean, siliconized 22 mm diameter circle or square cover slide. See Figure 2.
Solutions for Crystal Growth
Figure 1Cross section of a reservoir in the VDX plate.
ReservoirSolution
Well of theVDX
Crystallization Plate
Vacuum Grease
Figure 2
Siliconized Coverslip
Crystallization Droplet(2 ml Sample / 2 ml Reagent)
Crystallization Screening
12
Crystal Growth 101 page 6
4. Pipet 2 μl of screen reagent 1 from reservoir A1 into the sample droplet and either a) dispense or b) dispense and mix by aspirating and dis-pensing the droplet several times, keeping the tip in the drop during mixing to avoid foaming. See Figure 2.
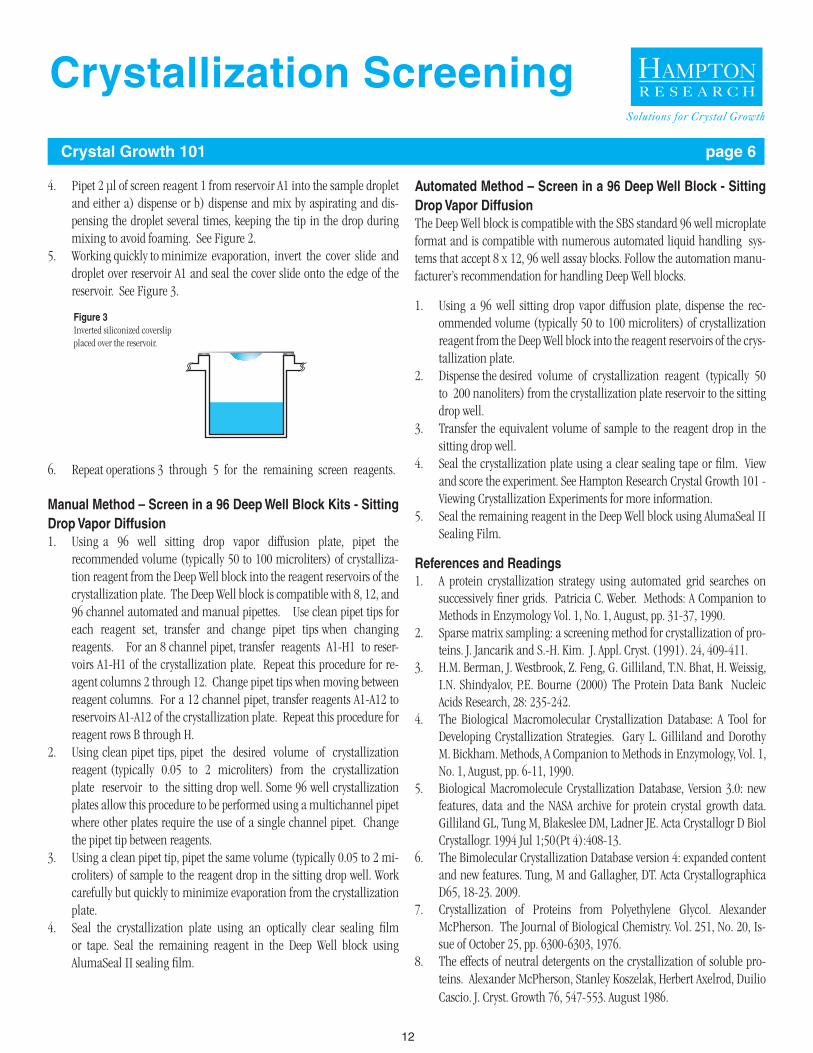
5. Working quickly to minimize evaporation, invert the cover slide and droplet over reservoir A1 and seal the cover slide onto the edge of the reservoir. See Figure 3.
6. Repeat operations 3 through 5 for the remaining screen reagents.
Manual Method – Screen in a 96 Deep Well Block Kits - Sitting Drop Vapor Diffusion1. Using a 96 well sitting drop vapor diffusion plate, pipet the
recommended volume (typically 50 to 100 microliters) of crystalliza-tion reagent from the Deep Well block into the reagent reservoirs of the crystallization plate. The Deep Well block is compatible with 8, 12, and 96 channel automated and manual pipettes. Use clean pipet tips for each reagent set, transfer and change pipet tips when changing reagents. For an 8 channel pipet, transfer reagents A1-H1 to reser-voirs A1-H1 of the crystallization plate. Repeat this procedure for re-agent columns 2 through 12. Change pipet tips when moving between reagent columns. For a 12 channel pipet, transfer reagents A1-A12 to reservoirs A1-A12 of the crystallization plate. Repeat this procedure for reagent rows B through H.
2. Using clean pipet tips, pipet the desired volume of crystallization reagent (typically 0.05 to 2 microliters) from the crystallization plate reservoir to the sitting drop well. Some 96 well crystallization plates allow this procedure to be performed using a multichannel pipet where other plates require the use of a single channel pipet. Change the pipet tip between reagents.
3. Using a clean pipet tip, pipet the same volume (typically 0.05 to 2 mi-croliters) of sample to the reagent drop in the sitting drop well. Work carefully but quickly to minimize evaporation from the crystallization plate.
4. Seal the crystallization plate using an optically clear sealing film or tape. Seal the remaining reagent in the Deep Well block using AlumaSeal II sealing film.
Automated Method – Screen in a 96 Deep Well Block - Sitting Drop Vapor DiffusionThe Deep Well block is compatible with the SBS standard 96 well microplate format and is compatible with numerous automated liquid handling sys-tems that accept 8 x 12, 96 well assay blocks. Follow the automation manu-facturer’s recommendation for handling Deep Well blocks.
1. Using a 96 well sitting drop vapor diffusion plate, dispense the rec-ommended volume (typically 50 to 100 microliters) of crystallization reagent from the Deep Well block into the reagent reservoirs of the crys-tallization plate.
2. Dispense the desired volume of crystallization reagent (typically 50 to 200 nanoliters) from the crystallization plate reservoir to the sitting drop well.
3. Transfer the equivalent volume of sample to the reagent drop in the sitting drop well.
4. Seal the crystallization plate using a clear sealing tape or film. View and score the experiment. See Hampton Research Crystal Growth 101 - Viewing Crystallization Experiments for more information.
5. Seal the remaining reagent in the Deep Well block using AlumaSeal II Sealing Film.
References and Readings1. A protein crystallization strategy using automated grid searches on
successively finer grids. Patricia C. Weber. Methods: A Companion to Methods in Enzymology Vol. 1, No. 1, August, pp. 31-37, 1990.
2. Sparse matrix sampling: a screening method for crystallization of pro-teins. J. Jancarik and S.-H. Kim. J. Appl. Cryst. (1991). 24, 409-411.
3. H.M. Berman, J. Westbrook, Z. Feng, G. Gilliland, T.N. Bhat, H. Weissig, I.N. Shindyalov, P.E. Bourne (2000) The Protein Data Bank Nucleic Acids Research, 28: 235-242.
4. The Biological Macromolecular Crystallization Database: A Tool for Developing Crystallization Strategies. Gary L. Gilliland and Dorothy M. Bickham. Methods, A Companion to Methods in Enzymology, Vol. 1, No. 1, August, pp. 6-11, 1990.
5. Biological Macromolecule Crystallization Database, Version 3.0: new features, data and the NASA archive for protein crystal growth data. Gilliland GL, Tung M, Blakeslee DM, Ladner JE. Acta Crystallogr D Biol Crystallogr. 1994 Jul 1;50(Pt 4):408-13.
6. The Bimolecular Crystallization Database version 4: expanded content and new features. Tung, M and Gallagher, DT. Acta Crystallographica D65, 18-23. 2009.
7. Crystallization of Proteins from Polyethylene Glycol. Alexander McPherson. The Journal of Biological Chemistry. Vol. 251, No. 20, Is-sue of October 25, pp. 6300-6303, 1976.
8. The effects of neutral detergents on the crystallization of soluble pro-teins. Alexander McPherson, Stanley Koszelak, Herbert Axelrod, Duilio Cascio. J. Cryst. Growth 76, 547-553. August 1986.
Solutions for Crystal Growth
Figure 3Inverted siliconized coverslip placed over the reservoir.
Crystallization Screening
13
Crystal Growth 101 page 7
9. A comparison of salts for the crystallization of macromolecules. Alex-ander McPherson. Protein Science, 2001 Feb; 10(2) 418-422.
10. Searching for silver bullets: an alternative strategy for crystallizing macromolecules. J Struct Biol 2006 Dec, 156(3) 387-406.
11. Protein crystallization and dumb luck. Bob Cudney. The Rigaku Jour-nal, Volume 16, No. 1, pp. 1-7, 1999.
12. Efficient Factorial Designs and the Analysis of Macromolecular Crystal Growth Conditions. Charles W. Carter, Jr. Methods, A Companion to Methods in Enzymology, Vol. 1, No. 1, August, pp. 12-24, 1990.
13. Glycerol concentrations required for cryoprotection of 50 typical pro-tein crystallization solutions using standard area-detector X-ray im-ages, Garman, E.F. and Mitchell, E.P., J. Appl. Cryst. (1996) 29, 584- 587.
14. The development and application of a method to quantify the quality of cryoprotectant solutions using standard area-detector X-ray images. McFerrin and Snell, J. Appl. Cryst. (2002). 35, 538-545.
15. Rapid crystallization of chemically synthesized hammherhead RNAs using a double screening procedure. William G. Scott, John T. Finch, Richard Grenfell, Jan Fogg, Terry Smith, Michael J. Gait and Aaron Klug. J. Mol. Biol. (1995) 250, 327–332.
16. A Highly Effective 24 Condition Matrix for the Crystallization of Nucleic Acid Fragments. Berger I1, Kang CH, Sinha N, Wolters M, Rich A. Acta Cryst. Section D. (1996) Vol. D52 Part 3, 465-468.
17. Crystallization of intact monoclonal antibodies. Harris, L.J., Skaletsky, E., McPherson, A. Proteins. 1995 Oct;23(2):285-9.
18. Screening and optimization strategies for macromolecular crystal growth. Cudney, R., Patel, S. Weisgraber, K., Newhouse, Y., McPherson, A. Acta Crystallogr D Biol Crystallogr. 1994 Jul 1;50(Pt 4):414-23.
19. Crystallization of biological macromolecules. Alexander McPherson. 1999. Cold Spring Harbor Laboratory Press. Pp. 271-329.
Related ProductsHR2-140 PCT 50 ml bottles (4 ea), cover slides (1 pk)HR2-142 PCT (with plates) 30 ml bottles (4 ea), cover slides (1 pk), VDX Plates with sealant (5 ea)HR2-451 GRAS Screen 1 1 ml, Deep Well block formatHR2-452 GRAS Screen 2 1 ml, Deep Well block formatHR2-453 GRAS Screen 3 1 ml, Deep Well block formatHR2-454 GRAS Screen 4 1 ml, Deep Well block format
HR2-455 GRAS Screen 5 1 ml, Deep Well block formatHR2-456 GRAS Screen 6 1 ml, Deep Well block formatHR2-457 GRAS Screen 7 1 ml, Deep Well block formatHR2-458 GRAS Screen 8 1 ml, Deep Well block formatHR2-144 Index 10 ml, tube formatHR2-134 Index HT 1 ml, Deep Well block format HR2-110 Crystal Screen 10 ml, tube formatHR2-112 Crystal Screen 2 10 ml, tube formatHR2-130 Crystal Screen HT 1 ml, Deep Well block formatHR2-082 PEGRx 1 10 ml, tube formatHR2-084 PEGRx 2 10 ml, tube formatHR2-086 PEGRx HT 1 ml, Deep Well block formatHR2-126 PEG/Ion Screen 10 ml, tube formatHR2-098 PEG/Ion 2 Screen 10 ml, tube formatHR2-139 PEG/Ion HT 1 ml, Deep Well block formatHR2-136 SaltRx HT 1 ml, Deep Well block formatHR2-107 SaltRx 1 10 ml, tube formatHR2-109 SaltRx 2 10 ml, tube formatHR2-114 MembFac 10 ml, tube formatHR2-128 Crystal Screen Lite 10 ml, tube formatHR2-137 MembFac HT 1 ml, Deep Well block formatHR2-116 Natrix 10 ml, tube formatHR2-117 Natrix 2 10 ml, tube format
Solutions for Crystal Growth
Crystallization Screening
14
Crystal Growth 101 page 8
HR2-131 Natrix HT 1 ml, Deep Well block formatHR2-211 Grid Screen Ammonium Sulfate 10 ml, tube formatHR2-219 Grid Screen Sodium Chloride 10 ml, tube formatHR2-247 Grid Screen Sodium Malonate 10 ml, tube formatHR2-221 Quik Screen 10 ml, tube formatHR2-217 Grid Screen PEG/LiCl 10 ml, tube formatHR2-213 Grid Screen PEG 6000 10 ml, tube formatHR2-215 Grid Screen MPD 10 ml, tube formatHR2-248 Grid Screen Salt HT 1 ml, Deep Well block formatHR2-118 Nucleic Acid Mini Screen 1 ml, tube format + 250 ml bottleHR2-120 Low Ionic Strength Screen 1 ml, tube formatHR2-519 Polyethylene glycol 3,350 Monodisperse 24% w/v solution - 200 mlHR8-069 AlumaSeal II Sealing Film 100 packHR4-413 Film Sealing Paddle 5 pack
Solutions for Crystal Growth
Crystallization Screening
15
Sitting Drop VaporDiffusion Crystallization Crystal Growth 101 page 1
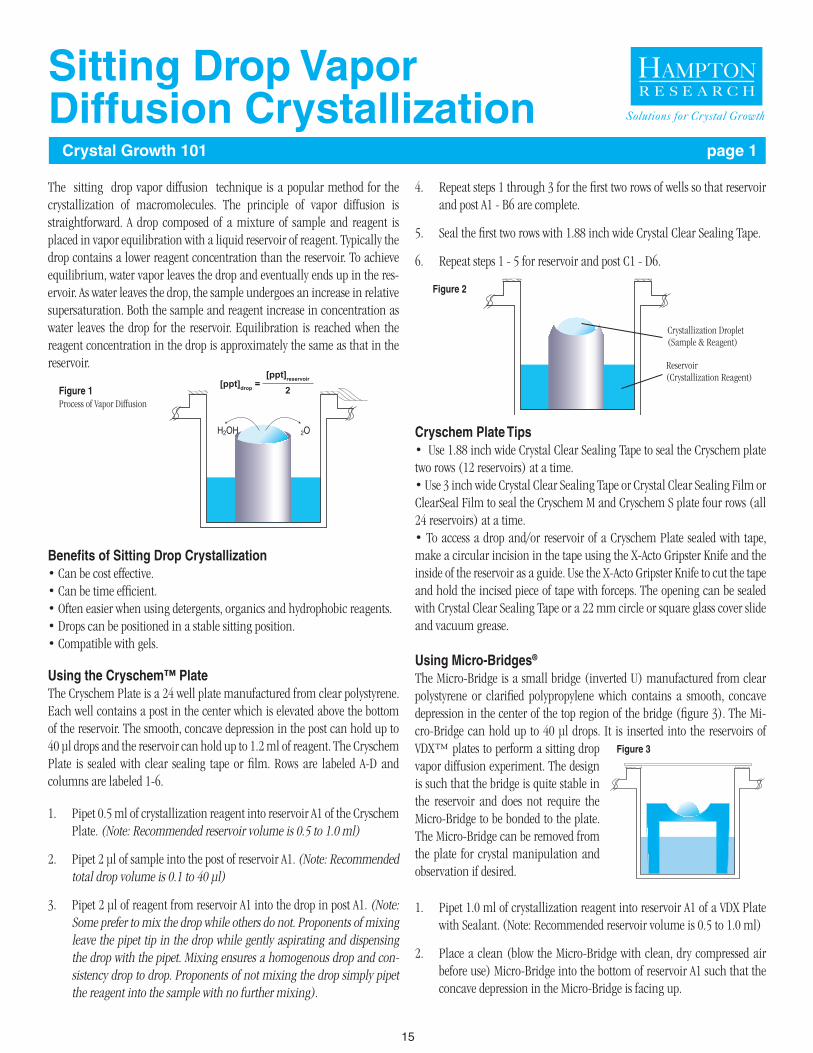
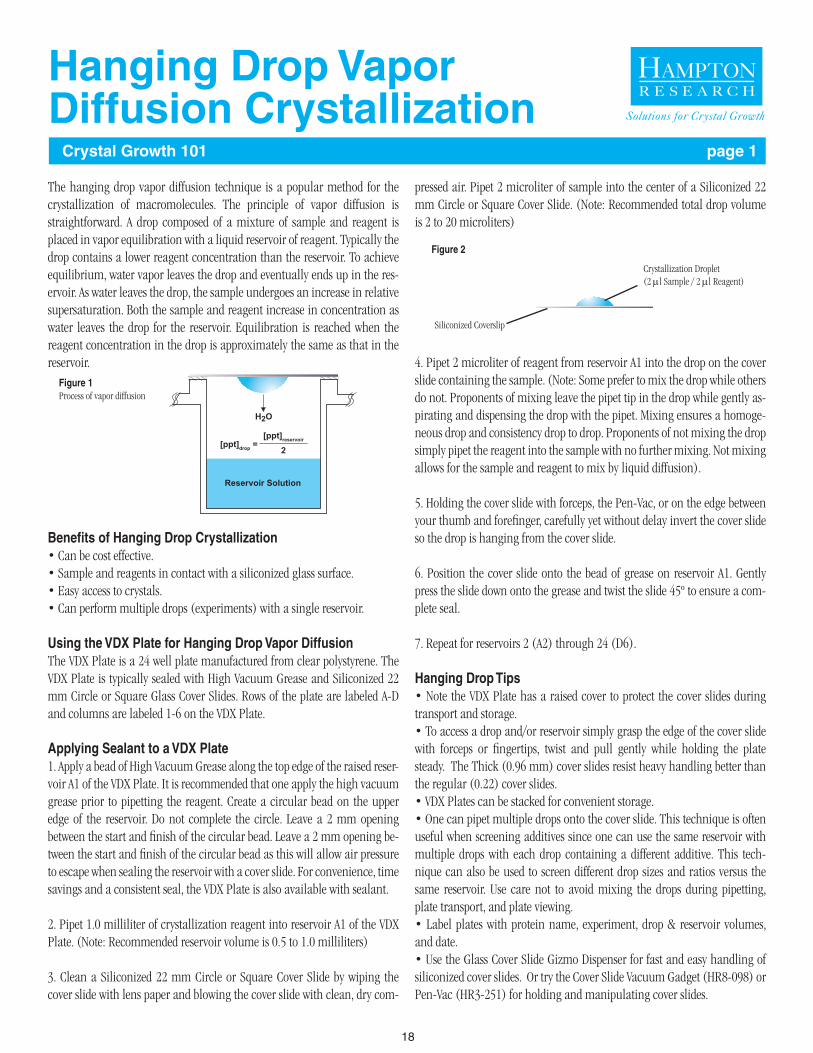
The sitting drop vapor diffusion technique is a popular method for the crystallization of macromolecules. The principle of vapor diffusion is straightforward. A drop composed of a mixture of sample and reagent is placed in vapor equilibration with a liquid reservoir of reagent. Typically the drop contains a lower reagent concentration than the reservoir. To achieve equilibrium, water vapor leaves the drop and eventually ends up in the res-ervoir. As water leaves the drop, the sample undergoes an increase in relative supersaturation. Both the sample and reagent increase in concentration as water leaves the drop for the reservoir. Equilibration is reached when the reagent concentration in the drop is approximately the same as that in the reservoir.
Benefits of Sitting Drop Crystallization• Can be cost effective.• Can be time efficient.• Often easier when using detergents, organics and hydrophobic reagents.• Drops can be positioned in a stable sitting position.• Compatible with gels.
Using the Cryschem™ PlateThe Cryschem Plate is a 24 well plate manufactured from clear polystyrene. Each well contains a post in the center which is elevated above the bottom of the reservoir. The smooth, concave depression in the post can hold up to 40 μl drops and the reservoir can hold up to 1.2 ml of reagent. The Cryschem Plate is sealed with clear sealing tape or film. Rows are labeled A-D and columns are labeled 1-6.
1. Pipet 0.5 ml of crystallization reagent into reservoir A1 of the Cryschem Plate. (Note: Recommended reservoir volume is 0.5 to 1.0 ml)
2. Pipet 2 μl of sample into the post of reservoir A1. (Note: Recommended total drop volume is 0.1 to 40 μl)
3. Pipet 2 μl of reagent from reservoir A1 into the drop in post A1. (Note: Some prefer to mix the drop while others do not. Proponents of mixing leave the pipet tip in the drop while gently aspirating and dispensing the drop with the pipet. Mixing ensures a homogenous drop and con-sistency drop to drop. Proponents of not mixing the drop simply pipet the reagent into the sample with no further mixing).
4. Repeat steps 1 through 3 for the first two rows of wells so that reservoir and post A1 - B6 are complete.
5. Seal the first two rows with 1.88 inch wide Crystal Clear Sealing Tape.
6. Repeat steps 1 - 5 for reservoir and post C1 - D6.
Cryschem Plate Tips• Use 1.88 inch wide Crystal Clear Sealing Tape to seal the Cryschem plate two rows (12 reservoirs) at a time.• Use 3 inch wide Crystal Clear Sealing Tape or Crystal Clear Sealing Film or ClearSeal Film to seal the Cryschem M and Cryschem S plate four rows (all 24 reservoirs) at a time.• To access a drop and/or reservoir of a Cryschem Plate sealed with tape, make a circular incision in the tape using the X-Acto Gripster Knife and the inside of the reservoir as a guide. Use the X-Acto Gripster Knife to cut the tape and hold the incised piece of tape with forceps. The opening can be sealed with Crystal Clear Sealing Tape or a 22 mm circle or square glass cover slide and vacuum grease.
Using Micro-Bridges®
The Micro-Bridge is a small bridge (inverted U) manufactured from clear polystyrene or clarified polypropylene which contains a smooth, concave depression in the center of the top region of the bridge (figure 3). The Mi-cro-Bridge can hold up to 40 μl drops. It is inserted into the reservoirs of VDX™ plates to perform a sitting drop vapor diffusion experiment. The design is such that the bridge is quite stable in the reservoir and does not require the Micro-Bridge to be bonded to the plate. The Micro-Bridge can be removed from the plate for crystal manipulation and observation if desired.
1. Pipet 1.0 ml of crystallization reagent into reservoir A1 of a VDX Plate with Sealant. (Note: Recommended reservoir volume is 0.5 to 1.0 ml)
2. Place a clean (blow the Micro-Bridge with clean, dry compressed air before use) Micro-Bridge into the bottom of reservoir A1 such that the concave depression in the Micro-Bridge is facing up.
Solutions for Crystal Growth
H2OH 2O
[ppt]drop = [ppt]reservoir
2Figure 1Process of Vapor Diffusion
Figure 2
Crystallization Droplet(Sample & Reagent)
Reservoir(Crystallization Reagent)
Figure 3
16
3. Pipet 2 μl of sample into the Micro-Bridge in reservoir A1. (Note: Rec-ommended total drop volume is 0.1 to 40 μl)
4. Pipet 2 μl of reagent from reservoir A1 into the drop in the Micro-Bridge A1. (Note: Some prefer to mix the drop while others do not. Proponents of mixing leave the pipet tip in the drop while gently aspirating and dispensing the drop with the pipet. Mixing ensures a homogenous drop and consistency drop to drop. Proponents of not mixing the drop sim-ply pipet the reagent into the sample with no further mixing.)
5. Using a 22 mm diameter circle cover slide, seal reservoir A1.
6. Repeat steps 1 through 5 for the remaining 23 reservoirs.
Micro-Bridge Tips• Micro-Bridges can also be set up in a VDX Plate without sealant and sealed with two strips of 1.88 inch wide Crystal Clear Sealing Tape. • To access a drop and/or reservoir sealed with tape, make a circular inci-sion in the tape using the X-Acto Gripster Knife and the inside of the reservoir as a guide. Use the X-Acto Gripster Knife to cut the tape and hold the incised piece of tape with forceps. The opening can be sealed with a Crystal Clear Sealing Tape or a 22 mm circle or square glass cover slide and vacuum grease.• Micro-Bridges can be removed for crystal seeding, mounting, manipula-tion, and observation.• Micro-Bridges are designed as disposable devices. It is not recommended to wash and re-use Micro-Bridges.• Micro-Bridges cannot be siliconized or autoclaved.
Sandwich Box™The Sandwich Box consists of a square polystyrene box, a plastic support, and a siliconized 9 well glass plate. The Sandwich Box is used when a com-mon dehydrant system is desired as well as very large drops. Enormous drops can be pipetted into the siliconized glass wells. The siliconized glass plates offer excellent optics and can be removed from the plastic box to inspect the drop for birefringence without optical interference from plastic. Sandwich Boxes offer unique vapor equilibration kinetics and are very easy to access for crystal seeding, manipulation, and mounting. The plates are often used for heavy atom screening and derivatization and are useful for long-term crystal storage when each well is sealed with a glass slide and vacuum grease.
Open the Sandwich Box and place a plastic support, bottom side facing up into the box. Apply a bead of vacuum grease to the outer top edge of the box or the outer lower edge of the lid. Pour 25 ml of crystallization reagent or common dehydrant into the Sandwich Box. Place the siliconized 9 well glass plate on top of the inverted plastic support. Pipet the sample into one of the nine wells. Add the appropriate crystallization reagent to each drop. Place the cover on the Sandwich Box.
Sandwich Box Tips• Apply a thin bead of vacuum grease around a single depression of the glass plate and seal the depression with a plain glass cover slide for long term crystal storage.• Use a siliconized glass depression plate to test a small amount of sample for solubility with various crystallization reagents.• Use a Sandwich Box to screen heavy atoms and ligands with crystals.
96 Well PlatesThe 96 well sitting drop plates offer a variety of drop well configurations andflexibility in a standard microplate footprint. The 8 x 12 reagent wells in 9 mm offset can be filled with automated liquid handling systems or man-ual, single, and multichannel pipets with a typical reagent fill volume of up to 100 μl. The diversity of the various sample drop wells allow for automated and manual pipetting into a variety of well shapes, volumes and geometries. Materials range from optically clear polystyrene to low birefringent polymers that are compatible with UV imaging. The plates can be manually or auto-matically sealed with optically clear sealing tape or film.
Plates for Sitting Drop Vapor Diffusion9 wellHR3-136 Sandwich Box Setup Contains: 6 siliconized, 9 well glass plates, 6 plastic supports, 6 sandwich boxes with covers
24 wellHR3-160 Cryschem Plate - 100 plate case - (round reagent reservoir, large plate footprint) • Seal with HR3-511 Crystal Clear Sealing Tape (1.88 inch x 43.7 yard roll, with cutter) or HR4-511 Crystal Clear Sealing Tape (1.88 inch x 60 yard roll, without cutter)
HR1-002 Cryschem M Plate - 50 plate case - (round reagent reservoir, small SBS plate footprint) • Seal with HR3-609 Crystal Clear Sealing Film (100 pack), HR4-521 ClearSeal Film (100 pack) or HR4-506 Crystal Clear Sealing Tape (3 inch x 55 yard roll, without cutter). HR4-508 Crystal Clear Sealing Tape (0.75 inch x 650 inch, with cutter) seals a single row at a time.
HR3-308 Cryschem S Plate - 50 plate case - (square reagent reservoir, small SBS plate footprint) • Seal with HR3-609 Crystal Clear Sealing Film (100 pack), HR4-521 ClearSeal Film (100 pack) or HR4-506 Crystal Clear Sealing Tape (3 inch x 55 yard roll, without cutter). HR4-508 Crystal Clear Sealing Tape (0.75 inch x 650 inch, with cutter) seals a single row at a time.
Crystal Growth 101 page 2
Solutions for Crystal Growth
Sitting Drop VaporDiffusion Crystallization
17
HR3-170 VDX™ Plate with sealant - 100 plate case and HR3-312 Micro-Bridges 400 pack• Seal with HR3-233 22 mm x 0.22 mm Siliconized circle cover slides 10.0 ounce case (~1,200 slides)
HR3-114 Intelli-Plate 24-4 - 40 plate case• Seal with HR3-609 Crystal Clear Sealing Film (100 pack), HR4-506 Crys-tal Clear Sealing Tape (3 inch x 55 yard roll, without cutter) or HR4-521 ClearSeal Film™ (100 pack).
48 wellHR3-180 MRC Maxi 48-Well Crystallization Plate - 40 plate caseHR8-152 Intelli-Plate 48-2 - 40 plate caseHR8-156 Intelli-Plate 48-3 - 40 plate case• Seal 48 well plates with Seal with HR3-609 Crystal Clear Sealing Film (100 pack), HR4-506 Crystal Clear Sealing Tape (3 inch x 55 yard roll, without cutter) or HR4-521 ClearSeal Film™ (100 pack).
96 wellHR3-271 Corning 3773 - 40 plate case CrystalEX 96 Well, Conical BottomHR3-115 Corning 3785 - 40 plate case CrystalEX 96 Well, Flat BottomHR8-134 Corning 3556 - 40 plate case 4 µl round drop well, 1 drop well, COC, untreatedHR8-136 Corning 3551 - 40 plate case 4 µl conical flat drop well, 1 drop well, COC, treatedHR8-138 Corning 3552 - 40 plate case 2 µl round drop well, 3 drop well, COC, untreatedHR8-140 Corning 3553 - 40 plate case 2 µl conical flat drop well, 3 drop well, COC, untreatedHR8-146 Corning 3550 - 40 plate case 1 µl conical flat drop well, 3 drop well, COC, untreated HR8-158 Corning 3557 - 40 plate case 1 µl conical flat drop well, 5 drop well, PZero
HR3-190 CrystalQuick™ 96 Well, Greiner 609101 - 40 plate case 4 µl square drop well, 3 drop well - 40 plate caseHR3-095G CrystalQuick™ Plus 96 Well, Greiner 609830 - 40 plate case 4 µl square drop well, 3 drop well, LBR, hydrophobicHR8-149 CrystalQuick™ Plus 96 Well, Greiner 609130 - 40 plate case 4 ul square drop well, 3 drop well, hydrophobicHR3-089 CrystalQuick™ 96 Well, Greiner 609801 - 40 plate case 4 µl square drop well, 3 drop well, LBR, hydrophobicHR3-304 CrystalQuick™ 96 Well, Greiner 609171 - 80 plate case 4 µl square drop well, 1 drop well, low profile
HR3-093G CrystalQuick™ Plus 96 Well, Greiner 609180 - 80 plate case 4 µl square drop well, 1 drop well, hydrophobic, low profileHR3-285 CrystalQuick™ 96 Well, Greiner 609871 - 80 plate case 4 µl square drop well, 1 drop well, LBR, low profileHR3-281 CrystalQuick™ 96 Well, Greiner 609120 - 40 plate case 2 µl round drop well, 3 drop wellHR3-091 CrystalQuick™ 96 Well, Greiner 609820 - 40 plate case 2 µl round drop well, 3 drop well, LBR
HR3-117 Intelli-Plate 96-2 Low Profile - 80 plate caseHR3-119 CrystalMation Intelli-Plate 96-3 low-profile - 80 plate caseHR3-145 Intelli-Plate 96-2 LVR - 40 plate caseHR3-185 Intelli-Plate 96-3 LVR - 40 plate caseHR3-299 Intelli-Plate 96-2 Original - 40 plate caseHR8-172 Intelli-Plate Flat Shelf - 40 plate caseHR3-164 Intelli-Plate 96-2 Shallow Well - 40 plate caseHR3-182 Intelli-Plate 96-2 Shallow Well Low Profile - 80 plate case
HR3-083 Swissci MRC 2 Well Crystallization Plate - 40 plate caseHR3-107 Swissci MRC 2 Well Crystallization Plate in UVXPO - 40 plate caseHR3-206 Swissci 3 Well Low Profile Crystallization Plate - 40 plate caseHR3-125 Swissci 3 Well Midi Crystallization Plate (Swissci) - 40 plate case
• Seal 96 well plates with HR3-609 Crystal Clear Sealing Film (100 pack), HR4-506 Crystal Clear Sealing Tape (3 inch x 55 yard roll, without cutter) or HR4-521 ClearSeal Film™ (100 pack).
384 wellHR8-058 CrystalEX 384 Well,Flat Bottom,Corning 3775 - 40 plate case • Seal with HR3-609 Crystal Clear Sealing Film (100 pack), HR4-506 Crys-tal Clear Sealing Tape (3 inch x 55 yard roll, without cutter) or HR4-521 ClearSeal Film™ (100 pack).
Other Items for Sitting Drop Vapor DiffusionHR4-430 Sticky Pad - eachHR3-510 Dow Corning® Vacuum Grease, 150 gram tube - eachHR4-124 X-Acto® Gripster Knife - each
Crystal Growth 101 page 3
Solutions for Crystal Growth
Sitting Drop VaporDiffusion Crystallization
18
Hanging Drop VaporDiffusion Crystallization Crystal Growth 101 page 1
The hanging drop vapor diffusion technique is a popular method for the crystallization of macromolecules. The principle of vapor diffusion is straightforward. A drop composed of a mixture of sample and reagent is placed in vapor equilibration with a liquid reservoir of reagent. Typically the drop contains a lower reagent concentration than the reservoir. To achieve equilibrium, water vapor leaves the drop and eventually ends up in the res-ervoir. As water leaves the drop, the sample undergoes an increase in relative supersaturation. Both the sample and reagent increase in concentration as water leaves the drop for the reservoir. Equilibration is reached when the reagent concentration in the drop is approximately the same as that in the reservoir.
Benefits of Hanging Drop Crystallization• Can be cost effective.• Sample and reagents in contact with a siliconized glass surface.• Easy access to crystals.• Can perform multiple drops (experiments) with a single reservoir.
Using the VDX Plate for Hanging Drop Vapor DiffusionThe VDX Plate is a 24 well plate manufactured from clear polystyrene. The VDX Plate is typically sealed with High Vacuum Grease and Siliconized 22 mm Circle or Square Glass Cover Slides. Rows of the plate are labeled A-D and columns are labeled 1-6 on the VDX Plate.
Applying Sealant to a VDX Plate1. Apply a bead of High Vacuum Grease along the top edge of the raised reser-voir A1 of the VDX Plate. It is recommended that one apply the high vacuum grease prior to pipetting the reagent. Create a circular bead on the upper edge of the reservoir. Do not complete the circle. Leave a 2 mm opening between the start and finish of the circular bead. Leave a 2 mm opening be-tween the start and finish of the circular bead as this will allow air pressure to escape when sealing the reservoir with a cover slide. For convenience, time savings and a consistent seal, the VDX Plate is also available with sealant.
2. Pipet 1.0 milliliter of crystallization reagent into reservoir A1 of the VDX Plate. (Note: Recommended reservoir volume is 0.5 to 1.0 milliliters)
3. Clean a Siliconized 22 mm Circle or Square Cover Slide by wiping the cover slide with lens paper and blowing the cover slide with clean, dry com-
pressed air. Pipet 2 microliter of sample into the center of a Siliconized 22 mm Circle or Square Cover Slide. (Note: Recommended total drop volume is 2 to 20 microliters)
4. Pipet 2 microliter of reagent from reservoir A1 into the drop on the cover slide containing the sample. (Note: Some prefer to mix the drop while others do not. Proponents of mixing leave the pipet tip in the drop while gently as-pirating and dispensing the drop with the pipet. Mixing ensures a homoge-neous drop and consistency drop to drop. Proponents of not mixing the drop simply pipet the reagent into the sample with no further mixing. Not mixing allows for the sample and reagent to mix by liquid diffusion).
5. Holding the cover slide with forceps, the Pen-Vac, or on the edge between your thumb and forefinger, carefully yet without delay invert the cover slide so the drop is hanging from the cover slide.
6. Position the cover slide onto the bead of grease on reservoir A1. Gently press the slide down onto the grease and twist the slide 45º to ensure a com-plete seal.
7. Repeat for reservoirs 2 (A2) through 24 (D6).
Hanging Drop Tips• Note the VDX Plate has a raised cover to protect the cover slides during transport and storage.• To access a drop and/or reservoir simply grasp the edge of the cover slide with forceps or fingertips, twist and pull gently while holding the plate steady. The Thick (0.96 mm) cover slides resist heavy handling better than the regular (0.22) cover slides.• VDX Plates can be stacked for convenient storage.• One can pipet multiple drops onto the cover slide. This technique is often useful when screening additives since one can use the same reservoir with multiple drops with each drop containing a different additive. This tech-nique can also be used to screen different drop sizes and ratios versus the same reservoir. Use care not to avoid mixing the drops during pipetting, plate transport, and plate viewing.• Label plates with protein name, experiment, drop & reservoir volumes, and date.• Use the Glass Cover Slide Gizmo Dispenser for fast and easy handling of siliconized cover slides. Or try the Cover Slide Vacuum Gadget (HR8-098) or Pen-Vac (HR3-251) for holding and manipulating cover slides.
Solutions for Crystal Growth
Reservoir Solution
H2O
[ppt]drop = [ppt]reservoir
2
Figure 1Process of vapor diffusion
Figure 2
Siliconized Coverslip
Crystallization Droplet(2 ml Sample / 2 ml Reagent)
19
Plates for Hanging Drop Vapor Diffusion24 well, use 22 mm cover slideHR3-140 VDX™ Plate without sealant - 100 plate caseHR3-170 VDX™ Plate with sealant - 100 plate case
24 well, use 18 mm cover slideHR3-108 VDXm™ Plate without sealant - 50 plate caseHR3-306 VDXm™ Plate with sealant - 50 plate caseHR3-200 24 Well ComboPlate without sealant, Greiner 662150 - 24 plate case
48 well, use 12 mm cover slideHR3-275 VDX48 Plate with sealant - 50 plate case
96 wellHR3-197 96 Well Hanging Drop Vapor Diffusion Plate - 100 packHR3-187 Hanging Drop Crystallization Plate (Swissci) - 10 plate case
Siliconized Cover Slides for Hanging Drop Vapor DiffusionHR3-277 12 mm x 0.22 mm Siliconized circle cover slides 0.5 ounce pack (~240 slides)HR8-090 12mm x 0.96mm Thick Siliconized circle cover slides 10.0 ounce case (~1,060 slides)HR3-241 18 mm x 0.22 mm Siliconized circle cover slides 5.0 ounce case (~1,000 slides)HR3-517 18mm x 0.96mm Thick Siliconized circle cover slides 10 oz case (~450 slides)HR3-233 22 mm x 0.22 mm Siliconized circle cover slides 10.0 ounce case (~1,200 slides)HR3-249 22mm x 0.96mm Thick Siliconized circle cover slides 30.0 ounce case (~750 slides)HR3-217 22 mm x 0.22 mm Siliconized square cover slides 10.0 ounce case (~1,000 slides)HR3-225 22mm x 0.96mm Thick Siliconized square cover slides 40.0 ounce case (~750 slides)
Sealing GreaseHR3-510 Dow Corning® Vacuum Grease, 150 gram tube - eachHR3-508 Dow Corning® 7 Release Compound Grease, 150 gram tube - each
Other Items for Hanging Drop Vapor DiffusionHR4-430 Sticky Pad - each
Crystal Growth 101 page 2
Solutions for Crystal Growth
Hanging Drop VaporDiffusion Crystallization
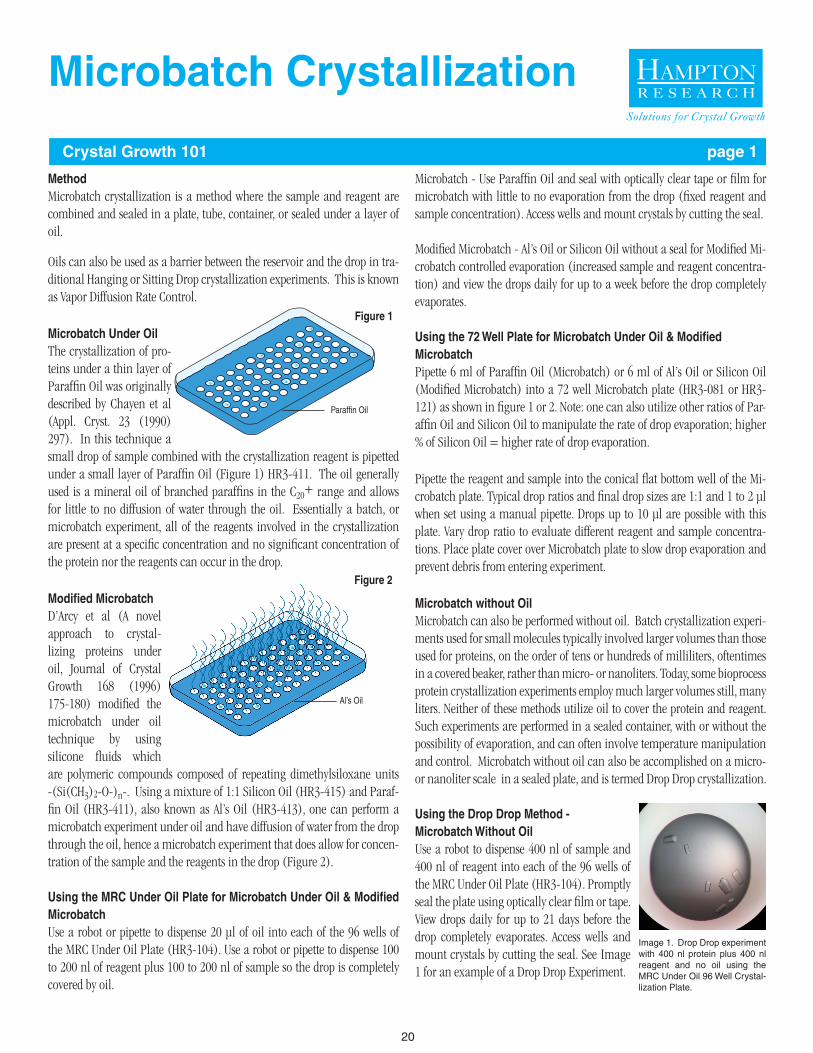
20
Crystal Growth 101 page 1
Microbatch Crystallization
MethodMicrobatch crystallization is a method where the sample and reagent are combined and sealed in a plate, tube, container, or sealed under a layer of oil.
Oils can also be used as a barrier between the reservoir and the drop in tra-ditional Hanging or Sitting Drop crystallization experiments. This is known as Vapor Diffusion Rate Control.
Microbatch Under OilThe crystallization of pro-teins under a thin layer of Paraffin Oil was originally described by Chayen et al (Appl. Cryst. 23 (1990) 297). In this technique a small drop of sample combined with the crystallization reagent is pipetted under a small layer of Paraffin Oil (Figure 1) HR3-411. The oil generally used is a mineral oil of branched paraffins in the C20+ range and allows for little to no diffusion of water through the oil. Essentially a batch, or microbatch experiment, all of the reagents involved in the crystallization are present at a specific concentration and no significant concentration of the protein nor the reagents can occur in the drop.
Modified MicrobatchD’Arcy et al (A novel approach to crystal-lizing proteins under oil, Journal of Crystal Growth 168 (1996) 175-180) modified the microbatch under oil technique by using silicone fluids which are polymeric compounds composed of repeating dimethylsiloxane units -(Si(CH3)2-O-)n-. Using a mixture of 1:1 Silicon Oil (HR3-415) and Paraf-fin Oil (HR3-411), also known as Al’s Oil (HR3-413), one can perform a microbatch experiment under oil and have diffusion of water from the drop through the oil, hence a microbatch experiment that does allow for concen-tration of the sample and the reagents in the drop (Figure 2).
Using the MRC Under Oil Plate for Microbatch Under Oil & Modified MicrobatchUse a robot or pipette to dispense 20 μl of oil into each of the 96 wells of the MRC Under Oil Plate (HR3-104). Use a robot or pipette to dispense 100 to 200 nl of reagent plus 100 to 200 nl of sample so the drop is completely covered by oil.
Microbatch - Use Paraffin Oil and seal with optically clear tape or film for microbatch with little to no evaporation from the drop (fixed reagent and sample concentration). Access wells and mount crystals by cutting the seal.
Modified Microbatch - Al’s Oil or Silicon Oil without a seal for Modified Mi-crobatch controlled evaporation (increased sample and reagent concentra-tion) and view the drops daily for up to a week before the drop completely evaporates.
Using the 72 Well Plate for Microbatch Under Oil & ModifiedMicrobatchPipette 6 ml of Paraffin Oil (Microbatch) or 6 ml of Al’s Oil or Silicon Oil (Modified Microbatch) into a 72 well Microbatch plate (HR3-081 or HR3-121) as shown in figure 1 or 2. Note: one can also utilize other ratios of Par-affin Oil and Silicon Oil to manipulate the rate of drop evaporation; higher % of Silicon Oil = higher rate of drop evaporation.
Pipette the reagent and sample into the conical flat bottom well of the Mi-crobatch plate. Typical drop ratios and final drop sizes are 1:1 and 1 to 2 μl when set using a manual pipette. Drops up to 10 μl are possible with this plate. Vary drop ratio to evaluate different reagent and sample concentra-tions. Place plate cover over Microbatch plate to slow drop evaporation and prevent debris from entering experiment.
Microbatch without OilMicrobatch can also be performed without oil. Batch crystallization experi-ments used for small molecules typically involved larger volumes than those used for proteins, on the order of tens or hundreds of milliliters, oftentimes in a covered beaker, rather than micro- or nanoliters. Today, some bioprocess protein crystallization experiments employ much larger volumes still, many liters. Neither of these methods utilize oil to cover the protein and reagent. Such experiments are performed in a sealed container, with or without the possibility of evaporation, and can often involve temperature manipulation and control. Microbatch without oil can also be accomplished on a micro- or nanoliter scale in a sealed plate, and is termed Drop Drop crystallization.
Using the Drop Drop Method - Microbatch Without OilUse a robot to dispense 400 nl of sample and 400 nl of reagent into each of the 96 wells of the MRC Under Oil Plate (HR3-104). Promptly seal the plate using optically clear film or tape. View drops daily for up to 21 days before the drop completely evaporates. Access wells and mount crystals by cutting the seal. See Image 1 for an example of a Drop Drop Experiment.
Figure 1
Paraffin Oil
Al’s Oil
Figure 2
Image 1. Drop Drop experiment with 400 nl protein plus 400 nl reagent and no oil using the MRC Under Oil 96 Well Crystal-lization Plate.
Solutions for Crystal Growth
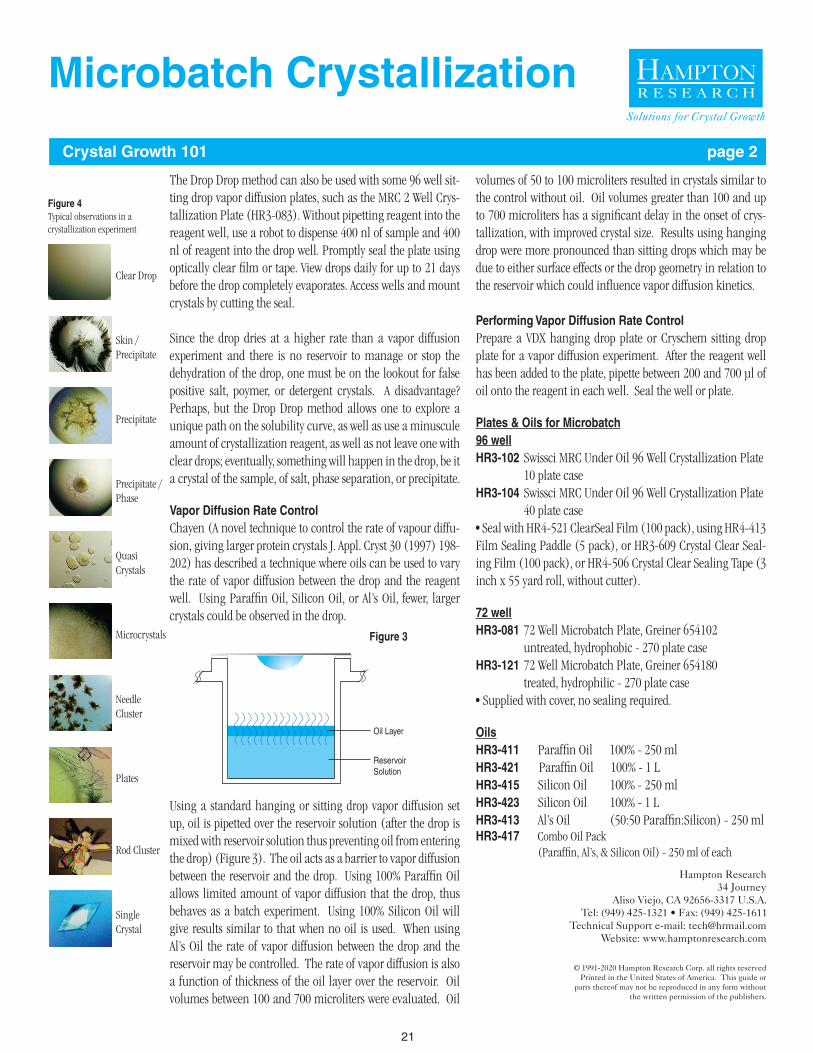
21
Crystal Growth 101 page 2
Solutions for Crystal Growth
The Drop Drop method can also be used with some 96 well sit-ting drop vapor diffusion plates, such as the MRC 2 Well Crys-tallization Plate (HR3-083). Without pipetting reagent into the reagent well, use a robot to dispense 400 nl of sample and 400 nl of reagent into the drop well. Promptly seal the plate using optically clear film or tape. View drops daily for up to 21 days before the drop completely evaporates. Access wells and mount crystals by cutting the seal.
Since the drop dries at a higher rate than a vapor diffusion experiment and there is no reservoir to manage or stop the dehydration of the drop, one must be on the lookout for false positive salt, poymer, or detergent crystals. A disadvantage? Perhaps, but the Drop Drop method allows one to explore a unique path on the solubility curve, as well as use a minuscule amount of crystallization reagent, as well as not leave one with clear drops; eventually, something will happen in the drop, be it a crystal of the sample, of salt, phase separation, or precipitate.
Vapor Diffusion Rate ControlChayen (A novel technique to control the rate of vapour diffu-sion, giving larger protein crystals J. Appl. Cryst 30 (1997) 198-202) has described a technique where oils can be used to vary the rate of vapor diffusion between the drop and the reagent well. Using Paraffin Oil, Silicon Oil, or Al’s Oil, fewer, larger crystals could be observed in the drop.
Using a standard hanging or sitting drop vapor diffusion set up, oil is pipetted over the reservoir solution (after the drop is mixed with reservoir solution thus preventing oil from entering the drop) (Figure 3). The oil acts as a barrier to vapor diffusion between the reservoir and the drop. Using 100% Paraffin Oil allows limited amount of vapor diffusion that the drop, thus behaves as a batch experiment. Using 100% Silicon Oil will give results similar to that when no oil is used. When using Al’s Oil the rate of vapor diffusion between the drop and the reservoir may be controlled. The rate of vapor diffusion is also a function of thickness of the oil layer over the reservoir. Oil volumes between 100 and 700 microliters were evaluated. Oil
volumes of 50 to 100 microliters resulted in crystals similar to the control without oil. Oil volumes greater than 100 and up to 700 microliters has a significant delay in the onset of crys-tallization, with improved crystal size. Results using hanging drop were more pronounced than sitting drops which may be due to either surface effects or the drop geometry in relation to the reservoir which could influence vapor diffusion kinetics.
Performing Vapor Diffusion Rate ControlPrepare a VDX hanging drop plate or Cryschem sitting drop plate for a vapor diffusion experiment. After the reagent well has been added to the plate, pipette between 200 and 700 µl of oil onto the reagent in each well. Seal the well or plate.
Plates & Oils for Microbatch96 wellHR3-102 Swissci MRC Under Oil 96 Well Crystallization Plate 10 plate caseHR3-104 Swissci MRC Under Oil 96 Well Crystallization Plate 40 plate case• Seal with HR4-521 ClearSeal Film (100 pack), using HR4-413 Film Sealing Paddle (5 pack), or HR3-609 Crystal Clear Seal-ing Film (100 pack), or HR4-506 Crystal Clear Sealing Tape (3 inch x 55 yard roll, without cutter).
72 wellHR3-081 72 Well Microbatch Plate, Greiner 654102 untreated, hydrophobic - 270 plate caseHR3-121 72 Well Microbatch Plate, Greiner 654180 treated, hydrophilic - 270 plate case• Supplied with cover, no sealing required.
OilsHR3-411 Paraffin Oil 100% - 250 mlHR3-421 Paraffin Oil 100% - 1 LHR3-415 Silicon Oil 100% - 250 mlHR3-423 Silicon Oil 100% - 1 LHR3-413 Al’s Oil (50:50 Paraffin:Silicon) - 250 mlHR3-417 Combo Oil Pack (Paraffin, Al’s, & Silicon Oil) - 250 ml of each
Figure 4Typical observations in a crystallization experiment
Clear Drop
Skin /Precipitate
Precipitate
Precipitate /Phase
Quasi Crystals
Microcrystals
Needle Cluster
Plates
Rod Cluster
Single Crystal
Microbatch Crystallization
Oil Layer
ReservoirSolution
Figure 3
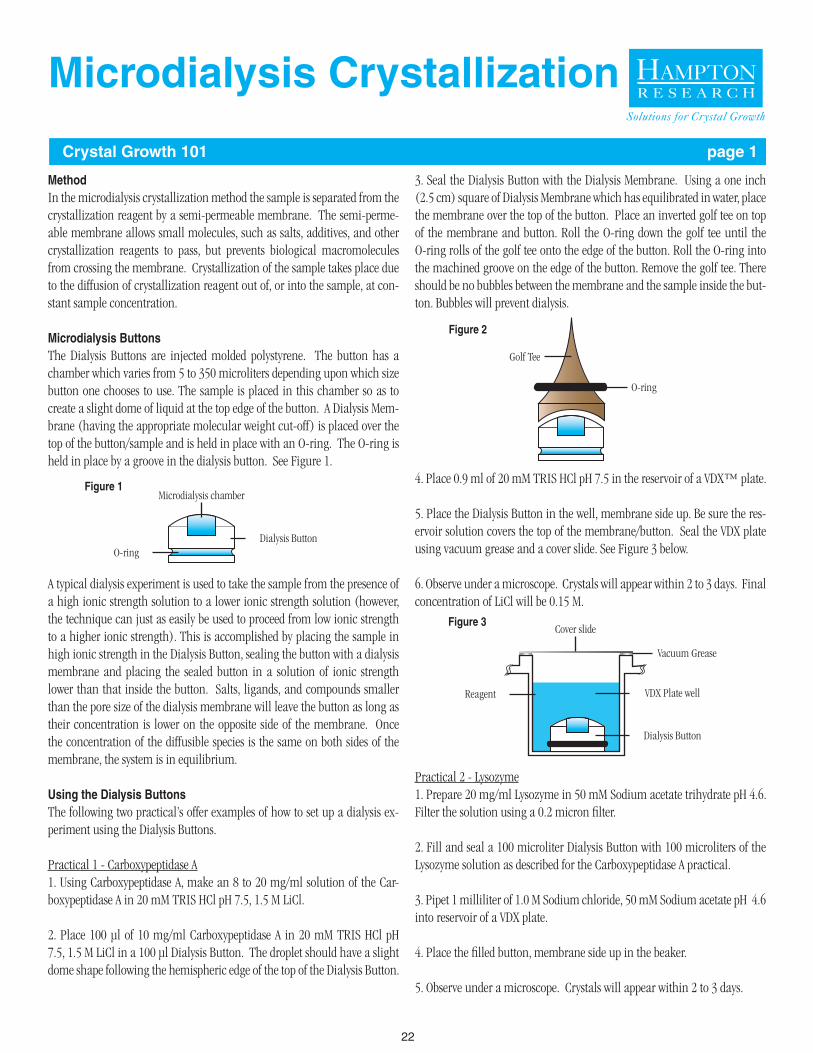
22
Crystal Growth 101 page 1
MethodIn the microdialysis crystallization method the sample is separated from the crystallization reagent by a semi-permeable membrane. The semi-perme-able membrane allows small molecules, such as salts, additives, and other crystallization reagents to pass, but prevents biological macromolecules from crossing the membrane. Crystallization of the sample takes place due to the diffusion of crystallization reagent out of, or into the sample, at con-stant sample concentration.
Microdialysis ButtonsThe Dialysis Buttons are injected molded polystyrene. The button has a chamber which varies from 5 to 350 microliters depending upon which size button one chooses to use. The sample is placed in this chamber so as to create a slight dome of liquid at the top edge of the button. A Dialysis Mem-brane (having the appropriate molecular weight cut-off) is placed over the top of the button/sample and is held in place with an O-ring. The O-ring is held in place by a groove in the dialysis button. See Figure 1.
A typical dialysis experiment is used to take the sample from the presence of a high ionic strength solution to a lower ionic strength solution (however, the technique can just as easily be used to proceed from low ionic strength to a higher ionic strength). This is accomplished by placing the sample in high ionic strength in the Dialysis Button, sealing the button with a dialysis membrane and placing the sealed button in a solution of ionic strength lower than that inside the button. Salts, ligands, and compounds smaller than the pore size of the dialysis membrane will leave the button as long as their concentration is lower on the opposite side of the membrane. Once the concentration of the diffusible species is the same on both sides of the membrane, the system is in equilibrium.
Using the Dialysis ButtonsThe following two practical’s offer examples of how to set up a dialysis ex-periment using the Dialysis Buttons.
Practical 1 - Carboxypeptidase A1. Using Carboxypeptidase A, make an 8 to 20 mg/ml solution of the Car-boxypeptidase A in 20 mM TRIS HCl pH 7.5, 1.5 M LiCl.
2. Place 100 μl of 10 mg/ml Carboxypeptidase A in 20 mM TRIS HCl pH 7.5, 1.5 M LiCl in a 100 μl Dialysis Button. The droplet should have a slight dome shape following the hemispheric edge of the top of the Dialysis Button.
3. Seal the Dialysis Button with the Dialysis Membrane. Using a one inch (2.5 cm) square of Dialysis Membrane which has equilibrated in water, place the membrane over the top of the button. Place an inverted golf tee on top of the membrane and button. Roll the O-ring down the golf tee until the O-ring rolls of the golf tee onto the edge of the button. Roll the O-ring into the machined groove on the edge of the button. Remove the golf tee. There should be no bubbles between the membrane and the sample inside the but-ton. Bubbles will prevent dialysis.
4. Place 0.9 ml of 20 mM TRIS HCl pH 7.5 in the reservoir of a VDX™ plate.
5. Place the Dialysis Button in the well, membrane side up. Be sure the res-ervoir solution covers the top of the membrane/button. Seal the VDX plate using vacuum grease and a cover slide. See Figure 3 below.
6. Observe under a microscope. Crystals will appear within 2 to 3 days. Final concentration of LiCl will be 0.15 M.
Practical 2 - Lysozyme1. Prepare 20 mg/ml Lysozyme in 50 mM Sodium acetate trihydrate pH 4.6. Filter the solution using a 0.2 micron filter.
2. Fill and seal a 100 microliter Dialysis Button with 100 microliters of the Lysozyme solution as described for the Carboxypeptidase A practical.
3. Pipet 1 milliliter of 1.0 M Sodium chloride, 50 mM Sodium acetate pH 4.6 into reservoir of a VDX plate.
4. Place the filled button, membrane side up in the beaker.
5. Observe under a microscope. Crystals will appear within 2 to 3 days.
Solutions for Crystal Growth
Microdialysis Crystallization
Figure 1Microdialysis chamber
Dialysis ButtonO-ring
Figure 2
Golf Tee
O-ring
Figure 3Cover slide
Dialysis Button
Reagent VDX Plate well
Vacuum Grease
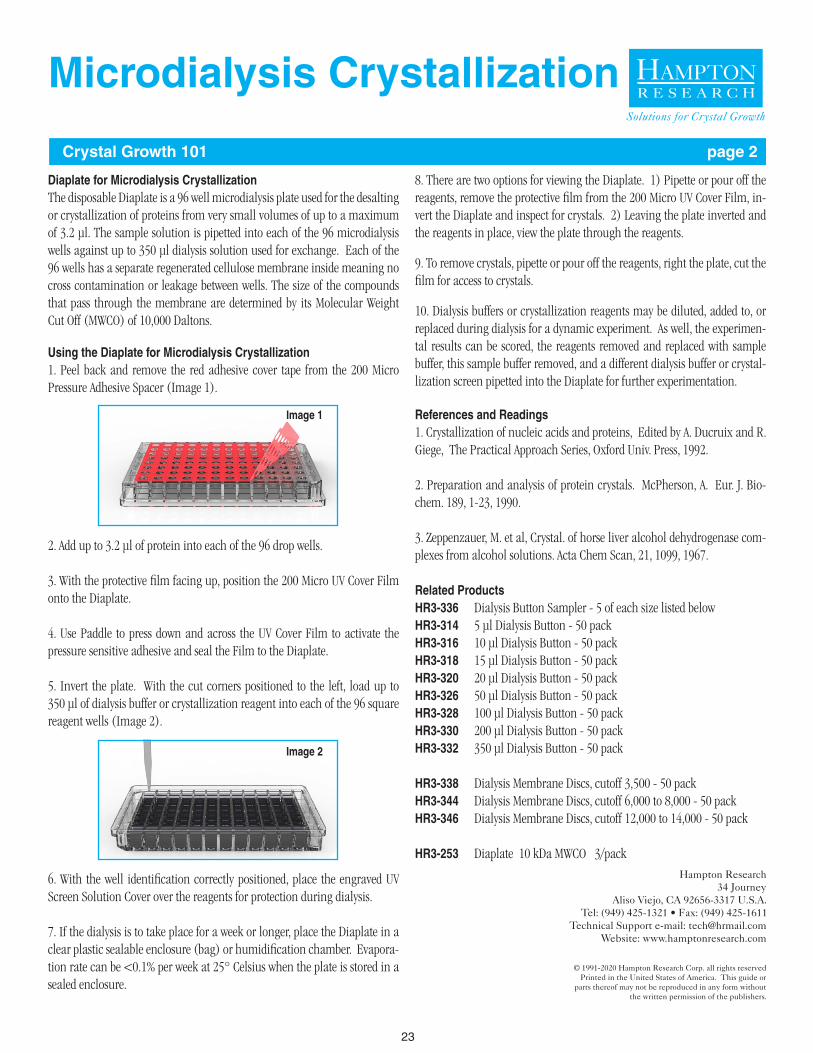
23
Diaplate for Microdialysis CrystallizationThe disposable Diaplate is a 96 well microdialysis plate used for the desalting or crystallization of proteins from very small volumes of up to a maximum of 3.2 µl. The sample solution is pipetted into each of the 96 microdialysis wells against up to 350 µl dialysis solution used for exchange. Each of the 96 wells has a separate regenerated cellulose membrane inside meaning no cross contamination or leakage between wells. The size of the compounds that pass through the membrane are determined by its Molecular Weight Cut Off (MWCO) of 10,000 Daltons.
Using the Diaplate for Microdialysis Crystallization1. Peel back and remove the red adhesive cover tape from the 200 Micro Pressure Adhesive Spacer (Image 1).
2. Add up to 3.2 μl of protein into each of the 96 drop wells.
3. With the protective film facing up, position the 200 Micro UV Cover Film onto the Diaplate.
4. Use Paddle to press down and across the UV Cover Film to activate the pressure sensitive adhesive and seal the Film to the Diaplate.
5. Invert the plate. With the cut corners positioned to the left, load up to 350 μl of dialysis buffer or crystallization reagent into each of the 96 square reagent wells (Image 2).
6. With the well identification correctly positioned, place the engraved UV Screen Solution Cover over the reagents for protection during dialysis.
7. If the dialysis is to take place for a week or longer, place the Diaplate in a clear plastic sealable enclosure (bag) or humidification chamber. Evapora-tion rate can be <0.1% per week at 25° Celsius when the plate is stored in a sealed enclosure.
8. There are two options for viewing the Diaplate. 1) Pipette or pour off the reagents, remove the protective film from the 200 Micro UV Cover Film, in-vert the Diaplate and inspect for crystals. 2) Leaving the plate inverted and the reagents in place, view the plate through the reagents.
9. To remove crystals, pipette or pour off the reagents, right the plate, cut the film for access to crystals.
10. Dialysis buffers or crystallization reagents may be diluted, added to, or replaced during dialysis for a dynamic experiment. As well, the experimen-tal results can be scored, the reagents removed and replaced with sample buffer, this sample buffer removed, and a different dialysis buffer or crystal-lization screen pipetted into the Diaplate for further experimentation.
References and Readings1. Crystallization of nucleic acids and proteins, Edited by A. Ducruix and R. Giege, The Practical Approach Series, Oxford Univ. Press, 1992.
2. Preparation and analysis of protein crystals. McPherson, A. Eur. J. Bio-chem. 189, 1-23, 1990.
3. Zeppenzauer, M. et al, Crystal. of horse liver alcohol dehydrogenase com-plexes from alcohol solutions. Acta Chem Scan, 21, 1099, 1967.
Related ProductsHR3-336 Dialysis Button Sampler - 5 of each size listed belowHR3-314 5 μl Dialysis Button - 50 packHR3-316 10 μl Dialysis Button - 50 packHR3-318 15 μl Dialysis Button - 50 packHR3-320 20 μl Dialysis Button - 50 packHR3-326 50 μl Dialysis Button - 50 packHR3-328 100 μl Dialysis Button - 50 packHR3-330 200 μl Dialysis Button - 50 packHR3-332 350 μl Dialysis Button - 50 pack
HR3-338 Dialysis Membrane Discs, cutoff 3,500 - 50 packHR3-344 Dialysis Membrane Discs, cutoff 6,000 to 8,000 - 50 packHR3-346 Dialysis Membrane Discs, cutoff 12,000 to 14,000 - 50 pack
HR3-253 Diaplate 10 kDa MWCO 3/pack
Crystal Growth 101 page 2
Solutions for Crystal Growth
Image 1
Image 2
Microdialysis Crystallization
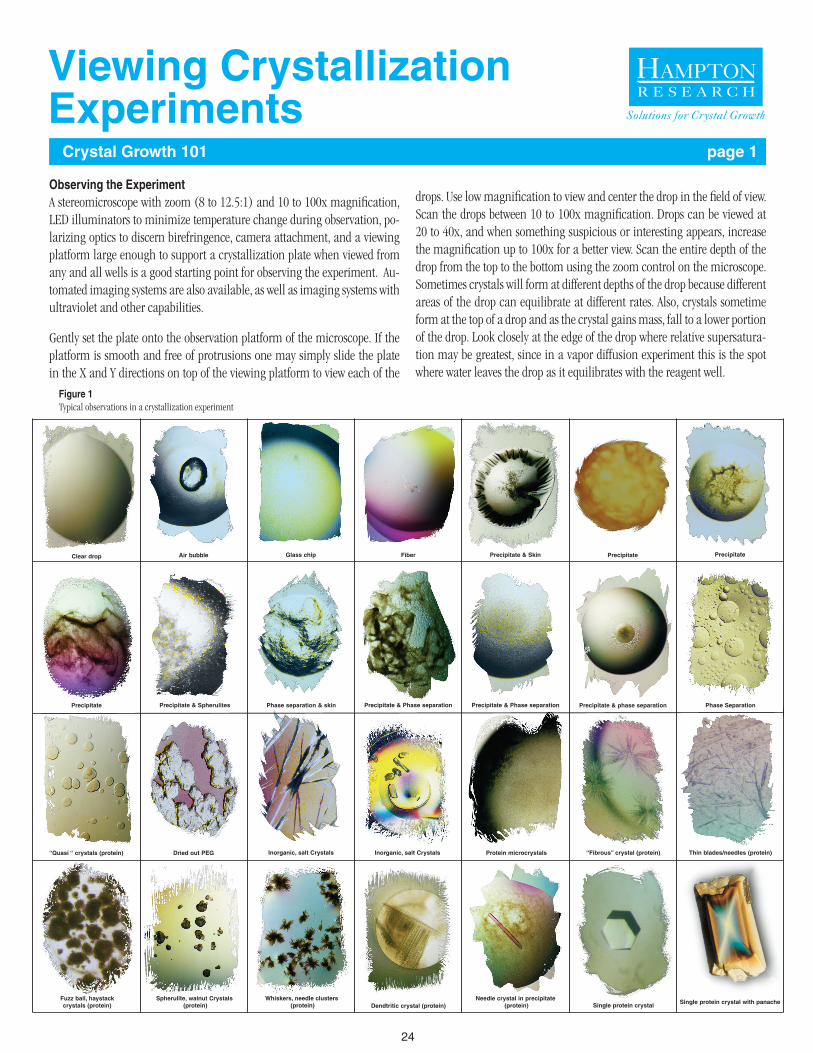
24
Crystal Growth 101 page 1
Solutions for Crystal Growth
Observing the ExperimentA stereomicroscope with zoom (8 to 12.5:1) and 10 to 100x magnification, LED illuminators to minimize temperature change during observation, po-larizing optics to discern birefringence, camera attachment, and a viewing platform large enough to support a crystallization plate when viewed from any and all wells is a good starting point for observing the experiment. Au-tomated imaging systems are also available, as well as imaging systems with ultraviolet and other capabilities.
Gently set the plate onto the observation platform of the microscope. If the platform is smooth and free of protrusions one may simply slide the plate in the X and Y directions on top of the viewing platform to view each of the
drops. Use low magnification to view and center the drop in the field of view. Scan the drops between 10 to 100x magnification. Drops can be viewed at 20 to 40x, and when something suspicious or interesting appears, increase the magnification up to 100x for a better view. Scan the entire depth of the drop from the top to the bottom using the zoom control on the microscope. Sometimes crystals will form at different depths of the drop because different areas of the drop can equilibrate at different rates. Also, crystals sometime form at the top of a drop and as the crystal gains mass, fall to a lower portion of the drop. Look closely at the edge of the drop where relative supersatura-tion may be greatest, since in a vapor diffusion experiment this is the spot where water leaves the drop as it equilibrates with the reagent well.
Figure 1Typical observations in a crystallization experiment
Clear drop Air bubble Glass chip Fiber Precipitate & Skin Precipitate Precipitate
Single protein crystal with panacheSingle protein crystalNeedle crystal in precipitate
(protein)Dendtritic crystal (protein)Whiskers, needle clusters
(protein)Spherulite, walnut Crystals
(protein)Fuzz ball, haystack crystals (protein)
Thin blades/needles (protein)“Fibrous” crystal (protein) Protein microcrystals“Quasi “ crystals (protein) Inorganic, salt CrystalsInorganic, salt CrystalsDried out PEG
Precipitate & phase separationPrecipitate & Spherulites Phase separation & skin Precipitate & Phase separation Phase SeparationPrecipitate & Phase separationPrecipitate
Viewing CrystallizationExperiments
25
Crystal Growth 101 page 2
Solutions for Crystal Growth
Scrutinize and document everything in the experiment, from clear drops to drops with amorphous material, various forms of precipitate, phase separation, and crys-tals. One is not only looking for crystals, but also different forms of changes in solubility over time, such as clear drops, phase separation or precipitation, since this information can be useful for further screening or optimization.
Be careful to not view the experiment in a single location for too long, or leave the plate unattended on the microscope with the light source on as this can elevate the temperature of the experiment, damaging or dissolving the crystal, or creating condensation on the seal, making viewing difficult.
When to Observe & ScoreObserve and score the results immediately after setting the experiment, then each and every day thereafter for the first week, then once a week for 3 more weeks, and then once a month thereafter until the drops are no longer viable and either contain reagent crystals or have dried into a crust. “If no crystals form, dump the samples in the sink and curse the darkness”. Alexander McPherson, 1982.
Typical Visible Results Clear Drops are free of crystals, precipitate, phase separation, or other insoluble outcome. Clear drops indicate the relative supersaturation (protein and reagent concentration) did not reach the point of saturation that would nucleate and grow crystals.
Amorphous Material includes fibers, glass, dust, and debris that was present in the plate, sample, or reagent when the experiment was set and sealed. This should be observed and noted immediately after setting the experiment in order to assist differentiating this outcome from precipitate or microcrystals.
Precipitate appears in many forms and shades of color, but is always without an edge. Yellow or brown precipitate that is often heavy, often clumped is an indication of denatured protein which will not crystallize. White precipitate, which is often amorphous, wispy and cloud like, and more often light than heavy, can indicate a precipitated but not denatured or unfolded protein, which still has the possibility of crystallization.
Skin on the drop can be an indication of oxidized or denatured protein formed at the air/oil/drop interface and crystals often times do not appear in such drops. If desired, the skin can be removed with a probe and the experiment continued.
Phase Separation appears as few large or many small droplets. When this phase separation is protein based, crystals can sometimes form afterwards within, or at the edge of the drops. The droplets are often considered a protein rich phase that separates from the original drop solution. Sometimes the phase separation is not protein based, and can be a polymer, polyol, or non-volatile organic that is not soluble in the presence of the reagent’s salt concentration. The presence or dis-appearance of the phase separation can be temperature dependent. Some phase separation appears or disappears below room temperature and sometimes above room temperature, so one can move the experiment to a different temperature to manipulate the presence of protein and reagent based phase separation.
Crystals can appear as microcrystals or microcrystalline precipitate, as near one dimensional needles, as two dimensional plate, or as three dimensional objects or clusters or needles or plates. Crystals will feature edges. Precipitate does not have edges. Crystals can appear as needles, blades, walnuts, spherulites, plates, and vari-ous geometric shapes. Crystals vary in size anywhere from a barely observable 5 microns to 1 millimeter or more. Larger drops can produce larger crystals than smaller drops.
Differentiating Microcrystals from PrecipitateCrystals smaller than 20 microns (microcrystals) can be difficult to differentiate from precipitate, especially under low power or with a low to medium quality micro-scope. Differentiate microcrystals from amorphous precipitate by looking for bire-fringence using polarizing optics. Birefringence appears as light colored shiny spots under a polarizer in dark field mode (crossed polarizers) and this birefringence is an indication of crystalline material.
Streak seeding from the drop into a new drop can be used to differentiate crystals from precipitate. Seeding can produce crystals from microcrystals, but not from true precipitate.
Introducing a small volume or colored dye to the drop can color protein crystals, where the precipitate will not take up the color of the dye.
Differentiating Salt from Protein CrystalsSee “Crystal Growth 101 Salt or Protein Crystals?”.
Viewing Experiments Below Room TemperatureTo avoid temperature fluctuation while viewing the experiment, it is best to view the experiments at the same temperature as incubation. This is not always pos-sible or practical. 4°C experiments may be observed in a cold room by moving the microscope into the cold room. Allow time for the microscope to equilibrate to 4°C to prevent fogging of the optics as well as unnecessary temperature transfer from the warm microscope to the cold experiment. Wear a warm jacket with gloves to stay as comfortable as possible in the cold room. Excessive moisture in a cold room can be destructive to a microscope so check with your maintenance group to keep the cold room as dry as possible and keep a keen eye on the microscope. If a cold room is unavailable and one is forced to work promptly at room temperature, so bet it. Move plates from an incubator one plate at a time to the microscope, carefully, without door slamming and plate juggling and dropping and make rapid yet thor-ough observations and notes. Experiments incubated in the cold or warm tend to fog up rapidly during room temperature observation. This is difficult to avoid and is one reason one prefers working in cold rooms or using a combination imaging and incubator system. The experiment seal can be removed for viewing, and replaced with a new seal for sitting drop experiments, but this will allow evaporation from the drops, and be more significant in smaller than larger drops, and introduce a variable into the experiment.
Viewing CrystallizationExperiments
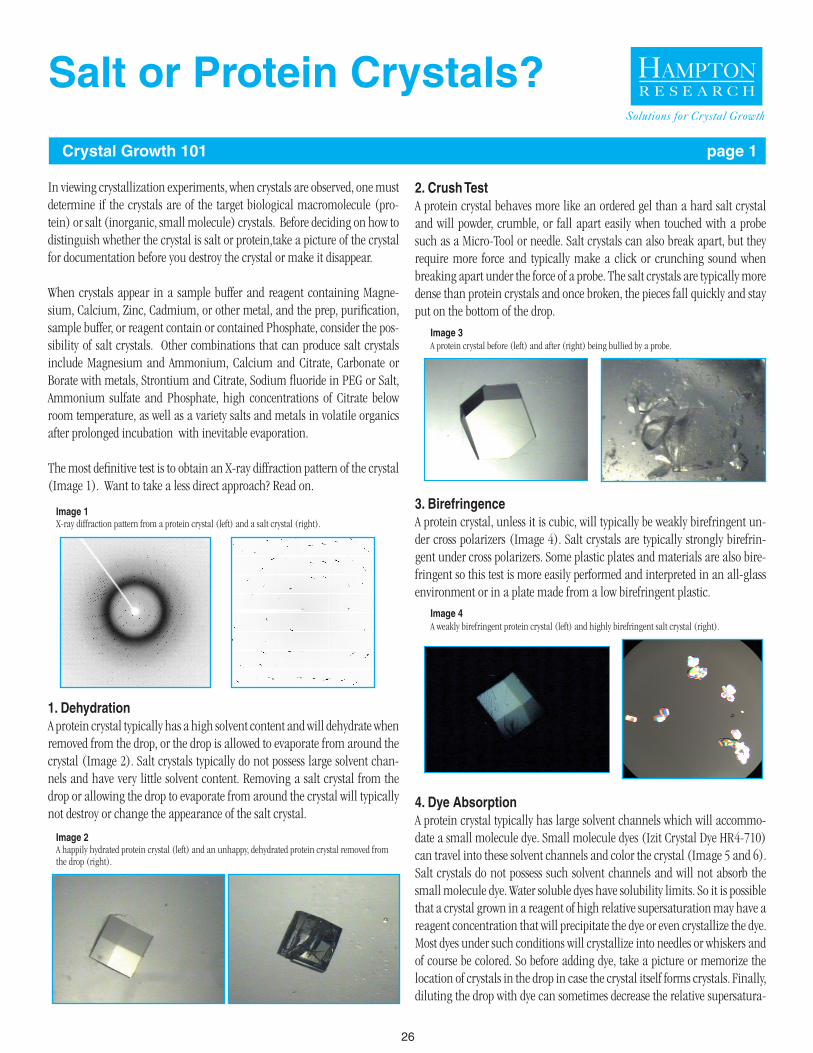
26
Salt or Protein Crystals?
Crystal Growth 101 page 1
In viewing crystallization experiments, when crystals are observed, one must determine if the crystals are of the target biological macromolecule (pro-tein) or salt (inorganic, small molecule) crystals. Before deciding on how to distinguish whether the crystal is salt or protein,take a picture of the crystal for documentation before you destroy the crystal or make it disappear.
When crystals appear in a sample buffer and reagent containing Magne-sium, Calcium, Zinc, Cadmium, or other metal, and the prep, purification, sample buffer, or reagent contain or contained Phosphate, consider the pos-sibility of salt crystals. Other combinations that can produce salt crystals include Magnesium and Ammonium, Calcium and Citrate, Carbonate or Borate with metals, Strontium and Citrate, Sodium fluoride in PEG or Salt, Ammonium sulfate and Phosphate, high concentrations of Citrate below room temperature, as well as a variety salts and metals in volatile organics after prolonged incubation with inevitable evaporation.
The most definitive test is to obtain an X-ray diffraction pattern of the crystal (Image 1). Want to take a less direct approach? Read on.
1. DehydrationA protein crystal typically has a high solvent content and will dehydrate when removed from the drop, or the drop is allowed to evaporate from around the crystal (Image 2). Salt crystals typically do not possess large solvent chan-nels and have very little solvent content. Removing a salt crystal from the drop or allowing the drop to evaporate from around the crystal will typically not destroy or change the appearance of the salt crystal.
2. Crush TestA protein crystal behaves more like an ordered gel than a hard salt crystal and will powder, crumble, or fall apart easily when touched with a probe such as a Micro-Tool or needle. Salt crystals can also break apart, but they require more force and typically make a click or crunching sound when breaking apart under the force of a probe. The salt crystals are typically more dense than protein crystals and once broken, the pieces fall quickly and stay put on the bottom of the drop.
3. BirefringenceA protein crystal, unless it is cubic, will typically be weakly birefringent un-der cross polarizers (Image 4). Salt crystals are typically strongly birefrin-gent under cross polarizers. Some plastic plates and materials are also bire-fringent so this test is more easily performed and interpreted in an all-glass environment or in a plate made from a low birefringent plastic.
4. Dye AbsorptionA protein crystal typically has large solvent channels which will accommo-date a small molecule dye. Small molecule dyes (Izit Crystal Dye HR4-710) can travel into these solvent channels and color the crystal (Image 5 and 6). Salt crystals do not possess such solvent channels and will not absorb the small molecule dye. Water soluble dyes have solubility limits. So it is possible that a crystal grown in a reagent of high relative supersaturation may have a reagent concentration that will precipitate the dye or even crystallize the dye. Most dyes under such conditions will crystallize into needles or whiskers and of course be colored. So before adding dye, take a picture or memorize the location of crystals in the drop in case the crystal itself forms crystals. Finally, diluting the drop with dye can sometimes decrease the relative supersatura-
Solutions for Crystal Growth
Image 1X-ray diffraction pattern from a protein crystal (left) and a salt crystal (right).
Image 2A happily hydrated protein crystal (left) and an unhappy, dehy drated protein crystal removed from the drop (right).
Image 3A protein crystal before (left) and after (right) being bullied by a probe.
Image 4A weakly birefringent protein crystal (left) and highly birefringent salt crystal (right).
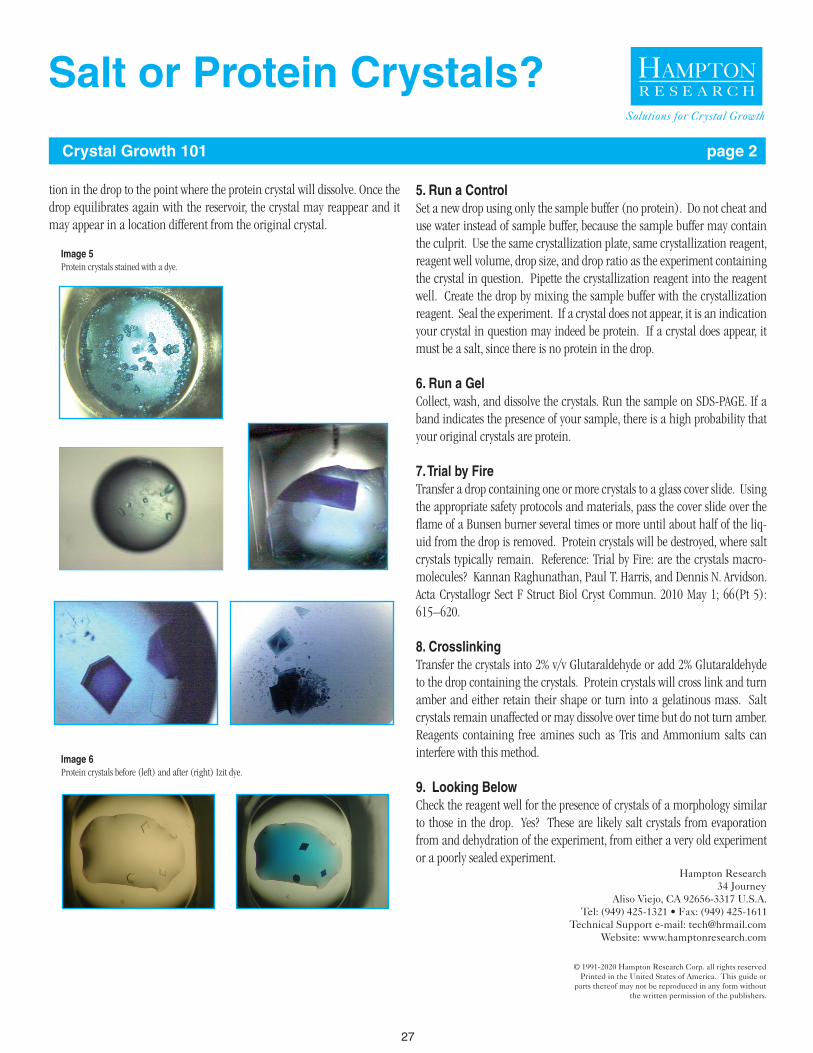
27
tion in the drop to the point where the protein crystal will dissolve. Once the drop equilibrates again with the reservoir, the crystal may reappear and it may appear in a location different from the original crystal.
5. Run a ControlSet a new drop using only the sample buffer (no protein). Do not cheat and use water instead of sample buffer, because the sample buffer may contain the culprit. Use the same crystallization plate, same crystallization reagent, reagent well volume, drop size, and drop ratio as the experiment containing the crystal in question. Pipette the crystallization reagent into the reagent well. Create the drop by mixing the sample buffer with the crystallization reagent. Seal the experiment. If a crystal does not appear, it is an indication your crystal in question may indeed be protein. If a crystal does appear, it must be a salt, since there is no protein in the drop.
6. Run a GelCollect, wash, and dissolve the crystals. Run the sample on SDS-PAGE. If a band indicates the presence of your sample, there is a high probability that your original crystals are protein.
7. Trial by FireTransfer a drop containing one or more crystals to a glass cover slide. Using the appropriate safety protocols and materials, pass the cover slide over the flame of a Bunsen burner several times or more until about half of the liq-uid from the drop is removed. Protein crystals will be destroyed, where salt crystals typically remain. Reference: Trial by Fire: are the crystals macro-molecules? Kannan Raghunathan, Paul T. Harris, and Dennis N. Arvidson. Acta Crystallogr Sect F Struct Biol Cryst Commun. 2010 May 1; 66(Pt 5): 615–620.
8. CrosslinkingTransfer the crystals into 2% v/v Glutaraldehyde or add 2% Glutaraldehyde to the drop containing the crystals. Protein crystals will cross link and turn amber and either retain their shape or turn into a gelatinous mass. Salt crystals remain unaffected or may dissolve over time but do not turn amber. Reagents containing free amines such as Tris and Ammonium salts can interfere with this method.
9. Looking BelowCheck the reagent well for the presence of crystals of a morphology similar to those in the drop. Yes? These are likely salt crystals from evaporation from and dehydration of the experiment, from either a very old experiment or a poorly sealed experiment.
Crystal Growth 101 page 2
Solutions for Crystal Growth
Image 5Protein crystals stained with a dye.
Image 6Protein crystals before (left) and after (right) Izit dye.
Salt or Protein Crystals?
28
Crystal Growth 101 page 1
PrologueThere is only one rule in the crystallization. And that rule is, there are no rules. Bob Cudney
IntroductionOptimization is the manipulation and evaluation of biochemical, chemi-cal, and physical crystallization variables, towards producing a crystal, or crystals with the specific desired characteristics.1
Once the appropriately prepared biological macromolecular sample (pro-tein, sample, macromolecule) is in hand, the search for conditions that will produce crystals of the protein generally begins with a screen. Once crystals are obtained, the initial crystals frequently possess something less than the desired optimal characteristics. The crystals may be too small or too large, have unsuitable morphology, yield poor X-ray diffraction intensities, or pos-sess non ideal formulation or therapeutic delivery properties. It is therefore generally necessary to improve upon these initial crystallization conditions in order to obtain crystals of sufficient quality for X-ray data collection, biological formulation and delivery, or meet whatever unique application is demanded of the crystals. Even when the initial samples are suitable, often marginally, refinement of conditions is recommended in order to obtain the highest quality crystals that can be grown. The quality and ease of an X-ray structure determination is directly correlated with the size and the perfection of the crystalline samples. The quality, efficacy, and stability of a crystal-line biological formulation can be directly correlated with the characteristics and quality of the crystals. Thus, refinement of conditions should always be a primary component of the crystal growth process. The improvement process is referred to as optimization, and it entails sequential, incremental changes in the chemical parameters that influence crystallization, such as pH, ionic strength and reagent concentration, as well as physical parameters such as temperature, sample volume and overall methodology. Optimiza-tion can also entail the application of novel procedures and approaches that may enhance nucleation or crystal development. Here, an attempt is made to provide guidance on how optimization might best be applied to crystal growth problems, and what parameters and factors might most profitably be explored to accelerate and achieve success (Table 1).
StrategyThe fundamental strategy in optimization focuses on the incremental ad-justment of crystallization parameters that, hopefully, converges on the best nucleation and growth conditions. But how does one choose which variable or set of variables to first evaluate? And how best does one prioritize the order in which to evaluate the variables? And once the primary variables have been evaluated, what other methods, strategies, techniques, and new variables should be considered and evaluated, and in what priority? The variables are numerous, diverse and often interdependent. Thus, multiple approaches and procedures can be applied to each of them, in parallel if possible. Some parameters may be addressed in a straightforward and sys-tematic way, such as buffer pH or precipitant concentration. Others, such as additives or detergents may require a significant amount of trial and error, as well as a significant application of creativity and biochemical insight. Feeling overwhelmed before we’ve even picked up a pipette? Balderdash! There is nothing to fear but fear itself, and the reward is in the journey.
Solutions for Crystal Growth
Optimization
Table 1Optimization Variable & Methods
Successive Grid Search Strategy – pH & Precipitant Concentration Reductive Alkylation
Design of Experiment (DOE) Chemical Modification
pH & Buffer Complex Formation
Precipitant Concentration Deglycosylation
Precipitant Type Point Mutants
Protein Concentration Truncations, Deletions, & Fusion Proteins
Converting Hits in nl Drops to µl Drops Surface Entropy Reduction
Drop Volume & Drop Ratio Gel Growth
Seeding Surfaces & Nucleating Agents
Additives Tag On or Tag Off
Crystallization Method Fresh Sample
Sample Buffer Fresh PEG, Old PEG
Further Purification & Batch Variation Change the Kinetics
Temperature Pressure
To Centrifuge, Filter, or Not? Magnetic & Electric Field
Additional Screening – When to Stop & Try Something Else Microgravity
Modification of the Protein Vibration
Proteolysis Data & Literature Review
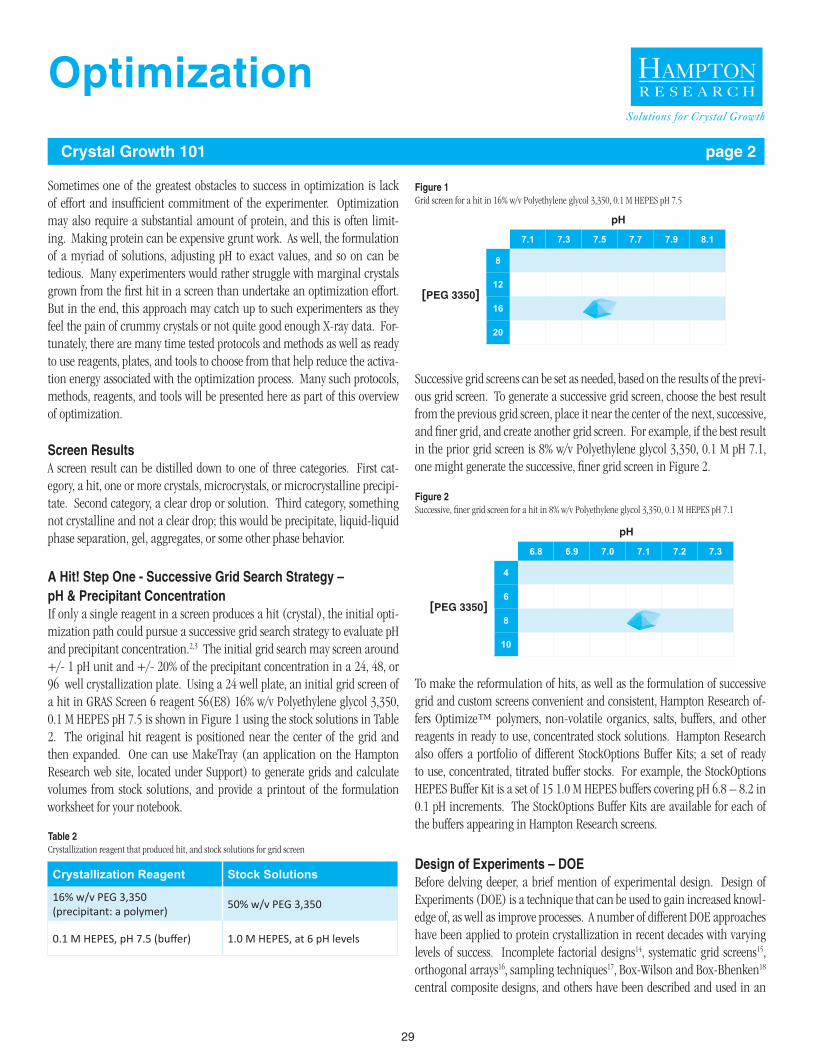
29
Crystal Growth 101 page 2
Sometimes one of the greatest obstacles to success in optimization is lack of effort and insufficient commitment of the experimenter. Optimization may also require a substantial amount of protein, and this is often limit-ing. Making protein can be expensive grunt work. As well, the formulation of a myriad of solutions, adjusting pH to exact values, and so on can be tedious. Many experimenters would rather struggle with marginal crystals grown from the first hit in a screen than undertake an optimization effort. But in the end, this approach may catch up to such experimenters as they feel the pain of crummy crystals or not quite good enough X-ray data. For-tunately, there are many time tested protocols and methods as well as ready to use reagents, plates, and tools to choose from that help reduce the activa-tion energy associated with the optimization process. Many such protocols, methods, reagents, and tools will be presented here as part of this overview of optimization.
Screen ResultsA screen result can be distilled down to one of three categories. First cat-egory, a hit, one or more crystals, microcrystals, or microcrystalline precipi-tate. Second category, a clear drop or solution. Third category, something not crystalline and not a clear drop; this would be precipitate, liquid-liquid phase separation, gel, aggregates, or some other phase behavior.
A Hit! Step One - Successive Grid Search Strategy – pH & Precipitant ConcentrationIf only a single reagent in a screen produces a hit (crystal), the initial opti-mization path could pursue a successive grid search strategy to evaluate pH and precipitant concentration.2,3 The initial grid search may screen around +/- 1 pH unit and +/- 20% of the precipitant concentration in a 24, 48, or 96 well crystallization plate. Using a 24 well plate, an initial grid screen of a hit in GRAS Screen 6 reagent 56(E8) 16% w/v Polyethylene glycol 3,350, 0.1 M HEPES pH 7.5 is shown in Figure 1 using the stock solutions in Table 2. The original hit reagent is positioned near the center of the grid and then expanded. One can use MakeTray (an application on the Hampton Research web site, located under Support) to generate grids and calculate volumes from stock solutions, and provide a printout of the formulation worksheet for your notebook.
Successive grid screens can be set as needed, based on the results of the previ-ous grid screen. To generate a successive grid screen, choose the best result from the previous grid screen, place it near the center of the next, successive, and finer grid, and create another grid screen. For example, if the best result in the prior grid screen is 8% w/v Polyethylene glycol 3,350, 0.1 M pH 7.1, one might generate the successive, finer grid screen in Figure 2.
To make the reformulation of hits, as well as the formulation of successive grid and custom screens convenient and consistent, Hampton Research of-fers Optimize™ polymers, non-volatile organics, salts, buffers, and other reagents in ready to use, concentrated stock solutions. Hampton Research also offers a portfolio of different StockOptions Buffer Kits; a set of ready to use, concentrated, titrated buffer stocks. For example, the StockOptions HEPES Buffer Kit is a set of 15 1.0 M HEPES buffers covering pH 6.8 – 8.2 in 0.1 pH increments. The StockOptions Buffer Kits are available for each of the buffers appearing in Hampton Research screens.
Design of Experiments – DOEBefore delving deeper, a brief mention of experimental design. Design of Experiments (DOE) is a technique that can be used to gain increased knowl-edge of, as well as improve processes. A number of different DOE approaches have been applied to protein crystallization in recent decades with varying levels of success. Incomplete factorial designs14, systematic grid screens15, orthogonal arrays16, sampling techniques17, Box-Wilson and Box-Bhenken18
central composite designs, and others have been described and used in an
Solutions for Crystal Growth
Crystallization Reagent Stock Solutions
16% w/v PEG 3,350 (precipitant: a polymer) 50% w/v PEG 3,350
0.1 M HEPES, pH 7.5 (buffer) 1.0 M HEPES, at 6 pH levels
Table 2Crystallization reagent that produced hit, and stock solutions for grid screen
Figure 1Grid screen for a hit in 16% w/v Polyethylene glycol 3,350, 0.1 M HEPES pH 7.5
7.1 7.3 7.5 7.7 7.9 8.1
8
12
16 X20
pH
[PEG 3350]
Figure 2Successive, finer grid screen for a hit in 8% w/v Polyethylene glycol 3,350, 0.1 M HEPES pH 7.1
6.8 6.9 7.0 7.1 7.2 7.3
4
6
8 X10
pH
[PEG 3350]
Optimization
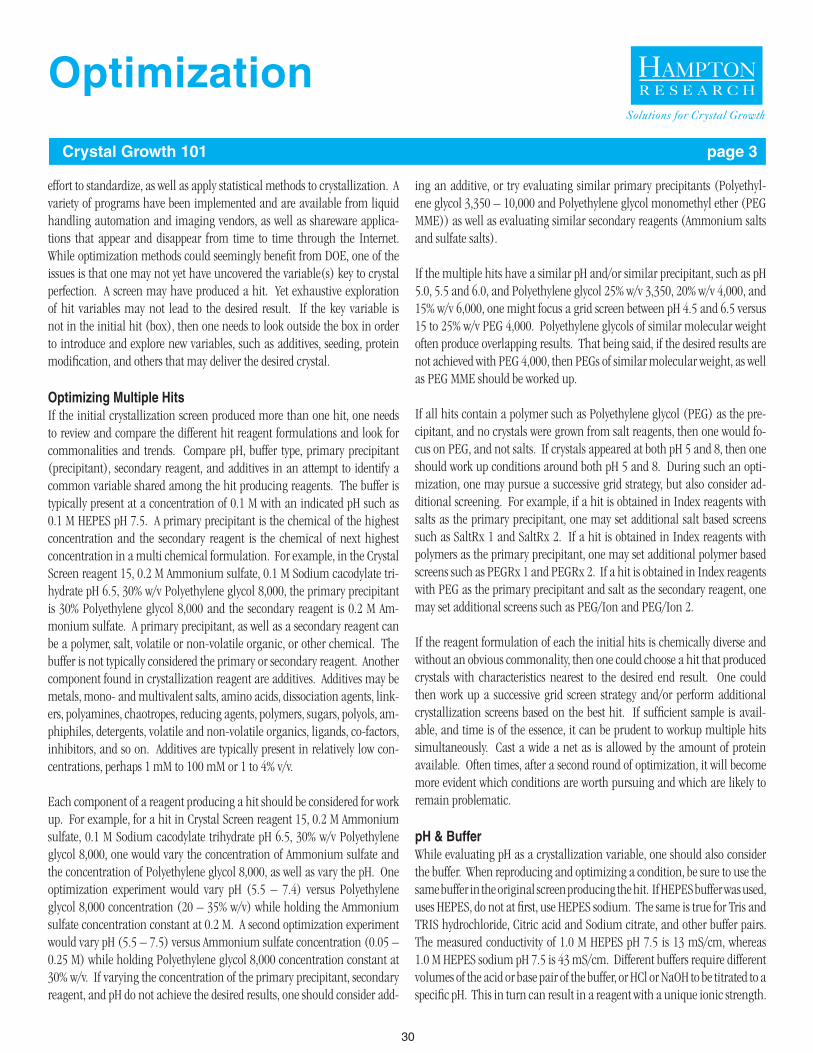
30
Crystal Growth 101 page 3
effort to standardize, as well as apply statistical methods to crystallization. A variety of programs have been implemented and are available from liquid handling automation and imaging vendors, as well as shareware applica-tions that appear and disappear from time to time through the Internet. While optimization methods could seemingly benefit from DOE, one of the issues is that one may not yet have uncovered the variable(s) key to crystal perfection. A screen may have produced a hit. Yet exhaustive exploration of hit variables may not lead to the desired result. If the key variable is not in the initial hit (box), then one needs to look outside the box in order to introduce and explore new variables, such as additives, seeding, protein modification, and others that may deliver the desired crystal.
Optimizing Multiple HitsIf the initial crystallization screen produced more than one hit, one needs to review and compare the different hit reagent formulations and look for commonalities and trends. Compare pH, buffer type, primary precipitant (precipitant), secondary reagent, and additives in an attempt to identify a common variable shared among the hit producing reagents. The buffer is typically present at a concentration of 0.1 M with an indicated pH such as 0.1 M HEPES pH 7.5. A primary precipitant is the chemical of the highest concentration and the secondary reagent is the chemical of next highest concentration in a multi chemical formulation. For example, in the Crystal Screen reagent 15, 0.2 M Ammonium sulfate, 0.1 M Sodium cacodylate tri-hydrate pH 6.5, 30% w/v Polyethylene glycol 8,000, the primary precipitant is 30% Polyethylene glycol 8,000 and the secondary reagent is 0.2 M Am-monium sulfate. A primary precipitant, as well as a secondary reagent can be a polymer, salt, volatile or non-volatile organic, or other chemical. The buffer is not typically considered the primary or secondary reagent. Another component found in crystallization reagent are additives. Additives may be metals, mono- and multivalent salts, amino acids, dissociation agents, link-ers, polyamines, chaotropes, reducing agents, polymers, sugars, polyols, am-phiphiles, detergents, volatile and non-volatile organics, ligands, co-factors, inhibitors, and so on. Additives are typically present in relatively low con-centrations, perhaps 1 mM to 100 mM or 1 to 4% v/v.
Each component of a reagent producing a hit should be considered for work up. For example, for a hit in Crystal Screen reagent 15, 0.2 M Ammonium sulfate, 0.1 M Sodium cacodylate trihydrate pH 6.5, 30% w/v Polyethylene glycol 8,000, one would vary the concentration of Ammonium sulfate and the concentration of Polyethylene glycol 8,000, as well as vary the pH. One optimization experiment would vary pH (5.5 – 7.4) versus Polyethylene glycol 8,000 concentration (20 – 35% w/v) while holding the Ammonium sulfate concentration constant at 0.2 M. A second optimization experiment would vary pH (5.5 – 7.5) versus Ammonium sulfate concentration (0.05 – 0.25 M) while holding Polyethylene glycol 8,000 concentration constant at 30% w/v. If varying the concentration of the primary precipitant, secondary reagent, and pH do not achieve the desired results, one should consider add-
ing an additive, or try evaluating similar primary precipitants (Polyethyl-ene glycol 3,350 – 10,000 and Polyethylene glycol monomethyl ether (PEG MME)) as well as evaluating similar secondary reagents (Ammonium salts and sulfate salts).
If the multiple hits have a similar pH and/or similar precipitant, such as pH 5.0, 5.5 and 6.0, and Polyethylene glycol 25% w/v 3,350, 20% w/v 4,000, and 15% w/v 6,000, one might focus a grid screen between pH 4.5 and 6.5 versus 15 to 25% w/v PEG 4,000. Polyethylene glycols of similar molecular weight often produce overlapping results. That being said, if the desired results are not achieved with PEG 4,000, then PEGs of similar molecular weight, as well as PEG MME should be worked up.
If all hits contain a polymer such as Polyethylene glycol (PEG) as the pre-cipitant, and no crystals were grown from salt reagents, then one would fo-cus on PEG, and not salts. If crystals appeared at both pH 5 and 8, then one should work up conditions around both pH 5 and 8. During such an opti-mization, one may pursue a successive grid strategy, but also consider ad-ditional screening. For example, if a hit is obtained in Index reagents with salts as the primary precipitant, one may set additional salt based screens such as SaltRx 1 and SaltRx 2. If a hit is obtained in Index reagents with polymers as the primary precipitant, one may set additional polymer based screens such as PEGRx 1 and PEGRx 2. If a hit is obtained in Index reagents with PEG as the primary precipitant and salt as the secondary reagent, one may set additional screens such as PEG/Ion and PEG/Ion 2.
If the reagent formulation of each the initial hits is chemically diverse and without an obvious commonality, then one could choose a hit that produced crystals with characteristics nearest to the desired end result. One could then work up a successive grid screen strategy and/or perform additional crystallization screens based on the best hit. If sufficient sample is avail-able, and time is of the essence, it can be prudent to workup multiple hits simultaneously. Cast a wide a net as is allowed by the amount of protein available. Often times, after a second round of optimization, it will become more evident which conditions are worth pursuing and which are likely to remain problematic.
pH & BufferWhile evaluating pH as a crystallization variable, one should also consider the buffer. When reproducing and optimizing a condition, be sure to use the same buffer in the original screen producing the hit. If HEPES buffer was used, uses HEPES, do not at first, use HEPES sodium. The same is true for Tris and TRIS hydrochloride, Citric acid and Sodium citrate, and other buffer pairs. The measured conductivity of 1.0 M HEPES pH 7.5 is 13 mS/cm, whereas 1.0 M HEPES sodium pH 7.5 is 43 mS/cm. Different buffers require different volumes of the acid or base pair of the buffer, or HCl or NaOH to be titrated to a specific pH. This in turn can result in a reagent with a unique ionic strength.
Solutions for Crystal Growth
Optimization
31
Crystal Growth 101 page 4
This subtle change in ionic strength can influence crystallization and can make the difference in being able to successfully reproduce a hit or not.
The buffer molecule itself can be a crystallization variable. 1.0 M Tris pH 7.5 has a measured conductivity of 43 mS/cm where 1.0 M HEPES pH 7.5 13 mS/cm. While this difference in ionic strength could be masked in a high salt condition, it might be significant in a low ionic strength polymer based condition. While it is important to at first use the same buffer used to produce the hit, evaluating a different buffer is something that should be considered during optimization. Until evaluated, one does not know if vary-ing ionic strength will worsen or improve crystal quality. The unique chemi-cal structure of different buffers effective over the same pH can also be a crystallization variable.4,5 The buffers Citrate, Malate, Succinate, Phosphate, Cacodylate, MES, Bis-Tris, and ADA are all appropriate buffers at pH 6. The unique chemical properties and structure of each of these buffers may influ-ence crystal quality. Screen both pH and buffer type during optimization.
The ionizable amino acid side chains in proteins are aspartic and glutamic acid (pKa values of about 4.5), histidine (pKa = 6.02), cysteine (pKa = 8.2), lysine (pKa = 10.5), tyrosine (pKa = 10.2), and arginine (pKa = 12.2). Although the pKa of an ionizable group on a protein may be strongly influ-enced by its chemical environment, it is worth keeping these pKa values in mind, as it is in their immediate neighborhoods that the charges on a pro-tein, their distribution and their electrostatic consequences may be most sen-sitive. Buffer pH can determine the ionization state of the side chains, and that can determine sample-sample and sample-solvent interactions, as well as lattice interactions, all having the potential to manipulate crystal quality.
Keep in mind the actual, measured pH of the crystallization reagent (con-dition, cocktail) may be different from that of the buffer stock used in formulation. This is okay, as long as one can reproduce the result. Most screen reagents are made from 0.5 or 1.0 M titrated buffer stocks, diluted to a final concentration of 0.1 M or lower. Dilution alone can change the pH, as well as the effect of additional chemicals, including salts, polymers, non-volatile organics, and additives. Unless otherwise indicated, or a Grid Screen kit which are titrated to pH after buffer and chemicals are added, the pH indicated on a tube label or formulation is that of a 1.0 M stock prior to the addition of other chemicals. The measured pH of each screen re-agent is available in the Support Materials section of the screen’s web page at hamptonresearch.com. Formulation details for screen buffers is available in Crystal Growth 101 – Buffer Formulation.
Precipitant ConcentrationA crystallization experiment containing microcrystalline precipitate, mi-crocrystals, or numerous small crystals may indicate the concentration of the precipitant is too high, and lower concentrations should be explored. A crystallization experiment with precipitate is also associated with precipitant
concentration that is too high; lowering the precipitant concentration may lead to crystals. Clear drops indicate the precipitant concentration is too low and one should evaluate increasing concentrations of precipitant. The appropriate precipitant concentration is interdependent on variables such as protein concentration, salt concentration, pH, and temperature.
Precipitant TypePolyethylene glycols (PEGs) are the most common precipitants used today for the crystallization of proteins. PEG molecular weight varies from 200- 20,000 but the middleweight range of PEGs (3,350-8,000) are most effective when growing crystals for X-ray diffraction. Experience seems to show that PEGs in the range of 200-600 are similar, PEGs in the range of 1,000-2,000 are similar, PEGs in the range of 3,350-8,000 are similar and PEGs in the range of 10,000-20,000 are similar. For example, a protein that crystallizes in a particular molecular weight of PEG, such as 3,350, is likely to crystallize in PEG 4,000, 6,000, and 8,000 albeit at decreasing PEG concentration as the molecular weight of the PEG increases. When optimizing a PEG based reagent, consider varying the concentration of the PEG, using similar mo-lecular weights, and substituting PEG MME for PEG (or vice versa) during optimization. When crystals appear in PEG, they often do so across a much broader concentration, range than salts. A crystal may appear in 5-20% PEG, although it may have an optimum within that range, so successive grid screening is warranted with PEGs. When optimizing a reagent with PEG as the primary precipitant with a secondary salt, one should not only evaluate similar PEGs, but also similar secondary salts. When screening the second-ary salt, one generally holds the cation constant, screening various anions, then hold the anion constant and screening various cations. For example, for a hit in 20% w/v Polyethylene glycol 3,350, 0.2 M Ammonium sulfate, when evaluating the secondary salt, one would screen Ammonium salts (Ammonium acetate, chloride, citrate, fluoride, formate, nitrate, phosphate, and tartrate) as well as Sulfate salts (lithium, magnesium, potassium, and sodium). PEG conditions, free of salt, with buffer present are considered low ionic strength conditions. Low ionic strength conditions are typically more sensitive to pH and temperature, so be sure to evaluate a broad and fine (0.1 pH increments) pH, as well as a temperature range between 4 and 37° Celsius. Vapor diffusion equilibration rates are lower in PEG based reagents, especially low ionic strength, free of salt, which drives equilibration more strongly than PEGs.
Salts, both inorganic and organic, are the second most common precipitants used today for the crystallization of proteins. The multivalent anions (SO
42-,
PO4
3-, Citrate3
-, etc.), yielding a higher ionic strength according to the square of their charge, are the most frequently utilized and productive salts. The type of cation or anion can affect protein solubility and stability. As just stated, when evaluating salts during optimization, one can hold the cation constant and vary the anion, and then hold the anion constant and vary the cation. This can help identify the optimal salt and also indicate if there is a
Solutions for Crystal Growth
Optimization
32
Crystal Growth 101 page 5
preference for a specific anion or cation. The concentration of salt suitable for promoting crystallization is typically much more narrow than for PEGs. Successive grid screens as fine as 0.05 M increments are often profitable and worth the effort. Vapor diffusion equilibration rates are higher in salt based reagents than PEG based reagent. The solubility dependence of most pro-teins are lessened by high salt concentration, so it is likely less rewarding to carry out experiments at multiple temperatures, although crystallization for purification and formulation would be an exception to this generalization.
Organic salts and acids, pH neutralized or not, can be effective crystalliza-tion reagents. Unless the measured pH of a salt is paired well with buffer pH, a salt based reagent can significantly influence the pH of the buffer, even pushing the solution pH outside the buffering capacity of the buffer. The use of neutralized organic acids makes pH pairing more obvious since the pH of the neutralized organic acid is consistent and indicated on the container, whereas the measured pH of some salts can vary significantly. Sodium mal-onate (malonic acid neutralized with Sodium hydroxide) has been shown to be highly effective in comparison to other commonly used salts such as am-monium sulfate.6 Sodium malonate is soluble across a broad pH, allowing the formulation of concentrated stocks of pH 4, 5, 6, 7, and 8, with the added advantage of being able to screen pH and salt concentration by blending two adjacent pH stocks (4/5, 5/6, 6/7, 7/8). Other neutralized organic acids such as Ammonium citrate, Malic acid, and Succinic acid have also shown to be unique and useful precipitants and secondary salts. This expanding port-folio of salt based precipitants requires more protein for optimization, and this prompted Hampton Research to develop Tacsimate™; a single reagent composed of seven organic salts, neutralized to pH 4, 5, 6, 7, 8, or 9, allowing one to screen seven different organic acids using a single reagent.
Mixtures of PEGs and salts have proven to be powerful crystallization re-agent formulations. Formulating PEG as the primary precipitant with salts as the secondary salt, at a concentration of 0.2 M has demonstrated broad success in the crystallization of biological macromolecules. A 0.2 M diva-lent anion concentration is almost precisely the concentration that would be predicted from physical-chemical considerations to provide the optimal electrostatic shielding between proteins in a solution.7,8 This may explain why a 0.2 M salt concentration provides an optimal ionic strength for many proteins that crystallize in PEG and other non-salt precipitants. The PEG/Ion and PEG/Ion 2 screens, and a host of other conditions are predicated on this mixture of PEGs and salts. The diversity of salts in the PEG and salt mixture is key to the sampling of pH and ionic strength in the presence of PEG, without the need for an added buffer since the salt drives the pH of the reagent. Hits produced in PEG/Ion type reagents can be optimized for pH by adding a buffer to fine screen pH, as part of successive grid screening of PEG concentration and pH, as well as an evaluation of similar PEGs.
Protein ConcentrationFor most macromolecules, the optimal protein concentration is between 5 and 20 mg/ml, although there are, of course, many exceptions. Complexes, large assemblies, viruses, and proteins with limited solubility usually range lower at 2-5 mg/ml. Peptides and small proteins tend to range higher at 20-50 mg/ml. The Protein Data Bank9 and Biological Macromolecular Crystal-lization Database10-12 report concentration ranges as low as 1 mg/ml and as high as 300 mg/ml.
To determine the appropriate protein concentration for crystallization screening, one can use a pre-crystallization test such as the Hampton Re-search PCT kit.
When evaluating crystallization experiments, clear drops indicate that ei-ther the relative supersaturation of the sample and reagent is too low or the drop has not yet completed equilibration. If the drop remains clear after 3 to 4 weeks, consider repeating the screen condition and doubling the sample concentration. If more than 70 of the 96 drops are clear, then consider doubling the sample concentration and repeating the entire screen.
Drops containing precipitate indicate either the relative supersaturation of the sample and reagent is too high, the sample has denatured, or the sample is heterogeneous. To reduce the relative supersaturation, dilute the sample twofold with sample buffer and repeat the screen condition. If more than 70 of the 96 drops contain precipitate and no crystals are pres-ent, then consider diluting the sample concentration in half by adding an equal volume of sample buffer to the sample and repeating the entire screen.
Below a certain protein concentration, the protein will simply not crystallize at all, producing a clear drop, or a drop with light precipitate. On the other hand, excessive protein concentration can favor uncontrolled nucleation, rapid and disordered growth, leading to numerous small crystals, or few to many crystals with visible and invisible defects. Note, beauty is only skin deep. External appearance has no relation to the quality of the crystal, in terms of X-ray diffraction, stability, or solubility.
Protein concentration and precipitant concentration work hand in hand. When presented with precipitate or an excessive number of small crystals, one may reduce the protein and/or the precipitant concentration to lower the relative supersaturation. Just the same, protein and/or precipitant con-centration may be increased to raise the relative supersaturation, in attempt to make something happen in clear drops. Changing the protein may not have the same effect as changing the precipitant concentration, so consider both options during optimization.
Solutions for Crystal Growth
Optimization
33
Crystal Growth 101 page 6
Converting Hits in nl Drops to µl DropsHits produced in nanoliter sized drops, such as 100 nl protein plus 100 nl reagent are typically scaled to larger drops during optimization. However, it is not unusual for a crystal producing reagent at the nanoliter scale to produce precipitate at the microliter scale. Current popular belief as to why this takes place is that the surface volume ratio is great for the smaller drops, meaning more protein is lost on the surface of smaller drops. In addition, the smaller drops equilibrate more rapidly with the reagent well. To correct for this when scaling to larger drops, the amount of protein needs to be decreased. One can accomplish this by diluting the protein concentration in half, or one can add half the amount of protein (at the original concentra-tion) to the drop. For example, if the original drop was 100 nl of 10 mg/ml protein plus 100 nl of reagent, the scaled up drop could either be 1 µl of 5 mg/ml protein plus 1 µl of reagent or 0.5 µl of 10 mg/ml protein plus 1.5 µl of reagent. One may also need to reduce the precipitant concentration.
Drop Volume & Drop RatioAutomated liquid handling systems (robots) allow one to set very small drops (100 nl protein plus 100 nl reagent) which conserves protein and al-lows one the option to screen more reagents, or have more protein available for optimization. Such small drops tend to produce small crystals. When larger crystals are necessary, the nanoliter sized drops are typically scaled to microliter drops. A compromise for those using crystals for X-ray diffraction analysis is to screen using 300 nl protein plus 300 nl reagent. This still saves protein compared to 1 µl protein plus 1 µl reagent drops, it increases the likelihood of producing crystals large enough for X-ray diffraction straight from the screen drop, and can prevent the need for scaling drop size.
During optimization, it is common to scale drops to 1 µl protein plus 1 µl reagent or even larger volumes. The volume of the drop can have a sig-nificant effect on the final size of the crystals produced. Andrew Karplus and Kristin Fox demonstrated a 60 fold increase in drop volume produced a 730 fold increase in crystal volume, and a simultaneous increase of the effective diffraction limit of the crystals from near 2.5 angstrom to well be-yond 2.0 angstrom resolution.13 The crystal volume increase may be due to the increased amount of protein and the lower equilibration rate associated with larger drops. Hanging drop vapor diffusion drops as large as 20 µl are straightforward to set, Cryschem sitting drop vapor diffusion crystallization plates can accommodate drops as large as 40 µl, and nine well glass plates and sandwich box setups can accommodate drops as large as 800 µl for vapor diffusion.
Drop ratios allow one to explore varying levels of initial and final protein and reagent concentration, explore different equilibration paths, and cover a wider range of relative supersaturation. All by simply changing the amount of sample and reagent added to the drop. Multiple drops with varying drop ratios can be set during screening and/or optimization to explore the effects
that different initial protein and reagent concentration, different final pro-tein concentration, and the equilibration path, may have on crystal nucle-ation, growth, and quality. For more information on drop ratios see Crystal Growth 101 – Drop Ratio.
SeedingSeeding allows one to grow crystals in the Metastable Zone, where spontane-ous homogeneous nucleation cannot occur, but crystal growth from seeds can occur. Why would one want to do this? For control, reproducibility, and to improve the likelihood of a successful crystallization experiment. For more information, see Crystal Growth 101 – Seeding.
Hampton Research offers several kits related to seeding, including the Crys-tal Crusher, Seeding Tool, and Seed Bead Kits.
AdditivesAdditives are considered chemicals in a crystallization reagent in addition to the primary precipitant, secondary reagent, and buffer. Additives can af-fect the solubility and crystallizability of biological macromolecules. These chemicals can perturb, manipulate, and stabilize sample-sample and sam-ple-solvent interactions, we well as perturb water structure, which can alter and improve the solubility of crystallization of the protein. Additives can stabilize or engender conformity by specific interactions with the protein. Additives can also establish stabilizing, intermolecular, non-covalent cross-links in protein crystals and thereby promote lattice formation.
The most commonly useful class of additives, and the only class of which we have any real understanding, are those which may, for physiological reasons, be bound by the protein with consequent favorable change in the protein physical-chemical properties or conformation. These include co-enzymes and prosthetic groups, inhibitors, enzymatic products, ions, and other effector molecules. Often times the ligand bound form of the protein is structurally defined and stable, while the unliganded form is not, and often the former will crystallize when the latter will not.
Chaotropes, osmolytes, and cosolvents can perturb or stabilize the hydration of macromolecules by altering the physical relationship between the surface of the protein and water.20-23 Detergents and non-detergent sulfobetaines (NDSB) can manipulate hydrophobic interactions and alter the solubility of the macromolecule and reduce aggregation without directly affecting its physical-chemical properties.24,25 Multivalent cations such as the diva-lent Cadmium chloride, Calcium chloride, and Magnesium chloride, and the trivalent Yttrium chloride, Iron chloride, and Nickel chloride stabilize conformation and structure of macromolecules.26 Volatile organic solvents alter the dielectric constant of water which can manipulate and stabilize the hydration of macromolecules. Salts alter the activity coefficient of water and help reinforce attractions among macromolecules. Biocompatible water-
Solutions for Crystal Growth
Optimization
34
Crystal Growth 101 page 7
soluble ionic liquids, organic salts and salts with melting points at or below room temperature have demonstrated usefulness as additives.27 Chemical protectants, molecules that assure protein integrity such as the reductants DTT and TCEP, as well as metal atom scavengers such as EDTA are yet an-other class of additives. Dissociating agents (phenol), amino acids, linkers (6-aminohexanoic acid), polyamines (spermidine), polymers (polyethylene glycol), sugars (sucrose), amphiphiles (benzamidine hydrochloride), and non-volatile organics ((+/-)-2-Methyl-2,4-pentanediol) are other additive classes. More recently, additives termed silver bullets, because of their abil-ity to play a primary role in the crystallization process, have expanded the portfolio of additives. Silver bullet molecules, which play an active role in creating and maintaining the crystal lattice through the formation of in-termolecular interactions of a reversible nature, i.e. they serve to crosslink, electrostatically or through hydrogen bonds and hydrophobic interactions, surface groups on neighboring molecules.28
Additives are easy to use. They are simply added to the reagent producing the crystal. The additive can be placed directly into the drop, or added to the reagent well and mixed with the macromolecule. Additives are screened much like crystallization reagents, in sets of 24 or 96. Unless there is de novo knowledge clearly indicating an additive be included in the crystalliza-tion experiment, the general strategy is to screen a portfolio of 96 or more additives, search for an effect, and then refining the effect.
Hampton Research offers several different additive screens, including the Additive Screen, Silver Bullets, Detergent Screen, and Ionic Liquid Screen.
Crystallization MethodSitting drop, hanging drop, sandwich drop, microbatch, liquid bridge, free interface diffusion, microdialysis, sequential extraction, and other methods of crystallization can present a unique start, equilibration path, and end-point. Subtle or significant, these different methods can and should be ex-plored when other optimization procedures do not deliver the goods.
Sample BufferIt can often be the case where the sample buffer is the final purification buffer, or a routinely used favorite, “because that’s what we’ve always done before” or “it seemed okay last time”. An evaluation of pH, buffer type, and portfolio of additives and excipients using Dynamic Light Scattering (DLS) to assay for monodispersity and aggregation, and Differential Scan-ning Fluorimetry (DSF) to assay for stability, can help to identify an optimal buffer formulation for the protein. A homogenous, monodisperse, stable sample can offer a better chance for crystallization, as well as produce highly ordered crystals. The sample is the single most important variable in the crystallization experiment.18,19 For more information, see Crystal Growth 101 – Sample Preparation for Crystallization for more information.
Further Purification & Batch VariationWith few exceptions, the probability of growing large single crystals of high quality is always substantially increased with homogeneity of the sample. In some instances, minor impurities are the impediment to high quality crystals, or even preliminary crystals, and once the macromolecule is sub-jected to further purification, crystallization is improved. When in doubt, purify further. And do everything possible to ensure the purification process is consistent, batch to batch. When one encounters a problem reproducing a hit, always question if the batch of protein is the same or different. Many a time reproducibility is blamed on reagents, when in reality it is variability in the macromolecule.
TemperatureWhile some proteins demonstrate temperature dependent solubility, others do not.81 So it is not surprising that temperature may be of appreciable im-portance for the crystallization of some macromolecules, or it may have no significance at all. Macromolecules may show normal or retrograde solu-bility, and this can be a function of ionic strength and pH.82 Macromolecu-lar crystallization in reagents composed of low ionic strength, containing polyethylene glycol, polyol, volatile- or non-volatile organic, no or very low salt, and a buffer typically demonstrate more temperature dependence and should be evaluated at multiple temperatures, such as 10, 20, and 30° Cel-sius. Volatile organics such as 2-Propanol or tert-Butanol should be set at reduced temperatures for increased efficacy as well as to protect the stability of the macromolecule.83,84 When practical, crystallization screens should be set at two or three different temperatures between 4 and 37° degrees Celsius. 10, 20, and 30° Celsius is a popular choice. Even when crystals are not obtained, comparing results between reagents at multiple temperatures can give valuable insight into the temperature and reagent dependent solubility of the macromolecular sample. If sample is limited, or screening multiple temperatures simultaneously is not possible, set and incubate the experi-ments at one temperature, for a period of time, score, and then move the experiments to another temperature. Score, and then move to a third tem-perature and compare the results between temperatures. And do not base the evaluation of temperature simply on the appearance or not of crystals. Compare all experimental results, including clear, precipitate, phase separa-tion, as well as the size, number and visible appearance of any crystals.
Incubating the crystallization experiment at an elevated temperature for a short period of time, and then moving the experiment to room temperature, or cooling the macromolecule, reagent and experiment during set up and incubation, as well as temperature ramping and/or cycling are all method-ologies with demonstrated success.85-87
To Centrifuge, Filter, or Not?Just before setting crystallization experiments, one may choose to centrifuge
Solutions for Crystal Growth
Optimization
35
Crystal Growth 101 page 8
or filter the sample to remove amorphous material, particulates, and aggre-gates, or not. One school of thought says that during initial screening, one should not centrifuge or filter the sample before the setup, as particulates and amorphous material may serve as a nucleating agent for crystalliza-tion. This school then suggest during optimization that the sample then be centrifuged or filtered to improve crystal quality. The OCD school of thought says be consistent, be clean, and always filter (0.22 micron) or centrifuge the sample. Centrifugation may be preferable to filtering, as there is no risk of sample loss due to the macromolecule binding to a filter, or dead volume, both wasting precious protein.
Additional Screening - When to Stop & Try Something ElseWhen the initial screen of 24, 48, or 96 reagents does not produce the desired macromolecular crystals, one may screen more reagents, with a focus on a different chemical space, using care not to duplicate conditions. If the land of clear and precipitated drops, free of crystals continues, how does one know when to say uncle and try something else? A well behaved, crystal-lizable protein, a trait we cannot assign the macromolecule until after it is crystallized, but only happens about 35% of the time, may crystallize in a chemically diverse screen composed of 96 to 384 reagents. Segelke, in 2000, analyzing a pool of structural genomics crystallization data, estimated that a protein with a success rate of only 2% would likely crystallize in a screen of 300 random reagents.64 Crystallization efforts since that time, through global protein structure initiatives, indicate that perhaps a diverse chemical space of 384 reagents (4 x 96) is a reasonable number of reagents to screen before trying something else beyond screening. That being said, efforts de-veloped and pursued since 2000 by Luft and DeTitta have focused on a screen composed of 1,536 reagents.65 On more than one occasion the screen has successfully delivered the desired crystal on as few as 1 reagent, of 1,536. So when to stop screening and try something else? Somewhere between 384 and 1,536 reagents; your mileage may vary.
Modification of the ProteinWhen optimization of the primary crystallization variables, seeding, ad-ditives, and further screening do not provide the desired crystals, and the sample being the single most important variable in the crystallization ex-periment, a logical approach is to change the sample in some manner.
ProteolysisProteases can be used to trim floppy bits from a protein, as well as gener-ate fragments or domains for crystallization screening. A proteolytic frag-ment or domain of a protein may crystallize more readily or form better diffracting crystals than the intact protein.29-33 Proteases can be used to gen-erate small, active fragments or domains of the target protein for crystal-lization. The fragment or domain can be used directly for crystallization experiments. Or the proteolytic sample analyzed by gel electrophoresis and/or mass spectrometry for mass and sequence for subsequent cloning, expres-
sion, purification and crystallization. Using proteolysis to enhance sample crystallization, the current overall success rate for yielding a deposited crys-tal structure has been reported to be better than 12%.31 Hampton Research offers the Proti-Ace and Proti-Ace 2 kits for limited proteolysis, in situ pro-teolysis, and proteolytic screening of protein samples for crystallization and structure determination. Refer to the Proti-Ace User Guide for proteolysis methodologies.
Reductive AlkylationReductive alkylation of lysine residues to change protein properties (pI, solubility and hydropathy) which may promote crystallization via improved crystal packing. Reductive methylation, ethylation, or isopropylation of ly-sine residues has been successfully applied to obtaining high quality crys-tals.34-37 Reductive alkylation does not change the intrinsic charge on a protein but may change the isoelectric point (pI) slightly. The N-terminal amino group on the backbone will also be reductively alkylated. In general, alkylated proteins retain their original biochemical function. Hampton Re-search offers this methodology in the Reductive Alkylation Kit. The protocol is designed with the goal of generating a high degree of modification with few side reactions, resulting in a homogeneous population of protein.
Chemical ModificationDespite the number of reagents available to modify particular sidechains of proteins, reductive alkylation is the method that appears most prominently in the crystallization literature. Although site specific chemical modifica-tion has been a useful tool in proteomics, the application has not transi-tioned into macromolecular crystallization. The options are numerous and include the modification of amino groups, histidine residues, arginine, carboxyl groups, cysteine, cystine, methionine, tyrosine, and tryptophan.38
Complex FormationProteins that have not yet crystallized in their native state may be crystallized as complexes. Complex formation followed by crystallization screening can be performed with inhibitors, co-factors, and antibody fragments.39-41 The conformational changes induced upon such ligand binding may be favor-able to the crystallization process by exposing new crystal contacts or by sta-bilizing the protein. Complex formation can be combined with seeding, as demonstrated by the crystallization of antibody-antigen complexes, promot-ed by combining complexation with microseed matrix screening (MMS).42 See Crystal Growth 101 – Seeding for the microseed matrix screening pro-cedure.
DeglycosylationProteins with high or heterogeneous carbohydrate content can prove difficult to crystallize. The enzymatic removal of sugars to promote crystallization has been used successfully in numerous instances.43-46 The glycosylation problem can also be solved by expression of glycoproteins in mammalian
Solutions for Crystal Growth
Optimization
36
Crystal Growth 101 page 9
cells in the presence of N-glycosylation processing inhibitors.47 This allows for correct glycoprotein folding, but leaves the macromolecule sensitive to enzymes like endoglycosidase H, that reduce the N-glycans to single resi-dues, enhancing the chance for crystallization.
Point MutationsProteins have a natural potential to interact via hydrogen bonds, ionic or electrostatic, and Van der Waals contacts and these are the same interactions which occur in the intermolecular packing within a protein crystal. For a protein resistant to crystallization, point mutations that change unfavorable contacts to more favorable contacts can and has been a successful crystal-lization strategy. Mutation of lysines to arginine or glutamine is one such option.48 There are a number of examples in which rational surface point mutations were used to engineer crystal contacts to generate a crystalliz-able protein.49-52 When pondering point mutations, keep in mind that not all mutations that resulted in crystalline protein have been rational. In a number of cases serendipity has played a role in the ability of the protein to crystallize. Consider both rational and random point mutations.
Truncations, Deletions, & Fusion ProteinsProteins are often composed of domains tethered by flexible linkers. Exces-sive flexibility can be a source of heterogeneity which can interfere with crys-tallization. Deleting or removing flexible regions at the termini or within a protein may promote crystallization by minimizing the interfering effects from heterogeneity. N-terminal and C-terminal truncations and deletions and well as insertions and deletions within a protein can be handled with recombinant protein expression.53-55 The creation of fusion proteins, using recombinant techniques where genes or gene fragments are spliced together to form gene fusions can be used to generate soluble protein for crystalliza-tion.56-58
Surface Entropy ReductionThe propensity of macromolecules to associate favorably and form crystals is largely defined by topology and physical chemistry of the surface of the macromolecule. Large, flexible amino acids such as Lysine, Glutamic acid and Glutamine, on the surface of the macromolecule can form an entropic shield and impede favorable intermolecular interactions and crystallization. Generating variants of the macromolecule free of the entropic shield, by replacing selected large and surface exposed residues with smaller residues such as Alanine is another way to promote a crystallizable sample. This crystal engineering strategy, based on surface entropy reduction (SER) has been extensively tested and shown to be another tool for handling macro-molecules recalcitrant to crystallization.59-62 The SER strategy can also be combined with other rational protein engineering strategies, such as using the fusion protein methodology, to encourage crystallization of less than well behaved macromolecules.59
Gel GrowthThe presence of gel in a crystallization experiment can reduce convection and sedimentation. Crystallization in gels can be performed by vapor dif-fusion, batch, microdialysis, and free interface diffusion. Gels composed of agarose as well as a silica hydrogel are well known as media for optimizing the size and quality of crystals.68,69 Dong, through X-ray diffraction mea-surements of crystals grown in gels versus those in standard liquid drops showed an improvement in crystal order.70 Hampton Research offers the Silica Hydrogel Kit and a Low Melting Agarose Gel for macromolecular crystallization in a gel matrix. For more information about using gels for crystal growth, see the Silica Hydrogel and LM Agarose for Crystallization user guides.
Surfaces & Nucleating agentsThe effect of surfaces on macromolecular crystallization is not yet well un-derstood. Intuition indicates surfaces should be important. It has been ru-mored that the best crystal growers were bearded, as bits from the beard made their way into crystallization experiments, serving as nucleating agents for the macromolecules. Don’t laugh, there’s proof of concept to hair and other bits promoting crystallization.90,91 Crystals are often observed, attached to a glass or plastic surface, growing at an air-water-phase interface, on a fiber or some debris in the sample. Surfaces can be important for crystallization since nucleation seems to preferentially occur on a surface. It is proposed that macromolecules adsorbed onto a surface conformationally constrained and this may assist in the formation of an ordered array, eventually result-ing in a crystal. Both epitaxial (close lattice match) and heterogeneous (poor lattice match) examples appear in the literature, together with other proposed surface and nucleating agents.92,93 Most of the time however, our experiments attempt to minimize the effect of surfaces by siliconizing glass cover slides and plates or using plastic plates molded from more hydropho-bic materials. Time will reveal if a holy grail nucleant truly exists, or not.
Tag On or Tag OffProtein tags, sometimes called affinity tags, are amino acid sequences graft-ed onto a recombinant protein. The tags are attached to proteins for various applications, but affinity tags are added to proteins so that the protein can be purified away from other materials in the prep using an affinity column. The poly(His) tag, often referred to as a His-tag is widely used for protein pu-rification, as it binds to metal chromatography matrices. Other tags include the maltose binding protein (MBP) and glutathione-S-transferase (GST) tags.
When it comes time to crystallize the purified, tagged protein, a common question is whether or not the tag should be removed for crystallization. The reason being, recall that crystallization is favored when the protein is homogeneous, monodisperse, and free of flexible domains or termini.
Solutions for Crystal Growth
Optimization
37
Crystal Growth 101 page 10
Superstition leads us to believe that His-tags should be unstructured and flexible, and this could deter crystallization. Yet, in reality, depending upon the tag and the protein, the tag may or may not be a variable in the crys-tallization experiment. The current consensus is to screen the protein for crystallization with the tag in place. If there are no crystals, then remove the tag and screen again. Based on what we hear and read, most remove the tag before screening, so the tag is not a variable. That being said, there are reports where only the tag form of the protein crystallized, or the presence of the tag resulted in a crystal form different from the non-tagged protein because the tag participated in crystal packing. And when asked about the length of the tag, the audience says 6 is better than 10.
Fresh SampleProtein degradation can occur over time. Some proteins are more sensi-tive to change, aggregation, degradation, and denaturation than others. It is often the case where the more interesting, troublesome, and costly the protein is to produce, the less stable it is. Using fresh protein seems to be an advantage for crystallization. Heterogeneous, degraded, aggregated, and denatured protein is less prone to crystallize than fresh, homogeneous, and monodisperse protein.
Fresh PEG, Old PEGSometimes there is nothing more frustrating than being unable to reproduce a crystallization condition. A hit is obtained in a screen, yet reproducing the hit is evasive. Since there are so many crystallization variables, there can be many reasons for the irreproducibility. One that seems to rear its ugly head from time to time is the difference between fresh PEG (polyethylene glycol, poly(oligo)-oxyethylene-based compounds) and old PEG. Aging of PEG can alter the chemical properties of common polyethylene glycols, resulting in increased levels of aldehydes, carboxylates, and peroxides, increased ionic strength, as well as increased metal binding and a reduction of pH.94,95 Hampton Research measured pH and conductivity of 8 different PEGs stored in a variety of typical laboratory storage settings over a period of 18 months.96 pH and conductivity were selected as suitable indicators of PEG aging (reduced pH and increased ionic strength) because pH and ionic strength can be significant crystallization variables. pH and conductivity measurements were recorded at 25° Celsius. All PEG solutions were initially prepared at the same time, sterile filtered, filled into sterile PETG bottles, and purged with argon before closing the cap on the bottles. The results varied with PEG type and molecular weight, and how the PEG was pack-aged and stored. Data showed aging affects can be accelerated by warm temperature, light, and the presence of oxygen. PEG solutions appear most stable when stored frozen (-20° Celsius), and refrigerated (4° Celsius) PEG solutions are more stable than those stored at room temperature. Aging of solutions stored at room temperature can be further minimized by purging atmosphere (oxygen) from filled containers using argon. Finally, the aging
of PEGs can be further minimized by storing the sealed solutions protected from light. Protein crystals can be grown in fresh PEG solutions or aged PEG solutions. But crystals grown in aged solutions will sometimes not grow in fresh solutions and vice versa.
When it comes to PEG, both quality and consistency should be considered significant crystallization variables. Hampton Research Optimize Polyeth-ylene glycol solutions are supplied in sterile, optically a clear PETG bottle, purged with argon before closure, and packaged in a protective carton. The carton helps protect the Polyethylene glycol from light. The optically clear PETG bottle has low oxygen permeability and also allows one to inspect the solution for color change or the appearance of amorphous material.
Use fresh PEG.
Change the KineticsIt has been said the reward is in the journey. And when it comes to the crys-tallization of macromolecules, that means the geometry, path, and kinetics of the experiment can determine whether or not a crystal is grown, as well as the quality of the crystal. Various crystallization methods, sitting, hanging, and sandwich drop, microbatch, dialysis, free interface diffusion, and oth-ers, can each present a unique experimental geometry, path, and kinetics of equilibration. Not only the method, but the type, size, and shape of the plate or device can provide unique kinetics and with it, unique crystallization outcomes.97,98 So another option during optimization is to try a different crystallization method, plate, or device to evaluate different kinetics.
Drop ratios are another way to manipulate the kinetics of crystallization, and that is presented in Crystal Growth 101 – Drop Ratios.
The use of alternative reservoirs is another way to change the path and kinetics of a vapor diffusion experiment. In the early, medieval times of protein crystallization, it was typical to pipette a number of drops in vapor diffusion with a common reservoir (reagent well, dehydrant). For example, a sandwich box setup, where drops of protein and reagent are dispensed into a 9 well siliconized glass plate, and that plate placed inside a plastic sand-wich box, partially filled with a reservoir such as concentrated Ammonium sulfate, and sealed with a greased cover. Later on, crystal growers purloined multiwall tissue culture plates in order to pipette reservoirs to match the reagent in the hanging drop. Today crystal growers can choose from dozens of different flavors of plates and devices for crystallization. Returning to kinetics, one may fill the reservoir of these plates with a common dehydrant, one that is an alternative to the drop paired reagent, in order to manipulate and evaluate the kinetics of vapor diffusion.99-102
Layering of oil over the reagent in the reservoir is yet another method to control kinetics, in this instance, slowing the rate of vapor diffusion between
Solutions for Crystal Growth
Optimization
38
Crystal Growth 101 page 11
the reagent and the drop, which can be fine-tuned by adjusting the volume and composition of the oil layer.103
PressurePressure has been explored as a crystallization parameter, as hydrostatic pressure can affect system uniformity and be rapidly altered.66 Protein solu-bility and crystal growth rates for several proteins were found to be depen-dent upon pressure.66-67
Magnetic and Electric fieldHigh magnetic fields have been applied for the purpose of improving crystal quality. Not only a homogeneous magnetic field but also a steep-gradient magnetic field (inhomogeneous magnetic field) have been shown to im-prove crystal growth.71,72 A magnetic force can counteract the gravitational force when applied in the opposite direction, and magnet-based quasi-microgravity environments have been exploited as an alternative to the space-based microgravity environment.73 Experimental studies on protein crystallization using a high magnetic field have reported a reduction in the number of crystal nuclei,74 as well as a relatively slow crystal growth rate,75 when compared with those under normal-gravity conditions outside the magnetic field.
External electric fields have been shown to reduce the nucleation rate, pro-duce fewer, larger crystals76 as well as improved crystal quality.77
MicrogravityMicrogravity has been used as a crystallization variable to study the funda-mental mechanism of macromolecular crystal growth, manipulate crystal nucleation, growth, size, and quality, as well as improve crystal quality.78,79
Overall, microgravity has delivered crystals of preferential size and of im-proved quality.80
VibrationSome level of mechanical vibration often takes place during the crystalliza-tion experiment. Work by Lu, looking at several different proteins crystal-lized with and without vibration demonstrated enhanced morphology and improved X-ray diffraction resolution with mechanical vibration, and pro-posed vibration may be a method for obtaining more hits during crystalliza-tion screening.88,89 Anecdotal observations related to vibration sometimes show a preference for setting the experiments aside in a still place like a fine spirit, for later analysis. Others report no difference between experiments set in vivacious, vibrating incubators and near motionless incubators or lab cupboards. In microgravity it is said crystal growth rates varied with a clear connection to when astronauts are exercising. At this time, the question “shaken or stirred”, when it comes to crystallization, remains an area for further exploration.
Data & Literature Review & MiningDelve into the literature.1-137 George Santayana said that those who cannot remember the past are condemned to repeat it. Yet in protein crystallization, the past (literature) is so full of wisdom, techniques, and methods, that it seems difficult to repeat some of them, so dig in and discover from the past. Before beginning a crystallization project one should review the literature related to their macromolecule and any similarities. Search the Protein Data Bank (www.wwpdb.org) and Biological Macromolecule Crystallization Database (http://xpdb.nist.gov:8060/BMCD4/index.faces) and the Internet for purification, characterization, crystallization, and structural data, as these could provide useful insight, clues and answers, before beginning, as well as during crystallization efforts. Read, learn, and apply.
EpilogueIf no crystals form, dump the samples in the sink and curse the darkness.Alexander McPherson
References and Readings1. Optimization of crystallization conditions for biological macromol-
ecules. McPherson, A., Cudney, B. Acta Crystallogr F Struct Biol Com-mun. 2014 Nov;70(Pt 11):1445-67.
2. An investigation of protein crystallization parameters using succes-sive automated grid searches (SAGS). Cox, M. J. & Weber, P. C. J. Cryst. Growth, Volume 90, 318-324, (1988).
3. A protein crystallization strategy using automated grid searchers on successively finer grids. Patricia C. Weber. Methods: A Companion to Methods in Enzymology, Vol. 1, No. 1, August, 31-37, 1990.
4. Searching for silver bullets: An alternative strategy for crystallizing macromolecules. Alexander McPherson, Bob Cudney. Journal of Struc-tural Biology 156 (2006) 387–406.
5. The Role of Small Molecule Additives and Chemical Modification in Protein Crystallization. A. McPherson, C. Nguyen, R. Cudney, and S. B. Larson. Cryst. Growth Des., 2011, 11 (5), pp 1469–1474.
6. A comparison of salts for the crystallization of macromolecules. McPherson, A. (2001). Protein Sci. 10, 418–422.
7. Ions from the Hofmeister series and osmolytes: effects on proteins in solution and in the crystallization process. Collins, K. D. (2004). Meth-ods, 34, 300–311.
8. The Hofmeister effect and the behaviour of water at interfaces. Collins, K. D. & Washabaugh, M. W. (1985). Q. Rev. Biophys. 18, 323–422.
9. H.M. Berman, J. Westbrook, Z. Feng, G. Gilliland, T.N. Bhat, H. Weis-sig, I.N. Shindyalov, P.E. Bourne (2000) The Protein Data Bank Nucleic Acids Research, 28: 235-242.
10. The Biological Macromolecular Crystallization Database: A Tool for Developing Crystallization Strategies. Gary L. Gilliland and Dorothy M. Bickham. Methods, A Companion to Methods in Enzymol-ogy, Vol. 1, No. 1, August, pp. 6-11, 1990.
Solutions for Crystal Growth
Optimization
39
Crystal Growth 101 page 12
11. Biological Macromolecule Crystallization Database, Version 3.0: new features, data and the NASA archive for protein crystal growth data. Gilliland GL, Tung M, Blakeslee DM, Ladner JE. Acta Crystallogr D Biol Crystallogr. 1994 Jul 1;50(Pt 4):408-13.
12. The Bimolecular Crystallization Database version 4: expanded content and new features. Tung, M and Gallagher, DT. Acta Crystallographica D65, 18-23. 2009.
13. Crystallization of Old Yellow Enzyme illustrates an effective strategy for increasing protein crystal size. Fox KM, Karplus PA. J Mol Biol. 1993 Nov 20; 234(2):502-7.
14. Statistical design of experiments for protein crystal growth and the use of a precrystallization assay. Charles W. Carter Jr., Eric T. Baldwin, Lloyd Frick. Volume 90, Issues 1–3, 2 July 1988, Pages 60-73.
15. Efficiency analysis of sampling protocols used in protein crystallization screening. Brent W. Segelke. Journal of Crystal Growth, Volume 232, Issues 1-4, November 2001, 553-562.
16. Search designs for protein crystallization based on orthogonal arrays. Kingston RL, Baker HM, Baker EN. Acta Crystallogr D Biol Crystallogr. 1994 Jul 1;50(Pt 4):429-40.
17. Using sampling techniques in protein crystallization. Shieh HS, Stall-ings WC, Stevens AM, Stegeman RA. Acta Crystallogr D Biol Crystallogr. 1995 May 1;51(Pt 3):305-10.
18. The protein as a variable in protein crystallization. Dale GE, Oefner C, D’Arcy A. J Struct Biol. 2003 Apr;142(1):88-97.
19. D’Arcy, A., 1994. Crystallising proteins - A rational approach. Acta Crystallogr. D 50, 469–471.Screening and Optimization Strategies for Macromolecular Crystal Growth. Cudney, B., McPherson, A. Acta Cryst. (1994). D50, 414-423.
20. Mechanism of protein precipitation and stabilization by co-solvents. Timasheff, S.N., Arakawa, T., 1988. J. Cryst. Growth 90, 39–46.
21. Solubility as a function of protein structure and solvent components. Schein, C.H., 1990. Biotechnology (N Y) 8, 308–317.
22. Effects of naturally occurring osmolytes on protein stability and solu-bility: issues important in protein crystallization. Bolen, D.W., 2004. Methods 34, 312–322.
23. Ions from the Hofmeister series and osmolytes: effects on proteins in solution and in the crystallization process. Collins, K.D., 2004. Methods 34, 300–311.
24. Detergent phenomena in membrane protein crystallization. Zulauf, M., 1990. In: Michel, H. (Ed.), Crystallization of Membrane Proteins. CRC Press, Boca Raton, FL.
25. Non-detergent sulphobetaines: a new class of molecules that facilitate in vitro protein renaturation. Goldberg, M.E., Expert-Bezancon, N., Vuillard, L., Rabilloud, T., 1996. Fold Des. 1, 21–27.
26. Influence of divalent cations in protein crystallization. Trakhanov S, Quiocho FA. Protein Sci. 1995 Sep;4(9):1914-9.
27. The effects of ionic liquids on protein crystallization and X-ray dif-fraction resolution. Judge, R.A., Takahashi, S., Longnecker, K.L. Fry, E.H., Abad-Zapatero, C., and Chi, M.L. 2009. Crystal Growth & Design 9:3463-3469.
28. Searching for silver bullets: An alternative strategy for crystallizing macromolecules. Alexander McPherson and Bob Cudney. Journal of Structural Biology, 156, 2006, 386-406.
29. Allan D’Arcy, personal communication, 1989-2017.30. In situ proteolysis for protein crystallization and structure determina-
tion. Dong, A et al. Nature Methods - 4, 1019 - 1021 (2007).31. In Situ Proteolysis to Generate Crystals for Structure Determination:
An Update. Amy Wernimont, Aled Edwards. PLoS ONE 4(4): e5094. doi:10.1371/ journal.pone.0005094.
32. The use of in situ proteolysis in the crystallization of murine CstF-77. Tong et al. Acta Cryst. (2007). F63, 135-138.
33. A crystallizable form of the Streptococcus gordonii surface antigen SspB C-domain obtained by limited proteolysis. Forsgren et al. Acta Cryst. (2009). F65, 712–714.
34. Structural consequences of reductive methylation of lysine residues in hen egg white lysozyme: An X-ray analysis at 1.8 angstrom resolution. Rypniewski, W.R., Holden, H.M., and Rayment, I. (1993). Biochemistry 32, 9851-9858.
35. Reductive alkylation of lysine residues to alter crystallization proper-ties of proteins. Ivan Rayment. Methods in Enzymology, Volume 276, 171-179, (1997).
36. Large-scale evaluation of protein reductive methylation for improving protein crystallization. Kim et al. Nature Methods, Volume 5, Number 10, page 853-854, October 2008.
37. Lysine methylation as a routine rescue strategy for protein crystalliza-tion. Walter et al. Structure 14, 1617–1622, November 2006.
38. Chemical reagents for protein modification. Roger L. Lundbland. 3rd edition, CRC Press, 2005.
39. Crystallization of a soluble form of the rat Tcell surface glycoprotein CD4 complexed with Fab from the W3/25 monoclonal antibody. Davis, S.J., Brady, R.L., Barclay, A.N., Harlos, K., Dodson, G.G., Williams, A.F., 1990. J. Mol. Biol. 213, 7–10.
40. Structure at 2.7AA resolution of the Paracoccus denitrificans two-sub-unit cytochrome c oxidase complexed with an antibody FV fragment. Ostermeier, C., Harrenga, A., Ermler, U., Michel, H., 1997. Proc. Natl. Acad. Sci. USA 94, 10547–10553.
41. Preparation and crystallization of a human immunodeficiency virus p24–Fab complex. Prongay, A.J., Smith, T.J., Rossmann, M.G., Ehrlich, L.S., Carter, C.A., McClure, J., 1990. Protein Eng. 7, 933–939.
42. Promoting crystallization of antibody–antigen complexes via micro-seed matrix screening. Galina Obmolova, Thomas J. Malia, Alexey Teplyakov, Raymond Sweet, and Gary L. Gilliland. Acta Crystallogr D Biol Crystallogr. 2010 Aug 1; 66(Pt 8): 927–933.
Solutions for Crystal Growth
Optimization
40
Crystal Growth 101 page 13
43. Enzymatic deglycosylation as a tool for crystallization of mammalian binding proteins. Baker, H.M., Day, C.L., Norris, G.E., Baker, E.N., 1994. Acta Crystallogr. D 50, 380–384.
44. Deglycosylation of proteins for crystallization using recombinant fu-sion protein glycosidases. Gruenunger-Leitch, F., D’Arcy, A., D’Arcy, B., Chene, C., 1996. Protein Sci. 12, 2617–2622.
45. Crystal structure of phytase from Aspergillus ficuum at 2.5 Angstrom resolution. Kostrewa, D., Grueninger-Leitch, F., D Arcy, A., Broger, C., Mitchell, D., van Loon, A.P.G.M., 1997. Nat. Struct. Biol. 4, 185–190.
46. Structure of human neutral endopeptidase (Neprilysin) complexed with phosphoramidon. Oefner, C., D’Arcy, A., Hennig, M., Winkler, F.K., Dale, G.E., 2000. J. Mol. Biol. 296, 341–349.
47. Glycoprotein Structural Genomics: Solving the Glycosylation Problem. Veronica T. Chang,1 Max Crispin, A. Radu Aricescu, David J. Harvey, Joanne E. Nettleship, Janet A. Fennelly, Chao Yu, Kent S. Boles, Edward J. Evans, David I. Stuart, Raymond A. Dwek, E. Yvonne Jones, Raymond J. Owens, and Simon J. Davis. Structure. 2007 Mar; 15(3): 267–273.
48. Nature of contacts between protein molecules in crystal lattices and between subunits of protein oligomers. Dasgupta, S., Iyer, G.H., Bryant, S.H., Lawrence, C.E., Bell, J.A., 1997. Proteins 28, 494–514.
49. Solving the structure of human H ferritin by genetically engineering intermolecular crystal contacts. Lawson, D.M., Artymiuk, P.J., Yewdall, S.J., Smith, J.M., Livingstone, J.C., Treffry, A., Luzzago, A., Levi, S., Arosio, P., Cesareni, G., 1991. Nature 349, 541–544.
50. Studies on engineering crystallizability by mutation of surface residues of human thymidylate synthase. McElroy, H.E., Sisson, G.W., Schoettlin, W.E., Aust, R.M., Villafranca, J.E., 1992. J. Cryst. Growth 122, 265–272.
51. Crystal structure of the catalytic domain of HIV-1 integrase: similar-ity to other polynucleotidyl transferases. Dyda, F., Hickman, A.B., Jen-kins, T.M., Engelman, A., Craigie, R., Davies, D.R., 1994. Science 266, 1981–1986.
52. Crystal engineering: a case study using the24 kDa fragment of the DNA gyrase B subunit from Escherichia coli. D’Arcy, A., Stihle, M., Kostrewa, D.A., Dale, G., 1999. Acta Crystallogr. D 55, 1623–1625.
53. High-resolution structures of the ligand binding domain of the wild-type bacterial aspartate receptor. Yeh, J.I., Biemann, H.P., Prive, G.G., Pandit, J., Koshland Jr., D.E., Kim, S.H., 1996. J. Mol. Biol. 262, 186–201.
54. Structure and function of the Bacillus hybrid enzyme GluXyn-1: na-tive-like jellyroll fold preserved after insertion of autonomous globular domain. Ay, J., Gotz, F., Borriss, R., Heinemann, U., 1998. Proc. Natl. Acad. Sci. USA 95, 6613–6618.
55. Crystal structure of mammalian poly(A) polymerase in complex with an analog of ATP. Martin, G., Keller, W., Doublie, S., 2000. EMBO J. 19, 4193–4203.
56. Use of a fusion protein to obtain crystals suitable for X-ray analysis: crystallization of a GST-fused protein containing the DNA-binding do-main of DNA replication-related element-binding factor, DREF. Kuge,
M., Fujii, Y., Shimizu, T., Hirose, F., Matsukage, A., Hakoshima, T., 1997. Protein Sci. 6, 1783–1786.
57. Crystallization of a trimeric human T cell leukemia virus type 1 gp21 ectodomain fragment as a chimera with maltose-binding protein. Cen-ter, R.J., Kobe, B., Wilson, K.A., The, T., Howlett, G.J., Kemp, B.E., Poum-bourios, P., 1998. Protein Sci. 7, 1612–1619.
58. Fusion-protein-assisted protein crystallization. B. Kobe, T. Ve and S. J. Williams. Acta Cryst. (2015). F71, 861-869.
59. Protein crystallization by surface entropy reduction: optimization of the SER strategy. David R. Cooper, Tomasz Boczek, Katarzyna Grelews-ka, Malgorzata Pinkowska, Malgorzata Sikorska, Michal Zawadzki and Zygmunt Derewenda. Acta Cryst. (2007). D63, 636–645.
60. Rational Protein Crystallization Ways & Means by Mutational Surface Engineering. Zygmunt S. Derewenda. Structure, Vol. 12, 529–535, April, 2004.
61. The use of recombinant methods and molecular engineering in protein crystallization. Zygmunt S. Derewenda. Methods 34 (2004) 354–363.
62. Application of protein engineering to enhance crystallizability and im-prove crystal properties. Zygmunt S. Derewenda. Acta Cryst. (2010). D66, 604–615.
63. A synergistic approach to protein crystallization: Combination of a fixed arm carrier with surface entropy reduction. Protein Science, 2010, May, 19(5), 901-913.
64. High throughput crystallization screening for structural genomics and data mining. Segelke BW. 2000. American Crystallographic Association Annual Meeting, July 22-27, 2000, St.Paul, MN. ACA Meeting Series 27, 43.
65. A deliberate approach to screening for initial crystallization conditions of biological macromolecules. Luft JR, Collins RJ, Fehrman NA, Lauri-cella AM, Veatch CK, DeTitta GT. J Struct Biol. 2003 Apr;142(1):170-9.
66. Protein crystallization under high pressure. Suzuki Y, Sazaki G, Miyas-hita S, Sawada T, Tamura K, Komatsu H. Biochim Biophys Acta. 2002 Mar 25;1595(1-2):345-56.
67. A new method for protein crystallization using high pressure. Visuri K, Kaipainen E, Kivimäki J, Niemi H, Leisola M, Palosaari S. Biotechnol-ogy (N Y). 1990 Jun;8(6):547-9.
68. Investigations on protein crystal growth by the gel acupuncture meth-od. García-Ruiz JM, Morena A. Acta Crystallogr D Biol Crystallogr. 1994 Jul 1;50(Pt 4):484-90.
69. Crystallization of macromolecules in silica hydrogels. R. Cudney, S. Patel, and A. McPherson. Acta Cryst. (1994). D50, 479-483.
70. Bound-solvent structures for microgravity-, ground control-, gel- and microbatch-grown hen egg-white lysozyme crystals at 1.8 Å resolution. J. Dong, T. J. Boggon, N. E. Chayen, J. Raftery, R.-C. Bi and J. R. Helliwell. Acta Cryst. (1999). D55, 745-752.
Solutions for Crystal Growth
Optimization
41
Crystal Growth 101 page 14
71. Protein crystallization in a magnetic field. Da-Chuan Yin. Progress in Crystal Growth and Characterization of Materials. Volume 61, Issue 1, March 2015, Pages 1–26.
72. Improvement in Quality of Protein Crystals Grown in a High Magnetic Field Gradient. Akira Nakamura, Jun Ohtsuka, Ken-ichi Miyazono, Aki-hiro Yamamura, Keiko Kubota, Ryoichi Hirose, Noriyuki Hirota, Mitsuo Ataka, Yoriko Sawano, and Masaru Tanokura. Cryst. Growth Des., 2012, 12 (3), pp 1141–1150.
73. Control of effective gravity. Wakayama, N. I. JP Patent 3278685, 2002, and U.S. Patent 6596076, 2003.
74. Effects of a magnetic field on the nucleation and growth of protein crystals. Sazaki, G. Yoshida, E. Komatsu, H. Nakada, T. Miyashita, S. Watanabe, K. J. Cryst. Growth 1997, 173, 231−234.
75. Effects of a magnetic field on the growth rate of tetragonal lysozyme crystals. Yanagiya, S. Sazaki, G. Durbin, S. D. Miyashita, S. Nakajima, K. Komatsu, H. Watanabe, K. Motokawa, M. J. Cryst. Growth 2000, 208, 645−650.
76. Crystallization of proteins under an external electric field. M Taleb, C Didierjean, C Jelsch, J.P Mangeot, B Capelle, A Aubry. Journal of Crystal Growth, Volume 200, Issues 3–4, April 1999, Pages 575–582.
77. Crystallization of high-quality protein crystals using an external elec-tric field. H. Koizumi, S. Uda, K. Fujiwara, M. Tachibana, K. Kojima and J. Nozawa. J. Appl. Cryst. (2015). 48, 1507-1513.
78. Microgravity protein crystallization. Alexander McPherson and Law-rence James DeLucas. Microgravity 1, Article number: 15010 (2015).
79. Protein crystal growth in microgravity review of large scale tempera-ture induction method: bovine insulin, human insulin and human alpha interferon. Long MM, Bishop JB, Nagabhushan TL, Reichert P, Smith GD, DeLucas LJ. (1996) J Crystal Growth 168(1-4): 233-243. doi:10.1016/0022-0248(96)00325-9.
80. Macromolecular crystallization in microgravity. Edward H Snell and John R Helliwell. Reports of Progress in Physics, 68 (2005) 799-853.
81. Temperature dependent solubility of selected proteins. G.K. Christopher, A.G. Phipps, R.J. Gray. Journal of Crystal Growth 191 (1998) 820-826.
82. Variation of lysozyme solubility as a function of temperature in the presence of organic and inorganic salts. Jean-Pierre Guilloteau, Mad-eleine M. Rie`s-Kautt, Arnaud F. Ducruix. Journal of Crystal Growth Volume 122, Issues 1–4, 2 August 1992, Pages 223-230.
83. The Use of Organic Solvents at Low Temperature for the Separation of Enzymes. Application to Aqueous Rabbit Muscle Extract. Brigitte A. Askonas. Biochem J. 1951 Jan;48(1):42-8.
84. Crystallization of Biological Macromolecules. Alexander McPherson. Cold Spring Harbor Laboratory Press, 1999.
85. Efficient optimization of crystallization conditions by manipulation of drop volume ratio and temperature. Luft JR, Wolfley JR, Said MI, Nagel RM, Lauricella AM, Smith JL, Thayer MH, Veatch CK, Snell EH, Malkowski MG, Detitta GT. Protein Sci. 2007 Apr;16(4):715-22. Epub 2007 Feb 27.
86. A novel approach to crystallizing proteins with temperature induction method: GrpE protein from ¹hermus thermophiles. Ken Kitano, Ken Motohashi, Masasuke Yoshida, Kunio Miki. Journal of Crystal Growth 186 (1998) 456-460.
87. Influence of temperature during crystallization setup on precipitate formation and crystal shape of a metalloendopeptidase. Xenia Bogda-novic and Winfried Hinrichs. Acta Cryst. (2011). F67, 421–423.
88. Effect of mechanical vibration on protein crystallization. Q.-Q. Lu, D.-C. Yin, Y.-M. Liu, X.-K. Wang, P.-F. Yang, Z.-T. Liu and P. Shang. J. Appl. Cryst. (2010). 43, 473-482.
89. Improving Protein Crystal Quality via Mechanical Vibration. Qin-Qin Lu, Bin Zhang, Liang Tao, Lu Xu, Da Chen, Jing Zhu, and Da-Chuan Yin. Cryst. Growth Des., 2016, 16 (9), pp 4869–4876
90. Using natural seeding material to generate nucleation in protein crys-tallization experiments. D’Arcy A, Mac Sweeney A, Haber A. Acta Crystal-logr D Biol Crystallogr. 2003 Jul;59(Pt 7):1343-6. Epub 2003 Jun 27.
91. Improved Success of Sparse Matrix Protein Crystallization Screening with Heterogeneous Nucleating Agents. Anil S. Thakur, Gautier Robin, Gregor Guncar, Neil F. W. Saunders, Janet Newman, Jennifer L. Mar-tin, Bostjan Kobe. P. Plos One. 2007, http://dx.doi.org/10.1371/journal.pone.0001091.
92. Heterogeneous and epitaxial nucleation of protein crystals on mineral surfaces. McPherson A, Shlichta P. Science. 1988 Jan 22;239(4838):385-7.
93. Protein crystallization facilitated by molecularly imprinted polymers. Saridakis E, Khurshid S, Govada L, Phan Q, Hawkins D, Crichlow GV, Lolis E, Reddy SM, Chayen NE. Proc Natl Acad Sci U S A. 2011 Jul 5;108(27):11081-6. doi: 10.1073/pnas.1016539108. Epub 2011 Jun 20.
94. A simple procedure for removing contaminating aldehydes and perox-ides from aqueous solutions of polyethylene glycols and of nonionic detergents that are based on the polyoxyethylene linkage. William J. Ray, Jr. and Joseph M. Puvathingal. Analytical Biochemistry, Volume 146, Issue 2, 1 May 1985, Pages 307-312.
95. Effect of chemical impurities in polyethylene glycol on macromolecu-lar crystallization. Frances Jurnak. Journal of Crystal Growth, Volume 76, Issue 3, 2 August 1986, Pages 577-582.
96. Hampton Research Crystal Growth 101 – Polyethylene Glycol Stabil-ity, 2012. http://hamptonresearch.com/documents/growth_101/27.pdf
97. A macromolecular crystallization procedure employing diffusion cells of varying depths as reservoirs to tailor the time course of equilibration in hanging- and sitting-drop vapor-diffusion and microdialysis experi-ments. J. R. Luft, S. V. Arakali, M. J. Kirisits, J. Kalenik, I. Wawrzak, V. Cody, W. A. Pangborn and G. T. DeTitta (1994). J. Appl. Cryst. 27, 443-452.
98. Non-ideality of aqueous solutions of polyethylene glycol: consequences for its use as a macromolecular crystallizing agent in vapor-diffusion experiments. S. V. Arakali, J. R. Luft and G. T. DeTitta. (1995). Acta Cryst. D51. 780-785.
Solutions for Crystal Growth
Optimization
42
Crystal Growth 101 page 15
99. Single Crystals of Transfer RNA from Formylmethionine and Phenyala-nine Transfer RNA’s.Arnold Hempel et al. Science, New Series, Vol. 162, No. 3860 (Dec. 20, 1968), 1384-1387.
100. A modified vapor-diffusion crystallization protocol that uses a com-mon dehydrating agent. Dunlop & Hazes. Acta Cryst. (2005). D61, 1041-1048.
101. Expanding screening space through the use of alternative reservoirs in vapor-diffusion experiments. Janet Newman. Acta Cryst. (2005). D61, 490-493.
102. Two approaches to the rapid screening of crystallization conditions. Alexander McPherson. Journal of Crystal Growth, Volume 122, Issues 1–4, 2 August 1992, Pages 161-167.
103. The role of oil in macromolecular crystallization. Naomi E Chayen. Structure, Volume 5, Issue 10, p1269–1274, 15 October 1997.
104. Current approaches to macromolecular crystallization. Alexander McPherson, Eur. J. Biochem. 189, 1-23 (1990).
105. Optimization of salt concentration in PEG-based crystallization solu-tions. Mari Yamanaka, Koji Inaka, Naoki Furubayashi, Masaaki Mat-sushima, Sachiko Takahashi, Hiroaki Tanaka, Satoshi Sano, Masaru Sato, Tomoyuki Kobayashi and Tetsuo Tanaka. J. Synchrotron Rad. (2011). 18, 84–87.
106. Microseed matrix screening for optimization in protein crystallization: what have we learned? Allan D’Arcy, Terese Bergfors, Sandra W. Cowan-Jacob and May Marsh. Acta Cryst. (2014). F70, 1117–1126.
107. Thermofluor-based high-throughput stability optimization of proteins for structural studies. Ulrika B. Ericsson, B. Martin Hallberg, George T. DeTitta, Niek Dekker, Par Nordlund. Anal. Biochem. 357 (2006) 289–298.
108. Optimization of protein buffer cocktails using Thermofluor. Linda Re-inhard, Hubert Mayerhofer, Arie Geerlof, Jochen Mueller-Dieckmann, and Manfred S. Weiss. Acta Cryst. (2013). F69, 209–214.
109. Thermofluor-based optimization strategy for the stabilization and crystallization of Campylobacter jejuni desulforubrerythrin. Sandra P. Santos , Tiago M. Bandeiras, Ana F. Pinto, Miguel Teixeira, Maria A. Carrondo, Célia V. Romão. Protein Expression and Purification 81 (2012) 193–200.
110. Optimization of buffer solutions for protein crystallization. Rajen-drakumar A. Gosavi, Timothy C. Mueser and Constance A. Schall. Acta Cryst. (2008). D64, 506–514.
111. Development and characterization of an automated high throughput screening method for optimization of protein refolding processes. An-nette Berg, Stefan A. Oelmeier, Jorg Kittelmann, Florian Dismer, Jurgen Hubbuch. J. Sep. Sci. 2012, 00, 1–11.
112. Optimization of soluble protein crystallization with detergents. Rong-Jin Guan, Miao Wang, Xing-Qi Liu, Da-Cheng Wang. Journal of Crystal Growth 231 (2001) 273–279.
113. Crystallization of Proteins from Polyethylene Glycol. McPherson, A. The Journal of Biological Chemistry, Vol. 251, No. 20, Issue of October 25, pp. 6300-6303, 1976.
114. Polymeric precipitants for the crystallization of macromolecules. Sam Patel, Bob Cudney, Alex McPherson. Biochemical and Biophysical Re-search Communications. Vol. 207, No. 2, 819-828, 1995.
115. An Experiment Regarding Crystallization of Soluble Proteins in the Presence of Beta-Octyl Glucoside. Alexander McPherson, Stanley Ko-szelak, Herbert Axelrod, John Day, Roger Williams, Lindsay Robinson, Mary McGrath, and Duilio Cascio. The Journal of Biological Chemistry. Vol. 261, No. 4, Issue of February 5, Pp. 1969-1975,1986.
116. Progress in the development of an alternative approach to macromo-lecular crystallization. S.B. Larson, J.S. Day, C. Nguyen, R. Cudney, and A. McPherson. Cryst. Growth Des., 2008, 8 (8), pp 3038–3052.
117. Protein and Virus Crystal Growth on International Microgravity Labo-ratory-2. Stanley Koszelak, John Day, Cathy Leja, Robert Cudney, and Alexander McPherson. Biophysical Journal Volume 69 July 1995 13-19.
118. The Crystallization of Proteins, Nucleic Acids, and Viruses for X-ray Dif-fraction Analysis. Alexander McPherson, Bob Cudney, Sam Patel. Bio-polymers Online. 8. 2005.
119. Heterogeneous and epitxial nucleation of protein crystal on mineral surfaces. Alexander McPherson and Paul Schlichta. Science, Vol. 239, 385-387, 1988.
120. A brief history of crystal growth. Alexander McPherson, Journal of Crys-tal Growth, 110 (1991), 1-10.
121. Increasing the size of microcrystals by fine sampling of pH limits. Al-exander McPherson, J. Appl. Cryst. (1995). 28, 362-365.
122. Protein Crystallization, Techniques, Strategies, and Tips, A Laboratory Manual. Edited by Terese M. Bergfors. International University Line, 1999.
123. Protein Crystallization, Second Edition. Edited by Terese M. Bergfors. International University Line, 2009.
124. Preparation and Analysis of Protein Crystals. Alexander McPherson. Robert E. Krisger Publishing Company, 1982.
125. Crystallization of Nucleic Acids and Protein, A Practical Approach. Ed-ited by A. Ducruix and R. Giege. IRL Press at Oxford University Press, 1992.
126. Crystallization of Nucleic Acids and Protein, A Practical Approach. Sec-ond Edition. Edited by A. Ducruix and R. Giege. IRL Press at Oxford University Press, 1999.
127. Methods in Enzymology, Volume 276, Macromolecular Crystallogra-phy, Part A. Edited by Charles W. Carter, Jr. and Robert M. Sweet. Aca-demic Press, 1997.
128. Methods in Enzymology, Volume 22, Enzyme Purification and Related Techniques. Edited by William B. Jakoby. Academic Press, 1971.
129. Macromolecular Crystallization. Editor: Alexander McPherson. Meth-ods, Volume 34, Number 3, November 2004.
Solutions for Crystal Growth
Optimization
43
Crystal Growth 101 page 16
130. Macromolecular Crystallization in the Structural Genomics Era. Edi-tor: Alexander McPherson. Journal of Structural Biology, Special Issue. Volume 142, Number 1, April 2003.
131. Membrane Protein Purification and Crystallization, A Practical Guide. Edited by Carola Hunte, Gebhard von Jagow, and Hermann Schagger. Academic Press, Elsevier Science, 1994.
132. Crystalline Enzymes. Number XII of the Columbia Biological Series. John H. Northrop, Moses Kuntz, and Roger M. Herriott. Columbia Uni-versity Press, 1948.
133. Protein Crystallography. T.L. Blundell and L.N. Johnson. Academic Press, Harcourt Brace Jovanovich, Publishers, 1976.
134. Advances in Protein Chemistry. Edited by C.B. Anfinsen, John T. Edsall, Frederic M. Richards, and David S. Eisenberg. Volume 41, Academic Press, 1991.
135. Crystallization of Membrane Proteins. Hartmut Michel, Editor. CRC Press, 1991.
136. Protein and Nucleic Acid Crystallization. Charles W. Carter, Jr., Editor. Methods, A Companion to Methods in Enzymology. Volume 1, Number 1, August 1990.
137. Protein Crystallization and Dumb Luck. Bob Cudney. Rigaku Journal, Volume 16, Number 1, 1999.
Related ProductsHR2-140 PCT 50 ml bottles (4 ea), cover slides (1 pk)
HR2-142 PCT (with plates) 30 ml bottles (4 ea), cover slides (1 pk), VDX Plates with sealant (5 ea)
HR4-216 Crystal Crusher - 5 pack
HR8-133 Seeding Tool - 5 pack
HR2-320 Seed Bead Kit - 24 tubes with PTFE Seed Bead
HR4-780 Seed Bead Steel kit - 24 tubes with Steel Seed Beads
HR4-781 Seed Bead Ceramic kit - 24 tubes with Ceramic Seed Beads
HR4-782 Seed Bead Glass kit - 24 tubes with Glass Seed Beads
HR2-429 Proti-Ace™ - tube format
HR2-432 Proti-Ace™ 2 - tube format
HR2-434 Reductive Alkylation Kit - tube format
HR8-092 LM Agarose - 10 g bottle
HR2-310 Silica Hydrogel kit - 500 µl, 24 tubes
HR2-073 CryoPro - 1 ml, tube format
Solutions for Crystal Growth
Optimization
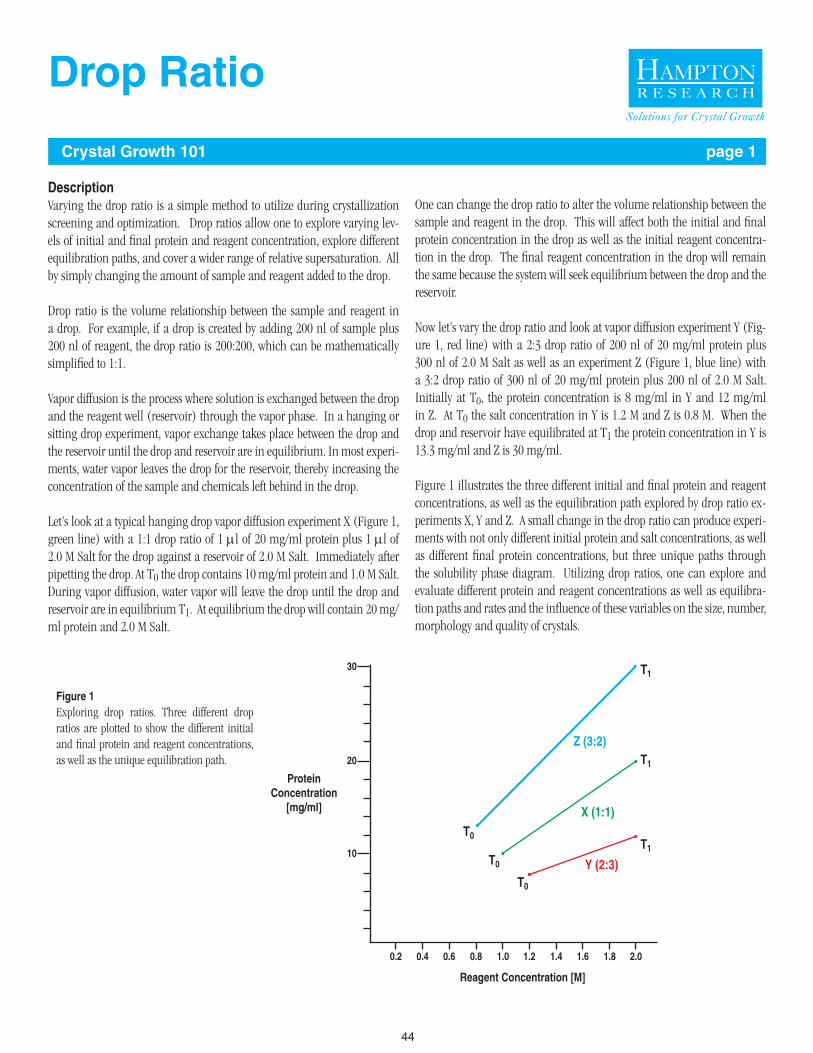
44
DescriptionVarying the drop ratio is a simple method to utilize during crystallization screening and optimization. Drop ratios allow one to explore varying lev-els of initial and final protein and reagent concentration, explore different equilibration paths, and cover a wider range of relative supersaturation. All by simply changing the amount of sample and reagent added to the drop.
Drop ratio is the volume relationship between the sample and reagent in a drop. For example, if a drop is created by adding 200 nl of sample plus 200 nl of reagent, the drop ratio is 200:200, which can be mathematically simplified to 1:1.
Vapor diffusion is the process where solution is exchanged between the drop and the reagent well (reservoir) through the vapor phase. In a hanging or sitting drop experiment, vapor exchange takes place between the drop and the reservoir until the drop and reservoir are in equilibrium. In most experi-ments, water vapor leaves the drop for the reservoir, thereby increasing the concentration of the sample and chemicals left behind in the drop.
Let’s look at a typical hanging drop vapor diffusion experiment X (Figure 1, green line) with a 1:1 drop ratio of 1 ml of 20 mg/ml protein plus 1 ml of 2.0 M Salt for the drop against a reservoir of 2.0 M Salt. Immediately after pipetting the drop. At T0 the drop contains 10 mg/ml protein and 1.0 M Salt. During vapor diffusion, water vapor will leave the drop until the drop and reservoir are in equilibrium T1. At equilibrium the drop will contain 20 mg/ml protein and 2.0 M Salt.
One can change the drop ratio to alter the volume relationship between the sample and reagent in the drop. This will affect both the initial and final protein concentration in the drop as well as the initial reagent concentra-tion in the drop. The final reagent concentration in the drop will remain the same because the system will seek equilibrium between the drop and the reservoir.
Now let’s vary the drop ratio and look at vapor diffusion experiment Y (Fig-ure 1, red line) with a 2:3 drop ratio of 200 nl of 20 mg/ml protein plus 300 nl of 2.0 M Salt as well as an experiment Z (Figure 1, blue line) with a 3:2 drop ratio of 300 nl of 20 mg/ml protein plus 200 nl of 2.0 M Salt. Initially at T0, the protein concentration is 8 mg/ml in Y and 12 mg/ml in Z. At T0 the salt concentration in Y is 1.2 M and Z is 0.8 M. When the drop and reservoir have equilibrated at T1 the protein concentration in Y is 13.3 mg/ml and Z is 30 mg/ml.
Figure 1 illustrates the three different initial and final protein and reagent concentrations, as well as the equilibration path explored by drop ratio ex-periments X, Y and Z. A small change in the drop ratio can produce experi-ments with not only different initial protein and salt concentrations, as well as different final protein concentrations, but three unique paths through the solubility phase diagram. Utilizing drop ratios, one can explore and evaluate different protein and reagent concentrations as well as equilibra-tion paths and rates and the influence of these variables on the size, number, morphology and quality of crystals.
Figure 1Exploring drop ratios. Three different drop ratios are plotted to show the different initial and final protein and reagent concentrations, as well as the unique equilibration path.
Reagent Concentration [M]
ProteinConcentration
[mg/ml]
Drop Ratio
Crystal Growth 101 page 1
Solutions for Crystal Growth
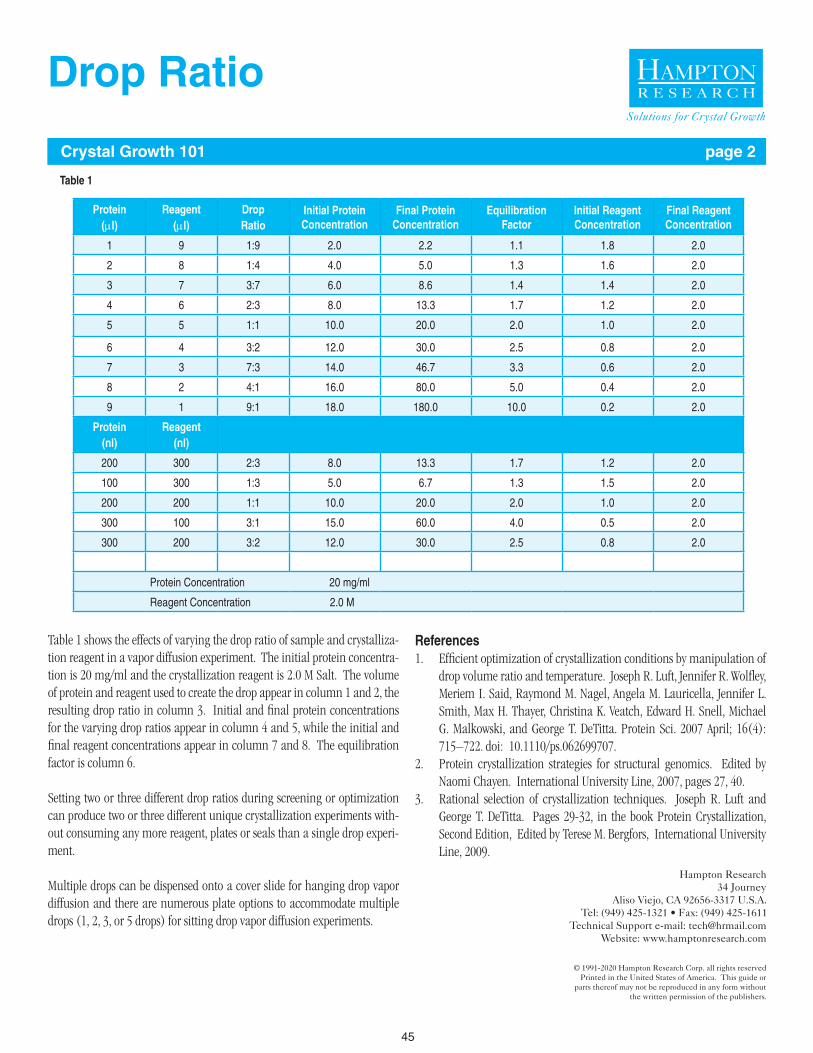
45
Table 1 shows the effects of varying the drop ratio of sample and crystalliza-tion reagent in a vapor diffusion experiment. The initial protein concentra-tion is 20 mg/ml and the crystallization reagent is 2.0 M Salt. The volume of protein and reagent used to create the drop appear in column 1 and 2, the resulting drop ratio in column 3. Initial and final protein concentrations for the varying drop ratios appear in column 4 and 5, while the initial and final reagent concentrations appear in column 7 and 8. The equilibration factor is column 6.
Setting two or three different drop ratios during screening or optimization can produce two or three different unique crystallization experiments with-out consuming any more reagent, plates or seals than a single drop experi-ment.
Multiple drops can be dispensed onto a cover slide for hanging drop vapor diffusion and there are numerous plate options to accommodate multiple drops (1, 2, 3, or 5 drops) for sitting drop vapor diffusion experiments.
References1. Efficient optimization of crystallization conditions by manipulation of
drop volume ratio and temperature. Joseph R. Luft, Jennifer R. Wolfley, Meriem I. Said, Raymond M. Nagel, Angela M. Lauricella, Jennifer L. Smith, Max H. Thayer, Christina K. Veatch, Edward H. Snell, Michael G. Malkowski, and George T. DeTitta. Protein Sci. 2007 April; 16(4): 715–722. doi: 10.1110/ps.062699707.
2. Protein crystallization strategies for structural genomics. Edited by Naomi Chayen. International University Line, 2007, pages 27, 40.
3. Rational selection of crystallization techniques. Joseph R. Luft and George T. DeTitta. Pages 29-32, in the book Protein Crystallization, Second Edition, Edited by Terese M. Bergfors, International University Line, 2009.
Protein(ml)
Reagent(ml)
DropRatio
Initial ProteinConcentration
Final ProteinConcentration
EquilibrationFactor
Initial Reagent Concentration
Final Reagent Concentration
1 9 1:9 2.0 2.2 1.1 1.8 2.0
2 8 1:4 4.0 5.0 1.3 1.6 2.0
3 7 3:7 6.0 8.6 1.4 1.4 2.0
4 6 2:3 8.0 13.3 1.7 1.2 2.0
5 5 1:1 10.0 20.0 2.0 1.0 2.0
6 4 3:2 12.0 30.0 2.5 0.8 2.0
7 3 7:3 14.0 46.7 3.3 0.6 2.0
8 2 4:1 16.0 80.0 5.0 0.4 2.0
9 1 9:1 18.0 180.0 10.0 0.2 2.0
Protein(nl)
Reagent(nl)
200 300 2:3 8.0 13.3 1.7 1.2 2.0
100 300 1:3 5.0 6.7 1.3 1.5 2.0
200 200 1:1 10.0 20.0 2.0 1.0 2.0
300 100 3:1 15.0 60.0 4.0 0.5 2.0
300 200 3:2 12.0 30.0 2.5 0.8 2.0
Protein Concentration 20 mg/ml
Reagent Concentration 2.0 M
Table 1
Drop Ratio
Crystal Growth 101 page 2
Solutions for Crystal Growth
46
Temperature as aCrystallization Variable Crystal Growth 101 page 1
Temperature and CrystallizationTemperature can be a significant variable in the crystallization of biologi-cal macromolecules (proteins).(1,5) Temperature often influences nucleation and crystal growth by manipulating the solubility and supersaturation of the sample. Temperature has also been shown to be an important variable with phase separation in detergent solutions during membrane protein crys-tallization.7
Control and manipulation of temperature during the screening, optimiza-tion and production of crystals is a prerequisite for successful and reproduc-ible crystal growth of proteins with temperature dependent solubility. Chris-topher et al., testing 30 randomly chosen proteins, found 86% demonstrated a temperature dependent solubility and suggested that temperature induced crystallization could be a generally useful technique.5 Temperature was shown to affect quantity, size, and quality of the crystals as well as sample solubility and preliminary crystallization data.
One advantage of temperature is that temperature provides precise, quick, and reversible control of relative supersaturation. Using temperature in ad-dition to standard crystallization variables such as sample concentration, re-agent composition and concentration, as well as pH can increase the proba-bility of producing crystals as well as uncover new crystallization conditions for a sample. Additional crystallization conditions may uncover reagent formulations more amicable to heavy atom derivatization, cryoprotection, and optimization or at least offer options. Temperature is amenable to con-trol and can be used to carefully manipulate crystal nucleation and growth. This control can also be used to etch or partially dissolve then grow back the crystal in an attempt to improve crystal size, morphology, and quality or assist with seeding. Temperature control is noninvasive and can manipulate sample solubility and crystallization with altering reagent formulation.
Traditionally, crystallization screens and experiments are performed at room temperature and sometimes 4 degrees Celsius. A reasonable range of temperature to screen and optimize for protein crystallization is 4 to 45 degrees Celsius and some proteins have been crystallized at 60 (glucagon and choriomammotropin) degrees Celsius. A practical strategy would be to screen at 10, 20 (or room temperature) and 30 degrees Celsius when the sample volume permits. Temperature incubations above room temperature should be monitored closely for evaporation from the drop and reservoir. A 2 microliter hanging drop vapor diffusion experiment at 37 degrees Celsius can evaporate in as little as 48 hours depending upon the plate, quality of seal. Microbatch under Paraffin Oil can minimize evaporation problems. In the case of room temperature incubations, temperature control and stability are often minimal since the experiments may be left in the open room. In an open room, temperature fluctuations may be significant, especially over a 24 hour period and on weekends when thermostatic control of the room environment can fluctuate 10 degrees or more. Incubation at 4 degrees Cel-sius and other temperatures are often more stable since the incubation is performed in some type of incubator. Another source of temperature fluctua-tion occurs while viewing experiments. The light microscope is a heat source and extended viewing can significantly alter the temperature of small drops.
Quick efficient viewing can minimize temperature changes. Also, remember to turn off the light source when leaving plates on the stage in one position for more than a few seconds.
While controlled temperature can be important for consistent results, tem-perature fluctuation can be useful in obtaining high quality crystals by screening a larger range of crystallization conditions since for a sample with temperature dependent solubility changes in temperature can equate to changes in a crystallization reagent condition.8 Hence, a sparse matrix screen takes on a new dimension when screened at multiple temperatures, or ramped over several different temperatures over a period of time.
How does one test for the effect of temperature and temperature dependent solubility without consuming a lot of sample? One solution is to set a single crystallization screen at one temperature, allow the experiment to incubate for a week, record the results and then move the plate to another tempera-ture. Allow the experiment to incubate for a week at the new temperature and record the results. If one notices changes in solubility (i.e. clear drop turning to precipitate, or precipitate turning to clear drops) between the two temperatures, then the sample has temperature dependent solubility and temperature should be explored as a crystallization variable.
Temperature gradients can be used for screening and optimization of proteins with temperature dependent solubility. For screening, set the ex-periment at one temperature, allow the experiment to equilibrate and then slowly change the temperature to a second temperature. In general, ramp the temperature so that the sample is exposed to an increase in relative su-persaturation as the temperature changes over time. In other words, ramp from high to low temperature if the sample is more soluble at high than low temperatures. This can be accomplished using a programmable tempera-ture incubator. A temperature gradient or ramp, allows one to slowly ap-proach temperatures where a sample may have a decrease in solubility with a corresponding increase in relative supersaturation. Published examples of temperature gradient or temperature ramp crystallization include elastase (25 to 20 degrees Celsius gradient), alpha-amylase (25 to 12 degrees Celsius gradient), and insulin (50 to 25 degrees Celsius gradient).(9,10,11)
To demonstrate how screening temperature could affect and enhance the results obtained from a preliminary crystallization screen, a programmable temperature incubator was used to screen 4 different temperatures. Using Glucose Isomerase and Crystal Screen, sitting drop vapor diffusion experi-ments were set using Cryschem plates at 4, 15, 25, and 37 degrees Celsius. Drops were observed daily and the results were quite interesting. Glucose Isomerase crystallized in 19 conditions at 25 degrees Celsius, 23 conditions at 15 degrees Celsius, 28 conditions at 4 degrees Celsius, and 12 conditions at 37 degrees Celsius. A similar approach with Trypsin, yielded crystals in 8 conditions at 15 degrees Celsius, 4 conditions at 25 degrees Celsius, and 7 conditions at 32 degrees Celsius. In the case of Trypsin, a single set of Cryschem plates were set and the plates simply moved from one tempera-ture to another over a period of a weeks time, scoring results before each temperature change.
Solutions for Crystal Growth
47
Temperature Tips• For proteins with “normal” solubility, in high salt the protein will be more soluble at cold than at warm temperatures.
• For proteins with “normal” solubility, in low salt the protein will be more soluble at warm than at cold temperatures.
• Proteins with “normal” solubility will precipitate or crystallize from lower concentration of PEG, MPD, or organic solvent more slowly at low than at high temperatures.
• Diffusion rates are less and equilibration occurs more slowly at low than at high temperatures. Crystallization may occur more slowly at low than at high temperatures.
• Temperature effects can be more pronounced at low ionic strength reagentconditions.
• Do not use the appearance or non-appearance of crystals at various tem-peratures to gauge the effectiveness of temperature as a crystallization variable. Rather, use the difference in the solubility at different temperatures to gauge the effect temperature has on sample solubility. If an effect is observed, explore temperature as a crystallization variable.
• Temperature can effect different crystal forms and growth mechanisms.12
• When incubating experiments below and above room temperature and view-ing experiments at room temperature, condensation can be a problem. To minimize and avoid condensation with vapor diffusion experiments, stack a “Dummy Plate” with reservoir filled with water and sealed, at the bottom and top of the stack of plates. This will slow the temperature change in the sand-wiched plates and minimize condensation.
• The Microbatch method works well for temperature exploration. In a tradi-tional Microbatch experiment, the relative supersaturation of the system does not change since, in theory there is no vapor diffusion. However, if the sample exhibits temperature dependent solubility, temperature can be used to manipu-late sample solubility in a Microbatch experiment. Another plus of using Micro-batch is the lack of condensation while viewing the experiment.
• Condensation with a hanging drop can mean alteration of your drop with the when the condensation mixes with the drop. Condensation with a sitting drop can mean there will be no mixing of the condensation with your drop, unless the condensation falls into the drop. Moral, sitting drop has less change for mixing with condensation.
• To dry up condensation, add a small amount of concentrated salt solution to the reservoir. Keep in mind this might also dry your drop a bit.
• Nucleic acid temperature stability allows one to examine temperatures be-tween 4 and 35 degrees Celsius.
• Ideally, one should set the experiment at the eventual incubation temperature and all reagents, samples, and plates should be equilibrated to the incubation temperature. This is a reality for room temperature setups and 4 degrees Celsius setups for those of us with cold rooms. For the rest of us, we can set the experi-ment at room temp and then toss it into the incubator. Or, for 4 degrees Celsius set ups, one can cheat. Simply incubate the reagents, sample, plates and slides in the refrigerator before set up. During the set up, place materials in a tray full of ice. Maintain the plates on ice during the set up. Seal and move smartly to the 4 degrees Celsius incubator.
• Increasing temperature increases the disorder of reagent molecules. Varying the temperature of a crystallization experiment can manipulate sample-sample as well as sample-reagent and reagent-reagent interactions. Such manipula-tions may have an impact on interactions which control nucleation and crystal growth. In addition, such interactions may have an impact on crystal packing as well as the termination of crystal growth. Hence, temperature can impact nucleation, growth, packing, and termination.
• Temperature can be a habit modifier and change the crystal lattice. For ex-ample, at temperatures below 25 degrees Celsius and in the presence of sodium chloride and acidic pH, the tetragonal form of lysozyme is favored. Under similar reagent conditions above 25 degrees Celsius, the orthorhombic form is favored.13
• The preparation of heavy atom isomorphous derivatives can depend upon the temperature of the experiment. In most cases, it seems the soak temperature is the same as the crystallization temperature.
References1. Giege, R., and Mikol, V., Trends in Biotechnology (1989) 7, 277.2. McPherson, A., European J. Biochemistry (1990) 189, 1.3. A. Ducruix and R. Giege, Editors, Crystallization of Nucleic Acids and Proteins: A Practical Approach, IRL Press at Oxford University Press, 1991.4. Lorber, B., and Giege, R., Journal of Crystal Growth (1992) 122, 168-175.5. Christopher, G.K., Phipps, A.G., and Gray, R.J., Journal of Crystal Growth (1998) 191, 820-826.6. Haser, R., et al., Journal of Crystal Growth (1992) 123, 109-120.7. Garavito, R.M., and Picot, D., Journal of Crystal Growth (1991) 110, 89.8. Drenth, J., Crystal Growth (1988) 90, 368.9. Shotton, D.M., Hartley, B.S., Camerman, H., Hofmann, T., Nyborg, S.C., and Rao, L., Journal of Molecular Biology (1968) 32, 155-156.10. McPherson, A., and Rich, A., Biochem. Biophys. Acta (1972) 285, 493-497.11. T.L. Blundell, and L.N. Johnson, Protein Crystallography, Academic Press (New York) 1976, 59-82 (method by Guy Dodson).12. A. McPherson, Crystallization of Biological Macromolecules, Cold Spring Harbor Laboratory Press, 1999.13. Ataka, M., and Tanaka, S., Biopolymers (1986) 25, 337.
Crystal Growth 101 page 2
Solutions for Crystal Growth
Temperature as aCrystallization Variable
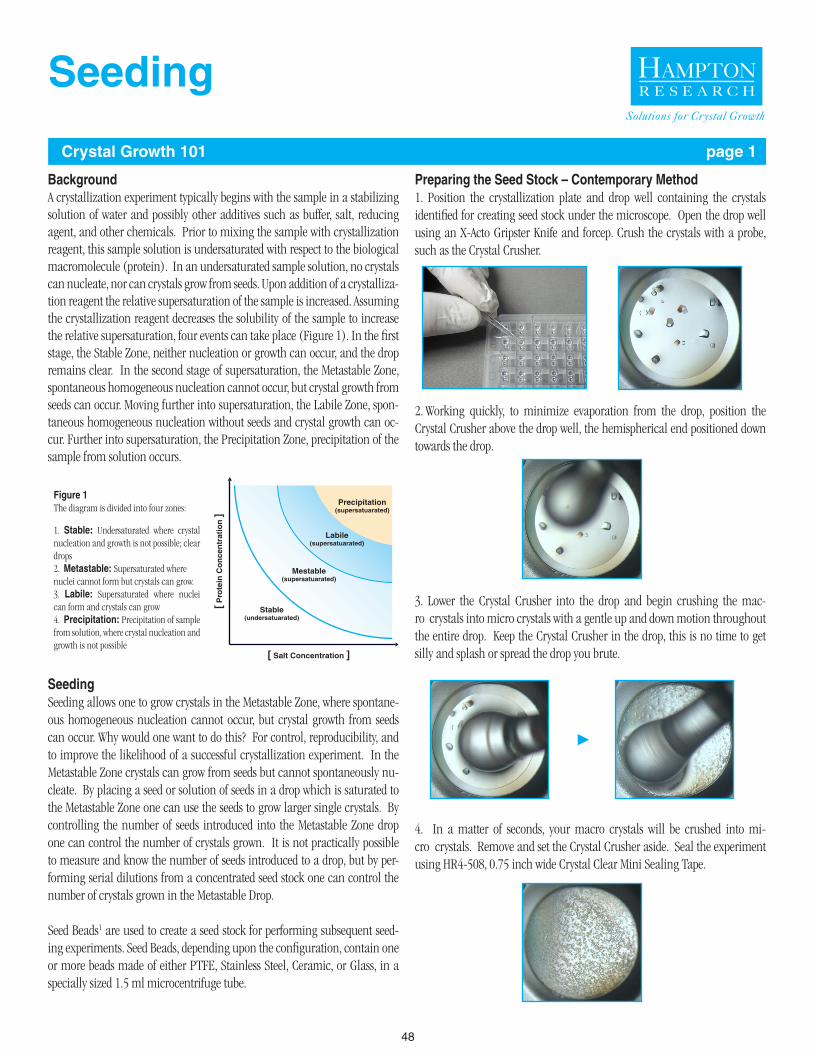
48
BackgroundA crystallization experiment typically begins with the sample in a stabilizing solution of water and possibly other additives such as buffer, salt, reducing agent, and other chemicals. Prior to mixing the sample with crystallization reagent, this sample solution is undersaturated with respect to the biological macromolecule (protein). In an undersaturated sample solution, no crystals can nucleate, nor can crystals grow from seeds. Upon addition of a crystalliza-tion reagent the relative supersaturation of the sample is increased. Assuming the crystallization reagent decreases the solubility of the sample to increase the relative supersaturation, four events can take place (Figure 1). In the first stage, the Stable Zone, neither nucleation or growth can occur, and the drop remains clear. In the second stage of supersaturation, the Metastable Zone, spontaneous homogeneous nucleation cannot occur, but crystal growth from seeds can occur. Moving further into supersaturation, the Labile Zone, spon-taneous homogeneous nucleation without seeds and crystal growth can oc-cur. Further into supersaturation, the Precipitation Zone, precipitation of the sample from solution occurs.
SeedingSeeding allows one to grow crystals in the Metastable Zone, where spontane-ous homogeneous nucleation cannot occur, but crystal growth from seeds can occur. Why would one want to do this? For control, reproducibility, and to improve the likelihood of a successful crystallization experiment. In the Metastable Zone crystals can grow from seeds but cannot spontaneously nu-cleate. By placing a seed or solution of seeds in a drop which is saturated to the Metastable Zone one can use the seeds to grow larger single crystals. By controlling the number of seeds introduced into the Metastable Zone drop one can control the number of crystals grown. It is not practically possible to measure and know the number of seeds introduced to a drop, but by per-forming serial dilutions from a concentrated seed stock one can control the number of crystals grown in the Metastable Drop.
Seed Beads1 are used to create a seed stock for performing subsequent seed-ing experiments. Seed Beads, depending upon the configuration, contain one or more beads made of either PTFE, Stainless Steel, Ceramic, or Glass, in a specially sized 1.5 ml microcentrifuge tube.
Preparing the Seed Stock – Contemporary Method1. Position the crystallization plate and drop well containing the crystals identified for creating seed stock under the microscope. Open the drop well using an X-Acto Gripster Knife and forcep. Crush the crystals with a probe, such as the Crystal Crusher.
2. Working quickly, to minimize evaporation from the drop, position the Crystal Crusher above the drop well, the hemispherical end positioned down towards the drop.
3. Lower the Crystal Crusher into the drop and begin crushing the mac-ro crystals into micro crystals with a gentle up and down motion throughout the entire drop. Keep the Crystal Crusher in the drop, this is no time to get silly and splash or spread the drop you brute.
4. In a matter of seconds, your macro crystals will be crushed into mi-cro crystals. Remove and set the Crystal Crusher aside. Seal the experiment using HR4-508, 0.75 inch wide Crystal Clear Mini Sealing Tape.
Solutions for Crystal Growth
Figure 1The diagram is divided into four zones:
1. Stable: Undersaturated where crystal nucleation and growth is not possible; clear drops2. Metastable: Supersaturated where nuclei cannot form but crystals can grow.3. Labile: Supersaturated where nuclei can form and crystals can grow4. Precipitation: Precipitation of sample from solution, where crystal nucleation and growth is not possible
►
Seeding
Crystal Growth 101 page 1
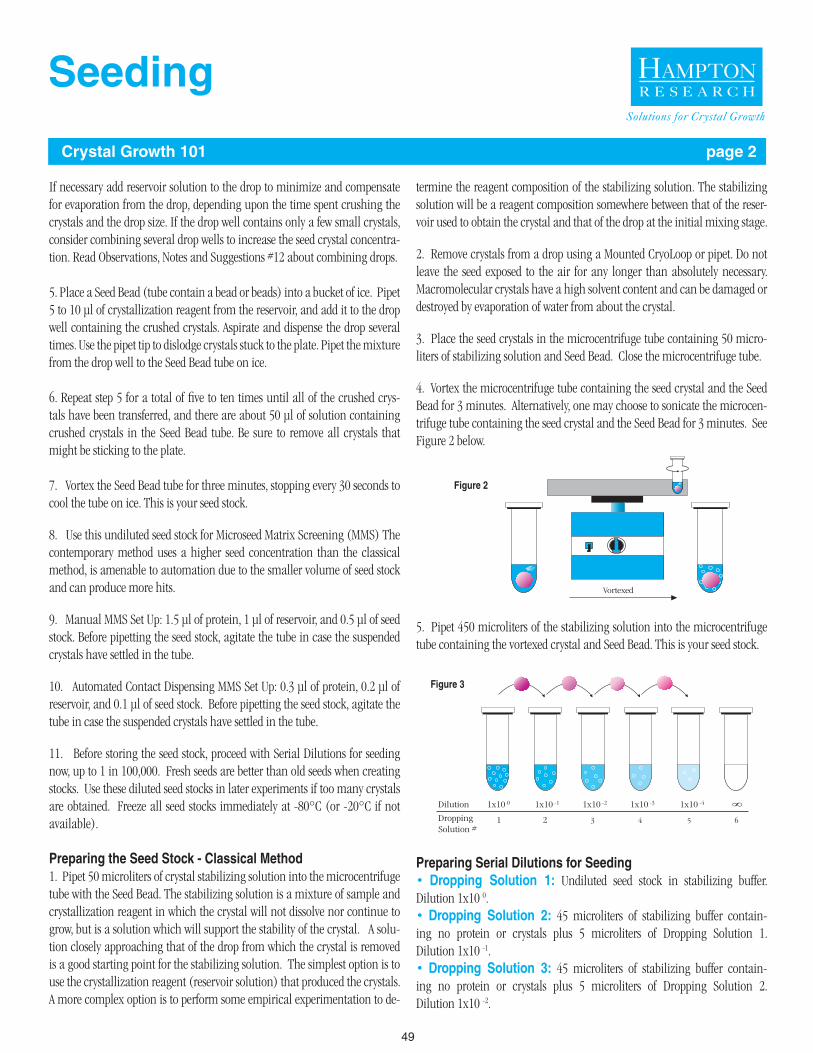
49
If necessary add reservoir solution to the drop to minimize and compensate for evaporation from the drop, depend ing upon the time spent crushing the crystals and the drop size. If the drop well contains only a few small crystals, consider combining several drop wells to increase the seed crystal concentra-tion. Read Observations, Notes and Sug gestions #12 about combining drops.
5. Place a Seed Bead (tube contain a bead or beads) into a bucket of ice. Pipet 5 to 10 μl of crystallization reagent from the reservoir, and add it to the drop well containing the crushed crystals. Aspirate and dispense the drop several times. Use the pipet tip to dislodge crystals stuck to the plate. Pipet the mixture from the drop well to the Seed Bead tube on ice.
6. Repeat step 5 for a total of five to ten times until all of the crushed crys-tals have been transferred, and there are about 50 μl of solution containing crushed crystals in the Seed Bead tube. Be sure to remove all crystals that might be sticking to the plate.
7. Vortex the Seed Bead tube for three minutes, stopping every 30 seconds to cool the tube on ice. This is your seed stock.
8. Use this undiluted seed stock for Microseed Matrix Screening (MMS) The contemporary method uses a higher seed concentration than the classical method, is amenable to automation due to the smaller volume of seed stock and can produce more hits.
9. Manual MMS Set Up: 1.5 µl of protein, 1 µl of reservoir, and 0.5 µl of seed stock. Before pipetting the seed stock, agitate the tube in case the suspended crystals have settled in the tube.
10. Automated Contact Dispensing MMS Set Up: 0.3 µl of protein, 0.2 µl of reservoir, and 0.1 µl of seed stock. Before pipetting the seed stock, agitate the tube in case the suspended crystals have settled in the tube.
11. Before storing the seed stock, proceed with Serial Dilutions for seeding now, up to 1 in 100,000. Fresh seeds are better than old seeds when creating stocks. Use these diluted seed stocks in later experiments if too many crystals are obtained. Freeze all seed stocks immediately at -80°C (or -20°C if not available).
Preparing the Seed Stock - Classical Method1. Pipet 50 microliters of crystal stabilizing solution into the microcen trifuge tube with the Seed Bead. The stabilizing solution is a mixture of sample and crystallization reagent in which the crystal will not dissolve nor continue to grow, but is a solution which will support the stability of the crystal. A solu-tion closely approaching that of the drop from which the crystal is removed is a good starting point for the stabilizing solution. The simplest option is to use the crystallization reagent (reservoir solution) that produced the crystals. A more complex option is to perform some empirical experimentation to de-
termine the reagent composition of the stabilizing solution. The stabilizing solution will be a reagent composition somewhere between that of the reser-voir used to obtain the crystal and that of the drop at the initial mixing stage.
2. Remove crystals from a drop using a Mounted CryoLoop or pipet. Do not leave the seed exposed to the air for any longer than absolutely necessary. Macromolecular crystals have a high solvent content and can be damaged or destroyed by evaporation of water from about the crystal.
3. Place the seed crystals in the microcentrifuge tube containing 50 micro-liters of stabilizing solution and Seed Bead. Close the microcentrifuge tube.
4. Vortex the microcentrifuge tube containing the seed crystal and the Seed Bead for 3 minutes. Alternatively, one may choose to sonicate the microcen-trifuge tube containing the seed crystal and the Seed Bead for 3 minutes. See Figure 2 below.
5. Pipet 450 microliters of the stabilizing solution into the microcentrifuge tube containing the vortexed crystal and Seed Bead. This is your seed stock.
Preparing Serial Dilutions for Seeding• Dropping Solution 1: Undiluted seed stock in stabilizing buffer. Dilution 1x10 0.• Dropping Solution 2: 45 microliters of stabilizing buffer contain-ing no protein or crystals plus 5 microliters of Dropping Solution 1. Dilution 1x10 -1.• Dropping Solution 3: 45 microliters of stabilizing buffer contain-ing no protein or crystals plus 5 microliters of Dropping Solution 2. Dilution 1x10 -2.
Solutions for Crystal Growth
Figure 3
Figure 2
Seeding
Crystal Growth 101 page 2
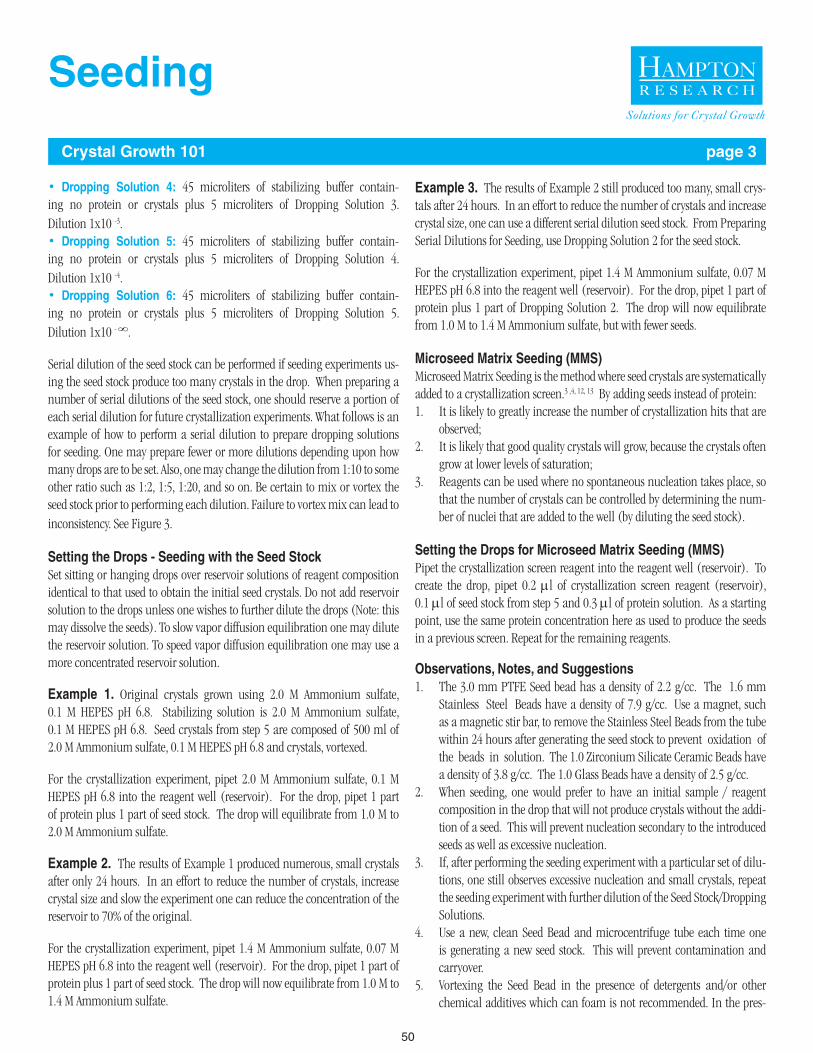
50
• Dropping Solution 4: 45 microliters of stabilizing buffer contain-ing no protein or crystals plus 5 microliters of Dropping Solution 3. Dilution 1x10 -3.• Dropping Solution 5: 45 microliters of stabilizing buffer contain-ing no protein or crystals plus 5 microliters of Dropping Solution 4. Dilution 1x10 -4.• Dropping Solution 6: 45 microliters of stabilizing buffer contain-ing no protein or crystals plus 5 microliters of Dropping Solution 5. Dilution 1x10 - .
Serial dilution of the seed stock can be performed if seeding experiments us-ing the seed stock produce too many crystals in the drop. When preparing a number of serial dilutions of the seed stock, one should reserve a portion of each serial dilution for future crystallization experiments. What follows is an example of how to perform a serial dilution to prepare dropping solutions for seeding. One may prepare fewer or more dilutions depending upon how many drops are to be set. Also, one may change the dilution from 1:10 to some other ratio such as 1:2, 1:5, 1:20, and so on. Be certain to mix or vortex the seed stock prior to performing each dilution. Failure to vortex mix can lead to inconsistency. See Figure 3.
Setting the Drops - Seeding with the Seed StockSet sitting or hanging drops over reservoir solutions of reagent com position identical to that used to obtain the initial seed crystals. Do not add reservoir solution to the drops unless one wishes to further dilute the drops (Note: this may dissolve the seeds). To slow vapor dif fusion equilibration one may dilute the reservoir solution. To speed vapor diffusion equilibration one may use a more concentrated res ervoir solution.
Example 1. Original crystals grown using 2.0 M Ammonium sulfate, 0.1 M HEPES pH 6.8. Stabilizing solution is 2.0 M Ammonium sulfate, 0.1 M HEPES pH 6.8. Seed crystals from step 5 are composed of 500 ml of 2.0 M Ammonium sulfate, 0.1 M HEPES pH 6.8 and crystals, vortexed.
For the crystallization experiment, pipet 2.0 M Ammonium sulfate, 0.1 M HEPES pH 6.8 into the reagent well (reservoir). For the drop, pipet 1 part of protein plus 1 part of seed stock. The drop will equilibrate from 1.0 M to 2.0 M Ammonium sulfate.
Example 2. The results of Example 1 produced numerous, small crystals after only 24 hours. In an effort to reduce the number of crystals, increase crystal size and slow the experiment one can reduce the concentration of the reservoir to 70% of the original.
For the crystallization experiment, pipet 1.4 M Ammonium sulfate, 0.07 M HEPES pH 6.8 into the reagent well (reservoir). For the drop, pipet 1 part of protein plus 1 part of seed stock. The drop will now equilibrate from 1.0 M to 1.4 M Ammonium sulfate.
Example 3. The results of Example 2 still produced too many, small crys-tals after 24 hours. In an effort to reduce the number of crystals and increase crystal size, one can use a different serial dilution seed stock. From Preparing Serial Dilutions for Seeding, use Dropping Solution 2 for the seed stock.
For the crystallization experiment, pipet 1.4 M Ammonium sulfate, 0.07 M HEPES pH 6.8 into the reagent well (reservoir). For the drop, pipet 1 part of protein plus 1 part of Dropping Solution 2. The drop will now equilibrate from 1.0 M to 1.4 M Ammonium sulfate, but with fewer seeds.
Microseed Matrix Seeding (MMS)Microseed Matrix Seeding is the method where seed crystals are systematically added to a crystallization screen.3 ,4, 12, 13 By adding seeds instead of protein: 1. It is likely to greatly increase the number of crystallization hits that are
observed; 2. It is likely that good quality crystals will grow, because the crystals often
grow at lower levels of saturation; 3. Reagents can be used where no spontaneous nucleation takes place, so
that the number of crystals can be controlled by determining the num-ber of nuclei that are added to the well (by diluting the seed stock).
Setting the Drops for Microseed Matrix Seeding (MMS)Pipet the crystallization screen reagent into the reagent well (reservoir). To create the drop, pipet 0.2 ml of crystallization screen reagent (reservoir), 0.1 ml of seed stock from step 5 and 0.3 ml of protein solution. As a starting point, use the same protein concentration here as used to produce the seeds in a previous screen. Repeat for the remaining reagents.
Observations, Notes, and Suggestions1. The 3.0 mm PTFE Seed bead has a density of 2.2 g/cc. The 1.6 mm
Stainless Steel Beads have a density of 7.9 g/cc. Use a magnet, such as a magnetic stir bar, to remove the Stainless Steel Beads from the tube within 24 hours after generating the seed stock to prevent oxidation of the beads in solution. The 1.0 Zirconium Silicate Ceramic Beads have a density of 3.8 g/cc. The 1.0 Glass Beads have a density of 2.5 g/cc.
2. When seeding, one would prefer to have an initial sample / reagent composition in the drop that will not produce crystals without the addi-tion of a seed. This will prevent nucleation secondary to the introduced seeds as well as excessive nucleation.
3. If, after performing the seeding experiment with a particular set of dilu-tions, one still observes excessive nucleation and small crystals, repeat the seeding experiment with further dilution of the Seed Stock/Dropping Solutions.
4. Use a new, clean Seed Bead and microcentrifuge tube each time one is generating a new seed stock. This will prevent contamination and carryover.
5. Vortexing the Seed Bead in the presence of detergents and/or other chemical additives which can foam is not recommended. In the pres-
Solutions for Crystal Growth
Seeding
Crystal Growth 101 page 3
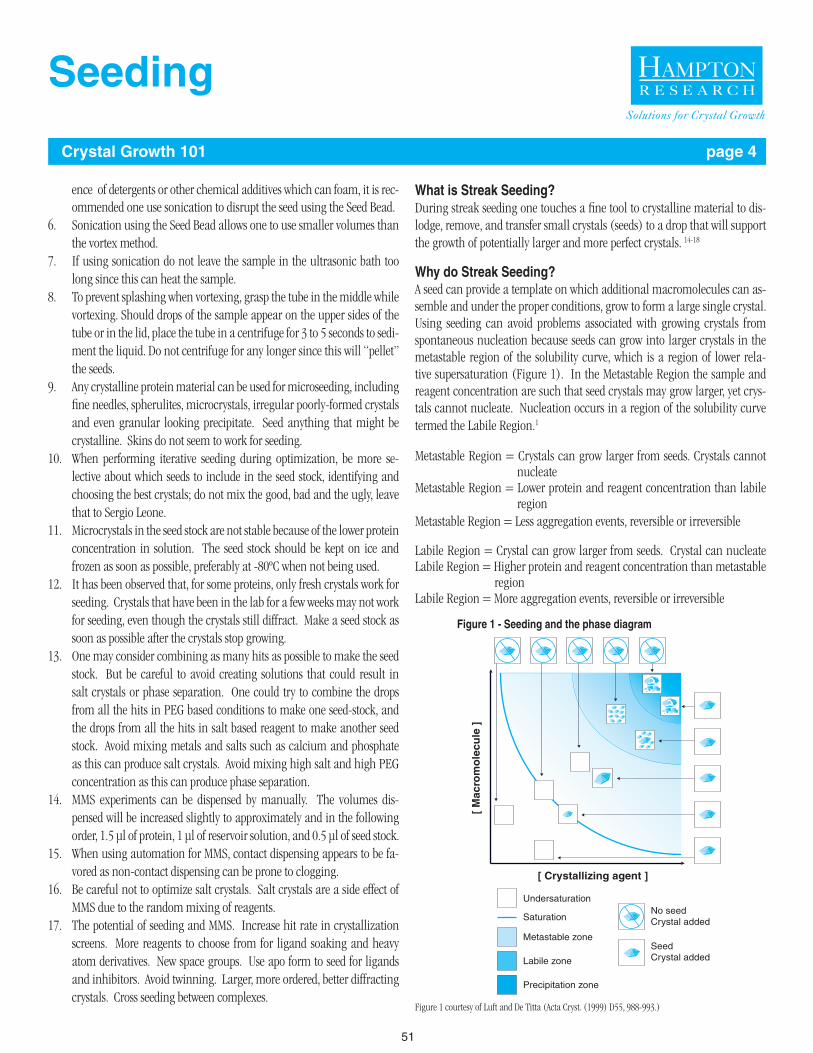
51
ence of detergents or other chemical additives which can foam, it is rec-ommended one use sonication to disrupt the seed using the Seed Bead.
6. Sonication using the Seed Bead allows one to use smaller volumes than the vortex method.
7. If using sonication do not leave the sample in the ultrasonic bath too long since this can heat the sample.
8. To prevent splashing when vortexing, grasp the tube in the middle while vortexing. Should drops of the sample appear on the upper sides of the tube or in the lid, place the tube in a centrifuge for 3 to 5 seconds to sedi-ment the liquid. Do not centrifuge for any longer since this will “pellet” the seeds.
9. Any crystalline protein material can be used for microseeding, including fine needles, spherulites, microcrystals, irregular poorly-formed crystals and even granular looking precipitate. Seed anything that might be crystalline. Skins do not seem to work for seeding.
10. When performing iterative seeding during optimization, be more se-lective about which seeds to include in the seed stock, identifying and choosing the best crystals; do not mix the good, bad and the ugly, leave that to Sergio Leone.
11. Microcrystals in the seed stock are not stable because of the lower protein concentration in solution. The seed stock should be kept on ice and frozen as soon as possible, preferably at -80ºC when not being used.
12. It has been observed that, for some proteins, only fresh crystals work for seeding. Crystals that have been in the lab for a few weeks may not work for seeding, even though the crystals still diffract. Make a seed stock as soon as possible after the crystals stop growing.
13. One may consider combining as many hits as possible to make the seed stock. But be careful to avoid creating solutions that could result in salt crystals or phase separation. One could try to combine the drops from all the hits in PEG based conditions to make one seed-stock, and the drops from all the hits in salt based reagent to make another seed stock. Avoid mixing metals and salts such as calcium and phosphate as this can produce salt crystals. Avoid mixing high salt and high PEG concentration as this can produce phase separation.
14. MMS experiments can be dispensed by manually. The volumes dis-pensed will be increased slightly to approximately and in the following order, 1.5 µl of protein, 1 µl of reservoir solution, and 0.5 µl of seed stock.
15. When using automation for MMS, contact dispensing appears to be fa-vored as non-contact dispensing can be prone to clogging.
16. Be careful not to optimize salt crystals. Salt crystals are a side effect of MMS due to the random mixing of reagents.
17. The potential of seeding and MMS. Increase hit rate in crystallization screens. More reagents to choose from for ligand soaking and heavy atom derivatives. New space groups. Use apo form to seed for ligands and inhibitors. Avoid twinning. Larger, more ordered, better diffracting crystals. Cross seeding between complexes.
What is Streak Seeding?During streak seeding one touches a fine tool to crystalline material to dis-lodge, remove, and transfer small crystals (seeds) to a drop that will support the growth of potentially larger and more perfect crystals. 14-18
Why do Streak Seeding?A seed can provide a template on which additional macromolecules can as-semble and under the proper conditions, grow to form a large single crystal. Using seeding can avoid problems associated with growing crystals from spontaneous nucleation because seeds can grow into larger crystals in the metastable region of the solubility curve, which is a region of lower rela-tive supersaturation (Figure 1). In the Metastable Region the sample and reagent concentration are such that seed crystals may grow larger, yet crys-tals cannot nucleate. Nucleation occurs in a region of the solubility curve termed the Labile Region.1
Metastable Region = Crystals can grow larger from seeds. Crystals cannot nucleateMetastable Region = Lower protein and reagent concentration than labile regionMetastable Region = Less aggregation events, reversible or irreversible
Labile Region = Crystal can grow larger from seeds. Crystal can nucleateLabile Region = Higher protein and reagent concentration than metastable regionLabile Region = More aggregation events, reversible or irreversible
Figure 1 courtesy of Luft and De Titta (Acta Cryst. (1999) D55, 988-993.)
Solutions for Crystal Growth
[ M
acro
mo
lecu
le ]
[ Crystallizing agent ]
Undersaturation
Saturation
Metastable zone
Labile zone
Precipitation zone
No seedCrystal added
SeedCrystal added
Figure 1 - Seeding and the phase diagram
Seeding
Crystal Growth 101 page 4
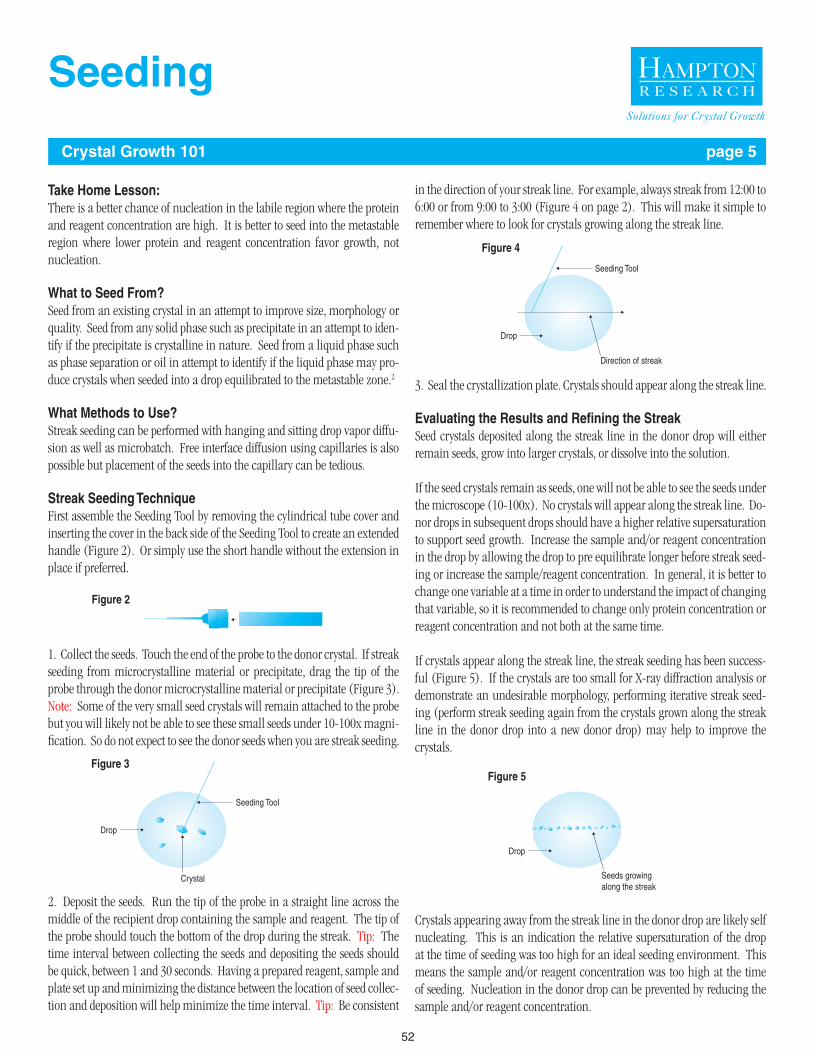
52
Take Home Lesson:There is a better chance of nucleation in the labile region where the protein and reagent concentration are high. It is better to seed into the metastable region where lower protein and reagent concentration favor growth, not nucleation.
What to Seed From?Seed from an existing crystal in an attempt to improve size, morphology or quality. Seed from any solid phase such as precipitate in an attempt to iden-tify if the precipitate is crystalline in nature. Seed from a liquid phase such as phase separation or oil in attempt to identify if the liquid phase may pro-duce crystals when seeded into a drop equilibrated to the metastable zone.2
What Methods to Use?Streak seeding can be performed with hanging and sitting drop vapor diffu-sion as well as microbatch. Free interface diffusion using capillaries is also possible but placement of the seeds into the capillary can be tedious.
Streak Seeding TechniqueFirst assemble the Seeding Tool by removing the cylindrical tube cover and inserting the cover in the back side of the Seeding Tool to create an extended handle (Figure 2). Or simply use the short handle without the extension in place if preferred.
1. Collect the seeds. Touch the end of the probe to the donor crystal. If streak seeding from microcrystalline material or precipitate, drag the tip of the probe through the donor microcrystalline material or precipitate (Figure 3). Note: Some of the very small seed crystals will remain attached to the probe but you will likely not be able to see these small seeds under 10-100x magni-fication. So do not expect to see the donor seeds when you are streak seeding.
2. Deposit the seeds. Run the tip of the probe in a straight line across the middle of the recipient drop containing the sample and reagent. The tip of the probe should touch the bottom of the drop during the streak. Tip: The time interval between collecting the seeds and depositing the seeds should be quick, between 1 and 30 seconds. Having a prepared reagent, sample and plate set up and minimizing the distance between the location of seed collec-tion and deposition will help minimize the time interval. Tip: Be consistent
in the direction of your streak line. For example, always streak from 12:00 to 6:00 or from 9:00 to 3:00 (Figure 4 on page 2). This will make it simple to remember where to look for crystals growing along the streak line.
3. Seal the crystallization plate. Crystals should appear along the streak line.
Evaluating the Results and Refining the StreakSeed crystals deposited along the streak line in the donor drop will either remain seeds, grow into larger crystals, or dissolve into the solution.
If the seed crystals remain as seeds, one will not be able to see the seeds under the microscope (10-100x). No crystals will appear along the streak line. Do-nor drops in subsequent drops should have a higher relative supersaturation to support seed growth. Increase the sample and/or reagent concentration in the drop by allowing the drop to pre equilibrate longer before streak seed-ing or increase the sample/reagent concentration. In general, it is better to change one variable at a time in order to understand the impact of changing that variable, so it is recommended to change only protein concentration or reagent concentration and not both at the same time.
If crystals appear along the streak line, the streak seeding has been success-ful (Figure 5). If the crystals are too small for X-ray diffraction analysis or demonstrate an undesirable morphology, performing iterative streak seed-ing (perform streak seeding again from the crystals grown along the streak line in the donor drop into a new donor drop) may help to improve the crystals.
Crystals appearing away from the streak line in the donor drop are likely self nucleating. This is an indication the relative supersaturation of the drop at the time of seeding was too high for an ideal seeding environment. This means the sample and/or reagent concentration was too high at the time of seeding. Nucleation in the donor drop can be prevented by reducing the sample and/or reagent concentration.
Solutions for Crystal Growth
Figure 2
Seeding Tool
Crystal
Drop
Figure 3
Seeding Tool
Drop
Direction of streak
Figure 4
Figure 5
Drop
Seeds growingalong the streak
Seeding
Crystal Growth 101 page 5
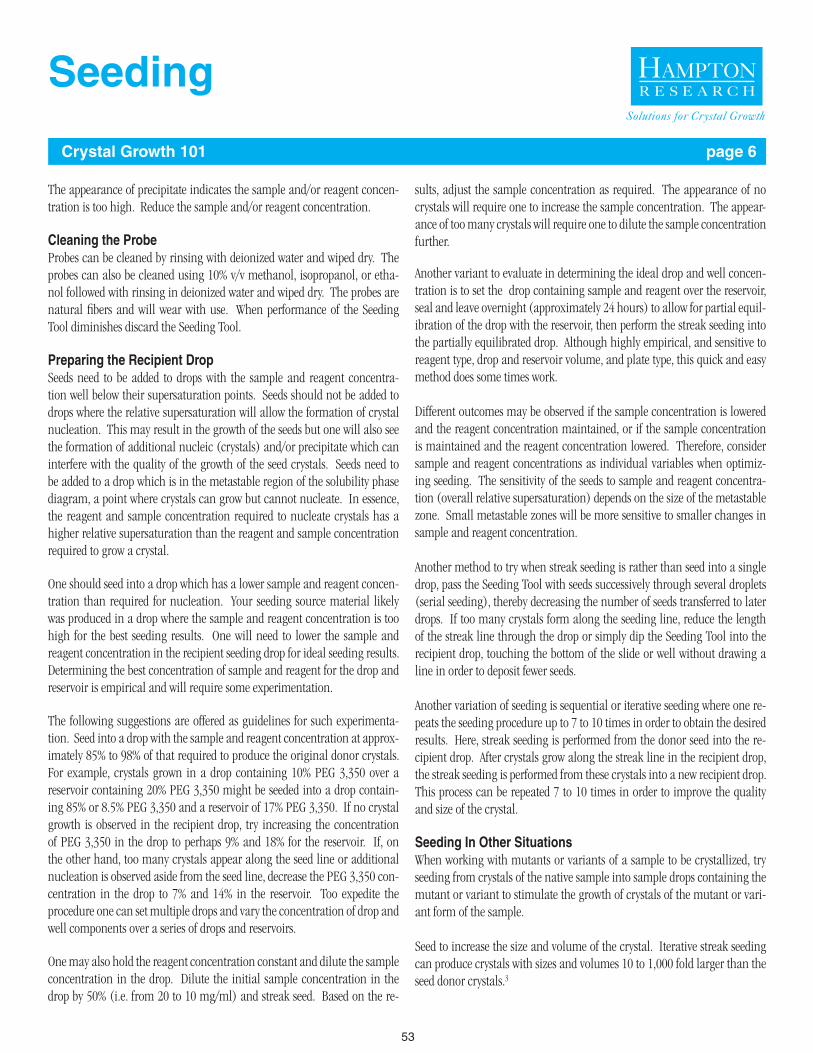
53
The appearance of precipitate indicates the sample and/or reagent concen-tration is too high. Reduce the sample and/or reagent concentration.
Cleaning the ProbeProbes can be cleaned by rinsing with deionized water and wiped dry. The probes can also be cleaned using 10% v/v methanol, isopropanol, or etha-nol followed with rinsing in deionized water and wiped dry. The probes are natural fibers and will wear with use. When performance of the Seeding Tool diminishes discard the Seeding Tool.
Preparing the Recipient DropSeeds need to be added to drops with the sample and reagent concentra-tion well below their supersaturation points. Seeds should not be added to drops where the relative supersaturation will allow the formation of crystal nucleation. This may result in the growth of the seeds but one will also see the formation of additional nucleic (crystals) and/or precipitate which can interfere with the quality of the growth of the seed crystals. Seeds need to be added to a drop which is in the metastable region of the solubility phase diagram, a point where crystals can grow but cannot nucleate. In essence, the reagent and sample concentration required to nucleate crystals has a higher relative supersaturation than the reagent and sample concentration required to grow a crystal.
One should seed into a drop which has a lower sample and reagent concen-tration than required for nucleation. Your seeding source material likely was produced in a drop where the sample and reagent concentration is too high for the best seeding results. One will need to lower the sample and reagent concentration in the recipient seeding drop for ideal seeding results. Determining the best concentration of sample and reagent for the drop and reservoir is empirical and will require some experimentation.
The following suggestions are offered as guidelines for such experimenta-tion. Seed into a drop with the sample and reagent concentration at approx-imately 85% to 98% of that required to produce the original donor crystals. For example, crystals grown in a drop containing 10% PEG 3,350 over a reservoir containing 20% PEG 3,350 might be seeded into a drop contain-ing 85% or 8.5% PEG 3,350 and a reservoir of 17% PEG 3,350. If no crystal growth is observed in the recipient drop, try increasing the concentration of PEG 3,350 in the drop to perhaps 9% and 18% for the reservoir. If, on the other hand, too many crystals appear along the seed line or additional nucleation is observed aside from the seed line, decrease the PEG 3,350 con-centration in the drop to 7% and 14% in the reservoir. Too expedite the procedure one can set multiple drops and vary the concentration of drop and well components over a series of drops and reservoirs.
One may also hold the reagent concentration constant and dilute the sample concentration in the drop. Dilute the initial sample concentration in the drop by 50% (i.e. from 20 to 10 mg/ml) and streak seed. Based on the re-
sults, adjust the sample concentration as required. The appearance of no crystals will require one to increase the sample concentration. The appear-ance of too many crystals will require one to dilute the sample concentration further.
Another variant to evaluate in determining the ideal drop and well concen-tration is to set the drop containing sample and reagent over the reservoir, seal and leave overnight (approximately 24 hours) to allow for partial equil-ibration of the drop with the reservoir, then perform the streak seeding into the partially equilibrated drop. Although highly empirical, and sensitive to reagent type, drop and reservoir volume, and plate type, this quick and easy method does some times work.
Different outcomes may be observed if the sample concentration is lowered and the reagent concentration maintained, or if the sample concentration is maintained and the reagent concentration lowered. Therefore, consider sample and reagent concentrations as individual variables when optimiz-ing seeding. The sensitivity of the seeds to sample and reagent concentra-tion (overall relative supersaturation) depends on the size of the metastable zone. Small metastable zones will be more sensitive to smaller changes in sample and reagent concentration.
Another method to try when streak seeding is rather than seed into a single drop, pass the Seeding Tool with seeds successively through several droplets (serial seeding), thereby decreasing the number of seeds transferred to later drops. If too many crystals form along the seeding line, reduce the length of the streak line through the drop or simply dip the Seeding Tool into the recipient drop, touching the bottom of the slide or well without drawing a line in order to deposit fewer seeds.
Another variation of seeding is sequential or iterative seeding where one re-peats the seeding procedure up to 7 to 10 times in order to obtain the desired results. Here, streak seeding is performed from the donor seed into the re-cipient drop. After crystals grow along the streak line in the recipient drop, the streak seeding is performed from these crystals into a new recipient drop. This process can be repeated 7 to 10 times in order to improve the quality and size of the crystal.
Seeding In Other SituationsWhen working with mutants or variants of a sample to be crystallized, try seeding from crystals of the native sample into sample drops containing the mutant or variant to stimulate the growth of crystals of the mutant or vari-ant form of the sample.
Seed to increase the size and volume of the crystal. Iterative streak seeding can produce crystals with sizes and volumes 10 to 1,000 fold larger than the seed donor crystals.3
Solutions for Crystal Growth
Seeding
Crystal Growth 101 page 6

54
Using the Seeding Tool, stir old drops with precipitate but no crystals to see if the kinetic energy of the mixing or disruption of the precipitate can induce nucleation and crystal growth.
When no crystals can be grown after exhaustive screening, streak seed from drops with precipitate into clear drops. Desperate times call for desperate measures.
Try streak seeding from bundles of crystals or needle crystals to change the crystal morphology.
Try streak seeding and at the same time evaluate different additives in the sample drop. Additives to consider include salts, polyols, divalent cations, detergents, chaotropes, organic solvents, ligands and co-factors.
If one experiences repeated dissolution of seeds no matter how the reagent and sample concentration are varied, try cross linking the seeds or donor crystals with glutaraldehyde before steak seeding to see if cross linking the crystal will prevent crystal dissolution.
Streak Seeding Lab Exercise17
The following exercise will demonstrate the streak seeding technique and also allow one to observe the effect of decreasing sample concentration on the nucleation rate.
Materials • Seeding Tool• Lysozyme stock. Make fresh the day of the experiment.
100 mg/ml in 0.1 M Sodium acetate trihydrate pH 4.6• Crystallization Reagent: 30% PEG 3,350, 1.0 M Sodium chloride,
0.1 M Sodium acetate trihydrate pH 4.6.• Siliconized cover slides and VDX Plate with sealant or your favorite crystallization plate.
Procedure1. On a siliconized cover slide pipet 10 microliters of 100 mg/ml lysozyme and 10 microliters of Crystallization Reagent. Pipet the lysozyme then the reagent. Gently aspirate and dispense the drop 5 to 10 times to mix the viscous crystallization reagent with the sample. Avoid making bubbles and denaturing the protein. Keep the tip in the drop during aspiration and dis-pensing.
2. Crystals will nucleate in 5 to 15 minutes. A freshly prepared stock of lysozyme will take longer to crystallize than an old stock. If the lysozyme precipitates immediately and does not solubilize with mixing, dilute the ly-sozyme stock to 80 mg/ml with 0.1 M Sodium acetate pH 4.6 and repeat step 1. If the lysozyme still precipitates immediately and does not solubilize with mixing, dilute the lysozyme stock to 60 mg/ml with 0.1 M Sodium acetate trihydrate pH 4.6 and repeat step 1.
3. To evaluate the effect of protein concentration on nucleation rate as well as the size and number of crystals perform the following experiment. Dilute the 100 mg/ml lysozyme stock to create stocks of 80, 60, 40, 20 and 10 mg/ml (Table 1 below).
Set two experiments for each of the six concentration of lysozyme. In the first set of experiments using 100, 80, 60, 40, 20 and 10 mg/ml lysozyme, pipet 10 microliters of lysozyme and 10 microliters of crystallization reagent. Gently aspirate and dispense the drop 5 to 10 times to mix the viscous crys-tallization reagent with the sample. In the second set of experiments using 100, 80, 60, 40, 20 and 10 mg/ml lysozyme, pipet 10 microliters of lysozyme and 10 microliters of crystallization reagent. Gently aspirate and dispense the drop 5 to 10 times to mix the viscous crystallization reagent with the sample. After preparing each drop apply streak seeding to each of the second set of drops by touching a parent crystal from the experiment in step 1 and streak seed across the drop.
4. Can you get crystals to grow across a streak line? Do you see fewer, but larger crystals as you dilute the lysozyme concentration? How long does nucleation and growth take in the drops with no streak seeding versus the drops with streak seeding? Can you find a concentration of lysozyme where crystals only grow with streak seeding?
5. For variations, try decreasing the reagent concentration and keeping the lysozyme concentration constant (i.e. 100 mg/ml or other constant concen-tration). Try equilibrating the drops over night and then performing streak seeding. How do the results of these experiments compare to drops where seeding was performed without equilibration?
References and Readings1. A method to produce microseed stock for use in the crystallization of
biological macromolecules Luft, J.R., DeTitta, G.T. Acta Cryst. (1999). D55, 988-993.
2. Kinetic aspects of macromolecular crystallization. J.R. Luft and G.T. De-Titta, Methods in Enzymology (1997) 276, 110-131.
3. An automated microseed matrix-screening method. Allan D’Arcy, Fred-eric Villard and May Marsh. Acta Cryst. (2007). D63, 550–554.
4. Semi-automated microseeding of nanolitre crystallization experiments. Thomas S. Walter, Erika J. Mancini, Jan Kadlec, Stephen C. Graham, Rene´ Assenberg, Jingshan Ren, Sarah Sainsbury, Raymond J. Owens,
Solutions for Crystal Growth
Final lysozyme concentration (mg/ml) 100 80 60 40 20 10
Table 1
Seeding
Crystal Growth 101 page 7
55
David I. Stuart, Jonathan M. Grimes and Karl Harlos Acta Cryst. (2008). F64, 14–18.
5. Analytical and production seeding techniques. Stura, E.A., Wilson, I.A., Methods: A Companion to Methods in Enzymology (1990) 1, 38-49.
6. Seeding Techniques in Crystallization of Nucleic Acids and Proteins: A Practical Approach. Stura, E.A., Wilson, I.A., Oxford University Press (1992) 99-126.
7. Structure of an orthorhombic form of xylanase II from Trichoderma reesei and analysis of thermal displacement. Watanabe et al. Acta Cryst. (2006). D62, 784-792.
8. Crystallization and preliminary crystallographic analysis of p40phox, a regulatory subunit of NADPH oxidase. K. Honbou, S. Yuzawa, N. N. Suzuki, Y. Fujioka, H. Sumimoto and F. Inagaki. Acta Cryst. (2006). F62, 1021-1023 (Used seed bead to optimize).
9. Purification, crystallization and preliminary X-ray diffraction study of human ribosomal protein L10 core domain. Yuji Kobayashi et al. Acta Cryst. (2007). F63, 950–952.
10. The role of bias in crystallization conditions in automated microseed-ing. Edwin Pozharski et al. Acta Cryst. (2008). D64, 1222-1227.
11. Transmission electron microscopy for the evaluation and optimization of crystal growth. Hilary P. Stevenson & Guillermo Calero et al. Acta Cryst. (2016) D72, 603-615.
12. Microseed matrix screening for optimization in protein crystallization: what have we learned? A. D’Arcy, T. Bergfors, S. W. Cowan-Jacob and M. Marsh. Acta Cryst. (2014). F70, 1117-1126.
13. Microseed matrix screening to improve crystals of yeast cytosine deami-nase. G. C. Ireton and B. L. Stoddard. Acta Cryst. (2004). D60, 601-605.
14. Crystallization of nucleic acids and proteins, a Practical Approach. Ed-ited by A. Ducruix and R. Giege. (1992) Oxford University Press. ISBN 0-19-963246-4.
15. Protein Crystallization, Techniques, Strategies, and Tips. A Labora-tory Manual. Edited by Terese Bergfors. (1999). International University Line. ISBN 0-9636817-5-3.
16. Repeated seeding technique for growing large single crystals of proteins. C. Thaller et al. (1981) J. Mol. Biol. 147, 465-469.
17. Protein Crystallization, Techniques, Strategies, and Tips. A Laboratory Manual. Edited by Terese M. Bergfors. Chapter 14. Seeding. By Enrico A. Stura. Pages 141-153. (1999).
18. Seeds to Crystals. Terese Bergfors (2003), Journal of Structural Biology, Vol ume 142, Number 1, pages 66-76.
19. Using natural seeding material to gener ate nucleation in protein crys-tallization experiments. D’Arcy A, Mac Sweeney A, Haber A., Acta Crystal-logr D Biol Crystallogr. 2003 Jul;59(Pt 7):1343-6.
Related ProductsHR2-320 Seed Bead Kit - 24 tubes with PTFE Seed Bead
HR4-780 Seed Bead Steel kit - 24 tubes with Steel Seed Beads
HR4-781 Seed Bead Ceramic kit - 24 tubes with Ceramic Seed Beads
HR4-782 Seed Bead Glass kit - 24 tubes with Glass Seed Beads
HR4-216 Crystal Crusher - 5 pack
HR8-133 Seeding Tool - 5 pack
HR4-217 Crystal Probe - 12 pack
HR4-508 0.75 inch wide Crystal Clear Mini Sealing Tape 0.75 inch x 650 inch, with cutter
HR4-811 Micro-Tools Set
HR4-837 Micro-Tools II Set
HR7-108 Lysozyme Kit 12 x 20 mg plus 12 x 1 ml solubilization buffer
HR2-805 15-Minute Lysozyme Crystallization Reagent 30% w/v PEG MME 5,000, 1.0 M Sodium chloride, 0.05 M Sodium acetate trihydrate pH 4.6, 100 ml
Solutions for Crystal Growth
Seeding
Crystal Growth 101 page 8

56
Solutions for Crystal Growth
Buffer Table
Crystal Growth 101 page 1
Buffer
Potassium chloride
Citric acidpKa 25°C (1) 3.1 (2) 4.8 (3) 6.4
Sodium citrate tribasic dihydratepKa 25°C (1) 3.1 (2) 4.8 (3) 6.4
Sodium cacodylate trihydratepKa 25°C 6.3
MES monohydratepKa 25°C 6.1
ACESpKa 25°C 6.8
PIPESpKa 25°C 6.8
ImidazolepKa 25°C 7.0
MOPSOpKa 25°C 6.9
HEPES sodiumpKa 25°C 7.5
HEPESpKa 25°C 7.5
BIS-TRIS propanepKa 25°C (1) 6.8 (2) 9.0
BESpKa 25°C 7.1
MOPSpKa 25°C 7.2
TESpKa 25°C 7.5
1 2 3 4 5 6 7 8 9 10 11 12 13
pH
MOBSpKa 25°C 7.6
1.0 2.2
2.2 6.5
Sodium acetate trihydratepKa 25°C 4.8
3.6 5.6
DL-Malic acidpKa 25°C (1) 3.4 (2) 5.1
3.7 6.0
Succinic acidpKa 25°C (1) 4.2 (2) 5.6
3.2 6.5
5.0 7.4
5.2 7.1
ADApKa 25°C 6.6
5.6 7.5
BIS-TRISpKa 25°C 6.5
5.5 7.5
6.1 7.5
6.2 7.8
6.2 7.6
6.3 9.5
6.4 7.8
6.5 7.9
6.8 8.2
6.9 8.3
2.2 6.5
6.1 7.5
6.8 8.2
6.8 8.2
TrispKa 25°C 8.1
DIPSOpKa 25°C 7.6
7.0 8.2
7.0 9.0
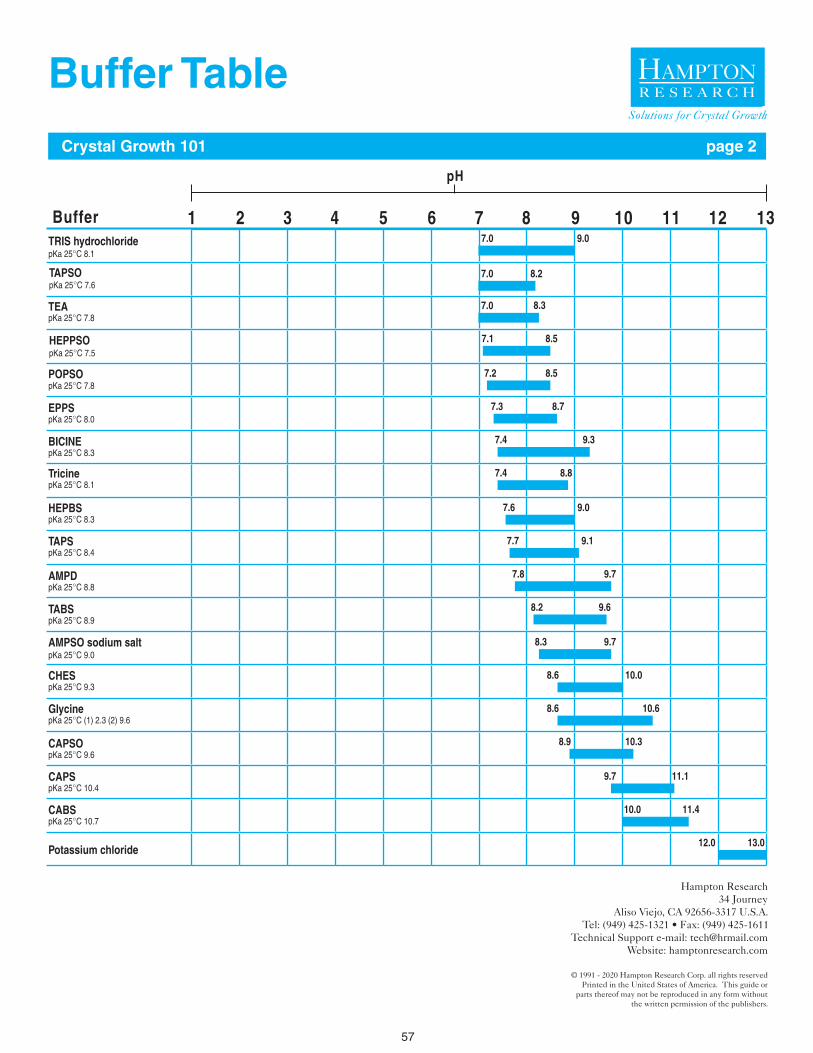
57
Solutions for Crystal Growth
Buffer Table
Crystal Growth 101 page 2
TRIS hydrochloridepKa 25°C 8.1
TAPSOpKa 25°C 7.6
BICINEpKa 25°C 8.3
TricinepKa 25°C 8.1
HEPBSpKa 25°C 8.3
TAPSpKa 25°C 8.4
AMPDpKa 25°C 8.8
GlycinepKa 25°C (1) 2.3 (2) 9.6
CAPSOpKa 25°C 9.6
TABSpKa 25°C 8.9
AMPSO sodium saltpKa 25°C 9.0
CHESpKa 25°C 9.3
CAPSpKa 25°C 10.4
CABSpKa 25°C 10.7
Potassium chloride
7.0 8.2
Buffer 1 2 3 4 5 6 7 8 9 10 11 12 13
pH
7.0 9.0
POPSOpKa 25°C 7.8
7.1 8.5HEPPSOpKa 25°C 7.5
7.2 8.5
EPPSpKa 25°C 8.0
7.3 8.7
7.4 9.3
7.4 8.8
7.6 9.0
7.7 9.1
7.8 9.7
8.2 9.6
8.3 9.7
8.6 10.0
8.6 10.6
8.9 10.3
11.19.7
11.410.0
13.012.0
TEApKa 25°C 7.8
8.37.0
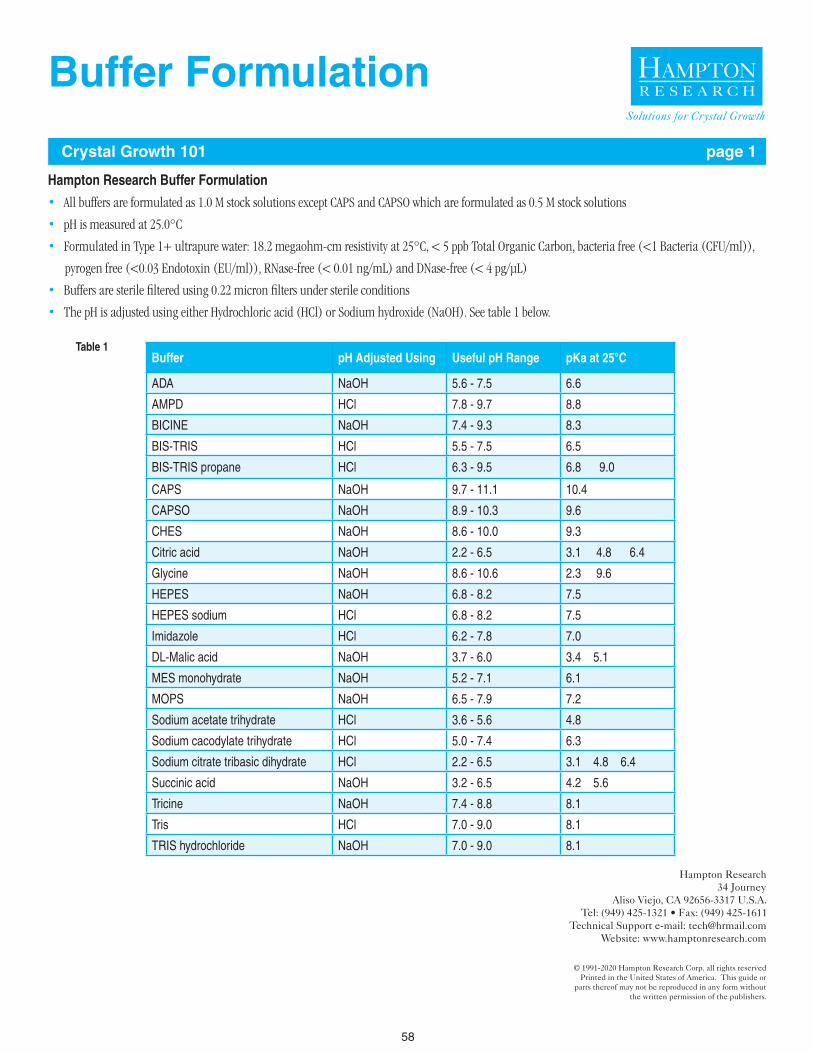
58
Hampton Research Buffer Formulation
• All buffers are formulated as 1.0 M stock solutions except CAPS and CAPSO which are formulated as 0.5 M stock solutions
• pH is measured at 25.0°C
• Formulated in Type 1+ ultrapure water: 18.2 megaohm-cm resistivity at 25°C, < 5 ppb Total Organic Carbon, bacteria free (<1 Bacteria (CFU/ml)),
pyrogen free (<0.03 Endotoxin (EU/ml)), RNase-free (< 0.01 ng/mL) and DNase-free (< 4 pg/µL)
• Buffers are sterile filtered using 0.22 micron filters under sterile conditions
• The pH is adjusted using either Hydrochloric acid (HCl) or Sodium hydroxide (NaOH). See table 1 below.
Buffer pH Adjusted Using Useful pH Range pKa at 25°C
ADA NaOH 5.6 - 7.5 6.6
AMPD HCl 7.8 - 9.7 8.8
BICINE NaOH 7.4 - 9.3 8.3
BIS-TRIS HCl 5.5 - 7.5 6.5
BIS-TRIS propane HCl 6.3 - 9.5 6.8 9.0
CAPS NaOH 9.7 - 11.1 10.4
CAPSO NaOH 8.9 - 10.3 9.6
CHES NaOH 8.6 - 10.0 9.3
Citric acid NaOH 2.2 - 6.5 3.1 4.8 6.4
Glycine NaOH 8.6 - 10.6 2.3 9.6
HEPES NaOH 6.8 - 8.2 7.5
HEPES sodium HCl 6.8 - 8.2 7.5
Imidazole HCl 6.2 - 7.8 7.0
DL-Malic acid NaOH 3.7 - 6.0 3.4 5.1
MES monohydrate NaOH 5.2 - 7.1 6.1
MOPS NaOH 6.5 - 7.9 7.2
Sodium acetate trihydrate HCl 3.6 - 5.6 4.8
Sodium cacodylate trihydrate HCl 5.0 - 7.4 6.3
Sodium citrate tribasic dihydrate HCl 2.2 - 6.5 3.1 4.8 6.4
Succinic acid NaOH 3.2 - 6.5 4.2 5.6
Tricine NaOH 7.4 - 8.8 8.1
Tris HCl 7.0 - 9.0 8.1
TRIS hydrochloride NaOH 7.0 - 9.0 8.1
Table 1
Buffer Formulation
Crystal Growth 101 page 1
Solutions for Crystal Growth
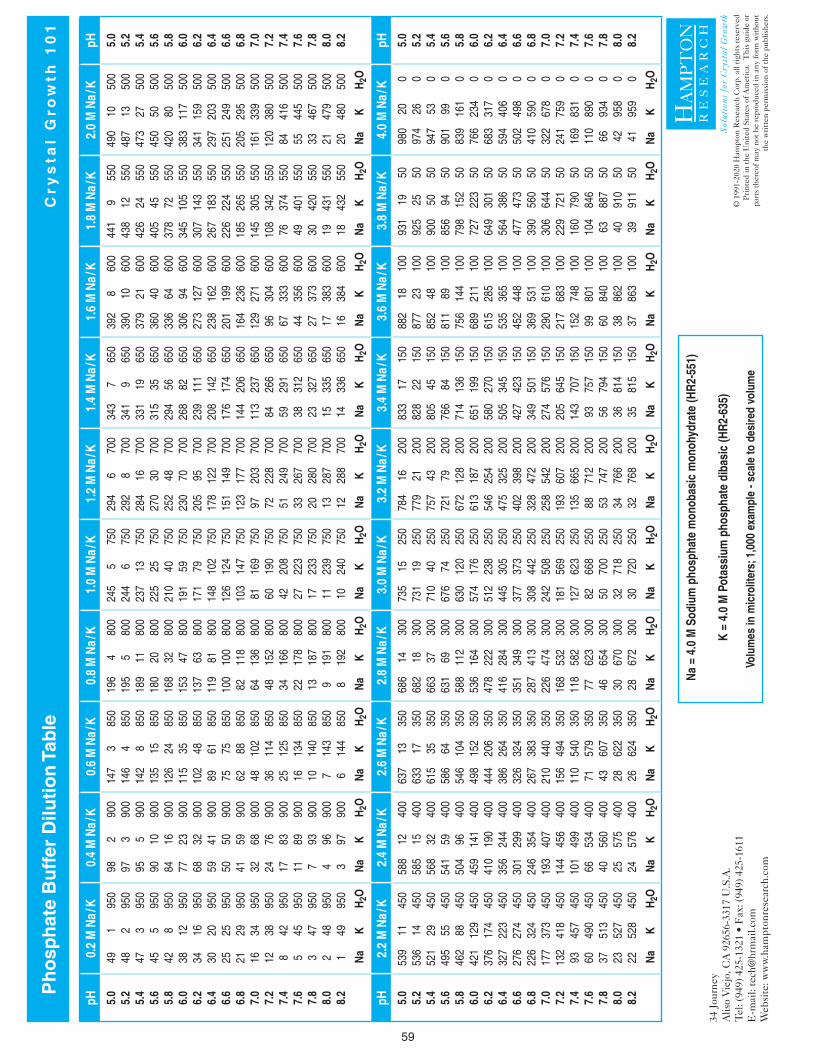
59
pH0.
2 M
Na /
K0.
4 M
Na /
K0.
6 M
Na /
K0.
8 M
Na /
K1.
0 M
Na /
K1.
2 M
Na /
K1.
4 M
Na /
K1.
6 M
Na /
K1.
8 M
Na /
K2.
0 M
Na /
KpH
5.0
5.2
5.4
5.6
5.8
6.0
6.2
6.4
6.6
6.8
7.0
7.2
7.4
7.6
7.8
8.0
8.2
49
1
95
0
48
2
95
0
47
3
95
0
45
5
95
0
42
8
95
0
38
1
2
950
3
4
16
9
50
30
2
0
950
2
5
25
9
50
21
2
9
950
1
6
34
9
50
12
3
8
950
8
42
950
5
45
950
3
47
950
2
48
950
1
49
950
Na
K
H2O
98
2
90
0
97
3
90
0
95
5
90
0
90
1
0
900
8
4
16
9
00
77
2
3
900
6
8
32
9
00
59
4
1
900
5
0
50
9
00
41
5
9
900
3
2
68
9
00
24
7
6
900
1
7
83
9
00
11
8
9
900
7
93
900
4
96
900
3
97
900
Na
K
H2O
147
3
85
0
146
4
85
0
142
8
85
0
135
1
5
850
1
26
24
8
50
115
3
5
850
1
02
48
8
50
89
6
1
850
7
5
75
8
50
62
8
8
850
4
8
102
8
50
36
1
14
850
2
5
125
8
50
16
1
34
850
1
0
140
8
50
7
1
43
850
6
144
8
50 N
a
K
H
2O
196
4
80
0
195
5
80
0
189
1
1
800
1
80
20
8
00
168
3
2
800
1
53
47
8
00
137
6
3
800
1
19
81
8
00
100
1
00
800
8
2
118
8
00
64
1
36
800
4
8
152
8
00
34
1
66
800
2
2
178
8
00
13
1
87
800
9
191
8
00
8
1
92
800
Na
K
H2O
245
5
75
0
244
6
75
0
237
1
3
750
2
25
25
7
50
210
4
0
750
1
91
59
7
50
171
7
9
750
1
48
102
7
50
126
1
24
750
1
03
147
7
50
81
1
69
750
6
0
190
7
50
42
2
08
750
2
7
223
7
50
17
2
33
750
1
1
239
7
50
10
2
40
750
Na
K
H2O
294
6
70
0
292
8
70
0
284
1
6
700
2
70
30
7
00
252
4
8
700
2
30
70
7
00 2
05
95
7
00
178
1
22
700
1
51
149
7
00
123
1
77
700
9
7
203
7
00
72
2
28
700
5
1
249
7
00
33
2
67
700
2
0
280
7
00
13
2
87
700
1
2
288
7
00
Na
K
H2O
343
7
65
0
341
9
65
0
331
1
9
650
3
15
35
6
50
294
5
6
650
2
68
82
6
50
239
1
11
650
2
08
142
6
50
176
1
74
650
1
44
206
6
50
113
2
37
650
8
4
266
6
50
59
2
91
650
3
8
312
6
50
23
3
27
650
1
5
335
6
50
14
3
36
650
Na
K
H2O
392
8
60
0
390
1
0
600
3
79
21
6
00
360
4
0
600
3
36
64
6
00
306
9
4
600
2
73
127
6
00
238
1
62
600
2
01
199
6
00
164
2
36
600
1
29
271
6
00
96
3
04
600
6
7
333
6
00
44
3
56
600
2
7
373
6
00
17
3
83
600
1
6
384
6
00 N
a
K
H
2O
441
9
55
0
438
1
2
550
4
26
24
5
50
405
4
5
550
3
78
72
5
50
345
1
05
550
3
07
143
5
50
267
1
83
550
2
26
224
5
50
185
2
65
550
1
45
305
5
50
108
3
42
550
7
6
374
5
50
49
4
01
550
3
0
420
5
50
19
4
31
550
1
8
432
5
50 N
a
K
H
2O
490
1
0
500
4
87
13
5
00
473
2
7
500
4
50
50
5
00
420
8
0
500
3
83
117
5
00
341
1
59
500
2
97
203
5
00
251
2
49
500
2
05
295
5
00
161
3
39
500
1
20
380
5
00
84
4
16
500
5
5
445
5
00
33
4
67
500
2
1
479
5
00
20
4
80
500
Na
K
H2O
5.0
5.2
5.4
5.6
5.8
6.0
6.2
6.4
6.6
6.8
7.0
7.2
7.4
7.6
7.8
8.0
8.2
pH2.
2 M
Na /
K2.
4 M
Na /
K2.
6 M
Na /
K2.
8 M
Na /
K3.
0 M
Na /
K3.
2 M
Na /
K3.
4 M
Na /
K3.
6 M
Na /
K3.
8 M
Na /
K4.
0 M
Na /
KpH
5.0
5.2
5.4
5.6
5.8
6.0
6.2
6.4
6.6
6.8
7.0
7.2
7.4
7.6
7.8
8.0
8.2
539
1
1
450
5
36
14
4
50
521
2
9
450
4
95
55
4
50
462
8
8
450
4
21
129
4
50
376
1
74
450
3
27
223
4
50
276
2
74
450
2
26
324
4
50
177
3
73
450
1
32
418
4
50
93
4
57
450
6
0
490
4
50
37
5
13
450
2
3
527
4
50
22
5
28
450
Na
K
H2O
588
1
2
400
5
85
15
4
00
568
3
2
400
5
41
59
4
00
504
9
6
400
4
59
141
4
00
410
1
90
400
3
56
244
4
00
301
2
99
400
2
46
354
4
00
193
4
07
400
1
44
456
4
00
101
4
99
400
6
6
534
4
00
40
5
60
400
2
5
575
4
00
24
5
76
400
Na
K
H2O
637
1
3
350
6
33
17
3
50
615
3
5
350
5
86
64
3
50
546
1
04
350
4
98
152
3
50
444
2
06
350
3
86
264
3
50
326
3
24
350
2
67
383
3
50
210
4
40
350
1
56
494
3
50
110
5
40
350
7
1
579
3
50
43
6
07
350
2
8
622
3
50
26
6
24
350
Na
K
H2O
686
1
4
300
6
82
18
3
00
663
3
7
300
6
31
69
3
00
588
1
12
300
5
36
164
3
00
478
2
22
300
4
16
284
3
00
351
3
49
300
2
87
413
3
00
226
4
74
300
1
68
532
3
00
118
5
82
300
7
7
623
3
00
46
6
54
300
3
0
670
3
00
28
6
72
300
Na
K
H2O
735
1
5
250
7
31
19
2
50
710
4
0
250
6
76
74
2
50
630
1
20
250
5
74
176
2
50
512
2
38
250
4
45
305
2
50
377
3
73
250
3
08
442
2
50
242
5
08
250
1
81
569
2
50
127
6
23
250
8
2
668
2
50
50
7
00
250
3
2
718
2
50
30
7
20
250
Na
K
H2O
784
1
6
200
7
79
21
2
00
757
4
3
200
7
21
79
2
00
672
1
28
200
6
13
187
2
00
546
2
54
200
4
75
325
2
00
402
3
98
200
3
28
472
2
00
258
5
42
200
1
93
607
2
00
135
6
65
200
8
8
712
2
00
53
7
47
200
3
4
766
2
00
32
7
68
200
Na
K
H2O
833
1
7
150
8
28
22
1
50
805
4
5
150
7
66
84
1
50
714
1
36
150
6
51
199
1
50
580
2
70
150
5
05
345
1
50
427
4
23
150
3
49
501
1
50
274
5
76
150
2
05
645
1
50
143
7
07
150
9
3
757
1
50
56
7
94
150
3
6
814
1
50
35
8
15
150
Na
K
H2O
882
1
8
100
8
77
23
1
00
852
4
8
100
8
11
89
1
00
756
1
44
100
6
89
211
1
00
615
2
85
100
5
35
365
1
00
452
4
48
100
3
69
531
1
00
290
6
10
100
2
17
683
1
00
152
7
48
100
9
9
801
1
00
60
8
40
100
3
8
862
1
00
37
8
63
100
Na
K
H2O
931
1
9
50
9
25
25
5
0
900
5
0
50
8
56
94
5
0
798
1
52
50
7
27
223
5
0
649
3
01
50
5
64
386
5
0
477
4
73
50
3
90
560
5
0
306
6
44
50
2
29
721
5
0
160
7
90
50
1
04
846
5
0
63
8
87
50
40
910
5
0
39
9
11
50
Na
K
H2O
980
2
0
0
9
74
26
0
947
5
3
0
9
01
99
0
839
1
61
0
7
66
234
0
683
3
17
0
5
94
406
0
502
4
98
0
4
10
590
0
322
6
78
0
2
41
759
0
169
8
31
0
1
10
890
0
66
9
34
0
42
958
0
41
9
59
0
Na
K
H2O
5.0
5.2
5.4
5.6
5.8
6.0
6.2
6.4
6.6
6.8
7.0
7.2
7.4
7.6
7.8
8.0
8.2
Na
= 4.
0 M
Sod
ium
pho
spha
te m
onob
asic
mon
ohyd
rate
(HR2
-551
)
K =
4.0
M P
otas
sium
pho
spha
te d
ibas
ic (H
R2-6
35)
Volu
mes
in m
icro
liter
s; 1
,000
exa
mpl
e - s
cale
to d
esire
d vo
lum
e
Ph
osp
hat
e B
uff
er D
iluti
on
Tab
le
C
ry
sta
l G
row
th 1
01
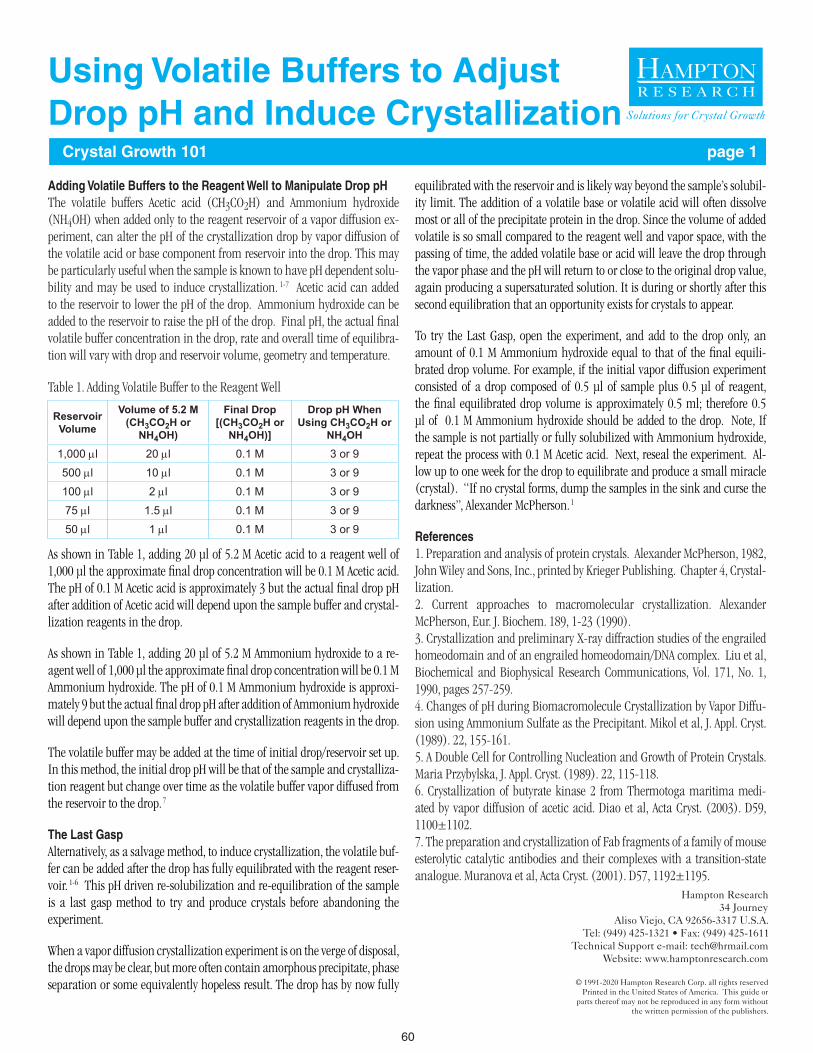
60
Crystal Growth 101 page 1
Solutions for Crystal Growth
Using Volatile Buffers to AdjustDrop pH and Induce Crystallization
Adding Volatile Buffers to the Reagent Well to Manipulate Drop pHThe volatile buffers Acetic acid (CH3CO2H) and Ammonium hydroxide (NH4OH) when added only to the reagent reservoir of a vapor diffusion ex-periment, can alter the pH of the crystallization drop by vapor diffusion of the volatile acid or base component from reservoir into the drop. This may be particularly useful when the sample is known to have pH dependent solu-bility and may be used to induce crystallization. 1-7 Acetic acid can added to the reservoir to lower the pH of the drop. Ammonium hydroxide can be added to the reservoir to raise the pH of the drop. Final pH, the actual final volatile buffer concentration in the drop, rate and overall time of equilibra-tion will vary with drop and reservoir volume, geometry and temperature.
Table 1. Adding Volatile Buffer to the Reagent Well
As shown in Table 1, adding 20 µl of 5.2 M Acetic acid to a reagent well of 1,000 µl the approximate final drop concentration will be 0.1 M Acetic acid. The pH of 0.1 M Acetic acid is approximately 3 but the actual final drop pH after addition of Acetic acid will depend upon the sample buffer and crystal-lization reagents in the drop.
As shown in Table 1, adding 20 µl of 5.2 M Ammonium hydroxide to a re-agent well of 1,000 µl the approximate final drop concentration will be 0.1 M Ammonium hydroxide. The pH of 0.1 M Ammonium hydroxide is approxi-mately 9 but the actual final drop pH after addition of Ammonium hydroxide will depend upon the sample buffer and crystallization reagents in the drop.
The volatile buffer may be added at the time of initial drop/reservoir set up. In this method, the initial drop pH will be that of the sample and crystalliza-tion reagent but change over time as the volatile buffer vapor diffused from the reservoir to the drop. 7
The Last GaspAlternatively, as a salvage method, to induce crystallization, the volatile buf-fer can be added after the drop has fully equilibrated with the reagent reser-voir. 1-6 This pH driven re-solubilization and re-equilibration of the sample is a last gasp method to try and produce crystals before abandoning the experiment.
When a vapor diffusion crystallization experiment is on the verge of disposal, the drops may be clear, but more often contain amorphous precipitate, phase separation or some equivalently hopeless result. The drop has by now fully
equilibrated with the reservoir and is likely way beyond the sample’s solubil-ity limit. The addition of a volatile base or volatile acid will often dissolve most or all of the precipitate protein in the drop. Since the volume of added volatile is so small compared to the reagent well and vapor space, with the passing of time, the added volatile base or acid will leave the drop through the vapor phase and the pH will return to or close to the original drop value, again producing a supersaturated solution. It is during or shortly after this second equilibration that an opportunity exists for crystals to appear.
To try the Last Gasp, open the experiment, and add to the drop only, an amount of 0.1 M Ammonium hydroxide equal to that of the final equili-brated drop volume. For example, if the initial vapor diffusion experiment consisted of a drop composed of 0.5 µl of sample plus 0.5 µl of reagent, the final equilibrated drop volume is approximately 0.5 ml; therefore 0.5 µl of 0.1 M Ammonium hydroxide should be added to the drop. Note, If the sample is not partially or fully solubilized with Ammonium hydroxide, repeat the process with 0.1 M Acetic acid. Next, reseal the experiment. Al-low up to one week for the drop to equilibrate and produce a small miracle (crystal). “If no crystal forms, dump the samples in the sink and curse the darkness”, Alexander McPherson. 1
References1. Preparation and analysis of protein crystals. Alexander McPherson, 1982, John Wiley and Sons, Inc., printed by Krieger Publishing. Chapter 4, Crystal-lization.2. Current approaches to macromolecular crystallization. Alexander McPherson, Eur. J. Biochem. 189, 1-23 (1990).3. Crystallization and preliminary X-ray diffraction studies of the engrailed homeodomain and of an engrailed homeodomain/DNA complex. Liu et al, Biochemical and Biophysical Research Communications, Vol. 171, No. 1, 1990, pages 257-259.4. Changes of pH during Biomacromolecule Crystallization by Vapor Diffu-sion using Ammonium Sulfate as the Precipitant. Mikol et al, J. Appl. Cryst. (1989). 22, 155-161.5. A Double Cell for Controlling Nucleation and Growth of Protein Crystals. Maria Przybylska, J. Appl. Cryst. (1989). 22, 115-118.6. Crystallization of butyrate kinase 2 from Thermotoga maritima medi-ated by vapor diffusion of acetic acid. Diao et al, Acta Cryst. (2003). D59, 1100±1102.7. The preparation and crystallization of Fab fragments of a family of mouse esterolytic catalytic antibodies and their complexes with a transition-state analogue. Muranova et al, Acta Cryst. (2001). D57, 1192±1195.
Reservoir Volume
Volume of 5.2 M (CH3CO2H or
NH4OH)
Final Drop [(CH3CO2H or
NH4OH)]
Drop pH When Using CH3CO2H or
NH4OH1,000 ml 20 ml 0.1 M 3 or 9500 ml 10 ml 0.1 M 3 or 9100 ml 2 ml 0.1 M 3 or 975 ml 1.5 ml 0.1 M 3 or 950 ml 1 ml 0.1 M 3 or 9
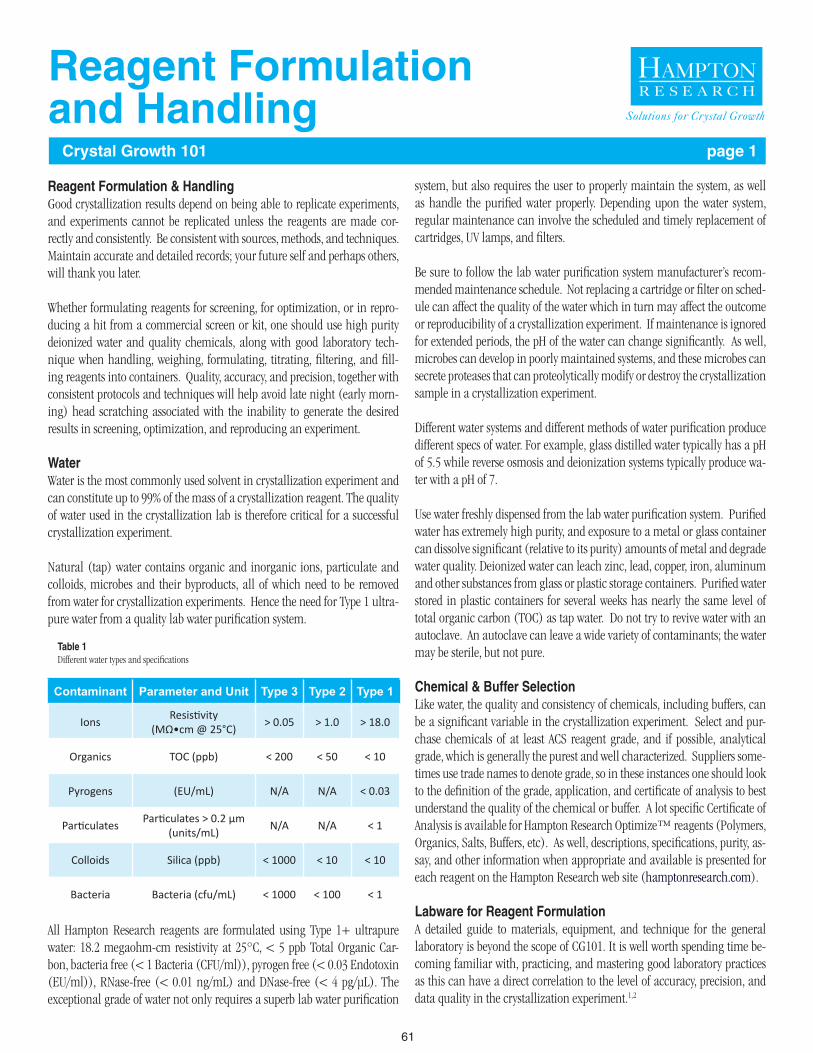
61
Reagent Formulation & HandlingGood crystallization results depend on being able to replicate experiments, and experiments cannot be replicated unless the reagents are made cor-rectly and consistently. Be consistent with sources, methods, and techniques. Maintain accurate and detailed records; your future self and perhaps others, will thank you later.
Whether formulating reagents for screening, for optimization, or in repro-ducing a hit from a commercial screen or kit, one should use high purity deionized water and quality chemicals, along with good laboratory tech-nique when handling, weighing, formulating, titrating, filtering, and fill-ing reagents into containers. Quality, accuracy, and precision, together with consistent protocols and techniques will help avoid late night (early morn-ing) head scratching associated with the inability to generate the desired results in screening, optimization, and reproducing an experiment.
WaterWater is the most commonly used solvent in crystallization experiment and can constitute up to 99% of the mass of a crystallization reagent. The quality of water used in the crystallization lab is therefore critical for a successful crystallization experiment.
Natural (tap) water contains organic and inorganic ions, particulate and colloids, microbes and their byproducts, all of which need to be removed from water for crystallization experiments. Hence the need for Type 1 ultra-pure water from a quality lab water purification system.
All Hampton Research reagents are formulated using Type 1+ ultrapure water: 18.2 megaohm-cm resistivity at 25°C, < 5 ppb Total Organic Car-bon, bacteria free (< 1 Bacteria (CFU/ml)), pyrogen free (< 0.03 Endotoxin (EU/ml)), RNase-free (< 0.01 ng/mL) and DNase-free (< 4 pg/µL). The exceptional grade of water not only requires a superb lab water purification
system, but also requires the user to properly maintain the system, as well as handle the purified water properly. Depending upon the water system, regular maintenance can involve the scheduled and timely replacement of cartridges, UV lamps, and filters.
Be sure to follow the lab water purification system manufacturer’s recom-mended maintenance schedule. Not replacing a cartridge or filter on sched-ule can affect the quality of the water which in turn may affect the outcome or reproducibility of a crystallization experiment. If maintenance is ignored for extended periods, the pH of the water can change significantly. As well, microbes can develop in poorly maintained systems, and these microbes can secrete proteases that can proteolytically modify or destroy the crystallization sample in a crystallization experiment.
Different water systems and different methods of water purification produce different specs of water. For example, glass distilled water typically has a pH of 5.5 while reverse osmosis and deionization systems typically produce wa-ter with a pH of 7.
Use water freshly dispensed from the lab water purification system. Purified water has extremely high purity, and exposure to a metal or glass container can dissolve significant (relative to its purity) amounts of metal and degrade water quality. Deionized water can leach zinc, lead, copper, iron, aluminum and other substances from glass or plastic storage containers. Purified water stored in plastic containers for several weeks has nearly the same level of total organic carbon (TOC) as tap water. Do not try to revive water with an autoclave. An autoclave can leave a wide variety of contaminants; the water may be sterile, but not pure.
Chemical & Buffer SelectionLike water, the quality and consistency of chemicals, including buffers, can be a significant variable in the crystallization experiment. Select and pur-chase chemicals of at least ACS reagent grade, and if possible, analytical grade, which is generally the purest and well characterized. Suppliers some-times use trade names to denote grade, so in these instances one should look to the definition of the grade, application, and certificate of analysis to best understand the quality of the chemical or buffer. A lot specific Certificate of Analysis is available for Hampton Research Optimize™ reagents (Polymers, Organics, Salts, Buffers, etc). As well, descriptions, specifications, purity, as-say, and other information when appropriate and available is presented for each reagent on the Hampton Research web site (hamptonresearch.com).
Labware for Reagent FormulationA detailed guide to materials, equipment, and technique for the general laboratory is beyond the scope of CG101. It is well worth spending time be-coming familiar with, practicing, and mastering good laboratory practices as this can have a direct correlation to the level of accuracy, precision, and data quality in the crystallization experiment.1,2
Solutions for Crystal Growth
Contaminant Parameter and Unit Type 3 Type 2 Type 1
Ions Resistivity (MΩ•cm @ 25°C) > 0.05 > 1.0 > 18.0
Organics TOC (ppb) < 200 < 50 < 10
Pyrogens (EU/mL) N/A N/A < 0.03
Particulates Particulates > 0.2 µm (units/mL) N/A N/A < 1
Colloids Silica (ppb) < 1000 < 10 < 10
Bacteria Bacteria (cfu/mL) < 1000 < 100 < 1
Table 1Different water types and specifications
Reagent Formulationand Handling Crystal Growth 101 page 1
62
Accuracy is the degree to which the result of a measurement conforms to the correct value or standard. Precision is the degree to which repeated mea-surements reproduce the same result. In other words, accuracy is shooting a single bullseye, where precision is repeatedly shooting a bullseye.
To help achieve and ensure both accuracy and precision when formulating stock solutions of chemicals and buffers, one uses quantitative methods and labware with the highest tolerance. The accurate measurement of liquid volume can be difficult, and there are a number of different types of contain-ers for making volume measurements. Tubes, Erlenmeyer flasks, beakers, graduated cylinders, and volumetric flasks each have a specific purpose and associated level of accuracy and precision. The volume contained and deliv-ered by any container is never the exact volume indicated by the markings; the volume is guaranteed to be within some prescribed tolerance. Dispos-able centrifuge tubes are a popular container for storing reagents but of-fer poor accuracy and precision in determining volume and should only be used when absolute uncertainty is the formulation goal. Erlenmeyer flasks and beakers are accurate to 5 - 10%, graduated cylinder to 1 - 5%, Class B volumetric flask about 0.06 - 0.08%, and Class A volumetric flask about 0.01 – 0.03%. Class A or other specialized volumetric flasks are the most ac-curate and precise container for quantitative volumetric measurement. For higher accuracy and precision one could turn to quantitative gravimetric measurement.
Liquid HandlingOn a smaller scale, perhaps 10 milliliters or less, liquids, as well as chemical and buffer stocks can also be measured and formulated using manual and electronic pipettes, as well as liquid handling automation (robots). Such liquid handling is associated with reproducing hits, and formulating cus-tom, or optimization screen experiments with reagent well (reservoir) vol-umes around 50 - 1,000 µl. Quality pipettes and robots with matching tips, as well as regular (annual) calibration, maintenance, and proper use, can help to ensure experimental accuracy and precision. There is more to pipet-ting than jamming on generic tips, turning dials, and pushing plungers or buttons. Find, read, follow, and keep nearby the user guide for your pipettes. Meanwhile, here are some pipetting basics.
For adjustable manual pipettes with a volume lock control, unlock to adjust the volume, and then lock, to aspirate and dispense. To eliminate errors due to mechanical backlash: when setting the desired volume, first turn the knob 1⁄3 turn above the desired volume. Then turn the knob slowly clockwise until the desired volume is displayed. Always dial down to the desired volume.
Pipettes and tips are often designed together as a pipetting system and can deliver better results than generic misfit options.
Don’t dip too deep into the reagent or sample. For example, a 2 - 10 µl
pipette tip should have an immersion depth of 1 - 2 mm, a 200 - 2,000 µl tip, 3 - 6 mm.
Pipette vertically, or within 20° of vertical. Don’t invert or lay the pipette flat with liquid in the tip.
Use a new, sterile tip for each unique reagent or buffer. When aspirating, first press the plunger to the first stop and hold it. Hold the pipette vertical or within 20 degrees of vertical, place the tip into the solution to the proper depth, relax your thumb and allow the plunger to slowly rise. Do not let go of the plunger or release the plunger too quickly, or this will result in inaccu-rate measurement. Pause in the solution, especially viscous solutions such as Polyethylene glycols and Glycerol, to ensure the full volume of solution is drawn into the tip. Withdraw the tip slowly from the solution, allowing the surface tension of the liquid in the container to wick away solution from the outside of the tip. When dispensing, touch the tip to the sidewall of the container, depress the plunger slowly to the first stop, wait 1-3 seconds for the liquid to move down the inside of the tip, then depress to the second stop (blowout) and hold for 1-3 seconds to ensure a complete dispense. Still holding the plunger, withdraw the tip while sliding along the side of the container to remove any stubborn solution from the tip. Gently release the plunger, discard the tip, and repeat the cycle as needed, with a fresh tip (to prevent carry-over).
Gravimetric MeasurementThe gravimetric measurements for Hampton Research reagents are always performed to an exact mass, each and every time, since 1991, and never a mass range. This is one small step in of many, that helps ensure reagent accuracy, precision, and consistency.
Analytical balances measure masses to a high degree of precision. Depend-ing upon the type and quality of the balance, readability is up to 0.01 mg (0.00001 gram). Follow the manufacturer’s user guide for proper use and care of the balance.
The balance should be located in a suitable area, free of traffic, temperature, humidity, and pressure changes. Be sure the balance is properly calibrated and tared. Handle each sample appropriately. Weigh hygroscopic samples quickly. Place the container and sample in the center of the balance, not off to the side. Do not lean on the bench while weighing. Check the level indicator bubble on the balance to confirm the balance is properly leveled before weighing. Do not handle tare containers with bare hands since fin-gerprints add mass as well as contaminants. One can use an anti-static device (Zerostat) to remove static electricity, dust, and lint from film, glass, and plasticware. Use a brush to clean spills in the weighing area. Keep the balance and work area clean and spotless. This is particularly important in order to avoid contamination of reagents.
Solutions for Crystal Growth
Reagent Formulationand Handling Crystal Growth 101 page 2
63
pH Measurement
Temperature and pHThe pH of all Hampton Research reagents and buffers is measured at 25.0 degrees Celsius. The temperature of the solution should always be consid-ered when measuring pH. The most common cause of error in pH measure-ment is temperature, because temperature variations can affect the electrode slope, reference element drift, temperature sensor errors, and the calibration buffer and sample.
Different buffers and chemicals have different temperature dependence, and Tris is a notorious example, pH measuring 7.5 at 0 degrees Celsius, 7.0 at 25 degrees Celsius, and 6.1 at 100 degrees Celsius. For this reason, it is a necessity to use a pH probe and meter that can measure temperature during pH measurement. Some pH probes and meters offer temperature compensa-tion, but this is an approximation and best practice is to maintain and mea-sure pH at the exact, desired temperature, typically 25.0 degrees Celsius. One can use an ice bath and warming plate to achieve and maintain a constant temperature during pH measurement. During the formulation and titration of some reagents, the temperature can decrease or increase significantly, at which point one must wait for the temperature to return to and stabilize at the desired temperature before final titration or pH measurement.
pH Probe CareIt is important to properly handle, maintain, clean, and calibrate the pH probe to ensure optimal performance, accuracy, and precision. This, in turn, will help ensure the crystallization experiments will be reproducible. Handle the probe with great care. Regularly inspect the probe for cracks, salt crystal buildup, and membrane/junction deposits. Ensure the probe has the ap-propriate volume of fill solution, which will need to be replenished from time to time per the manufacturer’s user guide. When not in use, the probe is to be stored in electrode storage solution, not water, nor calibration buffer. Use fresh buffers for calibration and choose calibration buffers that are 1 to 4 pH units apart. Use a two-point calibration for precise measurements, bracketing the pH to be measured. For example, use a pH 4 and 7 standard to calibrate the probe to measure pH 6. When one needs to measure pH 8.5, the probe will need to be recalibrated using pH 7 and 10 standards. Maintain a uniform and reasonable stir rate during pH measurement. No whirlpools. Between pH measurements, rinse the electrode with deionized water. Gently touch the probe with a lint free wipe to remove excess water. Avoid wip-ing and rubbing the probe as this can produce errors due to polarization. Clean the probe following the manufacturer’s guidelines. Common junc-tion cleaning can typically be accomplished using 0.1 M HCl with moderate stirring for 30 minutes. Remove and replace the probe fill solution after cleaning. Check the millivolt (mV) reading of the probe to ensure the mea-surement is within specification. If slow response or drifting continue after cleaning and refill, replace the probe. Even with proper care and cleaning, typical probe life is 1 - 3 years.
Concentration Units & Definitions
MolarityMolarity is the number of moles of solute per liter and represented as M, such as 3.0 M Ammonium sulfate. Molarity is the ratio between the moles of dis-solved solute (solid stuff) and the volume of solution (liquid stuff) in liters. The accepted volume of the solution is 1 L, so a 1 M (molar) solution would be 1 M = 1 mole of solute/1 L solution. Molarity is a way of determining the concentration of a solution. Dilute solutions are typically expressed in terms of millimolarity (mM) where 1 mM = 0.001 M. Typically, in crystallization we are asked to make something like a 3.5 M solution of Ammonium sulfate. To do this we need to know the molecular weight (Mr) of Ammonium sulfate (132.14 g/mole), the volume of solution to make (let’s make 500 ml or 0.5 L), and the desired concentration (3.5 M). Then we calculate:
# grams required = (desired Molarity)(formulation volume in liters)(Mr) # grams required = (3.5 mole/liter)(0.5 liter)(132.14 g/mole) = 231.25 g
To formulate the 3.5 M Ammonium sulfate we then weigh 231.25 g of Am-monium sulfate and add deionized water to dissolve the Ammonium sulfate and then adjust the final volume to 0.5 liter (500 ml). Do not simply add 500 ml of water to 231.25 g of Ammonium sulfate. Ideally one should use the most precise measuring instrument possible such as a class A volumetric flask. A less desirable instrument would be a graduated cylinder and the least desirable would be a beaker. Molarity is typically used as a concentration unit for salts, 1,6-Hexanediol, detergents, and some additives.
% w/v % w/v (percent weight/volume) is often used when formulating high mo-lecular weight Polyethylene glycols (PEGs) which are typically solids as well as some additives in solid form. % w/v is the weight of a solute in a given volume. % w/v = gram per 100 ml. For example, let’s make 1,000 ml of a 50% w/v PEG 4,000.
# grams required = (desired concentration in g/100 ml)(formulation vol-ume in milliliters) #grams required = (50 g/100 ml)(1,000 ml) = 500 grams
50% w/v PEG 4,000 is 500 g of PEG 4,000 in a final volume of 1,000 ml and not 500 g of PEG 4,000 plus 500 g of water. To make 1 liter of a 50% w/v solution of PEG 4,000, weigh 500 grams of PEG 4,000 into a volumetric flask and bring the final volume to 1 liter with water. Do not make the mistake of adding 500 grams of PEG 4,000 to 500 ml of water and believing you have made a 50% w/v solution.
Solutions for Crystal Growth
Reagent Formulationand Handling Crystal Growth 101 page 3
64
% v/v % v/v (percent volume/volume) is often used when formulating liquid, low molecular weight polymers (PEG 400), organics (MPD), and organic sol-vents (2-Propanol) into stock solutions. % v/v is the ratio of the volume of solute in 100 ml of solution. For example, a 100 ml solution of 50% v/v 2-Propanol contains 50 ml of the solute (100% 2-Propanol). Formulating reagents using % v/v can be done more precisely and accurately using the mass of the solute being formulated instead of the volume of the solute. To do this we need to know the density of the solute. For example, let’s formu-late 500 ml of 30% v/v (±)-2-Methyl-2,4-pentanediol (MPD). The density of MPD is 0.925 g/ml at 25° Celsius.
#grams required = (desired % v/v) (desired formulation volume in ml) (density of solute in g/ml) #grams required = (30 ml of solute/100 ml of solution) (500 ml) (0.925 g/ml) = 138.75 grams
30% of 500 ml is (0.3)(500) = 150 ml. To account for the difference in density of MPD we multiply 150 ml by 0.925 g/ml and obtain 138.75 grams. To formulate a 30% v/v MPD solution by mass we would then add 138.75 grams of MPD to a volumetric flask and bring the final volume to 500 ml at 25° Celsius with deionized water.
% saturation % saturation is the concentration of material in solution as a percent of the maximum concentration possible at the given temperature. A saturated solution is one where there is equilibrium between undissolved solute and dissolved solute. To make a saturated solution, a salt is added to water and often warmed to enhance solubilization. Complete dissolution is desired. Upon cooling, some of the solute (salt) will crystallize out and leave behind a saturated solution. The actual concentration of a saturated stock depends upon the temperature of the solution. For example, at 0°C, 127.5 g of Po-tassium iodide can be dissolved into 100 ml of water, but at 20°C, 144 g of potassium iodide can be dissolved into 100 ml of water. Therefore, depending upon whether the solution is kept at room temperature or in the cold, the salt concentration will be different. % saturation is a rather old school way to make salt solutions for crystallization. However, since we often perform crys-tallization at different temperatures, the actual concentration in the bottle, reservoir, or drop can be very different. Exact reproduction of a % saturation stock solution not only depends upon careful mass and volume measure-ment, but also temperature. Keep life simple, avoid reproducibility problems and stick with M, % w/v and % v/v when formulating solutions.
Milligram per milliliter (mg/ml)Milligram per milliliter (mg/ml) is typically used to express or determine protein concentration. To make a 20 mg/ml lysozyme solution we would weigh 20 mg of lysozyme and simply add 1 ml of buffer (20 mg plus 1 ml). However, others might weigh 20 mg of lysozyme and add 980 µl (0.98 ml)
(20 mg in 1 ml). Be sure you document which method was used to avoid a slight concentration inconsistency and potential reproducibility problems later.
DilutionsDilute 1:10 means adding one part of diluate (reagent) to nine parts of dilu-ent (water). Said another way, a 1:10 dilution means 1 part of the reagent plus 9 parts of water. Deionized water is the most frequently used diluent in crystallization experiments. Formulating a 0.1 M solution from a 1.0 M solution is a 1:10 dilution. To make 10 ml of 0.1 M solution from a 1.0 M solution, mix 1 ml of the 1.0 M solution with 9 ml of diluent.
A Bit About BuffersAll Hampton Research buffers are titrated using either HCl or NaOH. All buf-fer titrations are performed at 25.0 degrees Celsius.
Pay attention to buffer details and whether the buffer is the free acid or base. If Tris is indicated, do not substitute with Tris hydrochloride. Tris is titrated with HCl, where Tris hydrochloride is titrated with NaOH. A 1.0 M Tris pH 8.5 will have a conductivity of approximately 20 mS/cm at 25°C, where a 1.0 M Tris hydrochloride pH 8.5 will have a conductivity of approximately 60 mS/cm at 25°C. This different level of ionic strength can affect the out-come of the crystallization experiment, especially in a low ionic strength formulation.
The pH of a 1.0 M buffer will change when diluted in water to a final concen-tration of 0.1 M. The final pH of the reagent will also change due to the pres-ence of other reagents, such as salt, polymers, and additives. Pay particular attention to the indicated reagent formulation. In most screens, the buffer pH is that of a 1.0 M stock prior to dilution with water and other reagent components. For example, the reagent 0.1 M Tris pH 8.5, 2.5 M Ammonium sulfate has a final measured pH of 8.1. 8.5 is the measured pH of the 1.0 M Tris 8.5 before dilution to 0.1 M and in the presence of 2.5 M Ammonium sulfate. An exception to this generalization are the Grid Screens, where the pH is titrated after all components are in solution.
Inspect stored buffers before use, swirling to check for settled contaminants; if they appear cloudy or discolored, do not use them. Such solutions may have microbial contamination or may have become chemically unstable. One exception to this is MOPS, which sometimes appears slightly yellow.
Some buffers, including ADA, CAPS, CAPSO, and CHES do not go into solu-tion until titrated with the appropriate acid or base.
Sterile Filtration of ReagentsAll Hampton Research reagents, unless noted otherwise are sterile filtered using 0.22 or 0.45 µm filters into sterile containers. Detergents are formu-
Solutions for Crystal Growth
Reagent Formulationand Handling Crystal Growth 101 page 4
65
lated into sterile filtered deionized water, and not filtered following formula-tion, as micelles can be trapped in the filter, altering the final concentration of the detergent. All crystallization reagents save for detergents should be sterile filtered. Many crystallization reagents are susceptible to microbial growth if contaminated, and most crystallization experiments take place at room temperature, a cozy place for microbes to thrive.
When using a reagent that has been sitting around for more than a couple of weeks, give the container a swirl and inspect for signs of microbial growth such as a subtle, faint white, off white or yellow to brown precipitate coming off the bottom and swirling into solution. Sometimes partially precipitated reagents will resemble microbial growth to the untrained eye. To help differ-entiate precipitate from microbial growth, try warming the solution in your hands or a temperature incubator up to 50 degrees Celsius for 60 minutes. If the precipitate disappears it might well be precipitated reagent. Microbial growth will not dissolve.
Labware for Crystallization Reagent StorageAll labware used to contain and store crystallization reagents must be sterile, free of particulate, of a material that is compatible with the reagent, mini-mize gas and vapor permeability, and where practical, offer optical clarity for content inspection. Crystallization reagents should be protected from light to promote chemical stability. This is the reason Hampton Research kits and reagents are packaged in reclosable boxes.
Polypropylene offers compatibility with crystallization reagents and offers good protection against vapor permeability (evaporation). Hampton Re-search kits are filled into sterile polypropylene tubes and blocks. Some of the Optimize™ reagents are filled into polypropylene for optimal compat-ibility. Most of the Optimize™ reagents are compatible with Polyethylene terephthalate glycol-modified (PETG), and this material offers better optical clarity than polypropylene as well as being a better barrier to gas perme-ability. Polystyrene is inferior to polypropylene and PETG with regard to compatibility, gas and vapor permeability, and should not be used to store crystallization reagents.
Be sure labware is properly closed and sealed before stowing away reagents. Inspect labware (caps and containers) for cracks, and replace as needed. Date all filled containers with the date of receipt so one can readily know the age of the reagent.
Reagent Storage, Stability & LifetimeFollow the reagent maker’s guidelines for reagent storage and expiration. Most crystallization reagents are best if used within 12 months of receipt.
SafetyAlways wear the appropriate safety equipment when handling chemicals.
This might include, but not be limited to safety goggles/glasses/eye ware/face shield, nitrile exam gloves, lab coat and/or safety apron, and non-slip, closed toe footwear.
When working with acids, always measure water first and remember, add acid into water.
Work in a fume hood when handling acids and bases and volatile chemicals and all chemicals where the SDS recommends handling in a fume hood.
Reagent Formulation ExamplesFollowing are examples of how to reproduce 1,000 µl volumes of Hampton Research crystallization screen reagents. Scale to the desired volume. Al-ways add water first to promote the solubility of subsequently added reagents.
Grid Screen Salt HT Reagent 52 (E4)0.8 M Sodium / Potassium phosphate pH 6.9 800 µl Deionized water 70 µl 4.0 M Sodium phosphate monobasic monohydrate 130 µl 4.0 M Potassium phosphate dibasic Make no pH adjustment
Crystal Screen reagent 17 (B5)0.2 M Lithium sulfate monohydrate, 0.1 M TRIS hydrochloride pH 8.5, 30% w/v Polyethylene glycol 4,000 200 µl Deionized water 100 µl 1.0 M TRIS hydrochloride buffer 100 µl 2.0 M Lithium sulfate monohydrate 600 µl 50% w/v Polyethylene glycol 4,000 Make no pH adjustment
Crystal Screen Cryo reagent 12 (A12)0.18 M Magnesium chloride hexahydrate, 0.09 M HEPES sodium pH 7.5, 27% v/v 2-Propanol, 10% v/v Glycerol 440 µl Deionized water 100 µl 1.0 M HEPES sodium pH 7.5 90 µl 2.0 M Magnesium chloride hexahydrate 100 µl 100% Glycerol 270 µl 100% 2-Propanol Make no pH adjustment
GRAS Screen 2 reagent 93 (H9)8% v/v Tacsimate™ pH 7.0, 20% w/v Polyethylene glycol 1,000 520 µl Deionized water 80 µl 100% Tacsimate pH 7.0 400 µl 50% w/v Polyethylene glycol 1,000 Make no pH adjustment
Solutions for Crystal Growth
Reagent Formulationand Handling Crystal Growth 101 page 5
66
References and Readings1. Prudent Practices in the Laboratory. Handling and Disposal of Chemi-
cals. National Academy Press, Washington, D.C., 1995.2. The Laboratory Companion - A Practical Guide to Material, Equip-
ment, and Technique. Gary S. Coyne. John Wiley & Sons, Inc., 1997.3. Buffer Solutions - The Basics. R.J. Beynon and J.S. Easterby. IRL Press
at Oxford University Press, 1996.4. Buffers for pH and Metal Ion Control. DD. Perrin and Boyd Dempsey.
Chapman and Hall, 1974.
Solutions for Crystal Growth
Reagent Formulationand Handling Crystal Growth 101 page 6
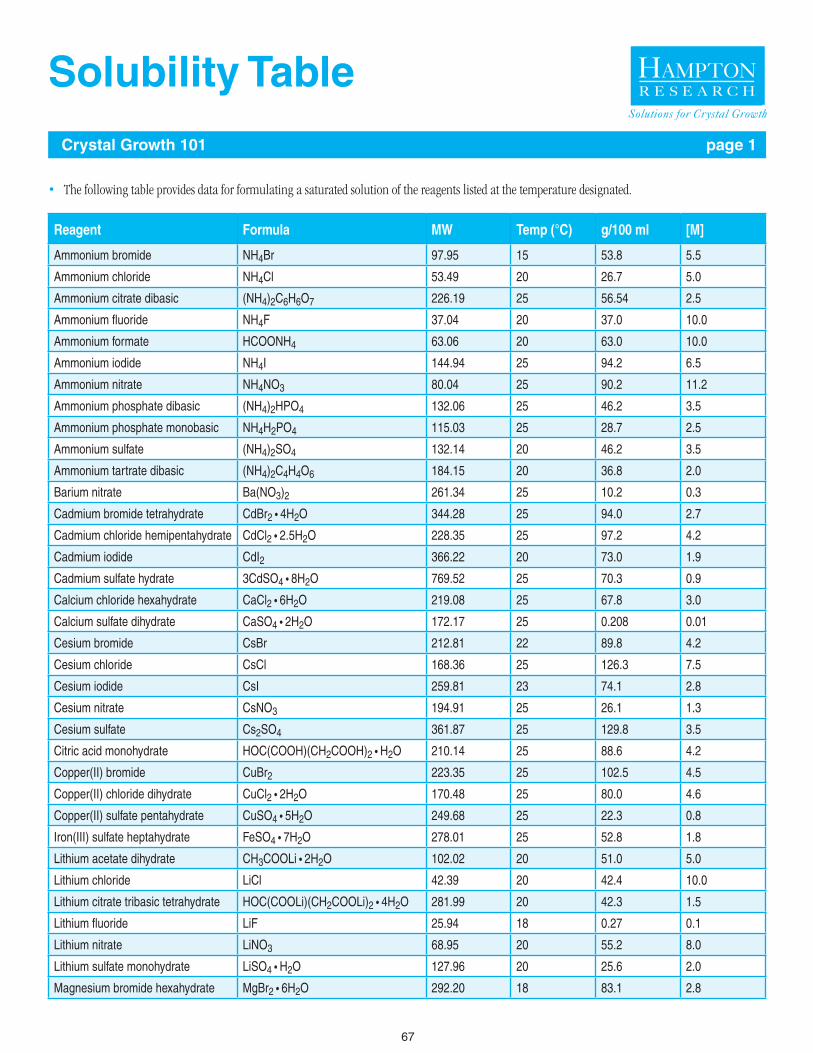
67
Solutions for Crystal Growth
Solubility Table
Crystal Growth 101 page 1
Reagent Formula MW Temp (°C) g/100 ml [M]
Ammonium bromide NH4Br 97.95 15 53.8 5.5
Ammonium chloride NH4Cl 53.49 20 26.7 5.0
Ammonium citrate dibasic (NH4)2C6H6O7 226.19 25 56.54 2.5
Ammonium fluoride NH4F 37.04 20 37.0 10.0
Ammonium formate HCOONH4 63.06 20 63.0 10.0
Ammonium iodide NH4I 144.94 25 94.2 6.5
Ammonium nitrate NH4NO3 80.04 25 90.2 11.2
Ammonium phosphate dibasic (NH4)2HPO4 132.06 25 46.2 3.5
Ammonium phosphate monobasic NH4H2PO4 115.03 25 28.7 2.5
Ammonium sulfate (NH4)2SO4 132.14 20 46.2 3.5
Ammonium tartrate dibasic (NH4)2C4H4O6 184.15 20 36.8 2.0
Barium nitrate Ba(NO3)2 261.34 25 10.2 0.3
Cadmium bromide tetrahydrate CdBr2 • 4H2O 344.28 25 94.0 2.7
Cadmium chloride hemipentahydrate CdCl2 • 2.5H2O 228.35 25 97.2 4.2
Cadmium iodide CdI2 366.22 20 73.0 1.9
Cadmium sulfate hydrate 3CdSO4 • 8H2O 769.52 25 70.3 0.9
Calcium chloride hexahydrate CaCl2 • 6H2O 219.08 25 67.8 3.0
Calcium sulfate dihydrate CaSO4 • 2H2O 172.17 25 0.208 0.01
Cesium bromide CsBr 212.81 22 89.8 4.2
Cesium chloride CsCl 168.36 25 126.3 7.5
Cesium iodide CsI 259.81 23 74.1 2.8
Cesium nitrate CsNO3 194.91 25 26.1 1.3
Cesium sulfate Cs2SO4 361.87 25 129.8 3.5
Citric acid monohydrate HOC(COOH)(CH2COOH)2 • H2O 210.14 25 88.6 4.2
Copper(II) bromide CuBr2 223.35 25 102.5 4.5
Copper(II) chloride dihydrate CuCl2 • 2H2O 170.48 25 80.0 4.6
Copper(II) sulfate pentahydrate CuSO4 • 5H2O 249.68 25 22.3 0.8
Iron(III) sulfate heptahydrate FeSO4 • 7H2O 278.01 25 52.8 1.8
Lithium acetate dihydrate CH3COOLi • 2H2O 102.02 20 51.0 5.0
Lithium chloride LiCl 42.39 20 42.4 10.0
Lithium citrate tribasic tetrahydrate HOC(COOLi)(CH2COOLi)2 • 4H2O 281.99 20 42.3 1.5
Lithium fluoride LiF 25.94 18 0.27 0.1
Lithium nitrate LiNO3 68.95 20 55.2 8.0
Lithium sulfate monohydrate LiSO4 • H2O 127.96 20 25.6 2.0
Magnesium bromide hexahydrate MgBr2 • 6H2O 292.20 18 83.1 2.8
• The following table provides data for formulating a saturated solution of the reagents listed at the temperature designated.
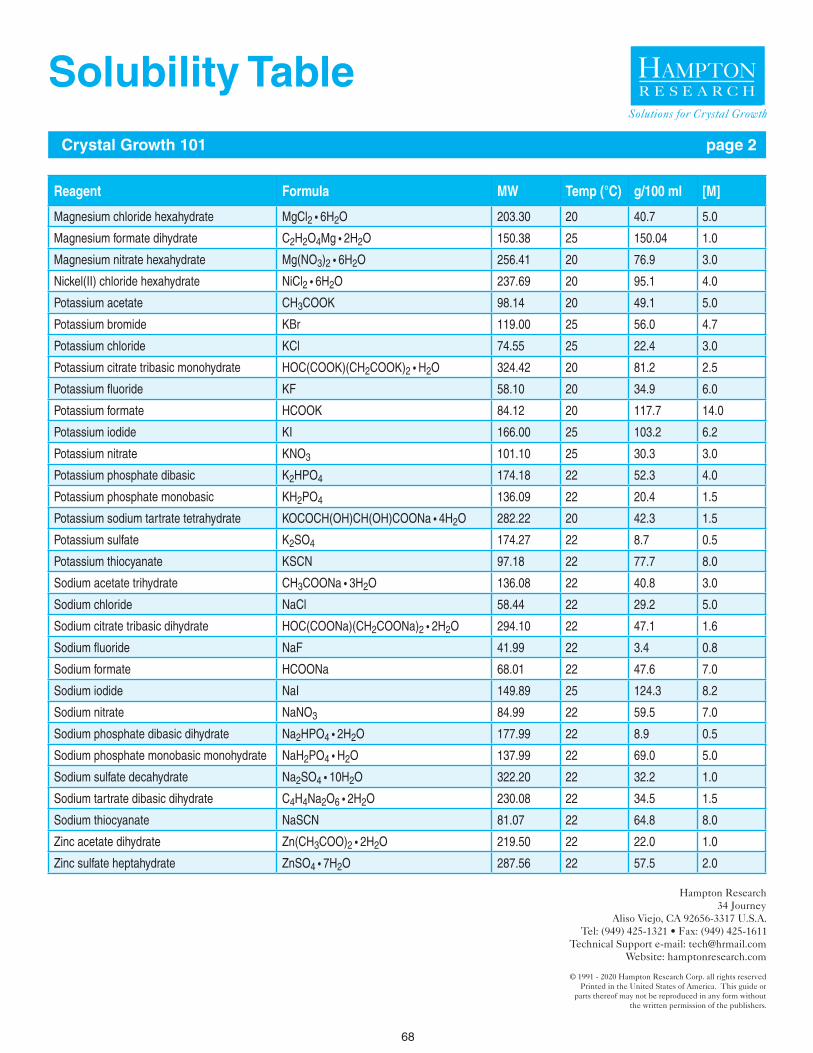
68
Solutions for Crystal Growth
Solubility Table
Crystal Growth 101 page 2
Reagent Formula MW Temp (°C) g/100 ml [M]
Magnesium chloride hexahydrate MgCl2 • 6H2O 203.30 20 40.7 5.0
Magnesium formate dihydrate C2H2O4Mg • 2H2O 150.38 25 150.04 1.0
Magnesium nitrate hexahydrate Mg(NO3)2 • 6H2O 256.41 20 76.9 3.0
Nickel(II) chloride hexahydrate NiCl2 • 6H2O 237.69 20 95.1 4.0
Potassium acetate CH3COOK 98.14 20 49.1 5.0
Potassium bromide KBr 119.00 25 56.0 4.7
Potassium chloride KCl 74.55 25 22.4 3.0
Potassium citrate tribasic monohydrate HOC(COOK)(CH2COOK)2 • H2O 324.42 20 81.2 2.5
Potassium fluoride KF 58.10 20 34.9 6.0
Potassium formate HCOOK 84.12 20 117.7 14.0
Potassium iodide KI 166.00 25 103.2 6.2
Potassium nitrate KNO3 101.10 25 30.3 3.0
Potassium phosphate dibasic K2HPO4 174.18 22 52.3 4.0
Potassium phosphate monobasic KH2PO4 136.09 22 20.4 1.5
Potassium sodium tartrate tetrahydrate KOCOCH(OH)CH(OH)COONa • 4H2O 282.22 20 42.3 1.5
Potassium sulfate K2SO4 174.27 22 8.7 0.5
Potassium thiocyanate KSCN 97.18 22 77.7 8.0
Sodium acetate trihydrate CH3COONa • 3H2O 136.08 22 40.8 3.0
Sodium chloride NaCl 58.44 22 29.2 5.0
Sodium citrate tribasic dihydrate HOC(COONa)(CH2COONa)2 • 2H2O 294.10 22 47.1 1.6
Sodium fluoride NaF 41.99 22 3.4 0.8
Sodium formate HCOONa 68.01 22 47.6 7.0
Sodium iodide NaI 149.89 25 124.3 8.2
Sodium nitrate NaNO3 84.99 22 59.5 7.0
Sodium phosphate dibasic dihydrate Na2HPO4 • 2H2O 177.99 22 8.9 0.5
Sodium phosphate monobasic monohydrate NaH2PO4 • H2O 137.99 22 69.0 5.0
Sodium sulfate decahydrate Na2SO4 • 10H2O 322.20 22 32.2 1.0
Sodium tartrate dibasic dihydrate C4H4Na2O6 • 2H2O 230.08 22 34.5 1.5
Sodium thiocyanate NaSCN 81.07 22 64.8 8.0
Zinc acetate dihydrate Zn(CH3COO)2 • 2H2O 219.50 22 22.0 1.0
Zinc sulfate heptahydrate ZnSO4 • 7H2O 287.56 22 57.5 2.0
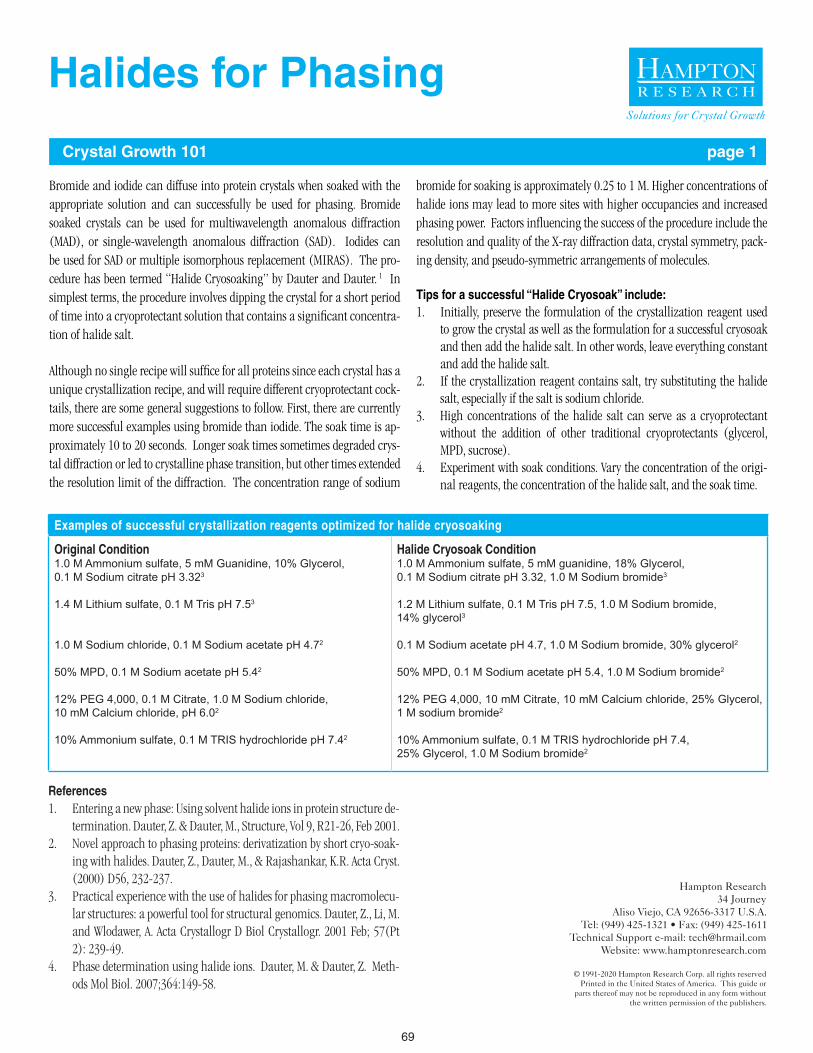
69
Solutions for Crystal Growth
Bromide and iodide can diffuse into protein crystals when soaked with the appropriate solution and can successfully be used for phasing. Bromide soaked crystals can be used for multiwavelength anomalous diffraction (MAD), or single-wavelength anomalous diffraction (SAD). Iodides can be used for SAD or multiple isomorphous replacement (MIRAS). The pro-cedure has been termed “Halide Cryosoaking” by Dauter and Dauter. 1 In simplest terms, the procedure involves dipping the crystal for a short period of time into a cryoprotectant solution that contains a significant concentra-tion of halide salt.
Although no single recipe will suffice for all proteins since each crystal has a unique crystallization recipe, and will require different cryoprotectant cock-tails, there are some general suggestions to follow. First, there are currently more successful examples using bromide than iodide. The soak time is ap-proximately 10 to 20 seconds. Longer soak times sometimes degraded crys-tal diffraction or led to crystalline phase transition, but other times extended the resolution limit of the diffraction. The concentration range of sodium
bromide for soaking is approximately 0.25 to 1 M. Higher concentrations of halide ions may lead to more sites with higher occupancies and increased phasing power. Factors influencing the success of the procedure include the resolution and quality of the X-ray diffraction data, crystal symmetry, pack-ing density, and pseudo-symmetric arrangements of molecules.
Tips for a successful “Halide Cryosoak” include:1. Initially, preserve the formulation of the crystallization reagent used
to grow the crystal as well as the formulation for a successful cryosoak and then add the halide salt. In other words, leave everything constant and add the halide salt.
2. If the crystallization reagent contains salt, try substituting the halide salt, especially if the salt is sodium chloride.
3. High concentrations of the halide salt can serve as a cryoprotectant without the addition of other traditional cryoprotectants (glycerol, MPD, sucrose).
4. Experiment with soak conditions. Vary the concentration of the origi-nal reagents, the concentration of the halide salt, and the soak time.
Examples of successful crystallization reagents optimized for halide cryosoaking
Original Condition1.0 M Ammonium sulfate, 5 mM Guanidine, 10% Glycerol, 0.1 M Sodium citrate pH 3.323
1.4 M Lithium sulfate, 0.1 M Tris pH 7.53
1.0 M Sodium chloride, 0.1 M Sodium acetate pH 4.72
50% MPD, 0.1 M Sodium acetate pH 5.42
12% PEG 4,000, 0.1 M Citrate, 1.0 M Sodium chloride, 10 mM Calcium chloride, pH 6.02
10% Ammonium sulfate, 0.1 M TRIS hydrochloride pH 7.42
Halide Cryosoak Condition1.0 M Ammonium sulfate, 5 mM guanidine, 18% Glycerol, 0.1 M Sodium citrate pH 3.32, 1.0 M Sodium bromide3
1.2 M Lithium sulfate, 0.1 M Tris pH 7.5, 1.0 M Sodium bromide, 14% glycerol3
0.1 M Sodium acetate pH 4.7, 1.0 M Sodium bromide, 30% glycerol2
50% MPD, 0.1 M Sodium acetate pH 5.4, 1.0 M Sodium bromide2
12% PEG 4,000, 10 mM Citrate, 10 mM Calcium chloride, 25% Glycerol, 1 M sodium bromide2
10% Ammonium sulfate, 0.1 M TRIS hydrochloride pH 7.4, 25% Glycerol, 1.0 M Sodium bromide2
Halides for Phasing
Crystal Growth 101 page 1
References1. Entering a new phase: Using solvent halide ions in protein structure de-
termination. Dauter, Z. & Dauter, M., Structure, Vol 9, R21-26, Feb 2001.2. Novel approach to phasing proteins: derivatization by short cryo-soak-
ing with halides. Dauter, Z., Dauter, M., & Rajashankar, K.R. Acta Cryst. (2000) D56, 232-237.
3. Practical experience with the use of halides for phasing macromolecu-lar structures: a powerful tool for structural genomics. Dauter, Z., Li, M. and Wlodawer, A. Acta Crystallogr D Biol Crystallogr. 2001 Feb; 57(Pt 2): 239-49.
4. Phase determination using halide ions. Dauter, M. & Dauter, Z. Meth-ods Mol Biol. 2007;364:149-58.
Related Documents


