LETTER doi:10.1038/nature10083 Cryptic genetic variation promotes rapid evolutionary adaptation in an RNA enzyme Eric J. Hayden 1,2 , Evandro Ferrada 1,2 & Andreas Wagner 1,2,3 Cryptic variation is caused by the robustness of phenotypes to muta- tions 1 . Cryptic variation has no effect on phenotypes in a given genetic or environmental background, but it can have effects after mutations or environmental change 2–5 . Because evolutionary adaptation by natural selection requires phenotypic variation, phenotypically revealed cryptic genetic variation may facilitate evolutionary adap- tation 6–8 . This is possible if the cryptic variation happens to be pre-adapted, or ‘‘exapted’’ 9 , to a new environment, and is thus advant- ageous once revealed. However, this facilitating role for cryptic vari- ation has not been proven, partly because most pertinent work focuses on complex phenotypes of whole organisms whose genetic basis is incompletely understood. Here we show that populations of RNA enzymes with accumulated cryptic variation adapt more rapidly to a new substrate than a population without cryptic variation. A detailed analysis of our evolving RNA populations in genotype space shows that cryptic variation allows a population to explore new geno- types that become adaptive only in a new environment. Our observa- tions show that cryptic variation contains new genotypes pre-adapted to a changed environment. Our results highlight the positive role that robustness and epistasis can have in adaptive evolution 10,11 . For our evolution experiments, we chose the well-characterized group I RNA enzyme (ribozyme) derived from the Azoarcus pre- tRNA Ile . This ribozyme retains activity at unusually high temperatures (80 uC), or in the presence of high concentrations of denaturants (7.5 M urea) 12 . Thus, we expected this robust phenotype to tolerate mutations without losing function, making it an ideal candidate for the experimental study of cryptic variation. In addition, detailed func- tional and structural data on the Azoarcus ribozyme provide guidance for designing and interpreting in vitro evolution experiments 13–16 . We used an in vitro procedure for the evolution of a group I intron 17,18 . In this procedure, populations of RNA molecules evolve on the basis of Darwinian principles, through cycles of random mutagenesis and selection based on the preservation of sequences that successfully per- form a catalytic task (Supplementary Fig. 1). To produce cryptic variation, we exposed ribozyme populations to mutagenesis followed by purifying selection for the ‘native’ activity of RNA phosphate bond cleavage (Supplementary Fig. 1b). We introduced mutations at an average rate of one mutation per individual per generation (Methods). We expected that evolving populations would accumulate mutations while maintaining the native function. We carried out two independent evolution experiments, and called them ‘‘line A’’ and ‘‘line B’’. They were identical except for the addition of a denaturant (5 M formamide) to line B, which in terms of structural stability is analogous to increasing the temperature by 13.5 uC (ref. 19; Supplementary Fig. 2). We monitored the native activity of the two lines over ten genera- tions of purifying selection while introducing mutations at every generation (Fig. 1a). No significant difference in activity (t-test, 95% confidence interval) exists between the initial and final round of selec- tion for both lines. This demonstrates that the procedure was main- taining the native activity of the population despite mutagenesis, and supports the cryptic nature of any accumulated mutations. We confirmed mutation accumulation through DNA sequencing of 2,748 6 770 molecules sampled from each generation (Methods). We determined the mutational distance between individuals in the popu- lations and the original wild-type sequence, which confirmed an increase in population distance from the wild-type sequence over time (Fig. 1b, c). By generation 10 less than 1% of the sampled individuals had no mutations (Supplementary Fig. 3). Mutation accumulation varied at each position in the ribozyme sequence; 35 positions in line A and 19 positions in line B were ‘‘mutable’’, with a rate of accumula- tion significantly greater than zero (Methods). Of these positions, 15 were common to both lines. Although the accumulated mutations did not affect the phenotype of the population under ‘native’ conditions, we proposed that they could facilitate evolutionary adaptation to a new chemical environment. 1 Institute of Evolutionary Biology and Environmental Studies, University of Zurich, 8057 Zurich, Switzerland. 2 The Swiss Institute of Bioinformatics, Quartier Sorge-Batiment Genopode, 1015 Lausanne, Switzerland. 3 The Santa Fe Institute, 1399 Hyde Park Road, Santa Fe, New Mexico 87501, USA. a b c 0 2 4 6 8 10 0 2 4 6 8 10 0% 10% 20% 30% 0% 10% 20% 30% G1 G10 Time G1 G10 Time 1 2 3 4 5 6 7 8 9 10 0.2 0.3 0.4 0.5 Fraction of ribozyme reacted Frequency Time (generations) Line A Line B Distance Distance Figure 1 | Evolution during selection for the native activity. a, Activity (fraction of ribozyme reacted) at each generation under conditions used during selection for the native activity (RNA oligonucleotide cleavage) over 10 generations (Methods). Error bars correspond to standard errors of three measurements. b, c, Histograms, from each generation of line A and B, showing the frequency (percent of sample) of individuals with a given number of nucleotide differences from the wild-type sequence (distance). Frequencies from generations 1 (G1) and 10 (G10) are shown as solid lines, and intervening generations are shown as dotted grey lines. 92 | NATURE | VOL 474 | 2 JUNE 2011 Macmillan Publishers Limited. All rights reserved ©2011

Welcome message from author
This document is posted to help you gain knowledge. Please leave a comment to let me know what you think about it! Share it to your friends and learn new things together.
Transcript
LETTERdoi:10.1038/nature10083
Cryptic genetic variation promotes rapidevolutionary adaptation in an RNA enzymeEric J. Hayden1,2, Evandro Ferrada1,2 & Andreas Wagner1,2,3
Cryptic variation is caused by the robustness of phenotypes to muta-tions1. Cryptic variation has no effect on phenotypes in a given geneticor environmental background, but it can have effects after mutationsor environmental change2–5. Because evolutionary adaptation bynatural selection requires phenotypic variation, phenotypicallyrevealed cryptic genetic variation may facilitate evolutionary adap-tation6–8. This is possible if the cryptic variation happens to bepre-adapted, or ‘‘exapted’’9, to a new environment, and is thus advant-ageous once revealed. However, this facilitating role for cryptic vari-ation has not been proven, partly because most pertinent workfocuses on complex phenotypes of whole organisms whose geneticbasis is incompletely understood. Here we show that populations ofRNA enzymes with accumulated cryptic variation adapt more rapidlyto a new substrate than a population without cryptic variation. Adetailed analysis of our evolving RNA populations in genotype spaceshows that cryptic variation allows a population to explore new geno-types that become adaptive only in a new environment. Our observa-tions show that cryptic variation contains new genotypes pre-adaptedto a changed environment. Our results highlight the positive role thatrobustness and epistasis can have in adaptive evolution10,11.
For our evolution experiments, we chose the well-characterizedgroup I RNA enzyme (ribozyme) derived from the Azoarcus pre-tRNAIle. This ribozyme retains activity at unusually high temperatures(80 uC), or in the presence of high concentrations of denaturants(7.5 M urea)12. Thus, we expected this robust phenotype to toleratemutations without losing function, making it an ideal candidate for theexperimental study of cryptic variation. In addition, detailed func-tional and structural data on the Azoarcus ribozyme provide guidancefor designing and interpreting in vitro evolution experiments13–16. Weused an in vitro procedure for the evolution of a group I intron17,18. Inthis procedure, populations of RNA molecules evolve on the basis ofDarwinian principles, through cycles of random mutagenesis andselection based on the preservation of sequences that successfully per-form a catalytic task (Supplementary Fig. 1).
To produce cryptic variation, we exposed ribozyme populations tomutagenesis followed by purifying selection for the ‘native’ activity ofRNA phosphate bond cleavage (Supplementary Fig. 1b). We introducedmutationsatanaverage rate ofone mutationper individual pergeneration(Methods). We expected that evolving populations would accumulatemutations while maintaining the native function. We carried out twoindependent evolution experiments, and called them ‘‘line A’’ and ‘‘lineB’’. They were identical except for the addition of a denaturant (5 Mformamide) to line B, which in terms of structural stability is analogousto increasing the temperature by 13.5 uC (ref. 19; Supplementary Fig. 2).
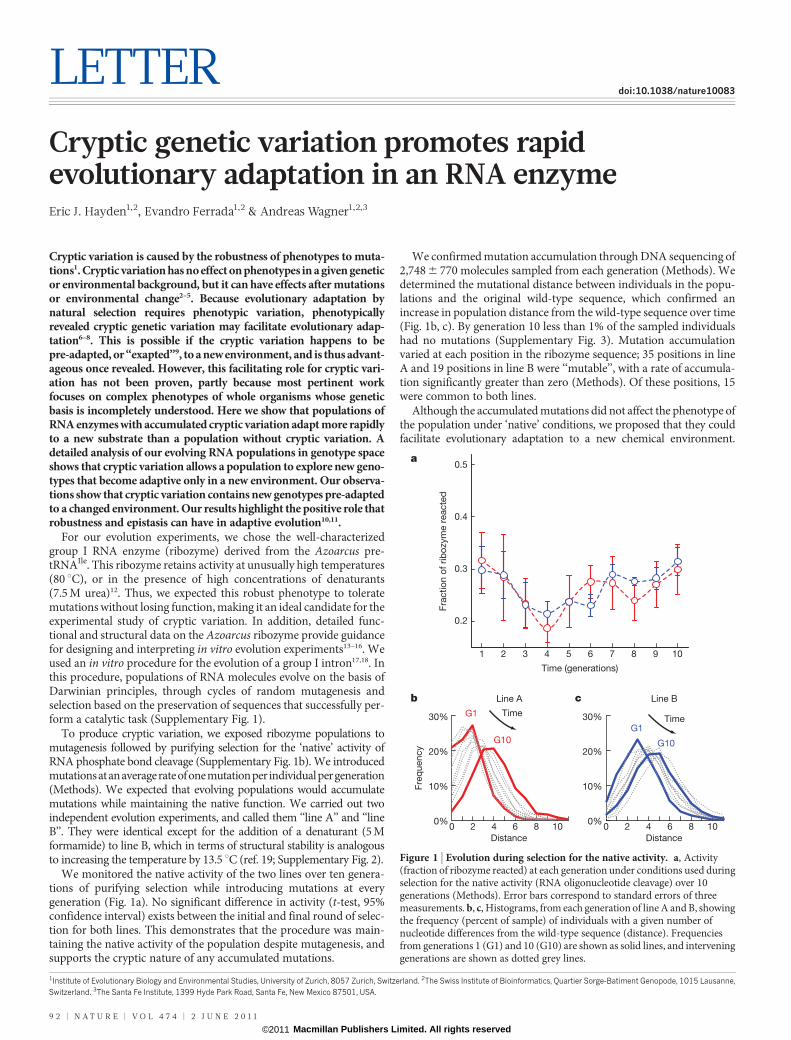
We monitored the native activity of the two lines over ten genera-tions of purifying selection while introducing mutations at everygeneration (Fig. 1a). No significant difference in activity (t-test, 95%confidence interval) exists between the initial and final round of selec-tion for both lines. This demonstrates that the procedure was main-taining the native activity of the population despite mutagenesis, andsupports the cryptic nature of any accumulated mutations.
We confirmed mutation accumulation through DNA sequencing of2,748 6 770 molecules sampled from each generation (Methods). Wedetermined the mutational distance between individuals in the popu-lations and the original wild-type sequence, which confirmed anincrease in population distance from the wild-type sequence over time(Fig. 1b, c). By generation 10 less than 1% of the sampled individualshad no mutations (Supplementary Fig. 3). Mutation accumulationvaried at each position in the ribozyme sequence; 35 positions in lineA and 19 positions in line B were ‘‘mutable’’, with a rate of accumula-tion significantly greater than zero (Methods). Of these positions, 15were common to both lines.
Although the accumulated mutations did not affect the phenotype ofthe population under ‘native’ conditions, we proposed that they couldfacilitate evolutionary adaptation to a new chemical environment.
1Institute of Evolutionary Biology and Environmental Studies, University of Zurich, 8057 Zurich, Switzerland. 2The Swiss Institute of Bioinformatics, Quartier Sorge-Batiment Genopode, 1015 Lausanne,Switzerland. 3The Santa Fe Institute, 1399 Hyde Park Road, Santa Fe, New Mexico 87501, USA.
a
b c
0 2 4 6 8 10 0 2 4 6 8 100%
10%
20%
30%
0%
10%
20%
30%G1
G10
Time
G1
G10
Time
1 2 3 4 5 6 7 8 9 10
0.2
0.3
0.4
0.5
Fra
ctio
n o
f rib
ozym
e r
eacte
d
Fre
quency
Time (generations)
Line A Line B
Distance Distance
Figure 1 | Evolution during selection for the native activity. a, Activity(fraction of ribozyme reacted) at each generation under conditions used duringselection for the native activity (RNA oligonucleotide cleavage) over 10generations (Methods). Error bars correspond to standard errors of threemeasurements. b, c, Histograms, from each generation of line A and B, showingthe frequency (percent of sample) of individuals with a given number ofnucleotide differences from the wild-type sequence (distance). Frequenciesfrom generations 1 (G1) and 10 (G10) are shown as solid lines, and interveninggenerations are shown as dotted grey lines.
9 2 | N A T U R E | V O L 4 7 4 | 2 J U N E 2 0 1 1
Macmillan Publishers Limited. All rights reserved©2011

Thus, we challenged the resulting populations to adapt to a non-nativefunction by changing the substrate in the selection procedure. We chosean RNA substrate with identical sequence, but with a phosphorothioatereplacing the scissile phosphate. This chemical change represents a‘‘promiscuous activity’’20 of the Azoarcus ribozyme with a ,200%decreased catalytic efficiency (kcat/Km), by mostly affecting kcat (ref. 13).We started new evolution lines from ,1013 (20 pmol) RNA moleculestaken from the last generation of line A and line B. We called these linesNew-A and New-B, respectively. In addition, we started another newline from a sample of ,1013 RNA molecules taken from the originalinitial population. We called this line New-WT. In this phase of theexperiment we wanted to analyse the effect of previously accumulatedmutations on evolutionary adaptation to the new substrate. Thus, weused the same reaction conditions for all three lines, and reduced themutation rate to ,0.16 per individual per generation, by replacing themutagenic PCR step of our selection procedure with a standard PCR(Methods).
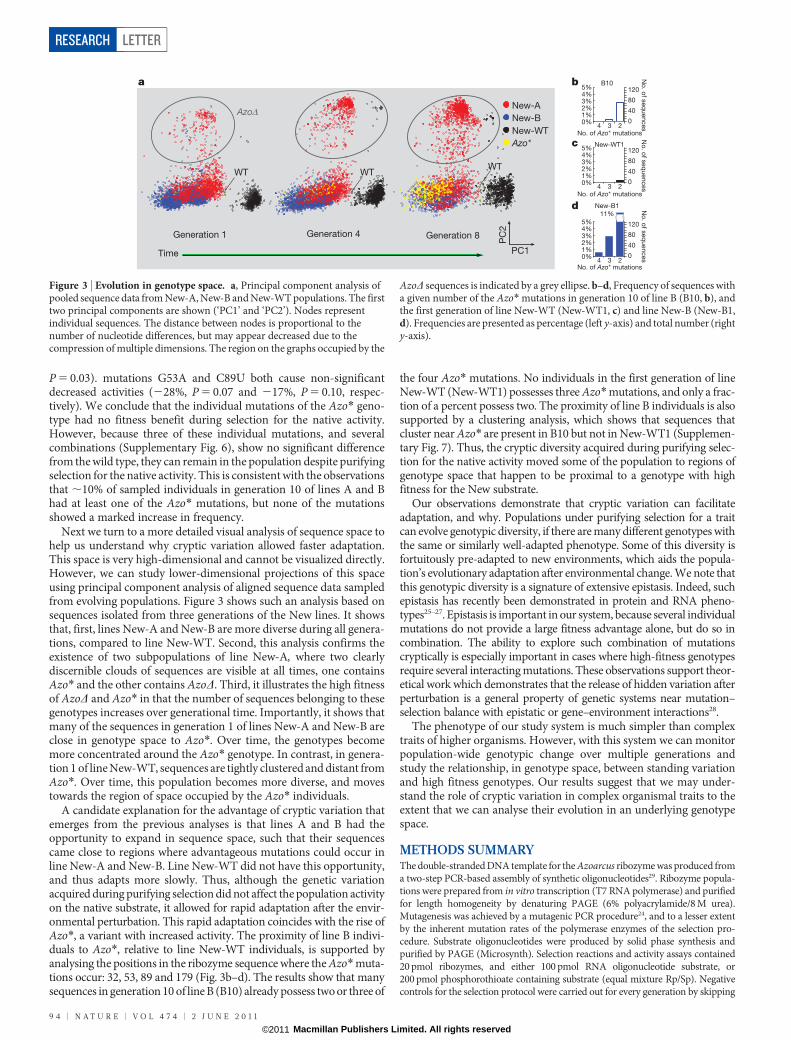
We selected for activity with the new substrate during eight genera-tions, and measured the activity of each population at each generation(Fig. 2a). In each line the activity increased significantly between thefirst and last generations. However, lines New-A and New-B showed amuch faster rate of adaptation than line New-WT. We calculated therate of adaptation by dividing the percent increase in the fraction ofribozyme reacted by time (generations). The greatest difference in rateis found at generation 5, where the rates of adaptation for lines New-A,New-B and New-WT were 19.5, 15.5, and 2.5, respectively, corres-ponding to an ,eightfold faster rate of evolutionary adaptation forline New-A, and an ,sixfold faster rate for line New-B, relative to lineNew-WT.
Next we identified genotypes (combinations of mutations) that werepotentially contributing to the increasing activities of the evolvingpopulations on the basis of their rapid frequency increase within thepopulation (Methods). Two important genotypes stand out (Fig. 2b).In line New-A, the most rapidly increasing genotype, termed AzoD,includes deletions at positions 47–53 combined with seven point muta-tions (G31U, G35U, G70U, G121A, C141U, A144G and G183C). Bygeneration 8, this genotype represented 31% of the population. In line
New-B, the most rapidly increasing genotype, termed Azo*, is com-posed of four point mutations (G32U, G53A, C89U and G179C). Bygeneration 8, sequences containing all four mutations accounted for23% of the population, and various subsets of these four mutationsaccounted for 78% of the population. All pairs of mutations of eachgenotype showed significant correlation coefficients21 (P , 0.05, chi-squared), supporting the conclusion that each combination of muta-tions usually occurs together in the same individual (SupplementaryTable 1).
To confirm the selective advantage of these genotypes, we synthe-sized clonal transcripts of the AzoD, Azo* and wild-type ribozymes forkinetic analysis (Methods). For the Azo* ribozyme, we found anincreased activity with a phosphorothioate substrate as compared tothe wild-type Azoarcus ribozyme (Fig. 2c). The four mutations of Azo*increase the observed rate constant (kobs) by 131%, and also increasethe extent of ribozyme reacted by 76%. Thus, the presence of thisgenotype in the population accounts for much of the increasing activityof line New-B.
Surprisingly, the clonal preparation of the AzoD ribozyme showedno activity towards the phosphorothioate substrate. We proposed thatthis sequence lacked the ability to fold into the native state individually,but could form an active complex in conjunction with other activeribozymes. Such an intermolecular partnership was observed in severalother ribozyme experiments22–24. To test this hypothesis, we assayed theAzoD ribozyme for activity with a phosphorothioate substrate alone, orin the presence of either the wild-type or the Azo* ribozymes (Fig. 2d).In these experiments, only the AzoD ribozyme was 59-radiolabled with32P, so that only the activity of this ribozyme was observable on adenaturing polyacrylamide gel. The results confirm that although theAzoD ribozyme is inactive individually, it regains activity upon additionof either active variant.
We also looked for the presence of the highly active Azo* genotypein lines New-A and New-WT. In line New-A, Azo* is present andincreases in frequency from 1.1% to 8.0% over eight generations(Fig. 2b). The lower fitness of Azo* in this line is presumably due tothe presence of individually inactive, yet highly fit AzoD variants.Because the increase in the frequency of Azo* is modest in this line,linear regression had not identified the four mutations as individuallysignificant, which demonstrates a limitation of the regressionapproach.
Although the Azo* genotype showed increased activity with thephosphorothioate substrate, this genotype did not rise to high fre-quency in line New-WT, which had not acquired cryptic variation.This genotype did not appear in the first three generations, and wefound only three individuals in generation 8 (0.2% of sample). Analysisof correlation coefficients in line New-WT confirms that Azo* muta-tions rarely occur together in the same individual (SupplementaryTable 1).
Although the Azo* genotype has an increased activity in the newenvironment, our data indicate that the mutations that comprise thisgenotype had no advantage in the native environment. First, the com-posite activities of the populations of lines A and B did not increaseduring selection for the native activity, indicating that these lines hadnot yet discovered higher fitness genotypes. Also, the individual muta-tions of the Azo* genotype do not dramatically increase in frequencyduring selection for the native activity (Supplementary Figs 4 and 5),and the Azo* genotype (all four mutations) was not detected in line Aor B.
To confirm the cryptic nature of the Azo* mutations, we engineeredthese mutations individually into the Azoarcus ribozyme. We thendetermined the activity of these variants under the conditions usedduring selection for the native activity (no formamide) and comparedthem to the wild-type activity (Supplementary Fig. 6). Only G179Ccauses an increased mean activity (14%), but that is not significantlydifferent from the activity of the wild-type ribozyme (P 5 0.11, t-test).mutation C32U causes a significantly decreased activity (233%,
1 2 3 4 5 6 7 8
0.2
0.3
0.4
0.5
a
1 2 3 4
1 2 3 4
5 6 7 80%
10%
20%
30%
40%
b
dcComparison of kinetic parameters for the
wild-type Azoarcus and Azo* ribozymes
Parameter WT Azo Azo*
kobs (min–1) 0.20 ± 0.03 0.46 ± 0.03
Extent (%) 23 ± 0.003 41 ± 0.008
Azo (New-A) w = 1.46ΔAzo* (New-B) w = 1.82
G53A C179G (New-WT) w = 2.15
Azo* (New-A) w = 1.35
Reacted
Unreacted
AzoΔ
Rela
tive f
req
uency
Fra
ctio
n o
f rib
ozym
e r
eacte
d
Time (generations)
Generation
No S+
WT+
Azo*
Figure 2 | Evolution during selection for the new activity. a, Activity(fraction of ribozyme reacted) at each generation under conditions used duringselection for phosphorothioate bond cleavage, with standard error based onthree measurements. b, Frequency of genotypes (percent of sample) over time(generations), and their corresponding relative fitness w. c, Comparison ofkinetic parameters for the Azo* and wild-type ribozymes. d, Intermolecularactivity of the AzoD ribozyme, under the same conditions as during selection(Methods): 200 pmol phosphorothioate substrate, 20 pmol 59-[32P]-labelledAzoD. In addition, lanes 3 and 4 contained 40 pmol wild-type and Azo*,respectively. The negative control ‘No S’ contained no substrate.
LETTER RESEARCH
2 J U N E 2 0 1 1 | V O L 4 7 4 | N A T U R E | 9 3
Macmillan Publishers Limited. All rights reserved©2011
P 5 0.03). mutations G53A and C89U both cause non-significantdecreased activities (228%, P 5 0.07 and 217%, P 5 0.10, respec-tively). We conclude that the individual mutations of the Azo* geno-type had no fitness benefit during selection for the native activity.However, because three of these individual mutations, and severalcombinations (Supplementary Fig. 6), show no significant differencefrom the wild type, they can remain in the population despite purifyingselection for the native activity. This is consistent with the observationsthat ,10% of sampled individuals in generation 10 of lines A and Bhad at least one of the Azo* mutations, but none of the mutationsshowed a marked increase in frequency.
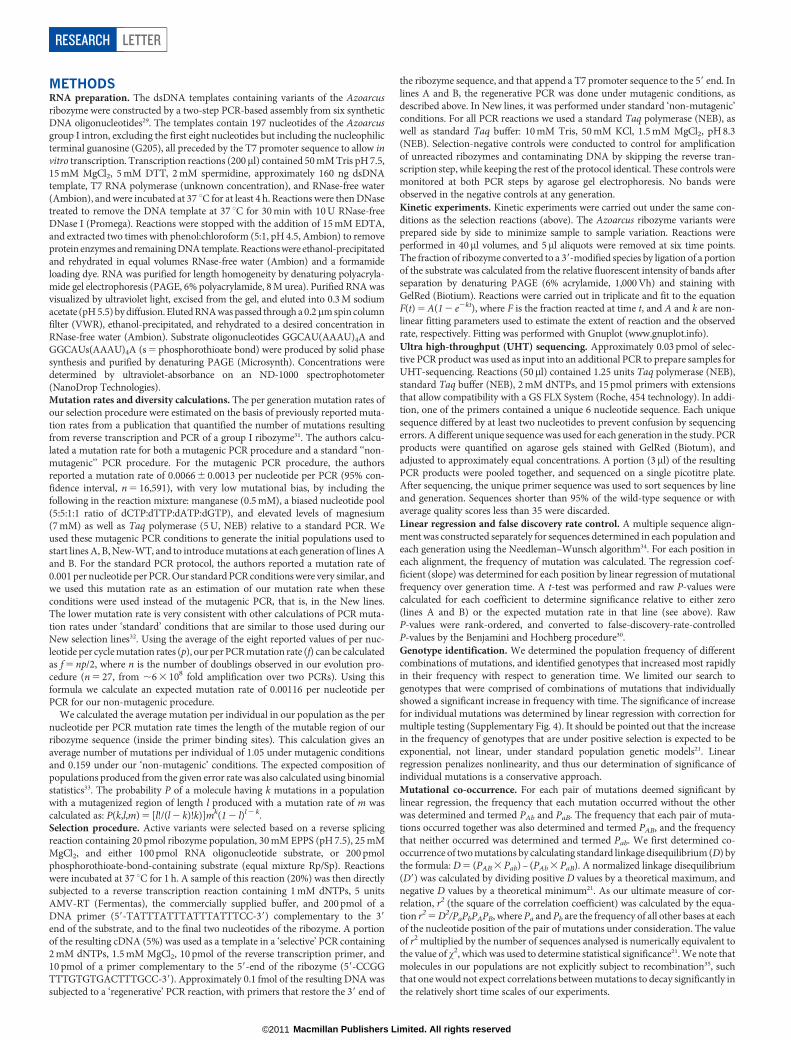
Next we turn to a more detailed visual analysis of sequence space tohelp us understand why cryptic variation allowed faster adaptation.This space is very high-dimensional and cannot be visualized directly.However, we can study lower-dimensional projections of this spaceusing principal component analysis of aligned sequence data sampledfrom evolving populations. Figure 3 shows such an analysis based onsequences isolated from three generations of the New lines. It showsthat, first, lines New-A and New-B are more diverse during all genera-tions, compared to line New-WT. Second, this analysis confirms theexistence of two subpopulations of line New-A, where two clearlydiscernible clouds of sequences are visible at all times, one containsAzo* and the other contains AzoD. Third, it illustrates the high fitnessof AzoD and Azo* in that the number of sequences belonging to thesegenotypes increases over generational time. Importantly, it shows thatmany of the sequences in generation 1 of lines New-A and New-B areclose in genotype space to Azo*. Over time, the genotypes becomemore concentrated around the Azo* genotype. In contrast, in genera-tion 1 of line New-WT, sequences are tightly clustered and distant fromAzo*. Over time, this population becomes more diverse, and movestowards the region of space occupied by the Azo* individuals.
A candidate explanation for the advantage of cryptic variation thatemerges from the previous analyses is that lines A and B had theopportunity to expand in sequence space, such that their sequencescame close to regions where advantageous mutations could occur inline New-A and New-B. Line New-WT did not have this opportunity,and thus adapts more slowly. Thus, although the genetic variationacquired during purifying selection did not affect the population activityon the native substrate, it allowed for rapid adaptation after the envir-onmental perturbation. This rapid adaptation coincides with the rise ofAzo*, a variant with increased activity. The proximity of line B indivi-duals to Azo*, relative to line New-WT individuals, is supported byanalysing the positions in the ribozyme sequence where the Azo* muta-tions occur: 32, 53, 89 and 179 (Fig. 3b–d). The results show that manysequences in generation 10 of line B (B10) already possess two or three of
the four Azo* mutations. No individuals in the first generation of lineNew-WT (New-WT1) possesses three Azo* mutations, and only a frac-tion of a percent possess two. The proximity of line B individuals is alsosupported by a clustering analysis, which shows that sequences thatcluster near Azo* are present in B10 but not in New-WT1 (Supplemen-tary Fig. 7). Thus, the cryptic diversity acquired during purifying selec-tion for the native activity moved some of the population to regions ofgenotype space that happen to be proximal to a genotype with highfitness for the New substrate.
Our observations demonstrate that cryptic variation can facilitateadaptation, and why. Populations under purifying selection for a traitcan evolve genotypic diversity, if there are many different genotypes withthe same or similarly well-adapted phenotype. Some of this diversity isfortuitously pre-adapted to new environments, which aids the popula-tion’s evolutionary adaptation after environmental change. We note thatthis genotypic diversity is a signature of extensive epistasis. Indeed, suchepistasis has recently been demonstrated in protein and RNA pheno-types25–27. Epistasis is important in our system, because several individualmutations do not provide a large fitness advantage alone, but do so incombination. The ability to explore such combination of mutationscryptically is especially important in cases where high-fitness genotypesrequire several interacting mutations. These observations support theor-etical work which demonstrates that the release of hidden variation afterperturbation is a general property of genetic systems near mutation–selection balance with epistatic or gene–environment interactions28.
The phenotype of our study system is much simpler than complextraits of higher organisms. However, with this system we can monitorpopulation-wide genotypic change over multiple generations andstudy the relationship, in genotype space, between standing variationand high fitness genotypes. Our results suggest that we may under-stand the role of cryptic variation in complex organismal traits to theextent that we can analyse their evolution in an underlying genotypespace.
METHODS SUMMARYThe double-stranded DNA template for the Azoarcus ribozyme was produced froma two-step PCR-based assembly of synthetic oligonucleotides29. Ribozyme popula-tions were prepared from in vitro transcription (T7 RNA polymerase) and purifiedfor length homogeneity by denaturing PAGE (6% polyacrylamide/8 M urea).Mutagenesis was achieved by a mutagenic PCR procedure24, and to a lesser extentby the inherent mutation rates of the polymerase enzymes of the selection pro-cedure. Substrate oligonucleotides were produced by solid phase synthesis andpurified by PAGE (Microsynth). Selection reactions and activity assays contained20 pmol ribozymes, and either 100 pmol RNA oligonucleotide substrate, or200 pmol phosphorothioate containing substrate (equal mixture Rp/Sp). Negativecontrols for the selection protocol were carried out for every generation by skipping
4 3 20%1%2%3%4%5%
0
40
80
120
4 3 20%1%2%3%4%5%
0
40
80
120
4 3 20%1%2%3%4%5%
0
40
80
120
Time PC1
New-B
New-WT
New-A
Azo*
Generation 1 Generation 4 Generation 8
ba
c
d
No. of Azo* mutations
No. of Azo* mutations
No. of Azo* mutations
B10
New-WT1
New-B1
No
. of s
eq
uen
ces
No
. of s
eq
uen
ces
No
. of s
eq
uen
ces
11%
WT WTWT
AzoΔ
PC
2
Figure 3 | Evolution in genotype space. a, Principal component analysis ofpooled sequence data from New-A, New-B and New-WT populations. The firsttwo principal components are shown (‘PC1’ and ‘PC2’). Nodes representindividual sequences. The distance between nodes is proportional to thenumber of nucleotide differences, but may appear decreased due to thecompression of multiple dimensions. The region on the graphs occupied by the
AzoD sequences is indicated by a grey ellipse. b–d, Frequency of sequences witha given number of the Azo* mutations in generation 10 of line B (B10, b), andthe first generation of line New-WT (New-WT1, c) and line New-B (New-B1,d). Frequencies are presented as percentage (left y-axis) and total number (righty-axis).
RESEARCH LETTER
9 4 | N A T U R E | V O L 4 7 4 | 2 J U N E 2 0 1 1
Macmillan Publishers Limited. All rights reserved©2011

the reverse transcription step, but keeping the remainder of the protocol identical,and were monitored at both PCR steps by agarose gel electrophoresis. No band wasever observed in a negative control. Kinetic parameters were determined bynonlinear curve fitting of time course data (Methods). Complementary DNAsamples from each generation were appended with a primer sequence unique tothat generation via a PCR reaction. Samples from all generations were combined andsequenced on a single picotitre plate with a GS-FLX system (Roche /454 LifeSciences) at the Functional Genomics Facility, Zurich. P-values from linear regres-sion were adjusted for multiple testing using the Benjamini Hochberg procedure30.Principle component analysis was performed using the princomp function in Matlabon multiple sequence alignments of data from pooled generations.
Full Methods and any associated references are available in the online version ofthe paper at www.nature.com/nature.
Received 29 September 2010; accepted 1 April 2011.
1. Wagner, A. Robustness and Evolvability in Living Systems. (Princeton UniversityPress, 2005).
2. Gibson, G. & Dworkin, I. Uncovering cryptic genetic variation. Nature Rev. Genet. 5,681–690 (2004).
3. Waddington, C. H. Genetic assimilation of an acquired character. Evolution 7,118–126 (1953).
4. Rutherford, S. L. From genotype to phenotype: buffering mechanisms and thestorage of genetic information. Bioessays 22, 1095–1105 (2000).
5. Le Rouzic, A. & Carlborg, O. Evolutionary potential of hidden genetic variation.Trends Ecol. Evol. 23, 33–37 (2008).
6. Rutherford, S. L. & Lindquist, S. Hsp90 as a capacitor for morphological evolution.Nature 396, 336–342 (1998).
7. True, H. L. & Lindquist, S. L. A yeast prion provides a mechanism for geneticvariation and phenotypic diversity. Nature 407, 477–483 (2000).
8. Masel, J. Cryptic genetic variation is enriched for potential adaptations. Genetics172, 1985–1991 (2006).
9. Gould, S. J. & Vrba, E. S. Exaptation—a missing term in the science of form.Paleobiology 8, 4–15 (1982).
10. Aharoni, A. et al. The ‘evolvability’ of promiscuous protein functions. Nature Genet.37, 73–76 (2004).
11. Bloom, J. D., Labthavikul, S. T., Otey, C. R. & Arnold, F. H. Protein stability promotesevolvability. Proc. Natl Acad. Sci. USA 103, 5869–5874 (2006).
12. Tanner, M. & Cech, T. Activity and thermostability of the small self-splicing group Iintron in the pre-tRNA(lle) of the purple bacteriumAzoarcus. RNA 2,74–83 (1996).
13. Kuo, L. Y., Davidson, L. A. & Pico, S. Characterization of the Azoarcus ribozyme: tightbinding to guanosine and substrate by an unusually small group I ribozyme.Biochim. Biophys. Acta 1489, 281–292 (1999).
14. Stahley,M.R.&Strobel, S.A. Structural evidence for a two-metal-ionmechanismofgroup I intron splicing. Science 309, 1587–1590 (2005).
15. Rangan, P., Masquida, B., Westhof, E. & Woodson, S. A. Assembly of core helicesand rapid tertiary folding of a small bacterial group I ribozyme. Proc. Natl Acad. Sci.USA 100, 1574–1579 (2003).
16. Pan, J.& Woodson, S. A. Folding intermediatesof a self-splicing RNA: mispairing ofthe catalytic core. J. Mol. Biol. 280, 597–609 (1998).
17. Beaudry, A. A. & Joyce, G. F. Directed evolution of an RNA enzyme. Science 257,635–641 (1992).
18. Lehman, N. & Joyce, G. F. Evolution in vitro of an RNA enzyme with altered metaldependence. Nature 361, 182–185 (1993).
19. Blake, R. D. & Delcourt, S. G. Thermodynamic effects of formamide on DNAstability. Nucleic Acids Res. 24, 2095–2103 (1996).
20. O’Brien, P. J. & Herschlag, D. Catalytic promiscuity and the evolution of newenzymatic activities. Chem. Biol. 6, R91–R105 (1999).
21. Hartl, D. L. & Clark, A. G. Principles of Population Genetics. (Sinauer Associates,1997).
22. Hanczyc, M. M. & Dorit, R. L. Experimental evolution of complexity: in vitroemergence of intermolecular ribozyme interactions. RNA 4, 268–275 (1998).
23. Lawrence, M. S. & Bartel, D. P. New ligase-derived RNA polymerase ribozymes.RNA 11, 1173–1180 (2005).
24. Ouellet, J., Byrne, M. & Lilley, D. M. Formation of an active site in trans by interactionof two complete Varkud Satellite ribozymes. RNA 15, 1822–1826 (2009).
25. Kondrashov, F. A. & Kondrashov, A. S. Multidimensional epistasis and thedisadvantage of sex. Proc. Natl Acad. Sci. USA 98, 12089–12092 (2001).
26. Wilke, C., Lenski, R. & Adami, C. Compensatory mutations cause excess ofantagonistic epistasis in RNA secondary structure folding. BMC Evol. Biol. 3, 3(2003).
27. Weinreich,D.M.,Delaney,N. F., Depristo,M.A.&Hartl,D.L.Darwinianevolutioncanfollow only very few mutational paths to fitter proteins. Science 312, 111–114(2006).
28. Hermisson, J. & Wagner, G. P. The population genetic theory of hidden variationand genetic robustness. Genetics 168, 2271–2284 (2004).
29. Rydzanicz, R., Zhao, X. S. & Johnson, P. E. Assembly PCR oligo maker: a tool fordesigning oligodeoxynucleotides for constructing long DNA molecules for RNAproduction. Nucleic Acids Res. 33, W521–W525 (2005).
30. Hochberg, Y. & Benjamini, Y. Controlling the false discovery rate: a practical andpowerful approach to multiple testing. J. R. Stat. Soc. B 57, 289–300 (1995).
Supplementary Information is linked to the online version of the paper atwww.nature.com/nature.
Acknowledgements We thank R. Dhar and N. de la Chaux for bioinformatic support.We thank the Functional Genomics Center, Zurich, for collecting sequence data. Weacknowledge support from Swiss National Science Foundation grants315200-116814, 315200-119697 and315230-129708, from the YeastX program ofSystemsX.ch, and from the Research Priority Program in Systems Biology at theUniversity of Zurich.
Author Contributions E.J.H. and A.W. contributed to the design of the experiments;E.J.H. performed the experiments; E.J.H., E.F., and A.W. all contributed to analysis of thedata and co-wrote the paper.
Author Information Reprints and permissions information is available atwww.nature.com/reprints. The authors declare no competing financial interests.Readers are welcome to comment on the online version of this article atwww.nature.com/nature. Correspondence and requests for materials should beaddressed to A.W. ([email protected]).
LETTER RESEARCH
2 J U N E 2 0 1 1 | V O L 4 7 4 | N A T U R E | 9 5
Macmillan Publishers Limited. All rights reserved©2011
METHODSRNA preparation. The dsDNA templates containing variants of the Azoarcusribozyme were constructed by a two-step PCR-based assembly from six syntheticDNA oligonucleotides29. The templates contain 197 nucleotides of the Azoarcusgroup I intron, excluding the first eight nucleotides but including the nucleophilicterminal guanosine (G205), all preceded by the T7 promoter sequence to allow invitro transcription. Transcription reactions (200ml) contained 50 mM Tris pH 7.5,15 mM MgCl2, 5 mM DTT, 2 mM spermidine, approximately 160 ng dsDNAtemplate, T7 RNA polymerase (unknown concentration), and RNase-free water(Ambion), and were incubated at 37 uC for at least 4 h. Reactions were then DNasetreated to remove the DNA template at 37 uC for 30 min with 10 U RNase-freeDNase I (Promega). Reactions were stopped with the addition of 15 mM EDTA,and extracted two times with phenol:chloroform (5:1, pH 4.5, Ambion) to removeprotein enzymes and remaining DNA template. Reactions were ethanol-precipitatedand rehydrated in equal volumes RNase-free water (Ambion) and a formamideloading dye. RNA was purified for length homogeneity by denaturing polyacryla-mide gel electrophoresis (PAGE, 6% polyacrylamide, 8 M urea). Purified RNA wasvisualized by ultraviolet light, excised from the gel, and eluted into 0.3 M sodiumacetate (pH 5.5) by diffusion. Eluted RNA was passed through a 0.2mm spin columnfilter (VWR), ethanol-precipitated, and rehydrated to a desired concentration inRNase-free water (Ambion). Substrate oligonucleotides GGCAU(AAAU)4A andGGCAUs(AAAU)4A (s 5 phosphorothioate bond) were produced by solid phasesynthesis and purified by denaturing PAGE (Microsynth). Concentrations weredetermined by ultraviolet-absorbance on an ND-1000 spectrophotometer(NanoDrop Technologies).Mutation rates and diversity calculations. The per generation mutation rates ofour selection procedure were estimated on the basis of previously reported muta-tion rates from a publication that quantified the number of mutations resultingfrom reverse transcription and PCR of a group I ribozyme31. The authors calcu-lated a mutation rate for both a mutagenic PCR procedure and a standard ‘‘non-mutagenic’’ PCR procedure. For the mutagenic PCR procedure, the authorsreported a mutation rate of 0.0066 6 0.0013 per nucleotide per PCR (95% con-fidence interval, n 5 16,591), with very low mutational bias, by including thefollowing in the reaction mixture: manganese (0.5 mM), a biased nucleotide pool(5:5:1:1 ratio of dCTP:dTTP:dATP:dGTP), and elevated levels of magnesium(7 mM) as well as Taq polymerase (5 U, NEB) relative to a standard PCR. Weused these mutagenic PCR conditions to generate the initial populations used tostart lines A, B, New-WT, and to introduce mutations at each generation of lines Aand B. For the standard PCR protocol, the authors reported a mutation rate of0.001 per nucleotide per PCR. Our standard PCR conditions were very similar, andwe used this mutation rate as an estimation of our mutation rate when theseconditions were used instead of the mutagenic PCR, that is, in the New lines.The lower mutation rate is very consistent with other calculations of PCR muta-tion rates under ‘standard’ conditions that are similar to those used during ourNew selection lines32. Using the average of the eight reported values of per nuc-leotide per cycle mutation rates (p), our per PCR mutation rate (f) can be calculatedas f 5 np/2, where n is the number of doublings observed in our evolution pro-cedure (n 5 27, from ,6 3 108 fold amplification over two PCRs). Using thisformula we calculate an expected mutation rate of 0.00116 per nucleotide perPCR for our non-mutagenic procedure.
We calculated the average mutation per individual in our population as the pernucleotide per PCR mutation rate times the length of the mutable region of ourribozyme sequence (inside the primer binding sites). This calculation gives anaverage number of mutations per individual of 1.05 under mutagenic conditionsand 0.159 under our ‘non-mutagenic’ conditions. The expected composition ofpopulations produced from the given error rate was also calculated using binomialstatistics33. The probability P of a molecule having k mutations in a populationwith a mutagenized region of length l produced with a mutation rate of m wascalculated as: P(k,l,m) 5 [l!/(l 2 k)!k)]mk(1 2 l)l 2 k.Selection procedure. Active variants were selected based on a reverse splicingreaction containing 20 pmol ribozyme population, 30 mM EPPS (pH 7.5), 25 mMMgCl2, and either 100 pmol RNA oligonucleotide substrate, or 200 pmolphosphorothioate-bond-containing substrate (equal mixture Rp/Sp). Reactionswere incubated at 37 uC for 1 h. A sample of this reaction (20%) was then directlysubjected to a reverse transcription reaction containing 1 mM dNTPs, 5 unitsAMV-RT (Fermentas), the commercially supplied buffer, and 200 pmol of aDNA primer (59-TATTTATTTATTTATTTCC-39) complementary to the 39
end of the substrate, and to the final two nucleotides of the ribozyme. A portionof the resulting cDNA (5%) was used as a template in a ‘selective’ PCR containing2 mM dNTPs, 1.5 mM MgCl2, 10 pmol of the reverse transcription primer, and10 pmol of a primer complementary to the 59-end of the ribozyme (59-CCGGTTTGTGTGACTTTGCC-39). Approximately 0.1 fmol of the resulting DNA wassubjected to a ‘regenerative’ PCR reaction, with primers that restore the 39 end of
the ribozyme sequence, and that append a T7 promoter sequence to the 59 end. Inlines A and B, the regenerative PCR was done under mutagenic conditions, asdescribed above. In New lines, it was performed under standard ‘non-mutagenic’conditions. For all PCR reactions we used a standard Taq polymerase (NEB), aswell as standard Taq buffer: 10 mM Tris, 50 mM KCl, 1.5 mM MgCl2, pH 8.3(NEB). Selection-negative controls were conducted to control for amplificationof unreacted ribozymes and contaminating DNA by skipping the reverse tran-scription step, while keeping the rest of the protocol identical. These controls weremonitored at both PCR steps by agarose gel electrophoresis. No bands wereobserved in the negative controls at any generation.Kinetic experiments. Kinetic experiments were carried out under the same con-ditions as the selection reactions (above). The Azoarcus ribozyme variants wereprepared side by side to minimize sample to sample variation. Reactions wereperformed in 40ml volumes, and 5ml aliquots were removed at six time points.The fraction of ribozyme converted to a 39-modified species by ligation of a portionof the substrate was calculated from the relative fluorescent intensity of bands afterseparation by denaturing PAGE (6% acrylamide, 1,000 Vh) and staining withGelRed (Biotium). Reactions were carried out in triplicate and fit to the equationF(t) 5 A(1 2 e2kt), where F is the fraction reacted at time t, and A and k are non-linear fitting parameters used to estimate the extent of reaction and the observedrate, respectively. Fitting was performed with Gnuplot (www.gnuplot.info).Ultra high-throughput (UHT) sequencing. Approximately 0.03 pmol of selec-tive PCR product was used as input into an additional PCR to prepare samples forUHT-sequencing. Reactions (50ml) contained 1.25 units Taq polymerase (NEB),standard Taq buffer (NEB), 2 mM dNTPs, and 15 pmol primers with extensionsthat allow compatibility with a GS FLX System (Roche, 454 technology). In addi-tion, one of the primers contained a unique 6 nucleotide sequence. Each uniquesequence differed by at least two nucleotides to prevent confusion by sequencingerrors. A different unique sequence was used for each generation in the study. PCRproducts were quantified on agarose gels stained with GelRed (Biotum), andadjusted to approximately equal concentrations. A portion (3ml) of the resultingPCR products were pooled together, and sequenced on a single picotitre plate.After sequencing, the unique primer sequence was used to sort sequences by lineand generation. Sequences shorter than 95% of the wild-type sequence or withaverage quality scores less than 35 were discarded.Linear regression and false discovery rate control. A multiple sequence align-ment was constructed separately for sequences determined in each population andeach generation using the Needleman–Wunsch algorithm34. For each position ineach alignment, the frequency of mutation was calculated. The regression coef-ficient (slope) was determined for each position by linear regression of mutationalfrequency over generation time. A t-test was performed and raw P-values werecalculated for each coefficient to determine significance relative to either zero(lines A and B) or the expected mutation rate in that line (see above). RawP-values were rank-ordered, and converted to false-discovery-rate-controlledP-values by the Benjamini and Hochberg procedure30.Genotype identification. We determined the population frequency of differentcombinations of mutations, and identified genotypes that increased most rapidlyin their frequency with respect to generation time. We limited our search togenotypes that were comprised of combinations of mutations that individuallyshowed a significant increase in frequency with time. The significance of increasefor individual mutations was determined by linear regression with correction formultiple testing (Supplementary Fig. 4). It should be pointed out that the increasein the frequency of genotypes that are under positive selection is expected to beexponential, not linear, under standard population genetic models21. Linearregression penalizes nonlinearity, and thus our determination of significance ofindividual mutations is a conservative approach.Mutational co-occurrence. For each pair of mutations deemed significant bylinear regression, the frequency that each mutation occurred without the otherwas determined and termed PAb and PaB. The frequency that each pair of muta-tions occurred together was also determined and termed PAB, and the frequencythat neither occurred was determined and termed Pab. We first determined co-occurrence of two mutations by calculating standard linkage disequilibrium (D) bythe formula: D 5 (PAB 3 Pab) – (PAb 3 PaB). A normalized linkage disequilibrium(D9) was calculated by dividing positive D values by a theoretical maximum, andnegative D values by a theoretical minimum21. As our ultimate measure of cor-relation, r2 (the square of the correlation coefficient) was calculated by the equa-tion r2 5 D2/PaPbPAPB, where Pa and Pb are the frequency of all other bases at eachof the nucleotide position of the pair of mutations under consideration. The valueof r2 multiplied by the number of sequences analysed is numerically equivalent tothe value of x2, which was used to determine statistical significance21. We note thatmolecules in our populations are not explicitly subject to recombination35, suchthat one would not expect correlations between mutations to decay significantly inthe relatively short time scales of our experiments.
RESEARCH LETTER
Macmillan Publishers Limited. All rights reserved©2011

Principal component analysis. Sequences from corresponding generations (1st,4th and 8th) of lines New-A, New-B and New-WT were combined and aligned in asingle multiple sequence alignment. Alignment sites containing more than 95%gaps were removed. Multiple sequence alignments were represented numerically(that is, gap:0; A:1; C:2; U:3; G:4), so a single sequence can be interpreted as a vectorof n variables where each correspond to a nucleotide sites along the sequence.Principal component analysis was carried out using the princomp function inMatlab (The MathWorks).Network graph. Sequences from generation 10 of line B, and the first generationsof lines New-B and New-WT were combined and aligned as described above. Thenumber of nucleotide differences between every pair of sequences in the alignmentwas counted (all against all distances). It was necessary to control for the number ofnodes and edges to allow visualization of the full data set. Thus, sequences wereclustered according to percentage identity using the cd-hit algorithm36. Therepresentative sequence for each cluster was defined as the sequence within thatcluster with the lowest average distance to all other sequences in the cluster.Network graphs were constructed with clusters represented as nodes, and edgesconnecting clusters containing sequences that differ by less then 10 nucleotides.Networks representation was accomplished using Cytoscape v2.7.0 (www.cytoscape.org).
Phylogeny. Sequences that clustered (96% identity) with the Azo* sequences fromgeneration B-10 and New-B1, as well as the representative sequences fromgeneration New-WT1 (less than 96% identity with Azo*) were used to constructan unrooted phylogenetic tree using maximum likelihood, and assuming a HKY85model, using the PhyML software37. The sequence data was used to determine basefrequencies and to estimate the ratio of transitions to transversions.
31. Cadwell, R. C. & Joyce, G. F. Randomization of genes by PCR mutagenesis. GenomeRes. 2, 28–33 (1992).
32. Eckert, K. A. & Kunkel, T. A. DNA polymerase fidelity and the polymerase chainreaction. Genome Res. 1, 17–24 (1991).
33. Breaker, R. R. & Joyce, G. F. Inventing and improving ribozyme function: Rationaldesign versus iterative selection methods. Trends Biotechnol. 12, 268–275 (1994).
34. Needleman, S. B. & Wunsch, C. D. A general method applicable to the search forsimilarities in the amino acid sequence of two proteins. J. Mol. Biol. 48, 443–453(1970).
35. Yu, W., Rusterholtz, K. J., Krummel, A. T. & Lehman, N. Detection of high levels ofrecombination generated during PCR amplification of RNA templates.Biotechniques 40, 499–507 (2006).
36. Li, W. & Godzik, A. Cd-hit: a fast program for clustering and comparing large sets ofprotein or nucleotide sequences. Bioinformatics 22, 1658–1659 (2006).
37. Guindon, S. & Gascuel, O. A simple, fast, and accurate algorithm to estimate largephylogenies by maximum likelihood. Syst. Biol. 52, 696–704 (2003).
LETTER RESEARCH
Macmillan Publishers Limited. All rights reserved©2011
Related Documents