This article appeared in a journal published by Elsevier. The attached copy is furnished to the author for internal non-commercial research and education use, including for instruction at the authors institution and sharing with colleagues. Other uses, including reproduction and distribution, or selling or licensing copies, or posting to personal, institutional or third party websites are prohibited. In most cases authors are permitted to post their version of the article (e.g. in Word or Tex form) to their personal website or institutional repository. Authors requiring further information regarding Elsevier’s archiving and manuscript policies are encouraged to visit: http://www.elsevier.com/authorsrights

Welcome message from author
This document is posted to help you gain knowledge. Please leave a comment to let me know what you think about it! Share it to your friends and learn new things together.
Transcript

This article appeared in a journal published by Elsevier. The attachedcopy is furnished to the author for internal non-commercial researchand education use, including for instruction at the authors institution
and sharing with colleagues.
Other uses, including reproduction and distribution, or selling orlicensing copies, or posting to personal, institutional or third party
websites are prohibited.
In most cases authors are permitted to post their version of thearticle (e.g. in Word or Tex form) to their personal website orinstitutional repository. Authors requiring further information
regarding Elsevier’s archiving and manuscript policies areencouraged to visit:
http://www.elsevier.com/authorsrights

Author's personal copy
Crustal structure beneath the Paleozoic Parnaíba Basin revealed byairborne gravity and magnetic data, Brazil
David L. de Castro a,⁎, Reinhardt A. Fuck b, Jeffrey D. Phillips c, Roberta M. Vidotti b,Francisco H.R. Bezerra a, Elton L. Dantas b
a Departamento de Geologia, Programa de Pós-Graduação em Geodinâmica e Geofísica, Universidade Federal do Rio Grande do Norte, Campus Universitário S/N, 59078-970 Natal, Brazilb Instituto de Geociências, Universidade de Brasília, Campus Universitário, 70910-900 Brasília, Brazilc U.S. Geological Survey, MS 964, Lakewood, CO 80225, USA
a b s t r a c ta r t i c l e i n f o
Article history:Received 8 May 2013Received in revised form 18 October 2013Accepted 19 December 2013Available online 29 December 2013
Keywords:Potential field methodsAirborne gravity/magnetic data3-D geophysical modelingCrustal domainsParnaíba Basin
The Parnaíba Basin is a large Paleozoic syneclise in northeastern Brazil underlain by Precambrian crystalline base-ment, which comprises a complex lithostructural and tectonic framework formed during the Neoproterozoic–Eopaleozoic Brasiliano–Pan African orogenic collage. A sag basin up to 3.5 km thick and 1000 km long formedafter the collage. The lithologic composition, structure, and role in the basin evolution of the underlying basementare the focus of this study. Airborne gravity and magnetic data were modeled to reveal the general crustal struc-ture underneath the Parnaíba Basin. Results indicate that gravity and magnetic signatures delineate the mainboundaries and structural trends of three cratonic areas and surrounding Neoproterozoic fold belts in the base-ment. Triangular-shaped basement inliers are geophysically defined in the central region of this continental-scale Neoproterozoic convergence zone. A 3-D gravity inversion constrained by seismological data reveals thatbasement inliers exhibit a 36–40.5 km deep crustal root, with borders defined by a high-density and thinnercrust. Forward modeling of gravity and magnetic data indicates that lateral boundaries between crustal unitsare limited by Brasiliano shear zones, representing lithospheric sutures of the Amazonian and São FranciscoCratons, Tocantins Province and Parnaíba Block. In addition, coincident residual gravity, residual magnetic, andpseudo-gravity lows indicate two complex systems of Eopaleozoic rifts related to the initial phase of the sagdeposition, which follow basement trends in several directions.
© 2013 Elsevier B.V. All rights reserved.
1. Introduction
Although the lithostratigraphic, structural and tectonic records ofthe Brasiliano and previous orogenic cycles are well preserved in theSouth American platform, vast regions are hidden by large Paleozoicsyneclises (Fig. 1). The geology of the basement under these basins isessential to an understanding of the Rodinia reconstruction, WestGondwana geodynamic evolution, and the role of these Precambrianunits played in the evolution and structure of the Paleozoic basins. Forexample, Fuck et al. (2008) considered it mandatory to include thecrustal fragments underlying the large Paleozoic basins to obtain a reli-able map of Rodinia as well as of West Gondwana.
The Parnaíba Basin in northeastern Brazil is a key region for thestudy of Rodinia, as well as cratonic basin evolution in the Phanerozoic.This Paleozoic syneclise conceals a large area of the South Americanplatform (Fig. 1), which was formed by the last orogenic cycle and theLate Neoproterozoic–Eopaleozoic Brasiliano–Pan African orogeny
(Almeida et al., 1981; Brito Neves and Fuck, 2013; Brito Neves et al.,1999; Cordani et al., 2013a). Its 1000 km long and 970 kmwide, nearlycircular-shaped area holds a basin sedimentary infill up to 3.5 km thickin its depocenters (Cordani et al., 1984), and covers a complex crustalframework. The underlying Precambrian basement is made up of a se-ries of crustal segments, which are the result of the Neoproterozoic–Eopaleozoic process of agglutination of West Gondwana by the generalcollage of the Amazonian, São Luís/West Africa and São Francisco/Congocratons. Neoproterozoic fold belts surround the cratonic masses, con-verging on a central basement inlier named the Parnaíba Block(Fig. 1), in an oblique collisional setting. The Parnaíba Block is boundedin the east by the NE–SW oriented Transbrasiliano Lineament, whichalongside other Brasiliano shear zones, represents the major structuraltrend of the Borborema Province to the east and also controlled oldtroughs and Paleozoic depocenters (Brito Neves et al., 1984; Cordaniet al., 2013b; Oliveira and Mohriak, 2003 and references therein).
Despite its importance for understanding the crustal structure ofSouth America, the regional geological setting is still poorly understoodin the Parnaíba Basin region. Thus, in this study several geological andgeophysical maps were compiled to summarize the current knowledge(Fig. 2). Our aim then is to recognize the crustal domains, which com-prise the Precambrian basement, and to better define their contact
Tectonophysics 614 (2014) 128–145
⁎ Corresponding author. Tel.: +1 55318432153808.E-mail addresses: [email protected] (D.L. de Castro), [email protected]
(R.A. Fuck), [email protected] (J.D. Phillips), [email protected] (R.M. Vidotti),[email protected] (F.H.R. Bezerra), [email protected] (E.L. Dantas).
0040-1951/$ – see front matter © 2013 Elsevier B.V. All rights reserved.http://dx.doi.org/10.1016/j.tecto.2013.12.009
Contents lists available at ScienceDirect
Tectonophysics
j ourna l homepage: www.e lsev ie r .com/ locate / tecto

Author's personal copy
relations beneath the basin. To achieve this goal we used new airbornegravity andmagnetic data, oldermagnetic airborne surveys, and gravitydata derived from the Earth Gravitational Model 2008 (Pavlis et al.,2012). The new geophysical data allow for an expansion of the knowl-edge presented by previous studies on the geological setting in thisarea (Cordani et al., 1984, 2009a; Nunes, 1993). Interpretation of themagnetic and gravity anomalies is based on data processing and depthanalysis techniques, which provide a new geological map of the crustaldomains underlying the basin. A 3-D gravity inversion constrained by aglobal crustal model and seismologic data is used to investigate the lith-ospheric internal geometry of the crustal domains. In addition, a joint 2-D forward model was created to reveal the structural configuration ofthe basin and its basement. Finally, the results are discussed in the con-text of understanding the different geotectonic aspects of the crustal do-mains in the basement, basement reactivation, and the Parnaíba Basinformation. A simplified tectonic model is proposed to provide new in-sights on the crustal evolution underneath the basin.
2. Geological setting
2.1. Basement units
The Parnaíba Basin is surrounded by several Precambrian units. Thenorthern boundary of the basin comprises the São Luís Craton and ad-joining Gurupi Belt (Fig. 2). The São Luís Craton is a small fraction ofthe West African Craton that remained in South America after thePangea breakup in the Cretaceous (Bullard et al., 1965; Klein et al.,2002). This craton is composed of granitoids and minor supracrustal
metavolcano-sedimentary sequences and bounded to the south by theNeoproterozoic Gurupi Fold Belt, supposedly along the Tentugal shearzone (Fig. 2).
On its western border, the basement under the Parnaíba Basinencompasses the Amazonian Craton and the Neoproterozoic TocantinsProvince (Figs. 1 and 2). The Amazonian is one of the largest cratonsof the world (Chew et al., 2011; Cordani and Teixeira, 2007) and com-prises an Archean seed nucleus and five Proterozoic tectonic provinces(Cordani et al., 2009b; Santos et al., 2000). These provinces exhibit ageneral NNW–SSE trend (Fig. 1) and crustal growth from northeast(2.3-2.1 Ga) to southwest (1.25-1.0 Ga). The eastern portion of theAmazonian Craton encompasses the Archean Central Amazonian andPaleoproterozoic Maroni–Itacaiúnas provinces (Figs. 1 and 2), whichbound the Parnaíba Basin. The structural grain of these units isdominantly close to E–W (Dall'Agnol et al., 1999). The Maroni–Itacaiúnas province comprises mostly Paleoproterozoic granite–green-stone terrains, including strongly reworked Archean blocks, whereasthe Archean Central Amazonian Province is composed mostly of granit-oid–greenstone terrains generated in northern South America duringthe Archean (Santos et al., 2000; Vasquez et al., 2008).
The Neoproterozoic Tocantins Provincewas formed during the amal-gamation of West Gondwana, when the Amazonian, São Francisco–Congo, and Paranapanema cratons converged (Almeida et al., 2000;Trompette, 1994). The Tocantins Province includes the N-NE-trendingBrasília Belt, forming the western margin of the São FranciscoCraton, and the N–S-trending Araguaia Belt, flanking the AmazonianCraton (Figs. 1 and 2). The former is composed of orthogneiss andmetasedimentary sequences and the latter comprises a thick pile of
Fig. 1. Simplified tectonic map of northern and central South America (modified from Fuck et al., 2008). Hidden basement inliers: PNB — Parnaíba Block; PPB — Paranapanema Block.Neoproterozoic tectonic provinces: BB — Borborema; TO— Tocantins; MA — Mantiqueira. Yellow areas: Phanerozoic covers. Shear zones: PA— Patos; PE — Pernambuco; SP — SenadorPompeu.
129D.L. de Castro et al. / Tectonophysics 614 (2014) 128–145

Author's personal copy
metasedimentary rocks, granites and Archean and Paleoproterozoicbasement units (Alvarenga et al., 2000). Gravity and magnetic trendssuggest that the belts continue beneath the basin (Soares et al., 2006;Ussami and Molina, 1999).
The western part of the Brasília Belt underlying the Parnaíba basintrendsNE–SW(Fig. 2), and comprises theGoiásMassif (made of Archeangranite–greenstone terrains), Paleoproterozoic orthogneiss and foldedmetasedimentary sequences, and the Goiás Magmatic Arc (GM inFig. 2), a Neoproterozoic juvenile arc terrain. Its formation is related toocean closure and continent collision, which took place at ca. 600 Ma(D'el-Rey Silva et al., 2011; Pimentel and Fuck, 1992). The GoiásMagmatic Arc is characterized by high Bouguer gravity anomalies and
a rather thin crust (Soares et al., 2006; Ventura et al., 2011). Theeastern part of the Brasília Belt underlying the Parnaíba basin com-prises Paleoproterozoic orthogneiss (Br in Fig. 2), basement to LatePaleoproterozoic rift sequences and Neoproterozoic passive margin de-posits (Dardenne, 2000; Pimentel et al., 2000).
The SE border of the Parnaíba Basin partially overlies the boundarybetween the Neoproterozoic Tocantins and Borborema provinces,and the São Francisco Craton (Figs. 1 and 2). This craton represents sec-tors of a Neoproterozoic paleocontinent preserved from the Brasilianoorogeny (Sial et al., 2010; Van Schmus et al., 2008). According to Bizziet al. (2003), the São Francisco Craton consists of Archean andPaleoproterozoic tonalite–trondhjemite–granodiorite (TTG) suites and
Fig. 2. Tectonic sketch of the Parnaíba Basin basement compiled fromprevious geophysical (Nunes, 1993) and geological (Cordani et al., 1984, 2009a; Vasconcelos et al., 2004)maps. A–A′:geological cross section in Fig. 3. Amazonian provinces: MI - Maroni-Itacaiúnas; CA - Central Amazonian.
130 D.L. de Castro et al. / Tectonophysics 614 (2014) 128–145

Author's personal copy
granite–greenstone supracrustal terrains overlain by middle to lateProterozoic platform-type cover (Fig. 2). Its limits with the surroundingBrasiliano belts are marked by folding and overthrusting.
The Borborema Province forms the eastern limit of the Parnaíba Basin(Figs. 1 and 2). According to Van Schmus et al. (1995), this province is acomplex mosaic of Neoproterozoic fold belts and basement inliers,which are mostly the result of previous Paleoproterozoic orogenies.The structural trends exhibit a fan-like distribution, consisting of an im-portant network of shear zones (Pernambuco, Patos, Senador Pompeu,and Transbrasiliano — Fig. 2). The Brasiliano orogeny deformed thisunit and generated granitic plutonism throughout this province.
Finally, the central part underneath the Parnaíba Basin comprisesconcealed basement inliers. Based on metamorphic polarities in theAraguaia (west) and Gurupi (north) belts, Cordani et al. (1984) pro-posed a cratonic nucleus, named the Parnaíba Block (PNB in Fig. 1), ad-jacent to the Transbrasiliano shear zone (Figs. 1 and 2). In studying theSão Luís Craton and theGurupi Belt, Klein et al. (2008) included a crustalmassif situated farther south to explain the Brasiliano collisional tecton-ics. Fuck et al. (2008) consider this cratonic block as one of the Rodiniadescendant fragments, which is surrounded by Neoproterozoic accre-tionary belts formed during the Brasiliano orogeny. Based on gravitydata, Nunes (1993) divided the basement inlier in four crustal seg-ments, separated by a series of NW–SE trending graben-like structures(Fig. 2). This author suggested that the correlated rifting process proba-bly affected the Parnaíba Block during the Proterozoic before theBrasiliano orogeny.
2.2. Sedimentary Basin
The transition of the Neoproterozoic to the early Phanerozoic wasmarked by continental breakup, separating Laurentia and Baltica fromWestern Gondwana (Bond et al., 1984). The resulting tectonic adjust-ments formed rift systems, which did not evolve to form passive conti-nental margin basins. The rift faults reactivatedmajor preexisting zonesof weakness, particularly the Brasiliano ductile shear zones within theBorborema Province (Fig. 2). A few NE- to E–W-oriented exposures ofCambrian–Ordovician graben related to this fault reactivation occur atthe eastern and southern edges of the Parnaíba Basin (Brito Neves,2002; Oliveira and Mohriak, 2003). These grabens encompass thickunits of immature clastic sedimentary rocks and bimodal volcanicrocks, intruded by granite. Deep exploratory boreholes and seismicsections (Brito Neves et al., 1984) and gravity and aeromagnetic data(Nunes, 1993) indicated a dozen areas under the Parnaíba basinwhere these graben-like structures may occur.
The Parnaíba Basin is a large cratonic Paleozoic–Mesozoic basin incentral and northeast Brazil, which caps these Cambrian–Ordoviciangrabens and vast areas of the Precambrian basement (Cordani et al.,1984) (Figs. 2 and 3). The basin encompasses four successive sub-basinswith distinct genesis and ages: (1) a cratonic sag sub-basin, filledby Ordovician to early Triassic marine sediments; (2) an intermediateinterior fracture basin, which combines continental sedimentary rocksand basaltic flows of Jurassic and Cretaceous age (Merle et al., 2011and references therein); and (3) two sub-basins, which occur on thenorthern and southern province edges, deposited respectively inmarineand desert environments (Pedreira da Silva et al., 2003). Its depositionalhistory spans the early Paleozoic to the Mesozoic. The stratigraphyexhibits three major sedimentation cycles (Fig. 3), which comprisethick epicontinental sequences, mostly of siliciclastic nature separatedby widespread unconformities (Góes et al., 1990).
In the Jurassic, with the beginning of Pangea disintegration, subsi-dence occurred in the central portion of the Parnaíba Basin and anENE-and NNE-oriented system of rifts was installed. Basaltic dikes andlava flows form the lower and upper limits of the Jurassic fluvial toaeolian sedimentary sequence (Góes et al., 1990). Major volcanic expo-sures occur along a broad E–W-oriented belt in the central part of thebasin, and secondary exposures occur on its NE corner and SE edge(Fig. 2). Cretaceous kimberlite pipes are found mainly along theTransbrasiliano Lineament (Kaminsky et al., 2009). During the Aptian–Albian, a broad uplift occurred in the central area of the ParnaíbaBasin, triggering continental sediment deposition. A more intensivestretching phase, associated with thermal subsidence, led to expandeddeposition after the Albian.
The extensional stresses, which culminated in the opening of theSouth Atlantic, led to the origin of new intracontinental sedimentaryareas throughout Gondwana in the Early Cretaceous. A N–S long andnarrow rift basin, named the Sanfranciscana Basin (Campos andDardenne, 1997), was established on the southern edge of the ParnaíbaBasin and along the western border of the São Francisco Craton (Fig. 2).Furthermore, Cenozoic sedimentation overlies large areas of theParnaíba Basin and the surrounding Precambrian basement. Sedimenta-ry units of the Amazon Basin and coastal sediments cover the limitsbetween the Parnaíba Basin and the São Luís Craton and Gurupi Belt(Fig. 2).
3. Geophysical data
An airborne gravity and magnetic survey was flown over theParnaíba Basin in 2006 by the Brazilian Petroleum Agency (ANP) as
Fig. 3. Schematic geological cross section of the Parnaíba Basin (adapted from Góes et al., 1990).
131D.L. de Castro et al. / Tectonophysics 614 (2014) 128–145

Author's personal copy
part of the Parnaíba Basin Project. The survey covered an area 950 kmlong by 980 km wide (Fig. 4) and was flown along E–W flight linesspaced every 6 km, at a flight elevation of 1100 m. North–south tielines were acquired every 24 km. The magnetic data were correctedfor the transient geomagnetic variations and International GeomagneticReference Field (IGRF). Corrections to the raw airborne gravity datawere made for vertical and horizontal accelerations, latitude, free-airreduction and Bouguer reduction. In addition, statistical leveling andmicro leveling were applied to minimize flight line corrugation. Afterall the corrections the final accuracy of the airborne gravity data was es-timated in 0.7 mGal.
3.1. Airborne magnetic data
As part of this study, 13 aeromagnetic surveysweremergedwith thenew survey to expand the area beyond the basin's boundaries (Fig. 4).These magnetic surveys were derived from the Brazilian GeologicalSurvey (CPRM) and ANP data banks and were collected from 1970until 2010 with different flight elevations (100 m to 1100 m), direc-tions (N–S or NW–SE), and spacing between lines (500 to 4000 m).Each data set was interpolated onto a 500 m cell size grid, using thebi-directional method. A decorrugation filter combined with a direc-tional cosine filter was applied to the grid of some surveys to eliminatehigh frequency noise along the flight direction, usually N–S or N45W.Degrees of the cosine function of 0.5 and 1 provided a rejection notchnarrowed enough to remove properly directional features from
magnetic data. Each survey grid was upward continued to the sameheight (3000 m) to generate a consistent datum between surveys.
The grids were reduced to the magnetic north pole (RTP) usinga pseudo-inclination factor of 60° to 85° to suppress the amplitudeand power in and near the declination direction at low magnetic lati-tudes (Blakely, 1996). The RTP operation centers the magnetic anoma-lies over their causative features, like gravity anomalies, making theinterpretation easier and more reliable. The RTP transformation wasapplied for each magnetic survey separately before merging, usingmagnetic inclinations and declinations given by the IGRF. The rangesof magnetic inclination and declination varied from −18.3° to 3.3°and from −22.1° to −18.0° in the study area, respectively.
The RTP transformation assumes a constant direction of magnetiza-tion parallel to the induced magnetic field. This assumption can beviolated in some cases, leading tomisinterpretation of the RTP anomalymap. However, the presence of remnant magnetization can be estimat-ed using the correlation coefficient between the 3-D analytic signalamplitude (ASA) and the total horizontal derivative (THD) of the RTPfield (Dannemiller and Li, 2006). For thewhole studied area, the comput-ed correlation coefficientwas 0.81,whichmeans a strong crosscorrelationbetween the ASA and THD data sets. We also calculated the correlationcoefficient separately to each crustal domain as well. The computedvalues varied from 0.75 on the western basin edge (Amazonian Cratonand Tocantins Province), to 0.86 in the São Francisco Craton area. Accord-ing to Noutchogwe et al. (2010), a strong analogy between the THD andthe ASA maps suggests that the magnetic sources mainly present aninducedmagnetization. Further, in cases where remnantmagnetization
Fig. 4. Airborne magnetic and gravity data of the Parnaíba Basin Project (red lines) and other aeromagnetic surveys (gray polygons).
Fig. 5.Reduced-to-pole regional (a) and residual (b)magnetic anomalymaps; tilt derivative (c); pseudo-gravity (d); total horizontal derivative (e); andmagnetic domains and lineaments(f). Labeled anomalies are discussed in the text.White contoured areas: location of possible Cambrian grabens. Black contoured area: volcanic exposures. 1–6: outcropping Cambrian gra-bens. Magnetic domains: SF— São Francisco; SL— São Luís; BN— Borborema N; BS— Borborema S; TR— Teresina; GU— Gurupi; PN— Parnaíba N; PS— Parnaíba S; MC—Médio Coreaú;GM— Goiás Magmatic Arc; Ab — Araguaia basement. Shear Zones: TB— Transbrasiliano; TG — Tentugal; PA— Patos; PE — Pernambuco; SP— Senador Pompeu.
132 D.L. de Castro et al. / Tectonophysics 614 (2014) 128–145

Author's personal copy
133D.L. de Castro et al. / Tectonophysics 614 (2014) 128–145

Author's personal copy
134 D.L. de Castro et al. / Tectonophysics 614 (2014) 128–145

Author's personal copy
exists, either their magnetic susceptibility is too weak, or their directionof magnetization is aligned with that of the geomagnetic field. In everycase, this correlation between the two magnetic sets enables us to vali-date the RTP carried out on the magnetic anomaly map in the ParnaíbaBasin region.
Grids of the individual magnetic surveys were merged using a grid-knitting tool to smooth the transition between adjacent grids. A mini-mum curvature suturing method automatically defines a suture pathfor estimating errors and then applies a proprietary multi-frequencycorrection along the path (Geosoft, 2013). A best-fitting trend fromboth grids was removed before stitching, using a first-order correction.The merged grid was combined with the grid of the Parnaíba BasinProject magnetic data, which was also continued to the same surfaceand reduced to the pole. In addition, RTP magnetic data were extractedfrom the World Magnetic Anomaly Maps collection (WDMAM — Mauset al., 2007) to fill areas without magnetic data. The final magneticanomaly maps of the basin are shown in Fig. 5.
3.1.1. Filtered magnetic anomaly dataA number of filters were applied to the magnetic anomaly grid and
were used to define domains that relate to major tectonic features inthe crystalline basement. A Gaussian filter was applied to the mergedgrid to separate the regional (Fig. 5a) and residual (Fig. 5b) componentsof the magnetic field, allowing separate interpretation of shallow anddeep magnetic sources. We analyzed the mean radial power spectrumof the magnetic data to choose the filter parameters. The power spec-trum curve shows three distinct segments. The part at the longwavelength (N125 km) with a steep slope is assigned to the regionalmagnetic signal. Thus, we choose a standard deviation of the Gaussianfunction of 0.008 rad/km to obtain the regional and residual magneticanomalies. This parameter is similar to a filter cutoff except that thefunction amplitude at this point is only 0.39 (Geosoft, 2013).
The tilt derivative filter, the ratio of the first vertical derivative of thepotential field to the horizontal gradient of the field (Miller and Singh,1994), was applied to the residual data (Fig. 5c) to enhance the edgesof shallowmagnetic sources related to geological contacts and structur-al fabric. A pseudo-gravity transformation (Blakely, 1996) was appliedto the residualmagnetic field reduced to the pole to highlight the anom-alies associated with deeper magnetic sources related to possibleCambrian grabens in the bottom of the Parnaíba Basin (Fig. 5d). A com-parison of the pseudo-gravity with the gravity anomaly allows us todiscuss the correlation between the magnetic and the gravity sources;the total horizontal gradient was also calculated to enhance the hori-zontal location and borders of basement structures (Fig. 5e).
3.2. Airborne and satellite gravity data
Gravity data derived from the Earth Gravitational Model 2008(EGM2008) were incorporated to extend the airborne survey area andallow a regional analysis of the Moho relief beneath the ParnaíbaBasin. The EGM2008model is based on terrestrial, airborne and satellite(GRACEMission) gravity data with a spatial resolution of 5′ × 5′ (Pavliset al., 2012). The regional Bouguer gravity anomaly grids (averaged over2.5′ × 2.5′) were computed at the International Gravimetric Bureau(BGI) from the EGM2008 spherical harmonic coefficients. The Bouguercorrections computed at regional scales were obtained using standarddensities of 1.03 g/cm3 and 2.67 g/cm3 for the water and land density,respectively. The topographic correction was applied up to a distanceof 167 km using the 1′ × 1′ ETOPO1 Digital Elevation Model. We inter-polated both airborne and global model datasets using the minimum
curvature method to a cell size of 1500 m. The EGM2008 Bougueranomalies were upward continued to 1100 m. The resulting gridswere merged using the same grid-knitting tool applied to the magneticdata.
3.2.1. Filtered gravity anomaly dataTwo filters were applied to the gravity anomaly grid to individualize
crustal domains beneath the basin. A Gaussian filter was applied to theBouguer anomaly map to separate the regional (Fig. 6a) and residual(Fig. 6b) components of the gravity field, allowing separate interpreta-tion of shallow and deep gravity sources. We used a standard deviationof the Gaussian function of 0.008 rad/km to separate the gravity anom-alies. Furthermore, the tilt derivative filter was applied to the residualdata to enhance the edges of shallow gravity sources related to geolog-ical contacts and structural fabric.
3.3. Euler deconvolution
The Euler deconvolution method (Reid et al., 1990) was applied toboth the residual magnetic and gravity grids to investigate the depthsof basement geophysical sources. Three important parameters regulatethe results of the Euler solution: the structural index, the window size,and maximum depth error tolerance (Dewangan et al., 2007). Wechoose a structural index of 0.5 for an initial estimate of basementdepths. This represents a step geometry for the causative source, corre-sponding to geological boundaries or faults of limited depth extent. Weapplied the deconvolution to the first vertical derivative of the gravityfield to make the gravity structural index equivalent to the magneticstructural index for the same model source and to increase the numberof Euler solutions for the gravity data (Dewangan et al., 2007). Thechosen window size of 30 km × 30 km was consistent with the wave-lengths of the potential field signal and the expected target depths.Finally, we limited depth solutions to thosewith error estimates smallerthan 15% of the depth.
4. Basement geophysical domains
A semi-qualitative interpretation of geophysical datawas carried outtomap crustal domains and structural features underneath the ParnaíbaBasin. We used direct analysis of magnetic and gravity anomalies, andvarious edge-enhancement techniques (ASA, THD, tilt derivative andEuler deconvolution). This task involved the recognition and delinea-tion of areas with distinctive or clearly defined anomaly pattern onmagnetic and gravity maps and the explanation of these in terms oftheir possible causative geological bodies and structures. The delinea-tion of geophysical domains was also based on information about themain geological units and structures of the outcropping basement.The major results of the semi-qualitative analysis are summarized inFigs. 5 to 7 and Table 1.
4.1. Magnetic domains
The study area can be subdivided into 13magnetic domains (Fig. 5f),defined on the basis of integrating the characteristics within the variousfiltered products with the geologic setting (Table 1). Themagnetic anom-alies in the Parnaíba Basin exhibit major NE–SW trending lineamentsroughly parallel to the Transbrasiliano Lineament (Fig. 5), which outcropsbeyond the NE and SW borders of the basin. In addition, E–W-trendinglong-wavelength magnetic anomalies occur mainly in the central partof the basin. NW–SE oriented magnetic alignments are very rare in
Fig. 6. Gravity anomaly maps: regional (a); residual (b); tilt derivative (c); gravity domains and lineaments (d); residual with location of possible Proterozoic–Phanerozoic graben-structures (gray areas) (e); and residual with location of possible Cambrian grabens (white contoured areas) and volcanic exposures (black contoured areas) (f).1–6: outcropping Cam-brian grabens. Gravity domains: AM — Amazonian; SF — São Francisco; SB — South Border; SL — São Luís; BB — Borborema; TR — Teresina; GU — Gurupi; PR — Parnaíba; MC — MédioCoreaú; GM—GoiásMagmatic Arc; BR— Brasília; Ab—Araguaia basement; As—Araguaia Supracrustal. Shear Zones: TB— Transbrasiliano; TG— Tentugal; PA— Patos; PE— Pernambuco;SP— Senador Pompeu.
135D.L. de Castro et al. / Tectonophysics 614 (2014) 128–145

Author's personal copy
the basin area. The E–W trend of magnetic anomalies separates thebasin in two regional domains, with positive anomalies to the northand negative anomalies to the south (Fig. 5a). In the southern part ofthe basin, the large magnetic low (A to E in Fig. 5a) should be relatedto deeper basement structures, which probably controlled the Cambri-an rifting and the Mesozoic volcanic activities. In the residual magneticanomaly map (Fig. 5b), the short to medium wavelength anomaliestrend NE and are parallel to co-parallel with the Transbrasiliano Linea-ment. To the east (São Francisco, Borborema S and Borborema N do-mains — Fig. 5f), the magnetic gradient trends follow the main shearzones of the Borborema Province, such as Patos and Pernambuco, andtend to bend toward the north on the western flank of theTransbrasiliano Lineament (Parnaíba S and Parnaíba N domains —
Fig. 5f), following the overall tectonic fabric of the Goiás Magmatic Arc(GM domain). The magnetic anomalies are essentially E–W orientedin the northern part of the Parnaíba Basin, with some bending roughlyparallel to the Tentugal Shear Zone (Fig. 2). This magnetic pattern al-lows the identification of the Médio Coreaú, Gurupi and São Luís do-mains (Fig. 5c, e and f). Finally, we identified the Teresina Domain inthe magnetic maps between the Transbrasiliano Lineament andParnaíba domains using high-frequency anomalies and tilt derivativesignal, which trend either in an E–W direction or to the NE–SW, closeto the Transbrasiliano Lineament (Fig. 5b and c). Low intensities of thetotal horizontal gradient also allow us to individualize the TeresinaBlock (Fig. 5e). Apparently, the E–W long wavelength features in themagnetic regional map (Fig. 5a) have no remarkable expression onthe residual magnetic signatures of the basement inlier blocks. Thissuggests that a continental-scale event affected the region after thesebasement blocks had been consolidated.
In addition, Fig. 5d shows the locations of Cambrian–Ordoviciangraben structures and volcanic rocks, superimposed on the pseudo-gravity map. These graben structures partially outcrop at the basinedges. It is worth noting that NE–SW and E–W-trending, linear pseudo-gravity lows are geographically coincident with those rifts and themain volcanic exposure in the western part of the basin (Fig. 2), suggest-ing that these features are characterized by rocks with little to nomagnetization and may map areas of extensive demagnetization due tohydrothermal alteration. It is also clear from the orientation of pseudo-gravity lows that the large Brasiliano shear zones controlled the riftingprocess. In addition, other pseudo-gravity lows are highlighted to identifyadditional possible buried graben structures beneath the basin.
4.2. Gravity domains
We identified several gravity domains in the basement (Fig. 6d andTable 1), based on gravity patterns and lineaments and correlated withthe outcropping geological units around the basin. At thewestern borderof the Parnaíba Basin, theN–S trending gravity domains contain alternat-ing positive (Amazonian Craton, Araguaia Basement andGoiásMagmaticArc domains — Fig. 6d) and negative (Araguaia supracrustal Domain)anomalies, in both regional and residual maps. This geophysical patternis repeated in the eastern (South Border and São Francisco Craton) andnorthern (Médio Coreaú, Gurupi Fold Belt and São Luís Craton) edgesof the basin. The central Teresina and Parnaíba domains were identifiedby a broad negative regional anomaly containing NE–SW and N–S orien-tations, parallel to the main structural trends (Fig. 6d). The residual mapalso shows a series of linear positive and negative anomalies with a
Fig. 7. Euler solutions (Structural Index = 0.5) for residual magnetic (top) and first derivative of gravity (bottom) anomalies for three depth estimate ranges. Geophysical domains: AM—
Amazonian; SF— São Francisco; SB— South Border; SL— São Luís; BB— Borborema; TR— Teresina; GU— Gurupi; PR— Parnaíba; PN— Parnaíba N; PS— Parnaíba S;MC—Médio Coreaú;GM— Goiás Magmatic Arc; BR— Brasília; Ab— Araguaia basement; As— Araguaia supracrustal. Shear Zones: TB— Transbrasiliano; TG— Tentugal; PA— Patos; PE— Pernambuco; SP—
Senador Pompeu.
136 D.L. de Castro et al. / Tectonophysics 614 (2014) 128–145

Author's personal copy
preferential N–S or NNE–SSW direction (Parnaíba Domain). This trendshifts to NE–SW eastwards in the Teresina Domain.
The regional anomaly map shows the Parnaíba Basin inserted in abroad gravity lowbounded by positive anomalies (Fig. 6a). This suggeststhat the basin was formed in an area at edges of crustal blocks. In fact,both regional and residual anomaly maps reveal a major N–S gravityhigh at the western basin edge, a major NE–SW gravity high at the SEbasin border sub-parallel to the Transbrasiliano Lineament, and a mainE–W gravity high at the northern basin boundary sub-parallel to theTentugal shear zone (Fig. 6a and b). To the north of the TransbrasilianoLineament (TB), NE–SW trending gravity anomalies bend in a NNW–
SSE direction within the basin.In the central part of the Parnaíba basin, a series of N–S to NE–SW-
oriented linear gravity minima are observed in the residual gravityanomalies map (Fig. 6e). This map suggests that low-density, graben-like features are present in the basement of the Parnaíba and Teresinadomains. They are slightly curved eastwards and, from west to east,their major axes bend in a NE–SW direction. These structures are par-tially bounded on the south by the Transbrasiliano Lineament or are par-allel on its eastern counterpart. These gravity lows can be caused bylighter sources either within the basin (buried grabens) or in the base-ment (granitic rocks and/or low-grade metasedimentary sequences).
Analyzing the magnetic maps (Fig. 5), it is clear that no magneticlineaments are correlated with the above-mentioned gravity trends,suggesting that the geological units that generate the gravity anomaliesdo not exhibit large lateral contrasts in magnetic susceptibility. On theother hand, the NE–SW trend of negative magnetic and pseudo-gravity anomalies, which are coincident with the Cambrian–Ordovicianrifts underlying the Parnaíba Basin (Fig. 5d and e), is not evident in thegravity maps (Fig. 6f). Considering the high correlation coefficientbetween magnetic ASA and THD data sets, remnant magnetization isnot expected to provoke an overall change in the magnetic trend capa-ble of overcoming a supposed magnetic trend related to the gravitylows. Therefore, it is reasonable that the gravity lows conceal the
anomalies of the graben-like structures. Thus, the causative sourcesshould be found in the Precambrian basement. In fact, Cordani et al.(1984) describe a single borehole that reached mylonitic syenite to adepth of 1686 m in the area of gravity lows. N–S gravity minima occuroverlaying supracrustal sequences in the Araguaia Belt farther west.This suggests that lighter low-grade metasedimentary sequences filledpossible N–S graben-like structures before the rifting process tookplace in the Cambrian–Ordovician time.
4.3. Euler solutions
The Euler solutions have been separated in three depth ranges tobetter identify the distribution of intrabasin (b2 km) and intrabasement(2 to 4 km and N 4 km) causative sources and to aid determination ofthe main magnetic and gravity domains beneath the Parnaíba Basin(Fig. 7 and Table 1). Both magnetic and gravity solutions are moresparse to depths of 2 km, suggesting that the major causative sourcesare located within the basement. The magnetic solutions show an E–W trend in the Amazonian Craton (AM) and Araguaia (As) domains,whereas the gravity solutions have a more random pattern. In theTocantins Province, the geophysical domains Ab and GM are character-ized by slightly N–S trends ofmagnetic Euler solutions, whereas the cra-tonic areas and their surrounding fold belts (SF + BS and GU + SL)show NE and E–W trends, respectively (Fig. 7a, b and c). In the centralpart of the basin, a high concentration of magnetic Euler solutions oc-curs in the Teresina Domain without an obvious trend. In contrast, theParnaíba domains (PN and PS) show a scarce and NE–SW to N–S orient-ed distribution ofmagnetic solutions (Fig. 7a, b and c). In this region, thegravity Euler solutions exhibit N–S orientation, partially coincidentwiththe proposed graben-like structures within the Precambrian basement.At the eastern edge of the basin, magnetic solutions appear as highlyconcentrated NE–SW-trending clusters. This area consists of severalNeoproterozoic fold belts and basement inliers, deformed and intrudedby granites during the Brasiliano orogeny. It is worth mentioning that
Table 1Qualitative analysis results of themagnetic and gravity anomalies. Summary of the characteristics of themain geophysical domains (Figs. 5 and 6); structural patterns, regional geophysicalsignatures and possible origin. Asterisks indicate the main anomaly pattern used to identify the geophysical domains. MIA - magnetic anomaly; GIA - gravity anomaly.
Domains Magnetic, pseudo-gravity and gravity Tilt-derivative (TDR), horizontalgradient (HGM), Euler solutions (EUS)
Possible origin
BS, BN, MCBorboremaProvince
NE–SWmagnetic and pseudo-gravity minima.E–W regional magnetic low.−92.7 nT b MIA N 237 nT−98.3 mGal b GIA N 44.7 mGal
NE–SWmagnetic and N–S gravity lineaments.Shallow gravity EUS follow the TBL.In the BS, S-shaped TDR and HGM trends; andrelatively low magnetic EUS concentration.*
Borborema Province structural setting.
As, Ab, GMTocantinsProvince
E–Wmagnetic and pseudo-gravity anomaly that isbending to NE–SW beneath the Parnaíba Basin.N–S broad gravity anomaly.*−390 nT b MIA N 380 nT−94.6 mGal b GIA N 15.7 mGal
Magnetic TDR, HGM and EUS trends limit Aband GM domains.N–S gravity TDR and deep EUS.*
Broad gravity minima are probably reflectingmetasediments and thrust sequences of Brasilianocollision.
PN, PS, TRParnaíbaBlock
Magnetic and pseudo-gravity lows parallel to the TBL.Regional gravity low.*Gravity anomaly swings from N–S near the TocantinsProvince to NE–SW towards the east in the vicinity of TBL.*−115 nT b MIA N 95.2 nT−89 mGal b GIA N −30.4 mGal
NE – SW and E – Wmagnetic trends.S-shaped gravity lineaments suggestW limit ofthe TR.Low TDR in the PN and TR and high TDR in thePS.In the TR, high magnetic EUS and low gravityEUS concentration.*
This geophysical pattern suggests an independentdomain wedged between fold belts.
SL, GUSão LuísCraton
ENE–WSW trends.NW–SE farther northwest.Regional magnetic high.*Gravity high indicates SL and GU boundaries.*−37.9 nT b MIA N 79.3 nT−90.8 mGal b GIA N 22.7 mGal
In the TDR andHGM, sharp lineaments indicateSL and GU boundaries.*Magnetic EUS follow SL-GU contact.
Probably reflect the SL and GU structural setting.
SF, SBSãoFranciscoCraton
NE–SW lineaments and N–S farther south (gravity)Low regional magnetic and gravity anomaly.*Residual gravity high in the SB.*−74.7 nT b MIA N 94.2 nT−115 mGal b GIA N −12.5 mGal
NE–SWmagnetic lineamentsThe gravity trend swings fromNE–SW in the SBto N–S towards to the south in the SF.*
Denser bodies along the northern limit of the craton.Regional gravity suggests a relatively thicker crust.
AMAmazonianCraton
E–Whigh-frequencymagnetic and pseudo-gravity anomaly.Distinct high regional gravity anomaly.*−320 nT b MIA N 770 nT−58.5 mGal b GIA N 16.9 mGal
In the TDR, HGM and EUS, sharp E–Wmagneticlineaments.*Gravity trends are not easy to recognize.
Complex Archean to Paleoproterozoic granite–greenstone terrains overlying a relatively thinner crust
137D.L. de Castro et al. / Tectonophysics 614 (2014) 128–145
Author's personal copy
clouds of both magnetic and gravity Euler solutions are distributed alongthemajor Brasiliano shear zones (Fig. 7). This suggests that some of thoseEuler solutions could be related to the Cambrian–Ordovician rifts, whichare the precursors of the Parnaíba basin. However, the regional scaleof the present study does not allow a more detailed analysis of thisassertion.
5. New insights on tectonic framework
The tectonic framework underlying the Parnaíba Basin (Fig. 8) isbased on previous geophysical studies and a variety of geological maps,compiled in Fig. 2, and the interpreted magnetic and gravity domainsand lineaments from this work. A comparison between our interpreta-tion and the previous map shows some similarity, but also some signifi-cant differences, mainly in the recognition of crustal boundaries andgraben-like structures. The Precambrian basement includes threecratonic areas, bounded by Neoproterozoic fold belts, and a centralconcealed block, which probably represents an old stable crustal seg-ment from the Brasiliano collision. The three main structural trends inthe surrounding fold belts, N–S in the west, NE–SW in the south andeast, and E–W in the north, are parallel to the basin boundaries. Thistectonic configuration reflects the lateral movement of the surroundingcrustal blocks during the Brasiliano orogeny, resulting in the triangularform of the basement inliers (Parnaíba and Teresina blocks).
Based on their magnetic and gravity signatures, the basement inlierscan be divided in three sub-domains, the Parnaíba N, Parnaíba S andTeresina blocks (Fig. 8). The Teresina Block is well distinguished by itsmagnetic and gravity patterns (Figs. 5 and 6, Table 1) and in the distri-bution of Euler solutions (Fig. 7). However, there is no exposure ofthese blocks, thus their sub-division is based solely on potential fielddata and requires further confirmation. Furthermore, the magneticand gravity maps also reveal two distinct sets of anomalies, which arerelated to structural features within the basement (Figs. 5 to 8). Theirlow density and low magnetic content suggest that they representtwo generations of rifts filled by sedimentary ormetasedimentary units.
6. Geophysical modeling
6.1. 3D Moho inversion
Knowledge of the crustal thickness is important for understanding thetectonic complexity of the Precambrian basement. Thus, a 3D inversion ofregional gravity anomalies (Fig. 6a) was calculated to estimate Moho re-lief, to provide a first order estimate of crustal thickness. We assume thatthe regional gravity anomaly is only due to variation in the crustal thick-ness. To make this premise more viable, the regional–residual separationfilter was applied to the Bouguer anomaly corrected for intra-crustal sed-imentary basins. This sediment correction was applied using sedimentthickness and density information obtained from a global sedimentthickness map developed by Laske and Masters (1997). Basementdepth information from 26 exploratory wells in the Parnaíba Basinwas incorporated in the sediment thickness data.
The inversion process was carried out using GMSYS-3D software,which uses frequency-domain calculations based on Pearson's imple-mentation (Pearson, 2001) of Parker's algorithm (Parker, 1972). Astructural model is defined by a number of stacked surface grids withdensity-distributions specified for the intervening layers. We used asimple two-layer model for the Parnaíba Basin region; the first layerrepresented a homogeneous crust and the second layer the lithosphericmantle. The top of the second layerwas a grid built froma regional crust-al model for South America, called GMSA12 (Van der Meijde et al.,2013), derived from GOCE satellite gravity data, and representing aninitial estimate of the Moho relief.
Since the region has a scarcely and spatially inhomogeneous seismiccoverage we decided to incorporate no point constraint data in the in-version approach. In this way, we obtained a simple, balanced and
non-biased crustal model. However, we compared our results with theGMSA12 model and 23 seismic point observations compiled byAssumpção et al. (2013) in order to evaluate the uncertainties of thecrustal thicknesses. The gravity-derived Moho relief was estimated as-suming standard densities of 2830 kg/m3 and 3200 kg/m3 for thecrust and lithosphericmantle, respectively. Uncertainties for the gravitymodel were estimated based on crustal thickness variations observedby varying the crust density with 0.05 g/cm3. The chosen density wasdefined by minor differences between our model, the GMSA12 modeland seismic points.
The gravity-derived crustal model shows the Moho surface rangingbetween 13.3 and 46.4 km in the Parnaíba Basin region (Fig. 9a). Com-parison of crustal thickness with seismic points, where reported uncer-tainties are on average±3 km(Assumpção et al., 2013), shows that 83%of the data exhibit a difference less than ±6 km. Van der Meijde et al.(2013) consider such an agreement between gravity- and seismic-derived estimates fairly good for providing new insights on crustalstructure and tectonics of the stable part of the South America con-tinent. Their GSMA12 model provides a very similar Moho relief(Fig. 9b) with a slightly better correlation with seismic-derived crustalthickness outside the Parnaíba Basin. However, our model highlightssome smaller-scale crustal features, mainly inside the airborne surveyarea, such as the internal blocks within the basement inliers (Parnaíbaand Teresina blocks) and their limits with the Tocantins Province(Araguaia Belt and Goiás Magmatic Arc) and São Francisco Craton.
The difference between seismological and gravity Moho depthsgreater than the seismic accuracy (±3 km) can be explained by recog-nizing that the proposed 3D gravity model does not take into accountany lateral density variations within the crust. Therefore, the gravityMoho models (Fig. 9) are either over- or under-estimated where thecrustal blocks are more or less dense, respectively. Modeling GOCE sat-ellite gravity data, Mariani et al. (2013) related a more than 5 km dis-crepancy between seismic and gravity crustal thickness beneath theParaná Basin to magmatic underplating in the lower crust. However,no evidence of a large igneous province underneath the ParnaíbaBasin has been yet shown. Thus, thicker gravity-derived crust in theAraguaia Belt and Borborema Province (As and BB in Fig. 9) suggeststhat these orogenic areas are relatively denser than the surroundingcrustal blocks. On the other hand, thinner gravity-derived crust in theSão Francisco Craton (SF) proposes a slightly lighter cratonic area com-pared to surrounding fold belts.
The modeled Moho depths are relatively deeper beneath cratonicareas (SF and SL domains), central basement inliers (PR and TR domains),and supracrustal sequences (As, GU and BB domains). On the other hand,the Moho depths are shallower below the western, southern and north-eastern borders of the Parnaíba and Teresina blocks (Ab, GM, SB andMC domains), thewestern edge of the Teresina block and the AmazonianCraton. It is worth mentioning that the Moho relief displays long-wavelength N–S trending undulations with depth differences of 4–6 kmin 250–350 km horizontal distances from the Amazonian Craton to theTeresina Block. In the region of the São Francisco Craton, such undulationsassume a NE–SW orientation, roughly parallel to the edges of this crustalblock. These crustal patterns of Moho undulations are consistent with aclassic continental collisional tectonic scenario (Condie, 1997), where rel-ative thinner crust occurs in the internal counterparts of a collisional zone(Parnaíba and Teresina blocks). The external counterparts comprise theAmazonian and São Francisco cratons and their respective surroundingfold belts belonging to the Tocantins and Borborema provinces. Shinet al. (2007) and Karabulut et al. (2013) described examples of Mohoundulations related to a collisional setting in the Tibetan Plateau andAnatolian microplate, respectively.
6.2. 2D joint modeling
Forward 2D joint modeling (Fig. 10) was carried out using GM-SYSsoftware on both reduced-to-pole magnetic and Bouguer anomalies
138 D.L. de Castro et al. / Tectonophysics 614 (2014) 128–145

Author's personal copy
along profile B–B′ (Fig. 8). This 1200 km long transect was selected tooutline the crustal structure at the western and southern edges of theParnaíba Basin, as well as its internal geometry. The profile extendsfrom the Amazonian Craton to the São Francisco Craton across foldbelts (Tocantins and Borborema provinces) and basement inliers be-neath the Parnaíba Basin. In particular, it is designed to shed morelight on the tectonic relationship between the many crustal blocks,which comprise the Precambrian basement, and their roles in thebasin formation.
We incorporated the Moho relief derived from the 3D gravitymodeling (Fig. 9) as constraints into the physical property model.Depths for upper and middle crusts were inferred from the CRUST 2.0model (Laske et al., 2000), which is a global model based on the compi-lation of existing seismological data with a resolution of 2° by 2°. Thiscrustal model divides the crust into the oceanic layer, two layers of sed-iments, and three crustal layers (upper, middle and lower crust). Noadjustments weremade to these crustal boundaries. In addition, we de-fined the causative bodies and their limits based on previously mapped
Fig. 8. Final interpreted tectonic sketch of the Parnaíba Basin structural framework.
139D.L. de Castro et al. / Tectonophysics 614 (2014) 128–145

Author's personal copy
geology and depth analysis using the analytic signal technique. Similarto Euler deconvolution, the analytic signal technique provides discretedepth-to-source information at a limited number of points along thetransect (Blakely, 1996). Because there is no direct information avail-able from boreholes, this 2D modeling is considered a first-order ap-proximation of the internal geometry of the basin and the rifts belowit. The model proposal is constrained indirectly by information fromwells and seismic data from other regions of the basin (Cordani et al.,1984; Oliveira andMohriak, 2003), summarized in the schematic profileof Fig. 3.
The final model densities (kg/m3) and assigned magnetic suscepti-bilities (SI units) of the different rocks units are given in Table 2.Assigned magnetic susceptibilities are mathematical representationsthat incorporate both magnetic susceptibility and a remanent compo-nent, if applicable. Thus, negative values represent dominantly reverse-polaritymagnetization. No remnantmagnetization has been incorporat-ed in the model, since no constraint of this variable is yet known.However, the high correlation between 3D analytical signal (ASA) andtotal horizontal gradient (THD) maps suggests that the magneticsourcesmainly present an inducedmagnetization. The physical proper-ties of the bodies were initially estimated from average values mea-sured from rock samples worldwide (e.g., Clark and Emerson, 1991;Telford et al., 1998) and published samplemeasurements from onshorebasins and basement rocks in NE Brazil (De Castro, 2011; Sousa, 1996;Ussami and Molina, 1999).
The reduced-to-pole magnetic and Bouguer gravity anomaliesalong profile B–B′ (Fig. 10a, b) reflect both the large-scale structuresassociated with deep crustal variations and the geological domainsin the upper crust. The regional field shows gravity highs at the NWand SE boundaries of the Borborema Province, interpreted as an ele-vation of the Moho and denser upper and middle crust, as suggestedby Ussami and Molina (1999) based on gravity modeling of the To-cantins Province. Thinner crust of the Araguaia basement and GoiásMagmatic arc depicted by Soares et al. (2006) further south underliethe gravity high in the NW part of the profile. On the other hand, noclear evidence has yet been found for higher density in the upper
crust. As for the SE border, a confirmation of Moho topography isnot yet possible.
The shallow basement areas in the Borborema Province, includingthe Parnaíba Block, are shown as gravity lows, reflecting the basin'sinternal geometry, and as alternating magnetic lows and highs, whichreveal a complex magnetization pattern of the underlying basement.The lateral contacts between these basement domains are wellconstrained by analytic signal solutions (Fig. 10c). The borders of thecratonic areas (Amazonian and São Francisco), sub-domains of theTocantins Province, and the Brasiliano shear zones (Transbrasiliano,Patos and Pernambuco) are clearly recognized in the alignments ofmagnetic (red dots) and gravity (blue dots) analytic signal solutions(Fig. 10c).
The final joint model, constructed by a trial and error process, isshown in Fig. 10d. Body descriptions and physical parameters aregiven in Table 2. It was necessary to introduce many sources in theupper crust in order to obtain the best fit between the observed and cal-culated magnetic anomalies. The densities of these bodies are constantbut the magnetic susceptibilities are variable in the modeling process.Their lateral limits were also defined based on analytic signal solutions(Fig. 10c). These causative bodies represent different rocks within thegeological blocks. In the study area, the model is consistent with a sub-surface structure dominated by a complex Precambrian collisional base-ment, overlain by different sedimentary units during the Phanerozoic.We built an interpretative geological model (Fig. 11) to synthetize thetectonic evolution of the Parnaíba Basin and its basement.
7. Discussion
The Parnaíba Basin is a large Phanerozoic basinwith partially hiddencrust segments of the Rodinia Supercontinent, amalgamated by theaccretionary and collisional Brasiliano/Pan-African orogeny that formedthe West Gondwana continent (Brito Neves, 2002; Fuck et al., 2008).The complex basement beneath this basin comprises cratonic frag-ments, basement inliers and Neoproterozoic fold belts. The regionrepresents a key area in the reconstruction models of Rodinia. The
Fig. 9.Comparison ofMoho relief derived from3-D inversion of regional gravity anomalies (a) andGMSA12model (b) (Van derMeijde et al., 2013)with seismic point dataset (Assumpçãoet al., 2013). Deviations are defined as the difference of the seismic point observation with respect to the gravity derived estimate (colored circles). Gravity domains: AM— Amazonian;SF— São Francisco; SB— South Border; SL— São Luís; BB— Borborema; TR— Teresina; GU— Gurupi; PR— Parnaíba;MC—Médio Coreaú; GM— Goiás Magmatic Arc; BR— Brasília; Ab—
Araguaia basement; As— Araguaia supracrustal. Shear zones: TB— Transbrasiliano; TG — Tentugal; PA— Patos; PE — Pernambuco; SP— Senador Pompeu.
140 D.L. de Castro et al. / Tectonophysics 614 (2014) 128–145

Author's personal copy
Precambrian tectonic history controlled the rifting processes at the be-ginning of the Phanerozoic and played an important role in the develop-ment of the whole Parnaíba Basin (Cordani et al., 1984, 2009a).
The regional gravity anomalies (Fig. 6) contribute to the interpreta-tion that the main depositional process developed on a thicker crustalplatform limited by collisional structural highs (Fig. 11). In fact, both
Fig. 10. 2Dmodeling of reduced-to-pole magnetic (a) and Bouguer gravity (b) anomalies along Profile B–B′. Magnetic (red circles) and gravity (blue circles) source distributions derivedfrom analytic signal depth analysis(c). Final adjusted geophysical model (d). Body descriptions and physical parameters are given in Table 2. Geological domains: As — Araguaiasupracrustal; Ab — Araguaia basement; GM — Goiás Magmatic Arc; JG — Jaguaribe; ZT — Transversal Zone; RP — Riacho do Pontal. Shear zones: TB— Transbrasilano; PA — Patos; PE —
Pernambuco.
141D.L. de Castro et al. / Tectonophysics 614 (2014) 128–145

Author's personal copy
the 3Dmodeling of theMoho relief (Fig. 9) and the 2D jointmodeling ofProfile B–B′ (Fig. 10) indicate that the western basin edge assumes a N–S orientation, coincident with the structural trend of the TocantinsProvince and the Amazonian Craton boundary. The geophysical modelsare consistent with geological and geochronological evidence of a typi-cal collisional margin (Pimentel and Fuck, 1992), where the GoiásMagmatic Arc and theAraguaia Fold Belt overlapped the eastern bound-ary of the subducted Amazonian Craton (D'el-Rey Silva et al., 2011)(Fig. 11). To the east of the Goiás Magmatic Arc (GM in Fig. 2 and c inFig. 8), the Parnaíba Block acted as the crustal counterpart to the overallaccretionary/collisional tectonics (Fig. 12a). In a similarway, theNE–SWoriented SE border of the Parnaíba Basin overlies a collisional boundary,involving the São Francisco Craton, Borborema Province and ParnaíbaBlock. The structural trend is marked by large shear zones, which
splay eastwards roughly following the boundary of the São FranciscoCraton. In this case, the marginal gravity high (South Border GravityDomain— Fig. 6) encompasses the northernmost portion of the cratonicmargin Rio Preto and Riacho do Pontal fold belts of the BorboremaProvince. According to the geophysical responses and modeling, thisarea results from collisional events involving the Amazonian and SãoFrancisco Cratons and the Parnaíba Block in a way similar to thatdescribed by D'el-Rey Silva et al. (2011) to the south, in Central Brazil.In both suture zones, local Moho elevations occur followed by thickercrustal portions beneath the Araguaia Belt and São Francisco Craton(Fig. 11).
Along the northern basin boundary, distinct magnetic and gravitypatterns allow us to infer the probable tectonic boundaries betweenthe São Luís Craton, Gurupi and Médio Coreaú belts, and the Parnaíba
Table 2Body physical properties of crustal domains along the Profile B–B′ from joint modeling of gravity and magnetic data.
Crustal domain Geological unit Lithology Model index Density (kg/m3) Assigned susp. (S.I.)
Parnaíba Basin Mosquito Formation Volcanic rocks 29 2900 0.000124Sedimentary units Sedimentary sequences 28 2450 0.000069
Cambrian rifts – Sedimentary sequences 27 2550 −0,000252Borborema Province Riacho do Pontal Metasedimentary sequences 26 2750 0.000038
Transversal Zone Metasedimentary sequences 25 2750 0.000419Jaguaribe Domain Metasedimentary sequences 24 2750 0.000189Parnaíba Block Metasedimentary sequences 23 2690 0.000043
Upper Crust — SE block 22c 2810 0.000370Upper Crust — Middle block 22b 2810 −0.000259Upper Crust — NW block 22a 2810 −0.000705
Middle crust – 21 2870 0.002754Tocantins Province Goiás Magmatic Arc Upper Crust — SE block 20 2810 −0.000636
Upper Crust — NW block 19 2710 −0.000536Middle crust 18 2870 0.002754
Araguaia basement metamorphic and igneous suite 17 2810 0.000506Middle crust: ultramafic rocks 16 2900 0.000712
Araguaia supracrustal Metasedimentary sequences 15 2700 0.000335Middle crust: mafic rocks 14 2810 −0.000234
São Francisco Craton (Sobradinho Block) Supracrustal II Ortogneissic unit 13 2700 −0.000412Supracrustal I Granitic— gneissic suite 12 2710 −0.000003Basement Upper Crust — SE block 11 2740 0.000569
Upper Crust — Middle block 10 2790 0.000339Upper Crust — NW block 9 2810 0.000358Middle Crust: ultramafic rocks 8 2890 0.003724
Upper Crust – 7 2750 0.000265Middle Crust – 6 2870 0.002754
Amazonian Craton Bacajás Domain Granite–greenstone terranes 5 2710 0.000863Upper Crust – 4 2770 −0.003481Middle Crust – 3 2870 −0.001854
Lower Crust – – 2 3000 0.0Mantle – – 1 3200 0.0
Fig. 11. Interpretativemodel for airborne gravity andmagnetic datamodel B–B′. Geological domains: As—Araguaia supracrustal; Ab— Araguaia basement; GM—GoiásMagmatic Arc; PG—
Paleozoic graben; CG— Cambrian graben; PR— Parnaíba Block; JG— Jaguaribe; ZT— Transversal Zone; RP— Riacho do Pontal; Sb— South border. Shear zones: TB— Transbrasiliano; PA—
Patos; PE — Pernambuco.
142 D.L. de Castro et al. / Tectonophysics 614 (2014) 128–145
Author's personal copy
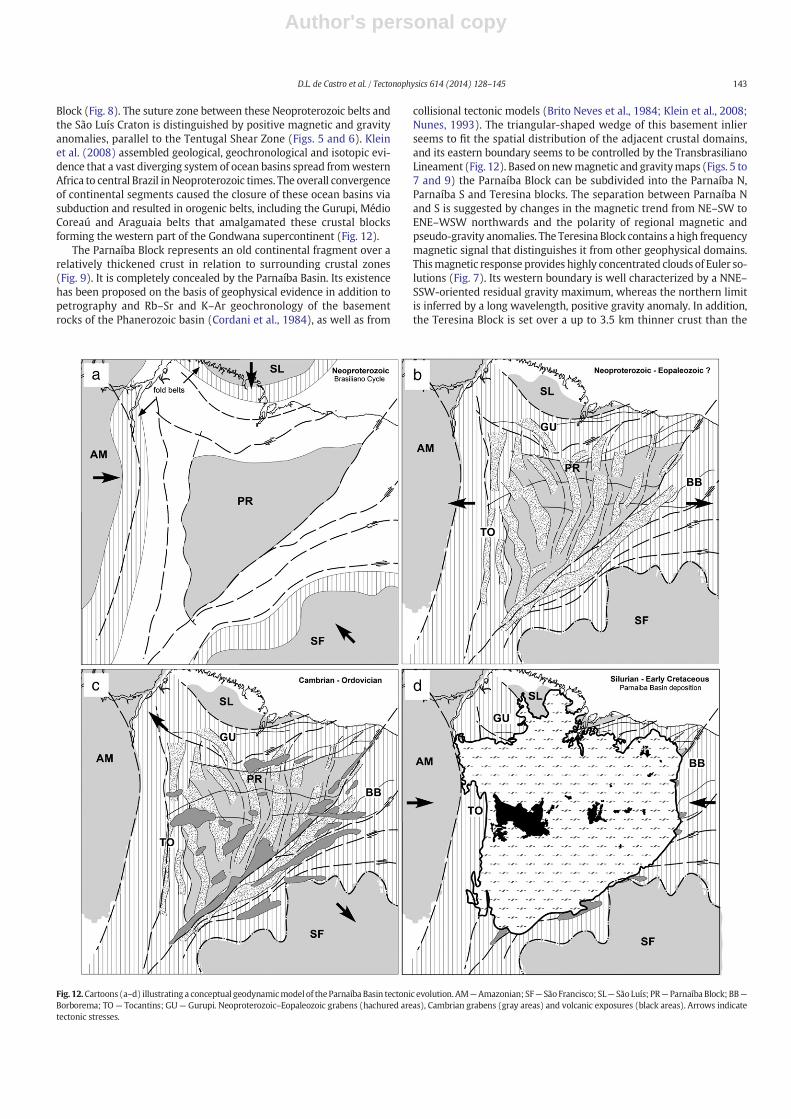
Block (Fig. 8). The suture zone between these Neoproterozoic belts andthe São Luís Craton is distinguished by positive magnetic and gravityanomalies, parallel to the Tentugal Shear Zone (Figs. 5 and 6). Kleinet al. (2008) assembled geological, geochronological and isotopic evi-dence that a vast diverging system of ocean basins spread fromwesternAfrica to central Brazil in Neoproterozoic times. The overall convergenceof continental segments caused the closure of these ocean basins viasubduction and resulted in orogenic belts, including the Gurupi, MédioCoreaú and Araguaia belts that amalgamated these crustal blocksforming the western part of the Gondwana supercontinent (Fig. 12).
The Parnaíba Block represents an old continental fragment over arelatively thickened crust in relation to surrounding crustal zones(Fig. 9). It is completely concealed by the Parnaíba Basin. Its existencehas been proposed on the basis of geophysical evidence in addition topetrography and Rb–Sr and K–Ar geochronology of the basementrocks of the Phanerozoic basin (Cordani et al., 1984), as well as from
collisional tectonic models (Brito Neves et al., 1984; Klein et al., 2008;Nunes, 1993). The triangular-shaped wedge of this basement inlierseems to fit the spatial distribution of the adjacent crustal domains,and its eastern boundary seems to be controlled by the TransbrasilianoLineament (Fig. 12). Based on newmagnetic and gravitymaps (Figs. 5 to7 and 9) the Parnaíba Block can be subdivided into the Parnaíba N,Parnaíba S and Teresina blocks. The separation between Parnaíba Nand S is suggested by changes in the magnetic trend from NE–SW toENE–WSW northwards and the polarity of regional magnetic andpseudo-gravity anomalies. The Teresina Block contains a high frequencymagnetic signal that distinguishes it from other geophysical domains.Thismagnetic response provides highly concentrated clouds of Euler so-lutions (Fig. 7). Its western boundary is well characterized by a NNE–SSW-oriented residual gravity maximum, whereas the northern limitis inferred by a long wavelength, positive gravity anomaly. In addition,the Teresina Block is set over a up to 3.5 km thinner crust than the
Fig. 12.Cartoons (a–d) illustrating a conceptual geodynamicmodel of theParnaíba Basin tectonic evolution. AM—Amazonian; SF— São Francisco; SL— São Luís; PR— Parnaíba Block; BB—
Borborema; TO— Tocantins; GU— Gurupi. Neoproterozoic–Eopaleozoic grabens (hachured areas), Cambrian grabens (gray areas) and volcanic exposures (black areas). Arrows indicatetectonic stresses.
143D.L. de Castro et al. / Tectonophysics 614 (2014) 128–145

Author's personal copy
adjacent western crustal segments (Fig. 9a), suggesting an importantlateral change in the deep crustal architecture within the whole base-ment inlier blocks.
In the period between the end of the Neoproterozoic–EopaleozoicBrasiliano collage and the initiation of sag deposition in the Silurian, atleast two rift stages were overprinted on the Parnaíba Basin structuralframework. The oldest one is apparently represented by a set of exten-sive graben-like non-outcropping structures, restricted mostly to thebasement inliers (Parnaíba and Teresina blocks). They are oriented N–S and NE–SW and curve slightly eastwards, as revealed by linear gravityminima in the central part of the basin (Fig. 6e). Their major axes haveno apparent relationship to the Brasiliano tectonic trends, althoughsuch structures are limited by the Transbrasiliano Lineament on theSE. Cordani et al. (1984) described low-grade metamorphic rocks col-lected in exploratory boreholes, which could represent the low-density rift infill. A possible origin for these features could be related toan E–W oriented extensional event in the Neoproterozoic–Eopaleozoic(Fig. 12b).
The second rift stage is recorded by a set of Cambrian–Ordoviciangrabens, which partially crop out at the basin edges and extend beneaththe Parnaíba Basin as indicated by deep exploratory boreholes and seis-mic sections (Brito Neves et al., 1984; Góes et al., 1990) and by a previ-ous interpretation of integrated terrestrial gravity and aeromagneticdata (Nunes, 1993). NE-oriented magnetic and pseudo-gravity minimaare correlated with these graben-like structures, which occur through-out the basin area, but are concentrated along the TransbrasilianoLineament. A few of them show an E–Worientation parallel to themag-netic alignment in the center of the basin (Line A–B in Fig. 5a, b). Accord-ing to Oliveira and Mohriak (2003), this whole set of grabens resultedfrom a widespread continental breakup during the transition ofNeoproterozoic to early Phanerozoic times (Fig. 12c), which separatedLaurentia and Baltica from West Gondwana. However, the Cambrian–Ordovician rifting process did not evolve to form passive continentalmargin basins (Brito Neves, 2002; Oliveira andMohriak, 2003). Instead,the West Gondwana continent underwent a period of tectonic quies-cence until extensional stresses induced the breakup between SouthAmerica and Africa and the formation of the Equatorial Atlantic in theMesozoic. In the meantime before breakup, the final stages of the riftphase in the Parnaíba Basin were affected by the inversion of previousextensional structures followed by a negative exponential subsidenceassociated with cooling and hence the isostatic adjustment of the litho-sphere (Oliveira and Mohriak, 2003). As a consequence, large post-riftsedimentary sequenceswere deposited over awidespread area, with in-tercalated volcanism, as in a typical cratonic sag basin (Fig. 12d).
8. Conclusions
Airborne potential field data have been used to constrain the struc-tural framework of the Parnaíba Basin and its complex Precambrianbasement. Improvements over previous interpretations of the ParnaíbaBasin basement include detailing of the basement inliers (Parnaíba andTeresina blocks) and refinement of the basement's internal structureand its contacts with the surrounding fold belts. N–S magnetic andgravity anomalies confirm the prolongation of the Tocantins Provincenorthwards. NE–SW geophysical lineaments reveal thewestern bound-ary of the Borborema Province, controlled by the Transbrasiliano Linea-ment. The limit between the basement inliers, Médio Coreaú Domain(Borborema Province), Gurupi Belt and São Luís Craton is inferredfrom E–W to NW–SE geophysical signal.
The triangular-shaped, 36 km to 40.5 km thick crustal fragment,which comprises the Parnaíba and Teresina blocks, is emplaced in thecentral region of an overall Neoproterozic–Eopaleozoic collisional eventin NE Brazil, where the Amazonian, São Francisco, and São Luís cratonsconverged during the West Gondwana amalgamation. The peripheralfold belts (Tocantins and Borborema provinces and Gurupi Belt) werestrongly deformed and metamorphosed during the Brasiliano–Pan
African orogeny. Especially at thewestern and SE basin edges, large grav-ity highs reflect significant crustal boundaries, possibly related to conti-nental collision with crustal thickening and local Moho elevation in thesuture zones. These limits are coincident with the major structuraltrends, represented by large N–S- and NE–oriented shear zones in theTocantins and Borborema provinces, respectively. In addition, an arcuatepositive gravity anomaly reflects the concealed suture zone between theSão Luís Craton and the Gurupi Belt. The contact between the Gurupi Beltand the basement inliers is less clear in the potential fieldmaps, suggest-ing that rocks of both crustal blocks have been reworked during theNeoproterozoic orogenic event, masking any lateral contrast betweenthem.
Two rifting stages preceded the major intracratonic sag deposition.The oldest one is revealed by weakly arcuate negative gravity anoma-lies, located in the central basement inliers. Their overall N–S orienta-tion shows a progressive bending to the NE–SW eastwards, suggestingthat E–W trending extensional stresses took place at the final stages ofthe Brasiliano orogeny. In the central sector of the basin, an E–W struc-tural trend and principal axes of graben-like features and volcanic expo-sures are recorded by regional magnetic lineaments. Negative residualmagnetic and pseudo-gravity anomalies display NE–SW linear grabensrelated to the second rifting process. This series of Cambrian–Ordoviciantroughs are exposed partially at the eastern and southern edges of theParnaíba Basin and their concealed portions can be better mappedusing the new geophysical maps. They mainly occur along theNeoproterozoic shear zones, especially the Transbrasiliano Lineament,exposing the structural control of the Precambrian tectonic fabric inthe rifting process. In the modeled profile, these graben-like featuresreach a maximum thickness of 1.5 km beneath the up to 2.5 km thicksag infill.
Acknowledgements
This research is part of the Transbrasiliano Project, supported by theBrazilian oil company Petrobras, and INCT-Estudos Tectônicos. The au-thors are greatful to the Agência Nacional do Petróleo, Gás Natural eBiocombustíveis (ANP) and Serviço Geológico do Brasil (CPRM) for sup-plying geophysical data. The geophysical processing, modeling and inter-pretation were carried out in the Crustal Geophysics and GeochemistryScience Center (CGGSC), U.S. Geological Survey. A.E. McCafferty(USGS) and two anonymous referees improved previous versions ofthis paper. The authors would also like to acknowledge the ConselhoNacional de Desenvolvimento Científico e Tecnológico (CNPq) andCoordenação de Aperfeiçoamento de Pessoal de Nível Superior(CAPES— Grant number: 8826/11-0) for their research grants. The cor-responding author dedicates his part in thiswork to hiswhole family, inparticular to Jorge Teixeira de Castro.
References
Almeida, F.F.M., Hasui, Y., Brito Neves, B.B., Fuck, R.A., 1981. Brazilian structural provinces:an introduction. Earth-Sci. Rev. 17, 1–29.
Almeida, F.F.M., Brito Neves, B.B., Carneiro, C.D.R., 2000. The origin and evolution of theSouth American Platform. Earth-Sci. Rev. 50, 77–111.
Alvarenga, C.J.S., Moura, C.A.V., Gorayeb, P.S.S., Abreu, F.A.M., 2000. Paraguay and Araguaiabelts. In: Cordani, U.G., Milani, E.J., Thomaz Filho, A., Campos, D.A. (Eds.), TectonicEvolution of South America. Rio de Janeiro. 31st International Geological Congress,pp. 183–193.
Assumpção, M.S., Bianchi, M., Julià, J., Dias, F.L., França, G.S.L., Pavão, C.G., Albuquerque,D.F., Lopes, A.E.V., 2013. Crustal thickness map of Brazil and adjacent areas: data com-pilation and main features. J. S. Am. Earth Sci. 43, 74–85.
Bizzi, L.A., Schobbenhaus, C., Vidotti, R.M., Gonçalves, J.H., 2003. Geologia, Tectônica eRecursos Minerais do Brasil. CPRM, Ed., UnB, Brasília, p. 692.
Blakely, R.J., 1996. Potential theory in gravity and magnetic applications, 2nd ed. Cam-bridge University Press, Cambridge (UK) (441 pp.).
Bond, G.C., Nickeson, P.A., Kominz, M.A., 1984. Breakup of a supercontinent between 625and 555 Ma: new evidence and implications for continental histories. Earth Planet.Sci. Lett. 70, 325–345.
Brito Neves, B.B., 2002. Main stages of the development of the sedimentary basins of SouthAmerica and their relationship with the tectonics of supercontinents. Gondwana Res. 5(1), 175–196.
144 D.L. de Castro et al. / Tectonophysics 614 (2014) 128–145

Author's personal copy
Brito Neves, B.B., Fuck, R.A., 2013. Neoproterozoic evolution of the basement of the SouthAmerican Platform. J. S. Am. Earth Sci. 47, 72–89.
Brito Neves, B.B., Fuck, R.A., Cordani, U.G., Thomaz Filho, A., 1984. Influence of basementstructures on the evolution of the major sedimentary basins on Brazil: a case of tec-tonic heritage. J. Geodyn. 1, 495–510.
Brito Neves, B.B., Campos Neto, M.C., Fuck, R.A., 1999. From Rodinia to Western Gondwa-na: an approach to the Brasiliano–Pan African Cycle and orogenic collage. Episodes 22(3), 155–166.
Bullard, E., Everett, J.E., Smith, A.G., 1965. The fit of the continents around the Atlantic:Symposium on Continental Drift. Philos. Trans. R. Soc. Lond. 258, 41–51.
Campos, J.E.G., Dardenne, M.A., 1997. Origem e Evolução Tectônica da Bacia Sanfranciscana.Rev. Bras. Geosci. 27 (3), 283–294.
Chew, D.M., Cardona, A., Mišković, A., 2011. Tectonic evolution of western Amazonia fromthe assembly of Rodinia to its break-up. Int. Geol. Rev. 53 (11–12), 1280–1296.
Clark, D.A., Emerson, D.W., 1991. Notes on rock magnetization in applied geophysicalstudies. Explor. Geophys. 22 (4), 547–555.
Condie, K.C., 1997. Plate tectonics and crustal evolution, 4th ed. Butterworth-Heinemann(282 pp.).
Cordani, U.G., Teixeira, W., 2007. Proterozoic accretionary belts in the Amazonian Craton.In: Hatcher, R.D.J., Carlson, M.P., McBride, J.H., Martínez, C.J.R. (Eds.), 4-D frameworkof continental crust. Boulder, Colorado, Geological Society of America Memoir, 200,pp. 297–320.
Cordani, U.G., Brito Neves, B.B., Fuck, R.A., Porto, R., Thomaz Filho, A., Cunha, F.M.B., 1984.Estudo preliminar de integração do Pré-Cambriano com os eventos tectônicos dasbacias sedimentares brasileiras. Ciência Técnica Petróleo, Seção Exploração dePetróleo, Rio de Janeiro 15, p70.
Cordani, U.G., Brito Neves, B.B., Thomaz Filho, A., 2009a. Estudo preliminar de integraçãodo Pré-Cambriano com os eventos tectônicos das bacias sedimentares brasileiras(Atualização). Bol. Geociênc. Petrobras, Rio de Janeiro 17 (1), 205–219.
Cordani, U.G., Teixeira, W., D'Agrella, M.S., Trindade, R.I., 2009b. The position of the Ama-zonian Craton in supercontinents. Gondwana Res. 15 (3–4), 396–407.
Cordani, U.G., Pimentel, M.M., Araújo, C.E.G., Basei, M.A.S., Fuck, R.A., Girardi, V.A.V., 2013a.Was there an Ediacaran Clymene ocean in central South America? Am. J. Sci. 313,517–539.
Cordani, U.G., Pimentel, M.M., Araújo, C.E.G., Fuck, R.A., 2013b. The significance of theTransbrasiliano-Kandi tectonic corridor for the amalgamation of West Gondwana.Braz. J. Geol. 43, 583–597.
D'el-Rey Silva, L.J.H., Oliveira, I.L., Pohren, C.B., Tanizaki, M.L.N., Carneiro, R.C., Fernandes,G.L.F., Aragão, P.E., 2011. Coeval perpendicular shortenings in the Brasília belt: colli-sion of irregular plate margins leading to oroclinal bending in the Neoproterozoicof central Brazil. J. S. Am. Earth Sci. 32 (1), 1–13.
Dall'Agnol, R., Costi, H.T., Leite, A.A.S., Magalhães, M.S., Teixeira, N.P., 1999. Rapakivi gran-ites from Brazil and adjacent areas. Precambrian Res. 95, 9–39.
Dannemiller, N., Li, Y., 2006. A newmethod for determination of magnetization direction.Geophysics 71, L69–L73.
Dardenne, M.A., 2000. The Brasília fold belt. In: Cordani, U.G., Milani, E.J., Thomaz Filho, A.,Campos, D.A. (Eds.), Tectonic Evolution of South America. 31st International Geolog-ical Congress, Rio de Janeiro, pp. 231–263.
De Castro, D.L., 2011. Gravity and magnetic joint modeling of the Potiguar rift basin (NEBrazil): basement control during Neocomian extension and deformation. J. S. Am.Earth Sci. 31, 186–198.
Dewangan, P., Ramprasad, T., Ramana, M.V., Desa, M., Shailaja, B., 2007. Automatic inter-pretation of magnetic data using Euler deconvolution with nonlinear background.Pure Appl. Geophys. 164, 2359–2372.
Fuck, R.A., Brito Neves, B.B., Schobbenhaus, C., 2008. Rodinia descendants in SouthAmerica. Precambrian Res. 160, 108–126.
Geosoft, 2013. Oasis Montaj 7.5 Mapping and Processing System. Quick StartTutorials.Geosoft Incorporated (258 pp.).
Góes, A.M.O., Souza, J.M.P., Teixeira, L.B., 1990. Estágio exploratório e perspectivaspetrolíferas da Bacia do Parnaíba. Bol. Geociênc. Petrobras 4 (1), 55–64.
Kaminsky, F.V., Sablukov, S.M., Sablukova, L.I., Zakharchenko, O.D., 2009. The FazendaLargo off-craton kimberlites of Piauí State, Brazil. Journal of South American Earth Sci-ences 28 (3), 288–303.
Karabulut, H., Paul, A., Ergun, T.A., Hatzfeld, D., Childs, D.M., Aktar, M., 2013. Long-wavelength undulations of the seismicMoho beneath the strongly stretchedWesternAnatolia. Geophys. J. Int. 194, 450–464.
Klein, E.L., Koppe, J.C., Moura, C.A.V., 2002. Geology and geochemistry of the Caxias golddeposit, and geochronology of the gold-hosting Caxias Microtonalite, São Luís Craton,northern Brazil. J. S. Am. Earth Sci. 14, 837–849.
Klein, E.L., Luzardo, R., Moura, C.A.V., Armstrong, R., 2008. Geochemistry and zircon geo-chronology of Paleoproterozoic granitoids: further evidence on the magmatic andcrustal evolution of the São Luís cratonic fragment, Brazil. Precambrian Res. 165(3–4), 221–242.
Laske, G., Masters, G., 1997. A global digital map of sediment thickness. EOS Trans. Am.Geophys. Union 78, F483.
Laske, G., Masters, G., Reid, C., 2000. CRUST 2.0: A new global crustal model at 2° × 2°.Available at http://igppweb.ucsd.edu/gabi/crust2.html.
Mariani, P., Braitenberg, C., Ussami, N., 2013. Explaining the thick crust in Paraná basin,Brazil, with satellite GOCE-gravity observations. J. S. Am. Earth Sci. 45, 209–223.
Maus, S., Sazonova, T., Hemant, K., Fairhead, J.D., Ravat, D., 2007. National geophysical datacenter candidate for the world digital magnetic anomaly map. Geochem. Geophys.Geosyst. 8, Q06017. http://dx.doi.org/10.1029/2007GC001643.
Merle, R., Marzoli, A., Bertrand, H., Reisberg, L., Verati, C., Zimmermann, C., Chiaradia, M.,Bellieni, G., Ernesto, M., 2011. 40Ar/39Ar ages and Sr–Nd–Pb–Os geochemistry ofCAMP tholeiites from Western Maranhão basin (NE Brazil). Lithos 122, 137–151.
Miller, H.G., Singh, V., 1994. Potential field tilt — a new concept for location of potentialfield sources. J. Appl. Geophys. 32, 213–217.
Noutchogwe, C.T., Koumetio, F., Manguelle-Dicoum, E., 2010. Structural features of South-Adamawa (Cameroon) inferred from magnetic anomalies: hydrogeological implica-tions. Compt. Rendus Geosci. 342, 467–474.
Nunes, K.C., 1993. Interpretação integrada da Bacia do Parnaíba com ênfase nos dadosaeromagnéticos. 3rd International Congress of the Brazilian Geophysical Society, Ex-panded Abstracts, pp. 152–157.
Oliveira, D.C., Mohriak,W.U., 2003. Jaibaras trough: an important element in the early tec-tonic evolution of the Parnaíba interior sag basin, Northern Brazil. Mar. Pet. Geol. 20,351–383.
Parker, R.L., 1972. The rapid calculation of potential anomalies. Geophys. J. R. Astron. Soc.42, 315–334.
Pavlis, N.K., Holmes, S.A., Kenyon, S.C., Factor, J.K., 2012. The development and evaluationof the Earth Gravitational Model 2008 (EGM2008). J. Geophys. Res. 117, B04406.http://dx.doi.org/10.1029/2011JB008916.
Pearson, W.C., 2001. Finding faults in a gas play. AAPG Explorer May. 52–55.Pedreira da Silva, A.J., Lopes, R.C., Vasconcelos, A.M., Bahia, R.B.C., 2003. Bacias Sedimentares
Paleozóicas e Meso-Cenozóicas Interiores. In: Bizzi, L.A., Schobbenhaus, C., Vidotti, R.M.,Gonçalves, J.H. (Eds.), Geologia, Tectônica e Recursos Minerais do Brasil. CPRM, Ed, UnB,Brasília, pp. 55–85.
Pimentel, M.M., Fuck, R.A., 1992. Neoproterozoic crustal accretion in central Brazil. Geol-ogy 20, 375–379.
Pimentel, M.M., Fuck, R.A., Jost, H., Ferreira Filho, C.F., Araújo, S.M., 2000. The basement ofthe Brasília Fold Belt and the Goiás Magmatic Arc. In: Cordani, U.G., Milani, E.J.,Thomaz Filho, A., Campos, D.A. (Eds.), Tectonic Evolution of South America. 31st In-ternational Geological Congress, Rio de Janeiro, pp. 151–182.
Reid, A.B., Allsop, J.M., Granser, H., Millete, A.J., Somerton, I.W., 1990. Magnetic interpreta-tion in three dimensions using Euler deconvolution. Geophysics 55, 80–91.
Santos, J.O.S., Hartmann, L.A., Gaudette, H.E., Groves, D.I., Mcnaughton, N.J., Fletcher, I.R.,2000. A new understanding of the provinces of the Amazon craton based on integra-tion of field mapping and U–Pb and Sm–Nd geochronology. Gondwana Res. 3 (4),453–488.
Shin, Y.H., Xu, H., Braitenberg, C., Fang, J., Wang, Y., 2007. Moho undulations beneath Tibetfrom GRACE-integrated gravity data. Geophys. J. Int. 170 (3), 971–985.
Sial, A.N., Dardenne, M.A., Misi, A., Pedreira, A., Ferreira, V.P., Silva Filho, M., Uhlein, A.,Pedrosa, A.C., Santos, R.V., Egydio-Silva, M., Babinski, M., Alvarenga, J.C., Fairchild,T.R., Pimentel, M.M., 2010. The São Francisco Paleocontinent. In: Gaucher, C., Sial,A.N., Frimmel, H., Halverson, G.P. (Eds.), Neoproterozoic–Cambrian Tectonics, GlobalChange and Evolution: A focus on Southwestern Gondwana, 16. Elsevier, Amsterdam,pp. 31–69.
Soares, J.E., Berrocal, J., Fuck, R.A., Mooney, W.D., Ventura, D.B.R., 2006. Seismic character-istics of central Brazil crust and upper mantle: a deep seismic refraction study.J. Geophys. Res. 111, 1029–1060.
Sousa, M.A., 1996. Regional gravity modelling and geohistory of the Parnaíba basin (NEBrazil). (PhD. Thesis) Newcastle University, Newcastle, p. 127.
Telford, W.M., Geldart, L.P., Sheriff, R.E., Keys, D.A., 1998. Applied geophysics, 5th ed. Cam-bridge University Press 860.
Trompette, R., 1994. Geology of Western Gondwana. A.A. Balkema, Rotterdam 350.Ussami, N., Molina, E.C., 1999. Flexural modeling of the Neoproterozoic Araguaia belt, cen-
tral Brazil. J. S. Am. Earth Sci. 12, 87–98.Van der Meijde, M., Julià, J., Assumpção, M., 2013. Gravity derived Moho for South
America. Tectonophysics 609, 456–467.Van Schmus, W.R., Brito Neves, B.B., Hackspacher, P., Babinski, M., 1995. U/Pb and Sm/Nd
geochronolgic studies of eastern Borborema Province, northeastern Brazil: initial con-clusions. J. S. Am. Earth Sci. 8, 267–288.
Van Schmus, W.R., Oliveira, E.P., Da Silva Filho, A.F., Toteu, S.F., Penaye, J., Guimarães,I.P., 2008. Proterozoic links between the Borborema Province, NE Brazil, andthe Central African Fold Belt. In: Pankhurst, R.J., Trouw, R.A.J., Brito Neves, B.B.,De Wit, M.J. (Eds.), West Gondwana: Pre-Cenozoic Correlations across theSouth Atlantic Region. Geological Society, London, Special Publications, 294,pp. 69–99.
Vasconcelos, A.M., Ribeiro, J.A.P., Colares, J.Q.S., Gomes, I.P., Forgiarini, L.L., Medeiros, M.F.,2004. Folha Teresina SB.23. In: Schobbenhaus, C., Gonçalves, J.H., Santos, J.O.S., Abram,M.B., Leão Neto, R., Matos, G.M.M., Vidotti, R.M., Ramos, M.A.B., Jesus, J.D.A. (Eds.),Carta Geológica do Brasil ao Milionésimo, Sistema de Informações Geográficas.Programa Geologia do Brasil. CPRM, Brasília (CD-ROM).
Vasquez, M.L., Macambira, M.J.B., Armastrong, R., 2008. Zircon geochronology of granit-oids fromwestern Bacajá domain, southeastern Amazonia Craton, Brazil: Neoarcheanto Orosirian evolution. Precambrian Res. 161, 297–302.
Ventura, D.B.R., Soares, J.E.P., Fuck, R.A., Caridade, L.C.C., 2011. Caracterização sísmica egravimétrica da litosfera sob a linha de refração sísmica profunda de Porangatu,Província Tocantins, Brasil Central. Rev. Bras. Geosci. 41 (1), 130–140.
145D.L. de Castro et al. / Tectonophysics 614 (2014) 128–145
Related Documents