Geophys. 1. In?. (1990) 102, 631-651 Crustal and upper mantle structure in the Ryukyu Island Arc deduced from deep seismic sounding T. Iwasaki,'" N. Hirata,3 T. Kana~awa,~ J. Melles,* K. Suyehiro,6 T. Urat~e,~ L. Moller: J. Makris2 and H. Shimamura' ' Laboratory for Ocean Bottom Seismology, Hokkaido University, Sapporo 060, Japan 'Department of Earth Science, Chiba University, Chiba 260, Japan 'Geophysical Instimte, the University of Tokyo, Tokyo 113, Japan 'Earthquake Research Institute, the University of Tokyo, Tokyo 113, Japan Geophysical Institute, Hamburg University, 0-2000 Hamburg, FRG Ocean Research Institute, the University of Tokyo, Tokyo 164, Japan Accepted 1990 March 26. Received 1989 December 21; in original form 1989 June 12 SUMMARY In 1984 an extensive geophysical investigation was conducted in the northernmost part of the Ryukyu Island Arc, south of Kyushu Island, Japan. The aim of this investigation was to obtain new information on the nature of crust and upper mantle at the continental margin through various geophysical measurements (seismic profiling, gravity, magnetism, sea beam and heat flow). This paper presents the crust and upper mantle structure deduced from ocean bottom seismographic profiling conducted along two lines. One line, 190 km long, was taken behind the northernmost part of the Ryukyu Island Arc, parallel to the major tectonic units, i.e. the Okinawa Trough, Ryukyu Arc and Ryukyu Trench. The other, 295 km long, was perpendicular to the tectonic units. Along these profiles, we deployed ocean bottom seismograms spaced 10-20km apart. As a controlled source, we used both explosives and an airgun array. The experiment was successful and provided quite important information on the tectonics of a trench- island arc-back arc system. The velocity structure obtained for the profile behind the Ryukyu Islands has continental properties. The sediment thickness is 3-4 km, although it shows lateral variations due to basement undulation. The velocities of the upper and lower crust are 5.8-6.2 and 6.6-6.8 km s-', respectively. The total crustal thickness decreases southwestward, from 27-30 to 23-24 km. This is direct evidence for crustal thinning associated with the process of back-arc spreading. The velocity structure along the profile from the trench to the island arc clearly shows the subduction, accretion and deformation at this margin. The crust beneath the trench has oceanic properties. The sediment thickness is 1.3-3.0 km, beneath which the igneous basement shows severe undulation. The total crustal thickness is 7-8 km. The P, velocity is slightly less than 8.0 km s-'. Our seismic data revealed a huge sedimentary wedge located 50-150 km landward of the trench. The maximum thickness of this wedge exceeds 12 km. The origin of this wedge may be oceanic because the P-wave velocity in its eastern half is almost comparable to that obtained for the trench area. The velocity structure landward of the wedge is continental and similar to that obtained for the profile behind the island arc. Key words: crustal structure, Okinawa Trough, Ryukyu, subduction. 1 INTRODUCTION The Ryukyu Island Arc is one of the major island arcs of the western Pacific. This arc forms the boundary between the Present address: Earthquake Research Institute, the University of Tokyo, Tokyo 113, Japan. NW end of the Philippine Sea Plate and the East China Sea. It is composed of more than 100 small islands, extending between the Kyushu Island and Taiwan for nearly 1200 km (Fig. 1). The Ryukyu Trench is located on the oceanic side of the Ryukyu Island Arc, beneath which the Philippine Sea 63 1

Welcome message from author
This document is posted to help you gain knowledge. Please leave a comment to let me know what you think about it! Share it to your friends and learn new things together.
Transcript

Geophys. 1. In?. (1990) 102, 631-651
Crustal and upper mantle structure in the Ryukyu Island Arc deduced from deep seismic sounding
T. Iwasaki,'" N. Hirata,3 T. Kana~awa,~ J. Melles,* K. Suyehiro,6 T. Urat~e ,~ L. Moller: J . Makris2 and H. Shimamura' ' Laboratory for Ocean Bottom Seismology, Hokkaido University, Sapporo 060, Japan
'Department of Earth Science, Chiba University, Chiba 260, Japan 'Geophysical Instimte, the University of Tokyo, Tokyo 113, Japan 'Earthquake Research Institute, the University of Tokyo, Tokyo 113, Japan
Geophysical Institute, Hamburg University, 0-2000 Hamburg, FRG
Ocean Research Institute, the University of Tokyo, Tokyo 164, Japan
Accepted 1990 March 26. Received 1989 December 21; in original form 1989 June 12
SUMMARY In 1984 an extensive geophysical investigation was conducted in the northernmost part of the Ryukyu Island Arc, south of Kyushu Island, Japan. The aim of this investigation was to obtain new information on the nature of crust and upper mantle at the continental margin through various geophysical measurements (seismic profiling, gravity, magnetism, sea beam and heat flow).
This paper presents the crust and upper mantle structure deduced from ocean bottom seismographic profiling conducted along two lines. One line, 190 km long, was taken behind the northernmost part of the Ryukyu Island Arc, parallel to the major tectonic units, i.e. the Okinawa Trough, Ryukyu Arc and Ryukyu Trench. The other, 295 km long, was perpendicular to the tectonic units. Along these profiles, we deployed ocean bottom seismograms spaced 10-20km apart. As a controlled source, we used both explosives and an airgun array. The experiment was successful and provided quite important information on the tectonics of a trench- island arc-back arc system.
The velocity structure obtained for the profile behind the Ryukyu Islands has continental properties. The sediment thickness is 3-4 km, although it shows lateral variations due to basement undulation. The velocities of the upper and lower crust are 5.8-6.2 and 6.6-6.8 km s-', respectively. The total crustal thickness decreases southwestward, from 27-30 to 23-24 km. This is direct evidence for crustal thinning associated with the process of back-arc spreading.
The velocity structure along the profile from the trench to the island arc clearly shows the subduction, accretion and deformation at this margin. The crust beneath the trench has oceanic properties. The sediment thickness is 1.3-3.0 km, beneath which the igneous basement shows severe undulation. The total crustal thickness is 7-8 km. The P, velocity is slightly less than 8.0 km s-'. Our seismic data revealed a huge sedimentary wedge located 50-150 km landward of the trench. The maximum thickness of this wedge exceeds 12 km. The origin of this wedge may be oceanic because the P-wave velocity in its eastern half is almost comparable to that obtained for the trench area. The velocity structure landward of the wedge is continental and similar to that obtained for the profile behind the island arc.
Key words: crustal structure, Okinawa Trough, Ryukyu, subduction.
1 INTRODUCTION The Ryukyu Island Arc is one of the major island arcs of the western Pacific. This arc forms the boundary between the
Present address: Earthquake Research Institute, the University of Tokyo, Tokyo 113, Japan.
NW end of the Philippine Sea Plate and the East China Sea. It is composed of more than 100 small islands, extending between the Kyushu Island and Taiwan for nearly 1200 km (Fig. 1). The Ryukyu Trench is located on the oceanic side of the Ryukyu Island Arc, beneath which the Philippine Sea
63 1
632 T. Iwasaki et al.
Q
EAST CHINA SEA
125' 130-E
Figure 1. Tectonic map of the Okinawa Trough, Ryukyu Island Arc and Ryukyu Trench after Kobayashi (1985). Water depths are indicated in units of metres. The dotted line shows the location of the volcanic front. The solid lines indicate the Tokara Channel and Kerama Gap. In 1984, an extensive geophysical investigation was conducted in the northern part of the Ryukyu Island Arc, south of Kyushu Island. Two crossing heavy lines (Profiles I and 11) show the seismic refraction profiles studied in this paper.
Plate is subducting. With a maximum depth of 6500 m, this trench is shallow compared to other trenches in the western Pacific. Behind the Ryukyu Island Arc, there exists a back-arc spreading zone known as the Okinawa Trough, where the maximum water depth approaches 2300m in the south and progressively decreases to about 200 m northeastward.
The subduction of the Philippine Sea Plate is clearly observed from seismic activity. Earthquakes occurring in a region from the Ryukyu Trench to the Okinawa Trough are concentrated along the subducting plate, i.e. the Wadati- Benioff zone dipping northwest from the trench (Katsumata & Sykes 1969; Shiono, Mikumo & Ichikawa 1980). According to Shiono et al. (1980), the Wadati-Benioff zone north of the Tokara Channel shows a remarkable bend at a depth of 70 km, below which it dips steeply (70"). South of the Tokara Channel, on the other hand, the dip angle of the Wadati-Benioff zone is 40"-50".
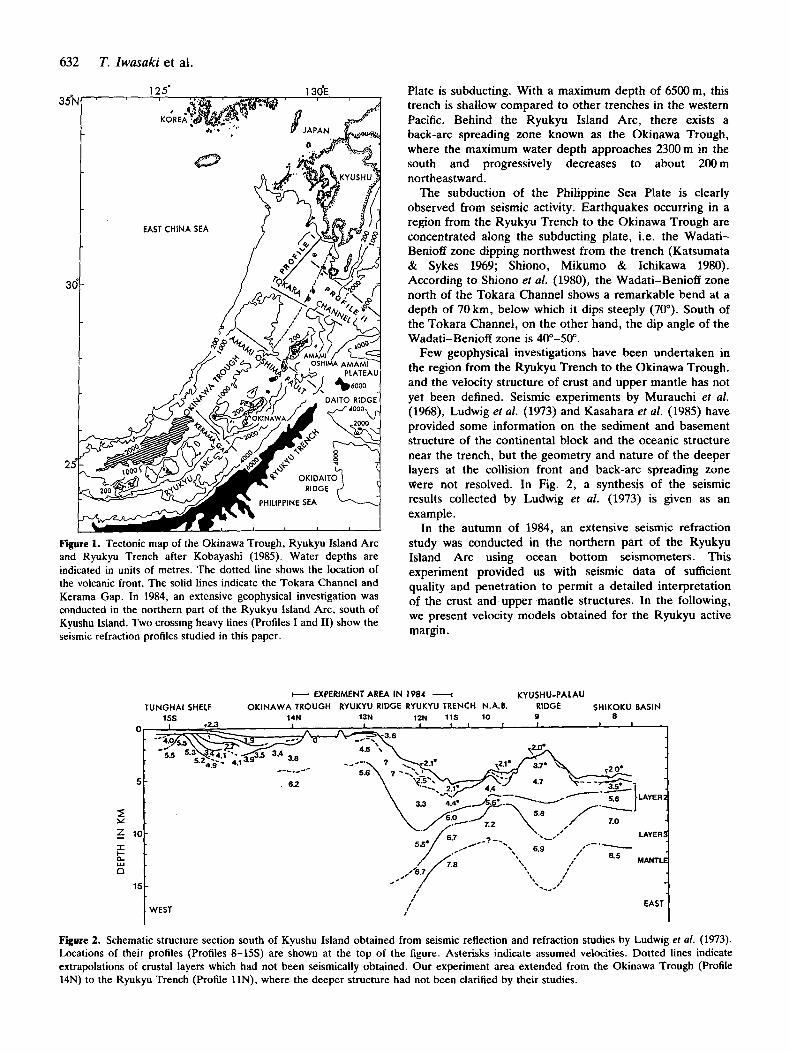
Few geophysical investigations have been undertaken in the region from the Ryukyu Trench to the Okinawa Trough. and the velocity structure of crust and upper mantle has not yet been defined. Seismic experiments by Murauchi et al. (1968), Ludwig et al. (1973) and Kasahara et al. (1985) have provided some information on the sediment and basement structure of the continental block and the oceanic structure near the trench, but the geometry and nature of the deeper layers at the collision front and back-arc spreading zone were not resolved. In Fig. 2, a synthesis of the seismic results collected by Ludwig et al. (1973) is given as an example.
In the autumn of 1984, an extensive seismic refraction study was conducted in the northern part of the Ryukyu Island Arc using ocean bottom seismometers. This experiment provided us with seismic data of sufficient quality and penetration to permit a detailed interpretation of the crust and upper mantle structures. In the following, we present velocity models obtained for the Ryukyu active margin.
[WEST 8' , EAST I
Figure 2. Schematic structure section south of Kyushu Island obtained from seismic reflection and refraction studies by Ludwig et al. (1973). Locations of their profiles (Profiles 8-15s) are shown at the top of the figure. Asterisks indicate assumed velocities. Dotted lines indicate extrapolations of crustal layers which had not been seismically obtained. Our experiment area extended from the Okinawa Trough (Profile 14N) to the Ryukyu Trench (Profile l l N ) , where the deeper structure had not been clarified by their studies.
Velocity structure in the Ryukyu lsland Arc 633
2 MORPHOLOGY A N D GEOLOGY OF THE RYUKYU AREA
2.1 The Okinawa Trough
The Okinawa Trough is a back-arc spreading zone between the East China Sea and the Ryukyus, formed by extension within continental lithosphere behind the Ryukyu trench- arc system. This trough can be divided into three segments. The deepest one is the southernmost segment extending from the north of Taiwan to the Kerama Gap, where the water depth is nearly 2300m. This segment is narrow, elongated and marked by steep normal faults. The sediments in this area are well developed (1000-3000 m thick), and in some parts the thickness exceeds 3000m (Wageman, Hilde & Emery 1970; Herman, Anderson & Truchan 1979; Lee et al. 1980). They show a well-stratified sedimentary sequence of an older, strongly deformed series, unconformably covered by a shallower sequence of faulted but not folded sediments. An earlier seismic refraction survey in this region showed that the crust at the axis of the trough has oceanic properties but twice the total thickness of typical oceanic crust (Lee ef al. 1980).
The central segment of the Okinawa Trough, limited to the north by the Tokara Channel, shoals gradually from water depths of 2000m to nearly 1OOOm. In this zone, sediments are also well developed and 1000-2000m in thickness, but less deformed than further south. The Tokara Channel clearly displaces eastwards all bathymetric con- tours, indicating significant wrench faulting. Kobayashi (1985) suggested that similar shearing is occurring along the Kerama Gap.
The northern part of the trough, which is the southward extension of the Kyushu Island, is marked by water depths of about 1000 m to the south and not more than 200-500 m in the northern part. As shown by Ludwig et nl. (1973) and confirmed by our study, the sediments are of the order of 3000-4000 m and locally may be as thick as 5000 m.
Recently, bathymetric (multi-narrow beam), seismic re- flection and magnetic data were collected in the entire region of the Okinawa Trough by Sibuet ef al. (1987). According to their results, the back-arc spreading phase started very recently in the middle and southern Okinawa Trough. Even in the southern Okinawa Trough, the major part is underlain by a thinned continental crust, and the region having oceanic crust is limited to a width of a few tens of kilometres or less. Axial back-arc volcanism is found along the rift of the southern trough, whereas active vol- canoes in the Ryukyu Island Arc occur only in the northern part.
2.2 The Ryukyu Island Arc
The Ryukyu Island Arc consists of an elevated ridge marked by two parallel chains comprising more than 100 islands. Islands along the inner arc are volcanoes of Quaternary age, whereas those along the outer arc are non-volcanic outcrops.
The episodic character of the geological evolution of the Ryukyu Island Arc is well documented in the volcanic activity and the ages of the extruded magmas. The oldest rocks have been found at the southern part of the arc
(178-202 Ma; Shibata, Konishi & Nozawa 1968). Accord- ing to Kobayashi (1985), the Ryukyu Island Arc has experienced at least five magmatic phases. The earliest one is likely to be a mid-oceanic magmatism. The following four phases can be associated with the collision and the subduction processes of the Philippine Sea Plate below the Ryukyu Ridge. From sedimentation at the Ryukyu Islands of Miocene to recent age, a change in the tectonic deformation is obviously recognized, since the pre-Miocene formations are faulted, folded and intruded by igneous rocks whereas the post-Miocene series are relatively undisturbed.
According to the seismic refraction study of Murauchi et al. (1968), the upper crust in the southern part of the arc consists of four layers with velocities of 2.0, 2.8 and 3.7 km s-' overlying the basement layer of 6.0 km s-'. In the northern part of the arc (outer arc), on the other hand, the velocity of the main crustal layer is 5.6 km s-', and is overlain by materials with velocities of 3.6 and 4.6 km sC1 (Ludwig et al. 1973).
2.3 The Ryukyu Trench
The axis of the Ryukyu Trench is located 120 km southeast of that of the Ryukyu Island Arc. The deep trench on the oceanic side is better developed in the south than in the north. The deepest point of the trench bottom, 7500m, is located 180km south of the Okinawa Island (Fig. 1). However, most parts of the axial trough of the trench are not deeper than 6500 m. In the north, the trench is divided by the Amami plateau, which is west of the northern end of the Palau Ridge. The shape of the trench in this area is oval, with depths of approximately 5500 m.
Ludwig et al. (1973) showed that the crust beneath the northern part of the trench is oceanic but with a thinner than normal layer 3. Such a thin layer 3 was also found further south by Murauchi et af. (1968).
3 EXPERIMENT
In the autumn of 1984, an extensive geophysical investigation was conducted in the northern part of the Ryukyu Island Arc by the research vessel Sonne, which belongs to RF (Reederei-gemeinschaft Forschungsschiffahrt GmbH, Bremen, FRG). The main part of the investigation was an ocean bottom seismographic refraction survey conducted from 13 to 30 September. In addition to the seismic experiment, we also carried out a gravity survey using a DSS-30 sea gravimeter, a multi-narrow beam survey, and a geomagnetic survey using a proton precession mag- netometer. Measurements of terrestrial heat flow were made at several locations along the profiles.
3.1 Ocean bottom seismometers
In the seismic experiment, two types of ocean bottom seismometers (OBSs) were deployed to record seismic signals generated by explosives and airguns.
The Japanese Universities of Hokkaido and Tokyo provided an OBS system of a pop-up type. The OBS of this type was self-contained in a glass sphere with a 43cm diameter (Yamada, Asada & Shimamura 1981). The OBS was equipped with a vertical and a horizontal geophone, both gimbal-mounted, an analogue magnetic cassette

634 T. Iwasaki et al.
recorder with amplifiers, a time code generator and batteries. Natural frequencies of the geophones were 3.0 Hz for the vertical component, and 4.5Hz for the horizontal component. Seismic signals from the geophones were fed to four-channel cassette tape together with the coded time signal. The vertical component was recorded at two different levels of amplification, resulting in a total dynamic range of 65 dB. The dynamic range for the horizontal component, which was recorded at one level of amplification, was 45 dB. The overall frequency band of the OBS system was 0.5-35Hz. The recording period was 14 days. The time code generator had a temperature-compensated crystal oscillator with an accuracy of 5 X lo-' (0-40 "C) (Inatani & Furuya 1980). Its output signal was checked against Japan standard time before deployment and after recovery. The time code generator was usually stable at the sea bottom and its timing error was rather small (less than 10-20ms). The OBSs were recovered using a pre-programmed timed release system (Urabe & Kanazawa 1984). We used 25 OBSs of this type for the seismic profiling.
The Institute of Geophysics, University of Hamburg (IfG), provided 20 OBSs which had a single component (Herber, Nuppenau & Snoek 1981). The sensor was a hydrophone, whose signals were recorded continuously on a cassette magnetic tape at three different levels of amplification. The overall dynamic range of this instrument was about 65dB. The recording period was 4-8 days,
31
3c
29
according to the requirements of the experiment. The German OBSs were anchored on the sea-bed and moored at the surface by a plastic buoy with the use of a nylon rope. In general, the Japanese and German OBSs had a comparable dynamic range and frequency response, which was quite important in the analysis of the observed amplitude data.
3.2 Seismic refhction profiling
Profiles of the seismic refraction survey are shown in Fig. 3. Profile I was laid out behind the northernmost part of the Ryukyu Island Arc, almost parallel to the main tectonic trends. Profile 11, which was almost perpendicular to Profile I, extended from the deep sea basin to the back arc. The total lengths of these profiles are 190 and 295km, respectively.
In the western part of the experiment area, a strong water current, Kuroshio, flows with a speed exceeding 1.5- 2.0ms-'. We deployed 20OBSs on Profile I, but lost four OBSs of the anchored-buoy type because their mooring systems were not strong enough to resist the fast sea current. Hence, 16 OBSs successfully recorded data on Profile I (see Fig. 3).
Profile I1 was shot three times due to the loss of several OBSs. This profile consists of three segments, Profile 11-A, -B and -C. Profile 11-A, the original profile, was 245 km in length and extended from the northern edge of the Ryukyu
Figure 3. Location map of our seismic experiment in 1984. Water depth is presented in units of metres. The experiment was conducted along two profiles; Profile I and Profile 11, south of Kyushu Island (see Fig. 1). Profile I1 consisted of three segments, Profile 11-A, -B and -C. Triangles indicate positions of OBSs successfully recovered. Shot positions of 20 kg explosives are shown by dots.

Velocity structure in the Ryukyu Island Arc 635
Trench to the Okinawa Trough. Of 24OBSs (OBSs 1-24) deployed, we lost 10 (OBSs 1-9 and 22), most of which were of the anchored-buoy type. We therefore rearranged our experiment to deploy five OBSs (OBSs 25-29) along Profile 11-B to supplement Profile 11-A. Profile 11-C, along which five OBSs (OBSs 30-34) were deployed, was intended to determine the velocity structure beneath the northern part of the Ryukyu Trench and the adjacent oceanic basin. The lengths of Profiles 11-B and -C were 45 and 60 km, respectively.
The total number of OBSs recovered was 24. Their positions are shown in Fig. 3. However, no data were recorded at OBSs 12, 15 and 25 due to a problem in the OBS recorder. Seismic data at OBSs 10, 11, 27 and 28 suffered from strong noise due to the sea currents, and were not used for the present analysis.
For a controlled source, we used explosives and an airgun array. The explosives, with charge sizes of 20 and 200 kg, were fired electrically at an optimum depth. The larger explosives of 200 kg were split into two 100 kg charges and set off at depths of 80-90 m by the dispersed charge method (Jacob 1975). The smaller explosives were fired at a depth of 50-60 m, keeping the ship speed at 7.5 knots.
We fired a total of 376 shots. On Profile I, three large shots and 148 small shots were set off. On Profile 11, six large explosions and 219 small explosions were fired. The shot interval for small explosions was 1.2-1.5 km, which was the densest firing sequence we have used for OBS refraction surveys in Japanese seas. The large explosions were positioned at the ends and in the middle of each profile in order to ensure effective penetration of the lower crust and upper mantle.
Airgun-OBS profiling was mainly conducted along Profile I. The airgun array used for this profiling consisted of four eight-liter airguns, which were towed at a depth of 15 m. We set the firing interval at about 150m to obtain higher resolution for determination of the geometry of the sediments and crystalline basement.
The shot timing of explosives and airguns was controlled by the master clock of IfG onboard, which was checked every day against Japan standard time using a chart recorder. The total error of the shot timing, including reading errors of signals on the chart sheet, was considered to be less than 5-10 m.
The shot and OBS positions were determined from an integrated navigation system (the INDAS system) using LORAN C and NNSS. We calculated shot-OBS distances from these position data and checked them using arrival times of water waves which were clearly recognized in the record section. The error in the shot-OBS distances is expected to be less than 100m.
4 DATA PROCESSING A N D CHARACTERISTICS OF OBSERVED SEISMOGRAMS
The recorded seismograms were digitized at the Universities of Hokkaido, Tokyo and Hamburg on identical computer systems (Data General Eclipse System). They were formatted according to the SEG-Y standard (Barry, Caves & Kneale 1975) for easier data exchange. The necessary
software was also exchanged so that full compatibility at all stages of the data processing has been ensured.
Figures 4-8 show examples of the record sections observed at five different positions (OBSs 2, 6, 10, 16 and 20) along Profile I. On these records, we can see that seismic energy from the 20 kg shots has reached up to 160 or even 170 km. In general, the propagation of seismic energy was very efficient along Profile I. Refracted waves in the crust (Pg phase) and wide-angle reflected waves from an intracrustal boundary (P,P phase) and the Moho boundary (PmP phase) can be observed on most of the seismic record sections (see Section 6).
Strong variations of the apparent velocities are observed. Such a feature in the records was rather unexpected because the seismic line was parallel to the main tectonic trends. As is shown in Section 6, the complicated behaviour of traveltime curves can be explained by lateral in- homogeneities in the uppermost crust along this profile.
In Figs 9-13, examples of recordings along Profile I1 are presented for OBSs 33, 24, 21, 18 and 14. The seismic energy propagation was also efficient along this profile.
In the section of OBS 33, which was deployed in the oceanic basin southeast of the Ryukyu Trench, we find first arrivals with apparent velocity of about 7.8 km s C 1 at offsets of 35-45 km, which correspond to a P, phase. The observed section indicates that the crust beneath the trench is thin and has oceanic properties. The seismograms observed on the continental shelf are considerably different from those in the trench. On OBS 14, for example, traveltimes show a large delay of almost 8 s to the southeast which is due to the thick sediments and the increase in water depth toward the Ryukyu Trench. In the northwestern part of the section, on the other hand, the observed traveltimes are nearly the same as those of Profile I.
5 MODELLING OF VELOCITY STRUCTURE
Velocity models for Profiles I and I1 were constructed from observed arrival-time data and amplitude data. The arrival-time data were mainly collected from unfiltered seismograms recorded on the high-gain channel of the vertical component. Digital filtering was not applied in this procedure because it distorts onsets of strong signals. Considering positioning error and timing error described in the previous section, the total error contained in our arrival-time data was within 0.05-0.1 s. For amplitude information, we used vertical-component seismograms from small explosives recorded on the low-gain channel. The seismic energy from the shots was concentrated in a frequency range of 5-7 Hz. We applied band-pass filtering (3-10 Hz) to the observed seismograms to suppress noise of 1-2Hz and 13-15Hz appearing in some parts of the sections. The high-gain channel data were not appropriate for the analysis of amplitude because they were saturated for nearby shots.
The procedure for constructing velocity models was essentially the same as that described by Iwasaki et al. (1989). The first computational procedure to develop the seismic model was to determine the velocity structure for the uppermost part of the crust, i.e. geometry of the basement and thickness of the sediments. To obtain an approximate model and to get some idea on the basement

636 T. Iwasaki et al.
(a)
v ,
3 : z : r -
& 20 n . -
I- -
20 10 60
60
80 I00 DISIANCE IN KM
80 DISTANCE IN KM
I20 I40
1 I40
I60
I C
180
I80
30 E Figure 4. Observed and synthetic seismograms at OBS 2. The origin of the distance axis is set at the position of OBS 20. Observed seismograms, which were recorded on a low-gain channel of the vertical component, have been digitally band-pass filtered (3-10 Hz) to suppress ground noise. The trace amplitudes are scaled for range (D) by the factor D'". Traveltime curves predicted from the model are superimposed on the observed record section. Our model explains well features of the observed seismograms. A remarkable phase, R1, appearing at offsets of 50-90 km (90-130 km in abscissa) is interpreted as reflected waves from an intercrustal boundary (P,P phase). A phase, R2, at offsets of 110-160 km (20-70 krn in abscissa) is a P , P phase. It is noted that first arrivals from nearby shots (less than 20-30 km) are quite strong and distorted by the digital filtering. See text for explanation. (a) Observed seismograms. (b) Synthetic seismograms. (c) Ray diagram.

Velocity structure in the Ryukyu Island Arc 637
30
20
-
40 60
40 6 0
80 I 0 0 DISTANCE IN KM
I 2 0 I A 0 I60 I 8 0
140
DISTANCE IN KM I 6 0
0
10
3
h 20
I I
0
DISTANCE IN KM
Figure 5. Observed and synthetic seismograms at OBS 6. The observed seismograms are interpreted well by our model. A clear phase, R2, in an offset range of 70-120 km (20-70 km in abscissa) is interpreted as a P,P phase. Weak arrivals in an offset range of 60-90 km (50-80 km in abscissa) are explained as a P, phase. See text for explanations. (a) Observed seismograms. (b) Synthetic seismograms. (c) Ray diagram.

638 T. twasaki et al.
5 -
4 -
D . Y
3 <
z - c!
2 -
I -
0 -
5
4
P g 3 a 0
c!
2
I
n
r-
0
v ,
0 20 40 60 80 1 0 0 120 1 A0 I60 180 DISTANCE IN KM
30 -
i 20 40 :I 60
10 100 DISTANCE IN KM
I20 140 160 180
0
10
3
& 20
z I
D
FEgare 6. Observed and synthetic seismograms at OBS 10. Later phases, R1 and Rl' , appearing at offset distances of 30-80 km (20-70 and 150-190 km in abscissa) are explained as a P,P phase. Weak amvals corresponding to a P, phase are recognized at an offset range of 45-60 km (40-55 km in abscissa). See text for explanation. (a) Observed seismograms. (b) Synthetic seismograms. (c) Ray diagram.

Velocity structure in the Ryukyu Zsiand Arc
(a)
Icl
20 40
40
I80 160 60 80 100 I20 I40 DISTANCE IN KM
i0 80 loo DISTANCE IN KM
I20 140 I60 180
639
. . 0
10
3 z $ m n
r
0 20 40 60 80 loo 120 140 I60 180
DISTANCE IN K M
Figure 7. Observed and synthetic seismograms at OBS 16. Later arrivals, Rl’, in an offset range of 40-70 km (80-110 km in abscissa) are interpreted as a P,P phase. A phase, R2, at offset distances greater than 110 km (150 km in abscissa) is a P,P phase. Arrivals corresponding to a P, phase are recognized at offsets of 50-60 and 80-95 km. (a) Observed seismograms. (b) Synthetic seismograms. (c) Ray diagram.
structure, a simple intercept-time interpretation technique sediments and basement was then improved iteratively using was applied to the observed arrival-time data from nearby a simple but fast ray-tracing method developed by Thiessen shots, i.e. with offset distance less than 20 km. We also used & Makris (1980) or Iwasaki (1988). inversion techniques, such as delay time and wavefront Once the sedimentary structures and, hence, the methods, depending on the quality and completeness of the geometry of the surface of the igneous basement had been data to accomplish this procedure. The model for the interpreted with sufficient accuracy, the model for the entire
640 T. Zwusaki et al.
A 0 80 100 I20 I40 I60 180 0 20
(bl
-I 0 20
(cl
w 40
~~ .. DISTANCE IN KM
60 80 DISTANCE IN K M
I20 I40 ~ I60
180
. .
30
0 20 40 60 80 100 120 I40 160 180 DISTANCE IN K M
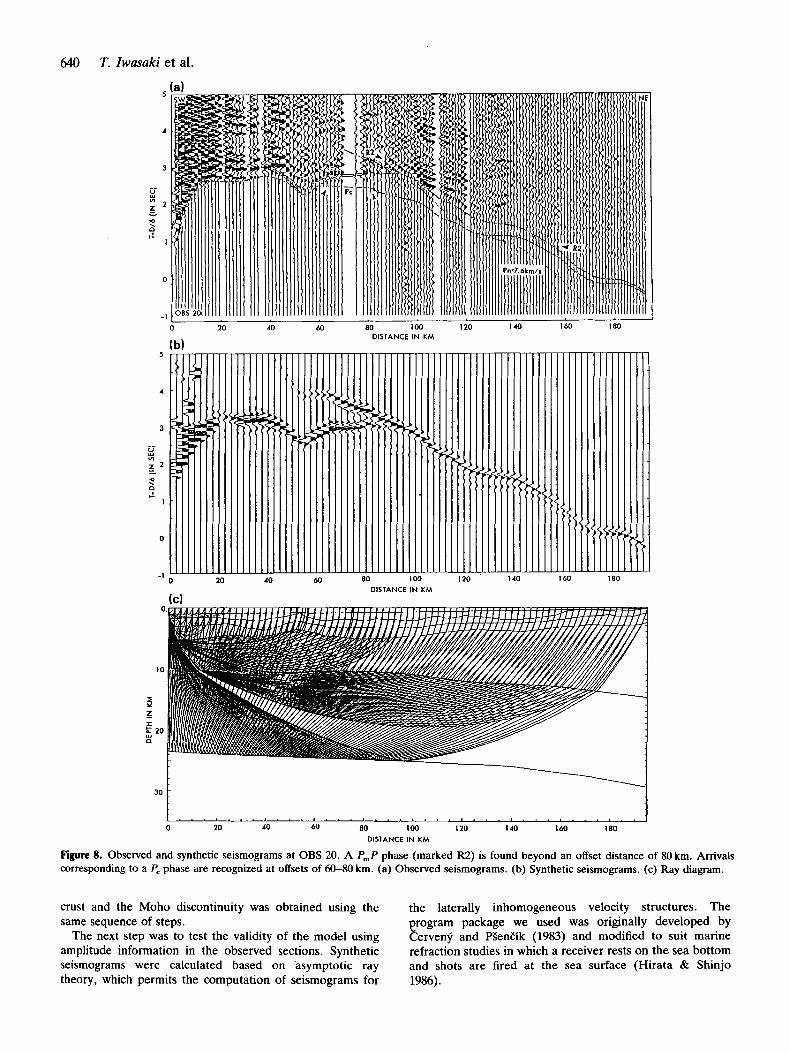
Figure 8. Observed and synthetic seismograms at OBS 20. A P,P phase (marked R2) is found beyond an offset distance of 80 km. Arrivals corresponding to a P, phase are recognized at offsets of 60-80 km. (a) Observed seismograms. (b) Synthetic seismograms. (c) Ray diagram.
crust and the Moho discontinuity was obtained using the the laterally inhomogeneous velocity structures. The same sequence of steps. erogram package we used was originally developed by
The next step was to test the validity of the model using Cervenf and PSenEik (1983) and modified to suit marine amplitude information in the observed sections. Synthetic refraction studies in which a receiver rests on the sea bottom seismograms were calculated based on asymptotic ray and shots are fired at the sea surface (Hirata & Shinjo theory, which permits the computation of seismograms for 1986).
Velocity structure in the Ryukyu Island Arc 641
I . . I 0 0 10 20 30 40
DISTANCE I N K M
DISTANCE IN KM 30 40
20 4 -I 0 10 20 30 40
DISTANCE IN KM
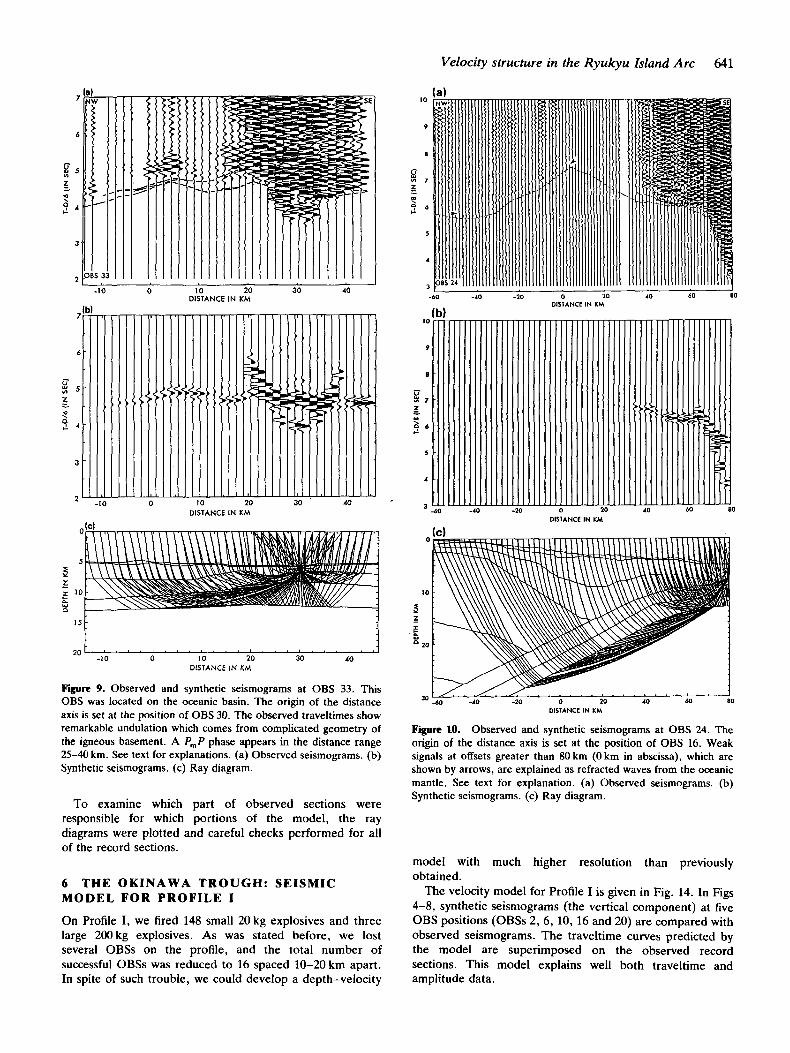
Figure 9. Observed and synthetic seismograms at OBS 33. This OBS was located on the oceanic basin. The origin of the distance axis is set at the position of OBS 30. The observed traveltimes show remarkable undulation which comes from complicated geometry of the igneous basement. A P , P phase appears in the distance range 25-40 km. See text for explanations. (a) Observed seismograms. (b) Synthetic seismograms. (c) Ray diagram.
To examine which part of observed sections were responsible for which portions of the model, the ray diagrams were plotted and careful checks performed for all of the record sections.
6 THE OKINAWA TROUGH: SEISMIC MODEL FOR PROFILE I
On Profile I, we fired 148 small 20 kg explosives and three large 200 kg explosives. As was stated before, we lost several OBSs on the profile, and the total number of successful OBSs was reduced t o 16 spaced 10-20 km apart. In spite of such trouble, we could develop a depth-velocity
60 -20 0 20 40 DISIANCE I N KM
-40
I -40 0 2
DISTANCE IN KM 40
ulllllll 60
80
I 80
........................... I 30 I64 -40 -20 0 20 40 60 80
DISIANCE IN KM
Figure 10. Observed and synthetic seismograms at OBS 24. The origin of the distance axis is set at the position of OBS 16. Weak signals at offsets greater than 80 km (0 km in abscissa), which are shown by arrows, are explained as refracted waves from the oceanic mantle. See text for explanation. (a) Observed seismograms. (b) Synthetic seismograms. (c) Ray diagram.
model with much higher resolution than previously obtained.
The velocity model for Profile I is given in Fig. 14. In Figs 4-8, synthetic seismograms (the vertical component) a t five OBS positions (OBSs 2, 6, 10,16 and 20) are compared with observed seismograms. The traveltime curves predicted by the model are superimposed on the observed record sections. This model explains well both traveltime and amplitude data.

642 T. Iwasaki et al.
L I -20 0 20 40 60 80 -60 -40
-6
ICl
-4
DISTANCE IN KM
-2 0 DISTANCE IN Kh4
4 0 20 60 80
0
10
3 z E U I 0
20
3 0 t , a : ._(;r'. -20 ' 0 2D 40 40 80 DISTANCE IN K M
Figure 11. Observed and synthetic seismograms at OBS 21. The signals at offset distances greater than 40 km (0 km in abscissa) are explained as turning waves within the subducting oceanic crust and upper mantle. See text for explanation. (a) Observed seismograms. (b) Synthetic seismograms. (c) Ray diagram.
6.1 Sediment and basement structures
The sediment and basement structures were mainly determined from first arrivals clearly observed at offset distances less than 40-50km. Ray diagrams in Figs 4-8
show that the sedimentary layers and upper crust are densely covered with rays corresponding to the first arrivals, and the structures for these parts are very well resolved. The calculated traveltime curves fit the observed first arrivals within an error of 0.05-0.1 s.
The sedimentary cover is well developed for most of the profile. The sediment thickness is 3-4 km, with variations due to basement undulations. In order to clarify the sediment structure, a contour map of the velocity field is presented in Fig. 14(b). In the southern part of the profile, the P-wave velocity beneath the soft sediment is relatively low (V, = 3.0-4.0 km s-'), but such low-velocity material disappears in the NE part. Sediment with V,=4.0- 5.0 km s-l, on the other hand, is found along the entire profile. The lift of the basement 50 km from the SW edge of the profile is not related to either surface geology or other geophysical anomalies. However, it seems to separate the northern basin from another basin which developed further south. In the middle of the profile (60-150 km from the SW edge), the equi-velocity lines are almost parallel to the basement, which indicates that the sediments have not suffered from severe folding. At the northern edge of the profile, the velocity of the uppermost part is considerably higher (3.9-5.3 km s-'), and the boundary between the sediment and upper crust is not so clear (Fig. 14b). We obtained a rather high velocity gradient in the sediment, 0.4-0.5 s-', which was necessary to explain large- amplitudes of first arrivals from nearby shots.
The velocity and the velocity gradient of the upper crust are determined to be 5.8-6.2 km s-' and 0.03-0.06 s-l, respectively, using traveltimes and amplitudes observed in an offset range of 20-60 km. The velocity gradient is smaller than in the sediment by an order of magnitude.
Figures 4-8 show that the undulation of observed traveltime curves is mainly due to the complicated structure of the sediment and the basement.
6.2 Lower crust and upper mantle structures
The velocity structure of the lower crust is not as well resolved as the upper crustal structure because first arrivals from the lower crust (P, phase) are not clearly observed. We constructed the velocity model for the lower crust and Moho boundary in the following way.
In the record sections at OBSs 2 and 10 (Figs 4 and 6), we can find strong later phases appearing in an offset range of 50-90 km (denoted by Rl). Similar strong phases are also recognized at OBSs 3 and 4. We interpreted these phases as wide-angle reflections from an intracrustal interface (P,P phase), and determined the depth of the interface to be 12-13.5 km (Fig. 14a). At the OBSs on the SW part of the profile, such a later phase is not so clear, but wavetrains of rather high energy are recognized in an offset range of 30-70km (Rl' in Figs 6 and 7). The corresponding boundary is obtained at about 10 km. Assuming the P-wave velocity of the lower crust is 6.6-6.7kms-', which is a typical value for Japanese Island Arc (Yoshii & Asano 1972; Okada et al. 1973, Yoshii et al. 1974), the traveltime curve of the P, phase was then calculated and compared with the observations (Figs 4-8). Although P, arrivals are not recorded clearly, weak wavetrains observed at OBSs 6, 10, 16, 18 and 20, which are indicated by arrows in Figs 5-8, are

Velocity structure in the Ryukyu Island Arc 643
I I -60 -40 -20 0 20 40 60 80
DISTANCE IN K M
-n 0 DISTANCE IN KM
40 80
0
I 0
3
5 2 S -
20
-80 -M) -40 -20 0 20 40 60 80
DISTANCE IN KM
Figure U. Observed and synthetic seismograms at OBS 18. Under this OBS, the sedimentary wedge attains its maximum thickness. Prominent later arrivals, R1, at offset distances of 40-80 km (-60 to -20 km in abscissa) are reflected waves from the subducting oceanic crust. (a) Observed seismograms. (b) Synthetic seismograms. (c) Ray diagram.
considered to be a part of the P, phase. In order to show these arrivals more clearly, corresponding parts of record sections at OBSs 6, 10 and 18 are magnified in Fig. 15. The amplitudes of these wavetrains are explained by taking the velocity gradient of the lower crust to be 0.01-0.015 s-'.
This value may be a maximum estimate because the P, phase is recognized only at a number of OBSs.
At most of the OBSs, clear arrivals are observed at offsets greater than 60-70 km, which are indicated by R2 in Figs 4, 5, 7 and 8. We interpreted these arrivals as a P,P phase and

644 T. Zwusaki et al.
-120 -100
2
I 20 .80 -60 -40 -20
DISTANCE IN KM 0
-40 DISTANCE IN KM
0
40 60
10
c Y
z 20 I c ," D
30
. . . . . . . . . . . . . . . . . . . . . . . . . . . 1 4 0 ' '-A0 . ' - 1 0 0 . -80 -60 -40 -20 0 20 40 60
DISTANCE IN K M
Figure W. Observed and synthetic seismograms at OBS 14. Clear first arrivals northwest of the OBS are turning waves within the continental crust. Weak arrivals appearing at offsets of 40-80 km (20-60 km in abscissa), which are shown by arrows, are turning waves from the subducting oceanic crust. (a) Observed seismograms. (b) Synthetic seismograms. (c) Ray diagram.
Velocity structure in the Ryukyu Island Arc 645
I 0 20 40 60 80 100 120 140 160 180 200
DISTANCE I N KM (b)
sw NE
z Z
S
Y
- c n. Y
n
0
2
4
I I
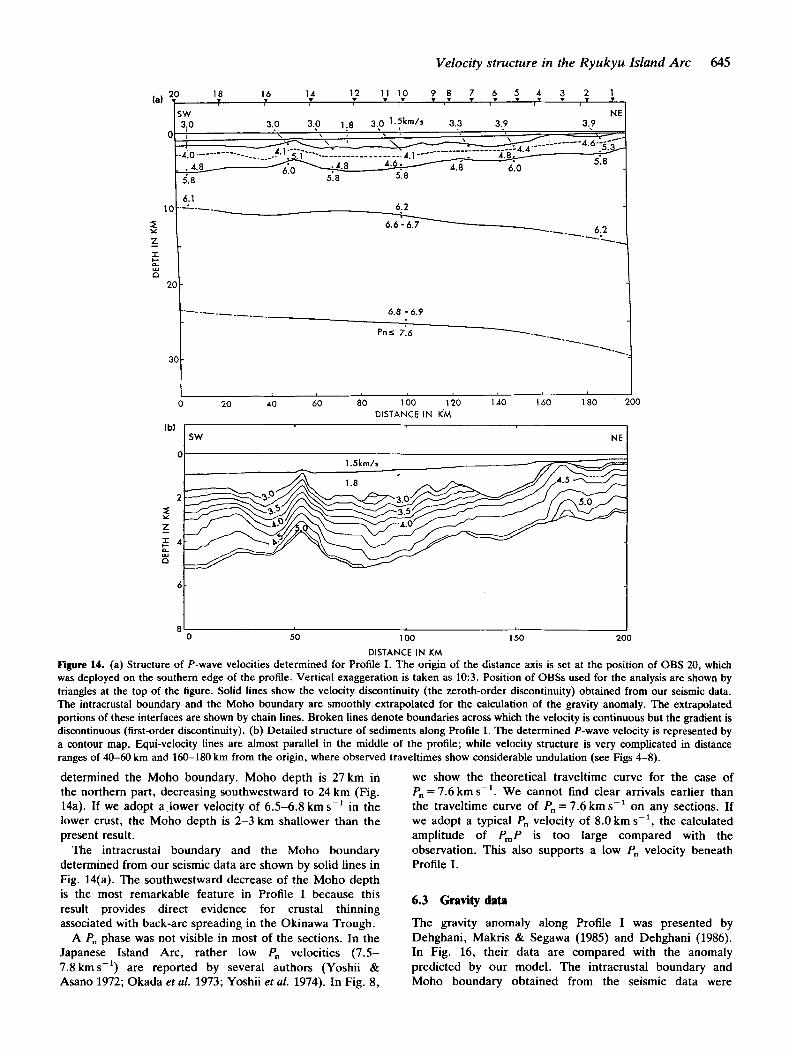
Figure 14. (a) Structure
0 50 100 150 200
DISTANCE I N KM of P-wave velocities determined for Profile I. The origin of the distance axis is set at the position of OBS 20, which
was deployed on the southern edge of the profile. Vertical exaggeration is taken as 10:3. Position of OBSs used for- the analysis are shown by triangles at the top of the figure. Solid lines show the velocity discontinuity (the zeroth-order discontinuity) obtained from our seismic data. The intracrustal boundary and the Moho boundary are smoothly extrapolated for the calculation of the gravity anomaly. The extrapolated portions of these interfaces are shown by chain lines. Broken lines denote boundaries across which the velocity is continuous but the gradient is discontinuous (first-order discontinuity). (b) Detailed structure of sediments along Profile I. The determined P-wave velocity is represented by a contour map. Equi-velocity lines are almost parallel in the middle of the profile; while velocity structure is very complicated in distance ranges of 40-60 km and 160-180 km from the origin, where observed traveltirnes show considerable undulation (see Figs 4-8).
determined the Moho boundary. Moho depth is 27km in we show the theoretical traveltime curve for the case of the northern part, decreasing southwestward to 24 km (Fig. P,, = 7.6 km s-'. We cannot find clear arrivals earlier than 14a). If we adopt a lower velocity of 6.5-6.8 km s-' in the the traveltime curve of P,, = 7.6 km s-' on any sections. If lower crust, the Moho depth is 2-3 km shallower than the we adopt a typical P,, velocity of 8.0 km s-', the calculated present result. amplitude of P,P is too large compared with the
The intracrustal boundary and the Moho boundary observation. This also supports a low P,, velocity beneath determined from our seismic data are shown by solid lines in Profile I. Fig. 14(a). The southwestward decrease of the Moho depth is the most remarkable feature in Profile I because this 6.3 Gravity data result provides direct evidence for crustal thinning associated with back-arc spreading in the Okinawa Trough. The gravity anomaly along Profile I was presented by
A P,, phase was not visible in most of the sections. In the Dehghani, Makris & Segawa (1985) and Dehghani (1986). Japanese Island Arc, rather low P,, velocities (7.5- In Fig. 16, their data are compared with the anomaly 7.8 kms-I) are reported by several authors (Yoshii & predicted by our model. The intracrustal boundary and Asano 1972; Okada et al. 1973; Yoshii et al. 1974). In Fig. 8, Moho boundary obtained from the seismic data were

646 T. Zwaraki et al.
z 0 20 40 60 80
DISTANCE IN KM
DENSITY MODEL 2,6 2,5 2:o 2i67 2 .,l 2.6
/- "., 2.? 2.65
I 0 20 40 60
DISTANCE I N KM
I 60 a0 1 00 120 140
DISTANCE IN KM Fcgrrre 15. Magnified seismograms at OBSs 6, 10 and 16. Weak arrivals corresponding to a P, phase are shown by arrows. Closed circle denotes the position of the first arrival. Open circle shows the position at which a weak wavetrain is recognized. The first arrival of this wave is considered to be earlier than this point. (a) Seismograms at OBS 6 (unfiltered). (b) Seismograms at OBS 10 (unfiltered). (c) Seismograms at OBS 16 (3-10 Hz band-pass filtered).
smoothly extrapolated to cover the entire profile (Fig. 14a). Densities adopted for the calculation are given in the lower part of Fig. 16. These were based on the experimental relation between P-wave velocity and density derived by Nafe & Drake (1963). The observed anomaly decreases northward from 90 to 45mgal. In order to explain such a trend of anomaly, a low upper mantle density (3.07- 3 . 1 0 g ~ m - ~ ) is needed. The curve in Fig. 16(a) shows the case of 3 . 0 7 g ~ m - ~ . The calculated anomaly fits the observations within 5 mgal. This result strongly suggests that the Pn velocity is low (about 7.5 km s-l).
6.4 An alternative model
As described above, the sedimentary layers and upper crust are densely covered with rays corresponding to clearly observed first arrivals and, therefore, their structures are
L . 8 10
,= 20 Z
2.95 - 6 0" 3ot 3.07-3.10 _. 1
Figure 16. Observed and calculated Bouguer anomaly for Profile I. Observed data were presented by Dehghani (1986). The density model adopted in the calculation is also shown in the bottom of the figure. The observed data require a rather low value of mantle density (3.07-3.1Og~m-~). Solid curve in the top of the figure shows the case for a mantle density of 3 .07g~m-~. The model explains the observed data within 5 mgal.
0 A0 80 120 140 DISTANCE IN KM
well defined. The model for a lower crust and Moho boundary, on the other hand, is less reliable due to the poor resolving power of our seismic data. This indicates that we must explore alternative models for the deeper part.
In our modelling, a phase R2 appearing at distant offsets (greater than 60-70km) was interpreted as a PmP phase (see Figs 4-8). Because clear arrivals are not found earlier than this phase in most of the sections (e.g. Figs 4 and 8), it seems possible to interpret this as a 'first arrival'. In this case, the intracrustal interface is obtained at a depth of 13.5 km throughout the profile, beneath which the P-wave velocity is 6.6-6.7 km s-'. This model explains the arrival time and amplitude of the R2 phase at OBSs 2, 18 and 20, but does not explain arrival times of weak wavetrains as shown in Fig. 15. At OBSs 6 and 18, for example, the calculated traveltimes are 0.2-0.3 s later than observed. This strongly supports the inference that the upper crust is thin in the NE part of the profile.
The Moho depth is determined from arrival times of the PmP phase once the intracrustal boundary is defined. Our seismic data suggest that the Moho boundary also dips northeastward. If we adopt a model with a constant Moho depth, the PmP phases at OBS 2 and 20 can not be interpreted simultaneously. Furthermore, this model does not explain the northeastward decrease of the gravity anomaly. Although we cannot precisely define the configuration of the intracrustal and Moho boundaries, these interfaces must dip northeastward to obtain a consistent explanation of our seismic data and the gravity anomaly.
7 T H E R Y U K Y U T R E N C H A N D T H E RYUKYU ISLANDS: SEISMIC MODEL FOR PROFILE I1
Profile 11, which was perpendicular to Profile I, crossed various structural transitions: the Ryukyu Islands; continen-

Velocity structure in the Ryukyu Island Arc 647
tal crust; the Ryukyu Trench; and the western part of the Philippine Sea Plate. We fired 149, 31 and 39 small shots along Profile 11-A, -B and -C, respectively. Along Profiles 11-A and -C, four and two big shots were also set off. We used seismic data at 17 OBSs for the analysis. The spacing between two neighbouring OBSs was about 10km. The water depth attains its maximum of 5640 m in the vicinity of OBS 32 (see Fig. 3).
The procedures used to model this profile were identical with those for Profile I. Fig. 17 shows our seismic model. Seismograms observed at five positions (OBSs 33, 24, 21, 18 and 14) are compared with synthetic seismograms in Figs 9-13. Traveltime curves predicted from our model are also superimposed on the observed seismograms. These figures show that our model explains the observed traveltimes and amplitudes very well.
7.1 Structure from the Ryukyu Trench to the oceanic basin
Profile 11-C (OBSs 30-34) was extended from the Ryukyu Trench to the oceanic basin, where the water depth is greater than 5000m (Fig. 3). The interpretation of the seismic data in Profile 11-C was relatively simple. The velocity structure developed for this part has oceanic properties with a crustal thickness of 7-8 km (Fig. 17).
The igneous basement undulates, and the thickness of the sediment layer vanes from 3.0 km near the trench axis (OBS 30) to 1.3 km at SE sites (OBS 34). The structure of this part of the crust was determined using the first arrival times from nearby shots (less than 20-30 km). The lower crust and upper mantle structures were modelled from traveltimes and amplitudes in an offset range of 30-50 km. The thickness of
26 27 13 14 16 17 18 19 20 21 23 24 30 31 32 33 3 (a)
51
------_-___ r I-
30 -
40 0
-1 00 -50 0 50 1 00 DISTANCE I N KM
- 1 50
z z r t
Y
Y P
1
1
I .IW SE
DISTANCE IN KM
Figure 17. (a) Structure of P-wave velocity determined for Profile 11. The origin of the distance axis is set at the position of OBS 16, which was deployed on the continental slope. Vertical exaggeration is taken as 10:3. Position of OBSs used for the analysis is shown by triangles at the top of the figure. Solid lines indicate the zeroth-order discontinuities determined from the seismic data. Chain lines are extrapolations of the seismologically determined interfaces, which are used for the calculation of the gravity anomaly. Dashed lines denote the first-order discontinuities. A huge sedimentary wedge is located between OBS 13 and 23. (b) Detailed structure within the sedimentary wedge. The P-wave velocity is represented by the contour map. In the eastern half of the wedge, sediments show an almost stratified structure and their velocities are comparable to those in the oceanic part southeast of OBS 24.
648 T. Iwasaki et al.
the igneous part of the crust, excluding the sediments, is not more than 5.5-6.0km. The lower crust has P-wave velocities of 6.7-7.0 km s-', which corresponds to a typical oceanic layer 3. Layer 3 is overlain by material with V, of 5.8-6.2kms-', corresponding to oceanic layer 2. The P,, velocity was estimated to be 7.8kms-'. This value, however, was not well constrained because the length of Profile 11-C was a little too short, i.e. only 60 km. As is shown in Fig. 9, the model obtained explains features of observed seismograms very well.
7.2 Structure in the continental slope of the Ryukyus
OBSs 13-24 were located on the western flank of the Ryukyu Trench and the continental slope of the Ryukyus (Fig. 3). Record sections observed at these OBSs (Figs 10-13) are quite different from those at the Ryukyu Trench area (Fig. 9). As is shown in Fig. 17, the crustal structure in this part is very complicated. We found a huge sedimentary wedge, whose thickness exceeds 12 km, overlying the subducted oceanic lithosphere. The velocity structure of the wedge is mainly determined from the first arrival-time data observed at OBSs 13-21. Ray diagrams in Figs 11-13 show that the rays corresponding to these arrivals densely cover the wedge. A contour map of velocity within the wedge is presented in Fig. 17(b). The SE part of the wedge shows a stratified structure with similar velocities to those in the oceanic basin. This suggests that materials forming the SE half of the wedge are of oceanic origin. The western part of the wedge, where the velocity is low, may correspond to the forearc basin.
The structure of the subducted oceanic crust was obtained by the following procedures. The oceanic crust southeast of the wedge was mainly modelled from first arrivals observed at OBSs 23 and 24 (Fig. 10). The velocity structure beneath the wedge was determined from both first arrivals and later arrivals recorded on OBSs 13-21. These arrival-time data, however, do not have enough resolving power for determining lateral velocity changes within the subducted oceanic crust. Hence, we fixed the velocities of the oceanic crust beneath the wedge and the continental crust, and determined the geometry of the subduction. At OBS 21, arrivals at 40-80 km (-40 to 0 km in abscissa) are well interpreted as refracted waves from the subducted oceanic crust (Fig. 11). The prominent later phase 40-80km northwest of OBS 18 (R1 in Fig. 12a) corresponds to the reflected wave from the oceanic crust under the huge wedge. Our model explains well the traveltimes and amplitudes of this phase (Fig. 12a and c). At OBS 24 (Fig. lo), we can find wavetrains in an offset range of 80-110 km (-30 to 0 km in abscissa). Such a phase is also recognized at OBS 23 and is explained as a P, phase from the oceanic upper mantle. At the OBSs west of the wedge, the refracted waves from the subducting oceanic crust appear with a high apparent velocity ( > K O km s-l) in an offset range of 40-80 km. On the record section at OBS 14 (Fig. 13a), for example, weak wavetrains shown by arrows are the refracted waves from the oceanic crust. Synthetic seismograms at OBS 14 (Fig. 13b) show that our model explains the behaviour of these wavetrains very well.
The velocity structure west of the sedimentary wedge was determined from the seismic data at OBSs 13-17. The
velocities of the upper crust and lower crust are 5.5-5.8 and 6.5-6.6 km s-l, respectively, which are comparable to those for Profile I. The upper and lower crusts in this part are covered by rays corresponding to the first arrivals at OBSs 13-16 (Fig. 13). It is noted that the upper crust is deformed and clearly dragged down by the subduction of the oceanic plate. The modelling of the continental Moho boundary and upper mantle is somewhat subjective because our seismic data do not have enough resolving power for them. We estimated the Moho depth and the P,, velocity in the continental part based on the results from Profile I and the gravity data.
7.3 Structure in the Ryukyu Ridge
The velocity structure in the Ryukyu Ridge was obtained from the seismic data at OBSs 26 and 27. Because Profile 11-B is rather short (45 km in length), these data constrain only the upper crustal structure. According to our results, the sedimentary layers become thinner towards the Ryukyu Islands (Fig. 17). On the Ryukyu Ridge, sediments were characterized by two layers of 1.9-2.3 and 4.3-4.4 km s-'. The total thickness of the sediments is remarkably thin (1.6-3.0 km) compared to the eastern slope of the ridge. The velocity in the upper crust is 5.5 km s-' and consistent with the result obtained from the seismic data at OBSs 13-16.
7.4 Gravitydata
Gravity data along Profile I1 were also presented by Dehghani (1986). We calculated the Bouguer anomaly from our seismic model and compared it with the observation (Fig. 18). At the NE edge of the profile, the structure of the
N W SE 2 400 - 0 . E g 300- . * + OBS. - CALC. 3 '
PROFILE I I - - 0 ' ~ ~ " ' " ' " ' " -120 -80 -40 0 40 80 120
DISTANCE IN KM
'30\# z - .,o/ CALC.
3 2 200 .. d z loo ..**....a .*.... - a * - .
.*
PROFILE I I . . . . . . . DISTANCE IN KM
. . 0 -120 -80 -40 0 40 80 120
DENSITY MODEL
3.22
40' ' -120 -80 -40 0 40 80 120 / / / , , I I I , I I I # I
DISTANCE IN KM
Figure 18. Observed and calculated Bouguer anomaly for Profile 11. Observed data were presented by Dehghani (1986). The density model adopted in the calculation is also shown in the bottom figure. The densities of the continental and oceanic mantle are set at 3.10 and 3 .22g~m-~. The model explains the observed data within 50 mgal.

Velocity structure in the Ryukyu Island Arc 649
continental crust was assumed to be identical to that for Profile I. The thickness of the continental crust was taken to be almost constant. The densities assumed for the computation are given in the lower part of Fig. 18.
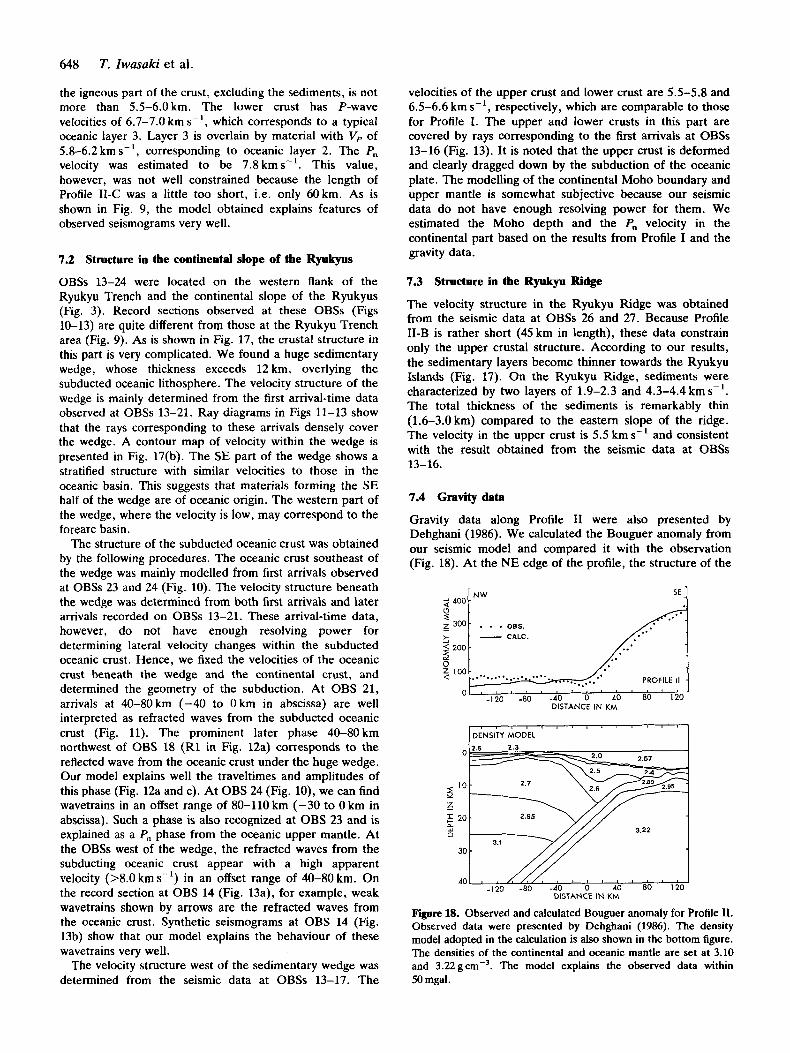
The calculated anomaly fits the observed data within 50 mgal, assuming densities for the continental and oceanic mantle to be 3.10 and 3.22 gcme3, respectively. Especially in the SE half of the profile, where the velocity structure is well constrained, the observed anomaly is explained quite well by the model. It is also noted that the anomaly in this part mainly depends on the density model of the crust, and is not sensitive to the adopted upper mantle density. These results strongly support the existence of the large sedimentary wedge.
If we compare our results with any of those previously published (see e.g. Ludwig et al. 1973; also Fig. 2 in this paper), it will become obvious that the older data provided some limited information on the sedimentary part of the crust and on the thin oceanic crust, but hardly any on the deeper part of the crust under the Ryukyu Islands or the Okinawa Trough. In the present study, the crustal structure of the Ryukyu region was clarified for the first time.
7.5 An alternative model
The velocity structure from the Ryukyu Trench to the oceanic basin is rather simple. In the following, we describe an alternative model for the continental slope.
We think that the structure of the wedge is well defined due to the dense ray coverage (see ray diagrams in Figs 10-13). The velocity of the wedge (2.7-4.5kms-') was determined from the first arrivals clearly observed at OBSs 13-21. The estimation errors for the velocity and thickness of the wedge are 0.2-0.3 km s-' and 1 km, respectively. If we assume a rather high velocity of 3.3 km s-' for the upper part of the wedge, the calculated traveltimes are 0.2-0.3 s earlier than the observation. A model with a thin wedge also yields results inconsistent with the observations. In a model with a lOkm thick wedge, for example, the discrepancy between calculated and observed traveltimes is quite large
As mentioned in Section 6.2, our data strongly suggest the subduction of the oceanic crust and upper mantle, but they do not have enough resolving power for defining the lateral velocity variations of the oceanic crust beneath the wedge. In our modelling, we fixed the velocities of the oceanic crust beneath the wedge and continental crust, and determined the geometry of the subduction. This modelling is not unique, and a thinner crust with high velocities or a thicker crust with low velocities may explain the observed data to the same degree. Our data also strongly suggest that the continental upper crust is dragged down by the subduction of oceanic lithosphere.
(0.2-0.3 s).
8 DISCUSSION A N D CONCLUSIONS
A controlled source study using a large number of OBSs has been successfully conducted in the NW edge of the Philippine Sea, where the Philippine Sea Plate is subducting beneath the Eurasian continental plate. Seismic data were collected on two profiles perpendicular to each other. Because of the high density of the obtained data, we have
succeeded in delineating complete picture of the crust and upper mantle of the whole region.
For the 190 km long profile taken in the northern part of the Okinawa Trough, we obtained a velocity structure characteristic of continental crust: four layers with velocities of 1.8, 3.0-4.8, 5.8-6.2 and 6.6-7.0 km s-l. The velocities of sediment and upper crust are in good agreement with the results of Ludwig et al. (1973). The Moho shallows towards the southwest, from 27-30 km beneath the Kyushu Island to about 23-24km at the SW end of the profile where the Okinawa Trough has the 1000m isobath. Our seismic data did not provide any evidence of P, velocity greater than 7.8-8.0 km s-'. From gravity measurements, the density of the upper mantle was determined to be 3.07-3.10 g crnp3. The result strongly suggests that the P, velocity has a considerably low value of 7.5 km s-' in this region.
From the present results, we may conclude that the northern part of the Okinawa Trough is in a stage of continental crustal extension [a 'rifting stage'; Lee et al. (1980)], and that seafloor spreading has not occurred in this region as yet. The southwestward decrease in Moho depth is considered to be direct evidence of crustal thinning occurring during the rifting stage. This interpretation is in good agreement with the geological scenario of the Okinawa Trough presented by Sibuet et al. (1987). Based on their model of back-arc spreading, the low-velocity and low-density upper mantle is explained by arc volcanism rather than back-arc basin volcanism.
Seismic data along another profile provided us with a complete section of the whole crust which clearly shows subduction and accretion. The structure at the collision front indicates that the continental crust is deformed and dragged down by the subduction of the oceanic plate.
The trench area is floored by old oceanic crust, which consists of three layers with velocities of 2.2-3.2, 5.8-6.2 and 6.7-7.0 km s-', respectively. The sediment is 1.3- 3.0 km thick, beneath which the igneous basement shows severe undulation. The total thickness of the crust is not more than 8 km, of which 5-6 km are built up by igneous rocks of basic composition. The P, velocity of the oceanic mantle is slightly lower than 8.0 km s-'.
The subduction of the Philippine Sea Plate below the Ryukyu Island Arc creates a huge sedimentary wedge at the collision front. The wedge thickens landward and attains its maximum thickness of 12 km at 70 km from the trench. The existence of this huge wedge is also supported by gravity data along the same profile. The velocity of the wedge is 2.7-4.5 km s-'. In the half of the wedge, the velocity is almost comparable to that of the sediment in the oceanic crust. This indicates that the wedge is of accretionary origin. The NE half, where the wedge has maximum thickness, may correspond to the forearc basin.
In the Ryukyu Islands, the velocity structure is comparable to that obtained in the Okinawa Trough. The sediment in this part is about 2 km s-l, and the velocity of the upper crust is 5.5-5.8 km s-'.
In order to clarify the features of subduction in our experimental area, we compare the present results to those obtained for the other active margins. Fig. 19 shows the velocity structure off Hokkaido Island, Japan, beneath which the Pacific Plate is subducting (Iwasaki et al. 1989). This profile, lo00 km north of the present experiment area,

650 T. Zwusaki et al.
40
5
z t
Y
8
- - 8.4
8.4 -
Figure 19. Structure of P-wave velocity in the southernmost part of the Kuril Trench determined from an ocean bottom seismographic refraction survey (Iwasaki et al., 1989). Vertical exaggeration is taken as 10:3. Position of OBSs used for the analysis are shown by triangles at the top of the figure. Solid and broken lines indicate the zeroth- and the first-order discontinuities, respectively. Note that the oceanic lithosphere, including oceanic layer 2, smoothly subducts without forming a remarkable sedimentary wedge. The uppermost part of layer 2 becomes a low-velocity layer under the continental slope.
extended from the oceanic basin to the continental slope of Hokkaido Island, across the Kuril Trench. The structure obtained shows a remarkable difference from that for Ryukyu Trench (Fig. 17). As is shown in Fig. 19, the crust in the oceanic basin (the SE part of the profile) has a typical oceanic structure. We cannot see the undulation of basement at the trench area, as is found in the Ryukyu Trench; nor do we see a thick accretionary sediment wedge. Such regional features of the velocity structure show that the subduction beneath the Kuril Trench progresses smoothly as compared with the case of the Ryukyu Trench.
ACKNOWLEDGMENTS
This seismic experiment was the joint effort of a number of scientists from the Federal Republic of Germany and Japan, and accomplished within the framework of the German- Japanese Technological Cooperation Programme. The Federal Ministry of Research and Technology (Federal Republic of Germany) and the Ministry of Education, Science and Culture (Japan) provided the major part of the funding. The Universities of Hamburg, Hokkaido and Tokyo supported not only the field operation but also data processing by providing computing facilities and funds. The authors would like to thank Captain H. Papenhagen and the crew of R/V ‘SONNE’ for their cooperation during the experiments. They also wish to express their sincere thanks to W. Ansgar, D. Berendsen, B. Norbert, G. A. Dehghani, Z. Makris, M. Schubert (Geophysical Institute, Hamburg University), T. Kakuta (Department of Science, Kagoshima University), T. Honda, J. Takenaka (Department of Earth Science, Chiba University) and S. Ueno (Geophysical
Institute, the University of Tokyo) for their cooperation throughout this study.
REFERENCES
Barry, K. M., Caves, D. A. & Kneale, C. M., 1975. Recommended standards for digital tape formats, Geophysics, 40, 344-352.
Cervedy, V. & PSenfik, I., 1983. Program package SEIS83, Charles University, Prague.
Dehghani, G. A,, 1986. Kurzbericht uber gravimetrische und magnetische Vermessungen im Bereich des Ryukyu Insel- bogen, in Internal Report of the Geophysical Institute, Hamburg University.
Dehghani, G. A., Makris, J. & Segawa, J., 1985. Gravity and magnetic studies of the Ryukyu Island Arc, in Abstract for the 23rd general assembly of IASPEI, vol. 1, p. 280, Tokyo.
Herber, R., Nuppenau, V. & Snoek, M., 1981. An O M system for marine seismic investigations, basic requirements and options: the Hamburg OBS, Boll. Geofis. Teor. Appl., 23, 233-242.
Herman, B. M., Anderson, R. N. & Truchan, M., 1979. Extensional tectonics in the Okinawa Trough, in Geological and Geophysical Investigations of Continental Margins, Am. Assoc. Pet. Geol. Mem., vol. 29, pp. 199-208, eds Watkins, J . S., Montadert, L. & Dickerson, P. W., Tulsa.
Hirata, N. & Shinjo, N., 1986. SEISOBS: Modified version of SEIS83 for ocean bottom seismograms, Zisin, 39, 317-321 (in Japanese).
Inatani, H. & Furuya, I., 1980. A microprocessor controlled time code generator for an OBS system, J. Phys. Earth, 28,
Iwasaki, T., 1988. Ray-tracing program for study of velocity structure by ocean bottom seismographic profiling, Zirin, 41, 263-266 (in Japanese).
Iwasaki, T., Shiobara, H., Nishizawa, A., Kanazawa, T., Suyehiro, K., Hirata, T., Urabe, T. & Shimamura, H., 1989. A detailed
28 1-292.

Velocity structure in the Ryukyu Island Arc 651
subduction structure in the Kuril Trench deduced from ocean bottom seismographic refraction studies, Tectonophysics, 165,
Jacob, A. W. B., 1975. Dispersed shots of optimum depth-an efficient seismic source for lithospheric studies, J. Geophys.,
Kasahara, J., Nagumo, S., Koresawa, S., Ouchi, T. & Kinosita, H., 1985. Seismic features in the central Okinawa T r o u g k a n active incipient rifting, in Abstracr for the 23rd general assembly of IASPEI, vol. 1, p. 279, Tokyo.
Kastumata, M. & Sykes, L., 1%9. Seismicity and tectonics of the western Pacific. h-Mariana-Caroline and Ryukyu-Taiwan regions, I . geophys. Res., 74, 5923-5948.
Kobayashi, K., 1985. Sea of Japan and Okinawa Trough, in the Ocean Basins and Margins, vol. 7A, pp. 419-458, eds Nairn A. E. M., Stehli, F. G. & Uyeda, S., Plenum Publishing Corporation, New York.
Lee, C. S., Shor, G. G. Jr, B i k e , L. D., Lu, R. S. & Hilde, T. W. C., 1980. Okinawa Trough: origin of a back arc basin, Mar. Geol., 5,219-241.
Ludwig, W., Murauchi, S., Den, N., Bull, P., Hotta, H., Ewing, M., Asanuma, T., Yoshii, T. & Sakajiri, N., 1973. Structure of East China Sea-West Philippine Sea margin off southern Kyushu, Japan, I . geophys. Res., 78,2526-2536.
Murauchi, S . er al., 1968. Crustal structure of the Philippine Sea, 1. geophys. Res., 73, 3143-3171.
Nafe, J. E. & Drake, C. C., 1963. Physical properties of marine sediment in the Sea, vol. 3, pp. 794-815, ed. Hill, M. N., Wiley Interscience, New York.
Okada, H., Suzuki, S., Moriya, T. & Asano, S., 1973. Crustal
315-336.
41,63-75.
structure in the profile across the southern part of Hokkaido, Japan, as derived from explosion seismic observations, J. Phys.
Shibata, K., Konishi, K. & Nozawa, T., 1968. K-Ar age of muscovite from crystalline schist of the northern Ishigakishima, Ryukyu Island, Bull. Geol. SUN. Japan, 19, 529-533.
Shiono, K., Mikumo, T. & Ichikawa, Y., 1980. Tectonics of the Kyushu-Ryukyu Arc as evidenced from seismicity and focal mechanics of shallow to intermediate-depth earthquakes, J .
Sibuet, J. C., et al., 1987. Back arc extension in the Okinawa Trough, J. geophys. Res.. 92, 14041-14063.
Thiessen, J. & Makris, J., 1980, A ray-tracing program for computer traveltimes in laterally inhomogeneous media, in Internal Report of the Geophysical Institute, Hamburg University.
Urabe, T. & Kanazawa, T., 1984. A high reliable timer for a pop-up OBS system, Zbin, 37, 511-512 (in Japanese).
Wageman, J. M., Hilde, T. W. C. & Emery, K. O., 1970. Structural framework of East China Sea and Yellow Sea, Am. Assoc. Pet. Geol. Bull., 54, 1611-1643.
Yarnada, T., Asada, T. L Shimamura, H., 1981. A pop-up ocean bottom seismograph, Prog. Abstr. seism. SOC. Japan., 2, 126.
Yoshii, T. & Asano, S., 1972. Time-term analyses of explosion seismic data, 1. Phys. Earth, 20, 47-57.
Yoshii, T., Sasaki, Y., Tada, T., Okada, H., Asano, S., Muramatsu, I., Hashizume, M. & Moriya, T., 1974. The third Kurayoshi explosion and the crustal structure in the western part of Japan, J. Phys. Earth, 22, 109-121.
Earth, 21,329-354.
Phys. Earth, 28, 17-43.
Related Documents