CRREL REPORT CRREL REPORT 95-10 95-10 Winter Navigation on the Great Lakes A Review of Environmental Studies James L. Wuebben, Editor May 1995

Welcome message from author
This document is posted to help you gain knowledge. Please leave a comment to let me know what you think about it! Share it to your friends and learn new things together.
Transcript
CR
REL
REP
OR
TC
RR
EL R
EPO
RT
95
-10
95
-10
Winter Navigation on the Great LakesA Review of Environmental StudiesJames L. Wuebben, Editor May 1995

AbstractIn 1970, Congress authorized a three-part Great Lakes–St. Lawrence SeawayNavigation Season Extension Program. It authorized a winter navigation dem-onstration program, a detailed survey study of season extension feasibilityand a study of insurance rates for shippers. This report provides a review ofnumerous environmental and engineering studies conducted as part of thedemonstration and feasibility portions of the program, as well as many envi-ronmental studies conducted after the completion of the original program.Topics include sediment transport, shoreline erosion, shore structure dam-age, oil and hazardous substance spills, biological effects, ship-induced vi-brations and ice control systems.
For conversion of SI units to non-SI units of measurement consult ASTMStandard E380-93, Standard Practice for Use of the International Systemof Units, published by the American Society for Testing and Materials,1916 Race St., Philadelphia, Pa. 19103.
Cover: The John G. Munsun in the St. Marys River.
CRREL Report 95-10
Winter Navigation on the Great LakesA Review of Environmental StudiesJames L. Wuebben, Editor May 1995
Prepared for
U.S. ARMY ENGINEER DISTRICT, DETROIT
Approved for public release; distribution is unlimited.
US Army Corps of Engineers Cold Regions Research & Engineering Laboratory
ii
PREFACE
This report was edited by James Wuebben, Research Hydraulic Engineer, Ice Engi-neering Research Division, Research and Engineering Directorate, U.S. Army Cold Re-gions Research and Engineering Laboratory. The various sections of the report werewritten by other CRREL researchers as follows:
IntroductionStephen L. DenHartog, formerly of the Ice Engineering Research Division
Sediment Transport, Shoreline Erosion and Shore Structure DamageJames L. Wuebben, Ice Engineering Research Division
Oil and Hazardous Substance SpillsSteven F. Daly, Ice Engineering Research Division
Biological EffectsJames L. Wuebben, Ice Engineering Research Division
Vibrations Caused by Ship TrafficF. Donald Haynes, Ice Engineering Research Division
Bubbler SystemsGeorge D. Ashton, Deputy Director for Research and Engineering
Ice Control StructuresRussell E. Perham, formerly of the Ice Engineering Research Division
Ice Control at LocksJohn H. Rand, Research and Engineering Directorate.
This report was prepared for the Detroit District, U.S. Army Corps of Engineers un-der Intra-Army Reimbursable Order NCE-IA-860127. This literature review summarizesselected investigations conducted under the Great Lakes–St. Lawrence Seaway WinterNavigation Demonstration Program, the Navigation Season Extension Feasibility Pro-gram and the Extended Season Navigation program under Operation and MaintenanceAuthority. It is not meant to be an all-inclusive, state-of-the-art review of the engineer-ing, physical and environmental effects of navigation in winter but rather a comprehen-sive review of work conducted on the Great Lakes system in support of the season ex-tension programs. While the sections on ice control might be better classified as reviewsof engineering projects rather than environmental studies, they have been included be-cause of their bearing on flow hydraulics, ice characteristics and shipping operations.The review primarily covers those reports specifically identified by the District for in-clusion, but these have been supplemented with additional information when necessaryfor completeness.
The contents of this report are not to be used for advertising or promotional pur-poses. Citation of brand names does not constitute an official endorsement or approvalof the use of such commercial products.
iii
CONTENTSPage
Preface ................................................................................................................................. iiIntroduction ........................................................................................................................ 1Sediment transport, shoreline erosion and shore structure damage ......................... 2
Physical effects of commercial navigation in ice ...................................................... 3Ship waves ..................................................................................................................... 3Propeller wash ............................................................................................................... 4Drawdown and surge .................................................................................................. 5Sediment transport and shoreline erosion ................................................................ 8Shore structure damage ............................................................................................... 13Dynamic horizontal ice forces ..................................................................................... 13Vertical ice forces .......................................................................................................... 15Field studies of structure damage .............................................................................. 18Summary ........................................................................................................................ 20
Oil and hazardous substance spills ................................................................................. 20Spill scenarios ................................................................................................................ 21Identification of probable spill materials .................................................................. 22Determination of spill probabilities ........................................................................... 22Identification of spill impacts ...................................................................................... 22Existing contingency plans .......................................................................................... 23Response capabilities and recovery techniques ....................................................... 23Modeling oil and hazardous substance spills ........................................................... 24
Biological effects ................................................................................................................ 24Water quality ................................................................................................................. 24Benthic macroinvertebrates ......................................................................................... 27Aquatic plants ............................................................................................................... 30Fish .................................................................................................................................. 31Birds ................................................................................................................................ 35Summary ........................................................................................................................ 36
Vibrations caused by ship traffic ..................................................................................... 36Engineering and environmental effects of heat-transfer bubbler systems................ 38
Environmental effects .................................................................................................. 38Ice control structures ......................................................................................................... 39
St. Lawrence River ........................................................................................................ 40Lake Erie ......................................................................................................................... 40St. Marys River .............................................................................................................. 40Reference measurements ............................................................................................. 43Port Huron ..................................................................................................................... 43
Ice control at docks ............................................................................................................ 44Minimizing ice adhesion to lock walls ...................................................................... 45Mechanical ice removal ................................................................................................ 46Floating ice control ....................................................................................................... 46Summary ........................................................................................................................ 47
Literature cited ................................................................................................................... 47Abstract ............................................................................................................................... 53
iv
ILLUSTRATIONSPage
Figure
1. The Great Lakes region .......................................................................................... 22. Maximum wave heights 100 ft from the sailing line for a variety of
hull forms......................................................................................................... 33. Damping of waves at an ice edge ........................................................................ 44. Ship-induced water movements .......................................................................... 55. Effects on drawdown due to changes in variables from a basic case ............. 76. Velocity, water surface elevation and sediment movement measurements
during vessel passage .................................................................................... 97. Relation of water level to a shore profile on the St. Marys River .................... 108. Horizontal movement of ice against rocks in early winter .............................. 149. Spring breakup on the St. Marys River ............................................................... 14
10. Series of finger piers damaged by ice jacking ..................................................... 1511. Aerial view of Johnson’s Point, showing active crack offshore of
structures ......................................................................................................... 1612. Private dock on the St. Marys River with protective pile clusters ................... 1613. Active crack passing through a damaged dock ................................................. 1714. Horizontal member of dock in contact with the ice cover ................................ 1715. Location of test sites on the St. Marys River ....................................................... 3616. Vibration instrumentation layout ......................................................................... 3717. Magnitude of vibrations for the Roger Blough passing the Gordon site ....... 3718. Schematic of a bubbler system .............................................................................. 3819. Location of the St. Marys River ice control structures....................................... 4120. Details of the St. Marys River ice boom ............................................................... 4221. Location of the Port Huron ice control structure ............................................... 4422. Schematic of an air screen ...................................................................................... 46
TABLES
Table
1. Summary of oil spills on the Great Lakes connecting channels ......................... 212. Peak loads on the St. Marys River ice boom, 1976 ............................................... 42
INTRODUCTION
In 1970, Congress authorized a three-part GreatLakes–St. Lawrence Seaway Navigation SeasonExtension Program in the Rivers and Harbors Actof 1970 (PL91-611) and subsequent amendments.It authorized a demonstration program, a detailedsurvey study of season extension feasibility anda study of ways to provide reasonable insurancerates to shippers. Since that time, there has beena series of investigations conducted by the U.S.Army Corps of Engineers on extending the navi-gation season on the Great Lakes and St. LawrenceSeaway system. From 1970 to 1979, with an expen-diture of about $21 million, a large number of envi-ronmental and engineering studies and demon-strations were completed by the U.S. Army Corpsof Engineers (COE), U.S. Coast Guard (USCG),St. Lawrence Seaway Development Corporation(SLSDC), U.S. Fish and Wildlife Service (FWS),National Oceanic and Atmospheric Administra-tion (NOAA), Maritime Administration (MARAD),Environmental Protection Agency (EPA) andothers.
The demonstration program was administeredby a Winter Navigation Board, which in turn setup seven working groups as follows: Ice Informa-tion, Ice Navigation, Ice Engineering, Ice Control,Ice Management, Economic Evaluation, and En-vironmental Evaluation. Primary organizationalresponsibility was handled by the Detroit Dis-trict, COE. Under the demonstration portion ofthe program, the working groups, for example,developed ice cover reporting and predictionschemes, conducted studies of fish habitat andwinter shore damage, determined future needsfor icebreakers and harbor improvements, andfound methods to overcome lockage delays dueto ice.
Concurrently a survey study was undertakento determine how long a season extension wasfeasible and whether it would be the same for allreaches of the waterway. It soon became clear thatthere are three reaches with different problemsthat had to be considered separately:
• The St. Lawrence River section of the St.Lawrence Seaway and the Welland Canalfrom Tidewater to Lake Erie;
• The Detroit and St. Clair River portion; and• The upper lakes including the St. Marys River
and the locks at Sault Ste. Marie.Six time extensions were considered, ranging
from the status quo (with closure of the Sault Locksand the St. Lawrence Seaway from late Decem-ber to early April) to year-round navigation onthe entire system (except for a one-month closureon the Seaway). An interim feasibility report wascompleted in 1977 recommending season exten-sion to 31 January ±2 weeks on the upper GreatLakes only. This would require very few engi-neering measures. The final recommendation ofthe final demonstration and survey reports (WNB1979, USACE 1979a) was that, from an engineer-ing and economic standpoint, year-round navi-gation was feasible on the upper two reaches, anda two-month closure (from 7 January to 7 March)would be necessary on the lower reach. The rec-ommended plan projected a total investment costof $451 million with a 4.0 benefit-to-cost ratio.The Office of Management and Budget, in responseto the 1977 interim feasibility report, recommendedthat, since the Corps already had authority tooperate the locks and maintain navigation, lim-ited extension be considered under operation andmaintenance authority. Consequently the DetroitDistrict addressed operation of the locks at SaultSte. Marie, Michigan, to 8 January ±1 week in anOctober 1979 environmental impact statement
Winter Navigation on the Great LakesA Review of Environmental Studies
JAMES L. WUEBBEN, EDITOR
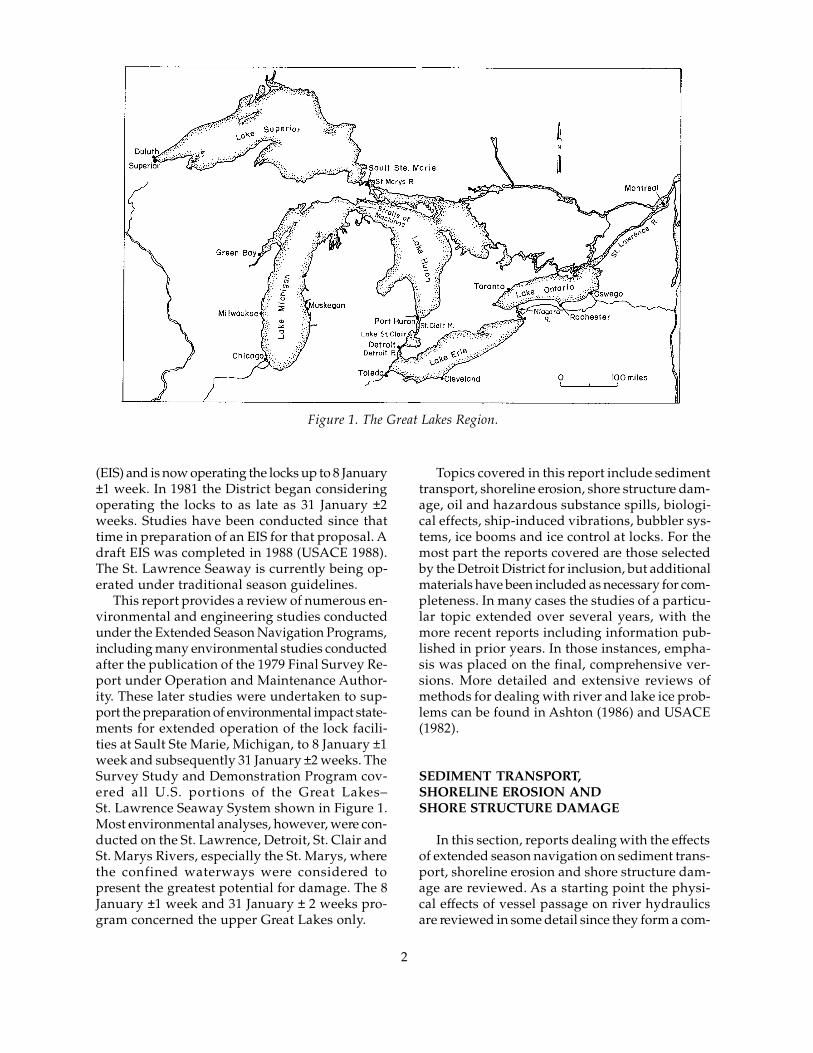
Figure 1. The Great Lakes Region.
Topics covered in this report include sedimenttransport, shoreline erosion, shore structure dam-age, oil and hazardous substance spills, biologi-cal effects, ship-induced vibrations, bubbler sys-tems, ice booms and ice control at locks. For themost part the reports covered are those selectedby the Detroit District for inclusion, but additionalmaterials have been included as necessary for com-pleteness. In many cases the studies of a particu-lar topic extended over several years, with themore recent reports including information pub-lished in prior years. In those instances, empha-sis was placed on the final, comprehensive ver-sions. More detailed and extensive reviews ofmethods for dealing with river and lake ice prob-lems can be found in Ashton (1986) and USACE(1982).
SEDIMENT TRANSPORT,SHORELINE EROSION ANDSHORE STRUCTURE DAMAGE
In this section, reports dealing with the effectsof extended season navigation on sediment trans-port, shoreline erosion and shore structure dam-age are reviewed. As a starting point the physi-cal effects of vessel passage on river hydraulicsare reviewed in some detail since they form a com-
(EIS) and is now operating the locks up to 8 January±1 week. In 1981 the District began consideringoperating the locks to as late as 31 January ±2weeks. Studies have been conducted since thattime in preparation of an EIS for that proposal. Adraft EIS was completed in 1988 (USACE 1988).The St. Lawrence Seaway is currently being op-erated under traditional season guidelines.
This report provides a review of numerous en-vironmental and engineering studies conductedunder the Extended Season Navigation Programs,including many environmental studies conductedafter the publication of the 1979 Final Survey Re-port under Operation and Maintenance Author-ity. These later studies were undertaken to sup-port the preparation of environmental impact state-ments for extended operation of the lock facili-ties at Sault Ste Marie, Michigan, to 8 January ±1week and subsequently 31 January ±2 weeks. TheSurvey Study and Demonstration Program cov-ered all U.S. portions of the Great Lakes–St. Lawrence Seaway System shown in Figure 1.Most environmental analyses, however, were con-ducted on the St. Lawrence, Detroit, St. Clair andSt. Marys Rivers, especially the St. Marys, wherethe confined waterways were considered topresent the greatest potential for damage. The 8January ±1 week and 31 January ± 2 weeks pro-gram concerned the upper Great Lakes only.
2
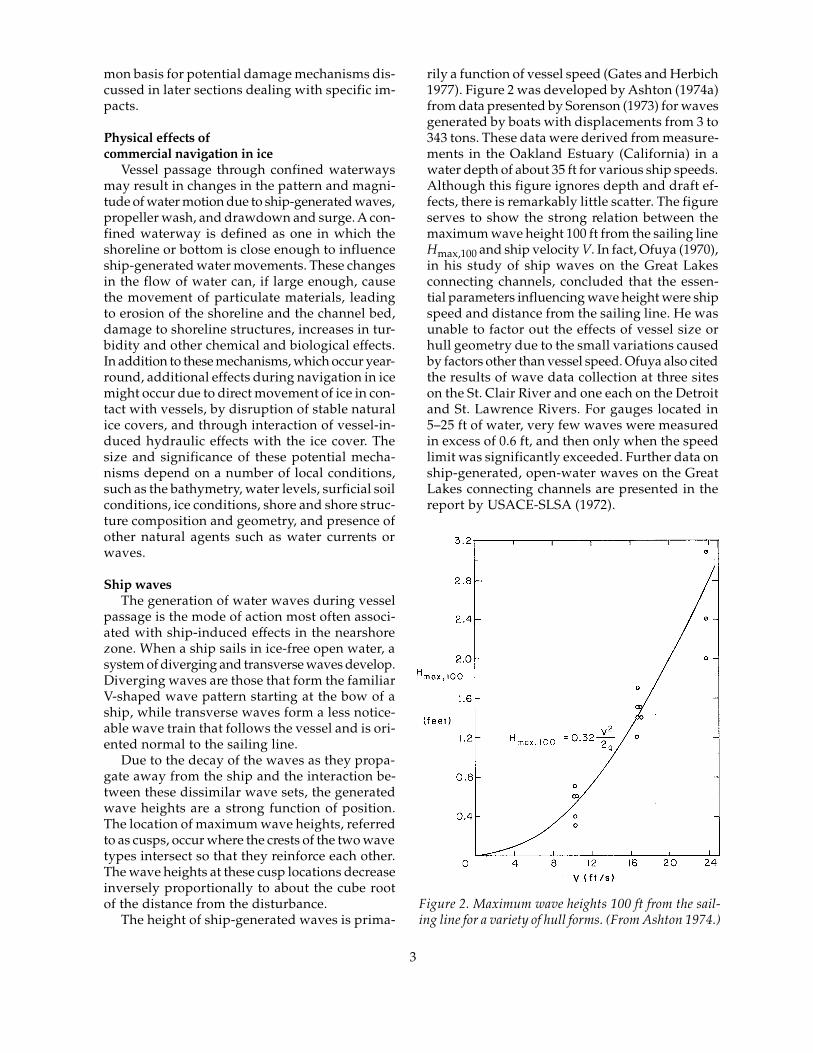
rily a function of vessel speed (Gates and Herbich1977). Figure 2 was developed by Ashton (1974a)from data presented by Sorenson (1973) for wavesgenerated by boats with displacements from 3 to343 tons. These data were derived from measure-ments in the Oakland Estuary (California) in awater depth of about 35 ft for various ship speeds.Although this figure ignores depth and draft ef-fects, there is remarkably little scatter. The figureserves to show the strong relation between themaximum wave height 100 ft from the sailing lineHmax,100 and ship velocity V. In fact, Ofuya (1970),in his study of ship waves on the Great Lakesconnecting channels, concluded that the essen-tial parameters influencing wave height were shipspeed and distance from the sailing line. He wasunable to factor out the effects of vessel size orhull geometry due to the small variations causedby factors other than vessel speed. Ofuya also citedthe results of wave data collection at three siteson the St. Clair River and one each on the Detroitand St. Lawrence Rivers. For gauges located in5–25 ft of water, very few waves were measuredin excess of 0.6 ft, and then only when the speedlimit was significantly exceeded. Further data onship-generated, open-water waves on the GreatLakes connecting channels are presented in thereport by USACE-SLSA (1972).
mon basis for potential damage mechanisms dis-cussed in later sections dealing with specific im-pacts.
Physical effects ofcommercial navigation in ice
Vessel passage through confined waterwaysmay result in changes in the pattern and magni-tude of water motion due to ship-generated waves,propeller wash, and drawdown and surge. A con-fined waterway is defined as one in which theshoreline or bottom is close enough to influenceship-generated water movements. These changesin the flow of water can, if large enough, causethe movement of particulate materials, leadingto erosion of the shoreline and the channel bed,damage to shoreline structures, increases in tur-bidity and other chemical and biological effects.In addition to these mechanisms, which occur year-round, additional effects during navigation in icemight occur due to direct movement of ice in con-tact with vessels, by disruption of stable naturalice covers, and through interaction of vessel-in-duced hydraulic effects with the ice cover. Thesize and significance of these potential mecha-nisms depend on a number of local conditions,such as the bathymetry, water levels, surficial soilconditions, ice conditions, shore and shore struc-ture composition and geometry, and presence ofother natural agents such as water currents orwaves.
Ship wavesThe generation of water waves during vessel
passage is the mode of action most often associ-ated with ship-induced effects in the nearshorezone. When a ship sails in ice-free open water, asystem of diverging and transverse waves develop.Diverging waves are those that form the familiarV-shaped wave pattern starting at the bow of aship, while transverse waves form a less notice-able wave train that follows the vessel and is ori-ented normal to the sailing line.
Due to the decay of the waves as they propa-gate away from the ship and the interaction be-tween these dissimilar wave sets, the generatedwave heights are a strong function of position.The location of maximum wave heights, referredto as cusps, occur where the crests of the two wavetypes intersect so that they reinforce each other.The wave heights at these cusp locations decreaseinversely proportionally to about the cube rootof the distance from the disturbance.
The height of ship-generated waves is prima-Figure 2. Maximum wave heights 100 ft from the sail-ing line for a variety of hull forms. (From Ashton 1974.)
3
Wuebben et al. (1984) analyzed the variationin ship-generated waves with vessel size on theSt. Marys, St. Clair and Detroit Rivers. For the44 shoreline sites considered, the waves gener-ated by a 1000-ft vessel traveling at existing speedlimits were calculated to be no more than about0.5 ft in amplitude at the shoreline. Althoughequations are available for predicting ship-gen-erated wave heights and their subsequent de-cay in open water, none adequately address situ-ations involving shallow water or confined orirregularly shaped channels accompanied bycomplex flow distributions such as those foundin the Great Lakes connecting channels. With-out site-specific field data to calibrate and checkthe calculated values, any projections made mustbe considered approximate. The available theo-ries do, however, clearly show that vessel speedis by far the most important variable control-ling the magnitude of ship waves generated, fol-lowed by the distance to the shoreline, whichgoverns their decay.
During winter ice conditions, the short-periodwaves generated by vessel passage are effectivelydamped by the ice cover. As part of a study ofthe effects of winter navigation on shoreline ero-sion and structure damage (USACE 1974), con-tinuous measurements of water level variationsduring ship passage were collected at several lo-cations on the St. Marys River during periods withand without an ice cover. These data clearlyshowed both wind- and ship-generated wavesduring open-water periods, but during periodswith ice covers no waves were detectable.
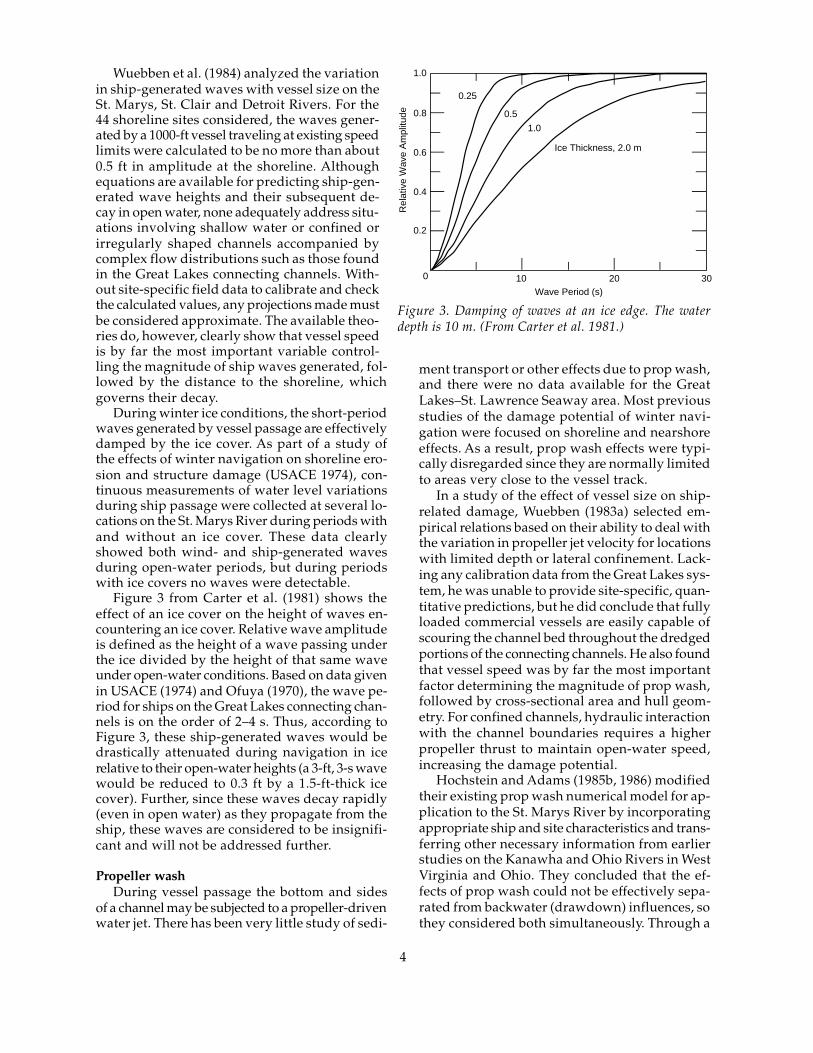
Figure 3 from Carter et al. (1981) shows theeffect of an ice cover on the height of waves en-countering an ice cover. Relative wave amplitudeis defined as the height of a wave passing underthe ice divided by the height of that same waveunder open-water conditions. Based on data givenin USACE (1974) and Ofuya (1970), the wave pe-riod for ships on the Great Lakes connecting chan-nels is on the order of 2–4 s. Thus, according toFigure 3, these ship-generated waves would bedrastically attenuated during navigation in icerelative to their open-water heights (a 3-ft, 3-s wavewould be reduced to 0.3 ft by a 1.5-ft-thick icecover). Further, since these waves decay rapidly(even in open water) as they propagate from theship, these waves are considered to be insignifi-cant and will not be addressed further.
Propeller washDuring vessel passage the bottom and sides
of a channel may be subjected to a propeller-drivenwater jet. There has been very little study of sedi-
1.0
0.8
0.6
0.4
0.2
0 10 20 30Wave Period (s)
Rel
ativ
e W
ave
Am
plitu
de
Ice Thickness, 2.0 m
1.0
0.5
0.25
Figure 3. Damping of waves at an ice edge. The waterdepth is 10 m. (From Carter et al. 1981.)
ment transport or other effects due to prop wash,and there were no data available for the GreatLakes–St. Lawrence Seaway area. Most previousstudies of the damage potential of winter navi-gation were focused on shoreline and nearshoreeffects. As a result, prop wash effects were typi-cally disregarded since they are normally limitedto areas very close to the vessel track.
In a study of the effect of vessel size on ship-related damage, Wuebben (1983a) selected em-pirical relations based on their ability to deal withthe variation in propeller jet velocity for locationswith limited depth or lateral confinement. Lack-ing any calibration data from the Great Lakes sys-tem, he was unable to provide site-specific, quan-titative predictions, but he did conclude that fullyloaded commercial vessels are easily capable ofscouring the channel bed throughout the dredgedportions of the connecting channels. He also foundthat vessel speed was by far the most importantfactor determining the magnitude of prop wash,followed by cross-sectional area and hull geom-etry. For confined channels, hydraulic interactionwith the channel boundaries requires a higherpropeller thrust to maintain open-water speed,increasing the damage potential.
Hochstein and Adams (1985b, 1986) modifiedtheir existing prop wash numerical model for ap-plication to the St. Marys River by incorporatingappropriate ship and site characteristics and trans-ferring other necessary information from earlierstudies on the Kanawha and Ohio Rivers in WestVirginia and Ohio. They concluded that the ef-fects of prop wash could not be effectively sepa-rated from backwater (drawdown) influences, sothey considered both simultaneously. Through a
4
combination of basic theory and empiricism, theyprovided a quasi-two-dimensional prediction ofvessel effects. The “quasi” prefix is used since thetwo-dimensional predictions are premised on em-pirically assumed distributions of ambient andship-affected velocities. Without collecting appro-priate field data (which they recommend), the per-formance of these assumed distributions in thecomplex, dredged channel portions of the rivercannot be accurately assessed. However, the modelhas been verified against all available Great Lakesconnecting channel data.*
In their reports Hochstein and Adams haveaccounted for the effects of ice in terms of theadded propeller thrust required to maintain speed.This was accomplished by assuming that the pro-peller jet velocity for a ship in ice increased asthe square of its equivalent open-water velocity.In their comparison of the effects of prop washfor various sizes of vessels traveling at existingspeed limits, they often found that the maximumeffects of lower-class vessels reached a maximumwhen their available horsepower was insufficientto maintain speed. Thus, the largest and most high-powered vessels could induce substantially largerpropeller-induced effects than size alone mightindicate. Quantitative, site-specific predictions ofship-induced velocity distributions across selectedriver cross sections were provided.
Drawdown and surgeWhen a vessel is in motion, even in deep wa-
ter, the water level in the vicinity of the ship islowered and the ship with it (called vessel squat).For the same ship this effect increases as the ves-sel speed increases or as the water depth decreases.When a ship enters a confined water, there is aconsiderable change in flow patterns about thehull. The water passing beneath the hull must passat a faster rate than in deep water, and as a resultthere is a pressure drop beneath the vessel, whichincreases vessel squat. In a channel that is restrictedlaterally, this effect is further exaggerated.
There is, however, another problem associatedwith the water level drop caused by the move-ment of a ship in confined waterways. The waterlevel drop becomes, in effect, a trough extendingfrom the ship to the shore and moves along thechannel at the same velocity as the ship. As theship size or speed increases, this moving trough
* Personal communications, Don Williams, Detroit Dis-trict, COE.
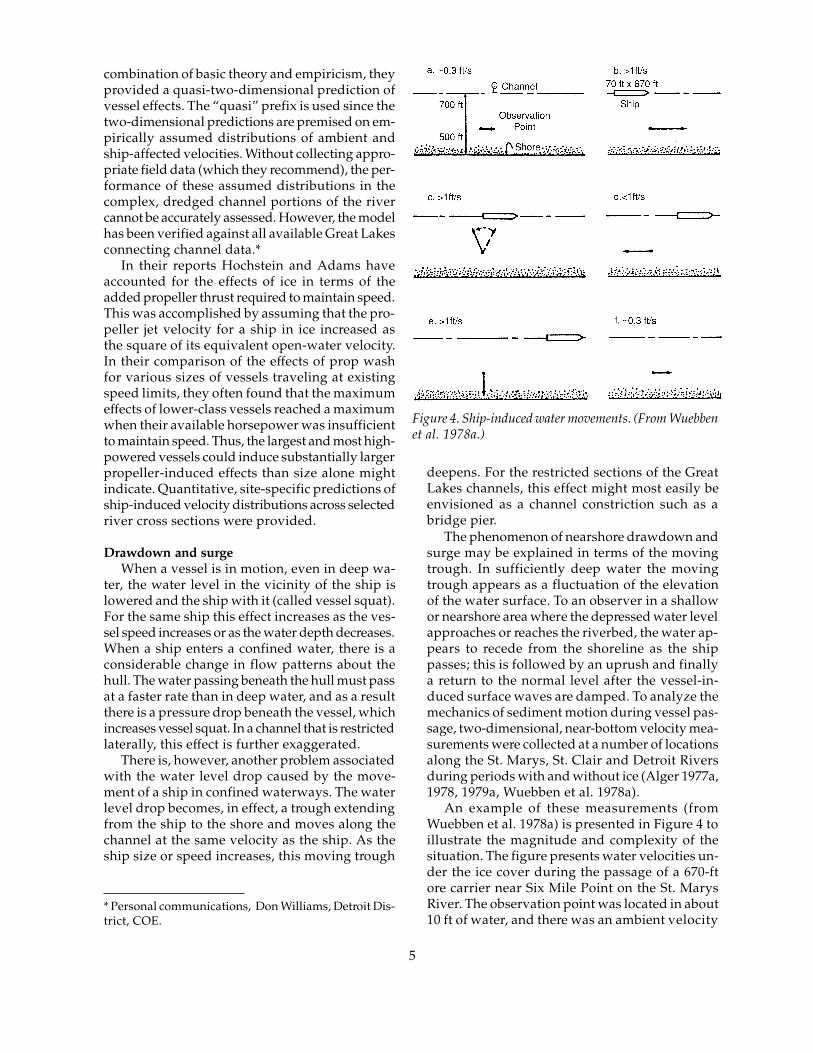
Figure 4. Ship-induced water movements. (From Wuebbenet al. 1978a.)
deepens. For the restricted sections of the GreatLakes channels, this effect might most easily beenvisioned as a channel constriction such as abridge pier.
The phenomenon of nearshore drawdown andsurge may be explained in terms of the movingtrough. In sufficiently deep water the movingtrough appears as a fluctuation of the elevationof the water surface. To an observer in a shallowor nearshore area where the depressed water levelapproaches or reaches the riverbed, the water ap-pears to recede from the shoreline as the shippasses; this is followed by an uprush and finallya return to the normal level after the vessel-in-duced surface waves are damped. To analyze themechanics of sediment motion during vessel pas-sage, two-dimensional, near-bottom velocity mea-surements were collected at a number of locationsalong the St. Marys, St. Clair and Detroit Riversduring periods with and without ice (Alger 1977a,1978, 1979a, Wuebben et al. 1978a).
An example of these measurements (fromWuebben et al. 1978a) is presented in Figure 4 toillustrate the magnitude and complexity of thesituation. The figure presents water velocities un-der the ice cover during the passage of a 670-ftore carrier near Six Mile Point on the St. MarysRiver. The observation point was located in about10 ft of water, and there was an ambient velocity
5
of about 0.3 ft/s. The direction of the near-bottomwater motion rotated 360° during the event, withvelocities in all directions significantly greater thanthe ambient downstream current. Numerous otherdata sets for the variation of water level and ve-locity are available in the reports by Alger (1977a,b,1978, 1979a,b). Nearshore drawdowns of up to 3ft have been measured on the connecting chan-nels (USACE 1974, Wuebben 1978), but the high-est recorded values have been for large vesselsapproaching or exceeding the speed limits. A fieldstudy of drawdown and surge on the St. LawrenceSeaway (Normandeau Associates 1979) docu-mented no drawdown events greater than 2 in.and felt that no reasonable correlation with ves-sel parameters was possible.
Ice effectsIn a study of the effects of winter navigation
on shoreline erosion and dock damage (USACE1974), continuous recordings of water level fluc-tuations were collected at various sites along theSt. Marys River. While the ship- and wind-gen-erated waves were well defined in the open-wa-ter recordings, they were undetectable for peri-ods with ice cover, indicating total damping. Incontrast, ship-generated drawdown and surgewere undamped and apparently even enhanced.
From data at an individual site, the authorswere able to get a reasonable correlation betweenmeasured drawdown values and an estimate ofthe drag force on a ship hull (USACE 1974). Atone site on the mainland shore of Lake Nicolet,ship passages were monitored during open-water conditions, early ice (0.3–0.5 ft) and mid-winter ice (1–1.3 ft). Although a comparison ofthe drawdown and surge among these three con-ditions is somewhat limited by the relatively fewdata points (22) and the scatter inherent in mak-ing such measurements, their parameterizationtechnique indicates that a drawdown of 0.4 ftduring open-water conditions might be increasedby about 40% during periods with ice. The datadid not indicate any clear difference with increas-ing ice thickness.
Hodek et al. (1986) also examined the effect ofice on the magnitude of drawdown. Although theflexure and cracking of an ice cover would dissi-pate some energy, they felt that the primary ef-fect of an ice cover would be to decrease the areaavailable for flow and thus increase the magni-tude of drawdown. On that basis, smaller crosssections would be more severely affected by icesince the same thickness of ice would constitute
a larger percentage of the water area in more-confined channel reaches. The numerical modelaccompanying their report accounts for both achange in vessel effects with the presence of iceand with increasing ice thickness. For one exam-ple given, a 1-ft open-water drawdown wouldbe increased as much as 33% for 18 in. of ice. Forthe same ice condition, the percentage increase indrawdown would increase as ship speed increased.
Analysis of drawdownMost analytical and predictive work on draw-
down in the Great Lakes connecting channels hasemployed a one-dimensional approach. Althougha multi-dimensional treatment would providemore detail, especially in regard to water veloci-ties, there are insufficient data to calibrate or vali-date an expanded treatment. Fortunately field data(Wuebben et al. 1978a) show that the magnitudeof drawdown is relatively constant over most ofthe channel cross section during vessel passageand that a one-dimensional treatment predicts thisvalue within acceptable accuracy (Alger 1977a,Wuebben 1983a, Hodek et al. 1986).
If the channel cross section is not symmetricalor the ship passes closer to one shore, the one-dimensional results can be improved by assum-ing that no water crosses the sailing line so thatthe section may be split into separate pieces forcalculation (Wuebben 1983a, Hodek et al. 1986).For highly non-uniform flow distributions or com-plex channel shapes, empirical cross-section shapefactors can also be included, but these are highlysite specific and cannot be reliably transferred else-where (Wuebben 1983a). The distribution of ve-locities and sediment transport potential acrossa river cross section cannot be directly consid-ered, however. Previous work has generally usedthe existing field database to develop shore andshore structure damage criteria that can be em-pirically correlated to one-dimensional modeling(Wuebben 1981b, 1983a, Wuebben et al. 1984,Hodek et al. 1986).
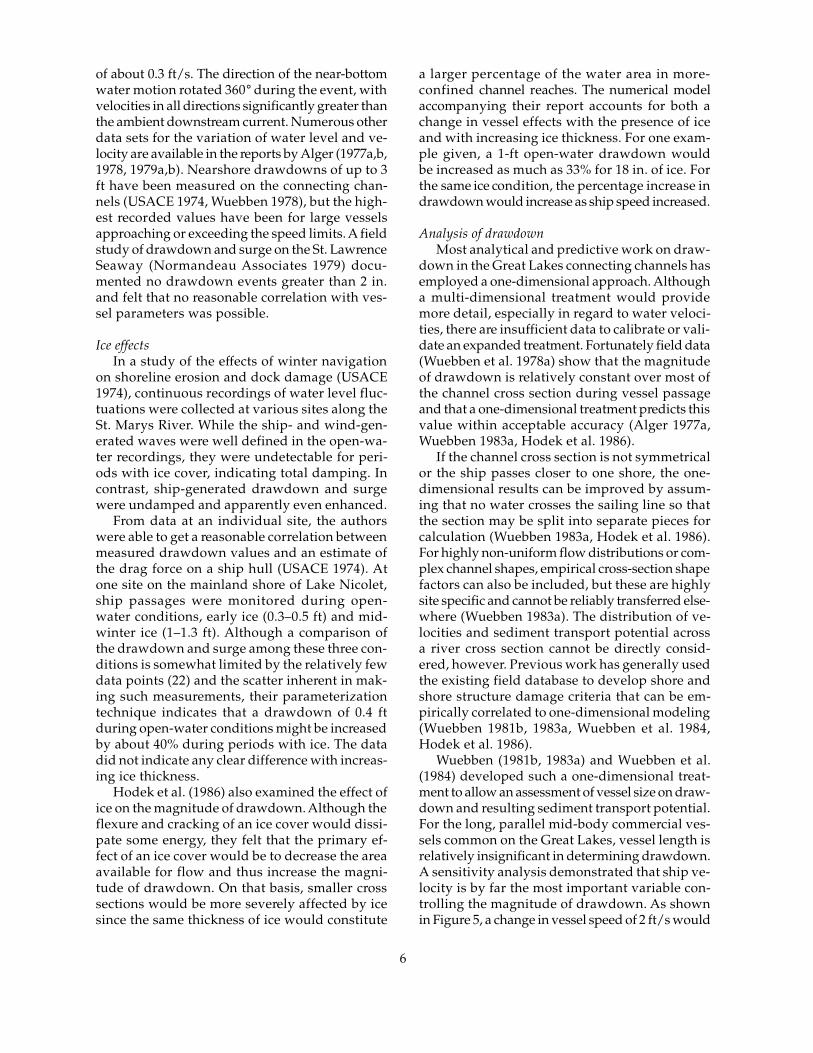
Wuebben (1981b, 1983a) and Wuebben et al.(1984) developed such a one-dimensional treat-ment to allow an assessment of vessel size on draw-down and resulting sediment transport potential.For the long, parallel mid-body commercial ves-sels common on the Great Lakes, vessel length isrelatively insignificant in determining drawdown.A sensitivity analysis demonstrated that ship ve-locity is by far the most important variable con-trolling the magnitude of drawdown. As shownin Figure 5, a change in vessel speed of 2 ft/s would
6
bidity, an estimate of the surge (increase in waterlevel) that often follows the drawdown phase, andan estimate of shore structure damage potentialfor basic structural categories were included. Theyalso found that drawdown is very sensitive tothe position of a vessel within the channel. Thecapability to predict the magnitude of the surgethat follows the drawdown phase is importantin evaluating whether an onshore bluff will beattacked or whether nearshore flooding duringhigh-water periods will be exacerbated, whereasthe values of turbidity are significant in the po-tential for biological impacts.
Hochstein and Adams (1985b) adapted a modelthat considers drawdown and the effects of pro-peller wash to the St. Marys River. A subsequentreport (Hochstein and Adams 1986) added treat-ment of ship-generated waves. Their model is at-tractive for assessing environmental effects in thatit makes quantitative predictions of the distribu-tion of water velocity, suspended solids and bedload across a river cross section based on propwash, waves and drawdown. The numerical for-mulation they employed is a quasi-two-dimen-sional treatment in that it conducts hydraulic cal-culations in one dimension and then superimposesassumed distributions for the cross-channel vari-ations of both ambient and ship-influenced flowvariables. While in simple channel shapes this ap-proach may provide useful additional detail, ex-tension to the complex channel shapes and flowdistributions present in the St. Marys River is un-
be more significant than a 10-ft change in vesselbeam, vessel draft or channel depth. The basiccase in Figure 5 is a ship with a 25-ft draft and100-ft beam traveling in a rectangular channel 35ft deep and 2000 ft wide. The ship velocity rela-tive to the water is 12 ft/s. This corresponds tothe central point on Figure 5.
Vessel speed and water velocity are of equalimportance in the calculations, but due to itsgreater range of variation, vessel speed is moresignificant in practical applications. An increasein vessel draft is more significant than an equalincrease in beam simply because it geometricallyadds more cross-sectional area to the ship. Simi-larly, an increase in water depth (with dischargeunchanged) would more than offset the cor-responding increase in allowable draft since theincrease in flow area across the river is much largerthan the change in the wetted area of the ship.The net effect is a decrease in the blockage of thechannel.
Hodek et al. (1986) and Alger and Hodek (1986)further refined the one-dimensional approach anddeveloped an interactive, user-friendly programthat could be run on a desktop computer system.This model allows rapid computation and com-parison of various scenarios of fleet mix and sitecharacteristics. The database for ship effects wasconsiderably expanded by monitoring hydraulicconditions at five new sites on the St. Marys Riverin addition to those documented under previousstudies. New topics such as vessel-generated tur-
Figure 5. Effects on drawdown due to changes in variables from a basiccase.
7
certain. However, the Hochstein and Adams modelshould provide an improved basis for compari-son of various vessel frequency scenarios. Thismodel was subsequently modified by personnelfrom the Detroit District to allow input of mea-sured ambient velocity distributions, but thehydraulic calculations remain one dimensional.Treating ship effects in two dimensions is impor-tant due to significant variation in ship-inducedwater velocities across a river cross section. Thisvariation must be accounted for in predicting mag-nitudes of sediment transport, turbidity and im-pacts on biological systems.
Data from a prior study on the Kanawha Riverin West Virginia (Hochstein and Adams 1985a)were compared with predicted values, but the re-sults are not presented in two-dimensional form.Further, no information is given on river or shipcharacteristics or the location of the samplingpoints, so the feasibility of transferring velocitydistributions and parameter values developedthere to a Great Lakes connecting channel is un-clear. Lacking a complete, two-dimensional setof field data on the variation of ship-induced watervelocities and sediment movement on the St.Marys River (which they strongly recommendedobtaining), the performance of the model cannotbe definitely assessed. It was, however, calibratedagainst the available data on ship-generated draw-down and waves. The model was also applied tochannels in Duluth–Superior Harbor* and resultedin predictions of sediment suspension of the sameorder of magnitude as the field data of Stortz andSydor (1980).
In summary, the major hydraulic effects of ves-sel passage during periods of ice include propel-ler wash and drawdown and surge. Ship-inducedwaves were found to be quickly damped by anice cover and thus unimportant. In contrast, pro-peller wash and drawdown can be increased dueto the need for greater thrust to overcome the re-sistance of ice and the reduction of open cross-sectional area by the ice. Several models have beendeveloped for or adapted to the Great Lakes con-necting channels for predicting vessel-induceddrawdown, providing both one-dimensional andtwo-dimensional predictions. The two-dimen-sional approach also considers ship waves andpropeller wash effects. These models provide acapability to develop system-wide predictions ofvessel effects, not only for existing navigation
* Personal communication, Don Williams, Detroit Dis-trict, COE.
scenarios but more importantly for scenarios con-sidered for possible future implementation wherefield documentation is not possible.
Sediment transportand shoreline erosion
The potential for shore damage due to draw-down is a direct function of the ship-inducedchange in hydraulic conditions that can initiatesediment transport or increase transport rates. Forsediment transport to occur, near-bottom ornearshore water velocities must overcome a sedi-ment particle’s resistance to motion. Three modesof transport of granular bottom sediments havebeen observed during vessel passage (Wuebbenet al. 1978a). They are
• Bed load, which is typified by a pattern ofslowly migrating sand ripples on the river-bed;
• Saltation load, the movement of individualgrains in a series of small arcs beginning andending at the riverbed; and
• Explosive liquefaction, in which bottom sedi-ment is rapidly suspended due to a rapidchange in the soil pore-water pressure gra-dient.
Bed load is the most commonly observed trans-port mode, with a progression to saltation andliquefaction for events with larger, faster ships.
For the cohesive sediments that are widely dis-tributed in the Great Lakes system, disrupted sedi-ments typically go directly into suspension, wherethey can remain for extended periods. Hodek etal. (1986) and Liston and McNabb (1986) madefield measurements of turbidity and light extinc-tion profiles under both ambient and ship-influ-enced conditions on the St. Marys River. Accord-ing to Hodek et al. (1986), during open-waterperiods, turbidity develops due to wind-drivenwaves acting on clay bluffs and the nearshore ri-verbed. For waves on the order of 6 in. or morein height, they observed that a high level of tur-bidity may develop, extending from the shore tothe navigation channel, and no increase in tur-bidity could be detected during ship passageduring periods of wind-driven waves. In the ab-sence of wind-driven waves, they stated that near-shore turbidity develops with the passage of eachvessel. This topic is discussed further in the sec-tion dealing with biological effects.
As discussed previously, a drawdown andsurge event can cause water movements in all di-rections, so that sediment transported in one di-rection may be offset during an opposing current.
8
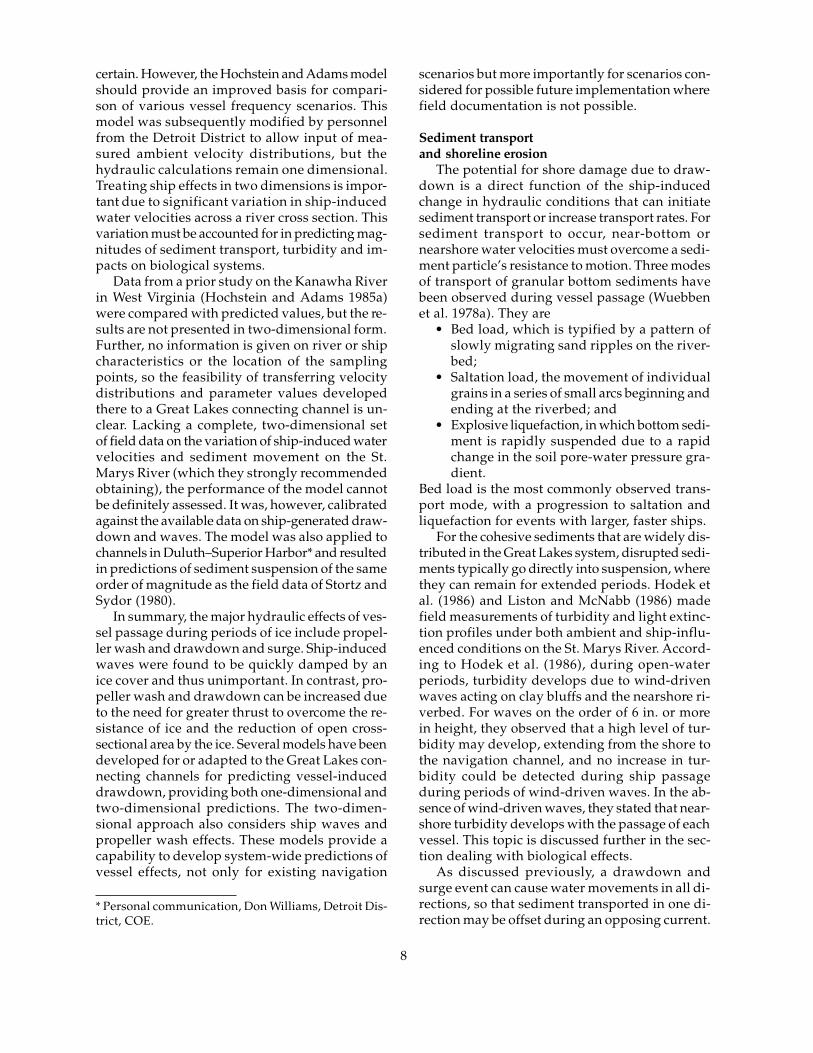
sage presented in Figure 6, so that all transportshould be ship induced. The direction of net trans-port has been found to be sensitive to the charac-teristics of a specific site, the vessel direction andthe magnitude of the drawdown event. In thiscase the net transport was primarily upstream andslightly offshore, as indicated by the vector R inFigure 6.
Further data on sediment transport duringvessel passage can be found in Alger (1978,1979a,b) and Hodek et al. (1986). The data analy-sis by Hodek et al. showed that downbound shipscaused much less sediment transport thanupbound vessels at comparable drawdowns. Italso showed that upbound vessels creating a draw-down of 6 in. or less cause relatively little distur-bance. For data indicating net transport, 83% ofupbound ships and 70% of downbound shipscaused net offshore movement.
However, natural currents, a sloping bottom andthe intensity and duration of vessel-generatedcurrents can combine to cause net transport inalmost any direction. Figure 6 shows velocity andstage measurements for a vessel passing Nine MilePoint on the St. Marys River at 10 mph (Alger1978). In the velocity graph the axes define themagnitude of water velocity with time, while thedirection of water movement at any particulartime is indicated by the superimposed arrow.
Sediment transport was also measured dur-ing that event using an array of four traps ori-ented in 90° increments. The traps had been setfor a 20-minute period prior to vessel passage,and no sediment was collected in any of the traps.On a different date the traps were set during aperiod with wind-driven waves of about 1-ftamplitude, and all traps collected some sediment.There were no wind waves during the vessel pas-
Figure 6. Velocity, water surface elevation and sediment movement measure-ments during vessel passage. (After Alger 1978.)
9
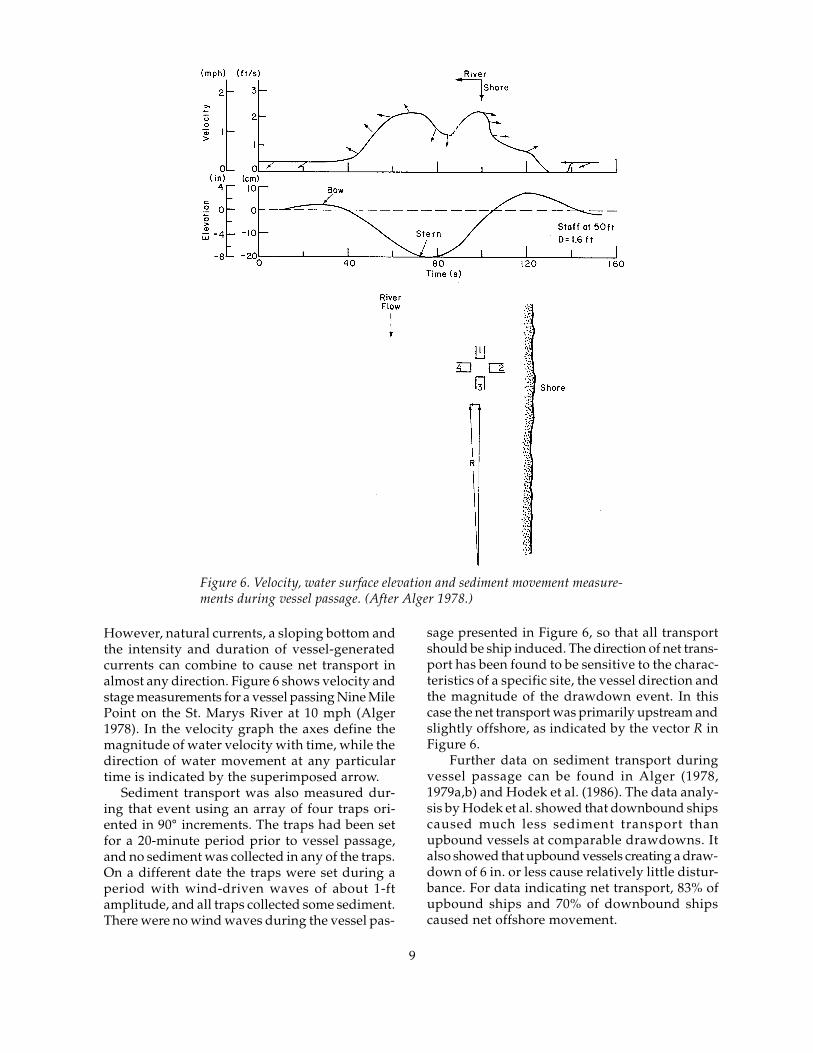
ral and ship-induced hydraulic forces are free toact on the low bluff on the waters edge during ahigh-water period. This bluff is frequently con-sidered to be the shoreline by many propertyowners. If the water level were lower, the waterwould not act directly against this “shore” buton the mildly sloping beach below. Persistenterosive forces might eventually erode back to thebluff, but in the interim the rate of material losswould be less since the mild sloping beach woulddissipate the energy more efficiently.
In addition to the lack of predictability for shipwaves discussed earlier, there is almost no in-formation available to examine their ability tocause sediment movement. Wuebben et al. (1984)assumed that ship waves were similar to wind-driven gravity waves, so that coastal sedimenttransport theory could be applied. This assump-tion is reasonable in deep water, but the validityof its extension to shallow nearshore zones is un-certain. Wuebben then used information presentedin the Shore Protection Manual (USACERC 1984)to propose a nearshore wave height of 0.5 ft as acriterion for the onset of sediment motion. De-pending on the depth of nearshore water, lowerwave heights could indeed cause transport, butdue to the oscillatory nature of water movementin waves, motion does not necessarily imply ero-sion. In addition, the criterion assumes a sandbed system, and no information was found to dealwith the cohesive sediments that are widespreadin the Great Lakes system. Since cohesive sedi-ments and materials larger than sand are moreresistant to erosion, any error would be on theconservative side, and predictions could be tem-pered with engineering judgment. While this cri-
terion is somewhat arbitrary, it did providea useful tool for locating potential damagesites. However, for winter navigation, ship-generated waves are of negligible impor-tance because they are nearly immediatelydamped by ice.
Hochstein and Adams (1985b) adapteda model that considers both drawdown andthe effects of propeller wash to the St. MarysRiver. They noted that bottom disturbanceis a function of distance from the propelleraxis to the bottom and that disturbances aregreatest in channel bends and reaches wherecrosswinds force vessels to crab their sail-ing line. Using a combination of basic theoryand empiricism, their model produces two-dimensional distributions of water veloci-ties. It was then assumed that sediment trans-
Figure 7. Relation of water level to a shore profile on the St.Marys River. (From Wuebben 1983a.)
Damage criteriaA major problem in setting damage criteria is
in defining levels of ship-induced effects that areeither undesirable or unacceptable. It cannot berealistically required that ships cause no sedimentmotion, even if it were possible to accurately pre-dict the transient, ship-induced threshold of mo-tion in the large, irregularly shaped channels con-sidered. Small sediment dislocations should notnecessarily be considered damaging, particularlysince natural currents, waves, recreational boat-ing and other factors are often more significant.
At the other extreme, ships may cause largewater-level fluctuations and currents that wouldcause unacceptable levels of sediment transport,shoreline erosion and structural damage, as wellas affecting recreation and personal safety. Be-tween these extremes the increase in significanceof ship effects is gradual, so it is difficult to de-fine a precise threshold where the effects becomeunacceptable. Any criterion must consider site-specific conditions of shoreline geometry and com-position, vessel speeds and water levels. Predic-tions of vessel effects are most often premised onexisting speed limits, but if these limits are notobserved, these effects can be severely underes-timated. Since drawdown increases as the squareof ship velocity, ship effects can increase rapidlyfor small increments above those speed limits. Incontrast, properly developed and enforced speedlimits could effectively eliminate ship-induceddamages.
The water level is another important variablein determining vessel effects, and it cannot be to-tally controlled. As shown in Figure 7 for a typi-cal shore profile on the St. Marys River, both natu-
10
port equations developed for gravity-driven flowscould be applied to these calculated velocity dis-tributions. This assumption may not be strictlycorrect but definitely necessary given the state ofthe art.
For two sites on the St. Marys River, they pre-dicted velocities, bed loads and suspended sedi-ment concentrations for several vessel classes.They did not attempt to discriminate betweenevents causing or not causing a level of unaccept-able transport, but they did compare vessel ef-fects in terms of kinetic energy density (one-halfof the square of net ship-induced velocity). It isnot clear how the kinetic energy of individual shippassages can be summed to provide a season-longestimate of the potential for sediment movement,but it is used here to compare the cumulative ef-fects of different fleet mixes and navigation sea-son durations.
In general, they found downbound vessel pas-sage to be more damaging, since ships are typi-cally loaded passing downbound and light pass-ing upbound. In comparing the relative effectsof ships in open water, a continuous broken icecover and sheet ice, they concluded that propel-ler wash effects also increase in that order sinceincreasing propeller thrust would be required tomaintain speed. They also concluded that thenewer, 1000-ft vessels had a potential for dam-age four to nine times higher than smaller exist-ing vessels due to higher horsepower, twin pro-pellers and greater possible draft. The lower num-ber represents open-water sailing, the latter witha solid ice sheet.
In developing a damage criterion for vessel-induced drawdown, Wuebben et al. (1984) adapt-ed non-scouring velocity criteria from the open-channel-flow literature for the various classes ofsoils found in the Great Lakes connecting chan-nels. Since drawdown is the ship effect that canbe predicted with the best accuracy, these scourcriteria were then correlated to field data on themaximum ship-induced velocities caused by givenlevels of drawdown. This allowed the use of aone-dimensional drawdown model to comparethe significance of various channel, vessel sizeand speed scenarios and to predict reaches alongthe river where the erosion potential was high.
Hodek et al. (1986) based their damage crite-ria on the level of drawdown and velocity distur-bance, the magnitude of surge, soil conditions andshore geometry. They also indicated that the de-velopment of shorefast, grounded ice would serveas a barrier to shoreline damage. In developing
their criteria, they used data on ship-induced ve-locities as well as the results of 34 measurementsof directional sediment transport. This allowedquantitative prediction of net transport and di-rection for sand-sized materials, but their actualdamage criteria were largely qualitative in na-ture. Their basis for prediction of cohesive sedi-ment transport is unclear. They classified the po-tential for damage into three categories. None tolight refers to inconsequential movement, mod-erate damage implies light transport as bedload,while severe damage is defined as a conditionwhere sediment is suspended and soils sustain-ing shallow-rooted organics may be displaced.As mentioned earlier, they found little sedimenttransport for drawdown events less than 6 in. inmagnitude and concluded that damage could beeffectively minimized by controlling vessel speedto prevent larger events.
Field studies of shoreline recessionThe first field study of shore damage in con-
nection with winter navigation on the Great Lakeswas conducted by the Detroit District on the St.Marys River beginning in 1972 (USACE 1974). Inthat study they measured waves and water levelfluctuations at four sites and repeatedly surveyedshoreline profiles at 12 sites. They observed nogouging of shorelines due to ice shoving and in-stead felt that the shore ice formations served asprotection against damage.
During a survey period from November 1972to March 1973 they noted little or no change inthe measured shore profiles. A subsequent Junesurvey indicated some erosion at most sites, witha maximum recession of about 2.5 ft for two siteson Lake Nicolet but more typically 0.5 ft or less.They observed that waves generated by small craft,particularly cruisers, were generally higher andapparently more damaging than those generatedby commercial vessels. Sites found to be experi-encing significant erosion were near Mission Point,Frechette Point, Six Mile Point, Nine Mile Point,the north shore of Neebish Island and upstreamof Johnson’s Point.
Their conclusions were that erosion of the shore-lines occurs during the traditional navigation sea-son but is minor during the extended season pe-riod. Further, they concluded that less than 5000ft of shoreline is subject to significant erosion andthat high water levels (which occurred during thestudy) are the most significant cause of erosion.
A follow-up study by the consulting firm ofDalton, Dalton, Little and Newport, Inc. (1975)
11
concluded that about 26,000 ft of shoreline alongthe St. Marys River was subject to significant ero-sion due to all causes. Of this, about 12,000 ft hadbeen protected in some way, leaving 14,000 ft un-protected. Based on data collected by the DetroitDistrict, they concluded that waves due to windand small boats were far more significant thanwaves generated by large ships. They recom-mended that eroding shorelines should be struc-turally protected to prevent erosion due to natu-ral causes. They concluded that control of vesselspeed was not important since they consideredthe significance of large ship waves to be minor.
Subsequently the U.S. Army Cold Regions Re-search and Engineering Laboratory began a se-ries of studies of the influence of ship passage onsediment transport and shoreline erosion extend-ing over several years (Alger 1977a,b, 1978, 1979a,1980, 1981, Gatto 1978, 1980a,b, 1982, Hodek etal. 1986, Wuebben 1978, 1981a,b,c, 1983a,b,Wuebben et al. 1978a,b, 1984). These studies rangedfrom field documentation to numerical model-ing of the physical effects of vessel passage onshoreline and shore structure stability.
The reports by Alger provide data from re-peated surveys of shore profiles from 1977 to 1981along the St. Marys, St. Clair and Detroit Rivers.Ten sites received detailed monitoring over a pe-riod of years, with multiple profiles at each site.Supplementary observations included documen-tation of ice conditions and water levels and ve-locities during ship passage. The maximum re-corded shoreline recession documented over a one-year interval was somewhat less than 4 ft, andfor the full period from 1976 to 1981 the maxi-mum recession was about 8 ft for a site on the St.Marys River, but most sites showed little or nochange over the full period of study. Althoughhe found that large vessel passage can producelarge hydraulic effects and cause sediment trans-port, based on these studies, Alger found no evi-dence of an increased potential for ship-inducederosion due to the presence of ice.
On the St. Marys River, Wuebben (1981a,c,1983b) reported the results of shore and shore struc-ture monitoring during two winter periods withessentially no commercial shipping. During theperiod from 15 January to 24 March 1980 therewere only eight passages (all by icebreakers), andfrom 31 December 1980 to 24 March 1981 therewere nine passages (all icebreakers except for onetanker). Under the program, shoreline profileswere repeatedly surveyed throughout the twowinters to detect any change due to natural agents.
Three river areas monitored during years withwinter navigation were selected for detailed ob-servation during the closed period. One site ex-periencing minor erosion over the course of sev-eral years showed no measurable change duringthe entire period bracketing both closed seasons.A second site previously exhibiting bluff reces-sion on the order of 1.5 ft per year continued torecede at about the same rate through the periodof study. Of the total bluff recession recorded atthis site from 1976 to 1981, the maximum reces-sion was 8 ft, with an average of about 5 ft.
The third site, despite an apparent potentialfor damage, had not experienced meaningful ero-sion during previous years of winter navigation.During the 1980 closed season, however, signifi-cant shoreline recession was noted at five of sevenprofiles at the site (0.5–2 ft). Over the 1980-81 closedseason, this site again showed little change, sug-gesting that the temporary increase in erosion mayhave been due to the relatively high water levelsduring 1979-80, which allowed water forces toact directly on the low bluffs at the water ’s edge.The shore at one of the profile locations had beenstructurally protected during the study period.During the 1980-81 closed period no furtherchanges were noted. The data collected duringextended season navigation (Alger 1977a,b, 1978,1979a) and the limited observations during peri-ods closed to navigation do not provide evidenceof increased erosion due to navigation in ice onthe St. Marys River.
Gatto (1978, 1980a,b, 1982) reviewed the shore-line characteristics and historic shoreline reces-sion rates for the St. Marys, St. Clair and DetroitRivers. Most of this information has been incor-porated into the final 1982 report. The specificobjectives were to document bank conditions anderosion sites along the rivers, to monitor and com-pare the amounts of winter and summer bankrecession and change, and to estimate the amountof recession that occurred prior to winter navi-gation. An analysis of historical air photos showedthat bank recession was active prior to winternavigation along the St. Marys, St. Clair and De-troit Rivers and was active without winter navi-gation on the St. Lawrence River.
An extensive field program was conducted toinventory shoreline characteristics in terms of soiltypes, shore geometry and the presence and typeof vegetation and shore protection structures(Gatto 1982). Three hundred and forty-five milesof river shoreline were observed and photo-graphed at least twice yearly from 1977 through
12
channels and harbors. Further, structures designedfor commercial use are typically able to withstandforces in excess of those generated by the abovemechanisms. This leaves privately owned struc-tures, such as docks, boathouses, boat hoists, etc.,as the structures most likely to experience dam-age. The majority of these private structures areof lightweight construction sufficient to serve theirsummertime function but not necessarily engi-neered to withstand the load potential of winterice.
Ice conditions within the Great Lakes system,even without winter shipping, have always sub-jected these small structures to forces capable ofdamage, but over time, construction techniquesevolved to provide structures that were generallycompetent to withstand the local ice conditions.The degree to which the shore structures of theGreat Lakes system may be damaged by ice variesgreatly according to the manner of ice action. Win-ter navigation, by disrupting the normal ice covercharacteristics, may aggravate any natural ice-re-lated damage. Ice effects on structures typicallyfall into one of the following categories:
• Static ice forces, which arise from a struc-ture in contact with an ice sheet subject tothermal expansion and contraction or steadywind or water drag forces;
• Dynamic horizontal ice forces, which arisefrom ice sheets or floes that move against astructure due to water currents or wind; or
• Vertical ice forces, which arise from a changein water level and require the adhesion offloating ice to structures.
For small structures within the connecting chan-nels, dynamic horizontal and vertical forces aretypically the critical modes of ice action.
Dynamic horizontal ice forcesDepending on the size and strength of an ice
floe, the horizontal force exerted on a structuremay depend on the strength of an ice sheet andits failure mode (bending, crushing or shear) orthe magnitude of the force driving the ice sheet(wind or water current). With a vertical pile orstructure face, failure of the ice sheet usually oc-curs by crushing. Current Association of StateHighway Transportation Officials standards em-ploy a crushing strength of ice of 400 psi, whilethe Canadian bridge design code provides for“effective ice strength” values ranging from 100to 400 psi. Thus, if there is sufficient driving forcefor the ice sheet, a pile subjected to horizontal iceloads would have to be strong indeed.
1980, with any visible signs of recent erosion noted.Banks were found to be eroding along 21.5 miles(6.2%). The erosion along approximately 15 of the21.5 miles (70%) was occurring along reaches notbordering winter navigation channels. The resultsof the twice-yearly surveys did not conclusivelyindicate whether or not winter bank erosion wasmore or less than that occurring during the sum-mer. Along most of the reaches, the degree of ero-sion appeared to remain the same over the win-ter and summer.
On the St. Lawrence Seaway a study was con-ducted to determine the nature and extent, if any,of shoreline erosion during the winter season toserve as a database in the event that the naviga-tion season was extended there (Palm 1977a,b,Palm and Cutter 1978). They developed a classi-fication system to define the potential for shore-line erodibility based on soil type, slope, vegeta-tion and potential for ice action. They estimatedthat 28.6 miles of shoreline could be impacted byan extended navigation season, or 7% of the shore-line length evaluated. Of 8250 ft considered tohave a potential for high impact, 6200 ft was classedas highly erodible. They also monitored 12 shore-line sites to document any ongoing erosion. Al-though some slumping of bluffs was noted, nogeneral recession of the shore profiles was evi-dent during the winter season.
In summary, although various analyses of vesseleffects have concluded that there is a potentialfor shoreline erosion, field surveys and reviewsof historical records have not supported that con-clusion. For the most part, erosion rates due toany cause have been minor, and a comparison oferosion rates during years with and without winternavigation shows no appreciable difference. Bothone- and two-dimensional models have been de-veloped to examine sediment transport causedby drawdown and surge, and the two-dimensionaltreatment also considers propeller-induced trans-port. All of these models have a strong empiricalcomponent due to the complexities of vessel ef-fects and their interaction with details of the riverchannel geometry and flow.
Shore structure damageDamage to shore structures can occur due to
water currents, water level fluctuations or ice ac-tion, either alone or in combination with vesseltraffic. Since ship effects extend over a limitedarea surrounding the ship, the potential for ves-sel-related damage is primarily limited to areasnear the shipping tracks, such as the connecting
13
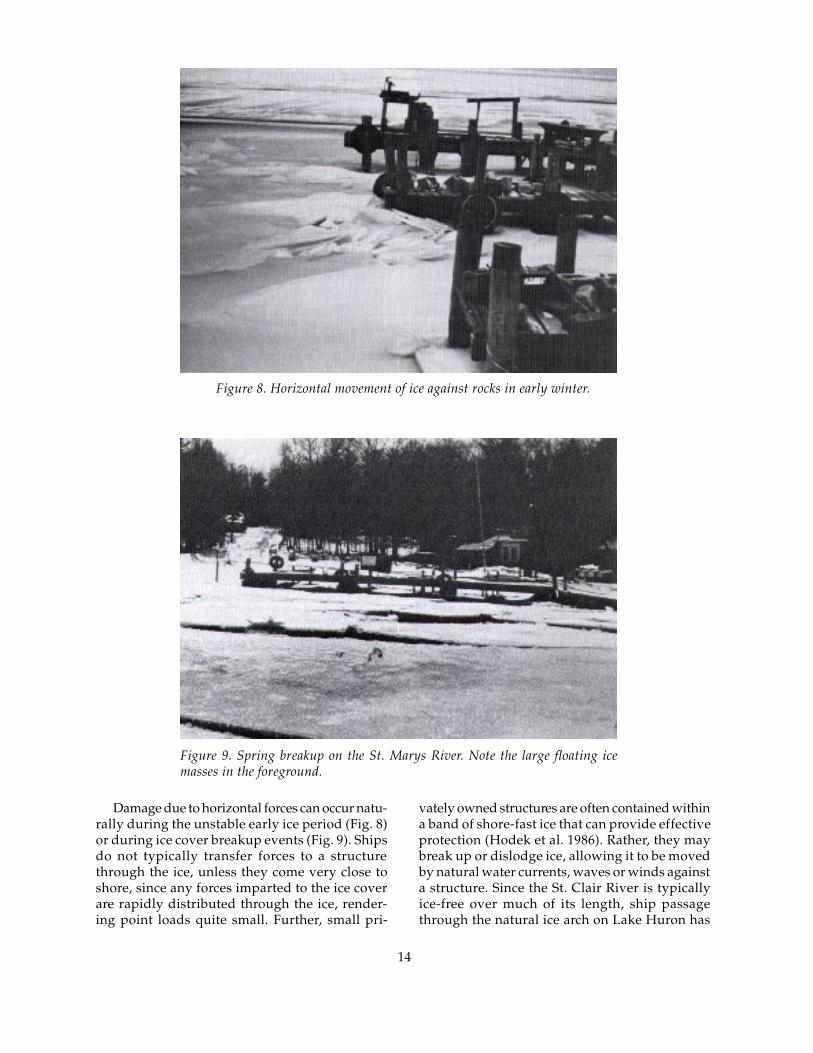
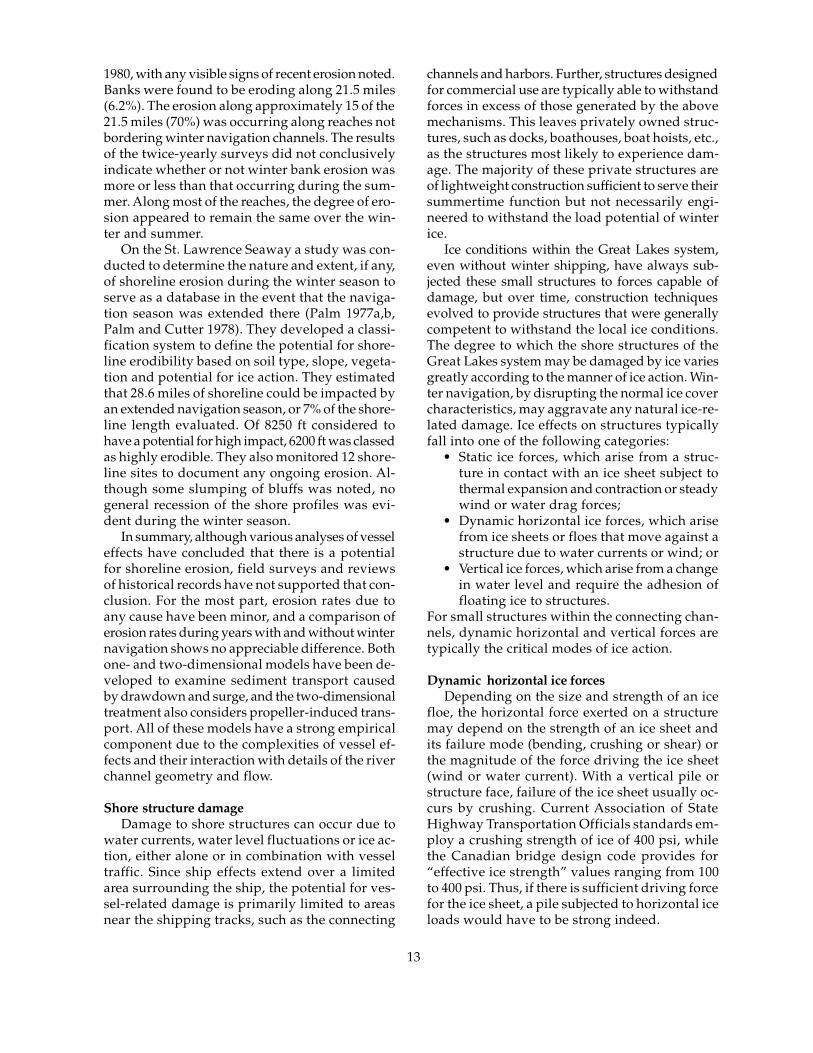
Figure 9. Spring breakup on the St. Marys River. Note the large floating icemasses in the foreground.
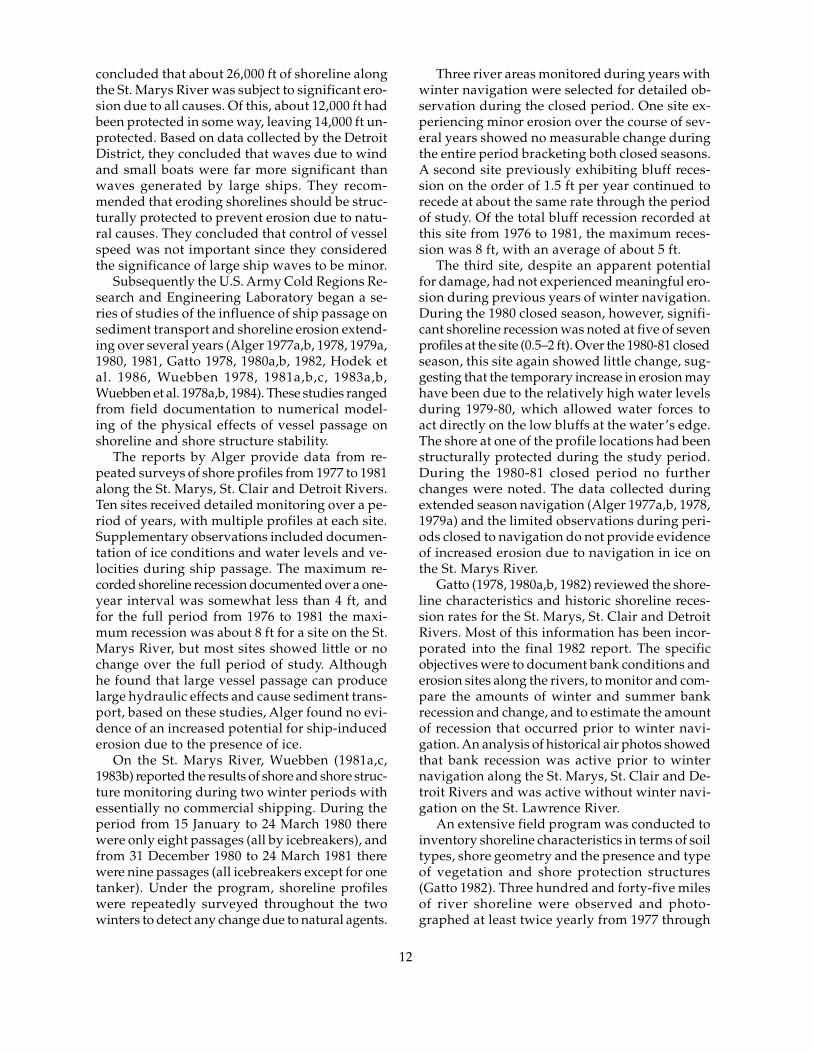
Figure 8. Horizontal movement of ice against rocks in early winter.
vately owned structures are often contained withina band of shore-fast ice that can provide effectiveprotection (Hodek et al. 1986). Rather, they maybreak up or dislodge ice, allowing it to be movedby natural water currents, waves or winds againsta structure. Since the St. Clair River is typicallyice-free over much of its length, ship passagethrough the natural ice arch on Lake Huron has
Damage due to horizontal forces can occur natu-rally during the unstable early ice period (Fig. 8)or during ice cover breakup events (Fig. 9). Shipsdo not typically transfer forces to a structurethrough the ice, unless they come very close toshore, since any forces imparted to the ice coverare rapidly distributed through the ice, render-ing point loads quite small. Further, small pri-
14
Figure 10. Series of finger piers damaged by ice jacking.
lifts the pile from the soil, and the void under thebottom tip of the pile fills in. When the water leveldrops, the weight of the ice is supported by theskin friction and point bearing of the pile. Sincethe pile is not driven into the soil as easily as it ispulled out, if the water level continues to drop,the ice will break and the ice sheet will drop rela-tive to the pile. The ice may then refreeze to thepile but at a lower position on the pile. This pro-cess occurs in cycles throughout the winter, gradu-ally “jacking” the pile completely out of the soil.Figure 10 shows a series of finger piers damagedby ice jacking.
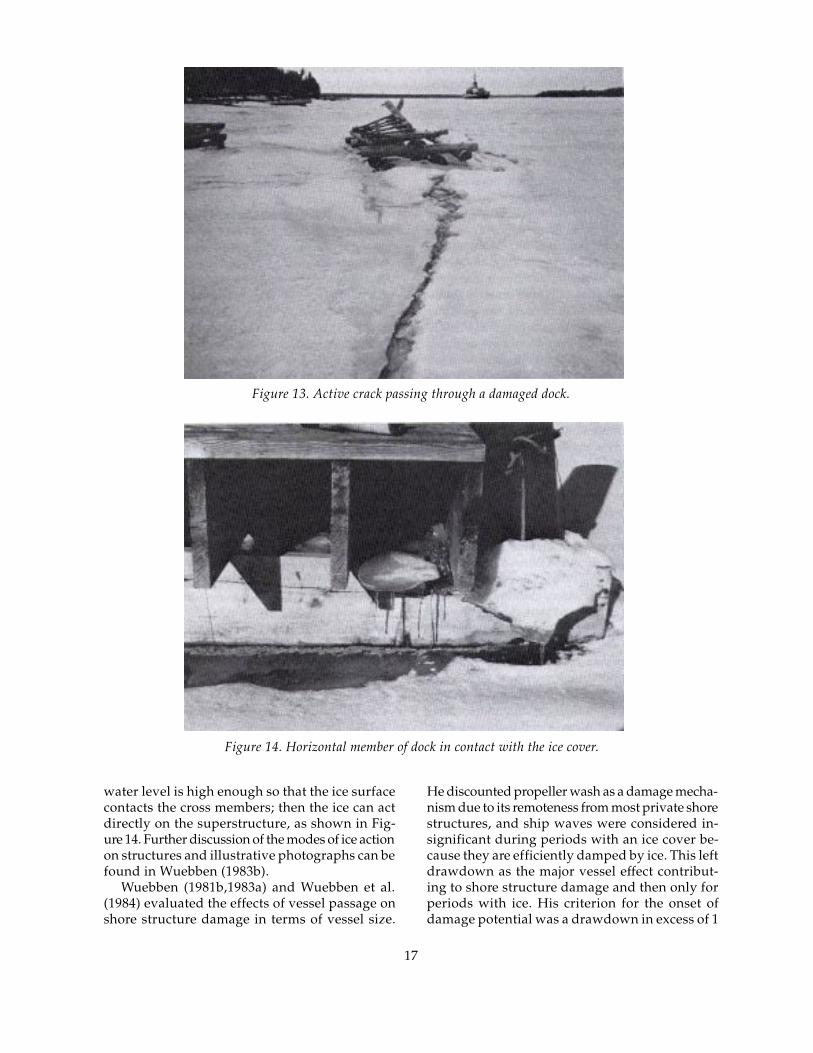
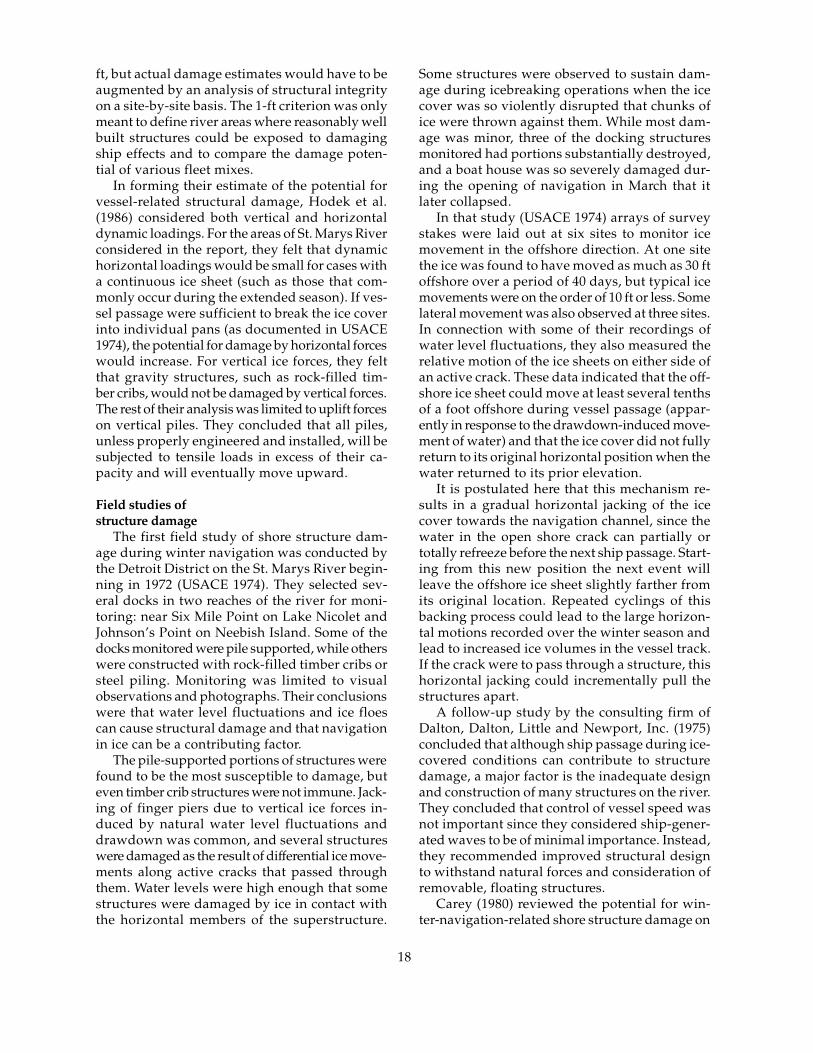
With moderate water level fluctuations of suf-ficient frequency, cracks in the ice sheet aroundstructures may not refreeze, and a permanentlyopen, active crack may result (Fig. 11). This crackmay serve as a vertical force release mechanism.One method of structure protection that takes ad-vantage of this concept is to surround a structurewith pile clusters, as in Figure 12, that resist up-lift and force an active crack to form around it. Ifthe crack passes through a dock, if the water levelfluctuations are large or infrequent, this protec-tive mechanism is lost (Fig. 13).
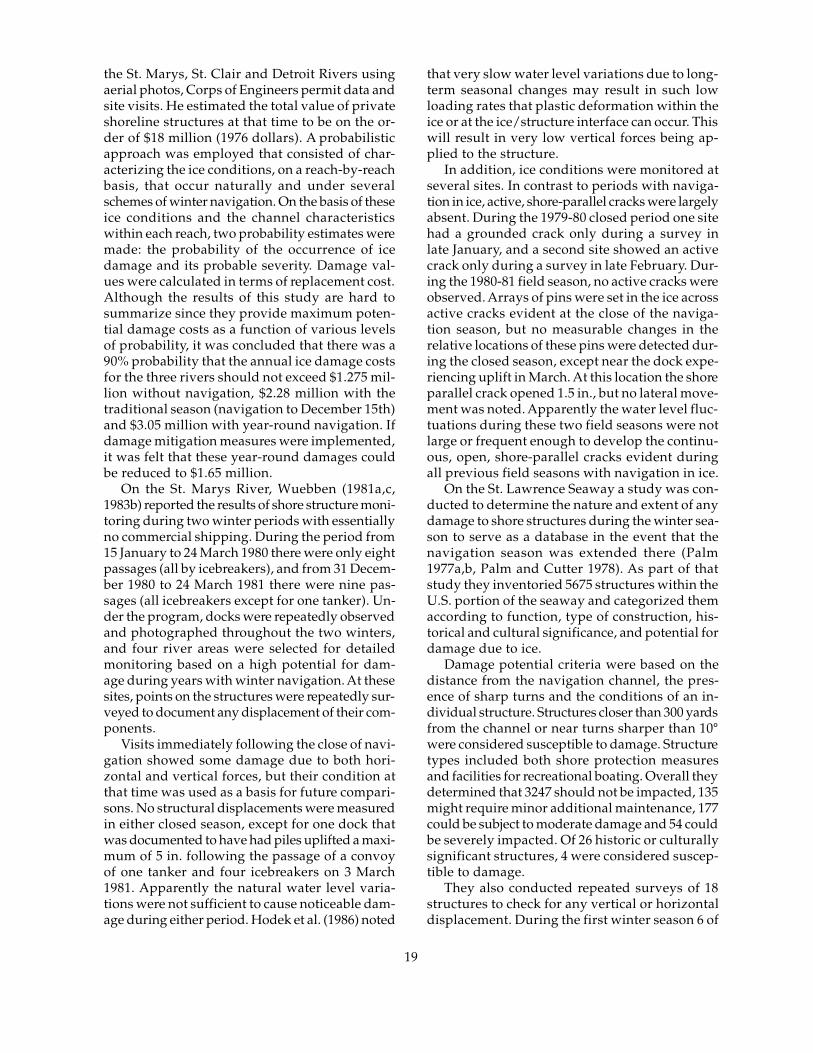
If piles resist uplifting, continuing water levelfluctuations may cause the ice to break aroundthe pile, and an accumulation of ice rubble maydevelop. These accumulations can develop to thepoint where they damage the horizontal mem-bers of a dock. Docks can also be damaged if the
the potential to cause damage if it destroys thearch, causing an ice run. However, this arch hasalso been disrupted naturally during periods withhigh winds. Vessels could also influence horizontalice loading if they generate significant drawdownand surge, since the associated water movementscan exert drag forces on the underside of an icecover, leading to horizontal forces on an ice-boundstructure.
Vertical ice forcesA major source of damage is the vertical move-
ment of an ice sheet. On any large body of waterthe water level constantly fluctuates. Coastal varia-tions are primarily due to tides, while on largelakes, barometric pressure fluctuations, wind set-up, runoff and seiche action contribute. Duringperiods of open water the normal fluctuations arerelatively harmless. In conjunction with an icesheet that is firmly attached to the structures, thesefluctuations can exert large vertical forces throughthe floating ice cover. For the confined channelareas of the Great Lakes, the drawdown and surgegenerated by vessel passage can be a major fac-tor.
The structures that typically suffer the mostdamage are light-duty pile-supported piers, suchas those constructed for pleasure boaters. Designedfor summer activity, the support piles have verylittle skin friction resistance to an upward force.When the water level rises, the buoyant ice sheet
15
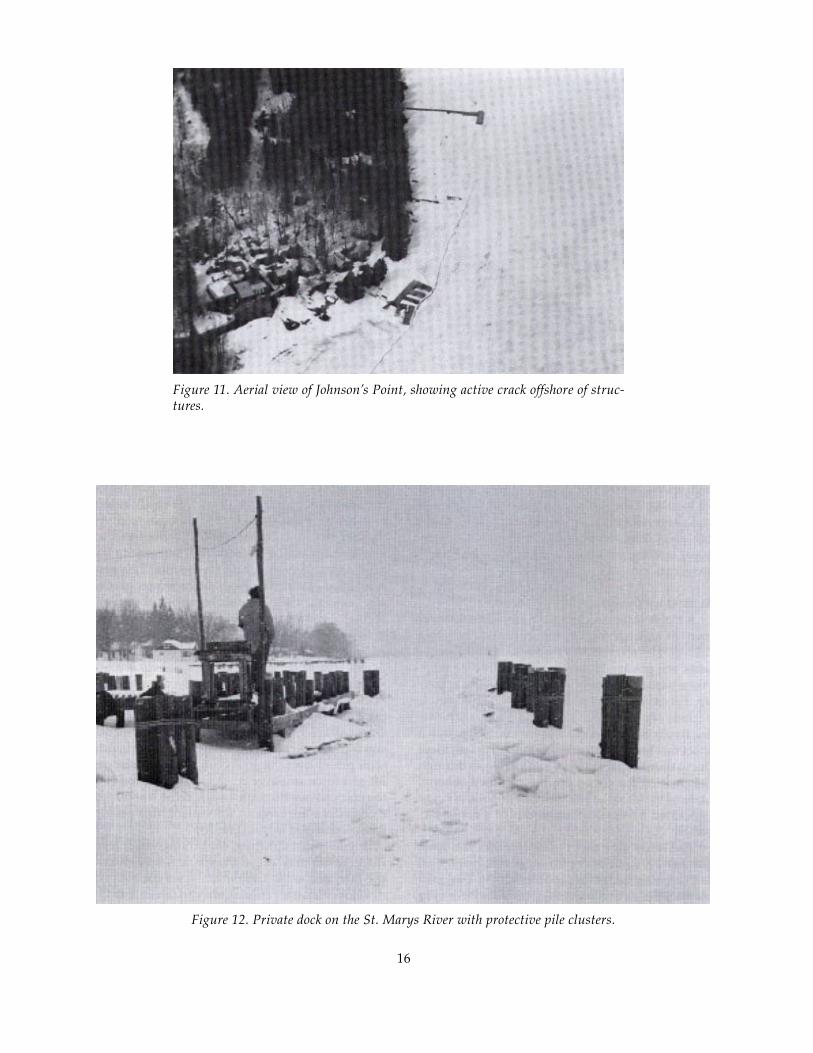
Figure 12. Private dock on the St. Marys River with protective pile clusters.
Figure 11. Aerial view of Johnson’s Point, showing active crack offshore of struc-tures.
16
He discounted propeller wash as a damage mecha-nism due to its remoteness from most private shorestructures, and ship waves were considered in-significant during periods with an ice cover be-cause they are efficiently damped by ice. This leftdrawdown as the major vessel effect contribut-ing to shore structure damage and then only forperiods with ice. His criterion for the onset ofdamage potential was a drawdown in excess of 1
Figure 14. Horizontal member of dock in contact with the ice cover.
Figure 13. Active crack passing through a damaged dock.
water level is high enough so that the ice surfacecontacts the cross members; then the ice can actdirectly on the superstructure, as shown in Fig-ure 14. Further discussion of the modes of ice actionon structures and illustrative photographs can befound in Wuebben (1983b).
Wuebben (1981b,1983a) and Wuebben et al.(1984) evaluated the effects of vessel passage onshore structure damage in terms of vessel size.
17
ft, but actual damage estimates would have to beaugmented by an analysis of structural integrityon a site-by-site basis. The 1-ft criterion was onlymeant to define river areas where reasonably wellbuilt structures could be exposed to damagingship effects and to compare the damage poten-tial of various fleet mixes.
In forming their estimate of the potential forvessel-related structural damage, Hodek et al.(1986) considered both vertical and horizontaldynamic loadings. For the areas of St. Marys Riverconsidered in the report, they felt that dynamichorizontal loadings would be small for cases witha continuous ice sheet (such as those that com-monly occur during the extended season). If ves-sel passage were sufficient to break the ice coverinto individual pans (as documented in USACE1974), the potential for damage by horizontal forceswould increase. For vertical ice forces, they feltthat gravity structures, such as rock-filled tim-ber cribs, would not be damaged by vertical forces.The rest of their analysis was limited to uplift forceson vertical piles. They concluded that all piles,unless properly engineered and installed, will besubjected to tensile loads in excess of their ca-pacity and will eventually move upward.
Field studies ofstructure damage
The first field study of shore structure dam-age during winter navigation was conducted bythe Detroit District on the St. Marys River begin-ning in 1972 (USACE 1974). They selected sev-eral docks in two reaches of the river for moni-toring: near Six Mile Point on Lake Nicolet andJohnson’s Point on Neebish Island. Some of thedocks monitored were pile supported, while otherswere constructed with rock-filled timber cribs orsteel piling. Monitoring was limited to visualobservations and photographs. Their conclusionswere that water level fluctuations and ice floescan cause structural damage and that navigationin ice can be a contributing factor.
The pile-supported portions of structures werefound to be the most susceptible to damage, buteven timber crib structures were not immune. Jack-ing of finger piers due to vertical ice forces in-duced by natural water level fluctuations anddrawdown was common, and several structureswere damaged as the result of differential ice move-ments along active cracks that passed throughthem. Water levels were high enough that somestructures were damaged by ice in contact withthe horizontal members of the superstructure.
Some structures were observed to sustain dam-age during icebreaking operations when the icecover was so violently disrupted that chunks ofice were thrown against them. While most dam-age was minor, three of the docking structuresmonitored had portions substantially destroyed,and a boat house was so severely damaged dur-ing the opening of navigation in March that itlater collapsed.
In that study (USACE 1974) arrays of surveystakes were laid out at six sites to monitor icemovement in the offshore direction. At one sitethe ice was found to have moved as much as 30 ftoffshore over a period of 40 days, but typical icemovements were on the order of 10 ft or less. Somelateral movement was also observed at three sites.In connection with some of their recordings ofwater level fluctuations, they also measured therelative motion of the ice sheets on either side ofan active crack. These data indicated that the off-shore ice sheet could move at least several tenthsof a foot offshore during vessel passage (appar-ently in response to the drawdown-induced move-ment of water) and that the ice cover did not fullyreturn to its original horizontal position when thewater returned to its prior elevation.
It is postulated here that this mechanism re-sults in a gradual horizontal jacking of the icecover towards the navigation channel, since thewater in the open shore crack can partially ortotally refreeze before the next ship passage. Start-ing from this new position the next event willleave the offshore ice sheet slightly farther fromits original location. Repeated cyclings of thisbacking process could lead to the large horizon-tal motions recorded over the winter season andlead to increased ice volumes in the vessel track.If the crack were to pass through a structure, thishorizontal jacking could incrementally pull thestructures apart.
A follow-up study by the consulting firm ofDalton, Dalton, Little and Newport, Inc. (1975)concluded that although ship passage during ice-covered conditions can contribute to structuredamage, a major factor is the inadequate designand construction of many structures on the river.They concluded that control of vessel speed wasnot important since they considered ship-gener-ated waves to be of minimal importance. Instead,they recommended improved structural designto withstand natural forces and consideration ofremovable, floating structures.
Carey (1980) reviewed the potential for win-ter-navigation-related shore structure damage on
18
the St. Marys, St. Clair and Detroit Rivers usingaerial photos, Corps of Engineers permit data andsite visits. He estimated the total value of privateshoreline structures at that time to be on the or-der of $18 million (1976 dollars). A probabilisticapproach was employed that consisted of char-acterizing the ice conditions, on a reach-by-reachbasis, that occur naturally and under severalschemes of winter navigation. On the basis of theseice conditions and the channel characteristicswithin each reach, two probability estimates weremade: the probability of the occurrence of icedamage and its probable severity. Damage val-ues were calculated in terms of replacement cost.Although the results of this study are hard tosummarize since they provide maximum poten-tial damage costs as a function of various levelsof probability, it was concluded that there was a90% probability that the annual ice damage costsfor the three rivers should not exceed $1.275 mil-lion without navigation, $2.28 million with thetraditional season (navigation to December 15th)and $3.05 million with year-round navigation. Ifdamage mitigation measures were implemented,it was felt that these year-round damages couldbe reduced to $1.65 million.
On the St. Marys River, Wuebben (1981a,c,1983b) reported the results of shore structure moni-toring during two winter periods with essentiallyno commercial shipping. During the period from15 January to 24 March 1980 there were only eightpassages (all by icebreakers), and from 31 Decem-ber 1980 to 24 March 1981 there were nine pas-sages (all icebreakers except for one tanker). Un-der the program, docks were repeatedly observedand photographed throughout the two winters,and four river areas were selected for detailedmonitoring based on a high potential for dam-age during years with winter navigation. At thesesites, points on the structures were repeatedly sur-veyed to document any displacement of their com-ponents.
Visits immediately following the close of navi-gation showed some damage due to both hori-zontal and vertical forces, but their condition atthat time was used as a basis for future compari-sons. No structural displacements were measuredin either closed season, except for one dock thatwas documented to have had piles uplifted a maxi-mum of 5 in. following the passage of a convoyof one tanker and four icebreakers on 3 March1981. Apparently the natural water level varia-tions were not sufficient to cause noticeable dam-age during either period. Hodek et al. (1986) noted
that very slow water level variations due to long-term seasonal changes may result in such lowloading rates that plastic deformation within theice or at the ice/structure interface can occur. Thiswill result in very low vertical forces being ap-plied to the structure.
In addition, ice conditions were monitored atseveral sites. In contrast to periods with naviga-tion in ice, active, shore-parallel cracks were largelyabsent. During the 1979-80 closed period one sitehad a grounded crack only during a survey inlate January, and a second site showed an activecrack only during a survey in late February. Dur-ing the 1980-81 field season, no active cracks wereobserved. Arrays of pins were set in the ice acrossactive cracks evident at the close of the naviga-tion season, but no measurable changes in therelative locations of these pins were detected dur-ing the closed season, except near the dock expe-riencing uplift in March. At this location the shoreparallel crack opened 1.5 in., but no lateral move-ment was noted. Apparently the water level fluc-tuations during these two field seasons were notlarge or frequent enough to develop the continu-ous, open, shore-parallel cracks evident duringall previous field seasons with navigation in ice.
On the St. Lawrence Seaway a study was con-ducted to determine the nature and extent of anydamage to shore structures during the winter sea-son to serve as a database in the event that thenavigation season was extended there (Palm1977a,b, Palm and Cutter 1978). As part of thatstudy they inventoried 5675 structures within theU.S. portion of the seaway and categorized themaccording to function, type of construction, his-torical and cultural significance, and potential fordamage due to ice.
Damage potential criteria were based on thedistance from the navigation channel, the pres-ence of sharp turns and the conditions of an in-dividual structure. Structures closer than 300 yardsfrom the channel or near turns sharper than 10°were considered susceptible to damage. Structuretypes included both shore protection measuresand facilities for recreational boating. Overall theydetermined that 3247 should not be impacted, 135might require minor additional maintenance, 177could be subject to moderate damage and 54 couldbe severely impacted. Of 26 historic or culturallysignificant structures, 4 were considered suscep-tible to damage.
They also conducted repeated surveys of 18structures to check for any vertical or horizontaldisplacement. During the first winter season 6 of
19
found to be more resistant but not immune todamage. Improved structure designs and propercontrol of vessel speed could minimize damages.
SummaryAlthough various analyses of vessel effects have
concluded that there is a potential for shorelineerosion, field surveys and reviews of historicalrecords have not supported that conclusion. Forthe most part, erosion rates due to any cause havebeen minor, and a comparison of erosion ratesduring years with and without winter navigationshows no clear trend. High water levels, how-ever, have been associated with periods of in-creased shoreline recession. There is a definitepotential for sediment transport during vesselpassage, and it appears that this material is oftentransported offshore towards the channel. Sinceambient sediment transport in the connectingchannels is quite low, this would constitute apermanent (though apparently small) net loss ofsoil from the nearshore zone. The transport couldalso have biological ramifications through in-creases in suspended solids and turbidity; thesetopics will be discussed later.
Information from periods without navigationrevealed little or no ice-related damage to evenpoorly constructed structures. There was a docu-mented potential for damage to private shore struc-tures due to vessel passage in ice, particularly thelight-duty pile-supported docks constructed byrecreational boaters. Because there are thousandsof these structures on the connecting channels,the previous damage estimates have run intomillions of dollars. Well-designed structures werefound to be significantly more resistant to dam-age but not immune. However, numerous stud-ies cited in the text have pointed out the strongrelation between the magnitude of vessel effectsand vessel speeds. Speed limits developed withregard to sediment transport and dock damagecould essentially eliminate measurable damage.In most cases existing limits were found adequate.
OIL AND HAZARDOUSSUBSTANCE SPILLS
Spills of oil or hazardous substances from tran-siting vessels during the season extension pro-gram represent a potential adverse impact to theenvironment. Because of the combination of coldweather and ice, spills in winter present additionaldifficulties in tracking, recovery and mitigation.Because of this, the potential for spills during ex-
the 12 docks monitored were determined to havebeen displaced vertically and/or horizontally, butmost displacements were on the order of 0.1 ftwith a maximum of 0.2 ft. Although it was statedthat the measurements were accurate to 0.001 ft,the reported displacements may actually reflectonly the true accuracy of the survey. It is particu-larly interesting to note that all recorded verticaldisplacements indicated that the structures weresinking as the winter progressed. This is contraryto the typically reported lifting or “jacking” ofpile structures by vertical ice forces.
During 1978, their second winter season, 8 ofthe 18 structures monitored during the first sea-son showed vertical and/or horizontal displace-ments in excess of 0.1 ft at one or more locations.Of six additional structures monitored during thesecond season only, five exhibited measurablemovement. Structures not experiencing damagewere supported by concrete or substantial tim-ber cribs. Of the docks experiencing displacement,one was pile supported and the remainder weretimber cribs. For the survey points monitored onthese docks, 109 displacements in excess of 0.1 ftwere recorded. For events with vertical displace-ment, 13 were up and 19 were down. For hori-zontal motion events, 6 displacements were on-shore and 20 were offshore; 26 were upriver and22 were downriver. The maximum vertical dis-placements were about 0.6 ft and occurred in bothdirections. The maximum horizontal displacementwas 0.9 ft onshore and 1.8 ft downstream. Oneincident of total destruction was cited, but nodescription of cause was provided.
In summary, there is a documented potentialfor shore structure damage due to vessel passagein ice. While little or no damage was observedduring periods without winter navigation, exten-sive damage or complete destruction of a num-ber of structures was documented on the St. MarysRiver during the demonstration program. Becauseit is necessary to consider details of constructiontechniques, ice conditions, ship passage charac-teristics and site layouts, quantitatively predict-ing damage for the thousands of privately ownedstructures on the Great Lakes connecting chan-nels is a nearly impossible task. The most com-prehensive analysis conducted so far relied onprobabilistic estimates of damages based on broadcategories of structure types, their values and iceconditions in the general area. Lightly constructed,pile-supported structures were found to be mostsusceptible to damage. More substantial pile struc-tures or other designs (such as timber cribs) were
20
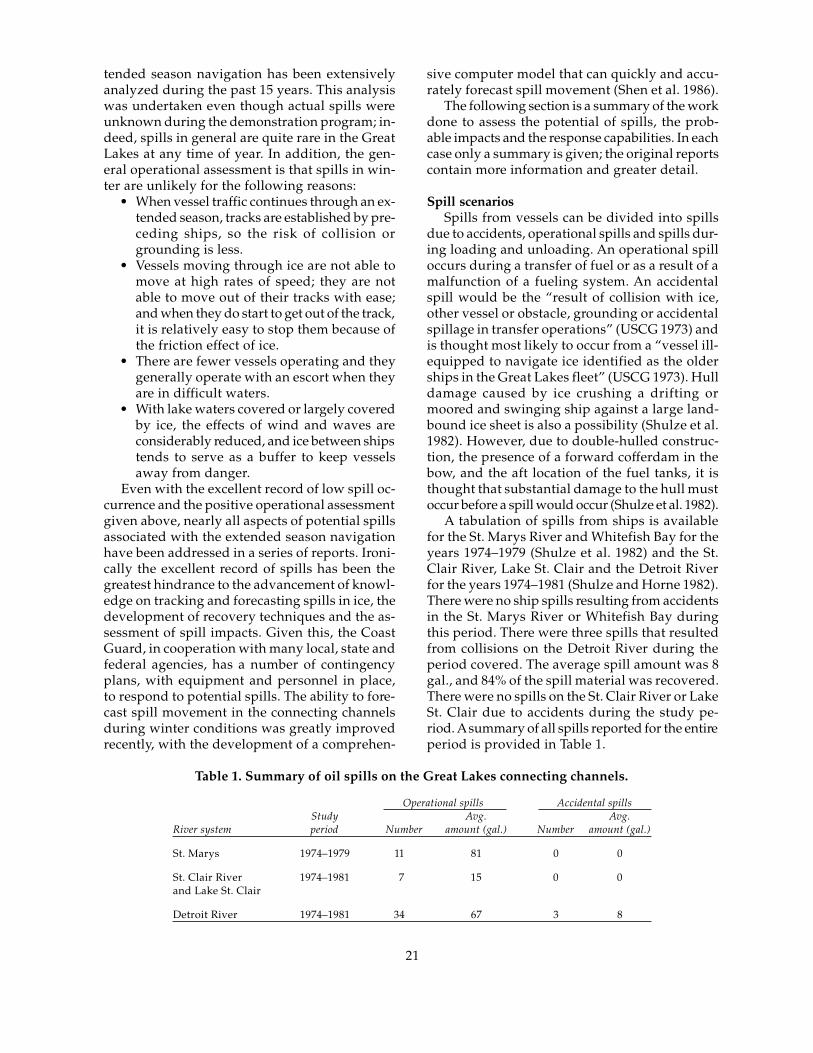
tended season navigation has been extensivelyanalyzed during the past 15 years. This analysiswas undertaken even though actual spills wereunknown during the demonstration program; in-deed, spills in general are quite rare in the GreatLakes at any time of year. In addition, the gen-eral operational assessment is that spills in win-ter are unlikely for the following reasons:
• When vessel traffic continues through an ex-tended season, tracks are established by pre-ceding ships, so the risk of collision orgrounding is less.
• Vessels moving through ice are not able tomove at high rates of speed; they are notable to move out of their tracks with ease;and when they do start to get out of the track,it is relatively easy to stop them because ofthe friction effect of ice.
• There are fewer vessels operating and theygenerally operate with an escort when theyare in difficult waters.
• With lake waters covered or largely coveredby ice, the effects of wind and waves areconsiderably reduced, and ice between shipstends to serve as a buffer to keep vesselsaway from danger.
Even with the excellent record of low spill oc-currence and the positive operational assessmentgiven above, nearly all aspects of potential spillsassociated with the extended season navigationhave been addressed in a series of reports. Ironi-cally the excellent record of spills has been thegreatest hindrance to the advancement of knowl-edge on tracking and forecasting spills in ice, thedevelopment of recovery techniques and the as-sessment of spill impacts. Given this, the CoastGuard, in cooperation with many local, state andfederal agencies, has a number of contingencyplans, with equipment and personnel in place,to respond to potential spills. The ability to fore-cast spill movement in the connecting channelsduring winter conditions was greatly improvedrecently, with the development of a comprehen-
sive computer model that can quickly and accu-rately forecast spill movement (Shen et al. 1986).
The following section is a summary of the workdone to assess the potential of spills, the prob-able impacts and the response capabilities. In eachcase only a summary is given; the original reportscontain more information and greater detail.
Spill scenariosSpills from vessels can be divided into spills
due to accidents, operational spills and spills dur-ing loading and unloading. An operational spilloccurs during a transfer of fuel or as a result of amalfunction of a fueling system. An accidentalspill would be the “result of collision with ice,other vessel or obstacle, grounding or accidentalspillage in transfer operations” (USCG 1973) andis thought most likely to occur from a “vessel ill-equipped to navigate ice identified as the olderships in the Great Lakes fleet” (USCG 1973). Hulldamage caused by ice crushing a drifting ormoored and swinging ship against a large land-bound ice sheet is also a possibility (Shulze et al.1982). However, due to double-hulled construc-tion, the presence of a forward cofferdam in thebow, and the aft location of the fuel tanks, it isthought that substantial damage to the hull mustoccur before a spill would occur (Shulze et al. 1982).
A tabulation of spills from ships is availablefor the St. Marys River and Whitefish Bay for theyears 1974–1979 (Shulze et al. 1982) and the St.Clair River, Lake St. Clair and the Detroit Riverfor the years 1974–1981 (Shulze and Horne 1982).There were no ship spills resulting from accidentsin the St. Marys River or Whitefish Bay duringthis period. There were three spills that resultedfrom collisions on the Detroit River during theperiod covered. The average spill amount was 8gal., and 84% of the spill material was recovered.There were no spills on the St. Clair River or LakeSt. Clair due to accidents during the study pe-riod. A summary of all spills reported for the entireperiod is provided in Table 1.
Table 1. Summary of oil spills on the Great Lakes connecting channels.
Operational spills Accidental spillsStudy Avg. Avg.
River system period Number amount (gal.) Number amount (gal.)
St. Marys 1974–1979 11 81 0 0
St. Clair River 1974–1981 7 15 0 0and Lake St. Clair
Detroit River 1974–1981 34 67 3 8
21
Identification ofprobable spill materials
The frequency and amount of substancesshipped through the St. Lawrence Seaway De-velopment Corporation (SLSDC) locks in 1977(Nicholson and Dixon 1979) and the St. Clair–Detroit River System (SCDRS) for the period 1974–1979 (Shulze and Horne 1982) have been tabu-lated.
By far the largest amount of potential spill ma-terial is oil and petroleum products. The major-ity of this is residual fuel oil (also called number6 and Bunker C) on all the systems studied. Also,refined fuels, mostly gasoline and fuel oil, areextensively transported. Residual fuel oil is notthought likely to spill in winter because of its highviscosity. At low ambient air temperatures, re-sidual fuel is nearly solid (Shulze and Horne 1982),with the consistency of toothpaste (USCG 1973).
The potentially hazardous substances shippedare approximately 10% of the volume of petro-leum products on the Detroit River and 32% ofthe volume of petroleum products on the St. ClairRiver. Approximately 85% of the potentially haz-ardous substances on the St. Clair and 70% onthe Detroit River are basic chemicals and chemi-cal products (Shulze and Horne 1982). In manycases these are a bulk cargo and are not likely tospill, and many are not necessarily hazardous ifthey are released in the water. Potentially toxicchemicals such as insecticides and disinfectantsmake up only 0.4% of the chemicals shipped.
Determination ofspill probabilities
The probability of a spill on the St. Marys Riverand the SCDRS has been calculated for variousoptions of the Extended Season Navigation Pro-gram (Schulze and Horne 1982, Schulze et al. 1982).The probability of a spill is determined by sum-ming the product of the probability of an acci-dent and the probability of a spill, given that anaccident has occurred, for all the possible acci-dents. The accidents assumed to be possible weregrounding, collision, collision with ice and, forthe SCDRS, grounding in ice. For each river sys-tem the probability for each type of accident wasdetermined by compiling the accident record andthe number of vessel transits. The probability ofa spill given an accident was determined by ex-amining the records from tank ships for all of theGreat Lakes. It was felt that tank ships representedthe principal threat for a spill.
The probability of a spill during the extendedseason was quite low in all cases. Generally theprobability was an order of magnitude less thanthe probability of a spill in the normal season, inpart due to the lower frequency of shipping. How-ever, it was found that there was an increasedrisk of a spill per transit during the extended seasonperiod of 1.5–3 times the normal season. In LakeSt. Clair it was found to be five times the normalrisk. This increased risk was largely due to oper-ating in ice.
The likely spill size in the extended season wasdetermined by summing the products of the av-erage spill size resulting from an accident andthe probability of a spill from each accident type.It was found that the likely additional dischargeof oil during the extended season is small and,for the St Marys River, generally less than anoperational spill during the normal season. Be-cause of the limitation of data that are available,it was not possible to compute an expected valueof spill size for the SCDRS.
Identification of spill impactsTo date, the potential impacts of an oil or haz-
ardous substance spill associated with extendingthe navigation season have been discussed(USACE 1979a, Baca et al. 1986). Actual data de-scribing impacts of spills in the Great Lakes arescarce, reflecting the relatively minor nature ofspills in the Great Lakes.
The general effects of a spill on an aquatic en-vironment could vary by impact and degree. Theseinclude:
• Direct kill of organisms through coating andasphyxiation;
• Direct kill through contact poisoning of or-ganisms;
• Direct kill through exposure to water-solubletoxic components of oil at some distance inspace and time from the accident;
• Destruction of the generally more sensitivespecies;
• Destruction of the generally more sensitivejuvenile forms of organisms;
• Incorporation of sublethal amounts of oil andoil products into organisms, resulting in re-duced resistance to infection and otherstresses (the principle cause of death in birdssurviving the immediate exposure to oil);
• Destruction of food values through the in-corporation of oil and oil products into fish-eries resources; and
22
• Incorporation of carcinogens into aquaticfood chain and human food resources.
Oil and greases could have a devastating ef-fect upon waterfowl as well as upon life withinthe water; the problems for waterfowl are com-pounded by low water temperatures. Therefore,of the living resources, waterfowl appear to bepotentially the most vulnerable to the effects ofan oil spillage. However, few waterfowl are presentduring the extended season navigation periodexcept on the Detroit River (Davis and Erwin 1982).
The specific impacts of spills on the fresh-water environment have been summarizedbased on laboratory and field studies and onobservations during four actual spills (Baca etal. 1986). None of the observed spills were inthe Great Lakes. The impacts were summarizedas follows:
• Algae. Phytoplankton was relatively unaf-fected by spilled oil except in certain labo-ratory cultures and in exposures to certaincomponents of oils. Filamentous and benthicalgae showed some impacts but were gen-erally resistant or recovered quickly. Blue-green algae frequently increased followingspills.
• Macrophyte vegetation. Submerged speciesor the submerged portions of emergent spe-cies were generally not impacted. However,emergent species or those at the edge of thewater (typically marsh) were affected orkilled by surface oiling.
• Invertebrates. Results of laboratory studiesestablished toxicity levels, but impacts in realspills have been minimal or short-lived. Themost impacted groups have been insectsmoving at the air/water interface.
• Fish. Toxicity studies have established lev-els, and field experience shows serious im-pacts caused by spills in some cases. Lar-vae and fry have generally been more sen-sitive than adults. Tainting of flesh in adultsis another impact. Oiling of lines and gearand impacts on ice fishing are other factorsto consider relative to fisheries.
• Birds. Historically the most noticeable im-pacts have been on this group. Toxic effectscan be through ingestion, absorption or trans-fer to eggs and chicks. Surficial oiling hasbeen most deleterious, causing problemswith heat regulation and buoyancy.
• Mammals. Similar to birds, impacts are re-lated to surface oiling, which causes a loss
in insulative properties of the fur. Mortal-ity can also be caused by ingestion.
Existing contingency plansA comprehensive review of the existing con-
tingency plans has been published (Nicholson andDixon 1979). The contingency plans for cleaningup oil spills in the Great Lakes exist on the inter-national (joint Canada–United States), national,regional, subregional and state levels. The U.S.plan was developed by the Council on Environ-mental Quality, the regional and subregional plansby the U.S. Coast Guard, and the state plans bythe individual state agencies responsible for natu-ral resources. Generally all the plans detailed thefive cleanup phases of discovery and notification;evaluation and initiation of action; containmentand countermeasures; cleanup, mitigation and dis-posal; and documentation and cost recovery(Nicholson and Dixon 1979). However, very fewof the plans contained any winter cleanup infor-mation, the exceptions being the Coast Guardsubregional plan for Sault Ste. Marie and the NewYork plan.
Response capabilitiesand recovery techniques
The Coast Guard has developed a number ofcontingency plans for spill cleanup and contain-ment. The response time is said to be on the or-der of a few hours, and equipment is availablefor various types of oil spills. A good descriptionof the organizational structure of the response ca-pabilities for the Great Lakes is available (USACE1979a). However, the presence of ice and coldweather may seriously hamper all major phasesof oil spill mitigation. As no major spill has re-sulted from winter navigation, there is no practi-cal experience available to guide us in assessingthe extent to which cold weather and ice will se-riously interfere with recovery operations. Theonly recourse at this point seems to be to gatherall information on oil spill recovery from otherlocations (such as the Arctic) and through labo-ratory and controlled field experiments, and sug-gest how this may be relevant to the season ex-tension program.
Several good summaries of techniques of win-tertime oil recovery are available (USCG 1973,Nicholson and Dixon 1979, USACE 1979a). Thesesummaries divide the techniques into responsesfor spills in water, on ice or under ice. Generallyspills in water are handled if possible with the
23
same techniques as during the open-water sea-son, with the acknowledgment that access maybe difficult and that floating ice may interfere withoperations. Absorbing agents, skimming byvacuum, skimming by pumping or burning, andherding agents have been proposed. Oil spills onice are rare. Burning has been proposed, and ifthe ice is strong enough, scraping by large ma-chinery may be possible. Little is known aboutthe behavior of oil beneath ice; this type of spillwould probably be the most difficult to deal with.It is known that the oil collects in pockets beneaththe ice; pumping the oil out of these pockets, driv-ing out the oil with compressed air, and deploy-ing booms through the ice (if it is thin) or underthe ice (if thick) have been suggested.
Alaska Clean Seas, a nonprofit organizationsponsored by 15 oil companies, is devoted to oilspill response in most offshore areas of Alaska.This organization has sponsored research anddevelopment of better oil spill cleanup equipmentand techniques, much of it for use in ice-coveredwaters. In addition, it provides manuals, train-ing and equipment for oil spill containment, dis-posal and mitigation. This organization could bea resource in improving the response capabili-ties and recovery techniques in the Great Lakesduring the extended season navigation periods.
Modeling oil andhazardous substance spills
The ability to model and forecast the trans-port of oil and hazardous substance spills is nec-essary to speed up response to spills and to ad-equately and expeditiously deploy existing equip-ment. The ability to model oil and hazardoussubstance spills depends intimately on the un-derstanding of the many processes that affect spills.These processes include advection by wind andwater currents; weathering of the material byevaporation and dissolution; mechanical spread-ing of the material by viscous, tension and grav-ity forces; and interaction of the material with theshoreline. In addition the ability to model move-ment in open-water and ice-covered conditionscan significantly improve response and deploy-ment in winter. A recent development in model-ing (Shen et al. 1986) has provided a state-of-the-art model that incorporates the above consider-ations. The model is specifically developed forthe St. Marys River, the St. Clair River, Lake St.Clair and the Detroit River. Available on main-frame or desktop computer, the model should be
valuable for real-time response to a spill or toprovide planning capabilities for spill response.
BIOLOGICAL EFFECTS
This section reviews the available documen-tation on the potential ecological effects of ex-tended season navigation on the Great Lakessystem. Most of the work has centered on the St.Marys River, where an ice cover is normally presentin winter, effects on the river ice regime due towinter navigation have been most apparent andthe potential for damage would seem the great-est. Further, significant navigation already occursin winter on the St. Clair and Detroit Rivers in-dependent of any season-extension activities. Vir-tually all of the studies have taken place since1979, and only one of those years included navi-gation on the St. Marys River significantly beyondthe traditional season. Data in other years werecollected to provide baseline information forcomparison. Topics considered include water qual-ity, benthic invertebrates, aquatic plants, fish,waterfowl and raptorial birds.
Water qualityListon and McNabb (1986) collected baseline
water quality data at seven stations in both ship-ping and non-shipping channels along the St.Marys River during periods without winter navi-gation. Variables considered include temperature,pH, dissolved oxygen, turbidity and sedimenta-tion rates.
Temperature, pH and dissolved oxygen werenot considered subject to impact by winter navi-gation. Turbidity was a more significant concernbecause of the biological importance of water clar-ity and light penetration for photosynthesis. Fur-ther, turbidity can directly impact invertebratesand fish by fouling gill mechanisms, which in turncan affect circulation, respiration, excretion andsalt balance. Turbidity levels sufficient to harminvertebrates and fish were not expected to oc-cur on the St. Marys River, with or without ex-tended season shipping, especially consideringthe rapid flushing rates in the river. Lake Nicolet,for example, undergoes about 1.3 volume ex-changes daily. From their studies, however, Listonand McNabb concluded that slight increases inturbidity can limit the outer depth limits of sub-merged macrophyte growth and affect speciescomposition.
24
Turbidity was generally lower during periodsof winter ice than for open-water conditions. Win-ter means were between 0.5 and 2.3 NTU, whilesummer means ranged from 1.3 to 45.5 NTU withno vessel traffic.* During open water, ambientturbidities generally decreased from shallow zonesout to the navigation channel and increased withdistance downriver due to tributary inputs andbroad expanses of shallow water subject to wind-driven wave action. Turbidity measurements dur-ing open-water vessel passages showed no val-ues in excess of 11.8 NTU at any of their sites,which is within the range of natural variation.Winter sedimentation rates without the presenceof navigation ranged from 53 to 2400 mg/day·m2,with a median value of about 962. The mean par-ticle size from all samples was estimated to bebetween 50 and 60 µm.
Sletten (1986) conducted a two-year study ofthe water quality effects of extended season op-erations on the SCDRS. Included were documen-tation of background water quality, sedimenta-tion rate data and water quality variations withtime during vessel passages. The backgroundwater quality information was primarily summa-rized from existing databases supplemented bya limited amount of data collection. The primaryemphasis in the analysis of these data was to lo-cate extreme values of total suspended solids andturbidity for comparison with vessel passageevents. Other variables examined were pH, tem-perature and dissolved oxygen. Average turbid-ities were found to vary from 8.7 JTU in the win-ter to 7.3 in the summer, but temporal variationswithin a season were large. Mean values of sus-pended solids, pH and dissolved oxygen did notvary significantly between seasons.
Baseline sedimentation rate data were also col-lected by Sletten (1986) at two sites on each riverin shallow, off-channel areas. Samplers were typi-cally placed at each site monthly from Decemberor January through March in both years. All sam-plers were collected simultaneously the follow-
ing April, and the amount of sedimentation be-tween deployment of each sampler could be es-timated incrementally. Most stations indicated atrend of increasing sedimentation rates with timefrom January through March, but no explanationswere given. Average rates during the entire sam-pling period ranged from 94 to 483 mg/day·m2,with a median of 310 and a maximum measure-ment of 850 at one site during 8 March to 9 April1985.
Ship passages were monitored at two sites, oneon each river. The Detroit River site had 24 pas-sages sampled, equally split between field tripsin August 1983 and April, August and December1984. The St. Clair River site had 18 passagessampled, evenly split between the three 1984 fieldtrips. April and December were considered win-ter, while the August trips constituted summer.Water samples were collected at intervals followingthe passage of the bow for periods of 30 or 60 min-utes, providing a time record of water quality varia-tions. Although levels of turbidity and suspend-ed solids were found to vary following vessel pas-sage, all maximum values recorded were signifi-cantly less than natural variations in backgroundlevels. No significant correlations between ship size,speed or season of passage, and measured changesin water quality parameters were detected.
Possible reasons cited for the lack of any cor-relations were that none exist, that correlationsexist but are too complex for analysis, and thatthe samplers were not located properly. However,Sletten used linear regression with single ship vari-ables (draft, displacement or speed) to examinecorrelation. Correlation on this basis would re-quire equal effects for large and small ships if theytraveled at the same speed, or equal effects for asingle ship traveling at different speeds. A lumpedparameter reflecting both ship speed and sizewould be more appropriate. Further, the data showthat the elapsed time from ship passage to themaximum recorded parameter values ranged ashigh as 60 minutes, which was the maximumperiod of sample collection. While vessel passageeffects can persist for a relatively long time, it iscurious that maximum values were often foundas much as an hour after the event, probably in-dicating other causes. Hodek et al. (1986) foundthat spatial variations in turbidity were large, evenunder ambient conditions on the St. Marys River,and that the maximum levels of ship-generatedturbidity were near the shoreline. Sletten’s sam-pling was conducted at the edge of the naviga-tion channel, where Hodek’s observations showed
* In the discussions that follow, turbidities are expressedin both Jackson Turbidity Units (JTU) and Nephelom-etric Turbidity Units (NTU) in order to retain the unitsemployed by the authors of the reports under review.Although these units are roughly equivalent, turbid-ity readings are influenced to some degree by the mea-surement technique and the characteristics of the ma-terial in suspension. For the purposes of this report,however, it should be possible to consider these unitsequivalent.
25
the least change and where fluctuations due toother causes would be more significant.
A study by Gleason et al. (n.d.) examined sedi-mentation rates on the St. Marys River by plac-ing nine samplers at three locations: one in a chan-nel closed to winter navigation and two alongactive channels. Sedimentation data were collectedbetween 7 and 27 March. The samplers were leftin place during breakup, but five were lost andonly two retained usable samples. Their analysisof the data at one site indicated an increase insedimentation with vessel traffic, although rateswere low (averaging 1.3 mg/day in their 18.5-cm2 sampler area). A second site showed no rela-tion between sedimentation rates and vessel pas-sage, perhaps due to high natural turbidity. Thethird site, which had the highest sedimentationaverage at 11.1 mg/day, showed a correlation withvessel passage. Further, sedimentation rates werefound to decrease with increasing distance fromthe channel.
They concluded that winter navigation can in-crease sedimentation rates over ambient condi-tions, but that natural sedimentation during springbreakup also causes sedimentation rates equal-ing or exceeding those due to navigation. Theycited sedimentation rates on a channel with sig-nificant navigation being 50 times greater thanat their control site, but the large difference insite conditions (and thus natural sedimentationrates) makes the comparison of questionable va-lidity. The authors did not find significant spawn-ing areas in the St. Marys, nor did they demon-strate or discuss the effects of sedimentation rateson coregonine eggs.
Hodek et al. (1986) conducted a field investi-gation of ship-generated turbidity on the St. MarysRiver. They provided the results of 95 measure-ments of turbidity and 85 light extinction pro-files under both ambient and ship-influenced con-ditions. Unfortunately there were no vessel pas-sages during sampling periods with an ice cover.Ambient turbidities during open-water conditionswere typically in the range of 5–30 JTU, althoughnumerous points were higher and the maximumreading was 380. Measurements during open-wa-ter vessel passages typically ranged from 6 to 30JTU, with a maximum of 53. This information hasbeen incorporated into the database of their nu-merical model of the physical effects of vesselpassage, which primarily deals with sedimenttransport and shoreline erosion potential. How-ever, it was not directly incorporated into thenumerical calculation scheme.
They found that a common source of turbid-ity was the clay shorelines common along the riverand that wind-driven waves of 6 in. or more inheight could generate a high level of turbidityextending from the shore to the navigation chan-nel. Under those conditions, no effect of vesselpassage could be discerned. Several of the sitesused to monitor other vessel effects examined intheir study were sufficiently turbid throughoutall field periods that it was impossible to see theriverbed. Their major findings were:
• The nearshore zones have more turbiditythan the navigation channel, both with anice cover and no vessel traffic and with open-water and vessel passages.
• Navigation channel turbidity was less inMarch than in May or June.
• In general, near-shore turbidity decreasedwith the removal of the ice cover.
• The turbidity in offshore areas of LakeMunuscong (but away from the channel) wasleast with an ice cover and most in June.
• Sites on Lake Nicolet showed a decrease inturbidity after ice-out.
• The Charlotte River is a major contributorof sediments causing turbidity.
Finally, vessel-induced turbidity was observed tobe slight near the channel and highest near theshore, indicating that ship waves and drawdownand surge were generally more significant thanpropeller wash.
Poe et al. (1980) also measured light extinc-tion on the St. Marys River during the winter of1978-79 during a period with winter navigation.They chose two river areas for study, and theyselected what they considered to be high- and low-impact data collection sites within each of theseareas based on a perceived difference in the po-tential for vessel passage effects. The basis fordetermining the level of vessel impact potentialis not clear, nor are differences in site conditionsapart from vessel effects explained.
All measurements were collected during or im-mediately following vessel passage except forthose made during March. Observations in Marchhad no vessel passages and were considered as a“control” condition. All measurements were takenthrough the ice, but by the April field period theice cover had become fragmented. They foundthat light penetration was generally lower in Feb-ruary than in March or April and that light pen-etration was greater at their low-impact sites thanat the high ones.
Based on records of ship passage they felt vessel
26
traffic may have been responsible for the higherturbidity in February, but only one site was moni-tored during February, and all March and Aprilmeasurements (except one) were collected at threeother sites. It is questionable whether a compari-son of samples collected at different sites on dif-ferent dates can be used to infer navigation-in-duced turbidity. Further, the single March “con-trol” measurement taken at the same site as theFebruary measurements was less than the maxi-mum light penetration recorded during February.
They also suggested that the greater light pen-etration at their low-impact sites supported theclaim of ship-induced turbidity. However, theirdata from their March control period show thissame relation between sites, suggesting naturalvariations may have contributed. Further, sinceHodek et al. (1986) found turbidity levels to varysignificantly with location (even for essentiallysimultaneous samples at a single site), drawingconclusions on ship effects by direct comparisonof turbidity levels at sites more than 3000 ft apartis tenuous. Interestingly penetration was greaterin April than in March despite heavier vessel traffic.They felt that this may be due to the fragmenta-tion of the solid ice cover in April.
Benthic macroinvertebratesListon and McNabb (1986) sampled benthic
macroinvertebrates on the St. Marys River dur-ing two years without winter navigation (1982and 1983). A total of 670 samples were analyzedto estimate the populations occurring at selectedsites along the river. Total benthic invertebrateabundance was generally high throughout theriver, ranging from 21 to 64,278 organisms persquare meter, with a median between 7,000 and8,000. Abundance was almost always less in thenavigation channel (the median was less than 1,000per square meter) than at other locations. Fur-ther, abundance was about three times greater onthe western shore than on the eastern shore. Thiswas considered to be a reflection of a lower en-ergy environment there due to prevailing windsfrom the west.
A total of 162 taxa were identified, with 118taxa within the vegetated littoral zone and 41 taxaunique to that zone. Organisms characterizing thelittoral zone include odonates, lepidopterans, co-leopterans and nonchironomid dipterans. Bothherbivores and predators were well represented.At offshore sites, 120 taxa were identified, of which42 were unique. Organisms characterizing thatzone include mollusks, trichopterans and chirono-
mids. Omnivores were the most common func-tional group at offshore sites. Within the naviga-tion channel, only 37 taxa were collected. Nonewere unique or dominant. It was stated that ex-tended season navigation could impact benthicinvertebrates through loss of food and cover ifaquatic macrophytes are damaged, through in-creased turbidity or sedimentation, or by caus-ing direct contact with ice. This in turn wouldaffect the abundance of food available to fish.However, no evidence of damage to aquatic mac-rophytes was cited, and no basis for hypothesiswas provided.
During the winter of 1974-75, the Great LakesFisheries Laboratory conducted a field study ofthe macrobenthos in the Lake Nicolet portion ofthe St. Marys River to assess what, if any, effectscould be attributed to navigation in ice (Hiltunen1979). Results from the sampling sites were alsocompared against control sites in the West Neebishchannel, which was closed to winter navigation.Although the winter of 1974-75 had the largestnumber of vessel transits and greatest tonnageshipped beyond the traditional navigation sea-son, Hiltunen found no significant decline in thepopulation densities of any macrozoobenthos ormacrophytes in either test or control site areas.
Poe et al. (1980) sampled fish, benthic macro-invertebrate populations and drift at four siteson the St. Marys River as part of the 1978-79 En-vironmental Evaluation Work Group effort. Toofew fish and eggs were sampled to examine theeffects of vessel passage on fish distribution orabundance. Their results indicated no decreasein the density of benthic macroinvertebrates dueto vessel-related disturbances, but they mentionedthat their data were subject to some statistical un-certainty. Examination of their drift net recordsled them to conclude that only in February couldan “unequivocal demonstration” be made of theeffects of vessel passage. At other times vesselpassage was too frequent to gather background-level data for comparison. Although they notedthat the available data were not sufficient to as-sess the significance of vessel-induced drift, theynonetheless postulated that if an increase in trans-port were to occur it could indicate a net loss ofenergy (biomass) in the system.
Poe and Edsall (1982) conducted a follow-upstudy of vessel-induced drift on the St. Marys Riverduring the period from January through May 1980.Their objective was to determine how the com-position and amount of drift varied between thefollowing conditions: ice covered with vessel traf-
27
fic; ice covered without traffic; and ice free withtraffic. However, they were unable to obtain ad-ditional data for ice-covered conditions with vesseltraffic. Their major conclusions include:
• Macroinvertebrate drift was less for ice-cov-ered conditions without vessel traffic thanfor open-water conditions with traffic.
• The average density and biomass of macro-invertebrate drift was higher in the naviga-tion channel than in nearby littoral waters.
• The amount of macrophyte drift for ice-covered conditions without vessel traffic wasless than that found during the 1979 study(Poe et al. 1980) for ice-covered conditionswith vessel traffic.
• Zooplankton biomass was higher in the navi-gation channel than in littoral waters.
• Detrital biomass was higher in the channelthan adjacent littoral waters for three out offour locations sampled.
They concluded that drift rates for all com-ponents were considerably higher when therewas navigation in ice than when there was iceand no navigation or when there was naviga-tion in open water. They also concluded that navi-gation in ice can cause considerable amountsof detritus, macrophytes, zooplankton and macro-invertebrates to be transported out of the sys-tem. While they noted that the significance ofthese losses could not be addressed with avail-able data, they felt that it was important thatthe losses would occur at a time when produc-tion reaches an annual minimum.
Jude et al. (1986) examined benthic drift at threesites on the lower St. Marys River during 1985,including Frechette Point, lower Lake Nicolet andPoint Aux Frenes. In addition to collecting con-secutive samples over approximate 12-hour timeincrements during one winter and one summerfield period, they also collected a series of five-minute samples during the passage of vessels dur-ing the summer. During the study a total of 71taxa were identified. Drift densities during bothwinter and summer were found to be significantlygreater (900–2200%) at night than during the dayfor all comparisons except at Frechette Point insummer. At all sites the number of taxa collectedwas greatest at night regardless of the season.
While the study of benthic density and diver-sity by Liston and McNabb (1986) found lesserbenthic densities along the eastern shore, whichthey attributed to greater scouring of the bed bywaves driven by prevailing winds from the west,Jude et al. found a general lack of benthic drift
density differences across the river. They did notesuch a trend at one site, Frechette Point, but thiswas only during the winter field period when windwaves would not be active due to the ice cover.Consistently greater drift densities at FrechettePoint than at the other two sites were attributedto higher ambient water velocities there.
When comparing their data to the earlier studiesof Poe and Edsall (1982) at Frechette Point, theyfound that their winter, under-ice drift densitywas 2000% greater (989 vs. 47/1000 m3) than inthat earlier study. Similarly the 1985 summer mea-surements showed a drift density 2600% greater(1659 vs. 64/1000 m3). While they cited annualbiological variations and slight variations in sea-sonal sampling times as a partial cause, they feltthat the disagreement was primarily due to dif-ferences in sampler mesh sizes. There was alsodisagreement between the two studies as to thevariation of drift density with depth. While Poeand Edsall found that drift density decreased fromthe surface to the bottom, Jude et al. found driftdensities to increase with depth. The cause of thisdisparity was considered unexplainable, but sea-sonal biological variations and slight differencesin sampling dates were again cited as possiblecontributors.
Jude et al. (1986) considered it highly prob-able that vessel passage could result in increasedbenthic drift, and based on visual observationsthey speculated that upbound vessels would havethe greatest impact on drift density. In reviewingtheir data, however, they were unable to demon-strate detectable increases in the density of drift-ing benthos due to vessel traffic. Noting the windyconditions prevalent during data collection, theyconcluded that ship passage had not significantlyaltered the already disturbed system.
While considering the distance that disruptedbenthos might be expected to travel in the St. MarysRiver before resettlement, Jude et al. speculatedthat a great proportion resettle within a short dis-tance, with only a small fraction consumed ordestroyed by drifting activity. Since the periodof ship disturbance is very short-lived in com-parison with wind events, which could last forhours or days, they concluded that ship-induceddrift would resettle more quickly than wind-induced drift. On that basis they felt that driftinduced by windy weather has a greater overall,river-wide effect on drift than individual, thoughfrequent, ice-free ship passages. They did notcollect data for ship passages in ice.
Based on their review of the field data of Poe
28
et al. (1980) for ship passage in ice, Jude et al.(1986) disagreed with the conclusion that therewould be a considerable increase in drift densityfor ship passages in ice. While they agreed thatthe data collected during February 1979 for peri-ods with and without vessel passages showedsignificant ship-induced drift, they noted that itis the only documented occurrence known to exist.Due to increased levels of ship traffic during fieldperiods subsequent to the one in January, no datacould be collected to represent the without-ship-ping case for those later data sets.
In arriving at their conclusion that ship pas-sage in ice would increase drift rates in general,Poe et al. (1980) and Poe and Edson (1982) pointedout that drift catch per unit time was roughly equalfor field periods in March and April 1979, eventhough there were only four vessel passages whiledrift nets were deployed in March and 22 whilenets were deployed in April. Since water flow ratesand temperatures were comparable for the twoperiods and limnological conditions that affectcatch were considered little changed, they con-cluded in the 1980 report that greater drift ratesoccur with ship passage in solid ice than for shippassage under floe ice (broken ice) conditions. Intheir 1982 report, Poe et al. expanded this con-clusion to state that drift rates were considerablyhigher for vessel passages with an ice cover thanfor ice-covered conditions without navigation orice-free conditions with navigation.
Jude et al. (1986), however, were not convincedthat the apparent ship-induced drift pulse con-tinue to be evident with additional ship passages.They instead interpreted the data to indicate thatship passage through ice may cause a pulsed in-crease in drift density during some events (Janu-ary data), while at other times (March data) it maycause little apparent effect. Further, they felt thatshort, ship-induced pulses of benthic drift in win-ter may not be subject to predation as severe asat other times due to generally lower metabolicrates. However, they were concerned about anyadditional loss of benthic populations at a timewhen numbers and productivity are minimal, andabout disruption or loss of preferred habitat. Theypostulated that ship-generated drawdown andsurge during spring breakup may result in icefloes disrupting the bed through direct contact.However, no documentation or observations werecited to support this proposed mechanism forincreased drift rates.
In view of several years of year-round navi-gation under the demonstration program and the
presence of reasonable benthic densities and pro-duction rates, Jude et al. concluded that the ef-fects of winter shipping have been minimal. How-ever, they felt that the available ship passage dataand the observation that previous shipping didnot appear to detrimentally affect the benthos isnot a sufficient basis on which to forecast the fu-ture.
Gleason et al. (1979) studied the loss of benthosthrough nearshore, shore-parallel cracks along theSt. Marys River. A system of one or more of thesecracks can form due to water level fluctuationslarge enough to fail the ice cover in flexure. Thefirst crack generally forms at the offshore limit ofshore-fast grounded ice, and other offshore crackshave sometimes occurred at sharp changes in riverbathymetry. With frequent water level fluctua-tions these cracks may not have time to refreeze,leading to open or active cracks persisting through-out the winter. For large, fast-moving ships it hasbeen observed that the associated drawdown andsurge can be large enough to cause water, sedi-ment, vegetation and even small fish to be sprayedthrough these nearshore cracks (Wuebben 1978).
At three sites Gleason et al. (1979) monitoredfluctuations in the elevation of the ice surface dur-ing ship passage, sampled the quantity and com-position of materials washed through a crack, andcollected dredged samples of bed material to de-fine site characteristics. During the study period,24 recorded ship-induced ice level fluctuationsranged from 2.8 to 72.5 cm. Twenty samples wereretrieved from events causing material to passthrough the active cracks. Of these, there wereonly five that contained benthic organisms, andthey were collected during the three vessel pas-sages causing the largest recorded vertical ice dis-placements.
The most abundant organisms found in the bedsamples were snails at 45%, followed by dipter-ans at 17%, annelids at 17% and pelecypods at12.4%. The most abundant in the crack sampleswere dipterans (75%), followed by annelids (15%)and ostracods (10%). From the bottom sample datathe average benthic density was 9593 organismsper square meter, while the 20 crack samplesyielded a total of 21 organisms. This yield of aboutone organism per vessel passage was extrapolatedto 10 organisms per meter of crack per vessel pas-sage, or about 0.1% of the existing benthos popu-lation along the vessel track.
They concluded that there was a correlationbetween the magnitude of vessel-induced fluc-tuation in ice elevation and benthic loss to the ice
29
surface but that it was not a continuous relation.Rather, large events caused dislocation onto theice, while events below some threshold did not.They felt that vessels transiting within existingspeed limits should cause little damage to benthicpopulations. Loss of benthos to the ice surfacewas considered insignificant in comparison withtotal annual mortality due to all causes.
Hudson et al. (1986) examined the distribu-tion and abundance of macrozoobenthos, aquaticmacrophytes and juvenile fishes during the 1983and 1984 open-water seasons in the SCDRS. Atotal of 756 benthic samples were collected along21 transects. The diversity of macrozoobenthoswas highest in the upper Detroit River, with 101taxa, and lowest in Lake St. Clair, where 65 wererecorded. Elsewhere, 98 taxa were identified inthe upper St. Clair River, 95 in the lower St. ClairRiver, and 80 in the lower Detroit River.
Hudson et al. (1986) concluded that the benthiccommunities observed in their study did not ex-hibit obvious ill effects from existing levels of win-ter navigation. However, winter vessel traffic hadalready occurred for many years, and there wasno truly unaffected baseline from which to judgeprior effects. A major ice jam on the St. Clair Riverin 1984 did, however, afford an opportunity toexamine conditions representing perhaps a worst-case scenario of winter ecosystem disruption byice. While the St. Clair and Detroit Rivers normallyremain nearly ice free, this jam persisted for threeweeks, from late April into early May, and includedsignificant ship traffic and icebreaking operations.
Macrozoobenthos populations appeared to bethe most adversely affected of the three groupsexamined in their study. Densities of ten taxa andtotal biomass were lower in 1984 than in 1983,and most declines occurred in the lower St. ClairRiver. It is not known whether these declines weredue to ice scour, lower temperatures or some otherfactor or combination of factors. If the low densi-ties had not recovered by the fall of 1984, it mighthave seemed reasonable to postulate that the icejam had caused long-term damage. However, mostof the affected taxa had recovered by the fall of1984 to levels equaling or exceeding those in thefall of 1983, and the remaining taxa were within30% of the fall 1983 values.
Aquatic plantsListon and McNabb (1986) examined aquatic
plants and primary productivity on the St. MarysRiver. Composition, distribution, biomass and pro-ductivity were found to be typical of oligotrophic
systems of the upper Great Lakes. The major spe-cies of phytoplankton were diatoms, but their bio-mass was low (on the order of 1 mg/m3 based onchlorophyll a). Submersed macrophyte commu-nities were simple in species composition, withthree species dominating: Chara globularis (charo-phyte), Isoetes riparia (quillwort) and Nitella flexilis(charophyte). The maximum annual biomass ofsubmersed stands ranged from 10 to 70 g/m2 (ash-free dry weight). Extensive emergent wetlandswere well developed in shore zones that wereprotected from waves, currents and shifting sand.Emergent wetlands were dominated by Scirpusacutus (hardstem bullrush) at 64% of the areasmapped, followed by secondary dominantsSparganium eurycarpum (bur reed) at 16% andEleocharis smallii (spikerush) at 13%.
Submersed and emergent plant communitiesvaried little in species composition, location, sizeand annual maximum biomass from year to yearduring the period of study. Submersed plant com-munities were 5–10 times more productive andemergent wetlands 300 times more productive thanphytoplankton, indicating their importance in thefood chains of the St. Marys River.
Aerial photographs revealed evidence of emer-gent wetland erosion at some locations in LakeNicolet, but its cause was not readily apparent.Apparently dead rootstocks of emergent plantswere evident in shallow water offshore of exist-ing emergent stands. Ground surveys found theseto be relics of previous bulrush stands in somelocations. Liston and McNabb (1986) felt thatpatterns of vegetation and channels in the adja-cent emergent stands supported the conclusionthat erosion was occurring. The rate of erosionwas not determined, however, since it was tooslow to be measured from the photographs. Atother sites along the Lake Nicolet shoreline, theouter fringe of the wetland had apparently un-dergone little change for over 30 years. Further,scuba observations and collections and Ponardredge sampling have shown that the locationand species of submerged macrophytes in the St.Marys River tended to be stable from year to year.
Further studies of the wetlands by personnelof the Detroit District, COE, using photointer-pretation of historical aerial photographs has in-dicated a correlation between the outer bound-ary of wetlands and water levels.* It is question-
* Personal communication, Don Williams, Detroit Dis-trict, COE.
30
able whether the sediments were actually erod-ing, and the outer boundaries of the wetlands wereprobably responding to increases in water levels.
Both submersed plant communities and emer-gent wetlands occurred on clay sediments, lead-ing Liston and McNabb to suggest that their de-struction could lead to increased turbidity in theriver. It might also be argued that the clays aremore stable than sands, allowing colonization byplants. Periods of winter ice were identified as atime of potential damage to the rootstocks ofemergent vegetation. Possible mechanisms includevertical movement of an ice cover frozen to thebed during water level fluctuations and scour-ing by moving ice floes during ice cover breakup.
Jude et al. (1986) found no strong seasonal dif-ferences in the occurrence of macrophytes in theirSt. Marys River drift samples (48% of all samplesin winter, 57% in summer). However, only six mac-rophytic taxa were collected in winter comparedwith 10 in the summer. At one site, Frechette Point,macrophytes were both more frequent and morediverse in summer (89%, nine taxa) than in win-ter (77%, five taxa). In addition, the dominantplants were found to change seasonally at Fre-chette Point and Point Aux Frenes.
Hudson et al. (1986) sampled aquatic macro-phytes in the Detroit and St. Clair Rivers duringthe open-water seasons of 1983 and 1984. Usinga Ponar grab sampler they collected a total of 18taxa of submersed macrophytes on the St. ClairRiver and 19 on the Detroit River. The averagedepths at which submersed plants were retrievedvaried only between 6 and 8 ft for all sites, de-spite wide ranges in light transmission and wa-ter velocity. Mean light transmission varied froma low of 2% measured on the Detroit River to 86%at a site on the St. Clair River. Near-bottom watervelocities ranged from essentially still water to2.5 ft/s. Light transmission was typically two tothree times greater and water velocities two timesgreater in the St. Clair River than in the DetroitRiver.
Hudson et al. (1986) concluded that the aquaticplant communities observed in their study didnot exhibit obvious ill effects from existing lev-els of winter navigation. However, winter vesseltraffic had occurred for many years, and therewas no truly unaffected baseline from which tojudge prior effects.
As discussed in the section on benthos, how-ever, a major ice jam on the St. Clair River in 1984afforded an opportunity to examine conditionsrepresenting perhaps a worst-case scenario from
disruption of the community by ice. The distri-bution and occurrence of aquatic macrophyte taxachanged little over this period. Plant bed devel-opment was delayed in the St. Clair River and atBelle Isle in 1984, but by September the beds werelittle different than in 1983. There were signifi-cant differences in biomass between the two years,but there were no consistent differences betweenlocations or months. No impacts on submersedmacrophytes could be attributed to the jam, ex-cept perhaps for delayed development due tolower water temperatures.
FishGleason et al. (n.d.) documented conditions
at potential coregonine (lake whitefish and lakeherring) spawning grounds as part of the Envi-ronmental Evaluation Working Group studiesduring the winter of 1978-79. There was concernthat winter navigation could adversely affect in-cubating eggs due to excessive sedimentation,localized current alterations and dislocation. Theirobjectives were to identify spawning areas, de-termine species composition by sampling eggs,quantify the rate of sedimentation, and determinethe composition of sediments in those areas. Theirliterature review generally indicated that sedi-mentation can adversely affect spawning grounds,but opinions in the literature often conflicted,perhaps due to a lack of quantification of mortal-ity vs. sedimentation rates. It was also unclearwhether coregonines have a “home” spawningground, which could make individual sites im-portant.
Nine potential spawning areas were identified,but attempts to sample eggs were unsuccessful.Sampling included visual searches by divers anddredging of areas thought to have a high poten-tial as spawning beds. A single egg was recov-ered at one site, and “several” at a second site.None of the areas were conclusively shown to bespawning areas. However, the authors felt thatthe lack of success may have been due to low ini-tial egg populations, high predation rates, dislo-cation of eggs by water currents, or inability tolocate discrete spawning areas. It was recom-mended that future attempts take place duringor immediately following spawning, along withsampling of fish at the sites.
Liston and McNabb (1986) sampled fish popu-lations in the St. Marys River during years with-out winter navigation past December (1982-83)with the objective of providing baseline informa-tion for analyzing the effects of winter naviga-
31
tion. Larval, juvenile and adult life stages wereexamined at seven sites, with sampling locationsat each site ranging from the navigation channelto nearshore zones. There were 896 samples ofichthyoplankton collected during the summersof 1982 and 1983, which yielded nearly 30,000larvae of 34 taxa. The density of fish larvae andthe number of taxa were generally greatest in theupper littoral zone and lowest in the channel.Rainbow smelt, cyprinid, yellow perch and em-erald shiner larvae dominated the samples, re-flecting their dominance as adults. Thirty-four taxawere identified, though not all were found eachyear, with temperature cited as a possible causefor differences. They also provided detailed de-scriptions of spatial and temporal distributionsfor the dominant taxa sampled.
Some 140,000 fish of 64 taxa were collected usingtrap nets, trawls and gill nets (Liston and McNabb1986). They also tagged 14,946 fish, of which 42were recovered, to document their movements.The shallow littoral zone was dominated annu-ally by emerald shiners, spottail shiners, mimicshiners, bluntnose minnows, yellow perch andwhite suckers, though brown bullheads, rainbowsmelt, gizzard shad and black crappies were alsoprominent during the warmer year of 1983. Thedemersal, offshore community was dominated byseveral small forage fish: trout-perch, spottailshiners, johnny darters, ninespine sticklebacks,yellow perch, mottled sculpins and mimic shin-ers. Top piscivores dominant in the river werenorthern pike and walleyes, followed by small-mouth and rock bass. Lake herring were a domi-nant species in the deeper, offshore areas. Shan-non–Weaver diversity indices ranged from 1.4 to2.8, with mid-river diversity the greatest at 2.4–2.8. Cold-water species such as salmonids weremore prevalent in upstream areas, while down-stream areas had both warm-water species suchas centrarchids and cyprinids and cold-water spe-cies such as lake whitefish.
Liston and McNabb (1986) also made a sig-nificant effort, based on gill net sampling, to de-fine the winter fish community. Almost half ofthe total samples were taken during winter, mostfrom late January to mid-March. While open-watergill net sampling collected 6354 fish of 37 spe-cies, the winter catch consisted of 1904 fish of 19species. The summer catch was dominated by lakeherring (27%), followed by white suckers (18%),northern pike (11.4%), rainbow smelt (10%), yel-low perch (9.7%), walleyes (9.5%) and rock bass(4.6%). In contrast, the winter catch consisted
primarily of lake herring (49%), white suckers(17%), northern pike (12%), yellow perch (6%) andboth walleye and rainbow smelt (5%).
The yellow perch catch was considered mea-ger in winter, perhaps due to their generally lowermobility. Significantly, more fish were collectednearshore than near the channel, which is con-trary to claims that they move into deeper waterareas of the St. Marys during winter. Most yel-low perch were found to be in good condition,but there was a moderate level of parasitization,which Liston and McNabb speculated could beincreased if the fish were to be further stressed.The number of white suckers sampled was con-siderably lower in winter than during open wa-ter, and it was felt that their movements are veryrestricted during that time. More suckers andnorthern pike were found near the shore than nearthe channel.
There was no significant difference in catch perunit effort between nearchannel and nearshoreareas for walleyes, lake herring or rainbow smeltsampled in winter. The catch per unit effort (CPE)was greater during summer for walleyes and rain-bow smelt but less during summer for herring.
The peak CPE for herring occurred during fallspawning activities. While other fish were cap-tured during the winter period, their numberswere insufficient for comparison. For example,only one brown bullhead and three rock bass werecollected in winter gill nets, all at the same sta-tion. Other smaller fish were collected only inci-dentally (or not at all) in the gill net samplings.
The authors noted that the effects of winternavigation on fish populations are limited to con-jecture. They cited potential changes due to di-rect mortality, alterations in suspended solids andalterations of macrophyte beds. For substantialdirect mortalities to occur, fish would have to beconcentrated in or near the shipping channels andexacerbated by low winter metabolic rates. Thisdoes not appear to be the case on the St. MarysRiver. From their studies on the SCDRS, Haas etal. (1985) concluded that fish concentrations aresubstantially reduced in the vicinity of the navi-gation channel during winter and that fish thatremain near the channel seek out adjacent marshesand channels as overwintering sites. There hasbeen no documentation of extended season navi-gation effects on macrophyte beds, but Liston andMcNabb have speculated that they might be ad-versely affected by scour or excessive sedimen-tation. Such scour or sedimentation processes havenot been documented, however. Hudson et al.
32
(1986) were able to compare the extent of macro-phyte beds in the SCDRS before and after a mas-sive ice jam in April 1984. Little change was notedin macrophyte beds due to this severe ice event,as noted earlier.
The potential effects of suspended solids in-cluded siltation of spawning beds, decreased pro-ductivity, reduced food availability, clogging ofgills, reduced respiration and changes in behav-ior. Liston and McNabb (1986) mentioned that highturbidity is generally recognized as an acute stressthat fish can tolerate for short periods of time andthat they may migrate away from it. As discussedearlier in this report, there has not been substan-tive documentation of large or persistent increasesin turbidity during ship passage on the Great Lakesconnecting channels. Liston and McNabb (1986)also cited documentation where several speciesof fish were exposed to very high levels of sus-pended solids (as high as 20,000 ppm) and tur-bidity (up to 500 NTU) without abnormal behav-ior or apparent harm.
These levels are far in excess of those observedby Poe et al. (1980), Sletten (1986) or Hodek et al.(1986) for ship passages on the St. Marys, St. Clairand Detroit Rivers. Liston and McNabb (1986)found ambient turbidity levels at their sites onthe St. Marys River to range from 1.3 to 45.5 NTUduring the summer and 0.5 to 2.3 NTU in thewinter. For ship passages monitored during theopen-water season, no reading exceeded 11.8 NTU.The measurements of Hodek et al. (1986) on theSt. Marys River showed typical ambient turbid-ity levels of 5–30 JTU, with a maximum readingof 380. During vessel passages their measurementstypically ranged from 6 to 30 JTU, with a maxi-mum of 53. On the Detroit and St. Clair Rivers,Sletten (1986) reviewed the Environmental Pro-tection Agency STORET database and estimatedthat mean turbidities varied from 7.3 JTU in thesummer to 8.7 in the winter. Sletten also moni-tored turbidity during 42 ship passages and foundmaximum levels ranging from 2.3 to 73 JTU. Themaximum turbidity measured during his “win-ter” field periods (April and December 1984) was7 JTU. Liston and McNabb (1986) concluded thatsuspended solids levels in the St. Marys Riverwould cause no direct harm to the fishery unlesscatastrophic increases in sediment load occur.
Haas et al. (1985) studied the movement andharvest of adult fish in the SCDRS during 1983and 1984. The objective of the study was to de-scribe the existing adult fish community and toconsider any potential impacts from operation of
the locks on the St. Marys River to 31 January ±2weeks. Since navigation throughout the winterwas already occurring on the SCDRS, they pre-sumed that the existing fish population was per-sisting without any severe stress from prior lev-els of shipping and limited their speculations tothe potential effects of increased winter vesseltraffic.
A total of 57,579 fish of 57 species and threehybrids were identified during the study. The pre-dominant species included rock bass, yellow perch,walleye and white perch. They also made spawn-ing condition determinations on 23 species. Yel-low perch comprised 66% of the fish observed inspawning condition, followed by rock bass (14%)and white bass (8%). There was no apparent cor-relation with the species composition of fish eggsand larvae determined by Muth et al. (1986), inwhich alewife, smelt and logperch comprised thebulk of the eggs collected, while larvae were domi-nated by alewife, gizzard shad, white perch andemerald shiner.
A fish tagging and creel survey effort showedthat the combined shore and boat angling effortin the U.S. waters of the SCDRS averaged 810,000hours on the St. Clair River, 1,409,000 hours onthe Detroit River and 1,953,000 hours on Lake St.Clair. The average annual harvest was 164,000 fishfrom the St. Clair River, 1,421,000 from the De-troit River and 1,198,000 from Lake St. Clair. Atotal of 29,168 fish of 43 species were tagged dur-ing the study to gather information on movements,exploitation and abundance. Angler tag returnsduring the period from December through Marchconstituted only 10% of the total 1,081 returns bysport and commercial fishermen. Ice angling wasdetermined to account for only 12% of anglinghours and 17% of the total catch.
Haas et al. (1985) considered potential impactsof winter navigation on both the fish communityand the winter angling fishery. They felt that fishspawning and food availability might be influ-enced by physical disruption of critical habitatsby ice gouging and that additional vessel pas-sages could alter patterns of ice formation thatmight interfere with ice fishing activities. Althoughconsidered less likely, they also mentioned thepossibility of interference with fish migration. Thesignificance of each of these effects was consid-ered to decrease with distance from the naviga-tion channel.
While they provided no documentation orspeculation as to the significance of their proposedimpact mechanisms, their observations on fish be-
33
havior are relevant. They noted that their dataon winter fish distribution in the SCDRS suggestthat fish generally move to overwintering areasin the fall and that wintertime movement ratesare low. From their fish tagging and net catch datathey further concluded that fish concentrationsare substantially reduced in the vicinity of thechannels and that fish that remain near the navi-gation channel seek out the adjacent marshes andchannels as overwintering sites. They also notedthat the angler effort and harvest on the SCDRSwere quite low in winter with the exception ofthe yellow perch fishery. That fishery was con-centrated in Anchor Bay, an apparent winteringarea, which is well away from the navigationchannel. Further, much of the St. Clair and De-troit Rivers remain ice free, limiting ice fishingopportunities.
To evaluate the validity of their postulated im-pact mechanisms, they proposed that a two-yearstudy take place if the season were extended toevaluate possible impacts on fish and furbearers.They suggested that such a study should be con-centrated on the St. Clair River, where they feltthat winter shipping would have the most influ-ence on fish and the sport fishery. Data from thateffort could be compared with the informationfrom their present report, which would serve asa baseline. Since their combined catch of nineselected species varied approximately 28% from1983 to 1984, however, they noted that extendedseason operations would have to cause evengreater changes in the fish population to be de-tectable. Further, since winter trap net catchesyielded only about 8% of those during summerhigh-catch periods, it would be difficult to makejudgments about winter fish behavior.
Hudson et al. (1986) captured 1771 fish of 36species in 1983 and 1038 fish of 26 species in 1984in the Detroit and St. Clair Rivers during the open-water season. The catches were dominated by yel-low perch, rock bass, hornyhead chub, spottailshiners, striped shiners, rainbow smelt and whitesuckers. These species made up 86% of the totalcatch. They conjectured that the fish communi-ties observed in their study did not exhibit obvi-ous ill effects from existing levels of winter navi-gation. However, winter vessel traffic and otherphysical changes have occurred for many years,and there was no true baseline from which to judgeprior effects.
As discussed in the section on benthos, how-ever, a major ice jam on the St. Clair River in 1984afforded an opportunity to compare conditions
before (1983) with those after the ice jam. Thisjam represents perhaps a worst-case scenario forice effects. Fish catches were usually lower in 1984in both rivers, but Hudson et al. did not considerthe difference to be statistically significant. Theyfelt that the lower catches may have been due tothe effect of lower water temperatures on the de-velopment of plant beds, general activity leveland seasonal migrations.
Muth et al. (1986) conducted a study on theSCDRS to provide baseline information on theabundance and distribution of fish eggs and lar-vae and to assess potential impacts on fish re-production that might occur from extending thelock operation season on the St. Marys River.Analyses of the distribution and abundance ofthe eggs of 19 species and the larvae of 29 speciessuggested that abundance varied significantlybetween the St. Clair and Detroit Rivers and be-tween the 1983 and 1984 data collection seasons.The number of eggs collected from the DetroitRiver (22,000) was more than 2.5 times greaterthan from the St. Clair (8,974). Rainbow smelt eggsdominated the St. Clair River samples, while thoseof gizzard shad and white bass dominated samplesfrom the Detroit River.
Egg abundance was less in 1983 than in 1984for both rivers. Fish larvae were also less abun-dant in 1983, but the difference was greater forthe St. Clair River. Alewives were the most abun-dant larvae in both rivers during both years. Thelarvae of rainbow smelt, various darters andlogperch were also abundant in the St. Clair River,while gizzard shad and emerald shiners wereabundant in the Detroit River. The distributionof larvae varied significantly between rivers, sites,months and study years.
Muth et al. (1986) noted that both water tem-perature and ice conditions can affect the abun-dance of eggs and larvae. They attributed low eggand larvae abundance in 1983 to low water tem-peratures and a slow rate of warming. Althoughthe 1984 ice jam on the St. Clair River probablydelayed fish spawning throughout the system,they felt that rapid warming in May and June mayhave resulted in greater egg and larvae produc-tion than in 1983. While the water temperaturesat their sites on the St. Clair River were compa-rable in May of each year, June temperatures weretypically 3–5°F lower in 1983 than in 1984 andJuly and August temperatures were typically 1–2°F lower. Water temperature differences betweenthe two years were not as consistent on the De-troit River, but June and August temperatures were
34
typically 3–6°F cooler in 1983. The Detroit Riveris typically about 5°F warmer than the St. ClairRiver during May through July, when many spe-cies spawn.
Interestingly the mean monthly water tempera-tures collected at the water intakes for the citiesof Port Huron and Detroit cited by Hudson et al.(1986) as a possible cause of the lower abundanceof macrophytes, benthos and fish in 1984 directlyconflicts with the trends used by Muth et al. (1986)to explain lower egg and larvae abundance in 1983.Mean monthly water temperatures near Port Hu-ron on the St. Clair River were higher for 1983than for 1984 during April, May, July and Sep-tember and were equal during June and August.On the Detroit River near Belle Isle, 1983 tem-peratures were higher from May through Octo-ber, with the exception of June, when the 1984temperature was 2°F higher.
Because only three species of fish identifiedduring their study spawn during fall or winter(and none were abundant in their samples), Muthet al. (1986) felt that it was highly unlikely thatextended season navigation would destroy sig-nificant numbers of fish eggs or recently hatchedlarvae. They did, however, speculate on the po-tential for adverse impact due to habitat alter-ation. They suggested that increased shippingcould result in increased ice accumulations andmovement that could scour spawning sites andreduce available habitat. Such scouring, however,has not been documented. They also felt that ex-tended season navigation could alter water tem-peratures by facilitating or delaying ice breakupor jamming. If water temperatures were altered,the impact could be either positive or negative.Although a major jam occurred during their pe-riod of study, and significant shipping andicebreaking activities took place during its three-week duration, they did not attempt to directlyaddress its impact on egg and larvae populations.
BirdsThe potential effects of winter navigation on
waterfowl and raptorial birds were studied byRobinson and Jensen (1980) in the vicinity of theSt. Marys River as part of the FY79 Environmen-tal Effects Working Group program. The objec-tives were to describe the species and numbersof waterfowl and raptors in the area, to defineareas used by resident and migrating populationsalong with the frequency of visits and their ac-tivities while observed, and to analyze the effectsof winter-navigation-related activities on bird
behavior. Waterfowl and raptors were observedon 60 days between January and April 1979. About1000 ducks were present in January, decliningslightly in February due to emigration, and in-creasing again in late March. The most frequentlyobserved raptors were a pair of adult bald eagles.Bird mortality appeared to be very low duringthe winter of 1978-79 (no dead birds were found)despite unusually harsh weather.
Critical areas occupied by wintering duckpopulations were identified as the St. Marys Rap-ids, the Edison Soo hydroplant outfall and open-water stretches along the Canadian shore nearSault Ste. Marie. Open water in the shipping laneswas scarcely used by ducks, perhaps due to a lackof food there. For eagles, two perch areas alongthe northeast shore of Sugar Island were foundto be important. The direct impact of the 425 ves-sel passages that occurred during the study pe-riod was considered minor, with flushing of birdsbeing the only observed effect. In virtually all in-cidents where ducks were flushed by ships, thenumber of ducks did not return to their pre-pas-sage levels. During the colder months, however,both ducks and eagles tended to avoid the ship-ping lanes and incidents of flushing were rare.By April, with more open water and more ships,the number of incidents increased dramatically.The metabolic significance of flushing, becauseof energy expenditures, remains unknown. How-ever, most flushing takes place in April (duringthe regular shipping season) when food resourcesare being uncovered and are becoming available.
The influence of ship-induced turbidity andice scouring of vegetation on duck foods, and thepossibility of spills of oil or toxic materials, werecited as potential effects but were not assessed,and no data were presented. The potential forscouring of vegetation by ice has been consid-ered by Liston and McNabb (1986) and discussedin the section of this report on aquatic plants.Hudson et al. (1986) also described the 1984 icejam on the St. Clair River and its impact on aquaticplants. The potential for oil or toxic material spillsis addressed in a separate part of this report.
Although the critical open-water areas citedin the report have not been sampled, studies byHodek et al. (1986), Sletten (1986), Gleason et al.(n.d.) do not support large or persistent increasesin turbidity during vessel passages. This wouldappear to be particularly true for sites isolatedfrom the navigation channel, such as the St. MarysRapids and pools along the Canadian shoreline.Further, the lack of an ice cover in these areas is
35
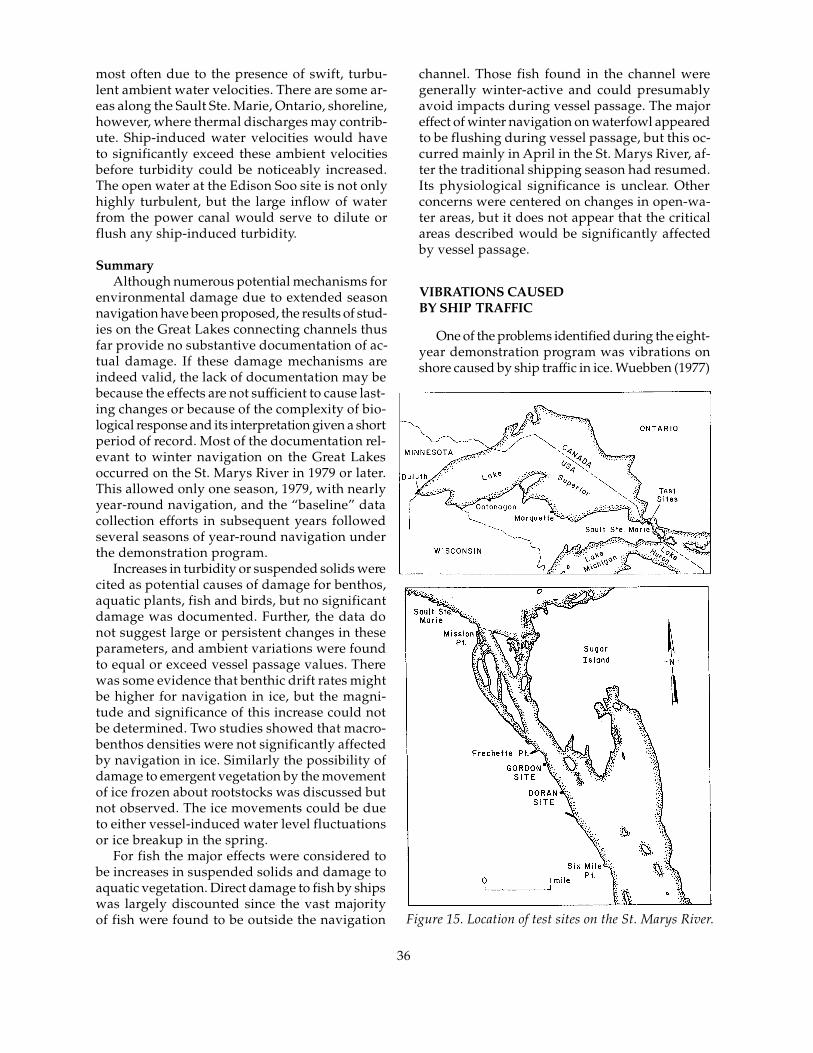
most often due to the presence of swift, turbu-lent ambient water velocities. There are some ar-eas along the Sault Ste. Marie, Ontario, shoreline,however, where thermal discharges may contrib-ute. Ship-induced water velocities would haveto significantly exceed these ambient velocitiesbefore turbidity could be noticeably increased.The open water at the Edison Soo site is not onlyhighly turbulent, but the large inflow of waterfrom the power canal would serve to dilute orflush any ship-induced turbidity.
SummaryAlthough numerous potential mechanisms for
environmental damage due to extended seasonnavigation have been proposed, the results of stud-ies on the Great Lakes connecting channels thusfar provide no substantive documentation of ac-tual damage. If these damage mechanisms areindeed valid, the lack of documentation may bebecause the effects are not sufficient to cause last-ing changes or because of the complexity of bio-logical response and its interpretation given a shortperiod of record. Most of the documentation rel-evant to winter navigation on the Great Lakesoccurred on the St. Marys River in 1979 or later.This allowed only one season, 1979, with nearlyyear-round navigation, and the “baseline” datacollection efforts in subsequent years followedseveral seasons of year-round navigation underthe demonstration program.
Increases in turbidity or suspended solids werecited as potential causes of damage for benthos,aquatic plants, fish and birds, but no significantdamage was documented. Further, the data donot suggest large or persistent changes in theseparameters, and ambient variations were foundto equal or exceed vessel passage values. Therewas some evidence that benthic drift rates mightbe higher for navigation in ice, but the magni-tude and significance of this increase could notbe determined. Two studies showed that macro-benthos densities were not significantly affectedby navigation in ice. Similarly the possibility ofdamage to emergent vegetation by the movementof ice frozen about rootstocks was discussed butnot observed. The ice movements could be dueto either vessel-induced water level fluctuationsor ice breakup in the spring.
For fish the major effects were considered tobe increases in suspended solids and damage toaquatic vegetation. Direct damage to fish by shipswas largely discounted since the vast majorityof fish were found to be outside the navigation Figure 15. Location of test sites on the St. Marys River.
channel. Those fish found in the channel weregenerally winter-active and could presumablyavoid impacts during vessel passage. The majoreffect of winter navigation on waterfowl appearedto be flushing during vessel passage, but this oc-curred mainly in April in the St. Marys River, af-ter the traditional shipping season had resumed.Its physiological significance is unclear. Otherconcerns were centered on changes in open-wa-ter areas, but it does not appear that the criticalareas described would be significantly affectedby vessel passage.
VIBRATIONS CAUSEDBY SHIP TRAFFIC
One of the problems identified during the eight-year demonstration program was vibrations onshore caused by ship traffic in ice. Wuebben (1977)
36
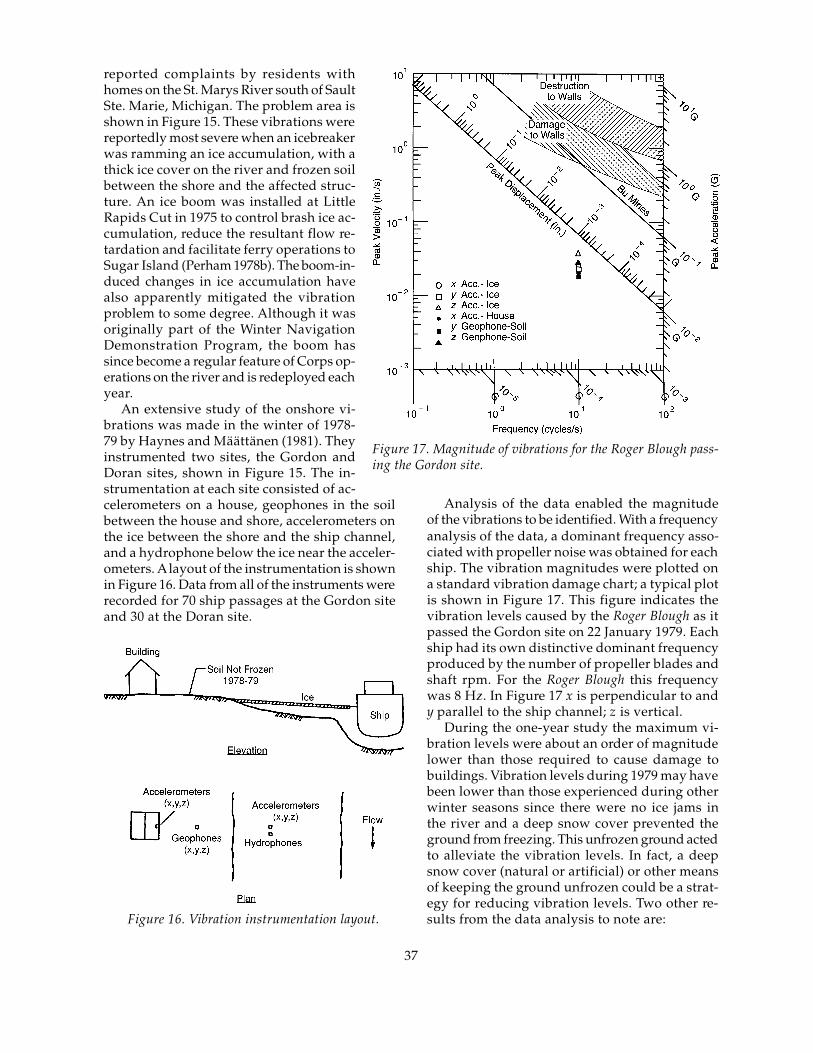
Analysis of the data enabled the magnitudeof the vibrations to be identified. With a frequencyanalysis of the data, a dominant frequency asso-ciated with propeller noise was obtained for eachship. The vibration magnitudes were plotted ona standard vibration damage chart; a typical plotis shown in Figure 17. This figure indicates thevibration levels caused by the Roger Blough as itpassed the Gordon site on 22 January 1979. Eachship had its own distinctive dominant frequencyproduced by the number of propeller blades andshaft rpm. For the Roger Blough this frequencywas 8 Hz. In Figure 17 x is perpendicular to andy parallel to the ship channel; z is vertical.
During the one-year study the maximum vi-bration levels were about an order of magnitudelower than those required to cause damage tobuildings. Vibration levels during 1979 may havebeen lower than those experienced during otherwinter seasons since there were no ice jams inthe river and a deep snow cover prevented theground from freezing. This unfrozen ground actedto alleviate the vibration levels. In fact, a deepsnow cover (natural or artificial) or other meansof keeping the ground unfrozen could be a strat-egy for reducing vibration levels. Two other re-sults from the data analysis to note are:
reported complaints by residents withhomes on the St. Marys River south of SaultSte. Marie, Michigan. The problem area isshown in Figure 15. These vibrations werereportedly most severe when an icebreakerwas ramming an ice accumulation, with athick ice cover on the river and frozen soilbetween the shore and the affected struc-ture. An ice boom was installed at LittleRapids Cut in 1975 to control brash ice ac-cumulation, reduce the resultant flow re-tardation and facilitate ferry operations toSugar Island (Perham 1978b). The boom-in-duced changes in ice accumulation havealso apparently mitigated the vibrationproblem to some degree. Although it wasoriginally part of the Winter NavigationDemonstration Program, the boom hassince become a regular feature of Corps op-erations on the river and is redeployed eachyear.
An extensive study of the onshore vi-brations was made in the winter of 1978-79 by Haynes and Määttänen (1981). Theyinstrumented two sites, the Gordon andDoran sites, shown in Figure 15. The in-strumentation at each site consisted of ac-celerometers on a house, geophones in the soilbetween the house and shore, accelerometers onthe ice between the shore and the ship channel,and a hydrophone below the ice near the acceler-ometers. A layout of the instrumentation is shownin Figure 16. Data from all of the instruments wererecorded for 70 ship passages at the Gordon siteand 30 at the Doran site.
Figure 16. Vibration instrumentation layout.
Figure 17. Magnitude of vibrations for the Roger Blough pass-ing the Gordon site.
37
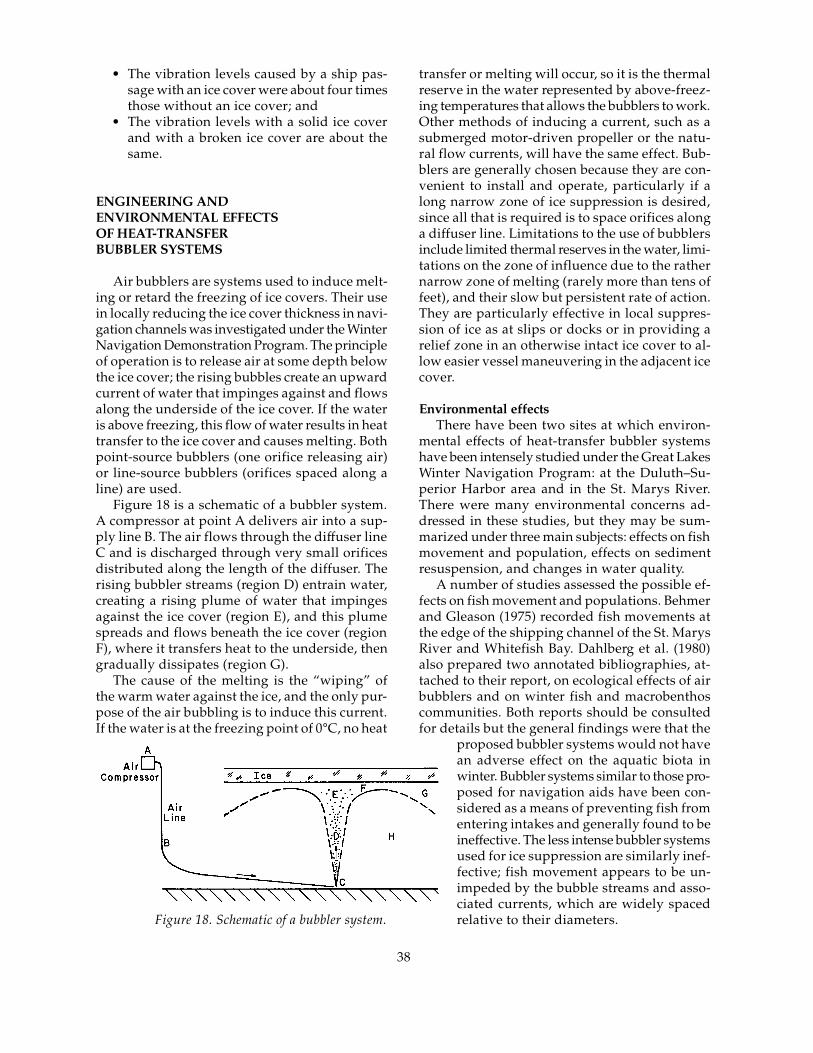
transfer or melting will occur, so it is the thermalreserve in the water represented by above-freez-ing temperatures that allows the bubblers to work.Other methods of inducing a current, such as asubmerged motor-driven propeller or the natu-ral flow currents, will have the same effect. Bub-blers are generally chosen because they are con-venient to install and operate, particularly if along narrow zone of ice suppression is desired,since all that is required is to space orifices alonga diffuser line. Limitations to the use of bubblersinclude limited thermal reserves in the water, limi-tations on the zone of influence due to the rathernarrow zone of melting (rarely more than tens offeet), and their slow but persistent rate of action.They are particularly effective in local suppres-sion of ice as at slips or docks or in providing arelief zone in an otherwise intact ice cover to al-low easier vessel maneuvering in the adjacent icecover.
Environmental effectsThere have been two sites at which environ-
mental effects of heat-transfer bubbler systemshave been intensely studied under the Great LakesWinter Navigation Program: at the Duluth–Su-perior Harbor area and in the St. Marys River.There were many environmental concerns ad-dressed in these studies, but they may be sum-marized under three main subjects: effects on fishmovement and population, effects on sedimentresuspension, and changes in water quality.
A number of studies assessed the possible ef-fects on fish movement and populations. Behmerand Gleason (1975) recorded fish movements atthe edge of the shipping channel of the St. MarysRiver and Whitefish Bay. Dahlberg et al. (1980)also prepared two annotated bibliographies, at-tached to their report, on ecological effects of airbubblers and on winter fish and macrobenthoscommunities. Both reports should be consultedfor details but the general findings were that the
proposed bubbler systems would not havean adverse effect on the aquatic biota inwinter. Bubbler systems similar to those pro-posed for navigation aids have been con-sidered as a means of preventing fish fromentering intakes and generally found to beineffective. The less intense bubbler systemsused for ice suppression are similarly inef-fective; fish movement appears to be un-impeded by the bubble streams and asso-ciated currents, which are widely spacedrelative to their diameters.
• The vibration levels caused by a ship pas-sage with an ice cover were about four timesthose without an ice cover; and
• The vibration levels with a solid ice coverand with a broken ice cover are about thesame.
ENGINEERING ANDENVIRONMENTAL EFFECTSOF HEAT-TRANSFERBUBBLER SYSTEMS
Air bubblers are systems used to induce melt-ing or retard the freezing of ice covers. Their usein locally reducing the ice cover thickness in navi-gation channels was investigated under the WinterNavigation Demonstration Program. The principleof operation is to release air at some depth belowthe ice cover; the rising bubbles create an upwardcurrent of water that impinges against and flowsalong the underside of the ice cover. If the wateris above freezing, this flow of water results in heattransfer to the ice cover and causes melting. Bothpoint-source bubblers (one orifice releasing air)or line-source bubblers (orifices spaced along aline) are used.
Figure 18 is a schematic of a bubbler system.A compressor at point A delivers air into a sup-ply line B. The air flows through the diffuser lineC and is discharged through very small orificesdistributed along the length of the diffuser. Therising bubbler streams (region D) entrain water,creating a rising plume of water that impingesagainst the ice cover (region E), and this plumespreads and flows beneath the ice cover (regionF), where it transfers heat to the underside, thengradually dissipates (region G).
The cause of the melting is the “wiping” ofthe warm water against the ice, and the only pur-pose of the air bubbling is to induce this current.If the water is at the freezing point of 0°C, no heat
Figure 18. Schematic of a bubbler system.
38
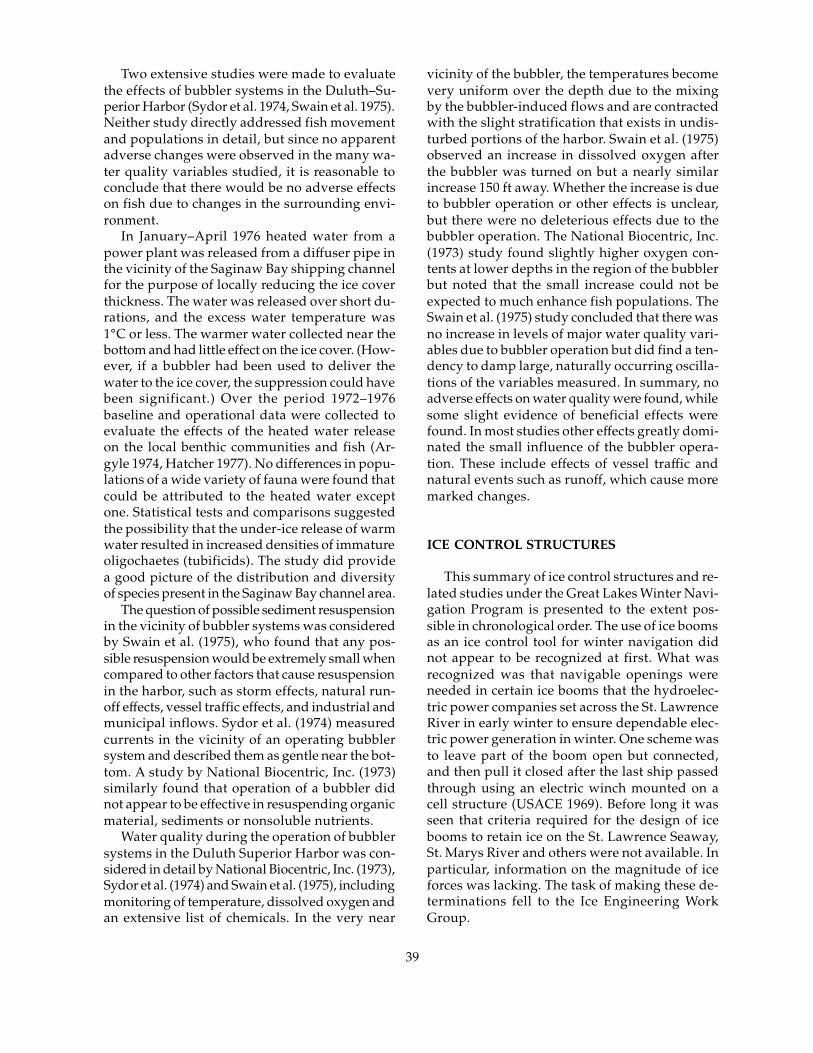
Two extensive studies were made to evaluatethe effects of bubbler systems in the Duluth–Su-perior Harbor (Sydor et al. 1974, Swain et al. 1975).Neither study directly addressed fish movementand populations in detail, but since no apparentadverse changes were observed in the many wa-ter quality variables studied, it is reasonable toconclude that there would be no adverse effectson fish due to changes in the surrounding envi-ronment.
In January–April 1976 heated water from apower plant was released from a diffuser pipe inthe vicinity of the Saginaw Bay shipping channelfor the purpose of locally reducing the ice coverthickness. The water was released over short du-rations, and the excess water temperature was1°C or less. The warmer water collected near thebottom and had little effect on the ice cover. (How-ever, if a bubbler had been used to deliver thewater to the ice cover, the suppression could havebeen significant.) Over the period 1972–1976baseline and operational data were collected toevaluate the effects of the heated water releaseon the local benthic communities and fish (Ar-gyle 1974, Hatcher 1977). No differences in popu-lations of a wide variety of fauna were found thatcould be attributed to the heated water exceptone. Statistical tests and comparisons suggestedthe possibility that the under-ice release of warmwater resulted in increased densities of immatureoligochaetes (tubificids). The study did providea good picture of the distribution and diversityof species present in the Saginaw Bay channel area.
The question of possible sediment resuspensionin the vicinity of bubbler systems was consideredby Swain et al. (1975), who found that any pos-sible resuspension would be extremely small whencompared to other factors that cause resuspensionin the harbor, such as storm effects, natural run-off effects, vessel traffic effects, and industrial andmunicipal inflows. Sydor et al. (1974) measuredcurrents in the vicinity of an operating bubblersystem and described them as gentle near the bot-tom. A study by National Biocentric, Inc. (1973)similarly found that operation of a bubbler didnot appear to be effective in resuspending organicmaterial, sediments or nonsoluble nutrients.
Water quality during the operation of bubblersystems in the Duluth Superior Harbor was con-sidered in detail by National Biocentric, Inc. (1973),Sydor et al. (1974) and Swain et al. (1975), includingmonitoring of temperature, dissolved oxygen andan extensive list of chemicals. In the very near
vicinity of the bubbler, the temperatures becomevery uniform over the depth due to the mixingby the bubbler-induced flows and are contractedwith the slight stratification that exists in undis-turbed portions of the harbor. Swain et al. (1975)observed an increase in dissolved oxygen afterthe bubbler was turned on but a nearly similarincrease 150 ft away. Whether the increase is dueto bubbler operation or other effects is unclear,but there were no deleterious effects due to thebubbler operation. The National Biocentric, Inc.(1973) study found slightly higher oxygen con-tents at lower depths in the region of the bubblerbut noted that the small increase could not beexpected to much enhance fish populations. TheSwain et al. (1975) study concluded that there wasno increase in levels of major water quality vari-ables due to bubbler operation but did find a ten-dency to damp large, naturally occurring oscilla-tions of the variables measured. In summary, noadverse effects on water quality were found, whilesome slight evidence of beneficial effects werefound. In most studies other effects greatly domi-nated the small influence of the bubbler opera-tion. These include effects of vessel traffic andnatural events such as runoff, which cause moremarked changes.
ICE CONTROL STRUCTURES
This summary of ice control structures and re-lated studies under the Great Lakes Winter Navi-gation Program is presented to the extent pos-sible in chronological order. The use of ice boomsas an ice control tool for winter navigation didnot appear to be recognized at first. What wasrecognized was that navigable openings wereneeded in certain ice booms that the hydroelec-tric power companies set across the St. LawrenceRiver in early winter to ensure dependable elec-tric power generation in winter. One scheme wasto leave part of the boom open but connected,and then pull it closed after the last ship passedthrough using an electric winch mounted on acell structure (USACE 1969). Before long it wasseen that criteria required for the design of icebooms to retain ice on the St. Lawrence Seaway,St. Marys River and others were not available. Inparticular, information on the magnitude of iceforces was lacking. The task of making these de-terminations fell to the Ice Engineering WorkGroup.
39
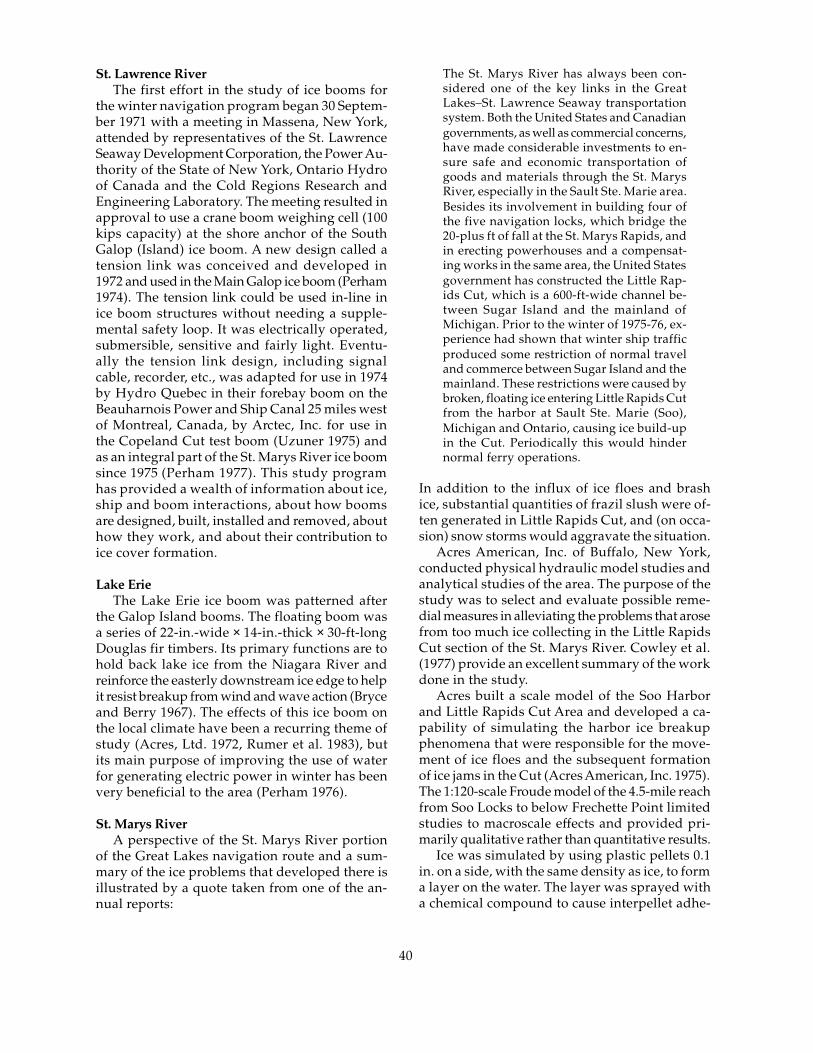
St. Lawrence RiverThe first effort in the study of ice booms for
the winter navigation program began 30 Septem-ber 1971 with a meeting in Massena, New York,attended by representatives of the St. LawrenceSeaway Development Corporation, the Power Au-thority of the State of New York, Ontario Hydroof Canada and the Cold Regions Research andEngineering Laboratory. The meeting resulted inapproval to use a crane boom weighing cell (100kips capacity) at the shore anchor of the SouthGalop (Island) ice boom. A new design called atension link was conceived and developed in1972 and used in the Main Galop ice boom (Perham1974). The tension link could be used in-line inice boom structures without needing a supple-mental safety loop. It was electrically operated,submersible, sensitive and fairly light. Eventu-ally the tension link design, including signalcable, recorder, etc., was adapted for use in 1974by Hydro Quebec in their forebay boom on theBeauharnois Power and Ship Canal 25 miles westof Montreal, Canada, by Arctec, Inc. for use inthe Copeland Cut test boom (Uzuner 1975) andas an integral part of the St. Marys River ice boomsince 1975 (Perham 1977). This study programhas provided a wealth of information about ice,ship and boom interactions, about how boomsare designed, built, installed and removed, abouthow they work, and about their contribution toice cover formation.
Lake ErieThe Lake Erie ice boom was patterned after
the Galop Island booms. The floating boom wasa series of 22-in.-wide × 14-in.-thick × 30-ft-longDouglas fir timbers. Its primary functions are tohold back lake ice from the Niagara River andreinforce the easterly downstream ice edge to helpit resist breakup from wind and wave action (Bryceand Berry 1967). The effects of this ice boom onthe local climate have been a recurring theme ofstudy (Acres, Ltd. 1972, Rumer et al. 1983), butits main purpose of improving the use of waterfor generating electric power in winter has beenvery beneficial to the area (Perham 1976).
St. Marys RiverA perspective of the St. Marys River portion
of the Great Lakes navigation route and a sum-mary of the ice problems that developed there isillustrated by a quote taken from one of the an-nual reports:
The St. Marys River has always been con-sidered one of the key links in the GreatLakes–St. Lawrence Seaway transportationsystem. Both the United States and Canadiangovernments, as well as commercial concerns,have made considerable investments to en-sure safe and economic transportation ofgoods and materials through the St. MarysRiver, especially in the Sault Ste. Marie area.Besides its involvement in building four ofthe five navigation locks, which bridge the20-plus ft of fall at the St. Marys Rapids, andin erecting powerhouses and a compensat-ing works in the same area, the United Statesgovernment has constructed the Little Rap-ids Cut, which is a 600-ft-wide channel be-tween Sugar Island and the mainland ofMichigan. Prior to the winter of 1975-76, ex-perience had shown that winter ship trafficproduced some restriction of normal traveland commerce between Sugar Island and themainland. These restrictions were caused bybroken, floating ice entering Little Rapids Cutfrom the harbor at Sault Ste. Marie (Soo),Michigan and Ontario, causing ice build-upin the Cut. Periodically this would hindernormal ferry operations.
In addition to the influx of ice floes and brashice, substantial quantities of frazil slush were of-ten generated in Little Rapids Cut, and (on occa-sion) snow storms would aggravate the situation.
Acres American, Inc. of Buffalo, New York,conducted physical hydraulic model studies andanalytical studies of the area. The purpose of thestudy was to select and evaluate possible reme-dial measures in alleviating the problems that arosefrom too much ice collecting in the Little RapidsCut section of the St. Marys River. Cowley et al.(1977) provide an excellent summary of the workdone in the study.
Acres built a scale model of the Soo Harborand Little Rapids Cut Area and developed a ca-pability of simulating the harbor ice breakupphenomena that were responsible for the move-ment of ice floes and the subsequent formationof ice jams in the Cut (Acres American, Inc. 1975).The 1:120-scale Froude model of the 4.5-mile reachfrom Soo Locks to below Frechette Point limitedstudies to macroscale effects and provided pri-marily qualitative rather than quantitative results.
Ice was simulated by using plastic pellets 0.1in. on a side, with the same density as ice, to forma layer on the water. The layer was sprayed witha chemical compound to cause interpellet adhe-
40
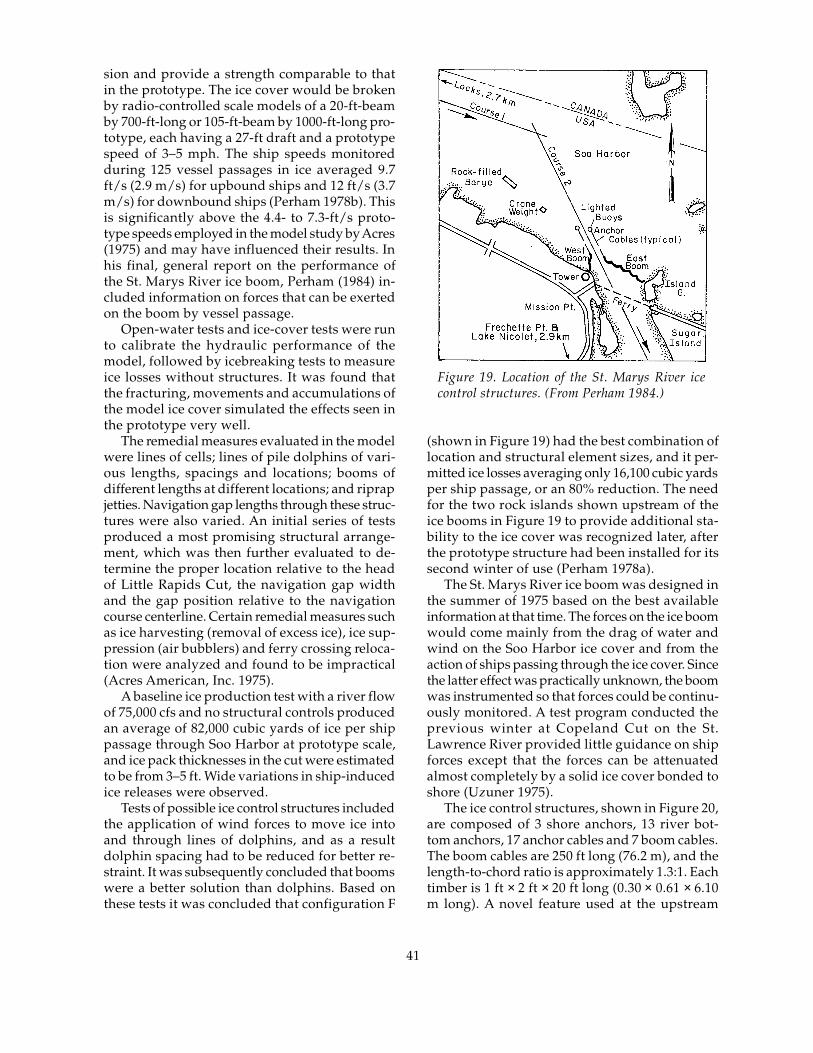
sion and provide a strength comparable to thatin the prototype. The ice cover would be brokenby radio-controlled scale models of a 20-ft-beamby 700-ft-long or 105-ft-beam by 1000-ft-long pro-totype, each having a 27-ft draft and a prototypespeed of 3–5 mph. The ship speeds monitoredduring 125 vessel passages in ice averaged 9.7ft/s (2.9 m/s) for upbound ships and 12 ft/s (3.7m/s) for downbound ships (Perham 1978b). Thisis significantly above the 4.4- to 7.3-ft/s proto-type speeds employed in the model study by Acres(1975) and may have influenced their results. Inhis final, general report on the performance ofthe St. Marys River ice boom, Perham (1984) in-cluded information on forces that can be exertedon the boom by vessel passage.
Open-water tests and ice-cover tests were runto calibrate the hydraulic performance of themodel, followed by icebreaking tests to measureice losses without structures. It was found thatthe fracturing, movements and accumulations ofthe model ice cover simulated the effects seen inthe prototype very well.
The remedial measures evaluated in the modelwere lines of cells; lines of pile dolphins of vari-ous lengths, spacings and locations; booms ofdifferent lengths at different locations; and riprapjetties. Navigation gap lengths through these struc-tures were also varied. An initial series of testsproduced a most promising structural arrange-ment, which was then further evaluated to de-termine the proper location relative to the headof Little Rapids Cut, the navigation gap widthand the gap position relative to the navigationcourse centerline. Certain remedial measures suchas ice harvesting (removal of excess ice), ice sup-pression (air bubblers) and ferry crossing reloca-tion were analyzed and found to be impractical(Acres American, Inc. 1975).
A baseline ice production test with a river flowof 75,000 cfs and no structural controls producedan average of 82,000 cubic yards of ice per shippassage through Soo Harbor at prototype scale,and ice pack thicknesses in the cut were estimatedto be from 3–5 ft. Wide variations in ship-inducedice releases were observed.
Tests of possible ice control structures includedthe application of wind forces to move ice intoand through lines of dolphins, and as a resultdolphin spacing had to be reduced for better re-straint. It was subsequently concluded that boomswere a better solution than dolphins. Based onthese tests it was concluded that configuration F
Figure 19. Location of the St. Marys River icecontrol structures. (From Perham 1984.)
(shown in Figure 19) had the best combination oflocation and structural element sizes, and it per-mitted ice losses averaging only 16,100 cubic yardsper ship passage, or an 80% reduction. The needfor the two rock islands shown upstream of theice booms in Figure 19 to provide additional sta-bility to the ice cover was recognized later, afterthe prototype structure had been installed for itssecond winter of use (Perham 1978a).
The St. Marys River ice boom was designed inthe summer of 1975 based on the best availableinformation at that time. The forces on the ice boomwould come mainly from the drag of water andwind on the Soo Harbor ice cover and from theaction of ships passing through the ice cover. Sincethe latter effect was practically unknown, the boomwas instrumented so that forces could be continu-ously monitored. A test program conducted theprevious winter at Copeland Cut on the St.Lawrence River provided little guidance on shipforces except that the forces can be attenuatedalmost completely by a solid ice cover bonded toshore (Uzuner 1975).
The ice control structures, shown in Figure 20,are composed of 3 shore anchors, 13 river bot-tom anchors, 17 anchor cables and 7 boom cables.The boom cables are 250 ft long (76.2 m), and thelength-to-chord ratio is approximately 1.3:1. Eachtimber is 1 ft × 2 ft × 20 ft long (0.30 × 0.61 × 6.10m long). A novel feature used at the upstream
41
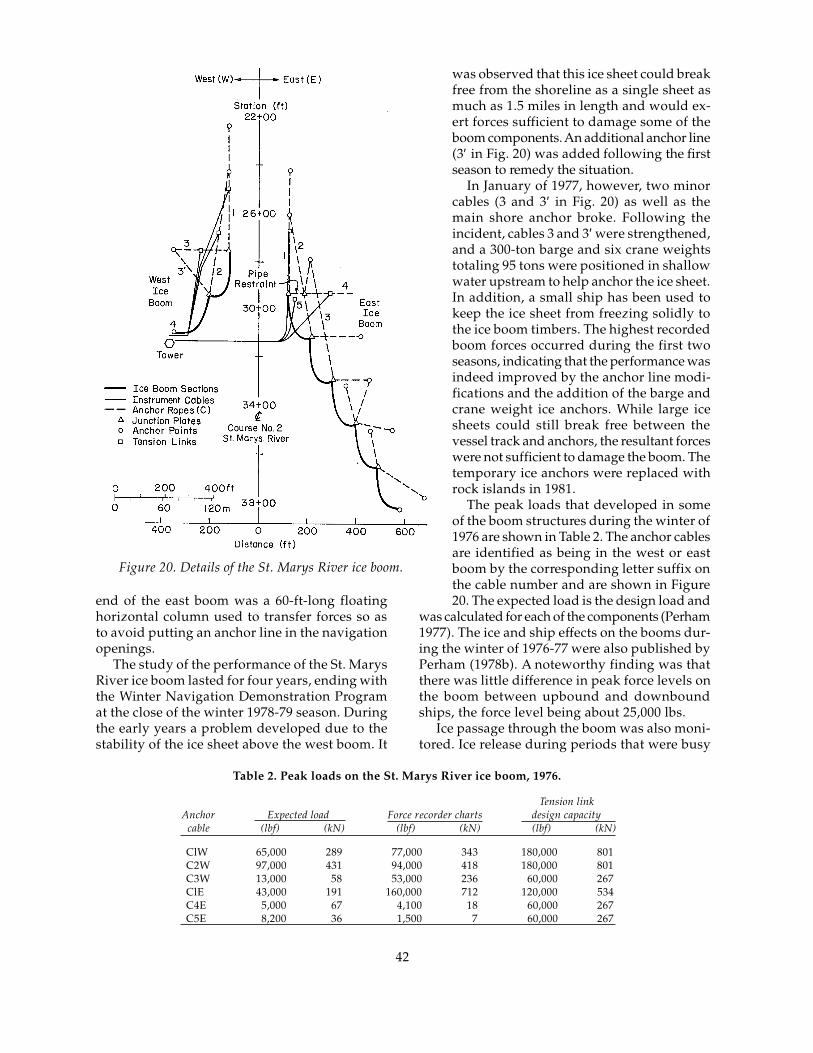
end of the east boom was a 60-ft-long floatinghorizontal column used to transfer forces so asto avoid putting an anchor line in the navigationopenings.
The study of the performance of the St. MarysRiver ice boom lasted for four years, ending withthe Winter Navigation Demonstration Programat the close of the winter 1978-79 season. Duringthe early years a problem developed due to thestability of the ice sheet above the west boom. It
was observed that this ice sheet could breakfree from the shoreline as a single sheet asmuch as 1.5 miles in length and would ex-ert forces sufficient to damage some of theboom components. An additional anchor line(3′ in Fig. 20) was added following the firstseason to remedy the situation.
In January of 1977, however, two minorcables (3 and 3′ in Fig. 20) as well as themain shore anchor broke. Following theincident, cables 3 and 3′ were strengthened,and a 300-ton barge and six crane weightstotaling 95 tons were positioned in shallowwater upstream to help anchor the ice sheet.In addition, a small ship has been used tokeep the ice sheet from freezing solidly tothe ice boom timbers. The highest recordedboom forces occurred during the first twoseasons, indicating that the performance wasindeed improved by the anchor line modi-fications and the addition of the barge andcrane weight ice anchors. While large icesheets could still break free between thevessel track and anchors, the resultant forceswere not sufficient to damage the boom. Thetemporary ice anchors were replaced withrock islands in 1981.
The peak loads that developed in someof the boom structures during the winter of1976 are shown in Table 2. The anchor cablesare identified as being in the west or eastboom by the corresponding letter suffix onthe cable number and are shown in Figure20. The expected load is the design load and
was calculated for each of the components (Perham1977). The ice and ship effects on the booms dur-ing the winter of 1976-77 were also published byPerham (1978b). A noteworthy finding was thatthere was little difference in peak force levels onthe boom between upbound and downboundships, the force level being about 25,000 lbs.
Ice passage through the boom was also moni-tored. Ice release during periods that were busy
Table 2. Peak loads on the St. Marys River ice boom, 1976.
Tension linkAnchor Expected load Force recorder charts design capacity
cable (lbf) (kN) (lbf) (kN) (lbf) (kN)
ClW 65,000 289 77,000 343 180,000 801C2W 97,000 431 94,000 418 180,000 801C3W 13,000 58 53,000 236 60,000 267ClE 43,000 191 160,000 712 120,000 534C4E 5,000 67 4,100 18 60,000 267C5E 8,200 36 1,500 7 60,000 267
Figure 20. Details of the St. Marys River ice boom.
42
with ship transits varied from 5,200 to 10,000 cubicyards per ship passage and averaged 7,230 cubicyards. The maximum was approximately 40,000cubic yards per passage. In the model study theaverage was 16,100 cubic yards. In terms of thedimensionless parameter Ar/b2 (area of ice re-leased per gap width squared), the average icerelease values are 2.9, 4.3, 2.2 and 3.0 for the fourwinters studied (Perham 1985).
Reference measurementsThe following information is a summary of data
obtained by the Detroit District to monitor theice boom performance and its effect on levels andflows. The primary survey of ice conditions andwater levels for the Navigation Season ExtensionDemonstration program was conducted by theU.S. Army Engineer District, Detroit, and consistedof:
• Field observations using three time-lapsemovie cameras;
• Aerial photography of the entire St. MarysRiver but with somewhat greater empha-sis on Soo Harbor;
• Monitoring of water levels in Soo Harborand Little Rapids Cut;
• Discharge measurements taken in the twochannels around Sugar Island to determinethe effect of the ice boom on flow distribu-tion; and
• Ice thickness measurements throughout thewinter above and below the boom.
From this information one can tell when theice cover began, its area and extent during thewinter, and some information about the ice edgelocation in Little Rapids Cut. Some conclusionsreached during 1978 are:
• The ice boom helps maintain a fairly stableice cover on Soo Harbor, similar to beforewinter navigation began, by retaining theice that might otherwise move down intoLittle Rapids Cut.
• Ice in Little Rapids Cut is a major factor inretarding flow between Soo Harbor and Fre-chette Point, but the quantity of ice anddegree of retardation do not directly cor-relate.
• The rock-filled scow and crane weightsproved effective in anchoring the Soo Har-bor ice field to shore.
• Ice jamming in and below Little Rapids Cutis believed to be due to large open-waterareas in the Cut, frazil ice and heavy snow-fall (USACE 1978).
In 1979 the same measurements were made asduring 1978 except that a substantial effort wasapplied to measuring the flow distribution aroundSugar Island. The winter measurements were takenfrom 27 February to 3 March 1979, and the datarevealed that 67% of the flow went through LittleRapids Cut and 33% of the flow went throughthe North (Lake George) Channel. Summer flowmeasurements were taken from 13 June to 16 June1979, and the data showed that 71% went downLittle Rapids Cut and 29% went down the NorthChannel. The flow distribution measurementsduring the winter periods indicate that the vari-ance of 5% is within the obtainable accuracy rangefor this type of measurement, and therefore nosignificant change (effect of the ice boom on riverflows) is evident (USACE 1980).
Although the Winter Navigation programended after the 1978-79 winter season, it was de-cided to continue installing the ice boom as partof the Soo Area Office, Detroit District regularwinter operation. The boom system has been ofvalue in stabilizing the ice cover in Soo Harbor,reducing the extent of ice accumulation in LittleRapids Cut and reducing the amount of ice inthe Sugar Island ferry crossing. These benefitsoccur whether there is winter navigation or not,as the harbor ice usually breaks up due to windand weather several times a year.
By lessening the possibility of ice jams in theCut, the boom has decreased the chances of flood-ing in Soo Harbor along with possible power lossesat the hydropower plants. By reducing the ad-verse effects of natural ice conditions on the SugarIsland ferry, it has contributed to more reliabletransportation between Sugar Island and themainland.
Port HuronDuring 1979 a study was initiated to provide
the necessary criteria for the detailed design ofan ice control structure at Port Huron (Fig. 21),with the major criteria being structural configu-ration and forces. The main problem was that iceleaves Lake Huron via the St. Clair River, whichis typically ice free, and passes through to LakeSt. Clair, which is usually ice covered. The mov-ing ice accumulates in this stagnant reach just northof Lake St. Clair and often forms deep jams. Twophysical models were employed: one to evaluatehydraulic conditions, the other to evaluate theeffects of wind.
The hydraulic model study used Froude scal-ing with an undistorted geometric scale of 1:85
43
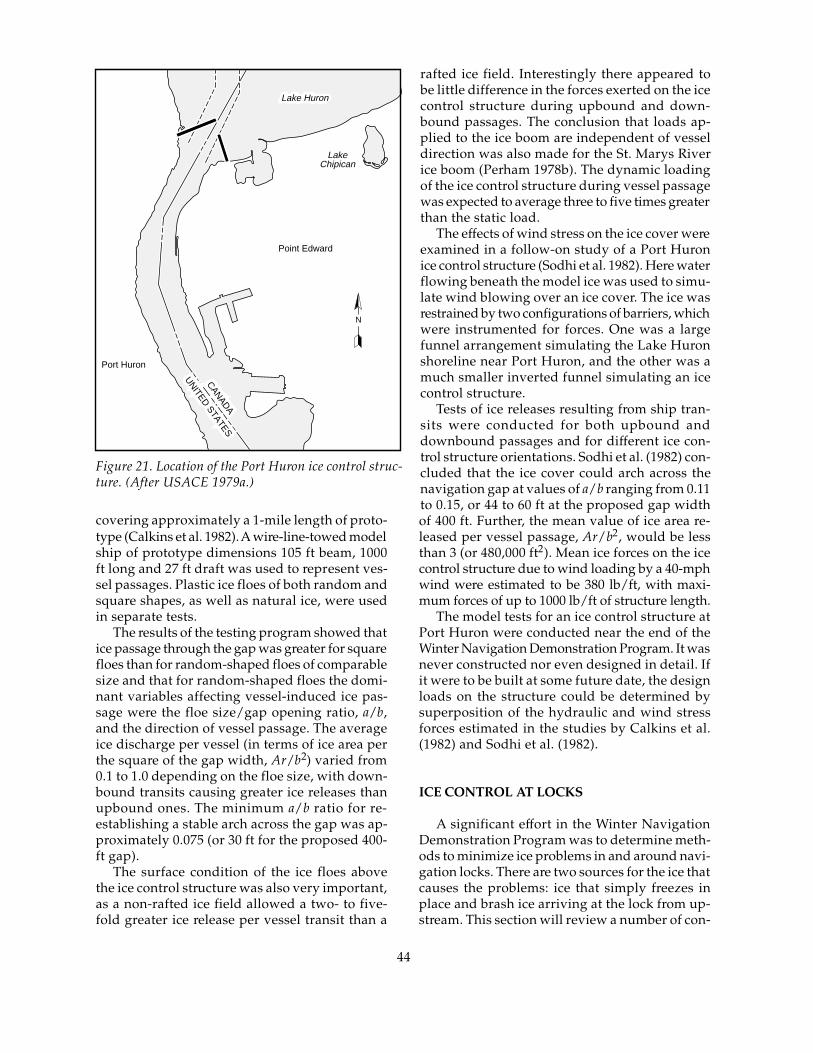
rafted ice field. Interestingly there appeared tobe little difference in the forces exerted on the icecontrol structure during upbound and down-bound passages. The conclusion that loads ap-plied to the ice boom are independent of vesseldirection was also made for the St. Marys Riverice boom (Perham 1978b). The dynamic loadingof the ice control structure during vessel passagewas expected to average three to five times greaterthan the static load.
The effects of wind stress on the ice cover wereexamined in a follow-on study of a Port Huronice control structure (Sodhi et al. 1982). Here waterflowing beneath the model ice was used to simu-late wind blowing over an ice cover. The ice wasrestrained by two configurations of barriers, whichwere instrumented for forces. One was a largefunnel arrangement simulating the Lake Huronshoreline near Port Huron, and the other was amuch smaller inverted funnel simulating an icecontrol structure.
Tests of ice releases resulting from ship tran-sits were conducted for both upbound anddownbound passages and for different ice con-trol structure orientations. Sodhi et al. (1982) con-cluded that the ice cover could arch across thenavigation gap at values of a/b ranging from 0.11to 0.15, or 44 to 60 ft at the proposed gap widthof 400 ft. Further, the mean value of ice area re-leased per vessel passage, Ar/b2, would be lessthan 3 (or 480,000 ft2). Mean ice forces on the icecontrol structure due to wind loading by a 40-mphwind were estimated to be 380 lb/ft, with maxi-mum forces of up to 1000 lb/ft of structure length.
The model tests for an ice control structure atPort Huron were conducted near the end of theWinter Navigation Demonstration Program. It wasnever constructed nor even designed in detail. Ifit were to be built at some future date, the designloads on the structure could be determined bysuperposition of the hydraulic and wind stressforces estimated in the studies by Calkins et al.(1982) and Sodhi et al. (1982).
ICE CONTROL AT LOCKS
A significant effort in the Winter NavigationDemonstration Program was to determine meth-ods to minimize ice problems in and around navi-gation locks. There are two sources for the ice thatcauses the problems: ice that simply freezes inplace and brash ice arriving at the lock from up-stream. This section will review a number of con-
covering approximately a 1-mile length of proto-type (Calkins et al. 1982). A wire-line-towed modelship of prototype dimensions 105 ft beam, 1000ft long and 27 ft draft was used to represent ves-sel passages. Plastic ice floes of both random andsquare shapes, as well as natural ice, were usedin separate tests.
The results of the testing program showed thatice passage through the gap was greater for squarefloes than for random-shaped floes of comparablesize and that for random-shaped floes the domi-nant variables affecting vessel-induced ice pas-sage were the floe size/gap opening ratio, a/b,and the direction of vessel passage. The averageice discharge per vessel (in terms of ice area perthe square of the gap width, Ar/b2) varied from0.1 to 1.0 depending on the floe size, with down-bound transits causing greater ice releases thanupbound ones. The minimum a/b ratio for re-establishing a stable arch across the gap was ap-proximately 0.075 (or 30 ft for the proposed 400-ft gap).
The surface condition of the ice floes abovethe ice control structure was also very important,as a non-rafted ice field allowed a two- to five-fold greater ice release per vessel transit than a
Figure 21. Location of the Port Huron ice control struc-ture. (After USACE 1979a.)
Point Edward
Port Huron
LakeChipican
N
Lake Huron
CAN
ADA
UN
ITED STATES
44
cepts that were demonstrated at the Soo Locksduring the Demonstration Program. Additionalinformation on ice control at locks can be foundin Hanamoto (1977) and USACE (1982).
Minimizing ice adhesionto lock walls
Ice can form on lock walls either by direct freez-ing of water or by the adhesion of broken ice thatis crushed and smeared against a wall by ships.The most significant accumulations of ice occurin a several-foot-thick collar extending down fromthe water surface at the upper pool elevation. Anumber of techniques were investigated to try toeither minimize the formation of such ice depos-its or reduce the strength of ice adhesion to thelock walls.
Modification of operating proceduresSince the surface of a lock wall must be cooled
below 32°F before significant ice can form on oradhere to a lock wall, it is unlikely that a sub-merged portion of a wall will undergo the neces-sary cooling. Thus, there is a strong incentive tohold the lock at the highest feasible water levelduring the long intervals between ship passages,preventing ice accumulation on the lower por-tions of the wall.
Built-in wall heatersIce adhesion can be prevented by maintain-
ing the wall temperature above 32°F, or ice col-lars can be shed by raising the wall temperatureabove freezing periodically. Possible arrangementsinclude embedded electrical heating cables, con-ductive surface materials and internal piping orducts for warm fluids. No special merits have beenfound for a hot fluid system compared to an elec-trical system for heating lock walls.
Pavement heating systems designed to meltsnow and ice usually use a power density of 30W/ft2. By using 11 lines of heating cable runninghorizontally at 5-in. centers, with a burial depthof 3 in., full heating coverage for a 5-ft depth ofbonded ice collar is achieved. At a power densityof 30 W/ft2, the cable has to dissipate 15 W/ft. Ifthe system is amortized over 20 years, the averageannual cost for amortization plus direct operatingcost is approximately $25,000 at 3 cents/kW-hr.
Conductive panels have also been considered,but they would find their best application wherethe conductive material can be recessed so as tomaintain a flush face on the lock wall. Conduc-tive panels attached directly to an existing lock
wall would slightly decrease the effective widthof the lock and be subject to damage by impactfrom ship hulls and shear forces transmittedthrough any attached ice. With ice tightly packedbetween a ship hull and the lock wall, lock op-eration could impose a vertical shearing force onthe order of 100 lbf per foot of wall length in crit-ical sections.
Surface coatingsThere is a long history of study on adhesion
reduction coatings for a variety of applications,but chemical coatings that shed ice reliably andrepeatedly have not yet emerged for commercialuse. The only chemical treatment that has beenused successfully on a large scale is repeated ap-plication of chemicals that depress the freezingpoint of water. As far as horizontal concrete sur-faces are concerned, the classic treatment for iceremoval is application of sodium chloride or cal-cium chloride.
An ice collar control method using a chemicalcoating to reduce the adhesive force between thecoated surface and the ice that forms on it wastested at the Soo Locks during the Demonstra-tion Program (Frankenstein et al. 1976). The ba-sic material is a long-chain copolymer compoundof polycarbonates and polysiloxanes. The mate-rial is produced on order by the General ElectricCo. in Pittsfield, Massachusetts, with a trade nameof LR 5630 (new designation GR 5530). The com-pound comes in coarse powder form.
A solution of the compound, silicone oil andtoluene leaves a thin coat of the copolymer andsilicone on the surface of the lock wall. The sur-face to be coated must be clean and dry. For con-crete and metal surfaces, steam cleaning is suffi-cient. A detergent was added to the steam cleanerwater supply in one case where the walls wereheavily coated with oil and algae. Once the sur-face is clean and dry, the solution can be sprayedon using an airless spray gun. A single pass willdeposit a coat 1–2 mils thick. Three coats are rec-ommended for a coating thickness of about 5 mils.
Tests were also conducted to examine the meritsof an undercoating for the copolymer on concretesurfaces that are worn and rough. An epoxy-typecoating was employed, acting as a filler over therough concrete, and it resulted in a surface to whichthe copolymer adhered better. While sprayed-oncoatings of copolymer can reduce the strength ofadhesive bonds, it appears that a subsidiary me-chanical system is need to actually dislodge theice that accumulates. Periodic renewal of the coat-
45
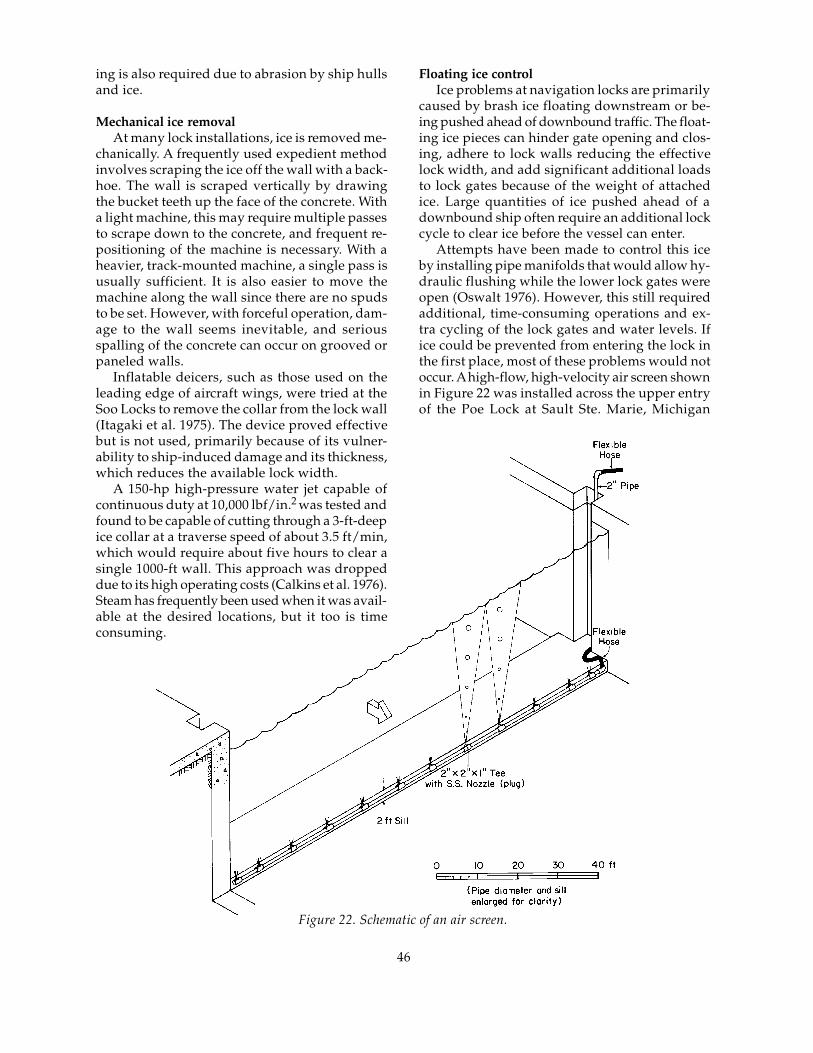
Floating ice controlIce problems at navigation locks are primarily
caused by brash ice floating downstream or be-ing pushed ahead of downbound traffic. The float-ing ice pieces can hinder gate opening and clos-ing, adhere to lock walls reducing the effectivelock width, and add significant additional loadsto lock gates because of the weight of attachedice. Large quantities of ice pushed ahead of adownbound ship often require an additional lockcycle to clear ice before the vessel can enter.
Attempts have been made to control this iceby installing pipe manifolds that would allow hy-draulic flushing while the lower lock gates wereopen (Oswalt 1976). However, this still requiredadditional, time-consuming operations and ex-tra cycling of the lock gates and water levels. Ifice could be prevented from entering the lock inthe first place, most of these problems would notoccur. A high-flow, high-velocity air screen shownin Figure 22 was installed across the upper entryof the Poe Lock at Sault Ste. Marie, Michigan
Figure 22. Schematic of an air screen.
ing is also required due to abrasion by ship hullsand ice.
Mechanical ice removalAt many lock installations, ice is removed me-
chanically. A frequently used expedient methodinvolves scraping the ice off the wall with a back-hoe. The wall is scraped vertically by drawingthe bucket teeth up the face of the concrete. Witha light machine, this may require multiple passesto scrape down to the concrete, and frequent re-positioning of the machine is necessary. With aheavier, track-mounted machine, a single pass isusually sufficient. It is also easier to move themachine along the wall since there are no spudsto be set. However, with forceful operation, dam-age to the wall seems inevitable, and seriousspalling of the concrete can occur on grooved orpaneled walls.
Inflatable deicers, such as those used on theleading edge of aircraft wings, were tried at theSoo Locks to remove the collar from the lock wall(Itagaki et al. 1975). The device proved effectivebut is not used, primarily because of its vulner-ability to ship-induced damage and its thickness,which reduces the available lock width.
A 150-hp high-pressure water jet capable ofcontinuous duty at 10,000 lbf/in.2 was tested andfound to be capable of cutting through a 3-ft-deepice collar at a traverse speed of about 3.5 ft/min,which would require about five hours to clear asingle 1000-ft wall. This approach was droppeddue to its high operating costs (Calkins et al. 1976).Steam has frequently been used when it was avail-able at the desired locations, but it too is timeconsuming.
46
(USACE 1982). The screen created sufficient hori-zontal water velocity in the upstream directionto keep the downbound ice from being pushedahead by a ship. This system has also been usedmore recently to keep debris out of the lock ap-proach during open water periods.
A compressor with an output of 1150 cfm at110 psi was available at the Soo Locks for use inthe air screen trials. The optimum air flow condi-tions were obtained using a 2-in.-diameter mani-fold and supply line system, with 0.40-in.-diam-eter nozzles spaced 10 ft apart. The manifold linewas 2-in. galvanized pipe with 2- × 2- × 1-in. teejoints for each 10 ft of pipe. A 1-in. stainless steelplug was mounted at each tee, and each plug hada 0.4-in. hole drilled in it that acted as the nozzle.
The air screen was installed at the upper ap-proach to the Poe Lock on the downstream, ver-tical face of an emergency stop-log gate sill. Thesill is located about 200 ft above the lock gates.The riser line was installed in a stop-log recess inthe wall. The width of the lock at this point is 110ft, and the height from the top of the sill to thetop of the lock wall is 39 ft.
The air screen has demonstrated that it can holdback ice pushed ahead of downbound traffic. Withships in the 70-ft-beam class, the ice was held backuntil the bow entered the air stream. The screenwas not as effective with 105-ft-beam ships. Oncethe bows of these wider ships pass the nose pierabout 130 ft upstream of the screen, the approachis just a little over 110 ft wide, so most of the iceremaining ahead of the ship is pushed into thelock. This problem might be remedied by relo-cating the air screen upstream of the nose pierarea and providing an area for ice to be pushedout of the vessel track.
SummaryOne of the major obstacles to be overcome in
extending the navigation season on the St. MarysRiver was to develop methods to mitigate ice prob-lems in and around the Soo Locks. The two ma-jor ice problems encountered were ice accumula-tions on lock walls, which reduced the usablewidth of the lock, and large quantities of brashice entering the lock from upstream, which couldhinder the operation of the miter gates and inter-fere with ships entering the locks.
During the program a variety of concepts wereexamined, including changing lock-operating pro-cedures, minimizing ice adhesion, removing themechanically and controlling floating ice. A chemi-cal, ice-release coating was developed that sig-
nificantly reduces the problem of ice accumula-tion on lock walls. The air screen system demon-strated during the program largely solves the float-ing ice problem by diverting ice from the lockand its approach. This not only limits the quan-tity of ice that can hinder gate operation and blockthe entry of ships into the lock, but it also reducesthe supply of ice that can be crushed and smearedonto the lock wall.
LITERATURE CITED
Acres American, Inc. (1975) Ice model study ofthe Little Rapids Cut area of the St. Marys River,Michigan. Draft contract report to the Detroit Dis-trict, U.S. Army Corps of Engineers, Contract No.DACW35-75-C-0014.Acres, Ltd. (1972) Study of Lake Erie ice boom.Prepared by Water Supply Canada by H.G. Acres,Limited.Alger, G.R. (1977a) A study of ice related sedi-ment transport and shoreline erosion, St. MarysRiver–Sault Ste. Marie, Michigan, Vol. 1: MainReport. Contract Report to the USA Cold RegionsResearch and Engineering Laboratory, ContractNo. DACA89-76-C-0013.Alger, G.R. (1977b) A study of ice related sedi-ment transport and shoreline erosion, St. MarysRiver–Sault Ste. Marie, Michigan, Vol. 2: Appen-dices. Contract Report to the USA Cold RegionsResearch and Engineering Laboratory, ContractNo. DACA89-76-C-0013.Alger, G.R. (1978) A study of ice related sedimenttransport and shoreline erosion, St. Marys River,St. Clair River, Detroit River, Michigan, Vol. 3.Contract Report to the USA Cold Regions Re-search and Engineering Laboratory, Contract No.DACA 89-76-C-0013.Alger, G.R. (1979a) A study of ice related sedi-ment transport and shoreline erosion; St. MarysRiver, St. Clair River, Detroit River, Michigan, Vol.4, with Appendix. Contract Report to the USACold Regions Research and Engineering Labora-tory, Contract No. DACA89-76-C-0013.Alger, G.R. (1979b) Ship-induced waves: Ice andphysical measurements on the St. Marys River.Report to the Great Lakes Basin Commission insupport of the Winter Navigation Board-Environ-mental Evaluation Work Group.Alger, G.R. (1980) A study of ice related sedimenttransport and shoreline erosion, St. Marys River–Sault Ste. Marie, Michigan, Vol. 5. Contract Re-port to the USA Cold Regions Research and En-
47
gineering Laboratory, Contract No. DACA89-80-M-795.Alger, G.R. (1981) Field study of the effect of iceon sediment transport and shoreline erosion, St.Marys River, Michigan, Vol. 6. Contract Reportto the USA Cold Regions Research and Engineer-ing Laboratory, Contract No. DACA89-81-M-0649.Alger, R.G. and R.J. Hodek (1986) Developmentof a predictive model to assess the effects of ex-tended season navigation on Great Lakes connect-ing waters; Users’ manual: Prediction of vesselimpacts in a confined waterway. Supplementalvolume to the main contract report (Hodek et al.1986) submitted to the USA Cold Regions Researchand Engineering Laboratory by Michigan Tech-nological University, Contract No. DACA89-85-K-0001.Argyle, R.L. (1974) Evaluation of environmentalbaseline data—Saginaw waste heat demonstra-tion. Interim Report for the period November 1972through October 1973, Fish and Wildlife Service,Great Lakes Fisheries Laboratory.Ashton, G.D. (1974a) Evaluation of ice manage-ment problems associated with operation of a me-chanical ice cutter on the Mississippi River. USACold Regions Research and Engineering Labora-tory, Special Report 214.Ashton, G.D. (1974b) Air bubbler systems tosuppress ice. Report to the Detroit District, U.S.Army Corps of Engineers by the USA Cold Re-gions Research and Engineering Laboratory,Contract No. NCE-IA-73-108, USA Cold RegionsResearch and Engineering Laboratory, SpecialReport 210.Ashton, G.D. (1975) Experimental evaluation ofbubbler induced heat transfer coefficients. Pro-ceedings of the Third International Symposium on IceProblems sponsored by the International Associationfor Hydraulic Research, Hanover, New Hampshire,August, pp. 133–141.Ashton, G.D. (1978) Numerical simulation of airbubbler systems. Canadian Journal of Civil Engi-neering, 5(2): 231–238.Ashton, G.D. (1979) Point source bubbler systemsto suppress ice. Cold Regions Science and Technol-ogy, 1(2): 93–100.Ashton, G.D. (Ed.) (1986) River and Lake Ice Engi-neering. Littleton, Colorado: Water Resources Pub-lications.Baca, B.J., T.E. Lankford and E.R. Gundlach (1986)Environmental impacts of oil and hazardous ma-terial spills with emphasis on winter conditionsin the Upper Great Lakes Region. Prepared for
the Detroit District, U.S. Army Corps of Engineersby Coastal Science and Engineering, Inc.Behmer, D.J. and G.R. Gleason (1975) Winter fishmovement at a proposed bubbler site; St. MarysRiver system. Contract Report to the U.S. Fishand Wildlife Service by Lake Superior State Col-lege, Contract No. 14-16-0003-30.Berlamont, J. and A. Van der Beken (1973) Solu-tions for lateral outflow in perforated conduits.Journal of the Hydraulics Division, American Soci-ety of Civil Engineers, 99(HY9): 1531–1549.Bryce, J.B. and G.T. Berry (1967) Lake Erie–Niagara River ice boom. Proceedings of the 1967Congress of Canadian Engineers, Montreal, EIC-68-CIV, May, p. 28–35.Calkins, D.J., D.S. Deck and D.S. Sodhi (1982)Hydraulic model study of Port Huron ice controlstructure. USA Cold Regions Research and Engi-neering Laboratory, CRREL Report 82-34.Calkins, D.J., M. Mellor and H. Ueda (1976)Lockwall de-icing with high velocity water jetsat Soo Locks, Michigan. USA Cold Regions Re-search and Engineering Laboratory, Technical Note(unpublished).Camp, T.R. and S.D. Graber (1968) Dispersionconduits. Journal of the Sanitary Division, Ameri-can Society of Civil Engineers, 94(SAl): 31–39.Carey, K.L. (1980) Estimating costs of ice dam-age to private shoreline structures on the GreatLakes connecting channels. Prepared for the De-troit District, U.S. Army Corps of Engineers bythe USA Cold Regions Research and Engineer-ing Laboratory, Contract No. NCE-IA-76-195,Special Report 80-22.Carter, D., Y. Ouellet and P. Pay (1981) Fractureof a solid ice cover by wind-induced or ship-gen-erated waves. In Proceedings, 6th International Con-ference on Port and Ocean Engineering under ArcticConditions (POAC ‘81), 27–31 July, Quebec, Canada.Université Laval, p. 843–856.Cowley, J.E., J.W. Hayden and W.W. Willis (1977)A model study of St. Marys River ice navigation.Canadian Journal of Civil Engineering, 4(3): 380–391.Dahlberg, M.D., J.W. Duncan and J.M. Burke(1980) Winter fish population in probable loca-tions of air bubblers in the St. Marys River–LakeSuperior area. Contract Report by NUS Corpora-tion to the U.S. Fish and Wildlife Service in coop-eration with the Detroit District, U.S. Army Corpsof Engineers, FWS Contract NO. 14-16-0009-79-087.Dalton, Dalton, Little and Newport, Inc. (1975)Report on shoreline erosion and structural dam-age along the St. Marys River, Michigan. Contract
48
Report to the Detroit District, U.S. Army Corpsof Engineers, Contract No. DACW35-74-C-0128.Davis, T.E. and R.W. Irwin (1982) Potential im-pacts of winter navigation upon migratory birdson the Upper Great Lakes. Prepared for the De-troit District, U.S. Army Corps of Engineers bythe Office of Biological Services, U.S. Fish andWildlife Service, issued as OBS Report 82/51.Frankenstein, G.E., J.L. Wuebben, H.H.G.Jellinek and R. Yokota (1976) Ice removal fromthe walls of navigation locks. Proceedings of theAmerican Society of Civil Engineers Conference Riv-ers 76, Fort Collins, Colorado, June, p. 1487–1496.Garfield, D.E., B. Hanamoto and M. Mellor (1976)Development of large ice saws. USA Cold RegionsResearch and Engineering Laboratory, CRRELReport 76-47.Gates, E.T. and J.B. Herbich (1977) The squat phe-nomenon and related effects of channel geometry.Hydraulics in the Coastal Zone, 25th Annual Hydrau-lics Division Specialty Conference, American Societyof Civil Engineers, College Station, Texas.Gatto, L.W. (1978) Data base for environmentalconditions along the U.S. shoreline of the St. Marys,St. Clair, Detroit, and St. Lawrence Rivers. USACold Regions Research and Engineering Labora-tory, Internal Report No. 553.Gatto, L.W. (1980a) Shoreline conditions and bankrecession along the U.S. shoreline of the St. Marys,St. Clair, Detroit and St. Lawrence Rivers. USACold Regions Research and Engineering Labora-tory, CRREL Report 82-11.Gatto, L.W . (1980b) Shoreline conditions andshoreline recession along the U.S. shoreline of theSt. Marys, St. Clair, Detroit, and St. LawrenceRivers. Prepared for the Detroit District, U.S. ArmyCorps of Engineers by the USA Cold RegionsResearch and Engineering Laboratory, InternalReport No. 533.Gatto, L.W. (1982) Bank conditions and recessionalong the U.S. shorelines of the St. Marys, St. Clair,Detroit and St. Lawrence Rivers: Ancillary data.Prepared for the Detroit District, U.S. Army Corpsof Engineers by the USA Cold Regions Researchand Engineering Laboratory, Internal Report No.747.Gleason, G.R., D.J. Behmer and R. Hook (n.d.)Evaluation of lake whitefish and herring spawn-ing grounds as they may be affected by excessivesedimentation induced by vessel entrapment dueto the ice environment within the St. Marys Riversystem. Report to the Detroit District, U.S. ArmyCorps of Engineers by Lake Superior State Col-
lege in support of the Winter Navigation Board—Environmental Evaluation Work Group, ContractNo. DACW-35-79-M-0561.Gleason, G.R., D.J. Behmer and K.L. Vincent(1979) Evaluation of benthic dislocation due topressure waves initiated by vessel passage in theSt. Marys River. Report to the Great Lakes BasinCommission by Lake Superior State College insupport of the Winter Navigation Board—Envi-ronmental Evaluation Work Group.Haas, R.C., W.C. Bryant, K.D. Smith and A.D.Nuhfer (1985) Movement and harvest of fish inLake St. Clair, St. Clair River, and Detroit River.Michigan Department of Natural Resources, Fish-eries Division, Contract Report to the Detroit Dis-trict, U.S. Army Corps of Engineers.Hanamoto, B. (1977) Lockwall deicing studies.USA Cold Regions Research and EngineeringLaboratory, Special Report 77-22.Hatcher, C.O. (1977) Evaluation of environmen-tal impact data—Saginaw waste heat demonstra-tion program, April 1973 through September 1976.Fish and Wildlife Service, Great Lakes FisheriesLaboratory.Haynes, F.D. and M. Määttänen (1981) Vibrationscaused by ship traffic on an ice-covered water-way. USA Cold Regions Research and Engineer-ing Laboratory, CRREL Report 81-5.Hiltunen, J.K. (1979) Investigation of macro-benthos in the St. Marys River during an experi-ment to extend navigation through winter, 1974-75. (Revised from version of 1978), U.S. Fish andWildlife Service Report to the Detroit District, U.S.Army Corps of Engineers.Hochstein, A.B. and C.E. Adams (1985a) An as-sessment of the effects of tow movements on theKanawha River. Contract report to the Hunting-ton District, U.S. Army Corps of Engineers.Hochstein, A.B. and C.E. Adams (1985b) A nu-merical model of the effects of propeller wash fromcommercial navigation in an extended navigationseason on erosion, sedimentation, and water qual-ity in the Great Lakes connecting channels andharbors. Contract report to the Detroit District,U.S. Army Corps of Engineers.Hochstein, A.B. and C.E. Adams (1986) A nu-merical model of the effects of propeller wash andship-induced waves from commercial navigationin an extended navigation season on erosion, sedi-mentation, and water quality in the Great Lakesconnecting channels and harbors. Contract reportto the Detroit District, U.S. Army Corps of Engi-neers.
49
Hodek, R.J., M.D. Annable, G.R. Alger and H.S.Santeford (1986) Development of a predictivemodel to assess the effects of extended season nav-igation on Great Lakes connecting waters. Con-tract Report to the USA Cold Regions Researchand Engineering Laboratory by Michigan Tech-nological University, Contract No. DACA89-85-K-0001.Hudson, P.L., B.M. Davis, S.J. Nichols and C.M.Tomcko (1986) Environmental studies of macro-zoobenthos, aquatic macrophytes, and juvenilefishes in the St. Clair–Detroit River system, 1983–1984. U.S. Fish and Wildlife Service, Great LakesFisheries Laboratory, Contract Report to the De-troit District, U.S. Army Corps of Engineers.Itagaki, K., M. Frank and S.F. Ackley (1975) Labo-ratory experiments on lock wall deicing usingpneumatic devices. USA Cold Regions Researchand Engineering Laboratory, Technical Note (un-published).Jude, D.J., M. Winnel, M.S. Evans, F.J. Tesar andR. Futyma (1986) Drift of zooplankton, benthos,and larval fish and distribution of macrophytesand larval fish during winter and summer, 1985.Contract report to the Detroit District, U.S. ArmyCorps of Engineers by the University of Michi-gan, Contract No. DACW35-85-C-0005.Liston, C.R. and C.D. McNabb (1986) Limnologi-cal and fisheries studies of the St. Marys River,Michigan, in relation to proposed extension ofthe navigation season, 1982 and 1983. ContractReport to the U.S. Fish and Wildlife Service byMichigan State University, Contract No. 14-16-0009-790-13Muth, K.M., D.R. Wolfert and M.T. Bur (1986)Environmental study of fish spawning and nurs-ery areas in the St. Clair-Detroit River system. U.S.Fish and Wildlife Service, Sandusky BiologicalStation, Contract Report to the Detroit District,U.S. Army Corps of Engineers.National Biocentric, Inc. (1973) Environmentalreview report for demonstration bubbler systemin the Superior entry, Duluth–Superior Harbor.Prepared for the St. Paul District, U.S. Army Corpsof Engineers, Contract No. DACW37-73-C-0058.Nicholson, S.A. and K.W. Dixon (1979) Reviewand evaluation of existing contingency plans andresponse capabilities for spills of oil and hazard-ous substances in the Great Lakes system. Con-tract report to the Detroit District, U.S. Army Corpsof Engineers by the St. Lawrence–Eastern OntarioCommission, Contract No. DACW35-79-R-0042.Normandeau Associates (1979) Ship generated
drawdown and surge study, St. Lawrence Rivernear Ogdensburg, New York. Prepared for the St.Lawrence Seaway Development Corporation,Washington, D.C.Ofuya, A.O. (1970) Shore erosion-ship and windwaves, St. Clair, Detroit, and St. Lawrence Riv-ers. Department of Public Works of Canada, Ma-rine Directorate, Design and Construction Branch,Report No. 21.Oswalt, N.R. (1976) Ice flushing from St. LawrenceSeaway locks. Prepared for the St. Lawrence Sea-way Development Corporation by the USA En-gineer Waterways Experiment Station, TechnicalReport H-76-9.Palm, D.J. (1977a) Evaluation of shore structuresand shore erodibility, St. Lawrence River, NewYork State. Prepared by the St. Lawrence–East-ern Ontario Commission for the St. LawrenceSeaway Development Corporation, U.S. Depart-ment of Transportation.Palm, D.J. (1977b) Evaluation of shore structuresand shore erodibility, St. Lawrence River, NewYork State, Appendix B. Prepared by the St.Lawrence–Eastern Ontario Commission for theSt. Lawrence Seaway Development Corporation,U.S. Department of Transportation.Palm, D.J. and T.M. Cutter (1978) Evaluation ofshore structures and shore erodibility, St. LawrenceRiver, New York State, Phase II. Prepared by theSt. Lawrence–Eastern Ontario Commission for theSt. Lawrence Seaway Development Corporation,U.S. Department of Transportation.Perham, R.E. (1974) Forces generated in ice boomstructures. USA Cold Regions Research and En-gineering Laboratory, Special Report 200.Perham, R.E. (1976) Some economic benefits ofice booms. Proceedings, 2nd International Sympo-sium on Cold Regions Engineering, Fairbanks, Alaska,12–14 August, University of Alaska–Fairbanks. ColdRegions Engineers Professional Association, p.570–591.Perham, R.E. (1977) St. Marys River ice booms:Design force estimate and field measurements.USA Cold Regions Research and EngineeringLaboratory, CRREL Report 77-4.Perham, R.E. (1978a) Performance of the St. MarysRiver ice booms 1976–77. USA Cold Regions Re-search and Engineering Laboratory, CRREL Re-port 78-24.Perham, R.E. (1978b) Ice and ship effects on theSt. Marys River ice boom. Canadian Journal of CivilEngineering, 5: 222–230.Perham, R.E. (1984) The effectiveness and influ-
50
ences of the navigation ice boom on the St. MarysRiver. USA Cold Regions Research and Engineer-ing Laboratory, CRREL Report 84-4.Perham, R.E. (1985) Determining the effective-ness of a navigable ice boom. USA Cold RegionsResearch and Engineering Laboratory, Special Re-port 85-17.Poe, T.P. and T.A. Edsall (1982) Effects of vessel-induced waves on the composition and amountof drift in an ice environment in the St. MarysRiver. Fish and Wildlife Service, Great Lakes Fish-eries Laboratory Administrative Report No. 82-6.Poe, T.P., T.A. Edsall and J.K. Hiltunen (1980)Effects of ship-induced waves in an ice environ-ment on the St. Marys River ecosystem. U.S. Fishand Wildlife Service, Great Lakes Fisheries Labo-ratory, Administrative Report 80-6.Robinson, W.L. and R.W. Jensen (1980) Effectsof winter navigation on waterfowl and raptorialbirds in the St. Marys River area. Report to theGreat Lakes Basin Commission by Northern Michi-gan University in support of the Winter Naviga-tion Board-Environmental Evaluation WorkGroup.Rumer, R.R., W.F. Bialis, F.H. Quinn, R.A. Asseland D.W. Gaskill (1983) Niagara River ice boom,effect on environment. Journal of Technical Topicsin Civil Engineering, American Society of Civil En-gineers, 109(2): 104–116.Schulze, R.H. and M. Horne (1982) Probabilityof hazardous substance spills on the St. Clair/Detroit River system. Contract Report to the De-troit District, U.S. Army Corps of Engineers byArctec, Inc., Contract No. DACW35-82-C-0049.Schulze, R.H., G. Wohl and L. Wallendorf (1982)Probability of hazardous substance spills on theSt. Marys River. Contract report to the DetroitDistrict, U.S. Army Corps of Engineers by Arctec,Inc., Contract No. DACW35-81-C-0076.Shen, H.T., P.D. Yapa and M.E. Petroski (1986)Simulation of oil slick transport in Great Lakesconnecting channels, Four volumes: 1) Theory andmodel formulation, 2) User’s manual for the riveroil spill simulation model, 3) User’s manual forthe lake-river oil spill simulation model, and 4)User’s manual for the microcomputer-based in-teractive program). Contract Report to the USACold Region Research and Engineering Labora-tory by Clarkson University, Clarkson Report No.86-1, Contract No. DACA33-85-C-0001.Sletten, R.S. (1986) Investigation of potential waterquality effects on the Detroit-St. Clair River sys-tem from operation of the Sault Locks to 31 Janu-
ary + 2 weeks. Contract Report to Detroit Dis-trict, U.S. Army Corps of Engineers by the USACold Regions Research and Engineering Labora-tory (Draft).Sodhi, D.S., D.J. Calkins, and D.S. Deck (1982)Model study of Port Huron ice control structure:wind stress simulation. USA Cold Regions Re-search and Engineering Laboratory, CRREL Re-port 82-9.Sorenson, R.M. (1973) Water waves produced byships. Journal of the Waterways, Harbors and CoastalEngineering Division, American Society of Civil En-gineers, 99(WW2): 245–256.Stortz, K.R. and M. Sydor (1980) Transports inthe Duluth–Superior Harbor. Journal of Great LakesResearch, International Association for Great LakesResearch, 6(3): 223–231.Swain, W.R., R.M. Wilson, R.P. Neri and G.S.Porter (1975) Evaluation of the effects of a har-bor bubbler system for winter navigation on thewater quality of Howards Bay in the Duluth–Superior Harbor—Winter 1974-75. Prepared forthe St. Paul District, U.S. Army Corps of Engi-neers by the University of Minnesota-Duluth,Contract No. DACW37-75-C-0124.Sydor, M., B.O. Krogstad and T.O. Odlaug (1974)Evaluation of bubbler system for winter naviga-tion, Howards Bay, Superior, Wisconsin, winter 1973–74. Prepared for the St. Paul District, U.S. ArmyCorps of Engineers by the University of Minne-sota-Duluth, Contract No. DACW37-74-C-0060.USACE (1969) Survey report on Great Lakes andSt. Lawrence Seaway navigation season extension:Main report and final environmental impact state-ment. Prepared by the U.S. Army Corps of Engi-neers, Detroit District.USACE (1974) Report on effects of winter navi-gation on erosion of shoreline and structure dam-age along the St. Marys River, Michigan. Preparedby the Detroit District, U.S. Army Corps of Engi-neers, Draft Report.USACE (1978) Model study of the Little Rapidscut area of the St. Marys River, Michigan. Pre-pared by the U.S. Army Corps of Engineers, De-troit District.USACE (1979a) Final survey study for Great Lakesand St. Lawrence Seaway navigation season ex-tension: Main report and final environmentalimpact statement. Prepared by the U.S. ArmyCorps of Engineers, Detroit District.USACE (1980) St. Marys River–Little Rapids cutice boom and its effects on levels and flows inthe Soo Harbor, winter of 1979-80. Prepared by
51
the U.S. Army Corps of Engineers, Detroit Dis-trict.USACE (1982) Ice Engineering. U.S. Army Corpsof Engineers, Office of the Chief of Engineers, En-gineer Manual EM 1110-2-1612.USACE (1988) Draft environmental impact state-ment: Supplement II to the final environmen-tal impact statement—operations, maintenance,and minor improvements of the federal facili-ties at Sault Ste. Marie, Michigan (July 1977),operation of the lock facilities to 31 January + 2weeks. Detroit District, U.S. Army Corps ofEngineers.USACE-SLSA (1972) Report on vessel speed andwave study, Detroit and St. Clair Rivers. U.S. ArmyCorps of Engineers, Detroit District and Opera-tions Branch, St. Lawrence Seaway Authority.USACERC (1984) Shore Protection Manual. U.S.Army Corps of Engineers, Coastal EngineeringResearch Center.USCG (1973) Oil pollution problems associatedwith the extended navigation season.U.S. CoastGuard, p. 133–156.Uzuner, M.S. (1975) Copeland cut ice boom de-sign criteria and data analysis, winter 1974-75.Report to the St. Lawrence Seaway DevelopmentCorporation, Vol. 1 of 2.WNB (1979) Demonstration program final report.Prepared by the Great Lakes and St. LawrenceSeaway Winter Navigation Board.Wuebben, J.L. (1977) Ship induced vibration pro-gram, St. Marys River. USA Cold Regions Researchand Engineering Laboratory, Technical Note (un-published).Wuebben, J.L. (1978) Vessel passage during winterice conditions: Observations of 25 January 1978.Letter report to the Detroit District, U.S. ArmyCorps of Engineers, from the USA Cold RegionsResearch and Engineering Laboratory (unpub-lished).Wuebben, J.L. (1981a) St. Marys River: Shorelineerosion and shore structure damage, 1980 closednavigation season. Contract report to the Detroit
District, U.S. Army Corps of Engineers by the USACold Regions Research and Engineering Lab-oratory, Contract No. NCE-IA-80-035.Wuebben, J.L. (1981b) Evaluation of the effect ofvessel size on shoreline and shore structure dam-age. Prepared for the Detroit District, U.S. ArmyCorps of Engineers by the USA Cold Regions Re-search and Engineering Laboratory.Wuebben, J.L. (1981c) St. Marys River: Shorelineerosion and shore structure damage, 1980–81closed navigation season. Contract report to theDetroit District, U.S. Army Corps of Engineersby the USA Cold Regions Research and Engineer-ing Laboratory, Contract No. NCE-IS-81-0027-ER.Wuebben, J.L. (1983a) Effect of vessel size on shore-line and shore structure damage along the GreatLakes connecting channels. USA Cold RegionsResearch and Engineering Laboratory, SpecialReport 83-11.Wuebben, J.L. (1983b) Shoreline erosion and shorestructure damage on the St. Marys River, 1980closed navigation season. USA Cold Regions Re-search and Engineering Laboratory, Special Re-port 83-15.Wuebben, J.L., G.R. Alger and R.J. Hodek (1978a)Ice and navigation related sedimentation. Proceed-ings of the Fourth International Symposium on IceProblems sponsored by the International Associationfor Hydraulic Research, Luleå, Sweden, August, p.393–403.Wuebben, J.L., L.W. Gatto and S.L. DenHartog(1978b) Assessment of shoreline areas potentiallyimpacted during winter navigation. Contract re-port to Detroit District, U.S. Army Corps of En-gineers, USA Cold Regions Research and Engi-neering Laboratory, Internal Report No. 590.Wuebben, J.L., W.M. Brown and L.J. Zabilansky(1984) Analysis of the physical effects of commer-cial vessel passage through the Great Lakes con-necting channels. Contract to the Detroit District,U.S. Army Corps of Engineers by the USA ColdRegions Research and Engineering Laboratory,Internal Report 884.
52
1. AGENCY USE ONLY (Leave blank) 2. REPORT DATE 3. REPORT TYPE AND DATES COVERED
4. TITLE AND SUBTITLE 5. FUNDING NUMBERS
6. AUTHORS
7. PERFORMING ORGANIZATION NAME(S) AND ADDRESS(ES) 8. PERFORMING ORGANIZATION REPORT NUMBER
9. SPONSORING/MONITORING AGENCY NAME(S) AND ADDRESS(ES) 10. SPONSORING/MONITORING AGENCY REPORT NUMBER
11. SUPPLEMENTARY NOTES
12a. DISTRIBUTION/AVAILABILITY STATEMENT 12b. DISTRIBUTION CODE
13. ABSTRACT (Maximum 200 words)
14. SUBJECT TERMS 15. NUMBER OF PAGES
16. PRICE CODE
17. SECURITY CLASSIFICATION 18. SECURITY CLASSIFICATION 19. SECURITY CLASSIFICATION 20. LIMITATION OF ABSTRACT OF REPORT OF THIS PAGE OF ABSTRACT
NSN 7540-01-280-5500 Standard Form 298 (Rev. 2-89)Prescribed by ANSI Std. Z39-18298-102
REPORT DOCUMENTATION PAGEForm ApprovedOMB No. 0704-0188
Public reporting burden for this collection of information is estimated to average 1 hour per response, including the time for reviewing instructions, searching existing data sources, gathering andmaintaining the data needed, and completing and reviewing the collection of information. Send comments regarding this burden estimate or any other aspect of this collection of information,including suggestion for reducing this burden, to Washington Headquarters Services, Directorate for Information Operations and Reports, 1215 Jefferson Davis Highway, Suite 1204, Arlington,VA 22202-4302, and to the Office of Management and Budget, Paperwork Reduction Project (0704-0188), Washington, DC 20503.
May 1995
Winter Navigation on the Great Lakes: A Review of Environmental Studies
Intra-Army ReimbursableOrder NCE-IA-860127
James L. Wuebben, Editor
U.S. Army Cold Regions Research and Engineering Laboratory72 Lyme Road CRREL Report 95-10Hanover, New Hampshire 03755-1290
U.S. Army Engineer District, Detroit
Approved for public release; distribution is unlimited.
Available from NTIS, Springfield, Virginia 22161
59Great Lakes Navigation Winter navigation
UNCLASSIFIED UNCLASSIFIED UNCLASSIFIED UL
In 1970, Congress authorized a three-part Great Lakes–St. Lawrence Seaway Navigation Season Extension Pro-gram. It authorized a winter navigation demonstration program, a detailed survey study of season extensionfeasibility and a study of insurance rates for shippers. This report provides a review of numerous environmentaland engineering studies conducted as part of the demonstration and feasibility portions of the program, as wellas many environmental studies conducted after the completion of the original program. Topics include sedi-ment transport, shoreline erosion, shore structure damage, oil and hazardous substance spills, biological effects,ship-induced vibrations and ice control systems.
Related Documents