Crowding is size and eccentricity dependent Department of Psychology, Concordia University, Montreal, Quebec, Canada Rick Gurnsey Department of Psychology, Concordia University, Montreal, Quebec, Canada Gabrielle Roddy Department of Psychology, Concordia University, Montreal, Quebec, Canada Waël Chanab Crowding is a form of lateral interaction in which flanking items interfere with the detection or discrimination of a target stimulus. It is believed that crowding is a property of peripheral vision only and that no crowding occurs at fixation. If these two claims are true, then there must be a change in the nature of crowding interactions across the visual field. In three different tasks, we determined target size and flanker separation at threshold for eccentricities of 0 to 16- in the lower visual field for 7 relative separations (1.25 to 8 times target size). In all three tasks, the magnitude of crowding increases with eccentricity; there was no crowding at fixation and extreme crowding at 16-. Using a novel double-scaling procedure, we show that the non-foveal data in all three tasks can be characterized as shifted versions of the same psychometric function such that different sections of the function characterize data at each eccentricity. This pattern of results can be understood in terms of size-dependent responses to the target and distance-dependent interference from the flankers. The data suggest that the distance-dependent interference increases with eccentricity. Keywords: crowding, size scaling, peripheral vision Citation: Gurnsey, R., Roddy, G., & Chanab, W. (2011). Crowding is size and eccentricity dependent. Journal of Vision, 11(7):15, 1–17, http://www.journalofvision.org/content/11/7/15, doi:10.1167/11.7.15. Introduction It is well known that eccentricity-dependent stimulus magnification frequently compensates for eccentricity- dependent sensitivity loss. In such cases, any level of sensitivity at the fovea can be matched at any eccentricity given sufficient stimulus magnification. In many cases, the needed magnification (scaling) increases linearly with eccentricity so that if s 0 is stimulus size at fovea, then s E = s 0 (1 + E/E 2 ) is the stimulus size at eccentricity E required to elicit equivalent-to-foveal performance; E 2 is a task-dependent constant. The success of magnification in overcoming eccentricity-dependent sensitivity loss encourages the view that peripheral vision is simply a scaled version of foveal vision, i.e., the mechanisms available at each eccentricity are the same in all respects and differ only in scale (Gurnsey, Poirier, Bluett, & Leibov, 2006; Gurnsey, Roddy, Ouhnana, & Troje, 2008; Makela, Whitaker, & Rovamo, 1993; Rovamo & Virsu, 1979; Watson, 1987; Weymouth, 1958; Whitaker, Latham, Makela, & Rovamo, 1993; Whitaker, Makela, Rovamo, & Latham, 1992; Whitaker, Rovamo, MacVeigh, & Ma ¨kela ¨, 1992). Such studies address eccentricity-dependent changes in sensitivity to isolated stimuli. In the real world, however, we are rarely confronted with isolated stimuli (i.e., on a homogenous, untextured background). Therefore, a full understanding of peripheral vision must deal with sensitivity to targets in the presence of non- target items. A large number of studies addressing this question fall in the category of “crowding studies.” Crowding refers to the deleterious effect of surround- ing stimuli (crowders or flankers) on the identification of a target. If peripheral vision were a scaled version of foveal vision, then the effect of crowders on target identification should be the same across the visual field. However, this is clearly not the case. When foveal and peripheral stimuli presented at peri-threshold size are surrounded with flankers of the same size at separations proportional to target size, there is far greater disruption in the periphery than at fixation (Toet & Levi, 1992; for reviews, see Levi, 2008; Pelli, Palomares, & Majaj, 2004). This undermines the notion that the visual system employs mechanisms at each eccentricity that are identical in all respects except scale. The failure of a single magnification factor to equate performance across the visual field does not invalidate the utility of magnification in explaining the relationship between foveal and peripheral vision. It is well known that uniform, eccentricity-dependent magnifications sometimes fail to equate performance across the visual field (Latham & Whitaker, 1996; Melmoth, Kukkonen, Ma ¨kela ¨, & Rovamo, 2000; Poirier & Gurnsey, 2002, 2005; Toet & Levi, 1992; Yu & Essock, 1996). Often, more than one Journal of Vision (2011) 11(7):15, 1–17 http://www.journalofvision.org/content/11/7/15 1 doi: 10.1167/11.7.15 Received September 27, 2010; published June 17, 2011 ISSN 1534-7362 * ARVO

Welcome message from author
This document is posted to help you gain knowledge. Please leave a comment to let me know what you think about it! Share it to your friends and learn new things together.
Transcript
Crowding is size and eccentricity dependentDepartment of Psychology, Concordia University,
Montreal, Quebec, CanadaRick Gurnsey
Department of Psychology, Concordia University,Montreal, Quebec, CanadaGabrielle Roddy
Department of Psychology, Concordia University,Montreal, Quebec, CanadaWaël Chanab
Crowding is a form of lateral interaction in which flanking items interfere with the detection or discrimination of a targetstimulus. It is believed that crowding is a property of peripheral vision only and that no crowding occurs at fixation. If thesetwo claims are true, then there must be a change in the nature of crowding interactions across the visual field. In threedifferent tasks, we determined target size and flanker separation at threshold for eccentricities of 0 to 16- in the lower visualfield for 7 relative separations (1.25 to 8 times target size). In all three tasks, the magnitude of crowding increases witheccentricity; there was no crowding at fixation and extreme crowding at 16-. Using a novel double-scaling procedure, weshow that the non-foveal data in all three tasks can be characterized as shifted versions of the same psychometric functionsuch that different sections of the function characterize data at each eccentricity. This pattern of results can be understood interms of size-dependent responses to the target and distance-dependent interference from the flankers. The data suggestthat the distance-dependent interference increases with eccentricity.
Keywords: crowding, size scaling, peripheral vision
Citation: Gurnsey, R., Roddy, G., & Chanab, W. (2011). Crowding is size and eccentricity dependent. Journal of Vision,11(7):15, 1–17, http://www.journalofvision.org/content/11/7/15, doi:10.1167/11.7.15.
Introduction
It is well known that eccentricity-dependent stimulusmagnification frequently compensates for eccentricity-dependent sensitivity loss. In such cases, any level ofsensitivity at the fovea can be matched at any eccentricitygiven sufficient stimulus magnification. In many cases, theneeded magnification (scaling) increases linearly witheccentricity so that if s0 is stimulus size at fovea, thensE = s0 (1 + E/E2) is the stimulus size at eccentricity Erequired to elicit equivalent-to-foveal performance; E2
is a task-dependent constant. The success of magnificationin overcoming eccentricity-dependent sensitivity lossencourages the view that peripheral vision is simply ascaled version of foveal vision, i.e., the mechanismsavailable at each eccentricity are the same in all respectsand differ only in scale (Gurnsey, Poirier, Bluett, &Leibov, 2006; Gurnsey, Roddy, Ouhnana, & Troje, 2008;Makela, Whitaker, & Rovamo, 1993; Rovamo & Virsu,1979;Watson, 1987; Weymouth, 1958; Whitaker, Latham,Makela, & Rovamo, 1993; Whitaker, Makela, Rovamo, &Latham, 1992; Whitaker, Rovamo, MacVeigh, & Makela,1992). Such studies address eccentricity-dependentchanges in sensitivity to isolated stimuli. In the realworld, however, we are rarely confronted with isolatedstimuli (i.e., on a homogenous, untextured background).
Therefore, a full understanding of peripheral vision mustdeal with sensitivity to targets in the presence of non-target items. A large number of studies addressing thisquestion fall in the category of “crowding studies.”Crowding refers to the deleterious effect of surround-
ing stimuli (crowders or flankers) on the identification ofa target. If peripheral vision were a scaled version offoveal vision, then the effect of crowders on targetidentification should be the same across the visual field.However, this is clearly not the case. When foveal andperipheral stimuli presented at peri-threshold size aresurrounded with flankers of the same size at separationsproportional to target size, there is far greater disruptionin the periphery than at fixation (Toet & Levi, 1992; forreviews, see Levi, 2008; Pelli, Palomares, & Majaj, 2004).This undermines the notion that the visual system employsmechanisms at each eccentricity that are identical in allrespects except scale.The failure of a single magnification factor to equate
performance across the visual field does not invalidate theutility of magnification in explaining the relationshipbetween foveal and peripheral vision. It is well known thatuniform, eccentricity-dependent magnifications sometimesfail to equate performance across the visual field (Latham& Whitaker, 1996; Melmoth, Kukkonen, Makela, &Rovamo, 2000; Poirier & Gurnsey, 2002, 2005; Toet &Levi, 1992; Yu & Essock, 1996). Often, more than one
Journal of Vision (2011) 11(7):15, 1–17 http://www.journalofvision.org/content/11/7/15 1
doi: 10 .1167 /11 .7 .15 Received September 27, 2010; published June 17, 2011 ISSN 1534-7362 * ARVO
aspect of a stimulus must be scaled (magnified) witheccentricity to elicit equivalent-to-foveal performance.For example, Toet and Levi (1992) showed that the rateat which interference zones increase with eccentricity isfar greater than that at which resolution thresholdsincrease with eccentricity. Melmoth et al. (2000) showedthat both stimulus size and contrast had to be scaled witheccentricity to eliminate eccentricity-dependent variabilityfrom their face discrimination data. Poirier and Gurnsey(2002) showed that two magnification factors wererequired to equate sensitivity to subjective contours acrossthe visual field; one scaled the length of the subjectivecontour and the other scaled the wavelength of the carriergrating.Latham and Whitaker (1996) explicitly addressed the
issue of crowding from a double-scaling perspective andexpanded on the work of Toet and Levi (1992). Theirsubjects were asked to identify the orientation (horizontalor vertical) of a target grating in isolation or surrounded(above, below, and to either side) by identical gratingpatches that were randomly horizontal or vertical. Theydetermined the stimulus size required to achieve thresh-old-level accuracy (75% correct in a two-alternative,forced-choice task). At each of four eccentricities (0, 2.5,5, and 10-), threshold was obtained at edge-to-edgeseparations of 0.25 to 7 times target size, whichcorresponded to center-to-center separations of 1.25 to 8times target size. From these data, Latham and Whitaker(1996) were able to express the separation (criticalseparation, scrit) needed to achieve a particular thresholdelevation (flanked vs. unflanked size threshold, Trel) at anygiven eccentricity (E) in terms of two free parameters:
scrit ¼ s2=E2H
ðTrel j 1Þ Eþ E2Hð Þ; ð1Þ
where Trel = Tflanked/Tunflanked, s2 is the separation atfixation at which size (resolution) threshold was twice theunflanked threshold, and E2H is the eccentricity at whichthe separation eliciting Trel doubles. It is clear from thisformulation that scrit will be proportional to eccentricitywhen E2H/E is small, but the exact proportion depends onTrel. The Latham and Whitaker approach provides themodel for the current study, although our data deviate ininteresting ways from theirs.There is an emerging consensus about the features of
crowding that distinguish it from other types of interactionthat fall under the rubric of masking. Two of these arewidely reported. First, crowding is thought to be princi-pally a phenomenon of peripheral vision (Levi, 2008; Pelliet al., 2004), i.e., crowding typically does not occur atfixation and target–flanker interactions at fixation may beunderstood as simple masking (Levi, Klein, & Hariharan,2002). Second, the spatial extent of target–flanker inter-action is proportional to eccentricity and independent ofstimulus size (Bouma, 1970; Levi, Klein et al., 2002). (As
noted, this must be true if scrit increases rapidly andlinearly with eccentricity.)There are two aspects of the Latham and Whitaker data
that tend to challenge the consensus view of crowding.First, Latham and Whitaker found a degree of crowding atfixation, which challenges the notion that crowding is apurely peripheral phenomenon, although the magnitude offoveal crowding was far less than that of peripheralcrowding (Pelli et al., 2004; Toet & Levi, 1992).Second, the relationship between target size at threshold
and target–crowder separation at threshold found byLatham and Whitaker (1996) is inconsistent with thenotion that critical separation is independent of target size(Bouma, 1970; Pelli et al., 2004; Tripathy & Cavanagh,2002). If scrit were independent of target size, then, in theLatham and Whitaker study, the product of target size andrelative separation at threshold should be a constant (scrit =Tsize * relSep). In other words, to keep performance at75% correct, relative separation must decrease as targetsize increases to keep scrit constant. However, it is clearfrom the data of Latham and Whitaker (Figure 4) that scritincreases as target size decreases. [It should be noted,however, that Latham and Whitaker defined target–flankerseparation as edge-to-edge separation, whereas otherauthors (Levi, Hariharan, & Klein, 2002; Pelli et al.,2004, 2007) define it as center-to-center separation. Whendefined as center-to-center separation, the size vs. separa-tion curves become steeper (see Figure 7).]In the present paper, we use the paradigm of Latham
and Whitaker to systematically examine the relationshipbetween stimulus size and crowder separation at thresholdacross the visual field. The following points motivate thepresent work.The claims that crowding is non-existent at fixation and
independent of target size in the periphery contrast withthe data of Latham and Whitaker; as mentioned, there wasboth crowding at fixation and size dependence at alleccentricities. Because theirs is the only one to employ adouble-scaling approach to crowding, it is conceivablethat the way crowding is measured has a profound effecton the conclusions one draws. Therefore, we replicate theLatham and Whitaker experiment and also use the samemethod to test for crowding at fixation using stimulipreviously employed by Pelli et al. (2004) and Tripathyand Cavanagh (2002) in the service of showing thatcrowding is size independent.Independent of Latham and Whitaker (1996), the twin
claims that crowding is non-existent at fixation andindependent of target size in the periphery implies thatat some eccentricities between fovea and “periphery”crowding is size dependent. In other words, there isunlikely to be a step function between states of nocrowding and size-independent crowding. More likely, atintermediate eccentricities, there is a trade-off betweentarget size and target–crowder separation such that largerseparations are required to maintain threshold perfor-mance as target size decreases. In fact, Tripathy and
Journal of Vision (2011) 11(7):15, 1–17 Gurnsey, Roddy, & Chanab 2
Cavanagh (2002) found the same tendency as Latham andWhitaker in this direction, although the change inseparation with decreasing size was not as pronounced.Therefore, using the method of Latham and Whitaker (andPoirier & Gurnsey, 2002), we hope to provide a system-atic evaluation of the changing nature of crowding acrossthe visual field.In addition, there is the question of whether critical
spacing is proportional to eccentricity. As Latham andWhitaker (1996) pointed out, this is almost certainly true,but the exact proportion of eccentricity will depend on thechange in performance used to define critical spacing.However, Pelli et al. (2004) found that for many observersscrit was not strictly proportional to eccentricity. Rather,scrit tended to increase with eccentricity. Finally, if criticalspacing (however defined) represents a hardwired con-straint, it is worth asking if it is task independent.Therefore, we bring together three sets of stimuli (drawnfrom Latham & Whitaker, 1996; Tripathy & Cavanagh,2002; Pelli et al., 2004) within a common paradigm toaddress this question.
Experiment 1
MethodsParticipants
There were four participants in the experiment (twomen and two women, mean age = 29). GR and WC wereauthors and P1 and P2 were experienced psychophysicalobservers with no prior experience in crowding experi-ments. All had normal or corrected-to-normal vision.
Apparatus
The experiments were conducted using an Intel MacProComputer equipped with a ViewSonic 222f 21-inch multi-scan monitor with the refresh rate set to 85 Hz and pixel
resolution set to 2048 horizontal by 1600 vertical. Allaspects of stimulus generation, presentation, and datacollection were under the control of MATLAB (Math-works) and the Psychophysics Toolbox extensions(Brainard, 1997; Pelli, 1997).
Stimuli and tasks
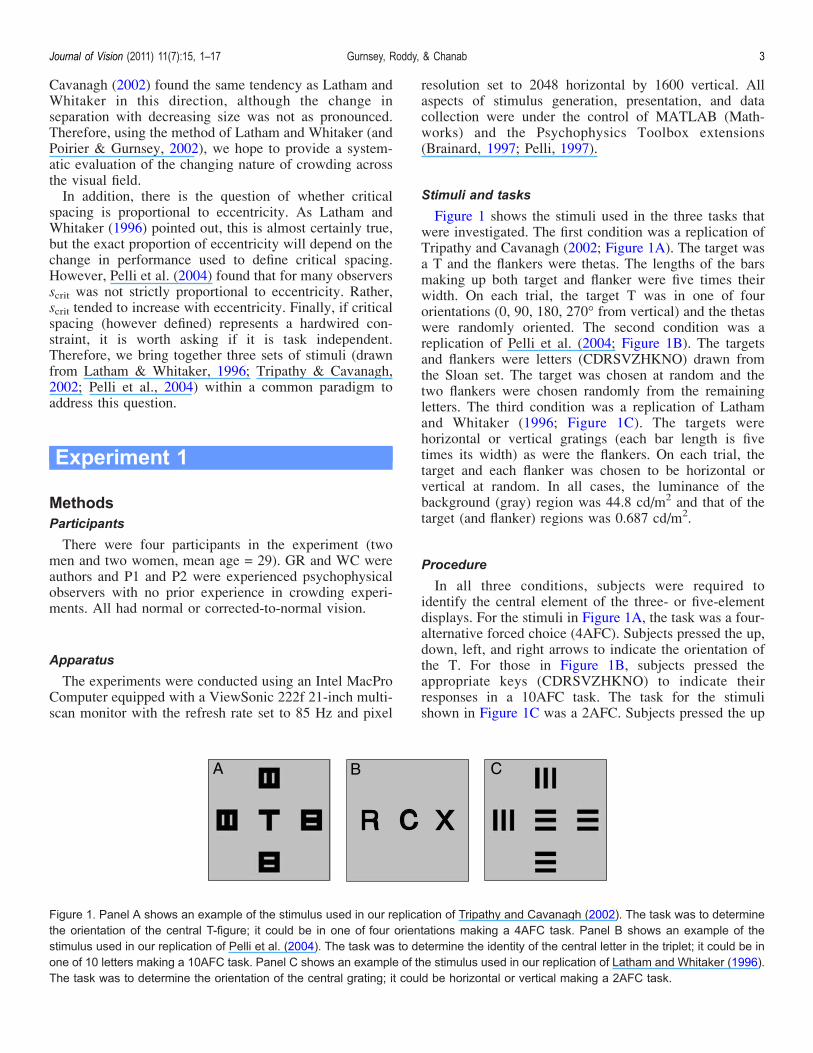
Figure 1 shows the stimuli used in the three tasks thatwere investigated. The first condition was a replication ofTripathy and Cavanagh (2002; Figure 1A). The target wasa T and the flankers were thetas. The lengths of the barsmaking up both target and flanker were five times theirwidth. On each trial, the target T was in one of fourorientations (0, 90, 180, 270- from vertical) and the thetaswere randomly oriented. The second condition was areplication of Pelli et al. (2004; Figure 1B). The targetsand flankers were letters (CDRSVZHKNO) drawn fromthe Sloan set. The target was chosen at random and thetwo flankers were chosen randomly from the remainingletters. The third condition was a replication of Lathamand Whitaker (1996; Figure 1C). The targets werehorizontal or vertical gratings (each bar length is fivetimes its width) as were the flankers. On each trial, thetarget and each flanker was chosen to be horizontal orvertical at random. In all cases, the luminance of thebackground (gray) region was 44.8 cd/m2 and that of thetarget (and flanker) regions was 0.687 cd/m2.
Procedure
In all three conditions, subjects were required toidentify the central element of the three- or five-elementdisplays. For the stimuli in Figure 1A, the task was a four-alternative forced choice (4AFC). Subjects pressed the up,down, left, and right arrows to indicate the orientation ofthe T. For those in Figure 1B, subjects pressed theappropriate keys (CDRSVZHKNO) to indicate theirresponses in a 10AFC task. The task for the stimulishown in Figure 1C was a 2AFC. Subjects pressed the up
Figure 1. Panel A shows an example of the stimulus used in our replication of Tripathy and Cavanagh (2002). The task was to determinethe orientation of the central T-figure; it could be in one of four orientations making a 4AFC task. Panel B shows an example of thestimulus used in our replication of Pelli et al. (2004). The task was to determine the identity of the central letter in the triplet; it could be inone of 10 letters making a 10AFC task. Panel C shows an example of the stimulus used in our replication of Latham and Whitaker (1996).The task was to determine the orientation of the central grating; it could be horizontal or vertical making a 2AFC task.
Journal of Vision (2011) 11(7):15, 1–17 Gurnsey, Roddy, & Chanab 3
and right arrow keys to indicate the orientation of thegrating.Stimuli were presented at 0, 1, 2, 4, 8, and 16- in the lower
visual field and subjects viewed them binocularly. The targetswere flanked by the non-target items at center-to-centerseparations of 1.25 to 8� target size in 7 equal logarithmicsteps. Stimuli were also tested in isolation, i.e., no flankers.Stimuli were always presented at the center of the screen.Viewing distance depended on eccentricity. Subjects viewedthe stimuli from 456 cm for 0- eccentricity, 228 cm for1- and 2- eccentricities, 114 cm for 4- eccentricity, 57 cmfor 8- eccentricity, and 40 cm for 16- eccentricity.For all eccentricities except 0-, a small green fixation
dot was placed above the stimulus. On each trial, stimuliwere presented for approximately 333 ms. Followingstimulus presentation, the fixation dot turned red until avalid response was given via the keyboard. Incorrectresponses were signaled by a 300-ms, 400-Hz tone.Stimulus size was controlled by Quest (Watson & Pelli,1983) and size thresholds were determined from two runswith a maximum of 100 trials each. Thresholds for theconditions shown in Figures 1A–1C were defined as 72%,67%, and 82%, respectively. These values correspond to
the mean of the underlying Weibull function whennormalized to the range of chance to 100% correct.
Results
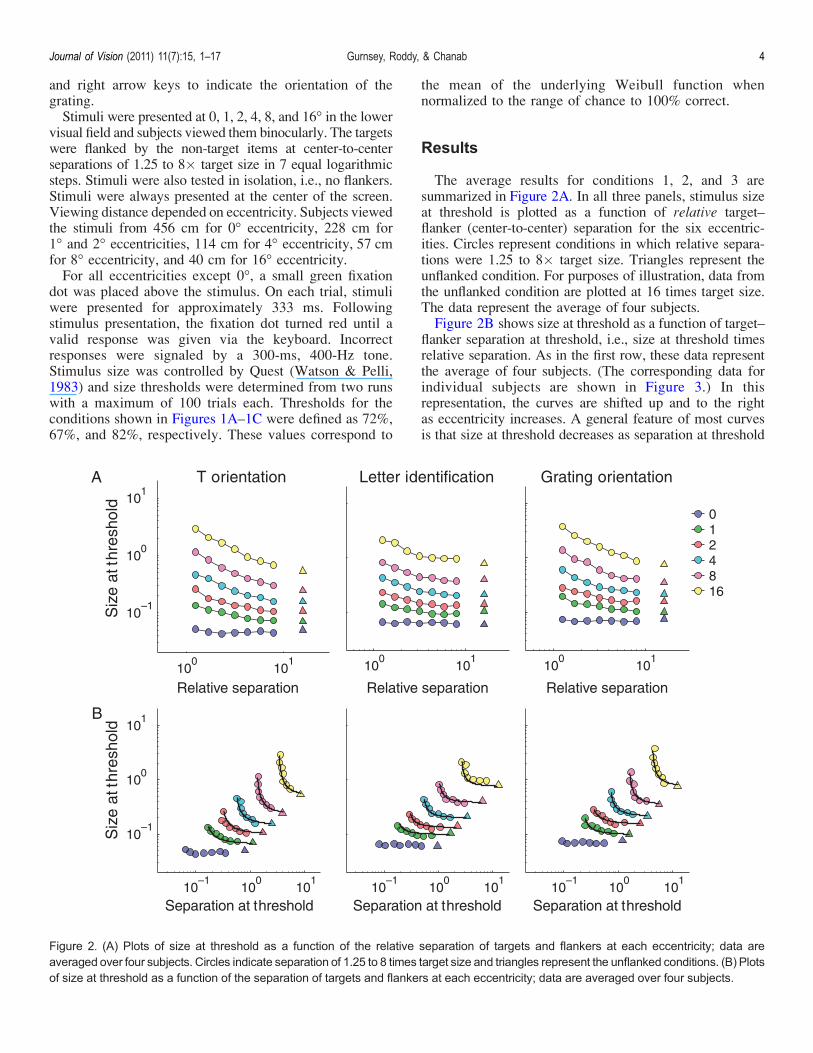
The average results for conditions 1, 2, and 3 aresummarized in Figure 2A. In all three panels, stimulus sizeat threshold is plotted as a function of relative target–flanker (center-to-center) separation for the six eccentric-ities. Circles represent conditions in which relative separa-tions were 1.25 to 8� target size. Triangles represent theunflanked condition. For purposes of illustration, data fromthe unflanked condition are plotted at 16 times target size.The data represent the average of four subjects.Figure 2B shows size at threshold as a function of target–
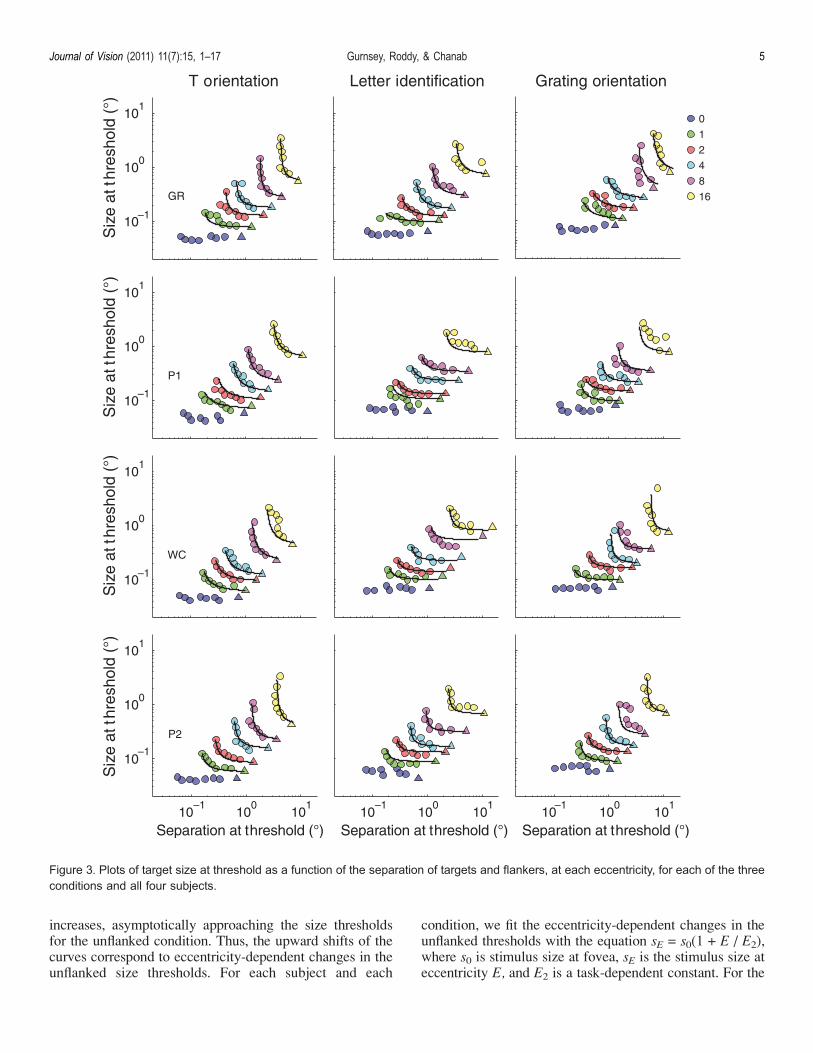
flanker separation at threshold, i.e., size at threshold timesrelative separation. As in the first row, these data representthe average of four subjects. (The corresponding data forindividual subjects are shown in Figure 3.) In thisrepresentation, the curves are shifted up and to the rightas eccentricity increases. A general feature of most curvesis that size at threshold decreases as separation at threshold
Figure 2. (A) Plots of size at threshold as a function of the relative separation of targets and flankers at each eccentricity; data areaveraged over four subjects. Circles indicate separation of 1.25 to 8 times target size and triangles represent the unflanked conditions. (B) Plotsof size at threshold as a function of the separation of targets and flankers at each eccentricity; data are averaged over four subjects.
Journal of Vision (2011) 11(7):15, 1–17 Gurnsey, Roddy, & Chanab 4
increases, asymptotically approaching the size thresholdsfor the unflanked condition. Thus, the upward shifts of thecurves correspond to eccentricity-dependent changes in theunflanked size thresholds. For each subject and each
condition, we fit the eccentricity-dependent changes in theunflanked thresholds with the equation sE = s0(1 + E / E2),where s0 is stimulus size at fovea, sE is the stimulus size ateccentricity E, and E2 is a task-dependent constant. For the
Figure 3. Plots of target size at threshold as a function of the separation of targets and flankers, at each eccentricity, for each of the threeconditions and all four subjects.
Journal of Vision (2011) 11(7):15, 1–17 Gurnsey, Roddy, & Chanab 5
T-orientation task, the mean E2 was 1.76 (SEM = 0.05;95% confidence interval = 1.59–1.93); for the letteridentification task, the mean E2 was 1.35 (SEM = 0.11;95% confidence interval = 1.01–1.69); for the gratingdiscrimination task, the mean E2 was 1.84 (SEM = 0.04;95% confidence interval = 1.72–1.97). These values are inline with previous reports of eccentricity-dependent changesin resolution thresholds (e.g., Latham & Whitaker, 1996).The critical question is whether a leftward shift, in
addition to a downward shift, would be sufficient tocollapse all data onto a single curve. We will show thatsuch shifts are sufficient to collapse all data (in eachcondition) onto a single curve, but the required shiftsviolate assumptions about the nature of crowding.The approaches of Latham and Whitaker (1996) and
Poirier and Gurnsey (2002) assume that the size vs.separation curves (at each eccentricity) are shiftedversions of each other in this two-dimensional space.However, in all three panels of Figure 2B, the most salientfeature is that the psychometric functions go from flat atfixation to increasingly steep as eccentricity increases. Forall three conditions, these changes reflect essentially nocrowding at fixation (size thresholds are independent oftarget–flanker separations) to extreme crowding at 8 and16- (separation at threshold is close to independent oftarget size). Therefore, one conclusion might be that thecurves are simply not shifted versions of each other but,rather, change shape with eccentricity.The counter to this argument is that the functions at each
eccentricity represent samples taken from different sectionsof the same underlying curve. If this were the case, it shouldbe possible to shift curves from all eccentricities onto asingle curve. To explore this, we employed a modifiedversion of the data fitting procedure described by Poirierand Gurnsey (2002). The data at each eccentricity wereassumed to conform to a rectangular parabola:
c2 ¼ ðsepj sepminÞðsizej sizeminÞ: ð2Þ
At fovea, size and sep are stimulus size and target–flankerseparation at threshold, respectively, sizemin is the size atwhich the parabola becomes parallel to the x-axis (i.e., thesize eventually reached in the no flanker condition), andsepmin is the separation at which the parabola becomesparallel to the y-axis (i.e., the separation eventually reachedas target size gets very large). The parabola describes allcombinations of size and separation eliciting thresholdperformance. By assumption, curves at any other eccen-tricity can be shifted onto the foveal curve by dividing size(or separation) by the appropriate scaling factor (1 + E/E2):
sizescaled ¼ size
1þ E=E2V
; ð3Þ
sepscaled ¼sep
1þ E=E2H
: ð4Þ
In Equation 3, E2V corresponds to the vertical (downward)shift, and in Equation 4, E2H corresponds to the horizontal(leftward) shift. To fit the data in Figure 2B, we used theMATLAB error minimization procedure (fminsearch) todetermine the values of c, sizemin, sepmin, E2V, and E2H
that provided the best fit to the data averaged over the foursubjects. (Analyses were also conducted in SPSS using thenon-linear regression routines to confirm the MATLABresults and establish bootstrapped 95% confidence inter-vals around the parameters. The results of both analyseswere identical.) Details of the data analysis strategy to fitthe rectangular parabola to the data can be found in Poirierand Gurnsey (2002).The results of this analysis (not shown) explained 98.3,
98.9, and 98.6% of the variability of the averaged data forthe T, letter, and grating conditions, respectively.Although this may seem impressive, it should be kept inmind that eccentricity makes a major contribution to thevariability in the data set and so even implausible fits mayaccount for it. Three limitations associated with the linearshifts (Equations 3 and 4) can be seen in Table 1. First, theleftward horizontal shift required to align the data isrepresented by E2H values on the order of 10j7, meaningthat the rate at which the extent of crowding regionsincrease with eccentricity is 107 times per degree visualangle. These implausible E2H values are accompanied bysepmin values also on the order of 10j7, meaning that thecenter-to-center separation at which size thresholdsbecome unmeasurable involves stimuli of 10j7 degreesof visual angle. Both of these failures relate to the fact thatthe size thresholds at fovea (blue dots in Figure 2) showno dependence on target–crowder separation and, thus, donot constrain the leftward shift of the curves. Theinstability of the fits is shown by the large 95% boot-strapped confidence intervals (upper and lower in Table 1)around these two parameters.A second failure of the linear model is that the reduction
of eccentricity-dependent variability from the data (98.6%on average) disguises the poor fit about the best fittingfunction. Specifically, the assumption that the requiredleftward shift is a linear function of eccentricity does nothold. In fact, the required leftward shift seems to acceleratewith eccentricity, implying a quadratic component to thefit. Therefore, a second fit was undertaken with Equation 4replaced by the following equation:
sepscaled ¼sep
1þ E!=": ð5Þ
Figure 4A shows the result of the fitting procedure foreach of the three conditions. The fitting procedure does agood job of eliminating eccentricity-dependent variabilityfrom the data, explaining 99.7, 99.4, and 99.5% of thevariability of the averaged data for the T, letter, and gratingconditions, respectively. The FChange statistics (FChange =(RNL
2 j RL2 ) / (1 j RNL
2 ) * (N j kNL j 1) / (kNL j kL))associated with the change in explained variance from the
Journal of Vision (2011) 11(7):15, 1–17 Gurnsey, Roddy, & Chanab 6
five-parameter (kL) linear (L) model to the six-parameter(kNL) non-linear (NL) model were FChange(1,42) = 191,34, and 74, for the T, letter, and grating conditions,respectively. Table 2 shows that the fits appear, primafacie, more plausible than those in Table 1, and thebootstrapped 95% confidence intervals are better behaved.From these analyses, one might argue that a linear verticalshift and a non-linear horizontal shift nicely account forthe apparent differences between the curves in Figure 2B(and Figure 3). This is consistent with the notion that datafrom each eccentricity simply reflect different samples ofthe same underlying curve.The difficulty with this argument is that the best fitting
functions predict stimulus configurations at and nearfixation that violate the assumptions about what consti-tutes crowding. In Figure 4A, the green rectangle in thebottom left of each panel plots the maximum predictedscaled size and the corresponding scaled separation.Typically, these points correspond to data from 16-eccentricity. When we express the center-to-center spac-ing in relative terms, we find that for the T-orientation,letter identification, and grating discrimination tasks thesecorrespond to 9.6%, 23.3%, and 15.5% of target size. Inall cases then, the predicted separation at fixation requiredto match the maximum observed size at threshold at 16- ismuch less than target size. This means that target andflankers would have to overlap, a condition that is outsidethe bounds of what is considered crowding and intomasking territory1 (Levi, 2008; Pelli et al., 2004).One may ask then, what the maximum predicted
crowding could be at fixation and other eccentricities. Toanswer these questions, we fit the data from each eccen-tricity in Figure 2B with a rectangular parabola, and fromthe fits, we determined 2E = separationE/sizeE = 1. We
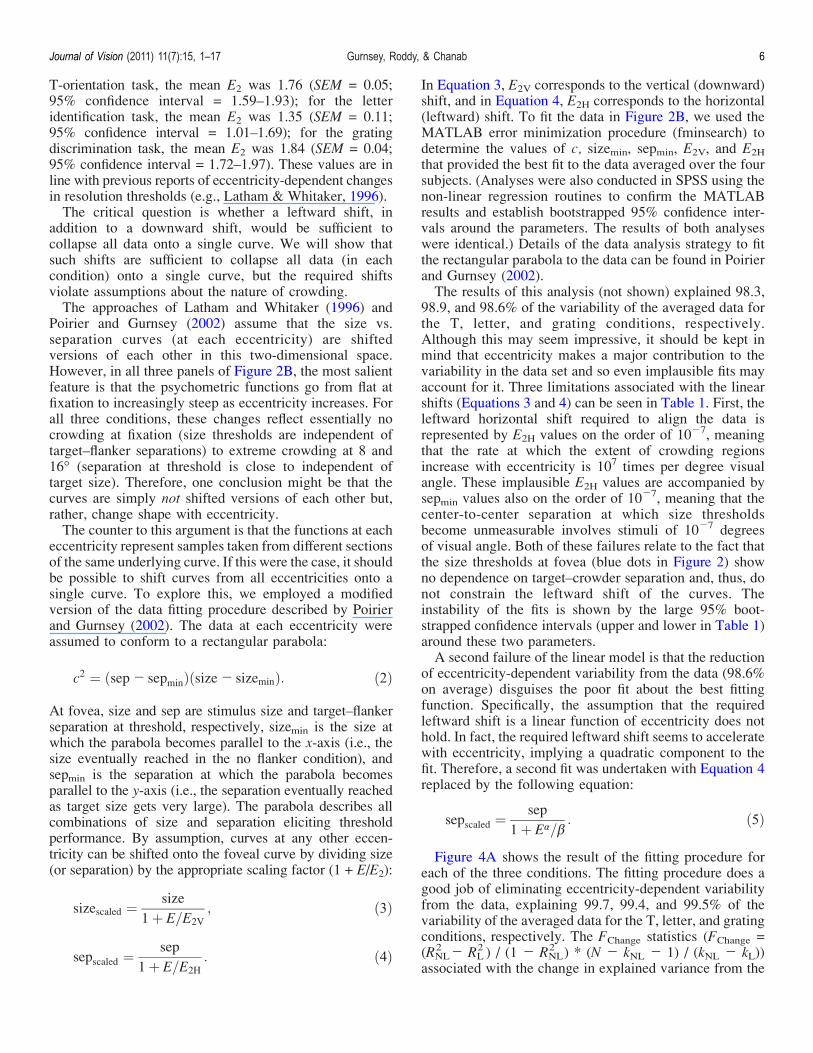
then compared predicted size in these conditions (2E =separationE/sizeE = 1) with size in the unflanked con-ditions. For T-orientation, letter identification, and gratingdiscrimination tasks, these correspond to increases atfixation of 27%, 29%, and 28%, respectively, over theunflanked conditions. These increases are dwarfed by the575%, 234%, and 586% increases seen at 16- in the T,letter, and grating tasks, respectively.2
The preceding analysis shows that although it ispossible to collapse all data onto a single function theassumptions underlying the fits lead to untenable con-clusions. Therefore, we reject the conclusion that thecurves at each eccentricity reflect different samples fromthe same underlying function.As noted, crowding can only exist for sep/size ratios of 1
or greater and so each such ratio represents a distinguishedpoint on each curve shown in Figure 2B and all curves inFigure 3. Therefore, if we were to left shift the data(Figure 2B) by dividing actual separation at each eccen-tricity by the separation at which sep/size is predicted tobe 1, we would align the points of maximum possiblecrowding. To find the point of maximum crowding, we fiteach curve in Figures 2B and 3 with a rectangular parabolaand, thus, determined 2E = separationE/sizeE = 1. FEH =2E/20 characterizes the relative shifts on the separation axis.Therefore, if we divide all separations at eccentricity E byFEH = 2E/20, the curves at each eccentricity will shiftleftward. A downward shift can be accomplished analo-gously. That is, FEV = unflankedE/unflanked0 expresses theunflanked threshold at each eccentricity relative to theunflanked threshold at fixation. Thus, dividing all sizes ateccentricity E by FEV = unflankedE/unflanked0 shifts curvesat each eccentricity downward. The results of these shiftsare shown in Figure 4B.
Subject sizemin sepmin c2 E2V E2H
T orientationEstimate 0.069 3.5E-8 2.6E-10 1.231 2.0E-10Standard error 0.004 0.019 19.08 0.143 0.105Lower 0.061 j0.038 j77.59 0.942 j0.213Upper 0.077 0.038 77.59 1.520 0.213
Letter identificationEstimate 0.060 1.3E-7 6.6E-10 1.488 9.3E-7Standard error 0.002 0.027 6.832 0.125 0.188Lower 0.055 j0.053 j27.78 1.236 j0.380Upper 0.065 0.053 27.78 1.739 0.380
Grating discriminationEstimate 0.069 4.6E-8 3.4E-10 1.772 1.7E-7Standard error 0.003 0.022 20.58 0.196 0.085Lower 0.063 j0.045 j83.70 1.377 j0.172Upper 0.074 0.045 83.70 2.167 0.172
Table 1. Double scaling: Linear fits.
Journal of Vision (2011) 11(7):15, 1–17 Gurnsey, Roddy, & Chanab 7
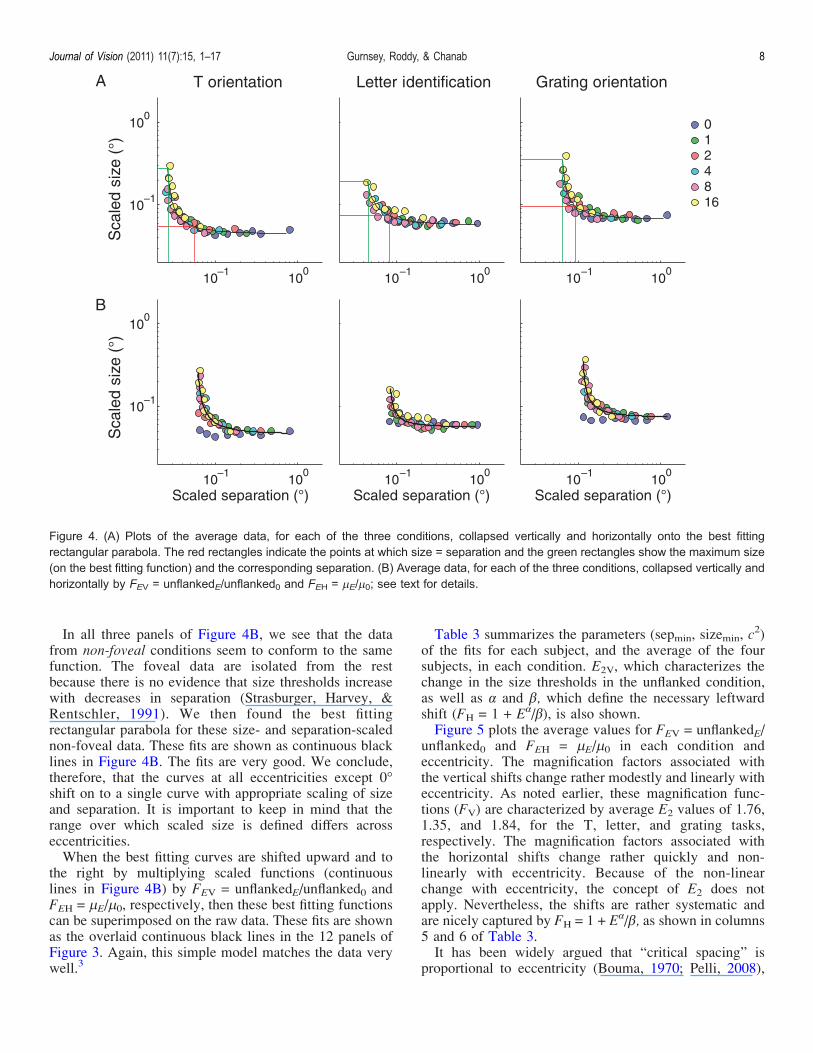
In all three panels of Figure 4B, we see that the datafrom non-foveal conditions seem to conform to the samefunction. The foveal data are isolated from the restbecause there is no evidence that size thresholds increasewith decreases in separation (Strasburger, Harvey, &Rentschler, 1991). We then found the best fittingrectangular parabola for these size- and separation-scalednon-foveal data. These fits are shown as continuous blacklines in Figure 4B. The fits are very good. We conclude,therefore, that the curves at all eccentricities except 0-shift on to a single curve with appropriate scaling of sizeand separation. It is important to keep in mind that therange over which scaled size is defined differs acrosseccentricities.When the best fitting curves are shifted upward and to
the right by multiplying scaled functions (continuouslines in Figure 4B) by FEV = unflankedE/unflanked0 andFEH = 2E/20, respectively, then these best fitting functionscan be superimposed on the raw data. These fits are shownas the overlaid continuous black lines in the 12 panels ofFigure 3. Again, this simple model matches the data verywell.3
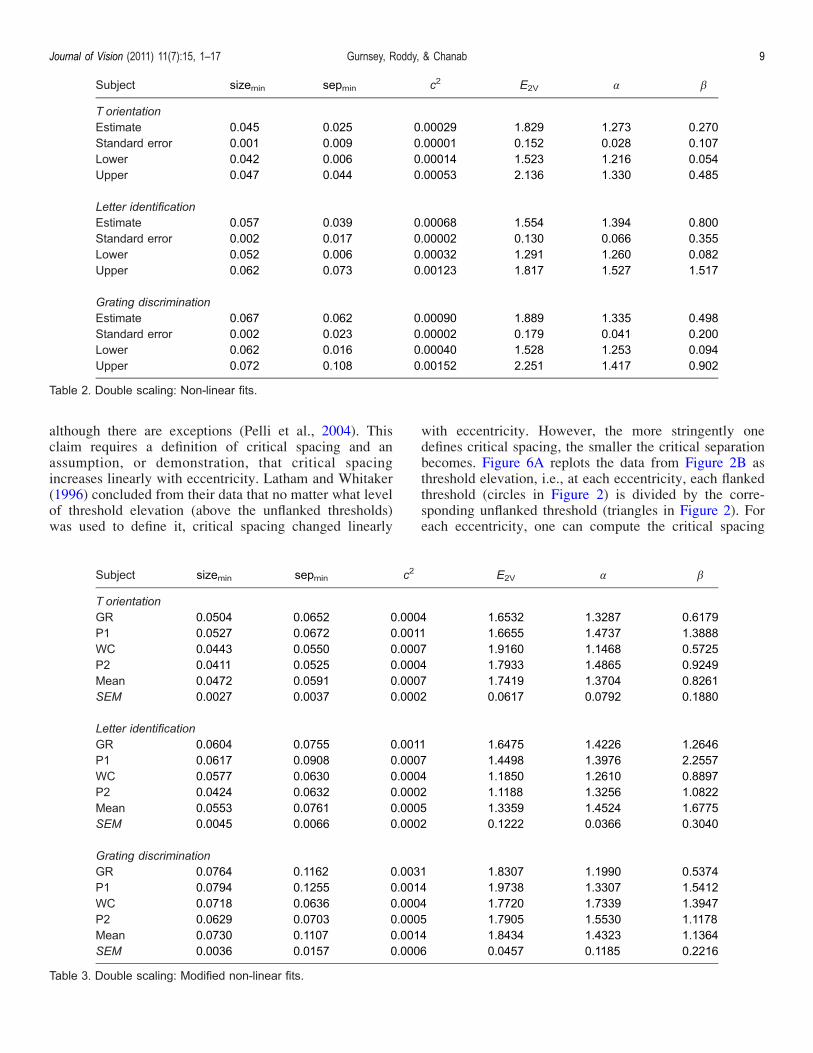
Table 3 summarizes the parameters (sepmin, sizemin, c2)
of the fits for each subject, and the average of the foursubjects, in each condition. E2V, which characterizes thechange in the size thresholds in the unflanked condition,as well as ! and ", which define the necessary leftwardshift (FH = 1 + E!/"), is also shown.Figure 5 plots the average values for FEV = unflankedE/
unflanked0 and FEH = 2E/20 in each condition andeccentricity. The magnification factors associated withthe vertical shifts change rather modestly and linearly witheccentricity. As noted earlier, these magnification func-tions (FV) are characterized by average E2 values of 1.76,1.35, and 1.84, for the T, letter, and grating tasks,respectively. The magnification factors associated withthe horizontal shifts change rather quickly and non-linearly with eccentricity. Because of the non-linearchange with eccentricity, the concept of E2 does notapply. Nevertheless, the shifts are rather systematic andare nicely captured by FH = 1 + E!/", as shown in columns5 and 6 of Table 3.It has been widely argued that “critical spacing” is
proportional to eccentricity (Bouma, 1970; Pelli, 2008),
Figure 4. (A) Plots of the average data, for each of the three conditions, collapsed vertically and horizontally onto the best fittingrectangular parabola. The red rectangles indicate the points at which size = separation and the green rectangles show the maximum size(on the best fitting function) and the corresponding separation. (B) Average data, for each of the three conditions, collapsed vertically andhorizontally by FEV = unflankedE/unflanked0 and FEH = 2E/20; see text for details.
Journal of Vision (2011) 11(7):15, 1–17 Gurnsey, Roddy, & Chanab 8
although there are exceptions (Pelli et al., 2004). Thisclaim requires a definition of critical spacing and anassumption, or demonstration, that critical spacingincreases linearly with eccentricity. Latham and Whitaker(1996) concluded from their data that no matter what levelof threshold elevation (above the unflanked thresholds)was used to define it, critical spacing changed linearly
with eccentricity. However, the more stringently onedefines critical spacing, the smaller the critical separationbecomes. Figure 6A replots the data from Figure 2B asthreshold elevation, i.e., at each eccentricity, each flankedthreshold (circles in Figure 2) is divided by the corre-sponding unflanked threshold (triangles in Figure 2). Foreach eccentricity, one can compute the critical spacing
Subject sizemin sepmin c2 E2V ! "
T orientationEstimate 0.045 0.025 0.00029 1.829 1.273 0.270Standard error 0.001 0.009 0.00001 0.152 0.028 0.107Lower 0.042 0.006 0.00014 1.523 1.216 0.054Upper 0.047 0.044 0.00053 2.136 1.330 0.485
Letter identificationEstimate 0.057 0.039 0.00068 1.554 1.394 0.800Standard error 0.002 0.017 0.00002 0.130 0.066 0.355Lower 0.052 0.006 0.00032 1.291 1.260 0.082Upper 0.062 0.073 0.00123 1.817 1.527 1.517
Grating discriminationEstimate 0.067 0.062 0.00090 1.889 1.335 0.498Standard error 0.002 0.023 0.00002 0.179 0.041 0.200Lower 0.062 0.016 0.00040 1.528 1.253 0.094Upper 0.072 0.108 0.00152 2.251 1.417 0.902
Table 2. Double scaling: Non-linear fits.
Subject sizemin sepmin c2 E2V ! "
T orientationGR 0.0504 0.0652 0.0004 1.6532 1.3287 0.6179P1 0.0527 0.0672 0.0011 1.6655 1.4737 1.3888WC 0.0443 0.0550 0.0007 1.9160 1.1468 0.5725P2 0.0411 0.0525 0.0004 1.7933 1.4865 0.9249Mean 0.0472 0.0591 0.0007 1.7419 1.3704 0.8261SEM 0.0027 0.0037 0.0002 0.0617 0.0792 0.1880
Letter identificationGR 0.0604 0.0755 0.0011 1.6475 1.4226 1.2646P1 0.0617 0.0908 0.0007 1.4498 1.3976 2.2557WC 0.0577 0.0630 0.0004 1.1850 1.2610 0.8897P2 0.0424 0.0632 0.0002 1.1188 1.3256 1.0822Mean 0.0553 0.0761 0.0005 1.3359 1.4524 1.6775SEM 0.0045 0.0066 0.0002 0.1222 0.0366 0.3040
Grating discriminationGR 0.0764 0.1162 0.0031 1.8307 1.1990 0.5374P1 0.0794 0.1255 0.0014 1.9738 1.3307 1.5412WC 0.0718 0.0636 0.0004 1.7720 1.7339 1.3947P2 0.0629 0.0703 0.0005 1.7905 1.5530 1.1178Mean 0.0730 0.1107 0.0014 1.8434 1.4323 1.1364SEM 0.0036 0.0157 0.0006 0.0457 0.1185 0.2216
Table 3. Double scaling: Modified non-linear fits.
Journal of Vision (2011) 11(7):15, 1–17 Gurnsey, Roddy, & Chanab 9
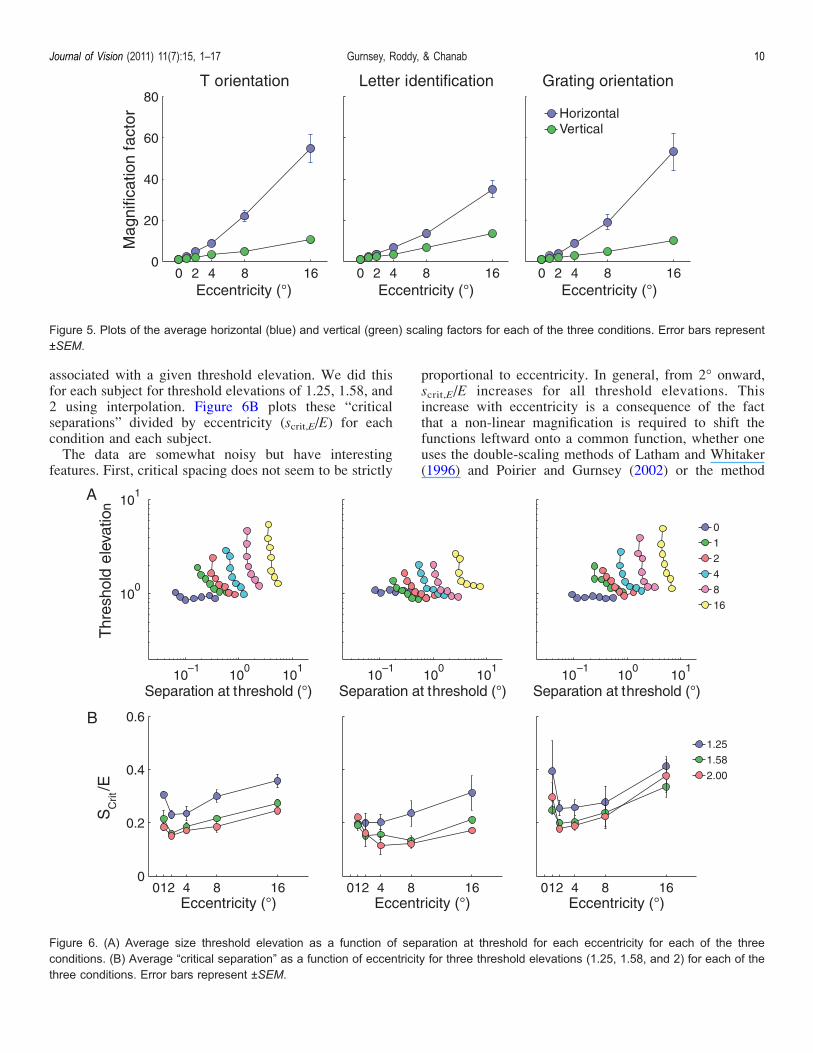
associated with a given threshold elevation. We did thisfor each subject for threshold elevations of 1.25, 1.58, and2 using interpolation. Figure 6B plots these “criticalseparations” divided by eccentricity (scrit,E/E) for eachcondition and each subject.The data are somewhat noisy but have interesting
features. First, critical spacing does not seem to be strictly
proportional to eccentricity. In general, from 2- onward,scrit,E/E increases for all threshold elevations. Thisincrease with eccentricity is a consequence of the factthat a non-linear magnification is required to shift thefunctions leftward onto a common function, whether oneuses the double-scaling methods of Latham and Whitaker(1996) and Poirier and Gurnsey (2002) or the method
Figure 5. Plots of the average horizontal (blue) and vertical (green) scaling factors for each of the three conditions. Error bars represent±SEM.
Figure 6. (A) Average size threshold elevation as a function of separation at threshold for each eccentricity for each of the threeconditions. (B) Average “critical separation” as a function of eccentricity for three threshold elevations (1.25, 1.58, and 2) for each of thethree conditions. Error bars represent ±SEM.
Journal of Vision (2011) 11(7):15, 1–17 Gurnsey, Roddy, & Chanab 10
summarized in Figure 4B. Second, as widely recognized,scrit,E/E depends on the criterion used to define scrit,E; thegreater the threshold elevation, the smaller scrit,E will be.For one to compare critical spacing across tasks andconditions, one would need to establish a uniformdefinition of critical spacing.
General discussion
Within the crowding literature, studies vary widely interms of task requirements, definition of critical spacing,and subsequent analyses. Therefore, we set out to examinethe relationship between crowding zones and resolutionlimits across the visual field in three different tasks using asingle paradigm. The tasks were those previously used byLatham and Whitaker (1996), Pelli et al. (2004), andTripathy and Cavanagh (2002). We asked whethercrowding occurs at fixation and whether double scalingcan capture changes in crowding across the visual field.We also asked about the degree to which crowding is sizeand task dependent and whether “critical spacing” isproportional to eccentricity.
Crowding at fixation?
Figures 2 and 3 show no evidence of threshold elevationat fixation as target–flanker separation decreases. Thesedata are consistent with the arguments of Pelli et al.(2004) and suggest that there is qualitative change incrowding across the visual field. It seems implausible toargue that foveal crowding was not in evidence becausethe separations tested were not small enough. In fact, ourvery liberal estimateVbased on extrapolated dataVshowsthat the maximum possible threshold elevations wereabout 30% at fixation.When comparing actual rather than extrapolated data,
we found that our results differ somewhat from those ofLatham and Whitaker (1996). At a center-to-centerspacing of 1.25 times target size, they found thresholdelevations of about 50% (in the right visual field at least),whereas we found a threshold “elevation” of j1.62% inthe same condition; our threshold elevations in this andthe other two conditions were not statistically differentfrom 0. It is not clear from their data what degree offoveal threshold elevation Latham and Whitaker found onthe lower vertical meridian (as tested here). It must bepointed out, however, that at 10-degree eccentricity theyfound threshold elevations of more than 200%. Thus, likeus, they found that the magnitude of crowding was fargreater in the periphery than at fixation. We showed thatthe difference between foveal and peripheral resultscannot be explained as a consequence of having sampled
the same underlying curve at different points at differenteccentricities.Previous studies have reported crowding at fixation
(e.g., Danilova & Bondarko, 2007; Levi, Hariharan et al.,2002, Liu & Arditi, 2000; Pelli et al., 2007), but in thecase of alphanumeric stimuli, these results may beattributed to masking. Levi (2008) suggests that asstimulus and flanker sizes decrease the separations thatmay lead to threshold elevation fall within the range ofinternal blur, meaning that target and flankers effectivelyoverlap. Therefore, apparent crowding at the fovea may beinterpreted as (at least partly) masking (Levi, 2008; Levi,Hariharan et al., 2002). We show later that the subjects inthe Latham and Whitaker study had lower size thresholdsat fixation, and therefore, the flankers may have elevatedthresholds at small target–flanker separations because ofmasking arising from internal blur.
Can double scaling characterize eccentricity-dependent changes in crowding?
The answer depends on what one means by doublescaling. It is clear that a linear scaling factor is sufficientto capture changes in resolution thresholds with eccen-tricity. We found average E2 values of 1.76, 1.35, and1.84, for the unflanked conditions of the T, letter, andgrating tasks, respectively. These results are consistentwith a large literature starting with Weymouth (1958).Latham and Whitaker (1996) found average E2 values of1.41 in the lower visual field, so our results are generallyconsistent with theirs.Latham and Whitaker (1996) showed that threshold
elevation curves (e.g., Figure 6A) could be left shiftedand aligned by dividing separation at threshold by FH ,1 + E/0.14. If these results are applied to the representa-tion shown in Figures 2B and 3, then the conclusionwould be that linear shifts in the vertical and horizontaldirectionsVdefined byFV , 1 +E/1.41 and FH , 1 + E/0.14,respectivelyVare sufficient to characterize the nature ofcrowding and resolution limits across the visual field. Thecurves in Figure 5 corresponding to the horizontalmagnifications (blue dots) can be approximated with astraight line with a corresponding E2 of 0.1 to 0.2.Therefore, our data showVlike those of Latham andWhitaker (1996) and Toet and Levi (1992)Vthat crowd-ing or interference zones increase far more rapidly witheccentricity than simple resolution limits. It is importantto note, however, that a linear magnification does notproperly characterize the changing extents of crowdingzones. In fact, the needed magnifications grow exponen-tially with eccentricity (Figure 5). Therefore, it may bethat when the needed magnification is very great it willaccelerate with eccentricity.4 We tested further into theperiphery than did Latham and Whitaker (16- vs. 10-),and perhaps because of this, the non-linearity is revealed.
Journal of Vision (2011) 11(7):15, 1–17 Gurnsey, Roddy, & Chanab 11
We showed that a non-linear, horizontal magnificationfactor (FH = 1 + E!/") in conjunction with a linear verticalmagnification factor (FV = 1 + E/E2) is sufficient tocollapse size vs. separation data from all eccentricitiesonto a single function. Although this kind of doublescaling technically eliminates eccentricity-dependent var-iance from our data set, the implied target–flanker overlaprequired at fixation to match the observed size threshold inthe periphery is inconsistent with the consensus view ofcrowding, and for this reason, we reject this version of thenon-linear model.Our alternative approach to double scaling involved left
shifting the separation vs. size curves to align the pointsfor which separation/size = 1. These leftward shifts aredirectly related to the maximum threshold elevationpossible without target and flankers overlapping. It isremarkable that when shifted leftward in this way allcurves except the foveal curve overlap and are capturedby the same rectangular parabola. (See Footnote 2 for aqualification of this conclusion.) In this sense, doublescaling does align all but the foveal curve. The nature ofthe alignment assures that the best fitting curve will notinclude points for which targets and crowders overlap.Therefore, we conclude that double scaling, in thismodified sense, provides a satisfactory characterizationof all but the foveal data. Unlike “standard” double-scaling procedures (Latham & Whitaker, 1996; Poirier &Gurnsey, 2002), our fits make explicit that the magnitudeof crowding (e.g., threshold elevation) increases witheccentricity. At each eccentricity, the data are fit with adifferent part of the rectangular parabola. Therefore, withthe exception of the foveal data, the changes witheccentricity may be considered quantitative rather thanqualitative.
Is crowding size independent?
Pelli et al. (2004) argue that the weight of evidenceshows that the extent of crowding zones is independent oftarget size. The work of Tripathy and Cavanagh (2002) isalso widely cited in this regard. Figures 3 and 4B showthat the data at each eccentricity are well fit by arectangular parabola. Parts of a rectangular parabolaapproach size independence (the part parallel to the y-axiscorresponding to small separations and large sizes), butas separation increases (and size decreases), the curveslopes and then becomes parallel to the x-axis. In thislatter part of the curve, size and separation trade off so thatas size decreases, larger separations are needed to maintainthreshold-level performance. Near fixation, the maximumthreshold elevation is relatively modest, and so over mostof the curve, there is a trade-off between size and separationat threshold. At further eccentricities, the maximum thresh-old elevation is much greater and so crowding is sizeindependent over more of the curve. Therefore, it is notgenerally true that crowding is size independent. At each
eccentricity, there are stimulus sizes for which crowdingis size dependent. As eccentricity increases, then largerparts of the function are roughly parallel to the size axis.This region represents size independence and the range ofsizes for which size independence is seen grows witheccentricity.We can compare our results with those in the experi-
ments we have replicated. Tripathy and Cavanagh (2002)used stimuli of the sort shown in Figure 1A. Stimuli werepresented at 9.2- in the lower visual field and the extent ofcrowding was measured for a range of stimulus sizes. Ateach size, stimulus contrast was adjusted to elicit 80%correct performance in the unflanked condition, i.e.,stimulus contrast decreased as target size increased.Accuracy was measured at this contrast as a functionof target–flanker separation (center to center). The extentof crowding was defined as the target–flanker separationthat produced a level of accuracy corresponding to(Accunflanked j Accchance) * (1 j 1/e) + Accchance. Theirresults for two subjects are plotted in Figure 7A. The dataare somewhat noisy for subject ST, but they are quitesimilar to our data at 8- for the same condition. Their datadiffer from ours in that there is less evidence at small sizesfor a shift from size independence to size dependence. Putthe other way around, crowding zones do not get smalleras targets get larger as they do in our data. This differencemay well be explained by the negative correlation betweenstimulus size and contrast (e.g., Strasburger et al., 1991).(We return to this point.)Figure 7B compares our data (at 0, 2, 4, and 8-) in the
lower visual field with those of subject KAT in Pelli et al.(2007) obtained 5- in the lower visual field. In thisexperiment, an adaptive procedure was used to find thespacing that elicited 80% correct responses in a 10AFC.Although separation thresholds were obtained for fourtarget flanker orientations, we have shown data only forthe horizontal separation (see Figure 1B). These data seemgenerally consistent with other data in the set, showing atendency for separation at threshold to decrease withstimulus size. The general form of the function seemsquite similar to our data obtained at 4-.Figure 7C compares our data to those of Latham and
Whitaker (1996) obtained at 0, 2.5, 5, and 10- in the rightvisual field. The data are the average of their two subjects’data. We noted earlier that Latham and Whitakerexpressed target–flanker separation as edge-to-edge sepa-ration, whereas we have replotted their data as center-to-center separation. As with our data, theirs show anincrease in crowding with eccentricity, with rather littlecrowding at fixation. At fixation, Latham and Whitaker’ssubjects show greater sensitivity than ours. (As notedearlier, the threshold increases seen at small separationsmight reflect masking induced by overlap of the blurredrepresentations of targets and flankers.) Their data at 2.5and 5- essentially superimpose on ours at 2- and 4-. Theirsubjects also have greater sensitivity at 10- than ours didat 8-. Because of the difference in sensitivity at fixation,
Journal of Vision (2011) 11(7):15, 1–17 Gurnsey, Roddy, & Chanab 12
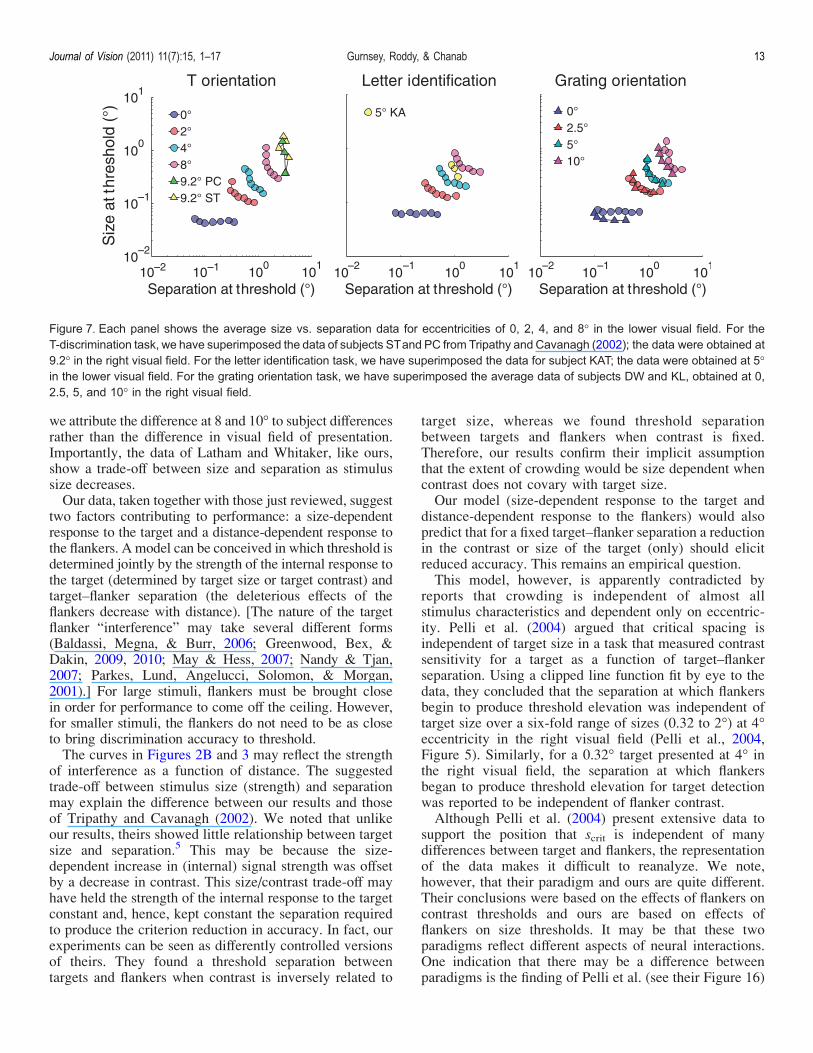
we attribute the difference at 8 and 10- to subject differencesrather than the difference in visual field of presentation.Importantly, the data of Latham and Whitaker, like ours,show a trade-off between size and separation as stimulussize decreases.Our data, taken together with those just reviewed, suggest
two factors contributing to performance: a size-dependentresponse to the target and a distance-dependent response tothe flankers. A model can be conceived in which threshold isdetermined jointly by the strength of the internal response tothe target (determined by target size or target contrast) andtarget–flanker separation (the deleterious effects of theflankers decrease with distance). [The nature of the targetflanker “interference” may take several different forms(Baldassi, Megna, & Burr, 2006; Greenwood, Bex, &Dakin, 2009, 2010; May & Hess, 2007; Nandy & Tjan,2007; Parkes, Lund, Angelucci, Solomon, & Morgan,2001).] For large stimuli, flankers must be brought closein order for performance to come off the ceiling. However,for smaller stimuli, the flankers do not need to be as closeto bring discrimination accuracy to threshold.The curves in Figures 2B and 3 may reflect the strength
of interference as a function of distance. The suggestedtrade-off between stimulus size (strength) and separationmay explain the difference between our results and thoseof Tripathy and Cavanagh (2002). We noted that unlikeour results, theirs showed little relationship between targetsize and separation.5 This may be because the size-dependent increase in (internal) signal strength was offsetby a decrease in contrast. This size/contrast trade-off mayhave held the strength of the internal response to the targetconstant and, hence, kept constant the separation requiredto produce the criterion reduction in accuracy. In fact, ourexperiments can be seen as differently controlled versionsof theirs. They found a threshold separation betweentargets and flankers when contrast is inversely related to
target size, whereas we found threshold separationbetween targets and flankers when contrast is fixed.Therefore, our results confirm their implicit assumptionthat the extent of crowding would be size dependent whencontrast does not covary with target size.Our model (size-dependent response to the target and
distance-dependent response to the flankers) would alsopredict that for a fixed target–flanker separation a reductionin the contrast or size of the target (only) should elicitreduced accuracy. This remains an empirical question.This model, however, is apparently contradicted by
reports that crowding is independent of almost allstimulus characteristics and dependent only on eccentric-ity. Pelli et al. (2004) argued that critical spacing isindependent of target size in a task that measured contrastsensitivity for a target as a function of target–flankerseparation. Using a clipped line function fit by eye to thedata, they concluded that the separation at which flankersbegin to produce threshold elevation was independent oftarget size over a six-fold range of sizes (0.32 to 2-) at 4-eccentricity in the right visual field (Pelli et al., 2004,Figure 5). Similarly, for a 0.32- target presented at 4- inthe right visual field, the separation at which flankersbegan to produce threshold elevation for target detectionwas reported to be independent of flanker contrast.Although Pelli et al. (2004) present extensive data to
support the position that scrit is independent of manydifferences between target and flankers, the representationof the data makes it difficult to reanalyze. We note,however, that their paradigm and ours are quite different.Their conclusions were based on the effects of flankers oncontrast thresholds and ours are based on effects offlankers on size thresholds. It may be that these twoparadigms reflect different aspects of neural interactions.One indication that there may be a difference betweenparadigms is the finding of Pelli et al. (see their Figure 16)
Figure 7. Each panel shows the average size vs. separation data for eccentricities of 0, 2, 4, and 8- in the lower visual field. For theT-discrimination task, we have superimposed the data of subjects STand PC from Tripathy and Cavanagh (2002); the data were obtained at9.2- in the right visual field. For the letter identification task, we have superimposed the data for subject KAT; the data were obtained at 5-in the lower visual field. For the grating orientation task, we have superimposed the average data of subjects DW and KL, obtained at 0,2.5, 5, and 10- in the right visual field.
Journal of Vision (2011) 11(7):15, 1–17 Gurnsey, Roddy, & Chanab 13
that orientation discrimination is not subject to crowdingwhen the gratings to be discriminated differed by 90-. Wefound very strong crowding effects under these conditions.Clearly, a direct test of paradigm dependence of crowdingis on order. We should also note that there is growingevidence that flanker characteristics make importantcontributions to the degree of crowding observed (Kooi,Toet, Tripathy, & Levi, 1994; Levi & Carney, 2009;Livne & Sagi, 2010; Nazir, 1992).
Is the critical separation proportional toeccentricity?
Several authors (Levi, 2008; Pelli et al., 2004) haveargued that the main goal of crowding research is toestablish the critical separation, which is defined as somedeviation from performance in the uncrowded condition.Just what this deviation should be is a matter of choice.We have just shown that the magnitude of crowdingincreases with eccentricity (e.g., Figure 6A). Therefore, ifone defines the critical separation stringently (e.g., theseparation at which threshold doubles from the uncrowdedcase), then it may be undefined at some eccentricities. Forexample, if critical spacing were defined as a thresholddoubling, then it would be undefined for some subjects atsmall eccentricities in our experiments. Pelli et al. (2004)argue that any deviation from the uncrowded thresholdshould define critical separation. The advantage of thisdefinition is that if crowding exists then critical spacing isdefined even if the magnitude of crowding is relativelymodest, i.e., does not rise to the level of some specifiedthreshold elevation. The drawback is that in many casesthe precision with which we can measure such a point isextremely coarse. Because the tail of any psychometricfunction approaches chance asymptotically, there is reallyno point that can be defined as the deviation from chance.Alternatives involve fitting the sloping and asymptoticparts of the curve with straight lines and looking at thepoint of intersection. Such an approach can do someviolence to the data and has an arbitrary quality to it.Figure 6B demonstrates that in our data the critical
spacing depends on the threshold elevation used to defineit. It is clear that the more stringent the definition (i.e.,larger threshold elevations) is, the smaller the criticalspacing will be. As discussed below, critical spacingvaries with eccentricity, but we find that even with arather loose definition (25% increase) the ratio of criticalspacing to eccentricity (scrit,E/E) generally remains wellbelow Bouma’s constant of 0.5, which may be consideredan upper limit on critical spacing.Leaving aside the issue of how to define the critical
separation, one can ask whether critical separation isproportional to eccentricity. As noted by Latham andWhitaker (1996), if the critical spacing (however defined)changes quickly and linearly with eccentricity, then it mustbe proportional to eccentricity. That is, if FH = 1 + E/E2,
then FH/E = 1/E + 1/E2 and this function drops rapidly toan asymptotic value of 1/E2. If E2 = 0.2, then FH/E dropsby only 8% from 2 to 16-. Therefore, one might expectcrowding to be proportional to eccentricity. However, wefind, as did Pelli et al. (2007), that this is not strictly thecase. At 1-, critical spacing relative to eccentricity isgenerally greater than at 2-, but this ratio tends to increasewith eccentricity thereafter (Figure 6B). Therefore, wefind the notion of Bouma’s constant to be a very roughapproximation to the true nature of crowding.
Is crowding task independent?
A salient feature of Figure 2B is that the crowdingfunctions look very similar for the T-orientation andgrating resolution tasks and differ from the letter discrim-ination task in terms of the maximum threshold elevationachieved; this is most clearly seen in Figures 4B and 6A.This difference most likely reflects differences in thenumber and arrangement of flankers in the three tasks.Indeed, many recent studies have found varied resultswhen configurations or grouping of flankers and targetsare manipulated within and across tasks (Danilova &Bondarko, 2007; Levi & Carney, 2009; Livne & Sagi,2010; Saarela, Westheimer, & Herzog, 2010). Crowdingzones are generally elongated, with the principal axisaligned with the center of the fovea. Thus, there is moreinterference when targets and flankers form a line parallelto the principle axis than when perpendicular to it (Feng,Jiang, & He, 2007; Pelli et al., 2007; Toet & Levi, 1992).In summary, some of the differences between the experi-ments can be explained by the fact that the arrangement offlankers was different in the letter identification task thanin the T-orientation and grating discrimination tasks.Although it should be possible to fit all results of all
three experiments (for each subject) using the sameparameters (Melmoth et al., 2000; reducing the overallnumber of parameters for each subject by two-thirds),such a fit would involve a compromise between parame-ters of the data sets that are clearly different. For example,as just discussed, there is greater crowding in the T andgrating tasks than in the letter identification task. As well,the minimum thresholds achieved across tasks are ratherdifferent across tasks (0.0472, 0.0553, and 0.0730 for T,letter, and grating tasks, respectively). These are allstatistically different, as are a number of other parametercomparisons. Therefore, a fit that collapses the data fromdifferent conditions would obscure these interesting differ-ences between conditions.
Conclusions
1. The maximum threshold elevation (2E) increases non-linearly with eccentricity.
Journal of Vision (2011) 11(7):15, 1–17 Gurnsey, Roddy, & Chanab 14
2. Left shifting all curves on the separation axis by FEH =2E/20 and downshifting all curves on the size axis byFEV = unflankedE/unflanked0 aligns all but the fovealcurve.
3. These scaled data can be fit with a single curve, thusproviding a complete description of the relationshipbetween size and separation at threshold acrosseccentricities of 0 to 16-.
4. The non-linear change in the extent of crowdingimplies that the “critical spacing” is not proportionalto eccentricity.
5. Furthermore, “critical spacing” depends on the level ofperformance used to define it.
Acknowledgments
This research was supported by NSERC and CIHRResearch Grants to Rick Gurnsey.
Commercial relationships: none.Corresponding author: Rick Gurnsey.Email: [email protected]: Department of Psychology, Concordia Univer-sity, 7141 Sherbrooke St. West, Montreal, Quebec H4B1R6, Canada.
Footnotes
1The same problem afflicts the model of Latham and
Whitaker (1996). For a threshold elevation of 3, thepredicted critical spacing at fixation is 0.0055-, which isfar smaller than the target size at threshold in theunflanked condition.
2Note that these numbers should be considered cau-tiously because they represent extrapolations from the data.When we consider the available data (not extrapolateddata), we find that the average differences at fixationbetween thresholds for the 1.25� and unflanked conditionsare 1.84%, 12.33%, and j1.62% for the T-orientation,letter identification, and grating discrimination tasks,respectively. None of these differences is statisticallysignificant (t3 = 2.02, 1.09, and j0.76; p = 0.14, 0.35,and 0.50, respectively; effect sizes = 1.02, 0.52, andj0.40, respectively). The corresponding analysis at 16-yields average increases of 467%, 171%, and 394% forthe T-orientation, letter identification, and grating dis-crimination tasks, respectively. All of these differences arestatistically significant (t3 = 5.24, 5.22, and 6.24; p =0.014, 0.014, and 0.008, respectively; effect sizes = 2.62,2.61, and 3.12, respectively).
3There is an inconsistency in this formulation that is of
little practical consequence. All curves in Figure 4B havebeen left shifted to align the point at which 2E =
separationE/sizeE = 1. When we then fit these shifted datawith a single rectangular parabola, the value for 2E =separationE/sizeE = 1 on the best fitting curve will notequal those used to left shift in the first place. Inspectionof Figure 3 shows that this small distortion is of littleconsequence.
4We thank David Whitaker for this point.5We must emphasize that on the surface the method
used by Tripathy and Cavanagh is exactly the same asours. In both cases, the objective is to determine thetarget–flanker separation that elicits criterion-level per-formance for a range of target sizes. Tripathy andCavanagh accomplished this by fixing target size andfinding the target–flanker separation that elicits criterion-level performance. We accomplished this by fixing therelative separation between target and flankers then variedthe size of the entire configuration until criterion-levelperformance was obtained. In both cases, the proceduressample the iso-performance line that relates target size totarget–flanker separation. The only difference between thetwo methods is that Tripathy and Cavanagh decreasedstimulus contrast as target size increased, and we did not.
References
Baldassi, S., Megna, N., & Burr, D. C. (2006). Visualclutter causes high-magnitude errors. PLoS Biology,4, e56.
Bouma, H. (1970). Interaction effects in parafoveal letterrecognition. Nature, 226, 177–178.
Brainard, D. H. (1997). The psychophysics toolbox.Spatial Vision, 10, 433–436.
Danilova, M. V., & Bondarko, V. M. (2007). Fovealcontour interactions and crowding effects at theresolution limit of the visual system. Journal ofVision, 7(2):25, 1–18, http://www.journalofvision.org/content/7/2/25, doi:10.1167/7.2.25. [PubMed][Article]
Feng, C., Jiang, Y., & He, S. (2007). Horizontal andvertical asymmetry in visual spatial crowdingeffects. Journal of Vision, 7(2):13, 1–10, http://www.journalofvision.org/content/7/2/13, doi:10.1167/7.2.13. [PubMed] [Article]
Greenwood, J. A., Bex, P. J., & Dakin, S. C. (2009).Positional averaging explains crowding with letter-likestimuli. Proceedings of the National Academy ofSciences of the United States of America, 106,13130–13135.
Greenwood, J. A., Bex, P. J., & Dakin, S. C. (2010).Crowding changes appearance. Current Biology, 20,496–501.
Gurnsey, R., Poirier, F. J., Bluett, P., & Leibov, L.(2006). Identification of 3D shape from texture and
Journal of Vision (2011) 11(7):15, 1–17 Gurnsey, Roddy, & Chanab 15
motion across the visual field. Journal of Vision,6(5):1, 543–553, http://www.journalofvision.org/content/6/5/1, doi:10.1167/6.5.1. [PubMed] [Article]
Gurnsey, R., Roddy, G., Ouhnana, M., & Troje, N. F.(2008). Stimulus magnification equates identificationand discrimination of biological motion across thevisual field. Vision Research, 48, 2827–2834.
Kooi, F. L., Toet, A., Tripathy, S. P., & Levi, D. M.(1994). The effect of similarity and duration onspatial interaction in peripheral vision. Spatial Vision,8, 255–279.
Latham, K., & Whitaker, D. (1996). Relative roles ofresolution and spatial interference in foveal andperipheral vision. Ophthalmic and PhysiologicalOptics, 16, 49–57.
Levi, D. M. (2008). CrowdingVAn essential bottleneckfor object recognition: A mini-review. VisionResearch, 48, 635–654.
Levi, D. M., & Carney, T. (2009). Crowding in peripheralvision: Why bigger is better. Current Biology, 19,1988–1993.
Levi, D. M., Hariharan, S., & Klein, S. A. (2002).Suppressive and facilitatory spatial interactions inperipheral vision: Peripheral crowding is neither sizeinvariant nor simple contrast masking. Journal ofVision, 2(2):3, 167–177, http://www.journalofvision.org/content/2/2/3, doi:10.1167/2.2.3. [PubMed][Article]
Levi, D. M., Klein, S. A., & Hariharan, S. (2002).Suppressive and facilitatory spatial interactions infoveal vision: Foveal crowding is simple contrastmasking. Journal of Vision, 2(2):2, 140–166, http://www.journalofvision.org/content/2/2/2, doi:10.1167/2.2.2. [PubMed] [Article]
Liu, L., & Arditi, A. (2000). Apparent string shorteningconcomitant with letter crowding. Vision Research,40, 1059–1067.
Livne, T., & Sagi, D. (2010). How do flankers’ relationsaffect crowding? Journal of Vision, 10(3):1, 1–14,http://www.journalofvision.org/content/10/3/1,doi:10.1167/10.3.1. [PubMed] [Article]
Makela, P., Whitaker, D., & Rovamo, J. (1993). Model-ling of orientation discrimination across the visualfield. Vision Research, 33, 723–730.
May, K. A., & Hess, R. F. (2007). Ladder contoursare undetectable in the periphery: A crowdingeffect? Journal of Vision, 7(13):9, 1–15, http://www.journalofvision.org/content/7/13/9, doi:10.1167/7.13.9. [PubMed] [Article]
Melmoth, D. R., Kukkonen, H. T., Makela, P. K., &Rovamo, J. M. (2000). The effect of contrast and sizescaling on face perception in foveal and extrafoveal
vision. Investigative Ophthalmology & Visual Science,41, 2811–2819.
Nandy, A. S., & Tjan, B. S. (2007). The nature of lettercrowding as revealed by first- and second-order clas-sification images. Journal of Vision, 7(2):5, 1–26,http://www.journalofvision.org/content/7/2/5,doi:10.1167/7.2.5. [PubMed] [Article]
Nazir, T. A. (1992). Effects of lateral masking and spatialpre-cueing on gap-resolution in central and peripheralvision. Vision Research, 32, 771–777.
Parkes, L., Lund, J., Angelucci, A., Solomon, J. A., &Morgan, M. (2001). Compulsory averaging ofcrowded orientation signals in human vision. NatureNeuroscience, 4, 739–744.
Pelli, D. G. (1997). The VideoToolbox software for visualpsychophysics: Transforming numbers into movies.Spatial Vision, 10, 437–442.
Pelli, D. G. (2008). Crowding: A cortical constraint onobject recognition. Current Opinion in Neurobiology,18, 445–451.
Pelli, D. G., Palomares, M., & Majaj, N. J. (2004).Crowding is unlike ordinary masking: Distinguishingfeature integration from detection. Journal of Vision,4(12):12, 1136–1169, http://www.journalofvision.org/content/4/12/12, doi:10.1167/4.12.12. [PubMed][Article]
Pelli, D. G., Tillman, K. A., Freeman, J., Su, M., Berger,T. D., & Majaj, N. J. (2007). Crowding andeccentricity determine reading rate. Journal of Vision,7(2):20, 21–36, http://www.journalofvision.org/content/7/2/20, doi:10.1167/7.2.20. [PubMed] [Article]
Poirier, F. J., & Gurnsey, R. (2002). Two eccentricity-dependent limitations on subjective contour discrim-ination. Vision Research, 42, 227–238.
Poirier, F. J., & Gurnsey, R. (2005). Non-monotonicchanges in performance with eccentricity modeled bymultiple eccentricity-dependent limitations. VisionResearch, 45, 2436–2448.
Rovamo, J., & Virsu, V. (1979). An estimation andapplication of the human cortical magnificationfactor. Experimental Brain Research, 37, 495–510.
Saarela, T. P., Westheimer, G., & Herzog, M. H. (2010).The effect of spacing regularity on visual crowd-ing. Journal of Vision, 10(10):17, 1–7, http://www.journalofvision.org/content/10/10/17, doi:10.1167/10.10.17. [PubMed] [Article]
Strasburger, H., Harvey, L. O., & Rentschler, I. (1991).Contrast thresholds for the identification of numericcharters in direct and eccentric view. Perception &Psychophysics, 49, 495–508.
Journal of Vision (2011) 11(7):15, 1–17 Gurnsey, Roddy, & Chanab 16
Toet, A., & Levi, D. M. (1992). The two-dimensionalshape of spatial interaction zones in the parafovea.Vision Research, 32, 1349–1357.
Tripathy, S. P., & Cavanagh, P. (2002). The extent ofcrowding in peripheral vision does not scale withtarget size. Vision Research, 42, 2357–2369.
Watson, A. B. (1987). Estimation of local spatialscale. Journal of the Optical Society of America A, 4,1579–1582.
Watson, A. B., & Pelli, D. G. (1983). QUEST: A Bayesianadaptive psychometric method. Perception & Psy-chophysics, 33, 113–120.
Weymouth, F. W. (1958). Visual sensory units and theminimal angle of resolution. American Journal ofOphthalmology, 46, 102–113.
Whitaker, D., Latham, K., Makela, P., & Rovamo, J.(1993). Detection and discrimination of curvature infoveal and peripheral vision. Vision Research, 33,2215–2224.
Whitaker, D., Makela, P., Rovamo, J., & Latham, K.(1992). The influence of eccentricity on position andmovement acuities as revealed by spatial scaling.Vision Research, 32, 1913–1930.
Whitaker, D., Rovamo, J., MacVeigh, D., & Makela, P.(1992). Spatial scaling of vernier acuity tasks. VisionResearch, 32, 1481–1491.
Yu, C., & Essock, E. A. (1996). Spatial scaling of end-stopped perceptive fields: Differences in neural basesof end-zones, flanks and centers. Vision Research, 36,3129–3139.
Journal of Vision (2011) 11(7):15, 1–17 Gurnsey, Roddy, & Chanab 17
Related Documents