Office of Research and Development Crosstalk in Stereoscopic Displays Andrew J. Woods This thesis is presented for the Degree of Doctor of Philosophy of Curtin University November 2013

Welcome message from author
This document is posted to help you gain knowledge. Please leave a comment to let me know what you think about it! Share it to your friends and learn new things together.
Transcript
Office of Research and Development
Crosstalk in Stereoscopic Displays
Andrew J. Woods
This thesis is presented for the Degree of Doctor of Philosophy
of Curtin University
November 2013
"To the best of my knowledge and belief this exegesis contains no material previously published by
any other person except where due acknowledgment has been made. This exegesis contains no
material which has been accepted for the award of any other degree or diploma in any university."
Andrew J. Woods
ii
Abstract The research presented in this thesis examines the image quality attribute of stereoscopic displays
called crosstalk.
Stereoscopic 3D displays function by presenting a separate perspective view to each of an observer’s
two eyes, thereby allowing most observers to perceive an image containing realistic depth by way of
binocular stereopsis. Ideally the left eye will only see the left perspective image, and the right eye
only see the right perspective image. However, when crosstalk is present in a stereoscopic display,
in addition to each eye seeing its intended view, it is also able to see some of the view(s) not
intended for that eye. Crosstalk, sometimes known as ghosting, is usually perceived as a ghost‐like
doubling of features across the image. High levels of crosstalk degrade the perceived image quality
of a stereoscopic image, and if crosstalk levels are particularly high, binocular fusion of the
stereoscopic image can be adversely affected or even prevented.
Crosstalk occurs with most stereoscopic displays and the mechanisms that cause crosstalk can vary
widely from one display technology to another, and from one 3D method to another. The thesis
examines these mechanisms and also describes the development of models and simulations to
predict the occurrence of crosstalk on a selection of stereoscopic displays. The development of a
simulation to predict crosstalk performance is an important step in the analysis of crosstalk as it
allows the relative contribution of the different crosstalk mechanisms to be determined – an aspect
which cannot be determined by crosstalk measurement alone. A crosstalk simulation also allows
"what‐if" scenarios to be conducted virtually and quickly to determine the efficacy of different
crosstalk reduction strategies.
Stereoscopic display technologies considered in this thesis include: time‐sequential 3D and anaglyph
3D methods on liquid crystal displays (LCDs), plasma displays, digital light projection (DLP) displays,
and cathode ray tube (CRT) displays; as well as anaglyph 3D in printed images.
The thesis includes a wide range of recommendations and guidance on techniques that will allow
crosstalk levels to be reduced, including: increasing the addressing rate on time‐sequential 3D LCDs,
using printing inks with improved spectral characteristics for printed anaglyph 3D images, using
anaglyph 3D glasses that have good spectral characteristics, disabling colour management on
anaglyph 3D displays, and reducing phosphor persistence on time‐sequential 3D plasma displays.
The ability to present stereoscopic images with low levels of crosstalk is an important goal in
producing high‐quality stereoscopic images, hence there is a motivation to develop stereoscopic

iii
displays that exhibit low levels of crosstalk. This thesis provides a range of new insights which are
critical to a detailed understanding of crosstalk and consequently to the development of effective
crosstalk reduction techniques.
(439 words)
iv
Acknowledgements There are many, many people I wish to acknowledge and thank for their support, advice, guidance,
direction and understanding whilst working towards the PhD holy grail.
Firstly, my gratitude to my supervisor and mentor, Dr Alec Duncan, and my co‐supervisor, Dr Peter
Fearns, for reading numerous drafts and providing expert guidance – your input has been invaluable.
I am grateful to the former and current Directors of the Centre for Marine Science and Technology
(CMST) at Curtin University: John Penrose, Kim Klaka, and Christine Erbe – your support and
encouragement have been very much appreciated. To my colleagues at CMST, you’re a great team
to work with – a wonderful family of marine researchers!
Over the years I have had the privilege of working with a number of people on projects that have
contributed to this PhD. Thank you to the many collaborators and co‐authors whom I have worked
with directly on various aspects of this work: Stanley Tan, Tegan Rourke, Ka Lun Yuen, Kai Karvinen,
Adin Sehic, Chris Harris, Dean Leggo, Jesse Helliwell, and Mike Weissman.
On the technical front, I am indebted to the many individuals who have assisted with test
equipment, lab space, and software: Glen Lawson, Mal Perry, Frank Thomas, Ming Lim and Dan
Marrable. Thanks also to those who helped with user testing: Bob Loss, Iain Parnum, Jesse Helliwell,
Alec Duncan, Angela Recalde Salas, Michael Bittle, Matthew Koessler, and Ming Lim.
Various parts of the work conducted in this thesis was supported by iVEC, WA:ERA, and JumboVision
– to these groups, a very big thank you. I would also like to acknowledge everyone who provided
assistance with fine‐tuning the published manuscripts: John Merritt, John Stern, plus the editors and
anonymous reviewers of the journals in which the papers of this thesis were published.
To the Deans of Research at Curtin: Leonie Rennie, Graeme Wright and Kate Wright – I appreciate
the important guidance you provided along the PhD pathway. To Andrew Hutchison, John Byron and
Graeme Wright, your support in the latter stages of the PhD program was crucial for its completion.
My gratitude goes out to the friends I have made through the Stereoscopic Displays and Applications
(SD&A) conference over the last 24 years, your friendship and enthusiasm for all things stereoscopic
have been a big part of my academic career. And to those whom I may not have mentioned
specifically but have shared ideas and suggestions along the way, thank you too!

v
Most importantly, the completion of this PhD would not have been possible without the support of
my family. To my wife, Denise, for her incredible support and understanding through this very time‐
consuming process. To my kids, Jasmine and Jade, for allowing their dad to become absorbed in his
work especially during the closing stages of the thesis submission process. Yes girls, Daddy has
FINALLY finished the thesis and you can have him back now.

vi
Table of Contents
Abstract ................................................................................................................................................... ii
Acknowledgements ................................................................................................................................ iv
Table of Contents ................................................................................................................................... vi
List of Publications ................................................................................................................................ vii
List of Additional Publications by the Candidate Relevant to the Thesis ................................................ x
Refereed Status Statement .................................................................................................................. xiv
Copyright Permission Statement .......................................................................................................... xv
List of Stereoscopic Terminology ......................................................................................................... xvi
1. Introduction ................................................................................................................................... 1
1.1 Novelty .................................................................................................................................. 7
1.2 Exegesis/Publications Roadmap ........................................................................................... 8
1.3 Chronology ............................................................................................................................ 9
1.4 Impact ................................................................................................................................. 12
2. Literature Review ........................................................................................................................ 13
3. Research Design .......................................................................................................................... 16
4. Overview and Results .................................................................................................................. 19
4.1 Crosstalk Mechanisms ........................................................................................................ 19
4.2 Time‐Sequential 3D using Active Shutter Glasses .............................................................. 20
4.2.1 Time‐Sequential 3D on CRT Displays .................................................................................. 22
4.2.2 Time‐Sequential 3D on Plasma Displays ............................................................................. 24
4.2.3 Time Sequential 3D on LCDs ............................................................................................... 26
4.2.4 Time‐Sequential 3D on DLP Projectors ............................................................................... 30
4.3 Anaglyph 3D ........................................................................................................................ 32
4.3.1 Anaglyph 3D on Emissive Displays ...................................................................................... 32
4.3.2 Anaglyph 3D in Printed Images ........................................................................................... 38
5. Review and Discussion ................................................................................................................ 42
6. Conclusion ................................................................................................................................... 48
7. List of References (Exegesis only) ................................................................................................ 49
8. Bibliography (from Exegesis and Included Publications) ............................................................. 57
9. Published Papers ......................................................................................................................... 78
Appendix 1 – Additional Publications Relevant to the Thesis ........................................................... A1‐1
Appendix 2 – Statement of Contribution of Candidate to Submitted Publications .......................... A2‐1
Appendix 3 – Evidence of Peer‐Review Status of Included Publications .......................................... A3‐1
Appendix 4 – Copyright Permissions ................................................................................................. A4‐1
Appendix 5 – Full List of All Included Publications ............................................................................ A5‐1
vii
List of Publications The full list of publications included in the body of the thesis is as follows.
The publications are grouped by type (refereed journal, refereed conference) and then in the order
in which they will appear.
Refereed Journal Articles
Paper 1 A. J. Woods (2012) “Crosstalk in Stereoscopic Displays: a review” Journal of Electronic
Imaging, IS&T/SPIE, 21(4), pp. 040902‐1 to 040902‐21, Oct‐Dec 2012.
This paper serves as both a literature review for the field, and also presents new work
on the mechanisms of crosstalk, and the measurement of crosstalk using test charts.
A precursor of this paper was presented as a keynote presentation at the 3DSA
conference in Japan in 2010.1
Paper 2 A. J. Woods, K. L. Yuen, K. S. Karvinen (2007) “Characterizing crosstalk in anaglyphic
stereoscopic images on LCD monitors and plasma displays” Journal of the Society for
Information Display, 15(11), pp. 889‐898, November 2007.
This paper presents early work on characterising anaglyph crosstalk on a selection of
emissive displays, the development of an early simulation, and the results of the
simulation. A simple validation was also performed.
Paper 3 A. J. Woods, C. R. Harris (2012) “Using cross‐talk simulation to predict the
performance of anaglyph 3‐D glasses” in Journal of the Society for Information
Display, 20(6), pp. 304‐315.
This paper presents a mathematical model, and a revised and improved simulation for
anaglyph crosstalk on emissive displays. The paper also presents a comprehensive
validation of the crosstalk model which provides high confidence in the model, and
subsequently the simulation is used to investigate a number of scenarios which can
significantly reduce the presence of crosstalk in anaglyph 3D images on emissive
displays.

viii
Paper 4 A. J. Woods, C. R. Harris, D. B. Leggo, T. M. Rourke (2013) “Characterizing and
Reducing Crosstalk in Printed Anaglyph Stereoscopic 3D Images” (Journal of) Optical
Engineering, SPIE, 52(4), pp. 043203‐1 to 043203‐19, April 2013.
Despite the printed anaglyph 3D technique having been invented in 1853, it appears
this paper is the first to comprehensively analyse the mechanisms of crosstalk in
printed anaglyph 3D images. The printed anaglyph has notable differences to
crosstalk in anaglyph 3D on emissive displays, and ordinarily presents much more
crosstalk than anaglyphs on emissive displays. The paper also describes a
mathematical model to simulate printed anaglyph 3D crosstalk, a program which
implements the model, and a comprehensive validation test which provides a high
level of confidence in the accuracy of the model. Finally the simulation is used to
consider a number of scenarios that can reduce the presence of crosstalk in printed
anaglyph 3D images.
Refereed Conference Papers
Paper 5 A. J. Woods, K. L. Yuen (2006) "Compatibility of LCD Monitors with Frame‐Sequential
Stereoscopic 3D Visualisation" (Invited Paper), IMID/IDMC '06 Digest, (The 6th
International Meeting on Information Display, and The 5th International Display
Manufacturing Conference), pp. 98‐102, Daegu, South Korea, 22‐25 August 2006.
This paper appears to have been the first published manuscript to comprehensively
analyse the time‐domain performance of LCD monitors and describe why high levels
of crosstalk occur with non‐3D‐ready LCD monitors. This work was the first published
manuscript to disclose a way of reducing crosstalk when using the time‐sequential 3D
method on LCD monitors by increasing the image update addressing rate. My early
papers used to term “compatibility” to refer to the display’s capability to present 3D
images with low levels of crosstalk.

ix
Paper 6 A. J. Woods, K. S. Karvinen (2008) "The compatibility of consumer plasma displays
with time‐sequential stereoscopic 3D visualization" Stereoscopic Displays and
Applications XIX, Proceedings of IS&T/SPIE Electronic Imaging, SPIE Vol. 6803, pp.
68030X‐1 to 68030X‐9, San Jose, California, January 2008.
This paper presents a comprehensive analysis of the ability for consumer plasma
displays to display low crosstalk images when used with active shutter 3D glasses.
Although a search of the literature found two papers which described an earlier effort
to develop an experimental plasma display which exhibited low‐crosstalk
performance, the methods they used were not disclosed.
Paper 7 A. J. Woods, A. Sehic (2009) “The compatibility of LCD TVs with time‐sequential
stereoscopic 3D visualization” Stereoscopic Displays and Applications XX, Proceedings
of IS&T/SPIE Electronic Imaging, SPIE Vol. 7237, pp. 72370N‐1 to 72370N‐9, San Jose,
California, January 2009.
This paper described the analysis of several new backlight and LCD addressing
technologies and their effect on the ability for low‐crosstalk images to be achieved on
these displays.
Paper 8 A. J. Woods, C. R. Harris (2010) “Comparing levels of crosstalk with red/cyan,
blue/yellow, and green/magenta anaglyph 3D glasses” in Stereoscopic Displays and
Applications XXI, Proceedings of IS&T/SPIE Electronic Imaging, SPIE Vol. 7253, pp.
75240Q‐1 to 75240Q‐12, San Jose, California, January 2010.
This work was conducted as a continuation of the work conducted in (refereed journal
paper) Paper 2. It extended the simulation to consider the performance of other
colour‐combination types of anaglyph glasses. A rudimentary validation was also
performed.
Referencing of Thesis Papers
Throughout this exegesis, references to each of the papers included in the thesis is done by way of
bold italic text “Paper #” where “#” is the actual paper number. For ease of reference when reading
this exegesis, a condensed list of all paper numbers, linking them to the paper titles is provided in
Appendix 5.
x
List of Additional Publications by the Candidate Relevant to the Thesis
Several additional manuscripts by me (one refereed journal paper, one invited refereed article, one
refereed conference paper, and six non‐refereed conference papers) which are also relevant to this
topic, but not part of the body of the thesis, are included as an appendix to the thesis – see
Appendix 1 (as per section 4.7 of “Curtin University of Technology ‐ Guidelines for Thesis by
Publication”).
Paper 9 A. J. Woods, S. Tan (2002) “Characterising Sources of Ghosting in Time‐Sequential
Stereoscopic Video Displays” presented at Stereoscopic Displays and Applications XIII
(SD&A), published in Stereoscopic Displays and Virtual Reality Systems IX,
Proceedings of IS&T/SPIE Electronic Imaging, SPIE Vol. 4660, pp. 66‐77, San Jose,
California, January 2002. [Non‐Refereed Conference Paper]
This paper reported on an analysis of the mechanisms of crosstalk when using active
shutter glasses with CRT displays to present stereoscopic 3D images. The results of
this work are reported in refereed journal format in Journal Paper 1. Paper 1 is the
first appearance of the work of Paper 9 in refereed journal format.
Paper 10 A. J. Woods, T. Rourke (2004) “Ghosting in Anaglyphic Stereoscopic Images”
presented at Stereoscopic Displays and Applications XV (SD&A), published in
Stereoscopic Displays and Virtual Reality Systems XI, Proceedings of IS&T/SPIE
Electronic Imaging, SPIE Vol. 5291, pp. 354‐365, San Jose, California, January 2004.
[Non‐Refereed Conference Paper]
This paper reported an early analysis of crosstalk in anaglyph 3D images on emissive
displays. The results of this work are reported in refereed journal format in (refereed
journal) Paper 1, and contributed valuable background research to (refereed journal)
Paper 2.
xi
Paper 11 A. J. Woods (2005) “Compatibility of Display Products with Stereoscopic Display
Methods” International Display Manufacturing Conference (IDMC), pp. 290‐293,
Taiwan, February 2005. [Non‐Refereed Conference Paper]
This paper was an early attempt to classify the display performance characteristics of
a wide range of emissive displays and their ability to present low‐crosstalk
stereoscopic images using a selection of stereoscopic display methods. In this context,
“compatibility” refers to the display’s ability to present low‐crosstalk stereoscopic
images.
Paper 12 A. J. Woods, T. Rourke, K. L. Yuen (2006) "The Compatibility of Consumer Displays
with Time‐Sequential Stereoscopic 3D Visualisation" (Invited Plenary Paper),
Proceedings of the K‐IDS Three‐Dimensional Display Workshop 2006, pp. 7‐10, Seoul
National University, Seoul, South Korea, 21 August 2006.
[Non‐Refereed Conference Paper]
This paper presented an analysis of the display performance characteristics of LCD
monitors and DLP projectors and their ability to display low‐crosstalk stereoscopic
images. Again in this context, “compatibility” refers to the display’s ability to present
low‐crosstalk stereoscopic images. This work was subsequently presented in more
detail in (refereed conference paper) Paper 5 and (non‐refereed conference paper)
Paper 12.
Paper 13 A. J. Woods, T. Rourke (2007) “The compatibility of consumer DLP projectors with
time‐sequential stereoscopic 3D visualization” presented at Stereoscopic Displays
and Applications XVIII, published in Stereoscopic Displays and Virtual Reality Systems
XIV, Proceedings of IS&T/SPIE Electronic Imaging, SPIE Vol. 6490, pp. 64900V‐1 to
64900V ‐7, San Jose, California, January 2007. [Non‐Refereed Conference Paper]
This paper presented a more detailed analysis of the display performance
characteristics of DLP projectors and their ability to display low‐crosstalk stereoscopic
images. Again in this context, “compatibility” refers to the display’s ability to present
low‐crosstalk stereoscopic images. Aspects of this work are subsequently reported in
(refereed journal) Paper 1.

xii
Paper 14 A. J. Woods (2009) "3‐D Displays in the Home" Information Display, 25(07), pp 8‐12,
July 2009. [Invited Refereed Article]
This paper reviewed the five technologies that were being used for consumer released
3DTVs and 3D monitors at the time the article was written – DLP time‐sequential, LCD
micro‐polarised, LCD time‐sequential, PDP (plasma display panel) time‐sequential,
and LCD variable‐polarisation‐angle. The second half of the paper discussed the
compatibility of conventional (non‐3D‐Ready) displays with stereoscopic display
methods, drawing from Paper 5, Paper 6, Paper 7, and Paper 11.
Paper 15 M. A. Weissman, A. J. Woods (2011) “A simple method for measuring crosstalk in
stereoscopic displays” Stereoscopic Displays and Applications XXII, Proceedings of
IS&T/SPIE Electronic Imaging, SPIE Vol. 7863, pp. 786310‐1 to ‐11, Burlingame,
California, January 2011. [Non‐Refereed Conference Paper]
This paper describes the development of a test chart method of measuring crosstalk in
stereoscopic displays. The results of this work are reported in Journal Paper 1.
Paper 16 A. J. Woods (2011) “How are crosstalk and ghosting defined in the stereoscopic
literature?” Stereoscopic Displays and Applications XXII, Proceedings of IS&T/SPIE
Electronic Imaging, SPIE Vol. 7863, pp. 78630Z‐1 to 78630Z‐12, Burlingame,
California, January 2011. [Non‐Refereed Conference Paper]
This paper investigated the published literature on the terms crosstalk and ghosting
and related terms to determine accepted meanings, as well as descriptive and
mathematical definitions. This paper informs the literature review of the thesis and
its results are also reported in (refereed journal) Paper 1.
xiii
Paper 17 A. J. Woods, J. Helliwell (2012) “Investigating the cross‐compatibility of IR‐controlled
active shutter glasses” Stereoscopic Displays and Applications XXIII, Proceedings of
IS&T/SPIE Electronic Imaging, SPIE Vol. 8288, pp. 82881C‐1 to 82881C‐10,
Burlingame, California, January 2012. [Refereed Conference Paper]
This paper investigates the infra‐red signalling which is used to control and
synchronise the operation of liquid‐crystal shutter glasses with the light output of
time‐sequential 3D displays. Aspects of this work, primarily the phase and duty cycle
of the glasses, provide background knowledge for the analysis of crosstalk in shutter
glasses 3D displays as reported in (refereed journal) Paper 1 and (refereed
conference) Paper 5, Paper 6 and Paper 7.
Paper 18 A. J. Woods (2013) “3D or 3‐D: A study of terminology, usage and style” European
Science Editing, 39(3), pp. 59‐62, August 2013. [Refereed Journal Paper]
This paper investigates the terminology and usage of the two acronyms “3D” and
“3‐D” and in particular examines the publication styles which prescribe their usage in
various technical publications. Both acronyms are accepted abbreviations for the
term “three‐dimensional” but when publishing the works of this thesis, several
different publication styles were encountered with different publishers. I felt it was
important to understand the background behind the various publication styles as they
can have a significant effect on the ambiguity and preciseness of language related to
stereoscopic displays.
xiv
Refereed Status Statement
This listing outlines the refereed status of all the publications included with this thesis.
[Core Publications]
Papers 1 to 4 are published in refereed journals:
the IS&T/SPIE Journal of Electronic Imaging (JEI)
the Journal of the Society for Information Display (JSID)
the SPIE journal of Optical Engineering (OE)
Papers 5 to 8 are refereed papers published in conference proceedings:
the IS&T/SPIE Stereoscopic Displays and Applications conference
the International Meeting on Information Display (IMID)
[Additional Publications]
Paper 18 is published in a refereed journal – European Science Editing.
Paper 14 is published in a refereed society periodical – Information Display.
Paper 17 is a refereed paper published in a conference proceedings – IS&T/SPIE Stereoscopic
Displays and Applications.
Paper 9, Paper 10, Paper 11, Paper 12, Paper 13, Paper 15 and Paper 16 were published in
conference proceedings and were not refereed.
Evidence of peer‐review of the refereed papers is provided in Appendix 3.

xv
Copyright Permission Statement
I warrant that I have obtained, where necessary, permission from the copyright owners to use any
third‐party copyright material reproduced in the thesis (e.g. questionnaires, artwork, unpublished
letters), or to use any of my own published work (e.g. journal articles) in which the copyright is held
by another party (e.g. publisher, co‐author).
Copies of the copyright permission statements for each of the papers included in this thesis are
included in Appendix 4.
xvi
List of Stereoscopic Terminology
3D An acronym for ‘three‐dimensional’. Is often used to specifically refer to
stereoscopic 3D technologies or methods (such as 3D Movies, 3D Displays, 3D
cameras, 3D glasses, etc.) which invoke a person’s binocular vision to experience
depth perception, however it can also be used to refer to non‐stereoscopic 3D
technologies (such as 3D computer graphics, 3D animation, 3D modelling, 3D
printing, DirectX 3D, etc.).
3DTV A television display that is capable of displaying stereoscopic 3D images and video.
Short for “Three‐Dimensional Television”.
3‐D see 3D
Anaglyph A method of presenting stereoscopic 3D images where the left and right images
are multiplexed using complementary colour channels of the display (usually red
for the left eye and cyan for the right eye, although other colour combinations are
possible) and the observer wears 3D glasses fitted with colour filters matched to
the chosen colour channels. From Late Latin ‘anaglyphus’, carved in low relief.
Crosstalk The incomplete isolation of the left and right image channels in a stereoscopic
display so that the content from one channel is partly present in another channel.2
For multi‐view displays this can be simplified to: The incomplete isolation of the
image channels in a stereoscopic display so that the content from one channel is
partly present in another channel.
CRT Cathode ray tube – as in the original technology used for television displays
DLP Digital light processing – as used in some projectors and rear‐projection televisions.
The core technology in a DLP based display is a digital micro‐mirror device (DMD).
Ghosting The perception of crosstalk – see crosstalk. 2
Leakage The (amount of) light that leaks from one stereoscopic image channel to another –
see crosstalk. 2
LCD Liquid‐crystal display
LCS Liquid‐crystal shutter ‐ as used in LCS 3D glasses (or active shutter glasses) with
time‐sequential stereoscopic displays.
PDP Plasma display panel
s3D Stereoscopic 3D – see ‘3D’ and ‘Stereoscopic’
Stereoscopic 'Solid looking': having visible depth as well as height and width. May refer to any
experience or device that is associated with binocular depth perception.3
xvii
Time‐sequential A method of presenting stereoscopic 3D images where the left and right images
are displayed alternately as a sequence of left and right images (usually at 120 or
100fps) and some type of 3D glasses or autostereoscopic apparatus is used to gate
left and right images to the left and right eyes. The most common implementation
has the observer wearing a pair of active shutter glasses (usually fitted with liquid
crystal (LC) shutters) which alternately block the left and right eyes in sequence
with the presented left and right images. Also known as time‐multiplexed, the
term is a superset of: field‐sequential, frame‐sequential, alternate field, alternate
frame, and active‐stereo.
1
1. Introduction
The research presented in this thesis examines the image quality attribute of stereoscopic displays
called crosstalk.
Stereoscopic displays are a special class of display which are capable of presenting stereoscopic 3D
images to an observer. There is an incredibly wide variety of stereoscopic display technologies that
have been conceived, demonstrated or are commercially available4,5 (Paper 14 provides a
description of 3D displays available to home consumers in 2009). Stereoscopic 3D displays function
by presenting a separate perspective image to each of an observer’s two eyes, thereby allowing
most observers to perceive an image containing realistic depth, by way of binocular stereopsis. It is
worth noting that an estimated 2% of the population do not have normal stereoscopic image
perception and hence won’t be able to experience the full benefit of a stereoscopic display.6 For
those that do have good binocular vision, stereoscopic displays provide a heightened sense of
realism and a visually attractive form of image reproduction.
The ways in which various stereoscopic displays relay different perspective images to the two eyes of
an observer are amazingly wide and varied. Examples include:
‘Time‐Sequential 3D’ where the observer(s) wear a pair of active shutter glasses (containing
liquid crystal shutters (LCS)) which alternately block and pass a discrete sequence of left
and right images from the display to the observers’ left and right eyes;
‘Polarised 3D’ where the left and right images are presented with different light
polarisation and the observer(s) wear a pair of polarised 3D glasses which direct the correct
image to each eye;
‘Anaglyph 3D’ (also known as spectral‐multiplexing) where the left and right images are
encoded into different colour ranges of the visible spectrum (The Infitec,7 Dolby 3D,8 and
Panavision 3D cinema techniques are a special cases of anaglyph); and
‘Lenticular 3D’ and ‘Parallax Barrier 3D’ where a special lens sheet or barrier sheet is placed
over the face of a display which creates multiple viewing zones in different directions so
that the observers’ left and right eyes receive different perspective images.
Display technologies which can be used as the basis for stereoscopic display include liquid crystal
displays (LCD), plasma display panels (PDP), cathode ray tubes (CRT), digital light projection (DLP),
organic light emitting diode (OLED), light emitting diode (LED) arrays, film projection and also the
printed page.
Stereoscopic displays are now deployed very widely in consumer, business, and industry
environments. In 2012 there were an estimated 43 thousand 3D cinema screens worldwide,9 and an
estimated cumulative 45 million 3DTVs (Three‐Dimensional Televisions) sold worldwide.10
2
Additionally, there is a growing number of stereoscopic 3D display devices including 3D monitors, 3D
projectors, 3D mobile phones, 3D cameras, 3D glasses, 3D tablets and other 3D devices.11
The substantive topic of this thesis is crosstalk in stereoscopic displays. Crosstalk is a display
performance characteristic of stereoscopic displays. In an ideal stereoscopic display, the left image is
only sent to the left eye and the right image is only sent to the right eye. However, due to various
imperfections with most stereoscopic display technologies, some of the left image can leak to the
right eye, and some of the right image leaks to the left eye. This leakage of one image into the other
eye will usually be seen as a slight doubling or ghosting of the image, and is generally known as
ghosting or crosstalk. Different displays will exhibit different amounts of crosstalk, and depending
on the amount of crosstalk, it can degrade the perceived image quality of stereoscopic 3D images. If
crosstalk levels are sufficiently high, the fusion of stereoscopic image pairs by the human observer’s
visual system can fail, preventing the successful perception of a stereoscopic 3D image. Crosstalk is
one of the primary determinants of image quality in stereoscopic displays. Ideally, crosstalk levels
for any high‐quality stereoscopic display will be low – preferably much less than 5%.2
The terms ‘stereoscopic’ and ‘3D’ are often used interchangeably in the published literature, as they
sometimes are in this exegesis and the included papers, however these two terms do have important
differences. The term ‘3D’ is short for ‘three‐dimensional’ and technically can be used to refer to any
device containing, or concept referring to, three dimensions. The term “three‐dimensional” has
been used in relation to stereoscopic photography at least since 1936.12 The first use of the
abbreviation “3‐D” in the published literature appears to be Spottiswoode, et al. in 1952 in reference
to 3D Movies.13 “3D” has been used in reference to all stereoscopic technologies ever since. In the
1970s and 1980s the terms 3D computer graphics and 3D animation started to be used to refer to
the computer generation of images which contained monocular depth cues to enhance the realism
of the images, but were not necessarily stereoscopic.14 Other uses of the 3D term include 3D
printing (additive manufacturing), 3D laser scanning, 3D Computer Aided Design (CAD), 3D modelling
(3D reconstruction), DirectX 3D, and others. In essence stereoscopic 3D is a subset of all possible
uses of the term 3D. For clarity, some authors use the abbreviation s3D to explicitly describe the
stereoscopic form of 3D, but in many instances the distinction will be obvious. In this thesis “3D” will
always be used in reference to stereoscopic 3D, unless stated otherwise.
The term three‐dimensional can be abbreviated as either “3‐D” or “3D”. Many journals and most
newspapers apply a house style requiring the use of the hyphenated “3‐D” form, whereas younger
publications generally use the non‐hyphenated “3D” form. This exegesis and most of the papers
included with the thesis use the non‐hyphenated “3D” form. Some of the papers in this thesis have
been published in journals which prescribe the use of the hyphenated form, and hence these papers

3
use the “3‐D” form. The usage of the two forms “3D” and “3‐D” in the wider published literature is
examined in more detail in Paper 18. 15
In the published literature the term crosstalk can sometimes be written as ‘cross‐talk’,16 ‘cross talk’17
or even ‘X‐talk’. 16 The term ‘crosstalk’ without any intermediate space or hyphen, is the more
commonly used variant so that is what will be used in this exegesis (as described in Paper 16).18 One
of the journals that published two of the papers contained in this thesis prescribed the use of the
‘cross‐talk’ form, so those two papers (Paper 2 and Paper 3) vary from the style of the other papers
contained in this thesis.
There is also some ambiguity about the definition of the term “stereoscopic display” in the published
literature. The three terms “stereoscopic display”, “autostereoscopic display”, and “three‐
dimensional display” are related but distinct.
In the first definition:
“stereoscopic display” refers to any display that is capable of displaying stereoscopic images
to an observer (either a display requiring the observer to wear some type of 3D glasses or a
display capable of presenting separate views to the left and right eyes without requiring the
user to wear some form of 3D glasses).19,20
In the second definition:
“stereoscopic display” refers to displays that are capable of presenting stereoscopic images
to the observer that require the observer to wear some form of viewing apparatus, e.g. 3D
glasses.21
In both definitions, “autostereoscopic displays” are displays capable of presenting stereoscopic
images to an observer without the observer needing to wear any form of viewing apparatus –
sometimes referred to as being “glasses‐free”. In definition 1, “stereoscopic display” is a superset of
“autostereoscopic display” whereas in definition 2, “stereoscopic display” and “autostereoscopic
display” are mutually exclusive terms. The term “three‐dimensional display” usually refers to a
superset of “stereoscopic display” and “autostereoscopic display” to additionally include volumetric
displays, and holographic displays.20 Definition 1 is what will be used in this thesis.
The human visual system determines depth and dimensionality from images using a range of depth
cues.22 These depth cues can be classified into ‘binocular depth cues’ – those requiring the image to
be viewed stereoscopically using two eyes – and ‘monocular depth cues’ – those depth cues that can
be perceived with only one eye. Monocular depth cues include interposition or occlusion, linear
perspective, aerial perspective, familiar size, shadows and shading, motion parallax, texture gradient,
4
and accommodation (focus).22 Binocular depth cues comprise convergence (the inward and outward
rotation of the eyes to align on particular objects in a scene) and binocular disparity (the difference
in image location of an object seen by the left and right eyes, resulting from the horizontal
separation of the two eyes).22 Convergence and binocular disparity are the two cues that are missing
from regular 2D displays – but are specifically invoked in stereoscopic displays. Two eyes (and
functioning binocular vision) are required to see and utilize binocular depth cues – they cannot be
seen with only one eye. Binocular depth cues usually provide the strongest sense of depth amongst
all depth cues.
One of the fascinating aspects about crosstalk is that the mechanisms by which it occurs vary
considerably from one stereoscopic display technology to another. Even within one stereoscopic
display: there will be multiple contributors to the overall crosstalk present in a display, the relative
proportion of those contributors to the overall crosstalk can vary considerably, and the overall
amount of crosstalk can also vary depending on screen position, viewing angle, viewing position, and
other factors. Crosstalk is a complicated topic and the work described in this thesis has attempted to
make sense and provide some order to the incredible variability of this topic.
In order to achieve the low crosstalk levels that characterise a high‐quality stereoscopic display, it is
important to understand the relative contributions of the various crosstalk mechanisms of a
stereoscopic display, know the display properties (such as pixel response rate, or pixel spectra) that
determine how crosstalk occurs, and finally identify the combination of display properties and
technologies that will economically allow low‐crosstalk levels. In order to understand the interplay
of all these crosstalk‐causing factors, it is highly advantageous to develop an algorithm and
simulation which will allow the prediction of crosstalk based on the display specifications. For a
display designer, the power of an accurate and functioning simulation is that it allows a range of
what‐if scenarios to be performed to research low‐crosstalk combinations without needing to
perform exhaustive physical testing.
The aims of the research described in this thesis are therefore to:
(a) Characterise the mechanisms by which crosstalk occurs in a selection of stereoscopic
display technologies,
(b) Mathematically model and simulate the presence of crosstalk in a selection of stereoscopic
display technologies, and validate those models,
(c) Use crosstalk simulation to investigate how different display parameters affect the presence
of crosstalk, and
(d) Recommend ways in which crosstalk can be reduced in a selection of stereoscopic display
technologies.
5
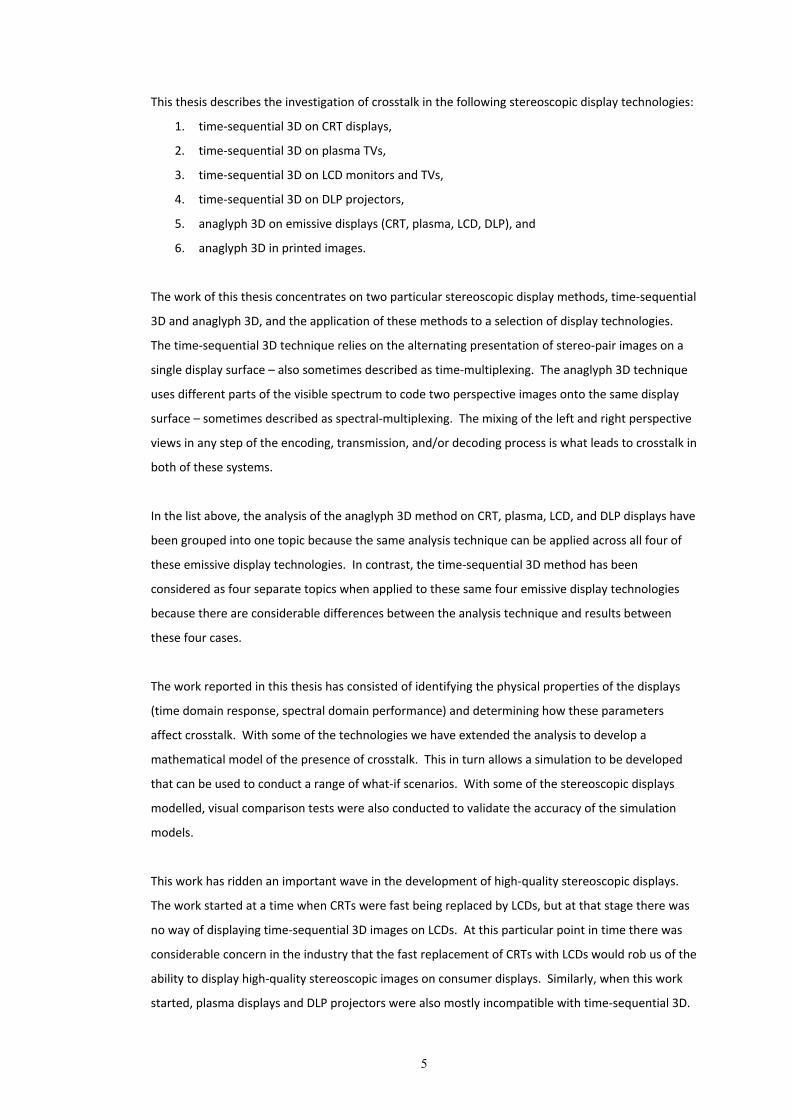
This thesis describes the investigation of crosstalk in the following stereoscopic display technologies:
1. time‐sequential 3D on CRT displays,
2. time‐sequential 3D on plasma TVs,
3. time‐sequential 3D on LCD monitors and TVs,
4. time‐sequential 3D on DLP projectors,
5. anaglyph 3D on emissive displays (CRT, plasma, LCD, DLP), and
6. anaglyph 3D in printed images.
The work of this thesis concentrates on two particular stereoscopic display methods, time‐sequential
3D and anaglyph 3D, and the application of these methods to a selection of display technologies.
The time‐sequential 3D technique relies on the alternating presentation of stereo‐pair images on a
single display surface – also sometimes described as time‐multiplexing. The anaglyph 3D technique
uses different parts of the visible spectrum to code two perspective images onto the same display
surface – sometimes described as spectral‐multiplexing. The mixing of the left and right perspective
views in any step of the encoding, transmission, and/or decoding process is what leads to crosstalk in
both of these systems.
In the list above, the analysis of the anaglyph 3D method on CRT, plasma, LCD, and DLP displays have
been grouped into one topic because the same analysis technique can be applied across all four of
these emissive display technologies. In contrast, the time‐sequential 3D method has been
considered as four separate topics when applied to these same four emissive display technologies
because there are considerable differences between the analysis technique and results between
these four cases.
The work reported in this thesis has consisted of identifying the physical properties of the displays
(time domain response, spectral domain performance) and determining how these parameters
affect crosstalk. With some of the technologies we have extended the analysis to develop a
mathematical model of the presence of crosstalk. This in turn allows a simulation to be developed
that can be used to conduct a range of what‐if scenarios. With some of the stereoscopic displays
modelled, visual comparison tests were also conducted to validate the accuracy of the simulation
models.
This work has ridden an important wave in the development of high‐quality stereoscopic displays.
The work started at a time when CRTs were fast being replaced by LCDs, but at that stage there was
no way of displaying time‐sequential 3D images on LCDs. At this particular point in time there was
considerable concern in the industry that the fast replacement of CRTs with LCDs would rob us of the
ability to display high‐quality stereoscopic images on consumer displays. Similarly, when this work
started, plasma displays and DLP projectors were also mostly incompatible with time‐sequential 3D.

6
Fortunately that situation has now completely changed, and high‐quality time‐sequential 3D
presentation is possible with a wide range of display technologies. My hope is that this early work
on the compatibility of new display technologies with stereoscopic display methods and the ability to
display low‐crosstalk images may have influenced the development efforts of new stereoscopic
display technologies. At the very least we know that some of the work of this thesis was conducted
at the very fast advancing edge of stereoscopic display developments.
In 2005 and 2006, Paper 11 and Paper 12 considered the compatibility of then current display
technologies with the various stereoscopic display methods. These papers sought to establish a
framework for understanding which displays would and would not support stereoscopic imaging,
draw attention to the fact that there were gaps in compatibility that needed further research, and
identify the aspects that limited 3D compatibility. Stereoscopic systems have long piggy‐backed on
existing technologies, hence considering compatibility of stereoscopic methods with existing
technologies has been an important process.
Despite the high level of deployment of stereoscopic display technologies in consumer and industrial
settings to date, there still remain many gaps of knowledge in this area and there are opportunities
for research to address these gaps.
The organisation of this thesis is as follows. Following this introduction (Chapter 1), the literature in
the field of crosstalk in stereoscopic displays is reviewed (Chapter 2). Next, the framework for the
research into crosstalk is discussed (Chapter 3). The results of the research into crosstalk (Chapter 4)
is then provided by way of a discussion of the published works – providing an overview of the
findings and linking the published works into a coherent theme. The results and findings of the
previous chapter are then reviewed and opportunities for future research discussed (Chapter 5).
Finally the thesis draws conclusions from the published works (Chapter 6).
In preparing this exegesis my aim has been to provide a detailed explanatory framework which links
the published papers without unnecessarily duplicating the content presented in the publications.
Copies of the publications which form the core of this thesis are included in Chapter 9. Additional
publications by me that are relevant to the thesis, and in some cases have informed the refereed
publications included in Chapter 9, are included in Appendix 1. A full listing of papers included in
the thesis is provided in Appendix 5 in paper number, chronological and title alphabetical order.
Some comments regarding typographical aspects in this exegesis: em‐dashes have been typeset with
surrounding spaces to give the different statement sections better visual separation; citations to
papers in the references list are shown in superscript form; if citations coincide with punctuation, the
7
citation will generally be placed after the punctuation; where quotations are used, the following
punctuation will be placed outside the quotation marks unless the punctuation originally appeared in
the quotation; and the exegesis is written in first person voice.
As the reader proceeds through this exegesis, “Chapter #” will refer to chapters in this exegesis, and
“Section #” will refer to particular sections in the included publications.
This thesis submission consists of two parts – the ‘exegesis’ and the compendium of published
works. The purpose of the ‘exegesis’ is to link the separate published works and to place them into a
logical research framework in the context of an established body of knowledge. Hence ‘thesis’ refers
to the full PhD submission, whereas ‘exegesis’ refers to the part excluding the published papers.
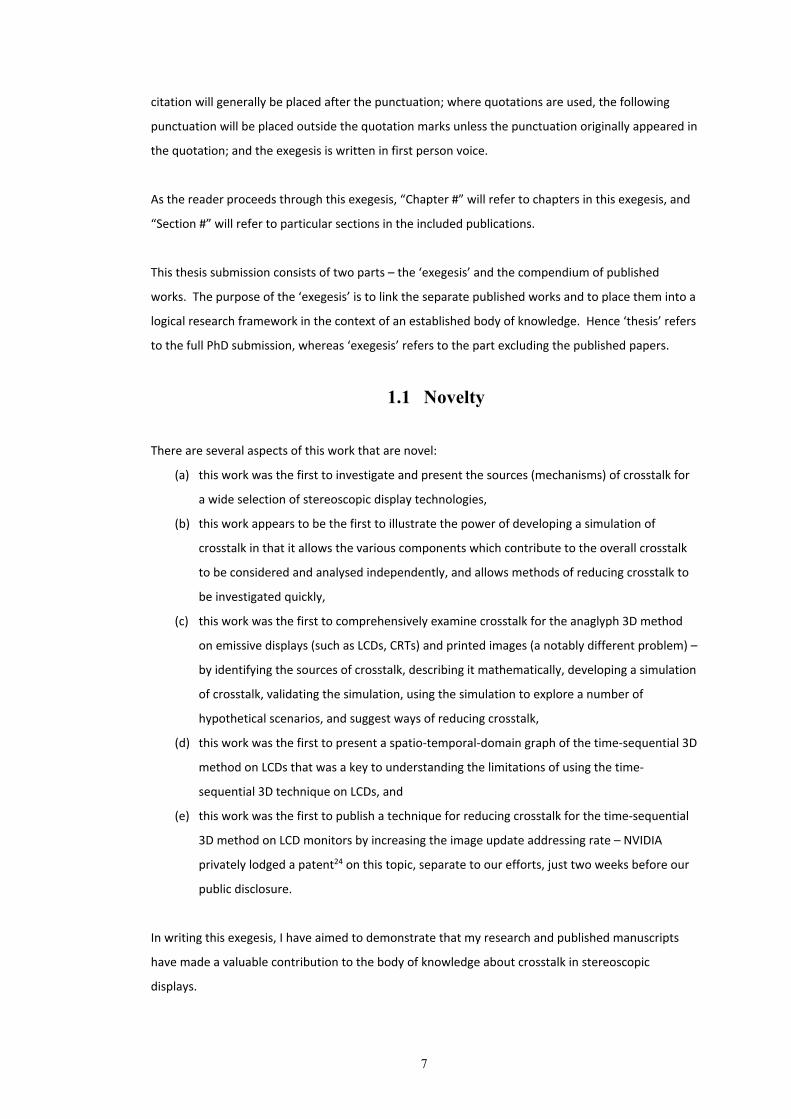
1.1 Novelty
There are several aspects of this work that are novel:
(a) this work was the first to investigate and present the sources (mechanisms) of crosstalk for
a wide selection of stereoscopic display technologies,
(b) this work appears to be the first to illustrate the power of developing a simulation of
crosstalk in that it allows the various components which contribute to the overall crosstalk
to be considered and analysed independently, and allows methods of reducing crosstalk to
be investigated quickly,
(c) this work was the first to comprehensively examine crosstalk for the anaglyph 3D method
on emissive displays (such as LCDs, CRTs) and printed images (a notably different problem) –
by identifying the sources of crosstalk, describing it mathematically, developing a simulation
of crosstalk, validating the simulation, using the simulation to explore a number of
hypothetical scenarios, and suggest ways of reducing crosstalk,
(d) this work was the first to present a spatio‐temporal‐domain graph of the time‐sequential 3D
method on LCDs that was a key to understanding the limitations of using the time‐
sequential 3D technique on LCDs, and
(e) this work was the first to publish a technique for reducing crosstalk for the time‐sequential
3D method on LCD monitors by increasing the image update addressing rate – NVIDIA
privately lodged a patent24 on this topic, separate to our efforts, just two weeks before our
public disclosure.
In writing this exegesis, I have aimed to demonstrate that my research and published manuscripts
have made a valuable contribution to the body of knowledge about crosstalk in stereoscopic
displays.
8
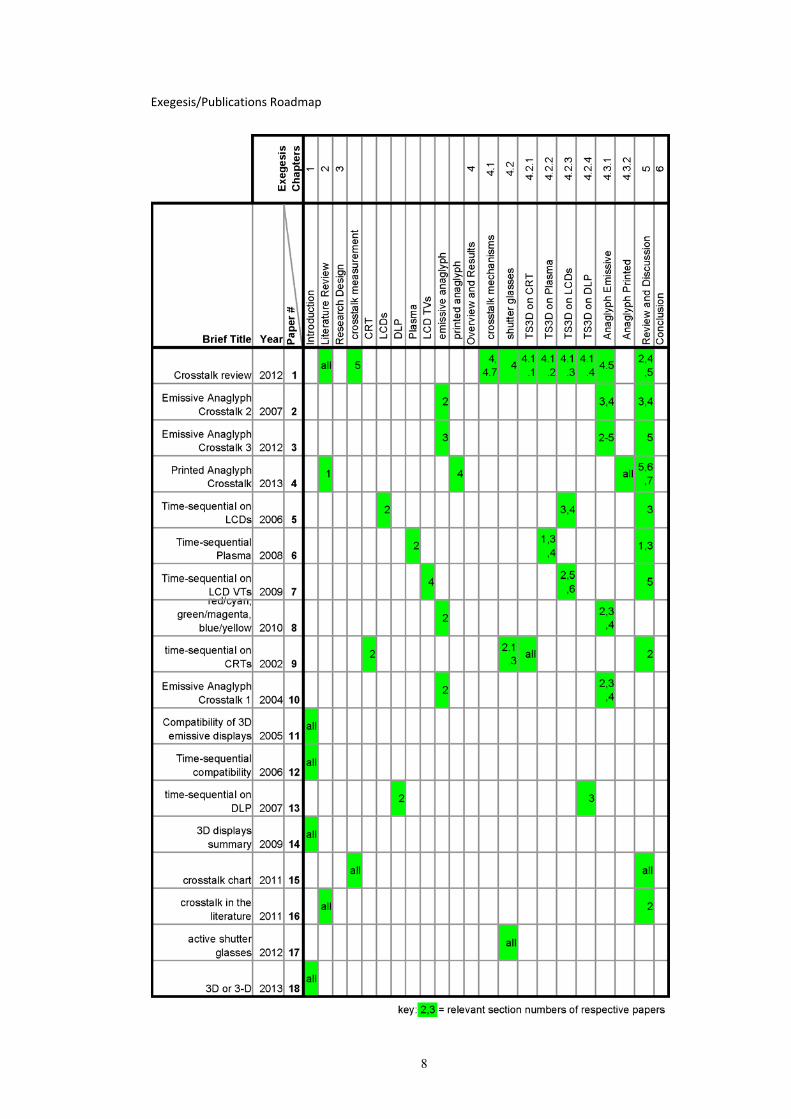
Exegesis/Publications Roadmap
9
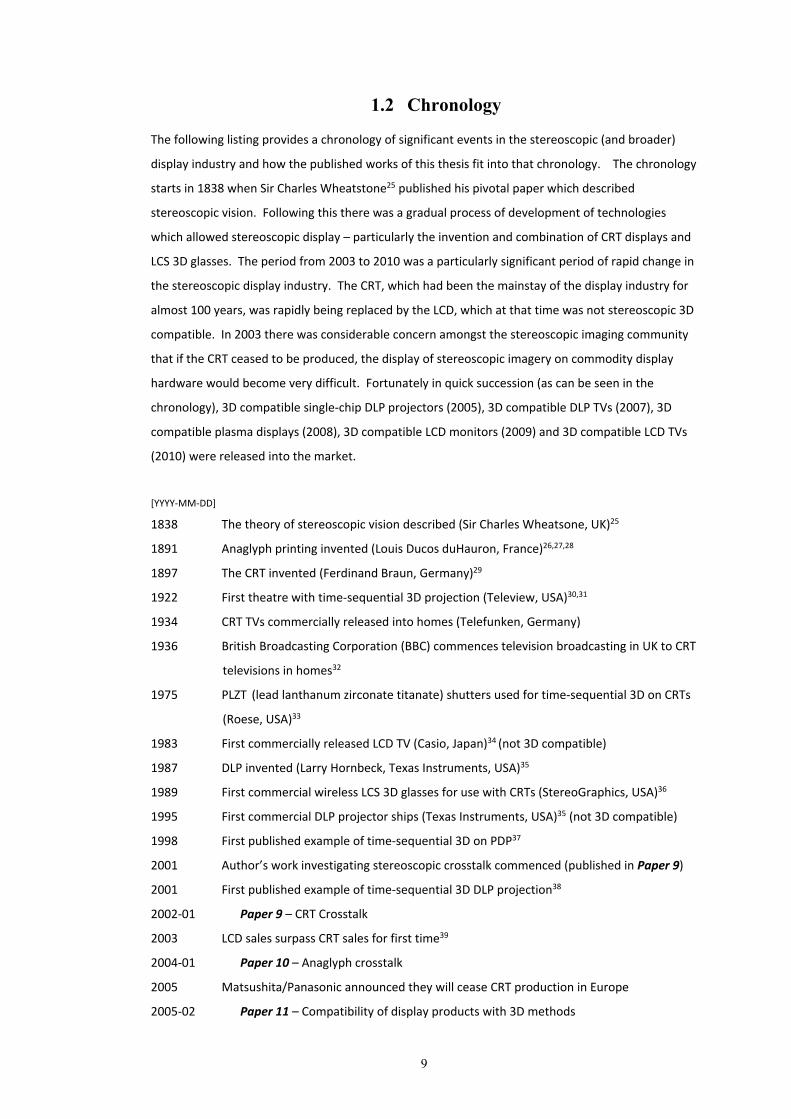
1.2 Chronology The following listing provides a chronology of significant events in the stereoscopic (and broader)
display industry and how the published works of this thesis fit into that chronology. The chronology
starts in 1838 when Sir Charles Wheatstone25 published his pivotal paper which described
stereoscopic vision. Following this there was a gradual process of development of technologies
which allowed stereoscopic display – particularly the invention and combination of CRT displays and
LCS 3D glasses. The period from 2003 to 2010 was a particularly significant period of rapid change in
the stereoscopic display industry. The CRT, which had been the mainstay of the display industry for
almost 100 years, was rapidly being replaced by the LCD, which at that time was not stereoscopic 3D
compatible. In 2003 there was considerable concern amongst the stereoscopic imaging community
that if the CRT ceased to be produced, the display of stereoscopic imagery on commodity display
hardware would become very difficult. Fortunately in quick succession (as can be seen in the
chronology), 3D compatible single‐chip DLP projectors (2005), 3D compatible DLP TVs (2007), 3D
compatible plasma displays (2008), 3D compatible LCD monitors (2009) and 3D compatible LCD TVs
(2010) were released into the market.
[YYYY‐MM‐DD]
1838 The theory of stereoscopic vision described (Sir Charles Wheatsone, UK)25
1891 Anaglyph printing invented (Louis Ducos duHauron, France)26,27,28
1897 The CRT invented (Ferdinand Braun, Germany)29
1922 First theatre with time‐sequential 3D projection (Teleview, USA)30,31
1934 CRT TVs commercially released into homes (Telefunken, Germany)
1936 British Broadcasting Corporation (BBC) commences television broadcasting in UK to CRT
televisions in homes32
1975 PLZT (lead lanthanum zirconate titanate) shutters used for time‐sequential 3D on CRTs
(Roese, USA)33
1983 First commercially released LCD TV (Casio, Japan)34 (not 3D compatible)
1987 DLP invented (Larry Hornbeck, Texas Instruments, USA)35
1989 First commercial wireless LCS 3D glasses for use with CRTs (StereoGraphics, USA)36
1995 First commercial DLP projector ships (Texas Instruments, USA)35 (not 3D compatible)
1998 First published example of time‐sequential 3D on PDP37
2001 Author’s work investigating stereoscopic crosstalk commenced (published in Paper 9)
2001 First published example of time‐sequential 3D DLP projection38
2002‐01 Paper 9 – CRT Crosstalk
2003 LCD sales surpass CRT sales for first time39
2004‐01 Paper 10 – Anaglyph crosstalk
2005 Matsushita/Panasonic announced they will cease CRT production in Europe
2005‐02 Paper 11 – Compatibility of display products with 3D methods
10
2005‐03 First 3D compatible single‐chip DLP projector commercially released (DepthQ, USA)40
2005‐11 DLP 3D projection commences in commercial theatres (RealD, USA)11
2006‐08‐04 NVIDIA files time‐sequential 3D LCD Patent (USA)24
2006‐08‐21 Paper 12 – Compatibility of display products with time‐sequential 3D
2006‐08‐22 Paper 5 – Compatibility of LCDs with time‐sequential 3D
2007‐01 Paper 13 – Compatibility of DLP displays with time‐sequential 3D
2007‐04 3D‐Ready DLP HDTVs commercially released (Samsung, USA)41
2007‐11 Paper 2 – Anaglyph crosstalk on LCD, plasma and CRT displays
2008 Sony announce they will cease CRT production42,32
2008‐01 Paper 6 – Compatibility of plasma displays with time‐sequential 3D
2008‐03 3D‐Ready plasma HDTVs commercially released (Samsung, USA) 41
2009‐01 Paper 7 – Compatibility of LCD TVs with time‐sequential 3D
2009‐02 first consumer‐grade 3D‐Ready single‐chip DLP projector released (Viewsonic)43,44
2009‐02 first 3D‐Ready LCD monitors commercially released (Samsung & Viewsonic, USA)45
2009‐07 Paper 14 – “3‐D Displays in the Home”
2010‐01 Paper 8 – Anaglyph crosstalk with different colour primaries
2010‐03 first 3D‐Ready LCD HDTVs commercially released (Samsung, USA) 41
2011‐01 Paper 15 – A simple method for measuring crosstalk
2011‐01 Paper 16 – “How are crosstalk and ghosting defined in the stereoscopic literature?”
2012‐01 Paper 17 – 3D shutter glasses IR protocols
2012‐06 Paper 3 – Anaglyph crosstalk simulation on emissive displays
2012‐12 Paper 1 – “Crosstalk in stereoscopic displays: a review”
2013‐04 Paper 4 – Printed anaglyph crosstalk
2013‐08 Paper 18 – “3D or 3‐D: A study of terminology, usage and style”
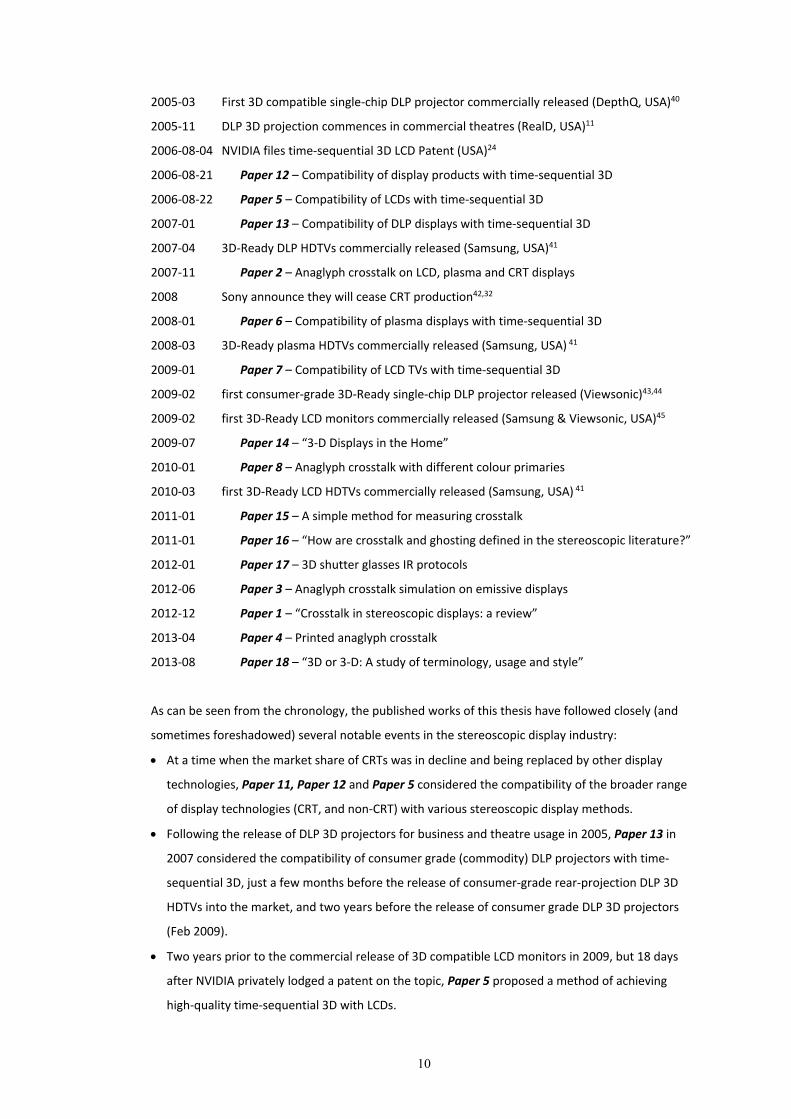
As can be seen from the chronology, the published works of this thesis have followed closely (and
sometimes foreshadowed) several notable events in the stereoscopic display industry:
At a time when the market share of CRTs was in decline and being replaced by other display
technologies, Paper 11, Paper 12 and Paper 5 considered the compatibility of the broader range
of display technologies (CRT, and non‐CRT) with various stereoscopic display methods.
Following the release of DLP 3D projectors for business and theatre usage in 2005, Paper 13 in
2007 considered the compatibility of consumer grade (commodity) DLP projectors with time‐
sequential 3D, just a few months before the release of consumer‐grade rear‐projection DLP 3D
HDTVs into the market, and two years before the release of consumer grade DLP 3D projectors
(Feb 2009).
Two years prior to the commercial release of 3D compatible LCD monitors in 2009, but 18 days
after NVIDIA privately lodged a patent on the topic, Paper 5 proposed a method of achieving
high‐quality time‐sequential 3D with LCDs.

11
Two months prior to the commercial release of 3D compatible plasma HDTVs, Paper 6 examined
the compatibility of plasma displays with the time‐sequential 3D method (reporting on work
commenced some 12 months earlier).
14 months prior to the commercial release of 3D compatible LCD HDTVs, Paper 7 considered the
compatibility of LCD TVs (and advanced LCD display technologies) with the time‐sequential
stereoscopic display method.
In 2011, when considerable research activity was being conducted into stereoscopic displays and
crosstalk but there remained a notable ‘disparity’ in terminology definitions and usage, Paper 16
investigated the historical usage of terms related to crosstalk and provided recommended
definitions and usage for these terms. This work was later included in (Refereed Journal) Paper 1.
Both of these papers, and an intermediate paper1 (a precursor to Paper 1), have been well cited
in the academic literature to date (109 citations to 20 October 2013).46
12
1.3 Impact
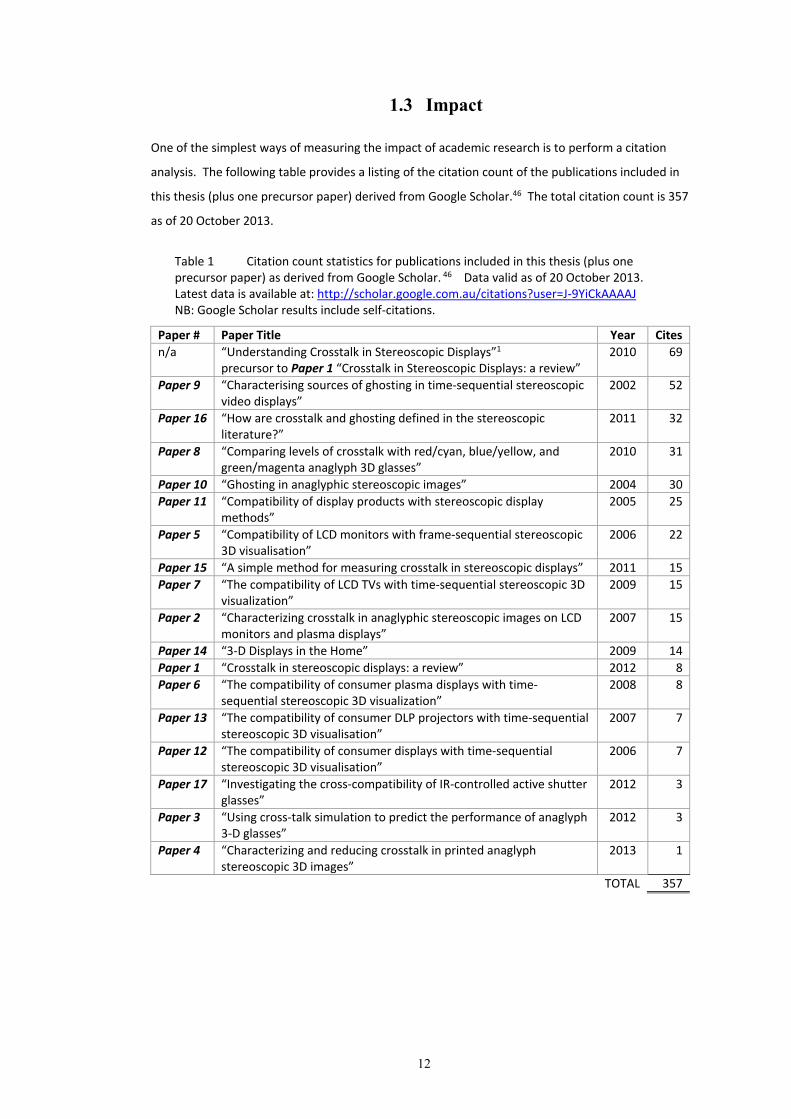
One of the simplest ways of measuring the impact of academic research is to perform a citation
analysis. The following table provides a listing of the citation count of the publications included in
this thesis (plus one precursor paper) derived from Google Scholar.46 The total citation count is 357
as of 20 October 2013.
Table 1 Citation count statistics for publications included in this thesis (plus one precursor paper) as derived from Google Scholar. 46 Data valid as of 20 October 2013. Latest data is available at: http://scholar.google.com.au/citations?user=J‐9YiCkAAAAJ NB: Google Scholar results include self‐citations.
Paper # Paper Title Year Cites
n/a “Understanding Crosstalk in Stereoscopic Displays”1
precursor to Paper 1 “Crosstalk in Stereoscopic Displays: a review” 2010 69
Paper 9 “Characterising sources of ghosting in time‐sequential stereoscopic video displays”
2002 52
Paper 16 “How are crosstalk and ghosting defined in the stereoscopic literature?”
2011 32
Paper 8 “Comparing levels of crosstalk with red/cyan, blue/yellow, and green/magenta anaglyph 3D glasses”
2010 31
Paper 10 “Ghosting in anaglyphic stereoscopic images” 2004 30
Paper 11 “Compatibility of display products with stereoscopic display methods”
2005 25
Paper 5 “Compatibility of LCD monitors with frame‐sequential stereoscopic 3D visualisation”
2006 22
Paper 15 “A simple method for measuring crosstalk in stereoscopic displays” 2011 15
Paper 7 “The compatibility of LCD TVs with time‐sequential stereoscopic 3D visualization”
2009 15
Paper 2 “Characterizing crosstalk in anaglyphic stereoscopic images on LCD monitors and plasma displays”
2007 15
Paper 14 “3‐D Displays in the Home” 2009 14
Paper 1 “Crosstalk in stereoscopic displays: a review” 2012 8
Paper 6 “The compatibility of consumer plasma displays with time‐sequential stereoscopic 3D visualization”
2008 8
Paper 13 “The compatibility of consumer DLP projectors with time‐sequential stereoscopic 3D visualisation”
2007 7
Paper 12 “The compatibility of consumer displays with time‐sequential stereoscopic 3D visualisation”
2006 7
Paper 17 “Investigating the cross‐compatibility of IR‐controlled active shutter glasses”
2012 3
Paper 3 “Using cross‐talk simulation to predict the performance of anaglyph 3‐D glasses”
2012 3
Paper 4 “Characterizing and reducing crosstalk in printed anaglyph stereoscopic 3D images”
2013 1
TOTAL 357

13
2. Literature Review
The topic of crosstalk has a long history. In electronics and telecommunications the term “crosstalk”
has been used as far back as the 1880s47 to describe the leakage of signals between parallel laid
telephone cables. In the field of stereoscopic displays, “crosstalk” has been a recognised term at
least since the 1930s48 to describe the leakage of images between the image channels of a
stereoscopic display.
An extensive review article, “Crosstalk in Stereoscopic Displays: A Review”2 (Paper 1), written by me
and forming part of this thesis submission, provides a detailed background and literature review of
the field of crosstalk in stereoscopic displays up to 2012.
My research into stereoscopic crosstalk commenced in 2001 (for Paper 9 published in 2002) and
hence in preparing this literature review there is necessarily some overlap between the published
literature as it stood in 2001, the published literature as it stands now, and my works which have
been published over the period 2002 to 2013. Several of my papers are believed to have been the
first to publish an investigation of crosstalk in a number of topic areas and hence now form an
important part of the published literature. In preparing this literature review, I have been careful to
identify and distinguish which works are by me and the papers that are by other authors.
The terminology, descriptive definitions, and mathematical definitions of “crosstalk” and related
terms “ghosting”, “leakage”, “system crosstalk”, “viewer crosstalk”, “grey‐to‐grey crosstalk”,
“autostereoscopic crosstalk”, “extinction ratio”, and “3D contrast” are set out in Section 2 of Paper 1
and will not be repeated here. A brief summary of the particular terms relevant to the field of
stereoscopic displays and crosstalk that are important for the understanding of this exegesis are
presented in “List of Stereoscopic Terminology” on page xvi.
An investigation of how the related terms “crosstalk” and “ghosting” have been historically used in
the published literature is presented in Paper 16 and was used to inform the content of Paper 1.
“Crosstalk” and “ghosting” are often used interchangeably in general discussion but do have
separate and distinct definitions as laid out by Lipton in 198749 and summarised on page xvi. My
own early papers tended to use the two terms interchangeably, however as my work has matured
and understanding of the area has increased, the later papers mostly use the term crosstalk, except
where it is appropriate to use the term ghosting.
It is broadly acknowledged that the presence of high levels of crosstalk is detrimental to the
perception of stereoscopic images and a large number of papers have studied this
14
effect.50,51,52,53,54,55,56 A summary of the perceptual effects of crosstalk is provided in Section 3 of
Paper 1.
Crosstalk occurs via a wide range of different mechanisms – Section 4 of Paper 1 provides a detailed
overview of the various methods by which crosstalk can occur in a wide selection of stereoscopic
display technologies. Up to 2001, when my work on crosstalk began, most of the literature on the
subject of crosstalk was based on the time‐sequential 3D CRT displays available at the
time.57,58,59,60,61,62 The literature cited three main contributors to crosstalk: phosphor afterglow,
shutter leakage, and the effect of angle of view through the liquid‐crystal shutter glasses. In 2002,
CRTs were the only emissive desktop display capable of working with the time‐sequential 3D
technique – LCDs and plasma displays were gaining increased market penetration, but commercially
released displays based on these technologies were not compatible with the time‐sequential 3D
display technique.64 In quick succession, time‐sequential 3D compatible displays based on DLP65
(2005), PDP41 (2008) and LCD45 (2009) technologies were released to market. The work of this thesis
has therefore ridden a wave of new stereoscopic display technology development. Background
literature on LCDs,66,67,68 PDPs37,69,70 and DLPs71,38,72 have played an important part in understanding
these display technologies but generally did not directly address any crosstalk related aspects
(Sections 4.1.2 to 4.1.4 of Paper 1).
Chapter 4 of this thesis provides detailed coverage of the new work conducted by me and
collaborators on the mechanisms by which crosstalk occurs with the following types of stereoscopic
displays: time‐sequential 3D on CRT displays, time‐sequential 3D on LCD monitors, time‐sequential
3D on DLP projectors, time‐sequential 3D on plasma TVs, time‐sequential 3D on LCD TVs, anaglyph
3D on emissive displays, and anaglyph 3D in printed images. The crosstalk mechanisms for polarised
3D projection, micro‐polarised LCDs, and autostereoscopic displays, constitute work by other
authors and are described as part of the background literature in Sections 4.2 to 4.4 of Paper 1.
Other background topics relating to crosstalk available in the published literature include: methods
of measuring crosstalk (Section 5 of Paper 1), ways in which crosstalk can be reduced (Section 6 of
Paper 1), a summary of the technique of crosstalk cancellation (Section 7 of Paper 1), and coverage
of the role of simulation in crosstalk analysis (Section 8 of Paper 1).
A full copy of Paper 1 is included in Chapter 9 of this thesis.
Although Paper 1 is ostensibly a review paper, the major content of the paper ‐ Section 4 “Crosstalk
Mechanisms” along with Section 5.2 “Visual Measurement Charts” ‐ are based on original works by
me, and represent the first refereed journal publication of a number of research topics investigated
by me. Approximately 46% of Paper 1 (mostly in the crosstalk mechanisms section) is based on
15
original work conducted by me in cooperation with collaborators. My work now forms a valuable
contribution to the published literature on this topic. It is worth noting that much of my early works
on crosstalk were published in non‐refereed publications. The passage of time would now preclude
the publication of those original works in refereed journals (e.g. CRTs are now an almost extinct
technology). Paper 1 therefore represents the first refereed journal publication of those topics. My
unrefereed papers (Paper 9, Paper 10, Paper 13, Paper 15, Paper 16, and Paper 17)73,74,64,75,76,77,18,78
which contribute to and inform refereed journal Paper 1 are included in Appendix 1 as “additional
publications by the candidate relevant to the thesis” – the contribution of these works to the overall
thesis will be discussed in further detail in Chapter 4 of this exegesis.
Full copies of Paper 9, Paper 10, Paper 13, Paper 15, Paper 16, and Paper 17 are included in
Appendix 1 of this thesis.
Lastly, background information on the topic of printed anaglyphs is provided in Section 1 of Paper 4.
Despite the printed anaglyph 3D technique being one of the oldest 3D methods, invented by Louis
Ducos duHauron in 1891,26,27,28 there has seemingly been relatively little technical analysis of this
very widely used 3D technique. Manuscripts by Norling79 in 1937, Harrington80 et al in 2002, Tran81
in 2005, and Labbe82 in 2009 have examined various aspects of the traditional printed anaglyph, but
there remained significant gaps in the understanding of this widespread 3D technique. One
significant aspect that separates the printed anaglyph 3D technique from the other 3D techniques
considered in this thesis is that the printed anaglyph uses the subtractive colour model whereas the
other 3D techniques all follow the additive colour model – this single aspect requires a different
analysis technique to the other 3D methods.
A full copy of Paper 4 is included in Chapter 9 of this thesis.
16
3. Research Design
The genesis of this thesis was asking the seemingly simple question as to how crosstalk occurs in a
stereoscopic display. This subsequently led onto the next question: What are the relative
contributions of the different crosstalk mechanisms towards the total crosstalk present in a
stereoscopic display.
In order to answer these questions, it was necessary to design an analysis technique which examined
the fundamental light output operation of a display, and considered how this interacts with the
selection device (e.g. 3D glasses) used to multiplex and de‐multiplex the different views to the two
human eyes. The analysis technique also needed to be designed within the technical limitations of
the measurement equipment which was available at the time, and tailored to the particular
requirements and characteristics of each display device and stereoscopic display technique.
The application of a particular stereoscopic display technique across different displays can produce
very different crosstalk performance results so it is important for the chosen analysis technique to be
able to capture the characteristics of each display that may affect crosstalk performance. Similarly,
the application of different stereoscopic display techniques to the one display can produce very
different crosstalk performance results, so ideally the display analysis technique will measure all
necessary display characteristics for multiple stereoscopic display methods.
Once the fundamental display characteristics are known, the performance attributes (of the display
and the glasses) can then be examined with a view to understanding how they interact, and how
crosstalk occurs. A mathematical model then needs to be developed and implemented to simulate
the presence of crosstalk in a particular stereoscopic display and start answering questions about the
relative contribution of different crosstalk mechanisms to the overall crosstalk present in a particular
stereoscopic display.
The basic design philosophy used for the project therefore led to the use of the following research
steps:
(a) Develop initial block diagram of crosstalk performance for a particular stereoscopic display,
(b) Measure the temporal, spatial, angular, and spectral performance attributes of the display
(as required),
(c) Measure the temporal, spatial, angular, and spectral performance of the selection device
(e.g. 3D glasses) (as required),
(d) Develop a mathematical Model which characterises occurrence of crosstalk for a particular
stereoscopic display,
17
(e) Implement the mathematical model in a computer program and use the program to
Simulate a selection of different scenarios,
(f) Validate the mathematical model against measurements of total crosstalk and/or human
perception testing of crosstalk performance, and finally
(g) Use the developed mathematical model to Extrapolate how crosstalk occurs when different
performance attributes are changed and therefore find cost‐effective solutions for reducing
crosstalk performance in a particular stereoscopic display.
I am calling this the measure/model/simulate/validate/extrapolate process.
Each of the steps above can be performed iteratively as needed to improve the accuracy of the
model.
Three main classes of test equipment have been used in this work to characterise the optical
performance characteristics of the displays and selection devices:
(a) a photodiode and oscilloscope to measure time‐domain performance,
(b) a spectroradiometer to measure the spectrum of the emitted light from the display (in each
of the three colour channels), and
(c) a spectrophotometer to measure the spectral transmission of the anaglyph glasses or
reflective spectrum of printed inks.
Spatial and angular performance is usually characterised by configuring the above equipment to
collect measurements at different spatial locations and/or alignment angles. In the case of spatio‐
temporal performance, it is important to correctly measure the phase of the measured signal (in
relation to the input video signal), because in some instances the shape of the waveform remains the
same, but the phase changes with changes in spatial location – e.g. with CRTs and LCDs.83,85,73
In order to characterise the time‐domain performance of the LC cells in LCS glasses, LEDs of three
different colours were usually used to provide a constant output light source and a photodiode was
used to measure the light transmission through the LC shutter73 (per Section 2.1.3 of Paper 9).
Specific examples of the equipment used during this study are as follows:
(a) Photodiode: IPL10530DAL Integrated Photodiode Amplifier.86,73,76,83,87,85
(b) Spectroradiometers: Ocean Optics S1000, 73 Zeiss Monolithic Miniature‐Spectrometer,74 and
Ocean Optics USB2000.88, 89, 90,91
(c) Spectrophotometers: Hitachi model 150‐20 Spectrophotometer,74 PG Instruments T90+
UV/VIS spectrophotometer,89 and Perkin Elmer Lambda 35 spectrophotometer.88,90, 91
18
In order to measure total crosstalk levels directly, it is necessary to use a photosensor that has a
weighted spectral sensitivity that is equivalent to the sensitivity of the human eye – or in the case of
a spectroradiometer, able to be calibrated to human eye sensitivity in post‐processing. I did
experiment with using a USB2000 spectroradiometer to measure total crosstalk, however that work
has not been published at this stage.
Crosstalk measurement charts were also experimented with as a technique for end‐users to easily
determine crosstalk levels (as outlined in Paper 15),77 however these results do not have high‐levels
of measurement accuracy (due to the difficulty of characterising and fixing display gamma, contrast,
brightness, and black‐level settings) and hence were not used directly in the crosstalk
characterisation stages of this work.
Other authors have used a wide range of other equipment to measure crosstalk levels and display
performance – as outlined in Section 5 of Paper 1.
This thesis examines the crosstalk performance and crosstalk mechanisms of seven specific
categories of stereoscopic displays and the reader is referred to specific sections of the included
papers for further specific information of the methodology used to study each of those displays:
(a) time‐sequential 3D on CRT displays – Section 2 of Paper 9
(b) time‐sequential 3D on LCD monitors – Section 2 of Paper 5
(c) time‐sequential 3D on DLP projectors – Section 2 of Paper 13
(d) time‐sequential 3D on plasma displays – Section 2 of Paper 6
(e) time‐sequential 3D on LCD TVs – Section 4 of Paper 7
(f) anaglyph 3D on emissive displays (CRTs, LCDs, DLPs, PDPs) – Section 2 of Paper 10, Section 2
of Paper 2, Section 3 of Paper 3, and Section 2 of Paper 8
(g) anaglyph 3D in printed images – Section 4 of Paper 4
19
4. Overview and Results
As stated in the introduction, this thesis describes the examination of the factors that contribute to
and determine the amount of crosstalk that occurs in a broad selection of stereoscopic display
technologies.
The particular types of stereoscopic display technologies about which the work of this thesis
provides contributions to the body of knowledge are itemised below, along with a corresponding list
of the papers and section numbers which contain the published record of the results of this work:
(a) Time‐sequential 3D using liquid‐crystal shutter glasses – Section 4.1 of Paper 1; Paper 9 and
Paper 17
(b) time‐sequential 3D on CRT displays – Section 4.1.1 of Paper 1; and Paper 9
(c) time‐sequential 3D on plasma displays – Section 4.1.2 of Paper 1; and Paper 6
(d) time‐sequential 3D on LCDs – Section 4.1.3 of Paper 1; Paper 5 and Paper 7
(e) time‐sequential 3D on DLP projectors – Section 4.1.4 of Paper 1; and Paper 13
(f) anaglyph 3D on emissive displays (CRTs, LCDs, DLPs, PDPs) – Section 4.5 of Paper 1; Paper 2;
Paper 3; Paper 8 and Paper 10
(g) anaglyph 3D in printed images – Paper 4
The following subsections of this chapter expand the discussion on crosstalk mechanisms generally,
and then specifically for all of the stereoscopic display technologies investigated in this study. For
each of the stereoscopic display technologies considered the results of the
measure/model/simulate/validate/extrapolate process are explained and explored where
applicable.
4.1 Crosstalk Mechanisms
Underpinning the analysis of crosstalk, it is an important step to determine the mechanisms that
cause crosstalk in each stereoscopic display technology. Figure 1 below shows the flow of images in
a stereoscopic system ‐ from capture, through storage, editing, transmission and display, to
perception by the observer. The figure is presented for a two‐view system (a stereoscopic display
system that presents two views – one for each eye), however the same theory could be applied to a
multi‐view system (a multi‐view stereoscopic display system presents multiple‐views and depending
on where the observer is located, ideally only one of the views will be seen by the left eye and
another of the views will be seen by the right eye. Multi‐view systems are usually autostereoscopic).
Although crosstalk can occur in all of the stages shown in Figure 1 (except perception), this thesis
primarily investigates crosstalk in the display and image separation stages, due to the fact that
crosstalk can generally be easily avoided in the capture, storage, editing and transmission stages (per
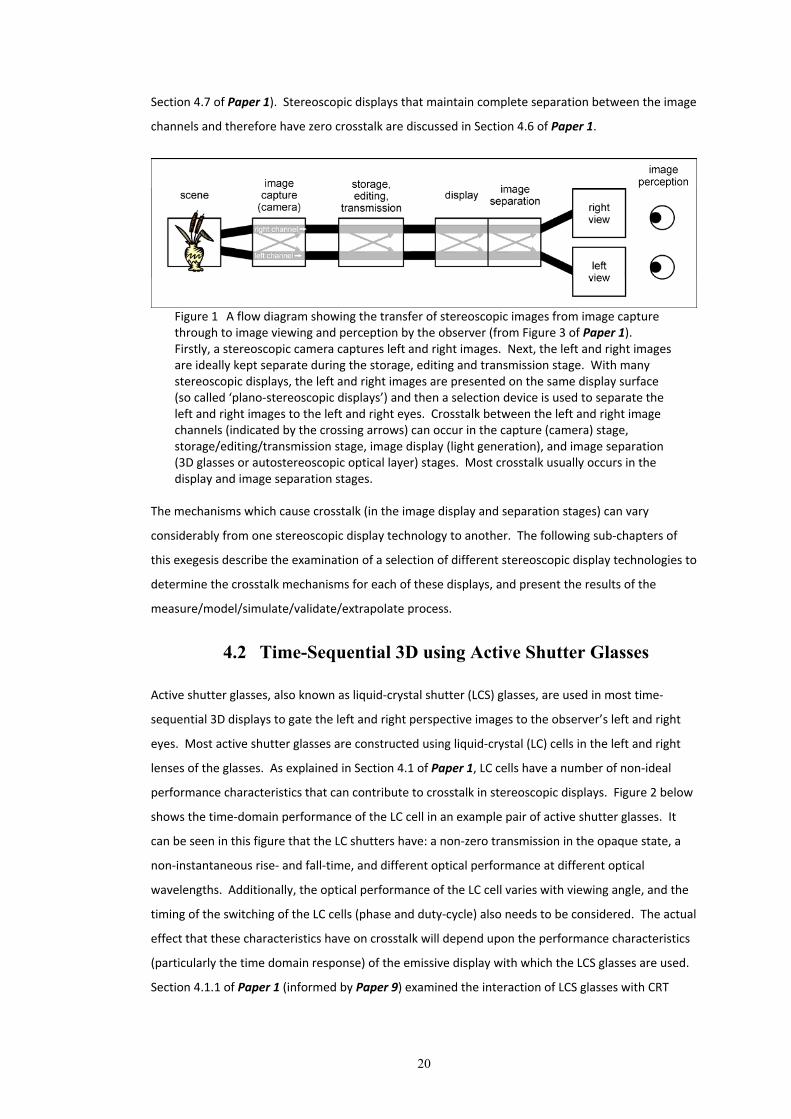
20
Section 4.7 of Paper 1). Stereoscopic displays that maintain complete separation between the image
channels and therefore have zero crosstalk are discussed in Section 4.6 of Paper 1.
Figure 1 A flow diagram showing the transfer of stereoscopic images from image capture through to image viewing and perception by the observer (from Figure 3 of Paper 1). Firstly, a stereoscopic camera captures left and right images. Next, the left and right images are ideally kept separate during the storage, editing and transmission stage. With many stereoscopic displays, the left and right images are presented on the same display surface (so called ‘plano‐stereoscopic displays’) and then a selection device is used to separate the left and right images to the left and right eyes. Crosstalk between the left and right image channels (indicated by the crossing arrows) can occur in the capture (camera) stage, storage/editing/transmission stage, image display (light generation), and image separation (3D glasses or autostereoscopic optical layer) stages. Most crosstalk usually occurs in the display and image separation stages.
The mechanisms which cause crosstalk (in the image display and separation stages) can vary
considerably from one stereoscopic display technology to another. The following sub‐chapters of
this exegesis describe the examination of a selection of different stereoscopic display technologies to
determine the crosstalk mechanisms for each of these displays, and present the results of the
measure/model/simulate/validate/extrapolate process.
4.2 Time-Sequential 3D using Active Shutter Glasses
Active shutter glasses, also known as liquid‐crystal shutter (LCS) glasses, are used in most time‐
sequential 3D displays to gate the left and right perspective images to the observer’s left and right
eyes. Most active shutter glasses are constructed using liquid‐crystal (LC) cells in the left and right
lenses of the glasses. As explained in Section 4.1 of Paper 1, LC cells have a number of non‐ideal
performance characteristics that can contribute to crosstalk in stereoscopic displays. Figure 2 below
shows the time‐domain performance of the LC cell in an example pair of active shutter glasses. It
can be seen in this figure that the LC shutters have: a non‐zero transmission in the opaque state, a
non‐instantaneous rise‐ and fall‐time, and different optical performance at different optical
wavelengths. Additionally, the optical performance of the LC cell varies with viewing angle, and the
timing of the switching of the LC cells (phase and duty‐cycle) also needs to be considered. The actual
effect that these characteristics have on crosstalk will depend upon the performance characteristics
(particularly the time domain response) of the emissive display with which the LCS glasses are used.
Section 4.1.1 of Paper 1 (informed by Paper 9) examined the interaction of LCS glasses with CRT

21
displays, and other papers in this thesis (and described in subsections of this exegesis below) report
on the interaction of LCS glasses with other emissive displays.
Figure 2 The optical transmission versus time response of an example pair of active shutter glasses at red, green and blue wavelengths. (from Figure 4 of Paper 1 and explained further in Section 2.1.3 of Paper 9).
The phase and duty cycle of a pair of LCS glasses is determined by the driving circuitry of the glasses
and system timing determined by the display system electronics. Paper 17 examined the protocols
which are used to control the timing of wireless active shutter glasses. Infra‐red (IR), visible optical
band, and radio‐frequency (RF) are commonly used techniques to signal the correct timing to the
active shutter glasses. Although it should be a fairly easy process to ensure that the active shutter
glasses switch at the appropriate time, the results of Paper 17 showed that there were a number of
circumstances under which crosstalk could occur due to incorrect timing – specifically phase
differences between different protocols (Section 4.3 of Paper 17) and inability of some protocols to
operate with anything but a 50% duty cycle (Section 4.1 of Paper 17).
Paper 1 is included in Chapter 9 of this exegesis as a core manuscript of the thesis.
Paper 9 and Paper 17 are included in Appendix 1 as additional publications relevant to the thesis.
The next four sub‐chapters of this exegesis now examine the performance of active shutter glasses
with four different emissive display technologies.

22
4.2.1 Time-Sequential 3D on CRT Displays
Section 4.1.1 of Paper 1 provides a description of the sources of crosstalk in the time‐sequential 3D
method on CRT displays and lists them as:
the performance of the liquid crystal shutters in the active shutter glasses (as discussed in detail
in Chapter 4.2 of this exegesis),
the amount of phosphor persistence,
the timing of the shuttering of the glasses with respect to the displayed images, and
the x‐y coordinates on the screen.
Expanding on the information presented in Section 4.1.1 of Paper 1, Paper 9 “Characterising Sources
of Ghosting in Time‐Sequential Stereoscopic Video Displays” went into further detail on this topic by:
describing a model for crosstalk in time‐sequential 3D CRT displays (Section 2.2 of Paper 9),
implementing the model in a computer simulation (Section 3.1 of Paper 9),
conducting measurements to populate the simulation (Section 2.1 of Paper 9), and
performing a rudimentary validation of the simulation (Section 3.2 of Paper 9).
The process by which crosstalk occurs in time‐sequential 3D on CRT displays is illustrated in Figure 3.
The top part of this figure illustrates the light output when the phosphor is energised by the scanned
electron beam and the time‐domain transmission response of the LC shutter – the phosphor is
energized during the first frame (L‐eye) period, when the shutter is closed, and exponentially decays.
The bottom part of the figure illustrates the multiplication of phosphor response by the shutter
response to give the amount of leakage. The area under the solid orange curve from end of VBI1
(vertical blanking interval) to the start of VBI2 represents crosstalk due to the incomplete extinction
of the shutter, and the area under the solid red curve from start of VBI2 onwards represents
crosstalk due to long phosphor persistence.

23
Figure 3 Illustration of crosstalk on a CRT (with exaggerated phosphor response for illustrative purposes). Top: phosphor response and shutter response. Bottom: multiplication of phosphor response by the shutter response to give the amount of leakage. (from Figure 8 of Paper 1 and explained further in Section 2.2 of Paper 9).
There is considerable variability in the amount of crosstalk present in this category of stereoscopic
displays due to different factors: optical quality of different shutter glasses, the spatial position on
the display surface, and the timing of the shutter glasses. There is very little variation in phosphor
persistence between CRT displays – as a result it is presumed that most commercially released CRT
displays use the same display phosphor formulation. This work also found that crosstalk at different
positions on the screen can be dominated by different crosstalk mechanisms – crosstalk at the top of
the display is usually dominated by shutter leakage whereas crosstalk at the bottom of the display is
usually dominated by phosphor decay – as illustrated in Figure 8 of Paper 9 and explained in Section
3.1 of Paper 9.
Paper 9 appears to be the first publication to illustrate the power of developing a simulation of
crosstalk in that it allows the various components which contribute to the overall crosstalk to be
considered and analysed independently. This is an important step because the relative contributors
to overall crosstalk cannot be determined individually by solely measuring the overall crosstalk.
Paper 1 is included in Chapter 9 of this exegesis as a core manuscript of the thesis.
Paper 9 is included in Appendix 1 of this thesis as an additional publication relevant to the thesis.

24
4.2.2 Time-Sequential 3D on Plasma Displays
This class of stereoscopic display presents stereoscopic images on a plasma display panel while the
observer wears active shutter glasses.
As described in Section 4.1.2 of Paper 1, the sources of crosstalk when using the time‐sequential 3D
method on plasma displays are as follows:
the performance of the liquid crystal shutters in the active shutter glasses (as discussed in detail
in Section 4.2 of this exegesis),
the amount of phosphor persistence,
the timing of the shuttering of the glasses with respect to the displayed images, and
the particular grey level value of a displayed pixel and therefore which sub‐frames are fired.
Expanding on the information presented in Paper 1, Paper 6 “The compatibility of consumer plasma
displays with time‐sequential stereoscopic 3D visualization”,87 a refereed conference paper by me,
goes into further detail on this topic by:
examining the detailed operation of plasma displays to determine the factors which determine
their compatibility (or incompatibility) with time‐sequential 3D display (Section 1 of Paper 6),
measuring the time‐domain performance of 14 consumer released plasma displays to determine
phosphor decay, sub‐frame sequencing, time delay, and display synchronisation of plasma
displays (Section 3 of Paper 6),
describing a method for modelling crosstalk of time‐sequential 3D on plasma displays and
calculating crosstalk values for the tested displays (Section 3.4 of Paper 6), and
recommending ways of reducing crosstalk and improving compatibility of plasma displays with
the time‐sequential 3D technique (Section 4 of Paper 6).
The research for Paper 6 was conducted just before the release of 3D‐Ready time‐sequential 3D
plasma displays into the consumer market. At this time the red and green phosphors of the tested
displays typically had much longer time constants (longer phosphor decay) than the blue phosphor
(as shown in Figure 4 of Paper 6). The presence of a long phosphor decay means that the image
from one frame will still be present in the time period for the next frame which leads to leakage
between stereoscopic image channels and therefore increased levels of crosstalk. Figure 4 below
illustrates the occurrence of crosstalk with the time‐sequential 3D method on plasma displays. In
this particular example (for the red channel) the contribution to total crosstalk due to shutter
leakage is roughly equivalent to the contribution due to the phosphor decay. Other plasma display
and LCS glasses combinations will produce different crosstalk results.
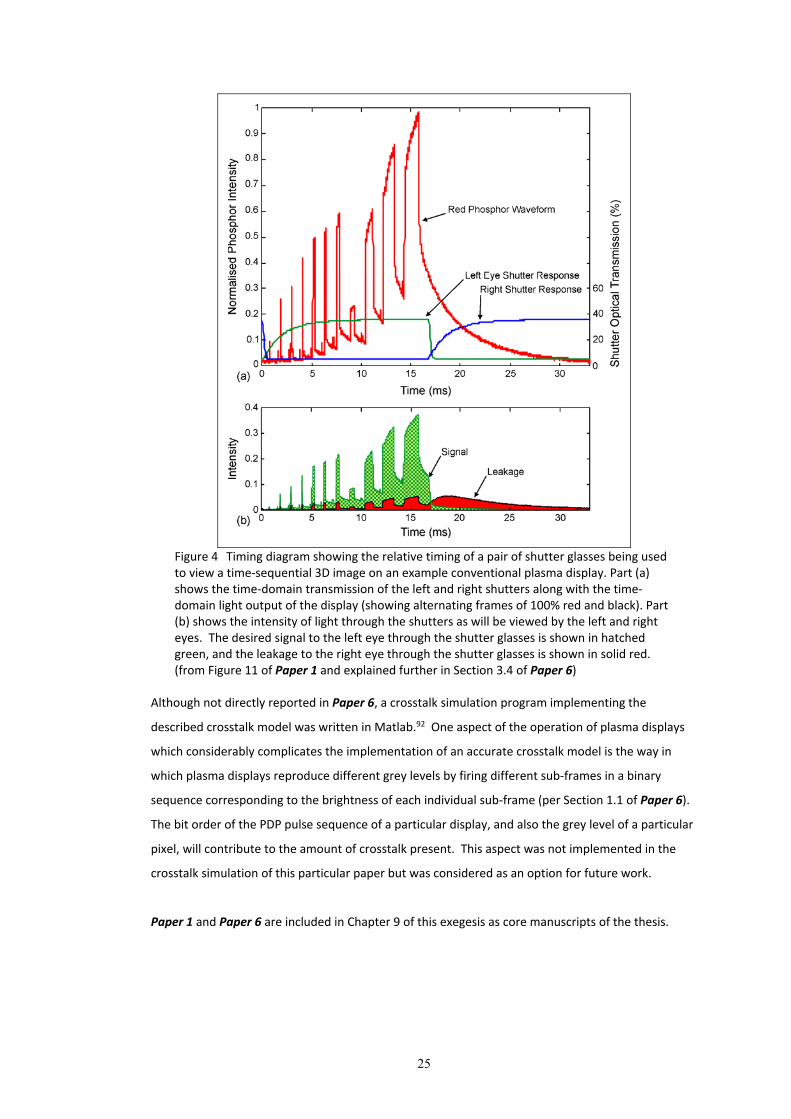
25
Figure 4 Timing diagram showing the relative timing of a pair of shutter glasses being used to view a time‐sequential 3D image on an example conventional plasma display. Part (a) shows the time‐domain transmission of the left and right shutters along with the time‐domain light output of the display (showing alternating frames of 100% red and black). Part (b) shows the intensity of light through the shutters as will be viewed by the left and right eyes. The desired signal to the left eye through the shutter glasses is shown in hatched green, and the leakage to the right eye through the shutter glasses is shown in solid red. (from Figure 11 of Paper 1 and explained further in Section 3.4 of Paper 6)
Although not directly reported in Paper 6, a crosstalk simulation program implementing the
described crosstalk model was written in Matlab.92 One aspect of the operation of plasma displays
which considerably complicates the implementation of an accurate crosstalk model is the way in
which plasma displays reproduce different grey levels by firing different sub‐frames in a binary
sequence corresponding to the brightness of each individual sub‐frame (per Section 1.1 of Paper 6).
The bit order of the PDP pulse sequence of a particular display, and also the grey level of a particular
pixel, will contribute to the amount of crosstalk present. This aspect was not implemented in the
crosstalk simulation of this particular paper but was considered as an option for future work.
Paper 1 and Paper 6 are included in Chapter 9 of this exegesis as core manuscripts of the thesis.
26
4.2.3 Time Sequential 3D on LCDs
This class of stereoscopic display present stereoscopic images on an LCD panel while the observer
wears active shutter glasses.
As described in Section 4.1.3 of Paper 1, there are a number of unique performance characteristics
of LCDs that determine compatibility and crosstalk levels when using the time‐sequential 3D
technique on LCDs. Of particular note is that LCDs use a scanned update method to update pixels
from one frame to the next – new pixels are updated row by row from the top to the bottom of the
display. Additionally, most LCDs are a hold‐type display – the image is held and light is output
continuously for the entire frame period. This is in contrast to CRT and plasma displays which emit
pulses of light with an exponential decay of light between pulses. In CRT or plasma displays, the so‐
called ‘blanking interval’ between frames provides an interval of low‐light output when the LC
shutters can change from one state to another with minimised influence, however most
conventional LCDs do not have a blanking period hence the switching time of the LC shutters is an
important consideration in crosstalk performance.
At the time of embarking on this part of the research, commercial LCDs were incapable of being used
for high‐quality time‐sequential stereoscopic display because considerable crosstalk was present.
Due to the considerable difference between the operation of LCDs and CRTs, or even plasma
displays, the conventional wisdom about the interaction of LC shutters with CRTs did not directly
apply to LCDs. A re‐examination of the operation of LCDs in relation to the time‐sequential
stereoscopic display method was therefore necessary.
Slow pixel response (the time that it takes for a pixel to change from one grey level to another) had
historically been considered to be the main reason that LCD monitors could not be used for time‐
sequential stereoscopic 3D viewing. Although pixel response rate is important, Paper 5 revealed that
the image update method of the panel is also an important consideration. Even if the pixel response
rate is improved, the scan‐like image update method of most conventional LCDs would still cause
problems for the frame‐sequential 3D method. This was an important realisation and informed the
next step which was to devise a technique of presenting low crosstalk stereoscopic images on LCDs.
27
Based upon the performance analysis of LCDs, Section 4.1.3 of Paper 1 describes the sources of
crosstalk in time‐sequential 3D on LCDs as:
the performance of the liquid crystal shutters in the active shutter glasses (as discussed in
detail in Section 4.2 of this exegesis),
the timing of the scanned image update method of the LCD (including the effects of Black
Frame Insertion (BFI), increased frame rate, and backlight modulation discussed below),
the pixel response rate of the LCD,
the timing of the shuttering of the glasses with respect to the displayed images,
the particular grey level value of a displayed pixel, and
the x‐y position on the screen.
Paper 5 and Paper 7 provide further detail on the original research presented in Journal Paper 1
(listed above).
Paper 5, “Compatibility of LCD Monitors with Frame‐Sequential Stereoscopic 3D Visualisation”,83 an
invited refereed conference paper, was published in 2006 before the commercial release of time‐
sequential 3D compatible LCDs in 2009. 45 On the basis of this chronology, Paper 5 provided the
following insights:
It examined and outlined the key performance attributes which determine the compatibility
(or incompatibility) of LCDs with the time‐sequential 3D method (Section 3 of Paper 5),
It presented a spatio‐temporal‐domain graph of the time‐sequential 3D method on LCDs
that was a key to understanding the limitations of using the time‐sequential 3D technique
on LCDs (Section 3.4 of Paper 5),
It identified the scanned image update method and the LCD pixel response rate (in
combination with the hold‐type display characteristic) as the primary factor causing high
crosstalk levels with the time‐sequential 3D display method on conventional LCDs (Sections
3.4 and 4 of Paper 5), and
It presented two techniques to allow low‐crosstalk stereoscopic images to be presented on
LCDs using the time‐sequential 3D display method (Section 4 of Paper 5).
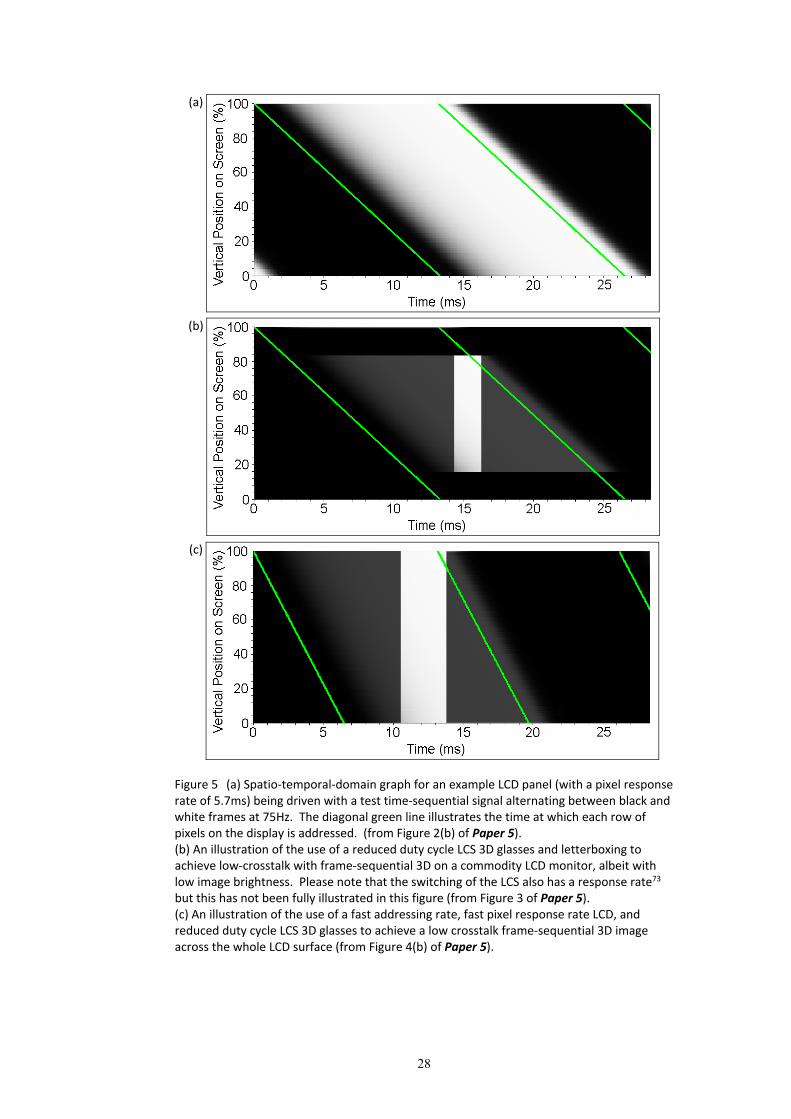
28
Figure 5 (a) Spatio‐temporal‐domain graph for an example LCD panel (with a pixel response rate of 5.7ms) being driven with a test time‐sequential signal alternating between black and white frames at 75Hz. The diagonal green line illustrates the time at which each row of pixels on the display is addressed. (from Figure 2(b) of Paper 5). (b) An illustration of the use of a reduced duty cycle LCS 3D glasses and letterboxing to achieve low‐crosstalk with frame‐sequential 3D on a commodity LCD monitor, albeit with low image brightness. Please note that the switching of the LCS also has a response rate73 but this has not been fully illustrated in this figure (from Figure 3 of Paper 5). (c) An illustration of the use of a fast addressing rate, fast pixel response rate LCD, and reduced duty cycle LCS 3D glasses to achieve a low crosstalk frame‐sequential 3D image across the whole LCD surface (from Figure 4(b) of Paper 5).
(a)
(b)
(c)

29
The development of a spatio‐temporal‐domain graph of the performance of the time‐sequential 3D
technique on LCDs was a critical step to understanding the limitations and developing solutions for
reducing crosstalk with this 3D display method. Figure 5 shows a series of spatio‐temporal graphs
for the time‐sequential 3D technique on LCDs. Figure 5(a) illustrates the scan‐like image update of a
conventional LCD monitor. If standard 50% duty cycle LCS 3D glasses (opaque for 50% of the time,
and transmissive for 50% of the time) are used with such a display, considerable crosstalk will be
present across most of the display surface because there is no one time when one image is visible
across the entire display surface. Figure 5(b) illustrates the first technique developed to reduce the
amount of crosstalk on screen by (i) reducing the duty cycle of the open time of the LCS 3D glasses,
(ii) letterboxing the displayed image, and (iii) using an LCD with a fast pixel response rate. Although
crosstalk is reduced using this technique, the image brightness is considerably reduced and the
requirement to blacken the top and bottom sections of the display is inconvenient. Figure 5(c)
illustrates a more robust (second) technique to reduce crosstalk by (i) using a fast addressing rate,
and two other techniques listed above (ii) using a reduced duty cycle of the LCS 3D glasses, and (iii)
using a fast pixel response rate LCD. These techniques were presented in Paper 5 published in 2006.
Displays which used the second technique, but developed independently of me, were first released
to market in 2009.45
Paper 7, “The compatibility of LCD TVs with time‐sequential stereoscopic 3D visualization”,85 a
refereed conference paper, was published in 2009, just as the first 3D‐Ready time‐sequential 3D
compatible LCD monitors were being released.45 By way of background, the first LCD TVs (as
opposed to LCD monitors) to use the time‐sequential 3D technique were released into the consumer
market in 2010.41 On the basis of this chronology, Paper 7 provided the following insights:
It examined and identified the key performance attributes of three new LCD technologies:
black frame insertion (BFI) (Sections 2.1 and 5.1 of Paper 7), 120Hz refresh (Sections 2.2 and
5.2 of Paper 7), and modulated backlight (Sections 2.3 and 5.3 of Paper 7) and outlined how
these new LCD technologies affected compatibility with the time‐sequential 3D display
method and offered opportunities to reduce crosstalk (Section 6 of Paper 7),
It reported that the new LCD technologies of BFI and 120Hz display (as implemented in the
displays released at that time) when used in isolation were not of a sufficient technical
change to allow high‐quality (low crosstalk) stereoscopic display using the time‐sequential
3D display method. For example, Figure 6 of Paper 7 indicates that BFI reduces the
crosstalk minimum and broadens the spatial range of the display which will have lower
crosstalk, however the top and bottom of the display would still have excessive crosstalk.
Paper 1, Paper 5 and Paper 7 are included in Chapter 9 of this exegesis as core manuscripts of the
thesis.
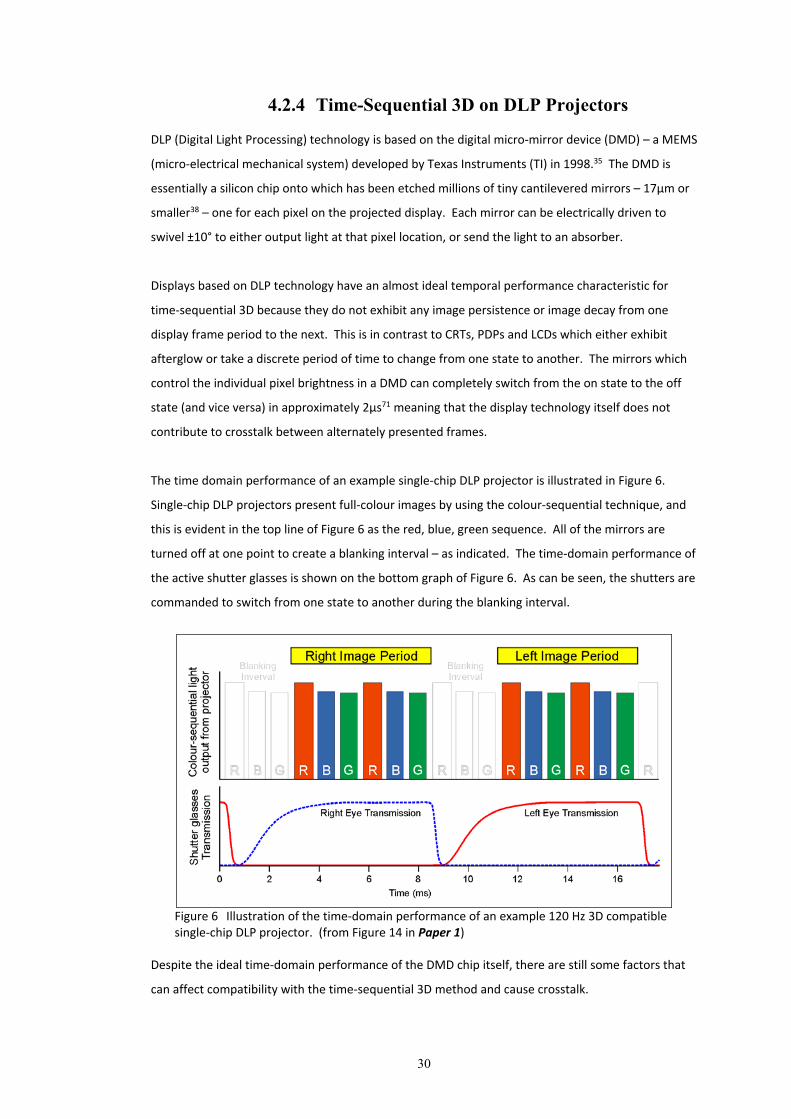
30
4.2.4 Time-Sequential 3D on DLP Projectors DLP (Digital Light Processing) technology is based on the digital micro‐mirror device (DMD) – a MEMS
(micro‐electrical mechanical system) developed by Texas Instruments (TI) in 1998.35 The DMD is
essentially a silicon chip onto which has been etched millions of tiny cantilevered mirrors – 17μm or
smaller38 – one for each pixel on the projected display. Each mirror can be electrically driven to
swivel ±10° to either output light at that pixel location, or send the light to an absorber.
Displays based on DLP technology have an almost ideal temporal performance characteristic for
time‐sequential 3D because they do not exhibit any image persistence or image decay from one
display frame period to the next. This is in contrast to CRTs, PDPs and LCDs which either exhibit
afterglow or take a discrete period of time to change from one state to another. The mirrors which
control the individual pixel brightness in a DMD can completely switch from the on state to the off
state (and vice versa) in approximately 2μs71 meaning that the display technology itself does not
contribute to crosstalk between alternately presented frames.
The time domain performance of an example single‐chip DLP projector is illustrated in Figure 6.
Single‐chip DLP projectors present full‐colour images by using the colour‐sequential technique, and
this is evident in the top line of Figure 6 as the red, blue, green sequence. All of the mirrors are
turned off at one point to create a blanking interval – as indicated. The time‐domain performance of
the active shutter glasses is shown on the bottom graph of Figure 6. As can be seen, the shutters are
commanded to switch from one state to another during the blanking interval.
Figure 6 Illustration of the time‐domain performance of an example 120 Hz 3D compatible single‐chip DLP projector. (from Figure 14 in Paper 1)
Despite the ideal time‐domain performance of the DMD chip itself, there are still some factors that
can affect compatibility with the time‐sequential 3D method and cause crosstalk.

31
Based upon the performance analysis of DLP displays, Section 4.1.4 of Paper 1 describes the sources
of crosstalk in time‐sequential 3D on DLP displays as:
the performance of the liquid crystal shutters in the active shutter glasses (as discussed in
detail in Section 4.2 of this exegesis),
the timing of the shuttering of the glasses with respect to the displayed images, and
the duration of the blanking interval.
Paper 13 provides further detail on the findings presented in Paper 1 (listed above). The research
work for Paper 13 was conducted in 2006, roughly one year after the first 3D compatible single‐chip
DLP projector was commercially released for the business market (by DepthQ),40 but three years
before the first consumer‐grade 3D compatible single‐chip DLP projector was released to market (by
Viewsonic).43,44 Section 3 of Paper 13 reported on the measurement of 45 commodity (non‐3D‐
certified) single‐chip DLP projectors for 3D compatibility. There are a range of additional factors
which affect 3D compatibility and levels of crosstalk when the time‐sequential 3D method is used
with commodity (non‐3D‐certified) DLP projectors:
Synchrony of the output display with the input video signal – some projectors do not
synchronise the display output sequence with the video input sequence which can lead to
an inability for LCS 3D glasses to correctly isolate left and right images and hence introduce
severe crosstalk (see Table 2 in Section 3 of Paper 13),
De‐interlacing performance (particularly for field‐sequential sources) – some projectors use
a de‐interlacing algorithm which mixes odd and even fields, which in turn causes severe
crosstalk (see Table 2 in Section 3 of Paper 13),
Time‐offset (phase) between the input video signal and the displayed image sequence –
invariably there is a one‐frame delay between the input video sequence and the image
display output however with some projectors there is a notable additional time offset of up
to 1ms which can introduce crosstalk (see Table 3 in Section 3 of Paper 13), and
colour‐wheel speed and sequencing – some combinations of colour wheel speed (the
number of colour sequence cycles per frame) and the sequence of filter segments on the
colour wheel (such as Red/Green/Blue, Red/Green/Blue/White, or
Red/Green/Blue/Yellow/Cyan) can cause problems such as colour bias or blanking interval
duration when switching into a high‐frequency 3D mode (see Figure 6 above).
3D‐certified DLP projectors have largely solved these problems now, however there are still
occasionally some irregularities with compatibility for some models. For example some projectors
frame convert a 50Hz input signal to 60Hz for display which can cause cadence and motion
reproduction issues (but generally does not affect crosstalk performance), and some projectors have
a time offset between the infra‐red token and the displayed image which can cause an incorrect
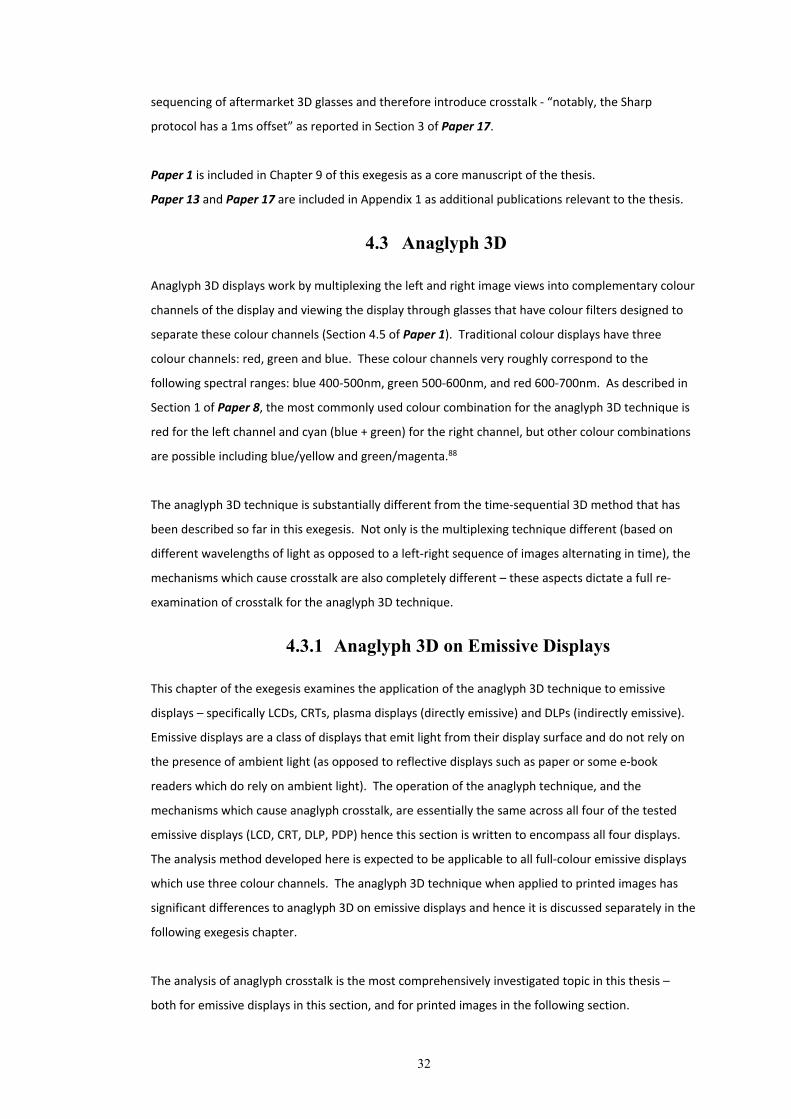
32
sequencing of aftermarket 3D glasses and therefore introduce crosstalk ‐ “notably, the Sharp
protocol has a 1ms offset” as reported in Section 3 of Paper 17.
Paper 1 is included in Chapter 9 of this exegesis as a core manuscript of the thesis.
Paper 13 and Paper 17 are included in Appendix 1 as additional publications relevant to the thesis.
4.3 Anaglyph 3D
Anaglyph 3D displays work by multiplexing the left and right image views into complementary colour
channels of the display and viewing the display through glasses that have colour filters designed to
separate these colour channels (Section 4.5 of Paper 1). Traditional colour displays have three
colour channels: red, green and blue. These colour channels very roughly correspond to the
following spectral ranges: blue 400‐500nm, green 500‐600nm, and red 600‐700nm. As described in
Section 1 of Paper 8, the most commonly used colour combination for the anaglyph 3D technique is
red for the left channel and cyan (blue + green) for the right channel, but other colour combinations
are possible including blue/yellow and green/magenta.88
The anaglyph 3D technique is substantially different from the time‐sequential 3D method that has
been described so far in this exegesis. Not only is the multiplexing technique different (based on
different wavelengths of light as opposed to a left‐right sequence of images alternating in time), the
mechanisms which cause crosstalk are also completely different – these aspects dictate a full re‐
examination of crosstalk for the anaglyph 3D technique.
4.3.1 Anaglyph 3D on Emissive Displays
This chapter of the exegesis examines the application of the anaglyph 3D technique to emissive
displays – specifically LCDs, CRTs, plasma displays (directly emissive) and DLPs (indirectly emissive).
Emissive displays are a class of displays that emit light from their display surface and do not rely on
the presence of ambient light (as opposed to reflective displays such as paper or some e‐book
readers which do rely on ambient light). The operation of the anaglyph technique, and the
mechanisms which cause anaglyph crosstalk, are essentially the same across all four of the tested
emissive displays (LCD, CRT, DLP, PDP) hence this section is written to encompass all four displays.
The analysis method developed here is expected to be applicable to all full‐colour emissive displays
which use three colour channels. The anaglyph 3D technique when applied to printed images has
significant differences to anaglyph 3D on emissive displays and hence it is discussed separately in the
following exegesis chapter.
The analysis of anaglyph crosstalk is the most comprehensively investigated topic in this thesis –
both for emissive displays in this section, and for printed images in the following section.

33
Based upon the performance analysis of the anaglyph 3D technique on emissive displays, Section 4.5
of Paper 1 describes the sources of crosstalk as:
The spectral quality of the display,
The spectral quality of the anaglyph glasses and how well they match the spectral output of
the display, and
The properties of the anaglyph image generation algorithm.
These results are based upon a series of work presented in the following papers: Paper 10 (2004),
Journal Paper 2 (2007), Paper 8 (2010), and Journal Paper 3 (2012). Paper 10, a non‐refereed
conference paper, reported on some early work which measured the spectra of a selection of
displays (CRT, LCD, DLP), developed an initial crosstalk model and simulation, and conducted a brief
validation experiment. This paper demonstrates an early attempt to implement the crosstalk
measure/model/simulate/validate/extrapolate process as described in Section 3 of this exegesis.
Most of Paper 10 concentrated on the ‘measure’ phase of the five phase process, and described
some initial work on modelling, validation and simulation of anaglyph crosstalk.
The process of anaglyph 3D crosstalk in emissive displays is illustrated in Figure 7 below ‐ Paper 10
was the first paper to set this out. Light from the three colour channels of the display have a certain
spectral distribution (a) which passes through the colour filters of the anaglyph glasses which have a
known spectral transmission (b). The spectral sensitivity of the human visual system affects how the
different spectral frequencies are perceived (c). A simulation (d), based upon the anaglyph crosstalk
model, can then be used to predict the amount of crosstalk as illustrated in (e) and (f).
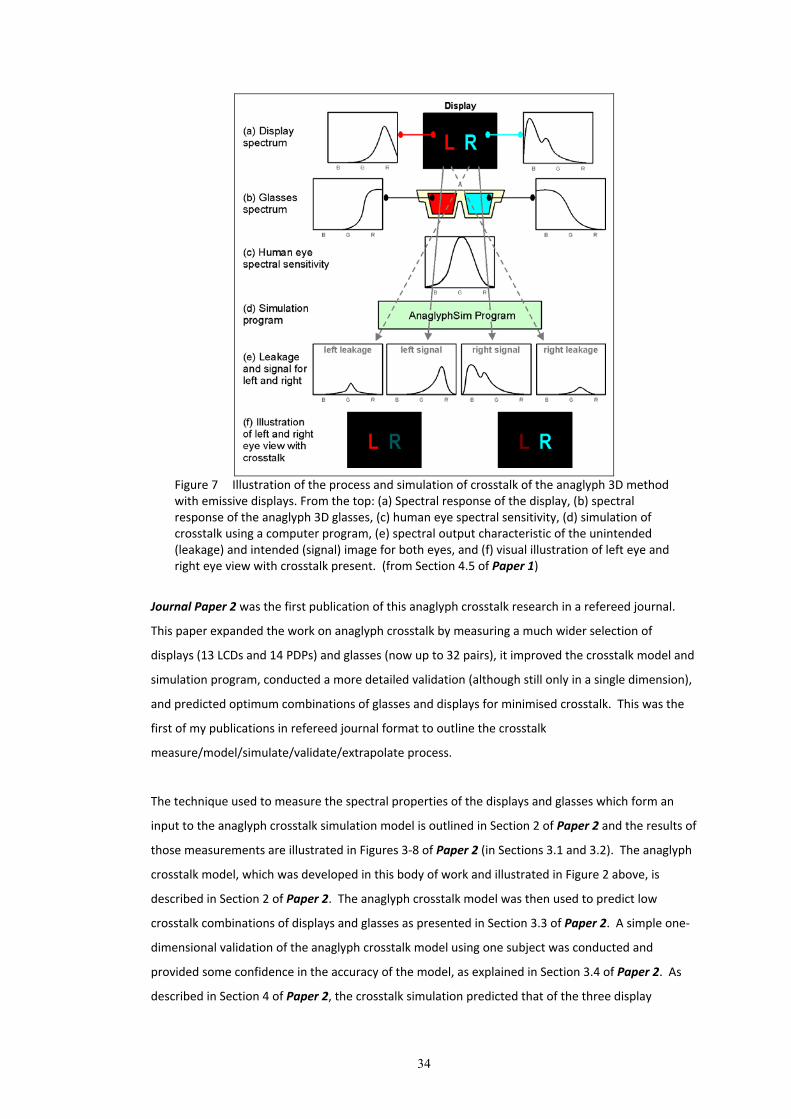
34
Figure 7 Illustration of the process and simulation of crosstalk of the anaglyph 3D method with emissive displays. From the top: (a) Spectral response of the display, (b) spectral response of the anaglyph 3D glasses, (c) human eye spectral sensitivity, (d) simulation of crosstalk using a computer program, (e) spectral output characteristic of the unintended (leakage) and intended (signal) image for both eyes, and (f) visual illustration of left eye and right eye view with crosstalk present. (from Section 4.5 of Paper 1)
Journal Paper 2 was the first publication of this anaglyph crosstalk research in a refereed journal.
This paper expanded the work on anaglyph crosstalk by measuring a much wider selection of
displays (13 LCDs and 14 PDPs) and glasses (now up to 32 pairs), it improved the crosstalk model and
simulation program, conducted a more detailed validation (although still only in a single dimension),
and predicted optimum combinations of glasses and displays for minimised crosstalk. This was the
first of my publications in refereed journal format to outline the crosstalk
measure/model/simulate/validate/extrapolate process.
The technique used to measure the spectral properties of the displays and glasses which form an
input to the anaglyph crosstalk simulation model is outlined in Section 2 of Paper 2 and the results of
those measurements are illustrated in Figures 3‐8 of Paper 2 (in Sections 3.1 and 3.2). The anaglyph
crosstalk model, which was developed in this body of work and illustrated in Figure 2 above, is
described in Section 2 of Paper 2. The anaglyph crosstalk model was then used to predict low
crosstalk combinations of displays and glasses as presented in Section 3.3 of Paper 2. A simple one‐
dimensional validation of the anaglyph crosstalk model using one subject was conducted and
provided some confidence in the accuracy of the model, as explained in Section 3.4 of Paper 2. As
described in Section 4 of Paper 2, the crosstalk simulation predicted that of the three display

35
technologies tested (LCDs, CRTs and PDPs), LCD monitors had the lowest average anaglyph crosstalk
factor (18.6), and also the global minimum anaglyph crosstalk factor (7.0). The plasma displays were
very similar with an average overall crosstalk factor of 18.6 but with a global minimum of only 8.1.
The CRT had much worse anaglyph crosstalk with an average overall crosstalk factor of 27.0 and
global minimum of 18.2. On average, the CRT had 45% more crosstalk than the LCD and plasma
displays. The simulation revealed that there was a huge difference between the best and worst
performing anaglyph glasses, but the best choice of anaglyph glasses depended upon which display
was being considered. Overall the paper revealed that anaglyph crosstalk could be reduced by the
selective choice of displays and glasses with optimum spectral characteristics, although crosstalk
levels were still relatively high with an overall minimum crosstalk factor of 7.0. The further ability for
crosstalk simulation to be able to predict (extrapolate) the performance of hypothetical
configurations was not discussed in this paper and was left for following papers.
The previous papers (Paper 10 and Paper 2) only considered red/cyan anaglyphs, whereas Paper 8, a
refereed conference paper, extended the anaglyph crosstalk model and simulation to consider and
compare other anaglyph colour combinations – specifically the blue/yellow and green/magenta
anaglyph 3D methods. The generalisation of the model to predict other anaglyph colour primary
combinations is described in Section 2 of Paper 8. The generalised model uses the same anaglyph
simulation process illustrated in Figure 7 above for the red/cyan case, but now the left and right
channels can be arbitrarily associated with different primary colour channels, to allow it to support
the blue/yellow and green/magenta combinations. The spectral performance of a representative
selection of glasses and displays is provided in Sections 3.1 and 3.2 of Paper 8 ‐ spectral data for
more than 70 pairs of anaglyph glasses had now been sampled (including four green/magenta and
six blue/yellow glasses). Section 3.4 of Paper 8 described a slightly more detailed, but still
rudimentary, validation process intended to compare the results of a human process of visually
ranking the glasses to a simulated ranking performed using the generalised crosstalk simulation. The
validation was conducted in one dimension (ranking a set of glasses when viewing a single display at
a time) and with up to two observers. The validation results were noisy and only provided a
moderate level of confidence in the ability of the model to accurately predict the comparison of
crosstalk between different colour combination anaglyphs. Sections 3.4 and 4.2 of Paper 8 went on
to outline the limitations and complications of trying to compare different colour combination
anaglyphs – particularly that the process of visually comparing anaglyph glasses of different colours
was found to be a very difficult task and is also possibly highly subjective. Section 3.3 of Paper 8
presented the results of the anaglyph crosstalk simulation across the three different anaglyph colour
combinations (red/cyan, blue/yellow and green/magenta), 16 different pairs of glasses, and 30
different displays (14 LCDs, 1 CRT and 15 PDPs). Section 4 of Paper 8 reported that the simulation
predicted the red/cyan glasses to have the lowest average crosstalk factor but cautioned that the
limitations of the study needed to be considered carefully when reviewing the simulation results.
36
This paper started to explore the real power of crosstalk simulation – using the crosstalk simulation
to explore the crosstalk performance of hypothetical cases – by simulating the performance of an
example set of dichroic filters for anaglyph purposes. The spectral performance of the dichroic
filters was obtained from datasheets and the simulation was conducted without having physical
samples of the dichroic filters in hand. The results of the simulation (presented in Sections 3.3 and
4.1 of Paper 8) predicted that the example red/cyan dichroic filter anaglyph glasses (with the
spectral performance specified in Figures 3‐8 of Paper 8) would offer a further two to four
percentage point reduction in anaglyph crosstalk compared to the other tested anaglyph glasses. A
good result in the simulation provides some motivation for the user to further investigate the option
of using dichroic filters for anaglyph glasses filters. Whether the high cost of a pair of dichroic filter
anaglyph glasses can be justified to achieve a two to four percentage point reduction in crosstalk is a
separate decision.
In contrast, the simulation predicted that the example blue/yellow dichroic filter pair would produce
considerably worse crosstalk than the existing blue/yellow anaglyph glasses and the difference was
so large that there would be high confidence in deciding that in this case the extra cost of dichroic
blue/yellow anaglyph glasses would not be justified. This example demonstrated that an accurate
crosstalk simulation can be very useful in deciding the appropriate research direction to undertake
when attempting to produce low crosstalk stereoscopic display solutions. The reason for the poor
performance of the dichroic blue/yellow glasses was because of the particular cut‐off wavelength of
these filters. If the cut‐off location occurred at a different wavelength, a much better result may
have been possible, but this was not specifically investigated. Further analysis and discussion of the
crosstalk results for different colour combination anaglyphs is provided in Section 4 of Paper 8 and is
not repeated here.
The most substantive work of all the four papers examining anaglyph crosstalk with emissive displays
is Journal Paper 3. Although this paper draws from the work reported in the previous three papers,
this paper extended the work to demonstrate the important role that crosstalk simulation can have
in guiding research to reduce crosstalk in stereoscopic display systems. The algorithm for anaglyph
crosstalk is expressed mathematically in Section 2 of Paper 3. The measurement of display and
glasses spectrums (presented in Sections 3.1, 3.2, 4.1 and 4.2 of Paper 3) followed essentially the
same process as reported in Paper 2 however more effort was expended to calibrate the
instruments and ensure the accuracy of the measurements. A new comprehensive validation
experiment was devised and conducted across five observers (presented in Sections 3.4, 4.4 and 4.5
of Paper 3). Each of the five observers conducted 40 separate crosstalk ranking tasks across 12 pairs
of glasses and four different displays, resulting in a total of 480 separate observations.90 The results
of the validation experiment (presented graphically in Figure 5 of Paper 3) revealed good agreement
between the simulation and the visual ranking results. The validation experimental results were also

37
subjected to statistical analysis which calculated the Spearman rank correlation (rs) values comparing
the visual ranking results with the simulation results. These statistics (shown in Table 5 of Paper 3)
provide a high level of confidence in the accuracy of the simulation model with 78% of the ranking
tests having an rs value of 0.9 or higher, and 18% having an rs value of 0.99 or higher.90
The availability of an accurate crosstalk model and simulation now allows the investigation of
hypothetical options for reducing crosstalk in this stereoscopic display system. Section 5 of Paper 3
provides two scenarios that were simulated using the anaglyph crosstalk model for emissive displays.
The first simulation scenario compares the performance of the real‐world anaglyph 3D glasses with
idealised colour filters exhibiting a theoretical ‘brick‐wall’ frequency response. ‘Brick‐wall’ response
colour filters are not achievable in reality, but using the model to simulate their theoretical effect on
crosstalk allows an understanding of how close the real‐world filters are to an ideal performance and
therefore know how much scope there is for their improvement. As can be seen in Table 2 below,
the use of ideal ‘brick‐wall’ filters would make little difference to anaglyph crosstalk performance on
LEDDLP1 – therefore it would be better to invest research into methods other than changes to the
glasses performance to improve crosstalk performance. On the other hand, the simulation predicts
that ‘brick‐wall’ red filters could provide a 55% improvement for LCD15 (a Samsung 2233RZ LCD
monitor) and a 65% improvement for CRT30 (a Mitsubishi Diamond View 1771ie CRT monitor) (per
Table 2 below) indicating that there may be scope for improved crosstalk performance by
investigating different real‐world performance red filters. Further research would be needed to
determine whether a cost‐effective improvement could be achieved using available spectral filter
technologies.
Table 2 Simulated improvement in anaglyph crosstalk performance by the use of theoretical “brick‐wall” colour filters as compared to the best real‐world filters tested in the study (from Table 6 of Paper 3).
The second simulation scenario considered attempts to improve the crosstalk performance of
display LEDDLP1 (a Samsung LED DLP rear‐projection HDTV). “Most LEDs have fairly narrow spectral
emission and very little out‐of‐band light output” but “in the case of LEDDLP1 … there is a lot of out‐
of‐band light output, particularly in the green channel”.90 It is believed the out‐of‐band light output
is due to the use of a colour management algorithm in the video‐processing path of the display. The

38
colour management algorithm cannot be disabled via the user accessible controls of this display, so
the anaglyph crosstalk simulation was used to predict the performance as if colour management
could be disabled. The process used for this simulation is outlined in Section 5 of Paper 3. The
results of the simulation (see Table 3 below) are remarkable – “a reduction of crosstalk by as much
as 97%.”90 The results indicate that if colour management “was able to be disabled on LEDDLP1,
instead of exhibiting the most crosstalk, it could be exhibiting the least crosstalk” 90 of the four
displays tested. This one simulation demonstrates the power of crosstalk simulation and its ability to
provide direction for research effort. The detrimental effect that colour management can have on
anaglyph crosstalk is explored further in the next sub‐chapter of this exegesis.
Table 3 Comparison of simulated crosstalk performance of the LED DLP rear‐projection HDTV with colour management (LEDDLP1) and without colour management (LEDDLP2). (from Table 7 of Paper 3)
A further sub‐topic of Paper 3 was an examination of the efficacy of using hand‐made anaglyph 3D
glasses. The experimental results shown in Table 3 of Paper 3 (and validated in the visual ranking
test presented in Section 4.4 of Paper 3) illustrate “that hand‐made anaglyph glasses can exhibit
significantly worse crosstalk performance than the better commercially available anaglyph 3‐D
glasses. Hence, good commercially available anaglyph 3D glasses [should be used] rather than hand‐
made glasses.” 90 This finding was not unexpected, but it was good to validate this hypothesis,
especially because there are many examples of people/groups/sites (including NASA93)
recommending people make their own anaglyph glasses.
Paper 1, Paper 2, Paper 3 and Paper 8 are included in Chapter 9 as core papers of the thesis.
Paper 10 is included in Appendix 1 as an additional publication relevant to the thesis.
4.3.2 Anaglyph 3D in Printed Images
The final stereoscopic display technique to be analysed as part of this thesis is the printing of
anaglyph 3D images, as presented in Journal Paper 4. Printed anaglyph images often exhibit
considerably higher levels of crosstalk than other stereoscopic display methods so there is some
motivation to improve this very widely used stereoscopic display technique.

39
The way in which crosstalk occurs with printed anaglyph 3D images has similarities to the way in
which crosstalk occurs with anaglyph 3D images on emissive displays, but there are a number of
distinct differences which required a new crosstalk model to be developed and new equations for
calculating crosstalk for printed anaglyphs to be devised. Figure 8 illustrates the model of printed
anaglyph crosstalk developed for this thesis. With reference to Figure 8 (and explained in Section 3
of Paper 4) the model uses the spectrum of the light source (a), paper (b), ink(c), and colour filters in
the anaglyph glasses (d). The simulation program (f) combines the above spectra with the spectral
sensitivity of the human visual system (e) to generate curves for signal and leakage (g‐h) and an
illustration of crosstalk (i). The mathematical expression of the printed anaglyph crosstalk model is
provided as Equations (1)‐(13) in Section 3 of Paper 4 and is not repeated here.
Figure 8 Illustration of the process of printed anaglyph crosstalk simulation. Each spectral graph shows wavelength on the horizontal axis (400 to 700nm, B=Blue, G=Green, R=Red) and intensity on the vertical axis. (from Figure 3 of Paper 4)
40
As can be seen from Figure 8, the crosstalk model has four input dimensions ‐ light source, paper, ink
type, and glasses – which means that the number of unique combinations of different inputs can
escalate very rapidly. Paper 4 considers three different light sources, one paper type, four different
ink types, and 12 different anaglyph glasses resulting in 144 unique combinations. The crosstalk
simulation provides a very quick way to compare all these different combinations and the results of
these comparisons are illustrated in Figure 6 of Paper 4. The simulation predicted that the lowest
crosstalk would be achieved using the combination of the RGB LED light source, the Epson printer ink
set, and a commercial pair of red/blue anaglyph glasses identified as 3DG3 (as described in Section
5.5 of Paper 4). This particular input combination has an estimated 30% crosstalk, which is huge
compared to other stereoscopic display methods, demonstrating a need to investigate options to
lower printed anaglyph crosstalk, and prospectively a hint that there may exist a technique that
could significantly reduce crosstalk in printed anaglyphs.
The printed anaglyph crosstalk model was validated by performing an extensive visual ranking
validation experiment involving 780 separate crosstalk ranking observations across five observers in
three domains (glasses, ink, lamp type) as outlined in Section 5.6 of Paper 4. The results of the
validation experiment are illustrated in Figures 7‐9 of Paper 4, and statistically analysed in Section
5.7 of Paper 4. The validation experiment results were analysed using both the Spearman rank
correlation and the Pearson product‐moment correlation techniques. The statistical analysis results
provide a high level of confidence in the accuracy of the crosstalk simulation algorithm ‐ in the
glasses domain 96% of the ranking tests have an rs value (Spearman’s rank correlation) of 0.9 or
better, 94% have an r2 value (Coefficient of Determination using the Pearson product‐moment
correlation technique) of 0.9 or better, 60% have an r2 value of 0.99 or better, and 20% have an rs
value of 0.99 or better. Statistical results in the ink and lamp domains also showed good correlation
between the visual observations and the crosstalk simulation as described at the end of Section 5.7
of Paper 4.
With a high level of confidence in the developed printed anaglyph crosstalk model, Section 6 of
Paper 4 used the model to investigate options for reducing crosstalk. The simulation was used to
investigate the effect of making changes in three different input dimensions – glasses, light source,
and ink type. In a similar manner to Paper 3, the real‐world glasses were compared to hypothetical
‘brick‐wall’ filter anaglyph glasses (so called ‘ideal’ glasses). The use of a hypothetical RGB laser light
source that provides very spectrally pure light was also examined, along with considering a new
hypothetical ink type with an optimised spectral performance. Further detail of this analysis is
provided in Section 6 of Paper 4 and is not repeated here. The result of simulating these three
scenarios is illustrated in Figure 9 below, which shows that although changes in the glasses and light
source domain do make a difference, the biggest improvement in crosstalk was achieved by the
changes made in the ink domain (down from 44% to 8.6%). Although there are no guarantees that it

41
will be possible to achieve a new ink set with the proposed spectrum, the simulation results certainly
provide motivation to conduct further research in this direction.
Figure 9 An illustration of the effect of making changes in the various input dimensions of printed anaglyph images (glasses dimension, ink set dimension, and light source dimension) has on the amount of crosstalk. The circle sizes (area) are proportional to the simulated amount of crosstalk for each condition. The simulation‐only conditions are shown with dotted circles (from Figure 12 of Paper 4).
Another important finding of this research was the significant detrimental effect that colour
management can have on printed anaglyph crosstalk levels. I believe that there needs to be
provision to allow colour management to be disabled, or overridden by a different anaglyph‐aware
colour management algorithm, when printing anaglyph 3D images. Section 2.3 of Paper 4 provides
further discussion of this aspect.
Journal Paper 4 is included in Chapter 9 of this exegesis as a core manuscript of the thesis.
42
5. Review and Discussion
This thesis has identified the sources of crosstalk for six stereoscopic display technologies – time‐
sequential 3D on CRT displays, time‐sequential 3D on plasma TVs, time‐sequential 3D on LCD
monitors and TVs, time‐sequential 3D on DLP projectors, anaglyph 3D on emissive displays (CRT,
plasma, LCD, DLP), and anaglyph 3D in printed images. In two cases (anaglyph 3D on emissive
displays (Paper 3), and anaglyph 3D in printed images (Paper 4)) a full simulation of crosstalk was
developed, validated, and extrapolated, and presented in refereed publications. In three cases
(time‐sequential 3D on CRTs (Paper 9), time‐sequential 3D on LCDs (Paper 5), and time‐sequential
3D on plasma displays (Paper 6)) a rudimentary crosstalk simulation was developed for the purposes
of analysis and generating figures, but was not specifically presented in the publications.
The development of an accurate crosstalk simulation has allowed the relative contribution of
different crosstalk mechanisms to the total crosstalk present in a display to be determined. In the
case of time‐sequential 3D on LCDs, this work identified that even if the pixel response time could be
reduced, the scanned image update method would still be a significant contributor to crosstalk
(particularly at the top and bottom of the screen) (Section 3.4 and 4 of Paper 5) unless work was
performed to increase the speed of image update. In two cases (anaglyph 3D on emissive displays,
and anaglyph 3D in printed images) crosstalk simulation has been used to identify conditions under
which low levels of crosstalk would be observed (Sections 3.3 and 4 of Paper 2, and Section 5.5 of
Paper 4) and additionally identify ways in which crosstalk could be reduced by making further
changes to the display technologies used – e.g. by disabling colour management in an LED DLP HDTV
(Section 5 of Paper 3) and by using improved spectral quality inks (Section 6 of Paper 4). This latter
aspect of these two papers demonstrates the power of crosstalk simulation to quickly and cheaply
identify ways in which crosstalk can be reduced and therefore improve the image quality of
stereoscopic displays.
In terms of future work, a unified simulation for time‐sequential 3D crosstalk across all of the
emissive display technologies would be advantageous. I have already performed some development
work towards this goal, however this work has not been finalised or published at this stage. In the
prior chapters of this exegesis, the investigation of the time‐sequential 3D method on the CRT, LCD,
plasma and DLP display technologies have been considered and presented separately because the
time‐domain performance of each of these displays is notably different and produces sometimes
radically different crosstalk mechanisms. However there is an opportunity to combine these
separate analyses to develop a unified simulation across all time‐sequential 3D displays. A unified
simulation would include and combine all of the time‐domain characteristics of the various emissive
displays to estimate crosstalk performance of all of these displays. These characteristics include:
image persistence (Section 2.1.2 of Paper 9)
43
pixel response (Section 4.1.1 and 4.1.3 of Paper 1)
image update method (Section 3.4 of Paper 5)
impulse vs. hold‐type display method (Section 3 of Paper 5)
grey level generation technique (e.g. CRTs and LCDs produce different grey levels in an
analog fashion (Sections 4.1.1 and 4.1.3 of Paper 1), DLP uses pulse width modulation
(Section 4.1.4 of Paper 1), and plasma displays use a binary combination of different
intensity pulses (Section 1.1 of Paper 6))
blanking interval performance (Section 5 of Paper 7), and
the time‐domain properties of the LCS 3D glasses (Section 2.1.3 of Paper 9).
Such a simulation would be fairly complicated which is part of the reason that the work on the
unified simulation has not yet been completed. The implementation of the plasma display grey level
method would be the most challenging aspect of the unified crosstalk simulation because of the
significant interplay between grey‐level, time‐domain pulse sequence (determined by the bit order
of the PDP pulses, and the binary representation of each grey level), and phosphor persistence
(Sections 1.1, 3.3 and 3.4 of Paper 6). A fully validated unified simulation of time‐sequential 3D
crosstalk would be beneficial because it would allow additional display technologies to be simulated
(e.g. OLED, or other future display technologies) and the different time‐sequential display
technologies to be compared under the same model.
Section 5 of Paper 3 explained that there was an opportunity to achieve an as yet unobtainably low
level of anaglyph crosstalk (for emissive displays) by disabling the colour management in an LED DLP
HDTV, however this prediction is yet to be validated using the actual display. The paper predicted
that crosstalk levels as low as 0.6% in each eye are feasible even using current generation gel‐filter
anaglyph glasses. The override of colour management in this display will at the very least require
access to the service menu and service controls of the display and may additionally require firmware
changes to the display. The particular LED DLP HDTV in question is already time‐sequential 3D
compatible so it may seem pointless to enable the display of low‐crosstalk anaglyph 3D images on
this display, however it would be valuable to perform this investigation to validate the prediction of
Paper 3 and therefore confirm the academic validity of the crosstalk simulation process.
Section 7 of Paper 4 proposed a range of techniques that could be used to improve the crosstalk
performance of printed anaglyph 3D images. The best prospect for improving crosstalk performance
is thought to be achieved by the use (or development) of inks which have better spectral purity –
particularly the cyan ink. The first step would be to review current ink technologies available in the
printing industry to determine whether printing inks with better spectral performance are already
available – however, my initial investigations indicate that this is not the case. Measuring the
spectra of a range of commercially obtainable inks and running these through the simulation would
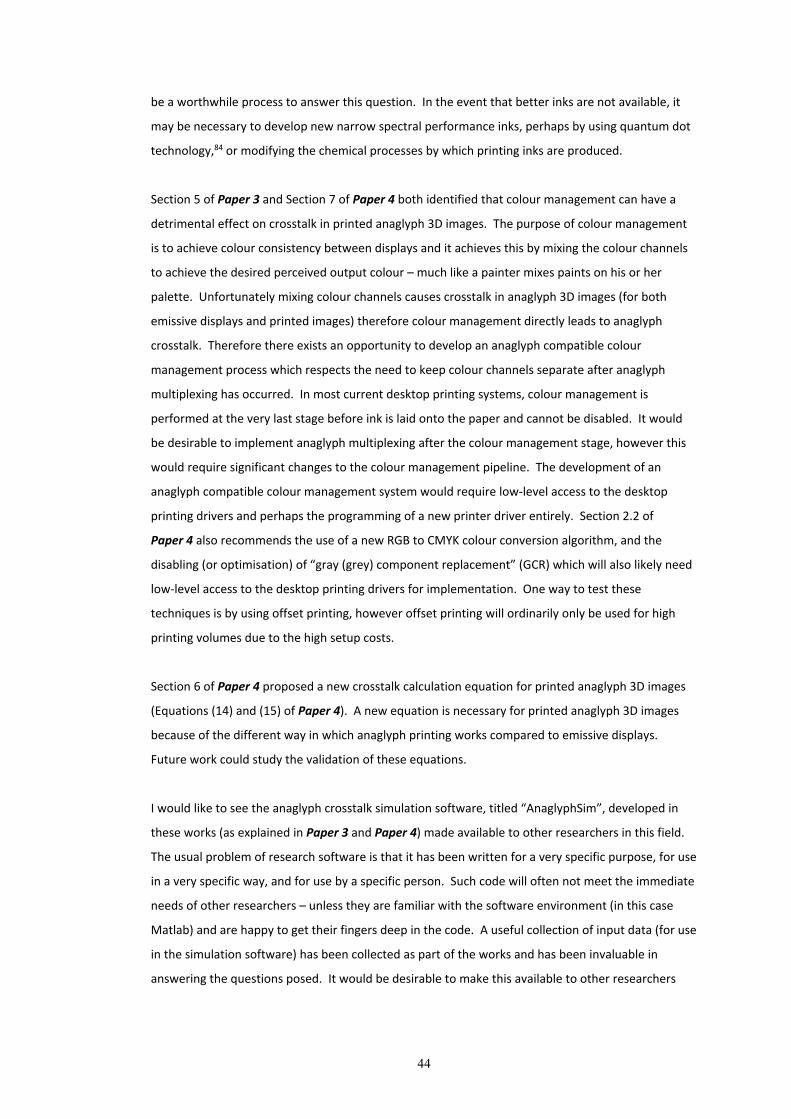
44
be a worthwhile process to answer this question. In the event that better inks are not available, it
may be necessary to develop new narrow spectral performance inks, perhaps by using quantum dot
technology,84 or modifying the chemical processes by which printing inks are produced.
Section 5 of Paper 3 and Section 7 of Paper 4 both identified that colour management can have a
detrimental effect on crosstalk in printed anaglyph 3D images. The purpose of colour management
is to achieve colour consistency between displays and it achieves this by mixing the colour channels
to achieve the desired perceived output colour – much like a painter mixes paints on his or her
palette. Unfortunately mixing colour channels causes crosstalk in anaglyph 3D images (for both
emissive displays and printed images) therefore colour management directly leads to anaglyph
crosstalk. Therefore there exists an opportunity to develop an anaglyph compatible colour
management process which respects the need to keep colour channels separate after anaglyph
multiplexing has occurred. In most current desktop printing systems, colour management is
performed at the very last stage before ink is laid onto the paper and cannot be disabled. It would
be desirable to implement anaglyph multiplexing after the colour management stage, however this
would require significant changes to the colour management pipeline. The development of an
anaglyph compatible colour management system would require low‐level access to the desktop
printing drivers and perhaps the programming of a new printer driver entirely. Section 2.2 of
Paper 4 also recommends the use of a new RGB to CMYK colour conversion algorithm, and the
disabling (or optimisation) of “gray (grey) component replacement” (GCR) which will also likely need
low‐level access to the desktop printing drivers for implementation. One way to test these
techniques is by using offset printing, however offset printing will ordinarily only be used for high
printing volumes due to the high setup costs.
Section 6 of Paper 4 proposed a new crosstalk calculation equation for printed anaglyph 3D images
(Equations (14) and (15) of Paper 4). A new equation is necessary for printed anaglyph 3D images
because of the different way in which anaglyph printing works compared to emissive displays.
Future work could study the validation of these equations.
I would like to see the anaglyph crosstalk simulation software, titled “AnaglyphSim”, developed in
these works (as explained in Paper 3 and Paper 4) made available to other researchers in this field.
The usual problem of research software is that it has been written for a very specific purpose, for use
in a very specific way, and for use by a specific person. Such code will often not meet the immediate
needs of other researchers – unless they are familiar with the software environment (in this case
Matlab) and are happy to get their fingers deep in the code. A useful collection of input data (for use
in the simulation software) has been collected as part of the works and has been invaluable in
answering the questions posed. It would be desirable to make this available to other researchers

45
too. Future work could include the use of this software and data collection to answer a wide range
of further questions about crosstalk in stereoscopic displays.
Paper 8 proposed the use of anaglyph glasses based on dichroic filters and used crosstalk simulation
to predict that such glasses could provide a small but noticeable reduction of crosstalk (for the
red/cyan and green/magenta cases) (Section 4.1 of Paper 8). It would be a valuable academic
exercise to validate this prediction by purchasing a sample set of dichroic filters for constructing into
a pair of anaglyph glasses to enable some human visual testing to be performed. The high cost of a
set of anaglyph glasses based on dichroic filters would reduce the likelihood of commercial success,
but there may be a selection of stereoscopic enthusiasts willing to pay a premium for increased
viewing quality. As has been described in Paper 2, Paper 3, Paper 4, and Paper 10 there are
additional display specifications which can also be considered to reduce crosstalk and hence improve
stereoscopic image quality in anaglyph 3D images.
Paper 1 and Paper 16 identified several points of disagreement and inconsistency in the
mathematical definition of crosstalk and grey‐to‐grey (gray‐to‐gray) crosstalk between various
authors which I believe merits further investigation. Section 2.2.3 of Paper 1 highlights that Huang
et al.94 provide a transfer function based approach to the mathematical definition of crosstalk,
whereas several other authors88,18,50,20,95,96 provide observer‐centric or output‐luminance centric
mathematical definitions of crosstalk. The difference between the transfer function based approach
and the output‐luminance approach is illustrated in Figure 10. The output‐luminance centric
definitions (shown in Figure 10 (a) and (b)) are based only on measurements of luminance at the
viewer location – measurements which are easily obtained – whereas the transfer function based
definition (Figure 8(c)) needs the source luminances ‘A’ and ‘B’ output by the display (before the
effect of the multiplexing system, such as 3D glasses, lenticular sheet, or parallax barrier) as well as
the luminance measurements at the viewer location. In cases where ‘A’ and ‘B’ cannot be measured
directly, these must be calculated from the eight ‘LXXX’ measurements (Figure 8(b)). The four transfer
functions α1, α2, β1 and β2 are then calculated from ‘A’, ‘B’ and the eight ‘LXXX’ measurements.
Section 2.2.4 of Paper 1 and Section 2.6 of Paper 16 highlight similarities and differences between
three different mathematical definitions of grey‐to‐grey crosstalk.97,98,99 The seemingly minor
differences between the various grey‐to‐grey crosstalk definitions, mainly pertaining to the choice of
variables on the denominator and the use of absolute values, still require some investigation to
determine the pros and cons of each approach and hopefully propose a single equation which is
most appropriate to use by all authors. More recently, a transfer function based mathematical
definition of grey‐to‐grey crosstalk has also been proposed100,101 – in contrast to the output‐
luminance centric mathematical definitions discussed in the previous sentence. The cited advantage
of the transfer function based approach is that it can be used to model intermediate values,101
however I remain concerned that such a model only simulates the effect of crosstalk in one display
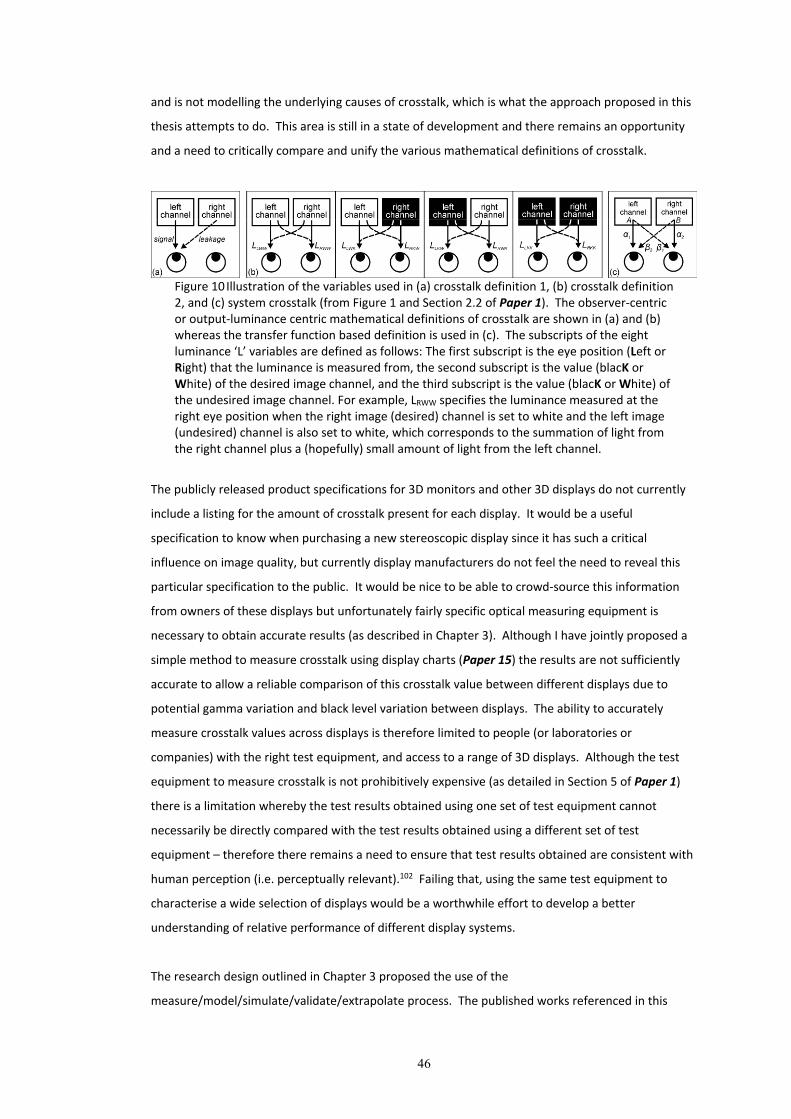
46
and is not modelling the underlying causes of crosstalk, which is what the approach proposed in this
thesis attempts to do. This area is still in a state of development and there remains an opportunity
and a need to critically compare and unify the various mathematical definitions of crosstalk.
Figure 10 Illustration of the variables used in (a) crosstalk definition 1, (b) crosstalk definition 2, and (c) system crosstalk (from Figure 1 and Section 2.2 of Paper 1). The observer‐centric or output‐luminance centric mathematical definitions of crosstalk are shown in (a) and (b) whereas the transfer function based definition is used in (c). The subscripts of the eight luminance ‘L’ variables are defined as follows: The first subscript is the eye position (Left or Right) that the luminance is measured from, the second subscript is the value (blacK or White) of the desired image channel, and the third subscript is the value (blacK or White) of the undesired image channel. For example, LRWW specifies the luminance measured at the right eye position when the right image (desired) channel is set to white and the left image (undesired) channel is also set to white, which corresponds to the summation of light from the right channel plus a (hopefully) small amount of light from the left channel.
The publicly released product specifications for 3D monitors and other 3D displays do not currently
include a listing for the amount of crosstalk present for each display. It would be a useful
specification to know when purchasing a new stereoscopic display since it has such a critical
influence on image quality, but currently display manufacturers do not feel the need to reveal this
particular specification to the public. It would be nice to be able to crowd‐source this information
from owners of these displays but unfortunately fairly specific optical measuring equipment is
necessary to obtain accurate results (as described in Chapter 3). Although I have jointly proposed a
simple method to measure crosstalk using display charts (Paper 15) the results are not sufficiently
accurate to allow a reliable comparison of this crosstalk value between different displays due to
potential gamma variation and black level variation between displays. The ability to accurately
measure crosstalk values across displays is therefore limited to people (or laboratories or
companies) with the right test equipment, and access to a range of 3D displays. Although the test
equipment to measure crosstalk is not prohibitively expensive (as detailed in Section 5 of Paper 1)
there is a limitation whereby the test results obtained using one set of test equipment cannot
necessarily be directly compared with the test results obtained using a different set of test
equipment – therefore there remains a need to ensure that test results obtained are consistent with
human perception (i.e. perceptually relevant).102 Failing that, using the same test equipment to
characterise a wide selection of displays would be a worthwhile effort to develop a better
understanding of relative performance of different display systems.
The research design outlined in Chapter 3 proposed the use of the
measure/model/simulate/validate/extrapolate process. The published works referenced in this
47
exegesis have shown this process to be an effective way of understanding and analysing crosstalk.
Paper 3 and Paper 4 have tested this process right out to the extrapolate step for the anaglyph 3D
technique. Other included papers have conducted work towards this step for the time‐sequential 3D
technique, however, as discussed above, further work is required to develop a unified model for all
time‐sequential 3D systems.
This thesis describes a wide range of knowledge about crosstalk in stereoscopic displays that has
been investigated by me and collaborators, and summarises a wide range of information from other
sources. Despite the breadth of work in this thesis, there remains considerable opportunity to
conduct further research in this field, to allow us to understand the crosstalk performance of various
displays, how crosstalk can be effectively reduced in different stereoscopic display technologies, and
to allow us to fully understand the human perception of crosstalk.

48
6. Conclusion
This thesis has presented an examination of the definitions, presence, occurrence, measurement,
mechanisms, simulation, reduction and perception of crosstalk in stereoscopic displays. The thesis
has presented an investigation of crosstalk in the following stereoscopic display technologies: time‐
sequential 3D and anaglyph 3D methods on liquid crystal displays (LCDs), plasma displays, digital
light projection (DLP) displays, and cathode ray tube (CRT) displays; as well as anaglyph 3D in printed
images.
In addressing the aims of this thesis, a body of work has been presented which has:
(a) Characterised the mechanisms by which crosstalk occurs in a wide range of stereoscopic display
technologies,
(b) Mathematically modelled and simulated the presence of crosstalk in a selection of stereoscopic
display technologies,
(c) Validated the models developed and used those models to investigate (extrapolate) how
different display parameters affect the presence of crosstalk, and
(d) Recommended ways in which crosstalk can be reduced in a range of stereoscopic display
technologies.
This exegesis has drawn the collected publications into a structured framework and has included
sufficient detail to explain the significance of the work without unnecessary duplication of the
content presented in the included publications.
Stereoscopic displays are now an important segment of the display industry and crosstalk remains an
important stereoscopic display performance attribute that needs to be minimised to allow the
presentation of high‐quality stereoscopic images. The work presented in this thesis has been
conducted in a very active and dynamic period of the stereoscopic display industry, and I believe the
works of this thesis have performed an important role in the maturation of the understanding of
crosstalk in this developing field.
I originally commenced investigating crosstalk in stereoscopic displays because I felt that it was an
important display attribute that I wanted to know more about and there was relatively little
published literature which answered the questions that I wanted answered. Looking back at the
published works now as I conclude this thesis, I recognise that it has been a truly fascinating journey
and the questions that I originally asked have been answered, and so much more! As you, the
reader, have worked through this exegesis and the included published works, I hope it has provided
a useful and sound base on which to launch further research in this important field.
49
7. List of References (Exegesis only)
1. A. J. Woods (2010) “Understanding Crosstalk in Stereoscopic Displays” (Keynote Presentation)
at 3DSA (Three‐Dimensional Systems and Applications) conference, Tokyo, Japan, 19‐21 May
2010.
2. A. J. Woods (2012) “Crosstalk in stereoscopic displays: a review” Journal of Electronic Imaging
21(4), 040902 (Oct–Dec 2012)
[included in Chapter 9 of this thesis as Paper 1]
3. International Stereoscopic Union (undated) “A Glossary of Stereoscopic Terms” [online]
http://www.stereoscopy.com/isu/glossary‐index.html Accessed: 20 October 2013.
4. A. J. Woods (2009) "3‐D Displays in the Home" Information Display, 25(07), pp 8‐12, July 2009.
http://informationdisplay.org/Portals/InformationDisplay/IssuePDF/07_2009.pdf
[included in Appendix 1 of this thesis as Paper 14]
5. B. Lee (2013) “Three‐dimensional displays, past and present” Physics Today, 44(6), pp. 36,
April 2013. DOI: http://dx.doi.org/10.1063/PT.3.1947
6. B. Julesz (1983) “Texton Theory of Two‐Dimensional and Three‐Dimensional Vision”
Processing and Display of Three‐Dimensional Data, Proc. SPIE 367, pp. 2 (April 8, 1983); DOI:
http://dx.doi.org/10.1117/12.934294
7. H. Jorke, M. Fritz (2006) “Stereo projection using interference filters” Proc. SPIE 6055,
Stereoscopic Displays and Virtual Reality Systems XIII, 60550G (January 27, 2006);
doi:10.1117/12.650348
8. M. J. Richards, and G. D. Gomes (2011) “Spectral Separation Filters for 3D Stereoscopic D‐
Cinema Presentation,” United States Patent US 7,959,295 B2.
9. T. Gunnarsson (2012) “Global 3‐D Market Flourishes Across Cinema, Home Video and TV VoD
Platforms” Press Release, IHS/iSuppli, 20 December 2012.
URL: http://www.isuppli.com/media‐research/news/pages/global‐3‐d‐market‐flourishes‐
across‐cinema‐home‐video‐and‐tv‐vod‐platforms.aspx Accessed 18 May 2013.
10. M. Kozuka (2012) “Panasonic’s Stereoscopic 3D Technologies, Standardization and Business
Strategy” Keynote Presentation, Stereoscopic Displays and Applications XXIII, Burlingame,
California, January 2012. (Presentation only) Video:
http://www.youtube.com/watch?v=7oy_IvTBLC4 Accessed 18 May 2013.
11. A. J. Woods (2013) “The Illustrated 3D Movie List” [online] May 2013. URL:
http://www.3dmovielist.com Accessed 18 May 2013.
12. C. Kennedy (1936) "The Development and Use of Stereo Photography for Educational
Purposes", Vol. 26, pp. 3‐17, January 1936.
13. R. Spottiswoode, N. L. Spottiswoode and Charles Smith (1952) "Basic Principles of the Three
Dimensional Film" Journal of the SMPTE, Vol. 59, pp. 249‐286, October 1952.
50
14. B. Mendiburu (2010) “3D Movie Making: Stereoscopic Digital Cinema from Script to Screen”
Focal Press.
15. A. J. Woods (2013) “3D or 3‐D: A study of terminology, usage and style”, European Science
Editing, 39(3), pp. 59‐62, August 2013.
[included in Appendix 1 of this thesis as Paper 18]
16. Y.‐C. Chang, C.‐Y. Chiang, K.‐T. Chen, Y.‐P. Huang (2009) “Investigation of Dynamic Crosstalk
for 3D Display” in 2009 International Display Manufacturing Conference, 3D Systems and
Applications, and Asia Display (IDMC/3DSA/Asia Display 2009), Taipei, Taiwan.
17. B. Lane (1982) “Stereoscopic displays” in Proc. SPIE Processing and Display of Three‐
Dimensional Data, ed. J.J. Pearson, 0367, 20‐32.
18. A. J. Woods (2011) “How are crosstalk and ghosting defined in the stereoscopic literature?” in
Stereoscopic Displays and Applications XXII, Proceedings of IS&T/SPIE Electronic Imaging, SPIE
Vol. 7863, pp. 78630Z‐1 to ‐12, Burlingame, California, January 2011.
[included in Appendix 1 of this thesis as Paper 16]
19. SMPTE (2009) “Report of SMPTE Taskforce on 3D to the Home” Society of Motion Picture and
Television Engineers (SMPTE), New York.
20. International Committee for Display Metrology (2012) “Information display measurements
standard (version 1.03),” Society for Information Display. [online] http://icdm‐sid.org/
21. IEC (2009) “TC110/220/NP ‐ New Work Proposal ‐ 3D Displays ‐ Terminology and letter
symbols” International Electrotechnical Commission, dated: 2009‐12‐18.
22. L. Lipton (1978) “Foundations of the Stereoscopic Cinema – A Study in Depth” Van Nostrand
Reinhold Company, New York.
23. L. Lipton (1989) “Compatibility of Stereoscopic Video Systems with Broadcast Television
Standards” Three‐Dimensional Visualization and Display Technologies, Proc. SPIE 1083, pp. 95.
24. G. A. Slavenburg, T. F. Fox, and David R. Cook (2007) “System, method, and computer program
product for increasing an LCD display vertical blanking interval,” United States Patent
Application Publication 20070229487 A1, publication date 4 October, 2007.
25. C. Wheatstone (1838) “Contributions to the Physiology of Vision.—Part the First. On some
remarkable, and hitherto unobserved, Phenomena of Binocular Vision” in Philosophical
Transactions of the Royal Society of London, Vol. 128, pp. 371 – 394.
26. Encyclopædia Britannica (2012) "Louis Ducos du Hauron" in Encyclopædia Britannica,
Encyclopædia Britannica Online, Encyclopædia Britannica Inc. Accessed: 22 Jul 2012 URL:
<http://www.britannica.com/EBchecked/topic/172961/Louis‐Ducos‐du‐Hauron>
27. L. D. duHauron (1891) “Estampes, photographies et tableaux stéréoscopiques, produisant lair
effect en plein jour, sans l’aide du stereoscope” French Patent No. 216465 (1891) in S. A.
Benton (editor) “Selected Papers on Three‐Dimensional Displays” SPIE Milestone Series,
MS162 (2001)
28. L. D. duHauron (1895) “Stereoscopic print” U.S. Patent No. 544666.
51
29. M. Macedonia (2006) “It's the end of the tube as we know it” IEEE Computer, June 2006,
Vol.39(6), pp.83‐85.
30. D. L. Symmes (2006) “The Chopper” Online: [ARCHIVED]
http://web.archive.org/web/20110707063258/http://www.3dmovingpictures.com/chopper.h
tml Dated: 14 November 2006, Accessed: 4 August 2013.
31. Laurence Hammond (1924) “Stereoscopic motion picture device,” U.S. Patent No. 1506524.
32. T. Takahashi (2010) “A Review of Electronic Paper Display Technologies from the Standpoint
of SID Symposium Digests” FDP 2010 Symposium Digest, (2010)
33. J. A. Roese (1975) “PLZT stereoscopic television system,” U.S. Patent No. 3903358.
34. Casio (undated) “Casio Corporate History ‐ Chronology of Products” Online: http://www.casio‐
europe.com/euro/corporate/chronologyofproducts/detail/1983_3/ Accessed: 11 August
2013.
35. L. J. Hornbeck (1995) “Digital Light Processing and MEMS: Timely Convergence for a Bright
Future” (Invited Plenary Paper), Proceedings SPIE, Vol. 2639, Micromachining and
Microfabrication Process Technology.
36. L. Lipton (2012) “Brief history of electronic stereoscopic displays” Optical Engineering 51(2),
021103, February 2012.
37. K. Hamada, T. Yamamoto, T. Kurita, Y. Takano, I. Yuyama (1998) “A field‐sequential
stereoscopic display system with 42‐in. HDTV DC‐PDP” Proc. Intl. Display Workshop IDW’98,
pp. 555–558, IDW, Japan.
38. I. McDowall, M. Bolas, D. Corr, T. Schmidt (2001) “Single and Multiple Viewer Stereo with DLP
Projectors” Stereoscopic Displays and Virtual Reality Systems VIII, Proc. SPIE Vol. 4297, pg 418‐
425, San Jose, California.
39. M. Hanlon (2003) “LCD sales surpass CRT sales for first time” GizMag, online:
http://www.gizmag.com/go/2427/ dated: 15 December 2003, Accessed: 6 August 2013.
40. Projector Central (undated) “Lightspeed DepthQ Projector” Online:
http://www.projectorcentral.com/Lightspeed‐DepthQ.htm Accessed: 11 August 2013.
41. A. J. Woods (2012) “The Illustrated 3D HDTV List”, URL:
http://www.3dmovielist.com/3dhdtvs.html dated: 24 May 2012, accessed: 19 June 2013.
42. J. M. Lytle (2008) “Pioneer pulls plasma plug, Sony cans CRTs” TechRadar, online:
http://www.techradar.com/au/news/television/pioneer‐pulls‐plasma‐plug‐sony‐cans‐crts‐
256211 dated: March 4th 2008, accessed: 12 August 2013.
43. A. J. Woods (2012) “The Illustrated 3D Compatible Projectors List”,
URL: http://www.3dmovielist.com/projectors.html , dated: 6 Feb 2012, accessed: 19 June
2013.
44. Projector Central (undated) “Viewsonic PJD5111” Online:
http://www.projectorcentral.com/ViewSonic‐PJD5111.htm Accessed: 11 August 2013.
52
45. A. J. Woods (2012) “The Illustrated 3D Monitor List”,
URL: http://www.3dmovielist.com/3dmonitors.html , dated: 13 May 2012, accessed: 19 June
2013.
46. Google Inc. (2013) “Google Scholar (citations for: Andrew J. Woods)” [online] URL:
http://scholar.google.com.au/citations?user=J‐9YiCkAAAAJ Dated: 13 October 2013,
Accessed: 13 October 2013.
47. W. W. Jacques (1885) “Underground wires,” Science 6(126), pp. 6–7.
48. C. W. Earp (1941) “Carrier wave transmission system,” U.S. Patent No. 2256317.
49. L. Lipton (1987) “Factors affecting ‘ghosting’ in time‐multiplexed planostereoscopic CRT
display systems,” in True 3D Imaging Techniques and Display Technologies, Proc. SPIE 761, pp.
75–78.
50. S. Pala, R. Stevens, and P. Surman (2007) “Optical crosstalk and visual comfort of a
stereoscopic display used in a real‐time application,” in Stereoscopic Displays and Virtual
Reality Systems XIV, Proc. SPIE 6490, 649011.
51. K.‐C. Huang, J.‐C. Yuan, C.‐H. Tsai, W.‐J. Hsueh, N.‐Y. Wang (2003) “A study of how crosstalk
affects stereopsis in stereoscopic displays,” in Stereoscopic Displays and Virtual Reality
Systems X, Proc. SPIE 5006, 247–253.
52. S. Pastoor (1995) “Human factors of 3D images: Results of recent research at Heinrich‐Hertz‐
Institut Berlin,” in Proc. IDW’95, Vol. 3D‐7, pp. 69–72, IDW, Japan.
53. Y. Nojiri et al. (2004) “Visual comfort/discomfort and visual fatigue caused by stereoscopic
HDTV viewing,” in Stereoscopic Displays and Virtual Reality Systems XI, Proc. SPIE 5291, 303–
313.
54. F. L. Kooi and A. Toet (2004) “Visual comfort of binocular and 3D displays,” Displays 25(2–3),
99–108.
55. P. J. H. Seuntiëns, L. M. J. Meesters, and W. A. Ijsselsteijn (2005) “Perceptual attributes of
crosstalk in 3D images,” Displays 26(4–5), 177–183.
56. K. Ukai and P. A. Howarth (2008) “Visual fatigue caused by viewing stereoscopic motion
images: background, theories, and observations,” Displays 29(2), 106–116.
57. T. J. Haven (1987) "A liquid‐crystal video stereoscope with high extinction ratios, a 28%
transmission state, and 100 µs switching", in True Three‐Dimensional Imaging Techniques &
Display Technologies, D.F. McAllister, WE. Robbins, Editors, Proceedings of SPIE vol. 761, pp.
23‐26, Bellingham Washington USA, 1987.
58. L. Lipton, J. Halnon, J. Wuopio, B. Dorworth (2000) "Eliminating it‐cell artefacts", in
Stereoscopic Displays & Virtual Reality Systems VII, JO. Merritt, S.A. Benton. A.J. Woods, MT.
Bolas, Editors, Proceedings of SPIE vol.3957, pp. 264‐270, Bellingham Washington USA.
59. P.J. Bos, T. Haven (1989) "Field‐Sequential Stereoscopic Viewing Systems using Passive
Glasses", in SID Vol. 30/1, pp. 39‐43.
53
60. J. S. Lipscomb, W. L. Wooten (1994) "Reducing Crosstalk between Stereoscopic Views", in
Stereoscopic Displays & Virtual Reality System, S. S. Fisher, J. O. Merritt, M. T. Bolas, Editors,
Proceedings of SPIE vol.2177, pp. 92‐96, Bellingham Washington USA.
61. P. J. Bos (1991) "Time Sequential Stereoscopic Displays: The Contribution of Phosphor
Persistence to the 'Ghost' Image Intensity", in Three‐Dimensional Image Technologies, H.
Kusaka, Editor, Proceedings of ITEC'91, ITE Annual Convention, pp. 603‐606, Institute of
Television Engineering of Japan, Tokyo, Japan, July 1991.
62. L. Lipton (2011) "The Stereoscopic Cinema: From Film to Digital Projection", in SMPTE Journal,
pp. 586‐593, Sept 2001.
63. L. Lipton (1992) "High Dynamic Range Electro‐Optical Shutter for Stereoscopic and other
Applications", United States Patent #5 1 17 302, May 1992.
64. A. J. Woods (2005) “Compatibility of Display Products with Stereoscopic Display Methods”
International Display Manufacturing Conference (IDMC), pp. 290‐293, Taiwan, February 2005.
[included in Appendix 1 of this thesis as Paper 11]
65. Projector Central (2013) “InFocus DepthQ Projector” URL:
http://www.projectorcentral.com/InFocus‐DepthQ.htm , dated: 18 June 2013, accessed: 18
June 2013.
66. H. Pan, X.‐F. Feng, S. Daly (2005) “LCD motion blur modeling and analysis” IEEE Int’l. Conf.
Image Processing, Vol. 2, pp. 21–24.
67. A. A. S. Sluyterman, E. P. Boonekamp (2005) "Architectural Choices in a Scanning Backlight for
Large LCD TVs" SID 05 Digest, pg 996‐998.
68. H.‐C. Hung, C.‐W. Shih (2005) "Improvement in Moving Picture Quality Using Scanning
Backlight System" Proceedings of the International Display Manufacturing Conference
(IDMC'05), Taipei, Taiwan.
69. K. Hamada, T. Kurita, M. Kanazawa, K. Yamamoto (2001) “A 3D Hi‐Vision Display with 50‐in.
AC PDP” Asia Display/Intl. Display Workshop IDW’01, pp. 785–788, IDW, Japan.
70. K.‐D. Cho (2004) “New Address and Sustain Waveforms for AC Plasma Display Panel”, PhD
Thesis, Kyungpook National University.
71. L. J. Hornbeck (1998) “Current status and future applications for DMD based projection
displays” Proc. Fifth Intl. Display Workshop IDW’98, Japan, pp. 1–4.
72. M. Husak, J. D. Lawrence, R. Mueller, C. Ward (2011) “System and method for synchronizing a
3D video projector” U.S. Patent No. 8066377.
73. A. J. Woods, S. Tan (2002) “Characterising Sources of Ghosting in Time‐Sequential
Stereoscopic Video Displays” presented at Stereoscopic Displays and Applications XIII (SD&A),
published in Stereoscopic Displays and Virtual Reality Systems IX, Proceedings of IS&T/SPIE
Electronic Imaging, SPIE Vol. 4660, pp. 66‐77, San Jose, California, January 2002.
[included in Chapter 9 of this thesis as Paper 9]
54
74. A. J. Woods, T. Rourke (2004) “Ghosting in Anaglyphic Stereoscopic Images” presented at
Stereoscopic Displays and Applications XV (SD&A), published in Stereoscopic Displays and
Virtual Reality Systems XI, Proceedings of IS&T/SPIE Electronic Imaging, SPIE Vol. 5291, pp.
354‐365, San Jose, California, January 2004.
[included in Appendix 1 of this thesis as Paper 10]
75. A. J. Woods, T. Rourke, K.‐L. Yuen (2006) "The Compatibility of Consumer Displays with Time‐
Sequential Stereoscopic 3D Visualisation" (Invited Plenary Paper), in Proceedings of the K‐IDS
Three‐Dimensional Display Workshop 2006, pp. 7‐10, Seoul National University, Seoul, South
Korea, 21 August 2006.
[included in Appendix 1 of this thesis as Paper 12]
76. A. J. Woods, T. Rourke (2007) “The compatibility of consumer DLP projectors with time‐
sequential stereoscopic 3D visualization”, presented at Stereoscopic Displays and Applications
XVIII, published in Stereoscopic Displays and Virtual Reality Systems XIV, Proceedings of
IS&T/SPIE Electronic Imaging, SPIE Vol. 6490, pp. 64900V‐1 to ‐7, San Jose, California, January
2007.
[included in Appendix 1 of this thesis as Paper 13]
77. M. A. Weissman, Andrew J. Woods (2011) “A simple method for measuring crosstalk in
stereoscopic displays” in Stereoscopic Displays and Applications XXII, Proceedings of IS&T/SPIE
Electronic Imaging, SPIE Vol. 7863, pp. 786310‐1 to ‐11, Burlingame, California, January 2011.
[included in Appendix 1 of this thesis as Paper 15]
78. A. J. Woods, Jesse Helliwell (2012) “Investigating the cross‐compatibility of IR‐controlled
active shutter glasses” in Stereoscopic Displays and Applications XXIII, Proceedings of
IS&T/SPIE Electronic Imaging, SPIE Vol. 8288, pp. 82881C‐1 to ‐10, Burlingame, California,
January 2012.
[included in Appendix 1 of this thesis as Paper 18]
79. J. A. Norling (1937) “Anaglyph Stereoscopy,” U.S. Patent No. 2,135,197.
80. S. J. Harrington, R. P. Loce, and G. Sharma (2006) “Systems for spectral multiplexing of source
images to provide a composite image, for rendering the composite image, and for spectral
demultiplexing of the composite image to animate recovered source images,” U.S. Patent No.
7,136,522 B2.
81. G. Sharma, R. P. Loce, S. J. Harrington, Y. Zhang (2003) “Illuminant multiplexed imaging:
special effects using GCR,” in Proc. 11th Color Imaging Conference: Color Science and
Engineering Systems, Technologies, and Applications, pp. 266–271, IS&T (Society for Imaging
Science & Technology), Springfield, Virginia.
82. R. Labbe, D. E. Klutho (2009) “Publishing stereoscopic images” Stereoscopic Displays and
Applications XX, Proc. SPIE Vol. 7237, 72370J.

55
83. A. J. Woods, Ka Lun Yuen (2006) "Compatibility of LCD Monitors with Frame‐Sequential
Stereoscopic 3D Visualisation" (Invited Paper), in IMID/IDMC '06 Digest, (The 6th International
Meeting on Information Display, and The 5th International Display Manufacturing
Conference), pp. 98‐102, Daegu, South Korea, 22‐25 August 2006.
[included in Chapter 9 of this thesis as Paper 5]
84. L. Cui, Y. Li, J. Wang, E. Tian, X. Zhang, Y. Zhang, Y. Song, Lei Jianga (2009) “Fabrication of large‐
area patterned photonic crystals by ink‐jet printing” Journal of Material Chemistry, Vol. 19, pp.
5499‐5502.
85. A. J. Woods, A. Sehic (2009) “The compatibility of LCD TVs with time‐sequential stereoscopic
3D visualization” in Stereoscopic Displays and Applications XX, Proceedings of IS&T/SPIE
Electronic Imaging, SPIE Vol. 7237, pp. 72370N‐1 to ‐9, San Jose, California, January 2009.
[included in Chapter 9 of this thesis as Paper 7]
86. IPL 10530 Integrated Photodiode Amplifiers, Product Data Sheet, Integrated Photomatrix
Limited, Dorchester, United Kingdom.
87. A. J. Woods, K. S. Karvinen (2008) "The compatibility of consumer plasma displays with time‐
sequential stereoscopic 3D visualization" in Stereoscopic Displays and Applications XIX,
Proceedings of IS&T/SPIE Electronic Imaging, SPIE Vol. 6803, pp. 68030X‐1 to ‐9, San Jose,
California, January 2008.
[included in Chapter 9 of this thesis as Paper 6]
88. A. J. Woods, C. R. Harris (2010) “Comparing levels of crosstalk with red/cyan, blue/yellow, and
green/magenta anaglyph 3D glasses” in Stereoscopic Displays and Applications XXI,
Proceedings of IS&T/SPIE Electronic Imaging, SPIE Vol. 7253, pp. 75240Q‐1 to ‐12, San Jose,
California, January 2010.
[included in Chapter 9 of this thesis as Paper 8]
89. A. J. Woods, K. L. Yuen, and K. S. Karvinen, (2007) “Characterizing crosstalk in anaglyphic
stereoscopic images on LCD monitors and plasma displays” in Journal of the Society for
Information Display, Volume 15, Issue 11, pp. 889‐898, November 2007.
[included in Chapter 9 of this thesis as Paper 2]
90. A. J. Woods, C. R. Harris (2012) “Using cross‐talk simulation to predict the performance of
anaglyph 3‐D glasses” in JSID (Journal of the Society for Information Display), Vol. 20, No. 6,
pp. 304‐315.
[included in Chapter 9 of this thesis as Paper 3]
91. A. J. Woods, C. R. Harris, Dean B. Leggo, Tegan M. Rourke (2013) “Characterizing and Reducing
Crosstalk in Printed Anaglyph Stereoscopic 3D Images” in (Journal of) Optical Engineering,
SPIE, Vol. 52, No. 4, pp. 043203‐1 to 043203‐19, April 2013.
[included in Chapter 9 of this thesis as Paper 4]
92. www.matlab.com

56
93. NASA (2012) “Build your own 3d glasses” National Aeronautics and Space Administration
[online] http://stereo.gsfc.nasa.gov/classroom/glasses.shtml Dated: 5 December 2012.
Accessed: 27 October 2013.
94. K.‐C. Huang, C.‐H. Tsai, K.‐J. Lee, W.‐J. Hsueh (2000) “Measurement of Contrast Ratios for 3D
Display” in Input/Output and Imaging Technologies II, Proc. SPIE 4080, pp. 78–86.
95. P. Boher, T. Leroux, T. Bignon, V. Collomb‐Patton (2010) “Multispectral polarization viewing
angle analysis of circular polarized stereoscopic 3D displays” Stereoscopic Displays and
Applications XXI, Proc. SPIE 7253, 72530R.
96. J.‐C. Liou, K. Lee, F.‐G. Tseng, J.‐F. Huang, W.‐T. Yen, W.‐L. Hsu (2009) “Shutter glasses stereo
LCD with a dynamic backlight” Stereoscopic Displays and Applications XX, Proc. SPIE 7237,
72370X.
97. S. Shestak, D.‐S. Kim, S.‐D. Hwang (2010) “Measuring of gray‐to‐gray crosstalk in a LCD based
time‐sequential stereoscopic displays,” Society for Information Display Symposium Digest
Technical Papers 41(1), 132–135.
98. S.‐M. Jung, Y.‐B. Lee, H.‐J. Park, S.‐C. Lee, W.‐N. Jeong, J.‐K. Shin, I.‐J. Chung (2010)
“Improvement of 3‐D crosstalk with over‐driving method for the active retarder 3‐D displays”
Society for Information Display Symposium Digest Technical Papers, 41(1), pp. 1264–1267.
99. C.‐C. Pan, Y.‐R. Lee, K.‐F. Huang, T.‐C. Huang (2010) “Cross‐talk evaluation of shutter‐type
stereoscopic 3D display” Society for Information Display Symposium Digest Technical Papers,
41(1), pp. 128–131.
100. F.‐H. Chen, J.‐C. Yang, Y.‐H. Chou, K.‐C. Huang, K. Lee (2012) “Gray‐to‐gray crosstalk model”
3DSA (Three Dimensional Systems and Applications) Confence, pp. 213–216.
101. K.‐C. Huang, F.‐H. Chen, L.‐C. Lin, H.‐Y. Lin, Y.‐H. Chou, C.‐C. Liao, Y.‐H. Chen, K. Lee (2013) “A
crosstalk model and its application to stereoscopic and autostereoscopic displays” Journal of
the Society for Information Display, 21(6), pp. 249‐262.
102. K. Teunissen, A. Sevo, A. van Dalfsen, and H. van Parys (2011) “Perceptually Relevant
Characterization of Stereoscopic Displays” Society for Information Display Symposium Digest
Technical Papers, 42(1), pp. 994‐997.
Every reasonable effort has been made to acknowledge the owners of copyright material. I would
be pleased to hear from any copyright owner who has been omitted or incorrectly acknowledged.
57
8. Bibliography (from Exegesis and Included Publications)
As a courtesy to the reader, this list includes, in one place, all of the references cited in the published
papers plus any additional references cited in the exegesis.
The circled number refers to the paper number(s) which cite this particular reference. e.g. = this
reference was cited in Paper 1. = this reference was cited in the Exegesis.
1. A. Abileah (2011) “3D Displays – Technologies & Testing Methods” at 3D Imaging
Workshop, Stanford University.
2. Agarwal (2010) “Make your own 3D glasses in 10 seconds,” Digital Inspiration
[online]. URL: http://www.labnol.org/home/make‐3dglasses/13776/ Dated: 2 June
2010. Accessed: 6 July 2011.
3. W. Allen, R. Ulichney (2005) “Wobulation: Doubling the Addressed Resolution of
Projection Displays,” SID Symposium Digest 36, 1514‐1517.
http://www.hpl.hp.com/personal/Robert_Ulichney/papers/2005‐wobulation‐
SID.pdf
4. American Polarizers Inc (undated) “Circular Polarizers ‐ APNCP37” American
Polarizers, Inc. [online] accessed 28 March 2010.
http://www.apioptics.com/pdf/APNCP37‐010‐STD.pdf
5. Associated Press (2013) "The Associated Press Stylebook and Briefing on Media
Law" New York: Associated Press. ISBN 978‐0‐917360‐57‐2.
6. V. C. Barber, D. A. Brett (1982) “"Colour bombardment" ‐ a human visual problem
that interferes with the viewing of anaglyph stereo material” in Scanning electron
microscopy, 2, pp.495‐498.
7. M. Barkowsky, S. Tourancheau, K. Brunnström, K. Wang, and B. Andrén (2011)
"Crosstalk Measurements of Shutter Glasses 3D Displays" SID 11 Digest, 812‐815.
8. G. R. Basile, F. J. Poradish (2006) “System and Method for Synchronizing a Viewing
Device” US Patent Application 2008/0151112 A1, dated 22 Dec 2006.
9. R. Blake R. Sekuler (2006) "Perception (5th edn.)" McGraw Hill, Boston, pp. 92.
10. L. Blondé, J.‐J. Sacré, D. Doyen, Q. Huynh‐Thu, and C. Thébault (2011) “Diversity
and Coherence of 3D Crosstalk Measurements,” SID 11 DIGEST, 804‐807.
11. W. Bloos (2008) “Ghosting test ‐ standard method for determining ghost image,”
Stereo Forum, online, dated 5 June 2008, accessed 25 March 2010.
http://www.stereoforum.org/viewtopic.php?f=16&t=53
12. A. Boev, A. Gotchev, and K. Egiazarian (2007) “Crosstalk measurement
methodology for autostereoscopic screens” 3DTV Conference, 1‐4.
58
13. K. R. Boff, J. E. Lincoln (1988) Engineering data compendium: Human perception
and performance, AAMRL, Wright‐Patterson AFB, OH, pp. 370.
14. P. Boher, T. Leroux, T. Bignon, V. Collomb‐Patton (2010) “Multispectral polarization
viewing angle analysis of circular polarized stereoscopic 3D displays” in Proc. SPIE
Stereoscopic Displays and Applications XXI, 7253, 0R1‐0R12.
15. P. Boher (2010) ELDIM, personal communication, 13 April 2010.
16. P.J. Bos, T. Haven (1989) "Field‐Sequential Stereoscopic Viewing Systems using
Passive Glasses", in SID Vol. 30/1, pp. 39‐43.
17. P. J. Bos (1991) "Time Sequential Stereoscopic Displays: The Contribution of
Phosphor Persistence to the 'Ghost' Image Intensity", in Three‐Dimensional Image
Technologies, H. Kusaka, Editor, Proceedings of ITEC'91, ITE Annual Convention, pp.
603‐606, Institute of Television Engineering of Japan, Tokyo, Japan, July 1991.
18. P. J. Bos (1991) “Performance limits of stereoscopic viewing systems using active
and passive glasses,” IEEE Virtual Reality Annual International Symposium, 371‐376
(1993). (NB: same as P. J. Bos, “Time sequential stereoscopic displays: The
contribution of phosphor persistence to the “ghost” image intensity,” Proc. ITEC’91
Annual Conf., Three‐Dimensional Image Tech., (H. Kusaka, ed.), 603‐606.
19. C. Bungert (2005) “Shutterglasses Comparison Chart” Online:
http://stereo3d.com/shutter.htm Dated: 1 April 2005. Accessed: 29 March 2011.
20. Casio (undated) “Casio Corporate History ‐ Chronology of Products” Online:
http://www.casio‐
europe.com/euro/corporate/chronologyofproducts/detail/1983_3/ Accessed: 11
August 2013.
21. Consumer Electronics Association (CEA) (2011) “R4WG16: Active Eyewear
Standards IR Sync Request for Proposal (RFP)”
22. Consumer Electronics Association (CEA) (2013) It Is Innovation (i3), 1(3), May 2013.
Arlington, Virginia. Available at http://www.ce.org/i3
23. J. Chang, H. J. Kim, J. W. Choi, and K. Y. Yu (2008) “Ghosting reduction method for
color anaglyphs,” in Stereoscopic Displays and Applications XIX, Proceedings of
SPIE‐IS&T Electronic Imaging, 6803, 68031G.1‐68031G.10.
24. Y.‐C. Chang, C.‐Y. Chiang, K.‐T. Chen, Y.‐P. Huang (2009) “Investigation of Dynamic
Crosstalk for 3D Display” in 2009 International Display Manufacturing Conference,
3D Systems and Applications, and Asia Display (IDMC/3DSA/Asia Display 2009),
Taipei, Taiwan.
25. L. Chen, Y. Tu, W. Liu, Q. F. Li, K. Teunissen, and I. Heynderickx (2008)
“Investigation of Crosstalk in a 2‐View 3D Display,” SID 08 Digest, 1138‐1141.

59
26. F.‐H. Chen, J.‐C. Yang, Y.‐H. Chou, K.‐C. Huang, K. Lee (2012) “Gray‐to‐gray crosstalk
model” 3DSA (Three Dimensional Systems and Applications) Confence, pp. 213–
216.
27. F.‐H. Chen, J.‐C. Yang, Y.‐H. Chou, K.‐C. Huang, and K. Lee (2012) “Gray‐to‐Gray
Crosstalk Model,” 3DSA (Three‐Dimensional Systems and Applications) conference,
213‐216.
28. Chien, K.‐W. and Shieh, H.‐P. D., “3D Mobile Display Based on Sequentially
Switching Backlight with Focusing Foil” in SID 2004 Digest, 1434‐1437 (2004).
29. C. Chinnock (2009) “Philips Decides to Shut Down 3D Operation,” Display Daily
[online] at http://displaydaily.com/2009/03/27/
30. K.‐D. Cho (2004) “New Address and Sustain Waveforms for AC Plasma Display
Panel”, PhD Thesis, Kyungpook National University.
31. Y.‐M. Chu, K.‐W. Chien, H.‐P. D. Shieh, J.‐M. Chang, A. Hu, V. Yang (2005) “3D
Mobile Display Based on Dual Directional Lightguides” in 4th International Display
Manufacturing Conference, Taipei, Taiwan, 799‐801.
32. CIE (1932) "Commission Internationale de l’Eclairage Proceedings" Cambridge
University Press.
33. C. Connolly (2003) “Colorimetry: Anatomical Studies Advance”, Photonics Spectra,
Issue Aug 2003, pp 56‐66.
34. D. Cook (2004) “Stereoscopic Gaming: Technology and Applications”, Keynote
Presentation at Stereoscopic Displays and Applications XV conference, 19‐21
January 2004, San Jose, California. (Presentation only).
35. M. Cowan, J. Greer, and L. Lipton (2011) “Ghost‐compensation for improved
stereoscopic projection,” US Patent Application Publication 2011/0025832 A1.
36. L. Cui, Y. Li, J. Wang, E. Tian, X. Zhang, Y. Zhang, Y. Song, Lei Jianga (2009)
“Fabrication of large‐area patterned photonic crystals by ink‐jet printing” Journal
of Material Chemistry, Vol. 19, pp. 5499‐5502.
37. Daleh (undated) “Build your own 3D glasses” [online]. URL:
http://www.daleh.id.au/3d_glasses.html Accessed: 26 August 2011.
38. DataColor AG, http://spyder.datacolor.com/product‐mc‐s3elite.php
39. J. Dennis (2011) National Stereoscopic Association, personal communication, 1
September 2011.
40. E. Dubois (2001) “A projection method to generate anaglyph stereo images,” IEEE
Intl. Conf. Acoustics, Speech, and Signal Processing, Proc. (ICASSP ‘01), 3, 1661–
1664.

60
41. L. D. duHauron (1891) “Estampes, photographies et tableaux stéréoscopiques,
produisant lair effect en plein jour, sans l’aide du stereoscope” French Patent No.
216465 (1891) in S. A. Benton (editor) “Selected Papers on Three‐Dimensional
Displays” SPIE Milestone Series, MS162 (2001)
42. L. D. duHauron (1895) “Stereoscopic print” U.S. Patent No. 544666.
43. K. Ealasubramonian, R. P. Rajappan (1983) “Compatible 3‐D television: the state of
the art” in Proc. SPIE Three‐Dimensional Imaging, ed. J.P. Ebbeni, A. Monfils, 0402,
100‐106.
44. C. W. Earp (1941) “Carrier wave transmission system,” U.S. Patent No. 2256317.
45. J. B. Eichenlaub (1990) “An autostereoscopic display for use with a personal
computer,” in Stereoscopic Displays and Applications, Proceedings of SPIE‐IS&T
Electronic Imaging, 1256, 156‐163.
46. Encyclopædia Britannica (2012) "Louis Ducos du Hauron" Encyclopædia Britannica,
Encyclopædia Britannica Online, Encyclopædia Britannica Inc. Accessed: 22 Jul
2012 URL: <http://www.britannica.com/EBchecked/topic/172961/Louis‐Ducos‐du‐
Hauron>
47. S. M. Faris (1991) “Micro‐Polarizer Arrays Applied to a New Class of Stereoscopic
Imaging,” SID 91 Digest, 840‐843.
48. S. M. Faris (1994) “Novel 3‐D stereoscopic imaging technology” in Stereoscopic
Displays and Virtual Reality Systems, Proceedings of SPIE vol. 2177, San Jose,
California, February 1994.
49. M. Fihn (2013) Veritas et Visus, personal communication, 28 May 2013.
50. S. S. Fisher, M. McGreevy, J. Humphries, and W. Robinett (1986) “Virtual
Environment Display System,” Proceedings of the Workshop on Interactive 3D
Graphics, 1‐11.
51. B. Fraser, C. Murphy, and F. Bunting, “Real world color management,” Peachpit
press (2004).
52. J. E. Gaudreau, “Stereoscopic displaying method and device” US Patent 5629798
(1997).
53. J. E. Gaudreau, et al., “Innovative stereoscopic display using variable polarized
angle” Stereoscopic Displays and Virtual Reality Systems XIII, Proc. SPIE 6055,
605518 (2006).
54. J. Goodman (2003) “Development of the 960p stereoscopic video format” in
Stereoscopic Displays and Virtual Reality Systems X, Proceedings of SPIE‐IS&T
Electronic Imaging, 5006, 187‐194.
55. Google Inc. (2013) “Google Scholar (citations for: Andrew J. Woods)” [online] URL:
http://scholar.google.com.au/citations?user=J‐9YiCkAAAAJ Dated: 13 October
2013, Accessed: 13 October 2013.
61
56. Google Inc. (2013) "Google Trends" [online] URL: www.google.com/trends Dated:
30 May 2013, Accessed: 30 May 2013
57. A. M. Gorski (1992) "User evaluation of a stereoscopic display for space training
applications" Proc. SPIE Stereoscopic Displays and Applications III, 1669, 236‐243.
58. T. Gunnarsson (2012) “Global 3‐D Market Flourishes Across Cinema, Home Video
and TV VoD Platforms” Press Release, IHS/iSuppli, 20 December 2012. URL:
http://www.isuppli.com/media‐research/news/pages/global‐3‐d‐market‐
flourishes‐across‐cinema‐home‐video‐and‐tv‐vod‐platforms.aspx Accessed 18
May 2013.
59. K. Hamada, T. Yamamoto, T. Kurita, Y. Takano, I. Yuyama (1998) “A field‐sequential
stereoscopic display system with 42‐in. HDTV DC‐PDP” Proc. Intl. Display Workshop
IDW’98, pp. 555–558, IDW, Japan.
60. K. Hamada, T. Kurita, M. Kanazawa, K. Yamamoto (2001) “A 3D Hi‐Vision Display
with 50‐in. AC PDP” Asia Display/Intl. Display Workshop IDW’01, pp. 785–788, IDW,
Japan.
61. L. Hammond (1924) “Stereoscopic Motion Picture Device” U.S. Patent No.
1,506,524, 26 August 1924.
62. M. Hanlon (2003) “LCD sales surpass CRT sales for first time” GizMag, online:
http://www.gizmag.com/go/2427/ dated: 15 December 2003, Accessed: 6 August
2013.
63. S. J. Harrington, R. P. Loce, G. Sharma “Systems for spectral multiplexing of source
images to provide a composite image, for rendering the composite image, and for
spectral demultiplexing of the composite image to animate recovered source
images” U.S. Patent US 7,136,522 B2 (Filed 2002, Issued 2006)
64. S. J. Harrington, R. P. Loce, and G. Sharma (2006) “Systems for spectral multiplexing
of source images to provide a composite image, for rendering the composite
image, and for spectral demultiplexing of the composite image to animate
recovered source images” U.S. Patent No. 7,136,522 B2.
65. T. J. Haven (1987) "A liquid‐crystal video stereoscope with high extinction ratios, a
28% transmission state, and 100 µs switching" True Three‐Dimensional Imaging
Techniques & Display Technologies, D.F. McAllister, WE. Robbins, Editors,
Proceedings of SPIE vol. 761, pp. 23‐26, Bellingham Washington USA, 1987.
66. HCinema (undated) "HCinema (projector database)" [online] Available:
http://www.projektoren‐datenbank.de/pro [accessed 21st Dec 2003]
67. S. P. Hines (1984) "Three‐Dimensional Cinematography" Proc. SPIE Optics in
Entertainment II, ed. C.S. Outwater, 0462, 41‐47 (1984).
68. L. F. Hodges (1991) “Basic principles of stereographic software development” in
Proc. SPIE Stereoscopic Displays and Applications II, 1457, 9‐17 (1991).
62
69. M. Hollins (1990) "Medical Physics" Thomas Nelson & Sons, London, pp26‐27.
70. H.‐K. Hong, J.‐W. Jang, D.‐G. Lee, M.‐J. Lim, and H.‐H. Shin (2010) “Analysis of
angular dependence of 3‐D technology using polarized eyeglasses” Journal of the
SID, 18(1), 8‐12.
71. L. J. Hornbeck (1995) “Digital Light Processing and MEMS: Timely Convergence for
a Bright Future” (Invited Plenary Paper), Proceedings SPIE, Vol. 2639,
Micromachining and Microfabrication Process Technology.
72. L. J. Hornbeck (1998) "Current Status and Future Applications for DMD‐Based
Projection Displays" Proceedings of the Fifth International Display Workshop IDW
'98, Kobe, Japan.
73. K.‐C. Huang, C.‐H. Tsai, K.‐J. Lee, W.‐J. Hsueh (2000) “Measurement of Contrast
Ratios for 3D Display” in Input/Output and Imaging Technologies II, Proc. SPIE
4080, pp. 78–86.
74. K.‐C. Huang et al. (2003) “A study of how crosstalk affects stereopsis in
stereoscopic displays” Stereoscopic Displays and Virtual Reality Systems X, Proc.
SPIE 5006, 247–253.
75. K.‐C. Huang, K. Lee, H.‐Y. Lin (2009) “Crosstalk issue in stereo/autostereoscopic
display” in Proc. Int. Display Manufacturing Conference, 2–18.
76. K.‐C. Huang, F.‐H. Chen, L.‐C. Lin, H.‐Y. Lin, Y.‐H. Chou, C.‐C. Liao, Y.‐H. Chen, K. Lee
(2013) “A crosstalk model and its application to stereoscopic and autostereoscopic
displays” Journal of the Society for Information Display, 21(6), pp. 249‐262.
77. H.‐C. Hung, C.‐W. Shih (2005) "Improvement in Moving Picture Quality Using
Scanning Backlight System" Proceedings of the International Display Manufacturing
Conference (IDMC'05), Taipei, Taiwan.
78. M. Husak, J. D. Lawrence, R. Mueller, C. Ward (2011) “System and method for
synchronizing a 3D video projector” U.S. Patent No. 8066377.
79. D. C. Hutchison (2007) “Introducing DLP 3‐D TV” Texas Instruments white paper.
http://dlp.com/downloads/Introducing DLP 3‐D HDTV Whitepaper.pdf
80. International Committee for Display Metrology (2012) “Information display
measurements standard (version 1.03)” Society for Information Display. [online]
http://icdm‐sid.org/
81. I. Ideses, L. Yaroslavsky (2005) “Three methods that improve the visual quality of
colour anaglyphs” Journal of Optics A: Pure and Applied Optics, 7(12), p.755‐762.
82. IEC (2009) “TC110/220/NP ‐ New Work Proposal ‐ 3D Displays ‐ Terminology and
letter symbols” International Electrotechnical Commission, dated: 2009‐12‐18.
83. Institute of Electrical and Electronics Engineers (IEEE) (2013) "IEEE Spectrum" 50(5)
(INT), May 2013, New York. Available at http://spectrum.ieee.org/
63
84. Integrated Photomatrix Limited (undated) "IPL 10530 Integrated Photodiode
Amplifiers, Product Data Sheet" Integrated Photomatrix Limited, Dorchester,
United Kingdom.
85. ISO (2012) “Ergonomics of human‐system interaction – Part 331: Optical
characteristics of autostereoscopic displays” Technical Report ISO/TR 9241‐331.
86. International Stereoscopic Union (undated) “A Glossary of Stereoscopic Terms”
[online] http://www.stereoscopy.com/isu/glossary‐index.html Accessed: 20
October 2013.
87. W. W. Jacques (1885) “Underground wires” Science 6(126), pp. 6–7.
88. A. Jain, and J. Konrad (2007) “Crosstalk in automultiscopic 3‐D displays: Blessing in
disguise?” in Stereoscopic Displays and Virtual Reality Systems XIV, Proceedings of
SPIE‐IS&T Electronic Imaging, 6490, 649012.1‐649012.12.
89. T. Järvenpää, M. Salmimaa (2007) “Optical Characterization Methods for
Autostereoscopic 3D Displays” Proc. of EuroDisplay, 132‐135.
90. T. Järvenpää, M. Salmimaa, T. Levola (2010) “Qualified Viewing Spaces for Near‐to‐
Eye and Autostereoscopic Displays” SID 10 Digest, 335‐338.
91. H. Jorke, M. Fritz (2006) “Stereo projection using interference filters” Proc. SPIE
6055, Stereoscopic Displays and Virtual Reality Systems XIII, 60550G (January 27,
2006); doi:10.1117/12.650348
92. B. Julesz (1983) “Texton Theory of Two‐Dimensional and Three‐Dimensional
Vision” Processing and Display of Three‐Dimensional Data, Proc. SPIE 367, pp. 2
(April 8, 1983); DOI: http://dx.doi.org/10.1117/12.934294
93. S.‐M. Jung, Y.‐B. Lee, H.‐J. Park, S.‐C. Lee, W.‐N. Jeong, J.‐K. Shin, I.‐J. Chung (2010)
“Improvement of 3‐D crosstalk with over‐driving method for the active retarder 3‐
D displays” Society for Information Display Symposium Digest Technical Papers,
41(1), pp. 1264–1267.
94. Kaptein, R. and Heynderickx, I., “Effect of Crosstalk in Multi‐View Autostereoscopic
3D Displays on Perceived Image Quality” in SID ’07 Digest, 1220‐1223 (2007).
95. K. S. Karvinen, A. J. Woods (2007) “The Compatibility of Plasma Displays with
Stereoscopic Visualisation” CMST Technical Report CMST2007‐04, Curtin University
of Technology, Perth Australia, February 2007.
96. C. Kennedy (1936) "The Development and Use of Stereo Photography for
Educational Purposes" Vol. 26, pp. 3‐17, January 1936.
97. T. Kim, J. M. Ra, J. H. Lee, S. H. Moon, and K.‐Y. Choi (2011) “3D Crosstalk
Compensation to Enhance 3D Image Quality of Plasma Display Panel” IEEE
Transactions on Consumer Electronics, 57(4), 1471‐1477.
98. S. Klimenko, P. Frolov, L. Nikitina, and I. Nikitin (2003) “Crosstalk reduction in
passive stereo‐projection systems” Proc. of Eurographics'03, 235–240.
64
99. J. Konrad, B. Lacotte, and E. Dubois (2000) “Cancellation of image crosstalk in time‐
sequential displays of stereoscopic video” IEEE Transactions on Image Processing,
9(5), 897‐908.
100. J. Konrad, and M. Halle (2007) “3‐D Displays and Signal Processing: An Answer to 3‐
D Ills?” IEEE Signal Processing Magazine, 24, 97‐111.
101. F. L. Kooi, A. Toet (2004) “Visual comfort of binocular and 3D displays” Displays
25(2–3), 99–108.
102. N. Koren (undated) "Making Fine Prints" [online]
http://www.normankoren.com/makingfineprints1A.html
103. M. Kozuka (2012) “Panasonic’s Stereoscopic 3D Technologies, Standardization and
Business Strategy” Keynote Presentation, Stereoscopic Displays and Applications
XXIII, Burlingame, California, January 2012. (Presentation only) Video:
http://www.youtube.com/watch?v=7oy_IvTBLC4 Accessed 18 May 2013.
104. E. Kurland (2013) 3‐DIY, personal communication, 28 May 2013.
105. R. Labbe, D. E. Klutho (2009) “Publishing Stereoscopic Images” in Stereoscopic
Displays and Applications XX, Proc. SPIE 7237, pp. 72370J‐1 to 72370J‐5
106. B. Lane (1982) “Stereoscopic displays” in Proc. SPIE Processing and Display of
Three‐Dimensional Data, ed. J.J. Pearson, 0367, 20‐32.
107. S. J. Lee, M. J. Kim, K. H. Lee, and K. H. Park (2009) “Review of Wire Grid Polarizer
and Retarder for Stereoscopic Display,” in Stereoscopic Displays and Applications
XX, Proceedings of SPIE‐IS&T Electronic Imaging, 7237, 72370P.1‐72370P.10.
108. Y. H. Lee, and Y. B. Jung, (2010) “Stereoscopic image projecting system using
circularly polarized filter module,” US Patent Application Publication No. US
2010/0079728 A1.
109. J. Lee, J. Lee, S. Kim, J. Han, T. Jun, and S. Shin (2010) “Optical Performance Analysis
Method of Auto‐stereoscopic 3D Displays,” SID 10 Digest, 327‐330.
110. B. Lee (2013) “Three‐dimensional displays, past and present” Physics Today, 44(6),
pp. 36, April 2013. DOI: http://dx.doi.org/10.1063/PT.3.1947
111. J. Levine, IEEE, personal communication, 23 September 2011.
112. B. Li, and J. Caviedes (2012) “Evaluating the Impact of Crosstalk on Shutter‐type
Stereoscopic 3D Displays,” Sixth International Workshop on Video Processing and
Quality Metrics, 1‐6.
113. J.‐C. Liou, K. Lee, F.‐G. Tseng, J.‐F. Huang, W.‐T. Yen, W.‐L. Hsu (2009) “Shutter
glasses stereo LCD with a dynamic backlight” Stereoscopic Displays and
Applications XX, Proc. SPIE 7237, 72370X.
65
114. J. S. Lipscomb, W. L. Wooten (1994) "Reducing Crosstalk between Stereoscopic
Views", in Stereoscopic Displays & Virtual Reality System, S. S. Fisher, J. O. Merritt,
M. T. Bolas, Editors, Proceedings of SPIE vol.2177, pp. 92‐96, Bellingham
Washington USA.
115. L. Lipton (1978) “Foundations of the Stereoscopic Cinema – A Study in Depth” Van
Nostrand Reinhold Company, New York.
116. L. Lipton (1987) “Factors affecting ‘ghosting’ in time‐multiplexed planostereoscopic
CRT display systems,” in True 3D Imaging Techniques and Display Technologies,
Proc. SPIE 761, pp. 75–78.
117. L. Lipton, A. Berman, L. D. Meyer, and J. L. Fergason (1988) “Method and system
employing a push‐pull liquid crystal modulator,” U.S. Pat. No. 4,792,850.
118. L. Lipton (1989) “Compatibility of Stereoscopic Video Systems with Broadcast
Television Standards” Three‐Dimensional Visualization and Display Technologies,
Proc. SPIE 1083, pp. 95.
119. L. Lipton (1991) "Selection devices for field‐sequential stereoscopic displays: a brief
history" Proc. SPIE Stereoscopic Displays and Applications II, 1457, 274‐282 (1991).
120. L. Lipton (1992) "High Dynamic Range Electro‐Optical Shutter for Stereoscopic and
other Applications", United States Patent #5 1 17 302, May 1992.
121. L. Lipton (1992) “The Future of autostereoscopic electronic displays,” in
Stereoscopic Displays and Applications III, Proceedings of SPIE‐IS&T Electronic
Imaging, 1669, 156‐162.
122. L. Lipton, J. Halnon, J. Wuopio, B. Dorworth (2000) "Eliminating it‐cell artefacts", in
Stereoscopic Displays & Virtual Reality Systems VII, JO. Merritt, S.A. Benton. A.J.
Woods, MT. Bolas, Editors, Proceedings of SPIE vol.3957, pp. 264‐270, Bellingham
Washington USA.
123. L. Lipton, "The Stereoscopic Cinema: From Film to Digital Projection", in SMPTE
Journal, pp. 586‐593, Sept 2001.
124. L. Lipton (2009) “Glossary,” Lenny Lipton’s Blog, online, dated 16 March 2009,
accessed 19 March 2010. http://lennylipton.wordpress.com/2009/03/16/glossary/
125. L. Lipton (2011) "The Stereoscopic Cinema: From Film to Digital Projection", in
SMPTE Journal, pp. 586‐593, Sept 2001.
126. L. Lipton (2011) Leonardo IP, personal communication, 8 Nov 2011.
127. L. Lipton (2012) “Brief history of electronic stereoscopic displays” Optical
Engineering 51(2), 021103, February 2012.
128. D. Lovy (1996) "WINDIG 2.5" [software], Dept of Physical Chemistry, University of
Geneva, Switzerland.

66
129. J. M. Lytle (2008) “Pioneer pulls plasma plug, Sony cans CRTs” TechRadar, online:
http://www.techradar.com/au/news/television/pioneer‐pulls‐plasma‐plug‐sony‐
cans‐crts‐256211 dated: March 4th 2008, accessed: 12 August 2013.
130. C.‐Y. Ma, Y.‐C. Chang, Y.‐P. Huang, and C.‐H. Tsao (2011) “A Simulation Platform
and Crosstalk Analysis for Patterned Retarder 3D Display,” SID 11 Digest, 808‐811.
131. S. G. G. MacDonald, D. M. Burns (1975) "Physics for the Life and Health Sciences"
Addison Wesley, USA.
132. M. Macedonia (2006) “It's the end of the tube as we know it” IEEE Computer, June
2006, Vol.39(6), pp.83‐85.
133. A. Marraud, and M. Bonne (1983) “Restitution of a Stereoscopic Picture by Means
of a Lenticular Sheet,” in Three‐Dimensional Imaging, Proceedings of SPIE‐IS&T
Electronic Imaging, 402, 129‐132.
134. D. F. McAllister, Y. Zhou, and S. Sullivan (2010) “Methods for computing color
anaglyphs,” in Stereoscopic Displays and Applications XXI, Proceedings of SPIE‐IS&T
Electronic Imaging, 7524, 75240S.1–75240S.12.
135. J. H. McDonald (2009) "Handbook of biological statistics (2nd ed.)" Sparky House
Publishing, Baltimore, Maryland, pp. 221‐223 (2009).
http://udel.edu/~mcdonald/statspearman.html
136. I. McDowall, M. Bolas, D. Corr, T. Schmidt (2001) “Single and Multiple Viewer
Stereo with DLP Projectors” Stereoscopic Displays and Virtual Reality Systems VIII,
Proc. SPIE Vol. 4297, pg 418‐425, San Jose, California.
137. D. J. McKnight (2010) “Enhanced ghost compensation for stereoscopic imagery,”
US Patent Application Publication US 2010/0040280 A1.
138. B. Mendiburu (2010) “3D Movie Making: Stereoscopic Digital Cinema from Script to
Screen” Focal Press.
139. L. Meyer (1992) "Monitor selection criteria for stereoscopic displays" Proc. SPIE
Stereoscopic Displays and Applications III, 1669, 211‐214.
140. S. Miles (2009) “How to make your own 3D glasses” Pocket‐lint [online] URL:
http://www.pocket‐lint.com/news/27268/how‐to‐make‐3d‐glasses Dated: 22
September 2009. Accessed: 6 July 2011.
141. A. Millin, P. Harman (2001) “Three‐dimensions via the Internet,” in Stereoscopic
Displays and Virtual Reality Systems VIII, Proceedings of SPIE‐IS&T Electronic
Imaging, 4297, 328‐333.
142. D. J. Montgommery, G. J. Woodgate, A. Jacobs, J. Harrold, D. Ezra (2001) “Analysis
of the performance of a flat panel display system convertible between 2D and
autostereoscopic 3D modes” in Proc. SPIE Stereoscopic Displays and Virtual Reality
Systems VIII, 4297, 148‐159.
67
143. H. Morishama, H. Nose, N. Taniguchi, K. Inoguchi, S. Matsumura, (1998) “An
Eyeglass‐Free Rear‐Cross‐Lenticular 3‐D Display” in SID Digest 1998, 923‐926.
144. J. Morreale (2011) SID, personal communication, 1 September 2011.
145. National Aeronautics and Space Administration (NASA) (2012) “Build your own 3d
glasses” [online] http://stereo.gsfc.nasa.gov/classroom/glasses.shtml Dated: 5
December 2012. Accessed: 27 October 2013.
146. National Stereoscopic Association (NSA) (2013) "Stereo World" 38(6), May/June
2013, Portland, Oregon. Available at http://www.stereoworld.org/
147. Y. Nojiri, H. Yamanoue, A. Kanazato, M. Emoto, and F. Okano (2004) “Visual
comfort / discomfort and visual fatigue caused by stereoscopic HDTV viewing,” in
Stereoscopic Displays and Virtual Reality Systems XI, Proceedings of SPIE‐IS&T
Electronic Imaging, 5291, 303‐313.
148. J. A. Norling (1937) “Anaglyph Stereoscopy,” U.S. Patent No. 2,135,197.
149. Y. Ohno (1999) "OSA Handbook of Optics, Volume III: Visual Optics and Vision"
National Institute of Standards and Technology, Maryland USA.
150. Optical Filters (undated) “XP42 Linear Polarizer Filters datasheet” Optical Filters
UK. http://www.opticalfilters.co.uk
151. J. Osterman, T. Scheffer (2011) “Contrast‐Enhanced High‐Speed Polarization
Modulator for Active‐Retarder 3D Displays,” SID 11 DIGEST, 93‐96.
152. S. Pala, R. Stevens, and P. Surman (2007) “Optical crosstalk and visual comfort of a
stereoscopic display used in a real‐time application,” in Stereoscopic Displays and
Virtual Reality Systems XIV, Proc. SPIE 6490, 649011.
H. Pan, X.‐F. Feng, S. Daly (2005) “LCD motion blur modeling and
analysis” IEEE Int’l. Conf. Image Processing, Vol. 2, pp. 21–24.
153. C.‐C. Pan, Y.‐R. Lee, K.‐F. Huang, T.‐C. Huang (2010) “Cross‐talk evaluation of
shutter‐type stereoscopic 3D display” Society for Information Display Symposium
Digest Technical Papers, 41(1), pp. 128–131.
154. S.‐M. Park, H.‐S. Lee, J.‐H. Jeong, S. Shestak, and D.‐S. Kim (2010) “Method and
Apparatus for Displaying Stereoscopic Image,” United States Patent Application
Publication 2010/0066820 A1, publication date 18 March 2010.
155. S. Pastoor (1995) “Human factors of 3D images: Results of recent research at
Heinrich‐Hertz‐Institut Berlin,” in Proc. IDW’95, Vol. 3D‐7, pp. 69–72, IDW, Japan.
156. R. Patterson (2007) “Human factors of 3‐D displays,” Journal of the SID, 15(11),
861‐871.
157. R. Patterson, et al (2007) “Binocular rivalry and head‐worn displays,” Human
Factors 49(6), 1083–1096.
158. R. Patterson (2009) “Review Paper: Human factors of stereo displays: An update,”
J. Soc. Info. Display, 17(12), 987–996.

68
159. Petrus (2011) “Universal sutterglasses controller” (sic) in MTBS3D Forums. Online:
http://www.mtbs3d.com/phpBB/viewtopic.php?p=55149#p55149 Dated: 10 Jan
2011. Accessed: 29 March 2011.
160. Projector Central (undated) “Viewsonic PJD5111” Online:
http://www.projectorcentral.com/ViewSonic‐PJD5111.htm Accessed: 11 August
2013.
161. Projector Central (2013) “InFocus DepthQ Projector” URL:
http://www.projectorcentral.com/InFocus‐DepthQ.htm , dated: 18 June 2013,
accessed: 18 June 2013.
162. Projector Central (undated) “Lightspeed DepthQ Projector” Online:
http://www.projectorcentral.com/Lightspeed‐DepthQ.htm Accessed: 11 August
2013.
163. C. Pulfrich (1922) “Die Stereoskopie im Dienste der isochromem und
herterochromen Photometrie,” Naturwissenschaft 10, 553–564.
164. M. A. Purnell (2003) “Casting, replication, and anaglyph stereo imaging of
microscopic detail in fossils, with examples from conodonts and other jawless
vertebrates,” Palaeontologia Electron. 6(2), 1–11, (see Appendix 1).
165. M. Ramstad (2009) “High‐Fidelity Printed Anaglyphs and Viewing Filters,” United
States Patent Application Publication, No.: US 2009/0278919 Al, Pub. Date: 12 Nov
2009.
166. M. J. Richards, G. D. Gomes (2011) “Spectral Separation Filters for 3D Stereoscopic
D‐Cinema Presentation,” United States Patent US 7,959,295 B2.
167. J. A. Roese (1975) “PLZT Stereoscopic Television System,” US Patent No. 3903358,
Filing date: 22 May 1974, Issue date: 2 September 1975
168. J. A. Roese, A. S. Khalafalla (1976) “Stereoscopic viewing with PLZT ceramics,”
Ferroelectrics, 10(1), 47‐51.
169. T. Rourke, A. J. Woods (2006) "Compatibility of Consumer DLP Projectors with
Time‐Sequential Stereoscopic Visualisation", Technical Report CMST 2006‐17,
Curtin University of Technology.
170. J. R. Rupkalvis (2012) personal communication, July 2012.
171. A. Ryer (1997) "International Light Handbook" pp. 11, International Light
Corporation, Newburyport, Massachusetts, USA. [online]: http://www.intl‐
light.comlhandbook
172. Samsung (2008) “SAMSUNG Debuts The First 3D Ready Flat‐Panel HDTV With Its
2008 Entry‐Level Plasma HDTV Line‐Up” Press Release 7 January 2008, Retrieved
on 9 January 2008 from
http://www.samsung.com/us/news/newsRead.do?news_seq=6449&page=1
69
173. W. R. Sanders, D. F. McAllister (2003) “Producing anaglyphs from synthetic images”
in Stereoscopic Displays and Virtual Reality Systems X, Proceedings of SPIE‐IS&T
Electronic Imaging, 5006, 348–358.
174. H. Sanftmann, D. Weiskopf (2011) “Anaglyph stereo without ghosting” Computer
Graphics Forum, 30(4), 1251–1259.
175. J. Scarpetti, “Stereoscopic Photographic Print, Method of Making, and Apparatus
for Viewing” United States Patent, Filed: 11 Sept 1972, Issued: 28 June 1974.
176. P. J. H. Seuntiëns, L. M. J. Meesters, and W. A. Ijsselsteijn (2005) “Perceptual
attributes of crosstalk in 3D images,” Displays 26(4–5), 177–183.
177. G. Sharma, R. P. Loce, S. J. Harrington, Y. Zhang (2003) “Illuminant multiplexed
imaging: special effects using GCR,” in Proc. 11th Color Imaging Conference: Color
Science and Engineering Systems, Technologies, and Applications, pp. 266–271,
IS&T (Society for Imaging Science & Technology), Springfield, Virginia.
178. K. Sheehan (2013) SPIE, personal communication, 29 May 2013.
179. S. Shestak, D.‐S. Kim (2007) “Application of Pi‐cells in Time‐Multiplexed
Stereoscopic and Autostereoscopic Displays, Based on LCD Panels,” in Stereoscopic
Displays and Virtual Reality Systems XIV, Proceedings of SPIE‐IS&T Electronic
Imaging, 6490, 64900Q.1‐64900Q.9.
180. S. Shestak, D.‐S. Kim, S.‐D. Hwang (2010) “Measuring of gray‐to‐gray crosstalk in a
LCD based time‐sequential stereoscopic displays,” Society for Information Display
Symposium Digest Technical Papers 41(1), 132–135.
181. S. Shestak, D. Kim, and Y. Kim (2012) “How much crosstalk can be allowed in a
stereoscopic system at various grey levels?” in Stereoscopic Displays and
Applications XXIII, Proceedings of SPIE‐IS&T Electronic Imaging, 8288, 828810.1‐
828810.10.
182. International Committee for Display Metrology (ICDM) (2012) “Information Display
Measurements Standard (version 1.03)” Society for Information Display (SID). URL:
http://icdm‐sid.org/
183. Society for Information Display (SID) (2013) "Information Display" 9(3), May/June
2013. Campbell, California. Available at http://informationdisplay.org/
184. G. A. Slavenburg, T. F. Fox, and D. R. Cook (2007) “System, method, and computer
program product for increasing an LCD display vertical blanking interval,” United
States Patent Application Publication 20070229487 A1, publication date 4 October
2007.
185. G. A. Slavenburg, T. F. Fox, and D. R. Cook (2011) “System, Method, and Computer
Program Product for Compensating for Crosstalk During the Display of Stereo
Content,” US Patent 8085217 B2.
70
186. A. A. S. Sluyterman, E. P. Boonekamp (2005) "Architectural Choices in a Scanning
Backlight for Large LCD TVs" SID 05 Digest, pg 996‐998.
187. SMPTE (2009) “Report of SMPTE Taskforce on 3D to the Home” Society of Motion
Picture and Television Engineers (SMPTE), New York.
188. SPIE (2013) "SPIE Professional" 8(2), April 2013, Bellingham, Washington.
189. R. Spottiswoode, N. L. Spottiswoode, C. Smith (1952) "Basic Principles of the Three
Dimensional Film" Journal of the SMPTE, Vol. 59, pp. 249‐286, October 1952.
190. S. S. Stevens (1957) “On the psychophysical law” Psychological Review, 64(3), pp.
153‐181.
191. R. F. Stevens (2004) "Cross‐talk in 3D displays" Report CETM 56, National Physical
Laboratory, UK.
192. H. Stevenson, M. Khazova (2004) “Patterned Grating Alignment of Reactive
Mesogens for Phase Retarders,” Proceedings of the 24th International Display
Research Conference (IDRC) with the 4th International Meeting on Information
Display (IMID), 1‐4.
193. A. Stockman, L. T. Sharpe (2007) “Luminous energy function (2 degree, linear
energy)” [online]. URL: http://www.cvrl.org/cvrlfunctions.htm and
http://www.cvrl.org/database/text/lum/CIE2008v2.htm Accessed: 29 July 2011.
194. A. Stockman, H. Jägle, M. Pirzer, L. T. Sharpe (2008) “The dependence of luminous
efficiency on chromatic adaptation,” J. Vision, 8(16):1, 1–26.
http://journalofvision.org/8/16/1/
195. W. Strunk, E. B. White, The Elements of Style. 4th ed. Boston, Massachusetts: Allyn
& Bacon; 2000. ISBN: 0‐205‐30902‐X
196. D. L. Symmes (2006) “The Chopper” {Online] [ARCHIVED]
http://web.archive.org/web/20110707063258/http://www.3dmovingpictures.com
/chopper.html Dated: 14 November 2006, Accessed: 4 August 2013.
197. T. Takahashi (2010) “A Review of Electronic Paper Display Technologies from the
Standpoint of SID Symposium Digests” FDP 2010 Symposium Digest, (2010)
198. S. S. L. Tan (2001) "Sources of Crosstalk in Stereoscopic 3D Displays" Centre for
Marine Science & Technology, Curtin University of Technology, Perth, Australia,
2001.
199. W. Tan, S. Z. Zhou, S. C. Read (2011) “Methods and Systems for Reducing or
Eliminating Perceived Ghosting in Displayed Stereoscopic Images” US Patent
Application Publication 2001/0080401 A1.
200. L. A. Taplin (2001) “Spectral Modeling of a Six‐Color Inkjet Printer” Master of
Science Thesis, Rochester Institute of Technology.
71
201. K. Teunissen, A. Sevo, A. van Dalfsen, H. van Parys (2011) “Perceptually Relevant
Characterization of Stereoscopic Displays” Society for Information Display
Symposium Digest Technical Papers, 42(1), pp. 994‐997.
202. G. Themelis (2003) “Comparison of Stereo Projection Screens,” online, dated April
2003, accessed 28 March 2010. http://www.drt3d.com/info/ScreenTesting.htm
203. S. Tourancheau, K. Wang, L. Janowski, J. Bułat, K. Brunnström, and M. Barkowsky
(2012) “Reproducibility of crosstalk measurements on active glasses 3D LCD
displays based on temporal characterization,” in Stereoscopic Displays and
Applications XXIII, Proceedings of SPIE‐IS&T Electronic Imaging, 8288, 82880Y.1‐
82880Y.17.
204. V. M. Tran, “New methods of rendering anaglyph stereoscopic images on CRT
displays and photo‐quality ink‐jet printers” M.A.Sc. Thesis, University of Ottawa,
December 2005.
205. I. Tsirlin, L. M. Wilcox, R. S. Allison (2011) “The Effect of Crosstalk on the Perceived
Depth from Disparity and Monocular Occlusions,” IEEE Transactions on
Broadcasting, 57(2), 445‐453.
206. I. Tsirlin, L. M. Wilcox, R. S. Allison (2012) “Effect of crosstalk on depth magnitude
in thin structures,” J. Electron. Imaging, 21(1), 011003‐1‐011003‐7.
207. I. Tsirlin, R. S. Allison, L. M. Wilcox (2012) “Crosstalk reduces the amount of depth
seen in 3D images of natural scenes,” in Stereoscopic Displays and Applications
XXIII, Proceedings of SPIE‐IS&T Electronic Imaging, 8288, 82880W.1‐82880W.9.
208. H. Uchiike, T. Hirakawa, “Color plasma displays” Proc IEEE 90, Issue 4, 533–539
(2002).
209. Uehara, S., Hiroya, T., Kusanagi, H., Shigemura, K. and Asada, H., "High‐visibility
2D/3D LCD with HDDP Arrangement and its Optical Characterization Methods"
IMID/IDMC/ASIA DISPLAY '08 Digest, 147‐150 (2008).
210. Uehara, S., Ujike, H., Hamagishi, G., Taira, K., Koike, T., Kato, C., Nomura, T.,
Horikoshi, T., Mashitani, K., Yuuki, A., Izumi, K., Hisatake, Y., Watanabe, N., Umezu,
N., Nakano, Y., "Standardization based on human factors for 3D display:
performance characteristics and measurement methods" Proc. SPIE Stereoscopic
Displays and Applications XXI, 7524 , 7524071‐12 (2010).
211. Uehara, S., Koike, T., Kato, C., Uchidoi, M., Horikoshi, T., Hamagishi, G., Hisatake, Y.,
Ujike, H., "Development of Performance Characteristics for 3D Displays"
IMID/IDMC/ASIA DISPLAY 2010 DIGEST, 245‐246 (2010).
212. K. Ukai and P. A. Howarth (2008) “Visual fatigue caused by viewing stereoscopic
motion images: background, theories, and observations,” Displays 29(2), 106–116.
213. Veritas et Visus (2013) "3rd Dimension" 8(2), May 2013, Temple, Texas. Available
at http://www.veritasetvisus.com/3rd_dimension.htm
72
214. H. Veron, D. A. Southard, J. R. Leger, J. L. Conway (1990) “Stereoscopic Displays for
Terrain Database Visualization” in Proc. SPIE Stereoscopic Displays and
Applications, 1256, 124‐135.
215. R. E. Walpole, R. H.Myers (1985) "Probability and Statistics for Engineers and
Scientists" Collier Macmillan, pp. 347.
216. V. Walworth, S. Bennett, and G. Trapani (1984), “Three‐dimensional projection
with circular polarizers” in Optics in Entertainment II, Proceedings of SPIE, 0462,
64‐68.
217. V. K. Walworth “Light polarization in support of stereoscopic display” Optical
Engineering 51(2), 021104 (February 2012)
218. B. A. Wandell, L. D. Silverstein (2003) “Digital color reproduction” in The Science of
Color, Elsevier, pp. 296.
219. L. Wang, Y. Tu, L. Chen, P. Zhang, T. Zhang, K. Teunissen, and I. Heynderickx (2012)
“Effect of Display Technology on the Crosstalk Perception in Stereoscopic Video
Content,” IEEE Transactions on Circuits and Systems for Video Technology, 22(9),
1257‐1265.
220. A. F. Watch (1895) “The Anaglyph: A New Method Of Producing The Stereoscopic
Effect,” Journal of the Franklin Institute, CXL(6), pp. 401‐405, December.
221. M. A. Weissman (2007) “A simple measurement of extinction ratio” presented at
Stereoscopic Displays and Applications XVIII, San Jose.
222. M. A. Weissman, A. J. Woods (2011) “A simple method for measuring crosstalk in
stereoscopic displays” in Stereoscopic Displays and Applications XXII, Proceedings
of IS&T/SPIE Electronic Imaging, SPIE Vol. 7863, pp. 786310‐1 to ‐11, Burlingame,
California, January 2011.
223. C. Wheatstone (1838) “Contributions to the Physiology of Vision.—Part the First.
On some remarkable, and hitherto unobserved, Phenomena of Binocular Vision” in
Philosophical Transactions of the Royal Society of London, Vol. 128, pp. 371 – 394.
224. D. Wickens, A. Kramer, J. Andersen, A. Glasser, K. Sarno (1990) “Focused and
divided attention in stereoscopic depth” in Stereoscopic Displays and Applications,
Proceedings of SPIE‐IS&T Electronic Imaging, 1256, 28‐34.
225. L. M. Wilcox, J. A. D. Stewart (2003) “Determinants of perceived image quality:
Ghosting vs. brightness” in Stereoscopic Displays and Virtual Reality Systems X,
Proc. of SPIE‐IS&T Electronic Imaging, 5006, 263‐268.
226. P. Wimmer (undated) “Anaglyph Methods Comparison” [online] URL:
http://www.3dtv.at/knowhow/anaglyphcomparison_en.aspx Accessed: 6 Mar
2013.

73
227. A .J. Woods, K.‐L. Yuen, K.S. Karvinen (2007) “Characterizing crosstalk in anaglyphic
stereoscopic images on LCD monitors and plasma displays,” Journal of the SID,
15(11), 889‐898.
228. W. Woo, N. Kim, Y. Iwadate (2000) “Stereo imaging using a camera with
stereoscopic adapter,” Proc. IEEE ‐ Systems, Man, and Cybernetics (SMC) 2000,
1512‐1517.
229. G. J. Woodgate, J. Harrold, A. M. S. Jacobs, R. R. Moseley, and D. Ezra (2000) “Flat
panel autostereoscopic displays – characterisation and enhancement” in
Stereoscopic Displays and Virtual Reality Systems VII, Proceedings of SPIE‐IS&T
Electronic Imaging, 3957, 153‐164.
230. A. J. Woods, T. Docherty, and R. Koch (1991) "The Use of Flicker‐Free Television
Products for Stereoscopic Display Applications" Stereoscopic Displays and
Applications II, Proceedings of SPIE Vol. 1457, San Jose, California, February 1991.
www.curtin.edu.au/cmst/publicat/1991‐18.pdf
231. A. J. Woods, S. Tan (2002) “Characterising Sources of Ghosting in Time‐
Sequential Stereoscopic Video Displays” presented at Stereoscopic Displays and
Applications XIII (SD&A), published in Stereoscopic Displays and Virtual Reality
Systems IX, Proceedings of IS&T/SPIE Electronic Imaging, SPIE Vol. 4660, pp. 66‐77,
San Jose, California, January 2002.
232. A. J. Woods, T. Rourke (2004) “Ghosting in Anaglyphic Stereoscopic Images”
presented at Stereoscopic Displays and Applications XV (SD&A), published in
Stereoscopic Displays and Virtual Reality Systems XI, Proceedings of IS&T/SPIE
Electronic Imaging, SPIE Vol. 5291, pp. 354‐365, San Jose, California, January 2004.
233. A. J. Woods (2005) “Compatibility of Display Products with Stereoscopic Display
Methods” International Display Manufacturing Conference (IDMC), pp. 290‐293,
Taiwan, February 2005. [included in Appendix 1 of this thesis as Paper 11]
234. A. J. Woods, K. L. Yuen (2006) "Compatibility of LCD Monitors with Frame‐
Sequential Stereoscopic 3D Visualisation" (Invited Paper), in IMID/IDMC '06 Digest,
(The 6th International Meeting on Information Display, and The 5th International
Display Manufacturing Conference), pp. 98‐102, Daegu, South Korea, 22‐25 August
2006.
235. A. J. Woods, T. Rourke, K.‐L. Yuen (2006) "The Compatibility of Consumer Displays
with Time‐Sequential Stereoscopic 3D Visualisation" (Invited Plenary Paper), in
Proceedings of the K‐IDS Three‐Dimensional Display Workshop 2006, pp. 7‐10,
Seoul National University, Seoul, South Korea, 21 August 2006.
74
236. A. J. Woods, K. L. Yuen, K. S. Karvinen, (2007) “Characterizing crosstalk in
anaglyphic stereoscopic images on LCD monitors and plasma displays” in Journal of
the Society for Information Display, Volume 15, Issue 11, pp. 889‐898, November
2007.
237. A. J. Woods, T. Rourke (2007) “The compatibility of consumer DLP projectors with
time‐sequential stereoscopic 3D visualization”, presented at Stereoscopic Displays
and Applications XVIII, published in Stereoscopic Displays and Virtual Reality
Systems XIV, Proceedings of IS&T/SPIE Electronic Imaging, SPIE Vol. 6490, pp.
64900V‐1 to ‐7, San Jose, California, January 2007.
238. A. J. Woods, K. L. Yuen, K. S. Karvinen (2007) “Characterizing crosstalk in anaglyphic
stereoscopic images on LCD monitors and plasma displays” in JSID, 15(11), pp. 889‐
898.
239. A. J. Woods, K. S. Karvinen (2008) "The compatibility of consumer plasma
displays with time‐sequential stereoscopic 3D visualization" Stereoscopic Displays
and Applications XIX, Proceedings of IS&T/SPIE Electronic Imaging, SPIE Vol. 6803,
pp. 68030X‐1 to ‐9, San Jose, California, January 2008.
240. A. J. Woods (2009) “3‐D Displays in the Home,” Information Display, 25(07), 8‐12.
241. A. J. Woods, A. Sehic (2009) “The compatibility of LCD TVs with time‐sequential
stereoscopic 3D visualization” in Stereoscopic Displays and Applications XX,
Proceedings of IS&T/SPIE Electronic Imaging, SPIE Vol. 7237, pp. 72370N‐1 to ‐9,
San Jose, California, January 2009.
242. A. J. Woods, C. R. Harris (2010) “Comparing levels of crosstalk with red/cyan,
blue/yellow, and green/magenta anaglyph 3D glasses” in Stereoscopic Displays and
Applications XXI, Proceedings of IS&T/SPIE Electronic Imaging, SPIE Vol. 7253, pp.
75240Q‐1 to ‐12, San Jose, California, January 2010.
243. A. J. Woods (2010) “Understanding Crosstalk in Stereoscopic Displays” (Keynote
Presentation) at 3DSA (Three‐Dimensional Systems and Applications) conference,
Tokyo, Japan, 19‐21 May 2010.
244. A. J. Woods, J. O. Merritt, S. S. Fisher, M. T. Bolas, S. A. Benton, N. S. Holliman, N. A.
Dodgson, I. E. McDowall, M. Dolinsky, eds. (2010) “Stereoscopic Displays and
Applications 1990‐2009: A Complete 20‐Year Retrospective and The Engineering
Reality of Virtual Reality 1994‐2009 (Special Collection)” (DVD‐ROM), SPIE, 51.
ISBN 987‐0‐8194‐7659‐3.
245. A. J. Woods (2011) “How are crosstalk and ghosting defined in the stereoscopic
literature?” in Stereoscopic Displays and Applications XXII, Proceedings of
IS&T/SPIE Electronic Imaging, SPIE Vol. 7863, pp. 78630Z‐1 to ‐12, Burlingame,
California, January 2011.
75
246. A. J. Woods, J. Helliwell (2011) “White Paper: A Survey of 3D Sync IR Protocols”,
Curtin University, March 2011.
http://www.cmst.curtin.edu.au/local/docs/pubs/2011‐17‐woods‐helliwell‐3D‐
Sync‐IR.pdf
247. A. J. Woods (2012) “Crosstalk in stereoscopic displays: a review” Journal of
Electronic Imaging 21(4), 040902 (Oct–Dec 2012)
248. A. J. Woods, J. Helliwell (2012) “Investigating the cross‐compatibility of IR‐
controlled active shutter glasses” in Stereoscopic Displays and Applications XXIII,
Proceedings of IS&T/SPIE Electronic Imaging, SPIE Vol. 8288, pp. 82881C‐1 to ‐10,
Burlingame, California, January 2012.
249. A. J. Woods (2012) “The Illustrated 3D Compatible Projectors List”, URL:
http://www.3dmovielist.com/projectors.html , dated: 6 Feb 2012, accessed: 19
June 2013.
250. A. J. Woods (2012) “The Illustrated 3D HDTV List”, URL:
http://www.3dmovielist.com/3dhdtvs.html dated: 24 May 2012, accessed: 19
June 2013.
251. A. J. Woods (2012) “The Illustrated 3D Monitor List”, URL:
http://www.3dmovielist.com/3dmonitors.html , dated: 13 May 2012, accessed: 19
June 2013.
252. A. J. Woods (2013) “The Illustrated 3D Movie List” [online] May 2013. URL:
http://www.3dmovielist.com Accessed 18 May 2013.
253. A. J. Woods, C. R. Harris (2012) “Using cross‐talk simulation to predict the
performance of anaglyph 3‐D glasses” in JSID (Journal of the Society for
Information Display), Vol. 20, No. 6, pp. 304‐315.
254. A. J. Woods (2013) “3D or 3‐D: A study of terminology, usage and style”, European
Science Editing, 39(3), pp. 59‐62, August 2013.
255. A. J. Woods, C. R. Harris, Dean B. Leggo, Tegan M. Rourke (2013) “Characterizing
and Reducing Crosstalk in Printed Anaglyph Stereoscopic 3D Images” in (Journal of)
Optical Engineering, SPIE, Vol. 52, No. 4, pp. 043203‐1 to 043203‐19, April 2013.
256. A. J. Woods (undated) “Proposed Standard for Field‐Sequential 3D Television”
[online] www.stereoscopic.org/standards
257. Z. Xie, T. G. Stockham Jr. (1989) “Toward the unification of three visual laws and
two visual models in brightness perception” IEEE Transactions on Systems, Man
and Cybernetics, 19(2), pp. 379 ‐ 387.
258. Yahoo (2010) "The Yahoo! Style Guide" New York, Yahoo! Inc, pp. 483. ISBN 978‐
0312569846.
76
259. Y.‐Y. Yeh, L. D. Silverstein (1989) “Using electronic stereoscopic color displays:
Limits of fusion and depth discrimination” in Proc. SPIE Three‐Dimensional
Visualization and Display Technologies, ed. S S Fisher, W E Robbins, 1083, 196‐204.
260. Y.‐Y. Yeh, L. D. Silverstein (1990) “Limits of fusion and depth judgment in
stereoscopic color displays” Human Factors, 32, 45‐60.
261. Y. Yoshihara (2003) “3D‐LCD用マイクロポールについて” (“About Micro‐Pol for
3D LCD”), 3D Consortium, June 2003. (presentation only)
262. K. L. Yuen (2006) "Compatibility of LCD Monitors with Stereoscopic Display
Methods", Technical Report CMST 2006‐34, Curtin University of Technology.
263. R. Z. Zeng, H. Z. Zeng (2011) “Printing Anaglyph Maps Optimized for Display” in
Color Imaging XVI: Displaying, Processing, Hardcopy, and Applications, Proc. of
Electronic Imaging, SPIE Vol. 7866, pp. 78661S‐1‐5.
264. R. Zone (2002) “Good old fashion anaglyph: High tech tools revive a classic format
in spy kids 3‐D,” Stereo World 29, No. 5, 11–13 and 46 (2002–2003).
265. R. Zone (2012) personal communication, July 2012.
266. The Macquarie Encyclopedic Dictionary, Macquarie University, Australia (1990).
267. The Full HD 3D Glasses Initiative. Online: http://www.fullhd3dglasses.com/
Accessed: 16 December 2011.
268. "Louis Ducos du Hauron" Encyclopædia Britannica, Encyclopædia Britannica Online,
Encyclopædia Britannica Inc. (2012). Accessed: 22 Jul 2012 URL:
<http://www.britannica.com/EBchecked/topic/172961/Louis‐Ducos‐du‐Hauron>
269. NVIDIA 3D Stereo Driver http://www.nvidia.com/object/3d_stereo.html
270. Powerstrip software http://entechtaiwan.net/util/ps.shtm
271. Wikipedia, http://en.wikipedia.org/wiki/SRGB_color_space
272. Stereoscopic Player software http://www.3dtv.at/Products/Player/Index_en.aspx
273. www.matlab.com
274. unknown author (2007) “Philips ditches Aptura backlight tech for LED” PC PRO, 13
March 2007, http://www.pcpro.co.uk/news/107108/philips‐ditches‐aptura‐
backlight‐tech‐for‐led.html
275. unknown author (2009) “NNVIDIA Geforce 3D Vision Review” OverClockersClub, 7
January 2009, http://www.overclockersclub.com/reviews/nvidia_3d_vision/
276. unknown author (undated) “How to make 3D glasses” [online] URL:
http://www.ehow.com/how_4455680_make‐3d‐glasses.html Accessed: 26 August
2011.
277. unknown author (undated) “How to make a pair of 3D glasses for 3D Anaglyphs”
[online] URL: http://www.haworth‐village.org.uk/3d/3d‐glasses.asp Accessed: 26
August 2011.
77
278. unknown author (undated) “Make your own 3‐D glasses” [online]. URL:
http://paperproject.org/3dglasses.html Accessed: 26 August 2011.
279. unknown author (undated) “How to make your own 3D glasses” Wikihow [online]
URL: http://www.wikihow.com/Make‐Your‐Own‐3D‐Glasses Accessed: 6 July
2011.
280. unknown author (undated) “Make 3‐D glasses” Wired How‐to Wiki [online] URL:
http://howto.wired.com/wiki/Make_3‐D_Glasses Accessed: 6 July 2011.
281. unknown author (undated) “The plasma behind the plasma TV screen” [online]
http://www.plasmatvscience.org/theinnerworkings.html Accessed: 28 November
2006

78
9. Published Papers “An original reprint of each paper must be bound directly into the thesis, or photocopied on A4 size paper. Papers should be separated by a sheet of coloured paper on which is stated the full bibliographic citation of the publication.” Refereed Journal Articles
Paper 1 A. J. Woods (2012) “Crosstalk in Stereoscopic Displays: a review” in Journal of
Electronic Imaging, IS&T/SPIE, Vol. 21, No. 4, pp. 040902‐1 to 040902‐21 (December 2012).
Paper 2 A. J. Woods, K. L. Yuen, and K. S. Karvinen (2007) “Characterizing crosstalk in
anaglyphic stereoscopic images on LCD monitors and plasma displays” in Journal of the Society for Information Display, Volume 15, Issue 11, pp. 889‐898, November 2007.
Paper 3 A. J. Woods, C. R. Harris (2012) “Using cross‐talk simulation to predict the performance of anaglyph 3‐D glasses” in Journal of the Society for Information Display, Vol. 20, No. 6, pp. 304‐315.
Paper 4 A. J. Woods, C. R. Harris, D. B. Leggo, T. M. Rourke (2013) “Characterizing and Reducing Crosstalk in Printed Anaglyph Stereoscopic 3D Images” in (Journal of) Optical Engineering, SPIE, Vol. 52, No. 4, pp. 043203‐1 to 043203‐19, April 2013.
Refereed Conference Papers
Paper 5 A. J. Woods, K. L. Yuen (2006) "Compatibility of LCD Monitors with Frame‐Sequential Stereoscopic 3D Visualisation" (Invited Paper), in IMID/IDMC '06 Digest, (The 6th International Meeting on Information Display, and The 5th International Display Manufacturing Conference), pp. 98‐102, Daegu, South Korea, 22‐25 August 2006.
Paper 6 A. J. Woods, K. S. Karvinen (2008) "The compatibility of consumer plasma displays with time‐sequential stereoscopic 3D visualization" in Stereoscopic Displays and Applications XIX, Proceedings of IS&T/SPIE Electronic Imaging, SPIE Vol. 6803, pp. 68030X‐1 to ‐9, San Jose, California, January 2008.
Paper 7 A. J. Woods, A. Sehic (2009) “The compatibility of LCD TVs with time‐sequential stereoscopic 3D visualization” in Stereoscopic Displays and Applications XX, Proceedings of IS&T/SPIE Electronic Imaging, SPIE Vol. 7237, pp. 72370N‐1 to ‐9, San Jose, California, January 2009.
Paper 8 A. J. Woods, C. R. Harris (2010) “Comparing levels of crosstalk with red/cyan, blue/yellow, and green/magenta anaglyph 3D glasses” in Stereoscopic Displays and Applications XXI, Proceedings of IS&T/SPIE Electronic Imaging, SPIE Vol. 7253, pp. 75240Q‐1 to ‐12, San Jose, California, January 2010.

Paper 1 [Refereed Journal Article]
A. J. Woods (2012) “Crosstalk in Stereoscopic Displays: a review” in Journal of Electronic Imaging, IS&T/SPIE, Vol. 21, No. 4, pp. 040902‐1 to 040902‐21 (December 2012).
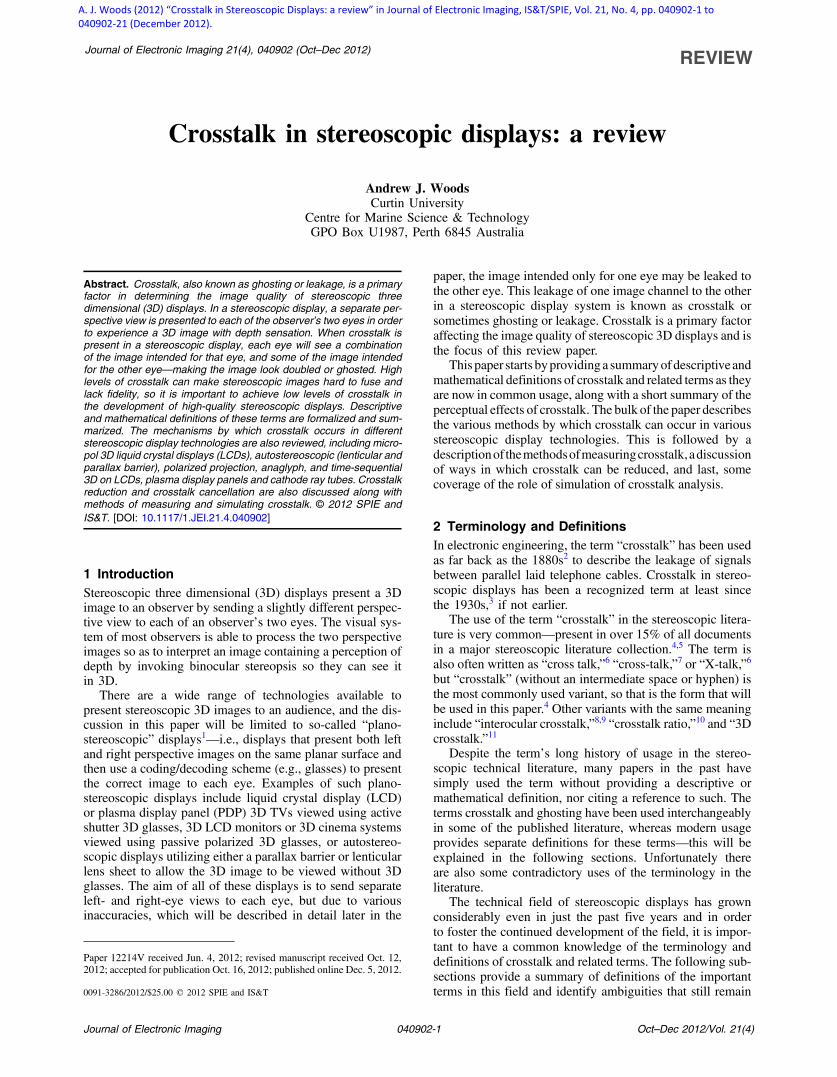
Crosstalk in stereoscopic displays: a review
Andrew J. WoodsCurtin University
Centre for Marine Science & TechnologyGPO Box U1987, Perth 6845 Australia
Abstract. Crosstalk, also known as ghosting or leakage, is a primaryfactor in determining the image quality of stereoscopic threedimensional (3D) displays. In a stereoscopic display, a separate per-spective view is presented to each of the observer’s two eyes in orderto experience a 3D image with depth sensation. When crosstalk ispresent in a stereoscopic display, each eye will see a combinationof the image intended for that eye, and some of the image intendedfor the other eye—making the image look doubled or ghosted. Highlevels of crosstalk can make stereoscopic images hard to fuse andlack fidelity, so it is important to achieve low levels of crosstalk inthe development of high-quality stereoscopic displays. Descriptiveand mathematical definitions of these terms are formalized and sum-marized. The mechanisms by which crosstalk occurs in differentstereoscopic display technologies are also reviewed, including micro-pol 3D liquid crystal displays (LCDs), autostereoscopic (lenticular andparallax barrier), polarized projection, anaglyph, and time-sequential3D on LCDs, plasma display panels and cathode ray tubes. Crosstalkreduction and crosstalk cancellation are also discussed along withmethods of measuring and simulating crosstalk. © 2012 SPIE andIS&T. [DOI: 10.1117/1.JEI.21.4.040902]
1 IntroductionStereoscopic three dimensional (3D) displays present a 3Dimage to an observer by sending a slightly different perspec-tive view to each of an observer’s two eyes. The visual sys-tem of most observers is able to process the two perspectiveimages so as to interpret an image containing a perception ofdepth by invoking binocular stereopsis so they can see itin 3D.
There are a wide range of technologies available topresent stereoscopic 3D images to an audience, and the dis-cussion in this paper will be limited to so-called “plano-stereoscopic” displays1—i.e., displays that present both leftand right perspective images on the same planar surface andthen use a coding/decoding scheme (e.g., glasses) to presentthe correct image to each eye. Examples of such plano-stereoscopic displays include liquid crystal display (LCD)or plasma display panel (PDP) 3D TVs viewed using activeshutter 3D glasses, 3D LCD monitors or 3D cinema systemsviewed using passive polarized 3D glasses, or autostereo-scopic displays utilizing either a parallax barrier or lenticularlens sheet to allow the 3D image to be viewed without 3Dglasses. The aim of all of these displays is to send separateleft- and right-eye views to each eye, but due to variousinaccuracies, which will be described in detail later in the
paper, the image intended only for one eye may be leaked tothe other eye. This leakage of one image channel to the otherin a stereoscopic display system is known as crosstalk orsometimes ghosting or leakage. Crosstalk is a primary factoraffecting the image quality of stereoscopic 3D displays and isthe focus of this review paper.
This paper starts byprovidinga summaryofdescriptiveandmathematical definitions of crosstalk and related terms as theyare now in common usage, along with a short summary of theperceptual effects of crosstalk. The bulk of the paper describesthe various methods by which crosstalk can occur in variousstereoscopic display technologies. This is followed by adescriptionof themethodsofmeasuringcrosstalk,adiscussionof ways in which crosstalk can be reduced, and last, somecoverage of the role of simulation of crosstalk analysis.
2 Terminology and DefinitionsIn electronic engineering, the term “crosstalk” has been usedas far back as the 1880s2 to describe the leakage of signalsbetween parallel laid telephone cables. Crosstalk in stereo-scopic displays has been a recognized term at least sincethe 1930s,3 if not earlier.
The use of the term “crosstalk” in the stereoscopic litera-ture is very common—present in over 15% of all documentsin a major stereoscopic literature collection.4,5 The term isalso often written as “cross talk,”6 “cross-talk,”7 or “X-talk,”6
but “crosstalk” (without an intermediate space or hyphen) isthe most commonly used variant, so that is the form that willbe used in this paper.4 Other variants with the same meaninginclude “interocular crosstalk,”8,9 “crosstalk ratio,”10 and “3Dcrosstalk.”11
Despite the term’s long history of usage in the stereo-scopic technical literature, many papers in the past havesimply used the term without providing a descriptive ormathematical definition, nor citing a reference to such. Theterms crosstalk and ghosting have been used interchangeablyin some of the published literature, whereas modern usageprovides separate definitions for these terms—this will beexplained in the following sections. Unfortunately thereare also some contradictory uses of the terminology in theliterature.
The technical field of stereoscopic displays has grownconsiderably even in just the past five years and in orderto foster the continued development of the field, it is impor-tant to have a common knowledge of the terminology anddefinitions of crosstalk and related terms. The following sub-sections provide a summary of definitions of the importantterms in this field and identify ambiguities that still remain
Paper 12214V received Jun. 4, 2012; revised manuscript received Oct. 12,2012; accepted for publication Oct. 16, 2012; published online Dec. 5, 2012.
0091-3286/2012/$25.00 © 2012 SPIE and IS&T
Journal of Electronic Imaging 040902-1 Oct–Dec 2012/Vol. 21(4)
Journal of Electronic Imaging 21(4), 040902 (Oct–Dec 2012) REVIEW
A. J. Woods (2012) “Crosstalk in Stereoscopic Displays: a review” in Journal of Electronic Imaging, IS&T/SPIE, Vol. 21, No. 4, pp. 040902‐1 to 040902‐21 (December 2012).
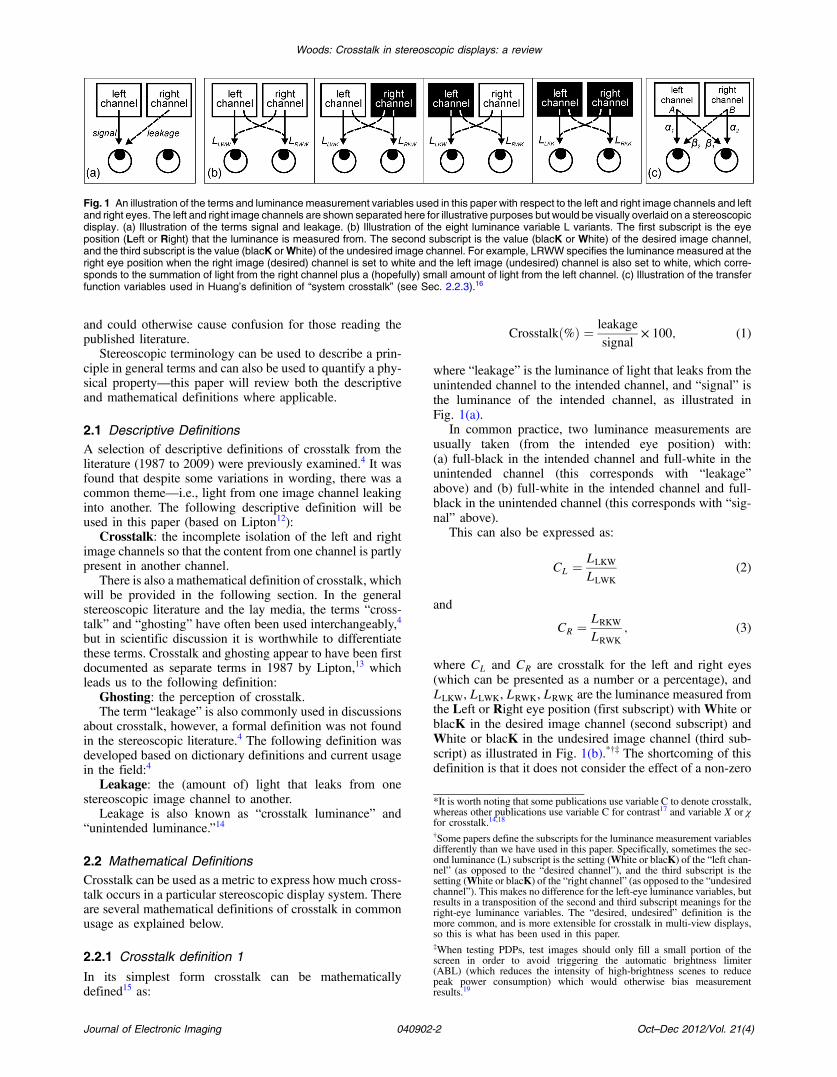
and could otherwise cause confusion for those reading thepublished literature.
Stereoscopic terminology can be used to describe a prin-ciple in general terms and can also be used to quantify a phy-sical property—this paper will review both the descriptiveand mathematical definitions where applicable.
2.1 Descriptive DefinitionsA selection of descriptive definitions of crosstalk from theliterature (1987 to 2009) were previously examined.4 It wasfound that despite some variations in wording, there was acommon theme—i.e., light from one image channel leakinginto another. The following descriptive definition will beused in this paper (based on Lipton12):
Crosstalk: the incomplete isolation of the left and rightimage channels so that the content from one channel is partlypresent in another channel.
There is also a mathematical definition of crosstalk, whichwill be provided in the following section. In the generalstereoscopic literature and the lay media, the terms “cross-talk” and “ghosting” have often been used interchangeably,4
but in scientific discussion it is worthwhile to differentiatethese terms. Crosstalk and ghosting appear to have been firstdocumented as separate terms in 1987 by Lipton,13 whichleads us to the following definition:
Ghosting: the perception of crosstalk.The term “leakage” is also commonly used in discussions
about crosstalk, however, a formal definition was not foundin the stereoscopic literature.4 The following definition wasdeveloped based on dictionary definitions and current usagein the field:4
Leakage: the (amount of) light that leaks from onestereoscopic image channel to another.
Leakage is also known as “crosstalk luminance” and“unintended luminance.”14
2.2 Mathematical DefinitionsCrosstalk can be used as a metric to express how much cross-talk occurs in a particular stereoscopic display system. Thereare several mathematical definitions of crosstalk in commonusage as explained below.
2.2.1 Crosstalk definition 1
In its simplest form crosstalk can be mathematicallydefined15 as:
Crosstalkð%Þ ¼ leakage
signal× 100; (1)
where “leakage” is the luminance of light that leaks from theunintended channel to the intended channel, and “signal” isthe luminance of the intended channel, as illustrated inFig. 1(a).
In common practice, two luminance measurements areusually taken (from the intended eye position) with:(a) full-black in the intended channel and full-white in theunintended channel (this corresponds with “leakage”above) and (b) full-white in the intended channel and full-black in the unintended channel (this corresponds with “sig-nal” above).
This can also be expressed as:
CL ¼ LLKW
LLWK
(2)
and
CR ¼ LRKW
LRWK
; (3)
where CL and CR are crosstalk for the left and right eyes(which can be presented as a number or a percentage), andLLKW, LLWK, LRWK, LRWK are the luminance measured fromthe Left or Right eye position (first subscript) with White orblacK in the desired image channel (second subscript) andWhite or blacK in the undesired image channel (third sub-script) as illustrated in Fig. 1(b).*†‡ The shortcoming of thisdefinition is that it does not consider the effect of a non-zero
Fig. 1 An illustration of the terms and luminance measurement variables used in this paper with respect to the left and right image channels and leftand right eyes. The left and right image channels are shown separated here for illustrative purposes but would be visually overlaid on a stereoscopicdisplay. (a) Illustration of the terms signal and leakage. (b) Illustration of the eight luminance variable L variants. The first subscript is the eyeposition (Left or Right) that the luminance is measured from. The second subscript is the value (blacK or White) of the desired image channel,and the third subscript is the value (blacK orWhite) of the undesired image channel. For example, LRWW specifies the luminance measured at theright eye position when the right image (desired) channel is set to white and the left image (undesired) channel is also set to white, which corre-sponds to the summation of light from the right channel plus a (hopefully) small amount of light from the left channel. (c) Illustration of the transferfunction variables used in Huang’s definition of “system crosstalk” (see Sec. 2.2.3).16
*It is worth noting that some publications use variable C to denote crosstalk,whereas other publications use variable C for contrast17 and variable X or χfor crosstalk.14,18
†Some papers define the subscripts for the luminance measurement variablesdifferently than we have used in this paper. Specifically, sometimes the sec-ond luminance (L) subscript is the setting (White or blacK) of the “left chan-nel” (as opposed to the “desired channel”), and the third subscript is thesetting (White or blacK) of the “right channel” (as opposed to the “undesiredchannel”). This makes no difference for the left-eye luminance variables, butresults in a transposition of the second and third subscript meanings for theright-eye luminance variables. The “desired, undesired” definition is themore common, and is more extensible for crosstalk in multi-view displays,so this is what has been used in this paper.‡When testing PDPs, test images should only fill a small portion of thescreen in order to avoid triggering the automatic brightness limiter(ABL) (which reduces the intensity of high-brightness scenes to reducepeak power consumption) which would otherwise bias measurementresults.19
Journal of Electronic Imaging 040902-2 Oct–Dec 2012/Vol. 21(4)
Woods: Crosstalk in stereoscopic displays: a review
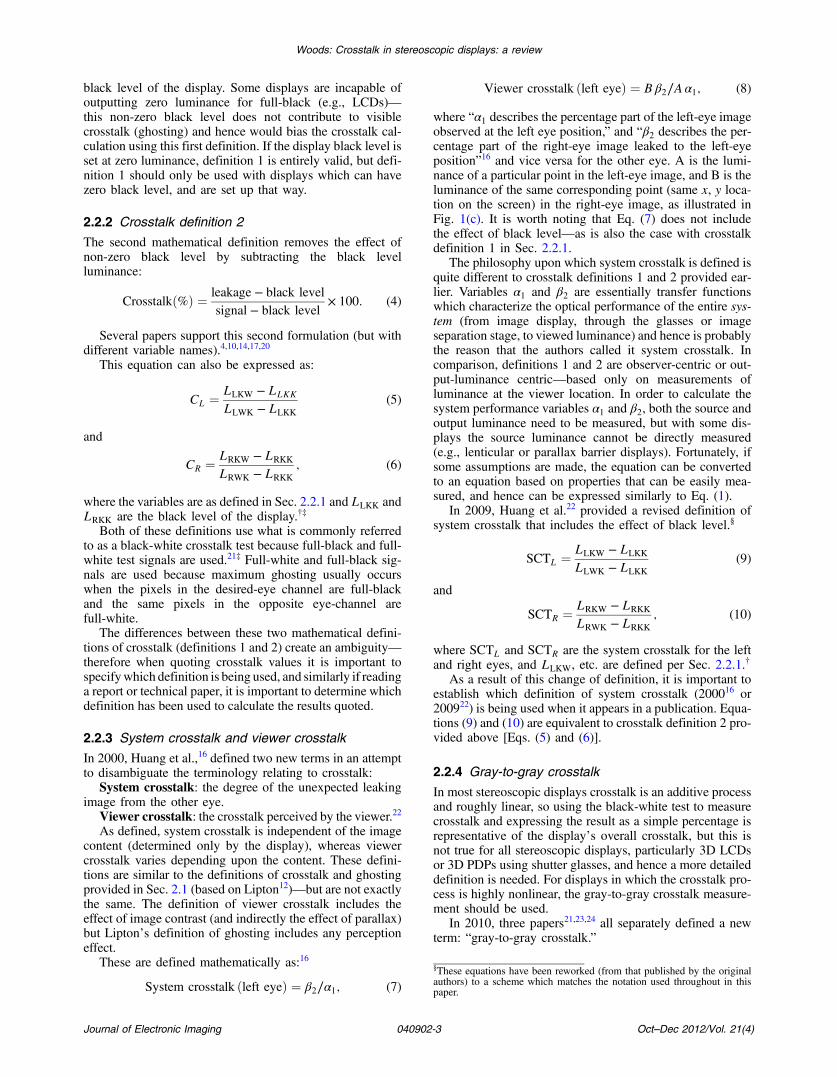
black level of the display. Some displays are incapable ofoutputting zero luminance for full-black (e.g., LCDs)—this non-zero black level does not contribute to visiblecrosstalk (ghosting) and hence would bias the crosstalk cal-culation using this first definition. If the display black level isset at zero luminance, definition 1 is entirely valid, but defi-nition 1 should only be used with displays which can havezero black level, and are set up that way.
2.2.2 Crosstalk definition 2
The second mathematical definition removes the effect ofnon-zero black level by subtracting the black levelluminance:
Crosstalkð%Þ ¼ leakage − black level
signal − black level× 100: (4)
Several papers support this second formulation (but withdifferent variable names).4,10,14,17,20
This equation can also be expressed as:
CL ¼ LLKW − LLKK
LLWK − LLKK
(5)
and
CR ¼ LRKW − LRKK
LRWK − LRKK
; (6)
where the variables are as defined in Sec. 2.2.1 and LLKK andLRKK are the black level of the display.†‡
Both of these definitions use what is commonly referredto as a black-white crosstalk test because full-black and full-white test signals are used.21‡ Full-white and full-black sig-nals are used because maximum ghosting usually occurswhen the pixels in the desired-eye channel are full-blackand the same pixels in the opposite eye-channel arefull-white.
The differences between these two mathematical defini-tions of crosstalk (definitions 1 and 2) create an ambiguity—therefore when quoting crosstalk values it is important tospecifywhich definition is being used, and similarly if readinga report or technical paper, it is important to determine whichdefinition has been used to calculate the results quoted.
2.2.3 System crosstalk and viewer crosstalk
In 2000, Huang et al.,16 defined two new terms in an attemptto disambiguate the terminology relating to crosstalk:
System crosstalk: the degree of the unexpected leakingimage from the other eye.
Viewer crosstalk: the crosstalk perceived by the viewer.22
As defined, system crosstalk is independent of the imagecontent (determined only by the display), whereas viewercrosstalk varies depending upon the content. These defini-tions are similar to the definitions of crosstalk and ghostingprovided in Sec. 2.1 (based on Lipton12)—but are not exactlythe same. The definition of viewer crosstalk includes theeffect of image contrast (and indirectly the effect of parallax)but Lipton’s definition of ghosting includes any perceptioneffect.
These are defined mathematically as:16
System crosstalk ðleft eyeÞ ¼ β2∕α1; (7)
Viewer crosstalk ðleft eyeÞ ¼ B β2∕A α1; (8)
where “α1 describes the percentage part of the left-eye imageobserved at the left eye position,” and “β2 describes the per-centage part of the right-eye image leaked to the left-eyeposition”16 and vice versa for the other eye. A is the lumi-nance of a particular point in the left-eye image, and B is theluminance of the same corresponding point (same x, y loca-tion on the screen) in the right-eye image, as illustrated inFig. 1(c). It is worth noting that Eq. (7) does not includethe effect of black level—as is also the case with crosstalkdefinition 1 in Sec. 2.2.1.
The philosophy upon which system crosstalk is defined isquite different to crosstalk definitions 1 and 2 provided ear-lier. Variables α1 and β2 are essentially transfer functionswhich characterize the optical performance of the entire sys-tem (from image display, through the glasses or imageseparation stage, to viewed luminance) and hence is probablythe reason that the authors called it system crosstalk. Incomparison, definitions 1 and 2 are observer-centric or out-put-luminance centric—based only on measurements ofluminance at the viewer location. In order to calculate thesystem performance variables α1 and β2, both the source andoutput luminance need to be measured, but with some dis-plays the source luminance cannot be directly measured(e.g., lenticular or parallax barrier displays). Fortunately, ifsome assumptions are made, the equation can be convertedto an equation based on properties that can be easily mea-sured, and hence can be expressed similarly to Eq. (1).
In 2009, Huang et al.22 provided a revised definition ofsystem crosstalk that includes the effect of black level.§
SCTL ¼ LLKW − LLKK
LLWK − LLKK
(9)
and
SCTR ¼ LRKW − LRKK
LRWK − LRKK
; (10)
where SCTL and SCTR are the system crosstalk for the leftand right eyes, and LLKW, etc. are defined per Sec. 2.2.1.†
As a result of this change of definition, it is important toestablish which definition of system crosstalk (200016 or200922) is being used when it appears in a publication. Equa-tions (9) and (10) are equivalent to crosstalk definition 2 pro-vided above [Eqs. (5) and (6)].
2.2.4 Gray-to-gray crosstalk
In most stereoscopic displays crosstalk is an additive processand roughly linear, so using the black-white test to measurecrosstalk and expressing the result as a simple percentage isrepresentative of the display’s overall crosstalk, but this isnot true for all stereoscopic displays, particularly 3D LCDsor 3D PDPs using shutter glasses, and hence a more detaileddefinition is needed. For displays in which the crosstalk pro-cess is highly nonlinear, the gray-to-gray crosstalk measure-ment should be used.
In 2010, three papers21,23,24 all separately defined a newterm: “gray-to-gray crosstalk.”
§These equations have been reworked (from that published by the originalauthors) to a scheme which matches the notation used throughout in thispaper.
Journal of Electronic Imaging 040902-3 Oct–Dec 2012/Vol. 21(4)
Woods: Crosstalk in stereoscopic displays: a review

Shestak et al.,21 provided the following definition.§
CLij ¼LLij − LLii
LLjj − LLii(11)
and
CRij ¼LRij − LRii
LRjj − LRii; (12)
where CLij is crosstalk for the Left eye (first subscript) cal-culated for the matrix of the desired image channel (secondsubscript) and the undesired image channel (third subscript)gray level combinations i and j,† LLij is the luminance mea-sured from the Left eye position (first subscript) with i graylevel in the desired image channel (second subscript) and igray level in the undesired image channel (third subscript),and so on.
Jung,23 Pan,24 ICDM,14 and Chen25 have also provideddefinitions for gray-to-gray crosstalk which vary from thatof Shestak,21 so again, it is important to know which defini-tion is used when gray-to-gray crosstalk values are pub-lished. Apart from variable notation differences, the maindifference between definitions of gray-to-gray crosstalk isthe choice of variables on the denominator and the use ofabsolute values. It would be useful to see a comparisonbetween these definitions to know the pros and cons ofeach and help decide on the most useful definition—likeJärvenpää et al., have done for autostereoscopic crosstalkdefinitions.26
There are some difficulties of these gray-to-gray crosstalkdefinitions—first, a singularity is present when i ¼ j withsome definitions, and secondly, the crosstalk values are notperceptually relevant. Teunissen et al.,27 and Shestak et al.,28
have described an extension of this work to provide a percep-tually relevant measure of the visibility of crosstalk (ghosting)in relation to the gray-to-gray crosstalk measurement.
2.2.5 Multi-view autostereoscopic (inter-view)crosstalk
The crosstalk definitions described so far only apply to two-view stereoscopic displays, but the definition can beextended to apply to multiview autostereoscopic displays,where it can also be called inter-view, adjacent-view orinter-zone crosstalk.
Järvenpää et al.18,29 have provided the following defini-tion of crosstalk for multi-view autostereoscopic displays.§
CiðθÞ ¼P
# of viewsj¼1 ½LjðθÞ − LKðθÞ� − ½LiðθÞ − LKðθÞ�
LiðθÞ − LKðθÞ;
(13)
where CiðθÞ is the calculated crosstalk curve for each view ias a function of the horizontal viewing angle θ, LjðθÞ is themeasured luminance curve for view j when that view iswhite and the other views are black, LiðθÞ is the measuredluminance curve for view i (the view for which the crosstalkis being determined) when that view is white and the otherviews are black, and LKðθÞ is the measured luminance curvewhen all display pixels (all views) are black.
Crosstalk can also vary with pixel position on the screenand vertical viewing angle of the observer, and the crosstalk
equation can be extended to include these variables ifneeded.18
The above definition applies only to autostereoscopic dis-plays with discrete views—a different formula would beneeded for autostereoscopic displays with continuousviews.18
2.2.6 Extinction and 3D contrast
Two other related terms are:
Extinction and extinction ratio: “The ratio of the lumi-nance of the correct eye [view] to the luminance of theunwanted ‘ghost’ from the image intended for theopposite eye”9—usually expressed as a ratio, forexample ‘50∶1.’
3D contrast: Unfortunately multiple definitions exist.Boher17 and ISO18 define 3D contrast as the inverseof (black-white) 3D crosstalk (definition 2 above).ISO18 also defines 3D contrast for multi-view autoster-eoscopic displays as the inverse of multi-view autoster-eoscopic crosstalk [Eq. (13) above]. However, ICDM14
defines 3D contrast as the arithmetic mean of the two(left and right) monocular contrasts, where monocularcontrast is defined as the luminance ratio of both chan-nels’white level to both channels’ black level. ICDM14
defines system contrast as LLWK∕LLKW (the inverse ofcrosstalk definition 1 above).
3 Perception of CrosstalkThe perception of crosstalk in stereoscopic displays has beenstudied widely.10,22,30–34 It is broadly acknowledged that thepresence of high levels of crosstalk in a stereoscopic displayis detrimental. Wilcox and Stewart35 reported that crosstalkwas the most important attribute in determining image qual-ity for 75% of their observers. The effects of crosstalk in astereoscopic image include ghosting and loss of contrast, lossof 3D effect and depth resolution, viewer discomfort,36
reduced limits of fusion, reduced image quality and reducedvisual comfort,9 and reduced perceived magnitude of depth.37
The perception of crosstalk (ghosting) increases withincreasing image contrast and increasing binocular parallaxof the image.21,30,33 This principle is illustrated in Fig. 2which summarizes an experiment performed by Pastoor.30
One example of this principle is that a stereoscopic imagewith high contrast (lots of bright whites against a deepblack background—e.g., a star field image) will exhibitmore ghosting on a particular stereoscopic display thanwill an image with low contrast. Other image content aspectsthat can also affect perception of crosstalk include focus andmotion blur (blur can disguise crosstalk)38 and the extent ofobjects (crosstalk is more visible on thin objects).39
The stereoscopic literature provides various advice on theamounts of crosstalk that are acceptable and unacceptable.Some examples include:
• “Difference [change] in crosstalk between [from] 2%and [to] 6% significantly affected image quality andvisual comfort” (Ref. 40 paraphrasing Ref. 9)
• “In order to reproduce a reasonable depth range (up to40 minarc) on a high-contrast display (100∶1), cross-talk should be as low as 0.3%”30
Journal of Electronic Imaging 040902-4 Oct–Dec 2012/Vol. 21(4)
Woods: Crosstalk in stereoscopic displays: a review
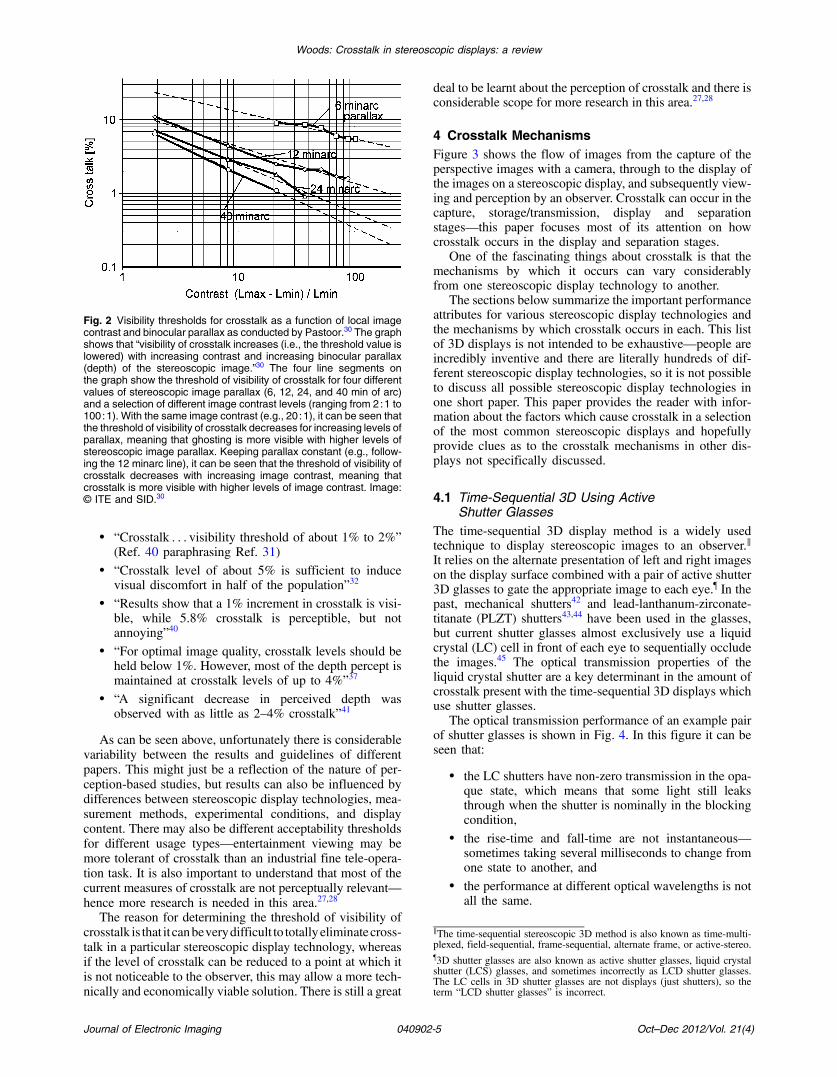
• “Crosstalk : : : visibility threshold of about 1% to 2%”(Ref. 40 paraphrasing Ref. 31)
• “Crosstalk level of about 5% is sufficient to inducevisual discomfort in half of the population”32
• “Results show that a 1% increment in crosstalk is visi-ble, while 5.8% crosstalk is perceptible, but notannoying”40
• “For optimal image quality, crosstalk levels should beheld below 1%. However, most of the depth percept ismaintained at crosstalk levels of up to 4%”37
• “A significant decrease in perceived depth wasobserved with as little as 2–4% crosstalk”41
As can be seen above, unfortunately there is considerablevariability between the results and guidelines of differentpapers. This might just be a reflection of the nature of per-ception-based studies, but results can also be influenced bydifferences between stereoscopic display technologies, mea-surement methods, experimental conditions, and displaycontent. There may also be different acceptability thresholdsfor different usage types—entertainment viewing may bemore tolerant of crosstalk than an industrial fine tele-opera-tion task. It is also important to understand that most of thecurrent measures of crosstalk are not perceptually relevant—hence more research is needed in this area.27,28
The reason for determining the threshold of visibility ofcrosstalk is that it canbeverydifficult to totallyeliminatecross-talk in a particular stereoscopic display technology, whereasif the level of crosstalk can be reduced to a point at which itis not noticeable to the observer, this may allow a more tech-nically and economically viable solution. There is still a great
deal to be learnt about the perception of crosstalk and there isconsiderable scope for more research in this area.27,28
4 Crosstalk MechanismsFigure 3 shows the flow of images from the capture of theperspective images with a camera, through to the display ofthe images on a stereoscopic display, and subsequently view-ing and perception by an observer. Crosstalk can occur in thecapture, storage/transmission, display and separationstages—this paper focuses most of its attention on howcrosstalk occurs in the display and separation stages.
One of the fascinating things about crosstalk is that themechanisms by which it occurs can vary considerablyfrom one stereoscopic display technology to another.
The sections below summarize the important performanceattributes for various stereoscopic display technologies andthe mechanisms by which crosstalk occurs in each. This listof 3D displays is not intended to be exhaustive—people areincredibly inventive and there are literally hundreds of dif-ferent stereoscopic display technologies, so it is not possibleto discuss all possible stereoscopic display technologies inone short paper. This paper provides the reader with infor-mation about the factors which cause crosstalk in a selectionof the most common stereoscopic displays and hopefullyprovide clues as to the crosstalk mechanisms in other dis-plays not specifically discussed.
4.1 Time-Sequential 3D Using ActiveShutter Glasses
The time-sequential 3D display method is a widely usedtechnique to display stereoscopic images to an observer.∥
It relies on the alternate presentation of left and right imageson the display surface combined with a pair of active shutter3D glasses to gate the appropriate image to each eye.¶ In thepast, mechanical shutters42 and lead-lanthanum-zirconate-titanate (PLZT) shutters43,44 have been used in the glasses,but current shutter glasses almost exclusively use a liquidcrystal (LC) cell in front of each eye to sequentially occludethe images.45 The optical transmission properties of theliquid crystal shutter are a key determinant in the amount ofcrosstalk present with the time-sequential 3D displays whichuse shutter glasses.
The optical transmission performance of an example pairof shutter glasses is shown in Fig. 4. In this figure it can beseen that:
• the LC shutters have non-zero transmission in the opa-que state, which means that some light still leaksthrough when the shutter is nominally in the blockingcondition,
• the rise-time and fall-time are not instantaneous—sometimes taking several milliseconds to change fromone state to another, and
• the performance at different optical wavelengths is notall the same.
Fig. 2 Visibility thresholds for crosstalk as a function of local imagecontrast and binocular parallax as conducted by Pastoor.30 The graphshows that “visibility of crosstalk increases (i.e., the threshold value islowered) with increasing contrast and increasing binocular parallax(depth) of the stereoscopic image.”30 The four line segments onthe graph show the threshold of visibility of crosstalk for four differentvalues of stereoscopic image parallax (6, 12, 24, and 40 min of arc)and a selection of different image contrast levels (ranging from 2∶1 to100∶1). With the same image contrast (e.g., 20∶1), it can be seen thatthe threshold of visibility of crosstalk decreases for increasing levels ofparallax, meaning that ghosting is more visible with higher levels ofstereoscopic image parallax. Keeping parallax constant (e.g., follow-ing the 12 minarc line), it can be seen that the threshold of visibility ofcrosstalk decreases with increasing image contrast, meaning thatcrosstalk is more visible with higher levels of image contrast. Image:© ITE and SID.30
∥The time-sequential stereoscopic 3D method is also known as time-multi-plexed, field-sequential, frame-sequential, alternate frame, or active-stereo.¶3D shutter glasses are also known as active shutter glasses, liquid crystalshutter (LCS) glasses, and sometimes incorrectly as LCD shutter glasses.The LC cells in 3D shutter glasses are not displays (just shutters), so theterm “LCD shutter glasses” is incorrect.
Journal of Electronic Imaging 040902-5 Oct–Dec 2012/Vol. 21(4)
Woods: Crosstalk in stereoscopic displays: a review
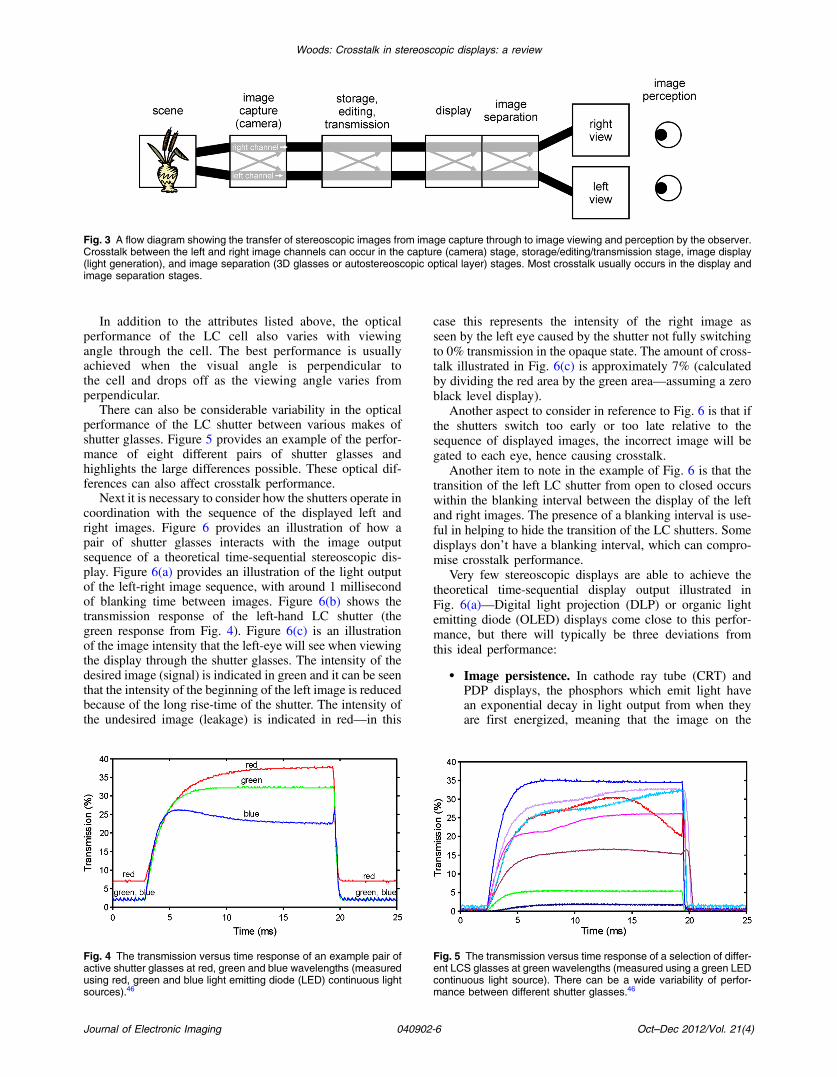
In addition to the attributes listed above, the opticalperformance of the LC cell also varies with viewingangle through the cell. The best performance is usuallyachieved when the visual angle is perpendicular tothe cell and drops off as the viewing angle varies fromperpendicular.
There can also be considerable variability in the opticalperformance of the LC shutter between various makes ofshutter glasses. Figure 5 provides an example of the perfor-mance of eight different pairs of shutter glasses andhighlights the large differences possible. These optical dif-ferences can also affect crosstalk performance.
Next it is necessary to consider how the shutters operate incoordination with the sequence of the displayed left andright images. Figure 6 provides an illustration of how apair of shutter glasses interacts with the image outputsequence of a theoretical time-sequential stereoscopic dis-play. Figure 6(a) provides an illustration of the light outputof the left-right image sequence, with around 1 millisecondof blanking time between images. Figure 6(b) shows thetransmission response of the left-hand LC shutter (thegreen response from Fig. 4). Figure 6(c) is an illustrationof the image intensity that the left-eye will see when viewingthe display through the shutter glasses. The intensity of thedesired image (signal) is indicated in green and it can be seenthat the intensity of the beginning of the left image is reducedbecause of the long rise-time of the shutter. The intensity ofthe undesired image (leakage) is indicated in red—in this
case this represents the intensity of the right image asseen by the left eye caused by the shutter not fully switchingto 0% transmission in the opaque state. The amount of cross-talk illustrated in Fig. 6(c) is approximately 7% (calculatedby dividing the red area by the green area—assuming a zeroblack level display).
Another aspect to consider in reference to Fig. 6 is that ifthe shutters switch too early or too late relative to thesequence of displayed images, the incorrect image will begated to each eye, hence causing crosstalk.
Another item to note in the example of Fig. 6 is that thetransition of the left LC shutter from open to closed occurswithin the blanking interval between the display of the leftand right images. The presence of a blanking interval is use-ful in helping to hide the transition of the LC shutters. Somedisplays don’t have a blanking interval, which can compro-mise crosstalk performance.
Very few stereoscopic displays are able to achieve thetheoretical time-sequential display output illustrated inFig. 6(a)—Digital light projection (DLP) or organic lightemitting diode (OLED) displays come close to this perfor-mance, but there will typically be three deviations fromthis ideal performance:
• Image persistence. In cathode ray tube (CRT) andPDP displays, the phosphors which emit light havean exponential decay in light output from when theyare first energized, meaning that the image on the
Fig. 3 A flow diagram showing the transfer of stereoscopic images from image capture through to image viewing and perception by the observer.Crosstalk between the left and right image channels can occur in the capture (camera) stage, storage/editing/transmission stage, image display(light generation), and image separation (3D glasses or autostereoscopic optical layer) stages. Most crosstalk usually occurs in the display andimage separation stages.
Fig. 4 The transmission versus time response of an example pair ofactive shutter glasses at red, green and blue wavelengths (measuredusing red, green and blue light emitting diode (LED) continuous lightsources).46
Fig. 5 The transmission versus time response of a selection of differ-ent LCS glasses at green wavelengths (measured using a green LEDcontinuous light source). There can be a wide variability of perfor-mance between different shutter glasses.46
Journal of Electronic Imaging 040902-6 Oct–Dec 2012/Vol. 21(4)
Woods: Crosstalk in stereoscopic displays: a review

display persists for a nominal period of time.46,47 Dis-plays which exhibit long image persistence will typi-cally exhibit more crosstalk because light from oneframe is still being output during the period of the fol-lowing frame.
• Pixel response rate. In LCDs it takes a measurableperiod of time for a pixel to change from one graylevel to another and this is referred to as the pixelresponse rate.48 A display with a slow pixel responserate will typically exhibit more crosstalk than a displaywith a fast pixel response rate.
• Image update method. This term describes the way inwhich the screen is updated from one image to another.In some displays, new images are scanned or addressedfrom the top to bottom (e.g., CRTs46 and LCDs48),whereas some displays update all pixels on the screenat the same time (e.g., DLPs49 and PDPs47). In simpleterms, it will be easier to synchronize a shutter to a dis-play whose pixels all update at the same moment.When shutter glasses are used with a scanned display,the amount of crosstalk present will usually vary withscreen position due to the different phase of the
switching of the shutter relative to the time the pixelschange at different screen coordinates.
These display performance attributes will affect crosstalkperformance by varying amounts as will be discussed inmore detail in Secs. 4.1.1 through 4.1.4 in relation to specificdisplay technologies.
In summary, the methods by which crosstalk can occur insystems using shutter glasses are:
• The optical performance of the liquid crystal cells—theamount of transmission in the opaque state, therise-time, the fall-time, and the amount of transmissionin the clear state.
• The relative timing (synchronization) of the glasseswith respect to the displayed images.
• The angle of view through the liquid crystal cells—theoptical performance of the cells usually falls off withviewing angles which are off perpendicular.
• The temporal performance of the particular displaybeing used and how this interacts with the temporalperformance of the shutters.
Fig. 6 An illustration of how a pair of shutter glasses interacts with the left/right image sequence of a theoretical time-sequential stereoscopicdisplay. (a) The sequence of left and right images output by a theoretical display with instantaneous pixel response. (b) The transmission versustime of the left-eye LC shutter. (c) The image intensity as viewed through the left-eye of the LC glasses.
Journal of Electronic Imaging 040902-7 Oct–Dec 2012/Vol. 21(4)
Woods: Crosstalk in stereoscopic displays: a review
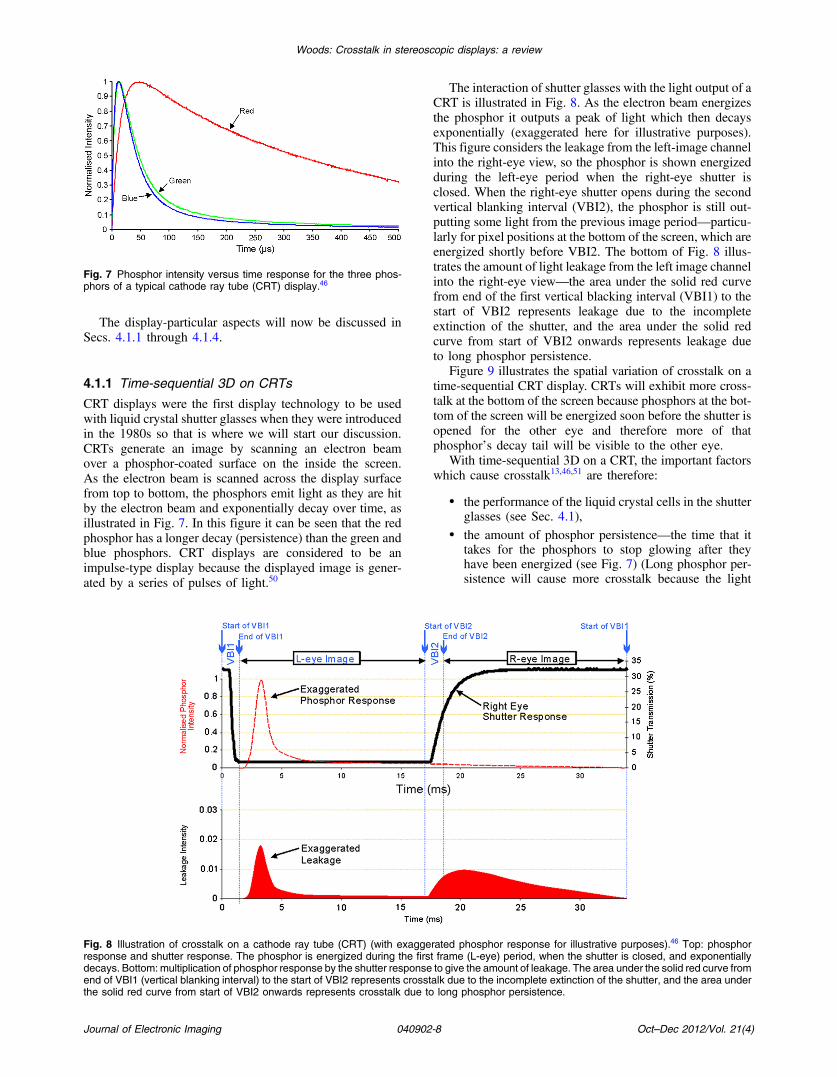
The display-particular aspects will now be discussed inSecs. 4.1.1 through 4.1.4.
4.1.1 Time-sequential 3D on CRTs
CRT displays were the first display technology to be usedwith liquid crystal shutter glasses when they were introducedin the 1980s so that is where we will start our discussion.CRTs generate an image by scanning an electron beamover a phosphor-coated surface on the inside the screen.As the electron beam is scanned across the display surfacefrom top to bottom, the phosphors emit light as they are hitby the electron beam and exponentially decay over time, asillustrated in Fig. 7. In this figure it can be seen that the redphosphor has a longer decay (persistence) than the green andblue phosphors. CRT displays are considered to be animpulse-type display because the displayed image is gener-ated by a series of pulses of light.50
The interaction of shutter glasses with the light output of aCRT is illustrated in Fig. 8. As the electron beam energizesthe phosphor it outputs a peak of light which then decaysexponentially (exaggerated here for illustrative purposes).This figure considers the leakage from the left-image channelinto the right-eye view, so the phosphor is shown energizedduring the left-eye period when the right-eye shutter isclosed. When the right-eye shutter opens during the secondvertical blanking interval (VBI2), the phosphor is still out-putting some light from the previous image period—particu-larly for pixel positions at the bottom of the screen, which areenergized shortly before VBI2. The bottom of Fig. 8 illus-trates the amount of light leakage from the left image channelinto the right-eye view—the area under the solid red curvefrom end of the first vertical blacking interval (VBI1) to thestart of VBI2 represents leakage due to the incompleteextinction of the shutter, and the area under the solid redcurve from start of VBI2 onwards represents leakage dueto long phosphor persistence.
Figure 9 illustrates the spatial variation of crosstalk on atime-sequential CRT display. CRTs will exhibit more cross-talk at the bottom of the screen because phosphors at the bot-tom of the screen will be energized soon before the shutter isopened for the other eye and therefore more of thatphosphor’s decay tail will be visible to the other eye.
With time-sequential 3D on a CRT, the important factorswhich cause crosstalk13,46,51 are therefore:
• the performance of the liquid crystal cells in the shutterglasses (see Sec. 4.1),
• the amount of phosphor persistence—the time that ittakes for the phosphors to stop glowing after theyhave been energized (see Fig. 7) (Long phosphor per-sistence will cause more crosstalk because the light
Fig. 7 Phosphor intensity versus time response for the three phos-phors of a typical cathode ray tube (CRT) display.46
Fig. 8 Illustration of crosstalk on a cathode ray tube (CRT) (with exaggerated phosphor response for illustrative purposes).46 Top: phosphorresponse and shutter response. The phosphor is energized during the first frame (L-eye) period, when the shutter is closed, and exponentiallydecays. Bottom: multiplication of phosphor response by the shutter response to give the amount of leakage. The area under the solid red curve fromend of VBI1 (vertical blanking interval) to the start of VBI2 represents crosstalk due to the incomplete extinction of the shutter, and the area underthe solid red curve from start of VBI2 onwards represents crosstalk due to long phosphor persistence.
Journal of Electronic Imaging 040902-8 Oct–Dec 2012/Vol. 21(4)
Woods: Crosstalk in stereoscopic displays: a review

from the first frame is still being output during the per-iod of the following frame),
• the timing of the shuttering of the glasses with respectto the display of images on the screen—it is importantthat the switching of the shutters occurs during the ver-tical blanking interval (VBI) to minimize crosstalk (seeFig. 8), and
• the x-y coordinates on the screen—the bottom of thescreen will exhibit more crosstalk than the top of thescreen due to the way that the electron beam scansthe display from top to bottom (see Fig. 9).
4.1.2 Time-sequential 3D on PDPs
PDPs with time-sequential 3D display capability were firstexperimentally demonstrated in 199852,53 and first commer-cially released in 2008 by Samsung.54 PDPs generate lightusing phosphors which are energized up to 10 times perframe (see Fig. 10). These 10 pulses (subframes) perframe have different durations (sustain time) and hence lumi-nance, in a binary sequence from longest duration to shortestduration. Different gray levels are achieved for each pixel byfiring or not firing the phosphors for each pixel in none,some, or all of the 10 subframes per frame. This is quite dif-ferent from the way that gray-levels are produced on a CRTwhich has analog control over the intensity of the pulse oflight from the phosphors, whereas with a PDP each indivi-dual pulse of light per pixel per subframe can only be on oroff—there is no in-between. Therefore, ten individual pulsesof pre-determined intensity are fired selectively to collec-tively produce different gray levels.47
With further reference to Fig. 10, it can be seen that thephosphors in PDPs also (like CRTs) exhibit an exponentialdecay in light output after they have been energized—this isparticularly visible in the period between 16 ms and 33 mswith the red and green color channels. Figure 11 illustratesthe interaction of shutter glasses with the light output ofanother conventional PDP display (different than Fig. 10).In Fig. 11(a) it can be seen that the long phosphor persistencefrom 17 ms onwards causes there to be light output from theprevious frame when the right shutter opens which will inturn cause crosstalk. Figure 11(b) illustrates the relativeintensity of the signal (left image channel into the left-eyeview) and leakage (left image channel into the right-eyeview) components. Additionally, the area under the red leak-age curve from 0 to 17 ms represents leakage due to theincomplete extinction of the shutter, and the area under
the red leakage curve from 17 ms onwards represents leakagedue to long phosphor persistence.
With time-sequential 3D on a PDP, the important contri-butors to crosstalk47 are therefore:
• the performance of the liquid crystal cells in the shutterglasses (see Sec. 4.1),
• the amount of phosphor persistence—the time that ittakes for the phosphors to stop glowing after theyhave been energized (see Fig. 10),
• the timing of the shuttering of the glasses relative to thedisplay of images on the screen (see Fig. 11), and
• the particular gray level value of a displayed pixel andtherefore which subframes are fired—a subframe firedimmediately before the transition point will dumpmore light into the following frame due to phosphorpersistence than for a subframe which is fired earlierwhose phosphor persistence will have had moretime to decay before the next frame (see Fig. 11).
Crosstalk does not vary with screen position on PDPsexcept where the visual angle through the shutter glassesmight be non-perpendicular for viewing the corners of thescreen.
Fig. 9 Illustration of spatial variation of crosstalk on a cathode ray tube (CRT), with increased crosstalk at the bottom of the screen: (a) actualscreen photograph of CRT crosstalk through a pair of active shutter glasses, and (b) histogram of measured CRT crosstalk.46
Fig. 10 The time-domain light output of an example plasma display(showing alternating frames of 100% white and black). The verticalaxis is the normalized phosphor intensity.47 This graph illustratesthe 10 pulses per frame used to construct images with variousgray levels and the long phosphor persistence of the red andgreen channels (of this particular display).
Journal of Electronic Imaging 040902-9 Oct–Dec 2012/Vol. 21(4)
Woods: Crosstalk in stereoscopic displays: a review
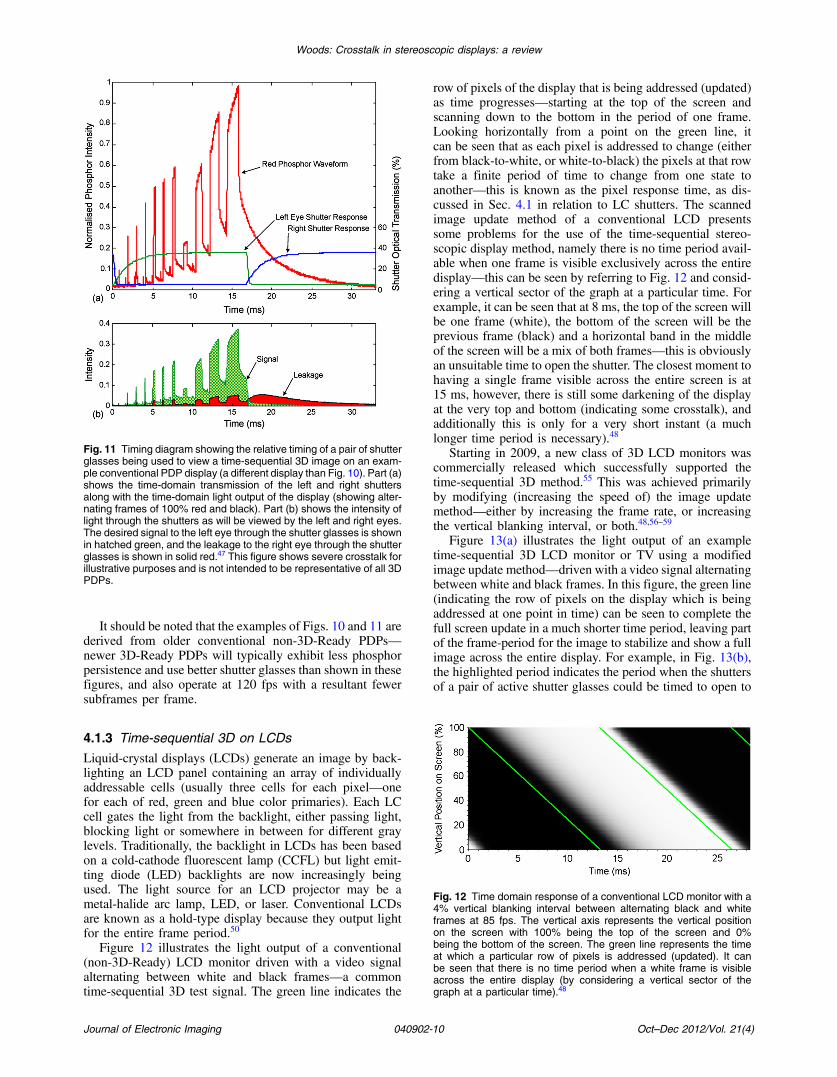
It should be noted that the examples of Figs. 10 and 11 arederived from older conventional non-3D-Ready PDPs—newer 3D-Ready PDPs will typically exhibit less phosphorpersistence and use better shutter glasses than shown in thesefigures, and also operate at 120 fps with a resultant fewersubframes per frame.
4.1.3 Time-sequential 3D on LCDs
Liquid-crystal displays (LCDs) generate an image by back-lighting an LCD panel containing an array of individuallyaddressable cells (usually three cells for each pixel—onefor each of red, green and blue color primaries). Each LCcell gates the light from the backlight, either passing light,blocking light or somewhere in between for different graylevels. Traditionally, the backlight in LCDs has been basedon a cold-cathode fluorescent lamp (CCFL) but light emit-ting diode (LED) backlights are now increasingly beingused. The light source for an LCD projector may be ametal-halide arc lamp, LED, or laser. Conventional LCDsare known as a hold-type display because they output lightfor the entire frame period.50
Figure 12 illustrates the light output of a conventional(non-3D-Ready) LCD monitor driven with a video signalalternating between white and black frames—a commontime-sequential 3D test signal. The green line indicates the
row of pixels of the display that is being addressed (updated)as time progresses—starting at the top of the screen andscanning down to the bottom in the period of one frame.Looking horizontally from a point on the green line, itcan be seen that as each pixel is addressed to change (eitherfrom black-to-white, or white-to-black) the pixels at that rowtake a finite period of time to change from one state toanother—this is known as the pixel response time, as dis-cussed in Sec. 4.1 in relation to LC shutters. The scannedimage update method of a conventional LCD presentssome problems for the use of the time-sequential stereo-scopic display method, namely there is no time period avail-able when one frame is visible exclusively across the entiredisplay—this can be seen by referring to Fig. 12 and consid-ering a vertical sector of the graph at a particular time. Forexample, it can be seen that at 8 ms, the top of the screen willbe one frame (white), the bottom of the screen will be theprevious frame (black) and a horizontal band in the middleof the screen will be a mix of both frames—this is obviouslyan unsuitable time to open the shutter. The closest moment tohaving a single frame visible across the entire screen is at15 ms, however, there is still some darkening of the displayat the very top and bottom (indicating some crosstalk), andadditionally this is only for a very short instant (a muchlonger time period is necessary).48
Starting in 2009, a new class of 3D LCD monitors wascommercially released which successfully supported thetime-sequential 3D method.55 This was achieved primarilyby modifying (increasing the speed of) the image updatemethod—either by increasing the frame rate, or increasingthe vertical blanking interval, or both.48,56–59
Figure 13(a) illustrates the light output of an exampletime-sequential 3D LCD monitor or TV using a modifiedimage update method—driven with a video signal alternatingbetween white and black frames. In this figure, the green line(indicating the row of pixels on the display which is beingaddressed at one point in time) can be seen to complete thefull screen update in a much shorter time period, leaving partof the frame-period for the image to stabilize and show a fullimage across the entire display. For example, in Fig. 13(b),the highlighted period indicates the period when the shuttersof a pair of active shutter glasses could be timed to open to
Fig. 11 Timing diagram showing the relative timing of a pair of shutterglasses being used to view a time-sequential 3D image on an exam-ple conventional PDP display (a different display than Fig. 10). Part (a)shows the time-domain transmission of the left and right shuttersalong with the time-domain light output of the display (showing alter-nating frames of 100% red and black). Part (b) shows the intensity oflight through the shutters as will be viewed by the left and right eyes.The desired signal to the left eye through the shutter glasses is shownin hatched green, and the leakage to the right eye through the shutterglasses is shown in solid red.47 This figure shows severe crosstalk forillustrative purposes and is not intended to be representative of all 3DPDPs.
Fig. 12 Time domain response of a conventional LCD monitor with a4% vertical blanking interval between alternating black and whiteframes at 85 fps. The vertical axis represents the vertical positionon the screen with 100% being the top of the screen and 0%being the bottom of the screen. The green line represents the timeat which a particular row of pixels is addressed (updated). It canbe seen that there is no time period when a white frame is visibleacross the entire display (by considering a vertical sector of thegraph at a particular time).48
Journal of Electronic Imaging 040902-10 Oct–Dec 2012/Vol. 21(4)
Woods: Crosstalk in stereoscopic displays: a review

present a stereoscopic image, however the gray tinting at thebottom of this area indicates that some crosstalk will still bepresent. Technologies such as black frame insertion (BFI)and modulated (or scanned) backlight can also be usedwith LCDs to improve 3D performance.56
With time-sequential 3D on an LCD, the important con-tributors to crosstalk are therefore:
• the performance of the liquid crystal cells in the shutterglasses (see Sec. 4.1);
• the specific timing of the image update method on thescreen (see Figs. 12 and 13) including the effects ofBFI, increased frame rate, and/or modulated backlight;
• the pixel response rate of the LCD (black-to-white,white-to-black, and gray-to-gray);
• the timing of the shuttering of the glasses with respectto the display of images on the screen (see Fig. 13)including the duty cycle of the shutters;
• the particular gray level value of a displayed pixel(pixel response rate varies with the input and outputpixel gray level—small changes in gray level oftentake the longest to complete);28 and
• the x-y position on the screen—depending upon shut-ter timing, the top and bottom of the screen may exhibitmore crosstalk than the middle of the screen (seeFig. 13).48
4.1.4 Time-sequential 3D on DLPs
DLP projectors and DLP rear-projection TVs work by shin-ing a light source (e.g., a metal halide arc lamp or LEDs)onto a DMD (digital micro-mirror device—an array of tinymirrors that can each be individually commanded to tilt�12°at very fast speeds). The reflection off the DMD is sentthrough a lens and focused on a screen and each mirror onthe DMD corresponds to one pixel on the screen. In single-chip DLP projectors, a color-sequential technique is used toachieve a full-color image49 as illustrated in Fig. 14. DLPsoperate most like a hold-type display—except that graylevels are achieved by a duty cycle modulation process andit is also possible to introduce a blanking interval betweenframes.60
With reference to Fig. 14 it can be seen that the right per-spective image is displayed over the period 3 to 8.5 ms withan approximately 3 ms blanking interval before and after theimage display period. The blanking interval provides a per-iod during which the left and right shutters in the active shut-ter glasses can stabilize after state change before light isdisplayed on the screen for the left and right eyes.
DLPs have very good performance characteristics fortime-sequential 3D display—in essence there is no crosstalkintroduced by the actual DLP display itself.49 This is due totwo key points: there is no phosphor decay (the DMD mir-rors can switch completely from one state to another in∼2 μs),61 and the entire image changes from one frame to thenext at effectively the same time. Crosstalk does not varywith screen position with DLP displays—except where theviewing angle through the shutter glasses might be differentfor viewing different parts of the screen. Ordinarily the onlycrosstalk present with time-sequential 3D on DLP is due tothe performance of the shutter glasses. It is also importantthat the video electronics path in the DLP display does notmix the left and right images and presents the images in acorrect left/right image sequence,49 but this is now fairlystandard with a wide range of 3D DLP projectors and TVsavailable commercially.
The important factors that cause crosstalk with time-sequential 3D on DLP displays are therefore:
• the performance of the liquid crystal cells in the shutterglasses (see Sec. 4.1),
• the timing (and phase) of the shuttering of the glasseswith respect to the image display sequence on thescreen (if the LC shutters switch at the wrong time,the glasses can direct images to the wrong eye andhence cause crosstalk), and
• the duration of the blanking interval (the blankinginterval should ideally be long enough to hide the tran-sition time of the LC shutters).
4.2 Polarized 3D ProjectionPolarization is an optical property of light that can be used toencode separate left and right images for presentation to thetwo eyes of an observer for stereoscopic display purposes.62
Conceptually, the simplest method of achieving polarized3D projection involves the use of two projectors, a polarizerfitted to the front lens of each projector, a silvered screen, andmatching polarized 3D glasses for the audience. The polar-izers can either be linear polarizers or circular polarizers.62
Fig. 13 (a) Time domain response of a simulated time-sequential 3DLCD monitor with a fast addressing rate and fast pixel response rate.Note that the entire screen is updated in only 4.2 ms (the time periodof the green line) versus 13 ms with a conventional LCD (Fig. 12).(b) The same monitor as (a) being viewed through shutter glasseswith reduced duty cycle switching (the response rate of shuttersare not shown).48 The highlighted period between 6.7 ms and8.8 ms is almost exclusively white, which means one of the viewswill dominate, but there is a bit of gray tinting at the bottom of this area,which suggests some crosstalk will be evident at the bottom of thescreen.
Journal of Electronic Imaging 040902-11 Oct–Dec 2012/Vol. 21(4)
Woods: Crosstalk in stereoscopic displays: a review

For stereoscopic display purposes the left image channel isencoded with one polarization state, and the right imagechannel will be encoded with an orthogonal polarizationstate (for example +45 deg and −45 deg, or 0 deg and90 deg for linear polarizers; or left-handed and right-handedfor circular polarizers). Ideally the left and right image chan-nels will be maintained separately, but due to various limita-tions of the filters, some leakage will occur between thechannels and cause crosstalk.
Polarizing filters are not perfect devices and unfortunatelydo not perfectly polarize the light that passes through them,which is an avenue for the presence of crosstalk. Figure 15illustrates the optical performance of an example linearpolarizer filter. The key factor to consider for establishingthe amount of crosstalk that will be present due to imperfectpolarizers is the amount of light that passes through a pair ofcrossed polarizers [indicated by the transmission crossed(Tc) curve in the figure] compared to the amount of lightthat passes through a pair of parallel polarizers (Tp in thefigure). In this example, the amount of light passed in thecrossed polarizer state is very low, which would indicatethe potential for very low crosstalk. Figure 16 illustratesthe optical performance of an example circular polarizer.In this case, the “double pass reflected” curve provides anindication of the amount of crosstalk to be expected,which is higher than the linear polarizer example of Fig. 15.
These examples are indicated for perfectly orthogonalprojection polarizers and perfectly oriented decoding polar-izers, however, in a real-life situation the orientation ofthe decoder polarizers in the glasses may not perfectlymatch the orientation of the projector polarizers (e.g., dueto head tilt or improperly worn glasses) which will adverselyaffect crosstalk performance.65 Circular polarizers are lesssensitive to rotational misalignment between encoder anddecoder polarizers than linear polarizers, but are stilladversely affected—the orientation of the rear linear layersmust match for optimal performance.
Projection screen properties can also affect crosstalk per-formance. Different screen materials have different polarizedlight preservation properties66 and front projection screens
have different polarization performance characteristics com-pared to rear-projection screens. The quality of the preserva-tion of polarization of light of the screen will affect crosstalkperformance.
In summary, the factors which affect crosstalk in dual-projector polarized 3D projection systems are:
• the optical polarization quality of the polarizers,• the polarization preservation properties of the projec-
tion screen, and• incorrect orientation of the coding or decoding polar-
izers (perhaps due to head tilt).
Polarized 3D projection can also be achieved time-sequentially with the use of a polarization modulator (asused by StereoGraphics/RealD,67 NuVision,68 andDepthQ69), or a circular polarization filter wheel (as usedby MasterImage70). In these systems, the polarization mod-ulator (or filter wheel) is configured to switch between two
Fig. 14 Illustration of the time-domain performance of an example 120 Hz 3D single-chip digital light projection (DLP) projector. In this figure, astereoscopic image pair is being presented at 120 frames per second (60 frames for the left and 60 for the right in alternating sequence) and viewedusing a pair of shutter glasses. The top of the figure shows the sequence of left and right images built up by a red, blue, green color sequence toconstruct a full-color image. The bottom half of the figure shows the optical transmission of the shuttering eyewear which must synchronize correctlywith the sequence of left and right images. This particular projector is operating with a 6× color cycle speed [6 RGB color cycles per 60 fps frameperiod (16.7 ms)] and in this case one color cycle per left/right frame period is extinguished to create a blanking interval.
Fig. 15 Spectral response of an example linear polarizer in single Ts,parallel Tp and crossed Tc configurations.63 The blue “crossed” curveis a close approximation of the amount of leakage that will occurbetween two linear polarized channels of a polarized stereoscopic dis-play (excluding the effect of head tilt and screen depolarization).
Journal of Electronic Imaging 040902-12 Oct–Dec 2012/Vol. 21(4)
Woods: Crosstalk in stereoscopic displays: a review
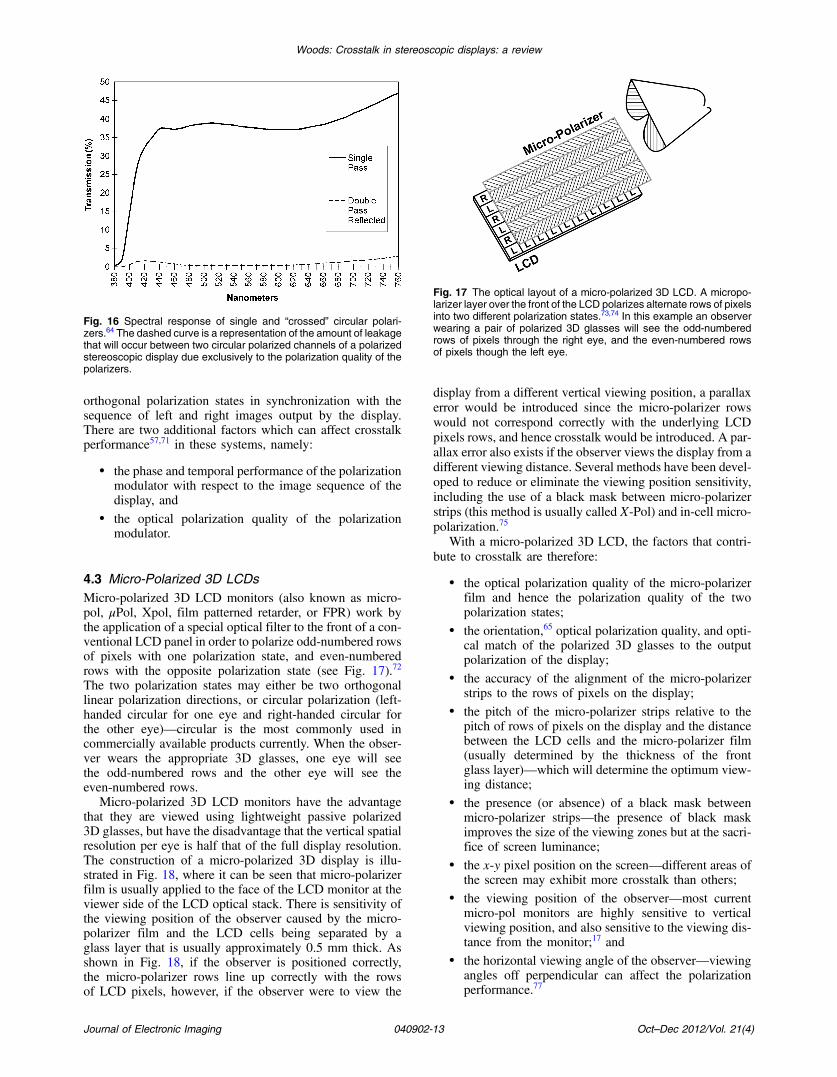
orthogonal polarization states in synchronization with thesequence of left and right images output by the display.There are two additional factors which can affect crosstalkperformance57,71 in these systems, namely:
• the phase and temporal performance of the polarizationmodulator with respect to the image sequence of thedisplay, and
• the optical polarization quality of the polarizationmodulator.
4.3 Micro-Polarized 3D LCDsMicro-polarized 3D LCD monitors (also known as micro-pol, μPol, Xpol, film patterned retarder, or FPR) work bythe application of a special optical filter to the front of a con-ventional LCD panel in order to polarize odd-numbered rowsof pixels with one polarization state, and even-numberedrows with the opposite polarization state (see Fig. 17).72
The two polarization states may either be two orthogonallinear polarization directions, or circular polarization (left-handed circular for one eye and right-handed circular forthe other eye)—circular is the most commonly used incommercially available products currently. When the obser-ver wears the appropriate 3D glasses, one eye will seethe odd-numbered rows and the other eye will see theeven-numbered rows.
Micro-polarized 3D LCD monitors have the advantagethat they are viewed using lightweight passive polarized3D glasses, but have the disadvantage that the vertical spatialresolution per eye is half that of the full display resolution.The construction of a micro-polarized 3D display is illu-strated in Fig. 18, where it can be seen that micro-polarizerfilm is usually applied to the face of the LCD monitor at theviewer side of the LCD optical stack. There is sensitivity ofthe viewing position of the observer caused by the micro-polarizer film and the LCD cells being separated by aglass layer that is usually approximately 0.5 mm thick. Asshown in Fig. 18, if the observer is positioned correctly,the micro-polarizer rows line up correctly with the rowsof LCD pixels, however, if the observer were to view the
display from a different vertical viewing position, a parallaxerror would be introduced since the micro-polarizer rowswould not correspond correctly with the underlying LCDpixels rows, and hence crosstalk would be introduced. A par-allax error also exists if the observer views the display from adifferent viewing distance. Several methods have been devel-oped to reduce or eliminate the viewing position sensitivity,including the use of a black mask between micro-polarizerstrips (this method is usually called X-Pol) and in-cell micro-polarization.75
With a micro-polarized 3D LCD, the factors that contri-bute to crosstalk are therefore:
• the optical polarization quality of the micro-polarizerfilm and hence the polarization quality of the twopolarization states;
• the orientation,65 optical polarization quality, and opti-cal match of the polarized 3D glasses to the outputpolarization of the display;
• the accuracy of the alignment of the micro-polarizerstrips to the rows of pixels on the display;
• the pitch of the micro-polarizer strips relative to thepitch of rows of pixels on the display and the distancebetween the LCD cells and the micro-polarizer film(usually determined by the thickness of the frontglass layer)—which will determine the optimum view-ing distance;
• the presence (or absence) of a black mask betweenmicro-polarizer strips—the presence of black maskimproves the size of the viewing zones but at the sacri-fice of screen luminance;
• the x-y pixel position on the screen—different areas ofthe screen may exhibit more crosstalk than others;
• the viewing position of the observer—most currentmicro-pol monitors are highly sensitive to verticalviewing position, and also sensitive to the viewing dis-tance from the monitor;17 and
• the horizontal viewing angle of the observer—viewingangles off perpendicular can affect the polarizationperformance.77
Fig. 16 Spectral response of single and “crossed” circular polari-zers.64 The dashed curve is a representation of the amount of leakagethat will occur between two circular polarized channels of a polarizedstereoscopic display due exclusively to the polarization quality of thepolarizers.
Fig. 17 The optical layout of a micro-polarized 3D LCD. A micropo-larizer layer over the front of the LCD polarizes alternate rows of pixelsinto two different polarization states.73,74 In this example an observerwearing a pair of polarized 3D glasses will see the odd-numberedrows of pixels through the right eye, and the even-numbered rowsof pixels though the left eye.
Journal of Electronic Imaging 040902-13 Oct–Dec 2012/Vol. 21(4)
Woods: Crosstalk in stereoscopic displays: a review
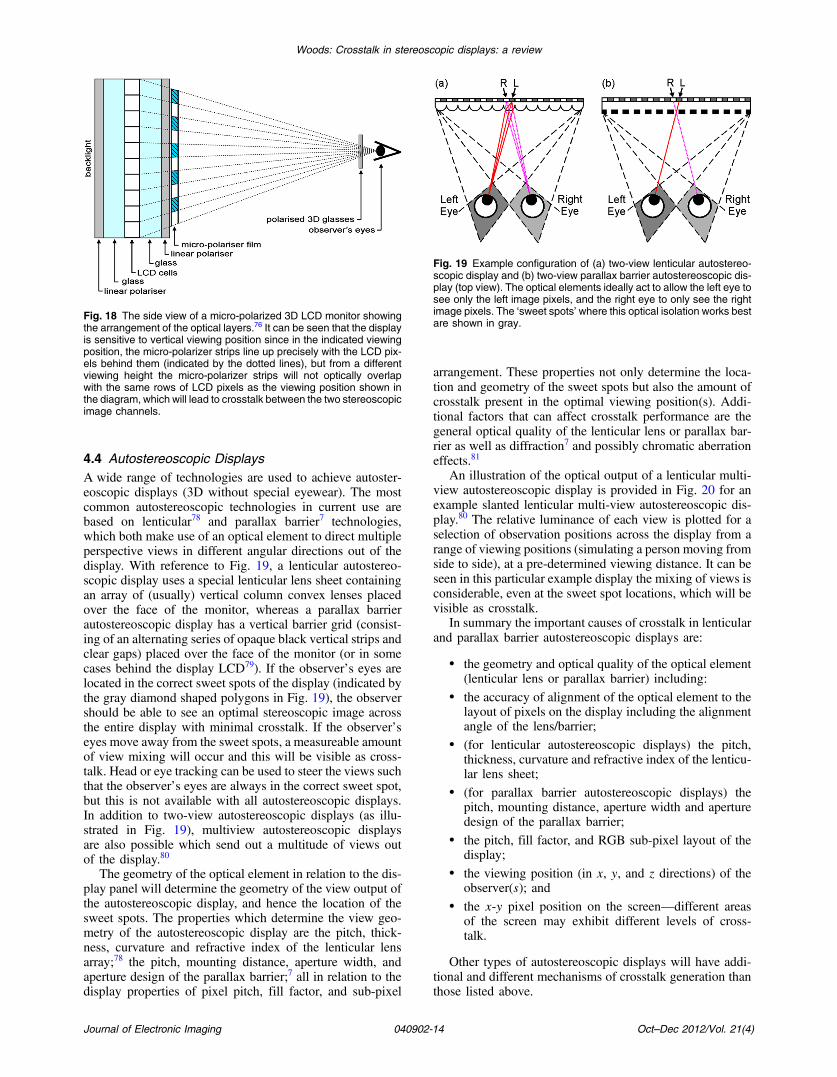
4.4 Autostereoscopic DisplaysA wide range of technologies are used to achieve autoster-eoscopic displays (3D without special eyewear). The mostcommon autostereoscopic technologies in current use arebased on lenticular78 and parallax barrier7 technologies,which both make use of an optical element to direct multipleperspective views in different angular directions out of thedisplay. With reference to Fig. 19, a lenticular autostereo-scopic display uses a special lenticular lens sheet containingan array of (usually) vertical column convex lenses placedover the face of the monitor, whereas a parallax barrierautostereoscopic display has a vertical barrier grid (consist-ing of an alternating series of opaque black vertical strips andclear gaps) placed over the face of the monitor (or in somecases behind the display LCD79). If the observer’s eyes arelocated in the correct sweet spots of the display (indicated bythe gray diamond shaped polygons in Fig. 19), the observershould be able to see an optimal stereoscopic image acrossthe entire display with minimal crosstalk. If the observer’seyes move away from the sweet spots, a measureable amountof view mixing will occur and this will be visible as cross-talk. Head or eye tracking can be used to steer the views suchthat the observer’s eyes are always in the correct sweet spot,but this is not available with all autostereoscopic displays.In addition to two-view autostereoscopic displays (as illu-strated in Fig. 19), multiview autostereoscopic displaysare also possible which send out a multitude of views outof the display.80
The geometry of the optical element in relation to the dis-play panel will determine the geometry of the view output ofthe autostereoscopic display, and hence the location of thesweet spots. The properties which determine the view geo-metry of the autostereoscopic display are the pitch, thick-ness, curvature and refractive index of the lenticular lensarray;78 the pitch, mounting distance, aperture width, andaperture design of the parallax barrier;7 all in relation to thedisplay properties of pixel pitch, fill factor, and sub-pixel
arrangement. These properties not only determine the loca-tion and geometry of the sweet spots but also the amount ofcrosstalk present in the optimal viewing position(s). Addi-tional factors that can affect crosstalk performance are thegeneral optical quality of the lenticular lens or parallax bar-rier as well as diffraction7 and possibly chromatic aberrationeffects.81
An illustration of the optical output of a lenticular multi-view autostereoscopic display is provided in Fig. 20 for anexample slanted lenticular multi-view autostereoscopic dis-play.80 The relative luminance of each view is plotted for aselection of observation positions across the display from arange of viewing positions (simulating a person moving fromside to side), at a pre-determined viewing distance. It can beseen in this particular example display the mixing of views isconsiderable, even at the sweet spot locations, which will bevisible as crosstalk.
In summary the important causes of crosstalk in lenticularand parallax barrier autostereoscopic displays are:
• the geometry and optical quality of the optical element(lenticular lens or parallax barrier) including:
• the accuracy of alignment of the optical element to thelayout of pixels on the display including the alignmentangle of the lens/barrier;
• (for lenticular autostereoscopic displays) the pitch,thickness, curvature and refractive index of the lenticu-lar lens sheet;
• (for parallax barrier autostereoscopic displays) thepitch, mounting distance, aperture width and aperturedesign of the parallax barrier;
• the pitch, fill factor, and RGB sub-pixel layout of thedisplay;
• the viewing position (in x, y, and z directions) of theobserver(s); and
• the x-y pixel position on the screen—different areasof the screen may exhibit different levels of cross-talk.
Other types of autostereoscopic displays will have addi-tional and different mechanisms of crosstalk generation thanthose listed above.
Fig. 18 The side view of a micro-polarized 3D LCD monitor showingthe arrangement of the optical layers.76 It can be seen that the displayis sensitive to vertical viewing position since in the indicated viewingposition, the micro-polarizer strips line up precisely with the LCD pix-els behind them (indicated by the dotted lines), but from a differentviewing height the micro-polarizer strips will not optically overlapwith the same rows of LCD pixels as the viewing position shown inthe diagram, which will lead to crosstalk between the two stereoscopicimage channels.
Fig. 19 Example configuration of (a) two-view lenticular autostereo-scopic display and (b) two-view parallax barrier autostereoscopic dis-play (top view). The optical elements ideally act to allow the left eye tosee only the left image pixels, and the right eye to only see the rightimage pixels. The ‘sweet spots’ where this optical isolation works bestare shown in gray.
Journal of Electronic Imaging 040902-14 Oct–Dec 2012/Vol. 21(4)
Woods: Crosstalk in stereoscopic displays: a review
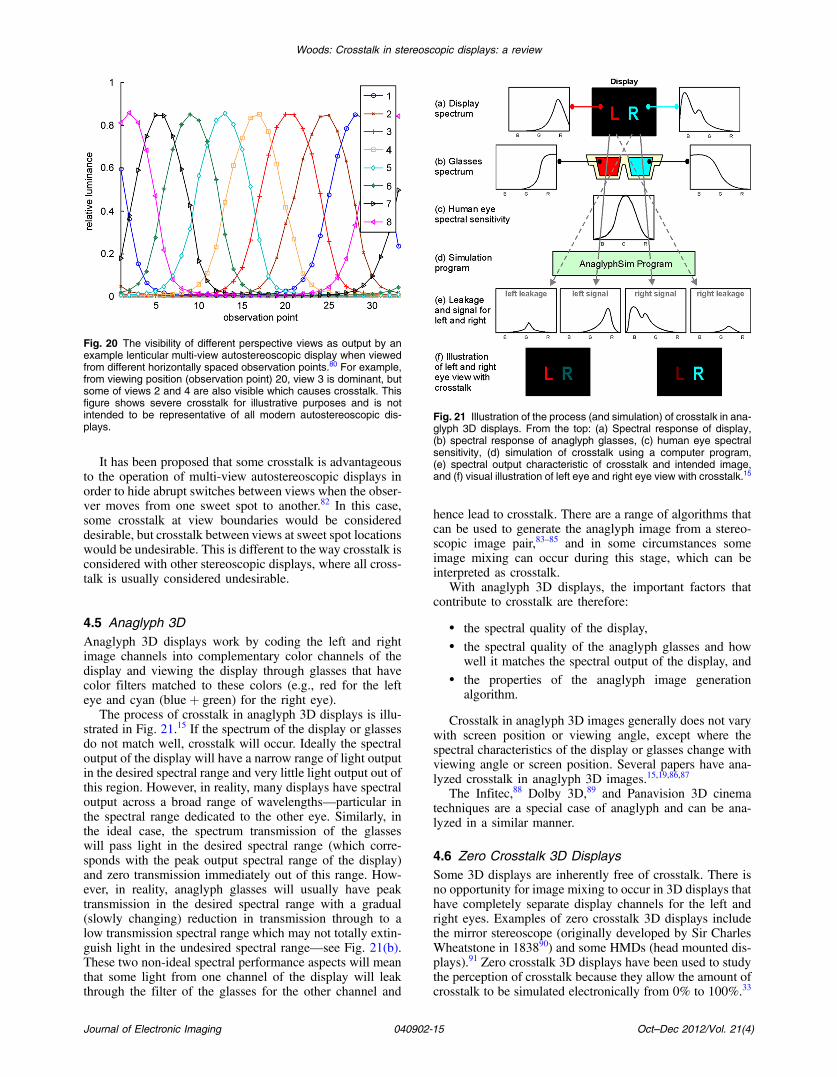
It has been proposed that some crosstalk is advantageousto the operation of multi-view autostereoscopic displays inorder to hide abrupt switches between views when the obser-ver moves from one sweet spot to another.82 In this case,some crosstalk at view boundaries would be considereddesirable, but crosstalk between views at sweet spot locationswould be undesirable. This is different to the way crosstalk isconsidered with other stereoscopic displays, where all cross-talk is usually considered undesirable.
4.5 Anaglyph 3DAnaglyph 3D displays work by coding the left and rightimage channels into complementary color channels of thedisplay and viewing the display through glasses that havecolor filters matched to these colors (e.g., red for the lefteye and cyan (blueþ green) for the right eye).
The process of crosstalk in anaglyph 3D displays is illu-strated in Fig. 21.15 If the spectrum of the display or glassesdo not match well, crosstalk will occur. Ideally the spectraloutput of the display will have a narrow range of light outputin the desired spectral range and very little light output out ofthis region. However, in reality, many displays have spectraloutput across a broad range of wavelengths—particular inthe spectral range dedicated to the other eye. Similarly, inthe ideal case, the spectrum transmission of the glasseswill pass light in the desired spectral range (which corre-sponds with the peak output spectral range of the display)and zero transmission immediately out of this range. How-ever, in reality, anaglyph glasses will usually have peaktransmission in the desired spectral range with a gradual(slowly changing) reduction in transmission through to alow transmission spectral range which may not totally extin-guish light in the undesired spectral range—see Fig. 21(b).These two non-ideal spectral performance aspects will meanthat some light from one channel of the display will leakthrough the filter of the glasses for the other channel and
hence lead to crosstalk. There are a range of algorithms thatcan be used to generate the anaglyph image from a stereo-scopic image pair,83–85 and in some circumstances someimage mixing can occur during this stage, which can beinterpreted as crosstalk.
With anaglyph 3D displays, the important factors thatcontribute to crosstalk are therefore:
• the spectral quality of the display,• the spectral quality of the anaglyph glasses and how
well it matches the spectral output of the display, and• the properties of the anaglyph image generation
algorithm.
Crosstalk in anaglyph 3D images generally does not varywith screen position or viewing angle, except where thespectral characteristics of the display or glasses change withviewing angle or screen position. Several papers have ana-lyzed crosstalk in anaglyph 3D images.15,19,86,87
The Infitec,88 Dolby 3D,89 and Panavision 3D cinematechniques are a special case of anaglyph and can be ana-lyzed in a similar manner.
4.6 Zero Crosstalk 3D DisplaysSome 3D displays are inherently free of crosstalk. There isno opportunity for image mixing to occur in 3D displays thathave completely separate display channels for the left andright eyes. Examples of zero crosstalk 3D displays includethe mirror stereoscope (originally developed by Sir CharlesWheatstone in 183890) and some HMDs (head mounted dis-plays).91 Zero crosstalk 3D displays have been used to studythe perception of crosstalk because they allow the amount ofcrosstalk to be simulated electronically from 0% to 100%.33
Fig. 20 The visibility of different perspective views as output by anexample lenticular multi-view autostereoscopic display when viewedfrom different horizontally spaced observation points.80 For example,from viewing position (observation point) 20, view 3 is dominant, butsome of views 2 and 4 are also visible which causes crosstalk. Thisfigure shows severe crosstalk for illustrative purposes and is notintended to be representative of all modern autostereoscopic dis-plays.
Fig. 21 Illustration of the process (and simulation) of crosstalk in ana-glyph 3D displays. From the top: (a) Spectral response of display,(b) spectral response of anaglyph glasses, (c) human eye spectralsensitivity, (d) simulation of crosstalk using a computer program,(e) spectral output characteristic of crosstalk and intended image,and (f) visual illustration of left eye and right eye view with crosstalk.15
Journal of Electronic Imaging 040902-15 Oct–Dec 2012/Vol. 21(4)
Woods: Crosstalk in stereoscopic displays: a review

4.7 Non-Display Related Sources of CrosstalkIt is important to note that crosstalk can also occur in thecapture, storage, manipulation and transmission of stereo-scopic images prior to arrival at the stereoscopic display.In this case the crosstalk can be caused by the mixing ofthe left and right images instead of keeping them separateand distinct.
For example, some image crosstalk is possible duringstereoscopic image capture using the NuView 3D cameraattachment92 or the prototype 3D lens adapter for theCanon XL-1 video camera.93 In these examples the crosstalkoccurs because the two imaging capture paths share a com-mon optical path before they reach the single imaging sensorand the optical isolation of the two views in this commonoptical path is not perfect.
Another example is during stereoscopic image manipula-tion or storage. If a row-interleaved or anaglyph 3D image isstored in JPEG format, the left and right images can becomemixed (because JPEG is a lossy compression method),resulting in image crosstalk. This type of crosstalk can bereduced or eliminated by avoiding the use of lossy compres-sion of row-interleaved images, or in the case of anaglyphJPEGs, using the RGB color-space rather than the YUVcolor-space.94
Steps should be taken to avoid crosstalk or image mixingin the stereoscopic source images before they are presentedon the stereoscopic display.
5 Measurement of CrosstalkTwo methods exist for the measurement of crosstalk: opticalsensors and visual measurement charts.
5.1 Optical SensorsAn optical measurement device, such as a photometer or aradiometer, can be used to measure crosstalk. The spectralsensitivity of the sensor(s) used should match the spectralsensitivity of the human visual system (photopic vision)so that the measurements are representative of what a humanobserver would see.95–97 Examples of sensors that have beenused to measure crosstalk include: Integrated PhotomatrixInc. IPL10530 DAL photo-diode,46 Ocean Optics USB2000spectroradiometer,87 Konica Minolta CS1000 spectroradi-ometer,65 Konica Minolta CS-100 spot chroma meter,20,22
Eldim EZContrastMS,17 and Photo Research PR-705.98
Many other devices can also be used for this purpose.In the first instance, the optical sensor will be placed at the
left eye position (either behind the left eye of the 3D glasses,or in the left eye viewing zone for an autostereoscopic dis-play) and a series of measurements taken with a cross-combination of the image channels set at various specifiedlevels. This is then repeated for the other eye position(s).In the case of black-white crosstalk, the two gray-levelswill be black and white (see Sec. 2.2.2) and for gray-to-gray crosstalk a much greater number of measurementswill be taken for a selection of gray-level combinations(Sec. 2.2.4). Crosstalk may also be characterized spatiallyacross the display,99,100 or for different horizontal and verticalviewing angles,14 in which case the number of measurementscan increase significantly, resulting in a much more complexcrosstalk dataset—in which case the automation of the takingof the measurements can be advantageous.
Efforts to standardize crosstalk measurement methods arecurrently under way and being published by ICDM,14
IEC, ISO, and others.4,27 Ensuring the accuracy and reprodu-cibility of crosstalk measurements between different mea-surement sensors, measurement methods and laboratoriesis an important problem and work is continuing in thisarea.99,101,102
5.2 Visual Measurement ChartsVisual measurement charts provide a very quick and effec-tive way of evaluating crosstalk in a stereoscopic displaywithout the need for expensive optical test equipment.Two examples of such charts are shown in Figs. 22 and23. The method of using the charts is to display the leftand right panels of the chart in the left and right channelsof the stereoscopic display. The user then visually comparesthe amount of crosstalk visible on screen for each eye sepa-rately in nominated areas of the chart against a scaled graylevel ramp.
Unfortunately, there are some limitations with thismethod: (a) the gamma curve of the monitor should be cali-brated using an appropriate sensor (such as the Spyder 3from Datacolor), (b) the chart does not account for the non-zero black level of some monitors (e.g., LCDs), (c) the chartonly measures white-to-black crosstalk, and (d) crosstalk canbe different in different parts of the screen. These charts onlymeasure crosstalk in relatively small portions of the screen,although this can be easily addressed with changes or multi-ple versions of the charts.
Due to the limitations of the visual measurement charts,appropriate electro-optic tools should be used to quantifycrosstalk when accurate crosstalk data are needed that arenot subject to the possible inaccuracies described above.
6 Crosstalk ReductionIn order to reduce the amount of crosstalk present on a par-ticular stereoscopic display, it is necessary to reduce theeffect of one or more of the crosstalk mechanisms of thatparticular display (as described in Sec. 4). First, develop adetailed listing of the crosstalk mechanisms of that display,their relative contribution to overall crosstalk, and an assess-ment of cost/benefit tradeoffs of any changes. In order todetermine the relative contribution of the crosstalk mechan-isms to overall crosstalk, it is necessary to perform a detailedanalysis and optical measurement of the display and glassesin the temporal, spatial, and spectral domains. It is also ben-eficial to develop a simulation of crosstalk on a particulardisplay in order to better understand the interrelationshipof the individual display properties and how they affectthe crosstalk mechanisms, and ultimately their relative con-tribution to overall crosstalk (see Sec. 8).
Once the relative contributions of each crosstalk mechan-ism are known, the main causes of crosstalk should beassessed first to see whether there are any changes thatcould be made to reduce the effect of these particular cross-talk mechanisms. There will also likely be cost/benefit trade-offs with any changes made to reduce crosstalk. In somecases the trade-off might be increased cost of manufactureof the display or glasses, or a reduction in some other displayperformance characteristic. There will probably be an opti-mum balance between crosstalk and other display perfor-mance characteristics (including cost of manufacture,
Journal of Electronic Imaging 040902-16 Oct–Dec 2012/Vol. 21(4)
Woods: Crosstalk in stereoscopic displays: a review
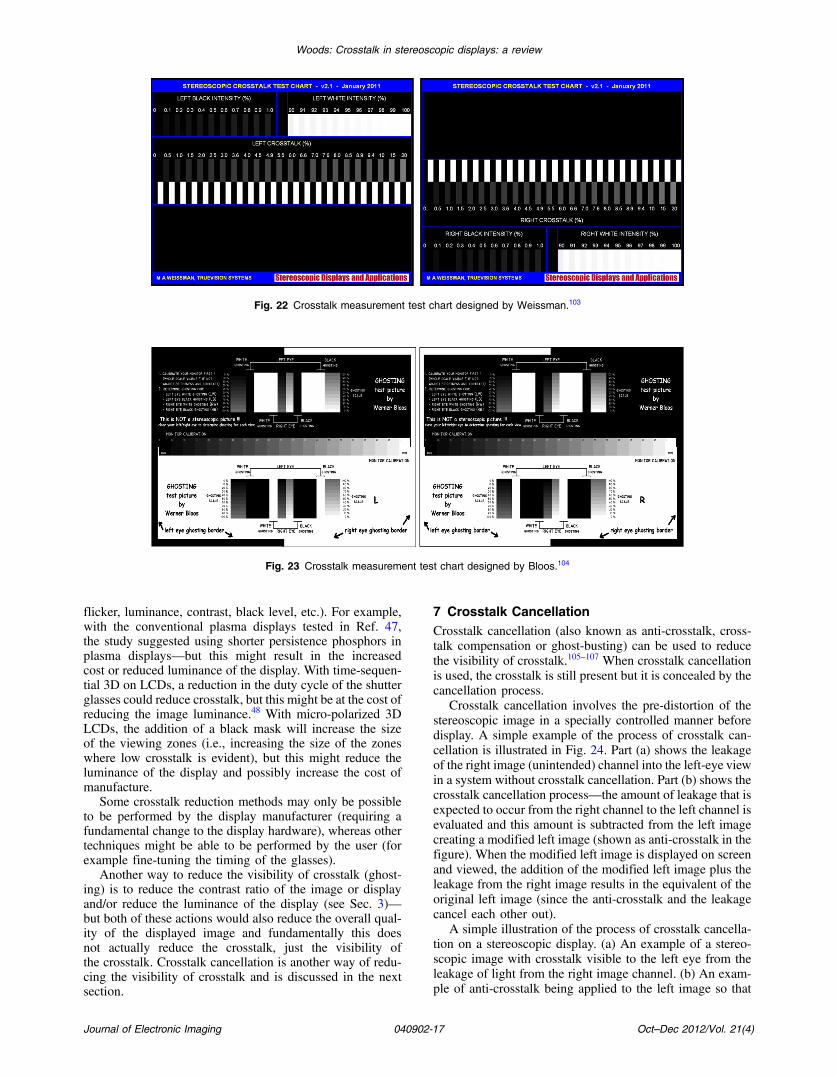
flicker, luminance, contrast, black level, etc.). For example,with the conventional plasma displays tested in Ref. 47,the study suggested using shorter persistence phosphors inplasma displays—but this might result in the increasedcost or reduced luminance of the display. With time-sequen-tial 3D on LCDs, a reduction in the duty cycle of the shutterglasses could reduce crosstalk, but this might be at the cost ofreducing the image luminance.48 With micro-polarized 3DLCDs, the addition of a black mask will increase the sizeof the viewing zones (i.e., increasing the size of the zoneswhere low crosstalk is evident), but this might reduce theluminance of the display and possibly increase the cost ofmanufacture.
Some crosstalk reduction methods may only be possibleto be performed by the display manufacturer (requiring afundamental change to the display hardware), whereas othertechniques might be able to be performed by the user (forexample fine-tuning the timing of the glasses).
Another way to reduce the visibility of crosstalk (ghost-ing) is to reduce the contrast ratio of the image or displayand/or reduce the luminance of the display (see Sec. 3)—but both of these actions would also reduce the overall qual-ity of the displayed image and fundamentally this doesnot actually reduce the crosstalk, just the visibility ofthe crosstalk. Crosstalk cancellation is another way of redu-cing the visibility of crosstalk and is discussed in the nextsection.
7 Crosstalk CancellationCrosstalk cancellation (also known as anti-crosstalk, cross-talk compensation or ghost-busting) can be used to reducethe visibility of crosstalk.105–107 When crosstalk cancellationis used, the crosstalk is still present but it is concealed by thecancellation process.
Crosstalk cancellation involves the pre-distortion of thestereoscopic image in a specially controlled manner beforedisplay. A simple example of the process of crosstalk can-cellation is illustrated in Fig. 24. Part (a) shows the leakageof the right image (unintended) channel into the left-eye viewin a system without crosstalk cancellation. Part (b) shows thecrosstalk cancellation process—the amount of leakage that isexpected to occur from the right channel to the left channel isevaluated and this amount is subtracted from the left imagecreating a modified left image (shown as anti-crosstalk in thefigure). When the modified left image is displayed on screenand viewed, the addition of the modified left image plus theleakage from the right image results in the equivalent of theoriginal left image (since the anti-crosstalk and the leakagecancel each other out).
A simple illustration of the process of crosstalk cancella-tion on a stereoscopic display. (a) An example of a stereo-scopic image with crosstalk visible to the left eye from theleakage of light from the right image channel. (b) An exam-ple of anti-crosstalk being applied to the left image so that
Fig. 23 Crosstalk measurement test chart designed by Bloos.104
Fig. 22 Crosstalk measurement test chart designed by Weissman.103
Journal of Electronic Imaging 040902-17 Oct–Dec 2012/Vol. 21(4)
Woods: Crosstalk in stereoscopic displays: a review
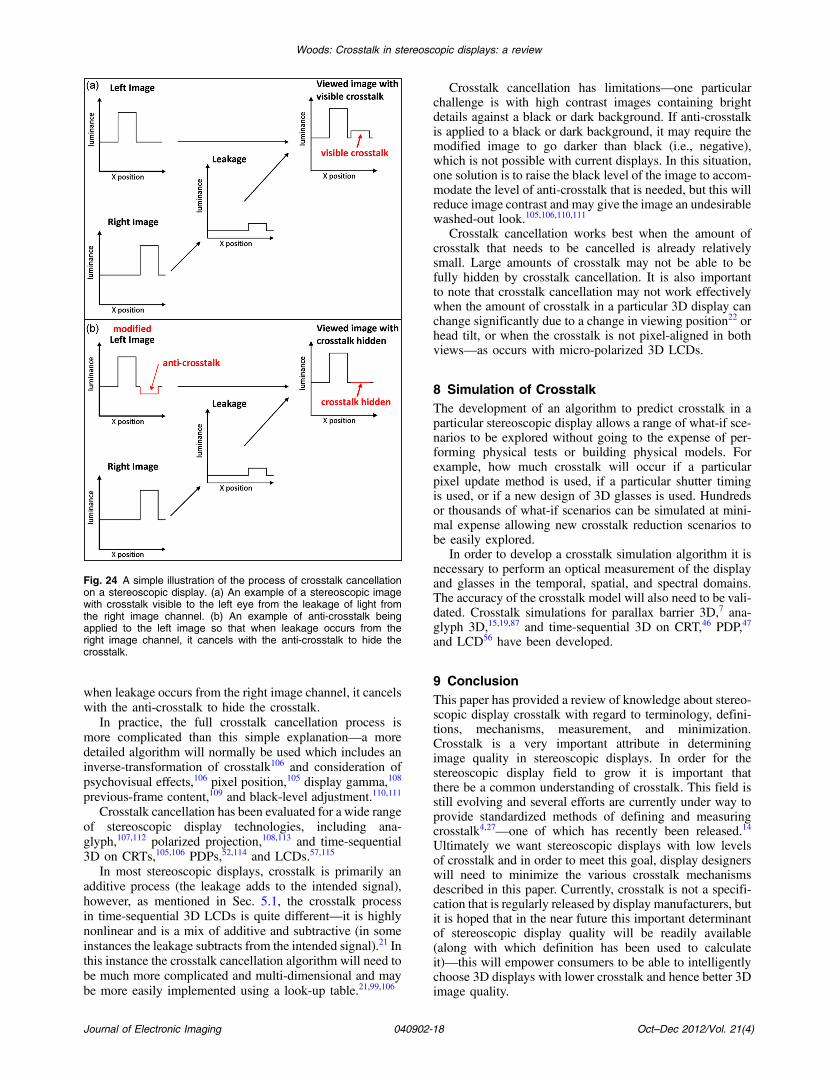
when leakage occurs from the right image channel, it cancelswith the anti-crosstalk to hide the crosstalk.
In practice, the full crosstalk cancellation process ismore complicated than this simple explanation—a moredetailed algorithm will normally be used which includes aninverse-transformation of crosstalk106 and consideration ofpsychovisual effects,106 pixel position,105 display gamma,108
previous-frame content,109 and black-level adjustment.110,111
Crosstalk cancellation has been evaluated for a wide rangeof stereoscopic display technologies, including ana-glyph,107,112 polarized projection,108,113 and time-sequential3D on CRTs,105,106 PDPs,52,114 and LCDs.57,115
In most stereoscopic displays, crosstalk is primarily anadditive process (the leakage adds to the intended signal),however, as mentioned in Sec. 5.1, the crosstalk processin time-sequential 3D LCDs is quite different—it is highlynonlinear and is a mix of additive and subtractive (in someinstances the leakage subtracts from the intended signal).21 Inthis instance the crosstalk cancellation algorithm will need tobe much more complicated and multi-dimensional and maybe more easily implemented using a look-up table.21,99,106
Crosstalk cancellation has limitations—one particularchallenge is with high contrast images containing brightdetails against a black or dark background. If anti-crosstalkis applied to a black or dark background, it may require themodified image to go darker than black (i.e., negative),which is not possible with current displays. In this situation,one solution is to raise the black level of the image to accom-modate the level of anti-crosstalk that is needed, but this willreduce image contrast and may give the image an undesirablewashed-out look.105,106,110,111
Crosstalk cancellation works best when the amount ofcrosstalk that needs to be cancelled is already relativelysmall. Large amounts of crosstalk may not be able to befully hidden by crosstalk cancellation. It is also importantto note that crosstalk cancellation may not work effectivelywhen the amount of crosstalk in a particular 3D display canchange significantly due to a change in viewing position22 orhead tilt, or when the crosstalk is not pixel-aligned in bothviews—as occurs with micro-polarized 3D LCDs.
8 Simulation of CrosstalkThe development of an algorithm to predict crosstalk in aparticular stereoscopic display allows a range of what-if sce-narios to be explored without going to the expense of per-forming physical tests or building physical models. Forexample, how much crosstalk will occur if a particularpixel update method is used, if a particular shutter timingis used, or if a new design of 3D glasses is used. Hundredsor thousands of what-if scenarios can be simulated at mini-mal expense allowing new crosstalk reduction scenarios tobe easily explored.
In order to develop a crosstalk simulation algorithm it isnecessary to perform an optical measurement of the displayand glasses in the temporal, spatial, and spectral domains.The accuracy of the crosstalk model will also need to be vali-dated. Crosstalk simulations for parallax barrier 3D,7 ana-glyph 3D,15,19,87 and time-sequential 3D on CRT,46 PDP,47
and LCD56 have been developed.
9 ConclusionThis paper has provided a review of knowledge about stereo-scopic display crosstalk with regard to terminology, defini-tions, mechanisms, measurement, and minimization.Crosstalk is a very important attribute in determiningimage quality in stereoscopic displays. In order for thestereoscopic display field to grow it is important thatthere be a common understanding of crosstalk. This field isstill evolving and several efforts are currently under way toprovide standardized methods of defining and measuringcrosstalk4,27—one of which has recently been released.14
Ultimately we want stereoscopic displays with low levelsof crosstalk and in order to meet this goal, display designerswill need to minimize the various crosstalk mechanismsdescribed in this paper. Currently, crosstalk is not a specifi-cation that is regularly released by display manufacturers, butit is hoped that in the near future this important determinantof stereoscopic display quality will be readily available(along with which definition has been used to calculateit)—this will empower consumers to be able to intelligentlychoose 3D displays with lower crosstalk and hence better 3Dimage quality.
Fig. 24 A simple illustration of the process of crosstalk cancellationon a stereoscopic display. (a) An example of a stereoscopic imagewith crosstalk visible to the left eye from the leakage of light fromthe right image channel. (b) An example of anti-crosstalk beingapplied to the left image so that when leakage occurs from theright image channel, it cancels with the anti-crosstalk to hide thecrosstalk.
Journal of Electronic Imaging 040902-18 Oct–Dec 2012/Vol. 21(4)
Woods: Crosstalk in stereoscopic displays: a review
AcknowledgmentsThe author would like to thank WA:ERA, iVEC, and JumboVision International as well as Stanley Tan, Tegan Rourke,Ka Lun Yuen, Kai Karvinen, Adin Sehic, Chris Harris andJesse Helliwell for their support of and contributions to someof the projects described in this paper. This paper is asignificantly expanded version of an earlier publishedmanuscript.116
References
1. L. Lipton, “The future of autostereoscopic electronic displays,” inStereoscopic Displays and Applications III, Proc. SPIE 1669,156–162 (1992).
2. W. W. Jacques, “Underground wires,” Science 6(126), 6–7 (1885).3. C. W. Earp, “Carrier wave transmission system,” U.S. Patent No.
2256317 (1941).4. A. J. Woods, “How are crosstalk and ghosting defined in the stereo-
scopic literature?” in Stereoscopic Displays and Applications XXII,Proc. SPIE 7863, 78630Z (2011).
5. A. J. Woods et al., Eds., “Stereoscopic displays and applications1990–2009: a complete 20-year retrospective and the engineering rea-lity of virtual reality 1994–2009 (Special Collection),” Selected SPIE/IS&T Papers on DVD-ROM, Vol. 51 (2010).
6. Y.-C. Chang et al., “Investigation of dynamic crosstalk for 3D dis-play,” presented at 2009 Int’l. Display Manufacturing Conf., 3D Sys-tems and Applications, and Asia Display (IDMC/3DSA/Asia Display2009), Taipei, Taiwan, SID, California (2009).
7. G. J. Woodgate et al., “Flat panel autostereoscopic displays—charac-terisation and enhancement,” in Stereoscopic Displays and VirtualReality Systems VII, Proc. SPIE 3957, 153–164 (2000).
8. C. D. Wickens et al., “Focused and divided attention in stereoscopicdepth,” in Stereoscopic Displays and Applications, Proc. SPIE 1256,28–34 (1990).
9. Y.-Y. Yeh and L. D. Silverstein, “Limits of fusion and depth judgmentin stereoscopic color displays,” Hum. Factors 32(1), 45–60 (1990).
10. S. Pala, R. Stevens, and P. Surman, “Optical crosstalk and visual com-fort of a stereoscopic display used in a real-time application,” inStereoscopic Displays and Virtual Reality Systems XIV, Proc. SPIE6490, 649011 (2007).
11. H. Stevenson and M. Khazova, “Patterned grating alignment of reac-tive mesogens for phase retarders,” in Proc. 24th Int’l. DisplayResearch Conf. with the 4th Int’l. Meeting on Information Display,Daegu, South Korea, pp. 1–4 (2004).
12. L. Lipton, “Glossary,” Lenny Lipton’s Blog, 16 March 2009, http://lennylipton.wordpress.com/2009/03/16/glossary/ (19 March 2010).
13. L. Lipton, “Factors affecting ‘ghosting’ time-multiplexed plano-stereoscopic CRT display systems,” in True 3D Imaging Techniquesand Display Technologies, Proc. SPIE 761, 75–78 (1987).
14. International Committee for Display Metrology, “Information displaymeasurements standard (version 1.03),” Society for Information Dis-play, http://icdm-sid.org/ (2012).
15. A. J. Woods and C. R. Harris, “Comparing levels of crosstalk with red/cyan, blue/yellow, and green/magenta anaglyph 3D glasses,” inStereoscopic Displays and Applications XXI, Proc. SPIE 7253,72530Q (2010).
16. K.-C. Huang et al., “Measurement of Contrast Ratios for 3D Display,”in Input/Output and Imaging Technologies II, Proc. SPIE 4080, 78–86(2000).
17. P. Boher et al., “Multispectral polarization viewing angle analysis ofcircular polarized stereoscopic 3D displays,” in Stereoscopic Displaysand Applications XXI, Proc. SPIE 7253, 72530R (2010).
18. ISO, “Ergonomics of human-system interaction—Part 331: Opticalcharacteristics of autostereoscopic displays,” Technical Report ISO/TR 9241-331 (2012).
19. A. J. Woods and C. R. Harris, “Using cross-talk simulation to predictthe performance of anaglyph 3-D glasses,” J. Soc. Inform. Display20(6), 304–315 (2012).
20. J.-C. Liou et al., “Shutter glasses stereo LCD with a dynamic back-light,” in Stereoscopic Displays and Applications XX, Proc. SPIE7237, 72370X (2009).
21. S. Shestak, D.-S. Kim, and S.-D. Hwang, “Measuring of gray-to-graycrosstalk in a LCD based time-sequential stereoscopic displays,”Soc. Inform. Display Symp. Digest Tech. Papers 41(1), 132–135(2010).
22. K.-C. Huang et al., “A study of how crosstalk affects stereopsis instereoscopic displays,” in Stereoscopic Displays and Virtual RealitySystems X, Proc. SPIE 5006, 247–253 (2003).
23. S.-M. Jung et al., “Improvement of 3-D crosstalk with over-drivingmethod for the active retarder 3-D displays,” Soc. Inform. DisplaySymp. Digest Tech. Papers 41(1) 1264–1267 (2010).
24. C.-C. Pan et al., “Cross-talk evaluation of shutter-type stereoscopic 3Ddisplay,” Soc. Inform. Display Symp. Digest Tech. Papers 41(1),128–131 (2010).
25. F.-H. Chen et al., “Gray-to-gray crosstalk model,” in 3DSA (ThreeDimensional Systems and Applications) Conf., pp. 213–216 (2012).
26. T. Järvenpää, M. Salmimaa, and T. Levola, “Qualified viewingspaces for near-to-eye and autostereoscopic displays,” Soc. Inform.Display Symp. Digest Tech. Papers 41(1), 335–338 (2010).
27. K. Teunissen et al., “Perceptually relevant characterization of stereo-scopic displays,” Soc. Inform. Display Symp. Digest Tech. Papers42(1), 994–997 (2011).
28. S. Shestak, D. Kim, and Y. Kim, “How much crosstalk can be allowedin a stereoscopic system at various grey levels?” in Stereoscopic Dis-plays and Applications XXIII, Proc. SPIE 8288, 828810 (2012).
29. T. Järvenpää and M. Salmimaa, “Optical characterization methods forautostereoscopic 3D displays,” in Proc. EuroDisplay, pp. 132–135,SID, California (2007).
30. S. Pastoor, “Human factors of 3D images: Results of recent researchat Heinrich-Hertz-Institut Berlin,” in Proc. IDW’95, Vol. 3D-7,pp. 69–72, IDW, Japan (1995).
31. Y. Nojiri et al., “Visual comfort/discomfort and visual fatigue causedby stereoscopic HDTV viewing,” in Stereoscopic Displays and VirtualReality Systems XI, Proc. SPIE 5291, 303–313 (2004).
32. F. L. Kooi and A. Toet, “Visual comfort of binocular and 3D displays,”Displays 25(2–3), 99–108 (2004).
33. P. J. H. Seuntiëns, L. M. J. Meesters, and W. A. Ijsselsteijn, “Percep-tual attributes of crosstalk in 3D images,” Displays 26(4–5), 177–183(2005).
34. K. Ukai and P. A. Howarth, “Visual fatigue caused by viewing stereo-scopic motion images: background, theories, and observations,”Displays 29(2), 106–116 (2008).
35. L. M. Wilcox and J. A. D. Stewart, “Determinants of perceived imagequality: Ghosting versus brightness,” in Stereoscopic Displays andVirtual Reality Systems X, Proc. SPIE 5006, 263–268 (2003).
36. R. F. Stevens, “Cross-talk in 3D displays,” Report CETM 56, NationalPhysical Laboratory, United Kingdom (2004).
37. I. Tsirlin, L. M. Wilcox, and R. S. Allison, “The effect of crosstalk onthe perceived depth from disparity and monocular occlusions,” IEEETrans. Broadcast. 57(2), 445–453 (2011).
38. L. Wang et al., “Effect of display technology on the crosstalk percep-tion in stereoscopic video content,” IEEE Trans. Circuits Syst. VideoTechnol. 22(9), 1257–1265 (2012).
39. I. Tsirlin, L. M. Wilcox, and R. S. Allison, “Effect of crosstalk ondepth magnitude in thin structures,” J. Electron. Imaging 21(1),011003 (2012).
40. L. Chen et al., “Investigation of crosstalk in a 2-view 3D display,” Soc.Inform. Display Symp. Digest Tech. Papers 39(1), 1138–1141 (2008).
41. I. Tsirlin, R. S. Allison, and L. M. Wilcox, “Crosstalk reduces theamount of depth seen in 3D images of natural scenes,” in StereoscopicDisplays and Applications XXIII, Proc. SPIE 8288, 82880W(2012).
42. L. Hammond, “Stereoscopic motion picture device,” U.S. Patent No.1506524 (1924).
43. J. A. Roese, “PLZT stereoscopic television system,” U.S. Patent No.3903358 (1975).
44. J. A. Roese and A. S. Khalafalla, “Stereoscopic viewing with PLZTceramics,” Ferroelectrics 10(1), 47–51 (1976).
45. L. Lipton, “Brief history of electronic stereoscopic displays,” Opt.Eng. 51(2), 021103 (2012).
46. A. J. Woods and S. S. L. Tan, “Characterising sources of ghosting intime-sequential stereoscopic video displays,” in Stereoscopic Displaysand Virtual Reality Systems IX, Proc. SPIE 4660, 66–77 (2002).
47. A. J. Woods and K. S. Karvinen, “The compatibility of consumerplasma displays with time-sequential stereoscopic 3D visualization,”in Stereoscopic Displays and Applications XIX, Proc. SPIE 6803,68030X (2008).
48. A. J. Woods and K.-L. Yuen, “Compatibility of LCD monitors withframe-sequential stereoscopic 3D visualisation,” IMID/IDMC’06Digest 6th Int’l. Meeting on Information Display and 5th Int’l. DisplayManufacturing Conf., pp. 98–102, SID, California (2006).
49. A. J. Woods and T. Rourke, “The compatibility of consumer DLP pro-jectors with time-sequential stereoscopic 3D visualization, Stereo-scopic Displays and Virtual Reality Systems XIV, Proc. SPIE 6490,64900V (2007).
50. H. Pan, X.-F. Feng, and S. Daly, “LCD motion blur modeling andanalysis,” IEEE Int’l. Conf. Image Processing, Vol. 2, pp. 21–24(2005).
51. P. J. Bos, “Performance limits of stereoscopic viewing systems usingactive and passive glasses,” IEEE Virtual Reality Annual Intl. Symp.,pp. 371–376, IEEE, Seattle, Washington (1993); H. Kusaka, “Timesequential stereoscopic displays: the contribution of phosphor persis-tence to the ‘ghost’ image intensity,” in Proc. ITEC’91 Annual Conf.Three-Dimensional Image Tech., pp. 603–606 (1991).
52. K. Hamada et al., “A field-sequential stereoscopic display systemwith 42-in. HDTV DC-PDP,” in Proc. Intl. Display WorkshopIDW’98, pp. 555–558, IDW, Japan (1998).
Journal of Electronic Imaging 040902-19 Oct–Dec 2012/Vol. 21(4)
Woods: Crosstalk in stereoscopic displays: a review

53. K. Hamada et al., “A 3D Hi-Vision Display with 50-in. AC PDP,” inAsia Display/Intl. Display Workshop IDW’01, pp. 785–788, IDW,Japan (2001).
54. A. J. Woods, “The illustrated 3D HDTV list,” (28 March 2012), www.3dmovielist.com/3dhdtvs.html (15 May 2012).
55. A. J. Woods, “The Illustrated 3D monitor list,” (2012), http://www.3dmovielist.com/3dmonitors.html (13 May 2012).
56. A. J. Woods and A. Sehic, “The compatibility of LCD TVs with time-sequential stereoscopic 3D visualization,” in Stereoscopic Displaysand Applications XX, Proc. SPIE 7237, 72370N (2009).
57. S. Shestak and D.-S. Kim, “Application of pi-cells in time-multiplexedstereoscopic and autostereoscopic displays, based on LCD panels,” inStereoscopic Displays and Virtual Reality Systems XIV, Proc. SPIE6490, 64900Q (2007).
58. G. A. Slavenburg, T. F. Fox, and D. R. Cook, “System, method, andcomputer program product for increasing an LCD display verticalblanking interval,” U.S. Patent Application Publication20070229487 A1 (2007).
59. S.-M. Park et al., “Method and apparatus for displaying stereoscopicimage,” U.S. Patent Application Publication 2010/0066820 A1(2010).
60. M. Husak et al., “System and method for synchronizing a 3D videoprojector,” U.S. Patent No. 8066377 (2011).
61. L. J. Hornbeck, “Current status and future applications for DMD-based projection displays,” in Proc. Fifth Intl. Display WorkshopIDW’98, Japan, pp. 1–4 (1998).
62. V. Walworth, S. Bennett, and G. Trapani, “Three-dimensional projec-tion with circular polarizers,” in Optics in Entertainment II, Proc.SPIE 0462, 64–68 (1984).
63. “XP42 linear polarizer filters datasheet,” Optical Filters United King-dom, http://www.opticalfilters.co.uk.
64. “Circular Polarizers—APNCP37,” American Polarizers, Inc., http://www.apioptics.com/pdf/APNCP37-010-STD.pdf (28 March 2010).
65. H.-K. Hong et al., “Analysis of angular dependence of 3-D technologyusing polarized eyeglasses,” J. Soc. Inform. Display 18(1), 8–12(2010).
66. G. Themelis, “Comparison of stereo projection screens,” (April 2003),http://www.drt3d.com/info/ScreenTesting.htm (28 March 2010).
67. L. Lipton et al., “Method and system employing a push-pull liquidcrystal modulator,” U.S. Patent No. 4792850 (1988).
68. T. Haven, “A liquid crystal stereoscope with high extinction ratios, a28% transmission state, and one hundred microsecond switching,” inTrue Three-Dimensional Imaging Techniques and Display Technolo-gies, Proc. SPIE 761, 23–26 (1987).
69. J. Osterman and T. Scheffer, “Contrast-enhanced high-speed polariza-tion modulator for active-retarder 3D displays,” Soc. Inform. DisplaySymp. Digest Tech. Papers 42(1), 93–96 (2011).
70. Y. H. Lee and Y. B. Jung, “Stereoscopic image projecting system usingcircularly polarized filter module,” U.S. Patent Application Publica-tion 2010/0079728 A1 (2010).
71. J. Konrad and M. Halle, “3-D displays and signal processing: ananswer to 3-D Ills?” IEEE Signal Process. Mag. 24(6), 97–111(2007).
72. S. M. Faris, “Micro-polarizer arrays applied to a new class of stereo-scopic imaging,” in SID 91 Digest, pp. 840–843 (1991).
73. A. J. Woods, “3-D displays in the home,” Inform. Display 25(7), 8–12(2009).
74. S. M. Faris, “Novel 3D stereoscopic imaging technology,” in Stereo-scopic Displays and Virtual Reality Systems XI, Proc. SPIE 5291,180–195 (2004).
75. S. J. Lee et al., “Review of wire grid polarizer and retarder for stereo-scopic display,” in Stereoscopic Displays and Applications XX, Proc.SPIE 7237, 72370P (2009).
76. Y. Yoshihara, “About Micro-Pol for 3D LCD” (English translation ofJapanese title), 3D Consortium (June 2003) (presentation only).
77. C.-Y. Ma et al., “A simulation platform and crosstalk analysis for pat-terned retarder 3D display,” Soc. Inform. Display Symp. Digest. Tech.Papers 42(1), 808–811 (2011).
78. A. Marraud and M. Bonne, “Restitution of a stereoscopic picture bymeans of a lenticular sheet,” in Three-Dimensional Imaging, Proc.SPIE 402, 129–132 (1983).
79. J. B. Eichenlaub, “An autostereoscopic display for use with a personalcomputer,” in Stereoscopic Displays and Applications, Proc. SPIE1256, 156–163 (1990).
80. A. Boev, A. Gotchev, and K. Egiazarian, “Crosstalk measurementmethodology for autostereoscopic screens,” in 3DTV Conference,pp. 1–4, IEEE, Kos Island (2007).
81. R. Patterson, “Human factors of 3-D displays,” J. Soc. Inform. Display15(11), 861–871 (2007).
82. A. Jain and J. Konrad, “Crosstalk in automultiscopic 3-D displays:blessing in disguise?” in Stereoscopic Displays and Virtual RealitySystems XIV, Proc. SPIE 6490, 649012 (2007).
83. E. Dubois, “A projection method to generate anaglyph stereo images,”in IEEE Intl. Conf. Acoustics, Speech, and Signal ProcessingProc. ICASSP’01, Vol. 3, pp. 1661–1664, IEEE, Salt Lake City,Utah (2001).
84. W. R. Sanders and D. F. McAllister, “Producing anaglyphs from syn-thetic images,” Stereoscopic Displays and Virtual Reality Systems X,Proc. SPIE 5006, 348–358 (2003).
85. D. F. McAllister, Y. Zhou, and S. Sullivan, “Methods for computingcolor anaglyphs,” in Stereoscopic Displays and Applications XXI,Proc. SPIE 7524, 75240S (2010).
86. A. J. Woods and T. Rourke, “Ghosting in anaglyphic stereoscopicimages,” in Stereoscopic Displays and Virtual Reality Systems XI,Proc. SPIE 5291, 354–365 (2004).
87. A. J. Woods, K.-L. Yuen, and K. S. Karvinen, “Characterizingcrosstalk in anaglyphic stereoscopic images on LCD monitorsand plasma displays,” J. Soc. Inform. Display 15(11), 889–898(2007).
88. H. Jorke and M. Fritz, “Stereo projection using interference filters,” inStereoscopic Displays and Virtual Reality Systems XIII, Proc. SPIE6055, 60550G (2006).
89. M. J. Richards and G. D. Gomes, “Spectral separation filters for 3Dstereoscopic D-cinema presentation,” U.S. Patent No. 7,959,295 B2(2011).
90. C. Wheatstone, “Contributions to the physiology of vision—Part thefirst on some remarkable, and hitherto unobserved, phenomena ofbinocular vision,” Philos. Trans. Roy. Soc. Lond. 128, 371–394(1838).
91. S. S. Fisher et al., “Virtual Environment Display System,” Proc.Workshop Interactive 3D Graphics, pp. 1–11, ACM, New York(1986).
92. W.Woo, N. Kim, and Y. Iwadate, “Stereo imaging using a camera withstereoscopic adapter,” Proc. IEEE Syst., Man Cybern., pp. 1512–1517,IEEE, Nashville, Tennessee (2000).
93. J. Goodman, “Development of the 960p stereoscopic video format,” inStereoscopic Displays and Virtual Reality Systems X, Proc. SPIE5006, 187–194 (2003).
94. A. Millin and P. Harman, “Three-dimensions via the Internet,” inStereoscopic Displays and Virtual Reality Systems VIII, Proc. SPIE4297, 328–333 (2001).
95. CIE, Commission Internationale de l’Eclairage Proceedings, Cam-bridge University Press, Cambridge, England (1932).
96. A. Stockman and L. T. Sharpe, “Luminous energy function (2 degree,linear energy),” (2007), http://www.cvrl.org/cvrlfunctions.htm andhttp://www.cvrl.org/database/text/lum/CIE2008v2.htm (29 July2011).
97. A. Stockman et al., “The dependence of luminous efficiency on chro-matic adaptation,” J. Vision 8(16), 1–26 (2008).
98. M. Barkowsky et al., “Crosstalk measurements of shutter glasses 3Ddisplays,” Soc. Inform. Display Digest Tech. Papers 42(1), 812–815(2011).
99. S. Tourancheau et al., “Reproducibility of crosstalk measurements onactive glasses 3D LCD displays based on temporal characterization,”in Stereoscopic Displays and Applications XXIII, Proc. SPIE 8288,82880Y (2012).
100. J. Lee et al., “Optical performance analysis method of auto-stereo-scopic 3D displays,” Soc. Inform. Display Digest Tech. Papers41(1), 327–330 (2010).
101. L. Blondé et al., “Diversity and coherence of 3D crosstalk measure-ments,” Soc. Inform. Display Digest Tech. Papers 42(1), 804–807(2011).
102. M. Barkowsky et al., “Crosstalk measurements of shutter glasses 3Ddisplays,” Soc. Inform. Display Digest Tech. Papers 42(1), 812–815(2011).
103. M. A. Weissman and A. J. Woods, “A simple method formeasuring crosstalk in stereoscopic displays,” in StereoscopicDisplays and Applications XXII, Proc. SPIE 7863, 786310(2011).
104. W. Bloos, “Ghosting test—standard method for determining ghostimage,” Stereo Forum, 5 June 2008, http://www.stereoforum.org/viewtopic.php?f=16&t=53 (25 March 2010).
105. J. S. Lipscomb and W. L. Wooten, “Reducing crosstalk betweenstereoscopic views,” in Stereoscopic Displays and Virtual Reality Sys-tems, Proc. SPIE 2177, 92–96 (1994).
106. J. Konrad, B. Lacotte, and E. Dubois, “Cancellation of image crosstalkin time-sequential displays of stereoscopic video,” IEEE Trans. ImageProcess. 9(5), 897–908 (2000).
107. A. J. Chang et al., “Ghosting reduction method for color anaglyphs,”in Stereoscopic Displays and Applications XIX, Proc. SPIE 6803,68031G (2008).
108. M. Cowan, J. Greer, and L. Lipton, “Ghost-compensation forimproved stereoscopic projection,” U.S. Patent Application Publica-tion 2011/0025832 A1 (2011).
109. G. A. Slavenburg, T. F. Fox, and D. R. Cook, “System, method,and computer program product for compensating for crosstalkduring the display of stereo content,” U.S. Patent No. 8085217 B2(2011).
110. W. Tan, S. Z. Zhou, and S. C. Read, “Methods and systems for redu-cing or eliminating perceived ghosting in displayed stereoscopicimages,” U.S. Patent Application Publication 2001/0080401 A1(2011).
Journal of Electronic Imaging 040902-20 Oct–Dec 2012/Vol. 21(4)
Woods: Crosstalk in stereoscopic displays: a review

111. D. J. McKnight, “Enhanced ghost compensation for stereoscopicimagery,” U.S. Patent Application Publication 2010/0040280 A1(2010).
112. H. Sanftmann and D. Weiskopf, “Anaglyph stereo without ghosting,”Comput. Graphics Forum 30(4), 1251–1259 (2011).
113. S. Klimenko et al., “Crosstalk reduction in passive stereo-projectionsystems,” in Proc. Eurographics’03, pp. 235–240 (2003).
114. T. Kim et al., “3D crosstalk compensation to enhance 3D image qual-ity of plasma display panel,” IEEE Trans. Consum. Electron. 57(4),1471–1477 (2011).
115. B. Li and J. Caviedes, “Evaluating the impact of crosstalk on shutter-type stereoscopic 3D displays,” in Sixth Int’l. Workshop on VideoProcessing and Quality Metrics, pp. 1–6 (2012).
116. A. J. Woods, “Understanding crosstalk in stereoscopic displays,”in 3DSA (Three-Dimensional Systems and Applications) Conf.,pp. 34–44 (2010).
Andrew J. Woods is a consultant andresearch engineer at Curtin University’s Cen-tre for Marine Science and Technology inPerth, Australia. He has more than 20years of experience in the design, applica-tion, and evaluation of stereoscopic videoequipment for industrial and entertainmentapplications. He has bachelor’s and master’sdegrees in electronic engineering, specializ-ing in stereoscopic imaging. He is also co-chair of the annual Stereoscopic Displays
and Applications Conference—the largest and longest running tech-nical stereoscopic 3D imaging conference.
Journal of Electronic Imaging 040902-21 Oct–Dec 2012/Vol. 21(4)
Woods: Crosstalk in stereoscopic displays: a review

Paper 2 [Refereed Journal Article]
A. J. Woods, K. L. Yuen, and K. S. Karvinen (2007) “Characterizing crosstalk in anaglyphic stereoscopic images on LCD monitors and plasma displays” in Journal of the Society for Information Display, Volume 15, Issue 11, pp. 889‐898, November 2007.

Characterizing crosstalk in anaglyphic stereoscopic images on LCD monitors andplasma displays
Andrew J. WoodsKa Lun YuenKai S. Karvinen
Abstract — In 1853, William Rollman1 developed the inexpensive and easy to use anaglyph methodfor displaying stereoscopic images. Although it can be used with nearly any type of full-color display,the anaglyph method compromises the accuracy of color reproduction, and it often suffers from cros-stalk (or ghosting) between the left- and right-eye image channels. Crosstalk degrades the ability ofthe observer to fuse the stereoscopic image, and hence reduces the quality of the 3-D image. Crosstalkis present in various levels with most stereoscopic displays; however, it is often particularly evidentwith anaglyphic 3-D images. This paper summarizes the results of two projects that characterized thepresence of anaglyphic crosstalk due to spectral issues on 13 LCD monitors, 14 plasma displays, anda CRT monitor when used with 25 different pairs of anaglyph 3-D glasses. A mathematical model wasused to predict the amount of crosstalk in anaglyphic 3-D images when different combinations ofdisplays and glasses are used, and therefore highlight displays, glasses, and combinations thereofwhich exhibit lower levels of crosstalk when displaying anaglyphic 3-D images.
Keywords — Anaglyph, 3-D, stereoscopic, crosstalk, ghosting, LCD monitors, plasma displays, CRTdisplays.
1 IntroductionThe anaglyph method of displaying stereoscopic imagesuses a complementary color-coding technique to send sepa-rate left and right views to an observer’s two eyes. The twoperspective images of a stereo-pair are stored in comple-mentary color channels of the display, and the observerwears a pair of glasses containing color filters which act topass the correct image but block the incorrect image to eacheye.
For example, if a red/cyan anaglyph is used, the leftperspective image is stored in the red color channel and theright perspective image is stored in the blue and green colorchannels (blue + green = cyan), and the observer wears apair of anaglyph 3-D glasses with the left-eye filter red andthe right-eye filter cyan.
The main advantages of the anaglyph 3-D method areits simplicity, low cost, and compatibility with any full-colordisplay. The main disadvantages are its inability to accu-rately depict full-color images, and commonly the presenceof crosstalk. Crosstalk (or ghosting) is the leaking of animage to one eye when it is intended exclusively for theother eye. For example, the left eye should only be able tosee the left perspective image, but due to crosstalk, the lefteye may see a small proportion of the right perspectiveimage. Crosstalk occurs with most stereoscopic displays andresults in reduced image quality and difficulty of fusion ifthe amount of crosstalk is large.
This paper considers the two spectral contributors toanaglyphic crosstalk: display spectral response and anaglyphglasses spectral response. Two other possible contributors to
anaglyph ghosting, image compression and image encod-ing/transmission,2 are not explored in this paper.
Figure 1 provides an illustration of the process of cros-stalk in anaglyph stereoscopic images due to spectral leak-age (as illustrated for the red/cyan method). Firstly, thedisplay has a specific spectral output for the red, green, andblue color channels. Usually the left perspective image isstored in the red color channel and the right perspectiveimage is stored in the green and blue color channels (cyan).Second, the red/cyan anaglyph 3-D glasses used to view theanaglyph display also have a certain spectral transmissionresponse for the left and right eye filters. Here the left filterpredominantly transmits red light but with a little bit oftransmission in the green band, and the right filter predomi-nantly transmits blue and green light but with a little bit oftransmission in the red band. Due to the non-ideal nature ofthe display and the glasses, some light from the right (cyan)color channel leaks through the left (red) eye filter. Simi-larly, some light from the left (red) color channel leaks. Thisis in addition to the transmission of the intended imagethrough the left- and right-eye filters. Therefore, the lefteye predominantly sees the left perspective image but witha small amount of the right perspective image visible, andthe right eye predominantly sees the right perspectiveimage but with a small amount of the left perspective imagevisible.
This paper carries on from the work of Woods andRourke2 which considered anaglyph ghosting with cathode-ray tube (CRT) monitors, one liquid-crystal display (LCD)monitor, and a mixture of LCD and digital light processing(DLP) projectors. This paper focuses on anaglyph ghostingon LCD monitors and plasma displays with 13 LCD moni-
The authors are with the Centre for Marine Science & Technology, Curtin University of Technology, GPO Box U1987, Perth, WA 6845 Australia;telephone +61-8-9266-7920, fax –4799, e-mail: A.Woods cmst.curtin.edu.au.
© Copyright 2007 Society for Information Display 1071-0922/07/1511-0889$1.00
Journal of the SID 15/11, 2007 889
The paper is copyright Society for Information Display (SID) and is included in this thesis with their permission.
A. J. Woods, K. L. Yuen, K. S. Karvinen (2007) “Characterizing crosstalk in anaglyphic stereoscopic images on LCD monitors and plasma displays” in Journal of the Society for Information Display, Volume 15, Issue 11, pp. 889‐898, November 2007.
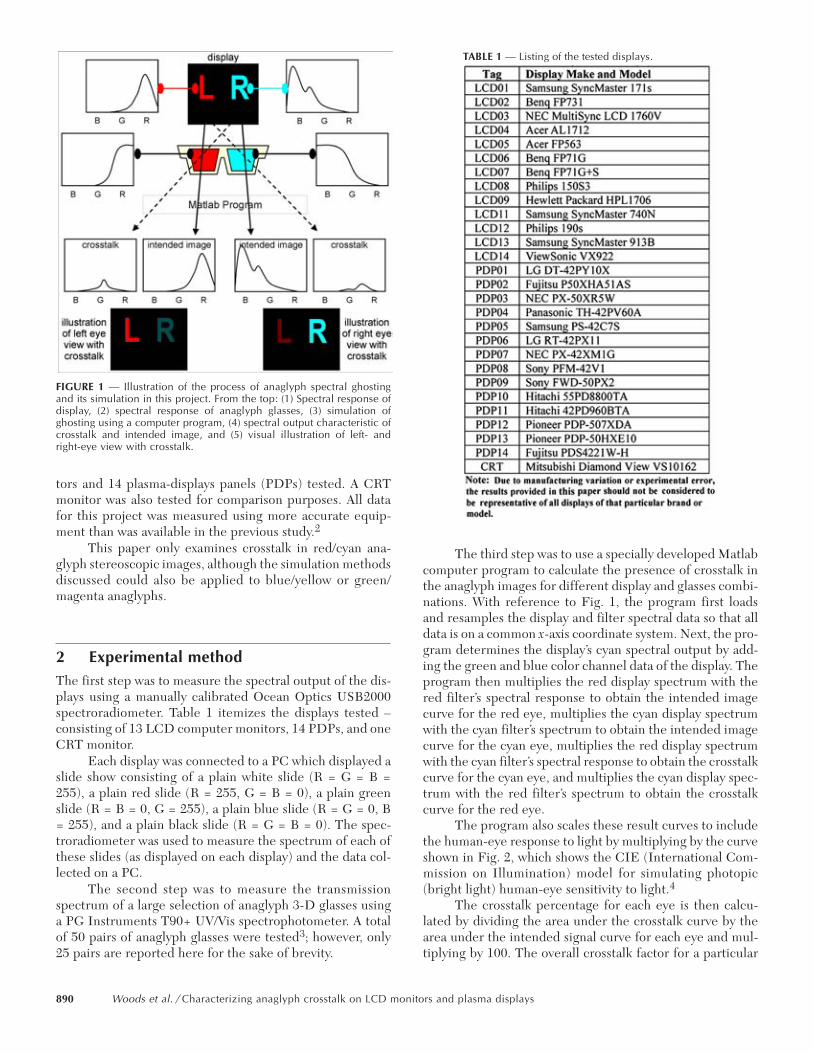
tors and 14 plasma-displays panels (PDPs) tested. A CRTmonitor was also tested for comparison purposes. All datafor this project was measured using more accurate equip-ment than was available in the previous study.2
This paper only examines crosstalk in red/cyan ana-glyph stereoscopic images, although the simulation methodsdiscussed could also be applied to blue/yellow or green/magenta anaglyphs.
2 Experimental methodThe first step was to measure the spectral output of the dis-plays using a manually calibrated Ocean Optics USB2000spectroradiometer. Table 1 itemizes the displays tested –consisting of 13 LCD computer monitors, 14 PDPs, and oneCRT monitor.
Each display was connected to a PC which displayed aslide show consisting of a plain white slide (R = G = B =255), a plain red slide (R = 255, G = B = 0), a plain greenslide (R = B = 0, G = 255), a plain blue slide (R = G = 0, B= 255), and a plain black slide (R = G = B = 0). The spec-troradiometer was used to measure the spectrum of each ofthese slides (as displayed on each display) and the data col-lected on a PC.
The second step was to measure the transmissionspectrum of a large selection of anaglyph 3-D glasses usinga PG Instruments T90+ UV/Vis spectrophotometer. A totalof 50 pairs of anaglyph glasses were tested3; however, only25 pairs are reported here for the sake of brevity.
The third step was to use a specially developed Matlabcomputer program to calculate the presence of crosstalk inthe anaglyph images for different display and glasses combi-nations. With reference to Fig. 1, the program first loadsand resamples the display and filter spectral data so that alldata is on a common x-axis coordinate system. Next, the pro-gram determines the display’s cyan spectral output by add-ing the green and blue color channel data of the display. Theprogram then multiplies the red display spectrum with thered filter’s spectral response to obtain the intended imagecurve for the red eye, multiplies the cyan display spectrumwith the cyan filter’s spectrum to obtain the intended imagecurve for the cyan eye, multiplies the red display spectrumwith the cyan filter’s spectral response to obtain the crosstalkcurve for the cyan eye, and multiplies the cyan display spec-trum with the red filter’s spectrum to obtain the crosstalkcurve for the red eye.
The program also scales these result curves to includethe human-eye response to light by multiplying by the curveshown in Fig. 2, which shows the CIE (International Com-mission on Illumination) model for simulating photopic(bright light) human-eye sensitivity to light.4
The crosstalk percentage for each eye is then calcu-lated by dividing the area under the crosstalk curve by thearea under the intended signal curve for each eye and mul-tiplying by 100. The overall crosstalk factor for a particular
FIGURE 1 — Illustration of the process of anaglyph spectral ghostingand its simulation in this project. From the top: (1) Spectral response ofdisplay, (2) spectral response of anaglyph glasses, (3) simulation ofghosting using a computer program, (4) spectral output characteristic ofcrosstalk and intended image, and (5) visual illustration of left- andright-eye view with crosstalk.
TABLE 1 — Listing of the tested displays.
890 Woods et al. / Characterizing anaglyph crosstalk on LCD monitors and plasma displays
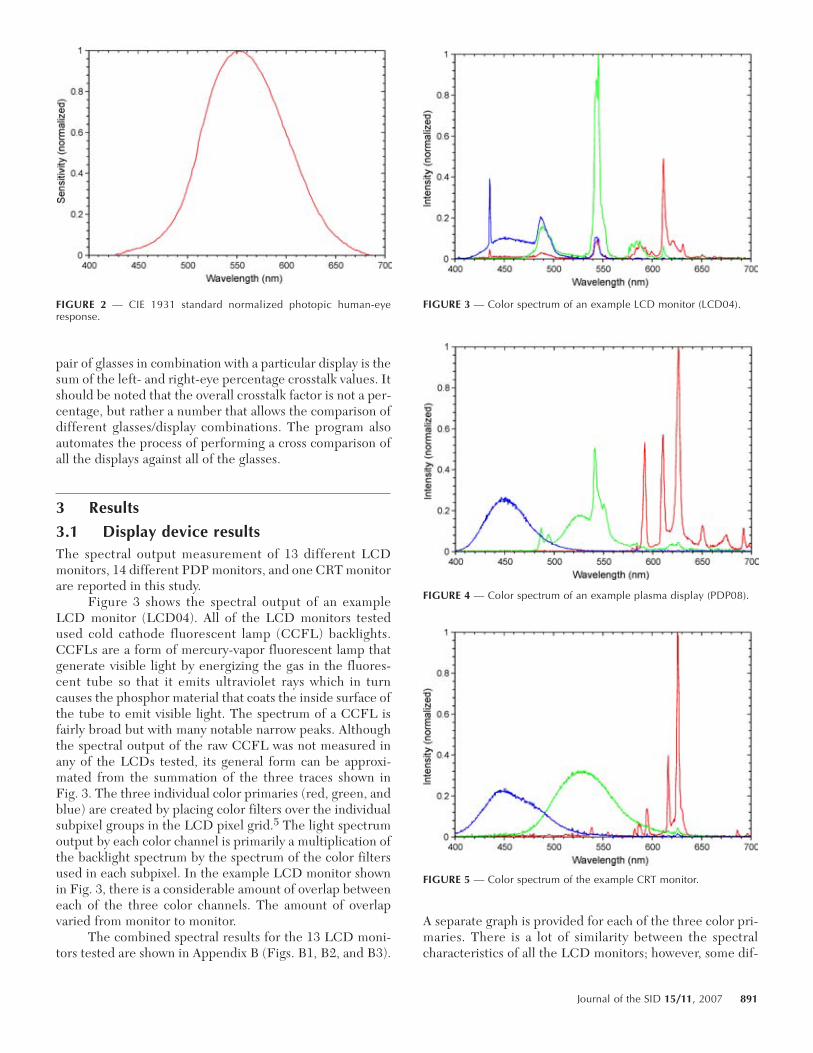
pair of glasses in combination with a particular display is thesum of the left- and right-eye percentage crosstalk values. Itshould be noted that the overall crosstalk factor is not a per-centage, but rather a number that allows the comparison ofdifferent glasses/display combinations. The program alsoautomates the process of performing a cross comparison ofall the displays against all of the glasses.
3 Results
3.1 Display device resultsThe spectral output measurement of 13 different LCDmonitors, 14 different PDP monitors, and one CRT monitorare reported in this study.
Figure 3 shows the spectral output of an exampleLCD monitor (LCD04). All of the LCD monitors testedused cold cathode fluorescent lamp (CCFL) backlights.CCFLs are a form of mercury-vapor fluorescent lamp thatgenerate visible light by energizing the gas in the fluores-cent tube so that it emits ultraviolet rays which in turncauses the phosphor material that coats the inside surface ofthe tube to emit visible light. The spectrum of a CCFL isfairly broad but with many notable narrow peaks. Althoughthe spectral output of the raw CCFL was not measured inany of the LCDs tested, its general form can be approxi-mated from the summation of the three traces shown inFig. 3. The three individual color primaries (red, green, andblue) are created by placing color filters over the individualsubpixel groups in the LCD pixel grid.5 The light spectrumoutput by each color channel is primarily a multiplication ofthe backlight spectrum by the spectrum of the color filtersused in each subpixel. In the example LCD monitor shownin Fig. 3, there is a considerable amount of overlap betweeneach of the three color channels. The amount of overlapvaried from monitor to monitor.
The combined spectral results for the 13 LCD moni-tors tested are shown in Appendix B (Figs. B1, B2, and B3).
A separate graph is provided for each of the three color pri-maries. There is a lot of similarity between the spectralcharacteristics of all the LCD monitors; however, some dif-
FIGURE 2 — CIE 1931 standard normalized photopic human-eyeresponse.
FIGURE 3 — Color spectrum of an example LCD monitor (LCD04).
FIGURE 4 — Color spectrum of an example plasma display (PDP08).
FIGURE 5 — Color spectrum of the example CRT monitor.
Journal of the SID 15/11, 2007 891

ferences occur in the out-of-band rejection (e.g., theamount of green light present in the red color primary)which will probably be related to the quality of color filtersused for each of the color primaries.
Figure 4 shows the spectral output of an exampleplasma display (PDP08). Color plasma displays generate vis-ible light by energizing a gas mixture in each cell so that itemits ultraviolet light rays which in turn causes the phos-phor material that coats the inside of each cell to emit visiblelight. The spectral output of each of the color channels isdetermined by the phosphor formulation used for eachgroup of subpixels.6 The blue output has a classic bell-shaped curve centered around 450 nm. The red output is amixture of several narrow peaks and the green output is amixture of a bell curve and another major narrow peak.
The combined spectral results for all of the 14 plasmadisplays tested are shown in Appendix B (Figs. B4, B5, andB6). A separate graph is provided for each of the three colorprimaries. The color spectrum of the red and blue color pri-maries are very similar across all the tested plasma displays;however, there is a lot of variation of the spectral responseof the green color primary which will probably relate to theformulation of the phosphors used.
Figure 5 shows the spectral output of an example CRTmonitor. A previous paper by Woods and Tan7 reported that11 tested CRT monitors had almost exactly the same spec-tral response which suggests that most CRTs use the samephosphor formulation for each of the color primary chan-nels. The blue and green output have a bell-shaped curvewhereas the red output is made up of several narrow peaks.
3.2 Anaglyph 3-D glasses resultsFigure 4 shows the spectral transmission of an example pairof red-cyan anaglyph glasses. In this example the red filterhas a pass band of wavelengths roughly 600–700 nm. Thecyan filter has a pass band of wavelengths roughly 550–400nm. As can be seen in Fig. 4, a little bit of light at the wave-length of around 590 nm will be transmitted through boththe red and cyan filters, therefore arriving at both eyes.When this overlap occurs it is another possible source ofcrosstalk.
All of the anaglyph glasses reported in this paper arelisted in Table 2. This list is substantially similar to thatreported in Woods and Rourke2 except that all pairs ofglasses have been retested using a more accurate instru-ment.
The spectral transmission of all the glasses from Table2 are shown overlaid in Fig. 7 (red filters) and Fig. 8 (cyanfilters). It can be seen that there is considerable variationbetween the spectral response of the various glasses tested.There is some clustering of some of the data, however, thisis probably due to some glasses being from the same manu-facturer or manufacturing process.
3.3 Crosstalk calculation resultsThe crosstalk and uncertainty results calculated by the Mat-lab program for the combination of all displays against allanaglyph glasses are shown in Tables C1 and C2 in AppendixC. For each display/glasses combination, the table lists thepercentage crosstalk for the red eye (top left), the percent-age crosstalk for the cyan eye (top right), and the overallcrosstalk factor for both eyes combined (bottom). The over-all crosstalk factor is the sum of the left- and right-eye per-centages, and as such is not a percentage. The uncertaintyfigures are only shown for the overall crosstalk factor. Theuncertainty figures were calculated for the individual redand cyan crosstalk but are omitted here due to space limita-tions.
3.4 Validation testA first-order validation test was performed to confirm thatthe results from the crosstalk model were sensible. A set of
FIGURE 6 — Spectral transmission of an example pair of anaglyph 3-Dglasses (3DG16).
FIGURE 7 — Spectral transmission for all the red filters.
892 Woods et al. / Characterizing anaglyph crosstalk on LCD monitors and plasma displays
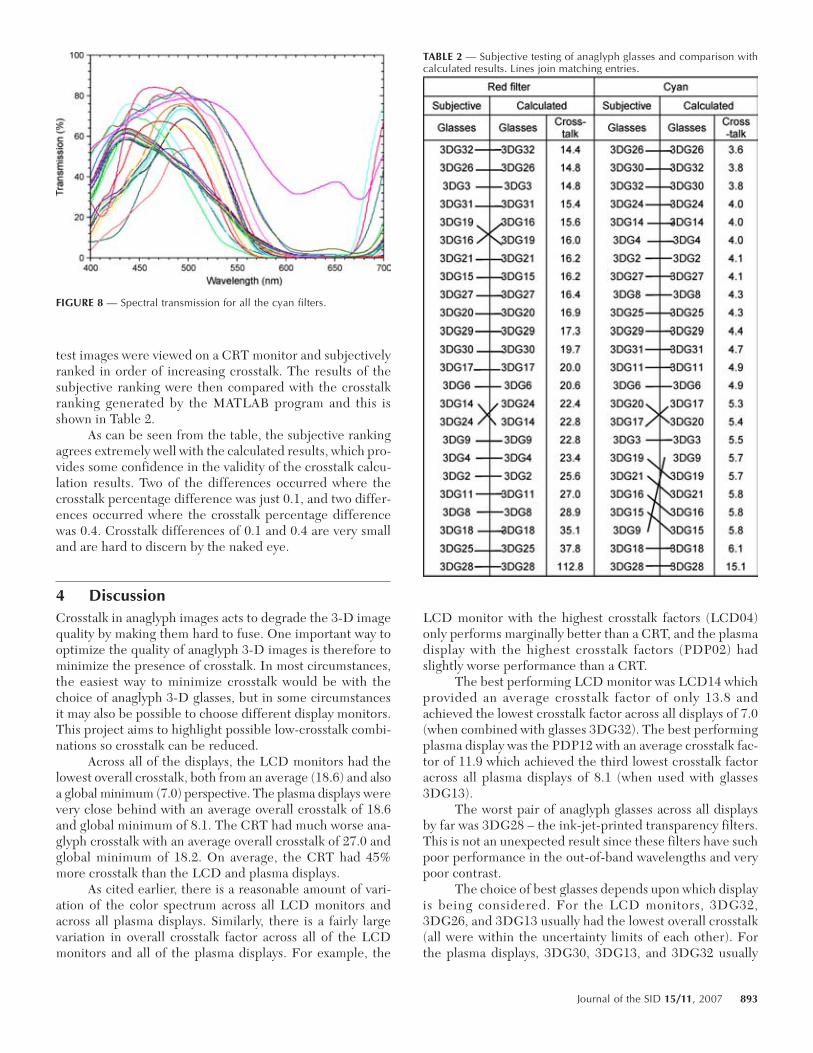
test images were viewed on a CRT monitor and subjectivelyranked in order of increasing crosstalk. The results of thesubjective ranking were then compared with the crosstalkranking generated by the MATLAB program and this isshown in Table 2.
As can be seen from the table, the subjective rankingagrees extremely well with the calculated results, which pro-vides some confidence in the validity of the crosstalk calcu-lation results. Two of the differences occurred where thecrosstalk percentage difference was just 0.1, and two differ-ences occurred where the crosstalk percentage differencewas 0.4. Crosstalk differences of 0.1 and 0.4 are very smalland are hard to discern by the naked eye.
4 DiscussionCrosstalk in anaglyph images acts to degrade the 3-D imagequality by making them hard to fuse. One important way tooptimize the quality of anaglyph 3-D images is therefore tominimize the presence of crosstalk. In most circumstances,the easiest way to minimize crosstalk would be with thechoice of anaglyph 3-D glasses, but in some circumstancesit may also be possible to choose different display monitors.This project aims to highlight possible low-crosstalk combi-nations so crosstalk can be reduced.
Across all of the displays, the LCD monitors had thelowest overall crosstalk, both from an average (18.6) and alsoa global minimum (7.0) perspective. The plasma displays werevery close behind with an average overall crosstalk of 18.6and global minimum of 8.1. The CRT had much worse ana-glyph crosstalk with an average overall crosstalk of 27.0 andglobal minimum of 18.2. On average, the CRT had 45%more crosstalk than the LCD and plasma displays.
As cited earlier, there is a reasonable amount of vari-ation of the color spectrum across all LCD monitors andacross all plasma displays. Similarly, there is a fairly largevariation in overall crosstalk factor across all of the LCDmonitors and all of the plasma displays. For example, the
LCD monitor with the highest crosstalk factors (LCD04)only performs marginally better than a CRT, and the plasmadisplay with the highest crosstalk factors (PDP02) hadslightly worse performance than a CRT.
The best performing LCD monitor was LCD14 whichprovided an average crosstalk factor of only 13.8 andachieved the lowest crosstalk factor across all displays of 7.0(when combined with glasses 3DG32). The best performingplasma display was the PDP12 with an average crosstalk fac-tor of 11.9 which achieved the third lowest crosstalk factoracross all plasma displays of 8.1 (when used with glasses3DG13).
The worst pair of anaglyph glasses across all displaysby far was 3DG28 – the ink-jet-printed transparency filters.This is not an unexpected result since these filters have suchpoor performance in the out-of-band wavelengths and verypoor contrast.
The choice of best glasses depends upon which displayis being considered. For the LCD monitors, 3DG32,3DG26, and 3DG13 usually had the lowest overall crosstalk(all were within the uncertainty limits of each other). Forthe plasma displays, 3DG30, 3DG13, and 3DG32 usually
TABLE 2 — Subjective testing of anaglyph glasses and comparison withcalculated results. Lines join matching entries.
FIGURE 8 — Spectral transmission for all the cyan filters.
Journal of the SID 15/11, 2007 893
had the lowest overall crosstalk (within the uncertainty lim-its). For the CRT case, the best glasses were 3DG32,3DG26, and 3DG13. It is interesting to note that the “cyan”filters of 3DG13 and 3DG26 have a more blue appearancethan those of 3DG30 and 3DG32 that have a more cyanappearance. These differences may have some effect oncolor perception which is discussed below.
As can be seen in Tables C1 and C2, red crosstalk isusually significantly greater than cyan crosstalk – on averagealmost four times greater. Red crosstalk usually thereforedominates the overall crosstalk value. This can be attributedto the shape of the spectral curves for the display andglasses, but will also be due to the fact that the green chan-nel is usually much brighter than the red channel.
It is usually possible to obtain a slightly lower overallcrosstalk figure for a particular display by mixing and match-ing filters from different glasses; however, the improvementachieved is usually less than the calculated overall uncer-tainty value.
It is worth mentioning that even a perfect filter (onethat transmits 100% of light in the desired wavelengthdomain and 0% outside it) would still have crosstalk if thedisplay’s color channels overlap in the spectral domain (asmost displays do).
Three further items are worth considering. First,intensity. If the filter cuts out most of the light, the imagewill be very dim and hard to see. Lower light levels alsomake the effect of even small ghosting levels proportionallygreater than they might otherwise be. A brightness imbal-ance between left and right eye can also result in the Pul-frich effect8 whereby horizontal motion can be interpretedas binocular depth, which is generally undesirable. Bright-ness levels and imbalance have not been considered in thispaper.
Second, color perception. Truly full-color stereoscopicimages are not possible with anaglyphs, but a properly con-structed anaglyph using complimentary colors can approxi-mate a full-color image. This distorted color image is usuallyreferred to as a “pseudo-color anaglyph” or a “polychromaticanaglyph” as opposed to a “full-color anaglyph” (which is notpossible). If a non-complimentary combination is used (e.g.,red/blue or red/green), pseudo-color anaglyphs are impossi-ble because a large portion of the visible spectrum is miss-ing. The overall image may also be darker. This paper hasonly considered red/cyan anaglyphs, although it is some-times hard to draw a line between what is classified as a cyanfilter and what is classified as a blue filter.
Third, color balance and color temperature. Mostmonitors allow the color balance or color temperature of thedisplay to be adjusted. This allows the user to change therelative intensities of the three color channels (but not thespectral output of each color channel). We have found thatsuch adjustments do affect the results of the crosstalk calcu-lations; however, as yet we have not used this knowledge tochoose an optimum color balance, or performed any valida-tion experiments to confirm whether the simulation of color
balance changes matches human perception. For the pur-poses of this study, the default color profiles were used foreach monitor.
5 ConclusionAlthough there are a range of stereoscopic display technolo-gies available that produce much better 3-D image qualitythan the anaglyph 3-D method, the anaglyph remains widelyused because of its simplicity, low cost, and compatibilitywith all full-color displays. This paper highlights one par-ticular way of improving the image quality of anaglyph 3-Dimages specifically relating to spectral crosstalk.
This study has revealed that crosstalk in anaglyphic3-D images can be minimized by the appropriate choice ofanaglyphic 3-D glasses. The study has revealed that therecan be considerable variation in the amount of crosstalk pre-sent when an anaglyphic 3-D display is viewed with differ-ent anaglyphic 3-D glasses.
The study has also revealed that there is considerablevariation in the amount of anaglyphic crosstalk exhibited bydifferent displays. For example, on average CRT monitorsexhibit approximately 45% more crosstalk than LCD moni-tors and plasma displays.
An anaglyphic crosstalk calculation algorithm has beendeveloped that appears to work well and generates outputsthat agree well with subjective assessments of anaglyphic3-D crosstalk.
It should be noted that the results of this paper are notintended to be a leader board of one glasses manufacturerversus another – we have not tested all glasses from allmanufacturers, nor have we tested a large sample of eachmanufacturers glasses. This paper does, however, highlightthat there is significant variation between different ana-glyph 3-D glasses and displays. Further crosstalk optimiza-tion may be possible by using the anaglyphic crosstalkcalculation algorithm and working with 3-D glasses manu-facturers.
AcknowledgmentsWe would like to thank the multitude of companies andindividuals who lent LCD monitors and plasma displays fortesting.3,9 We also wish to thank iVEC (the hub of advancedcomputing in Western Australia) and Jumbo Vision Interna-tional for their support of the plasma displays phase of thisproject.
References1 R Zone, “Good old fashion anaglyph: High tech tools revive a classic format
in spy kids 3-D,” Stereo World 29, No. 5, 11–13 and 46 (2002–2003).2 A J Woods and T Rourke, “Ghosting in anaglyphic stereoscopic im-
ages,” Stereoscopic Displays and Virtual Reality Systems XI, Proc SPIE5291, 354–365 (2004).
3 K S Karvinen and A J Woods, “The compatibility of plasma displayswith stereoscopic visualization,” Technical Report CMST2007-04 (Cur-tin University of Technology, Australia, 2007).
894 Woods et al. / Characterizing anaglyph crosstalk on LCD monitors and plasma displays

4 CIE, Commission Internationale de l’Eclairage Proceedings (Cam-bridge University Press, 1932).
5 B A Wandell and L D Silverstein, “Digital color reproduction,” TheScience of Color (Elsevier, 2003), pp. 296.
6 H Uchiike and T Hirakawa, “Color plasma displays,” Proc IEEE 90,Issue 4, 533–539 (2002).
7 A J Woods and S S L Tan, “Characterizing sources of ghosting intime-sequential stereoscopic video displays,” Stereoscopic Displaysand Virtual Reality Systems IX, Proc SPIE 4660, 66–77 (2002).
8 C Pulfrich, “Die Stereoskopie im Dienste der isochromem undherterochromen Photometrie,” Naturwissenschaft 10, 553–564 (1922).
9 K L Yuen, “Compatibility of LCD monitors with stereoscopic displaymethods,” Undergraduate Student Project Report (Curtin Universityof Technology, 2006).
Appendix A: Red/cyan anaglyph glasses
Appendix B: Spectral results for all testedLCD monitors and plasma displays
The figures below show the spectral results for each colorchannel of all tested LCD monitors and plasma displays.Figure B1 is normalized on the average value between 450and 455 nm. Figures B2 and B3 are normalized on the peakvalue. Figures B4–B6 are normalized on the area under the
TABLE A1 — Red/cyan anaglyphic 3-D glasses measured.
Journal of the SID 15/11, 2007 895
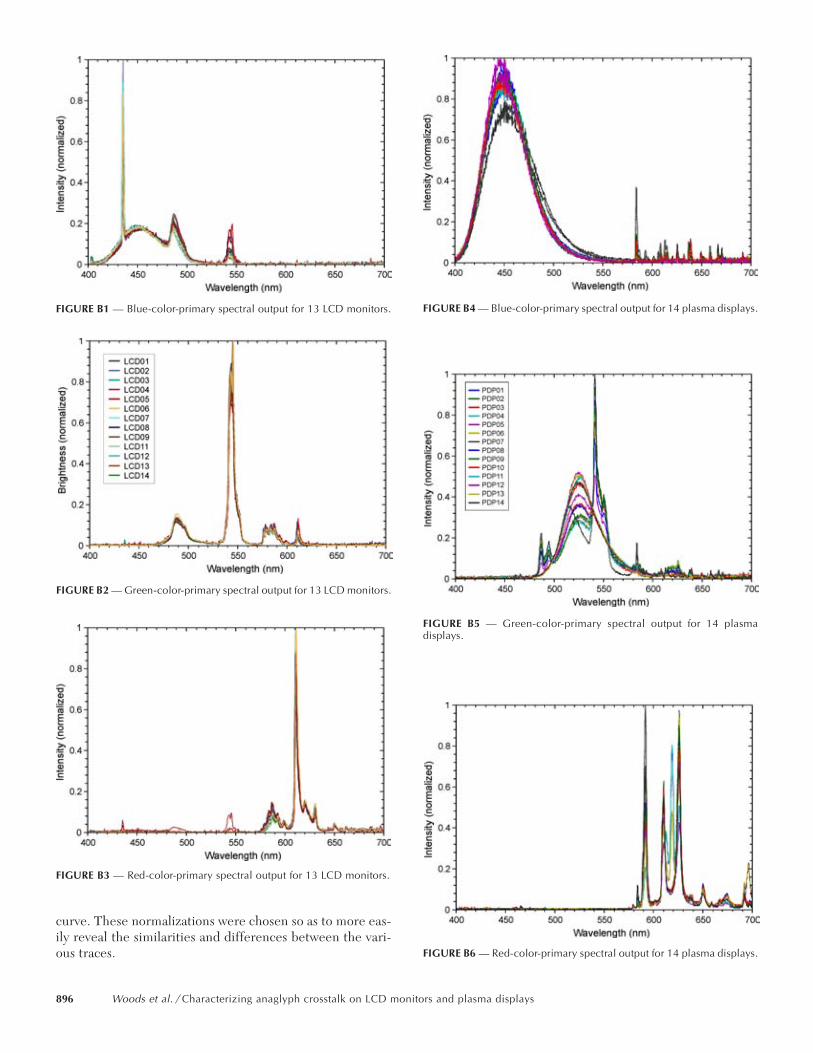
curve. These normalizations were chosen so as to more eas-ily reveal the similarities and differences between the vari-ous traces.
FIGURE B1 — Blue-color-primary spectral output for 13 LCD monitors.
FIGURE B2 — Green-color-primary spectral output for 13 LCD monitors.
FIGURE B4 — Blue-color-primary spectral output for 14 plasma displays.
FIGURE B3 — Red-color-primary spectral output for 13 LCD monitors.
FIGURE B5 — Green-color-primary spectral output for 14 plasmadisplays.
FIGURE B6 — Red-color-primary spectral output for 14 plasma displays.
896 Woods et al. / Characterizing anaglyph crosstalk on LCD monitors and plasma displays
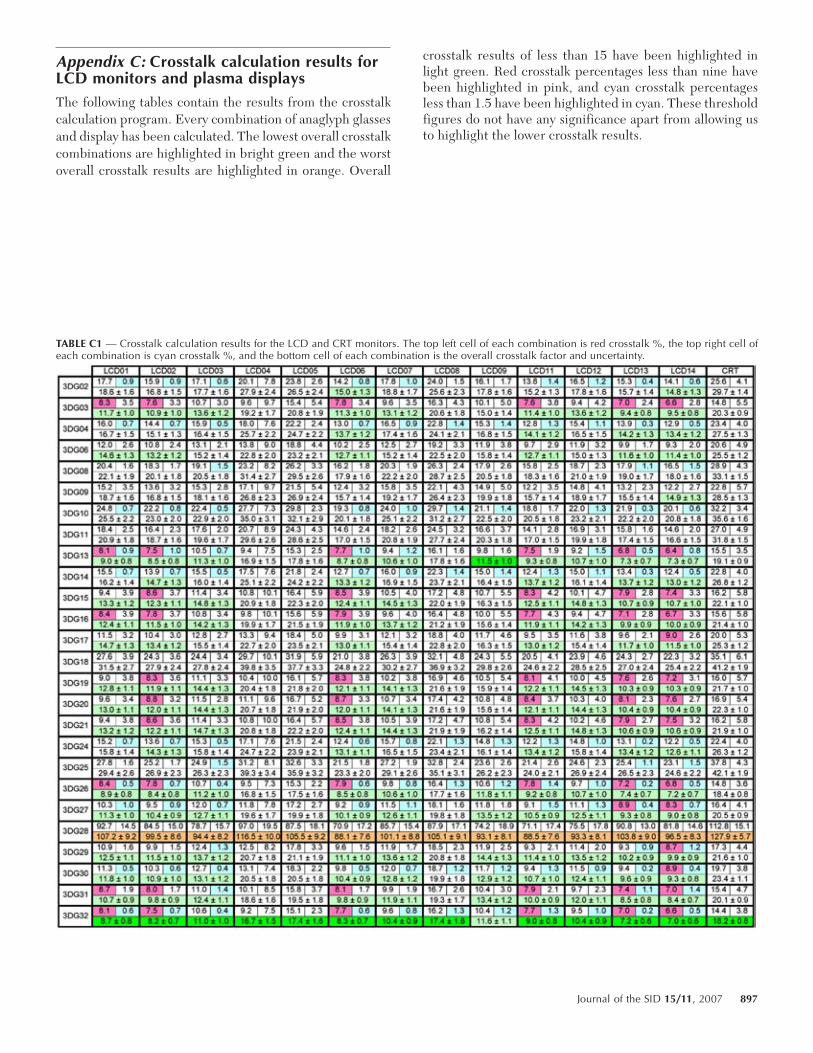
Appendix C: Crosstalk calculation results forLCD monitors and plasma displaysThe following tables contain the results from the crosstalkcalculation program. Every combination of anaglyph glassesand display has been calculated. The lowest overall crosstalkcombinations are highlighted in bright green and the worstoverall crosstalk results are highlighted in orange. Overall
crosstalk results of less than 15 have been highlighted inlight green. Red crosstalk percentages less than nine havebeen highlighted in pink, and cyan crosstalk percentagesless than 1.5 have been highlighted in cyan. These thresholdfigures do not have any significance apart from allowing usto highlight the lower crosstalk results.
TABLE C1 — Crosstalk calculation results for the LCD and CRT monitors. The top left cell of each combination is red crosstalk %, the top right cell ofeach combination is cyan crosstalk %, and the bottom cell of each combination is the overall crosstalk factor and uncertainty.
Journal of the SID 15/11, 2007 897
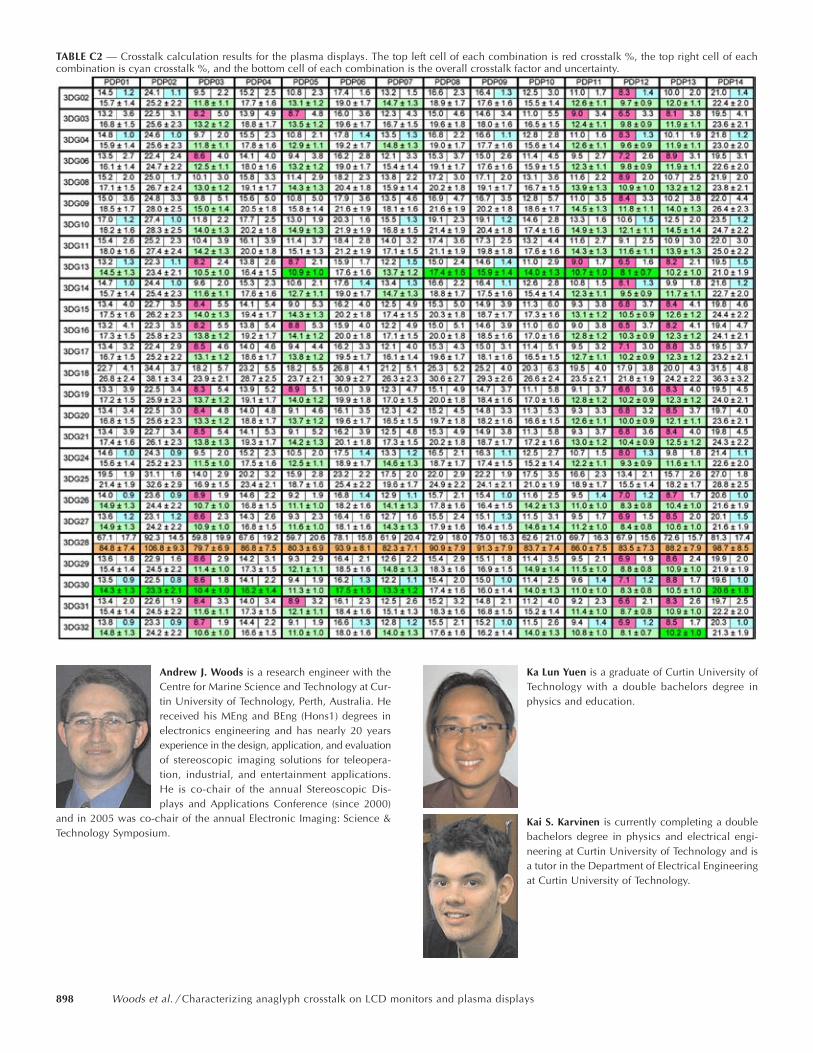
Andrew J. Woods is a research engineer with theCentre for Marine Science and Technology at Cur-tin University of Technology, Perth, Australia. Hereceived his MEng and BEng (Hons1) degrees inelectronics engineering and has nearly 20 yearsexperience in the design, application, and evaluationof stereoscopic imaging solutions for teleopera-tion, industrial, and entertainment applications.He is co-chair of the annual Stereoscopic Dis-plays and Applications Conference (since 2000)
and in 2005 was co-chair of the annual Electronic Imaging: Science &Technology Symposium.
Ka Lun Yuen is a graduate of Curtin University ofTechnology with a double bachelors degree inphysics and education.
Kai S. Karvinen is currently completing a doublebachelors degree in physics and electrical engi-neering at Curtin University of Technology and isa tutor in the Department of Electrical Engineeringat Curtin University of Technology.
TABLE C2 — Crosstalk calculation results for the plasma displays. The top left cell of each combination is red crosstalk %, the top right cell of eachcombination is cyan crosstalk %, and the bottom cell of each combination is the overall crosstalk factor and uncertainty.
898 Woods et al. / Characterizing anaglyph crosstalk on LCD monitors and plasma displays

Paper 3 [Refereed Journal Article]
A. J. Woods, C. R. Harris (2012) “Using cross‐talk simulation to predict the performance of anaglyph 3‐D glasses” in Journal of the Society for Information Display, Vol. 20, No. 6, pp. 304‐315.

Using cross-talk simulation to predict the performance of anaglyph 3-D glasses
Andrew J. Woods (SID Member)Chris R. Harris
Abstract — The anaglyph 3-D method is a widely used technique for presenting stereoscopic 3-Dimages. Its primary advantage is that it will work on any full-color display (LCDs, plasmas, and evenprints) and only requires that the user view the anaglyph image using a pair of anaglyph 3-D glasseswith usually one lens tinted red and the other lens tinted cyan (blue plus green). A common image-quality problem of anaglyph 3-D images is high levels of cross-talk – the incomplete isolation of theleft and right image channels such that each eye sees a “ghost” of the opposite perspective view. Ananaglyph cross-talk simulation model has been developed which allows the amount of anaglyph cross-talk to be estimated based on the spectral characteristics of the anaglyph glasses and the display. Themodel is validated using a visual cross-talk ranking test which indicates good agreement. The modelis then used to consider two scenarios for the reduction of cross-talk in anaglyph systems and findsthat a considerable reduction is likely to be achieved by using spectrally pure displays. The study alsofinds that the 3-D performance of commercial anaglyph glasses can be significantly better than hand-made anaglyph glasses.
Keywords — Stereoscopic, 3-D, cross-talk, ghosting, leakage, anaglyph.
DOI # 10.1889/JSID20.6.304
1 IntroductionThe anaglyph 3-D display technique dates back to 1853when it was developed by William Rollman.1 The techniqueinvolves the presentation of the left and right perspectiveimages in complementary color channels of the display –usually with the left perspective image stored in the redcolor channel and the right perspective image in the blueand green color channels. To see the anaglyph 3-D image,the observer wears a pair of glasses fitted with color filtersin front of each eye – usually red for the left eye and cyan(blue plus green) for the right eye. The color filters act toseparate the components of the presented anaglyph 3-Dimage so that the left perspective image is only seen by theleft eye, and the right perspective image is only seen by the righteye, and hence the observer can see a stereoscopic 3-D image.
Anaglyph 3-D has several limitations in terms of thequality of the presented 3-D images – particularly the inabilityto produce accurate full-color 3-D images (since color isused as the separation or multiplexing technique), binocularrivalry2,3 (sometimes known as retinal rivalry) (because eacheye sees a different color), and often the presence of highlevels of cross-talk (also known as crosstalk or cross talk).4
Despite the availability of stereoscopic 3-D display tech-nologies which offer much higher-quality 3-D presentation(e.g., polarized and active shutter glasses), anaglyph contin-ues to be used today in a wide range of applications becauseit will work with any full-color display and the glasses arevery cheap and commonly available, whereas polarized andactive shutter 3-D methods require specialized equipmentwhich may not be available to the user. The anaglyph 3-Dtechnique is also seeing high levels of usage because of thecurrent high level of interest in 3-D technologies generally.
Given the continued widespread use of the anaglyph3-D technique, there is value in efforts to improve theimage-quality of this technique. This paper concentrates onthe 3-D image quality metric of cross-talk which can bedefined as the “incomplete isolation of the left and rightimage channels”5,6 such that one eye can see a ghost imagefrom the other channel. Cross-talk is one of the main deter-minants of 3-D image quality7 and stereoscopic viewingcomfort.8,9
Although there is very little literature on the percep-tual effects of cross-talk in anaglyph 3-D images, there is agood body of work on the perceptual effects of cross-talk inother stereoscopic 3-D display technologies. Cross-talk hasbeen found to “strongly affect subjective ratings of displayimage quality and visual comfort” in an active-shutterstereoscopic display.10 Cross-talk was found to “significantlydegrade viewing comfort” in a polarized projected 3-D dis-play.8 Cross-talk has also been found to have “a detrimentaleffect on the perceived magnitude of depth from disparityand monocular occlusions” using a mirror-stereoscope dis-play.11 Studies have found cross-talk levels of 5–9% can sig-nificantly affect visual comfort and image quality.8,10 Ourown anecdotal evidence indicates that anaglyph 3-D imagesare similarly adversely affected by cross-talk.
Several methods have been proposed for improvingthe perceived quality of anaglyph 3-D images: applyingcross-talk cancellation to reduce the perception of ghostingdue to cross-talk,12 registering the parallax of foregroundobjects,13 using different primary color combinations,14 andusing different algorithms to calculate the RGB values ofthe anaglyph image.15–18 This paper uses the technique ofoptimizing the spectral curves of the display and/or glasses
Received 10-18-11; accepted 04-12-12.The author is with Curtin University, GPO Box U1987, Perth, WA 6845, Australia; telephone +61-8-9266-7920, e-mail: A.Woods curtin.edu.au.© Copyright 2012 Society for Information Display 1071-0922/12/2006-0304$1.00.
304 Journal of the SID 20/6, 2012
@
The paper is copyright Society for Information Display (SID) and is included in this thesis with their permission.
A. J. Woods, C. R. Harris (2012) “Using cross‐talk simulation to predict the performance of anaglyph 3‐D glasses” in Journal of the Society for Information Display, Vol. 20, No. 6, pp. 304‐315.
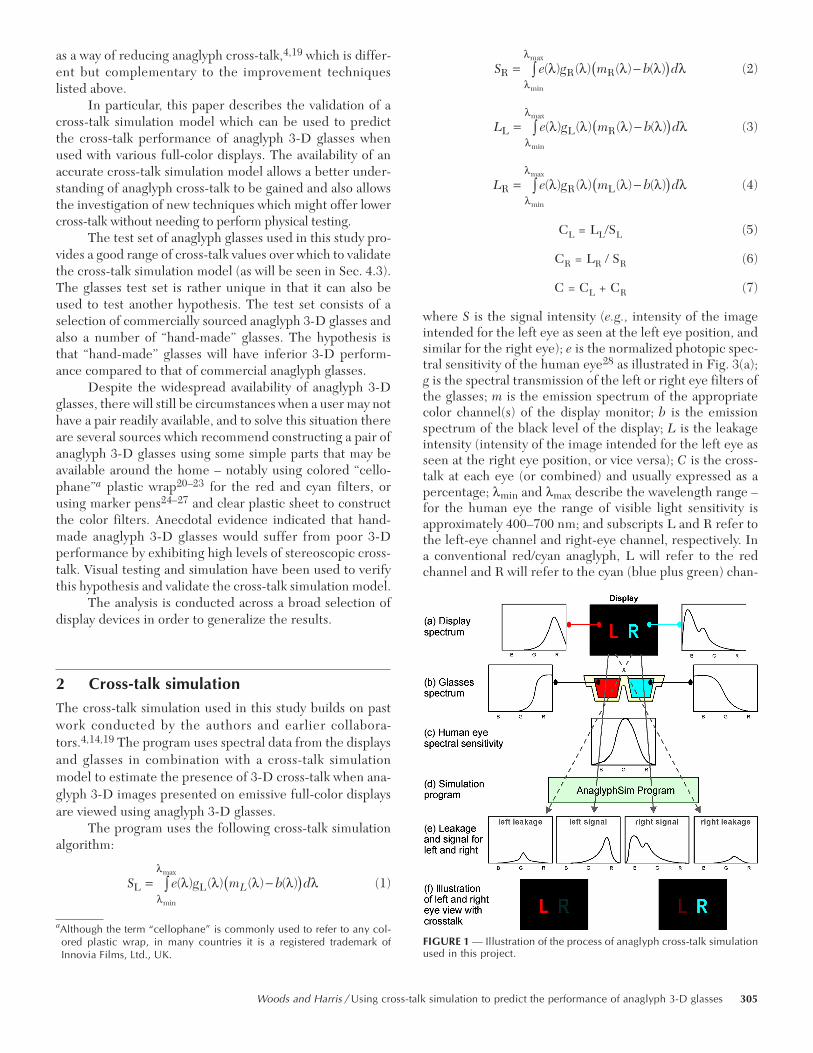
as a way of reducing anaglyph cross-talk,4,19 which is differ-ent but complementary to the improvement techniqueslisted above.
In particular, this paper describes the validation of across-talk simulation model which can be used to predictthe cross-talk performance of anaglyph 3-D glasses whenused with various full-color displays. The availability of anaccurate cross-talk simulation model allows a better under-standing of anaglyph cross-talk to be gained and also allowsthe investigation of new techniques which might offer lowercross-talk without needing to perform physical testing.
The test set of anaglyph glasses used in this study pro-vides a good range of cross-talk values over which to validatethe cross-talk simulation model (as will be seen in Sec. 4.3).The glasses test set is rather unique in that it can also beused to test another hypothesis. The test set consists of aselection of commercially sourced anaglyph 3-D glasses andalso a number of “hand-made” glasses. The hypothesis isthat “hand-made” glasses will have inferior 3-D perform-ance compared to that of commercial anaglyph glasses.
Despite the widespread availability of anaglyph 3-Dglasses, there will still be circumstances when a user may nothave a pair readily available, and to solve this situation thereare several sources which recommend constructing a pair ofanaglyph 3-D glasses using some simple parts that may beavailable around the home – notably using colored “cello-phane”a plastic wrap20–23 for the red and cyan filters, orusing marker pens24–27 and clear plastic sheet to constructthe color filters. Anecdotal evidence indicated that hand-made anaglyph 3-D glasses would suffer from poor 3-Dperformance by exhibiting high levels of stereoscopic cross-talk. Visual testing and simulation have been used to verifythis hypothesis and validate the cross-talk simulation model.
The analysis is conducted across a broad selection ofdisplay devices in order to generalize the results.
2 Cross-talk simulationThe cross-talk simulation used in this study builds on pastwork conducted by the authors and earlier collabora-tors.4,14,19 The program uses spectral data from the displaysand glasses in combination with a cross-talk simulationmodel to estimate the presence of 3-D cross-talk when ana-glyph 3-D images presented on emissive full-color displaysare viewed using anaglyph 3-D glasses.
The program uses the following cross-talk simulationalgorithm:
(1)
(2)
(3)
(4)
CL = LL/SL (5)
CR = LR / SR (6)
C = CL + CR (7)
where S is the signal intensity (e.g., intensity of the imageintended for the left eye as seen at the left eye position, andsimilar for the right eye); e is the normalized photopic spec-tral sensitivity of the human eye28 as illustrated in Fig. 3(a);g is the spectral transmission of the left or right eye filters ofthe glasses; m is the emission spectrum of the appropriatecolor channel(s) of the display monitor; b is the emissionspectrum of the black level of the display; L is the leakageintensity (intensity of the image intended for the left eye asseen at the right eye position, or vice versa); C is the cross-talk at each eye (or combined) and usually expressed as apercentage; λmin and λmax describe the wavelength range –for the human eye the range of visible light sensitivity isapproximately 400–700 nm; and subscripts L and R refer tothe left-eye channel and right-eye channel, respectively. Ina conventional red/cyan anaglyph, L will refer to the redchannel and R will refer to the cyan (blue plus green) chan-
S e g m b dLL L= -z ( ) ( ) ( ) ( )min
max
l l l l ll
lb g
S e g m b dR R R= -z ( ) ( ) ( ) ( )min
max
l l l l ll
lb g
L e g m b dL L R= -z ( ) ( ) ( ) ( )min
max
l l l l ll
lb g
L e g m b dR R L= -z ( ) ( ) ( ) ( )min
max
l l l l ll
lb g
aAlthough the term “cellophane” is commonly used to refer to any col-ored plastic wrap, in many countries it is a registered trademark ofInnovia Films, Ltd., UK.
FIGURE 1 — Illustration of the process of anaglyph cross-talk simulationused in this project.
Woods and Harris / Using cross-talk simulation to predict the performance of anaglyph 3-D glasses 305

nel, but other color variations are possible (e.g., blue/yellowor green/magenta14).
There is no requirement to use a calibrated device tomeasure m and b – the only requirement is that the samedevice and scaling is used between measurements. Addi-tionally, S and L can be in arbitrary units because they areonly used as a ratio in Eqs. (5) and (6).
This anaglyph cross-talk simulation algorithm is illus-trated in Fig. 1 for the example case of a red/cyan anaglyph.Firstly, (a) the emission spectrum of red channel of the dis-play, (b) the spectrum of the red filter of the glasses, and (c)the human-eye spectral sensitivity are multiplied to obtain(e) the spectrum of the intended signal seen by the left eye,and similar for the right eye. The spectrum of the leakageseen by the left eye is obtained by multiplying the spectrumof the blue plus green channels of the display, the spectrumof the red filter of the glasses, and the human eye spectralsensitivity. A similar process is used to determine the right-eye leakage. The luminance of each of these signals is obtainedby integrating the resulting curves, which is illustrated bythe bottom row (f) of this figure. The cross-talk percentageis obtained by dividing the leakage luminance by the signalluminance for each eye as set out in Eqs. (5) and (6). A verysimilar process would be used if different anaglyph colorprimaries were used.
The cross-talk performance of anaglyph glasses canvary quite widely from one pair of glasses to another andbetween different displays. The cross-talk simulation pro-gram can very quickly provide an estimate of cross-talk per-formance across a very large number of combinations ofglasses and displays – a process that would be extremelytime-consuming and logistically difficult if performed withphysical displays and glasses. Another advantage of using across-talk simulation program is that it can be used to esti-mate the cross-talk performance of new or theoretical filtersor displays without needing to perform physical testing.
Since the last paper on this topic,14 the simulation pro-gram, has been updated to use a more recent model of thehuman-eye spectral sensitivity28,29 and optimized to signifi-cantly increase the speed of operation.
3 Experimental methodThe cross-talk simulation model was validated using a four-step process.
3.1 Spectral emission of displaysThe spectral-emission properties of a selection of displays(LCD, PDP, CRT, and LED DLP)b were measured using anOcean Optics USB2000 spectroradiometer and also obtained
from previous studies.4,14 Table 1 lists the displays used inthis study.
The “Glasses IDs” and “Display IDs” used here corre-spond to the identification series first started in Ref. 19 andcontinued in Refs. 14 and 4 and are consistent among thesestudies.
It should be noted that particular care must be exer-cised when measuring the spectrum of the displays in orderto minimize measurement error due to the measurementtechnique. In the case of the PDP and CRT monitors, theirimpulse-type operation can create synchronization issueswith the sampling period of the sensor. Although all of thetested displays have some time-varying light output, PDPand CRT have the most variation. Long integration timesshould be used to minimize the effect of the time-varyinglight output. In the case of PDPs, another factor to consideris the presence of an automatic brightness limiter (ABL)which reduces the intensity of high-brightness scenes (toreduce power consumption). Full-screen test charts shouldnot be used in order to avoid triggering the ABL, whichwould otherwise affect the measurement of the relative bal-ance of the red, green, and blue color channels. The testcharts should therefore be limited to a small portion of thescreen, against a black background. The sensing head of thespectroradiometer should also not be placed too close to thesurface of the screen such that the spatial separation of thecolor subpixels would be detected by the sensor.
3.2 Spectral transmission of glassesThe 12 pairs of anaglyph glasses tested in this study arelisted in Table 2. The selection of glasses consists of threecommercial pairs, three pairs constructed using markerpens, and six pairs constructed using colored plastic wrap(“cellophane”). This selection of glasses provided a widerange of cross-talk values which was useful for validating thecross-talk simulation model.
The three pairs of marker pen anaglyph glasses wereconstructed by using red/blue pairs of marker pens pur-chased from retail outlets. The marker pens were used todraw red and blue filter samples on a fresh sheet of over-head transparency film. The overhead transparency filmused had good clarity and optical performance, in keepingwith its manufacture for use in an optical projection appli-cation.
TABLE 1 — Register of tested displays.
bLCD = liquid-crystal display; PDP = plasma-display panel; CRT = cath-ode-ray tube; LED = light-emitting diode; DLP = digital light processing,which uses a digital micro-mirror device (DMD); CCFL = cold-cathodefluorescent lamp.
306 Journal of the SID 20/6, 2012
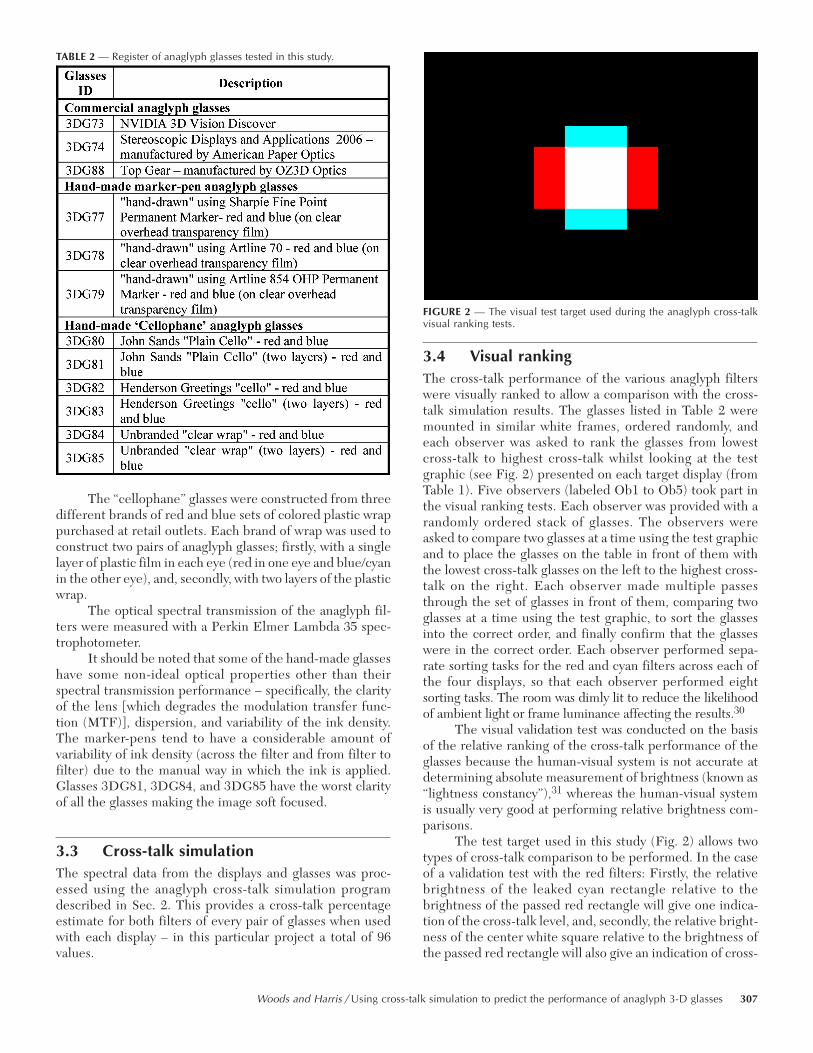
The “cellophane” glasses were constructed from threedifferent brands of red and blue sets of colored plastic wrappurchased at retail outlets. Each brand of wrap was used toconstruct two pairs of anaglyph glasses; firstly, with a singlelayer of plastic film in each eye (red in one eye and blue/cyanin the other eye), and, secondly, with two layers of the plasticwrap.
The optical spectral transmission of the anaglyph fil-ters were measured with a Perkin Elmer Lambda 35 spec-trophotometer.
It should be noted that some of the hand-made glasseshave some non-ideal optical properties other than theirspectral transmission performance – specifically, the clarityof the lens [which degrades the modulation transfer func-tion (MTF)], dispersion, and variability of the ink density.The marker-pens tend to have a considerable amount ofvariability of ink density (across the filter and from filter tofilter) due to the manual way in which the ink is applied.Glasses 3DG81, 3DG84, and 3DG85 have the worst clarityof all the glasses making the image soft focused.
3.3 Cross-talk simulationThe spectral data from the displays and glasses was proc-essed using the anaglyph cross-talk simulation programdescribed in Sec. 2. This provides a cross-talk percentageestimate for both filters of every pair of glasses when usedwith each display – in this particular project a total of 96values.
3.4 Visual rankingThe cross-talk performance of the various anaglyph filterswere visually ranked to allow a comparison with the cross-talk simulation results. The glasses listed in Table 2 weremounted in similar white frames, ordered randomly, andeach observer was asked to rank the glasses from lowestcross-talk to highest cross-talk whilst looking at the testgraphic (see Fig. 2) presented on each target display (fromTable 1). Five observers (labeled Ob1 to Ob5) took part inthe visual ranking tests. Each observer was provided with arandomly ordered stack of glasses. The observers wereasked to compare two glasses at a time using the test graphicand to place the glasses on the table in front of them withthe lowest cross-talk glasses on the left to the highest cross-talk on the right. Each observer made multiple passesthrough the set of glasses in front of them, comparing twoglasses at a time using the test graphic, to sort the glassesinto the correct order, and finally confirm that the glasseswere in the correct order. Each observer performed sepa-rate sorting tasks for the red and cyan filters across each ofthe four displays, so that each observer performed eightsorting tasks. The room was dimly lit to reduce the likelihoodof ambient light or frame luminance affecting the results.30
The visual validation test was conducted on the basisof the relative ranking of the cross-talk performance of theglasses because the human-visual system is not accurate atdetermining absolute measurement of brightness (known as“lightness constancy”),31 whereas the human-visual systemis usually very good at performing relative brightness com-parisons.
The test target used in this study (Fig. 2) allows twotypes of cross-talk comparison to be performed. In the caseof a validation test with the red filters: Firstly, the relativebrightness of the leaked cyan rectangle relative to thebrightness of the passed red rectangle will give one indica-tion of the cross-talk level, and, secondly, the relative bright-ness of the center white square relative to the brightness ofthe passed red rectangle will also give an indication of cross-
FIGURE 2 — The visual test target used during the anaglyph cross-talkvisual ranking tests.
TABLE 2 — Register of anaglyph glasses tested in this study.
Woods and Harris / Using cross-talk simulation to predict the performance of anaglyph 3-D glasses 307

talk level. It is usually easier to use the first method to com-pare glasses with low cross-talk levels and the secondmethod for mid-to-high levels of cross-talk. The observerswere briefed accordingly, but were free to use whichevermethod they found easiest.
The observers were asked to try to only consider cross-talk differences between the glasses and ignore other opticaldifferences such as relative brightness, relative clarity, and
variability of the filter pigments. The marker pen filters usu-ally had a high level of pigment variability. Some of the “cel-lophane” filters had very poor clarity and softened the imageconsiderably. Several of the observers commented that itwas difficult to compare cross-talk levels between two filterswhich had vastly different clarity, particularly when thecross-talk levels were seemingly close, which may lead toranking error.
FIGURE 3 — Spectral plots of (a) human-eye spectral sensitivity, (b) the emission spectrum of the red channel of the tested displays, (c)the emission spectrum of the green channel of the tested displays, (d) the emission spectrum of the blue channel of the tested displays,(e) red filter of the tested “cellophane” glasses, (f) cyan filter of the tested “cellophane” glasses, (g) red filter of the commercial andmarker-pen glasses with the human-eye response also indicated, and (h) cyan filter of the commercial and marker-pen glasses withhuman-eye response also indicated. The plots are shown vertically stacked with the same horizontal axis to allow easy comparisonbetween different plots of the same color range.
308 Journal of the SID 20/6, 2012
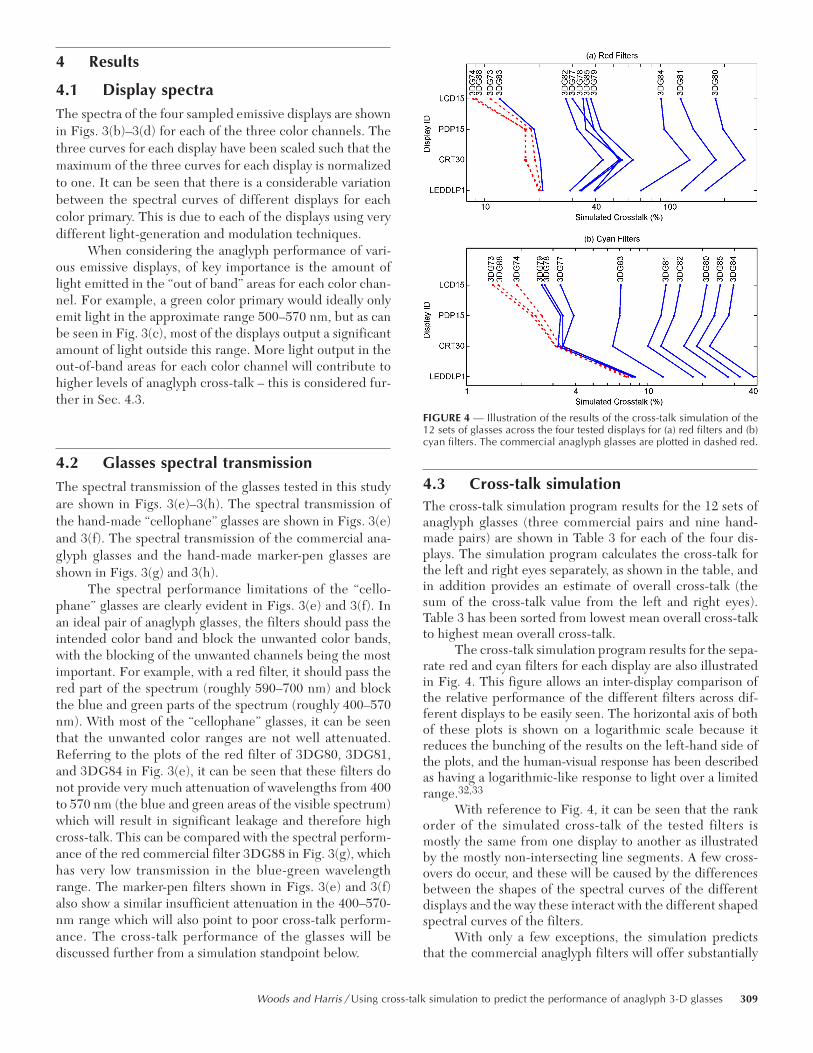
4 Results
4.1 Display spectraThe spectra of the four sampled emissive displays are shownin Figs. 3(b)–3(d) for each of the three color channels. Thethree curves for each display have been scaled such that themaximum of the three curves for each display is normalizedto one. It can be seen that there is a considerable variationbetween the spectral curves of different displays for eachcolor primary. This is due to each of the displays using verydifferent light-generation and modulation techniques.
When considering the anaglyph performance of vari-ous emissive displays, of key importance is the amount oflight emitted in the “out of band” areas for each color chan-nel. For example, a green color primary would ideally onlyemit light in the approximate range 500–570 nm, but as canbe seen in Fig. 3(c), most of the displays output a significantamount of light outside this range. More light output in theout-of-band areas for each color channel will contribute tohigher levels of anaglyph cross-talk – this is considered fur-ther in Sec. 4.3.
4.2 Glasses spectral transmissionThe spectral transmission of the glasses tested in this studyare shown in Figs. 3(e)–3(h). The spectral transmission ofthe hand-made “cellophane” glasses are shown in Figs. 3(e)and 3(f). The spectral transmission of the commercial ana-glyph glasses and the hand-made marker-pen glasses areshown in Figs. 3(g) and 3(h).
The spectral performance limitations of the “cello-phane” glasses are clearly evident in Figs. 3(e) and 3(f). Inan ideal pair of anaglyph glasses, the filters should pass theintended color band and block the unwanted color bands,with the blocking of the unwanted channels being the mostimportant. For example, with a red filter, it should pass thered part of the spectrum (roughly 590–700 nm) and blockthe blue and green parts of the spectrum (roughly 400–570nm). With most of the “cellophane” glasses, it can be seenthat the unwanted color ranges are not well attenuated.Referring to the plots of the red filter of 3DG80, 3DG81,and 3DG84 in Fig. 3(e), it can be seen that these filters donot provide very much attenuation of wavelengths from 400to 570 nm (the blue and green areas of the visible spectrum)which will result in significant leakage and therefore highcross-talk. This can be compared with the spectral perform-ance of the red commercial filter 3DG88 in Fig. 3(g), whichhas very low transmission in the blue-green wavelengthrange. The marker-pen filters shown in Figs. 3(e) and 3(f)also show a similar insufficient attenuation in the 400–570-nm range which will also point to poor cross-talk perform-ance. The cross-talk performance of the glasses will bediscussed further from a simulation standpoint below.
4.3 Cross-talk simulationThe cross-talk simulation program results for the 12 sets ofanaglyph glasses (three commercial pairs and nine hand-made pairs) are shown in Table 3 for each of the four dis-plays. The simulation program calculates the cross-talk forthe left and right eyes separately, as shown in the table, andin addition provides an estimate of overall cross-talk (thesum of the cross-talk value from the left and right eyes).Table 3 has been sorted from lowest mean overall cross-talkto highest mean overall cross-talk.
The cross-talk simulation program results for the sepa-rate red and cyan filters for each display are also illustratedin Fig. 4. This figure allows an inter-display comparison ofthe relative performance of the different filters across dif-ferent displays to be easily seen. The horizontal axis of bothof these plots is shown on a logarithmic scale because itreduces the bunching of the results on the left-hand side ofthe plots, and the human-visual response has been describedas having a logarithmic-like response to light over a limitedrange.32,33
With reference to Fig. 4, it can be seen that the rankorder of the simulated cross-talk of the tested filters ismostly the same from one display to another as illustratedby the mostly non-intersecting line segments. A few cross-overs do occur, and these will be caused by the differencesbetween the shapes of the spectral curves of the differentdisplays and the way these interact with the different shapedspectral curves of the filters.
With only a few exceptions, the simulation predictsthat the commercial anaglyph filters will offer substantially
FIGURE 4 — Illustration of the results of the cross-talk simulation of the12 sets of glasses across the four tested displays for (a) red filters and (b)cyan filters. The commercial anaglyph glasses are plotted in dashed red.
Woods and Harris / Using cross-talk simulation to predict the performance of anaglyph 3-D glasses 309

lower cross-talk than the other filters. With the better per-forming glasses (the commercial glasses), the simulationalso points to some big differences in cross-talk perform-ance from one display to another – for example, the simula-tion predicts that the commercial glasses will provide muchlower cross-talk when used with LCD15 than the other dis-plays, for both filter colors.
The simulation also predicts a good spread in thecross-talk performance of the selection of test filters used inthis study – which in turn will aid in the validation of thesimulation algorithm.
Some of the cross-talk simulation values presented inTable 3 are greater than 100% (i.e., the worst performingfilters) – the reader might at first think this is impossible,but this can occur with anaglyph cross-talk because the blueand green channels combined (one eye) have a much higherluminance than the red channel (the other eye).
It can be seen from Fig. 4(a) that the red filter of 3DG83has a predicted cross-talk performance very close to that ofthe commercial filters; however, the cyan filter of 3DG83has quite poor predicted cross-talk performance. Addition-ally, both of these marker-pen ink filters have high ink-den-sity variability which degrade the visual quality of the glassesas a whole.
4.4 Visual ranking and validationThe visual ranking experiment involved 40 separate cross-talk ranking tasks across five observers, 12 pairs of glasses(two filters in each pair of glasses), and four different dis-plays, resulting in 480 separate observations. The results ofthe visual ranking experiment are illustrated in Fig. 5. Theglasses ranking results for each display, observer, and filtercolor combination are plotted against the correspondingsimulated cross-talk ranking for that display and filter color.A line segment joins the visual ranking with the simulatedranking for each pair of glasses.
When plotting the ranking results, we had the optionof showing the ranking observations with an equal spacingbetween observations; however, this would give an unrealis-tic equal visual emphasis on ranking observations regardlessof how close or disparate the cross-talk is between thoseparticular filters. We therefore decided to plot the results onhorizontal axis values which correspond to the simulated
TABLE 3 — Cross-talk calculation results of the four displays.The lowest “overall cross-talk” for each display has beenhighlighted in rich green. “Overall cross-talk” of less than 15has been highlighted in light green. The highest “overallcross-talk” for each display has been highlighted in orange.
TABLE 4 — Example of the ranking representation technique used in Fig.5 for Observer 2 ranking the cyan filters on LEDDLP1.
310 Journal of the SID 20/6, 2012
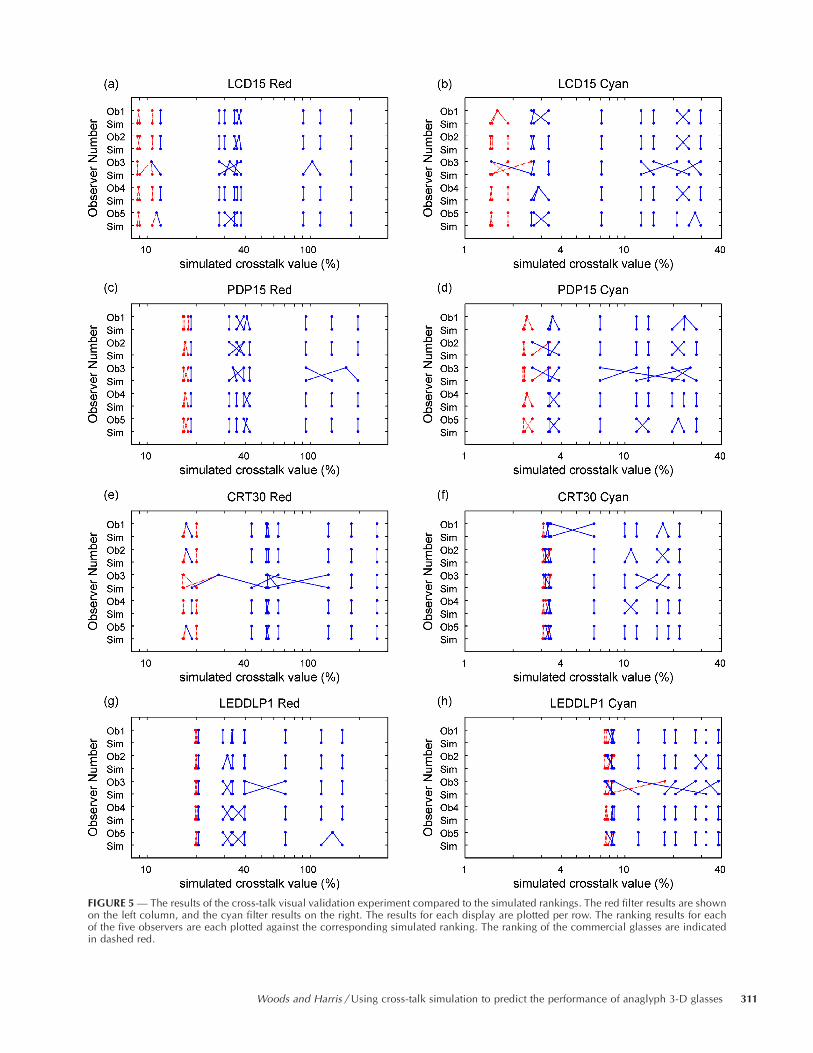
FIGURE 5 — The results of the cross-talk visual validation experiment compared to the simulated rankings. The red filter results are shownon the left column, and the cyan filter results on the right. The results for each display are plotted per row. The ranking results for eachof the five observers are each plotted against the corresponding simulated ranking. The ranking of the commercial glasses are indicatedin dashed red.
Woods and Harris / Using cross-talk simulation to predict the performance of anaglyph 3-D glasses 311

cross-talk values for each pair of glasses. This plotting tech-nique provides more visual emphasis on ranking errorswhich have greater simulated cross-talk differences thanranking errors between filters which have small simulatedcross-talk differences. We believe this plotting techniqueallows a more useful analysis of the data.
This process is further illustrated in Table 4 for oneobserver, display, and filter-color-combination ranking test.The first two columns show rank order as calculated by thesimulation program vs. the rank order as seen by the observer.Line segments have been shown between columns 1 and 2to illustrate the quality of the comparison. Unity separationbetween ranking observations has been used in these firsttwo columns. Columns 3 and 4 change the unity spacing ofthe observations to a spacing corresponding to the calcu-lated cross-talk values. The values illustrated in columns 3and 4 are then used to generate Fig. 5 – in this specificexample observer Ob2 of Fig. 5(h).
The horizontal axis of Fig. 5 is shown on a logarithmicscale because the eye has a logarithmic-like response tolight. The use of a logarithmic scale also reduces the bunch-ing of the results on the left-hand side of the plots.
In cases where the observer was unable to distinguishany difference between different filters (i.e., they looked tohave the same amount of cross-talk), observers were allowedto group those glasses together. Glasses that have beengrouped together by an observer are plotted with the samehorizontal axis value (using the mean of the correspondingsimulated cross-talk values).
The commercial glasses results are plotted in dashedred, whereas the hand-made glasses are plotted in solid blue– thus allowing the commercial glasses to be easily identi-fied. This also highlights the better performance (lowercross-talk) of the commercial glasses.
Referring to Fig. 5, in cases where the visual rankingagrees with the simulated ranking, the line segments arevertical and do not intersect. In cases where the visual andsimulated rankings disagree, there will be a cross-over of theline segments.
In general terms, the validation results, as depicted inFig. 5, agree very well with the cross-talk simulation rankingresults. Across all of the tests, a high proportion (66%) of theobservations were ranked perfectly. It can be seen from thefigure that ranking errors (indicated by crossing line-seg-ments) rarely occurred across large simulated cross-talkvalue differences. The vast number of ranking errors occurredbetween filters with very similar values of simulated cross-talk. These results are statistically analyzed in the next sec-tion.
We should note that the visual ranking tests were onlyconducted within each display and not between displays.The cross-talk simulation results of Table 3 and Fig. 4 doindicate that LCD15 is expected to provide noticeably lowercross-talk than the other displays when using the commer-cial glasses. This scenario was tested visually using red filter3DG88 and LCD15 could be seen to have significantlylower cross-talk than PDP15, CRT30, and LEDDLP1 aspredicted by the cross-talk simulation model; however, thistest was only conducted informally and hence this aspect hasnot been validated in this particular study.
4.5 Statistical analysis
The quality of agreement between the visual ranking andthe simulated ranking was assessed using the Spearman’srank correlation35 technique. The Spearman’s rank correla-tion is often used in biological statistics when one or moreof the variables in a dataset consist of only ranks, as is thecase with the human-visual ranking of cross-talk of anaglyphglasses as described in Sec. 4.4. The Spearman rank corre-lation (rs) values were calculated for all of the visual valida-tion observations across each display, observer, and filtercolor combination, and these are presented in Table 5 alongwith the average correlation for each observer.
The average rs value for each observer was calculatedas the mean of the eight correlation results for each observer(across four displays and two filter colors). The results of
TABLE 5 — Results of the statistical analysis of the visual ranking results.The table shows the correlation data for each of the display, observer, andfilter-color combinations, and also the average correlation for eachobserver using the Spearman’s rank correlation (rs) technique asdescribed in Sec. 4.5. (1 indicates good agreement, 0 indicates pooragreement).
312 Journal of the SID 20/6, 2012
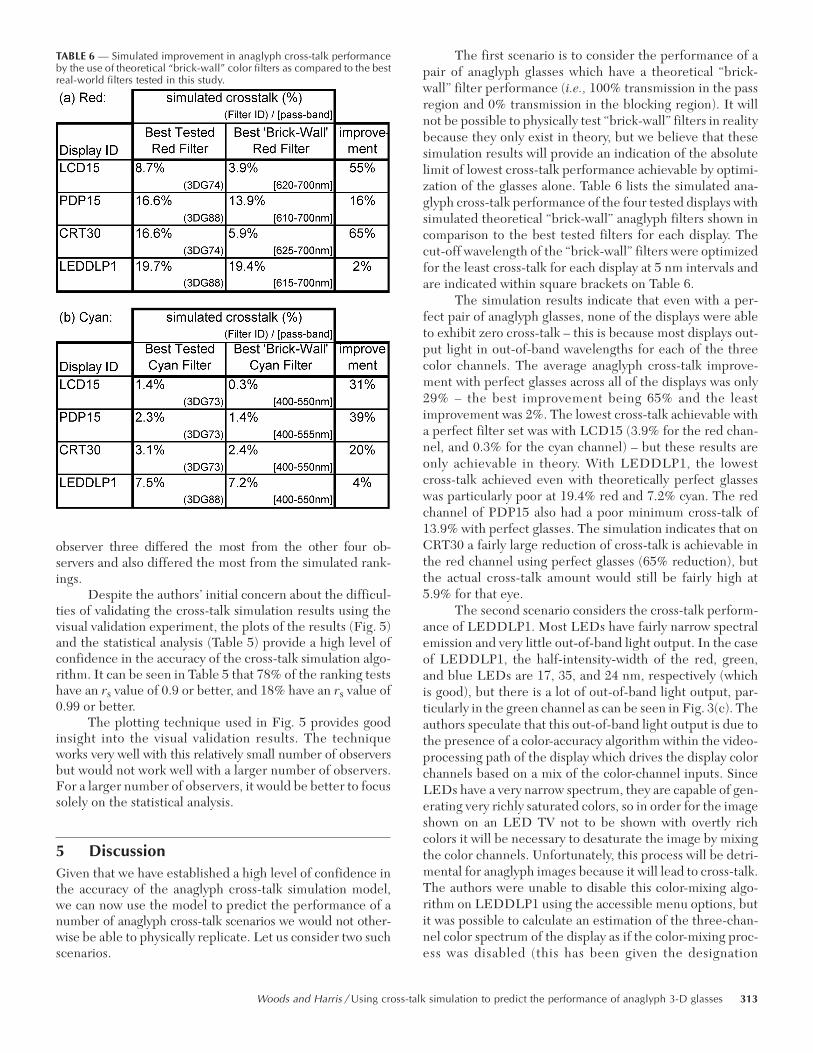
observer three differed the most from the other four ob-servers and also differed the most from the simulated rank-ings.
Despite the authors’ initial concern about the difficul-ties of validating the cross-talk simulation results using thevisual validation experiment, the plots of the results (Fig. 5)and the statistical analysis (Table 5) provide a high level ofconfidence in the accuracy of the cross-talk simulation algo-rithm. It can be seen in Table 5 that 78% of the ranking testshave an rs value of 0.9 or better, and 18% have an rs value of0.99 or better.
The plotting technique used in Fig. 5 provides goodinsight into the visual validation results. The techniqueworks very well with this relatively small number of observersbut would not work well with a larger number of observers.For a larger number of observers, it would be better to focussolely on the statistical analysis.
5 DiscussionGiven that we have established a high level of confidence inthe accuracy of the anaglyph cross-talk simulation model,we can now use the model to predict the performance of anumber of anaglyph cross-talk scenarios we would not other-wise be able to physically replicate. Let us consider two suchscenarios.
The first scenario is to consider the performance of apair of anaglyph glasses which have a theoretical “brick-wall” filter performance (i.e., 100% transmission in the passregion and 0% transmission in the blocking region). It willnot be possible to physically test “brick-wall” filters in realitybecause they only exist in theory, but we believe that thesesimulation results will provide an indication of the absolutelimit of lowest cross-talk performance achievable by optimi-zation of the glasses alone. Table 6 lists the simulated ana-glyph cross-talk performance of the four tested displays withsimulated theoretical “brick-wall” anaglyph filters shown incomparison to the best tested filters for each display. Thecut-off wavelength of the “brick-wall” filters were optimizedfor the least cross-talk for each display at 5 nm intervals andare indicated within square brackets on Table 6.
The simulation results indicate that even with a per-fect pair of anaglyph glasses, none of the displays were ableto exhibit zero cross-talk – this is because most displays out-put light in out-of-band wavelengths for each of the threecolor channels. The average anaglyph cross-talk improve-ment with perfect glasses across all of the displays was only29% – the best improvement being 65% and the leastimprovement was 2%. The lowest cross-talk achievable witha perfect filter set was with LCD15 (3.9% for the red chan-nel, and 0.3% for the cyan channel) – but these results areonly achievable in theory. With LEDDLP1, the lowestcross-talk achieved even with theoretically perfect glasseswas particularly poor at 19.4% red and 7.2% cyan. The redchannel of PDP15 also had a poor minimum cross-talk of13.9% with perfect glasses. The simulation indicates that onCRT30 a fairly large reduction of cross-talk is achievable inthe red channel using perfect glasses (65% reduction), butthe actual cross-talk amount would still be fairly high at5.9% for that eye.
The second scenario considers the cross-talk perform-ance of LEDDLP1. Most LEDs have fairly narrow spectralemission and very little out-of-band light output. In the caseof LEDDLP1, the half-intensity-width of the red, green,and blue LEDs are 17, 35, and 24 nm, respectively (whichis good), but there is a lot of out-of-band light output, par-ticularly in the green channel as can be seen in Fig. 3(c). Theauthors speculate that this out-of-band light output is due tothe presence of a color-accuracy algorithm within the video-processing path of the display which drives the display colorchannels based on a mix of the color-channel inputs. SinceLEDs have a very narrow spectrum, they are capable of gen-erating very richly saturated colors, so in order for the imageshown on an LED TV not to be shown with overtly richcolors it will be necessary to desaturate the image by mixingthe color channels. Unfortunately, this process will be detri-mental for anaglyph images because it will lead to cross-talk.The authors were unable to disable this color-mixing algo-rithm on LEDDLP1 using the accessible menu options, butit was possible to calculate an estimation of the three-chan-nel color spectrum of the display as if the color-mixing proc-ess was disabled (this has been given the designation
TABLE 6 — Simulated improvement in anaglyph cross-talk performanceby the use of theoretical “brick-wall” color filters as compared to the bestreal-world filters tested in this study.
Woods and Harris / Using cross-talk simulation to predict the performance of anaglyph 3-D glasses 313
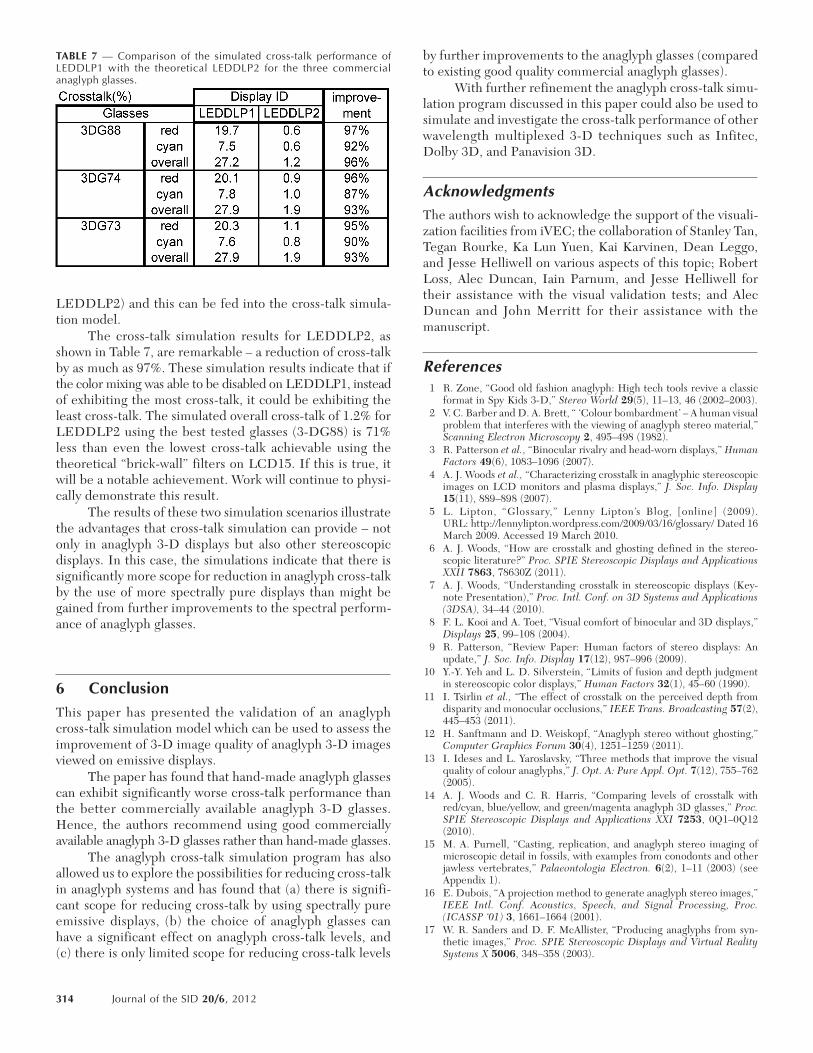
LEDDLP2) and this can be fed into the cross-talk simula-tion model.
The cross-talk simulation results for LEDDLP2, asshown in Table 7, are remarkable – a reduction of cross-talkby as much as 97%. These simulation results indicate that ifthe color mixing was able to be disabled on LEDDLP1, insteadof exhibiting the most cross-talk, it could be exhibiting theleast cross-talk. The simulated overall cross-talk of 1.2% forLEDDLP2 using the best tested glasses (3-DG88) is 71%less than even the lowest cross-talk achievable using thetheoretical “brick-wall” filters on LCD15. If this is true, itwill be a notable achievement. Work will continue to physi-cally demonstrate this result.
The results of these two simulation scenarios illustratethe advantages that cross-talk simulation can provide – notonly in anaglyph 3-D displays but also other stereoscopicdisplays. In this case, the simulations indicate that there issignificantly more scope for reduction in anaglyph cross-talkby the use of more spectrally pure displays than might begained from further improvements to the spectral perform-ance of anaglyph glasses.
6 ConclusionThis paper has presented the validation of an anaglyphcross-talk simulation model which can be used to assess theimprovement of 3-D image quality of anaglyph 3-D imagesviewed on emissive displays.
The paper has found that hand-made anaglyph glassescan exhibit significantly worse cross-talk performance thanthe better commercially available anaglyph 3-D glasses.Hence, the authors recommend using good commerciallyavailable anaglyph 3-D glasses rather than hand-made glasses.
The anaglyph cross-talk simulation program has alsoallowed us to explore the possibilities for reducing cross-talkin anaglyph systems and has found that (a) there is signifi-cant scope for reducing cross-talk by using spectrally pureemissive displays, (b) the choice of anaglyph glasses canhave a significant effect on anaglyph cross-talk levels, and(c) there is only limited scope for reducing cross-talk levels
by further improvements to the anaglyph glasses (comparedto existing good quality commercial anaglyph glasses).
With further refinement the anaglyph cross-talk simu-lation program discussed in this paper could also be used tosimulate and investigate the cross-talk performance of otherwavelength multiplexed 3-D techniques such as Infitec,Dolby 3D, and Panavision 3D.
AcknowledgmentsThe authors wish to acknowledge the support of the visuali-zation facilities from iVEC; the collaboration of Stanley Tan,Tegan Rourke, Ka Lun Yuen, Kai Karvinen, Dean Leggo,and Jesse Helliwell on various aspects of this topic; RobertLoss, Alec Duncan, Iain Parnum, and Jesse Helliwell fortheir assistance with the visual validation tests; and AlecDuncan and John Merritt for their assistance with themanuscript.
References1 R. Zone, “Good old fashion anaglyph: High tech tools revive a classic
format in Spy Kids 3-D,” Stereo World 29(5), 11–13, 46 (2002–2003).2 V. C. Barber and D. A. Brett, “ ‘Colour bombardment’ – A human visual
problem that interferes with the viewing of anaglyph stereo material,”Scanning Electron Microscopy 2, 495–498 (1982).
3 R. Patterson et al., “Binocular rivalry and head-worn displays,” HumanFactors 49(6), 1083–1096 (2007).
4 A. J. Woods et al., “Characterizing crosstalk in anaglyphic stereoscopicimages on LCD monitors and plasma displays,” J. Soc. Info. Display15(11), 889–898 (2007).
5 L. Lipton, “Glossary,” Lenny Lipton’s Blog, [online] (2009).URL: http://lennylipton.wordpress.com/2009/03/16/glossary/ Dated 16March 2009. Accessed 19 March 2010.
6 A. J. Woods, “How are crosstalk and ghosting defined in the stereo-scopic literature?” Proc. SPIE Stereoscopic Displays and ApplicationsXXII 7863, 78630Z (2011).
7 A. J. Woods, “Understanding crosstalk in stereoscopic displays (Key-note Presentation),” Proc. Intl. Conf. on 3D Systems and Applications(3DSA), 34–44 (2010).
8 F. L. Kooi and A. Toet, “Visual comfort of binocular and 3D displays,”Displays 25, 99–108 (2004).
9 R. Patterson, “Review Paper: Human factors of stereo displays: Anupdate,” J. Soc. Info. Display 17(12), 987–996 (2009).
10 Y.-Y. Yeh and L. D. Silverstein, “Limits of fusion and depth judgmentin stereoscopic color displays,” Human Factors 32(1), 45–60 (1990).
11 I. Tsirlin et al., “The effect of crosstalk on the perceived depth fromdisparity and monocular occlusions,” IEEE Trans. Broadcasting 57(2),445–453 (2011).
12 H. Sanftmann and D. Weiskopf, “Anaglyph stereo without ghosting,”Computer Graphics Forum 30(4), 1251–1259 (2011).
13 I. Ideses and L. Yaroslavsky, “Three methods that improve the visualquality of colour anaglyphs,” J. Opt. A: Pure Appl. Opt. 7(12), 755–762(2005).
14 A. J. Woods and C. R. Harris, “Comparing levels of crosstalk withred/cyan, blue/yellow, and green/magenta anaglyph 3D glasses,” Proc.SPIE Stereoscopic Displays and Applications XXI 7253, 0Q1–0Q12(2010).
15 M. A. Purnell, “Casting, replication, and anaglyph stereo imaging ofmicroscopic detail in fossils, with examples from conodonts and otherjawless vertebrates,” Palaeontologia Electron. 6(2), 1–11 (2003) (seeAppendix 1).
16 E. Dubois, “A projection method to generate anaglyph stereo images,”IEEE Intl. Conf. Acoustics, Speech, and Signal Processing, Proc.(ICASSP ‘01) 3, 1661–1664 (2001).
17 W. R. Sanders and D. F. McAllister, “Producing anaglyphs from syn-thetic images,” Proc. SPIE Stereoscopic Displays and Virtual RealitySystems X 5006, 348–358 (2003).
TABLE 7 — Comparison of the simulated cross-talk performance ofLEDDLP1 with the theoretical LEDDLP2 for the three commercialanaglyph glasses.
314 Journal of the SID 20/6, 2012
18 D. F. McAllister et al., “Methods for computing color anaglyphs,” Proc.SPIE Stereoscopic Displays and Applications XXI 7524, 75240S-1–75240S-12 (2010).
19 A. J. Woods and T. Rourke, “Ghosting in anaglyphic stereoscopic images,”Proc. SPIE Stereoscopic Displays and Virtual Reality Systems XI 5291,354–365 (2004).
20 Daleh, “Build your own 3D glasses” [online]. URL: http://www.daleh.id.au/3d_glasses.html Accessed: 26 August 2011.
21 Various authors, “How to make 3D glasses” [online]. URL: http://www.ehow.com/how_4455680_make-3d-glasses.html Accessed: 26August 2011.
22 Author unknown, “How to make a pair of 3D glasses for 3D Anaglyphs”[online]. URL: http://www.haworth-village.org.uk/3d/3d-glasses.aspAccessed: 26 August 2011.
23 Author unknown, “Make your own 3-D glasses” [online]. URL: http://paperproject.org/3dglasses.html Accessed: 26 August 2011.
24 A. Agarwal, “Make your own 3D glasses in 10 seconds,” Digital Inspi-ration [online] (2010). URL: http://www.labnol.org/home/make-3d-glasses/13776/ Dated: 2 June 2010. Accessed: 6 July 2011.
25 Various authors, “How to make your own 3D glasses,” Wikihow [on-line]. URL: http://www.wikihow.com/Make-Your-Own-3D-GlassesAccessed: 6 July 2011.
26 Various authors, “Make 3-D glasses,” Wired How-to Wiki [online].URL: http://howto.wired.com/wiki/Make_3-D_Glasses Accessed: 6July 2011.
27 S. Miles, “How to make your own 3D glasses,” Pocket-lint [online](2009). URL: http://www.pocket-lint.com/news/27268/how-to-make-3d-glasses Dated: 22 September 2009. Accessed: 6 July 2011.
28 A. Stockman and L. T. Sharpe, “Luminous energy function (2 degree, linearenergy)” [online] (2007). URL: http://www.cvrl.org/cvrlfunctions.htm andhttp://www.cvrl.org/database/text/lum/CIE2008v2.htm Accessed: 29July 2011.
29 A. Stockman et al., “The dependence of luminous efficiency on chromaticadaptation,” J. Vision 8(16):1, 1–26 (2008). http://journalofvision.org/8/16/1/
30 K. R. Boff and J. E. Lincoln, Engineering data compendium: Humanperception and performance, AAMRL, Wright-Patterson AFB, OH,pp. 370 (1988).
31 R. Blake and R. Sekuler, Perception (5th edn.) (McGraw Hill, Boston,2006), pp. 92.
32 S. S. Stevens, “On the psychophysical law,” Psychological Rev. 64(3),153–181 (1957).
33 Z. Xie and T. G. Stockham Jr., “Toward the unification of three visuallaws and two visual models in brightness perception,” IEEE Trans.Systems, Man and Cybernetics 19(2), 379–387 (1989).
34 R. E. Walpole and R. H. Myers, Probability and Statistics for Engineersand Scientists (Collier Macmillan, 1985), pp. 347.
35 J. H. McDonald, Handbook of Biological Statistics (2nd edn.) (SparkyHouse Publishing, Baltimore, Maryland, 2009), pp. 221–223.http://udel.edu/~mcdonald/statspearman.html
Andrew J. Woods is a research engineer at CurtinUniversity’s Centre for Marine Science & Technol-ogy in Perth, Australia. He has MEng and BEng(Hons1) degrees in electronic engineering. He hasexpertise in the design, application, and evalu-ation of stereoscopic imaging systems for indus-trial and entertainment applications. He hasserved as co-chair of the Stereoscopic Displaysand Applications conference since 2000.
Chris R. Harris is a graduate of Curtin Universitywith a B.S. degree in applied physics and hasinterests in electronics and information technol-ogy. He is currently employed by Murdoch Uni-versity.
Woods and Harris / Using cross-talk simulation to predict the performance of anaglyph 3-D glasses 315

Paper 4 [Refereed Journal Article]
A. J. Woods, C. R. Harris, D. B. Leggo, T. M. Rourke (2013) “Characterizing and Reducing Crosstalk in Printed Anaglyph Stereoscopic 3D Images” in (Journal of) Optical Engineering, SPIE, Vol. 52, No. 4, pp. 043203‐1 to 043203‐19, April 2013.
Characterizing and reducing crosstalk in printed anaglyphstereoscopic 3D images
Andrew J. WoodsCurtin UniversityCentre for Marine Science and TechnologyGPO Box U1987Perth, Western Australia 6845, Australia
Chris R. HarrisMurdoch University90 South StreetMurdoch, Western Australia 6150, Australia
Dean B. LeggoLabTech Training25 Colray AvenueOsborne Park, Western Australia 6017, Australia
Tegan M. RourkeSir Charles Gairdner HospitalHospital AvenueNedlands, Western Australia 6009, Australia
Abstract. The anaglyph three-dimensional (3D) method is a widely usedtechnique for presenting stereoscopic 3D images. Its primary advantagesare that it will work on any full-color display and only requires that the userview the anaglyph image using a pair of anaglyph 3D glasses with usuallyone lens tinted red and the other lens tinted cyan. A common image qualityproblem of anaglyph 3D images is high levels of crosstalk–the incompleteisolation of the left and right image channels such that each eye sees a“ghost” of the opposite perspective view. In printed anaglyph images, thecrosstalk levels are often very high–much higher than when anaglyphimages are presented on emissive displays. The sources of crosstalkin printed anaglyph images are described and a simulation model is devel-oped that allows the amount of printed anaglyph crosstalk to be estimatedbased on the spectral characteristics of the light source, paper, ink set, andanaglyph glasses. The model is validated using a visual crosstalk rankingtest, which indicates good agreement. The model is then used to considerscenarios for the reduction of crosstalk in printed anaglyph systemsand finds a number of options that are likely to reduce crosstalk consid-erably. © The Authors. Published by SPIE under a Creative Commons Attribution 3.0Unported License. Distribution or reproduction of this work in whole or in part requires full attri-bution of the original publication, including its DOI. [DOI: 10.1117/1.OE.52.4.043203]
Subject terms: stereoscopic; three-dimensional; crosstalk; ghosting; leakage;anaglyph.
Paper 121666 received Nov. 15, 2012; revised manuscript received Mar. 6, 2013;accepted for publication Mar. 7, 2013; published online Apr. 5, 2013.
1 IntroductionThe anaglyph three-dimensional (3D) method is the mostcommonly used technique for printing stereoscopic 3Dimages, with it being used in a wide range of technicaland entertainment publications. The anaglyph techniqueuses spectral multiplexing to encode left and right viewswithin a single printed image. The left and right perspectiveimages are encoded in complementary color channels of theimage–usually the left image in the red channel and the rightimage in the blue and green color channels. To see the ana-glyph 3D image, the observer wears a pair of glasses fittedwith color filters in front of each eye—usually red for the lefteye and cyan (blue plus green) for the right eye. The colorfilters act to separate the components of the presented ana-glyph 3D image with the aim that the left-perspective imageis only seen by the left eye, and the right-perspective image isonly seen by the right eye, and allow the observer to see acompelling stereoscopic 3D image.
There are many techniques which can be used to print 3Dimages1 (e.g., lenticular, free-view stereo-pairs, stereo-pairsviewed with mirror or lensed viewers, parallax barrier, polar-ized vectographs,2 and polarized StereoJet prints2), howeveranaglyph printing is the most commonly used 3D printingtechnique, primarily because of its economy and ease ofuse. Despite its popularity, anaglyph 3D printing suffersfrom probably the lowest 3D quality of all the 3D printingmethods. Given the continued widespread use of the ana-glyph 3D technique, there is value in efforts to improvethe image quality of this technique.
Anaglyph 3D has several limitations in terms of the qual-ity of the presented 3D images—particularly the inability to
produce accurate full-color 3D images (since color is used asthe separation or multiplexing technique), binocular rivalry3
(sometimes known as retinal rivalry) (because each eye seesa different color), and often the presence of high levels ofcrosstalk.4 This paper concentrates on the 3D image qualitymetric of crosstalk, which can be defined as the “incompleteisolation of the left and right image channels”5,6 such that oneeye can see a ghost image from the other channel. Crosstalkis one of the main determinants of 3D image quality7 andstereoscopic viewing comfort.8
Although there is very little literature on the perceptualeffects of crosstalk in anaglyph 3D images, there is a goodbody of work on the perceptual effects of crosstalk in otherstereoscopic 3D display technologies. Crosstalk has beenfound to “strongly affect subjective ratings of displayimage quality and visual comfort” in an active shutter stereo-scopic display,9 “significantly degrade viewing comfort” in apolarized projected 3D display,8 and have “a detrimentaleffect on the perceived magnitude of depth from disparityand monocular occlusions” using a mirror-stereoscopedisplay.10 Studies have found crosstalk levels of 5% to 9%can significantly affect visual comfort and image quality.8,9
Our own anecdotal evidence indicates that anaglyph 3Dimages are similarly adversely affected by crosstalk.
Several methods have been proposed for improving theperceived quality of anaglyph 3D images: applying crosstalkcancellation to reduce the perception of ghosting due tocrosstalk,11 registering the parallax of foreground objects,12
using different primary color combinations,13 and usingdifferent anaglyph multiplexing algorithms to calculate theRGB values of the anaglyph image.14–20 The choice of
Optical Engineering 043203-1 April 2013/Vol. 52(4)
Optical Engineering 52(4), 043203 (April 2013)
A. J. Woods, C. R. Harris, D. B. Leggo, T. M. Rourke (2013) “Characterizing and Reducing Crosstalk in Printed Anaglyph Stereoscopic 3D Images” in (Journal of) Optical Engineering, SPIE, Vol. 52, No. 4, pp. 043203‐1 to 043203‐19, April 2013.

anaglyph multiplexing algorithm will determine the amountand quality of color reproduction in the anaglyph image andinversely, the amount of binocular rivalry. For example, ahighly saturated scene can cause high levels of binocularrivalry if a high color reproduction anaglyph algorithm isused. However, binocular rivalry can be reduced by usingan anaglyph algorithm which desaturates the input images,but this reduces the quality of color reproduction.20
This paper uses the technique of optimizing the spectralcurves of the “display” and glasses, and maintaining purityof the color channels, as a way of reducing anaglyphcrosstalk,4,21 which is different but complementary to theimprovement techniques listed above. In the context ofprinted anaglyphs discussed in this paper, the term “display”will be used to refer to the printed image which is displayedto the observer—and indirectly the specific ink set and paperused to generate the print, and the light source used to illu-minate it.
The anaglyph 3D technique dates back to 1853 when itwas developed by William Rollman22—although it isbelieved he only used solid blocks of color in his work andnot continuous tone images. Louis Ducos Duhauron is cred-ited as inventing the continuous tone printed anaglyph in1891.23–25 In 1895, Alfred Watch26 presented a descriptivearticle introducing the printed anaglyph process.
Despite anaglyph 3D prints having been with us for over ahundred years, it is surprising that there have been relativelyfew technical publications to have described the science andtechnique of the printed anaglyph 3D image over this period,and several fundamental problems remain unsolved.
In 1937, John Norling27 identified that “inks, pigmentsand dyes commonly used in printing the red and blue pic-tures are not pure colors” and hence “a residual image orghost image” will be present, and patented a technique ofoverprinting with yellow ink to improve the printed spectra.
In 2002, Steven Harrington et al.28,29 disclosed a series ofwork on Illuminant Multiplexed Images, encoding separateimages in the separate ink colors, and decoding the imagesusing narrow-band light sources. This topic has some rel-evance to anaglyph imaging however their work did not spe-cifically address printed anaglyphs viewed through anaglyphglasses.
In 2005, Vu Tran18 described the development of an ana-glyph multiplexing algorithm for printed anaglyphs whichaimed to improve the color rendition of printed anaglyphs(using dichopic color mixture theory)18 and reduce crosstalk.In this dissertation, he identified that in-built color manage-ment can disrupt the quality of printed anaglyphs (whichagrees with our findings) and developed a detailed algorithmto cope with this effect. He also wrote “the illuminant lightdoes not have a strong effect on overall 3D perception”which disagrees with our findings. In 2011, Ru Zhu Zeng19
described another algorithm to color correct anaglyph 3Dimages for printing, but the paper did not disclose the details.
In 2009, Ron Labbe1 provided a summary of 3D printingtechniques and a timeline of the use of the printed anaglyphin publicly released publications. He also correctly identifiedthat “the inks in the CMYK process do not lend themselvesto a perfectly ghost-free image, especially the cyan”1—this isdiscussed in further detail later in Sec. 5.3.
Moving on from the traditional printed anaglyph, in 1974Jay Scarpetti30 proposed a printed anaglyph technique based
on a front and back lit printed transparency, and in 2009,Monte Ramstad31 disclosed an extension of the conventionalanaglyph printing process using fluorescent inks, but thesetechniques do not offer any direct benefit to the conventionalprinted anaglyph.
Attempts to optimize the performance of printed anaglyphimages by the appropriate choice of printing inks and filtersin the anaglyph glasses has also been performed for sometime but mainly in an empirical manner.32,33 This paper pro-poses a similar optimization, but using a technical analysisand simulation to guide the choice of glasses and inks, withan additional variable which is the choice of light source.
The work on printed anaglyphs described in this paperbuilds upon previous work that some of the authors ofthis paper published on crosstalk with anaglyph imageson emissive displays such as liquid crystal displays (LCDs),plasma display panels (PDPs), digital light projection televi-sions (DLP TVs) and cathode ray tubes (CRTs).4,13,21,34
Emissive displays and printed images differ in the waythat the image and color is generated. Emissive displaysuse the additive color model (by additive mixing of red,green and blue color primaries) whereas printing uses thesubtractive color model (by subtractive mixing of cyan,magenta and yellow inks).35 Figure 1 provides an illustrationof the difference between the additive color and subtractivecolor models. With an emissive display, the screen startsfrom a black base and then red, green or blue light isadded in various combinations to produce a wide range ofcolors. For example, when red and blue light are addedtogether [Fig. 1(a)] the result is a magenta color, and whenred, green, and blue light are used together (in an appropriatebalance), the additive result is white. In contrast to emissivedisplays, the starting point with color printing is a blankwhite page. The most commonly used primary color inksare cyan, magenta and yellow—commonly called “processinks.”35 With reference to Fig. 2, it can be seen that the yel-low ink mostly attenuates (subtracts) light in the blue spectralregion (∼400 to 500 nm) whilst not substantially attenuatinglight in the green (∼500 to −600 nm) and red (∼600 to−700 nm) regions. Ideally the magenta ink attenuates (sub-tracts) light in the green spectral region, and cyan ink attenu-ates (subtracts) light in the red spectral region, while notattenuating light outside these regions. In printing, the appli-cation of cyan ink attenuates the red spectral band so it can be
Fig. 1 An illustration of (a) the additive color model as used in emis-sive displays with red, green and blue color primaries, and (b) the sub-tractive color model as used in printing with cyan, magenta, andyellow color primaries. The combination of the different color primariesin varying amounts in the two models results in a wide range of pos-sible colors.
Optical Engineering 043203-2 April 2013/Vol. 52(4)
Woods et al.: Characterizing and reducing crosstalk in printed anaglyph stereoscopic. . .
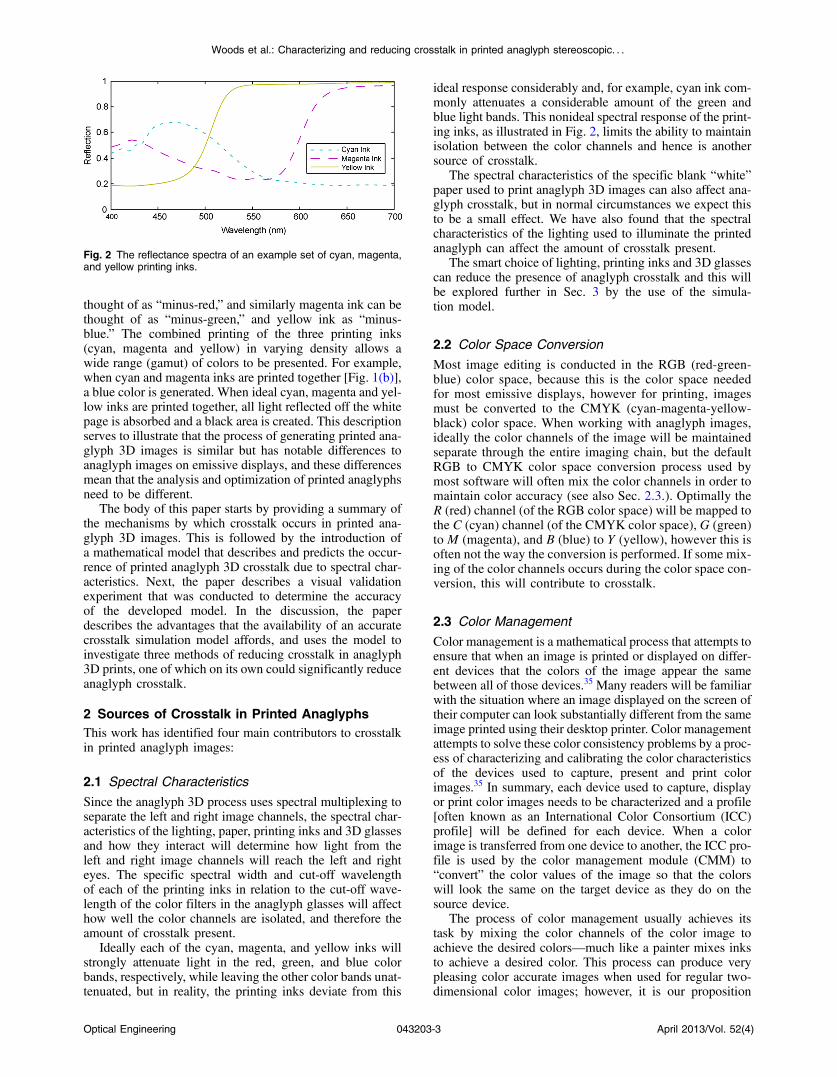
thought of as “minus-red,” and similarly magenta ink can bethought of as “minus-green,” and yellow ink as “minus-blue.” The combined printing of the three printing inks(cyan, magenta and yellow) in varying density allows awide range (gamut) of colors to be presented. For example,when cyan and magenta inks are printed together [Fig. 1(b)],a blue color is generated. When ideal cyan, magenta and yel-low inks are printed together, all light reflected off the whitepage is absorbed and a black area is created. This descriptionserves to illustrate that the process of generating printed ana-glyph 3D images is similar but has notable differences toanaglyph images on emissive displays, and these differencesmean that the analysis and optimization of printed anaglyphsneed to be different.
The body of this paper starts by providing a summary ofthe mechanisms by which crosstalk occurs in printed ana-glyph 3D images. This is followed by the introduction ofa mathematical model that describes and predicts the occur-rence of printed anaglyph 3D crosstalk due to spectral char-acteristics. Next, the paper describes a visual validationexperiment that was conducted to determine the accuracyof the developed model. In the discussion, the paperdescribes the advantages that the availability of an accuratecrosstalk simulation model affords, and uses the model toinvestigate three methods of reducing crosstalk in anaglyph3D prints, one of which on its own could significantly reduceanaglyph crosstalk.
2 Sources of Crosstalk in Printed AnaglyphsThis work has identified four main contributors to crosstalkin printed anaglyph images:
2.1 Spectral Characteristics
Since the anaglyph 3D process uses spectral multiplexing toseparate the left and right image channels, the spectral char-acteristics of the lighting, paper, printing inks and 3D glassesand how they interact will determine how light from theleft and right image channels will reach the left and righteyes. The specific spectral width and cut-off wavelengthof each of the printing inks in relation to the cut-off wave-length of the color filters in the anaglyph glasses will affecthow well the color channels are isolated, and therefore theamount of crosstalk present.
Ideally each of the cyan, magenta, and yellow inks willstrongly attenuate light in the red, green, and blue colorbands, respectively, while leaving the other color bands unat-tenuated, but in reality, the printing inks deviate from this
ideal response considerably and, for example, cyan ink com-monly attenuates a considerable amount of the green andblue light bands. This nonideal spectral response of the print-ing inks, as illustrated in Fig. 2, limits the ability to maintainisolation between the color channels and hence is anothersource of crosstalk.
The spectral characteristics of the specific blank “white”paper used to print anaglyph 3D images can also affect ana-glyph crosstalk, but in normal circumstances we expect thisto be a small effect. We have also found that the spectralcharacteristics of the lighting used to illuminate the printedanaglyph can affect the amount of crosstalk present.
The smart choice of lighting, printing inks and 3D glassescan reduce the presence of anaglyph crosstalk and this willbe explored further in Sec. 3 by the use of the simula-tion model.
2.2 Color Space Conversion
Most image editing is conducted in the RGB (red-green-blue) color space, because this is the color space neededfor most emissive displays, however for printing, imagesmust be converted to the CMYK (cyan-magenta-yellow-black) color space. When working with anaglyph images,ideally the color channels of the image will be maintainedseparate through the entire imaging chain, but the defaultRGB to CMYK color space conversion process used bymost software will often mix the color channels in order tomaintain color accuracy (see also Sec. 2.3.). Optimally theR (red) channel (of the RGB color space) will be mapped tothe C (cyan) channel (of the CMYK color space), G (green)to M (magenta), and B (blue) to Y (yellow), however this isoften not the way the conversion is performed. If some mix-ing of the color channels occurs during the color space con-version, this will contribute to crosstalk.
2.3 Color Management
Color management is a mathematical process that attempts toensure that when an image is printed or displayed on differ-ent devices that the colors of the image appear the samebetween all of those devices.35 Many readers will be familiarwith the situation where an image displayed on the screen oftheir computer can look substantially different from the sameimage printed using their desktop printer. Color managementattempts to solve these color consistency problems by a proc-ess of characterizing and calibrating the color characteristicsof the devices used to capture, present and print colorimages.35 In summary, each device used to capture, displayor print color images needs to be characterized and a profile[often known as an International Color Consortium (ICC)profile] will be defined for each device. When a colorimage is transferred from one device to another, the ICC pro-file is used by the color management module (CMM) to“convert” the color values of the image so that the colorswill look the same on the target device as they do on thesource device.
The process of color management usually achieves itstask by mixing the color channels of the color image toachieve the desired colors—much like a painter mixes inksto achieve a desired color. This process can produce verypleasing color accurate images when used for regular two-dimensional color images; however, it is our proposition
Fig. 2 The reflectance spectra of an example set of cyan, magenta,and yellow printing inks.
Optical Engineering 043203-3 April 2013/Vol. 52(4)
Woods et al.: Characterizing and reducing crosstalk in printed anaglyph stereoscopic. . .

that this mixing is detrimental when applied to anaglyph 3Dimages and will lead to the presence of crosstalk.
Although color management still has some importancewith anaglyph images, the color spectrum received byeach eye is distorted by the anaglyph glasses worn by theobserver (which are designed to de-multiplex the differentcolor bands to each eye) and hence the perception ofcolor is substantially biased. The color channel mixing proc-ess used by color management also conflicts with the need tomaintain isolation between the color channels in anaglyphimages. We therefore suggest that there needs to be a differ-ent color management process for anaglyph images, one thatmaintains isolation between the color channels, perhaps byintegrating the color management and color multiplexingsteps into a single process.15,18
For the purposes of this project it would have been helpfulif color management could be totally disabled, but we wereunable to find a reliable way of achieving this with commondesktop printers. Even programs which purported to offer anoption to disable color management, did not actually disablecolor management fully. We only found one reference to aprinter driver which allowed direct control of the individualinks,36 however we did not have access to this driver duringthe work of this paper. Interestingly, anaglyph images pre-sented on emissive displays connected to a computer ordi-narily do not suffer from any anaglyph image degradationdue to color management, because many image editing appli-cations simply directly map the RGB values of each pixel inthe image to the pixels on the display without any color man-agement. On the other hand, more advanced image editingprograms may include color management and hence mayintroduce problems for anaglyph images. In offset printingit is possible to bypass color management because the indi-vidual separations (individual color plates for each ink color)can be controlled separately and hence avoid crosstalkcaused by color management—unfortunately desktop print-ers do not operate using separations.
2.4 Gray Component Replacement
Although we referred earlier to printing commonly usingonly three primary inks to produce a full-color image, afourth printing ink, black, is usually used to improve the con-trast range of printed images. The problem is that the com-bination of real cyan, magenta and yellow inks usuallyproduces a dark muddy brown rather than a deep black,so it is beneficial to use black ink in dark areas to improvethe image quality in dark regions of the image.29,35 Black inkalso has the advantage that it is cheaper than color inks sothere is a financial incentive to use black ink in preference toheavy concentrations of cyan, magenta and yellow inks.Black ink can also be used in mid-gray areas of theimage instead of using a combination of cyan, magentaand yellow inks. “The two basic black generation strategiesare Under Color Removal (UCR), and Gray ComponentReplacement (GCR). UCR separations use black only in theneutral and near-neutral areas, while GCR is a more aggres-sive strategy that replaces the amount of CMY that wouldproduce a neutral with K, even in colors that are quite along way from neutral.”35
If an aggressive amount of GCR is used, it can compro-mise the separation between the left and right image channelsin near-neutral gray areas of the image and hence cause
crosstalk. It is also our experience that even small amountsof black ink replacement can compromise anaglyph images,even if the black ink is only used in very dark parts of theimage, for two reasons. First, the black ink is often used toexpand the dark range of the image into areas of darknessthat the individual color inks are not able to achieve ontheir own, and when viewed through anaglyph glasses thistransition from a color ink area to a black ink replacementarea may be noticeable, and because the introduction ofblack replacement can be triggered by the image contentin the other perspective image channel, it can lead to cross-talk (in dark areas of the image). Second, the black ink canlook quite different to equivalent density of the color primaryinks when viewed through the anaglyph glasses due to subtledifferences in the spectral curves of the black and color inks,which in turn can also lead to crosstalk.
Our experience to date suggests that less crosstalk will beobserved in printed anaglyph images if GCR and UCR canbe switched off. Unfortunately we were unable to find a reli-able way of disabling GCR and UCR on the color inkjet andcolor laser printers that we tested.
3 Simulation of Spectral CrosstalkWe have developed a crosstalk simulation model to predictthe occurrence of crosstalk in printed anaglyph images dueto the spectral properties of the light source, paper, inksand anaglyph glasses. The simulation used in this studybuilds on the crosstalk model for anaglyph images onemissive displays developed by the authors and earliercollaborators.4,13,21,34
The analysis in this paper is performed for the red/cyancolor combination, but it could equally be applied to othercolor combinations.13
The printed anaglyph crosstalk simulation algorithm isillustrated in Fig. 3 for the example case of a red-left/cyan-right anaglyph. With reference to Fig. 3, the model uses(a) the emission spectrum of the light source (in this examplean incandescent lamp), (b) the spectrum of the blank paper,(c) the spectrum of the “red” and cyan inks, (d) the spectrumof the red and cyan filters of the glasses, and (e) the humaneye spectral sensitivity.
In this particular study we chose to simplify the analysisby considering the use of red ink (which is the combinationof yellow and magenta inks) for the right eye channel ratherthan presenting the performance of yellow and magenta inksseparately. It should be noted that an actual red ink is notusually available in many printers and instead it is producedby combining yellow and magenta inks. The simulation cancalculate the performance of yellow and magenta inks sep-arately but we are only reporting the results of “red” ink per-formance here.
The anaglyph crosstalk simulation program [see Fig. 3(f)]multiplies the spectra [(a) through (e)] together to obtainthe spectral plots shown in Fig. 3(g). In the four plots[Fig. 3(g1)) through 3(g4)], the dashed black line representsthe luminance spectrum that is visible when the blank whitepage is viewed through the left or right colored lens, and thesolid line represents the spectrum visible when the “red” orcyan inks are printed on the page and viewed through the leftor right lenses of the glasses. Specifically, the black dashedlines shown in Fig. 3(g1) and 3(g2) are identical and showthe luminance spectrum when the white page is viewed
Optical Engineering 043203-4 April 2013/Vol. 52(4)
Woods et al.: Characterizing and reducing crosstalk in printed anaglyph stereoscopic. . .
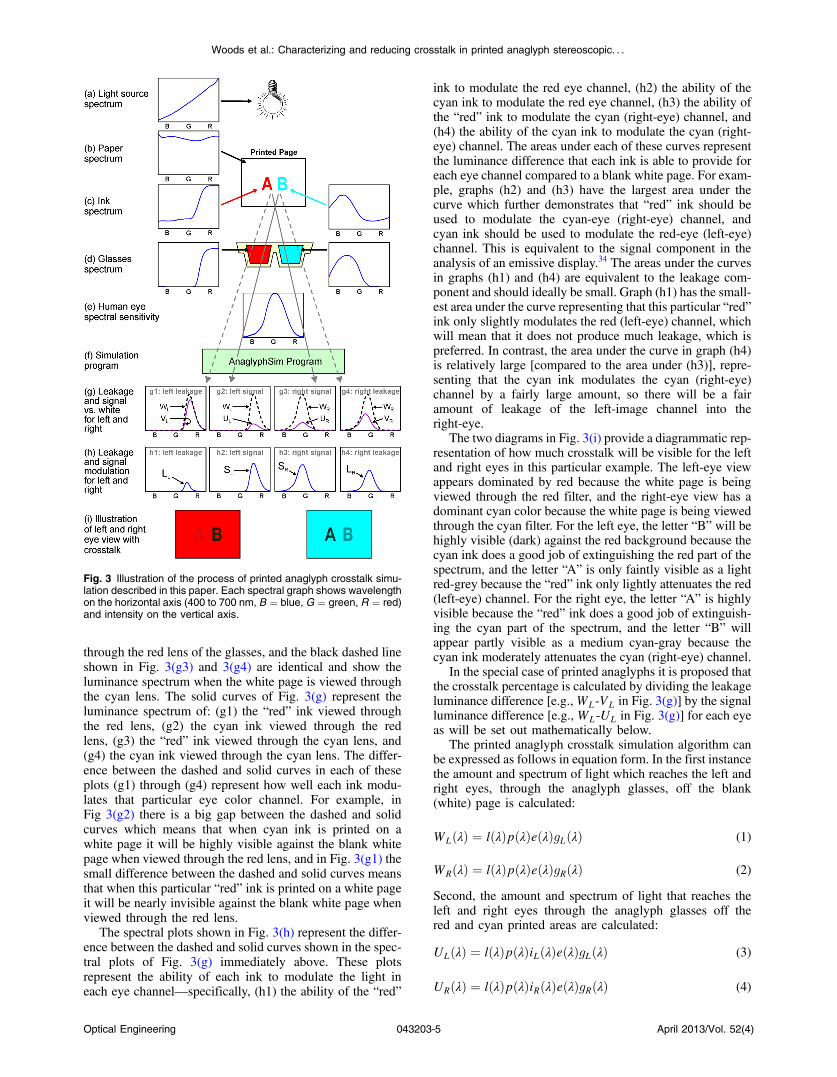
through the red lens of the glasses, and the black dashed lineshown in Fig. 3(g3) and 3(g4) are identical and show theluminance spectrum when the white page is viewed throughthe cyan lens. The solid curves of Fig. 3(g) represent theluminance spectrum of: (g1) the “red” ink viewed throughthe red lens, (g2) the cyan ink viewed through the redlens, (g3) the “red” ink viewed through the cyan lens, and(g4) the cyan ink viewed through the cyan lens. The differ-ence between the dashed and solid curves in each of theseplots (g1) through (g4) represent how well each ink modu-lates that particular eye color channel. For example, inFig 3(g2) there is a big gap between the dashed and solidcurves which means that when cyan ink is printed on awhite page it will be highly visible against the blank whitepage when viewed through the red lens, and in Fig. 3(g1) thesmall difference between the dashed and solid curves meansthat when this particular “red” ink is printed on a white pageit will be nearly invisible against the blank white page whenviewed through the red lens.
The spectral plots shown in Fig. 3(h) represent the differ-ence between the dashed and solid curves shown in the spec-tral plots of Fig. 3(g) immediately above. These plotsrepresent the ability of each ink to modulate the light ineach eye channel—specifically, (h1) the ability of the “red”
ink to modulate the red eye channel, (h2) the ability of thecyan ink to modulate the red eye channel, (h3) the ability ofthe “red” ink to modulate the cyan (right-eye) channel, and(h4) the ability of the cyan ink to modulate the cyan (right-eye) channel. The areas under each of these curves representthe luminance difference that each ink is able to provide foreach eye channel compared to a blank white page. For exam-ple, graphs (h2) and (h3) have the largest area under thecurve which further demonstrates that “red” ink should beused to modulate the cyan-eye (right-eye) channel, andcyan ink should be used to modulate the red-eye (left-eye)channel. This is equivalent to the signal component in theanalysis of an emissive display.34 The areas under the curvesin graphs (h1) and (h4) are equivalent to the leakage com-ponent and should ideally be small. Graph (h1) has the small-est area under the curve representing that this particular “red”ink only slightly modulates the red (left-eye) channel, whichwill mean that it does not produce much leakage, which ispreferred. In contrast, the area under the curve in graph (h4)is relatively large [compared to the area under (h3)], repre-senting that the cyan ink modulates the cyan (right-eye)channel by a fairly large amount, so there will be a fairamount of leakage of the left-image channel into theright-eye.
The two diagrams in Fig. 3(i) provide a diagrammatic rep-resentation of how much crosstalk will be visible for the leftand right eyes in this particular example. The left-eye viewappears dominated by red because the white page is beingviewed through the red filter, and the right-eye view has adominant cyan color because the white page is being viewedthrough the cyan filter. For the left eye, the letter “B” will behighly visible (dark) against the red background because thecyan ink does a good job of extinguishing the red part of thespectrum, and the letter “A” is only faintly visible as a lightred-grey because the “red” ink only lightly attenuates the red(left-eye) channel. For the right eye, the letter “A” is highlyvisible because the “red” ink does a good job of extinguish-ing the cyan part of the spectrum, and the letter “B” willappear partly visible as a medium cyan-gray because thecyan ink moderately attenuates the cyan (right-eye) channel.
In the special case of printed anaglyphs it is proposed thatthe crosstalk percentage is calculated by dividing the leakageluminance difference [e.g.,WL-VL in Fig. 3(g)] by the signalluminance difference [e.g., WL-UL in Fig. 3(g)] for each eyeas will be set out mathematically below.
The printed anaglyph crosstalk simulation algorithm canbe expressed as follows in equation form. In the first instancethe amount and spectrum of light which reaches the left andright eyes, through the anaglyph glasses, off the blank(white) page is calculated:
WLðλÞ ¼ lðλÞpðλÞeðλÞgLðλÞ (1)
WRðλÞ ¼ lðλÞpðλÞeðλÞgRðλÞ (2)
Second, the amount and spectrum of light that reaches theleft and right eyes through the anaglyph glasses off thered and cyan printed areas are calculated:
ULðλÞ ¼ lðλÞpðλÞiLðλÞeðλÞgLðλÞ (3)
URðλÞ ¼ lðλÞpðλÞiRðλÞeðλÞgRðλÞ (4)
Fig. 3 Illustration of the process of printed anaglyph crosstalk simu-lation described in this paper. Each spectral graph shows wavelengthon the horizontal axis (400 to 700 nm, B ¼ blue, G ¼ green, R ¼ red)and intensity on the vertical axis.
Optical Engineering 043203-5 April 2013/Vol. 52(4)
Woods et al.: Characterizing and reducing crosstalk in printed anaglyph stereoscopic. . .
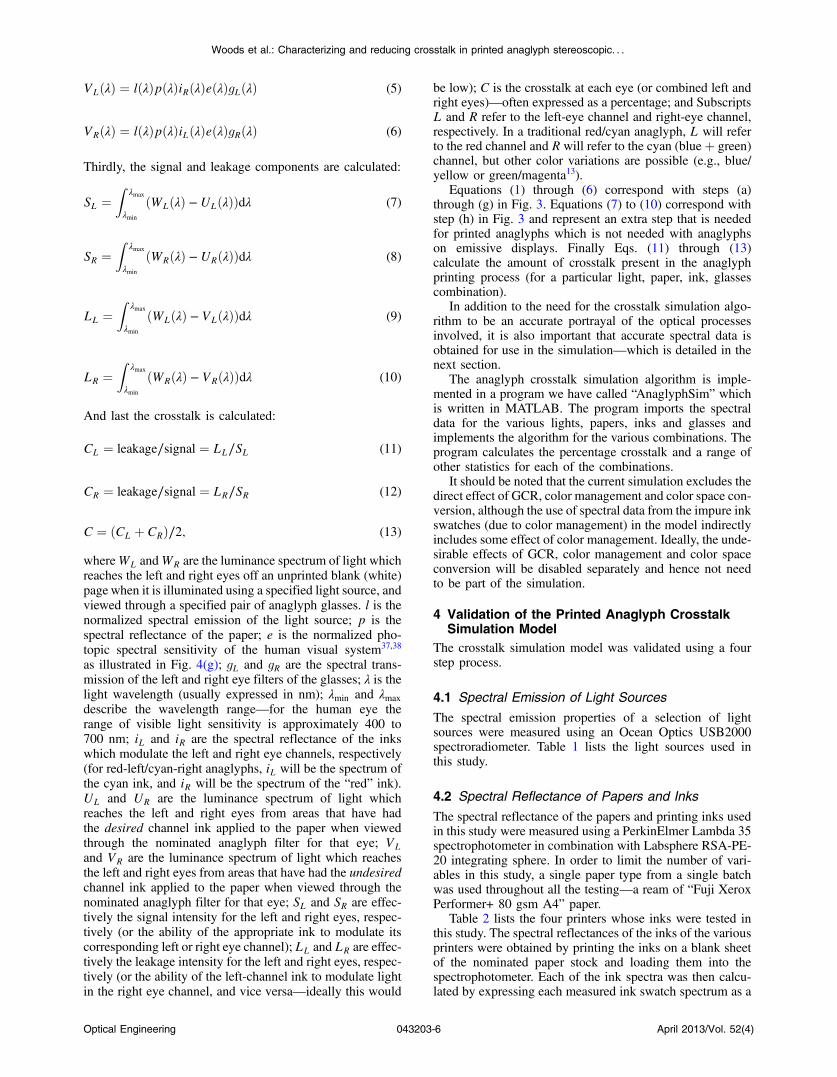
VLðλÞ ¼ lðλÞpðλÞiRðλÞeðλÞgLðλÞ (5)
VRðλÞ ¼ lðλÞpðλÞiLðλÞeðλÞgRðλÞ (6)
Thirdly, the signal and leakage components are calculated:
SL ¼Z
λmax
λmin
ðWLðλÞ − ULðλÞÞdλ (7)
SR ¼Z
λmax
λmin
ðWRðλÞ − URðλÞÞdλ (8)
LL ¼Z
λmax
λmin
ðWLðλÞ − VLðλÞÞdλ (9)
LR ¼Z
λmax
λmin
ðWRðλÞ − VRðλÞÞdλ (10)
And last the crosstalk is calculated:
CL ¼ leakage∕signal ¼ LL∕SL (11)
CR ¼ leakage∕signal ¼ LR∕SR (12)
C ¼ ðCL þ CRÞ∕2; (13)
whereWL andWR are the luminance spectrum of light whichreaches the left and right eyes off an unprinted blank (white)page when it is illuminated using a specified light source, andviewed through a specified pair of anaglyph glasses. l is thenormalized spectral emission of the light source; p is thespectral reflectance of the paper; e is the normalized pho-topic spectral sensitivity of the human visual system37,38
as illustrated in Fig. 4(g); gL and gR are the spectral trans-mission of the left and right eye filters of the glasses; λ is thelight wavelength (usually expressed in nm); λmin and λmax
describe the wavelength range—for the human eye therange of visible light sensitivity is approximately 400 to700 nm; iL and iR are the spectral reflectance of the inkswhich modulate the left and right eye channels, respectively(for red-left/cyan-right anaglyphs, iL will be the spectrum ofthe cyan ink, and iR will be the spectrum of the “red” ink).UL and UR are the luminance spectrum of light whichreaches the left and right eyes from areas that have hadthe desired channel ink applied to the paper when viewedthrough the nominated anaglyph filter for that eye; VLand VR are the luminance spectrum of light which reachesthe left and right eyes from areas that have had the undesiredchannel ink applied to the paper when viewed through thenominated anaglyph filter for that eye; SL and SR are effec-tively the signal intensity for the left and right eyes, respec-tively (or the ability of the appropriate ink to modulate itscorresponding left or right eye channel); LL and LR are effec-tively the leakage intensity for the left and right eyes, respec-tively (or the ability of the left-channel ink to modulate lightin the right eye channel, and vice versa—ideally this would
be low); C is the crosstalk at each eye (or combined left andright eyes)—often expressed as a percentage; and SubscriptsL and R refer to the left-eye channel and right-eye channel,respectively. In a traditional red/cyan anaglyph, L will referto the red channel and R will refer to the cyan (blueþ green)channel, but other color variations are possible (e.g., blue/yellow or green/magenta13).
Equations (1) through (6) correspond with steps (a)through (g) in Fig. 3. Equations (7) to (10) correspond withstep (h) in Fig. 3 and represent an extra step that is neededfor printed anaglyphs which is not needed with anaglyphson emissive displays. Finally Eqs. (11) through (13)calculate the amount of crosstalk present in the anaglyphprinting process (for a particular light, paper, ink, glassescombination).
In addition to the need for the crosstalk simulation algo-rithm to be an accurate portrayal of the optical processesinvolved, it is also important that accurate spectral data isobtained for use in the simulation—which is detailed in thenext section.
The anaglyph crosstalk simulation algorithm is imple-mented in a program we have called “AnaglyphSim” whichis written in MATLAB. The program imports the spectraldata for the various lights, papers, inks and glasses andimplements the algorithm for the various combinations. Theprogram calculates the percentage crosstalk and a range ofother statistics for each of the combinations.
It should be noted that the current simulation excludes thedirect effect of GCR, color management and color space con-version, although the use of spectral data from the impure inkswatches (due to color management) in the model indirectlyincludes some effect of color management. Ideally, the unde-sirable effects of GCR, color management and color spaceconversion will be disabled separately and hence not needto be part of the simulation.
4 Validation of the Printed Anaglyph CrosstalkSimulation Model
The crosstalk simulation model was validated using a fourstep process.
4.1 Spectral Emission of Light Sources
The spectral emission properties of a selection of lightsources were measured using an Ocean Optics USB2000spectroradiometer. Table 1 lists the light sources used inthis study.
4.2 Spectral Reflectance of Papers and Inks
The spectral reflectance of the papers and printing inks usedin this study were measured using a PerkinElmer Lambda 35spectrophotometer in combination with Labsphere RSA-PE-20 integrating sphere. In order to limit the number of vari-ables in this study, a single paper type from a single batchwas used throughout all the testing—a ream of “Fuji XeroxPerformer+ 80 gsm A4” paper.
Table 2 lists the four printers whose inks were tested inthis study. The spectral reflectances of the inks of the variousprinters were obtained by printing the inks on a blank sheetof the nominated paper stock and loading them into thespectrophotometer. Each of the ink spectra was then calcu-lated by expressing each measured ink swatch spectrum as a
Optical Engineering 043203-6 April 2013/Vol. 52(4)
Woods et al.: Characterizing and reducing crosstalk in printed anaglyph stereoscopic. . .
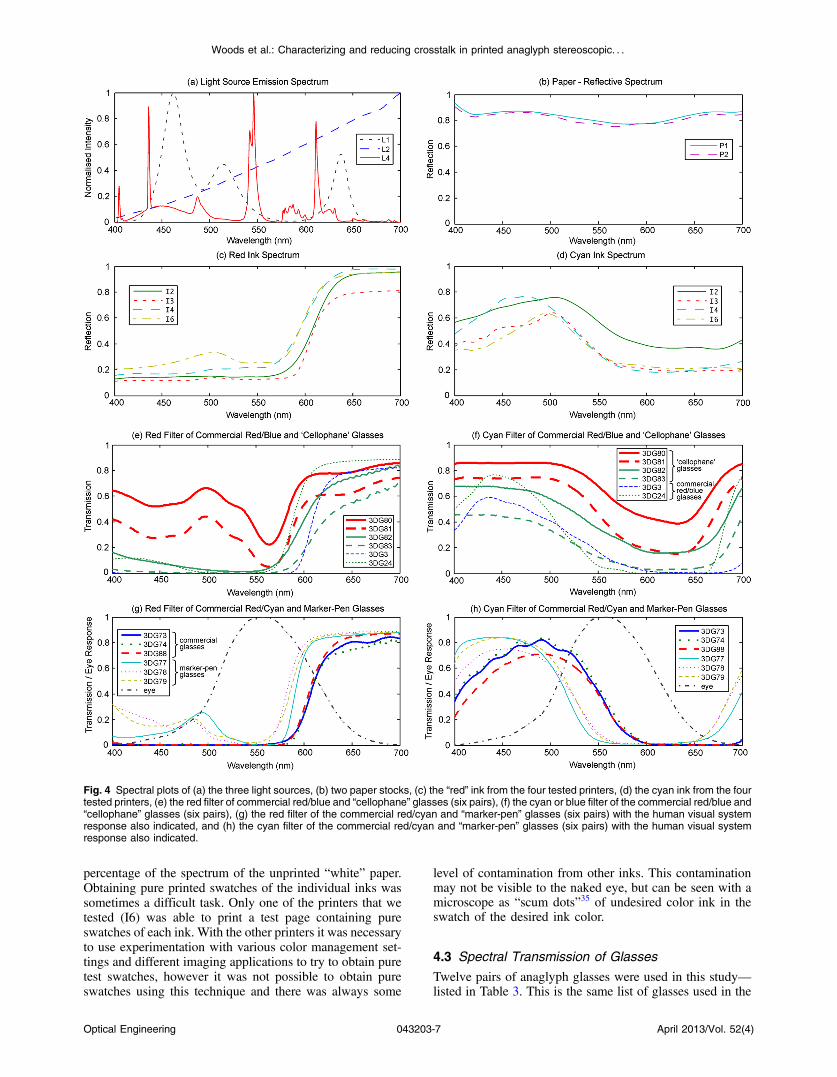
percentage of the spectrum of the unprinted “white” paper.Obtaining pure printed swatches of the individual inks wassometimes a difficult task. Only one of the printers that wetested (I6) was able to print a test page containing pureswatches of each ink. With the other printers it was necessaryto use experimentation with various color management set-tings and different imaging applications to try to obtain puretest swatches, however it was not possible to obtain pureswatches using this technique and there was always some
level of contamination from other inks. This contaminationmay not be visible to the naked eye, but can be seen with amicroscope as “scum dots”35 of undesired color ink in theswatch of the desired ink color.
4.3 Spectral Transmission of Glasses
Twelve pairs of anaglyph glasses were used in this study—listed in Table 3. This is the same list of glasses used in the
Fig. 4 Spectral plots of (a) the three light sources, (b) two paper stocks, (c) the “red” ink from the four tested printers, (d) the cyan ink from the fourtested printers, (e) the red filter of commercial red/blue and “cellophane” glasses (six pairs), (f) the cyan or blue filter of the commercial red/blue and“cellophane” glasses (six pairs), (g) the red filter of the commercial red/cyan and “marker-pen” glasses (six pairs) with the human visual systemresponse also indicated, and (h) the cyan filter of the commercial red/cyan and “marker-pen” glasses (six pairs) with the human visual systemresponse also indicated.
Optical Engineering 043203-7 April 2013/Vol. 52(4)
Woods et al.: Characterizing and reducing crosstalk in printed anaglyph stereoscopic. . .
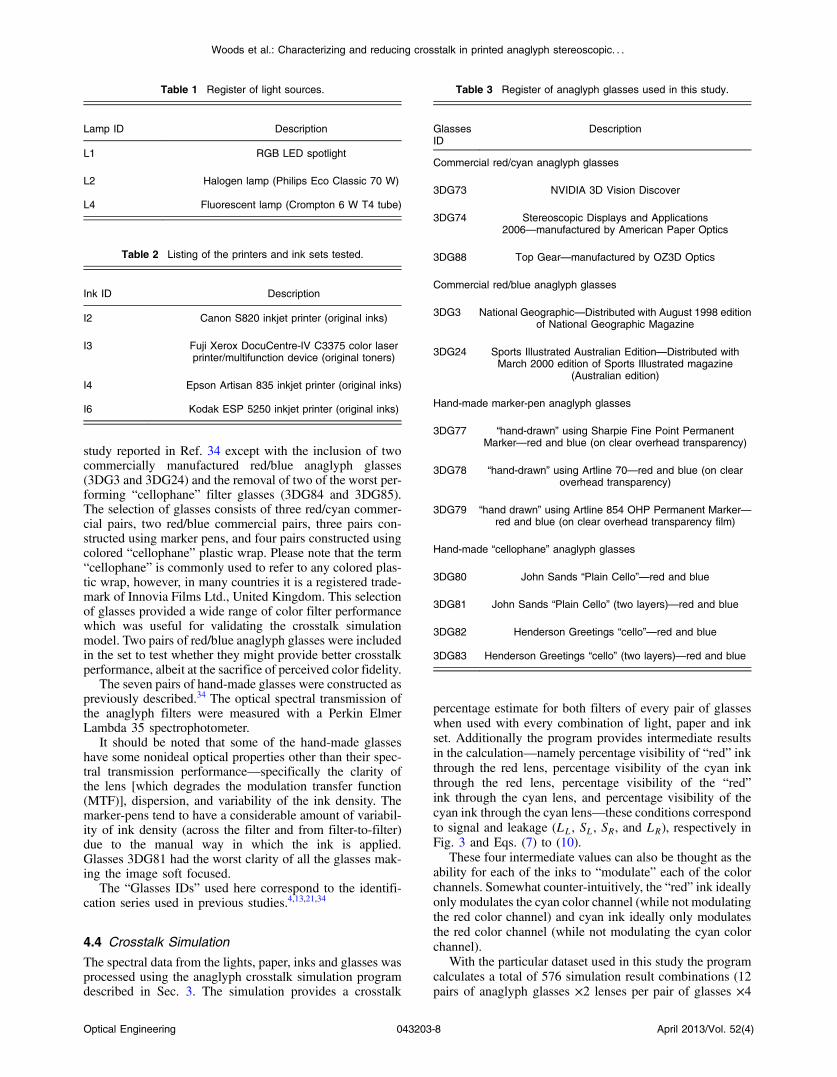
study reported in Ref. 34 except with the inclusion of twocommercially manufactured red/blue anaglyph glasses(3DG3 and 3DG24) and the removal of two of the worst per-forming “cellophane” filter glasses (3DG84 and 3DG85).The selection of glasses consists of three red/cyan commer-cial pairs, two red/blue commercial pairs, three pairs con-structed using marker pens, and four pairs constructed usingcolored “cellophane” plastic wrap. Please note that the term“cellophane” is commonly used to refer to any colored plas-tic wrap, however, in many countries it is a registered trade-mark of Innovia Films Ltd., United Kingdom. This selectionof glasses provided a wide range of color filter performancewhich was useful for validating the crosstalk simulationmodel. Two pairs of red/blue anaglyph glasses were includedin the set to test whether they might provide better crosstalkperformance, albeit at the sacrifice of perceived color fidelity.
The seven pairs of hand-made glasses were constructed aspreviously described.34 The optical spectral transmission ofthe anaglyph filters were measured with a Perkin ElmerLambda 35 spectrophotometer.
It should be noted that some of the hand-made glasseshave some nonideal optical properties other than their spec-tral transmission performance—specifically the clarity ofthe lens [which degrades the modulation transfer function(MTF)], dispersion, and variability of the ink density. Themarker-pens tend to have a considerable amount of variabil-ity of ink density (across the filter and from filter-to-filter)due to the manual way in which the ink is applied.Glasses 3DG81 had the worst clarity of all the glasses mak-ing the image soft focused.
The “Glasses IDs” used here correspond to the identifi-cation series used in previous studies.4,13,21,34
4.4 Crosstalk Simulation
The spectral data from the lights, paper, inks and glasses wasprocessed using the anaglyph crosstalk simulation programdescribed in Sec. 3. The simulation provides a crosstalk
percentage estimate for both filters of every pair of glasseswhen used with every combination of light, paper and inkset. Additionally the program provides intermediate resultsin the calculation—namely percentage visibility of “red” inkthrough the red lens, percentage visibility of the cyan inkthrough the red lens, percentage visibility of the “red”ink through the cyan lens, and percentage visibility of thecyan ink through the cyan lens—these conditions correspondto signal and leakage (LL, SL, SR, and LR), respectively inFig. 3 and Eqs. (7) to (10).
These four intermediate values can also be thought as theability for each of the inks to “modulate” each of the colorchannels. Somewhat counter-intuitively, the “red” ink ideallyonly modulates the cyan color channel (while not modulatingthe red color channel) and cyan ink ideally only modulatesthe red color channel (while not modulating the cyan colorchannel).
With the particular dataset used in this study the programcalculates a total of 576 simulation result combinations (12pairs of anaglyph glasses ×2 lenses per pair of glasses ×4
Table 1 Register of light sources.
Lamp ID Description
L1 RGB LED spotlight
L2 Halogen lamp (Philips Eco Classic 70 W)
L4 Fluorescent lamp (Crompton 6 W T4 tube)
Table 2 Listing of the printers and ink sets tested.
Ink ID Description
I2 Canon S820 inkjet printer (original inks)
I3 Fuji Xerox DocuCentre-IV C3375 color laserprinter/multifunction device (original toners)
I4 Epson Artisan 835 inkjet printer (original inks)
I6 Kodak ESP 5250 inkjet printer (original inks)
Table 3 Register of anaglyph glasses used in this study.
GlassesID
Description
Commercial red/cyan anaglyph glasses
3DG73 NVIDIA 3D Vision Discover
3DG74 Stereoscopic Displays and Applications2006—manufactured by American Paper Optics
3DG88 Top Gear—manufactured by OZ3D Optics
Commercial red/blue anaglyph glasses
3DG3 National Geographic—Distributed with August 1998 editionof National Geographic Magazine
3DG24 Sports Illustrated Australian Edition—Distributed withMarch 2000 edition of Sports Illustrated magazine
(Australian edition)
Hand-made marker-pen anaglyph glasses
3DG77 “hand-drawn” using Sharpie Fine Point PermanentMarker—red and blue (on clear overhead transparency)
3DG78 “hand-drawn” using Artline 70—red and blue (on clearoverhead transparency)
3DG79 “hand drawn” using Artline 854 OHP Permanent Marker—red and blue (on clear overhead transparency film)
Hand-made “cellophane” anaglyph glasses
3DG80 John Sands “Plain Cello”—red and blue
3DG81 John Sands “Plain Cello” (two layers)—red and blue
3DG82 Henderson Greetings “cello”—red and blue
3DG83 Henderson Greetings “cello” (two layers)—red and blue
Optical Engineering 043203-8 April 2013/Vol. 52(4)
Woods et al.: Characterizing and reducing crosstalk in printed anaglyph stereoscopic. . .

printer ink sets ×2 inks per printer (“red” and cyan) ×1 papertype ×3 light sources ¼ 576 values).
4.5 Visual Ranking
The crosstalk performance of the various anaglyph filterswere visually ranked to allow a comparison with the cross-talk simulation model results. In a previous study,34 the vis-ual ranking was performed on the basis of the amount ofcrosstalk of each combination, but, it can be difficult foran observer to judge crosstalk visually because it is a derivedvalue—that is, the luminance of the leakage component di-vided by the luminance of the signal component, whilst alsoignoring the effect of overall luminance and any other lenseffects such as defocus or filter pigment variability. For thisparticular project, it was decided to perform the visual rank-ing on the basis of a simpler intermediate value—i.e., thepercentage visibility of a particular ink through a particularcolored lens (i.e., modulation). This simplifies the compari-son for the user, but still provides a useful ranking compari-son in order to test the validity of the simulation.
Figure 5 shows the four different printed test targets usedto perform the visual ranking. Each of the four test targetswas printed separately on each of the four printers listedin Table 2 (resulting in 16 test sheets). Figure 5(a) is usedto compare the percentage visibility of the “red” ink throughthe cyan lens—ideally “red” ink should appear dark or blackwhen viewed through the cyan lens. The black surround inFig. 5(a) and 5(b) was included because it was found to makeit easier to judge the darkness of the colored ink area.Figure 5(b) is used to compare the percentage visibility ofthe cyan ink through the red lens—ideally cyan ink shouldappear dark or black when viewed through the red lens.Figure 5(c) is used to compare the percentage visibility ofthe “red” ink through the red lens, and Fig. 5(d) is usedto compare the percentage visibility of the cyan ink throughthe cyan lens.
In the authors’ previous study34 of anaglyph crosstalk onemissive displays the visual ranking was performed acrossonly a single dimension (i.e., across the 12 sets of anaglyphglasses for a particular display condition). This provided agood validation of the simulation’s ability to correctly esti-mate the relative performance of different sets of anaglyphglasses, however it did not specifically validate the model’sability to correctly estimate the relative performance of dif-ferent displays. In this study, the visual ranking process wasexpanded to include two additional conditions which rankedanaglyph performance between (a) the four different ink sets,and (b) the three different light sources—therefore the modelis now being validated in three dimensions (glasses, ink set,and light source).
Five observers (labeled Ob1 to Ob5) took part in the vis-ual ranking tests. Due to the large number of individual testcombinations (576 as stated in the previous section) it wasnecessary to limit the number of test rank combinations per-formed by the observers. We feel that the range of rank testsperformed (detailed below) allowed a reasonable assessment,whilst also limiting the time to undertake the experiment toavoid observer overload. The visual ranking process tookapproximately two hours for each observer.
The first test condition performed was a ranking in theglasses dimension. The 12 pairs of glasses listed in Table 3were mounted in similar white frames, ordered randomly,and each observer was asked to rank the glasses whilst look-ing at a particular test target [Fig. 5(a)–5(d)] printed by aparticular printer, illuminated by a nominated light source.The observers were asked to compare two glasses at atime using the printed test target and to place the glasseson the table in front of them with the lowest modulation(least visibility) on the left to the highest modulation (highestvisibility) on the right. Each observer made multiple passesthrough the set of glasses in front of them to confirm that theglasses were in the correct order. Each observer performed aseparate sorting task for each condition, so that each observerperformed 10 glasses sorting tasks (labeled “A1” through“A10” in Table 4). The visual ranking test was conductedin a photographic dark room with the only source of lightingbeing the specified light source (from Table 1) so as to pre-vent ambient lighting affecting the results. The observerswere briefed at the beginning of the visual trials as to thebackground of the project and the process they were touse in each visual rank test.
The second test condition performed was a ranking in theink set dimension. A single pair of glasses (3DG74) was usedto view and rank a set of four test prints (one from each of thefour printers), whilst illuminated by a specified lamp. The sixtest conditions for this test are itemized in Table 5. Eachobserver was asked to rank the four test prints in terms ofthe amount of leakage each condition exhibited.
The third test condition performed was a ranking in thelamp illuminant dimension. A single pair of glasses(3DG74), was used to view a specified test print (printed bya nominated printer), and the observer was asked to rank theamount of leakage present whilst successively illuminated bythe three lamp types (from Table 1). The four test conditionsperformed are itemized in Table 6.
The visual validation test was conducted on the basis ofthe relative ranking of visual performance because thehuman visual system is not accurate at determining absolute
Fig. 5 The four printed visual test targets used during the anaglyphcrosstalk visual ranking tests. Target (a) was used to measure theability of “red” ink to modulate cyan light (as viewed through thecyan lens), (b) was used to measure the ability of cyan ink to modulatered light (as viewed through the red lens), (c) was used to measure theinvisibility of the “red” ink when viewed through the red lens, and(d) was used to measure the invisibility of the cyan ink when viewedthrough the cyan lens. The test targets are printed one per page foreach printer ink set.
Optical Engineering 043203-9 April 2013/Vol. 52(4)
Woods et al.: Characterizing and reducing crosstalk in printed anaglyph stereoscopic. . .
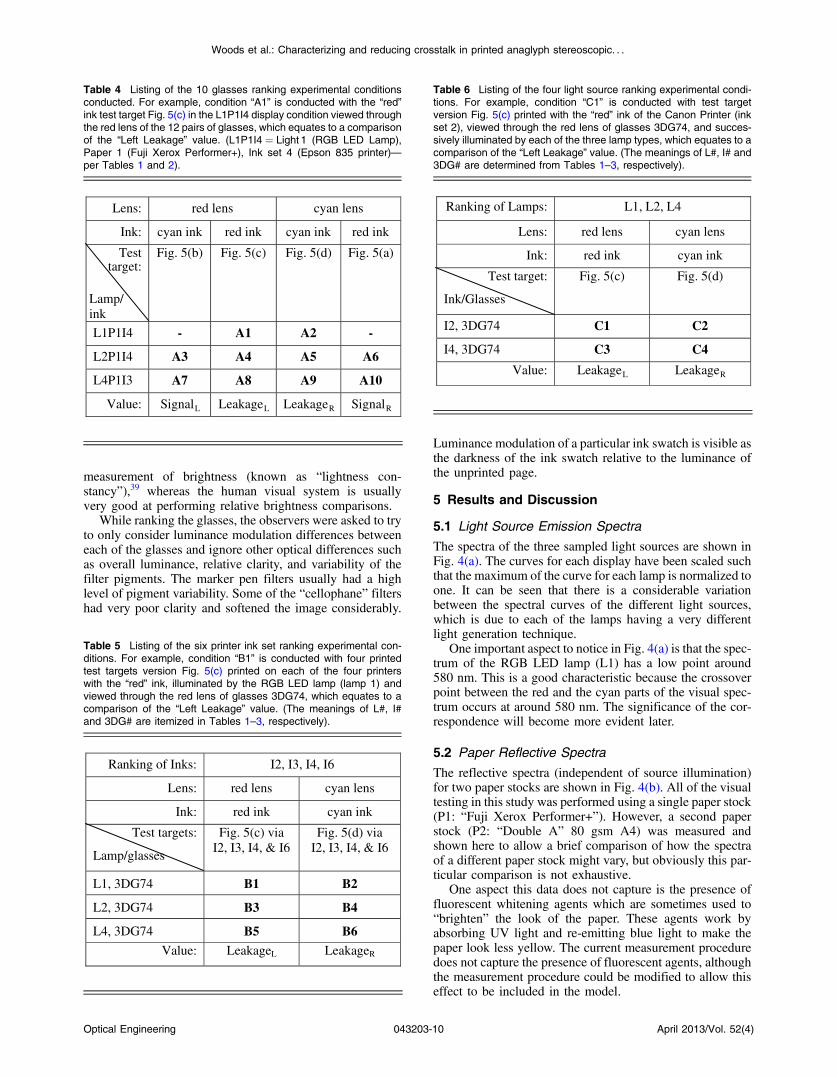
measurement of brightness (known as “lightness con-stancy”),39 whereas the human visual system is usuallyvery good at performing relative brightness comparisons.
While ranking the glasses, the observers were asked to tryto only consider luminance modulation differences betweeneach of the glasses and ignore other optical differences suchas overall luminance, relative clarity, and variability of thefilter pigments. The marker pen filters usually had a highlevel of pigment variability. Some of the “cellophane” filtershad very poor clarity and softened the image considerably.
Luminance modulation of a particular ink swatch is visible asthe darkness of the ink swatch relative to the luminance ofthe unprinted page.
5 Results and Discussion
5.1 Light Source Emission Spectra
The spectra of the three sampled light sources are shown inFig. 4(a). The curves for each display have been scaled suchthat the maximum of the curve for each lamp is normalized toone. It can be seen that there is a considerable variationbetween the spectral curves of the different light sources,which is due to each of the lamps having a very differentlight generation technique.
One important aspect to notice in Fig. 4(a) is that the spec-trum of the RGB LED lamp (L1) has a low point around580 nm. This is a good characteristic because the crossoverpoint between the red and the cyan parts of the visual spec-trum occurs at around 580 nm. The significance of the cor-respondence will become more evident later.
5.2 Paper Reflective Spectra
The reflective spectra (independent of source illumination)for two paper stocks are shown in Fig. 4(b). All of the visualtesting in this study was performed using a single paper stock(P1: “Fuji Xerox Performer+”). However, a second paperstock (P2: “Double A” 80 gsm A4) was measured andshown here to allow a brief comparison of how the spectraof a different paper stock might vary, but obviously this par-ticular comparison is not exhaustive.
One aspect this data does not capture is the presence offluorescent whitening agents which are sometimes used to“brighten” the look of the paper. These agents work byabsorbing UV light and re-emitting blue light to make thepaper look less yellow. The current measurement proceduredoes not capture the presence of fluorescent agents, althoughthe measurement procedure could be modified to allow thiseffect to be included in the model.
Table 4 Listing of the 10 glasses ranking experimental conditionsconducted. For example, condition “A1” is conducted with the “red”ink test target Fig. 5(c) in the L1P1I4 display condition viewed throughthe red lens of the 12 pairs of glasses, which equates to a comparisonof the “Left Leakage” value. (L1P1I4 ¼ Light 1 (RGB LED Lamp),Paper 1 (Fuji Xerox Performer+), Ink set 4 (Epson 835 printer)—per Tables 1 and 2).
Lens: red lens cyan lens
Ink: cyan ink red ink cyan ink red ink
Test target:
Lamp/ ink
Fig. 5(b) Fig. 5(c) Fig. 5(d) Fig. 5(a)
L1P1I4 - A1 A2 -
L2P1I4 A3 A4 A5 A6
L4P1I3 A7 A8 A9 A10
Value: SignalL LeakageL LeakageR SignalR
Table 5 Listing of the six printer ink set ranking experimental con-ditions. For example, condition “B1” is conducted with four printedtest targets version Fig. 5(c) printed on each of the four printerswith the “red” ink, illuminated by the RGB LED lamp (lamp 1) andviewed through the red lens of glasses 3DG74, which equates to acomparison of the “Left Leakage” value. (The meanings of L#, I#and 3DG# are itemized in Tables 1–3, respectively).
Ranking of Inks: I2, I3, I4, I6
Lens: red lens cyan lens
Ink: red ink cyan ink
Test targets:
Lamp/glasses
Fig. 5(c) via I2, I3, I4, & I6
Fig. 5(d) via I2, I3, I4, & I6
L1, 3DG74 B1 B2
L2, 3DG74 B3 B4
L4, 3DG74 B5 B6
Value: LeakageL LeakageR
Table 6 Listing of the four light source ranking experimental condi-tions. For example, condition “C1” is conducted with test targetversion Fig. 5(c) printed with the “red” ink of the Canon Printer (inkset 2), viewed through the red lens of glasses 3DG74, and succes-sively illuminated by each of the three lamp types, which equates to acomparison of the “Left Leakage” value. (The meanings of L#, I# and3DG# are determined from Tables 1–3, respectively).
Ranking of Lamps: L1, L2, L4
Lens: red lens cyan lens
Ink: red ink cyan ink
Test target:
Ink/Glasses
Fig. 5(c) Fig. 5(d)
I2, 3DG74 C1 C2
I4, 3DG74 C3 C4
Value: LeakageL LeakageR
Optical Engineering 043203-10 April 2013/Vol. 52(4)
Woods et al.: Characterizing and reducing crosstalk in printed anaglyph stereoscopic. . .
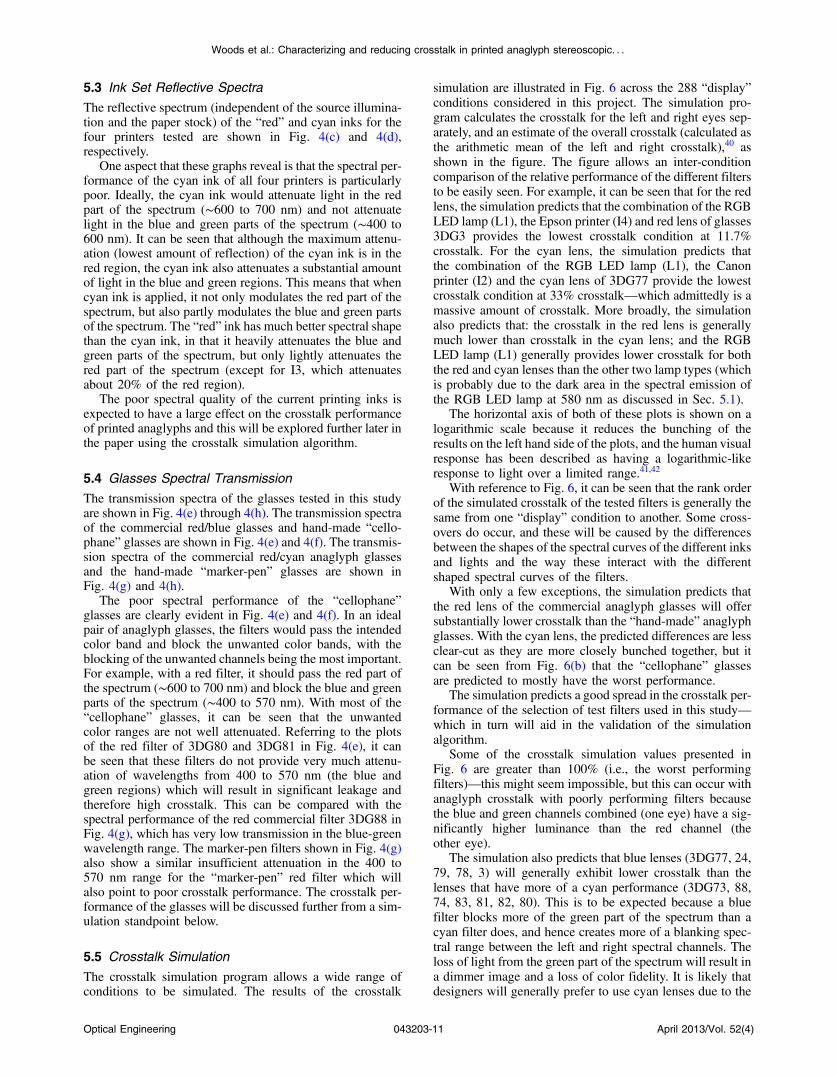
5.3 Ink Set Reflective Spectra
The reflective spectrum (independent of the source illumina-tion and the paper stock) of the “red” and cyan inks for thefour printers tested are shown in Fig. 4(c) and 4(d),respectively.
One aspect that these graphs reveal is that the spectral per-formance of the cyan ink of all four printers is particularlypoor. Ideally, the cyan ink would attenuate light in the redpart of the spectrum (∼600 to 700 nm) and not attenuatelight in the blue and green parts of the spectrum (∼400 to600 nm). It can be seen that although the maximum attenu-ation (lowest amount of reflection) of the cyan ink is in thered region, the cyan ink also attenuates a substantial amountof light in the blue and green regions. This means that whencyan ink is applied, it not only modulates the red part of thespectrum, but also partly modulates the blue and green partsof the spectrum. The “red” ink has much better spectral shapethan the cyan ink, in that it heavily attenuates the blue andgreen parts of the spectrum, but only lightly attenuates thered part of the spectrum (except for I3, which attenuatesabout 20% of the red region).
The poor spectral quality of the current printing inks isexpected to have a large effect on the crosstalk performanceof printed anaglyphs and this will be explored further later inthe paper using the crosstalk simulation algorithm.
5.4 Glasses Spectral Transmission
The transmission spectra of the glasses tested in this studyare shown in Fig. 4(e) through 4(h). The transmission spectraof the commercial red/blue glasses and hand-made “cello-phane” glasses are shown in Fig. 4(e) and 4(f). The transmis-sion spectra of the commercial red/cyan anaglyph glassesand the hand-made “marker-pen” glasses are shown inFig. 4(g) and 4(h).
The poor spectral performance of the “cellophane”glasses are clearly evident in Fig. 4(e) and 4(f). In an idealpair of anaglyph glasses, the filters would pass the intendedcolor band and block the unwanted color bands, with theblocking of the unwanted channels being the most important.For example, with a red filter, it should pass the red part ofthe spectrum (∼600 to 700 nm) and block the blue and greenparts of the spectrum (∼400 to 570 nm). With most of the“cellophane” glasses, it can be seen that the unwantedcolor ranges are not well attenuated. Referring to the plotsof the red filter of 3DG80 and 3DG81 in Fig. 4(e), it canbe seen that these filters do not provide very much attenu-ation of wavelengths from 400 to 570 nm (the blue andgreen regions) which will result in significant leakage andtherefore high crosstalk. This can be compared with thespectral performance of the red commercial filter 3DG88 inFig. 4(g), which has very low transmission in the blue-greenwavelength range. The marker-pen filters shown in Fig. 4(g)also show a similar insufficient attenuation in the 400 to570 nm range for the “marker-pen” red filter which willalso point to poor crosstalk performance. The crosstalk per-formance of the glasses will be discussed further from a sim-ulation standpoint below.
5.5 Crosstalk Simulation
The crosstalk simulation program allows a wide range ofconditions to be simulated. The results of the crosstalk
simulation are illustrated in Fig. 6 across the 288 “display”conditions considered in this project. The simulation pro-gram calculates the crosstalk for the left and right eyes sep-arately, and an estimate of the overall crosstalk (calculated asthe arithmetic mean of the left and right crosstalk),40 asshown in the figure. The figure allows an inter-conditioncomparison of the relative performance of the different filtersto be easily seen. For example, it can be seen that for the redlens, the simulation predicts that the combination of the RGBLED lamp (L1), the Epson printer (I4) and red lens of glasses3DG3 provides the lowest crosstalk condition at 11.7%crosstalk. For the cyan lens, the simulation predicts thatthe combination of the RGB LED lamp (L1), the Canonprinter (I2) and the cyan lens of 3DG77 provide the lowestcrosstalk condition at 33% crosstalk—which admittedly is amassive amount of crosstalk. More broadly, the simulationalso predicts that: the crosstalk in the red lens is generallymuch lower than crosstalk in the cyan lens; and the RGBLED lamp (L1) generally provides lower crosstalk for boththe red and cyan lenses than the other two lamp types (whichis probably due to the dark area in the spectral emission ofthe RGB LED lamp at 580 nm as discussed in Sec. 5.1).
The horizontal axis of both of these plots is shown on alogarithmic scale because it reduces the bunching of theresults on the left hand side of the plots, and the human visualresponse has been described as having a logarithmic-likeresponse to light over a limited range.41,42
With reference to Fig. 6, it can be seen that the rank orderof the simulated crosstalk of the tested filters is generally thesame from one “display” condition to another. Some cross-overs do occur, and these will be caused by the differencesbetween the shapes of the spectral curves of the different inksand lights and the way these interact with the differentshaped spectral curves of the filters.
With only a few exceptions, the simulation predicts thatthe red lens of the commercial anaglyph glasses will offersubstantially lower crosstalk than the “hand-made” anaglyphglasses. With the cyan lens, the predicted differences are lessclear-cut as they are more closely bunched together, but itcan be seen from Fig. 6(b) that the “cellophane” glassesare predicted to mostly have the worst performance.
The simulation predicts a good spread in the crosstalk per-formance of the selection of test filters used in this study—which in turn will aid in the validation of the simulationalgorithm.
Some of the crosstalk simulation values presented inFig. 6 are greater than 100% (i.e., the worst performingfilters)—this might seem impossible, but this can occur withanaglyph crosstalk with poorly performing filters becausethe blue and green channels combined (one eye) have a sig-nificantly higher luminance than the red channel (theother eye).
The simulation also predicts that blue lenses (3DG77, 24,79, 78, 3) will generally exhibit lower crosstalk than thelenses that have more of a cyan performance (3DG73, 88,74, 83, 81, 82, 80). This is to be expected because a bluefilter blocks more of the green part of the spectrum than acyan filter does, and hence creates more of a blanking spec-tral range between the left and right spectral channels. Theloss of light from the green part of the spectrum will result ina dimmer image and a loss of color fidelity. It is likely thatdesigners will generally prefer to use cyan lenses due to the
Optical Engineering 043203-11 April 2013/Vol. 52(4)
Woods et al.: Characterizing and reducing crosstalk in printed anaglyph stereoscopic. . .
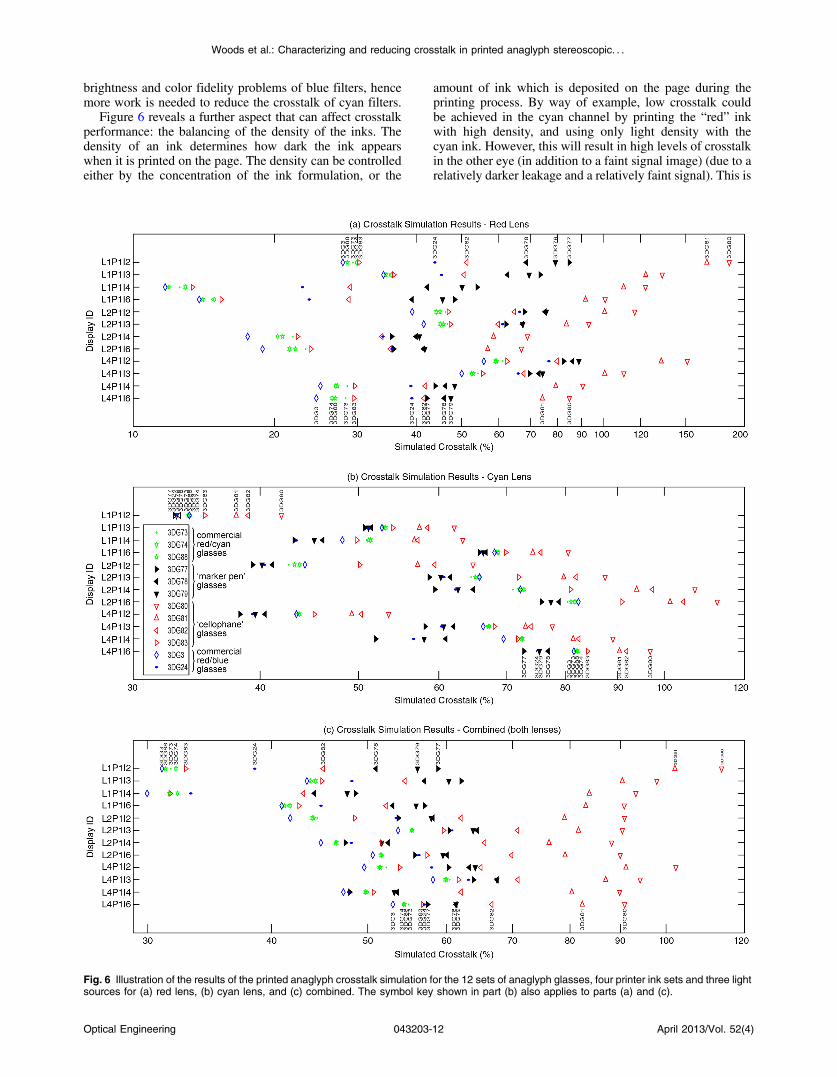
brightness and color fidelity problems of blue filters, hencemore work is needed to reduce the crosstalk of cyan filters.
Figure 6 reveals a further aspect that can affect crosstalkperformance: the balancing of the density of the inks. Thedensity of an ink determines how dark the ink appearswhen it is printed on the page. The density can be controlledeither by the concentration of the ink formulation, or the
amount of ink which is deposited on the page during theprinting process. By way of example, low crosstalk couldbe achieved in the cyan channel by printing the “red” inkwith high density, and using only light density with thecyan ink. However, this will result in high levels of crosstalkin the other eye (in addition to a faint signal image) (due to arelatively darker leakage and a relatively faint signal). This is
Fig. 6 Illustration of the results of the printed anaglyph crosstalk simulation for the 12 sets of anaglyph glasses, four printer ink sets and three lightsources for (a) red lens, (b) cyan lens, and (c) combined. The symbol key shown in part (b) also applies to parts (a) and (c).
Optical Engineering 043203-12 April 2013/Vol. 52(4)
Woods et al.: Characterizing and reducing crosstalk in printed anaglyph stereoscopic. . .
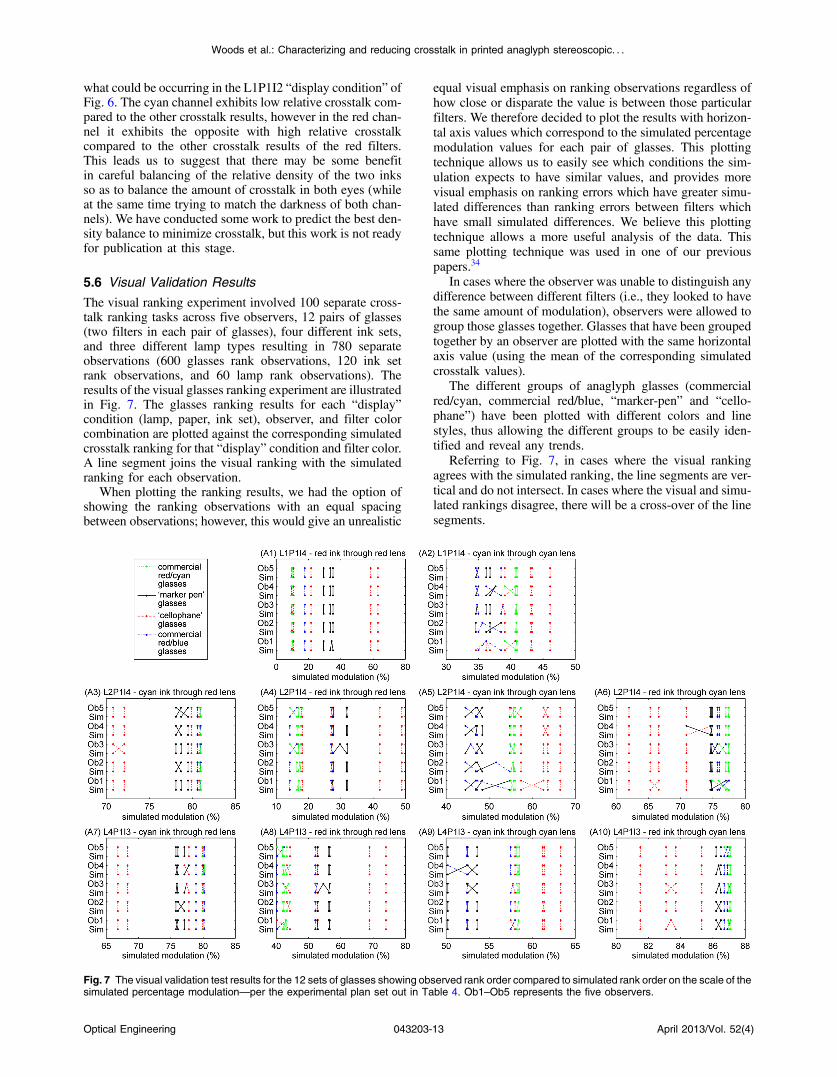
what could be occurring in the L1P1I2 “display condition” ofFig. 6. The cyan channel exhibits low relative crosstalk com-pared to the other crosstalk results, however in the red chan-nel it exhibits the opposite with high relative crosstalkcompared to the other crosstalk results of the red filters.This leads us to suggest that there may be some benefitin careful balancing of the relative density of the two inksso as to balance the amount of crosstalk in both eyes (whileat the same time trying to match the darkness of both chan-nels). We have conducted some work to predict the best den-sity balance to minimize crosstalk, but this work is not readyfor publication at this stage.
5.6 Visual Validation Results
The visual ranking experiment involved 100 separate cross-talk ranking tasks across five observers, 12 pairs of glasses(two filters in each pair of glasses), four different ink sets,and three different lamp types resulting in 780 separateobservations (600 glasses rank observations, 120 ink setrank observations, and 60 lamp rank observations). Theresults of the visual glasses ranking experiment are illustratedin Fig. 7. The glasses ranking results for each “display”condition (lamp, paper, ink set), observer, and filter colorcombination are plotted against the corresponding simulatedcrosstalk ranking for that “display” condition and filter color.A line segment joins the visual ranking with the simulatedranking for each observation.
When plotting the ranking results, we had the option ofshowing the ranking observations with an equal spacingbetween observations; however, this would give an unrealistic
equal visual emphasis on ranking observations regardless ofhow close or disparate the value is between those particularfilters. We therefore decided to plot the results with horizon-tal axis values which correspond to the simulated percentagemodulation values for each pair of glasses. This plottingtechnique allows us to easily see which conditions the sim-ulation expects to have similar values, and provides morevisual emphasis on ranking errors which have greater simu-lated differences than ranking errors between filters whichhave small simulated differences. We believe this plottingtechnique allows a more useful analysis of the data. Thissame plotting technique was used in one of our previouspapers.34
In cases where the observer was unable to distinguish anydifference between different filters (i.e., they looked to havethe same amount of modulation), observers were allowed togroup those glasses together. Glasses that have been groupedtogether by an observer are plotted with the same horizontalaxis value (using the mean of the corresponding simulatedcrosstalk values).
The different groups of anaglyph glasses (commercialred/cyan, commercial red/blue, “marker-pen” and “cello-phane”) have been plotted with different colors and linestyles, thus allowing the different groups to be easily iden-tified and reveal any trends.
Referring to Fig. 7, in cases where the visual rankingagrees with the simulated ranking, the line segments are ver-tical and do not intersect. In cases where the visual and simu-lated rankings disagree, there will be a cross-over of the linesegments.
Fig. 7 The visual validation test results for the 12 sets of glasses showing observed rank order compared to simulated rank order on the scale of thesimulated percentage modulation—per the experimental plan set out in Table 4. Ob1–Ob5 represents the five observers.
Optical Engineering 043203-13 April 2013/Vol. 52(4)
Woods et al.: Characterizing and reducing crosstalk in printed anaglyph stereoscopic. . .
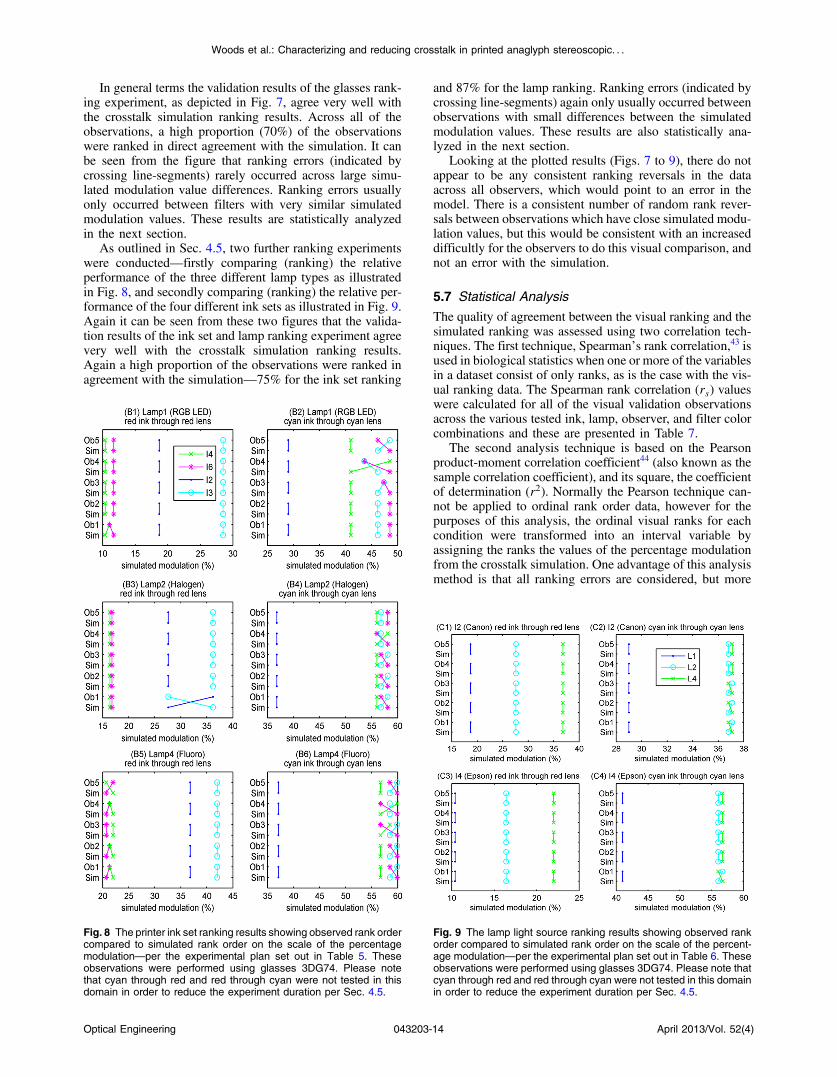
In general terms the validation results of the glasses rank-ing experiment, as depicted in Fig. 7, agree very well withthe crosstalk simulation ranking results. Across all of theobservations, a high proportion (70%) of the observationswere ranked in direct agreement with the simulation. It canbe seen from the figure that ranking errors (indicated bycrossing line-segments) rarely occurred across large simu-lated modulation value differences. Ranking errors usuallyonly occurred between filters with very similar simulatedmodulation values. These results are statistically analyzedin the next section.
As outlined in Sec. 4.5, two further ranking experimentswere conducted—firstly comparing (ranking) the relativeperformance of the three different lamp types as illustratedin Fig. 8, and secondly comparing (ranking) the relative per-formance of the four different ink sets as illustrated in Fig. 9.Again it can be seen from these two figures that the valida-tion results of the ink set and lamp ranking experiment agreevery well with the crosstalk simulation ranking results.Again a high proportion of the observations were ranked inagreement with the simulation—75% for the ink set ranking
and 87% for the lamp ranking. Ranking errors (indicated bycrossing line-segments) again only usually occurred betweenobservations with small differences between the simulatedmodulation values. These results are also statistically ana-lyzed in the next section.
Looking at the plotted results (Figs. 7 to 9), there do notappear to be any consistent ranking reversals in the dataacross all observers, which would point to an error in themodel. There is a consistent number of random rank rever-sals between observations which have close simulated modu-lation values, but this would be consistent with an increaseddifficultly for the observers to do this visual comparison, andnot an error with the simulation.
5.7 Statistical Analysis
The quality of agreement between the visual ranking and thesimulated ranking was assessed using two correlation tech-niques. The first technique, Spearman’s rank correlation,43 isused in biological statistics when one or more of the variablesin a dataset consist of only ranks, as is the case with the vis-ual ranking data. The Spearman rank correlation (rs) valueswere calculated for all of the visual validation observationsacross the various tested ink, lamp, observer, and filter colorcombinations and these are presented in Table 7.
The second analysis technique is based on the Pearsonproduct-moment correlation coefficient44 (also known as thesample correlation coefficient), and its square, the coefficientof determination (r2). Normally the Pearson technique can-not be applied to ordinal rank order data, however for thepurposes of this analysis, the ordinal visual ranks for eachcondition were transformed into an interval variable byassigning the ranks the values of the percentage modulationfrom the crosstalk simulation. One advantage of this analysismethod is that all ranking errors are considered, but more
Fig. 8 The printer ink set ranking results showing observed rank ordercompared to simulated rank order on the scale of the percentagemodulation—per the experimental plan set out in Table 5. Theseobservations were performed using glasses 3DG74. Please notethat cyan through red and red through cyan were not tested in thisdomain in order to reduce the experiment duration per Sec. 4.5.
Fig. 9 The lamp light source ranking results showing observed rankorder compared to simulated rank order on the scale of the percent-age modulation—per the experimental plan set out in Table 6. Theseobservations were performed using glasses 3DG74. Please note thatcyan through red and red through cyan were not tested in this domainin order to reduce the experiment duration per Sec. 4.5.
Optical Engineering 043203-14 April 2013/Vol. 52(4)
Woods et al.: Characterizing and reducing crosstalk in printed anaglyph stereoscopic. . .
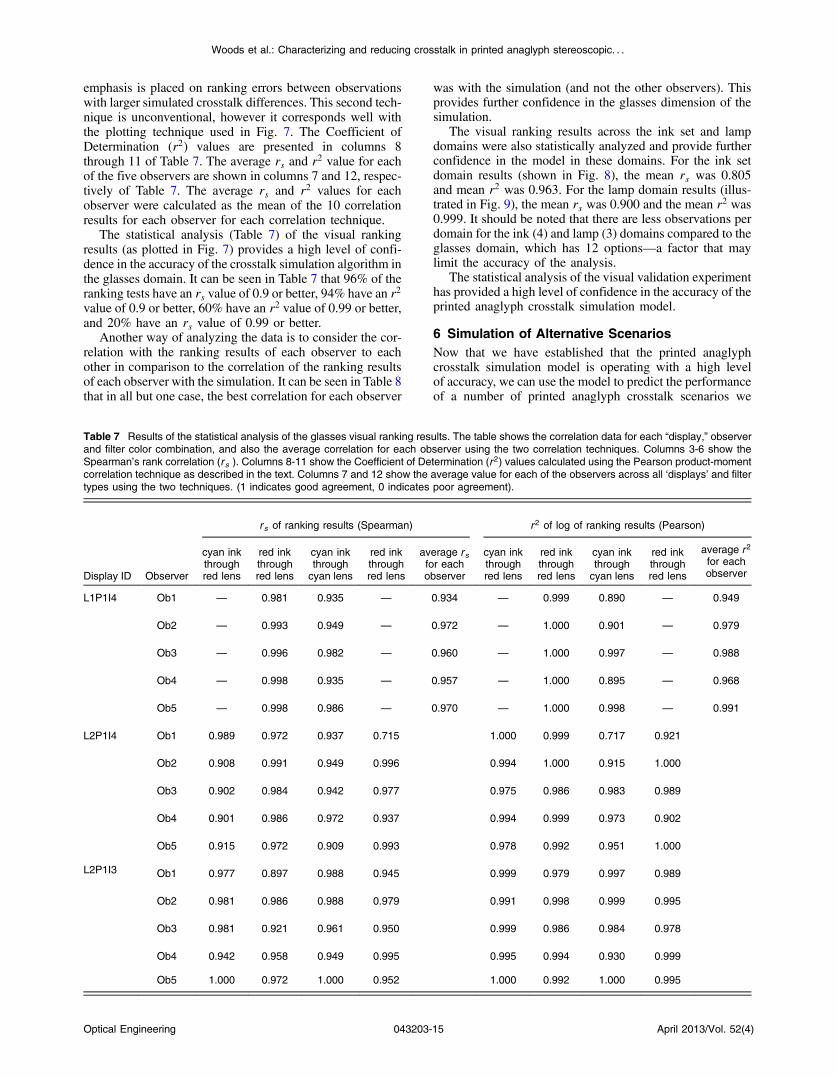
emphasis is placed on ranking errors between observationswith larger simulated crosstalk differences. This second tech-nique is unconventional, however it corresponds well withthe plotting technique used in Fig. 7. The Coefficient ofDetermination (r2) values are presented in columns 8through 11 of Table 7. The average rs and r2 value for eachof the five observers are shown in columns 7 and 12, respec-tively of Table 7. The average rs and r2 values for eachobserver were calculated as the mean of the 10 correlationresults for each observer for each correlation technique.
The statistical analysis (Table 7) of the visual rankingresults (as plotted in Fig. 7) provides a high level of confi-dence in the accuracy of the crosstalk simulation algorithm inthe glasses domain. It can be seen in Table 7 that 96% of theranking tests have an rs value of 0.9 or better, 94% have an r2
value of 0.9 or better, 60% have an r2 value of 0.99 or better,and 20% have an rs value of 0.99 or better.
Another way of analyzing the data is to consider the cor-relation with the ranking results of each observer to eachother in comparison to the correlation of the ranking resultsof each observer with the simulation. It can be seen in Table 8that in all but one case, the best correlation for each observer
was with the simulation (and not the other observers). Thisprovides further confidence in the glasses dimension of thesimulation.
The visual ranking results across the ink set and lampdomains were also statistically analyzed and provide furtherconfidence in the model in these domains. For the ink setdomain results (shown in Fig. 8), the mean rs was 0.805and mean r2 was 0.963. For the lamp domain results (illus-trated in Fig. 9), the mean rs was 0.900 and the mean r2 was0.999. It should be noted that there are less observations perdomain for the ink (4) and lamp (3) domains compared to theglasses domain, which has 12 options—a factor that maylimit the accuracy of the analysis.
The statistical analysis of the visual validation experimenthas provided a high level of confidence in the accuracy of theprinted anaglyph crosstalk simulation model.
6 Simulation of Alternative ScenariosNow that we have established that the printed anaglyphcrosstalk simulation model is operating with a high levelof accuracy, we can use the model to predict the performanceof a number of printed anaglyph crosstalk scenarios we
Table 7 Results of the statistical analysis of the glasses visual ranking results. The table shows the correlation data for each “display,” observerand filter color combination, and also the average correlation for each observer using the two correlation techniques. Columns 3-6 show theSpearman’s rank correlation (r s ). Columns 8-11 show the Coefficient of Determination (r 2) values calculated using the Pearson product-momentcorrelation technique as described in the text. Columns 7 and 12 show the average value for each of the observers across all ‘displays’ and filtertypes using the two techniques. (1 indicates good agreement, 0 indicates poor agreement).
r s of ranking results (Spearman) r 2 of log of ranking results (Pearson)
Display ID Observer
cyan inkthroughred lens
red inkthroughred lens
cyan inkthroughcyan lens
red inkthroughred lens
average r sfor eachobserver
cyan inkthroughred lens
red inkthroughred lens
cyan inkthroughcyan lens
red inkthroughred lens
average r 2
for eachobserver
L1P1I4 Ob1 — 0.981 0.935 — 0.934 — 0.999 0.890 — 0.949
Ob2 — 0.993 0.949 — 0.972 — 1.000 0.901 — 0.979
Ob3 — 0.996 0.982 — 0.960 — 1.000 0.997 — 0.988
Ob4 — 0.998 0.935 — 0.957 — 1.000 0.895 — 0.968
Ob5 — 0.998 0.986 — 0.970 — 1.000 0.998 — 0.991
L2P1I4 Ob1 0.989 0.972 0.937 0.715 1.000 0.999 0.717 0.921
Ob2 0.908 0.991 0.949 0.996 0.994 1.000 0.915 1.000
Ob3 0.902 0.984 0.942 0.977 0.975 0.986 0.983 0.989
Ob4 0.901 0.986 0.972 0.937 0.994 0.999 0.973 0.902
Ob5 0.915 0.972 0.909 0.993 0.978 0.992 0.951 1.000
L2P1I3 Ob1 0.977 0.897 0.988 0.945 0.999 0.979 0.997 0.989
Ob2 0.981 0.986 0.988 0.979 0.991 0.998 0.999 0.995
Ob3 0.981 0.921 0.961 0.950 0.999 0.986 0.984 0.978
Ob4 0.942 0.958 0.949 0.995 0.995 0.994 0.930 0.999
Ob5 1.000 0.972 1.000 0.952 1.000 0.992 1.000 0.995
Optical Engineering 043203-15 April 2013/Vol. 52(4)
Woods et al.: Characterizing and reducing crosstalk in printed anaglyph stereoscopic. . .
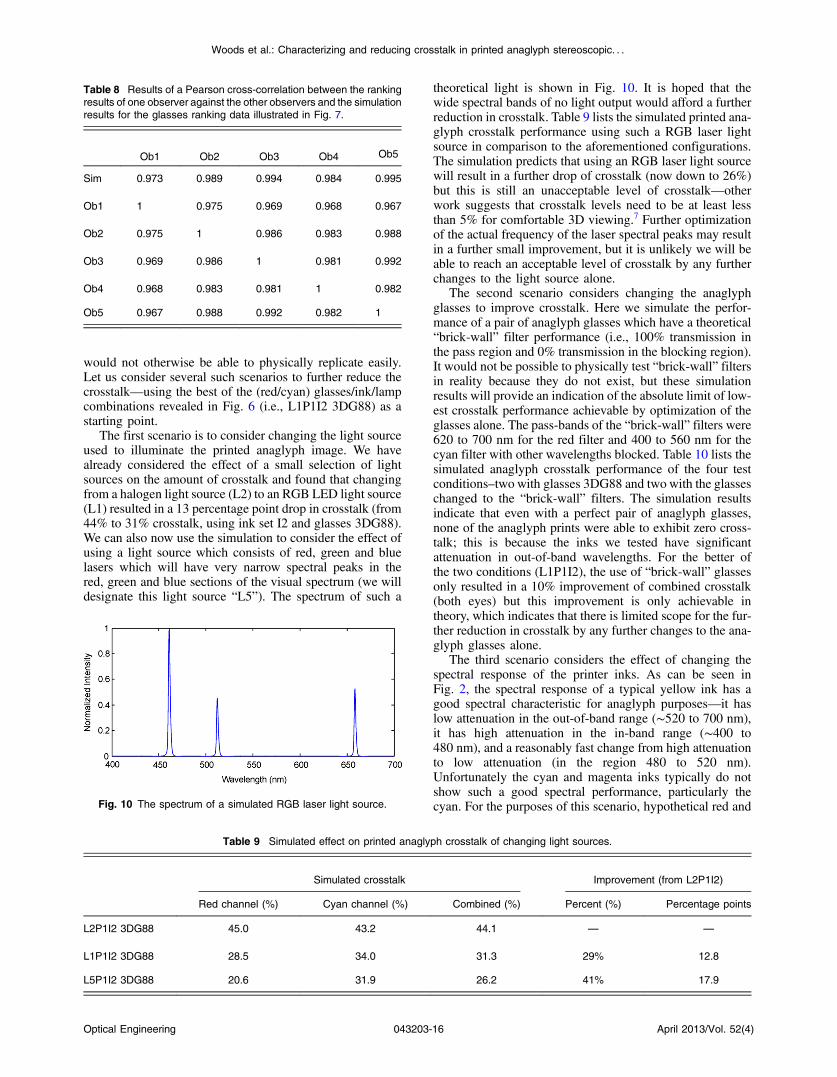
would not otherwise be able to physically replicate easily.Let us consider several such scenarios to further reduce thecrosstalk—using the best of the (red/cyan) glasses/ink/lampcombinations revealed in Fig. 6 (i.e., L1P1I2 3DG88) as astarting point.
The first scenario is to consider changing the light sourceused to illuminate the printed anaglyph image. We havealready considered the effect of a small selection of lightsources on the amount of crosstalk and found that changingfrom a halogen light source (L2) to an RGB LED light source(L1) resulted in a 13 percentage point drop in crosstalk (from44% to 31% crosstalk, using ink set I2 and glasses 3DG88).We can also now use the simulation to consider the effect ofusing a light source which consists of red, green and bluelasers which will have very narrow spectral peaks in thered, green and blue sections of the visual spectrum (we willdesignate this light source “L5”). The spectrum of such a
theoretical light is shown in Fig. 10. It is hoped that thewide spectral bands of no light output would afford a furtherreduction in crosstalk. Table 9 lists the simulated printed ana-glyph crosstalk performance using such a RGB laser lightsource in comparison to the aforementioned configurations.The simulation predicts that using an RGB laser light sourcewill result in a further drop of crosstalk (now down to 26%)but this is still an unacceptable level of crosstalk—otherwork suggests that crosstalk levels need to be at least lessthan 5% for comfortable 3D viewing.7 Further optimizationof the actual frequency of the laser spectral peaks may resultin a further small improvement, but it is unlikely we will beable to reach an acceptable level of crosstalk by any furtherchanges to the light source alone.
The second scenario considers changing the anaglyphglasses to improve crosstalk. Here we simulate the perfor-mance of a pair of anaglyph glasses which have a theoretical“brick-wall” filter performance (i.e., 100% transmission inthe pass region and 0% transmission in the blocking region).It would not be possible to physically test “brick-wall” filtersin reality because they do not exist, but these simulationresults will provide an indication of the absolute limit of low-est crosstalk performance achievable by optimization of theglasses alone. The pass-bands of the “brick-wall” filters were620 to 700 nm for the red filter and 400 to 560 nm for thecyan filter with other wavelengths blocked. Table 10 lists thesimulated anaglyph crosstalk performance of the four testconditions–two with glasses 3DG88 and two with the glasseschanged to the “brick-wall” filters. The simulation resultsindicate that even with a perfect pair of anaglyph glasses,none of the anaglyph prints were able to exhibit zero cross-talk; this is because the inks we tested have significantattenuation in out-of-band wavelengths. For the better ofthe two conditions (L1P1I2), the use of “brick-wall” glassesonly resulted in a 10% improvement of combined crosstalk(both eyes) but this improvement is only achievable intheory, which indicates that there is limited scope for the fur-ther reduction in crosstalk by any further changes to the ana-glyph glasses alone.
The third scenario considers the effect of changing thespectral response of the printer inks. As can be seen inFig. 2, the spectral response of a typical yellow ink has agood spectral characteristic for anaglyph purposes—it haslow attenuation in the out-of-band range (∼520 to 700 nm),it has high attenuation in the in-band range (∼400 to480 nm), and a reasonably fast change from high attenuationto low attenuation (in the region 480 to 520 nm).Unfortunately the cyan and magenta inks typically do notshow such a good spectral performance, particularly thecyan. For the purposes of this scenario, hypothetical red and
Table 8 Results of a Pearson cross-correlation between the rankingresults of one observer against the other observers and the simulationresults for the glasses ranking data illustrated in Fig. 7.
Ob1 Ob2 Ob3 Ob4 Ob5
Sim 0.973 0.989 0.994 0.984 0.995
Ob1 1 0.975 0.969 0.968 0.967
Ob2 0.975 1 0.986 0.983 0.988
Ob3 0.969 0.986 1 0.981 0.992
Ob4 0.968 0.983 0.981 1 0.982
Ob5 0.967 0.988 0.992 0.982 1
Fig. 10 The spectrum of a simulated RGB laser light source.
Table 9 Simulated effect on printed anaglyph crosstalk of changing light sources.
Simulated crosstalk Improvement (from L2P1I2)
Red channel (%) Cyan channel (%) Combined (%) Percent (%) Percentage points
L2P1I2 3DG88 45.0 43.2 44.1 — —
L1P1I2 3DG88 28.5 34.0 31.3 29% 12.8
L5P1I2 3DG88 20.6 31.9 26.2 41% 17.9
Optical Engineering 043203-16 April 2013/Vol. 52(4)
Woods et al.: Characterizing and reducing crosstalk in printed anaglyph stereoscopic. . .
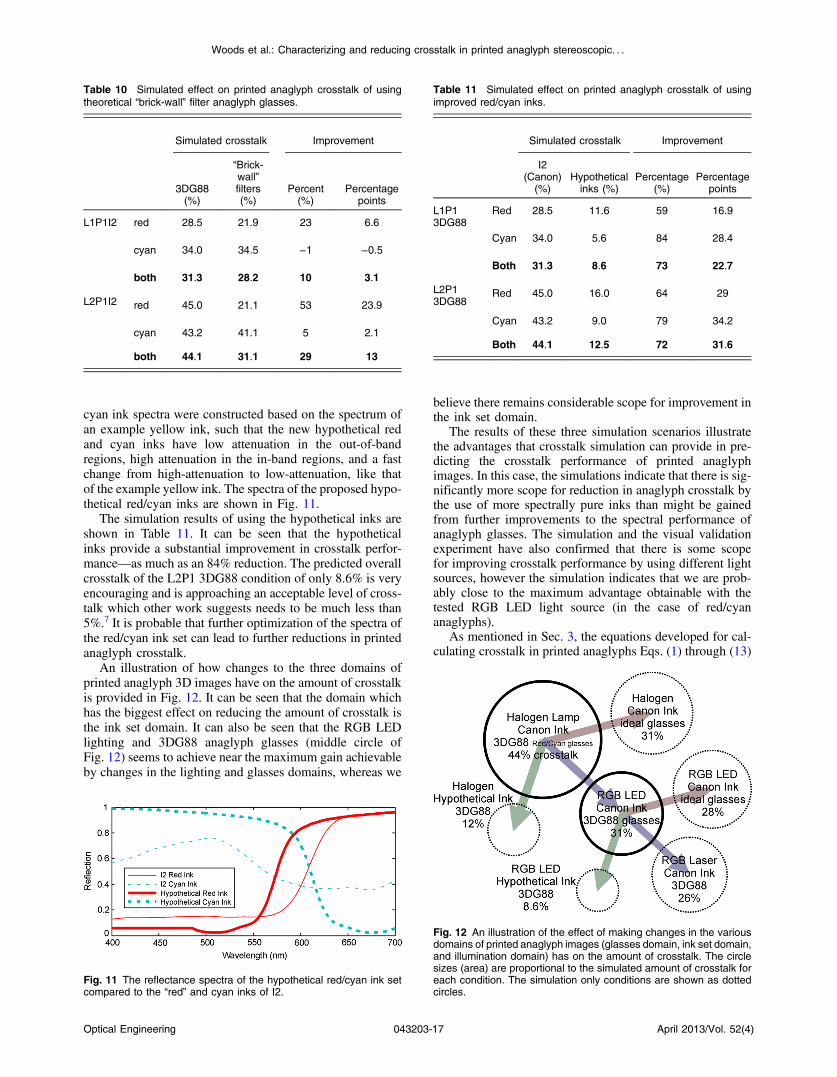
cyan ink spectra were constructed based on the spectrum ofan example yellow ink, such that the new hypothetical redand cyan inks have low attenuation in the out-of-bandregions, high attenuation in the in-band regions, and a fastchange from high-attenuation to low-attenuation, like thatof the example yellow ink. The spectra of the proposed hypo-thetical red/cyan inks are shown in Fig. 11.
The simulation results of using the hypothetical inks areshown in Table 11. It can be seen that the hypotheticalinks provide a substantial improvement in crosstalk perfor-mance—as much as an 84% reduction. The predicted overallcrosstalk of the L2P1 3DG88 condition of only 8.6% is veryencouraging and is approaching an acceptable level of cross-talk which other work suggests needs to be much less than5%.7 It is probable that further optimization of the spectra ofthe red/cyan ink set can lead to further reductions in printedanaglyph crosstalk.
An illustration of how changes to the three domains ofprinted anaglyph 3D images have on the amount of crosstalkis provided in Fig. 12. It can be seen that the domain whichhas the biggest effect on reducing the amount of crosstalk isthe ink set domain. It can also be seen that the RGB LEDlighting and 3DG88 anaglyph glasses (middle circle ofFig. 12) seems to achieve near the maximum gain achievableby changes in the lighting and glasses domains, whereas we
believe there remains considerable scope for improvement inthe ink set domain.
The results of these three simulation scenarios illustratethe advantages that crosstalk simulation can provide in pre-dicting the crosstalk performance of printed anaglyphimages. In this case, the simulations indicate that there is sig-nificantly more scope for reduction in anaglyph crosstalk bythe use of more spectrally pure inks than might be gainedfrom further improvements to the spectral performance ofanaglyph glasses. The simulation and the visual validationexperiment have also confirmed that there is some scopefor improving crosstalk performance by using different lightsources, however the simulation indicates that we are prob-ably close to the maximum advantage obtainable with thetested RGB LED light source (in the case of red/cyananaglyphs).
As mentioned in Sec. 3, the equations developed for cal-culating crosstalk in printed anaglyphs Eqs. (1) through (13)
Table 10 Simulated effect on printed anaglyph crosstalk of usingtheoretical “brick-wall” filter anaglyph glasses.
Simulated crosstalk Improvement
3DG88(%)
“Brick-wall”filters(%)
Percent(%)
Percentagepoints
L1P1I2 red 28.5 21.9 23 6.6
cyan 34.0 34.5 −1 −0.5
both 31.3 28.2 10 3.1
L2P1I2 red 45.0 21.1 53 23.9
cyan 43.2 41.1 5 2.1
both 44.1 31.1 29 13
Fig. 11 The reflectance spectra of the hypothetical red/cyan ink setcompared to the “red” and cyan inks of I2.
Table 11 Simulated effect on printed anaglyph crosstalk of usingimproved red/cyan inks.
Simulated crosstalk Improvement
I2(Canon)
(%)Hypotheticalinks (%)
Percentage(%)
Percentagepoints
L1P13DG88
Red 28.5 11.6 59 16.9
Cyan 34.0 5.6 84 28.4
Both 31.3 8.6 73 22.7
L2P13DG88
Red 45.0 16.0 64 29
Cyan 43.2 9.0 79 34.2
Both 44.1 12.5 72 31.6
Fig. 12 An illustration of the effect of making changes in the variousdomains of printed anaglyph images (glasses domain, ink set domain,and illumination domain) has on the amount of crosstalk. The circlesizes (area) are proportional to the simulated amount of crosstalk foreach condition. The simulation only conditions are shown as dottedcircles.
Optical Engineering 043203-17 April 2013/Vol. 52(4)
Woods et al.: Characterizing and reducing crosstalk in printed anaglyph stereoscopic. . .

are similar but notably different to the crosstalk equations foremissive displays.7 This difference also extends to the equa-tions used to calculate crosstalk from light measurementdevice readings off an anaglyph print. Crosstalk Eqs. (11)and (12) can therefore be expressed as
CL ¼ ðLLWW − LLWKÞ∕ðLLWW − LLKWÞ; (14)
CR ¼ ðLRWW − LRWKÞ∕ðLRWW − LRKWÞ; (15)
where CL and CR are the crosstalk at each eye—oftenexpressed as a percentage; and LLWW , LLWK , LLKW , LRWW ,LRWK , and LRKW are the luminance as measured behind theglasses at the left or right eye position (first subscript), withthe desired eye channel ink applied (K—black) or the desiredeye channel ink not applied (W–white) (second subscript),and with the undesired eye channel ink applied (K–black)or the undesired eye channel ink not applied (W–white)(third subscript). For example, in the case of a red-left/cyan-right anaglyph print, LLWW is the luminance measured fromthe left eye position behind the red lens when there is no inkapplied to the white page, LLKW is the luminance measuredfrom the left eye position behind the red lens when only cyanink (the desired ink for this eye channel) is applied to thepage, and LRWK is the luminance measured from the righteye position behind the cyan lens when only cyan ink (theundesired ink for this eye channel) is applied to the page.This particular luminance variable expression can appearconfusing; however it is expressed this way in order to cor-respond with the variable definitions used to express themeasurement of crosstalk in emissive displays.7
7 ConclusionThis paper has presented the development and validation of acrosstalk simulation model for printed anaglyph images. Themodel is significant in that it allows for the first time adetailed analysis of the process of crosstalk in printed ana-glyph 3D images. Printed anaglyph 3D images can oftenexhibit a lot of crosstalk so it is very useful to have a toolthat allows the exploration of techniques to reduce crosstalkin such images. The model has already allowed us to proposea solution that may reduce crosstalk to as low as 8.6%. Themodel can very quickly simulate the crosstalk performanceof a huge number of input combinations (glasses, inks,papers, and lights) to determine optimum combinations—a process that would be impossible to conduct physically.The model can be used to intelligently guide research effortbefore time and money is expended on physical testing.
In summary, this paper has identified seven ways ofreducing crosstalk with printed anaglyph 3D images:
1. use (or perhaps develop) inks which have better spec-tral purity;
2. use an optimized light source (such as the RGB LEDlamp described in Sec. 4.1);
3. use anaglyph 3D glasses which exhibit good spectralperformance (such as the commercial anaglyph 3Dred/cyan glasses described in Sec. 4.3);
4. use an RGB to CMYK color conversion algorithmwhich does not mix color channels;
5. avoid the use of gray component replacement (GCR);
6. use (or perhaps develop) a color management processwhich respects the need to keep color channels sepa-rate after anaglyph multiplexing (perhaps by perform-ing color management before anaglyph multiplexing);
7. use an anaglyph multiplexing algorithm that does notintroduce crosstalk by mixing the left and right colorchannels.
Many of these items cannot be achieved with current ink-jet and color laser printers, but can with offset printing.
The information presented in this paper should facilitate asignificant improvement in the 3D image quality of this verywidely used 3D presentation technique.
AcknowledgmentsThe authors wish to acknowledge the support of AlecDuncan for his assistance with the manuscript; DanMarrable, Ming Lim, and Glen Lawson for their assistancewith the optical test equipment; and Angela Recalde,Matthew Koessler, Michael Biddle, and Ming Lim for theirassistance with the visual validation tests.
References
1. R. Labbe and D. E. Klutho, “Publishing stereoscopic images,”Proc. SPIE, 7237, 72370J (2009).
2. V. K. Walworth, “Light polarization in support of stereoscopic display,”Opt. Eng. 51(2), 021104 (2012).
3. V. C. Barber and D. A. Brett, “Colour bombardment—a human visualproblem that interferes with the viewing of anaglyph stereo material,”Scan. Electron Microsc. 2(Pt. 2), 495–498 (1982).
4. A. J. Woods, K. L. Yuen, and K. S. Karvinen, “Characterizing crosstalkin anaglyphic stereoscopic images on LCD monitors and plasma dis-plays,” J. Soc. Inform. Disp. 15(11), 889–898 (2007).
5. L. Lipton, “Glossary” in Lenny Lipton’s Blog, dated 16 March 2009,http://lennylipton.wordpress.com/2009/03/16/glossary/ (19 March2010).
6. A. J. Woods, “How are crosstalk and ghosting defined in the stereo-scopic literature?,” Proc. SPIE 7863, 78630Z (2011).
7. A. J. Woods, “Crosstalk in stereoscopic displays: a review,” J. Electron.Imag. 21(4), 040902 (2012).
8. F. L. Kooi and A. Toet, “Visual comfort of binocular and 3D displays,”Displays 25(2–3), 99–108 (2004).
9. Y.-Y. Yeh and L. D. Silverstein, “Limits of fusion and depth judgementin stereoscopic color displays,” Hum. Factors 32(1), 45–60 (1990).
10. I. Tsirlin, L. M. Wilcox, and R. S. Allison, “The effect of crosstalkon the perceived depth from disparity and monocular occlusions,”IEEE Trans. Broadcast. 57(2), 445–453 (2011).
11. H. Sanftmann and D. Weiskopf, “Anaglyph stereo without ghosting,”Comput. Graph. Forum 30(4), 1251–1259 (2011).
12. I. Ideses and L. Yaroslavsky, “Three methods that improve the visualquality of colour anaglyphs,” J. Opt. A Pure Appl. Opt. 7(12),755–762 (2005).
13. A. J. Woods and C. R. Harris, “Comparing levels of crosstalk with red/cyan, blue/yellow, and green/magenta anaglyph 3D glasses,” Proc. SPIE7524, 75240Q (2010).
14. M. A. Purnell, “Casting, replication, and anaglyph stereo imaging ofmicroscopic detail in fossils, with examples from conodonts andother jawless vertebrates,” Palaeont. Electron. 6(2), 1–11 (2003).
15. E. Dubois, “A projection method to generate anaglyph stereo images,”in Proc. IEEE Int. Conf. on Acoustics, Speech, and Signal Process.,Vol. 3, pp. 1661–1664, IEEE, Piscataway, New Jersey (2001).
16. W. R. Sanders and D. F. McAllister, “Producing anaglyphs from syn-thetic images,” Proc. SPIE 5006, 348–358 (2003).
17. D. F. McAllister, Y. Zhou, and S. Sullivan, “Methods for computingcolor anaglyphs,” Proc. SPIE 7524, 75240S (2010).
18. V. M. Tran, “New methods of rendering anaglyph stereoscopic imageson CRT displays and photo-quality ink-jet printers,” MASc Thesis,University of Ottawa (2005).
19. R. Z. Zeng and H. Z. Zeng, “Printing anaglyph maps optimized for dis-play,” Proc. SPIE 7866, 78661S (2011).
20. P. Wimmer, “Anaglyph methods comparison,” http://www.3dtv.at/knowhow/anaglyphcomparison_en.aspx (6 March 2013).
21. A. J. Woods and T. Rourke, “Ghosting in anaglyphic stereoscopicimages,” Proc. SPIE 5291, 354–365 (2004).
22. R. Zone, “Good old fashion anaglyph: high tech tools revive a classicformat in Spy Kids 3-D,” Stereo World 29(5), 11–13 and 46 (2002).
Optical Engineering 043203-18 April 2013/Vol. 52(4)
Woods et al.: Characterizing and reducing crosstalk in printed anaglyph stereoscopic. . .

23. “Louis Ducos du Hauron,” in Encyclopædia Britannica, EncyclopædiaBritannica Online, Encyclopædia Britannica Inc., (2012), http://www.britannica.com/EBchecked/topic/172961/Louis-Ducos-du-Hauron (22July 2012).
24. L. D. Duhauron, “Estampes, photographies et tableaux stéréoscopiques,produisant lair effect en plein jour, sans l’aide du stereoscope,”French Patent No. 216465 (1891) in S. A. Benton, Ed., SelectedPapers on Three-Dimensional Displays, SPIE Milestone Series,MS162, pp. 138–145 (2001).
25. L. D. Duhauron, “Stereoscopic print,” U.S. Patent No. 544666 (1895).26. A. F. Watch, “The anaglyph: a new method of producing the stereo-
scopic effect,” J. Franklin Inst. 140(6) 401–405 (1895).27. J. A. Norling, “Anaglyph Stereoscopy,” U.S. Patent No. 2,135,197
(1937).28. S. J. Harrington, R. P. Loce, and G. Sharma, “Systems for spectral multi-
plexing of source images to provide a composite image, for renderingthe composite image, and for spectral demultiplexing of the compositeimage to animate recovered source images,” U.S. Patent No. 7,136,522B2 (2006).
29. G. Sharma et al., “Illuminant multiplexed imaging: special effects usingGCR,” in Proc. 11th Color Imaging Conference: Color Science andEngineering Systems, Technologies, and Applications, pp. 266–271,IS&T (Society for Imaging Science & Technology), Springfield,Virginia (2003).
30. J. Scarpetti, “Stereoscopic photographic print, method of making, andapparatus for viewing,” U.S. Patent 3820874 (1974).
31. M. Ramstad, “High-fidelity printed anaglyphs and viewing filters,” U.S.Patent Application Publication No. US 2009/0278919 Al (2009).
32. J. R. Rupkalvis, StereoScope International, Personal Communication(2012).
33. R. Zone, The 3D Zone, Personal Communication (2012).34. A. J. Woods and C. R. Harris, “Using cross-talk simulation to predict the
performance of anaglyph 3-D glasses,” J. Soc. Inform. Disp. 20(6),304–315 (2012).
35. B. Fraser, C. Murphy, and F. Bunting, Real World Color Management,Peachpit Press, San Francisco, California (2004).
36. L. A. Taplin, “Spectral modeling of a six-color inkjet printer,”MS Thesis, Rochester Institute of Technology (2001).
37. A. Stockman and L. T. Sharpe, “Luminous energy function (2 degree,linear energy),” (2007), http://www.cvrl.org/cvrlfunctions.htm andhttp://www.cvrl.org/database/text/lum/CIE2008v2.htm (29 July 2011).
38. A. Stockman et al., “The dependence of luminous efficiency on chro-matic adaptation,” J. Vision 8(16), 1–26 (2008).
39. R. Blake and R. Sekuler, Perception, 5th ed., McGraw Hill, Boston,Massachusetts (2006).
40. International Committee for Display Metrology (ICDM), “Informationdisplay measurements standard (version 1.03),” SID, http://icdm-sid.org/ (2012).
41. S. S. Stevens, “On the psychophysical law,” Psychol. Rev. 64(3),153–181 (1957).
42. Z. Xie and T. G. Stockham Jr., “Toward the unification of three visuallaws and two visual models in brightness perception,” IEEE Trans. Syst.Man Cybern. 19(2), 379–387 (1989).
43. J. H. McDonald, Handbook of Biological Statistics, 2nd ed., pp. 221–223, Sparky House Publishing, Baltimore, Maryland, http://udel.edu/~mcdonald/statspearman.html (2009).
44. R. E. Walpole and R. H. Myers, Probability and Statistics for Engineersand Scientists, p. 347, Collier Macmillan, New York (1985).
Andrew J. Woods is a research engineer atCurtin University’s Centre for Marine Science& Technology in Perth, Australia. He hasMEng and BEng (Hons1) degrees in elec-tronic engineering. He has expertise in thedesign, application, and evaluation of stereo-scopic imaging systems for industrial andentertainment applications. He has servedas co-chair of the Stereoscopic Displaysand Applications conference since 2000.
Chris R. Harris is a graduate of Curtin Uni-versity with a bachelor’s degree in appliedphysics and has interests in electronicsand information technology. He is currentlyemployed by Murdoch University.
Dean B. Leggo is a graduate of Curtin Uni-versity with a Bachelor of Science in physics.He is currently employed as a trainer andassessor by LabTech Training. His interestsare in frontier science, film production andvolunteering.
Tegan M. Rourke is currently employed as aradiation physicist at Sir Charles GairdnerHospital in Perth, Western Australia. Shehas a bachelor’s degree in physics from Cur-tin University and is currently completing aPhD with the University of Western Australia.
Optical Engineering 043203-19 April 2013/Vol. 52(4)
Woods et al.: Characterizing and reducing crosstalk in printed anaglyph stereoscopic. . .

Paper 5 [Refereed Conference Paper]
A. J. Woods, K. L. Yuen (2006) "Compatibility of LCD Monitors with Frame‐Sequential Stereoscopic 3D Visualisation" (Invited Paper), in IMID/IDMC '06 Digest, (The 6th International Meeting on Information Display, and The 5th International Display Manufacturing Conference), pp. 98‐102, Daegu, South Korea, 22‐25 August 2006.
Compatibility of LCD Monitors with Frame-Sequential Stereoscopic 3D Visualisation
Andrew J. WOODS, Ka Lun YUEN Centre for Marine Science & Technology, Curtin University of Technology,
GPO Box U1987, Perth WA 6845, Australia
Phone: +61 8 9266 7920, Fax: +61 8 9266 4799, E-mail: A.Woods cmst.curtin.edu.au
Abstract
Historically, LCD monitors have not been able to be used for frame-sequential stereoscopic 3D visualisation due to their slow pixel response rate. With LCD pixel response rates now in the single-digit millisecond range it is natural to ask whether it is now possible to achieve frame-sequential stereoscopic 3D viewing on LCDs.
1. Introduction
Historically, LCD monitors have not been able to be
used for frame-sequential stereoscopic 3D visual-
isation primarily due to their slow pixel response rate.
The frame-sequential stereoscopic display method
(also known as field-sequential, time-sequential, or
alternate field) works by displaying an alternating
sequence of left and right perspective images on a
display screen. The observer wears a pair of Liquid
Crystal Shutter (LCS) 3D glasses which alternately
occlude the left and right eyes, such that the left eye
sees only the left perspective images as they are
displayed on the screen, and the right eye sees only
the right perspective images as they are displayed on
the screen. In order for the frame-sequential
stereoscopic viewing method to work on a particular
display device, the display must be capable of
displaying separate and discrete alternate images
without noticeable crosstalk between images (and at a
sufficiently high image update frequency to avoid
visible flicker). If the display is not able to
completely extinguish the previous image before
displaying the next image, ghosting (aka: crosstalk)
[1] will be visible in the stereoscopic image and this
can significantly degrade stereoscopic image quality.
A slow pixel response rate will have this effect.
With some currently available LCDs having pixel
response rates in the single-digit millisecond range it
is natural to ask whether it is now possible to achieve
frame-sequential stereoscopic viewing on LCDs.
We conducted a study to establish the important
factors determining whether LCD monitors can or
cannot be used for frame-sequential stereoscopic 3D
visualisation.
These questions are particularly pertinent now
because the production of CRTs is declining and the
production of LCDs is increasing. CRTs have been
the display of choice for use with the frame-sequential
3D method for many years, but there is a risk that at
some point the production of CRTs could cease
completely. The use of stereoscopic viewing is also
increasing rapidly in a wide range of application areas
– more people now want stereoscopic capability on
their desktop or laptop PC.
2. Experimental Method
In this study we tested fifteen different LCD monitors
from various manufacturers ranging from units that
are several years old to units that have been just
released in the last six months.
Equipment used for testing included: two custom built
photodiode sensor pens (based on an Integrated
Photomatrix Inc. IPL10530 DAL), an oscilloscope
(Goldstar OS-3000), a PC equipped with an NVIDIA
6600GT (stereoscopic capable) graphics card for test
image generation, and a custom built LCS 3D glasses
driver box capable of adjustable phase and duty cycle.
The measurement method consisted of driving the
LCD monitors with a range of video test signals via
the VGA or DVI port, and monitoring the light output
of the monitor with the photodiode sensor pens.
Data analysis was performed using a range of custom-
written Maple programs and Excel spreadsheets.
98 • IMID/IDMC '06 DIGEST
5-4 / A. J. Woods
A. J. Woods, K. L. Yuen (2006) "Compatibility of LCD Monitors with Frame‐Sequential Stereoscopic 3D Visualisation" (Invited Paper), in IMID/IDMC '06 Digest, (The 6th International Meeting on Information Display, and The 5th International Display Manufacturing Conference), pp. 98‐102, Daegu, South Korea, pp. 22‐25, August 2006.
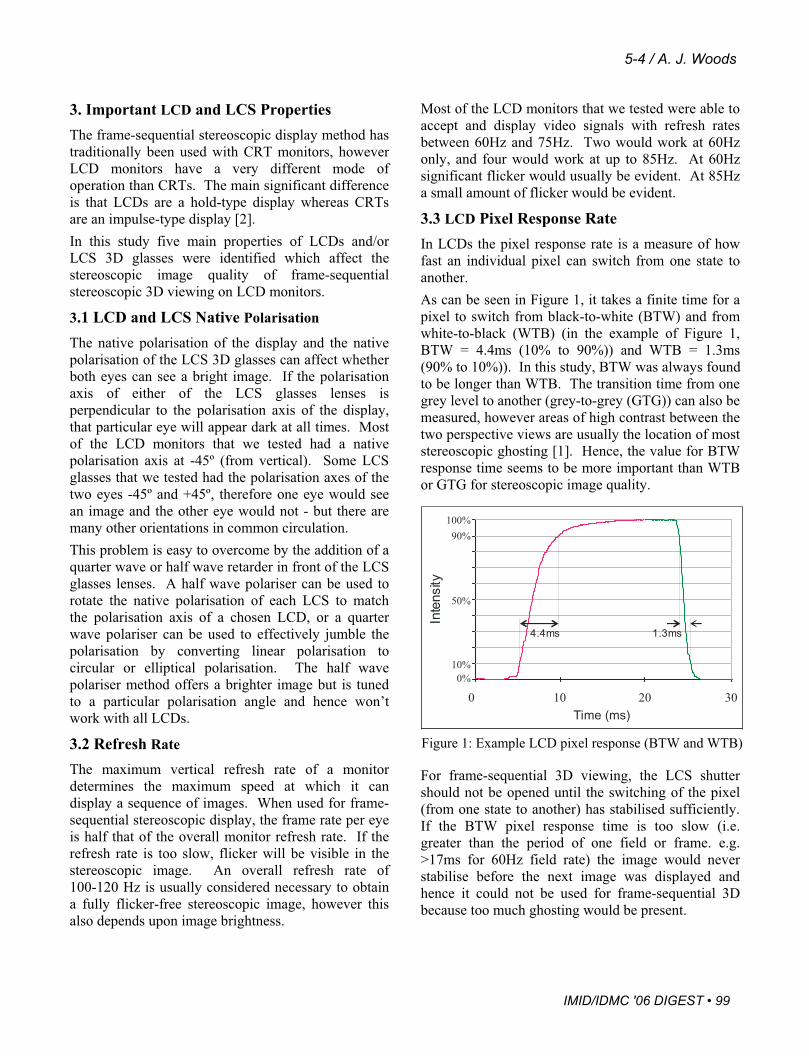
3. Important LCD and LCS Properties
The frame-sequential stereoscopic display method has
traditionally been used with CRT monitors, however
LCD monitors have a very different mode of
operation than CRTs. The main significant difference
is that LCDs are a hold-type display whereas CRTs
are an impulse-type display [2].
In this study five main properties of LCDs and/or
LCS 3D glasses were identified which affect the
stereoscopic image quality of frame-sequential
stereoscopic 3D viewing on LCD monitors.
3.1 LCD and LCS Native Polarisation
The native polarisation of the display and the native
polarisation of the LCS 3D glasses can affect whether
both eyes can see a bright image. If the polarisation
axis of either of the LCS glasses lenses is
perpendicular to the polarisation axis of the display,
that particular eye will appear dark at all times. Most
of the LCD monitors that we tested had a native
polarisation axis at -45º (from vertical). Some LCS
glasses that we tested had the polarisation axes of the
two eyes -45º and +45º, therefore one eye would see
an image and the other eye would not - but there are
many other orientations in common circulation.
This problem is easy to overcome by the addition of a
quarter wave or half wave retarder in front of the LCS
glasses lenses. A half wave polariser can be used to
rotate the native polarisation of each LCS to match
the polarisation axis of a chosen LCD, or a quarter
wave polariser can be used to effectively jumble the
polarisation by converting linear polarisation to
circular or elliptical polarisation. The half wave
polariser method offers a brighter image but is tuned
to a particular polarisation angle and hence won’t
work with all LCDs.
3.2 Refresh Rate
The maximum vertical refresh rate of a monitor
determines the maximum speed at which it can
display a sequence of images. When used for frame-
sequential stereoscopic display, the frame rate per eye
is half that of the overall monitor refresh rate. If the
refresh rate is too slow, flicker will be visible in the
stereoscopic image. An overall refresh rate of
100-120 Hz is usually considered necessary to obtain
a fully flicker-free stereoscopic image, however this
also depends upon image brightness.
Most of the LCD monitors that we tested were able to
accept and display video signals with refresh rates
between 60Hz and 75Hz. Two would work at 60Hz
only, and four would work at up to 85Hz. At 60Hz
significant flicker would usually be evident. At 85Hz
a small amount of flicker would be evident.
3.3 LCD Pixel Response Rate
In LCDs the pixel response rate is a measure of how
fast an individual pixel can switch from one state to
another.
As can be seen in Figure 1, it takes a finite time for a
pixel to switch from black-to-white (BTW) and from
white-to-black (WTB) (in the example of Figure 1,
BTW = 4.4ms (10% to 90%)) and WTB = 1.3ms
(90% to 10%)). In this study, BTW was always found
to be longer than WTB. The transition time from one
grey level to another (grey-to-grey (GTG)) can also be
measured, however areas of high contrast between the
two perspective views are usually the location of most
stereoscopic ghosting [1]. Hence, the value for BTW
response time seems to be more important than WTB
or GTG for stereoscopic image quality.
For frame-sequential 3D viewing, the LCS shutter
should not be opened until the switching of the pixel
(from one state to another) has stabilised sufficiently.
If the BTW pixel response time is too slow (i.e.
greater than the period of one field or frame. e.g.
>17ms for 60Hz field rate) the image would never
stabilise before the next image was displayed and
hence it could not be used for frame-sequential 3D
because too much ghosting would be present.
0 10 20 30
Time (ms)
0%
10%
50%
90%
100%
Inte
nsity
1.3ms4.4ms
Figure 1: Example LCD pixel response (BTW and WTB)
IMID/IDMC '06 DIGEST • 99
5-4 / A. J. Woods
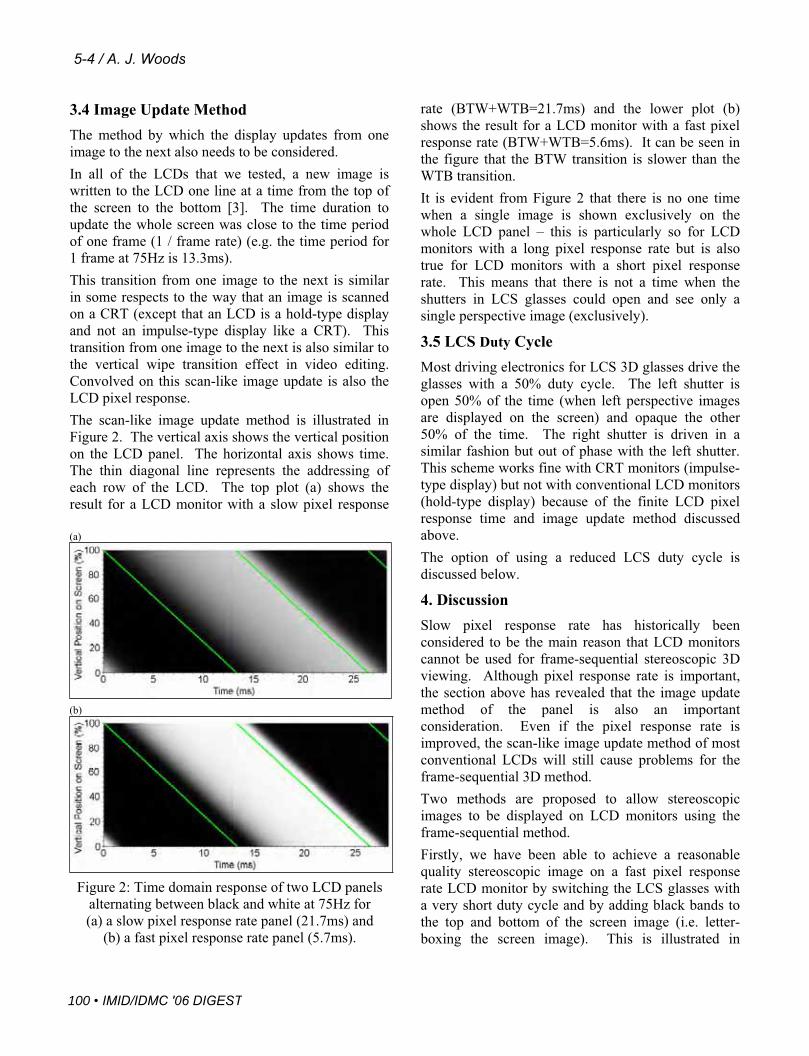
3.4 Image Update Method
The method by which the display updates from one
image to the next also needs to be considered.
In all of the LCDs that we tested, a new image is
written to the LCD one line at a time from the top of
the screen to the bottom [3]. The time duration to
update the whole screen was close to the time period
of one frame (1 / frame rate) (e.g. the time period for
1 frame at 75Hz is 13.3ms).
This transition from one image to the next is similar
in some respects to the way that an image is scanned
on a CRT (except that an LCD is a hold-type display
and not an impulse-type display like a CRT). This
transition from one image to the next is also similar to
the vertical wipe transition effect in video editing.
Convolved on this scan-like image update is also the
LCD pixel response.
The scan-like image update method is illustrated in
Figure 2. The vertical axis shows the vertical position
on the LCD panel. The horizontal axis shows time.
The thin diagonal line represents the addressing of
each row of the LCD. The top plot (a) shows the
result for a LCD monitor with a slow pixel response
rate (BTW+WTB=21.7ms) and the lower plot (b)
shows the result for a LCD monitor with a fast pixel
response rate (BTW+WTB=5.6ms). It can be seen in
the figure that the BTW transition is slower than the
WTB transition.
It is evident from Figure 2 that there is no one time
when a single image is shown exclusively on the
whole LCD panel – this is particularly so for LCD
monitors with a long pixel response rate but is also
true for LCD monitors with a short pixel response
rate. This means that there is not a time when the
shutters in LCS glasses could open and see only a
single perspective image (exclusively).
3.5 LCS Duty Cycle
Most driving electronics for LCS 3D glasses drive the
glasses with a 50% duty cycle. The left shutter is
open 50% of the time (when left perspective images
are displayed on the screen) and opaque the other
50% of the time. The right shutter is driven in a
similar fashion but out of phase with the left shutter.
This scheme works fine with CRT monitors (impulse-
type display) but not with conventional LCD monitors
(hold-type display) because of the finite LCD pixel
response time and image update method discussed
above.
The option of using a reduced LCS duty cycle is
discussed below.
4. Discussion
Slow pixel response rate has historically been
considered to be the main reason that LCD monitors
cannot be used for frame-sequential stereoscopic 3D
viewing. Although pixel response rate is important,
the section above has revealed that the image update
method of the panel is also an important
consideration. Even if the pixel response rate is
improved, the scan-like image update method of most
conventional LCDs will still cause problems for the
frame-sequential 3D method.
Two methods are proposed to allow stereoscopic
images to be displayed on LCD monitors using the
frame-sequential method.
Firstly, we have been able to achieve a reasonable
quality stereoscopic image on a fast pixel response
rate LCD monitor by switching the LCS glasses with
a very short duty cycle and by adding black bands to
the top and bottom of the screen image (i.e. letter-
boxing the screen image). This is illustrated in
(a)
(b)
Figure 2: Time domain response of two LCD panels
alternating between black and white at 75Hz for
(a) a slow pixel response rate panel (21.7ms) and
(b) a fast pixel response rate panel (5.7ms).
100 • IMID/IDMC '06 DIGEST
5-4 / A. J. Woods
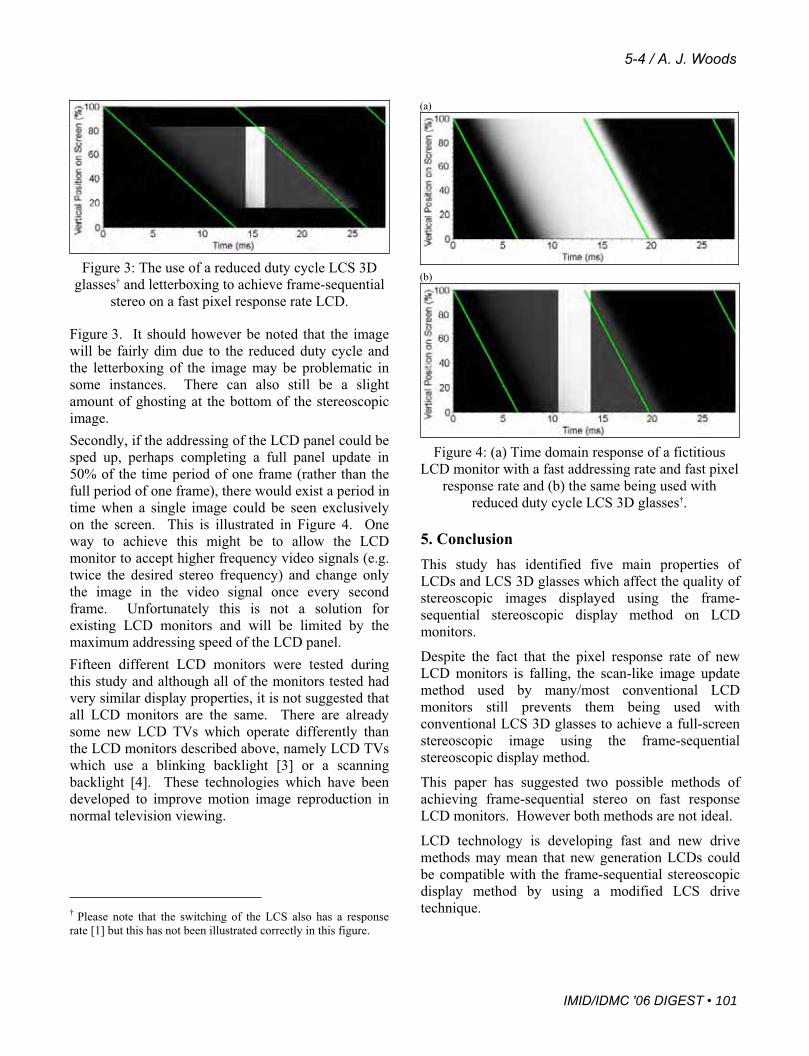
Figure 3. It should however be noted that the image
will be fairly dim due to the reduced duty cycle and
the letterboxing of the image may be problematic in
some instances. There can also still be a slight
amount of ghosting at the bottom of the stereoscopic
image.
Secondly, if the addressing of the LCD panel could be
sped up, perhaps completing a full panel update in
50% of the time period of one frame (rather than the
full period of one frame), there would exist a period in
time when a single image could be seen exclusively
on the screen. This is illustrated in Figure 4. One
way to achieve this might be to allow the LCD
monitor to accept higher frequency video signals (e.g.
twice the desired stereo frequency) and change only
the image in the video signal once every second
frame. Unfortunately this is not a solution for
existing LCD monitors and will be limited by the
maximum addressing speed of the LCD panel.
Fifteen different LCD monitors were tested during
this study and although all of the monitors tested had
very similar display properties, it is not suggested that
all LCD monitors are the same. There are already
some new LCD TVs which operate differently than
the LCD monitors described above, namely LCD TVs
which use a blinking backlight [3] or a scanning
backlight [4]. These technologies which have been
developed to improve motion image reproduction in
normal television viewing.
† Please note that the switching of the LCS also has a response
rate [1] but this has not been illustrated correctly in this figure.
5. Conclusion
This study has identified five main properties of
LCDs and LCS 3D glasses which affect the quality of
stereoscopic images displayed using the frame-
sequential stereoscopic display method on LCD
monitors.
Despite the fact that the pixel response rate of new
LCD monitors is falling, the scan-like image update
method used by many/most conventional LCD
monitors still prevents them being used with
conventional LCS 3D glasses to achieve a full-screen
stereoscopic image using the frame-sequential
stereoscopic display method.
This paper has suggested two possible methods of
achieving frame-sequential stereo on fast response
LCD monitors. However both methods are not ideal.
LCD technology is developing fast and new drive
methods may mean that new generation LCDs could
be compatible with the frame-sequential stereoscopic
display method by using a modified LCS drive
technique.
(a)
(b)
Figure 4: (a) Time domain response of a fictitious
LCD monitor with a fast addressing rate and fast pixel
response rate and (b) the same being used with
reduced duty cycle LCS 3D glasses†.
Figure 3: The use of a reduced duty cycle LCS 3D
glasses† and letterboxing to achieve frame-sequential
stereo on a fast pixel response rate LCD.
IMID/IDMC '06 DIGEST • 101
5-4 / A. J. Woods

LCD panels can be used for other stereoscopic
viewing methods and these are summarised in
reference [5].
6. Acknowledgements
We wish to thank the companies and individuals who
lent LCD monitors for testing.
7. References
[1] A. J. Woods, and S. S. L. Tan, “Characterising
Sources of Ghosting in Time-Sequential
Stereoscopic Video Displays”, in Stereoscopic
Displays and Virtual Reality Systems IX, Proc.
SPIE Vol. 4660, San Jose, California (2002).
[2] H. Pan, X.-F. Feng, and S. Daly, “LCD motion
blur modelling and analysis”, in IEEE
International Conference on Image Processing
(ICIP 2005), Vol. 2, pp 21-24, (2005).
[3] A. A. S. Sluyterman, and E. P. Boonekamp,
"Architectural Choices in a Scanning Backlight
for Large LCD TVs", in SID 05 Digest, pg 996-
(2005)
[4] H.-C. Hung, and C.-W. Shih, "Improvement in
Moving Picture Quality Using Scanning
Backlight System", in Proceedings of the
International Display Manufacturing Conference
(IDMC'05), Taipei, Taiwan (2005).
[5] A. J. Woods, "Compatibility of Display Products
with Stereoscopic Display Methods", in
Proceedings of the International Display
Manufacturing Conference (IDMC'05), ISBN
957-28522-2-1, Taipei, Taiwan (2005).
102 • IMID/IDMC '06 DIGEST
5-4 / A. J. Woods

Paper 6 [Refereed Conference Paper]
A. J. Woods, K. S. Karvinen (2008) "The compatibility of consumer plasma displays with time‐sequential stereoscopic 3D visualization" in Stereoscopic Displays and Applications XIX, Proceedings of IS&T/SPIE Electronic Imaging, SPIE Vol. 6803, pp. 68030X‐1 to ‐9, San Jose, California, January 2008.
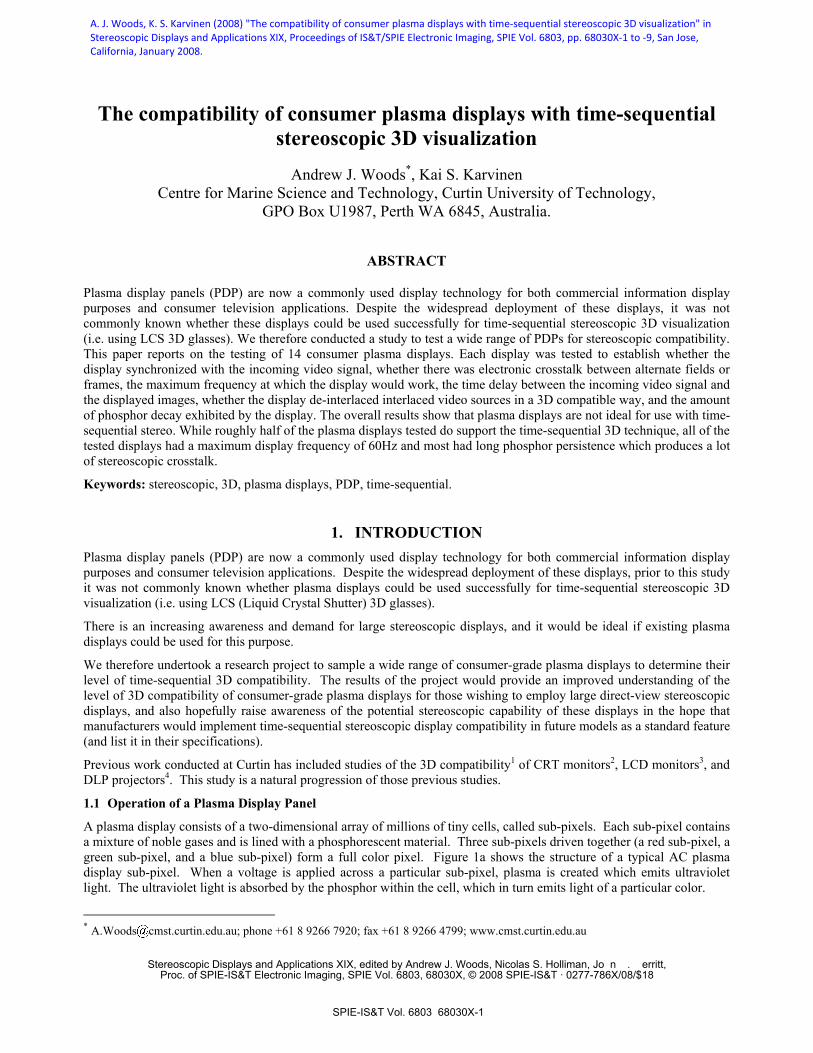
The compatibility of consumer plasma displays with time-sequential stereoscopic 3D visualization
Andrew J. Woods*, Kai S. Karvinen
Centre for Marine Science and Technology, Curtin University of Technology, GPO Box U1987, Perth WA 6845, Australia.
ABSTRACT
Plasma display panels (PDP) are now a commonly used display technology for both commercial information display purposes and consumer television applications. Despite the widespread deployment of these displays, it was not commonly known whether these displays could be used successfully for time-sequential stereoscopic 3D visualization (i.e. using LCS 3D glasses). We therefore conducted a study to test a wide range of PDPs for stereoscopic compatibility. This paper reports on the testing of 14 consumer plasma displays. Each display was tested to establish whether the display synchronized with the incoming video signal, whether there was electronic crosstalk between alternate fields or frames, the maximum frequency at which the display would work, the time delay between the incoming video signal and the displayed images, whether the display de-interlaced interlaced video sources in a 3D compatible way, and the amount of phosphor decay exhibited by the display. The overall results show that plasma displays are not ideal for use with time-sequential stereo. While roughly half of the plasma displays tested do support the time-sequential 3D technique, all of the tested displays had a maximum display frequency of 60Hz and most had long phosphor persistence which produces a lot of stereoscopic crosstalk.
Keywords: stereoscopic, 3D, plasma displays, PDP, time-sequential.
1. INTRODUCTION Plasma display panels (PDP) are now a commonly used display technology for both commercial information display purposes and consumer television applications. Despite the widespread deployment of these displays, prior to this study it was not commonly known whether plasma displays could be used successfully for time-sequential stereoscopic 3D visualization (i.e. using LCS (Liquid Crystal Shutter) 3D glasses).
There is an increasing awareness and demand for large stereoscopic displays, and it would be ideal if existing plasma displays could be used for this purpose.
We therefore undertook a research project to sample a wide range of consumer-grade plasma displays to determine their level of time-sequential 3D compatibility. The results of the project would provide an improved understanding of the level of 3D compatibility of consumer-grade plasma displays for those wishing to employ large direct-view stereoscopic displays, and also hopefully raise awareness of the potential stereoscopic capability of these displays in the hope that manufacturers would implement time-sequential stereoscopic display compatibility in future models as a standard feature (and list it in their specifications).
Previous work conducted at Curtin has included studies of the 3D compatibility1 of CRT monitors2, LCD monitors3, and DLP projectors4. This study is a natural progression of those previous studies.
1.1 Operation of a Plasma Display Panel
A plasma display consists of a two-dimensional array of millions of tiny cells, called sub-pixels. Each sub-pixel contains a mixture of noble gases and is lined with a phosphorescent material. Three sub-pixels driven together (a red sub-pixel, a green sub-pixel, and a blue sub-pixel) form a full color pixel. Figure 1a shows the structure of a typical AC plasma display sub-pixel. When a voltage is applied across a particular sub-pixel, plasma is created which emits ultraviolet light. The ultraviolet light is absorbed by the phosphor within the cell, which in turn emits light of a particular color.
* A.Woods cmst.curtin.edu.au; phone +61 8 9266 7920; fax +61 8 9266 4799; www.cmst.curtin.edu.au
Stereoscopic Displays and Applications XIX, edited by Andrew J. Woods, Nicolas S. Holliman, John O. Merritt,Proc. of SPIE-IS&T Electronic Imaging, SPIE Vol. 6803, 68030X, © 2008 SPIE-IS&T · 0277-786X/08/$18
SPIE-IS&T Vol. 6803 68030X-1
A. J. Woods, K. S. Karvinen (2008) "The compatibility of consumer plasma displays with time‐sequential stereoscopic 3D visualization" in Stereoscopic Displays and Applications XIX, Proceedings of IS&T/SPIE Electronic Imaging, SPIE Vol. 6803, pp. 68030X‐1 to ‐9, San Jose, California, January 2008.
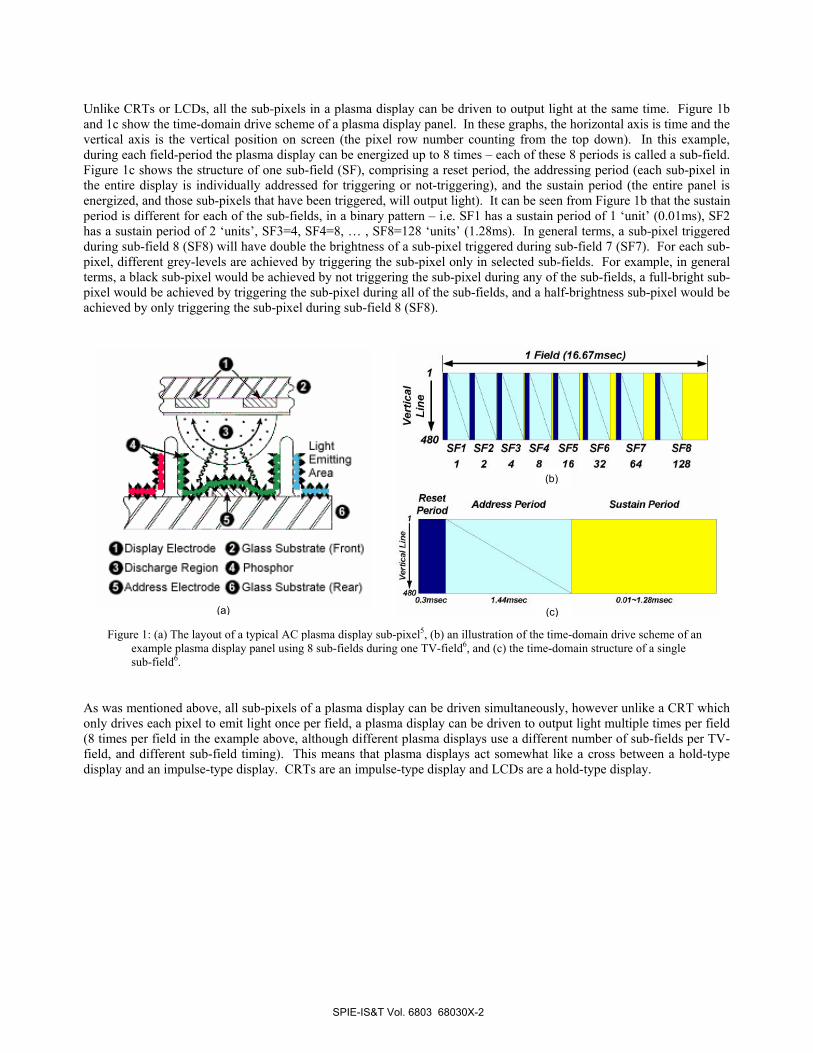
LigNi ;• Area
o0 Display Electrode 0 Ci ass Substrate {Front)
O Disaarge Region 0 PhosphorOAddress Electrode 0 Ci ass Substrate Rear)
I Field (16.G7msec)
'iI 1111111480 -
SF1 SF2 SF3 SF4 SF5 SF6 SF?1 2 4 8 16 32 64 128
(b)
Address Period Sustain Period
144msec-
OO1—128msec
C)
Unlike CRTs or LCDs, all the sub-pixels in a plasma display can be driven to output light at the same time. Figure 1b and 1c show the time-domain drive scheme of a plasma display panel. In these graphs, the horizontal axis is time and the vertical axis is the vertical position on screen (the pixel row number counting from the top down). In this example, during each field-period the plasma display can be energized up to 8 times – each of these 8 periods is called a sub-field. Figure 1c shows the structure of one sub-field (SF), comprising a reset period, the addressing period (each sub-pixel in the entire display is individually addressed for triggering or not-triggering), and the sustain period (the entire panel is energized, and those sub-pixels that have been triggered, will output light). It can be seen from Figure 1b that the sustain period is different for each of the sub-fields, in a binary pattern – i.e. SF1 has a sustain period of 1 ‘unit’ (0.01ms), SF2 has a sustain period of 2 ‘units’, SF3=4, SF4=8, … , SF8=128 ‘units’ (1.28ms). In general terms, a sub-pixel triggered during sub-field 8 (SF8) will have double the brightness of a sub-pixel triggered during sub-field 7 (SF7). For each sub-pixel, different grey-levels are achieved by triggering the sub-pixel only in selected sub-fields. For example, in general terms, a black sub-pixel would be achieved by not triggering the sub-pixel during any of the sub-fields, a full-bright sub-pixel would be achieved by triggering the sub-pixel during all of the sub-fields, and a half-brightness sub-pixel would be achieved by only triggering the sub-pixel during sub-field 8 (SF8).
Figure 1: (a) The layout of a typical AC plasma display sub-pixel5, (b) an illustration of the time-domain drive scheme of an
example plasma display panel using 8 sub-fields during one TV-field6, and (c) the time-domain structure of a single sub-field6.
As was mentioned above, all sub-pixels of a plasma display can be driven simultaneously, however unlike a CRT which only drives each pixel to emit light once per field, a plasma display can be driven to output light multiple times per field (8 times per field in the example above, although different plasma displays use a different number of sub-fields per TV-field, and different sub-field timing). This means that plasma displays act somewhat like a cross between a hold-type display and an impulse-type display. CRTs are an impulse-type display and LCDs are a hold-type display.
(a)
(b)
(c)
SPIE-IS&T Vol. 6803 68030X-2
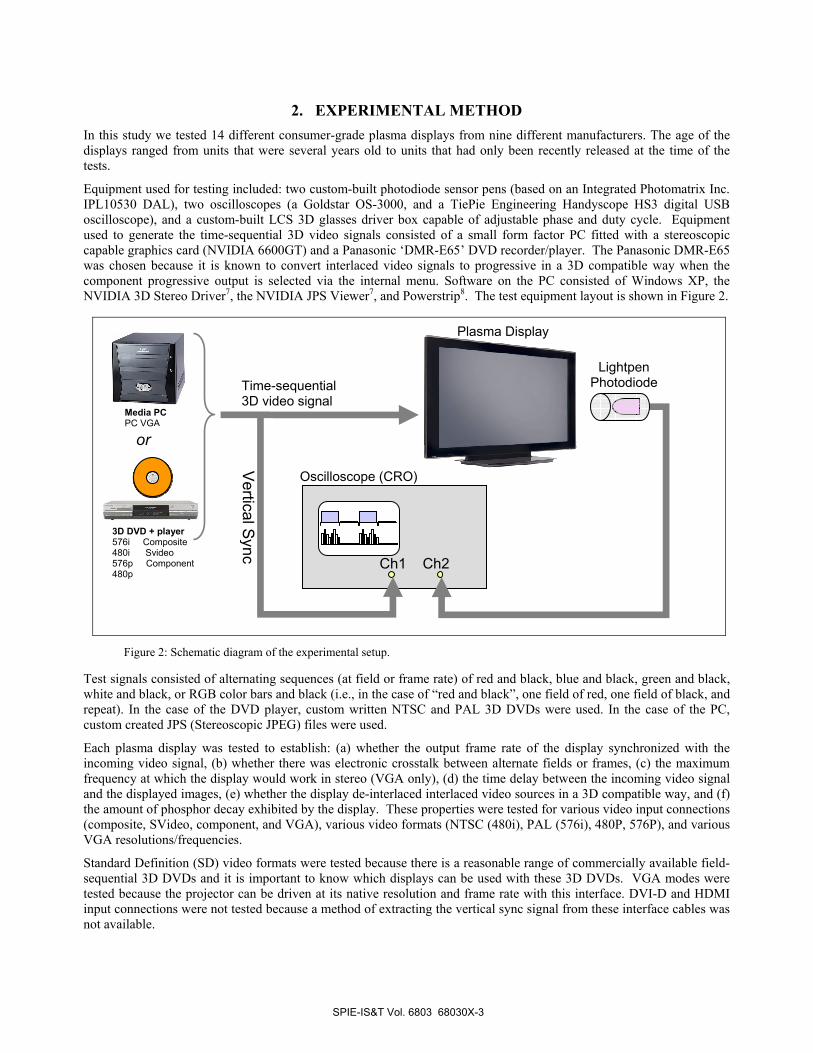
2. EXPERIMENTAL METHOD In this study we tested 14 different consumer-grade plasma displays from nine different manufacturers. The age of the displays ranged from units that were several years old to units that had only been recently released at the time of the tests.
Equipment used for testing included: two custom-built photodiode sensor pens (based on an Integrated Photomatrix Inc. IPL10530 DAL), two oscilloscopes (a Goldstar OS-3000, and a TiePie Engineering Handyscope HS3 digital USB oscilloscope), and a custom-built LCS 3D glasses driver box capable of adjustable phase and duty cycle. Equipment used to generate the time-sequential 3D video signals consisted of a small form factor PC fitted with a stereoscopic capable graphics card (NVIDIA 6600GT) and a Panasonic ‘DMR-E65’ DVD recorder/player. The Panasonic DMR-E65 was chosen because it is known to convert interlaced video signals to progressive in a 3D compatible way when the component progressive output is selected via the internal menu. Software on the PC consisted of Windows XP, the NVIDIA 3D Stereo Driver7, the NVIDIA JPS Viewer7, and Powerstrip8. The test equipment layout is shown in Figure 2.
Test signals consisted of alternating sequences (at field or frame rate) of red and black, blue and black, green and black, white and black, or RGB color bars and black (i.e., in the case of “red and black”, one field of red, one field of black, and repeat). In the case of the DVD player, custom written NTSC and PAL 3D DVDs were used. In the case of the PC, custom created JPS (Stereoscopic JPEG) files were used.
Each plasma display was tested to establish: (a) whether the output frame rate of the display synchronized with the incoming video signal, (b) whether there was electronic crosstalk between alternate fields or frames, (c) the maximum frequency at which the display would work in stereo (VGA only), (d) the time delay between the incoming video signal and the displayed images, (e) whether the display de-interlaced interlaced video sources in a 3D compatible way, and (f) the amount of phosphor decay exhibited by the display. These properties were tested for various video input connections (composite, SVideo, component, and VGA), various video formats (NTSC (480i), PAL (576i), 480P, 576P), and various VGA resolutions/frequencies.
Standard Definition (SD) video formats were tested because there is a reasonable range of commercially available field-sequential 3D DVDs and it is important to know which displays can be used with these 3D DVDs. VGA modes were tested because the projector can be driven at its native resolution and frame rate with this interface. DVI-D and HDMI input connections were not tested because a method of extracting the vertical sync signal from these interface cables was not available.
Figure 2: Schematic diagram of the experimental setup.
Time-sequential 3D video signal
Ch1 Ch2
Lightpen Photodiode
or
Vertical Sync
3D DVD + player 576i Composite 480i Svideo 576p Component 480p
Media PC PC VGA
Oscilloscope (CRO)
Plasma Display
SPIE-IS&T Vol. 6803 68030X-3
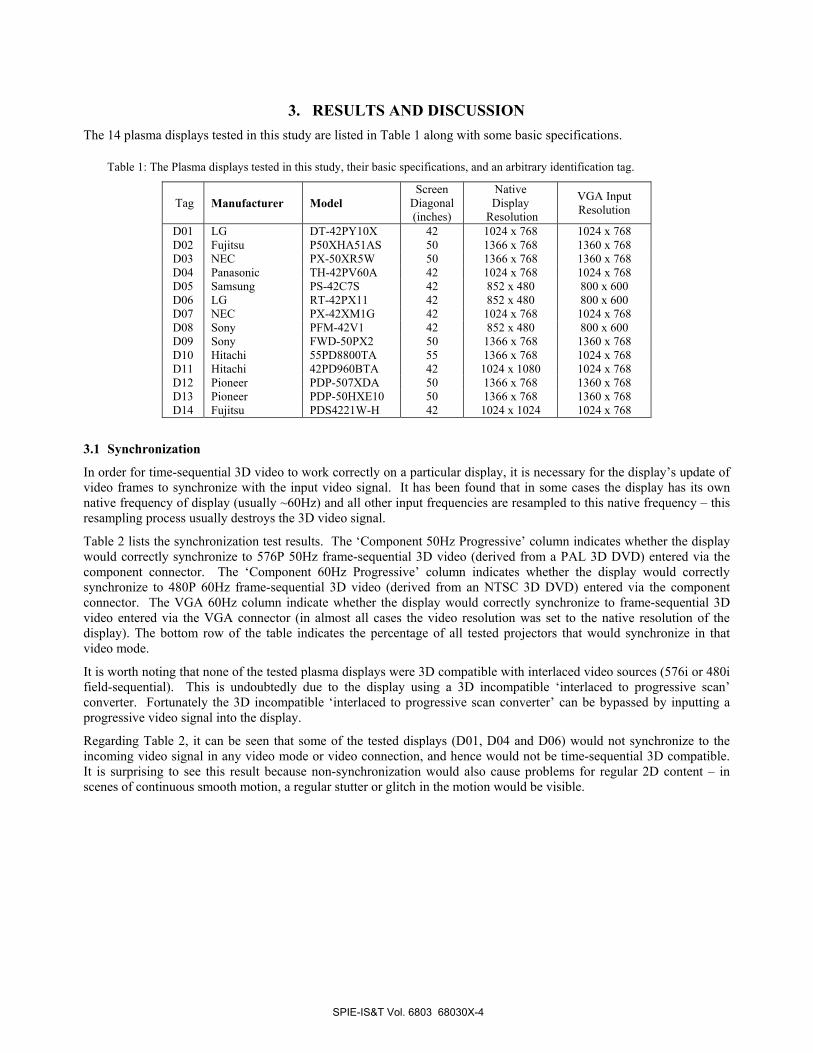
3. RESULTS AND DISCUSSION The 14 plasma displays tested in this study are listed in Table 1 along with some basic specifications.
Table 1: The Plasma displays tested in this study, their basic specifications, and an arbitrary identification tag.
Tag Manufacturer Model Screen
Diagonal (inches)
Native Display
Resolution
VGA Input Resolution
D01 LG DT-42PY10X 42 1024 x 768 1024 x 768 D02 Fujitsu P50XHA51AS 50 1366 x 768 1360 x 768 D03 NEC PX-50XR5W 50 1366 x 768 1360 x 768 D04 Panasonic TH-42PV60A 42 1024 x 768 1024 x 768 D05 Samsung PS-42C7S 42 852 x 480 800 x 600 D06 LG RT-42PX11 42 852 x 480 800 x 600 D07 NEC PX-42XM1G 42 1024 x 768 1024 x 768 D08 Sony PFM-42V1 42 852 x 480 800 x 600 D09 Sony FWD-50PX2 50 1366 x 768 1360 x 768 D10 Hitachi 55PD8800TA 55 1366 x 768 1024 x 768 D11 Hitachi 42PD960BTA 42 1024 x 1080 1024 x 768 D12 Pioneer PDP-507XDA 50 1366 x 768 1360 x 768 D13 Pioneer PDP-50HXE10 50 1366 x 768 1360 x 768 D14 Fujitsu PDS4221W-H 42 1024 x 1024 1024 x 768
3.1 Synchronization
In order for time-sequential 3D video to work correctly on a particular display, it is necessary for the display’s update of video frames to synchronize with the input video signal. It has been found that in some cases the display has its own native frequency of display (usually ~60Hz) and all other input frequencies are resampled to this native frequency – this resampling process usually destroys the 3D video signal.
Table 2 lists the synchronization test results. The ‘Component 50Hz Progressive’ column indicates whether the display would correctly synchronize to 576P 50Hz frame-sequential 3D video (derived from a PAL 3D DVD) entered via the component connector. The ‘Component 60Hz Progressive’ column indicates whether the display would correctly synchronize to 480P 60Hz frame-sequential 3D video (derived from an NTSC 3D DVD) entered via the component connector. The VGA 60Hz column indicate whether the display would correctly synchronize to frame-sequential 3D video entered via the VGA connector (in almost all cases the video resolution was set to the native resolution of the display). The bottom row of the table indicates the percentage of all tested projectors that would synchronize in that video mode.
It is worth noting that none of the tested plasma displays were 3D compatible with interlaced video sources (576i or 480i field-sequential). This is undoubtedly due to the display using a 3D incompatible ‘interlaced to progressive scan’ converter. Fortunately the 3D incompatible ‘interlaced to progressive scan converter’ can be bypassed by inputting a progressive video signal into the display.
Regarding Table 2, it can be seen that some of the tested displays (D01, D04 and D06) would not synchronize to the incoming video signal in any video mode or video connection, and hence would not be time-sequential 3D compatible. It is surprising to see this result because non-synchronization would also cause problems for regular 2D content – in scenes of continuous smooth motion, a regular stutter or glitch in the motion would be visible.
SPIE-IS&T Vol. 6803 68030X-4
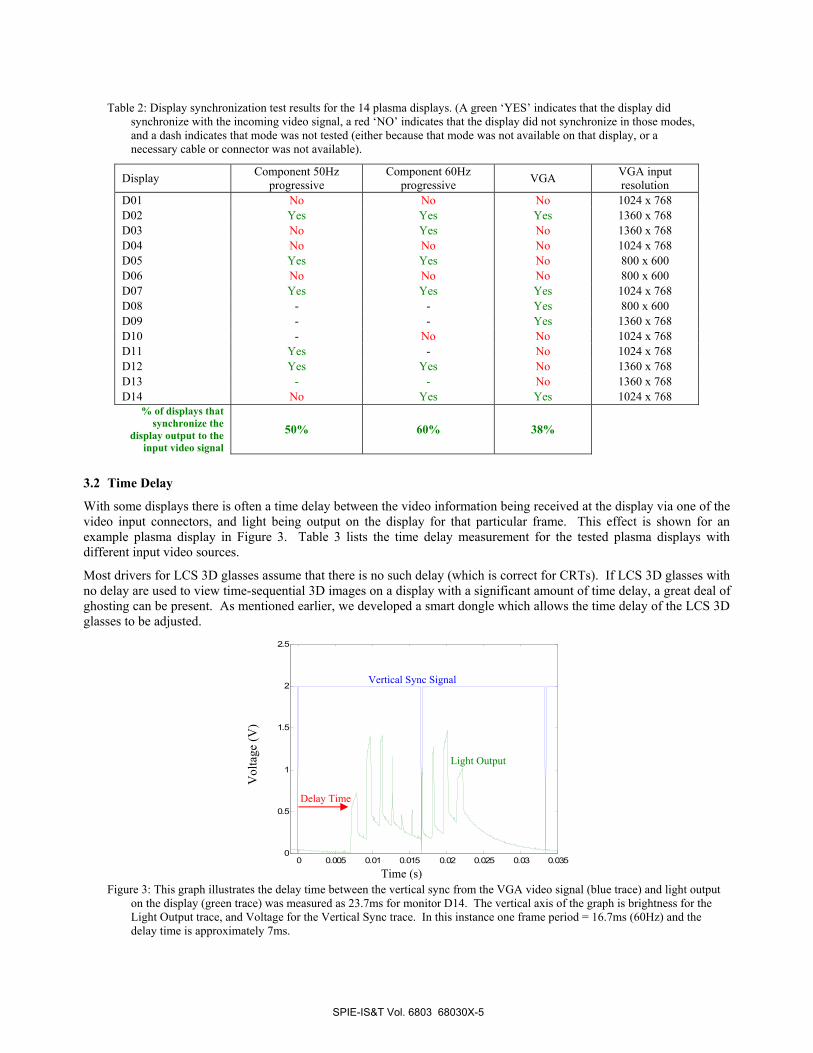
Table 2: Display synchronization test results for the 14 plasma displays. (A green ‘YES’ indicates that the display did synchronize with the incoming video signal, a red ‘NO’ indicates that the display did not synchronize in those modes, and a dash indicates that mode was not tested (either because that mode was not available on that display, or a necessary cable or connector was not available).
Display Component 50Hz progressive
Component 60Hz progressive VGA VGA input
resolution D01 No No No 1024 x 768 D02 Yes Yes Yes 1360 x 768 D03 No Yes No 1360 x 768 D04 No No No 1024 x 768 D05 Yes Yes No 800 x 600 D06 No No No 800 x 600 D07 Yes Yes Yes 1024 x 768 D08 - - Yes 800 x 600 D09 - - Yes 1360 x 768 D10 - No No 1024 x 768 D11 Yes - No 1024 x 768 D12 Yes Yes No 1360 x 768 D13 - - No 1360 x 768 D14 No Yes Yes 1024 x 768
% of displays that synchronize the
display output to the input video signal
50% 60% 38%
3.2 Time Delay
With some displays there is often a time delay between the video information being received at the display via one of the video input connectors, and light being output on the display for that particular frame. This effect is shown for an example plasma display in Figure 3. Table 3 lists the time delay measurement for the tested plasma displays with different input video sources.
Most drivers for LCS 3D glasses assume that there is no such delay (which is correct for CRTs). If LCS 3D glasses with no delay are used to view time-sequential 3D images on a display with a significant amount of time delay, a great deal of ghosting can be present. As mentioned earlier, we developed a smart dongle which allows the time delay of the LCS 3D glasses to be adjusted.
0 0.005 0.01 0.015 0.02 0.025 0.03 0.0350
0.5
1
1.5
2
2.5
Figure 3: This graph illustrates the delay time between the vertical sync from the VGA video signal (blue trace) and light output
on the display (green trace) was measured as 23.7ms for monitor D14. The vertical axis of the graph is brightness for the Light Output trace, and Voltage for the Vertical Sync trace. In this instance one frame period = 16.7ms (60Hz) and the delay time is approximately 7ms.
Time (s)
Vertical Sync Signal
Light Output
Vol
tage
(V)
Delay Time
SPIE-IS&T Vol. 6803 68030X-5
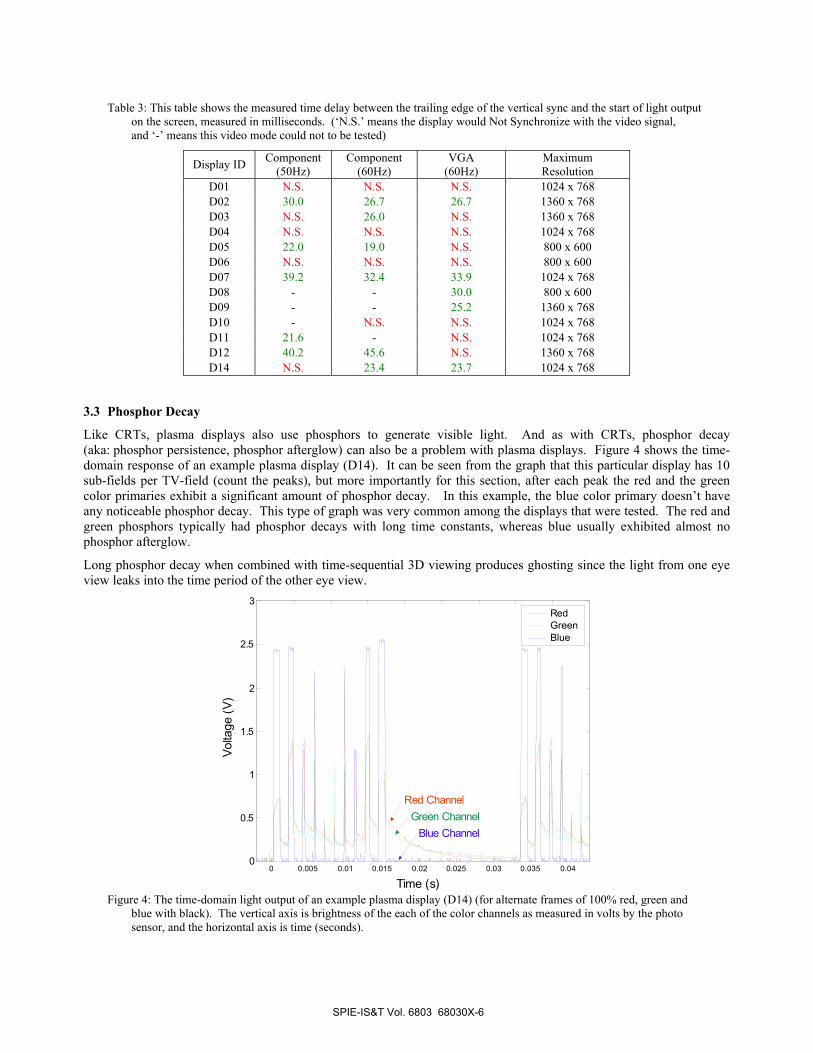
Table 3: This table shows the measured time delay between the trailing edge of the vertical sync and the start of light output on the screen, measured in milliseconds. (‘N.S.’ means the display would Not Synchronize with the video signal, and ‘-’ means this video mode could not to be tested)
Display ID Component (50Hz)
Component (60Hz)
VGA (60Hz)
Maximum Resolution
D01 N.S. N.S. N.S. 1024 x 768 D02 30.0 26.7 26.7 1360 x 768 D03 N.S. 26.0 N.S. 1360 x 768 D04 N.S. N.S. N.S. 1024 x 768 D05 22.0 19.0 N.S. 800 x 600 D06 N.S. N.S. N.S. 800 x 600 D07 39.2 32.4 33.9 1024 x 768 D08 - - 30.0 800 x 600 D09 - - 25.2 1360 x 768 D10 - N.S. N.S. 1024 x 768 D11 21.6 - N.S. 1024 x 768 D12 40.2 45.6 N.S. 1360 x 768 D14 N.S. 23.4 23.7 1024 x 768
3.3 Phosphor Decay
Like CRTs, plasma displays also use phosphors to generate visible light. And as with CRTs, phosphor decay (aka: phosphor persistence, phosphor afterglow) can also be a problem with plasma displays. Figure 4 shows the time-domain response of an example plasma display (D14). It can be seen from the graph that this particular display has 10 sub-fields per TV-field (count the peaks), but more importantly for this section, after each peak the red and the green color primaries exhibit a significant amount of phosphor decay. In this example, the blue color primary doesn’t have any noticeable phosphor decay. This type of graph was very common among the displays that were tested. The red and green phosphors typically had phosphor decays with long time constants, whereas blue usually exhibited almost no phosphor afterglow.
Long phosphor decay when combined with time-sequential 3D viewing produces ghosting since the light from one eye view leaks into the time period of the other eye view.
0
0.5
1
1.5
2
2.5
3Red GreenBlue
0 0.005 0.01 0.015 0.02 0.025 0.03 0.035 0.04
Time (s)
Volta
ge (V
)
Red ChannelGreen Channel
Blue Channel
Figure 4: The time-domain light output of an example plasma display (D14) (for alternate frames of 100% red, green and
blue with black). The vertical axis is brightness of the each of the color channels as measured in volts by the photo sensor, and the horizontal axis is time (seconds).
SPIE-IS&T Vol. 6803 68030X-6
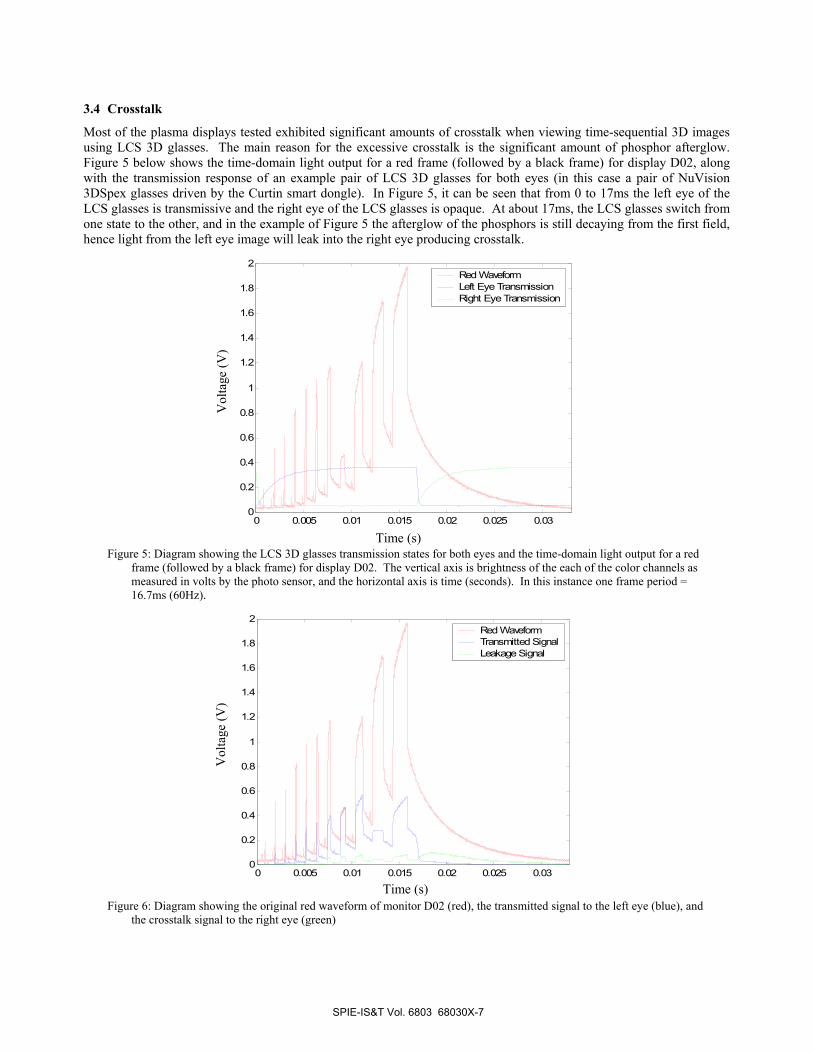
3.4 Crosstalk
Most of the plasma displays tested exhibited significant amounts of crosstalk when viewing time-sequential 3D images using LCS 3D glasses. The main reason for the excessive crosstalk is the significant amount of phosphor afterglow. Figure 5 below shows the time-domain light output for a red frame (followed by a black frame) for display D02, along with the transmission response of an example pair of LCS 3D glasses for both eyes (in this case a pair of NuVision 3DSpex glasses driven by the Curtin smart dongle). In Figure 5, it can be seen that from 0 to 17ms the left eye of the LCS glasses is transmissive and the right eye of the LCS glasses is opaque. At about 17ms, the LCS glasses switch from one state to the other, and in the example of Figure 5 the afterglow of the phosphors is still decaying from the first field, hence light from the left eye image will leak into the right eye producing crosstalk.
0 0.005 0.01 0.015 0.02 0.025 0.030
0.2
0.4
0.6
0.8
1
1.2
1.4
1.6
1.8
2Red Waveform Left Eye Transmission Right Eye Transmission
Figure 5: Diagram showing the LCS 3D glasses transmission states for both eyes and the time-domain light output for a red
frame (followed by a black frame) for display D02. The vertical axis is brightness of the each of the color channels as measured in volts by the photo sensor, and the horizontal axis is time (seconds). In this instance one frame period = 16.7ms (60Hz).
0 0.005 0.01 0.015 0.02 0.025 0.030
0.2
0.4
0.6
0.8
1
1.2
1.4
1.6
1.8
2Red Waveform Transmitted SignalLeakage Signal
Figure 6: Diagram showing the original red waveform of monitor D02 (red), the transmitted signal to the left eye (blue), and
the crosstalk signal to the right eye (green)
Time (s)
Vol
tage
(V)
Time (s)
Vol
tage
(V)
SPIE-IS&T Vol. 6803 68030X-7
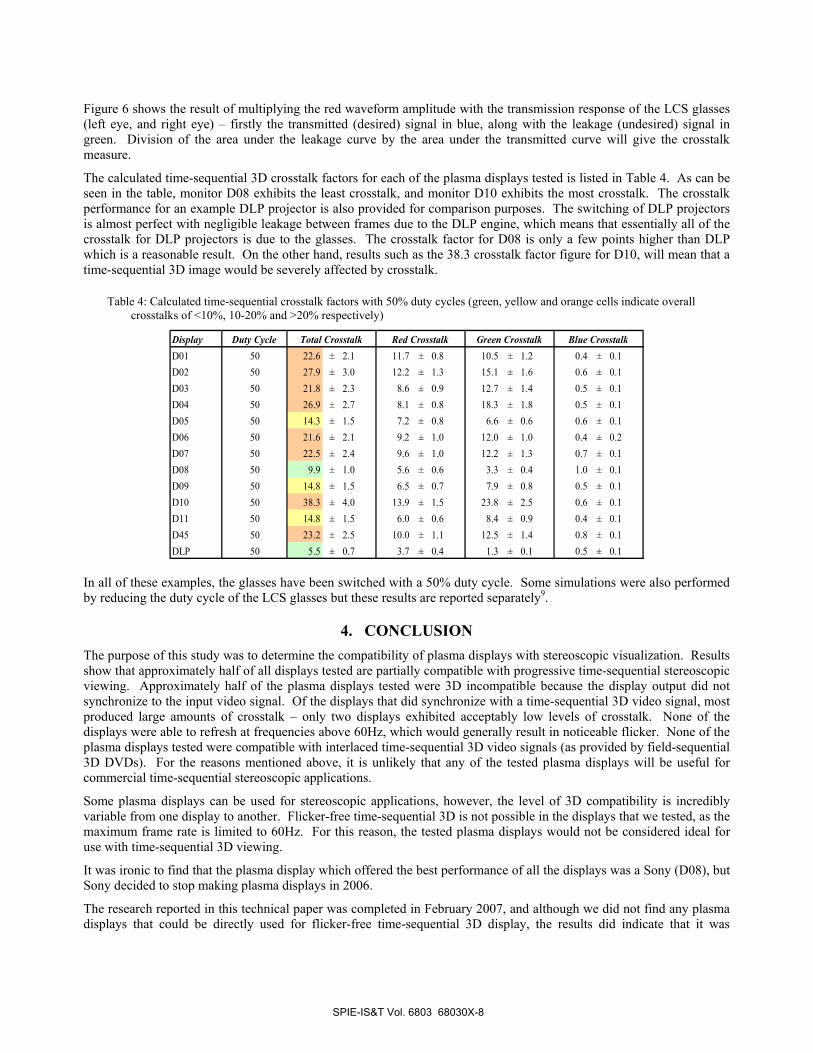
Figure 6 shows the result of multiplying the red waveform amplitude with the transmission response of the LCS glasses (left eye, and right eye) – firstly the transmitted (desired) signal in blue, along with the leakage (undesired) signal in green. Division of the area under the leakage curve by the area under the transmitted curve will give the crosstalk measure.
The calculated time-sequential 3D crosstalk factors for each of the plasma displays tested is listed in Table 4. As can be seen in the table, monitor D08 exhibits the least crosstalk, and monitor D10 exhibits the most crosstalk. The crosstalk performance for an example DLP projector is also provided for comparison purposes. The switching of DLP projectors is almost perfect with negligible leakage between frames due to the DLP engine, which means that essentially all of the crosstalk for DLP projectors is due to the glasses. The crosstalk factor for D08 is only a few points higher than DLP which is a reasonable result. On the other hand, results such as the 38.3 crosstalk factor figure for D10, will mean that a time-sequential 3D image would be severely affected by crosstalk.
Table 4: Calculated time-sequential crosstalk factors with 50% duty cycles (green, yellow and orange cells indicate overall crosstalks of <10%, 10-20% and >20% respectively)
Display Duty CycleD01 50 22.6 ± 2.1 11.7 ± 0.8 10.5 ± 1.2 0.4 ± 0.1D02 50 27.9 ± 3.0 12.2 ± 1.3 15.1 ± 1.6 0.6 ± 0.1D03 50 21.8 ± 2.3 8.6 ± 0.9 12.7 ± 1.4 0.5 ± 0.1D04 50 26.9 ± 2.7 8.1 ± 0.8 18.3 ± 1.8 0.5 ± 0.1D05 50 14.3 ± 1.5 7.2 ± 0.8 6.6 ± 0.6 0.6 ± 0.1D06 50 21.6 ± 2.1 9.2 ± 1.0 12.0 ± 1.0 0.4 ± 0.2D07 50 22.5 ± 2.4 9.6 ± 1.0 12.2 ± 1.3 0.7 ± 0.1D08 50 9.9 ± 1.0 5.6 ± 0.6 3.3 ± 0.4 1.0 ± 0.1D09 50 14.8 ± 1.5 6.5 ± 0.7 7.9 ± 0.8 0.5 ± 0.1D10 50 38.3 ± 4.0 13.9 ± 1.5 23.8 ± 2.5 0.6 ± 0.1D11 50 14.8 ± 1.5 6.0 ± 0.6 8.4 ± 0.9 0.4 ± 0.1D45 50 23.2 ± 2.5 10.0 ± 1.1 12.5 ± 1.4 0.8 ± 0.1DLP 50 5.5 ± 0.7 3.7 ± 0.4 1.3 ± 0.1 0.5 ± 0.1
Total Crosstalk Red Crosstalk Green Crosstalk Blue Crosstalk
In all of these examples, the glasses have been switched with a 50% duty cycle. Some simulations were also performed by reducing the duty cycle of the LCS glasses but these results are reported separately9.
4. CONCLUSION The purpose of this study was to determine the compatibility of plasma displays with stereoscopic visualization. Results show that approximately half of all displays tested are partially compatible with progressive time-sequential stereoscopic viewing. Approximately half of the plasma displays tested were 3D incompatible because the display output did not synchronize to the input video signal. Of the displays that did synchronize with a time-sequential 3D video signal, most produced large amounts of crosstalk – only two displays exhibited acceptably low levels of crosstalk. None of the displays were able to refresh at frequencies above 60Hz, which would generally result in noticeable flicker. None of the plasma displays tested were compatible with interlaced time-sequential 3D video signals (as provided by field-sequential 3D DVDs). For the reasons mentioned above, it is unlikely that any of the tested plasma displays will be useful for commercial time-sequential stereoscopic applications.
Some plasma displays can be used for stereoscopic applications, however, the level of 3D compatibility is incredibly variable from one display to another. Flicker-free time-sequential 3D is not possible in the displays that we tested, as the maximum frame rate is limited to 60Hz. For this reason, the tested plasma displays would not be considered ideal for use with time-sequential 3D viewing.
It was ironic to find that the plasma display which offered the best performance of all the displays was a Sony (D08), but Sony decided to stop making plasma displays in 2006.
The research reported in this technical paper was completed in February 2007, and although we did not find any plasma displays that could be directly used for flicker-free time-sequential 3D display, the results did indicate that it was
SPIE-IS&T Vol. 6803 68030X-8
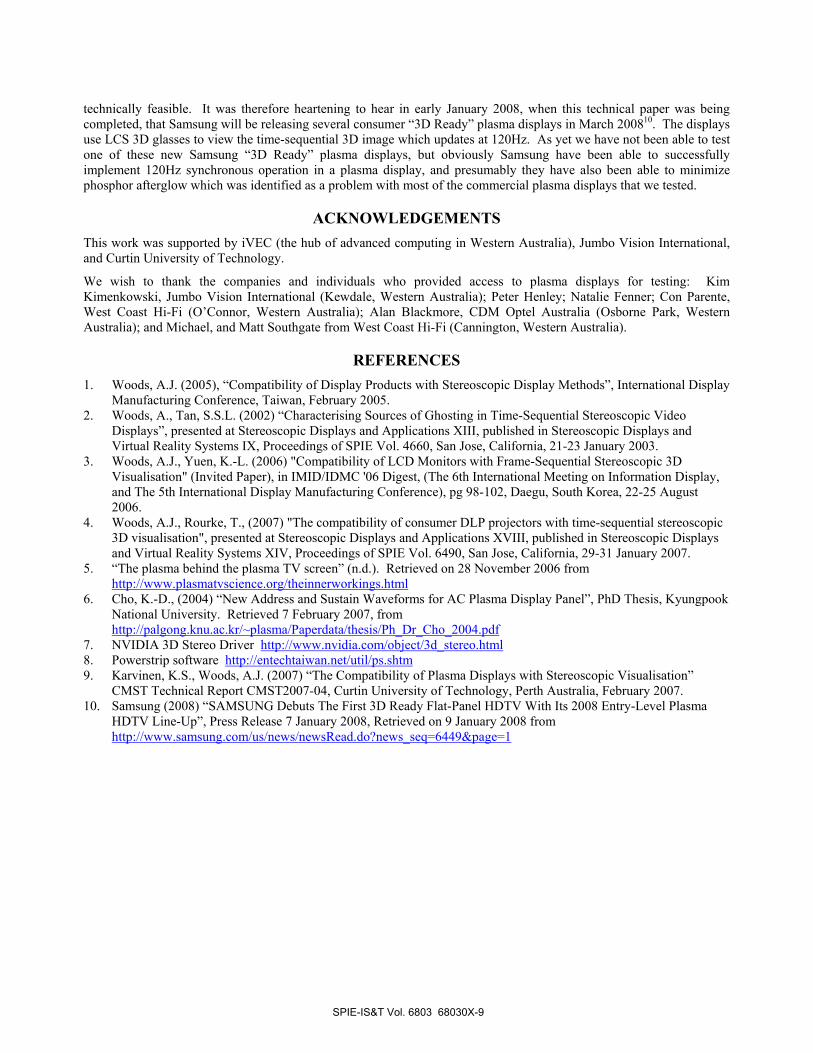
technically feasible. It was therefore heartening to hear in early January 2008, when this technical paper was being completed, that Samsung will be releasing several consumer “3D Ready” plasma displays in March 200810. The displays use LCS 3D glasses to view the time-sequential 3D image which updates at 120Hz. As yet we have not been able to test one of these new Samsung “3D Ready” plasma displays, but obviously Samsung have been able to successfully implement 120Hz synchronous operation in a plasma display, and presumably they have also been able to minimize phosphor afterglow which was identified as a problem with most of the commercial plasma displays that we tested.
ACKNOWLEDGEMENTS This work was supported by iVEC (the hub of advanced computing in Western Australia), Jumbo Vision International, and Curtin University of Technology.
We wish to thank the companies and individuals who provided access to plasma displays for testing: Kim Kimenkowski, Jumbo Vision International (Kewdale, Western Australia); Peter Henley; Natalie Fenner; Con Parente, West Coast Hi-Fi (O’Connor, Western Australia); Alan Blackmore, CDM Optel Australia (Osborne Park, Western Australia); and Michael, and Matt Southgate from West Coast Hi-Fi (Cannington, Western Australia).
REFERENCES 1. Woods, A.J. (2005), “Compatibility of Display Products with Stereoscopic Display Methods”, International Display
Manufacturing Conference, Taiwan, February 2005. 2. Woods, A., Tan, S.S.L. (2002) “Characterising Sources of Ghosting in Time-Sequential Stereoscopic Video
Displays”, presented at Stereoscopic Displays and Applications XIII, published in Stereoscopic Displays and Virtual Reality Systems IX, Proceedings of SPIE Vol. 4660, San Jose, California, 21-23 January 2003.
3. Woods, A.J., Yuen, K.-L. (2006) "Compatibility of LCD Monitors with Frame-Sequential Stereoscopic 3D Visualisation" (Invited Paper), in IMID/IDMC '06 Digest, (The 6th International Meeting on Information Display, and The 5th International Display Manufacturing Conference), pg 98-102, Daegu, South Korea, 22-25 August 2006.
4. Woods, A.J., Rourke, T., (2007) "The compatibility of consumer DLP projectors with time-sequential stereoscopic 3D visualisation", presented at Stereoscopic Displays and Applications XVIII, published in Stereoscopic Displays and Virtual Reality Systems XIV, Proceedings of SPIE Vol. 6490, San Jose, California, 29-31 January 2007.
5. “The plasma behind the plasma TV screen” (n.d.). Retrieved on 28 November 2006 from http://www.plasmatvscience.org/theinnerworkings.html
6. Cho, K.-D., (2004) “New Address and Sustain Waveforms for AC Plasma Display Panel”, PhD Thesis, Kyungpook National University. Retrieved 7 February 2007, from http://palgong.knu.ac.kr/~plasma/Paperdata/thesis/Ph_Dr_Cho_2004.pdf
7. NVIDIA 3D Stereo Driver http://www.nvidia.com/object/3d_stereo.html 8. Powerstrip software http://entechtaiwan.net/util/ps.shtm 9. Karvinen, K.S., Woods, A.J. (2007) “The Compatibility of Plasma Displays with Stereoscopic Visualisation”
CMST Technical Report CMST2007-04, Curtin University of Technology, Perth Australia, February 2007. 10. Samsung (2008) “SAMSUNG Debuts The First 3D Ready Flat-Panel HDTV With Its 2008 Entry-Level Plasma
HDTV Line-Up”, Press Release 7 January 2008, Retrieved on 9 January 2008 from http://www.samsung.com/us/news/newsRead.do?news_seq=6449&page=1
SPIE-IS&T Vol. 6803 68030X-9

Paper 7 [Refereed Conference Paper]
A. J. Woods, A. Sehic (2009) “The compatibility of LCD TVs with time‐sequential stereoscopic 3D visualization” in Stereoscopic Displays and Applications XX, Proceedings of IS&T/SPIE Electronic Imaging, SPIE Vol. 7237, pp. 72370N‐1 to ‐9, San Jose, California, January 2009.

The compatibility of LCD TVs with time-sequential stereoscopic 3D visualization
Andrew J. Woods*, Adin Sehic
Centre for Marine Science and Technology, Curtin University of Technology, GPO Box U1987, Perth WA 6845, Australia.
ABSTRACT
Liquid Crystal Displays (LCD) are now a popular display technology for consumer television applications. Our previous research has shown that conventional LCD computer monitors are not well suited to time-sequential stereoscopic visualization due to the scanning image update method, the hold-type operation of LCDs, and in some cases slow pixel response rate. Recently some new technologies are being used in LCD TVs to improve 2D motion reproduction - such as black frame insertion and 100/120Hz capability. This paper reports on the testing of a selection of recent LCD TVs to investigate their compatibility with the time-sequential stereoscopic display method – particularly investigating new display technologies. Aspects considered in this investigation include image update method, pixel response rate, maximum input frame rate, backlight operation, frame rate up-conversion technique, synchronization, etc. A more advanced Matlab program was also developed as part of this study to simulate and characterize 3D compatibility and calculate the crosstalk present on each display. The results of the project show that black frame insertion does improve 3D compatibility of LCDs but not to a sufficient level to produce good 3D results. Unfortunately 100/120Hz operation of the tested LCD did not improve 3D compatibility compared to the LCD monitors tested previously.
Keywords: Stereoscopic, time-sequential 3D, LCD, compatibility, 100Hz, 120Hz, black frame insertion.
1. INTRODUCTION The time-sequential (also known as: field-sequential, frame-sequential, time-multiplexed, alternate field) stereoscopic display technique has a long and successful history of use with CRT (Cathode Ray Tube) displays. High-quality full-color flicker-free stereoscopic images can be seen with the aid of Liquid Crystal Shutter (LCS) 3D glasses when operating at a display frequency of 120Hz. CRTs have now almost completely been replaced by LCDs (and Plasma) displays in the home television market, so naturally people are interested to know whether LCD TVs can be used with LCS 3D glasses to view stereoscopic 3D content. Our previous work has shown that conventional consumer LCD computer monitors [1] and Plasma displays [2] are not well suited to time-sequential stereoscopic 3D visualization. Some of the incompatibility reasons cited were fundamental to the way that the displays output light and generated images, but other factors were more specific to way that the specific display was implemented (usually related to video processing).
For the purposes of this discussion, we divide LCD TVs into three categories: (1) Commercially released displays in which the 3D compatibility of the display is unstated, (2) commercially released displays which are stated as being 3D Ready or Stereoscopic 3D capable, and (3) customized displays which are being developed in R&D labs but are not commercially released. This paper aims to establish whether any LCDs in Category 1 can be used for time-sequential 3D visualization. Obviously the 3D status of displays in Category 2 is already known. It is hoped that the analyses and results of this paper will be helpful for the innovations taking place in Category 3, but since such displays are not currently commercially available, it is outside the scope of this paper.
2. NEW LCD TECHNOLOGIES Since the publication of our LCD compatibility paper [1] in 2006, a number of new technologies have been introduced into some commercially released LCD TVs. These new technologies are: Black Frame Insertion (BFI), 120Hz refresh,
* A.Woods curtin.edu.au; phone +61 8 9266 7920; fax +61 8 9266 4799; www.3d.curtin.edu.au
Stereoscopic Displays and Applications XX, edited by Andrew J. Woods, Nicolas S. Holliman,John O. Merritt, Proceedings of SPIE-IS&T Electronic Imaging, SPIE Vol. 7237, 72370N
© 2009 SPIE-IS&T · CCC code: 0277-786X/09/$18 · doi: 10.1117/12.811838
SPIE-IS&T/ Vol. 7237 72370N-1
A. J. Woods, A. Sehic (2009) “The compatibility of LCD TVs with time‐sequential stereoscopic 3D visualization” in Stereoscopic Displays and Applications XX, Proceedings of IS&T/SPIE Electronic Imaging, SPIE Vol. 7237, pp. 72370N‐1 to ‐9, San Jose, California, January 2009.
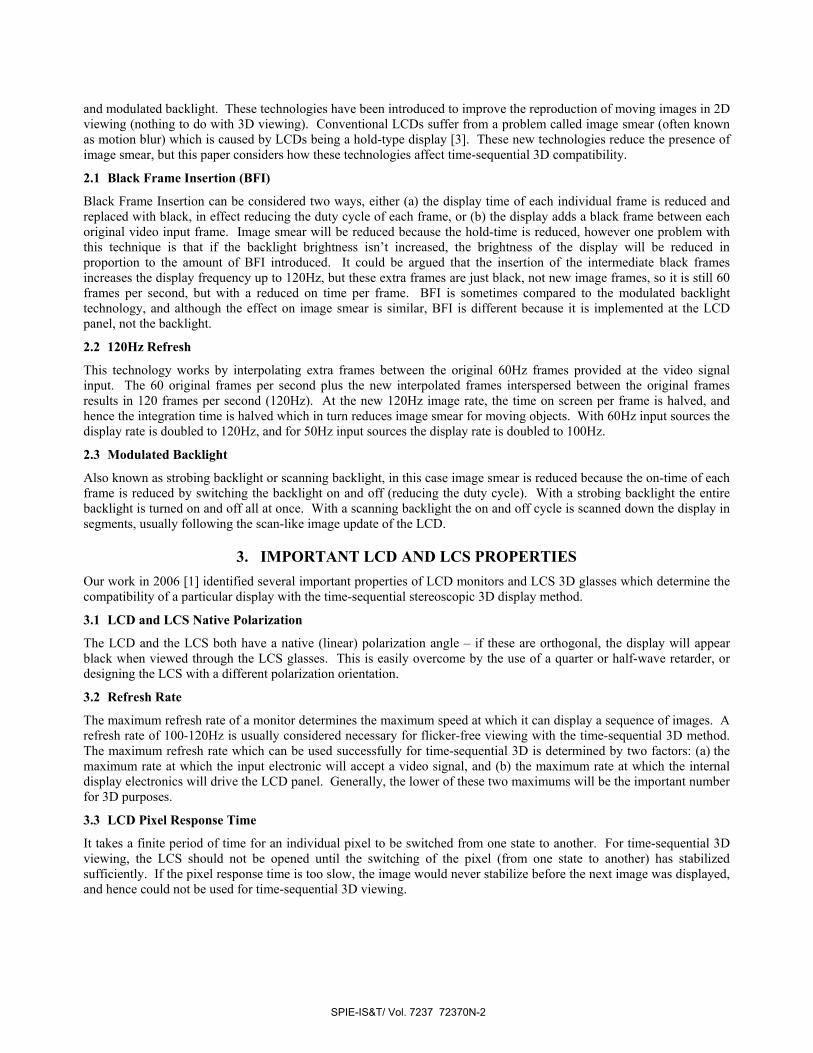
and modulated backlight. These technologies have been introduced to improve the reproduction of moving images in 2D viewing (nothing to do with 3D viewing). Conventional LCDs suffer from a problem called image smear (often known as motion blur) which is caused by LCDs being a hold-type display [3]. These new technologies reduce the presence of image smear, but this paper considers how these technologies affect time-sequential 3D compatibility.
2.1 Black Frame Insertion (BFI)
Black Frame Insertion can be considered two ways, either (a) the display time of each individual frame is reduced and replaced with black, in effect reducing the duty cycle of each frame, or (b) the display adds a black frame between each original video input frame. Image smear will be reduced because the hold-time is reduced, however one problem with this technique is that if the backlight brightness isn’t increased, the brightness of the display will be reduced in proportion to the amount of BFI introduced. It could be argued that the insertion of the intermediate black frames increases the display frequency up to 120Hz, but these extra frames are just black, not new image frames, so it is still 60 frames per second, but with a reduced on time per frame. BFI is sometimes compared to the modulated backlight technology, and although the effect on image smear is similar, BFI is different because it is implemented at the LCD panel, not the backlight.
2.2 120Hz Refresh
This technology works by interpolating extra frames between the original 60Hz frames provided at the video signal input. The 60 original frames per second plus the new interpolated frames interspersed between the original frames results in 120 frames per second (120Hz). At the new 120Hz image rate, the time on screen per frame is halved, and hence the integration time is halved which in turn reduces image smear for moving objects. With 60Hz input sources the display rate is doubled to 120Hz, and for 50Hz input sources the display rate is doubled to 100Hz.
2.3 Modulated Backlight
Also known as strobing backlight or scanning backlight, in this case image smear is reduced because the on-time of each frame is reduced by switching the backlight on and off (reducing the duty cycle). With a strobing backlight the entire backlight is turned on and off all at once. With a scanning backlight the on and off cycle is scanned down the display in segments, usually following the scan-like image update of the LCD.
3. IMPORTANT LCD AND LCS PROPERTIES Our work in 2006 [1] identified several important properties of LCD monitors and LCS 3D glasses which determine the compatibility of a particular display with the time-sequential stereoscopic 3D display method.
3.1 LCD and LCS Native Polarization
The LCD and the LCS both have a native (linear) polarization angle – if these are orthogonal, the display will appear black when viewed through the LCS glasses. This is easily overcome by the use of a quarter or half-wave retarder, or designing the LCS with a different polarization orientation.
3.2 Refresh Rate
The maximum refresh rate of a monitor determines the maximum speed at which it can display a sequence of images. A refresh rate of 100-120Hz is usually considered necessary for flicker-free viewing with the time-sequential 3D method. The maximum refresh rate which can be used successfully for time-sequential 3D is determined by two factors: (a) the maximum rate at which the input electronic will accept a video signal, and (b) the maximum rate at which the internal display electronics will drive the LCD panel. Generally, the lower of these two maximums will be the important number for 3D purposes.
3.3 LCD Pixel Response Time
It takes a finite period of time for an individual pixel to be switched from one state to another. For time-sequential 3D viewing, the LCS should not be opened until the switching of the pixel (from one state to another) has stabilized sufficiently. If the pixel response time is too slow, the image would never stabilize before the next image was displayed, and hence could not be used for time-sequential 3D viewing.
SPIE-IS&T/ Vol. 7237 72370N-2

Ver
tical
Pos
ition
on
Scr
een
(%)
NJ
-0)
0)0
00
00
00
3.4 Image Update Method
A new image is written to an LCD one line at a time from the top of the screen to the bottom. This transition from one image to the next is similar to the way that an image is scanned on a CRT, except that an LCD is a hold-type display whereas a CRT is an impulse-type display [3]. The scan-line image update method of a conventional LCD is illustrated in Figure 1. It is evident from this figure that there is no one time when a single image is shown exclusively on the whole LCD panel – this is particularly so for LCD monitors with a long pixel response rate, but is also true for LCDs with a short pixel response rate. In this example there is no single time when the shutters in the LCS glasses could open and see exclusively a single perspective image.
Figure 1: The time-domain response of an example conventional LCD panel alternating between black and white at 75Hz.
The vertical axis shows the vertical position on the LCD panel. The horizontal axis shows time. The thin diagonal line represents the addressing of each row of the LCD.
3.5 LCS Duty Cycle
Most driving electronics for LCS 3D glasses drive the shutters with a 50% duty cycle which is problematic for time-sequential 3D on LCDs. In our previous work [1] we showed that reducing the LCS duty cycle can improve compatibility with the time-sequential 3D method.
3.6 Synchronization
In order for time-sequential 3D video to work correctly on a particular display, it is necessary for the display’s update of video frames to synchronize with the input video signal. Somewhat surprisingly some commercial displays do not synchronize to the incoming video signal and instead resample the signal to the display’s own native frequency (usually ~60Hz) – this resampling process usually destroys the time-sequential 3D video signal.
4. EXPERIMENTAL METHOD In this study we attempted to test a display representing each of the three technologies described earlier. For the 100/120Hz LCD technology we tested a Sony “KDL46XBR” (46” LCD). For the BFI technology we tested a BenQ “FP241WZ” LCD. Unfortunately we were unable to obtain access to an LCD which used backlight modulation for our tests. Philips did commercially release a range of LCD HDTVs which incorporated a modulated backlight (under the trade name Aptura), however these had been discontinued when we began our testing [7] and we were unable to locate any second-hand displays for testing purposes.
Equipment used for testing included: two custom-built photodiode sensor pens (based on an Integrated Photomatrix Inc. IPL10530 DAL), an oscilloscope (a TiePie Engineering Handyscope HS3 digital USB oscilloscope), and a custom-built LCS 3D glasses driver box capable of adjustable phase and duty cycle. Equipment used to generate the time-sequential 3D video signals consisted of a small form factor PC fitted with a stereoscopic capable graphics card (NVIDIA 6600GT). Software on the PC consisted of Windows XP, Microsoft Powerpoint, the NVIDIA 3D Stereo Driver and JPS Viewer [8], and Powerstrip [9]. The test equipment layout is shown in Figure 2.
SPIE-IS&T/ Vol. 7237 72370N-3
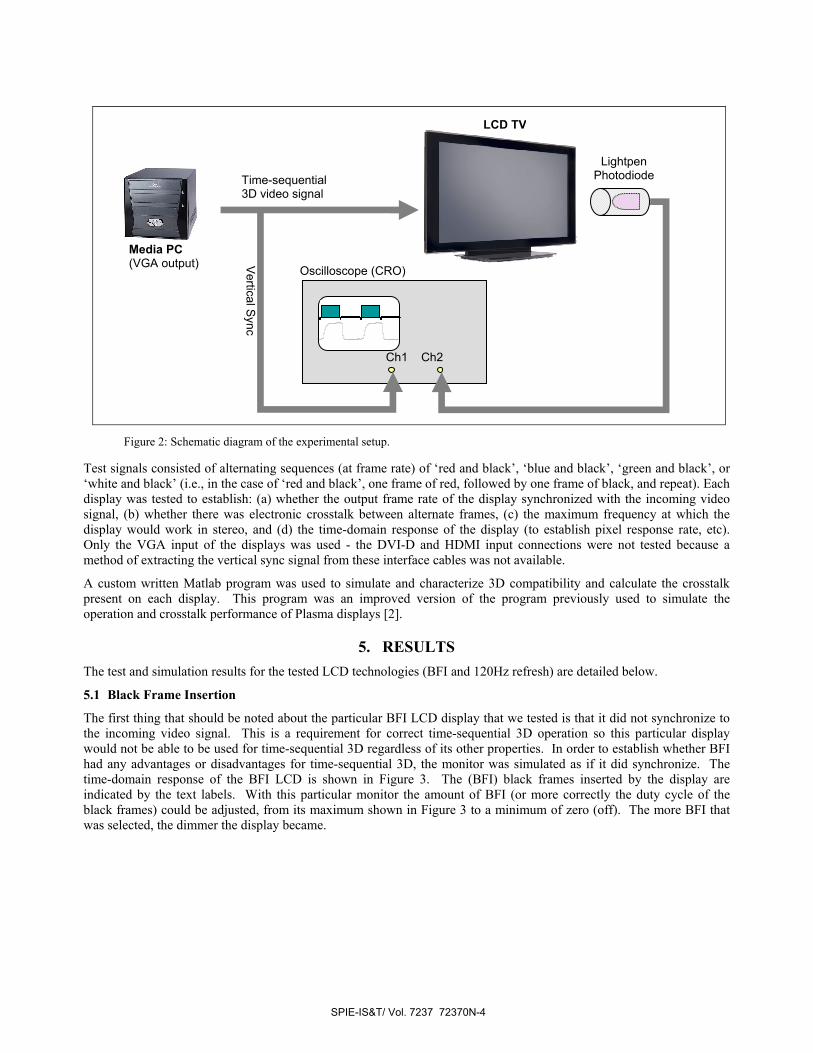
Li
Test signals consisted of alternating sequences (at frame rate) of ‘red and black’, ‘blue and black’, ‘green and black’, or ‘white and black’ (i.e., in the case of ‘red and black’, one frame of red, followed by one frame of black, and repeat). Each display was tested to establish: (a) whether the output frame rate of the display synchronized with the incoming video signal, (b) whether there was electronic crosstalk between alternate frames, (c) the maximum frequency at which the display would work in stereo, and (d) the time-domain response of the display (to establish pixel response rate, etc). Only the VGA input of the displays was used - the DVI-D and HDMI input connections were not tested because a method of extracting the vertical sync signal from these interface cables was not available.
A custom written Matlab program was used to simulate and characterize 3D compatibility and calculate the crosstalk present on each display. This program was an improved version of the program previously used to simulate the operation and crosstalk performance of Plasma displays [2].
5. RESULTS The test and simulation results for the tested LCD technologies (BFI and 120Hz refresh) are detailed below.
5.1 Black Frame Insertion
The first thing that should be noted about the particular BFI LCD display that we tested is that it did not synchronize to the incoming video signal. This is a requirement for correct time-sequential 3D operation so this particular display would not be able to be used for time-sequential 3D regardless of its other properties. In order to establish whether BFI had any advantages or disadvantages for time-sequential 3D, the monitor was simulated as if it did synchronize. The time-domain response of the BFI LCD is shown in Figure 3. The (BFI) black frames inserted by the display are indicated by the text labels. With this particular monitor the amount of BFI (or more correctly the duty cycle of the black frames) could be adjusted, from its maximum shown in Figure 3 to a minimum of zero (off). The more BFI that was selected, the dimmer the display became.
Figure 2: Schematic diagram of the experimental setup.
Time-sequential 3D video signal
Ch1 Ch2
Lightpen Photodiode
Vertical S
ync
Media PC (VGA output) Oscilloscope (CRO)
LCD TV
SPIE-IS&T/ Vol. 7237 72370N-4
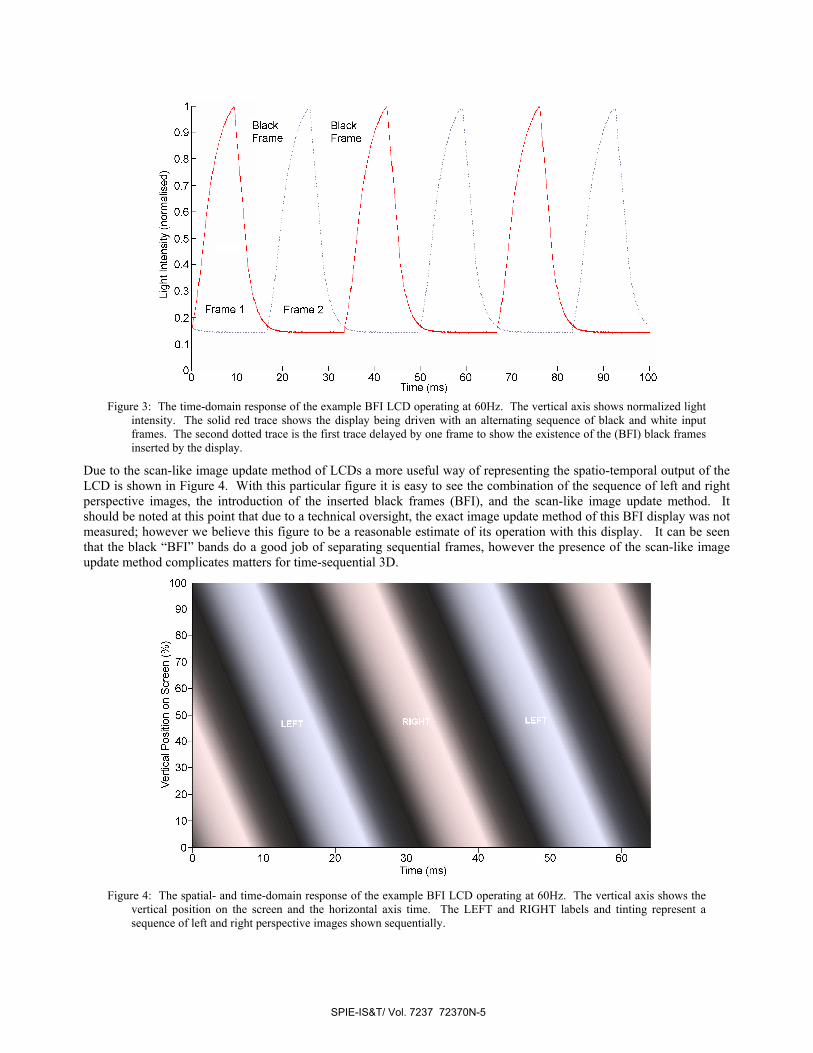
I0 I I
0 10 20 30 40 50 60Time (ms)
20-
10-
rtic
aI P
ositi
on o
n S
cree
n (%
)()
401
0)0)
(00)
oo
o0
00
00
I
:..me1\Frame2
./\
0 10 20 30 40 50 60 70 80 90 100Time (ms)
0.9
0.8
-o0.7
0.6
0.5Cl)Ca)E 0.4-C
0.3
Black BlackFrame Frame
Figure 3: The time-domain response of the example BFI LCD operating at 60Hz. The vertical axis shows normalized light intensity. The solid red trace shows the display being driven with an alternating sequence of black and white input frames. The second dotted trace is the first trace delayed by one frame to show the existence of the (BFI) black frames inserted by the display.
Due to the scan-like image update method of LCDs a more useful way of representing the spatio-temporal output of the LCD is shown in Figure 4. With this particular figure it is easy to see the combination of the sequence of left and right perspective images, the introduction of the inserted black frames (BFI), and the scan-like image update method. It should be noted at this point that due to a technical oversight, the exact image update method of this BFI display was not measured; however we believe this figure to be a reasonable estimate of its operation with this display. It can be seen that the black “BFI” bands do a good job of separating sequential frames, however the presence of the scan-like image update method complicates matters for time-sequential 3D.
Figure 4: The spatial- and time-domain response of the example BFI LCD operating at 60Hz. The vertical axis shows the
vertical position on the screen and the horizontal axis time. The LEFT and RIGHT labels and tinting represent a sequence of left and right perspective images shown sequentially.
SPIE-IS&T/ Vol. 7237 72370N-5
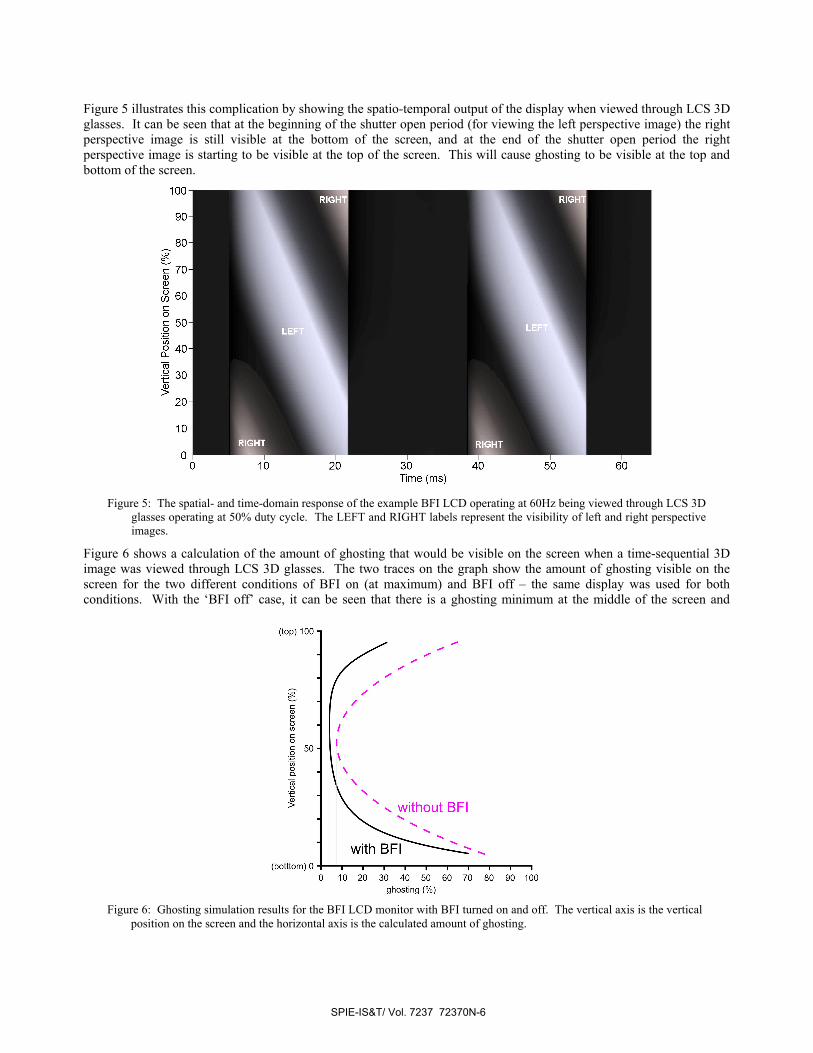
()00Cs0
(botttom) 0
.. without BFI
with BFI
0 10 20 30 40 50 60 70 80 90 100
ghosting (%)
ition
on
scre
en (
%)
01
0 0
Figure 5 illustrates this complication by showing the spatio-temporal output of the display when viewed through LCS 3D glasses. It can be seen that at the beginning of the shutter open period (for viewing the left perspective image) the right perspective image is still visible at the bottom of the screen, and at the end of the shutter open period the right perspective image is starting to be visible at the top of the screen. This will cause ghosting to be visible at the top and bottom of the screen.
Figure 5: The spatial- and time-domain response of the example BFI LCD operating at 60Hz being viewed through LCS 3D
glasses operating at 50% duty cycle. The LEFT and RIGHT labels represent the visibility of left and right perspective images.
Figure 6 shows a calculation of the amount of ghosting that would be visible on the screen when a time-sequential 3D image was viewed through LCS 3D glasses. The two traces on the graph show the amount of ghosting visible on the screen for the two different conditions of BFI on (at maximum) and BFI off – the same display was used for both conditions. With the ‘BFI off’ case, it can be seen that there is a ghosting minimum at the middle of the screen and
Figure 6: Ghosting simulation results for the BFI LCD monitor with BFI turned on and off. The vertical axis is the vertical
position on the screen and the horizontal axis is the calculated amount of ghosting.
SPIE-IS&T/ Vol. 7237 72370N-6
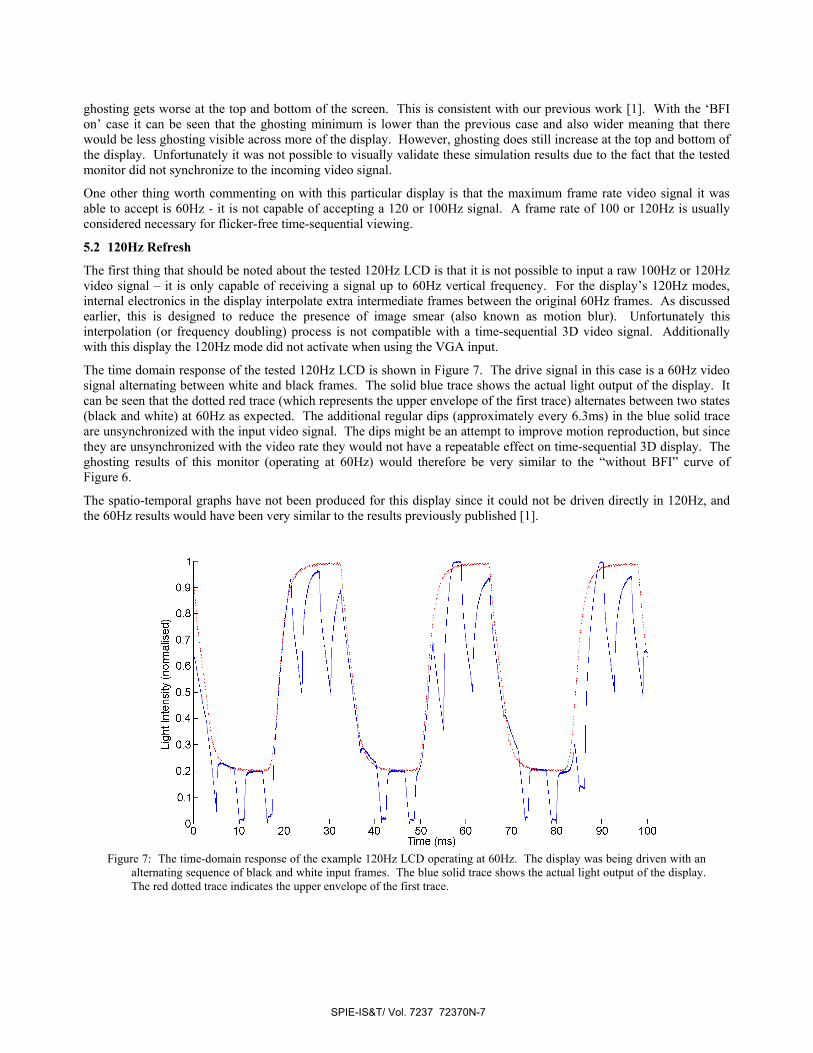
I I ir20 30 40 50 60
Time (ms)
I FI
70 80 90 100
0.2
0.1
010
Ligh
t Int
ensi
ty (
norm
alis
ed)
pp p
pp
pp
()4
010)
0)(0
ghosting gets worse at the top and bottom of the screen. This is consistent with our previous work [1]. With the ‘BFI on’ case it can be seen that the ghosting minimum is lower than the previous case and also wider meaning that there would be less ghosting visible across more of the display. However, ghosting does still increase at the top and bottom of the display. Unfortunately it was not possible to visually validate these simulation results due to the fact that the tested monitor did not synchronize to the incoming video signal.
One other thing worth commenting on with this particular display is that the maximum frame rate video signal it was able to accept is 60Hz - it is not capable of accepting a 120 or 100Hz signal. A frame rate of 100 or 120Hz is usually considered necessary for flicker-free time-sequential viewing.
5.2 120Hz Refresh
The first thing that should be noted about the tested 120Hz LCD is that it is not possible to input a raw 100Hz or 120Hz video signal – it is only capable of receiving a signal up to 60Hz vertical frequency. For the display’s 120Hz modes, internal electronics in the display interpolate extra intermediate frames between the original 60Hz frames. As discussed earlier, this is designed to reduce the presence of image smear (also known as motion blur). Unfortunately this interpolation (or frequency doubling) process is not compatible with a time-sequential 3D video signal. Additionally with this display the 120Hz mode did not activate when using the VGA input.
The time domain response of the tested 120Hz LCD is shown in Figure 7. The drive signal in this case is a 60Hz video signal alternating between white and black frames. The solid blue trace shows the actual light output of the display. It can be seen that the dotted red trace (which represents the upper envelope of the first trace) alternates between two states (black and white) at 60Hz as expected. The additional regular dips (approximately every 6.3ms) in the blue solid trace are unsynchronized with the input video signal. The dips might be an attempt to improve motion reproduction, but since they are unsynchronized with the video rate they would not have a repeatable effect on time-sequential 3D display. The ghosting results of this monitor (operating at 60Hz) would therefore be very similar to the “without BFI” curve of Figure 6.
The spatio-temporal graphs have not been produced for this display since it could not be driven directly in 120Hz, and the 60Hz results would have been very similar to the results previously published [1].
Figure 7: The time-domain response of the example 120Hz LCD operating at 60Hz. The display was being driven with an
alternating sequence of black and white input frames. The blue solid trace shows the actual light output of the display. The red dotted trace indicates the upper envelope of the first trace.
SPIE-IS&T/ Vol. 7237 72370N-7
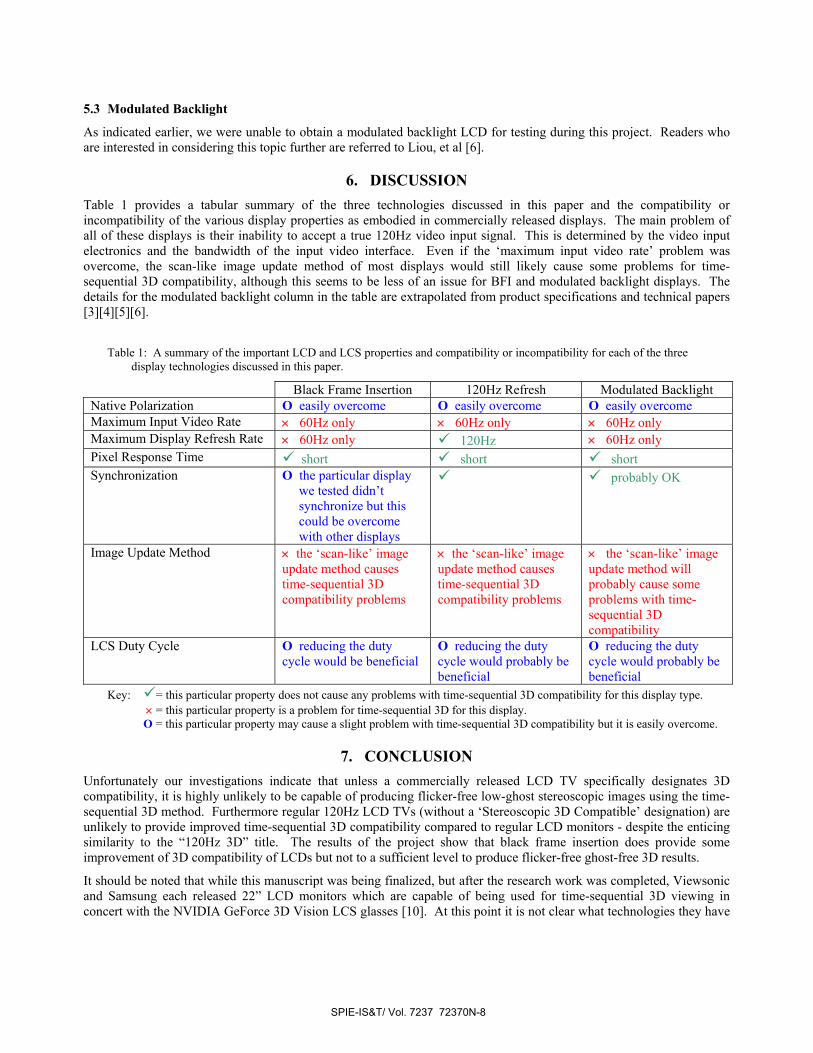
5.3 Modulated Backlight
As indicated earlier, we were unable to obtain a modulated backlight LCD for testing during this project. Readers who are interested in considering this topic further are referred to Liou, et al [6].
6. DISCUSSION Table 1 provides a tabular summary of the three technologies discussed in this paper and the compatibility or incompatibility of the various display properties as embodied in commercially released displays. The main problem of all of these displays is their inability to accept a true 120Hz video input signal. This is determined by the video input electronics and the bandwidth of the input video interface. Even if the ‘maximum input video rate’ problem was overcome, the scan-like image update method of most displays would still likely cause some problems for time-sequential 3D compatibility, although this seems to be less of an issue for BFI and modulated backlight displays. The details for the modulated backlight column in the table are extrapolated from product specifications and technical papers [3][4][5][6].
Table 1: A summary of the important LCD and LCS properties and compatibility or incompatibility for each of the three
display technologies discussed in this paper.
Black Frame Insertion 120Hz Refresh Modulated Backlight Native Polarization O easily overcome O easily overcome O easily overcome Maximum Input Video Rate × 60Hz only × 60Hz only × 60Hz only Maximum Display Refresh Rate × 60Hz only 120Hz × 60Hz only Pixel Response Time short short short Synchronization O the particular display
we tested didn’t synchronize but this could be overcome with other displays
probably OK
Image Update Method × the ‘scan-like’ image update method causes time-sequential 3D compatibility problems
× the ‘scan-like’ image update method causes time-sequential 3D compatibility problems
× the ‘scan-like’ image update method will probably cause some problems with time-sequential 3D compatibility
LCS Duty Cycle O reducing the duty cycle would be beneficial
O reducing the duty cycle would probably be beneficial
O reducing the duty cycle would probably be beneficial
Key: = this particular property does not cause any problems with time-sequential 3D compatibility for this display type. × = this particular property is a problem for time-sequential 3D for this display. O = this particular property may cause a slight problem with time-sequential 3D compatibility but it is easily overcome.
7. CONCLUSION Unfortunately our investigations indicate that unless a commercially released LCD TV specifically designates 3D compatibility, it is highly unlikely to be capable of producing flicker-free low-ghost stereoscopic images using the time-sequential 3D method. Furthermore regular 120Hz LCD TVs (without a ‘Stereoscopic 3D Compatible’ designation) are unlikely to provide improved time-sequential 3D compatibility compared to regular LCD monitors - despite the enticing similarity to the “120Hz 3D” title. The results of the project show that black frame insertion does provide some improvement of 3D compatibility of LCDs but not to a sufficient level to produce flicker-free ghost-free 3D results.
It should be noted that while this manuscript was being finalized, but after the research work was completed, Viewsonic and Samsung each released 22” LCD monitors which are capable of being used for time-sequential 3D viewing in concert with the NVIDIA GeForce 3D Vision LCS glasses [10]. At this point it is not clear what technologies they have
SPIE-IS&T/ Vol. 7237 72370N-8
implemented to achieve 120Hz time-sequential 3D, however they have certainly increased the maximum input video rate to 120Hz and implemented some other modifications from conventional LCD technology.
It is hoped that more LCDs will be released with stereoscopic 3D compatibility – which will be achieved by addressing the limitations discussed in this paper.
8. ACKNOWLEDGEMENTS We wish to thank Stuart Parker at BenQ Australia and Con Parente at West Coast HiFi (O’Connor, Western Australia) who provided access to LCDs for testing during this project. We also wish to thank iVEC (the hub of advanced computing in Western Australia) and Jumbo Vision International for their financial and in-kind support of the project.
REFERENCES
[1] Woods, A.J. and Yuen, K.-L., "Compatibility of LCD Monitors with Frame-Sequential Stereoscopic 3D Visualisation" (Invited Paper), in IMID/IDMC '06 Digest, (The 6th International Meeting on Information Display, and The 5th International Display Manufacturing Conference), pg 98-102, Daegu, South Korea (2006). http://www.cmst.curtin.edu.au/publicat/2006-30.pdf
[2] Woods, A. J. and Karvinen, K. S., "The compatibility of consumer plasma displays with time-sequential stereoscopic 3D visualization" in Stereoscopic Displays and Applications XIX, Proceedings of SPIE Vol. 6803, SPIE, Bellingham, WA, USA (2008). http://www.cmst.curtin.edu.au/publicat/2008-01_3d-plasma_woods_karvinen.pdf
[3] Pan, H., Feng, X.-F. and Daly, S., “LCD motion blur modelling and analysis”, in IEEE International Conference on Image Processing (ICIP 2005), Vol. 2, pp 21-24, (2005).
[4] Sluyterman, A. A. S. and Boonekamp, E. P., "Architectural Choices in a Scanning Backlight for Large LCD TVs", in SID 05 Digest, pg 996- (2005)
[5] Hung, H.-C. , and Shih, C.-W., "Improvement in Moving Picture Quality Using Scanning Backlight System", in Proceedings of the International Display Manufacturing Conference (IDMC'05), Taipei, Taiwan (2005).
[6] Liou, J.-C., Lee, K., Tseng, F.-G., Huang, J.-F., Yen, W.-T. and Hsu, W.-L., “Shutter Glasses Stereo LCD with a Dynamic Backlight”, in Stereoscopic Displays and Applications XX, Proceedings of Electronic Imaging Vol. 7237, SPIE, Bellingham, WA, USA (2009) (in press).
[7] “Philips ditches Aptura backlight tech for LED”, PC PRO, 13 March 2007, http://www.pcpro.co.uk/news/107108/philips-ditches-aptura-backlight-tech-for-led.html
[8] NVIDIA 3D Stereo Driver http://www.nvidia.com/object/3d_stereo.html (accessed 22 December 2008) [9] Powerstrip software http://entechtaiwan.net/util/ps.shtm (accessed 22 December 2008) [10] “Nvidia Geforce 3D Vision Review”, OverClockersClub, 7 January 2009,
http://www.overclockersclub.com/reviews/nvidia_3d_vision/
SPIE-IS&T/ Vol. 7237 72370N-9

Paper 8 [Refereed Conference Paper]
A. J. Woods, C. R. Harris (2010) “Comparing levels of crosstalk with red/cyan, blue/yellow, and green/magenta anaglyph 3D glasses” in Stereoscopic Displays and Applications XXI, Proceedings of IS&T/SPIE Electronic Imaging, SPIE Vol. 7253, pp. 75240Q‐1 to ‐12, San Jose, California, January 2010.
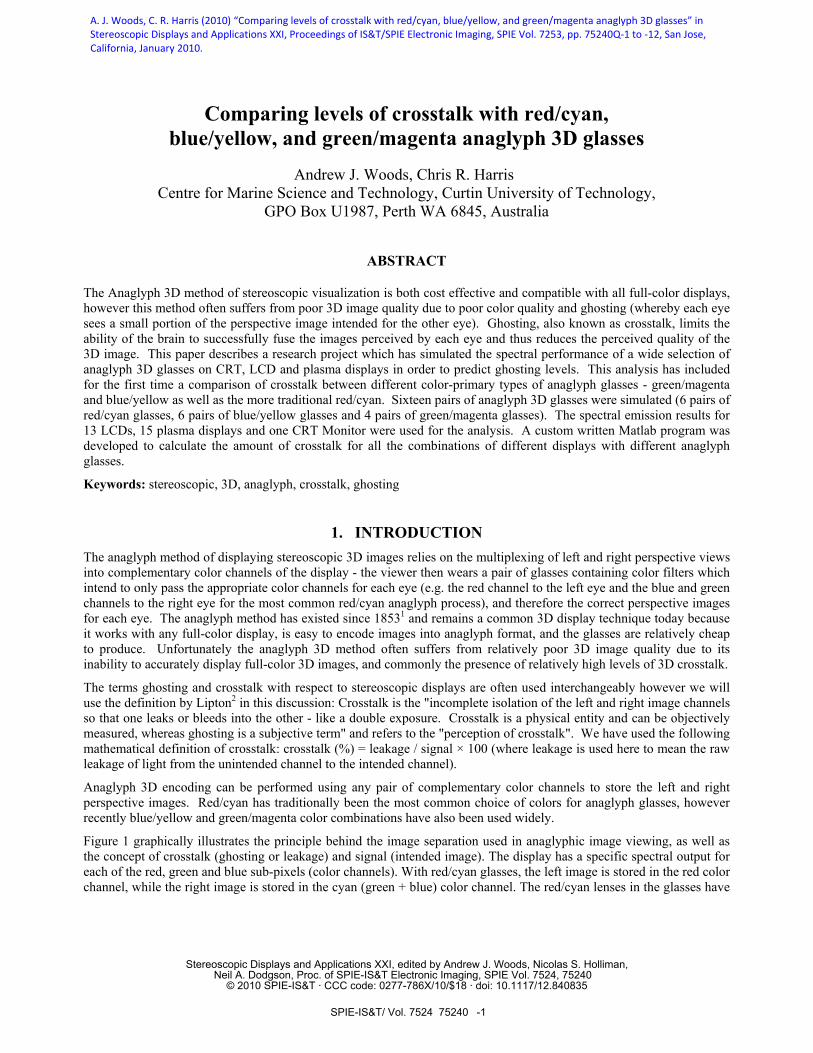
Comparing levels of crosstalk with red/cyan, blue/yellow, and green/magenta anaglyph 3D glasses
Andrew J. Woods, Chris R. Harris
Centre for Marine Science and Technology, Curtin University of Technology, GPO Box U1987, Perth WA 6845, Australia
ABSTRACT
The Anaglyph 3D method of stereoscopic visualization is both cost effective and compatible with all full-color displays, however this method often suffers from poor 3D image quality due to poor color quality and ghosting (whereby each eye sees a small portion of the perspective image intended for the other eye). Ghosting, also known as crosstalk, limits the ability of the brain to successfully fuse the images perceived by each eye and thus reduces the perceived quality of the 3D image. This paper describes a research project which has simulated the spectral performance of a wide selection of anaglyph 3D glasses on CRT, LCD and plasma displays in order to predict ghosting levels. This analysis has included for the first time a comparison of crosstalk between different color-primary types of anaglyph glasses - green/magenta and blue/yellow as well as the more traditional red/cyan. Sixteen pairs of anaglyph 3D glasses were simulated (6 pairs of red/cyan glasses, 6 pairs of blue/yellow glasses and 4 pairs of green/magenta glasses). The spectral emission results for 13 LCDs, 15 plasma displays and one CRT Monitor were used for the analysis. A custom written Matlab program was developed to calculate the amount of crosstalk for all the combinations of different displays with different anaglyph glasses.
Keywords: stereoscopic, 3D, anaglyph, crosstalk, ghosting
1. INTRODUCTION The anaglyph method of displaying stereoscopic 3D images relies on the multiplexing of left and right perspective views into complementary color channels of the display - the viewer then wears a pair of glasses containing color filters which intend to only pass the appropriate color channels for each eye (e.g. the red channel to the left eye and the blue and green channels to the right eye for the most common red/cyan anaglyph process), and therefore the correct perspective images for each eye. The anaglyph method has existed since 18531 and remains a common 3D display technique today because it works with any full-color display, is easy to encode images into anaglyph format, and the glasses are relatively cheap to produce. Unfortunately the anaglyph 3D method often suffers from relatively poor 3D image quality due to its inability to accurately display full-color 3D images, and commonly the presence of relatively high levels of 3D crosstalk.
The terms ghosting and crosstalk with respect to stereoscopic displays are often used interchangeably however we will use the definition by Lipton2 in this discussion: Crosstalk is the "incomplete isolation of the left and right image channels so that one leaks or bleeds into the other - like a double exposure. Crosstalk is a physical entity and can be objectively measured, whereas ghosting is a subjective term" and refers to the "perception of crosstalk". We have used the following mathematical definition of crosstalk: crosstalk (%) = leakage / signal × 100 (where leakage is used here to mean the raw leakage of light from the unintended channel to the intended channel).
Anaglyph 3D encoding can be performed using any pair of complementary color channels to store the left and right perspective images. Red/cyan has traditionally been the most common choice of colors for anaglyph glasses, however recently blue/yellow and green/magenta color combinations have also been used widely.
Figure 1 graphically illustrates the principle behind the image separation used in anaglyphic image viewing, as well as the concept of crosstalk (ghosting or leakage) and signal (intended image). The display has a specific spectral output for each of the red, green and blue sub-pixels (color channels). With red/cyan glasses, the left image is stored in the red color channel, while the right image is stored in the cyan (green + blue) color channel. The red/cyan lenses in the glasses have
Stereoscopic Displays and Applications XXI, edited by Andrew J. Woods, Nicolas S. Holliman,Neil A. Dodgson, Proc. of SPIE-IS&T Electronic Imaging, SPIE Vol. 7524, 75240Q
© 2010 SPIE-IS&T · CCC code: 0277-786X/10/$18 · doi: 10.1117/12.840835
SPIE-IS&T/ Vol. 7524 75240Q-1
A. J. Woods, C. R. Harris (2010) “Comparing levels of crosstalk with red/cyan, blue/yellow, and green/magenta anaglyph 3D glasses” in Stereoscopic Displays and Applications XXI, Proceedings of IS&T/SPIE Electronic Imaging, SPIE Vol. 7253, pp. 75240Q‐1 to ‐12, San Jose, California, January 2010.
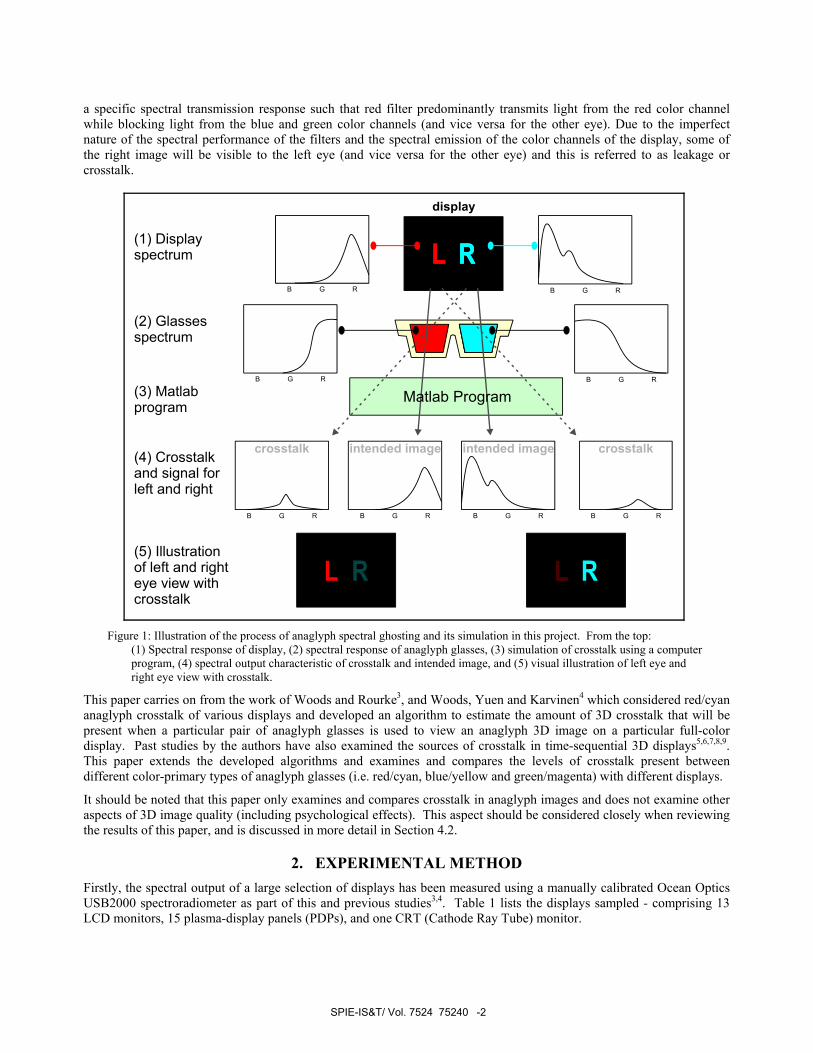
a specific spectral transmission response such that red filter predominantly transmits light from the red color channel while blocking light from the blue and green color channels (and vice versa for the other eye). Due to the imperfect nature of the spectral performance of the filters and the spectral emission of the color channels of the display, some of the right image will be visible to the left eye (and vice versa for the other eye) and this is referred to as leakage or crosstalk.
L RL RL R
L R L R
Matlab Program
crosstalk crosstalkintended image intended image(4) Crosstalk and signal forleft and right
(2) Glassesspectrum
(1) Displayspectrum
(3) Matlabprogram
(5) Illustrationof left and righteye view withcrosstalk
B G R
B G R
B G R
B G R
B G R
B G RB G RB G R
display
Figure 1: Illustration of the process of anaglyph spectral ghosting and its simulation in this project. From the top:
(1) Spectral response of display, (2) spectral response of anaglyph glasses, (3) simulation of crosstalk using a computer program, (4) spectral output characteristic of crosstalk and intended image, and (5) visual illustration of left eye and right eye view with crosstalk.
This paper carries on from the work of Woods and Rourke3, and Woods, Yuen and Karvinen4 which considered red/cyan anaglyph crosstalk of various displays and developed an algorithm to estimate the amount of 3D crosstalk that will be present when a particular pair of anaglyph glasses is used to view an anaglyph 3D image on a particular full-color display. Past studies by the authors have also examined the sources of crosstalk in time-sequential 3D displays5,6,7,8,9. This paper extends the developed algorithms and examines and compares the levels of crosstalk present between different color-primary types of anaglyph glasses (i.e. red/cyan, blue/yellow and green/magenta) with different displays.
It should be noted that this paper only examines and compares crosstalk in anaglyph images and does not examine other aspects of 3D image quality (including psychological effects). This aspect should be considered closely when reviewing the results of this paper, and is discussed in more detail in Section 4.2.
2. EXPERIMENTAL METHOD Firstly, the spectral output of a large selection of displays has been measured using a manually calibrated Ocean Optics USB2000 spectroradiometer as part of this and previous studies3,4. Table 1 lists the displays sampled - comprising 13 LCD monitors, 15 plasma-display panels (PDPs), and one CRT (Cathode Ray Tube) monitor.
SPIE-IS&T/ Vol. 7524 75240Q-2
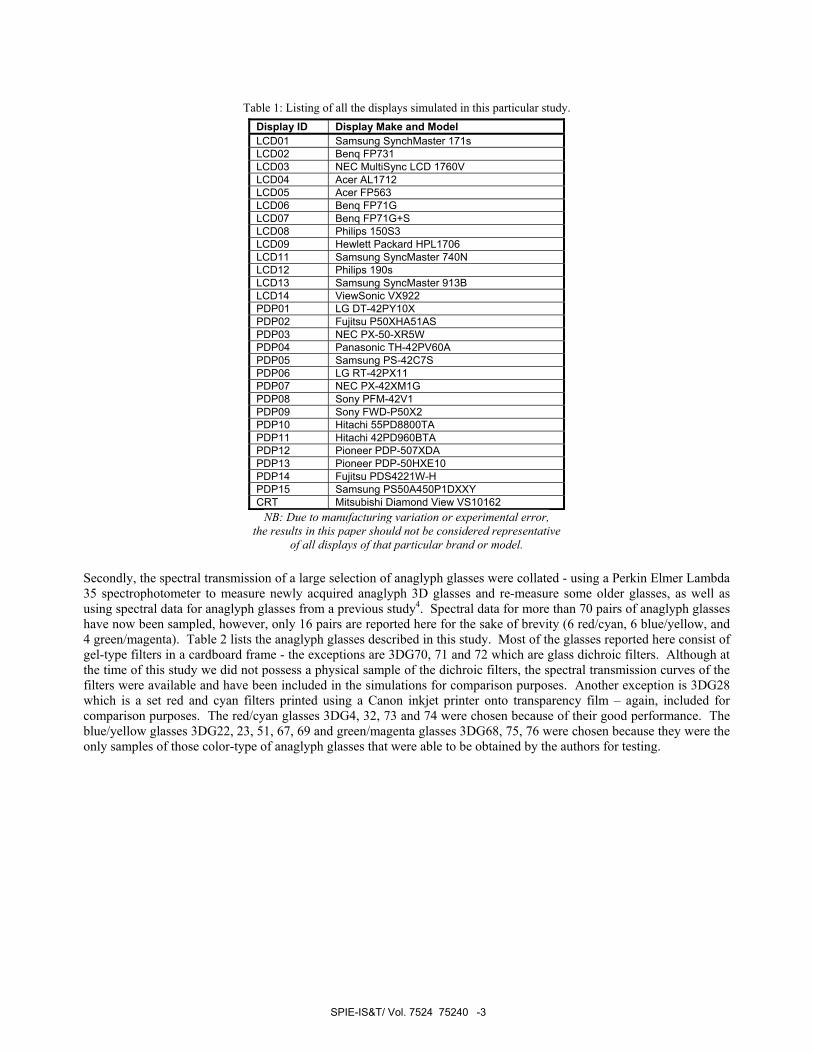
Table 1: Listing of all the displays simulated in this particular study. Display ID Display Make and Model LCD01 Samsung SynchMaster 171s LCD02 Benq FP731 LCD03 NEC MultiSync LCD 1760V LCD04 Acer AL1712 LCD05 Acer FP563 LCD06 Benq FP71G LCD07 Benq FP71G+S LCD08 Philips 150S3 LCD09 Hewlett Packard HPL1706 LCD11 Samsung SyncMaster 740N LCD12 Philips 190s LCD13 Samsung SyncMaster 913B LCD14 ViewSonic VX922 PDP01 LG DT-42PY10X PDP02 Fujitsu P50XHA51AS PDP03 NEC PX-50-XR5W PDP04 Panasonic TH-42PV60A PDP05 Samsung PS-42C7S PDP06 LG RT-42PX11 PDP07 NEC PX-42XM1G PDP08 Sony PFM-42V1 PDP09 Sony FWD-P50X2 PDP10 Hitachi 55PD8800TA PDP11 Hitachi 42PD960BTA PDP12 Pioneer PDP-507XDA PDP13 Pioneer PDP-50HXE10 PDP14 Fujitsu PDS4221W-H PDP15 Samsung PS50A450P1DXXY CRT Mitsubishi Diamond View VS10162
NB: Due to manufacturing variation or experimental error, the results in this paper should not be considered representative
of all displays of that particular brand or model.
Secondly, the spectral transmission of a large selection of anaglyph glasses were collated - using a Perkin Elmer Lambda 35 spectrophotometer to measure newly acquired anaglyph 3D glasses and re-measure some older glasses, as well as using spectral data for anaglyph glasses from a previous study4. Spectral data for more than 70 pairs of anaglyph glasses have now been sampled, however, only 16 pairs are reported here for the sake of brevity (6 red/cyan, 6 blue/yellow, and 4 green/magenta). Table 2 lists the anaglyph glasses described in this study. Most of the glasses reported here consist of gel-type filters in a cardboard frame - the exceptions are 3DG70, 71 and 72 which are glass dichroic filters. Although at the time of this study we did not possess a physical sample of the dichroic filters, the spectral transmission curves of the filters were available and have been included in the simulations for comparison purposes. Another exception is 3DG28 which is a set red and cyan filters printed using a Canon inkjet printer onto transparency film – again, included for comparison purposes. The red/cyan glasses 3DG4, 32, 73 and 74 were chosen because of their good performance. The blue/yellow glasses 3DG22, 23, 51, 67, 69 and green/magenta glasses 3DG68, 75, 76 were chosen because they were the only samples of those color-type of anaglyph glasses that were able to be obtained by the authors for testing.
SPIE-IS&T/ Vol. 7524 75240Q-3
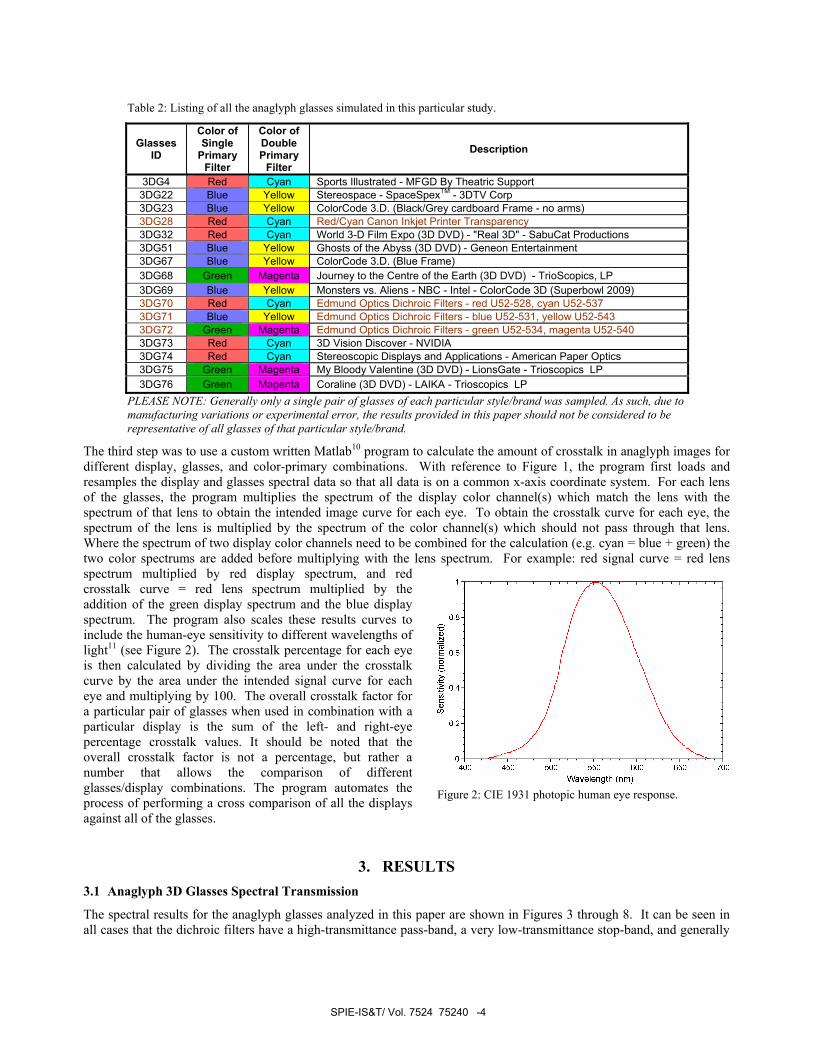
The third step was to use a custom written Matlab10 program to calculate the amount of crosstalk in anaglyph images for different display, glasses, and color-primary combinations. With reference to Figure 1, the program first loads and resamples the display and glasses spectral data so that all data is on a common x-axis coordinate system. For each lens of the glasses, the program multiplies the spectrum of the display color channel(s) which match the lens with the spectrum of that lens to obtain the intended image curve for each eye. To obtain the crosstalk curve for each eye, the spectrum of the lens is multiplied by the spectrum of the color channel(s) which should not pass through that lens. Where the spectrum of two display color channels need to be combined for the calculation (e.g. cyan = blue + green) the two color spectrums are added before multiplying with the lens spectrum. For example: red signal curve = red lens spectrum multiplied by red display spectrum, and red crosstalk curve = red lens spectrum multiplied by the addition of the green display spectrum and the blue display spectrum. The program also scales these results curves to include the human-eye sensitivity to different wavelengths of light11 (see Figure 2). The crosstalk percentage for each eye is then calculated by dividing the area under the crosstalk curve by the area under the intended signal curve for each eye and multiplying by 100. The overall crosstalk factor for a particular pair of glasses when used in combination with a particular display is the sum of the left- and right-eye percentage crosstalk values. It should be noted that the overall crosstalk factor is not a percentage, but rather a number that allows the comparison of different glasses/display combinations. The program automates the process of performing a cross comparison of all the displays against all of the glasses.
3. RESULTS 3.1 Anaglyph 3D Glasses Spectral Transmission
The spectral results for the anaglyph glasses analyzed in this paper are shown in Figures 3 through 8. It can be seen in all cases that the dichroic filters have a high-transmittance pass-band, a very low-transmittance stop-band, and generally
Figure 2: CIE 1931 photopic human eye response.
Table 2: Listing of all the anaglyph glasses simulated in this particular study.
Glasses ID
Color of Single
Primary Filter
Color of Double Primary
Filter Description
3DG4 Red Cyan Sports Illustrated - MFGD By Theatric Support 3DG22 Blue Yellow Stereospace - SpaceSpexTM - 3DTV Corp 3DG23 Blue Yellow ColorCode 3.D. (Black/Grey cardboard Frame - no arms) 3DG28 Red Cyan Red/Cyan Canon Inkjet Printer Transparency 3DG32 Red Cyan World 3-D Film Expo (3D DVD) - "Real 3D" - SabuCat Productions 3DG51 Blue Yellow Ghosts of the Abyss (3D DVD) - Geneon Entertainment 3DG67 Blue Yellow ColorCode 3.D. (Blue Frame) 3DG68 Green Magenta Journey to the Centre of the Earth (3D DVD) - TrioScopics, LP 3DG69 Blue Yellow Monsters vs. Aliens - NBC - Intel - ColorCode 3D (Superbowl 2009) 3DG70 Red Cyan Edmund Optics Dichroic Filters - red U52-528, cyan U52-537 3DG71 Blue Yellow Edmund Optics Dichroic Filters - blue U52-531, yellow U52-543 3DG72 Green Magenta Edmund Optics Dichroic Filters - green U52-534, magenta U52-540 3DG73 Red Cyan 3D Vision Discover - NVIDIA 3DG74 Red Cyan Stereoscopic Displays and Applications - American Paper Optics 3DG75 Green Magenta My Bloody Valentine (3D DVD) - LionsGate - Trioscopics LP 3DG76 Green Magenta Coraline (3D DVD) - LAIKA - Trioscopics LP
PLEASE NOTE: Generally only a single pair of glasses of each particular style/brand was sampled. As such, due to manufacturing variations or experimental error, the results provided in this paper should not be considered to be representative of all glasses of that particular style/brand.
SPIE-IS&T/ Vol. 7524 75240Q-4

a very sharp transition. It can be seen that the inkjet filters in Figures 3 and 4 have very poor performance in the stop band which will negatively affect their use as anaglyph filters considerably. The remaining curves in Figures 3 through 8 are gel-filters and although there is some clustering, it can be seen that can be a lot of variation between individual filters.
0
0.1
0.2
0.3
0.4
0.5
0.6
0.7
0.8
0.9
1
400 450 500 550 600 650 700
Wavelength (nm)
Tran
smis
sion
Fac
tor
3DG4
3DG28
3DG32
3DG70
3DG73
3DG74
inkjet print
dichroic
0
0.1
0.2
0.3
0.4
0.5
0.6
0.7
0.8
0.9
1
400 450 500 550 600 650 700
Wavelength (nm)
Tran
smis
sion
Fac
tor
3DG43DG28
3DG323DG703DG73
3DG74
inkjet print
dichroic
Figure 3 - Spectral transmission of the red filters.α Figure 4 - Spectral transmission of the cyan filters.
0
0.1
0.2
0.3
0.4
0.5
0.6
0.7
0.8
0.9
1
400 450 500 550 600 650 700
Wavelength (nm)
Tran
smis
sion
Fac
tor
3DG68
3DG72
3DG75
3DG76
dichroic
0
0.1
0.2
0.3
0.4
0.5
0.6
0.7
0.8
0.9
1
400 450 500 550 600 650 700
Wavelength(nm)
Tran
smis
sion
Fac
tor
3DG68
3DG72
3DG75
3DG76
dichroi c
Figure 5 - Spectral transmission of the green filters. Figure 6 - Spectral transmission of the magenta filters.
0
0.1
0.2
0.3
0.4
0.5
0.6
0.7
0.8
0.9
1
400 450 500 550 600 650 700
Wavelength (nm)
Tran
smis
sion
Fac
tor
3DG223DG233DG513DG67
3DG693DG71
dichroic
0
0.1
0.2
0.3
0.4
0.5
0.6
0.7
0.8
0.9
1
400 450 500 550 600 650 700
Wavelength (nm)
Tran
smis
sion
Fac
tor
3DG223DG233DG513DG673DG693DG71
dichroic
Figure 7 - Spectral transmission of the blue filters. Figure 8 - Spectral transmission of the yellow filters.
α The legends and colors of some of the figures and tables in this paper won't be distinguishable when printed in black and white.
A color version of the figures and tables is available from the primary author's website.
SPIE-IS&T/ Vol. 7524 75240Q-5
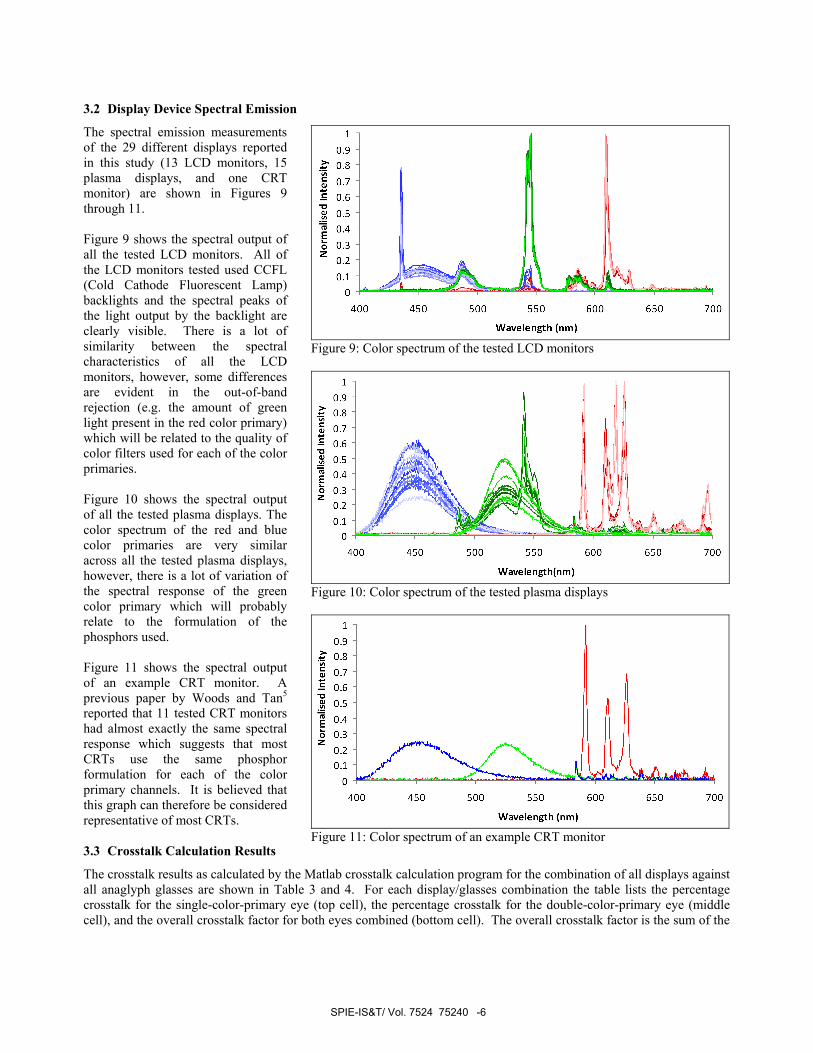
3.2 Display Device Spectral Emission
The spectral emission measurements of the 29 different displays reported in this study (13 LCD monitors, 15 plasma displays, and one CRT monitor) are shown in Figures 9 through 11. Figure 9 shows the spectral output of all the tested LCD monitors. All of the LCD monitors tested used CCFL (Cold Cathode Fluorescent Lamp) backlights and the spectral peaks of the light output by the backlight are clearly visible. There is a lot of similarity between the spectral characteristics of all the LCD monitors, however, some differences are evident in the out-of-band rejection (e.g. the amount of green light present in the red color primary) which will be related to the quality of color filters used for each of the color primaries. Figure 10 shows the spectral output of all the tested plasma displays. The color spectrum of the red and blue color primaries are very similar across all the tested plasma displays, however, there is a lot of variation of the spectral response of the green color primary which will probably relate to the formulation of the phosphors used. Figure 11 shows the spectral output of an example CRT monitor. A previous paper by Woods and Tan5 reported that 11 tested CRT monitors had almost exactly the same spectral response which suggests that most CRTs use the same phosphor formulation for each of the color primary channels. It is believed that this graph can therefore be considered representative of most CRTs. 3.3 Crosstalk Calculation Results
The crosstalk results as calculated by the Matlab crosstalk calculation program for the combination of all displays against all anaglyph glasses are shown in Table 3 and 4. For each display/glasses combination the table lists the percentage crosstalk for the single-color-primary eye (top cell), the percentage crosstalk for the double-color-primary eye (middle cell), and the overall crosstalk factor for both eyes combined (bottom cell). The overall crosstalk factor is the sum of the
Figure 9: Color spectrum of the tested LCD monitors
Figure 10: Color spectrum of the tested plasma displays
Figure 11: Color spectrum of an example CRT monitor
SPIE-IS&T/ Vol. 7524 75240Q-6
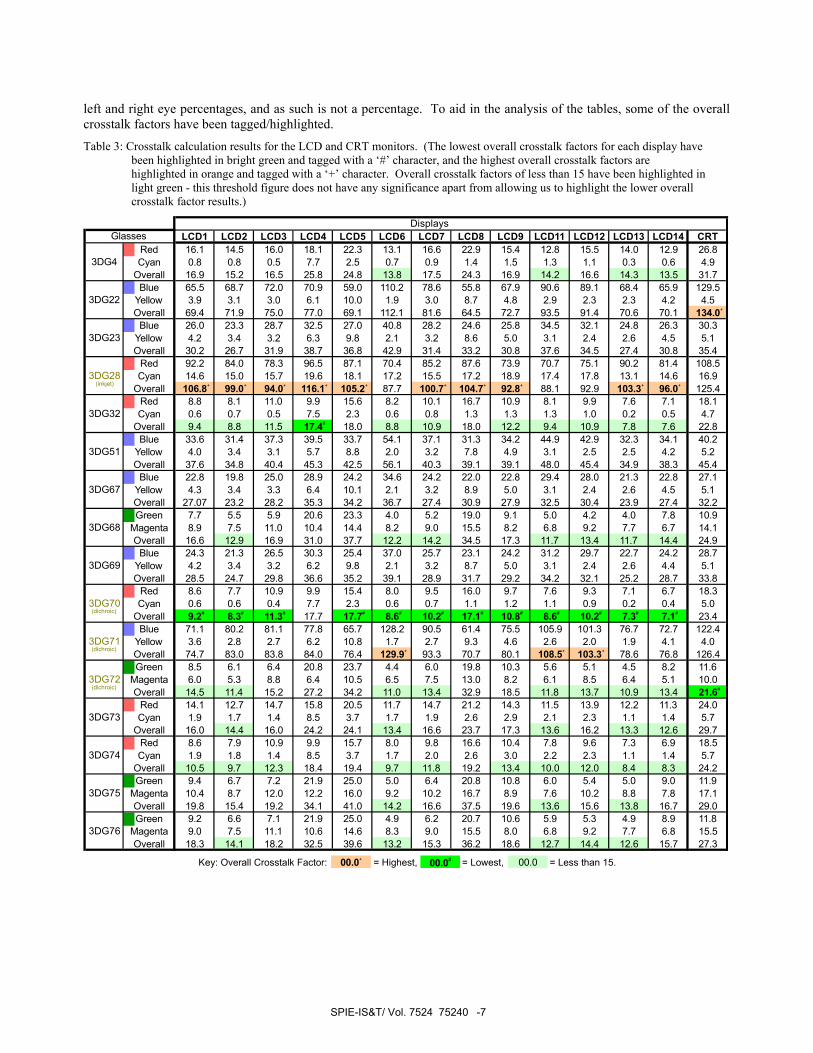
left and right eye percentages, and as such is not a percentage. To aid in the analysis of the tables, some of the overall crosstalk factors have been tagged/highlighted.
Table 3: Crosstalk calculation results for the LCD and CRT monitors. (The lowest overall crosstalk factors for each display have been highlighted in bright green and tagged with a ‘#’ character, and the highest overall crosstalk factors are highlighted in orange and tagged with a ‘+’ character. Overall crosstalk factors of less than 15 have been highlighted in light green - this threshold figure does not have any significance apart from allowing us to highlight the lower overall crosstalk factor results.)
LCD1 LCD2 LCD3 LCD4 LCD5 LCD6 LCD7 LCD8 LCD9 LCD11 LCD12 LCD13 LCD14 CRT16.1 14.5 16.0 18.1 22.3 13.1 16.6 22.9 15.4 12.8 15.5 14.0 12.9 26.8
3DG4 Cyan 0.8 0.8 0.5 7.7 2.5 0.7 0.9 1.4 1.5 1.3 1.1 0.3 0.6 4.9Overall 16.9 15.2 16.5 25.8 24.8 13.8 17.5 24.3 16.9 14.2 16.6 14.3 13.5 31.7
65.5 68.7 72.0 70.9 59.0 110.2 78.6 55.8 67.9 90.6 89.1 68.4 65.9 129.53DG22 Yellow 3.9 3.1 3.0 6.1 10.0 1.9 3.0 8.7 4.8 2.9 2.3 2.3 4.2 4.5
Overall 69.4 71.9 75.0 77.0 69.1 112.1 81.6 64.5 72.7 93.5 91.4 70.6 70.1 134.0+
26.0 23.3 28.7 32.5 27.0 40.8 28.2 24.6 25.8 34.5 32.1 24.8 26.3 30.33DG23 Yellow 4.2 3.4 3.2 6.3 9.8 2.1 3.2 8.6 5.0 3.1 2.4 2.6 4.5 5.1
Overall 30.2 26.7 31.9 38.7 36.8 42.9 31.4 33.2 30.8 37.6 34.5 27.4 30.8 35.492.2 84.0 78.3 96.5 87.1 70.4 85.2 87.6 73.9 70.7 75.1 90.2 81.4 108.5
3DG28 Cyan 14.6 15.0 15.7 19.6 18.1 17.2 15.5 17.2 18.9 17.4 17.8 13.1 14.6 16.9Overall 106.8+ 99.0+ 94.0+ 116.1+ 105.2+ 87.7 100.7+ 104.7+ 92.8+ 88.1 92.9 103.3+ 96.0+ 125.4
8.8 8.1 11.0 9.9 15.6 8.2 10.1 16.7 10.9 8.1 9.9 7.6 7.1 18.13DG32 Cyan 0.6 0.7 0.5 7.5 2.3 0.6 0.8 1.3 1.3 1.3 1.0 0.2 0.5 4.7
Overall 9.4 8.8 11.5 17.4# 18.0 8.8 10.9 18.0 12.2 9.4 10.9 7.8 7.6 22.833.6 31.4 37.3 39.5 33.7 54.1 37.1 31.3 34.2 44.9 42.9 32.3 34.1 40.2
3DG51 Yellow 4.0 3.4 3.1 5.7 8.8 2.0 3.2 7.8 4.9 3.1 2.5 2.5 4.2 5.2Overall 37.6 34.8 40.4 45.3 42.5 56.1 40.3 39.1 39.1 48.0 45.4 34.9 38.3 45.4
22.8 19.8 25.0 28.9 24.2 34.6 24.2 22.0 22.8 29.4 28.0 21.3 22.8 27.13DG67 Yellow 4.3 3.4 3.3 6.4 10.1 2.1 3.2 8.9 5.0 3.1 2.4 2.6 4.5 5.1
Overall 27.07 23.2 28.2 35.3 34.2 36.7 27.4 30.9 27.9 32.5 30.4 23.9 27.4 32.27.7 5.5 5.9 20.6 23.3 4.0 5.2 19.0 9.1 5.0 4.2 4.0 7.8 10.9
3DG68 Magenta 8.9 7.5 11.0 10.4 14.4 8.2 9.0 15.5 8.2 6.8 9.2 7.7 6.7 14.1Overall 16.6 12.9 16.9 31.0 37.7 12.2 14.2 34.5 17.3 11.7 13.4 11.7 14.4 24.9
24.3 21.3 26.5 30.3 25.4 37.0 25.7 23.1 24.2 31.2 29.7 22.7 24.2 28.73DG69 Yellow 4.2 3.4 3.2 6.2 9.8 2.1 3.2 8.7 5.0 3.1 2.4 2.6 4.4 5.1
Overall 28.5 24.7 29.8 36.6 35.2 39.1 28.9 31.7 29.2 34.2 32.1 25.2 28.7 33.88.6 7.7 10.9 9.9 15.4 8.0 9.5 16.0 9.7 7.6 9.3 7.1 6.7 18.3
3DG70 Cyan 0.6 0.6 0.4 7.7 2.3 0.6 0.7 1.1 1.2 1.1 0.9 0.2 0.4 5.0Overall 9.2# 8.3# 11.3# 17.7 17.7# 8.6# 10.2# 17.1# 10.8# 8.6# 10.2# 7.3# 7.1# 23.4
71.1 80.2 81.1 77.8 65.7 128.2 90.5 61.4 75.5 105.9 101.3 76.7 72.7 122.43DG71 Yellow 3.6 2.8 2.7 6.2 10.8 1.7 2.7 9.3 4.6 2.6 2.0 1.9 4.1 4.0
Overall 74.7 83.0 83.8 84.0 76.4 129.9+ 93.3 70.7 80.1 108.5+ 103.3+ 78.6 76.8 126.48.5 6.1 6.4 20.8 23.7 4.4 6.0 19.8 10.3 5.6 5.1 4.5 8.2 11.6
3DG72 Magenta 6.0 5.3 8.8 6.4 10.5 6.5 7.5 13.0 8.2 6.1 8.5 6.4 5.1 10.0Overall 14.5 11.4 15.2 27.2 34.2 11.0 13.4 32.9 18.5 11.8 13.7 10.9 13.4 21.6#
14.1 12.7 14.7 15.8 20.5 11.7 14.7 21.2 14.3 11.5 13.9 12.2 11.3 24.03DG73 Cyan 1.9 1.7 1.4 8.5 3.7 1.7 1.9 2.6 2.9 2.1 2.3 1.1 1.4 5.7
Overall 16.0 14.4 16.0 24.2 24.1 13.4 16.6 23.7 17.3 13.6 16.2 13.3 12.6 29.78.6 7.9 10.9 9.9 15.7 8.0 9.8 16.6 10.4 7.8 9.6 7.3 6.9 18.5
3DG74 Cyan 1.9 1.8 1.4 8.5 3.7 1.7 2.0 2.6 3.0 2.2 2.3 1.1 1.4 5.7Overall 10.5 9.7 12.3 18.4 19.4 9.7 11.8 19.2 13.4 10.0 12.0 8.4 8.3 24.2
9.4 6.7 7.2 21.9 25.0 5.0 6.4 20.8 10.8 6.0 5.4 5.0 9.0 11.93DG75 Magenta 10.4 8.7 12.0 12.2 16.0 9.2 10.2 16.7 8.9 7.6 10.2 8.8 7.8 17.1
Overall 19.8 15.4 19.2 34.1 41.0 14.2 16.6 37.5 19.6 13.6 15.6 13.8 16.7 29.0
Red
Blue
Blue
Red
Red
Blue
Blue
Green
Blue
Red
Blue
Green
Red
Red
Green
Green 9.2 6.6 7.1 21.9 25.0 4.9 6.2 20.7 10.6 5.9 5.3 4.9 8.9 11.83DG76 Magenta 9.0 7.5 11.1 10.6 14.6 8.3 9.0 15.5 8.0 6.8 9.2 7.7 6.8 15.5
Overall 18.3 14.1 18.2 32.5 39.6 13.2 15.3 36.2 18.6 12.7 14.4 12.6 15.7 27.3
DisplaysGlasses
(inkjet)
(dichroic)
(dichroic)
(dichroic)
Key: Overall Crosstalk Factor: = Highest, = Lowest, = Less than 15.00.0#00.0+ 00.0
SPIE-IS&T/ Vol. 7524 75240Q-7
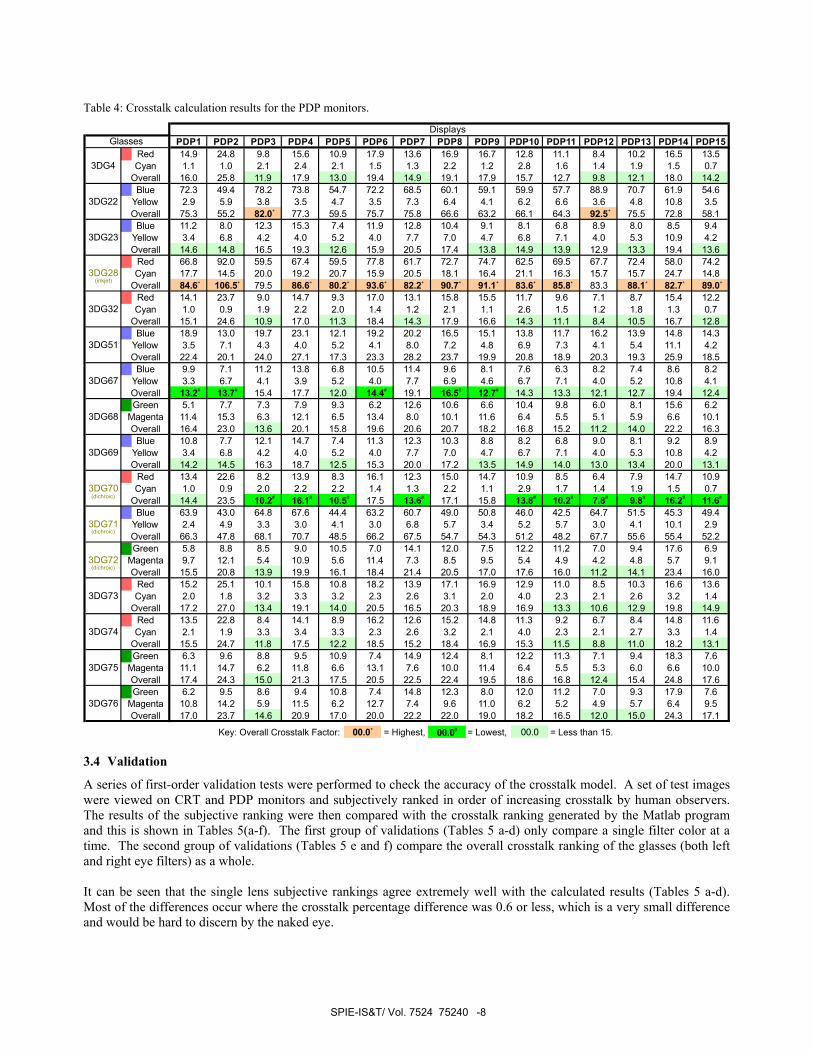
Table 4: Crosstalk calculation results for the PDP monitors.
Key: Overall Crosstalk Factor: = Highest, = Lowest, = Less than 15.
3DG28
PDP1 PDP2 PDP3 PDP4 PDP5 PDP6 PDP7 PDP8 PDP9 PDP10 PDP11 PDP12 PDP13 PDP14 PDP15Red 14.9 24.8 9.8 15.6 10.9 17.9 13.6 16.9 16.7 12.8 11.1 8.4 10.2 16.5 13.5
3DG4 Cyan 1.1 1.0 2.1 2.4 2.1 1.5 1.3 2.2 1.2 2.8 1.6 1.4 1.9 1.5 0.7Overall 16.0 25.8 11.9 17.9 13.0 19.4 14.9 19.1 17.9 15.7 12.7 9.8 12.1 18.0 14.2
Blue 72.3 49.4 78.2 73.8 54.7 72.2 68.5 60.1 59.1 59.9 57.7 88.9 70.7 61.9 54.63DG22 Yellow 2.9 5.9 3.8 3.5 4.7 3.5 7.3 6.4 4.1 6.2 6.6 3.6 4.8 10.8 3.5
Overall 75.3 55.2 82.0+ 77.3 59.5 75.7 75.8 66.6 63.2 66.1 64.3 92.5+ 75.5 72.8 58.1Blue 11.2 8.0 12.3 15.3 7.4 11.9 12.8 10.4 9.1 8.1 6.8 8.9 8.0 8.5 9.4
3DG23 Yellow 3.4 6.8 4.2 4.0 5.2 4.0 7.7 7.0 4.7 6.8 7.1 4.0 5.3 10.9 4.2Overall 14.6 14.8 16.5 19.3 12.6 15.9 20.5 17.4 13.8 14.9 13.9 12.9 13.3 19.4 13.6
Red 66.8 92.0 59.5 67.4 59.5 77.8 61.7 72.7 74.7 62.5 69.5 67.7 72.4 58.0 74.2Cyan 17.7 14.5 20.0 19.2 20.7 15.9 20.5 18.1 16.4 21.1 16.3 15.7 15.7 24.7 14.8
Overall 84.6+ 106.5+ 79.5 86.6+ 80.2+ 93.6+ 82.2+ 90.7+ 91.1+ 83.6+ 85.8+ 83.3 88.1+ 89.0+
Red 14.1 23.7 9.0 14.7 9.3 17.0 13.1 15.8 15.5 11.7 9.6 7.1 8.7 15.4 12.23DG32 Cyan 1.0 0.9 1.9 2.2 2.0 1.4 1.2 2.1 1.1 2.6 1.5 1.2 1.8 1.3 0.7
Overall 15.1 24.6 10.9 17.0 11.3 18.4 14.3 17.9 16.6 14.3 11.1 8.4 10.5 16.7 12.8Blue 18.9 13.0 19.7 23.1 12.1 19.2 20.2 16.5 15.1 13.8 11.7 16.2 13.9 14.8 14.3
3DG51 Yellow 3.5 7.1 4.3 4.0 5.2 4.1 8.0 7.2 4.8 6.9 7.3 4.1 5.4 11.1 4.2Overall 22.4 20.1 24.0 27.1 17.3 23.3 28.2 23.7 19.9 20.8 18.9 20.3 19.3 25.9 18.5
Blue 9.9 7.1 11.2 13.8 6.8 10.5 11.4 9.6 8.1 7.6 6.3 8.2 7.4 8.6 8.23DG67 Yellow 3.3 6.7 4.1 3.9 5.2 4.0 7.7 6.9 4.6 6.7 7.1 4.0 5.2 10.8 4.1
Overall 13.2# 13.7# 15.4 17.7 12.0 14.4# 19.1 16.5# 12.7# 14.3 13.3 12.1 12.7 19.4 12.4Green 5.1 7.7 7.3 7.9 9.3 6.2 12.6 10.6 6.6 10.4 9.8 6.0 8.1 15.6 6.2
3DG68 Magenta 11.4 15.3 6.3 12.1 6.5 13.4 8.0 10.1 11.6 6.4 5.5 5.1 5.9 6.6 10.1Overall 16.4 23.0 13.6 20.1 15.8 19.6 20.6 20.7 18.2 16.8 15.2 11.2 14.0 22.2 16.3
Blue 10.8 7.7 12.1 14.7 7.4 11.3 12.3 10.3 8.8 8.2 6.8 9.0 8.1 9.2 8.93DG69 Yellow 3.4 6.8 4.2 4.0 5.2 4.0 7.7 7.0 4.7 6.7 7.1 4.0 5.3 10.8 4.2
Overall 14.2 14.5 16.3 18.7 12.5 15.3 20.0 17.2 13.5 14.9 14.0 13.0 13.4 20.0 13.1Red 13.4 22.6 8.2 13.9 8.3 16.1 12.3 15.0 14.7 10.9 8.5 6.4 7.9 14.7 10.9
3DG70 Cyan 1.0 0.9 2.0 2.2 2.2 1.4 1.3 2.2 1.1 2.9 1.7 1.4 1.9 1.5 0.7Overall 14.4 23.5 10.2# 16.1# 10.5# 17.5 13.6# 17.1 15.8 13.8# 10.2# 7.8# 9.8# 16.2# 11.6#
Blue 63.9 43.0 64.8 67.6 44.4 63.2 60.7 49.0 50.8 46.0 42.5 64.7 51.5 45.3 49.43DG71 Yellow 2.4 4.9 3.3 3.0 4.1 3.0 6.8 5.7 3.4 5.2 5.7 3.0 4.1 10.1 2.9
Overall 66.3 47.8 68.1 70.7 48.5 66.2 67.5 54.7 54.3 51.2 48.2 67.7 55.6 55.4 52.2Green 5.8 8.8 8.5 9.0 10.5 7.0 14.1 12.0 7.5 12.2 11.2 7.0 9.4 17.6 6.9
3DG72 Magenta 9.7 12.1 5.4 10.9 5.6 11.4 7.3 8.5 9.5 5.4 4.9 4.2 4.8 5.7 9.1Overall 15.5 20.8 13.9 19.9 16.1 18.4 21.4 20.5 17.0 17.6 16.0 11.2 14.1 23.4 16.0
Red 15.2 25.1 10.1 15.8 10.8 18.2 13.9 17.1 16.9 12.9 11.0 8.5 10.3 16.6 13.63DG73 Cyan 2.0 1.8 3.2 3.3 3.2 2.3 2.6 3.1 2.0 4.0 2.3 2.1 2.6 3.2 1.4
Overall 17.2 27.0 13.4 19.1 14.0 20.5 16.5 20.3 18.9 16.9 13.3 10.6 12.9 19.8 14.9Red 13.5 22.8 8.4 14.1 8.9 16.2 12.6 15.2 14.8 11.3 9.2 6.7 8.4 14.8 11.6
3DG74 Cyan 2.1 1.9 3.3 3.4 3.3 2.3 2.6 3.2 2.1 4.0 2.3 2.1 2.7 3.3 1.4Overall 15.5 24.7 11.8 17.5 12.2 18.5 15.2 18.4 16.9 15.3 11.5 8.8 11.0 18.2 13.1Green 6.3 9.6 8.8 9.5 10.9 7.4 14.9 12.4 8.1 12.2 11.3 7.1 9.4 18.3 7.6
3DG75 Magenta 11.1 14.7 6.2 11.8 6.6 13.1 7.6 10.0 11.4 6.4 5.5 5.3 6.0 6.6 10.0Overall 17.4 24.3 15.0 21.3 17.5 20.5 22.5 22.4 19.5 18.6 16.8 12.4 15.4 24.8 17.6Green 6.2 9.5 8.6 9.4 10.8 7.4 14.8 12.3 8.0 12.0 11.2 7.0 9.3 17.9 7.6
3DG76 Magenta 10.8 14.2 5.9 11.5 6.2 12.7 7.4 9.6 11.0 6.2 5.2 4.9 5.7 6.4 9.5Overall 17.0 23.7 14.6 20.9 17.0 20.0 22.2 22.0 19.0 18.2 16.5 12.0 15.0 24.3 17.1
DisplaysGlasses
(dichroic)
(dichroic)
(dichroic)
(inkjet)
00.0#00.0+ 00.0 3.4 Validation
A series of first-order validation tests were performed to check the accuracy of the crosstalk model. A set of test images were viewed on CRT and PDP monitors and subjectively ranked in order of increasing crosstalk by human observers. The results of the subjective ranking were then compared with the crosstalk ranking generated by the Matlab program and this is shown in Tables 5(a-f). The first group of validations (Tables 5 a-d) only compare a single filter color at a time. The second group of validations (Tables 5 e and f) compare the overall crosstalk ranking of the glasses (both left and right eye filters) as a whole. It can be seen that the single lens subjective rankings agree extremely well with the calculated results (Tables 5 a-d). Most of the differences occur where the crosstalk percentage difference was 0.6 or less, which is a very small difference and would be hard to discern by the naked eye.
SPIE-IS&T/ Vol. 7524 75240Q-8
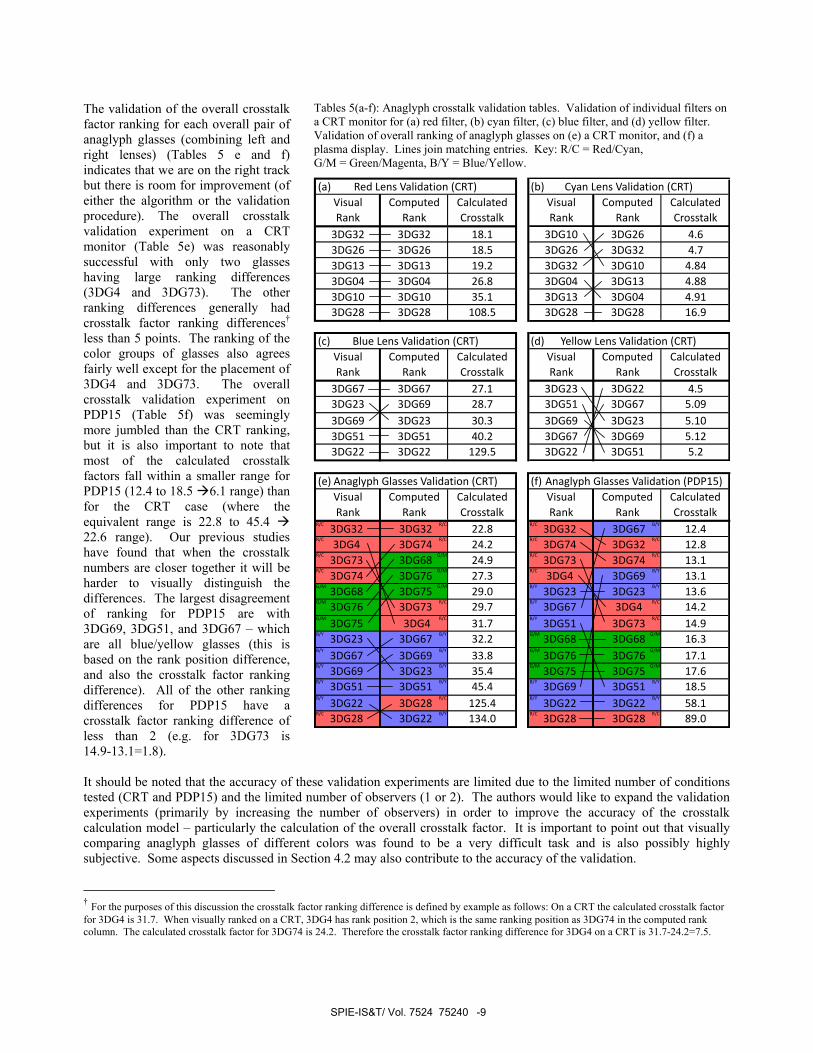
The validation of the overall crosstalk factor ranking for each overall pair of anaglyph glasses (combining left and right lenses) (Tables 5 e and f) indicates that we are on the right track but there is room for improvement (of either the algorithm or the validation procedure). The overall crosstalk validation experiment on a CRT monitor (Table 5e) was reasonably successful with only two glasses having large ranking differences (3DG4 and 3DG73). The other ranking differences generally had crosstalk factor ranking differences† less than 5 points. The ranking of the color groups of glasses also agrees fairly well except for the placement of 3DG4 and 3DG73. The overall crosstalk validation experiment on PDP15 (Table 5f) was seemingly more jumbled than the CRT ranking, but it is also important to note that most of the calculated crosstalk factors fall within a smaller range for PDP15 (12.4 to 18.5 6.1 range) than for the CRT case (where the equivalent range is 22.8 to 45.4 22.6 range). Our previous studies have found that when the crosstalk numbers are closer together it will be harder to visually distinguish the differences. The largest disagreement of ranking for PDP15 are with 3DG69, 3DG51, and 3DG67 – which are all blue/yellow glasses (this is based on the rank position difference, and also the crosstalk factor ranking difference). All of the other ranking differences for PDP15 have a crosstalk factor ranking difference of less than 2 (e.g. for 3DG73 is 14.9-13.1=1.8). It should be noted that the accuracy of these validation experiments are limited due to the limited number of conditions tested (CRT and PDP15) and the limited number of observers (1 or 2). The authors would like to expand the validation experiments (primarily by increasing the number of observers) in order to improve the accuracy of the crosstalk calculation model – particularly the calculation of the overall crosstalk factor. It is important to point out that visually comparing anaglyph glasses of different colors was found to be a very difficult task and is also possibly highly subjective. Some aspects discussed in Section 4.2 may also contribute to the accuracy of the validation.
† For the purposes of this discussion the crosstalk factor ranking difference is defined by example as follows: On a CRT the calculated crosstalk factor for 3DG4 is 31.7. When visually ranked on a CRT, 3DG4 has rank position 2, which is the same ranking position as 3DG74 in the computed rank column. The calculated crosstalk factor for 3DG74 is 24.2. Therefore the crosstalk factor ranking difference for 3DG4 on a CRT is 31.7-24.2=7.5.
Tables 5(a-f): Anaglyph crosstalk validation tables. Validation of individual filters on a CRT monitor for (a) red filter, (b) cyan filter, (c) blue filter, and (d) yellow filter. Validation of overall ranking of anaglyph glasses on (e) a CRT monitor, and (f) a plasma display. Lines join matching entries. Key: R/C = Red/Cyan, G/M = Green/Magenta, B/Y = Blue/Yellow.
Visual Computed Calculated Visual Computed CalculatedRank Rank Crosstalk Rank Rank Crosstalk
3DG32 3DG32 18.1 3DG10 3DG26 4.63DG26 3DG26 18.5 3DG26 3DG32 4.73DG13 3DG13 19.2 3DG32 3DG10 4.843DG04 3DG04 26.8 3DG04 3DG13 4.883DG10 3DG10 35.1 3DG13 3DG04 4.913DG28 3DG28 108.5 3DG28 3DG28 16.9
Visual Computed Calculated Visual Computed CalculatedRank Rank Crosstalk Rank Rank Crosstalk
3DG67 3DG67 27.1 3DG23 3DG22 4.53DG23 3DG69 28.7 3DG51 3DG67 5.093DG69 3DG23 30.3 3DG69 3DG23 5.103DG51 3DG51 40.2 3DG67 3DG69 5.123DG22 3DG22 129.5 3DG22 3DG51 5.2
Blue Lens Validation (CRT) Yellow Lens Validation (CRT)
Red Lens Validation (CRT) Cyan Lens Validation (CRT)
Visual Computed Calculated Visual Computed CalculatedRank Rank Crosstalk Rank Rank Crosstalk
3DG32 3DG32 22.8 3DG32 3DG67 12.43DG4 3DG74 24.2 3DG74 3DG32 12.8
3DG73 3DG68 24.9 3DG73 3DG74 13.13DG74 3DG76 27.3 3DG4 3DG69 13.13DG68 3DG75 29.0 3DG23 3DG23 13.63DG76 3DG73 29.7 3DG67 3DG4 14.23DG75 3DG4 31.7 3DG51 3DG73 14.93DG23 3DG67 32.2 3DG68 3DG68 16.33DG67 3DG69 33.8 3DG76 3DG76 17.13DG69 3DG23 35.4 3DG75 3DG75 17.63DG51 3DG51 45.4 3DG69 3DG51 18.53DG22 3DG28 125.4 3DG22 3DG22 58.13DG28 3DG22 134.0 3DG28 3DG28 89.0
Anaglyph Glasses Validation (PDP15)Anaglyph Glasses Validation (CRT)
R/C
R/C
R/C
R/C
G/M
G/M
G/M
B/Y
B/Y
B/Y
B/Y
B/Y
R/C
R/C
R/C
G/M
G/M
G/M
R/C
R/C
B/Y
B/Y
B/Y
B/Y
R/C
B/Y
R/C
R/C
R/C
R/C
B/Y
B/Y
B/Y
G/M
G/M
G/M
B/Y
B/Y
R/C
B/Y
R/C
R/C
B/Y
B/Y
R/C
R/C
G/M
G/M
G/M
B/Y
B/Y
R/C
(a) (b)
(c) (d)
(e) (f)
SPIE-IS&T/ Vol. 7524 75240Q-9
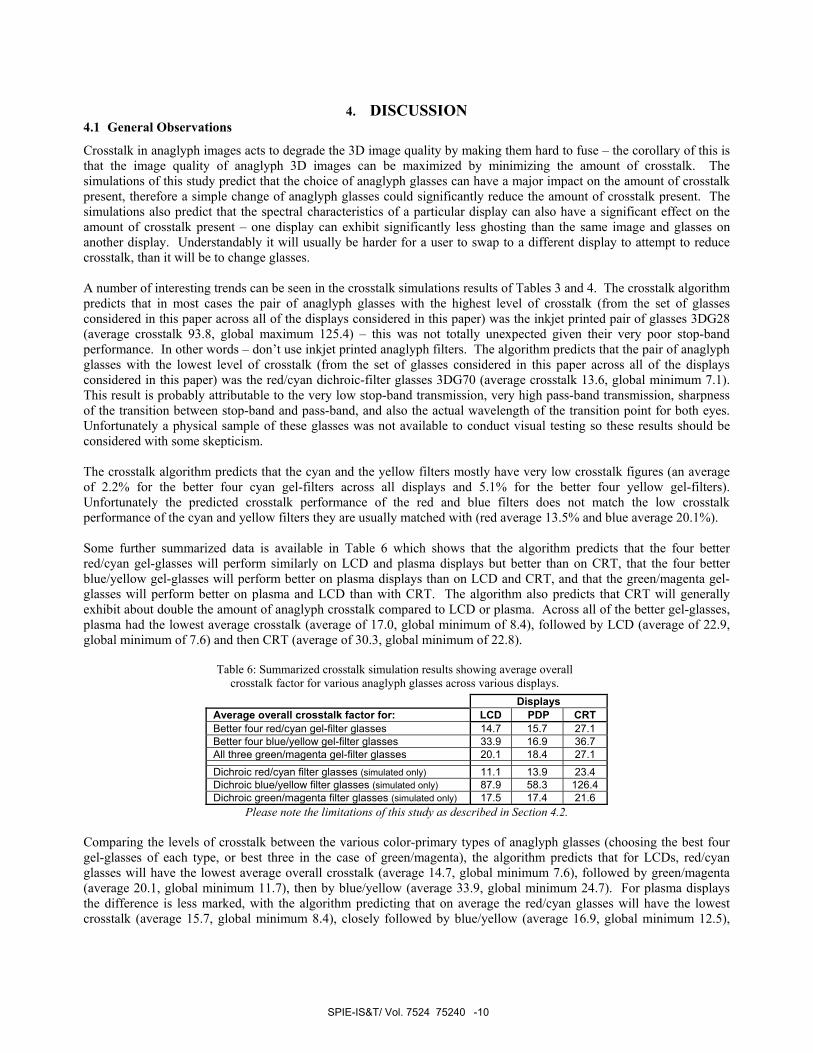
4. DISCUSSION 4.1 General Observations
Crosstalk in anaglyph images acts to degrade the 3D image quality by making them hard to fuse – the corollary of this is that the image quality of anaglyph 3D images can be maximized by minimizing the amount of crosstalk. The simulations of this study predict that the choice of anaglyph glasses can have a major impact on the amount of crosstalk present, therefore a simple change of anaglyph glasses could significantly reduce the amount of crosstalk present. The simulations also predict that the spectral characteristics of a particular display can also have a significant effect on the amount of crosstalk present – one display can exhibit significantly less ghosting than the same image and glasses on another display. Understandably it will usually be harder for a user to swap to a different display to attempt to reduce crosstalk, than it will be to change glasses. A number of interesting trends can be seen in the crosstalk simulations results of Tables 3 and 4. The crosstalk algorithm predicts that in most cases the pair of anaglyph glasses with the highest level of crosstalk (from the set of glasses considered in this paper across all of the displays considered in this paper) was the inkjet printed pair of glasses 3DG28 (average crosstalk 93.8, global maximum 125.4) – this was not totally unexpected given their very poor stop-band performance. In other words – don’t use inkjet printed anaglyph filters. The algorithm predicts that the pair of anaglyph glasses with the lowest level of crosstalk (from the set of glasses considered in this paper across all of the displays considered in this paper) was the red/cyan dichroic-filter glasses 3DG70 (average crosstalk 13.6, global minimum 7.1). This result is probably attributable to the very low stop-band transmission, very high pass-band transmission, sharpness of the transition between stop-band and pass-band, and also the actual wavelength of the transition point for both eyes. Unfortunately a physical sample of these glasses was not available to conduct visual testing so these results should be considered with some skepticism. The crosstalk algorithm predicts that the cyan and the yellow filters mostly have very low crosstalk figures (an average of 2.2% for the better four cyan gel-filters across all displays and 5.1% for the better four yellow gel-filters). Unfortunately the predicted crosstalk performance of the red and blue filters does not match the low crosstalk performance of the cyan and yellow filters they are usually matched with (red average 13.5% and blue average 20.1%). Some further summarized data is available in Table 6 which shows that the algorithm predicts that the four better red/cyan gel-glasses will perform similarly on LCD and plasma displays but better than on CRT, that the four better blue/yellow gel-glasses will perform better on plasma displays than on LCD and CRT, and that the green/magenta gel-glasses will perform better on plasma and LCD than with CRT. The algorithm also predicts that CRT will generally exhibit about double the amount of anaglyph crosstalk compared to LCD or plasma. Across all of the better gel-glasses, plasma had the lowest average crosstalk (average of 17.0, global minimum of 8.4), followed by LCD (average of 22.9, global minimum of 7.6) and then CRT (average of 30.3, global minimum of 22.8).
Table 6: Summarized crosstalk simulation results showing average overall crosstalk factor for various anaglyph glasses across various displays.
Displays Average overall crosstalk factor for: LCD PDP CRT Better four red/cyan gel-filter glasses 14.7 15.7 27.1 Better four blue/yellow gel-filter glasses 33.9 16.9 36.7 All three green/magenta gel-filter glasses 20.1 18.4 27.1
Dichroic red/cyan filter glasses (simulated only) 11.1 13.9 23.4 Dichroic blue/yellow filter glasses (simulated only) 87.9 58.3 126.4 Dichroic green/magenta filter glasses (simulated only) 17.5 17.4 21.6
Please note the limitations of this study as described in Section 4.2. Comparing the levels of crosstalk between the various color-primary types of anaglyph glasses (choosing the best four gel-glasses of each type, or best three in the case of green/magenta), the algorithm predicts that for LCDs, red/cyan glasses will have the lowest average overall crosstalk (average 14.7, global minimum 7.6), followed by green/magenta (average 20.1, global minimum 11.7), then by blue/yellow (average 33.9, global minimum 24.7). For plasma displays the difference is less marked, with the algorithm predicting that on average the red/cyan glasses will have the lowest crosstalk (average 15.7, global minimum 8.4), closely followed by blue/yellow (average 16.9, global minimum 12.5),
SPIE-IS&T/ Vol. 7524 75240Q-10

and closely followed by green/magenta (average 18.4, global minimum 11.2). For CRT, the algorithm predicts that on average red/cyan and green/magenta have the same average lowest crosstalk (red/cyan average 27.1, global minimum 22.8) (green/magenta average 27.1, global minimum 24.9), followed by blue/yellow (average 36.7, global minimum 32.2). Across all of the tested displays, the algorithm predicts that red/cyan has the lowest average crosstalk (average 15.7), followed closely by green/magenta (average 19.5), and then blue/yellow (average 25.2). It was mentioned above that the red/cyan dichroic filter glasses were predicted to have the lowest average crosstalk across all of the tested displays. Let’s look more closely at the performance of the other dichroic filters. According to the simulation, the green/magenta dichroic filter glasses have slightly lower crosstalk levels (average 17.6) than the green/magenta gel-filter glasses (average 19.5). This would be for the same reasons cited for the good performance of the red/cyan dichroic filter glasses. On the other hand, the blue/yellow dichroic filter glasses are predicted to have grossly higher average crosstalk levels (average 73.9) than the better blue-yellow gel-filter glasses (average 25.2). Looking more closely at this result, the yellow dichroic filter is predicted to have slightly lower crosstalk than the better yellow gel-filters, but the algorithm predicts the blue dichroic filter to have almost three times the crosstalk as the better blue gel-filters. This will be the source of the high result overall dichroic crosstalk result. Looking at the spectrum of the blue dichroic filter shows that the transition wavelength is around 505nm which is probably too high. If the transition wavelength was closer to 480 or 490nm, the result would probably be very different. The simulation results indicate that dichroic filters have potential to offer lower crosstalk than equivalent gel-filters, providing the transition wavelengths are positioned optimally. It would be interesting to validate these predictions with visual tests on physical pairs of these glasses. 4.2 Limitations of this Study
The techniques used in this study have several limitations which should be considered when the results of this study are reviewed. The study only considers a limited number of displays – it is unclear whether these displays are a valid representation of all displays in common circulation. Furthermore recent model displays may have a different spectral emission performance – for example, LED backlit LCD TVs are likely to have different spectral characteristics and therefore very different crosstalk results. The crosstalk calculation algorithm only considers crosstalk as an indicator for 3D image quality – there are a number of other factors which also contribute towards the perception of 3D image quality but are not included in the algorithm. For example: clarity or sharpness of the lenses (filters with a low MTF would reduce 3D image quality); brightness balance of the left and right lenses (high brightness imbalance can lead to the perception of the Pulfrich effect – our calculations indicate that the green/magenta glasses generally have better brightness balance and blue/yellow glasses have the greatest brightness imbalance although that work isn’t reported here due to space limitations); color balance of the monitor (our tests have revealed that color balance does have an effect on crosstalk calculations but we have not been able to design this out of the algorithm at the present time); experimental variation and product manufacturing variation; the inherent difficulty of accurately visually comparing relative brightness of different colors; and other psychological effects (which can lead to subjective variation). The current crosstalk simulation algorithm uses a simple addition of left eye crosstalk and right eye crosstalk to obtain the overall crosstalk factor for a pair of glasses. This may not be a good representation of how we perceive overall levels of crosstalk – particularly when there are large brightness differences and large crosstalk differences between the eyes. One example of this is glasses 3DG51 on a CRT – the crosstalk of the blue filter has almost eight times the amount of crosstalk of the yellow lens (which has quite low crosstalk). The yellow lens is also substantially brighter than the blue lens. When glasses 3DG51 are worn, the perception of the brighter yellow lens seems to dominate the perception of the 3D image and less crosstalk is perceived than a simple addition of yellow and blue individual crosstalk would suggest. Further work is required in this area and would be aided by an expanded validation experiment as mentioned in Section 3.4. This study also ignores the introduction of anaglyph crosstalk by the use of lossy compression techniques on anaglyph images (e.g. JPEG compression), and the use of incorrect anaglyph generation algorithms (which may unwittingly mix left and right images). These effects are quite separate from the spectral techniques described in this paper and should be considered separately. Anaglyph content producers should work to ensure that their anaglyph 3D content is not adversely affected by these last two factors.
SPIE-IS&T/ Vol. 7524 75240Q-11
5. CONCLUSION
Although there are a range of other stereoscopic display technologies available that produce much better 3D image quality than the anaglyph 3D method (e.g. polarized, shutter glasses, and Infitec), the anaglyph 3d method remains widely used because of its simplicity, low cost, and compatibility with all full-color displays and prints. If anaglyph 3D is to be used, it would be best if it were used optimally which is one of the purposes of this paper. This paper has revealed that crosstalk in anaglyphic 3-D images can be minimized by the appropriate choice of anaglyphic 3-D glasses. The study has also revealed that there is considerable variation in the amount of anaglyphic crosstalk exhibited by different displays. Compared to previous work that has only considered red/cyan anaglyph glasses, this paper has extended the work to include blue/yellow and green/magenta anaglyph glasses which are now also in common usage. The paper has also considered the effect of using dichroic filters and inkjet printed filters for anaglyph 3D viewing. The techniques used in the paper to simulate anaglyph crosstalk are by no means perfect at this stage, but they do confirm that there is considerable opportunity for the optimization of anaglyph viewing by the appropriate choice of anaglyph glasses and displays.
6. ACKNOWLEDGMENTS
The authors would like to thank WA:ERA, iVEC and Jumbo Vision International for their support of various aspects of this project.
REFERENCES
1. R Zone, “Good old fashion anaglyph: High tech tools revive a classic format in spy kids 3-D,” Stereo World 29, No. 5, 11–13 and 46 (2002–2003).
2. L Lipton "Glossary" in Lenny Lipton's Blog, dated: 16 March 2009, accessed: 16 December 2009. Online: http://lennylipton.wordpress.com/2009/03/16/glossary/
3. Woods, A.J., and Rourke T. (2004) "Ghosting in Anaglyphic Stereoscopic Images", presented at Stereoscopic Displays and Applications XV, published in Stereoscopic Displays and Virtual Reality Systems XI, Proceedings of SPIE-IS&T Electronic Imaging, SPIE Vol. 5291, San Jose, California.
4. Woods, A.J., Yuen, K.-L., and Karvinen, K.S. (2007) “Characterizing crosstalk in anaglyphic stereoscopic images on LCD monitors and plasma displays” in Journal of the Society for Information Display, Volume 15, Issue 11, pp. 889-898, November 2007.
5. Woods, A.J., and Tan, S.S.L. (2002) "Characterising Sources of Ghosting in Time-Sequential Stereoscopic Video Displays", presented at Stereoscopic Displays and Applications XIII, published in Stereoscopic Displays and Virtual Reality Systems IX, Proceedings of SPIE Vol. 4660, San Jose, California, 21-23 January 2003.
6. Woods, A.J., Yuen, K.-L. (2006) "Compatibility of LCD Monitors with Frame-Sequential Stereoscopic 3D Visualisation" (Invited Paper), in IMID/IDMC '06 Digest, (The 6th International Meeting on Information Display, and The 5th International Display Manufacturing Conference), pg 98-102, Daegu, South Korea, 22-25 August 2006.
7. Woods, A.J., and Rourke, T., (2007) “The compatibility of consumer DLP projectors with time-sequential stereoscopic 3D visualization”, presented at Stereoscopic Displays and Applications XVIII, published in Stereoscopic Displays and Virtual Reality Systems XIV, Proceedings of IS&T/SPIE Electronic Imaging Vol. 6490, San Jose, California, 29-31 January 2007.
8. Woods, A.J., Karvinen, K. S. (2008) "The compatibility of consumer plasma displays with time-sequential stereoscopic 3D visualization" in Stereoscopic Displays and Applications XIX, Proceedings of SPIE Vol. 6803, San Jose, California.
9. Woods, A.J, and Sehic, A. (2009) “The compatibility of LCD TVs with time-sequential stereoscopic 3D visualization” in Stereoscopic Displays and Applications XX, Proceedings of Electronic Imaging, Proc SPIE Vol. 7237, San Jose, California, 19-21 January 2009.
10. www.matlab.com 11. CIE, Commission Internationale de l’Eclairage Proceedings (Cambridge University Press, 1932).
SPIE-IS&T/ Vol. 7524 75240Q-12

This is a separator page and is intentionally blank.
A1-1
Appendix 1 – Additional Publications Relevant to the Thesis
Paper 9 A. J. Woods, S. Tan (2002) “Characterising Sources of Ghosting in Time‐Sequential Stereoscopic Video Displays” presented at Stereoscopic Displays and Applications XIII (SD&A), published in Stereoscopic Displays and Virtual Reality Systems IX, Proceedings of IS&T/SPIE Electronic Imaging, SPIE Vol. 4660, pp. 66‐77, San Jose, California, January 2002.
Paper 10 A. J. Woods, T. Rourke (2004) “Ghosting in Anaglyphic Stereoscopic Images”
presented at Stereoscopic Displays and Applications XV (SD&A), published in Stereoscopic Displays and Virtual Reality Systems XI, Proceedings of IS&T/SPIE Electronic Imaging, SPIE Vol. 5291, pp. 354‐365, San Jose, California, January 2004.
Paper 11 A. J. Woods (2005) “Compatibility of Display Products with Stereoscopic Display Methods” International Display Manufacturing Conference (IDMC), pp. 290‐293, Taiwan, February 2005.
Paper 12 A. J. Woods, T. Rourke, K. L. Yuen (2006) "The Compatibility of Consumer Displays with Time‐Sequential Stereoscopic 3D Visualisation" (Invited Plenary Paper), in Proceedings of the K‐IDS Three‐Dimensional Display Workshop 2006, pp. 7‐10, Seoul National University, Seoul, South Korea, 21 August 2006.
Paper 13 A. J. Woods, T. Rourke (2007) “The compatibility of consumer DLP projectors with time‐sequential stereoscopic 3D visualization”, presented at Stereoscopic Displays and Applications XVIII, published in Stereoscopic Displays and Virtual Reality Systems XIV, Proceedings of IS&T/SPIE Electronic Imaging, SPIE Vol. 6490, pp. 64900V‐1 to ‐7, San Jose, California, January 2007.
Paper 14 [Invited Reviewed Article] A. J. Woods (2009) “3‐D Displays in the Home” Information Display, 7(09), pp. 8‐12.
Paper 15 M. A. Weissman, A. J. Woods (2011) “A simple method for measuring crosstalk in
stereoscopic displays” in Stereoscopic Displays and Applications XXII, Proceedings of IS&T/SPIE Electronic Imaging, SPIE Vol. 7863, pp. 786310‐1 to ‐11, Burlingame, California, January 2011.
Paper 16 A. J. Woods (2011) “How are crosstalk and ghosting defined in the stereoscopic literature?” in Stereoscopic Displays and Applications XXII, Proceedings of IS&T/SPIE Electronic Imaging, SPIE Vol. 7863, pp. 78630Z‐1 to ‐12, Burlingame, California, January 2011.
Paper 17 [Refereed Conference Paper] A. J. Woods, J. Helliwell (2012) “Investigating the cross‐compatibility of IR‐controlled active shutter glasses” in Stereoscopic Displays and Applications XXIII, Proceedings of IS&T/SPIE Electronic Imaging, SPIE Vol. 8288, pp. 82881C‐1 to ‐10, Burlingame, California, January 2012.
Paper 18 [Refereed Journal Paper]
A. J. Woods (2013) “3D or 3‐D: a study of terminology, usage and style” European Science Editing, 39(3), pp. 59‐62, August 2013.

Paper 9 A. J. Woods, S. Tan (2002) “Characterising Sources of Ghosting in Time‐Sequential
Stereoscopic Video Displays” presented at Stereoscopic Displays and Applications XIII (SD&A), published in Stereoscopic Displays and Virtual Reality Systems IX, Proceedings of IS&T/SPIE Electronic Imaging, SPIE Vol. 4660, pp. 66‐77, San Jose, California, January 2002.
Characterising Sources of Ghosting in Time-Sequential Stereoscopic Video Displays
Andrew J. Woods*, Stanley S. L. Tan
Centre for Marine Science and Technology (CMST), Curtin University of Technology
ABSTRACT A common artefact of time-sequential stereoscopic video displays is the presence of some image ghosting or crosstalk between the two eye views. In general this happens because of imperfect shuttering of the Liquid Crystal Shutter (LCS) glasses used, and the afterglow of one image into another due to phosphor persistence. This paper describes a project that has measured and quantified these sources of image ghosting and developed a mathematical model of stereoscopic image ghosting. The primary parameters which have been measured for use in the model are: the spectral response of the red, green and blue phosphors for a wide range of monitors, the phosphor decay rate of same, and the transmission response of a wide range of LCS glasses. The model compares reasonably well with perceived image ghosting. This paper aims to provide the reader with an improved understanding of the mechanisms of stereoscopic image ghosting and to provide guidance in reducing image ghosting in time-sequential stereoscopic displays. Keywords: Stereoscopic, Liquid Crystal Shutter glasses, Ghosting, Crosstalk, Phosphor Afterglow, Shutter Leakage.
1. INTRODUCTION One of the most common stereoscopic display techniques is the use of liquid crystal shutter (LCS) glasses in combination with the sequential display of left and right perspective images on a common Cathode Ray Tube (CRT) display (e.g. most TVs and computer monitors). When the left perspective image is displayed on the screen, the right eye cell of the LCS glasses goes opaque and the left eye cell goes clear, and vice versa for when the right perspective image is displayed. Therefore the left eye sees only left perspective images and vice versa for the right eye. If the speed of repetition is sufficiently high, the eye will not notice the alternate presentation of the images nor any flicker. This technique is often called field-sequential or frame-sequential 3D since sequential or alternate images contain the left and right image. The term field-sequential applies to interlaced video systems and frame-sequential applies to progressive mode video displays. An overall term that can be used to describe both field- and frame-sequential systems is "time-sequential". An unfortunate property of these types of stereoscopic displays is the presence of a low level amount of image ghosting or crosstalk. Image ghosting or crosstalk is the leakage of one eye view into the other eye. For example, the left eye should only be able to see the left perspective image, but due to crosstalk, the left eye sees a small proportion of the right perspective image. The amount of crosstalk is typically quite low and hence is usually mostly noticed on images that exhibit high contrast. For example, where a bright object appears against a dark background. Most of the literature on the subject of crosstalk 1,2,3,4,5,6 cites two main contributors to crosstalk: • Phosphor Afterglow
Images are formed on a CRT display when the phosphor coating on the inside of the tube fluoresces upon excitation by an electron beam. The light output of these phosphors ‘decay’ after the initial excitation instead of extinguishing immediately. This phosphor persistence (or afterglow) enables one image to persist in time so that a faint ‘afterglow image’ may still be seen when the subsequent image is being displayed on the CRT. In this way, the left perspective
* A.Woods cmst.curtin.edu.au; phone: +61 8 9266 7920; fax: +61 8 9266 4799; http://www.cmst.curtin.edu.au ; Centre for Marine Science & Technology, Curtin University of Technology, GPO Box U1987, Perth 6845, AUSTRALIA.
A. J. Woods, S. Tan (2002) “Characterising Sources of Ghosting in Time‐Sequential Stereoscopic Video Displays” presented at Stereoscopic Displays and Applications XIII (SD&A), published in Stereoscopic Displays and Virtual Reality Systems IX, Proceedings of IS&T/SPIE Electronic Imaging, SPIE Vol. 4660, pp. 66‐77, San Jose, California, January 2002.
Proc. SPIE Vol. 4660 66
image is displayed simultaneously with an ‘afterglow image’ of the right perspective image, enabling the left eye to see both, and similarly for the right eye.
• Shutter leakage Due to the physical limitations of LC (liquid crystal) technology, when an LC shutter occludes an eye, it does not become totally 100% opaque. Thus if the displayed image is bright, the occluded eye may still be able to see a small percentage of the image not intended for it.
Our questions were: • How much do phosphor afterglow and shutter leakage actually contribute to crosstalk? • Are there any other contributors to crosstalk? Some factors that we considered were: timing of the LCS drive signal
(when in the Vertical Blanking Interval the switch occurs), the nature of the signal used to drive the LCS (voltage, modulation, etc), and the field/frame rate of the CRT display. Lipton7 also discusses angle of view through the LCS.
These questions weren’t entirely addressed in the literature so we set about performing some measurements to characterise the crosstalk.
2. CROSSTALK MEASUREMENT AND MODELING 2.1 CROSSTALK MEASUREMENT
Unfortunately, it wasn’t possible for us to separately measure the contribution of phosphor afterglow and incomplete extinction to ghosting directly in one measurement. Therefore we had to devise a method by which we could model the crosstalk process mathematically using the measured individual properties of the CRT phosphors and LCS glasses. The three items that we measured to develop our model were: • Phosphor spectral response, • Phosphor time response, and • LC shutter time/spectral response. 2.1.1 PHOSPHOR SPECTRAL RESPONSE
The colour image on a CRT display is constructed using three different colour phosphors: RED, GREEN, and BLUE. We used an Ocean Optics S1000 Spectoradiometer to measure the spectral output of the three colour phosphors. The results of this measurement (carried out on a selection of 11 different CRT computer monitors and TVs) are shown in Figure 1. It can be seen that the blue and green phosphors exhibit a classic bell shape curve centred at around 450nm for blue and 520nm for green. In contrast the red phosphor has many peaks with the main peak at around 630nm. One further aspect of this result to note is the partial spectral overlap of the three phosphors. We carried out this same measurement on 11 different CRT computer monitors and TVs in order to establish how much variation there was between different monitors. The overlaid results of all 11 CRT monitors are shown in Figure 2. We were surprised by the uniformity of the result, which obviously indicates that a standard set of phosphors is used in most CRT displays. Note, however, that the one CRT projector that we measured had a very different spectrum than the CRT monitors that we measured. LCD displays also have a considerably different spectrum for each of the red, green and blue primaries, which is due to the entirely different display method used. However, it should be noted that LCS glasses would not normally be used with current LCD monitors.
Proc. SPIE Vol. 4660 67
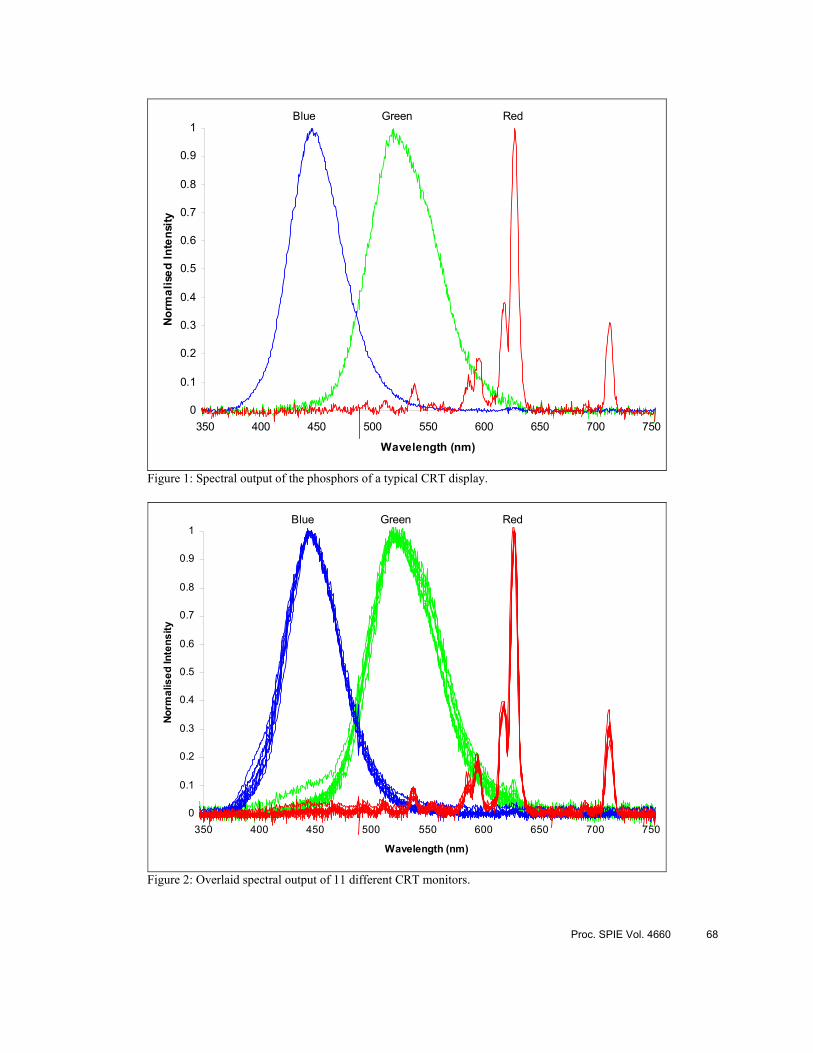
0
0.1
0.2
0.3
0.4
0.5
0.6
0.7
0.8
0.9
1
350 400 450 500 550 600 650 700 750
Wavelength (nm)
Norm
alis
ed In
tens
ity
Blue Green Red
Figure 1: Spectral output of the phosphors of a typical CRT display.
0
0.1
0.2
0.3
0.4
0.5
0.6
0.7
0.8
0.9
1
350 400 450 500 550 600 650 700 750
Wavelength (nm)
Norm
alis
ed In
tens
ity
Blue Green Red
Figure 2: Overlaid spectral output of 11 different CRT monitors.
Proc. SPIE Vol. 4660 68
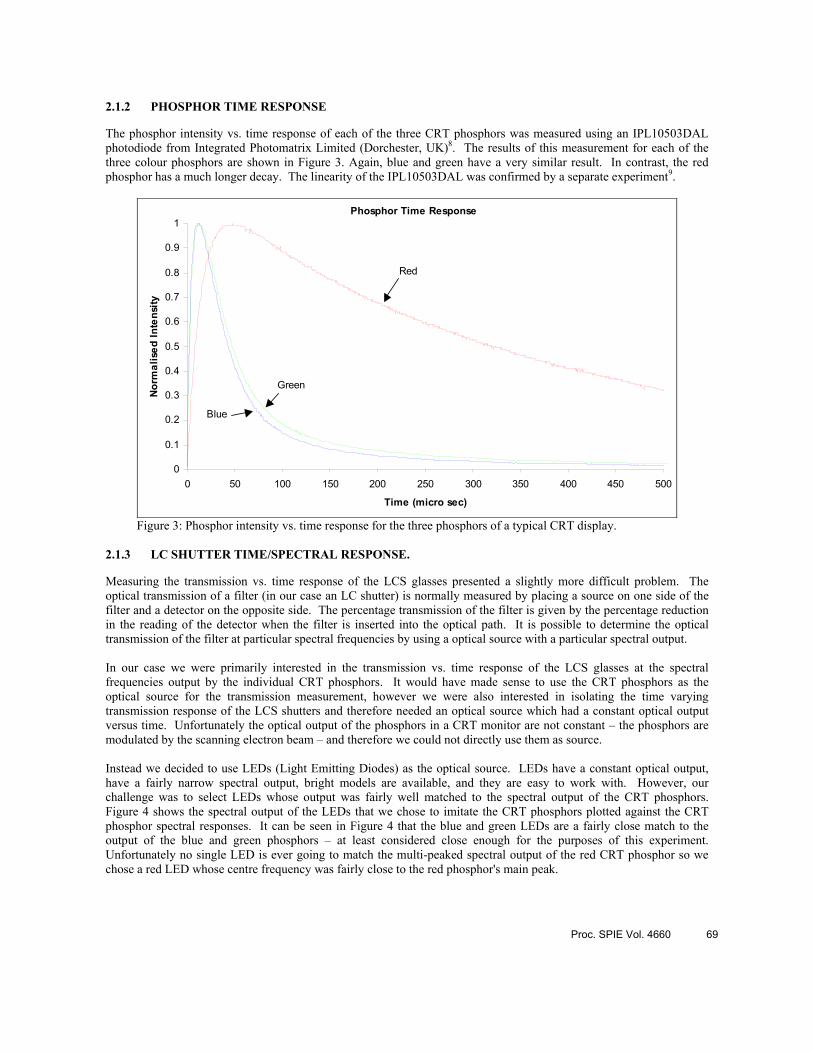
2.1.2 PHOSPHOR TIME RESPONSE
The phosphor intensity vs. time response of each of the three CRT phosphors was measured using an IPL10503DAL photodiode from Integrated Photomatrix Limited (Dorchester, UK)8. The results of this measurement for each of the three colour phosphors are shown in Figure 3. Again, blue and green have a very similar result. In contrast, the red phosphor has a much longer decay. The linearity of the IPL10503DAL was confirmed by a separate experiment9.
Phosphor Time Response
0
0.1
0.2
0.3
0.4
0.5
0.6
0.7
0.8
0.9
1
0 50 100 150 200 250 300 350 400 450 500
Time (micro sec)
Norm
alis
ed In
tens
ity
Red
Blue
Green
Figure 3: Phosphor intensity vs. time response for the three phosphors of a typical CRT display. 2.1.3 LC SHUTTER TIME/SPECTRAL RESPONSE.
Measuring the transmission vs. time response of the LCS glasses presented a slightly more difficult problem. The optical transmission of a filter (in our case an LC shutter) is normally measured by placing a source on one side of the filter and a detector on the opposite side. The percentage transmission of the filter is given by the percentage reduction in the reading of the detector when the filter is inserted into the optical path. It is possible to determine the optical transmission of the filter at particular spectral frequencies by using a optical source with a particular spectral output. In our case we were primarily interested in the transmission vs. time response of the LCS glasses at the spectral frequencies output by the individual CRT phosphors. It would have made sense to use the CRT phosphors as the optical source for the transmission measurement, however we were also interested in isolating the time varying transmission response of the LCS shutters and therefore needed an optical source which had a constant optical output versus time. Unfortunately the optical output of the phosphors in a CRT monitor are not constant – the phosphors are modulated by the scanning electron beam – and therefore we could not directly use them as source. Instead we decided to use LEDs (Light Emitting Diodes) as the optical source. LEDs have a constant optical output, have a fairly narrow spectral output, bright models are available, and they are easy to work with. However, our challenge was to select LEDs whose output was fairly well matched to the spectral output of the CRT phosphors. Figure 4 shows the spectral output of the LEDs that we chose to imitate the CRT phosphors plotted against the CRT phosphor spectral responses. It can be seen in Figure 4 that the blue and green LEDs are a fairly close match to the output of the blue and green phosphors – at least considered close enough for the purposes of this experiment. Unfortunately no single LED is ever going to match the multi-peaked spectral output of the red CRT phosphor so we chose a red LED whose centre frequency was fairly close to the red phosphor's main peak.
Proc. SPIE Vol. 4660 69
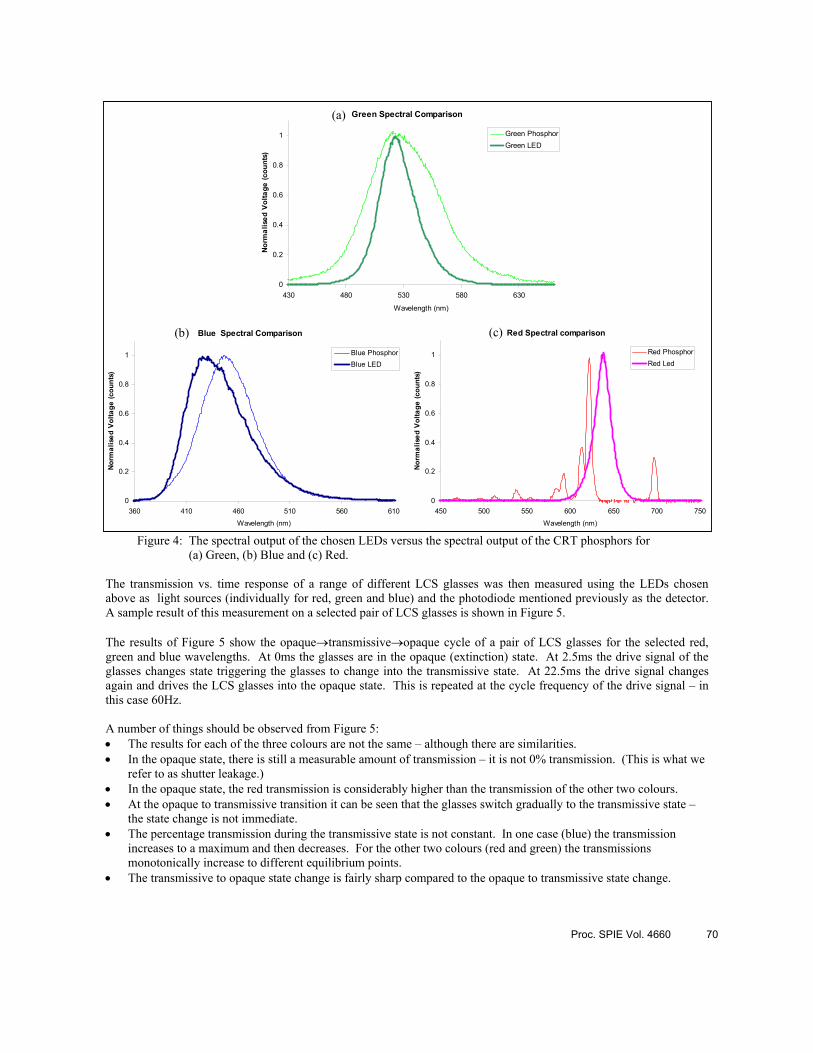
Green Spectral Comparison
0
0.2
0.4
0.6
0.8
1
430 480 530 580 630
Wavelength (nm)
Norm
alis
ed V
olta
ge (c
ount
s)
Green PhosphorGreen LED
Blue Spectral Comparison
0
0.2
0.4
0.6
0.8
1
360 410 460 510 560 610Wavelength (nm)
Norm
alis
ed V
olta
ge (c
ount
s)
Blue PhosphorBlue LED
Red Spectral comparison
0
0.2
0.4
0.6
0.8
1
450 500 550 600 650 700 750Wavelength (nm)
Norm
alis
ed V
olta
ge (c
ount
s)
Red PhosphorRed Led
Figure 4: The spectral output of the chosen LEDs versus the spectral output of the CRT phosphors for
(a) Green, (b) Blue and (c) Red. The transmission vs. time response of a range of different LCS glasses was then measured using the LEDs chosen above as light sources (individually for red, green and blue) and the photodiode mentioned previously as the detector. A sample result of this measurement on a selected pair of LCS glasses is shown in Figure 5. The results of Figure 5 show the opaque→transmissive→opaque cycle of a pair of LCS glasses for the selected red, green and blue wavelengths. At 0ms the glasses are in the opaque (extinction) state. At 2.5ms the drive signal of the glasses changes state triggering the glasses to change into the transmissive state. At 22.5ms the drive signal changes again and drives the LCS glasses into the opaque state. This is repeated at the cycle frequency of the drive signal – in this case 60Hz. A number of things should be observed from Figure 5: • The results for each of the three colours are not the same – although there are similarities. • In the opaque state, there is still a measurable amount of transmission – it is not 0% transmission. (This is what we
refer to as shutter leakage.) • In the opaque state, the red transmission is considerably higher than the transmission of the other two colours. • At the opaque to transmissive transition it can be seen that the glasses switch gradually to the transmissive state –
the state change is not immediate. • The percentage transmission during the transmissive state is not constant. In one case (blue) the transmission
increases to a maximum and then decreases. For the other two colours (red and green) the transmissions monotonically increase to different equilibrium points.
• The transmissive to opaque state change is fairly sharp compared to the opaque to transmissive state change.
(a)
(b) (c)
Proc. SPIE Vol. 4660 70
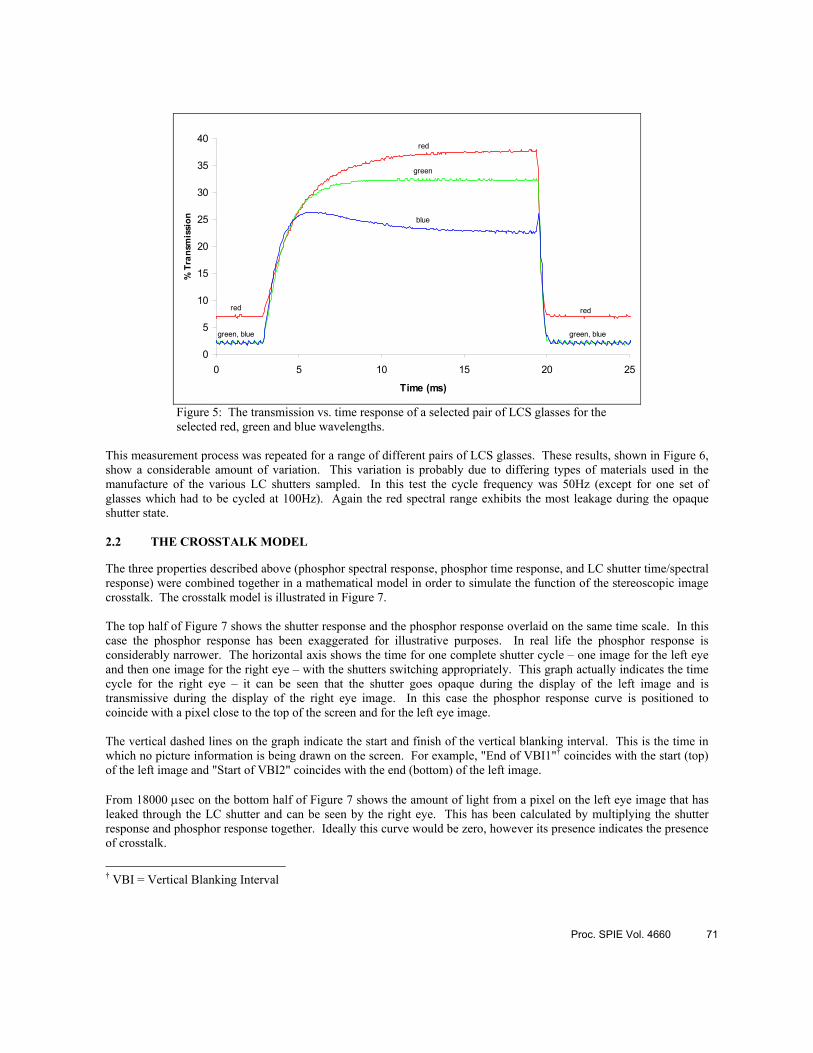
0
5
10
15
20
25
30
35
40
0 5 10 15 20 25
Time (ms)
% T
rans
mis
sion blue
green, blue green, blue
green
red
red red
Figure 5: The transmission vs. time response of a selected pair of LCS glasses for the selected red, green and blue wavelengths.
This measurement process was repeated for a range of different pairs of LCS glasses. These results, shown in Figure 6, show a considerable amount of variation. This variation is probably due to differing types of materials used in the manufacture of the various LC shutters sampled. In this test the cycle frequency was 50Hz (except for one set of glasses which had to be cycled at 100Hz). Again the red spectral range exhibits the most leakage during the opaque shutter state. 2.2 THE CROSSTALK MODEL
The three properties described above (phosphor spectral response, phosphor time response, and LC shutter time/spectral response) were combined together in a mathematical model in order to simulate the function of the stereoscopic image crosstalk. The crosstalk model is illustrated in Figure 7. The top half of Figure 7 shows the shutter response and the phosphor response overlaid on the same time scale. In this case the phosphor response has been exaggerated for illustrative purposes. In real life the phosphor response is considerably narrower. The horizontal axis shows the time for one complete shutter cycle – one image for the left eye and then one image for the right eye – with the shutters switching appropriately. This graph actually indicates the time cycle for the right eye – it can be seen that the shutter goes opaque during the display of the left image and is transmissive during the display of the right eye image. In this case the phosphor response curve is positioned to coincide with a pixel close to the top of the screen and for the left eye image. The vertical dashed lines on the graph indicate the start and finish of the vertical blanking interval. This is the time in which no picture information is being drawn on the screen. For example, "End of VBI1"† coincides with the start (top) of the left image and "Start of VBI2" coincides with the end (bottom) of the left image. From 18000 µsec on the bottom half of Figure 7 shows the amount of light from a pixel on the left eye image that has leaked through the LC shutter and can be seen by the right eye. This has been calculated by multiplying the shutter response and phosphor response together. Ideally this curve would be zero, however its presence indicates the presence of crosstalk.
† VBI = Vertical Blanking Interval
Proc. SPIE Vol. 4660 71
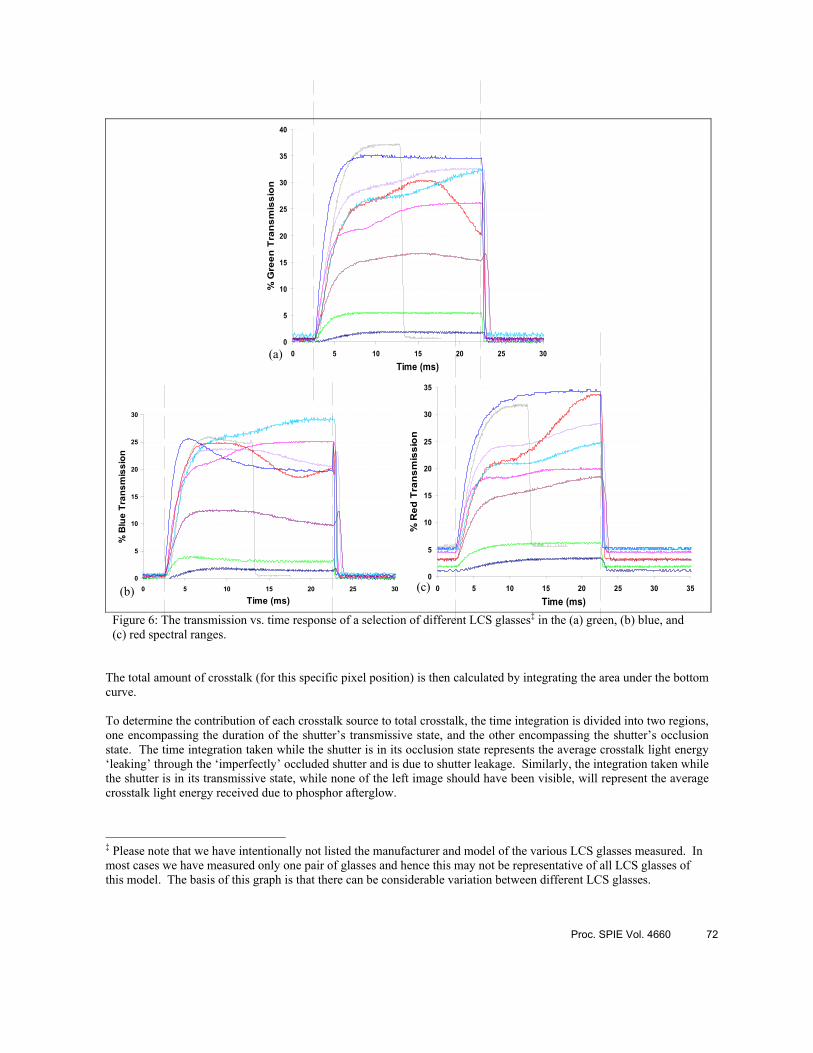
The total amount of crosstalk (for this specific pixel position) is then calculated by integrating the area under the bottom curve. To determine the contribution of each crosstalk source to total crosstalk, the time integration is divided into two regions, one encompassing the duration of the shutter’s transmissive state, and the other encompassing the shutter’s occlusion state. The time integration taken while the shutter is in its occlusion state represents the average crosstalk light energy ‘leaking’ through the ‘imperfectly’ occluded shutter and is due to shutter leakage. Similarly, the integration taken while the shutter is in its transmissive state, while none of the left image should have been visible, will represent the average crosstalk light energy received due to phosphor afterglow. ‡ Please note that we have intentionally not listed the manufacturer and model of the various LCS glasses measured. In most cases we have measured only one pair of glasses and hence this may not be representative of all LCS glasses of this model. The basis of this graph is that there can be considerable variation between different LCS glasses.
0
5
10
15
20
25
30
35
40
0 5 10 15 20 25 30
Time (ms)
% G
reen
Tra
nsm
issi
on
0
5
10
15
20
25
30
0 5 10 15 20 25 30
Time (ms)
% B
lue
Tran
smis
sion
Figure 6: The transmission vs. time response of a selection of different LCS glasses‡ in the (a) green, (b) blue, and (c) red spectral ranges.
0
5
10
15
20
25
30
35
0 5 10 15 20 25 30 35
Time (ms)
% R
ed T
rans
mis
sion
(a)
(b) (c)
Proc. SPIE Vol. 4660 72
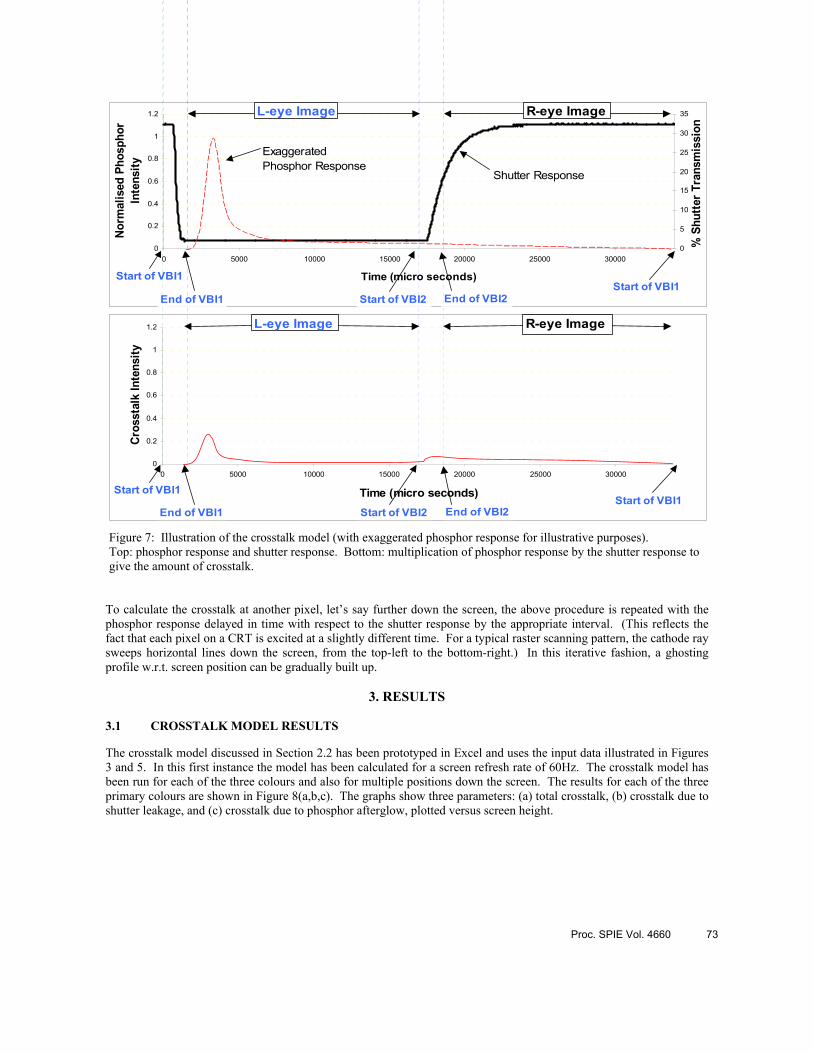
0
0.2
0.4
0.6
0.8
1
1.2
0 5000 10000 15000 20000 25000 30000
Time (micro seconds)
Norm
alis
ed P
hosp
hor
Inte
nsity
0
5
10
15
20
25
30
35
% S
hutte
r Tra
nsm
issi
on
Shutter Response
ExaggeratedPhosphor Response
R-eye Image
Start of VBI1
End of VBI1 End of VBI2Start of VBI2Start of VBI1
L-eye Image
0
0.2
0.4
0.6
0.8
1
1.2
0 5000 10000 15000 20000 25000 30000
Time (micro seconds)
Cros
stal
k In
tens
ity
Start of VBI1
End of VBI1 End of VBI2Start of VBI2Start of VBI1
R-eye ImageL-eye Image
Figure 7: Illustration of the crosstalk model (with exaggerated phosphor response for illustrative purposes). Top: phosphor response and shutter response. Bottom: multiplication of phosphor response by the shutter response to give the amount of crosstalk.
To calculate the crosstalk at another pixel, let’s say further down the screen, the above procedure is repeated with the phosphor response delayed in time with respect to the shutter response by the appropriate interval. (This reflects the fact that each pixel on a CRT is excited at a slightly different time. For a typical raster scanning pattern, the cathode ray sweeps horizontal lines down the screen, from the top-left to the bottom-right.) In this iterative fashion, a ghosting profile w.r.t. screen position can be gradually built up.
3. RESULTS 3.1 CROSSTALK MODEL RESULTS
The crosstalk model discussed in Section 2.2 has been prototyped in Excel and uses the input data illustrated in Figures 3 and 5. In this first instance the model has been calculated for a screen refresh rate of 60Hz. The crosstalk model has been run for each of the three colours and also for multiple positions down the screen. The results for each of the three primary colours are shown in Figure 8(a,b,c). The graphs show three parameters: (a) total crosstalk, (b) crosstalk due to shutter leakage, and (c) crosstalk due to phosphor afterglow, plotted versus screen height.
Proc. SPIE Vol. 4660 73
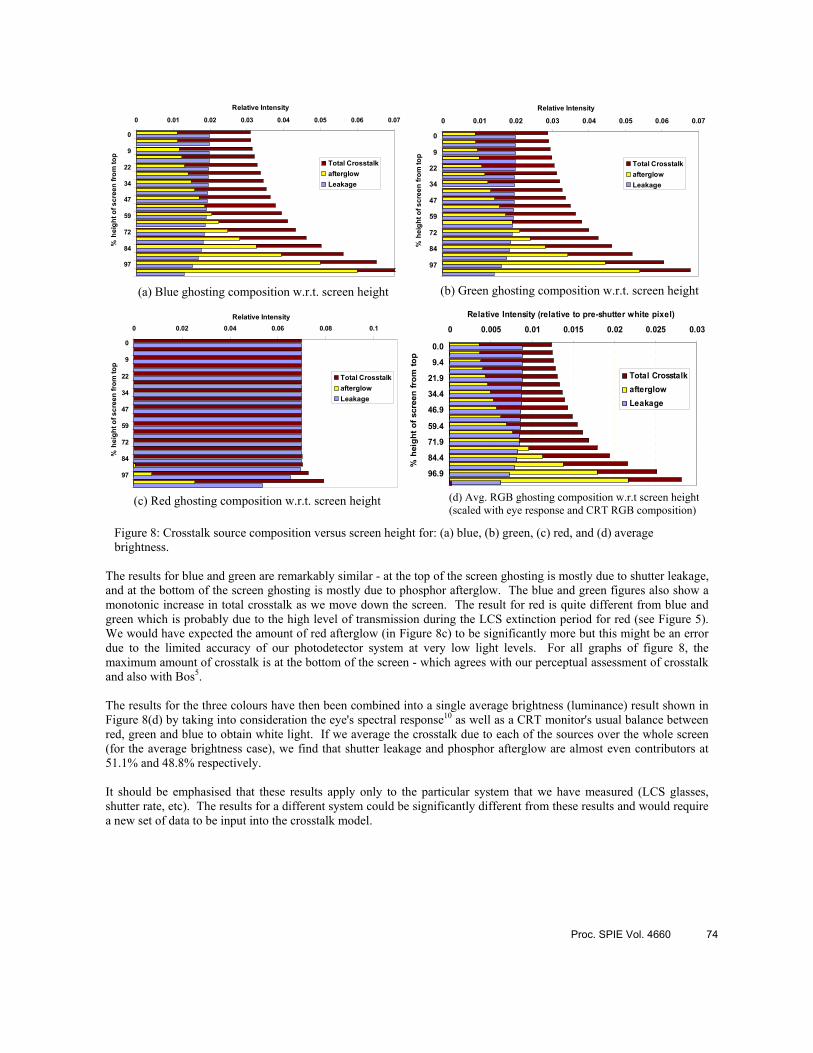
Ghosting Composition w.r.t. screen height
0 0.01 0.02 0.03 0.04 0.05 0.06 0.07
0
9
22
34
47
59
72
84
97
% h
eigh
t of s
cree
n fro
m to
pRelative Intensity
Total CrosstalkafterglowLeakage
Ghosting Composition w.r.t. screen height
0 0.01 0.02 0.03 0.04 0.05 0.06 0.07
0
9
22
34
47
59
72
84
97
% h
eigh
t of s
cree
n fro
m to
p
Relative Intensity
Total CrosstalkafterglowLeakage
Red Ghosting Composition w.r.t. screen height
0 0.02 0.04 0.06 0.08 0.1
0
9
22
34
47
59
72
84
97
% h
eigh
t of s
cree
n fro
m to
p
Relative Intensity
Total CrosstalkafterglowLeakage
Figure 8: Crosstalk source composition versus screen height for: (a) blue, (b) green, (c) red, and (d) average brightness.
The results for blue and green are remarkably similar - at the top of the screen ghosting is mostly due to shutter leakage, and at the bottom of the screen ghosting is mostly due to phosphor afterglow. The blue and green figures also show a monotonic increase in total crosstalk as we move down the screen. The result for red is quite different from blue and green which is probably due to the high level of transmission during the LCS extinction period for red (see Figure 5). We would have expected the amount of red afterglow (in Figure 8c) to be significantly more but this might be an error due to the limited accuracy of our photodetector system at very low light levels. For all graphs of figure 8, the maximum amount of crosstalk is at the bottom of the screen - which agrees with our perceptual assessment of crosstalk and also with Bos5. The results for the three colours have then been combined into a single average brightness (luminance) result shown in Figure 8(d) by taking into consideration the eye's spectral response10 as well as a CRT monitor's usual balance between red, green and blue to obtain white light. If we average the crosstalk due to each of the sources over the whole screen (for the average brightness case), we find that shutter leakage and phosphor afterglow are almost even contributors at 51.1% and 48.8% respectively. It should be emphasised that these results apply only to the particular system that we have measured (LCS glasses, shutter rate, etc). The results for a different system could be significantly different from these results and would require a new set of data to be input into the crosstalk model.
(d) Avg. RGB Ghosting Composition w.r.t. screen height (scaled with eye response and CRT RGB composition)
0 0.005 0.01 0.015 0.02 0.025 0.03
0.0
9.4
21.9
34.4
46.9
59.4
71.9
84.4
96.9
% h
eigh
t of s
cree
n fr
om to
p
Relative Intensity (relative to pre-shutter white pixel)
Total CrosstalkafterglowLeakage
(a) Blue ghosting composition w.r.t. screen height (b) Green ghosting composition w.r.t. screen height
(c) Red ghosting composition w.r.t. screen height (d) Avg. RGB ghosting composition w.r.t screen height(scaled with eye response and CRT RGB composition)
Proc. SPIE Vol. 4660 74

3.2 VALIDATION
To provide us with a quick check that the results from the crosstalk model were close to correct, we used a digital camera to capture the presence of crosstalk on a time-sequential stereoscopic display. Although the digital camera (a Kodak DC625) is by no means a metric device, it would at least provide us with some level of validation. Figure 9 shows a photograph taken through the right shutter, with the glasses shuttering, the screen was showing a time sequential image, the right image was set to black and the left image was set to full screen 100% green (the other colours were tested separately). The increase of crosstalk toward the bottom of the screen can be clearly observed, and is in accord with the crosstalk model results shown in Figure 8. Figure 10 shows a 3D plot of the data of Figure 9 and shows the nature of the increase in ghost intensity at the bottom of the screen.
Figure 9: Digital photograph of green ghosting Figure 10: 3D histogram of Figure 9 In order to compare the crosstalk model with the digital camera results for total crosstalk, the ghost to (intended) transmission (G/T) Ratio with respect to screen height was calculated. This ratio was used since the camera's absolute light sensitivity was unknown. Figure 11 shows a comparison of (G/T) ratio calculated from the crosstalk model, and that calculated from data extracted from the digital photographs for each of the three primary colours. The closest match is with the green response. Although there is an offset between the two curves (modelled and measured), the ‘shape’ of the two curves is remarkably similar. The similarity of the two curves provides some reassurance as to the accuracy of the crosstalk model for the green case. The offset between the two curves may be due to a scaling, exposure or non-linearity issue with the digital camera or may simply represent an error with the crosstalk model. The results for blue and red (Figure 11b,c) aren't quite as close but the shape is somewhat similar. An offset between the model and the measured is again present.
Proc. SPIE Vol. 4660 75

Green Phosphor
0 0.05 0.1 0.15 0.2 0.25 0.3 0.35 0.4 0.45
0
9
22
34
47
59
72
84
97%
Hei
ght f
rom
top
of s
cree
n
Ghosting to Transmission Ratio
ModelMeasured
Blue Phosphor
0 0.05 0.1 0.15 0.2 0.25 0.3 0.35 0.4 0.45 0.5
0.0
9.4
21.9
34.4
46.9
59.4
71.9
84.4
96.9
% H
eigh
t fro
m to
p of
scr
een
Ghosting to Transmission Ratio
ModelMeasured
Red Phosphor
0 0.05 0.1 0.15 0.2 0.25 0.3 0.35
0.0
9.4
21.9
34.4
46.9
59.4
71.9
84.4
96.9
% H
eigh
t fro
m to
p of
scr
een
Ghosting to Transmission Ratio
ModelMeasured
Figure 11: Ghost to Transmission Ratio Comparison for (a) Green, (b) Blue, and (c) Red.
4. CONCLUSION This paper has discussed the development of a model for crosstalk/ghosting in time-sequential stereoscopic displays. The model provides insight into the mechanisms by which crosstalk occurs. Preliminary validation of the model indicates that it gives a reasonable prediction of crosstalk, however more work is needed for complete validation. Some of the limitations of the current crosstalk model are: the method used to measure the LCS transmission response in the red channel may not be accurate (because the LED spectral response does not match the red phosphor response), the CRT phosphor afterglow measurements may not be entirely accurate (the photodetector system that we used has limited accuracy in low light levels), and the photodetector system has a bandwidth which is very close to the expected bandwidth of the phosphor afterglow response (hence we may be missing high frequency information for the phosphor time response). The advantage of the crosstalk model is that it allows the quick simulation of crosstalk under a variety of conditions and hence may be a useful tool to help find ways to reduce crosstalk in stereoscopic displays. One immediate observation of this study is that the first thing to consider when attempting to reduce crosstalk is to consider changing the LCS glasses (or at least review the performance of the LCS glasses being used). This study found considerable performance variation between various makes and models of LCS glasses. In contrast, very little performance variation was noted between commonly available CRT monitors – hence little change is likely to be obtained by simply swapping monitors. Monitors with short phosphor persistence may well be available by special order but this was beyond the scope of this particular study.
(a)
(b) (c)
Proc. SPIE Vol. 4660 76
The crosstalk model in its current form isn’t particularly user friendly and could be rewritten to improve this aspect. The crosstalk model could also be extended to simulate the use of stereoscopic polarisation modulator panels (such as available from NuVision and StereoGraphics), and could also be modified to simulate the change in crosstalk that would occur with higher field/frame rates. Using a different phosphor time response data set, the model could also simulate the use of CRT projectors for time-sequential stereoscopic display (CRT projectors have a different phosphor time response and spectral response than most CRT monitors). We have also considered the effect of some of the other sources of crosstalk (as discussed in the introduction), however a full description of these studies is beyond the scope of this paper. 9 We hope that the reader has gained a better understanding of the mechanisms of stereoscopic image ghosting/crosstalk from the presentation of this research.
REFERENCES 1. T.J. Haven, “A liquid-crystal video stereoscope with high extinction ratios, a 28% transmission state, and 100 µs
switching”, in True Three-Dimensional Imaging Techniques & Display Technologies, D.F. McAllister, W.E. Robbins, Editors, Proceedings of SPIE vol. 761, pp. 23-26, Bellingham Washington USA, 1987.
2. L. Lipton, J. Halnon, J. Wuopio, B. Dorworth, “Eliminating π-cell artefacts”, in Stereoscopic Displays & Virtual Reality Systems VII, J.O. Merritt, S.A. Benton. A.J. Woods, M.T. Bolas, Editors, Proceedings of SPIE vol.3957, pp. 264-270, Bellingham Washington USA, 2000.
3. P.J. Bos, T. Haven, “Field-Sequential Stereoscopic Viewing Systems using Passive Glasses”, in SID Vol. 30/1, pp. 39-43, 1989.
4. J.S. Lipscomb, W.L. Wooten, “Reducing Crosstalk between Stereoscopic Views”, in Stereoscopic Displays & Virtual Reality System, S.S. Fisher, J.O. Merritt, M.T. Bolas, Editors, Proceedings of SPIE vol.2177, pp. 92-96, Bellingham Washington USA, 1994.
5. P.J. Bos, “Time Sequential Stereoscopic Displays: The Contribution of Phosphor Persistence to the ‘Ghost’ Image Intensity”, in Three-Dimensional Image Technologies, H. Kusaka, Editor, Proceedings of ITEC’91, ITE Annual Convention, pp. 603-606, Institute of Television Engineering of Japan, Tokyo, Japan, July 1991.
6. L. Lipton, “The Stereoscopic Cinema: From Film to Digital Projection”, in SMPTE Journal, pp. 586-593, Sept 2001.
7. L. Lipton, “High Dynamic Range Electro-Optical Shutter for Stereoscopic and other Applications”, United States Patent #5 117 302, May 1992.
8. IPL 10530 Integrated Photodiode Amplifiers, Product Data Sheet, Integrated Photomatrix Limited, Dorchester, United Kingdom. [online]: http://www.ipl-uk.com
9. S.S.L. Tan, Sources of Crosstalk in Stereoscopic 3D Displays, Centre for Marine Science & Technology, Curtin University of Technology, Perth, Australia, 2001.
10. A. Ryer, International Light Handbook, pp. 11, International Light Corporation, Newburyport, Massachusetts, USA, 1997. [online]: http://www.intl-light.com/handbook
Proc. SPIE Vol. 4660 77

Paper 10 A. J. Woods, T. Rourke (2004) “Ghosting in Anaglyphic Stereoscopic Images”
presented at Stereoscopic Displays and Applications XV (SD&A), published in Stereoscopic Displays and Virtual Reality Systems XI, Proceedings of IS&T/SPIE Electronic Imaging, SPIE Vol. 5291, pp. 354‐365, San Jose, California, January 2004.

Ghosting in Anaglyphic Stereoscopic Images
Andrew J. Woods*, Tegan Rourke Centre for Marine Science & Technology (CMST), Curtin University of Technology
ABSTRACT Anaglyphic 3D images are an easy way of displaying stereoscopic 3D images on a wide range of display types, eg. CRT, LCD, print, etc. While the anaglyphic 3D image method is cheap and accessible, its use requires a compromise in stereoscopic image quality. A common problem with anaglyphic 3D images is ghosting. Ghosting (or crosstalk) is the leaking of an image to one eye, when it is intended exclusively for the other eye. Ghosting degrades the ability of the observer to fuse the stereoscopic image and hence the quality of the 3D image is reduced. Ghosting is present in various levels with most stereoscopic displays, however it is often particularly evident with anaglyphic 3D images. This paper describes a project whose aim was to characterise the presence of ghosting in anaglyphic 3D images due to spectral issues. The spectral response curves of several different display types and several different brands of anaglyph glasses were measured using a spectroradiometer or spectrophotometer. A mathematical model was then developed to predict the amount of crosstalk in anaglyphic 3D images when different combinations of displays and glasses are used, and therefore predict the best type of anaglyph glasses for use with a particular display type. Keywords: Anaglyph, stereoscopic, 3D, crosstalk, ghosting, image quality.
1. INTRODUCTION There are many methods of displaying a stereoscopic image, including polarized images, time-sequential alternating frames, two separate images viewed through a binocular lens arrangement, and others. The method used in this project is the anaglyph. Here, the two perspective images are combined into a single image using a complimentary colour coding technique. For example, if a red/cyan anaglyph method is used, the left perspective image is stored in the red channel and the right perspective image is stored in the blue and green colour channels (blue + green = cyan). The observer wears a pair of glasses with one eye’s filter coloured red, and the other eye’s filter coloured cyan. The filters act to permit the transmission of the correct image to each eye but prevent the transmission of the image not intended for that eye. The brain processes the different perspective images and depth is perceived in the image. Anaglyphic 3D encoding can be performed using any pair of complimentary colours to store the left and right perspective images. Red/cyan is the most common choice however yellow/blue is also used, and green/magenta is also theoretically possible. The combination of red/blue or red/green can also be used – however brightness is reduced because one of the colour channels is missing in each case. The main advantages of the anaglyphic 3D method are its simplicity and low cost. All that is required is an anaglyphic 3D image, which can be displayed using almost any colour display method, and a corresponding pair of anaglyphic 3D glasses. The main disadvantages of anaglyphic images are their inability to accurately depict full-colour images, and the presence of crosstalk. Crosstalk or ghosting is the leaking of an image to one eye, when it is intended exclusively for the other eye. It happens with most stereoscopic displays and results in reduced image quality and difficulty of fusion if the crosstalk is large. Possible sources of crosstalk in anaglyphic images are: • Display spectral response
Most emissive type displays (e.g. CRTs, LCDs, DMDs) work by emitting light in three specific primary colour bands (red, green and blue). The actual spectral content of each light band can vary quite considerably between different display types. If the spectrum of the primary colour bands overlap with each other by any significant
* [email protected]; phone: +61 8 9266 7920; fax: +61 8 9266 4799; http://www.cmst.curtin.edu.au; Centre for Marine Science & Technology, Curtin University of Technology, GPO Box U1987, Perth 6845, AUSTRALIA.
Stereoscopic Displays and Virtual Reality Systems XI, edited by Andrew J. Woods, John O. Merritt, Stephen A. Benton,Mark T. Bolas, Proc. of SPIE-IS&T Electronic Imaging, SPIE Vol. 5291 © 2004 SPIE and IS&T · 0277-786X/04/$15
354
A. J. Woods, T. Rourke (2004) “Ghosting in Anaglyphic Stereoscopic Images” presented at Stereoscopic Displays and Applications XV (SD&A), published in Stereoscopic Displays and Virtual Reality Systems XI, Proceedings of IS&T/SPIE Electronic Imaging, SPIE Vol. 5291, pp. 354‐365, San Jose, California, January 2004.
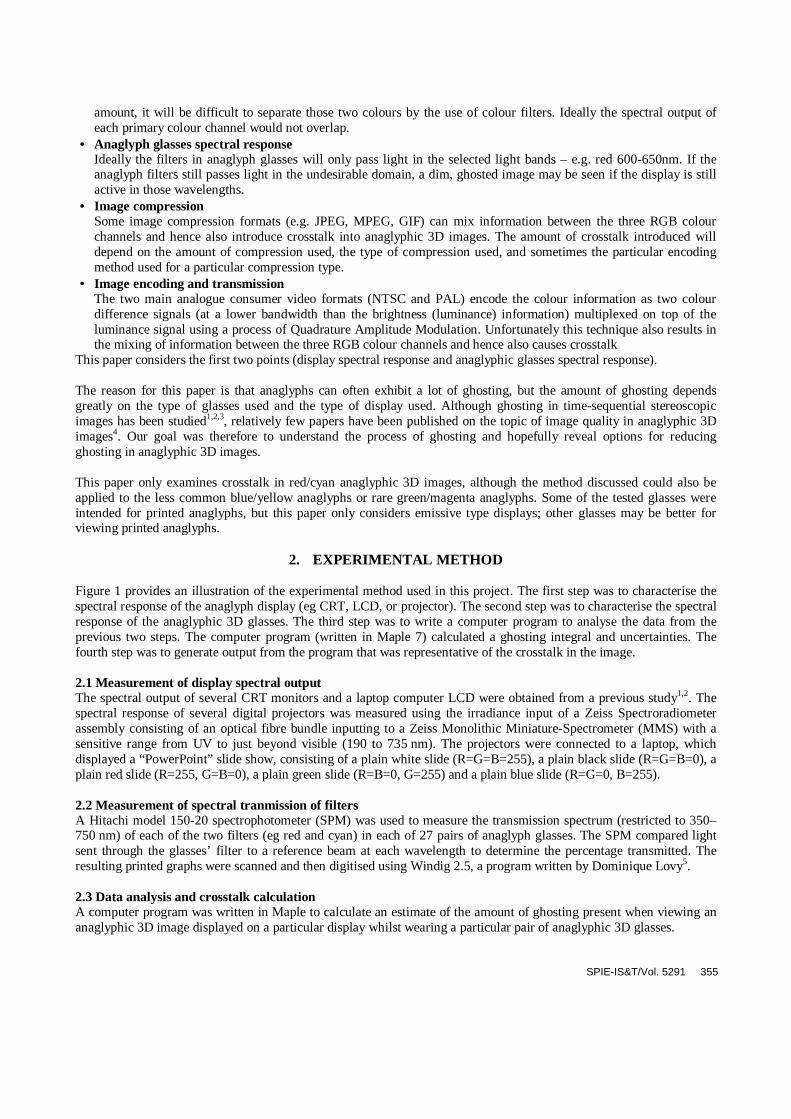
amount, it will be difficult to separate those two colours by the use of colour filters. Ideally the spectral output of each primary colour channel would not overlap.
• Anaglyph glasses spectral response Ideally the filters in anaglyph glasses will only pass light in the selected light bands – e.g. red 600-650nm. If the anaglyph filters still passes light in the undesirable domain, a dim, ghosted image may be seen if the display is still active in those wavelengths.
• Image compression Some image compression formats (e.g. JPEG, MPEG, GIF) can mix information between the three RGB colour channels and hence also introduce crosstalk into anaglyphic 3D images. The amount of crosstalk introduced will depend on the amount of compression used, the type of compression used, and sometimes the particular encoding method used for a particular compression type.
• Image encoding and transmission The two main analogue consumer video formats (NTSC and PAL) encode the colour information as two colour difference signals (at a lower bandwidth than the brightness (luminance) information) multiplexed on top of the luminance signal using a process of Quadrature Amplitude Modulation. Unfortunately this technique also results in the mixing of information between the three RGB colour channels and hence also causes crosstalk
This paper considers the first two points (display spectral response and anaglyphic glasses spectral response). The reason for this paper is that anaglyphs can often exhibit a lot of ghosting, but the amount of ghosting depends greatly on the type of glasses used and the type of display used. Although ghosting in time-sequential stereoscopic images has been studied1,2,3, relatively few papers have been published on the topic of image quality in anaglyphic 3D images4. Our goal was therefore to understand the process of ghosting and hopefully reveal options for reducing ghosting in anaglyphic 3D images. This paper only examines crosstalk in red/cyan anaglyphic 3D images, although the method discussed could also be applied to the less common blue/yellow anaglyphs or rare green/magenta anaglyphs. Some of the tested glasses were intended for printed anaglyphs, but this paper only considers emissive type displays; other glasses may be better for viewing printed anaglyphs.
2. EXPERIMENTAL METHOD Figure 1 provides an illustration of the experimental method used in this project. The first step was to characterise the spectral response of the anaglyph display (eg CRT, LCD, or projector). The second step was to characterise the spectral response of the anaglyphic 3D glasses. The third step was to write a computer program to analyse the data from the previous two steps. The computer program (written in Maple 7) calculated a ghosting integral and uncertainties. The fourth step was to generate output from the program that was representative of the crosstalk in the image. 2.1 Measurement of display spectral output The spectral output of several CRT monitors and a laptop computer LCD were obtained from a previous study1,2. The spectral response of several digital projectors was measured using the irradiance input of a Zeiss Spectroradiometer assembly consisting of an optical fibre bundle inputting to a Zeiss Monolithic Miniature-Spectrometer (MMS) with a sensitive range from UV to just beyond visible (190 to 735 nm). The projectors were connected to a laptop, which displayed a “PowerPoint” slide show, consisting of a plain white slide (R=G=B=255), a plain black slide (R=G=B=0), a plain red slide (R=255, G=B=0), a plain green slide (R=B=0, G=255) and a plain blue slide (R=G=0, B=255). 2.2 Measurement of spectral tranmission of filters A Hitachi model 150-20 spectrophotometer (SPM) was used to measure the transmission spectrum (restricted to 350–750 nm) of each of the two filters (eg red and cyan) in each of 27 pairs of anaglyph glasses. The SPM compared light sent through the glasses’ filter to a reference beam at each wavelength to determine the percentage transmitted. The resulting printed graphs were scanned and then digitised using Windig 2.5, a program written by Dominique Lovy5. 2.3 Data analysis and crosstalk calculation A computer program was written in Maple to calculate an estimate of the amount of ghosting present when viewing an anaglyphic 3D image displayed on a particular display whilst wearing a particular pair of anaglyphic 3D glasses.
SPIE-IS&T/Vol. 5291 355
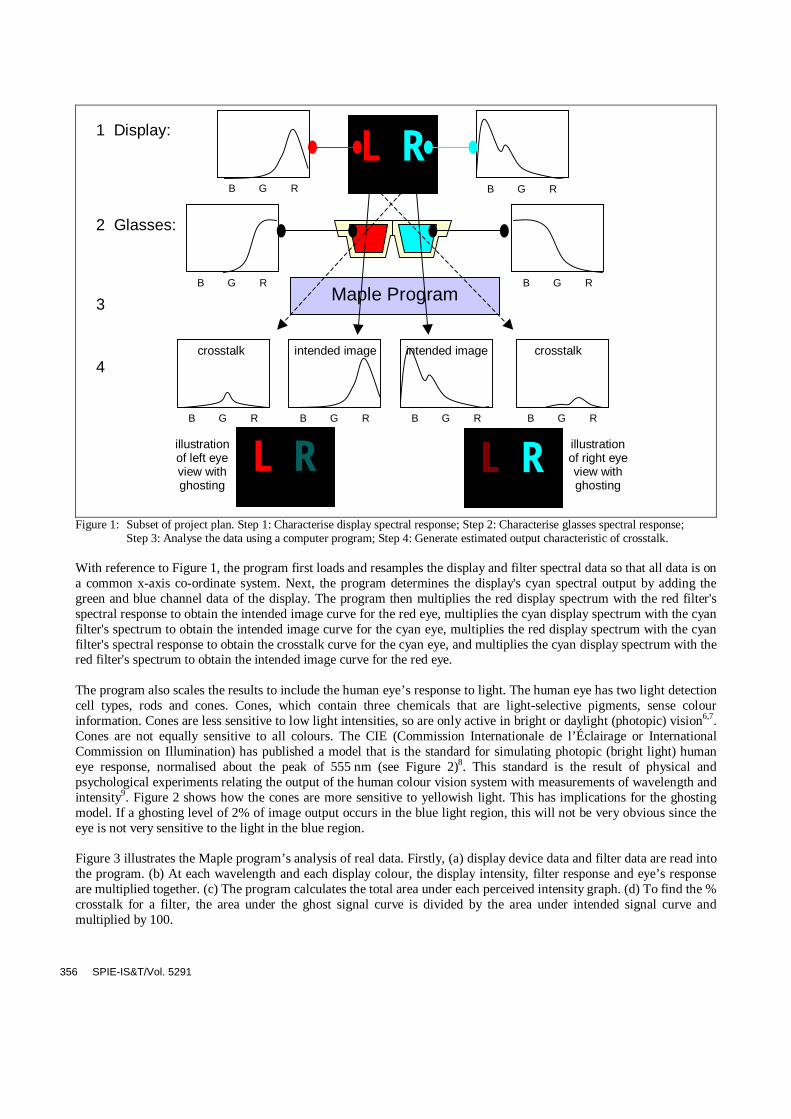
1 Display: 2 Glasses: 3 crosstalk intended image intended image crosstalk
4 illustration illustration of left eye of right eye view with view with ghosting ghosting
Figure 1: Subset of project plan. Step 1: Characterise display spectral response; Step 2: Characterise glasses spectral response;
Step 3: Analyse the data using a computer program; Step 4: Generate estimated output characteristic of crosstalk. With reference to Figure 1, the program first loads and resamples the display and filter spectral data so that all data is on a common x-axis co-ordinate system. Next, the program determines the display's cyan spectral output by adding the green and blue channel data of the display. The program then multiplies the red display spectrum with the red filter's spectral response to obtain the intended image curve for the red eye, multiplies the cyan display spectrum with the cyan filter's spectrum to obtain the intended image curve for the cyan eye, multiplies the red display spectrum with the cyan filter's spectral response to obtain the crosstalk curve for the cyan eye, and multiplies the cyan display spectrum with the red filter's spectrum to obtain the intended image curve for the red eye. The program also scales the results to include the human eye’s response to light. The human eye has two light detection cell types, rods and cones. Cones, which contain three chemicals that are light-selective pigments, sense colour information. Cones are less sensitive to low light intensities, so are only active in bright or daylight (photopic) vision6,7. Cones are not equally sensitive to all colours. The CIE (Commission Internationale de l’Éclairage or International Commission on Illumination) has published a model that is the standard for simulating photopic (bright light) human eye response, normalised about the peak of 555 nm (see Figure 2)8. This standard is the result of physical and psychological experiments relating the output of the human colour vision system with measurements of wavelength and intensity9. Figure 2 shows how the cones are more sensitive to yellowish light. This has implications for the ghosting model. If a ghosting level of 2% of image output occurs in the blue light region, this will not be very obvious since the eye is not very sensitive to the light in the blue region. Figure 3 illustrates the Maple program’s analysis of real data. Firstly, (a) display device data and filter data are read into the program. (b) At each wavelength and each display colour, the display intensity, filter response and eye’s response are multiplied together. (c) The program calculates the total area under each perceived intensity graph. (d) To find the % crosstalk for a filter, the area under the ghost signal curve is divided by the area under intended signal curve and multiplied by 100.
B G R
B G R B G R
B G R B G R B G R
B G R
B G R
L R
Maple Program
L R L R
356 SPIE-IS&T/Vol. 5291
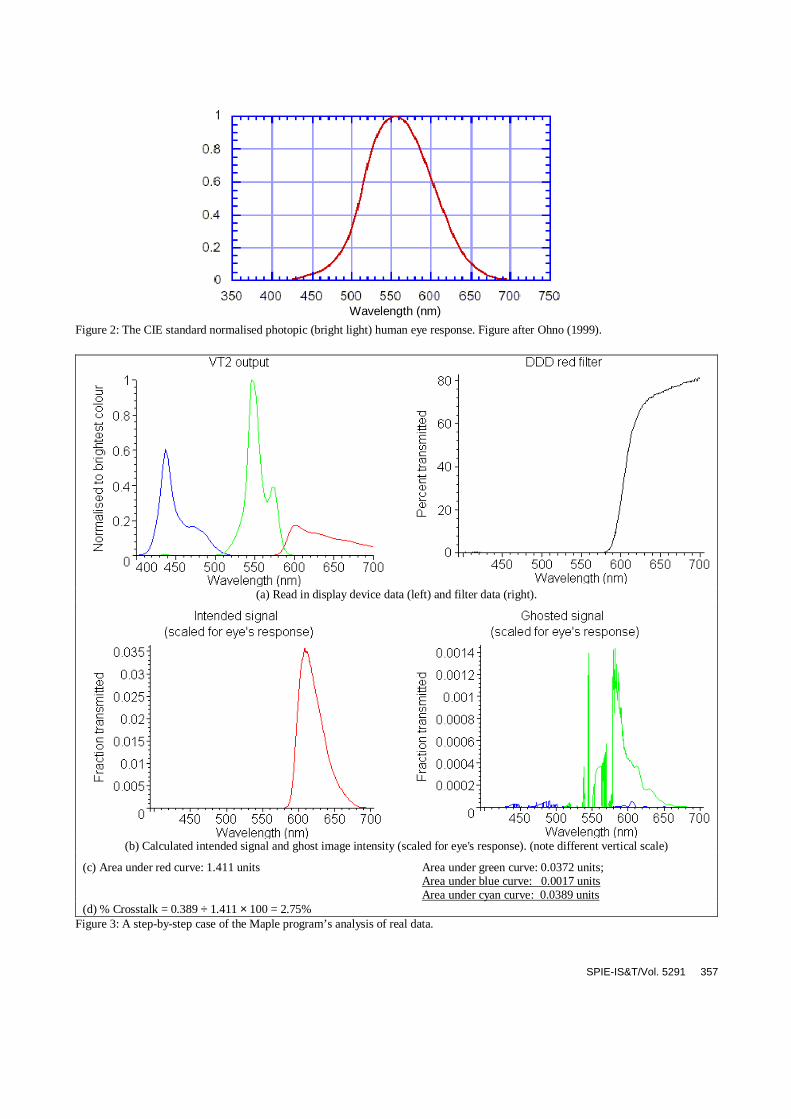
Figure 2: The CIE standard normalised photopic (bright light) human eye response. Figure after Ohno (1999).
(a) Read in display device data (left) and filter data (right).
(b) Calculated intended signal and ghost image intensity (scaled for eye's response). (note different vertical scale)
(c) Area under red curve: 1.411 units Area under green curve: 0.0372 units; Area under blue curve: 0.0017 units Area under cyan curve: 0.0389 units
(d) % Crosstalk = 0.389 ÷ 1.411 × 100 = 2.75% Figure 3: A step-by-step case of the Maple program’s analysis of real data.
Wavelength (nm)
SPIE-IS&T/Vol. 5291 357
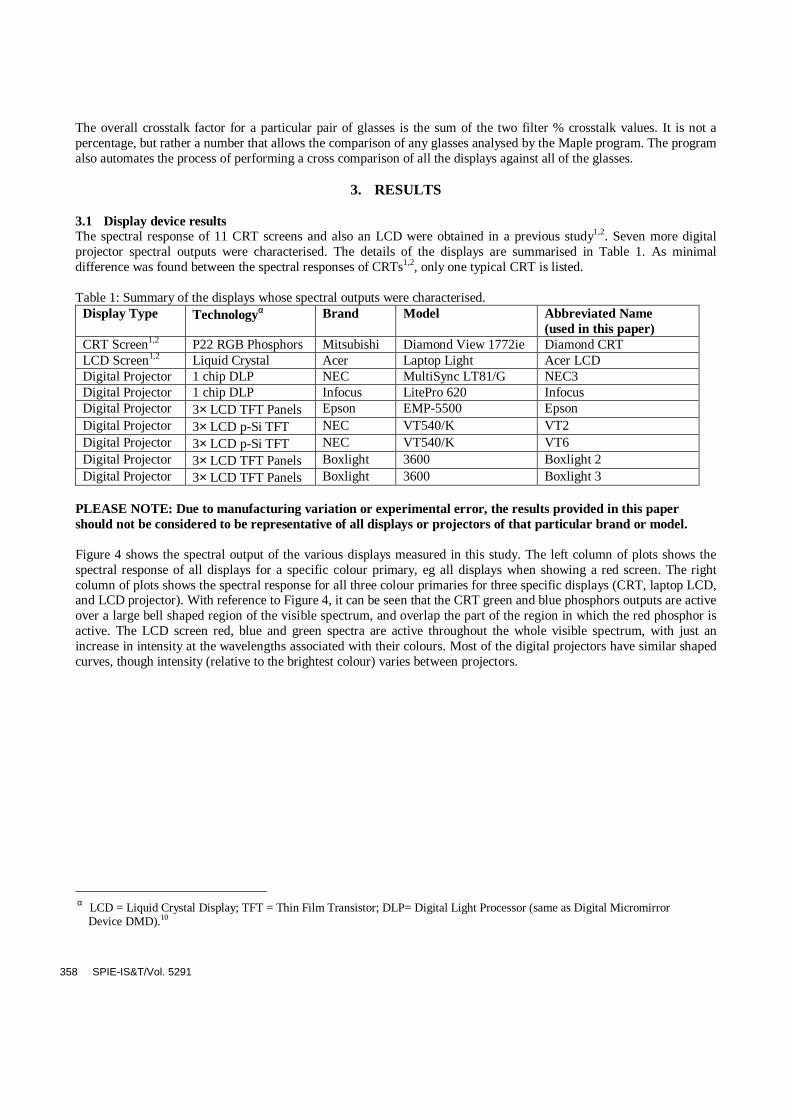
The overall crosstalk factor for a particular pair of glasses is the sum of the two filter % crosstalk values. It is not a percentage, but rather a number that allows the comparison of any glasses analysed by the Maple program. The program also automates the process of performing a cross comparison of all the displays against all of the glasses.
3. RESULTS 3.1 Display device results The spectral response of 11 CRT screens and also an LCD were obtained in a previous study1,2. Seven more digital projector spectral outputs were characterised. The details of the displays are summarised in Table 1. As minimal difference was found between the spectral responses of CRTs1,2, only one typical CRT is listed. Table 1: Summary of the displays whose spectral outputs were characterised.
Display Type Technologyα Brand Model Abbreviated Name (used in this paper)
CRT Screen1,2 P22 RGB Phosphors Mitsubishi Diamond View 1772ie Diamond CRT LCD Screen1,2 Liquid Crystal Acer Laptop Light Acer LCD Digital Projector 1 chip DLP NEC MultiSync LT81/G NEC3 Digital Projector 1 chip DLP Infocus LitePro 620 Infocus Digital Projector 3× LCD TFT Panels Epson EMP-5500 Epson Digital Projector 3× LCD p-Si TFT NEC VT540/K VT2 Digital Projector 3× LCD p-Si TFT NEC VT540/K VT6 Digital Projector 3× LCD TFT Panels Boxlight 3600 Boxlight 2 Digital Projector 3× LCD TFT Panels Boxlight 3600 Boxlight 3
PLEASE NOTE: Due to manufacturing variation or experimental error, the results provided in this paper should not be considered to be representative of all displays or projectors of that particular brand or model. Figure 4 shows the spectral output of the various displays measured in this study. The left column of plots shows the spectral response of all displays for a specific colour primary, eg all displays when showing a red screen. The right column of plots shows the spectral response for all three colour primaries for three specific displays (CRT, laptop LCD, and LCD projector). With reference to Figure 4, it can be seen that the CRT green and blue phosphors outputs are active over a large bell shaped region of the visible spectrum, and overlap the part of the region in which the red phosphor is active. The LCD screen red, blue and green spectra are active throughout the whole visible spectrum, with just an increase in intensity at the wavelengths associated with their colours. Most of the digital projectors have similar shaped curves, though intensity (relative to the brightest colour) varies between projectors.
α LCD = Liquid Crystal Display; TFT = Thin Film Transistor; DLP= Digital Light Processor (same as Digital Micromirror Device DMD).10
358 SPIE-IS&T/Vol. 5291
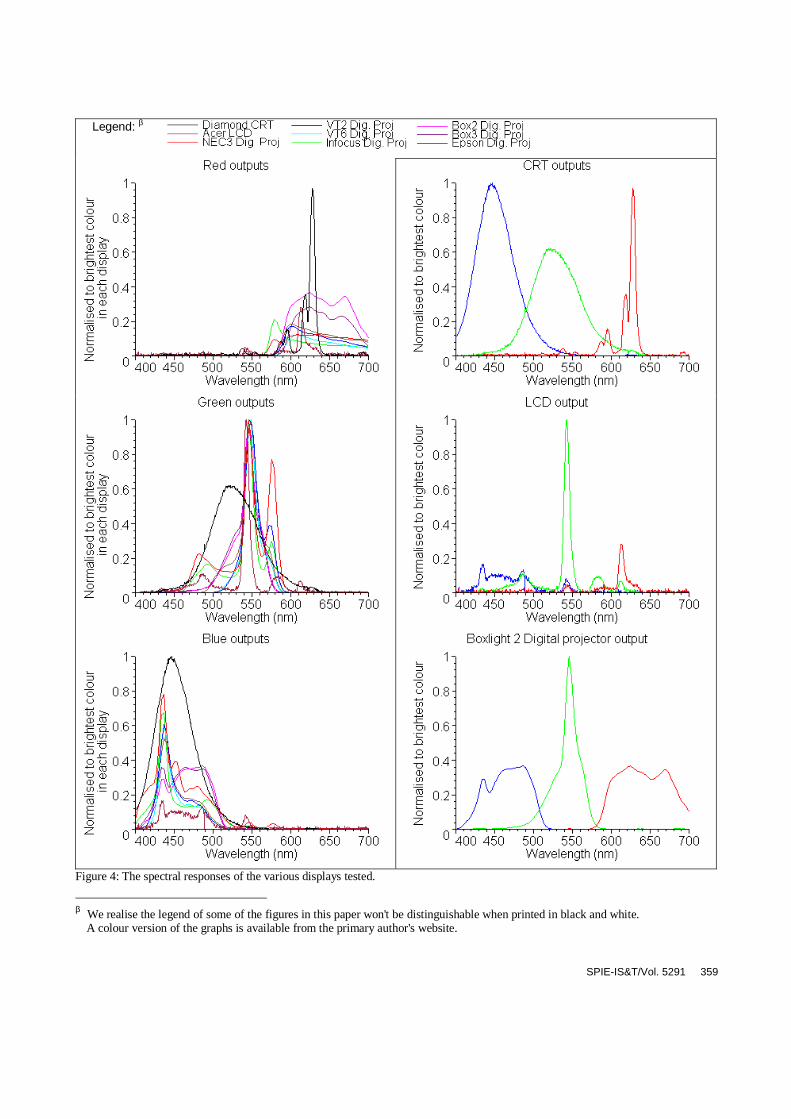
Legend: β
Figure 4: The spectral responses of the various displays tested.
β We realise the legend of some of the figures in this paper won't be distinguishable when printed in black and white. A colour version of the graphs is available from the primary author's website.
SPIE-IS&T/Vol. 5291 359

3.2 Anaglyph filter results To fulfil Step 2 of the plan, data characterising the transmission spectra of various anaglyphic 3D glasses were acquired. Table 2 lists the various red/cyan anaglyphic 3D glasses measured. Table 2: Red/Cyan Anaglyphic glasses measured.
Glasses Number
Name Other information on glasses
3DG 2 IMAX/OMNIMAX "Fujitsu presentation of “We are born of stars”; © IMAX Systems Corp., 1986; Made in USA by Theatric Support, Studio City, California."
3DG 3 National Geographic Distributed with August 1998 edition of National Geographic Magazine 3DG 4 Sports Illustrated Distributed with Winter 2000 edition of Sports Illustrated magazine (US edition).
"MFGD by Theatric Support." 3DG 6 3D Greets Attached to a pseudo-colour anaglyph postcard of a Tiger. 3DG 8 Spectacles "Theatric Support, Studio City CA" Hard-rimmed spectacles purchased from Reel-3D. 3DG 9 Bugs! From Bugs! magazine series 3DG 11 [no name] [no identification or writing on glasses – white cardboard] 3DG 14 Reel 3D #1 Purchased from Reel-3D – apparently made by Theatric Support. 3DG 15 Reel 3D #2 Purchased from Reel-3D. 3DG 16 Freddy's Dead "The Final Nightmare; New Line Cinema 1991" Distributed at showings of the movie
"Freddy's Dead: The Final Nightmare" 3DG 17 3D Video Glasses "© 1982 3D Video Corp., N. Hollywood, California; for use with 3D Video
electronically processed TV programs" 3DG 18 Rhino Home Video “Cat Women of the Moon”, “Robot Monster” & “The Mask” 3DG 19 DDD “www.ddd3d.com Dynamic Digital Depth”. Supplied by American Paper Optics. 3DG 20 ABC "96/97 new season premiere; http://abc.com" 3DG 21 Optic Boom “A DDD Product; ddd.com" 3DG 24 Studio 3D "Stereoscopic imaging; www.studio3d.com" 3DG 25 Sports Illustrated
Australian Edition Distributed with March 2000 edition of Sports Illustrated magazine (Australian edition).
3DG 26 Substance Comic Distributed with “3-D Substance #2" Comic, by Jack C. Harris and Steve Ditko and The 3-D Zone. ©1991.
3DG 27 Deep Vision 3D of Hollywood
"For Deep Vision 3-D TV"
3DG 28 Canon ink Canon Ink (BCI-3e C/M/Y) printed on inkjet transparency sheet 3DG 29 Spy Kids 3D "© 2003 Miramax Film Corp.; www.spykids.com, Troublemaker Studios, Dimension
Films; Mfrd by Playwerks Inc., USA " PLEASE NOTE: Although a wide selection of glasses was studied, generally only a single pair of glasses of each particular style/brand was sampled. As such, due to manufacturing variations or experimental error, the results provided in this paper should not be considered to be representative of all glasses of that particular style/brand. Figure 5 shows the combined spectral responses of the filters from the glasses listed in Table 2, grouped according to colour. It is interesting to note that there appears to be a cluster of red and cyan filters in Figure 5 that all trend along the same path. One distinct cyan cluster consists of the cyan filters of the following glasses: 3DG 6, 3DG 15, 3DG 16, 3DG 17, 3DG 19 and 3DG 21. A second distinct cyan cluster consists of the cyan filters of the following glasses: 3DG 3, 3DG 11 and 3DG 20. There are also two distinct red clusters. The first consists of the red filters of the glasses: 3DG 15, 3DG 19 and 3DG 21, and the second consists of the red filters of the glasses: 3DG 4, 3DG 9, 3DG 14 and 3DG 24. It is possible that the same chemicals are used to produce these clustered filters. Three pairs of glasses cluster together in both the red and cyan filters: 3DG 15, 3DG 19 and 3DG 21. These are probably manufactured by the same company and distributed to other companies. The fact that this path presents as a path, and not a single line, could indicate either production variability or be an artefact of the experimental procedure.
360 SPIE-IS&T/Vol. 5291
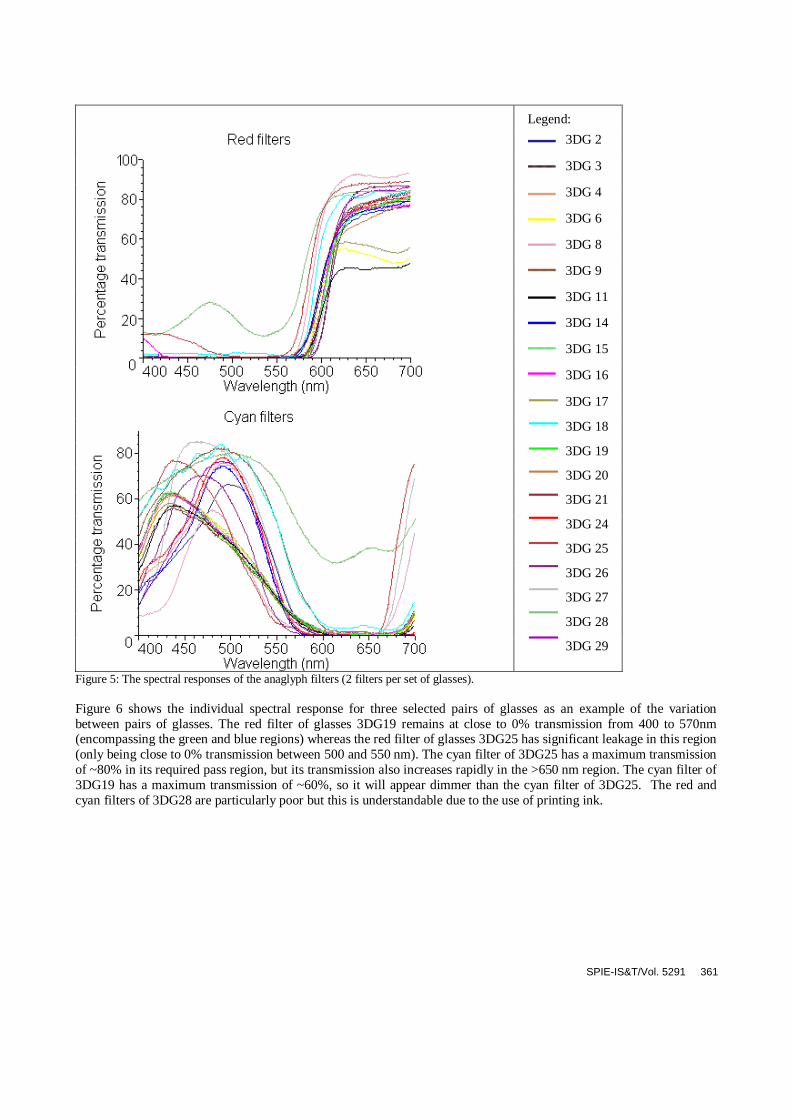
Legend:
3DG 2
3DG 3
3DG 4
3DG 6
3DG 8
3DG 9
3DG 11
3DG 14
3DG 15
3DG 16
3DG 17
3DG 18
3DG 19
3DG 20
3DG 21
3DG 24
3DG 25
3DG 26
3DG 27
3DG 28
3DG 29
Figure 5: The spectral responses of the anaglyph filters (2 filters per set of glasses). Figure 6 shows the individual spectral response for three selected pairs of glasses as an example of the variation between pairs of glasses. The red filter of glasses 3DG19 remains at close to 0% transmission from 400 to 570nm (encompassing the green and blue regions) whereas the red filter of glasses 3DG25 has significant leakage in this region (only being close to 0% transmission between 500 and 550 nm). The cyan filter of 3DG25 has a maximum transmission of ~80% in its required pass region, but its transmission also increases rapidly in the >650 nm region. The cyan filter of 3DG19 has a maximum transmission of ~60%, so it will appear dimmer than the cyan filter of 3DG25. The red and cyan filters of 3DG28 are particularly poor but this is understandable due to the use of printing ink.
SPIE-IS&T/Vol. 5291 361
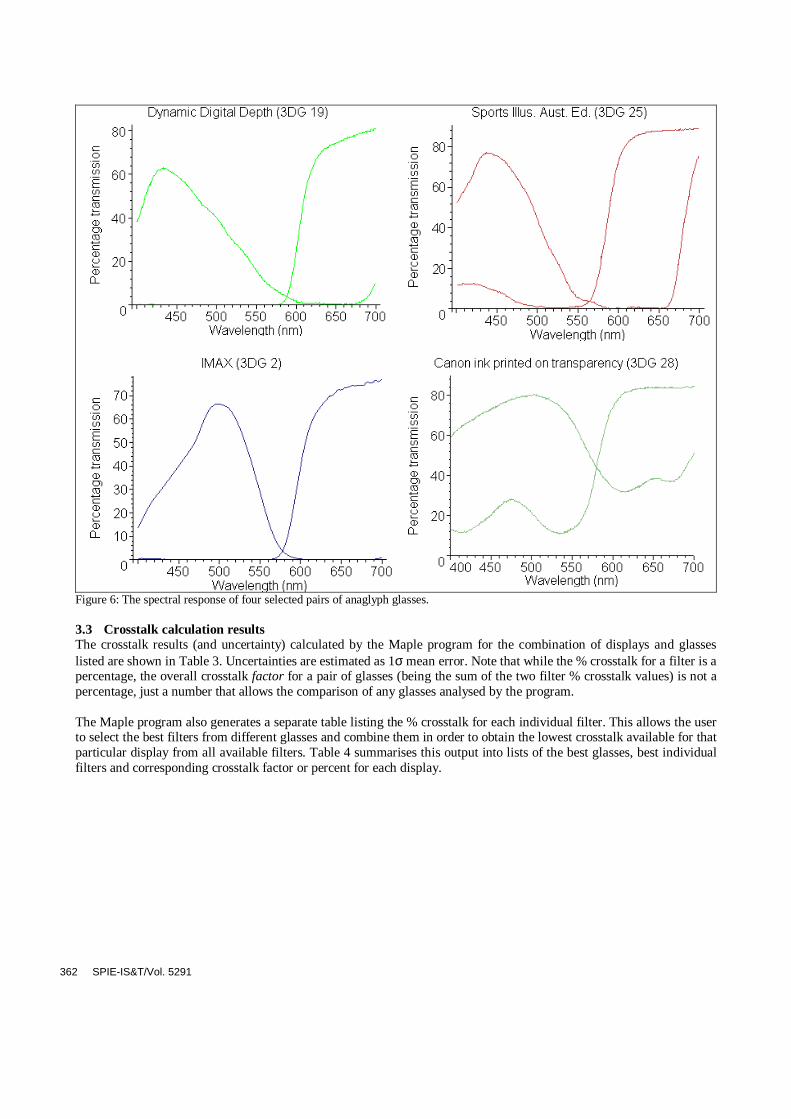
Figure 6: The spectral response of four selected pairs of anaglyph glasses. 3.3 Crosstalk calculation results The crosstalk results (and uncertainty) calculated by the Maple program for the combination of displays and glasses listed are shown in Table 3. Uncertainties are estimated as 1σ mean error. Note that while the % crosstalk for a filter is a percentage, the overall crosstalk factor for a pair of glasses (being the sum of the two filter % crosstalk values) is not a percentage, just a number that allows the comparison of any glasses analysed by the program. The Maple program also generates a separate table listing the % crosstalk for each individual filter. This allows the user to select the best filters from different glasses and combine them in order to obtain the lowest crosstalk available for that particular display from all available filters. Table 4 summarises this output into lists of the best glasses, best individual filters and corresponding crosstalk factor or percent for each display.
362 SPIE-IS&T/Vol. 5291
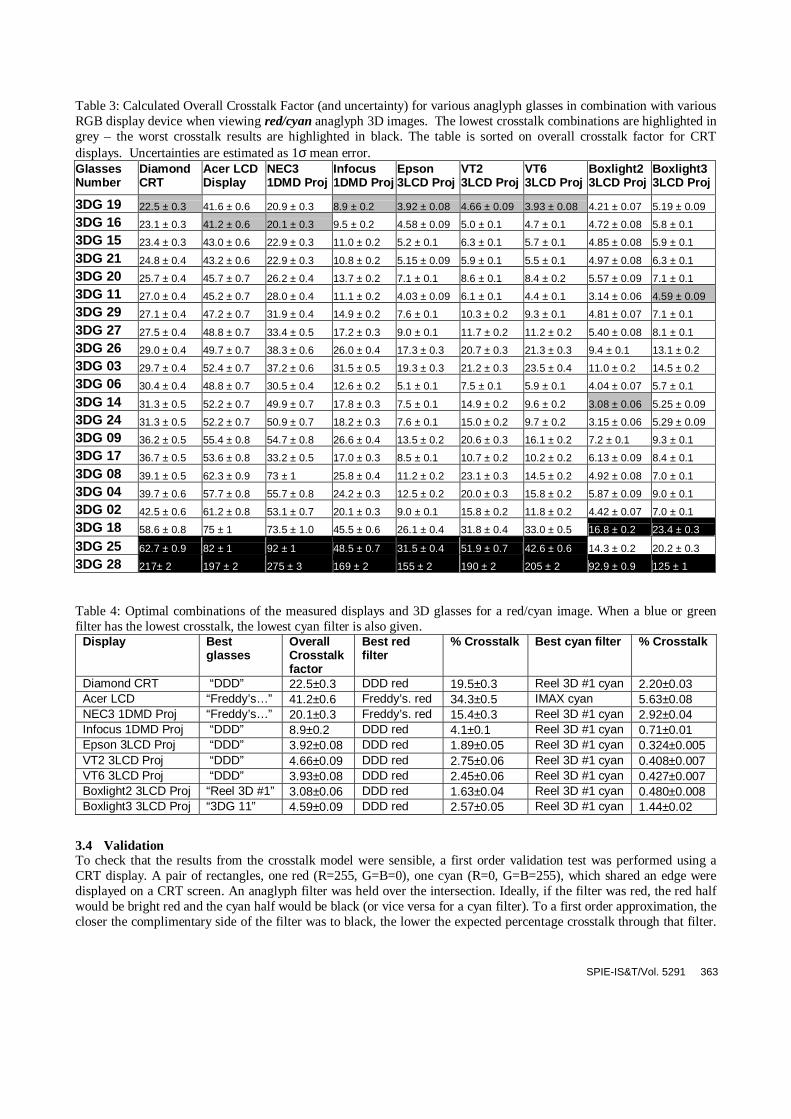
Table 3: Calculated Overall Crosstalk Factor (and uncertainty) for various anaglyph glasses in combination with various RGB display device when viewing red/cyan anaglyph 3D images. The lowest crosstalk combinations are highlighted in grey – the worst crosstalk results are highlighted in black. The table is sorted on overall crosstalk factor for CRT displays. Uncertainties are estimated as 1σ mean error. Glasses Number
Diamond CRT
Acer LCD Display
NEC3 1DMD Proj
Infocus 1DMD Proj
Epson 3LCD Proj
VT2 3LCD Proj
VT6 3LCD Proj
Boxlight2 3LCD Proj
Boxlight3 3LCD Proj
3DG 19 22.5 ± 0.3 41.6 ± 0.6 20.9 ± 0.3 8.9 ± 0.2 3.92 ± 0.08 4.66 ± 0.09 3.93 ± 0.08 4.21 ± 0.07 5.19 ± 0.09
3DG 16 23.1 ± 0.3 41.2 ± 0.6 20.1 ± 0.3 9.5 ± 0.2 4.58 ± 0.09 5.0 ± 0.1 4.7 ± 0.1 4.72 ± 0.08 5.8 ± 0.1
3DG 15 23.4 ± 0.3 43.0 ± 0.6 22.9 ± 0.3 11.0 ± 0.2 5.2 ± 0.1 6.3 ± 0.1 5.7 ± 0.1 4.85 ± 0.08 5.9 ± 0.1
3DG 21 24.8 ± 0.4 43.2 ± 0.6 22.9 ± 0.3 10.8 ± 0.2 5.15 ± 0.09 5.9 ± 0.1 5.5 ± 0.1 4.97 ± 0.08 6.3 ± 0.1
3DG 20 25.7 ± 0.4 45.7 ± 0.7 26.2 ± 0.4 13.7 ± 0.2 7.1 ± 0.1 8.6 ± 0.1 8.4 ± 0.2 5.57 ± 0.09 7.1 ± 0.1
3DG 11 27.0 ± 0.4 45.2 ± 0.7 28.0 ± 0.4 11.1 ± 0.2 4.03 ± 0.09 6.1 ± 0.1 4.4 ± 0.1 3.14 ± 0.06 4.59 ± 0.09
3DG 29 27.1 ± 0.4 47.2 ± 0.7 31.9 ± 0.4 14.9 ± 0.2 7.6 ± 0.1 10.3 ± 0.2 9.3 ± 0.1 4.81 ± 0.07 7.1 ± 0.1
3DG 27 27.5 ± 0.4 48.8 ± 0.7 33.4 ± 0.5 17.2 ± 0.3 9.0 ± 0.1 11.7 ± 0.2 11.2 ± 0.2 5.40 ± 0.08 8.1 ± 0.1
3DG 26 29.0 ± 0.4 49.7 ± 0.7 38.3 ± 0.6 26.0 ± 0.4 17.3 ± 0.3 20.7 ± 0.3 21.3 ± 0.3 9.4 ± 0.1 13.1 ± 0.2
3DG 03 29.7 ± 0.4 52.4 ± 0.7 37.2 ± 0.6 31.5 ± 0.5 19.3 ± 0.3 21.2 ± 0.3 23.5 ± 0.4 11.0 ± 0.2 14.5 ± 0.2
3DG 06 30.4 ± 0.4 48.8 ± 0.7 30.5 ± 0.4 12.6 ± 0.2 5.1 ± 0.1 7.5 ± 0.1 5.9 ± 0.1 4.04 ± 0.07 5.7 ± 0.1
3DG 14 31.3 ± 0.5 52.2 ± 0.7 49.9 ± 0.7 17.8 ± 0.3 7.5 ± 0.1 14.9 ± 0.2 9.6 ± 0.2 3.08 ± 0.06 5.25 ± 0.09
3DG 24 31.3 ± 0.5 52.2 ± 0.7 50.9 ± 0.7 18.2 ± 0.3 7.6 ± 0.1 15.0 ± 0.2 9.7 ± 0.2 3.15 ± 0.06 5.29 ± 0.09
3DG 09 36.2 ± 0.5 55.4 ± 0.8 54.7 ± 0.8 26.6 ± 0.4 13.5 ± 0.2 20.6 ± 0.3 16.1 ± 0.2 7.2 ± 0.1 9.3 ± 0.1
3DG 17 36.7 ± 0.5 53.6 ± 0.8 33.2 ± 0.5 17.0 ± 0.3 8.5 ± 0.1 10.7 ± 0.2 10.2 ± 0.2 6.13 ± 0.09 8.4 ± 0.1
3DG 08 39.1 ± 0.5 62.3 ± 0.9 73 ± 1 25.8 ± 0.4 11.2 ± 0.2 23.1 ± 0.3 14.5 ± 0.2 4.92 ± 0.08 7.0 ± 0.1
3DG 04 39.7 ± 0.6 57.7 ± 0.8 55.7 ± 0.8 24.2 ± 0.3 12.5 ± 0.2 20.0 ± 0.3 15.8 ± 0.2 5.87 ± 0.09 9.0 ± 0.1
3DG 02 42.5 ± 0.6 61.2 ± 0.8 53.1 ± 0.7 20.1 ± 0.3 9.0 ± 0.1 15.8 ± 0.2 11.8 ± 0.2 4.42 ± 0.07 7.0 ± 0.1
3DG 18 58.6 ± 0.8 75 ± 1 73.5 ± 1.0 45.5 ± 0.6 26.1 ± 0.4 31.8 ± 0.4 33.0 ± 0.5 16.8 ± 0.2 23.4 ± 0.3
3DG 25 62.7 ± 0.9 82 ± 1 92 ± 1 48.5 ± 0.7 31.5 ± 0.4 51.9 ± 0.7 42.6 ± 0.6 14.3 ± 0.2 20.2 ± 0.3
3DG 28 217± 2 197 ± 2 275 ± 3 169 ± 2 155 ± 2 190 ± 2 205 ± 2 92.9 ± 0.9 125 ± 1
Table 4: Optimal combinations of the measured displays and 3D glasses for a red/cyan image. When a blue or green filter has the lowest crosstalk, the lowest cyan filter is also given.
Display Best glasses
Overall Crosstalk factor
Best red filter
% Crosstalk Best cyan filter % Crosstalk
Diamond CRT “DDD” 22.5±0.3 DDD red 19.5±0.3 Reel 3D #1 cyan 2.20±0.03 Acer LCD “Freddy’s…” 41.2±0.6 Freddy’s. red 34.3±0.5 IMAX cyan 5.63±0.08 NEC3 1DMD Proj “Freddy’s…” 20.1±0.3 Freddy’s. red 15.4±0.3 Reel 3D #1 cyan 2.92±0.04 Infocus 1DMD Proj “DDD” 8.9±0.2 DDD red 4.1±0.1 Reel 3D #1 cyan 0.71±0.01 Epson 3LCD Proj “DDD” 3.92±0.08 DDD red 1.89±0.05 Reel 3D #1 cyan 0.324±0.005 VT2 3LCD Proj “DDD” 4.66±0.09 DDD red 2.75±0.06 Reel 3D #1 cyan 0.408±0.007 VT6 3LCD Proj “DDD” 3.93±0.08 DDD red 2.45±0.06 Reel 3D #1 cyan 0.427±0.007 Boxlight2 3LCD Proj “Reel 3D #1” 3.08±0.06 DDD red 1.63±0.04 Reel 3D #1 cyan 0.480±0.008 Boxlight3 3LCD Proj “3DG 11” 4.59±0.09 DDD red 2.57±0.05 Reel 3D #1 cyan 1.44±0.02
3.4 Validation To check that the results from the crosstalk model were sensible, a first order validation test was performed using a CRT display. A pair of rectangles, one red (R=255, G=B=0), one cyan (R=0, G=B=255), which shared an edge were displayed on a CRT screen. An anaglyph filter was held over the intersection. Ideally, if the filter was red, the red half would be bright red and the cyan half would be black (or vice versa for a cyan filter). To a first order approximation, the closer the complimentary side of the filter was to black, the lower the expected percentage crosstalk through that filter.
SPIE-IS&T/Vol. 5291 363

The model takes into account the brightness of the transmitted colour too, which can also be roughly guessed by the eye. The validation involved holding up two filters of the same colour (eg red) at the same time, and seeing which had a blacker complimentary colour, and how bright the matching colour was, and then estimating which pair of glasses would have a lower % crosstalk. Some filters were very easy to rank, eg the red 3DG18 (19.5±0.3%), 3DG02 (46.9±0.7%) and 3DG04 (60.5±0.8%). The eye’s first order observations agree reasonably well with the model being used except where the % crosstalk difference was <2% at which point many of the glasses were difficult to arrange into sequence by eye anyway. One characteristic the eye has, that the model does not, is the tendency for some colours to seem brighter or dimmer than they really are when placed near certain other colours.9 Perhaps this effect distorts perceived brightness enough to overwhelm small differences in crosstalk.
4. DISCUSSION It is worth mentioning that even a perfect filter (one that transmits 100% of light in the desired wavelength domain and 0% outside it) will have crosstalk if the display’s green channel spectral output, say, overlaps the filter’s red domain. Hence the perceived crosstalk will vary between display devices, even for the same pair of filters. Glasses will generally produce low ghosting figures if the filters have a low crossover point as well as ≈0% transmission outside their desired wavelength region. The wavelength of the crossover point is also important - Ideally, the wavelength of the glasses’ crossover point will be close to that of the display device's crossover point. When choosing a display and filter combination, several aspects must be considered. Firstly, large amounts of crosstalk degrade the quality of the 3D experience, and the images become more difficult for the brain to fuse. This project aimed to highlight possible low-crosstalk combinations, so crosstalk could be reduced. Secondly, intensity is important. If the filter cuts out most of the light, the image will be very dim and hard to see. Lower light levels also make the effect of even small ghosting levels proportionally greater than they might otherwise be. A brightness imbalance between left and right eye can also result in the Pulfrich effect whereby horizontal motion can be interpreted as binocular depth – which is generally undesirable. Brightness levels and imbalance have not been considered in this paper. Thirdly, colour must be considered. Truly full colour stereoscopic images are not possible with anaglyphs, but a properly constructed anaglyph using complimentary colours can approximate a full colour image. This distorted colour image is usually referred to as a “pseudo-colour anaglyph” or a “polychromatic anaglyph” rather than a “full colour anaglyph”. If a non-complimentary combination is used, (e.g. red/blue or red/green) pseudo-colour anaglyphs are impossible, as a large portion of the visible spectrum is missing. The overall image may also be darker. This paper has only considered red/cyan anaglyphs. For red/cyan anaglyphic 3D images, the minimum overall crosstalk factor in CRTs was very high at 22.5±0.3. Even mixing and matching the best filters would only reduce the crosstalk factor to just over 21. This is despite the fact that many of the glasses tested were specifically made for watching 3D videos on television CRT screens. The main difficulty here is not the filters, but the large overlapping wavelength domains of the CRT phosphors. This could be reduced by using red/blue only anaglyphs on CRTs, since the crosstalk factor for them decreases to 5.89±0.09, but this entails other problems as discussed in the previous two paragraphs. The Acer Laptop LCD that was tested has very high crosstalk factors with all tested glasses. Again, there is little a filter can do when the spectral output of the display device is active across so many different wavelengths; Figure 3 shows that when showing a red screen only, for example, the output includes wavelengths all the way into the blue region. It would be near impossible to obtain a filter that matches well with this output. 3-chip LCD projectors exhibited the lowest overall crosstalk factor of all the displays tested. Single chip DMD based projectors (NEC3 and Infocus) gave crosstalk results that were worse than 3-chip LCD projectors but better than CRT displays. These variations between displays are understandable given that each of the different technologies (CRT, LCD, LCD projector, and DMD) use different methods to create the three colour primaries. We have defined a cyan filter as one that passes a reasonable amount of blue and green (but very little red). If the filter passes blue but very little green and red, it is considered a blue filter. We realise this definition is somewhat approximate – to be more scientific the relative transmission of each of the colour primaries through the filters could be calculated and the filters classified on this bases. This data would also be useful for evaluating the colour balance of the image for image quality purposes and evaluating possible Pulfrich effects. It is also worth noting that the colour
364 SPIE-IS&T/Vol. 5291

balance of the display will also have an effect on ghosting. It can be seen that a slight colour balance difference between Boxlight2 and Boxlight3 has produced a different set of ghosting results (see Figure 4 and Table 3). In this study we have used the default colour balance of the display, however colour balance effects could also be studied in more detail. It should be noted that this study only reports on emissive displays. Some of the glasses were intended for use with printed anaglyphs, and hence may perform better with printed anaglyphs than emissive displays. However, testing of anaglyphic 3D ghosting with printed anaglyphs is not reported here.
5. CONCLUSION This study has revealed that crosstalk in anaglyphic 3D images can be minimised by the appropriate choice of anaglyphic 3D glasses. The study has revealed that there can be considerable variation in the amount of ghosting present when an anaglyphic 3D display is viewed with different anaglyphic 3D glasses. The study has also revealed that there is considerable variation in the amount of anaglyphic ghosting exhibited by different types of displays – 3 chip LCD projectors were found to offer considerably lower anaglyphic ghosting than the other types of displays tested in this study (CRT displays, LCD screens, and DMD projectors). The anaglyphic ghosting model works well and generates outputs which appear to agree with subjective assessments of anaglyphic 3D ghosting. The model currently does not take into account the more complicated aspects of colour vision, such as hue perception. However as technological advances, such as functional MRI, are increasing our ability to understand the anatomy, physiology and perception of colour, and non-linear modelling continues9, when a complete model is perfected and agreed upon, the program can be modified to include it. The model also does not take into account dimness, brightness imbalance, or pseudo-colour considerations, which are also important to the anaglyph 3D experience. It should be noted that the results of this paper are not intended to be a leaderboard of one glasses manufacturer versus another - we haven't tested all glasses from all manufacturers, nor have we tested a large sample of each manufacturers glasses. This paper does however highlight that there is significant variation between different anaglyph 3D glasses and displays. Further crosstalk optimisation may be possible by using the model and working with 3D glasses manufacturers.
REFERENCES 1. Tan, Stanley (2001), Sources of Crosstalk in 3D Stereoscopic Displays, Centre for Marine Science & Technology,
Curtin University of Technology, Bentley, Western Australia. 2. Woods, Andrew & Tan, Stanley (2002), "Characterising Sources of Ghosting in Time- Sequential Stereoscopic
Video Displays", presented at Stereoscopic Displays and Applications XIII, published in Stereoscopic Displays and Virtual Reality Systems IX, Proceedings of SPIE Vol. 4660, pp. 66-77, San Jose, California, 21-23 January 2002.
3. Konrad, J (2000), “Cancellation of image crosstalk in time-sequential displays of stereoscopic video”, in IEEE Transactions on Image Processing, Vol. 9, No. 5, pp 897–908.
4. Sanders, William & McAllister, David (2003) "Producing Anaglyphs from Synthetic Images", presented at Stereoscopic Displays and Applications XIV, published in Stereoscopic Displays and Virtual Reality Systems X, Proceedings of SPIE Vol. 5006, pp 348-358, Santa Clara, California, 21-23 January 2003.
5. Lovy, D (1996), WINDIG 2.5, Email: [email protected], Dept of Physical Chemistry, University of Geneva, Switzerland.
6. Hollins, Martin (1990) Medical Physics, Thomas Nelson & Sons, London, pp26-27. 7. MacDonald & Burns (1975) Physics for the Life and Health Sciences, Addison Wesley, USA. 8. Ohno, Yoshi (1999), OSA Handbook of Optics, Volume III: Visual Optics and Vision, National Institute of
Standards and Technology, Maryland USA. 9. Connolly, C (2003), “Colorimetry: Anatomical Studies Advance”, Photonics Spectra, Issue Aug 2003, pp 56-66. 10. HCinema (not dated), [online], Available: http://www.projektoren-datenbank.de/pro [accessed 21st Dec 2003]
“Projektoren-Datenbank”, “Abkurzungen”, “Lexikon”, “DLP Projektoren”, “LCD Projektoren”.
SPIE-IS&T/Vol. 5291 365

Paper 11 A. J. Woods (2005) “Compatibility of Display Products with Stereoscopic Display
Methods” International Display Manufacturing Conference (IDMC), pp. 290‐293, Taiwan, February 2005.
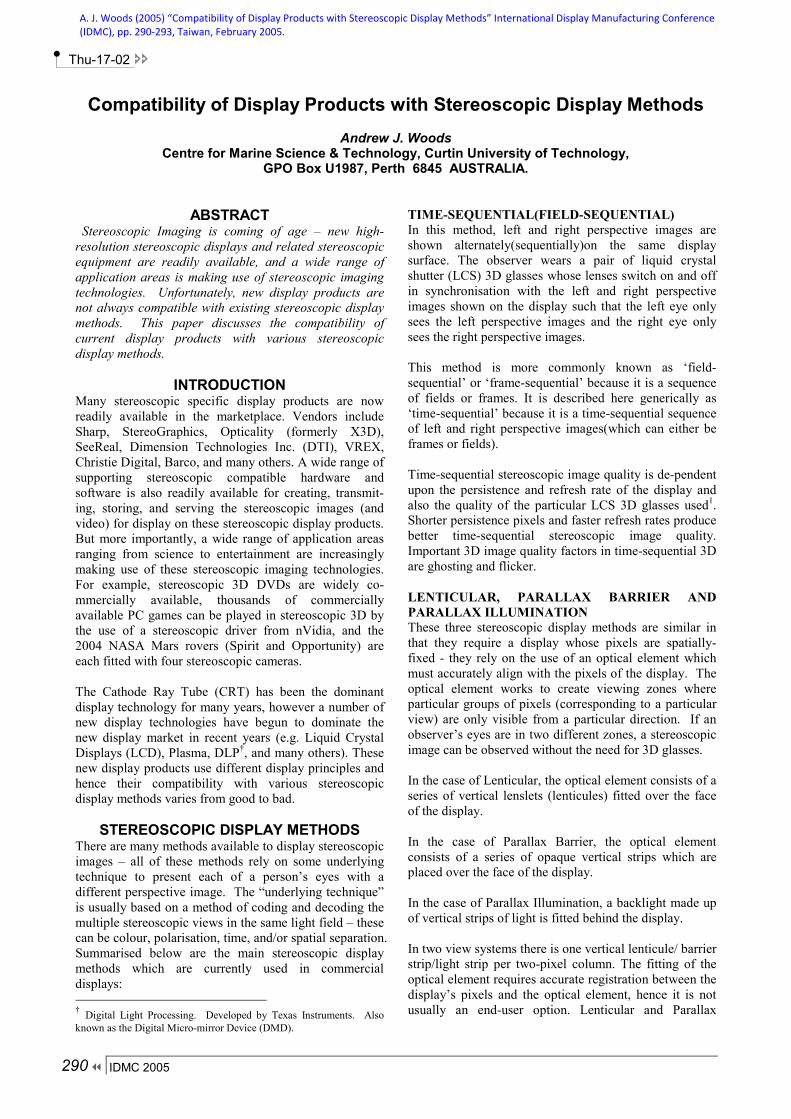
Thu-17-02
290 IDMC 2005
Compatibility of Display Products with Stereoscopic Display Methods
Andrew J. Woods Centre for Marine Science & Technology, Curtin University of Technology,
GPO Box U1987, Perth 6845 AUSTRALIA.
ABSTRACT
Stereoscopic Imaging is coming of age – new high-resolution stereoscopic displays and related stereoscopic equipment are readily available, and a wide range of application areas is making use of stereoscopic imaging technologies. Unfortunately, new display products are not always compatible with existing stereoscopic display methods. This paper discusses the compatibility of current display products with various stereoscopic display methods.
INTRODUCTION Many stereoscopic specific display products are now readily available in the marketplace. Vendors include Sharp, StereoGraphics, Opticality (formerly X3D), SeeReal, Dimension Technologies Inc. (DTI), VREX, Christie Digital, Barco, and many others. A wide range of supporting stereoscopic compatible hardware and software is also readily available for creating, transmit-ing, storing, and serving the stereoscopic images (and video) for display on these stereoscopic display products. But more importantly, a wide range of application areas ranging from science to entertainment are increasingly making use of these stereoscopic imaging technologies. For example, stereoscopic 3D DVDs are widely co-mmercially available, thousands of commercially available PC games can be played in stereoscopic 3D by the use of a stereoscopic driver from nVidia, and the 2004 NASA Mars rovers (Spirit and Opportunity) are each fitted with four stereoscopic cameras. The Cathode Ray Tube (CRT) has been the dominant display technology for many years, however a number of new display technologies have begun to dominate the new display market in recent years (e.g. Liquid Crystal Displays (LCD), Plasma, DLP†, and many others). These new display products use different display principles and hence their compatibility with various stereoscopic display methods varies from good to bad.
STEREOSCOPIC DISPLAY METHODS There are many methods available to display stereoscopic images – all of these methods rely on some underlying technique to present each of a person’s eyes with a different perspective image. The “underlying technique” is usually based on a method of coding and decoding the multiple stereoscopic views in the same light field – these can be colour, polarisation, time, and/or spatial separation. Summarised below are the main stereoscopic display methods which are currently used in commercial displays: † Digital Light Processing. Developed by Texas Instruments. Also known as the Digital Micro-mirror Device (DMD).
TIME-SEQUENTIAL(FIELD-SEQUENTIAL) In this method, left and right perspective images are shown alternately(sequentially)on the same display surface. The observer wears a pair of liquid crystal shutter (LCS) 3D glasses whose lenses switch on and off in synchronisation with the left and right perspective images shown on the display such that the left eye only sees the left perspective images and the right eye only sees the right perspective images. This method is more commonly known as ‘field-sequential’ or ‘frame-sequential’ because it is a sequence of fields or frames. It is described here generically as ‘time-sequential’ because it is a time-sequential sequence of left and right perspective images(which can either be frames or fields). Time-sequential stereoscopic image quality is de-pendent upon the persistence and refresh rate of the display and also the quality of the particular LCS 3D glasses used1. Shorter persistence pixels and faster refresh rates produce better time-sequential stereoscopic image quality. Important 3D image quality factors in time-sequential 3D are ghosting and flicker. LENTICULAR, PARALLAX BARRIER AND PARALLAX ILLUMINATION These three stereoscopic display methods are similar in that they require a display whose pixels are spatially-fixed - they rely on the use of an optical element which must accurately align with the pixels of the display. The optical element works to create viewing zones where particular groups of pixels (corresponding to a particular view) are only visible from a particular direction. If an observer’s eyes are in two different zones, a stereoscopic image can be observed without the need for 3D glasses. In the case of Lenticular, the optical element consists of a series of vertical lenslets (lenticules) fitted over the face of the display. In the case of Parallax Barrier, the optical element consists of a series of opaque vertical strips which are placed over the face of the display. In the case of Parallax Illumination, a backlight made up of vertical strips of light is fitted behind the display. In two view systems there is one vertical lenticule/ barrier strip/light strip per two-pixel column. The fitting of the optical element requires accurate registration between the display’s pixels and the optical element, hence it is not usually an end-user option. Lenticular and Parallax
A. J. Woods (2005) “Compatibility of Display Products with Stereoscopic Display Methods” International Display Manufacturing Conference (IDMC), pp. 290‐293, Taiwan, February 2005.
Tue-17-02
IDMC 2005 291
Barrier methods can be applied to rear projection displays but are not currently implemented commercially. SPATIALLY MULTIPLEXED POLARISED In this method an optical sheet is placed over the face of the display which polarises alternate pixels of the display in orthogonal polarisation states2. The viewer wears a pair of polarised 3D glasses to view the stereoscopic image on screen. This method will only work with displays which have spatially-fixed pixels. The fitting of the optical element requires accurate registration between the display’s pixels and the optical element, hence it is not usually an end-user option. POLARISED PROJECTION With polarised projection, two displayed images are optically overlayed (e.g. two video projectors projecting onto a single silvered screen) and polarisation is used to code and decode the two views. The observer wears polarised 3D glasses to see the stereoscopic image. ANAGLYPH This stereoscopic display method uses colour to separate the two perspective views. Usually the left perspective image is displayed in the red channel of the display and the right perspective image is displayed in the blue and green channels of the display. The observer(s) wears glasses with the left lens red and the right lens cyan. Other combinations of colour primaries are possible. The anaglyph method is widely used because it is compatible with all full colour displays, however the quality of the perceived stereoscopic image is relatively poor as compared to other stereoscopic methods and truly full-colour stereoscopic images cannot be achieved using anaglyph. A recent study revealed that anaglyph image quality was dependent upon the spectral colour purity of the display and the glasses3. The study ranked the following displays from best to worst for anaglyph image quality: 3-chip LCD projector, 1-chip DLP projector, CRT display, LCD display. OTHER METHODS There are many more methods of displaying stereoscopic images available(plus variations of the methods su-mmarised above), however a full description of all possible stereoscopic display methods is beyond the scope of this paper. For further information, the interested reader is referred to the proceedings of the Stereoscopic Displays and Applications conference4. STEREOSCOPIC COMPATIBILTY Several factors determine whether a particular display is compatible with a particular stereoscopic display method. These factors include: native polarisation, image pe-
rsistence(sometimes referred to as response time or refresh rate), colour purity, and whether the pixels are spatially-fixed. The stereoscopic compatibility of the fundamental technology used in a range of different displays is summarised in Figure 1 and described below: CRT CRT display technology is fundamentally compatible with time-sequential, polarised projection, and anaglyph methods but incompatible with fixed-pixel methods‡. LCD LCDs are compatible with fixed-pixel methods‡ (although some care must be taken with native polarisation and the arrangement of the individual colour primary pixels) and polarised projection methods. The colour purity of different LCDs has been found to vary considerably from display to display hence anaglyph compatibility varies from poor to good (not withstanding the limitations of anaglyph)3. LCDs are usually incompatible with time-sequential 3D – their long persistence (low refresh rate) usually causes significant stereoscopic image ghosting. Refresh rates of LCDs are steadily improving hence this problem may soon be overcome. PLASMA Plasma display technology is fundamentally compatible with time-sequential, and fixed-pixel methods‡. An-aglyph compatibility is untested by this author but it is expected to be similar to CRTs. Plasma is currently only used in direct-view displays. DLP DLP display technology is fundamentally compatible with time-sequential and polarised projection methods. DLP technology is currently only used in projection displays and hence it is not usually considered for fixed-pixel methods‡. The colour purity of different DLP displays varies considerably (usually depending upon the spectral quality of the colour wheel) hence anaglyph compatibility varies from poor to good3.
OTHER DISPLAY PRODUCTS A range of other display products is also available (or becoming available) in the market, including LED (Light Emitting Diode), OLED (Organic Light Emitting Diode), FELCD (Ferro-Electric Liquid Crystal Display), LCoS (Liquid Crystal on Silicon), and many others. Their compatibility is not discussed in this paper but their own fundamental display properties will determine their compatibility with the various stereoscopic display methods. ‡ Fixed-Pixel Methods = Lenticular, Parallax Barrier, Parallax Illumination, and Spatially Multiplexed Polarised methods.

Thu-17-02
292 IDMC 2005
Time-Sequential Lenticular
Parallax Barrier
Parallax Illumination
Spatially Multiplexed Polarised
Polarised Projection Anaglyph
Direct View CRT √ X X X X n/a Moderate
LCD X* √ √ √ √ n/a Poor to good
PLASMA √ √ √ X √ n/a ? DLP n/a n/a n/a n/a n/a n/a n/a Projection (Front and Rear) CRT √ n/a n/a n/a X √ Moderate
LCD X* n/a* n/a* n/a √ √ Poor to good
PLASMA n/a n/a n/a n/a n/a n/a n/a
DLP √ n/a* n/a* n/a X √ Poor to good
Fig. 1. Summary of display method compatibility with stereoscopic display methods. ( * = see text)
DISCUSSION A good number of stereoscopic specific display products are now commercially available. However, there are instances where a consumer would like to use their existing display to view stereoscopic 3D images or video. The stereoscopic display methods which can be most easily retrofitted to an existing display by an end user are anaglyph and time-sequential. Anaglyph will work with all current displays however its 3D image quality is relatively poor. Time-sequential provides much better 3D image quality, however there are several mitigating factors which may prevent that particular display from being used with time-sequential 3D (even though the fundamental display technology may be compatible with time-sequential 3D display). These mitigating factors usually relate to video processing functions performed in the particular display product - such as interlaced to progressive conversion, 50 to 100Hz conversion, frame rate conversion, and image scaling. INTERLACED TO PROGRESSIVE CONVERSION Interlaced to progressive conversion(sometimes called deinterlacing)is necessary for displays which are natively progressive(LCD, Plasma and DLP). Several different algorithms for interlaced to progressive conversion are currently in common usage in different display products, and unfortunately some of these algorithms are in-compatible with time-sequential 3D(they disrupt the 3D content by mixing the fields). In some instances ‘interlaced to progressive’ converters also implement reverse 3:2 pulldown however this is also incompatible with time-sequential 3D video. Fortunately there is an interlaced to progressive conversion algorithm which is compatible with field-sequential 3D and a number of display products (and DVD players) use this particular algorithm. If it is found that a particular display product uses a deinterlacer which is incompatible with field-sequential 3D, the internal deinterlacer can often be bypassed by using an external(3D friendly)deinterlacer, and inputting this signal into the particular display product.
50 TO 100Hz CONVERSION Some displays include another form of video processing (50 to 100Hz conversion - sometimes called ‘100Hz Digital Scan’) designed to reduce the amount of visible flicker in a television image. Most display products which include 50 to 100Hz conversion use an algorithm which is incompatible with time-sequential 3D, however there is a 50 to 100Hz conversion algorithm which is compatible with time-sequential 3D which could be relatively easily included to maintain time-sequential 3D compatibility. 50 to 100Hz conversion is a very good thing for time-sequential 3D because it overcomes the flicker problem normally associated with viewing field-sequential 3D video (particularly at 50Hz)4, however a 3D compatible algorithm needs to be used. (DLP) FRAME RATE CONVERSION Some models of DLP projector have a fixed internal operation frequency (usually 60Hz) – a frame rate co-nverter is used to convert a video input signal of any other frame rate to the native frequency of the DLP engine. Unfortunately frame rate conversion usually disrupts the 3D content of a time-sequential 3D video signal. In order to achieve 3D compatibility with these devices, it is necessary to input time sequential 3D video into these display devices at a field-rate or frame-rate which matches the internal operating frequency of the DLP engine. IMAGE SCALING In order for display products which have a fixed pixel resolution to display video from a different source resolution, it is necessary for the input video signal to be up-scaled or down-scaled to the resolution of the display. Image scaling will likely disrupt the 3D compatibility of fixed-pixel stereoscopic display methods‡ but should not affect time-sequential 3D. For optimal 3D compatibility, it would be desirable if display products which included the video processing functions described above also provided a menu option

Tue-17-02
IDMC 2005 293
which either allowed the device to be switched into a time-sequential 3D compatible mode or disabled the particular video processing function. Interestingly some HD television sets do include a menu option called “game mode” which puts the television into a display mode which is compatible with field-sequential 3D NTSC. It is also problematic that display product documentation does not usually list whether that display is time-sequential 3D compatible. Third-party listings of products that are compatible and incompatible with time-sequential 3D video are appearing and this should be encouraged. FIELD-SEQUENTIAL 3D NTSC/PAL As mentioned in the introduction, a wide range of 3D DVDs is now commercially available – many of these are in field-sequential format (a defacto standard for time-sequential 3D on NTSC and PAL video6). Unfortunately a high percentage of new display products are incompatible with time-sequential 3D (in their default mode) and hence more care must now be taken to check or ensure field-sequential 3D will work with particular display products. Although SD (Standard Definition) video standards such as NTSC and PAL are on the road to retirement, they will remain with us for some time as we gradually transition to HDTV and other formats. Field-sequential 3D will likely remain a useful format during this transition period.
CONCLUSION The market for stereoscopic compatible display products is increasing and many new stereoscopic specific display products are now available in the market place. This paper has summarised the compatibility of a selection of stereoscopic display methods with a range of display product technologies. The biggest stereoscopic compatibility problem at the current time is with the time-sequential 3D method - a high percentage of new display products being released are incompatible (in their default mode) with time-sequential 3D. In some cases this incompatibility is due to fundamental display technology limitations (e.g. LCD) but in some cases it is due to the implementation of
advanced video processing features which disrupt the 3D video signal (in some cases this could be relatively easily corrected). Display manufacturers need to be aware of the growing stereoscopic imaging market and the potential for their display products to be used in stereoscopic display applications.
ACKNOWLEDGEMENTS The author would like to thank the staff at West Coast Hi-Fi in Cannington, Western Australia for their help in allowing a range of new display products to be tested for stereoscopic compatibility.
REFERENCES 1. A.J. Woods, and S.S.L. Tan (2002) "Characterising
Sources of Ghosting in Time-Sequential Stereoscopic Video Displays", in Stereoscopic Displays and Virtual Reality Systems IX, Proceedings of SPIE Vol. 4660, San Jose, California, January 2002. www.curtin.edu.au/cmst/publicat/2002-09.pdf
2. S. Faris (1994) “Novel 3-D stereoscopic imaging technology” in Stereoscopic Displays and Virtual Reality Systems, Proceedings of SPIE vol. 2177, San Jose, California, February 1994.
3. A.J. Woods, and T. Rourke (2004) "Ghosting in Anaglyphic Stereoscopic Images", in Stereoscopic Displays and Virtual Reality Systems XI, Proceedings of SPIE-IS&T Electronic Imaging, SPIE Vol. 5291, San Jose, California, January 2004. www.curtin.edu.au/cmst/publicat/2004-08.pdf
4. The proceedings of the Stereoscopic Displays and Applications conference are published as Stereoscopic Displays and Virtual Reality Systems, Proceedings of SPIE, Bellingham, Washington, USA. www.stereoscopic.org/proc
5. A.J. Woods, T. Docherty, and R. Koch, (1991) "The Use of Flicker-Free Television Products for Stereoscopic Display Applications", in Stereoscopic Displays and Applications II, Proceedings of SPIE Vol. 1457, San Jose, California, February 1991. www.curtin.edu.au/cmst/publicat/1991-18.pdf
6. “Proposed Standard for Field-Sequential 3D Television” www.stereoscopic.org/standards

Paper 12 A. J. Woods, T. Rourke, K. L. Yuen (2006) "The Compatibility of Consumer Displays
with Time‐Sequential Stereoscopic 3D Visualisation" (Invited Plenary Paper), in Proceedings of the K‐IDS Three‐Dimensional Display Workshop 2006, pp. 7‐10, Seoul National University, Seoul, South Korea, 21 August 2006.
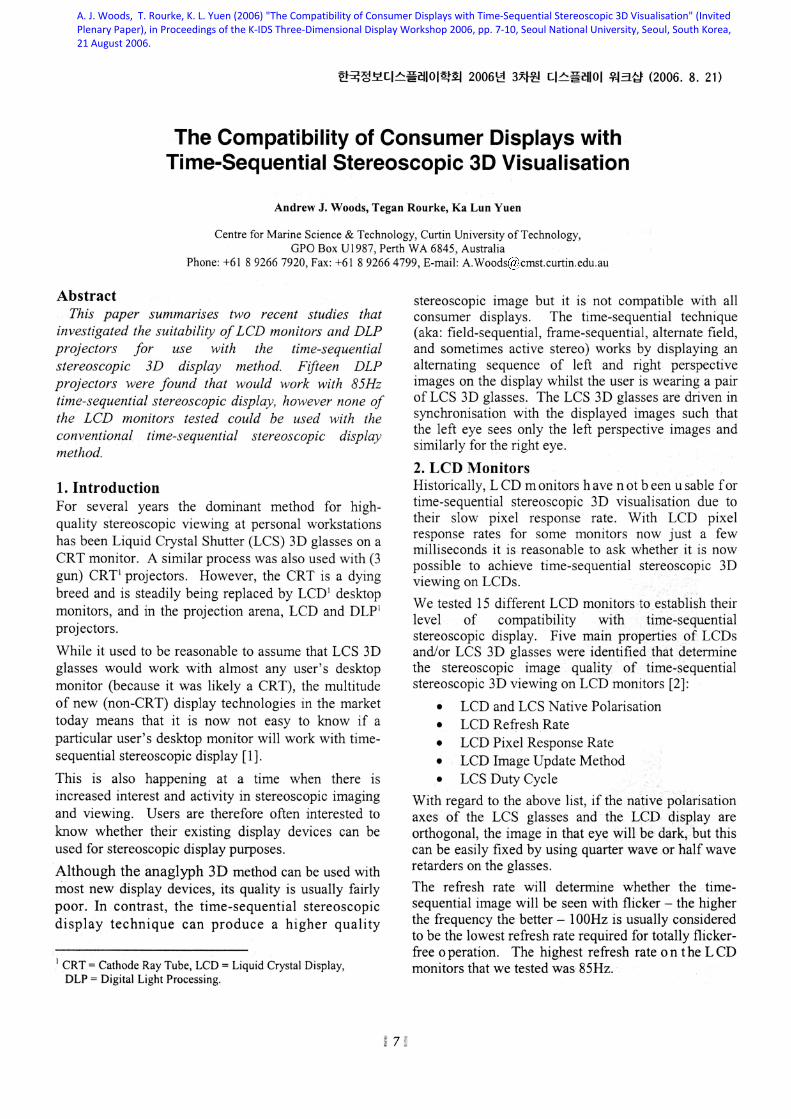
The Compatibility of Consumer Displays with Time-Sequential Stereoscopic 3D Visualisation
Andrew J. Woods, Tegan Rourke, Ka Lun Vuen
Centre for Marine Science & Technology, Curtin University of Technology, GPO Box U1987, Perth WA 6845 , Australia
Phone: +61892667920, Fax: +61892664799, E-mail: A.Woods cmst.curtin.edu.au
Abstract This paper summarises two recent studies that
investigated the suitability of LCD monitors and DLP projectors for use with the time-sequential stereoscopic 3D display method. Fifteen DLP projectors were found that would work with 85Hz time-sequential stereoscopic display, however none of the LCD monitors tested could be used with the conventional time-sequential stereoscopic display method.
1. Introduction For several years the dominant method for highquality stereoscopic viewing at personal workstations has been Liquid Crystal Shutter (LCS) 3D glasses on a CRT monitor. A similar process was also used with (3 gun) CRT1 projectors. However, the CRT is a dying breed and is steadily being replaced by LCD 1 desktop monitors, and in the projection arena, LCD and DLp l
projectors.
While it used to be reasonable to assume that LCS 3D glasses would work with almost any user's desktop monitor (because it was likely a CRT), the multitude of new (non-CRT) display technologies in the market today means that it is now not easy to know if a particular user's desktop monitor will work with timesequential stereoscopic display [1].
This is also happening at a time when there is increased interest and activity in stereoscopic imaging and viewing. Users are therefore often interested to know whether their existing display devices can be used for stereoscopic display purposes.
Although the anaglyph 3D method can be used with most new display devices, its quality is usually fairly poor. In contrast, the time-sequential stereoscopic display technique can produce a higher quality
I CRT = Cathode Ray Tube, LCD = Liquid Crystal Display, DLP = Digital Light Processing.
$ 7
stereoscopic image but it is not compatible with all consumer displays. The time-sequential technique (aka: field-sequential, frame-sequential, alternate field, and sometimes active stereo) works by displaying an alternating sequence of left and right perspective images on the display whilst the user is wearing a pair of LCS 3D glasses. The LCS 3D glasses are driven in synchronisation with the displayed images such that the left eye sees only the left perspective images and similarly for the right eye.
2. LCD Monitors Historically, LCD monitors have not been usable for time-sequential stereoscopic 3D visualisation due to their slow pixel response rate. With LCD pixel response rates for some monitors now just a few milliseconds it is reasonable to ask whether it is now possible to achieve time-sequential stereoscopic 3D viewing on LCDs.
We tested 15 different LCD monitors to establish their level of compatibility with time-sequential stereoscopic display. Five main properties of LCDs and/or LCS 3D glasses were identified that determine the stereoscopic image quality of time-sequential stereoscopic 3D viewing on LCD monitors [2]:
• LCD and LCS Native Polarisation • LCD Refresh Rate • LCD Pixel Response Rate • LCD Image Update Method • LCS Duty Cycle
With regard to the above list, if the native polarisation axes of the LCS glasses and the LCD display are orthogonal, the image in that eye will be dark, but this can be easily fixed by using quarter wave or half wave retarders on the glasses.
The refresh rate will determine whether the . timesequential image will be seen with flicker - the higher the frequency the better - 100Hz is usually considered to be the lowest refresh rate required for totally flickerfree 0 peration. The highest refresh rate 0 n the LCD monitors that we tested was 85Hz.
A. J. Woods, T. Rourke, K. L. Yuen (2006) "The Compatibility of Consumer Displays with Time‐Sequential Stereoscopic 3D Visualisation" (Invited Plenary Paper), in Proceedings of the K‐IDS Three‐Dimensional Display Workshop 2006, pp. 7‐10, Seoul National University, Seoul, South Korea, 21 August 2006.
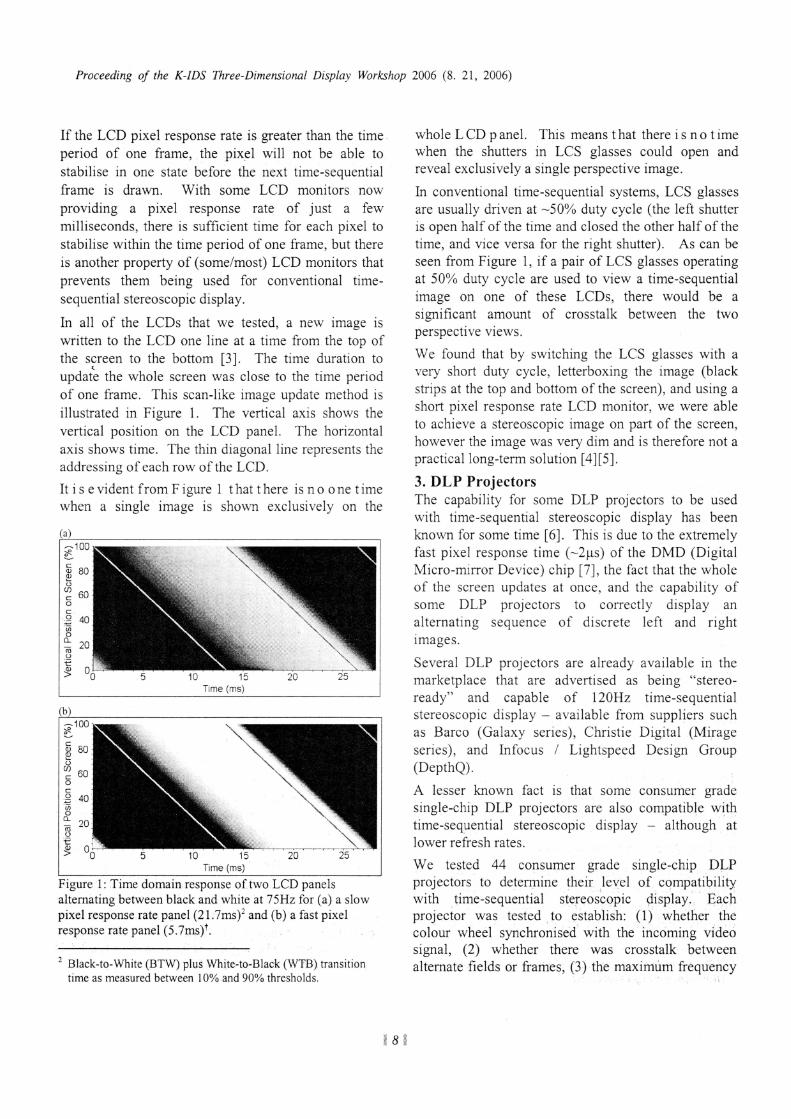
Proceeding of the K-JDS Three-Dimensional Display Workshop 2006 (8. 21, 2006)
If the LCD pixel response rate is greater than the time . period of one frame, the pixel will not be able to stabilise in one state before the next time-sequential frame is drawn. With some LCD monitors now providing a pixel response rate of just a few milliseconds, there is sufficient time for each pixel to stabilise within the time period of one frame, but there is another property of (some/most) LCD monitors that prevents them being used for conventional timesequential stereoscopic display.
In all of the LCDs that we tested, a new image is written to the LCD one line at a time from the top of the screen to the bottom [3]. The time duration to
t
update the whole screen was close to the time period of one frame. This scan-like image update method is illustrated in Figure 1. The vertical axis shows the vertical position on the LCD panel. The horizontal axis shows time. The thin diagonal line represents the addressing of each row of the LCD.
It i s e vi dent from Figure 1 that t here is no 0 ne time when a single image is shown exclusively on the
(a)
c · 0 '';::
en o Q..
ro ()
:e ~
(b) -100 ~ c al 80 <:; ~ 60 o c 0 40 z en 0
Q.. 20 ro
()
:e ~
Time (ms)
Figure I: Time domain response of two LCD panels alternating between black and white at 75Hz for (a) a slow pixel response rate panel (21. 7ms)2 and (b) a fast pixel response rate panel (5 .7ms)t.
2 Black-to-White (BTW) plus White-to-Black (WTB) transition time as measured between 10% and 90% thresholds.
whole LCD panel. This means t hat there is not ime when the shutters in LCS glasses could open and reveal exclusively a single perspective image.
In conventional time-sequential systems, LCS glasses are usually driven at -50% duty cycle (the left shutter is open half of the time and closed the other half of the time, and vice versa for the right shutter). As can be seen from Figure 1, if a pair of LCS glasses operating at 50% duty cycle are used to view a time-sequential image on one of these LCDs, there would be a significant amount of crosstalk between the two perspective views.
We found that by switching the LCS glasses with a very short duty cycle, letterboxing the image (black strips at the top and bottom of the screen), and using a short pixel response rate LCD monitor, we were able to achieve a stereoscopic image on part of the screen, however the image was very dim and is therefore not a practical long-term solution [4][5].
3. DLP Projectors The capability for some DLP projectors to be used with time-sequential stereoscopic display has been known for some time [6]. This is due to the extremely fast pixel response time (-2).1s) of the DMD (Digital Micro-mirror Device) chip [7], the fact that the whole of the screen updates at once, and the capability of some DLP projectors to correctly display an alternating sequence of discrete left and right Images.
Several DLP projectors are already available in the marketplace that are advertised as being "stereoready" and capable of 120Hz time-sequential stereoscopic display - available from suppliers such as Barco (Galaxy series), Christie Digital (Mirage series), and Infocus / Lightspeed Design Group (DepthQ).
A lesser known fact IS that some consumer grade single-chip DLP projectors are also compatible with time-sequential stereoscopic display - although at lower refresh rates.
We tested 44 consumer grade single-chip DLP projectors to determine their level of compatibility with time-sequential stereoscopic ~isplay. Each projector was tested , to establish: (1) whether the colour wheel synchronised' with the incoming Video signal, (2) whether there was crosstalk between alternate fields or frames, (3) the maximum frequency
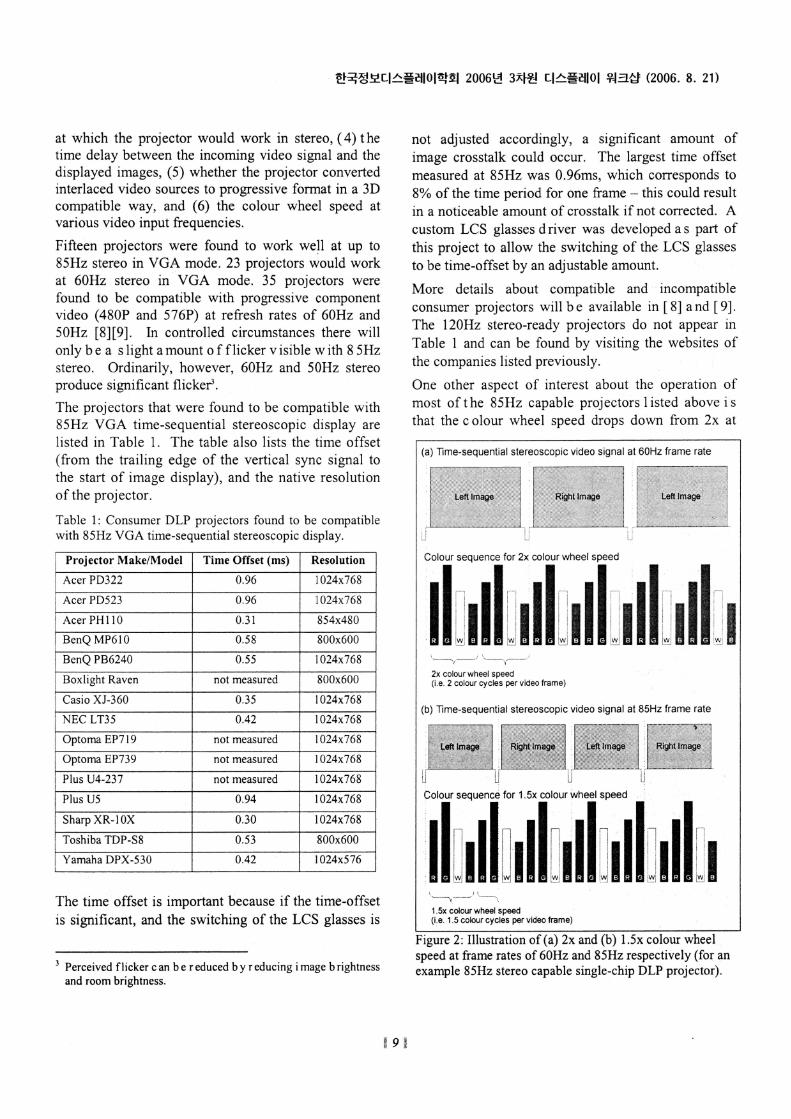
at which the projector would work in stereo, ( 4) the time delay between the incoming video signal and the displayed images, (5) whether the projector converted interlaced video sources to progressive format in a 3D compatible way, and (6) the colour wheel speed at various video input frequencies.
Fifteen projectors were found to work well at up to 85Hz stereo in VGA mode. 23 projectors would work at 60Hz stereo in VGA mode. 35 projectors were found to be compatible with progressive component video (480P and 576P) at refresh rates of 60Hz and 50Hz [8][9]. In controlled circumstances there will only be a s light a mount 0 f flicker visible with 85Hz stereo. Ordinarily, however, 60Hz and 50Hz stereo produce significant flicker.
The projectors that were found to be compatible with 85Hz VGA time-sequential stereoscopic display are listed in Table 1. The table also lists the time offset (from the trailing edge of the vertical sync signal to the start of image display), and the native resolution of the proj ector.
Table 1: Consumer DLP projectors found to be compatible with 85Hz VGA time-sequential stereoscopic display.
Projector Make/Model Time Offset (ms) Resolution
Acer PD322 0.96 1024x768
Acer PD523 0.96 1024x768
Acer PHIlO 0.31 854x480
BenQ MP610 0.58 800x600
BenQ PB6240 0.55 1024x768
Boxlight Raven not measured 800x600
Casio XJ-360 0.35 1024x768
NEC LT35 0.42 1024x768
Optoma EP719 not measured 1024x768
Optoma EP739 not measured 1024x768
Plus U4-237 not measured 1024x768
Plus US 0.94 1024x768
Sharp XR-IOX 0.30 1024x768
Toshiba TDP-S8 0.53 800x600
Yamaha DPX-530 0.42 1024x576
The time offset is important because if the time-offset is significant, and the switching of the LCS glasses is
3 Perceived flicker c an be reduced by reducing image brightness and room brightness.
not adjusted accordingly, a significant amount of image crosstalk could occur. The largest time offset measured at 85Hz was O.96ms, which corresponds to 8% of the time period for one frame - this could result in a noticeable amount of crosstalk if not corrected. A custom LCS glasses d river was developed a s part of this project to allow the switching of the LCS glasses to be time-offset by an adjustable amount.
More details about compatible and incompatible consumer projectors will be available in [ 8] and [9]. The 120Hz stereo-ready projectors do not appear in Table I and can be found by visiting the websites of the companies listed previously.
One other aspect of interest about the operation of most of t he 85Hz capable projectors I isted above is that the colour wheel speed drops down from 2x at
(a) Time-sequential stereoscopiC video signal at 60Hz frame rate
Colour sequence for 2x colour wheel speed
II ~ lin III 11111 11 lin . wi. ~ I . ~ I . ~ I JI. wi 2x colour wheel speed (i.e. 2 colour cycles per video frame)
(b) Time-sequential stereoscopic video signal at 85Hz frame rate
\--,_'~.
1 .5x colour wheel speed (i.e. 1.5 colour cycles per video frame)
Figure 2: Illustration of (a) 2x and (b) 1.5x colour wheel speed at frame rates of 60Hz and 85Hz respectively (for an example 85Hz stereo capable single-chip DLP projector).
Proceeding of the K-/DS Three-Dimensional Display Workshop 2006 (8. 21, 2006)
60Hz to 1.5x at 85Hz. "2x colour wheel speed" means that the colour wheel performs two colour cycles per frame. "1.5x colour wheel speed" means that the colour wheel performs one and a half colour cycles per frame. It can be seen in Figure 2 that for 85Hz the left eye will see two red segments and two green segments whereas the right eye will only see one of each. The opposite occurs for the white and blue segments. Images for each eye will therefore have a slightly different colour bias. The effect is noticeable but slight, and may be ameliorated by the auto-white-balance capability of the human eyes.
4. Discussion and Conclusion Thi~ study has revealed that most current generation LCD monitors cannot be used with the time-sequential stereoscopic display technique - this is due to the image-update method. There IS continuous development in this area hence there is the possibility that newly released LCD monitors might be 3D compatible in some way - one example is LCD TVs which use a blinking or scanned backlight [3]. LCD panels can be used for other stereoscopic viewing methods and these are summarised in reference [1].
A second study reported in this paper has revealed a relatively large number of consumer single-chip DLP projectors that can be used for time-sequential stereoscopic display - some at image refresh rates as high as 85Hz. Although 60Hz and 85Hz stereo are generally not suitable for situations requiring totally flicker-free stereoscopic viewing, the knowledge that low-cost consumer DLP projectors can be used for time-sequential stereoscopic viewing will open up the range of applications and users of stereoscopic visualisation. Such users and applications can graduate to higher-end flicker-free "stereo-ready" projection systems when requirements dictate.
A wide range of other stereoscopic and autostereoscopic displays are now available in the market or are near to market. With stereoscopic imaging now being used in an increasing number of applications, this is great news for users.
5. Acknowledgements The work on consumer DLP projectors was supported in part by iVEC (the hub of advanced computing in Western Australia), Jumbo Vision International, arid ISA Technologies. We also thank the multitude of
companies and individuals who lent LCD monitors and DLP projectors for testing.
6. References [1] A. J. Woods, "Compatibility of Display Products
with Stereoscopic Display Methods", m Proceedings of the International Display Manufacturing Conference (IDMC'05), ISBN 957-28522-2-1, Taipei, Taiwan (2005).
[2] A. J. Woods, and S. S. L. Tan, "Characterising Sources of Ghosting in Time-Sequential Stereoscopic Video Displays", in Stereoscopic Displays and Virtual Reality Systems IX, Proc. SPIE Vol. 4660, San Jose, California (2002).
[3] A. A. S. Sluyterrnan, and E. P. Boonekamp, "Architectural Choices in a Scanning Backlight for Large LCD TVs", in SID 05 Digest, pg 996 (2005).
[4] A. J. Woods, K. L. Yuen, "Compatibility of LCD Monitors with Frame-Sequential Stereoscopic 3 D Visualisation", in IMID/IDMC '06 DIGEST, Daegu, South Korea (2006). (in press)
[5] K. L. Yuen, "Compatibility of LCD Monitors with Stereoscopic Display Methods", Technical Report CMST 2006-34, Curtin University of Technology (2006). (in preparation)
[6] I. McDowall, M. Bolas, D. Corr, T. Schmidt, "Single and Multiple Viewer Stereo with DLP Projectors", in Stereoscopic Displays and Virtual Reality Systems VIII, Proc. SPIE Vol. 4297, pg 418-425, San Jose, California (2001).
[7] L. J. Hornbeck, "Current Status and Future Applications for DMD-Based Projection Displays", in Proceedings of the Fifth International Display Workshop IDW '98, Kobe, Japan (1998) .
[8] A. J. Woods, T. Rourke, "The Compatibility of Consumer DLP Projectors with Time-Sequential Stereoscopic 3D Visualisation", to be presented at Stereoscopic Displays and Applications XVIII, San Jose, California, January (2007). (accepted for presentation)
[9] T. Rourke, A. J. Woods, "Compatibility of Consumer DLP Projectors with Time-Sequential Stereoscopic Visualisation", Technical · Report CMST 2006-17, Cortin Unive'rsity of Technology (2006). (in preparation)

Paper 13 A. J. Woods, T. Rourke (2007) “The compatibility of consumer DLP projectors with
time‐sequential stereoscopic 3D visualization”, presented at Stereoscopic Displays and Applications XVIII, published in Stereoscopic Displays and Virtual Reality Systems XIV, Proceedings of IS&T/SPIE Electronic Imaging, SPIE Vol. 6490, pp. 64900V‐1 to ‐7, San Jose, California, January 2007.
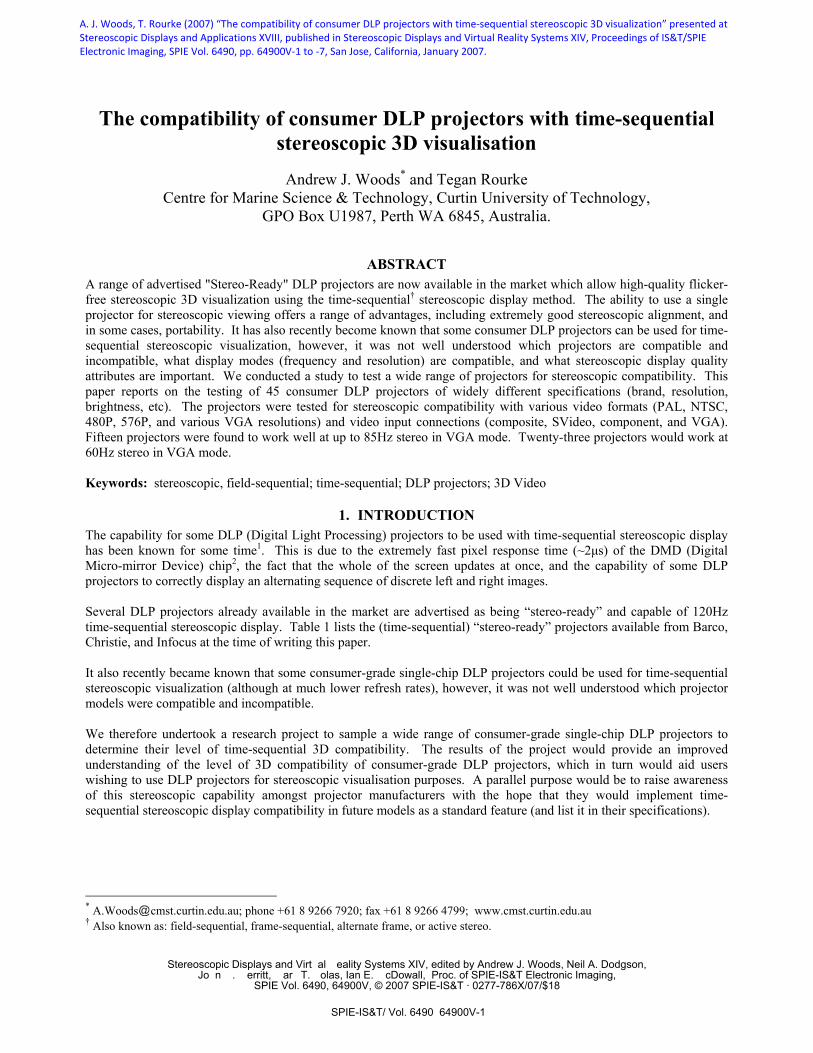
The compatibility of consumer DLP projectors with time-sequential stereoscopic 3D visualisation
Andrew J. Woods* and Tegan Rourke
Centre for Marine Science & Technology, Curtin University of Technology, GPO Box U1987, Perth WA 6845, Australia.
ABSTRACT A range of advertised "Stereo-Ready" DLP projectors are now available in the market which allow high-quality flicker-free stereoscopic 3D visualization using the time-sequential† stereoscopic display method. The ability to use a single projector for stereoscopic viewing offers a range of advantages, including extremely good stereoscopic alignment, and in some cases, portability. It has also recently become known that some consumer DLP projectors can be used for time-sequential stereoscopic visualization, however, it was not well understood which projectors are compatible and incompatible, what display modes (frequency and resolution) are compatible, and what stereoscopic display quality attributes are important. We conducted a study to test a wide range of projectors for stereoscopic compatibility. This paper reports on the testing of 45 consumer DLP projectors of widely different specifications (brand, resolution, brightness, etc). The projectors were tested for stereoscopic compatibility with various video formats (PAL, NTSC, 480P, 576P, and various VGA resolutions) and video input connections (composite, SVideo, component, and VGA). Fifteen projectors were found to work well at up to 85Hz stereo in VGA mode. Twenty-three projectors would work at 60Hz stereo in VGA mode. Keywords: stereoscopic, field-sequential; time-sequential; DLP projectors; 3D Video
1. INTRODUCTION The capability for some DLP (Digital Light Processing) projectors to be used with time-sequential stereoscopic display has been known for some time1. This is due to the extremely fast pixel response time (~2µs) of the DMD (Digital Micro-mirror Device) chip2, the fact that the whole of the screen updates at once, and the capability of some DLP projectors to correctly display an alternating sequence of discrete left and right images. Several DLP projectors already available in the market are advertised as being “stereo-ready” and capable of 120Hz time-sequential stereoscopic display. Table 1 lists the (time-sequential) “stereo-ready” projectors available from Barco, Christie, and Infocus at the time of writing this paper. It also recently became known that some consumer-grade single-chip DLP projectors could be used for time-sequential stereoscopic visualization (although at much lower refresh rates), however, it was not well understood which projector models were compatible and incompatible. We therefore undertook a research project to sample a wide range of consumer-grade single-chip DLP projectors to determine their level of time-sequential 3D compatibility. The results of the project would provide an improved understanding of the level of 3D compatibility of consumer-grade DLP projectors, which in turn would aid users wishing to use DLP projectors for stereoscopic visualisation purposes. A parallel purpose would be to raise awareness of this stereoscopic capability amongst projector manufacturers with the hope that they would implement time-sequential stereoscopic display compatibility in future models as a standard feature (and list it in their specifications).
* A.Woods cmst.curtin.edu.au; phone +61 8 9266 7920; fax +61 8 9266 4799; www.cmst.curtin.edu.au † Also known as: field-sequential, frame-sequential, alternate frame, or active stereo.
Stereoscopic Displays and Virtual Reality Systems XIV, edited by Andrew J. Woods, Neil A. Dodgson,John O. Merritt, Mark T. Bolas, Ian E. McDowall, Proc. of SPIE-IS&T Electronic Imaging,
SPIE Vol. 6490, 64900V, © 2007 SPIE-IS&T · 0277-786X/07/$18
SPIE-IS&T/ Vol. 6490 64900V-1
A. J. Woods, T. Rourke (2007) “The compatibility of consumer DLP projectors with time‐sequential stereoscopic 3D visualization” presented at Stereoscopic Displays and Applications XVIII, published in Stereoscopic Displays and Virtual Reality Systems XIV, Proceedings of IS&T/SPIE Electronic Imaging, SPIE Vol. 6490, pp. 64900V‐1 to ‐7, San Jose, California, January 2007.
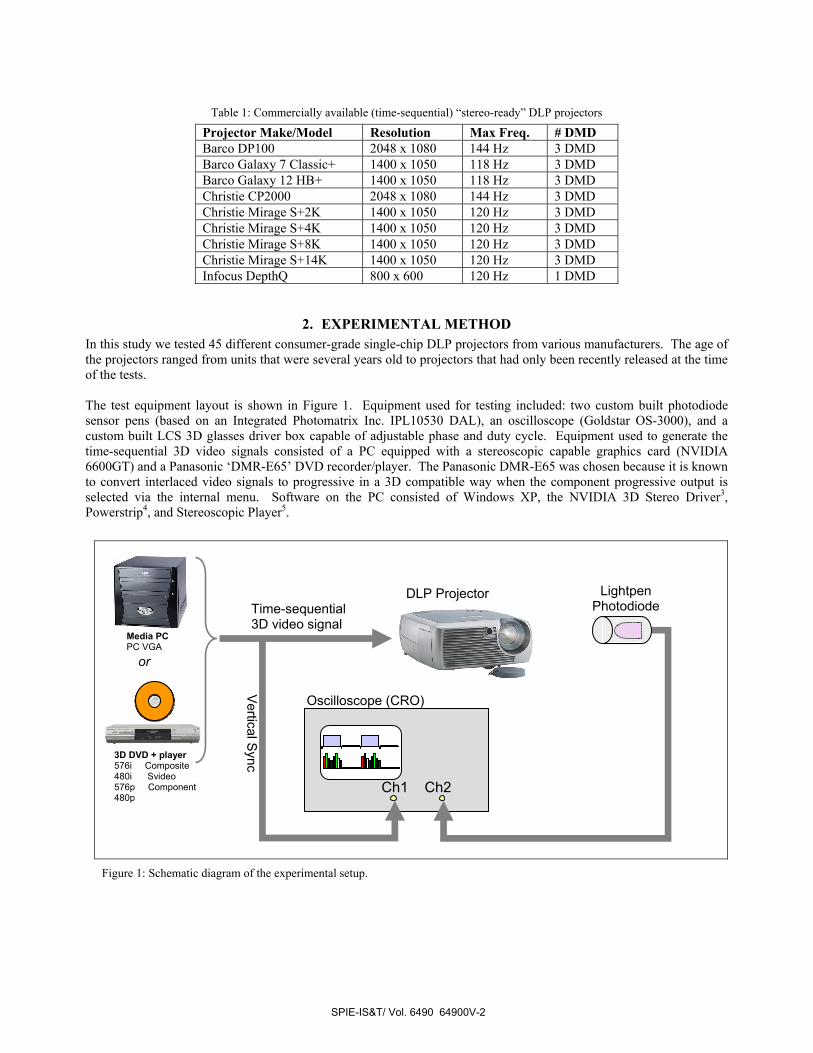
Table 1: Commercially available (time-sequential) “stereo-ready” DLP projectors
Projector Make/Model Resolution Max Freq. # DMD Barco DP100 2048 x 1080 144 Hz 3 DMD Barco Galaxy 7 Classic+ 1400 x 1050 118 Hz 3 DMD Barco Galaxy 12 HB+ 1400 x 1050 118 Hz 3 DMD Christie CP2000 2048 x 1080 144 Hz 3 DMD Christie Mirage S+2K 1400 x 1050 120 Hz 3 DMD Christie Mirage S+4K 1400 x 1050 120 Hz 3 DMD Christie Mirage S+8K 1400 x 1050 120 Hz 3 DMD Christie Mirage S+14K 1400 x 1050 120 Hz 3 DMD Infocus DepthQ 800 x 600 120 Hz 1 DMD
2. EXPERIMENTAL METHOD In this study we tested 45 different consumer-grade single-chip DLP projectors from various manufacturers. The age of the projectors ranged from units that were several years old to projectors that had only been recently released at the time of the tests. The test equipment layout is shown in Figure 1. Equipment used for testing included: two custom built photodiode sensor pens (based on an Integrated Photomatrix Inc. IPL10530 DAL), an oscilloscope (Goldstar OS-3000), and a custom built LCS 3D glasses driver box capable of adjustable phase and duty cycle. Equipment used to generate the time-sequential 3D video signals consisted of a PC equipped with a stereoscopic capable graphics card (NVIDIA 6600GT) and a Panasonic ‘DMR-E65’ DVD recorder/player. The Panasonic DMR-E65 was chosen because it is known to convert interlaced video signals to progressive in a 3D compatible way when the component progressive output is selected via the internal menu. Software on the PC consisted of Windows XP, the NVIDIA 3D Stereo Driver3, Powerstrip4, and Stereoscopic Player5.
Figure 1: Schematic diagram of the experimental setup.
DLP Projector
Time-sequential 3D video signal Oscilloscope (CRO)
Ch1 Ch2
Lightpen Photodiode
or
Vertical S
ync
3D DVD + player 576i Composite 480i Svideo 576p Component 480p
Media PC PC VGA
SPIE-IS&T/ Vol. 6490 64900V-2

Test signals consisted of alternating sequences (at field or frame rate) of red and black, blue and black, green and black, white and black, or RGB colour bars and black (i.e., in the case of “red and black”, one field of red, one field of black, and repeat). In the case of the DVD player, custom written NTSC and PAL DVDs were used. In the case of the PC, custom created JPS (Stereoscopic JPEG) files or stereoscopic (side-by-side) AVI files were used. Each projector was tested to establish: (1) whether the frame rate of the projector synchronized with the incoming video signal, (2) whether the colour-wheel synchronized with the incoming video signal, (3) whether there was crosstalk between alternate fields or frames, (4) the maximum frequency at which the projector would work in stereo (VGA only), (5) the time delay between the incoming video signal and the displayed images, (6) whether the projector converted interlaced video sources to progressive format in a 3D compatible way, and (7) the colour-wheel speed at various video input frequencies. These properties were tested for various video input connections (composite, SVideo, component, and VGA), various video formats (NTSC (480i), PAL (576i), 480P, 576P), and various VGA resolutions/frequencies. Standard Definition (SD) video formats were tested because there is a reasonable range of commercially available field-sequential 3D DVDs and it is important to know which displays can be used with these 3D DVDs. VGA modes were tested because the projector can be driven at its native resolution and frame rate with this interface. DVI-D input connections were not tested because a method of extracting the vertical sync signal from the DVI-D cable was not available.
3. RESULTS AND DISCUSSION The 3D compatibility results of the tested projectors were wide and varied. The overall results of the 3D compatibility testing are listed in Table 2. The ‘Composite & SVideo’ column indicates whether the projector would correctly display field-sequential 3D video (PAL or NTSC) entered via the composite and SVideo connector. The results for composite and SVideo are combined in the same column because there was no difference between composite and SVideo results across all the tested projectors. The ‘Component Interlaced’ column indicates whether the projector would correctly display field-sequential 3D video (derived from PAL or NTSC DVD) entered via the component connector. The ‘Component Progressive’ column indicates whether the projector would correctly display frame-sequential 3D video (576P 50Hz or 480P 60Hz) entered via the component connector. There was no difference in 3D compatibility between PAL and NTSC (50/60Hz) in all of the tests for all of the tested projectors so those results are combined in the composite/SVideo and component columns. The VGA 60Hz and 85Hz columns indicate whether the projector would correctly display frame-sequential 3D video entered via the VGA connector (in almost all cases the video resolution was set to the native resolution of the projector). The bottom row of the table indicates the percentage of all tested projectors that were time-sequential 3D compatible in that video mode. Regarding Table 2, some projectors were totally incompatible with time-sequential 3D video in all video modes and all video connections. This was generally due to the frame output of the projector not synchronizing with the incoming video signal. In most cases where this happened the input video signal was resampled to the native frequency of the projector (usually ~60Hz) – this resampling process usually destroys the 3D video signal. Some projectors would work with progressive time-sequential 3D video signals but not interlaced time-sequential 3D video signals. This suggests that the projector uses a deinterlacing (interlaced to progressive conversion) routine which is not time-sequential 3D compatible. Fortunately the internal deinterlacer can be bypassed by feeding the projector with a progressive video signal. In most instances where the projector was 3D incompatible in interlaced mode, it could be seen that the colour-wheel was synchronising to the incoming video signal but the odd and even fields were being mixed during the deinterlacing process. Since DMDs are progressive devices, any interlaced video signal input to the projector must be deinterlaced (converted from interlaced to progressive).
SPIE-IS&T/ Vol. 6490 64900V-3

Table 2: Time-sequential 3D compatibility results for the 45 DLP projectors tested. (a green tick indicates that mode was time-sequential 3D compatible, a red cross indicates that mode is not 3D compatible, a dash indicates that mode was not tested, ‘n/a’ indicates that connection or mode was not available on that projector)
Brand Model Composite & S-Video
Component Interlaced
Component Progressive
VGA 60 Hz VGA 85 Hz
Acer PD322 x x √ √ √ Acer PD523 x x √ √ √ Acer PD723P x x √ x x Acer PH110 x x √ √ √ BenQ MP 610 x x √ √ √ BenQ PB 6240 x x √ √ √ BenQ PE 7800 x x x x x BenQ PE 8700 x x x x x Boxlight Raven x x √ √ √ Casio XJ 360 x x √ √ √ Casio XJ 560 x x √ x x Dell 3200 MP x - - x x IBM C400 x n/a n/a x x Infocus LitePro 620 √ n/a n/a x x Liesegang DDV 2111 Ultra √ n/a n/a x x Liesegang DDV 3200 x x √ x x Liesegang e.Motion 4100 x x √ x x Liesegang LuxorPlus x x √ x x Liesegang Multi800 x n/a √ x x Mitsubishi HC3000 x x √ √ x Mitsubishi XD450U x x √ x x NEC HT 1100 x x √ √ x NEC LT 35 x x √ √ √ NEC LT 100 √ √ √ x x Optoma EP719 - - - √ √ Optoma EP739 - - - √ √ Optoma EP759 x x √ x x Optoma H27 x x √ - - Optoma H57 x x √ x x Optoma HD72i x x √ √ x Panasonic PT-D 5500E x x √ √ x PLUS U4-237 x n/a n/a √ √ PLUS U5-112 x x √ √ √ Projection Design Action! Model 2 Mk2 x n/a √ √ x Projection Design Evo 2 SX+ x x √ √ x Projection Design F1+ SX+ x x √ √ x Projection Design F3 SXGA+ x x √ √ x Sharp XR10X x x √ √ √ Sharp XV-Z2000 √ √ √ x x Sharp XV-Z9000E x x √ x x Studio Experience SE 30 HD x x √ x x Studio Experience SE 50 HD x x x x x Toshiba TDP-S8 x x √ √ √ Yamaha DPX-1300 x x √ x x Yamaha DPX-530 x x √ √ √ % 3D compatible: 9% 5% 83% 52% 34%
SPIE-IS&T/ Vol. 6490 64900V-4
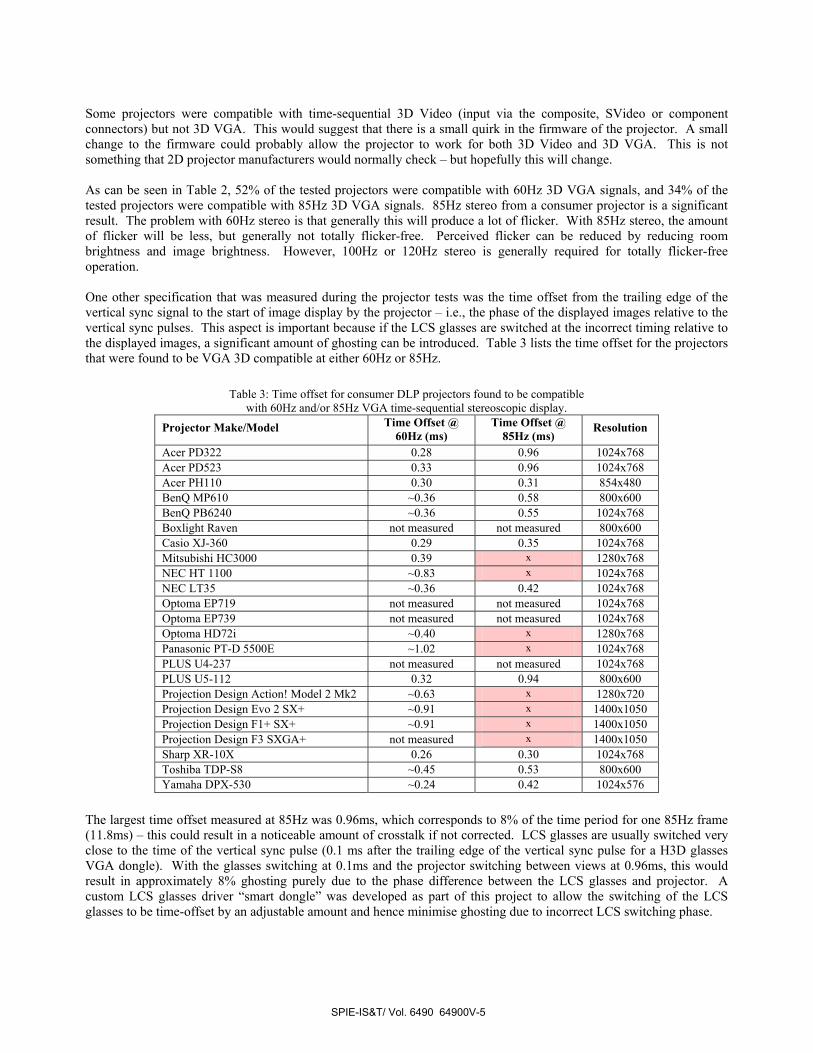
Some projectors were compatible with time-sequential 3D Video (input via the composite, SVideo or component connectors) but not 3D VGA. This would suggest that there is a small quirk in the firmware of the projector. A small change to the firmware could probably allow the projector to work for both 3D Video and 3D VGA. This is not something that 2D projector manufacturers would normally check – but hopefully this will change. As can be seen in Table 2, 52% of the tested projectors were compatible with 60Hz 3D VGA signals, and 34% of the tested projectors were compatible with 85Hz 3D VGA signals. 85Hz stereo from a consumer projector is a significant result. The problem with 60Hz stereo is that generally this will produce a lot of flicker. With 85Hz stereo, the amount of flicker will be less, but generally not totally flicker-free. Perceived flicker can be reduced by reducing room brightness and image brightness. However, 100Hz or 120Hz stereo is generally required for totally flicker-free operation. One other specification that was measured during the projector tests was the time offset from the trailing edge of the vertical sync signal to the start of image display by the projector – i.e., the phase of the displayed images relative to the vertical sync pulses. This aspect is important because if the LCS glasses are switched at the incorrect timing relative to the displayed images, a significant amount of ghosting can be introduced. Table 3 lists the time offset for the projectors that were found to be VGA 3D compatible at either 60Hz or 85Hz.
Table 3: Time offset for consumer DLP projectors found to be compatible with 60Hz and/or 85Hz VGA time-sequential stereoscopic display.
Projector Make/Model Time Offset @ 60Hz (ms)
Time Offset @ 85Hz (ms)
Resolution
Acer PD322 0.28 0.96 1024x768 Acer PD523 0.33 0.96 1024x768 Acer PH110 0.30 0.31 854x480 BenQ MP610 ~0.36 0.58 800x600 BenQ PB6240 ~0.36 0.55 1024x768 Boxlight Raven not measured not measured 800x600 Casio XJ-360 0.29 0.35 1024x768 Mitsubishi HC3000 0.39 x 1280x768 NEC HT 1100 ~0.83 x 1024x768 NEC LT35 ~0.36 0.42 1024x768 Optoma EP719 not measured not measured 1024x768 Optoma EP739 not measured not measured 1024x768 Optoma HD72i ~0.40 x 1280x768 Panasonic PT-D 5500E ~1.02 x 1024x768 PLUS U4-237 not measured not measured 1024x768 PLUS U5-112 0.32 0.94 800x600 Projection Design Action! Model 2 Mk2 ~0.63 x 1280x720 Projection Design Evo 2 SX+ ~0.91 x 1400x1050 Projection Design F1+ SX+ ~0.91 x 1400x1050 Projection Design F3 SXGA+ not measured x 1400x1050 Sharp XR-10X 0.26 0.30 1024x768 Toshiba TDP-S8 ~0.45 0.53 800x600 Yamaha DPX-530 ~0.24 0.42 1024x576
The largest time offset measured at 85Hz was 0.96ms, which corresponds to 8% of the time period for one 85Hz frame (11.8ms) – this could result in a noticeable amount of crosstalk if not corrected. LCS glasses are usually switched very close to the time of the vertical sync pulse (0.1 ms after the trailing edge of the vertical sync pulse for a H3D glasses VGA dongle). With the glasses switching at 0.1ms and the projector switching between views at 0.96ms, this would result in approximately 8% ghosting purely due to the phase difference between the LCS glasses and projector. A custom LCS glasses driver “smart dongle” was developed as part of this project to allow the switching of the LCS glasses to be time-offset by an adjustable amount and hence minimise ghosting due to incorrect LCS switching phase.
SPIE-IS&T/ Vol. 6490 64900V-5
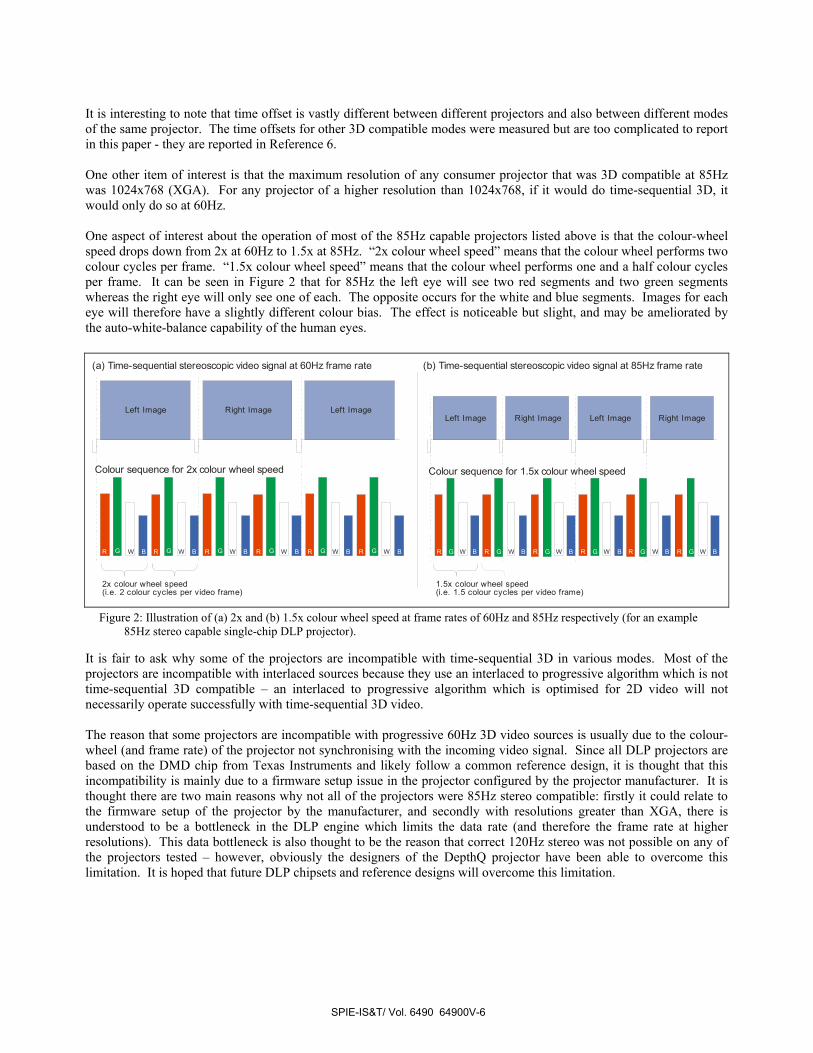
It is interesting to note that time offset is vastly different between different projectors and also between different modes of the same projector. The time offsets for other 3D compatible modes were measured but are too complicated to report in this paper - they are reported in Reference 6. One other item of interest is that the maximum resolution of any consumer projector that was 3D compatible at 85Hz was 1024x768 (XGA). For any projector of a higher resolution than 1024x768, if it would do time-sequential 3D, it would only do so at 60Hz. One aspect of interest about the operation of most of the 85Hz capable projectors listed above is that the colour-wheel speed drops down from 2x at 60Hz to 1.5x at 85Hz. “2x colour wheel speed” means that the colour wheel performs two colour cycles per frame. “1.5x colour wheel speed” means that the colour wheel performs one and a half colour cycles per frame. It can be seen in Figure 2 that for 85Hz the left eye will see two red segments and two green segments whereas the right eye will only see one of each. The opposite occurs for the white and blue segments. Images for each eye will therefore have a slightly different colour bias. The effect is noticeable but slight, and may be ameliorated by the auto-white-balance capability of the human eyes.
It is fair to ask why some of the projectors are incompatible with time-sequential 3D in various modes. Most of the projectors are incompatible with interlaced sources because they use an interlaced to progressive algorithm which is not time-sequential 3D compatible – an interlaced to progressive algorithm which is optimised for 2D video will not necessarily operate successfully with time-sequential 3D video. The reason that some projectors are incompatible with progressive 60Hz 3D video sources is usually due to the colour-wheel (and frame rate) of the projector not synchronising with the incoming video signal. Since all DLP projectors are based on the DMD chip from Texas Instruments and likely follow a common reference design, it is thought that this incompatibility is mainly due to a firmware setup issue in the projector configured by the projector manufacturer. It is thought there are two main reasons why not all of the projectors were 85Hz stereo compatible: firstly it could relate to the firmware setup of the projector by the manufacturer, and secondly with resolutions greater than XGA, there is understood to be a bottleneck in the DLP engine which limits the data rate (and therefore the frame rate at higher resolutions). This data bottleneck is also thought to be the reason that correct 120Hz stereo was not possible on any of the projectors tested – however, obviously the designers of the DepthQ projector have been able to overcome this limitation. It is hoped that future DLP chipsets and reference designs will overcome this limitation.
2x colour wheel speed(i.e. 2 colour cycles per video frame)
1.5x colour wheel speed(i.e. 1.5 colour cycles per video frame)
Right Image Left ImageLeft ImageLeft Image Right Image Left Image Right Image
R G W B R G W B R G W B R G W B R G W B R G W B R G W B R G W B R G W B R G W B R G W B R G W B
(a) Time-sequential stereoscopic video signal at 60Hz frame rate (b) Time-sequential stereoscopic video signal at 85Hz frame rate
Colour sequence for 2x colour wheel speed Colour sequence for 1.5x colour wheel speed
Figure 2: Illustration of (a) 2x and (b) 1.5x colour wheel speed at frame rates of 60Hz and 85Hz respectively (for an example 85Hz stereo capable single-chip DLP projector).
SPIE-IS&T/ Vol. 6490 64900V-6
4. CONCLUSION This study has revealed a relatively large number of consumer single-chip DLP projectors that can be used for time-sequential stereoscopic display – some at image refresh rates as high as 85Hz. Although 85Hz stereo is not generally totally flicker-free, the knowledge that low-cost consumer DLP projectors can be used for time-sequential stereoscopic viewing will open up stereoscopic visualisation to a wider range of users and applications. Such users and applications can graduate to higher-end flicker-free “stereo-ready” projection systems when requirements dictate and funds allow. Unfortunately most of the projectors tested are not directly compatible with field-sequential 3D DVDs (using common video interfaces: composite, SVideo and component interlaced), however, it was found that 83% of tested projectors could be used to display field-sequential DVDs if the 3D DVD was played back from a 3D compatible progressive output DVD player. Not all progressive output DVD players convert from interlaced to progressive in a 3D compatible way, however, it is known that some Panasonic DVD players do (such as the Panasonic DMR-E65, Panasonic DVD-S55 (NSTC only), and Panasonic DVD-S47 (possibly NTSC only)). It would be useful to develop a list of 3D compatible progressive output DVD players, but that is beyond the scope of this paper. 85Hz stereo via the VGA connector will be of use to a wide range of computer-based stereoscopic imaging applications, the most prominent probably being gaming. Over a thousand different PC games can be played in stereo with the use of an NVIDIA graphics card and the NVIDIA 3D Stereo driver7. Currently the 3D compatibility of consumer DLP projectors is not advertised or listed in product specifications by manufacturers or distributors. Additionally, we did not find any consumer projectors that were capable of 100/120Hz stereo operation. It is hoped that in the near future both of these factors will change.
5. ACKNOWLEDGEMENTS This work was supported by iVEC (the hub of advanced computing in Western Australia), Jumbo Vision International, and ISA Technologies. We also wish to thank the multitude of companies and individuals who lent DLP projectors for testing: Kim Kimenkowski, Jumbo Vision International; Sil La Puma and Simon Beard, ISA Technologies; Con Parente, West Coast Hi-Fi O’Connor; David Tuttle, Optoma USA; Geoff Frampton, Essential Office Products; Roger Castle, Castle Funding; Evan Papantoniou, Thames Computer Group; Vaughan Doyle and Adam Thackrah, J Mills Distribution; Nic Beames, Dynamic Digital Depth; Simon, Shriro Australia; Brendan, Perth Audio Visual; Marc Störig, AVCE Liesegang Australia; Will Rossiter and Duncan Boekhold, Yamaha Music; Brian Wood, West Coast Hi-Fi Joondalup; Chris Malcolm, John Curtin Prime Ministerial Gallery; Martin Todd, NEC Australia; Ross Sawatzky and Jayne Schröder, Advanced Visual Design; Alan, Direct National Business Machines; Peter Cutts, PCA Marketing; Adam Byrne, Toshiba Australia; Mike Butler, ComputerCorp; John Voss and Leigh, Rexel Australia; Peter Shilkin, Panasonic Australia; Claudio Cardile, Mitsubishi Australia; Darren Goble, LG Electrical; and Jason Burns, Douglas Hi-Fi.
6. REFERENCES 1. I. McDowall, M. Bolas, D. Corr, T. Schmidt, “Single and Multiple Viewer Stereo with DLP Projectors”, in
Stereoscopic Displays and Virtual Reality Systems VIII, Proc. SPIE Vol. 4297, pg 418-425, San Jose, California (2001).
2. L. J. Hornbeck, “Current Status and Future Applications for DMD-Based Projection Displays”, in Proceedings of the Fifth International Display Workshop IDW ‘98, Kobe, Japan (1998).
3. NVIDIA 3D Stereo Driver http://www.nvidia.com/object/3d_stereo.html 4. Powerstrip software http://entechtaiwan.net/util/ps.shtm 5. Stereoscopic Player software http://www.3dtv.at/Products/Player/Index_en.aspx 6. T. Rourke, A. J. Woods, “Compatibility of Consumer DLP Projectors with Time-Sequential Stereoscopic
Visualisation”, Technical Report CMST 2006-17, Curtin University of Technology, Perth, Australia (2006). 7. D. Cook, “Stereoscopic Gaming: Technology and Applications”, Keynote Presentation at Stereoscopic Displays
and Applications XV conference, 19-21 January 2004, San Jose, California. (Presentation only).
SPIE-IS&T/ Vol. 6490 64900V-7

Paper 14 [Reviewed Article]
A. J. Woods (2009) “3‐D Displays in the Home” Information Display, 7(09), pp. 8‐12.
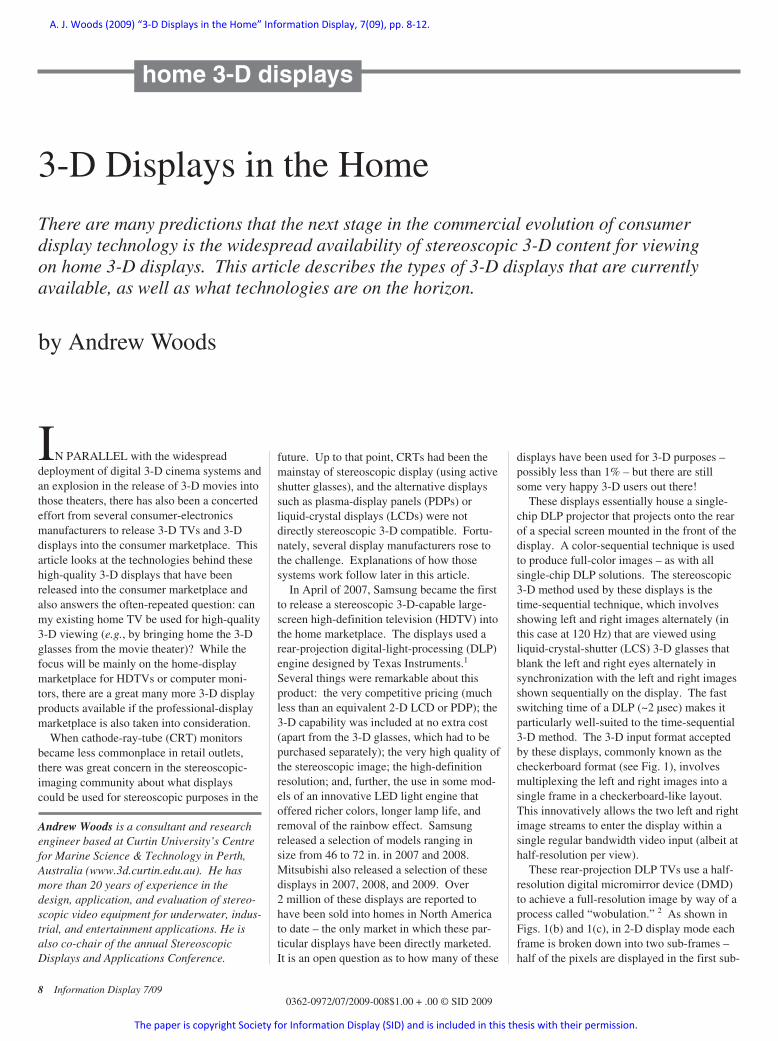
IN PARALLEL with the widespreaddeployment of digital 3-D cinema systems andan explosion in the release of 3-D movies intothose theaters, there has also been a concertedeffort from several consumer-electronics manufacturers to release 3-D TVs and 3-Ddisplays into the consumer marketplace. Thisarticle looks at the technologies behind thesehigh-quality 3-D displays that have beenreleased into the consumer marketplace andalso answers the often-repeated question: canmy existing home TV be used for high-quality3-D viewing (e.g., by bringing home the 3-Dglasses from the movie theater)? While thefocus will be mainly on the home-display marketplace for HDTVs or computer moni-tors, there are a great many more 3-D displayproducts available if the professional-displaymarketplace is also taken into consideration.
When cathode-ray-tube (CRT) monitorsbecame less commonplace in retail outlets,there was great concern in the stereoscopic-imaging community about what displayscould be used for stereoscopic purposes in the
future. Up to that point, CRTs had been themainstay of stereoscopic display (using activeshutter glasses), and the alternative displayssuch as plasma-display panels (PDPs) or liquid-crystal displays (LCDs) were notdirectly stereoscopic 3-D compatible. Fortu-nately, several display manufacturers rose tothe challenge. Explanations of how those systems work follow later in this article.
In April of 2007, Samsung became the firstto release a stereoscopic 3-D-capable large-screen high-definition television (HDTV) intothe home marketplace. The displays used arear-projection digital-light-processing (DLP)engine designed by Texas Instruments.1
Several things were remarkable about thisproduct: the very competitive pricing (muchless than an equivalent 2-D LCD or PDP); the3-D capability was included at no extra cost(apart from the 3-D glasses, which had to bepurchased separately); the very high quality ofthe stereoscopic image; the high-definitionresolution; and, further, the use in some mod-els of an innovative LED light engine thatoffered richer colors, longer lamp life, andremoval of the rainbow effect. Samsungreleased a selection of models ranging in size from 46 to 72 in. in 2007 and 2008. Mitsubishi also released a selection of thesedisplays in 2007, 2008, and 2009. Over 2 million of these displays are reported tohave been sold into homes in North Americato date – the only market in which these par-ticular displays have been directly marketed.It is an open question as to how many of these
displays have been used for 3-D purposes –possibly less than 1% – but there are stillsome very happy 3-D users out there!
These displays essentially house a single-chip DLP projector that projects onto the rearof a special screen mounted in the front of thedisplay. A color-sequential technique is usedto produce full-color images – as with all single-chip DLP solutions. The stereoscopic3-D method used by these displays is thetime-sequential technique, which involvesshowing left and right images alternately (inthis case at 120 Hz) that are viewed using liquid-crystal-shutter (LCS) 3-D glasses thatblank the left and right eyes alternately in synchronization with the left and right imagesshown sequentially on the display. The fastswitching time of a DLP (~2 µsec) makes itparticularly well-suited to the time-sequential3-D method. The 3-D input format acceptedby these displays, commonly known as thecheckerboard format (see Fig. 1), involvesmultiplexing the left and right images into asingle frame in a checkerboard-like layout.This innovatively allows the two left and rightimage streams to enter the display within asingle regular bandwidth video input (albeit athalf-resolution per view).
These rear-projection DLP TVs use a half-resolution digital micromirror device (DMD)to achieve a full-resolution image by way of aprocess called “wobulation.” 2 As shown inFigs. 1(b) and 1(c), in 2-D display mode eachframe is broken down into two sub-frames –half of the pixels are displayed in the first sub-
3-D Displays in the Home
There are many predictions that the next stage in the commercial evolution of consumer display technology is the widespread availability of stereoscopic 3-D content for viewing on home 3-D displays. This article describes the types of 3-D displays that are currentlyavailable, as well as what technologies are on the horizon.
by Andrew Woods
Andrew Woods is a consultant and researchengineer based at Curtin University’s Centrefor Marine Science & Technology in Perth,Australia (www.3d.curtin.edu.au). He hasmore than 20 years of experience in thedesign, application, and evaluation of stereo-scopic video equipment for underwater, indus-trial, and entertainment applications. He isalso co-chair of the annual Stereoscopic Displays and Applications Conference.
8 Information Display 7/090362-0972/07/2009-008$1.00 + .00 © SID 2009
home 3-D displays
A. J. Woods (2009) “3‐D Displays in the Home” Information Display, 7(09), pp. 8‐12.
The paper is copyright Society for Information Display (SID) and is included in this thesis with their permission.
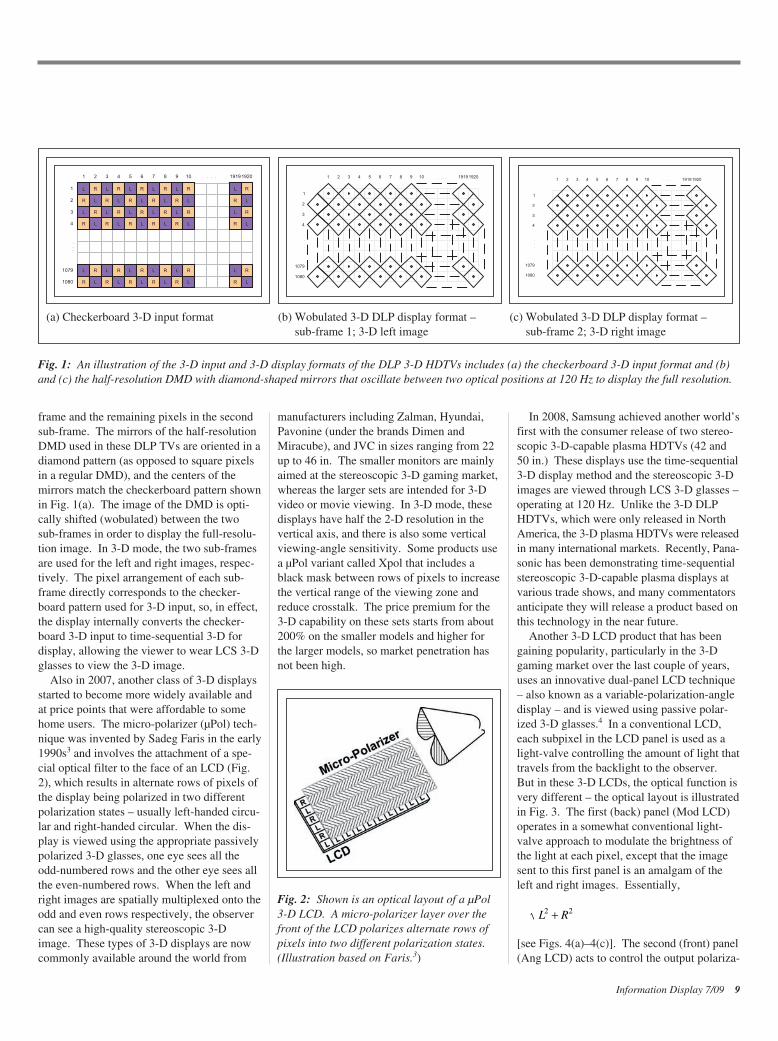
frame and the remaining pixels in the secondsub-frame. The mirrors of the half-resolutionDMD used in these DLP TVs are oriented in adiamond pattern (as opposed to square pixelsin a regular DMD), and the centers of the mirrors match the checkerboard pattern shownin Fig. 1(a). The image of the DMD is opti-cally shifted (wobulated) between the twosub-frames in order to display the full-resolu-tion image. In 3-D mode, the two sub-framesare used for the left and right images, respec-tively. The pixel arrangement of each sub-frame directly corresponds to the checker-board pattern used for 3-D input, so, in effect,the display internally converts the checker-board 3-D input to time-sequential 3-D fordisplay, allowing the viewer to wear LCS 3-Dglasses to view the 3-D image.
Also in 2007, another class of 3-D displaysstarted to become more widely available andat price points that were affordable to somehome users. The micro-polarizer (µPol) tech-nique was invented by Sadeg Faris in the early1990s3 and involves the attachment of a spe-cial optical filter to the face of an LCD (Fig.2), which results in alternate rows of pixels ofthe display being polarized in two differentpolarization states – usually left-handed circu-lar and right-handed circular. When the dis-play is viewed using the appropriate passivelypolarized 3-D glasses, one eye sees all theodd-numbered rows and the other eye sees allthe even-numbered rows. When the left andright images are spatially multiplexed onto theodd and even rows respectively, the observercan see a high-quality stereoscopic 3-Dimage. These types of 3-D displays are nowcommonly available around the world from
manufacturers including Zalman, Hyundai,Pavonine (under the brands Dimen andMiracube), and JVC in sizes ranging from 22up to 46 in. The smaller monitors are mainlyaimed at the stereoscopic 3-D gaming market,whereas the larger sets are intended for 3-Dvideo or movie viewing. In 3-D mode, thesedisplays have half the 2-D resolution in thevertical axis, and there is also some verticalviewing-angle sensitivity. Some products usea µPol variant called Xpol that includes ablack mask between rows of pixels to increasethe vertical range of the viewing zone andreduce crosstalk. The price premium for the3-D capability on these sets starts from about200% on the smaller models and higher forthe larger models, so market penetration hasnot been high.
In 2008, Samsung achieved another world’sfirst with the consumer release of two stereo-scopic 3-D-capable plasma HDTVs (42 and50 in.) These displays use the time-sequential3-D display method and the stereoscopic 3-Dimages are viewed through LCS 3-D glasses –operating at 120 Hz. Unlike the 3-D DLPHDTVs, which were only released in North America, the 3-D plasma HDTVs were releasedin many international markets. Recently, Pana-sonic has been demonstrating time-sequentialstereoscopic 3-D-capable plasma displays atvarious trade shows, and many commentatorsanticipate they will release a product based onthis technology in the near future.
Another 3-D LCD product that has beengaining popularity, particularly in the 3-Dgaming market over the last couple of years,uses an innovative dual-panel LCD technique– also known as a variable-polarization-angledisplay – and is viewed using passive polar-ized 3-D glasses.4 In a conventional LCD,each subpixel in the LCD panel is used as alight-valve controlling the amount of light thattravels from the backlight to the observer.But in these 3-D LCDs, the optical function isvery different – the optical layout is illustratedin Fig. 3. The first (back) panel (Mod LCD)operates in a somewhat conventional light-valve approach to modulate the brightness ofthe light at each pixel, except that the imagesent to this first panel is an amalgam of theleft and right images. Essentially,
[see Figs. 4(a)–4(c)]. The second (front) panel (Ang LCD) acts to control the output polariza-
Information Display 7/09 9
(a) Checkerboard 3-D input format (b) Wobulated 3-D DLP display format –sub-frame 1; 3-D left image
(c) Wobulated 3-D DLP display format –sub-frame 2; 3-D right image
Fig. 1: An illustration of the 3-D input and 3-D display formats of the DLP 3-D HDTVs includes (a) the checkerboard 3-D input format and (b) and (c) the half-resolution DMD with diamond-shaped mirrors that oscillate between two optical positions at 120 Hz to display the full resolution.
Fig. 2: Shown is an optical layout of a µPol3-D LCD. A micro-polarizer layer over thefront of the LCD polarizes alternate rows ofpixels into two different polarization states.(Illustration based on Faris.3)
L R2 2+
The paper is copyright Society for Information Display (SID) and is included in this thesis with their permission.
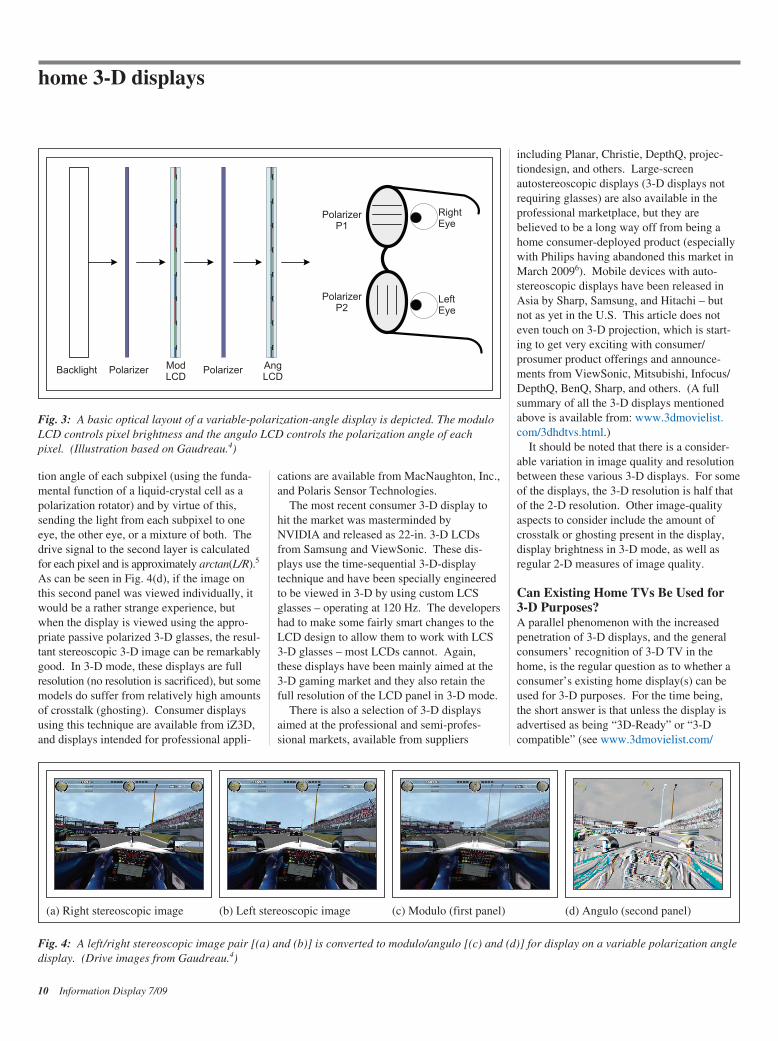
tion angle of each subpixel (using the funda-mental function of a liquid-crystal cell as apolarization rotator) and by virtue of this,sending the light from each subpixel to oneeye, the other eye, or a mixture of both. Thedrive signal to the second layer is calculated for each pixel and is approximately arctan(L/R).5
As can be seen in Fig. 4(d), if the image onthis second panel was viewed individually, itwould be a rather strange experience, butwhen the display is viewed using the appro-priate passive polarized 3-D glasses, the resul-tant stereoscopic 3-D image can be remarkably good. In 3-D mode, these displays are full resolution (no resolution is sacrificed), but some models do suffer from relatively high amountsof crosstalk (ghosting). Consumer displaysusing this technique are available from iZ3D,and displays intended for professional appli-
cations are available from MacNaughton, Inc.,and Polaris Sensor Technologies.
The most recent consumer 3-D display tohit the market was masterminded by NVIDIA and released as 22-in. 3-D LCDsfrom Samsung and ViewSonic. These dis-plays use the time-sequential 3-D-displaytechnique and have been specially engineeredto be viewed in 3-D by using custom LCSglasses – operating at 120 Hz. The developershad to make some fairly smart changes to theLCD design to allow them to work with LCS3-D glasses – most LCDs cannot. Again,these displays have been mainly aimed at the3-D gaming market and they also retain thefull resolution of the LCD panel in 3-D mode.
There is also a selection of 3-D displaysaimed at the professional and semi-profes-sional markets, available from suppliers
including Planar, Christie, DepthQ, projec-tiondesign, and others. Large-screenautostereoscopic displays (3-D displays notrequiring glasses) are also available in theprofessional marketplace, but they arebelieved to be a long way off from being ahome consumer-deployed product (especiallywith Philips having abandoned this market inMarch 20096). Mobile devices with auto-stereoscopic displays have been released inAsia by Sharp, Samsung, and Hitachi – butnot as yet in the U.S. This article does noteven touch on 3-D projection, which is start-ing to get very exciting with consumer/ prosumer product offerings and announce-ments from ViewSonic, Mitsubishi, Infocus/DepthQ, BenQ, Sharp, and others. (A fullsummary of all the 3-D displays mentionedabove is available from: www.3dmovielist.com/3dhdtvs.html.)
It should be noted that there is a consider-able variation in image quality and resolutionbetween these various 3-D displays. For someof the displays, the 3-D resolution is half thatof the 2-D resolution. Other image-qualityaspects to consider include the amount ofcrosstalk or ghosting present in the display,display brightness in 3-D mode, as well asregular 2-D measures of image quality.
Can Existing Home TVs Be Used for 3-D Purposes?A parallel phenomenon with the increasedpenetration of 3-D displays, and the generalconsumers’ recognition of 3-D TV in thehome, is the regular question as to whether aconsumer’s existing home display(s) can beused for 3-D purposes. For the time being,the short answer is that unless the display isadvertised as being “3D-Ready” or “3-D compatible” (see www.3dmovielist.com/
10 Information Display 7/09
home 3-D displays
Fig. 3: A basic optical layout of a variable-polarization-angle display is depicted. The moduloLCD controls pixel brightness and the angulo LCD controls the polarization angle of eachpixel. (Illustration based on Gaudreau.4)
(a) Right stereoscopic image (b) Left stereoscopic image (c) Modulo (first panel) (d) Angulo (second panel)
Fig. 4: A left/right stereoscopic image pair [(a) and (b)] is converted to modulo/angulo [(c) and (d)] for display on a variable polarization angledisplay. (Drive images from Gaudreau.4)

3dhdtvs.html) it unfortunately will not be ableto be used for high-quality flicker-free full-color stereoscopic 3-D viewing (except in thecase of older CRT monitors). Consumers maybe tempted to take home the 3-D glasses fromthe various high-quality 3-D movie screen-ings, but unfortunately they simply will notwork on their conventional home TV. Ignor-ing the displays that are advertised as beingstereoscopic 3-D capable, here is why conven-tional displays cannot be used for high-qualitystereoscopic 3-D viewing.
First, consider the three types of 3-Dglasses being used in the theaters – passivepolarized glasses, active LCS glasses, andInfitec (Dolby 3-D) glasses.
Polarized 3-D glasses will not work withconventional displays because they outputlight either in a single polarization direction(e.g., LCDs) or they are unpolarized (e.g.,PDPs). An optical filter would need to beadded to these displays to provide two polar-ization states (for the left and right views) –but currently this is not a customer-deployablesolution.
LCS 3-D glasses do not work with conven-tional LCDs for a range of reasons,7 but themost significant reason is the image-updatemethod. Unlike CRTs, LCDs are a hold-typedisplay, meaning that each pixel of the displayoutputs light over the entire frame period –i.e., there is no blanking period. But similiarto a CRT, the image on an LCD is updated
row by row from the top of the display to thebottom. The time taken to address the entiredisplay is almost one frame period. What thismeans is that there is no one time, or period oftime, when the display shows one imageexclusively across the entire display; i.e.,there is no one time when the shutters in a pairof LCS 3-D glasses could be opened so that aleft (or right) image would be seen across theentire screen. Figure 5 shows the image-update method of conventional LCDs, whichillustrates the problem. As mentioned above,ViewSonic and Samsung have implementedan as-yet-undisclosed modification in their 3-D LCDs to overcome this problem.
Unfortunately, conventional plasma displaysalso cannot be used with LCS 3-D glasses toproduce a high-quality flicker-free 3-Dimage.8 Unlike CRTs or conventional LCDsin which updated pixels are presented sequen-tially over the course of the frame (see Fig. 5),plasma displays have the nice feature that allof the updated pixels in a frame are illumi-nated simultaneously. However, the longphosphor persistence of conventional plasmadisplays means that crosstalk (ghosting) willbe high. Additionally, conventional plasmadisplays can only be driven with a 60-Hzvideo signal, meaning that even if the cross-talk was ignored, the image seen through theLCS 3-D glasses would flicker excessively.Samsung’s 3D-ready plasma displays makeuse of the checkerboard 3-D input method to
deliver the 3-D video signal and presumablyuse custom phosphors to reduce the amount ofcrosstalk due to phosphor persistence.
Even displays that are advertised as being120 Hz do not solve the problem – 120-Hz(and 240-Hz) technologies are being imple-mented with a range of LCDs and plasma displays to reduce the problem of imagesmear in scenes containing fast image motion.Many people recognize that “120 Hz” is oftenassociated with stereoscopic 3-D viewing, butunfortunately the inclusion of 120-Hz refreshrates does not solve all the problems for suc-cessfully using time-sequential 3-D on thesedisplays. The most obvious problem is thatthere is no way of driving them with a true120-Hz video signal, containing 120 distinctframes per second. Usually, the displayaccepts only a conventional 60-Hz video signal and the display internally interpolatesextra frames. The inability to send 120unique frames per second to the display wouldmean that it could not be used for 120-Hz 3-Dpurposes. So, unless the display is labeled as“3-D-ready” or “3-D compatible,” any men-tion of 120 Hz currently will not be an advan-tage to time-sequential 3-D compatibility.9
The Infitec system employed in Dolby 3-Dcinemas uses special interference filters todivide the visible color spectrum into six narrow bands called R1, R2, G1, G2, B1, andB2 for the purposes of this description.10 TheR1, G1, and B1 bands are used for one eyeimage and R2, G2, and B2 for the other eye.The human eye is largely insensitive to suchfine spectral differences, so this technique isable to generate full-color 3-D images withminimal color differences between the twoeyes. Unfortunately, conventional displayslack the ability to modulate light wavelengthsat this fine scale, so Infitec/Dolby 3-D glassesalso will not work on conventional displays.This may be a possibility in the future withmultiprimary-color displays, but there is noth-ing like this currently in the consumer market.
The only 3-D solution that can be widelydeployed to any consumer color display is theanaglyph 3-D method. The anaglyph has beenaround since the 1800s, and for modern full-color displays involves sending the left andright image views into one or two comple-mentary color channels, respectively. Forexample, the most common anaglyph tech-nique involves the left perspective imagebeing stored in the red color channel and theright perspective image being stored in the
Information Display 7/09 11
Fig. 5: Time-domain response of an example conventional LCD monitor (with 5.7-msec pixelresponse rate alternating between black and white frames at 75 Hz). The green line representsthe time each row is addressed. It can be seen that there is no point in time when the entirescreen shows one image across the entire screen.7
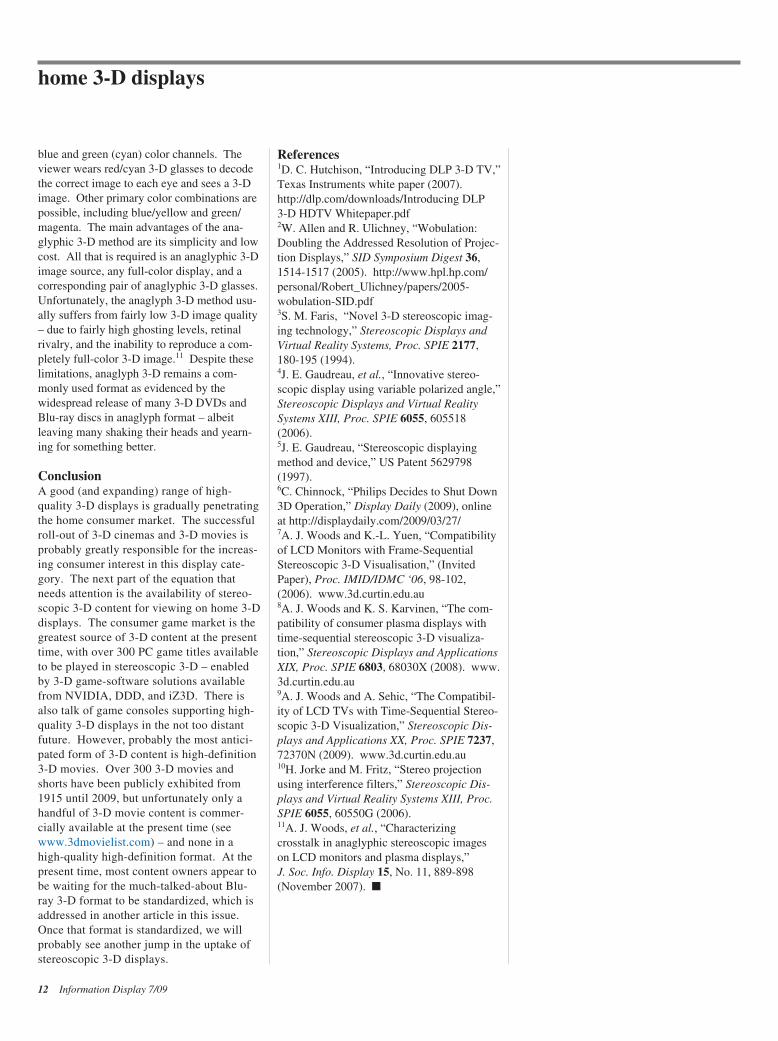
blue and green (cyan) color channels. Theviewer wears red/cyan 3-D glasses to decodethe correct image to each eye and sees a 3-Dimage. Other primary color combinations arepossible, including blue/yellow and green/magenta. The main advantages of the ana-glyphic 3-D method are its simplicity and lowcost. All that is required is an anaglyphic 3-Dimage source, any full-color display, and acorresponding pair of anaglyphic 3-D glasses.Unfortunately, the anaglyph 3-D method usu-ally suffers from fairly low 3-D image quality– due to fairly high ghosting levels, retinalrivalry, and the inability to reproduce a com-pletely full-color 3-D image.11 Despite theselimitations, anaglyph 3-D remains a com-monly used format as evidenced by thewidespread release of many 3-D DVDs andBlu-ray discs in anaglyph format – albeit leaving many shaking their heads and yearn-ing for something better.
ConclusionA good (and expanding) range of high-quality 3-D displays is gradually penetratingthe home consumer market. The successful roll-out of 3-D cinemas and 3-D movies isprobably greatly responsible for the increas-ing consumer interest in this display cate-gory. The next part of the equation thatneeds attention is the availability of stereo-scopic 3-D content for viewing on home 3-Ddisplays. The consumer game market is thegreatest source of 3-D content at the presenttime, with over 300 PC game titles availableto be played in stereoscopic 3-D – enabledby 3-D game-software solutions availablefrom NVIDIA, DDD, and iZ3D. There isalso talk of game consoles supporting high-quality 3-D displays in the not too distantfuture. However, probably the most antici-pated form of 3-D content is high-definition3-D movies. Over 300 3-D movies andshorts have been publicly exhibited from1915 until 2009, but unfortunately only ahandful of 3-D movie content is commer-cially available at the present time (seewww.3dmovielist.com) – and none in ahigh-quality high-definition format. At thepresent time, most content owners appear tobe waiting for the much-talked-about Blu-ray 3-D format to be standardized, which isaddressed in another article in this issue.Once that format is standardized, we willprobably see another jump in the uptake ofstereoscopic 3-D displays.
References1D. C. Hutchison, “Introducing DLP 3-D TV,”Texas Instruments white paper (2007). http://dlp.com/downloads/Introducing DLP3-D HDTV Whitepaper.pdf2W. Allen and R. Ulichney, “Wobulation: Doubling the Addressed Resolution of Projec-tion Displays,” SID Symposium Digest 36,1514-1517 (2005). http://www.hpl.hp.com/personal/Robert_Ulichney/papers/2005-wobulation-SID.pdf3S. M. Faris, “Novel 3-D stereoscopic imag-ing technology,” Stereoscopic Displays andVirtual Reality Systems, Proc. SPIE 2177,180-195 (1994).4J. E. Gaudreau, et al., “Innovative stereo-scopic display using variable polarized angle,”Stereoscopic Displays and Virtual RealitySystems XIII, Proc. SPIE 6055, 605518(2006).5J. E. Gaudreau, “Stereoscopic displayingmethod and device,” US Patent 5629798(1997).6C. Chinnock, “Philips Decides to Shut Down3D Operation,” Display Daily (2009), onlineat http://displaydaily.com/2009/03/27/7A. J. Woods and K.-L. Yuen, “Compatibilityof LCD Monitors with Frame-SequentialStereoscopic 3-D Visualisation,” (InvitedPaper), Proc. IMID/IDMC ‘06, 98-102,(2006). www.3d.curtin.edu.au8A. J. Woods and K. S. Karvinen, “The com-patibility of consumer plasma displays withtime-sequential stereoscopic 3-D visualiza-tion,” Stereoscopic Displays and ApplicationsXIX, Proc. SPIE 6803, 68030X (2008). www.3d.curtin.edu.au9A. J. Woods and A. Sehic, “The Compatibil-ity of LCD TVs with Time-Sequential Stereo-scopic 3-D Visualization,” Stereoscopic Dis-plays and Applications XX, Proc. SPIE 7237,72370N (2009). www.3d.curtin.edu.au10H. Jorke and M. Fritz, “Stereo projectionusing interference filters,” Stereoscopic Dis-plays and Virtual Reality Systems XIII, Proc.SPIE 6055, 60550G (2006).11A. J. Woods, et al., “Characterizingcrosstalk in anaglyphic stereoscopic imageson LCD monitors and plasma displays,” J. Soc. Info. Display 15, No. 11, 889-898(November 2007). �
12 Information Display 7/09
home 3-D displays
Have you forgotten about these issues?
Log onto informationdisplay.org

Paper 15 M. A. Weissman, A. J. Woods (2011) “A simple method for measuring crosstalk in
stereoscopic displays” in Stereoscopic Displays and Applications XXII, Proceedings of IS&T/SPIE Electronic Imaging, SPIE Vol. 7863, pp. 786310‐1 to ‐11, Burlingame, California, January 2011.
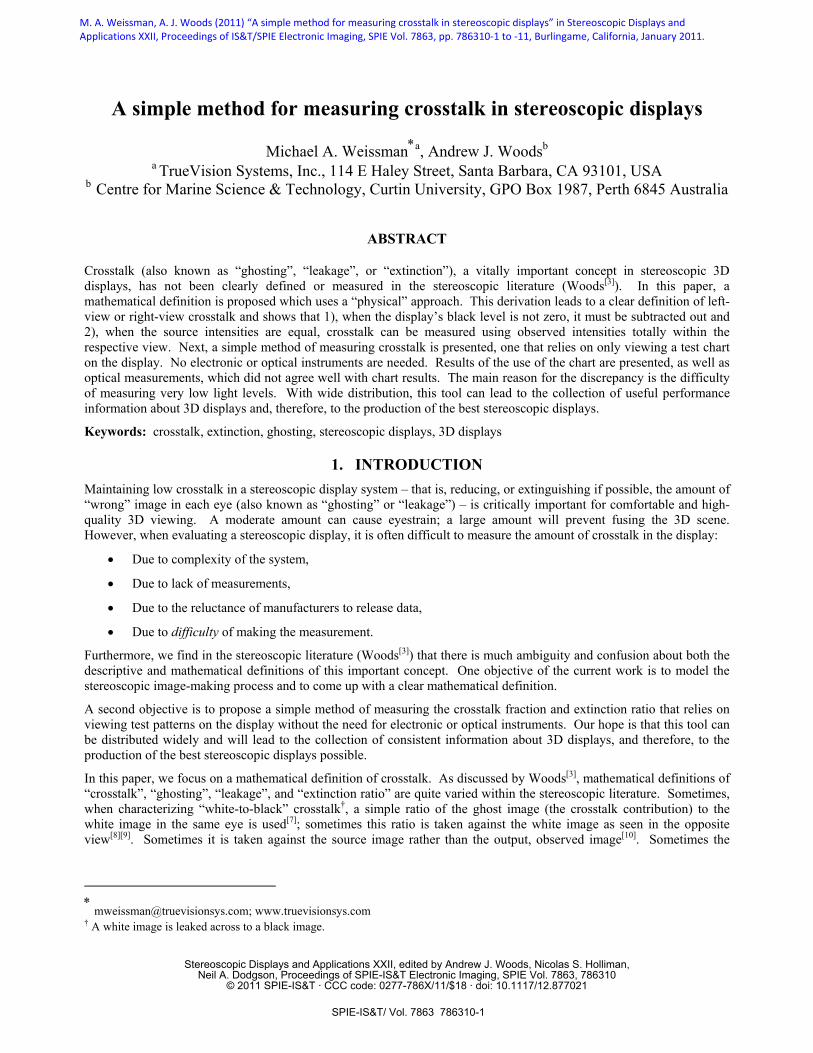
A simple method for measuring crosstalk in stereoscopic displays
Michael A. Weissman∗a, Andrew J. Woodsb
a TrueVision Systems, Inc., 114 E Haley Street, Santa Barbara, CA 93101, USA b Centre for Marine Science & Technology, Curtin University, GPO Box 1987, Perth 6845 Australia
ABSTRACT
Crosstalk (also known as “ghosting”, “leakage”, or “extinction”), a vitally important concept in stereoscopic 3D displays, has not been clearly defined or measured in the stereoscopic literature (Woods[3]). In this paper, a mathematical definition is proposed which uses a “physical” approach. This derivation leads to a clear definition of left-view or right-view crosstalk and shows that 1), when the display’s black level is not zero, it must be subtracted out and 2), when the source intensities are equal, crosstalk can be measured using observed intensities totally within the respective view. Next, a simple method of measuring crosstalk is presented, one that relies on only viewing a test chart on the display. No electronic or optical instruments are needed. Results of the use of the chart are presented, as well as optical measurements, which did not agree well with chart results. The main reason for the discrepancy is the difficulty of measuring very low light levels. With wide distribution, this tool can lead to the collection of useful performance information about 3D displays and, therefore, to the production of the best stereoscopic displays.
Keywords: crosstalk, extinction, ghosting, stereoscopic displays, 3D displays
1. INTRODUCTION Maintaining low crosstalk in a stereoscopic display system – that is, reducing, or extinguishing if possible, the amount of “wrong” image in each eye (also known as “ghosting” or “leakage”) – is critically important for comfortable and high-quality 3D viewing. A moderate amount can cause eyestrain; a large amount will prevent fusing the 3D scene. However, when evaluating a stereoscopic display, it is often difficult to measure the amount of crosstalk in the display:
• Due to complexity of the system,
• Due to lack of measurements,
• Due to the reluctance of manufacturers to release data,
• Due to difficulty of making the measurement.
Furthermore, we find in the stereoscopic literature (Woods[3]) that there is much ambiguity and confusion about both the descriptive and mathematical definitions of this important concept. One objective of the current work is to model the stereoscopic image-making process and to come up with a clear mathematical definition.
A second objective is to propose a simple method of measuring the crosstalk fraction and extinction ratio that relies on viewing test patterns on the display without the need for electronic or optical instruments. Our hope is that this tool can be distributed widely and will lead to the collection of consistent information about 3D displays, and therefore, to the production of the best stereoscopic displays possible.
In this paper, we focus on a mathematical definition of crosstalk. As discussed by Woods[3], mathematical definitions of “crosstalk”, “ghosting”, “leakage”, and “extinction ratio” are quite varied within the stereoscopic literature. Sometimes, when characterizing “white-to-black” crosstalk†, a simple ratio of the ghost image (the crosstalk contribution) to the white image in the same eye is used[7]; sometimes this ratio is taken against the white image as seen in the opposite view[8][9]. Sometimes it is taken against the source image rather than the output, observed image[10]. Sometimes the
∗
[email protected]; www.truevisionsys.com † A white image is leaked across to a black image.
Stereoscopic Displays and Applications XXII, edited by Andrew J. Woods, Nicolas S. Holliman,Neil A. Dodgson, Proceedings of SPIE-IS&T Electronic Imaging, SPIE Vol. 7863, 786310
© 2011 SPIE-IS&T · CCC code: 0277-786X/11/$18 · doi: 10.1117/12.877021
SPIE-IS&T/ Vol. 7863 786310-1
M. A. Weissman, A. J. Woods (2011) “A simple method for measuring crosstalk in stereoscopic displays” in Stereoscopic Displays and Applications XXII, Proceedings of IS&T/SPIE Electronic Imaging, SPIE Vol. 7863, pp. 786310‐1 to ‐11, Burlingame, California, January 2011.

black level is subtracted out[11][12][13][14][15][16][17]; sometimes not[7][8][9][10]. In order to confirm which formulation is most appropriate, a “physical” model of crosstalk is developed in the next section.
2. DEFINING CROSSTALK A model of the optical process for the formation of stereoscopic images is given in Figure 1. Going from left to right on the diagram, the Left and Right Source Images create source light intensities‡ that enter into “stereoscopic processing”. This is where the two images are combined – so that they overlap as perfectly as possible in the resultant stereo view – and separated back into each of the viewer’s eyes.
Figure 1. Physical model of the stereoscopic display process, showing light passing from source images, through stereoscopic processing, to observed images. (The variables are defined in the text.)
The combining/separating process takes various forms and technologies. It could be temporally multiplexed (as in time-sequential CRTs, LCDs, or projectors), spatially multiplexed (as in row-interleaved and autostereoscopic displays), or two-channel (as in projector systems or head-mounted displays). A dual projector display, for example, encodes the left and right images with polarized light and overlays them on a (polarization preserving) screen. Polarized glasses are used to decode the two images into the two eyes. The stereoscopic processing part of the display system consists of the projector filters, the screen, and the glasses. The optical processing of any part of this sub-system can be incomplete, leading to crosstalk.
After stereoscopic processing, an observed left or right image is composed mostly of light that was intended for that view, but there can be some “leaked” or “crossed over” contribution from the unintended image. In addition, there could be a contribution from ambient light. Therefore, the observed image intensity for each eye (OL,OR) is made up of three components:
OL = DL + CL + AL (1a)
OR = DR + CR + AR (1b)
where
D = Direct contribution to the observed image.
C = Crossover contribution to the observed image.
A = Ambient light contribution to the observed image.
The direct and crossover contributions can be characterized as portions of the source intensities; i.e., let
‡ By “intensity”, we are referring to the luminance at some position on the display surface, which is usually measured in cd/m2. This emitted light can have any spectral character. For example, in color displays, the formulation could be applied to the red, green, and blue channels separately.
SPIE-IS&T/ Vol. 7863 786310-2

τL = DL/SL , τR = DR/SR (2a,b)
χRL = CL/SR , χLR = CR/SL (3a,b)
where SL,SR = left and right source image intensities. These fractions can be called
“transmittance” (τL and τR), the fraction of source image that is intended for each eye, and
“crosstalk” (χRL and χLR), the fraction of source image that crosses over or leaks, forming the “ghost” image.
Note the subscript notation “RL” and “LR”. “RL” is used to represent the crosstalk from Right Image to Left Image, and vice-versa. This clarifies which crosstalk contribution is being referred to. Both crosstalk and transmittance are simply fractional quantities, not constants. Since the formation of images on stereoscopic displays is sometimes nonlinear, these quantities can be functions of the source intensity levels (as in time-sequential liquid-crystal displays
[15][16][17]).
Equations 3 provide a simple, basic, definition of crosstalk: the leaked intensity in one view as a fraction of the source intensity of the other view. Unfortunately, it is often impossible to measure these quantities. The source intensity must be measured before stereo processing; on some displays, such as those with a lenticular or polarizing film, this cannot be done. In addition, the observed intensities (of Equation 1) are the sum of three contributions. Even if we reduce the ambient light to zero, the observed light is the sum of direct and crossed-over light. There are two measured quantities and four unknowns. Theoretically, we could “turn off”, say, the left view and measure only a direct contribution in the right and a crossover contribution in the left. However, in most displays, when black images are presented to the display, the resulting light output is not zero. Thus, the direct contribution in the left and the crossover contribution in the right have not been eliminated.
The light level of a black image (i.e., zero “signal”) is called the black level (BL) of the display. LCDs, in particular, have a relatively high BL, which can be comparable to the crossover contribution. Even for displays having very low intrinsic BL, such as CRTs, plasmas, and OLEDs, there can still be a significant BL if their contrast and/or brightness levels are not adjusted properly.
The conclusion is that a formulation is required that subtracts out any influence of the black level. In addition, it should use quantities measured after stereo processing and, if possible, in only one view. This is presented in the next section.
3. MEASURING CROSSTALK In most stereoscopic 3D displays, the maximum ghosting§ occurs when one view has maximum signal level, or a “white” image, and the other has minimum signal level, or a “black” image. This is commonly called white-to-black crosstalk and is the most common way to characterize crosstalk in 3D displays.
As discussed above, white and black image pairs are not sufficient to measure crosstalk when the display has a non-zero black level. A third image pair must be added so that the black level can be properly accounted for. This is illustrated in Figure 2. White and black source image pairs are combined to produce three pairs of observed images. For the left view, for example, there are three resulting observed images: “White”, “Ghost”, and “Black”, as follows,
• White: The observed image is composed of mainly the direct white image with a small crossover component from the black image, plus ambient; i.e., from Equations 1, 2, and 3,
OWL = τ
L(W) + χ
RL(B) + AL (4a)
• Ghost: The observed image is composed of the direct black image plus the crossover white image (these two can be similar in magnitude), plus ambient,
OGL = τ
L(B) + χ
RL(W) + AL (4b)
§ As discussed by Woods[3] and others, ghosting, that is, the perception of crosstalk, also depends on content. For example, when the disparity (or parallax) of homologous objects is very small or zero, the crossover contribution lies on top of the direct contribution and is therefore not noticeable by the user. However, the contribution is still there and can be measured.

• Black: The observed image is composed of the direct black image plus the crossover black image, plus ambient,
OBL = τ
L(B) + χ
RL(B) + AL (4c)
Figure 2. Two white and black Source Images combine to form six Observed Images: “White”, “Ghost”, and “Black” for each view. (Variables are defined in the text.)
where W is the light intensity coming from the white source image and B is the intensity of the black source image. Even though the black image comes from the minimum signal level (e.g., “zero gray-level”), it will not necessarily be zero, because of the black level of the display.
Subtracting Equation 4c from 4a and Equation 4c from 4b, leads to, respectively,
OWL – O
BL = τ
L(W – B) (5a)
OGL – O
BL = χ
RL(W – B) (5b)
And in turn,
χRL = τL(OGL – OBL)/(OWL – OBL). (6a)
A similar derivation follows for the right view,
χLR = τR(OGR – OBR)/(OWR – OBR). (6b)
This result is convenient because all the quantities are measured on the “same side”. However, these equations are not convenient because they still require the transmittance factors, which could be difficult to measure. Therefore, the final step is to define an “observed” crosstalk as
OCTRL = χRL/τL = (OGL – OBL)/(OWL – OBL) (7a)
OCTLR = χLR/τR = (OGR – OBR)/(OWR – OBR). (7b)
This parameter has been called “System Crosstalk” by Huang[11] and is used by many authors[13][14][15][16][17]. We refer to it here as “observed crosstalk” to emphasize that it uses quantities measured in the observed images and to distinguish it from the crosstalk fraction defined by Equations 3. We suggest the previous crosstalk fraction, χ, be called “intrinsic” crosstalk because it is defined by the source of the crossover contribution. As seen in Equations 7, the difference between observed and intrinsic crosstalk is the transmittance.
Authors will sometimes use the term “extinction ratio” when referring to crosstalk[3]. The Extinction Ratio is the inverse of the crosstalk fraction. That is,
ERRL = 1/OCTRL = (OWL - OBL)/(OGL - OBL) (8a)
SPIE-IS&T/ Vol. 7863 786310-4
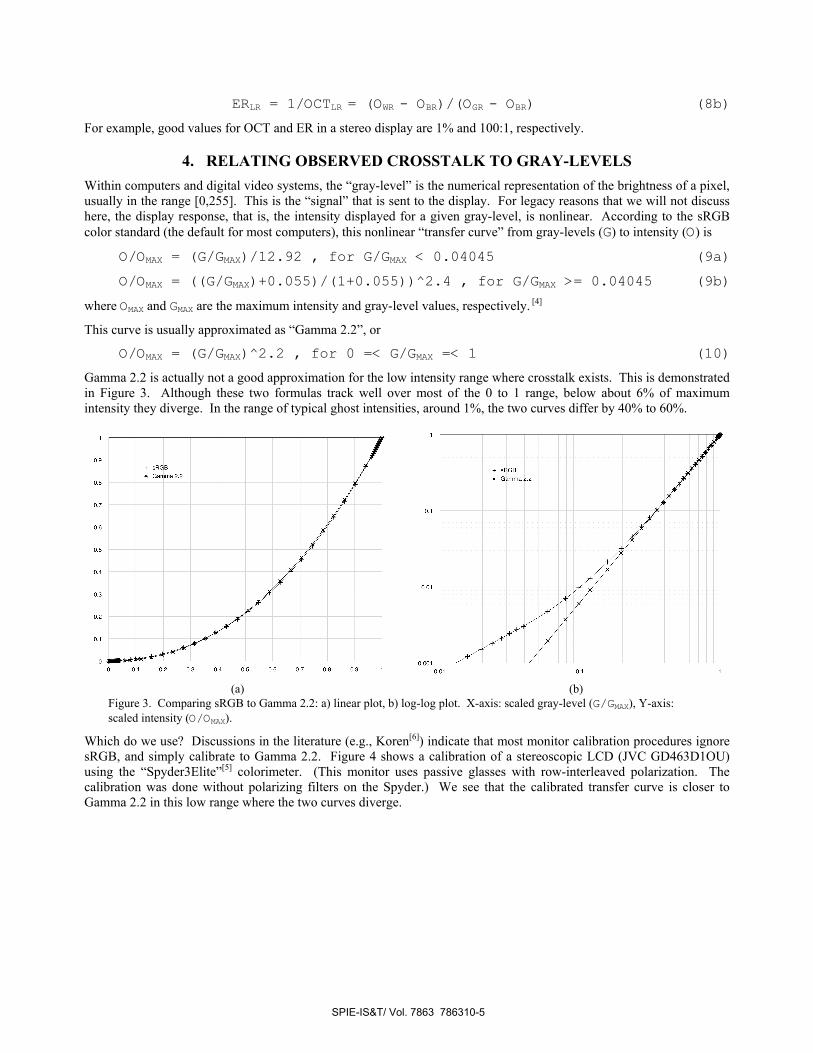
ERLR = 1/OCTLR = (OWR - OBR)/(OGR - OBR) (8b)
For example, good values for OCT and ER in a stereo display are 1% and 100:1, respectively.
4. RELATING OBSERVED CROSSTALK TO GRAY-LEVELS Within computers and digital video systems, the “gray-level” is the numerical representation of the brightness of a pixel, usually in the range [0,255]. This is the “signal” that is sent to the display. For legacy reasons that we will not discuss here, the display response, that is, the intensity displayed for a given gray-level, is nonlinear. According to the sRGB color standard (the default for most computers), this nonlinear “transfer curve” from gray-levels (G) to intensity (O) is
O/OMAX = (G/GMAX)/12.92 , for G/GMAX < 0.04045 (9a)
O/OMAX = ((G/GMAX)+0.055)/(1+0.055))^2.4 , for G/GMAX >= 0.04045 (9b)
where OMAX and GMAX are the maximum intensity and gray-level values, respectively. [4]
This curve is usually approximated as “Gamma 2.2”, or
O/OMAX = (G/GMAX)^2.2 , for 0 =< G/GMAX =< 1 (10)
Gamma 2.2 is actually not a good approximation for the low intensity range where crosstalk exists. This is demonstrated in Figure 3. Although these two formulas track well over most of the 0 to 1 range, below about 6% of maximum intensity they diverge. In the range of typical ghost intensities, around 1%, the two curves differ by 40% to 60%.
(a) (b)
Figure 3. Comparing sRGB to Gamma 2.2: a) linear plot, b) log-log plot. X-axis: scaled gray-level (G/GMAX), Y-axis: scaled intensity (O/OMAX).
Which do we use? Discussions in the literature (e.g., Koren[6]) indicate that most monitor calibration procedures ignore sRGB, and simply calibrate to Gamma 2.2. Figure 4 shows a calibration of a stereoscopic LCD (JVC GD463D1OU) using the “Spyder3Elite”[5] colorimeter. (This monitor uses passive glasses with row-interleaved polarization. The calibration was done without polarizing filters on the Spyder.) We see that the calibrated transfer curve is closer to Gamma 2.2 in this low range where the two curves diverge.
SPIE-IS&T/ Vol. 7863 786310-5
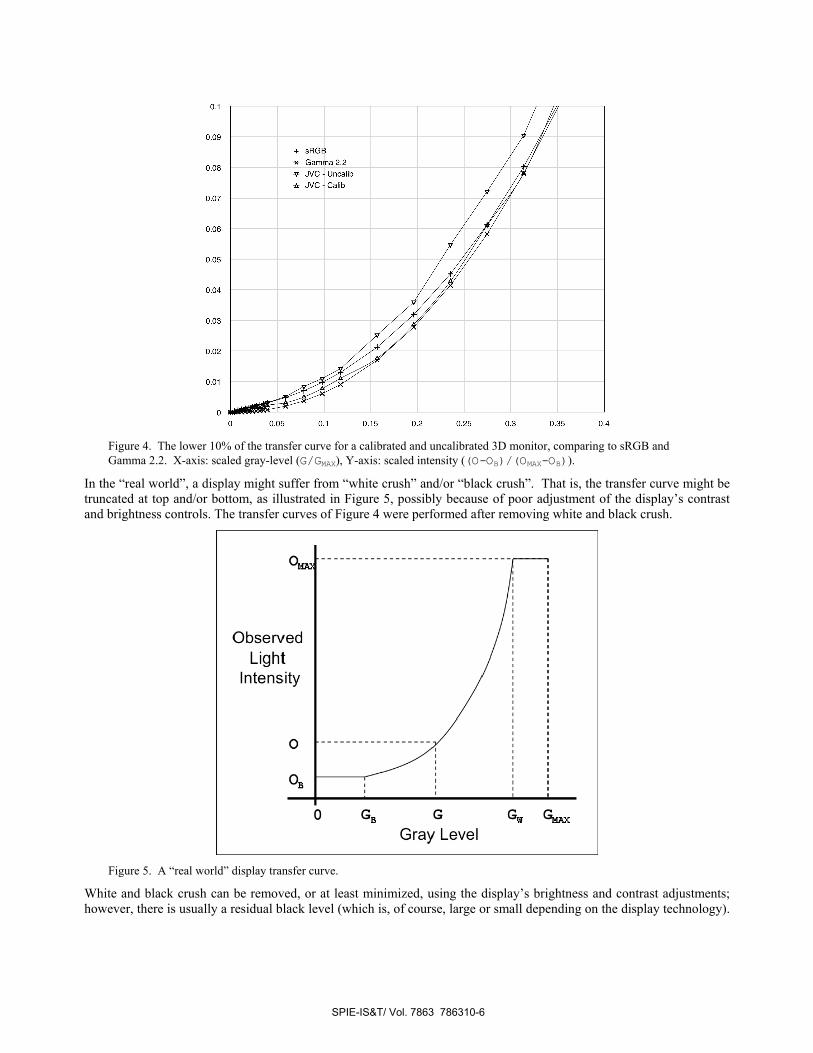
Figure 4. The lower 10% of the transfer curve for a calibrated and uncalibrated 3D monitor, comparing to sRGB and Gamma 2.2. X-axis: scaled gray-level (G/GMAX), Y-axis: scaled intensity ((O-OB)/(OMAX-OB)).
In the “real world”, a display might suffer from “white crush” and/or “black crush”. That is, the transfer curve might be truncated at top and/or bottom, as illustrated in Figure 5, possibly because of poor adjustment of the display’s contrast and brightness controls. The transfer curves of Figure 4 were performed after removing white and black crush.
Figure 5. A “real world” display transfer curve.
White and black crush can be removed, or at least minimized, using the display’s brightness and contrast adjustments; however, there is usually a residual black level (which is, of course, large or small depending on the display technology).
SPIE-IS&T/ Vol. 7863 786310-6
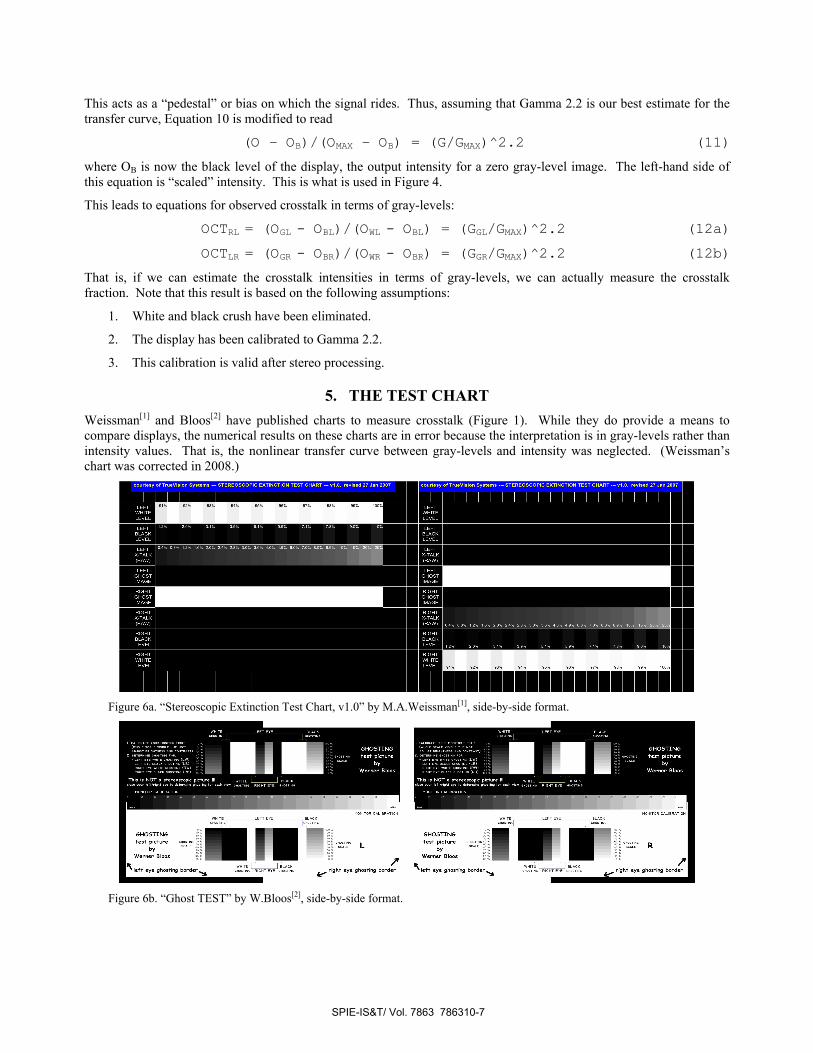
This acts as a “pedestal” or bias on which the signal rides. Thus, assuming that Gamma 2.2 is our best estimate for the transfer curve, Equation 10 is modified to read
(O – OB)/(OMAX – OB) = (G/GMAX)^2.2 (11)
where OB is now the black level of the display, the output intensity for a zero gray-level image. The left-hand side of this equation is “scaled” intensity. This is what is used in Figure 4.
This leads to equations for observed crosstalk in terms of gray-levels:
OCTRL = (OGL - OBL)/(OWL - OBL) = (GGL/GMAX)^2.2 (12a)
OCTLR = (OGR - OBR)/(OWR - OBR) = (GGR/GMAX)^2.2 (12b)
That is, if we can estimate the crosstalk intensities in terms of gray-levels, we can actually measure the crosstalk fraction. Note that this result is based on the following assumptions:
1. White and black crush have been eliminated.
2. The display has been calibrated to Gamma 2.2.
3. This calibration is valid after stereo processing.
5. THE TEST CHART Weissman[1] and Bloos[2] have published charts to measure crosstalk (Figure 1). While they do provide a means to compare displays, the numerical results on these charts are in error because the interpretation is in gray-levels rather than intensity values. That is, the nonlinear transfer curve between gray-levels and intensity was neglected. (Weissman’s chart was corrected in 2008.)
Figure 6a. “Stereoscopic Extinction Test Chart, v1.0” by M.A.Weissman[1], side-by-side format.
Figure 6b. “Ghost TEST” by W.Bloos[2], side-by-side format.
SPIE-IS&T/ Vol. 7863 786310-7

The new chart, the “Stereoscopic Crosstalk Test Chart”**, presents all scales as percent intensity and makes it easier to compare the ghost image of the white image with graduated gray patches. As shown in Figure 7, the ghost image comes from the seriated white row of the opposite image and is interleaved with the gray patches for better readability. The gray patches are calibrated according to Equations 12.
(a) Left Image (b) Right Image Figure 7. The new version of the Stereoscopic Crosstalk Test Chart. The images may be resized, but, when presented on a stereoscopic display, the left and right images must overlap exactly.
The white and black scales are used to minimize white and black “crush”, the truncation of the transfer curve at the top and/or the bottom. The display’s brightness and contrast levels are adjusted so that these scales are visible. This new version of the chart reports these scales as percent intensity (rather than percent gray-level) and limits them to ranges that are appropriate for sufficient accuracy (10% for white, 1% for black).
The following table gives guidelines for using the chart:
Table 1. How to use the Stereoscopic Crosstalk Test Chart.
1. Adjust brightness and contrast: Put on eyewear or otherwise view in stereo. Using the display’s brightness and contrast controls and the Black Intensity scale, minimize the black level without black crush (if possible!). Using White Intensity scale, maximize the white level without white crush. Repeat as needed.
2. Calibrate display: If possible, calibrate to a gamma value of 2.2 and in stereoscopic mode, that is, after stereo processing.
3. Read Crosstalk: Put on eyewear or otherwise view in stereo. View with either left or right eye (not both at same time!). Read the left crosstalk % from the upper interleaved scale at the place where the intensities match and the right crosstalk % from the lower interleaved scale.
6. MEASUREMENTS 6.1 Typical Stereoscopic Crosstalk Test Chart Readings.
The SCT Chart was used to examine the crosstalk of several 3D displays, as listed in Table 2.
** Weissman’s original chart was called “The Stereoscopic Extinction Test Chart” because the scale was calibrated as extinction ratio.
SPIE-IS&T/ Vol. 7863 786310-8
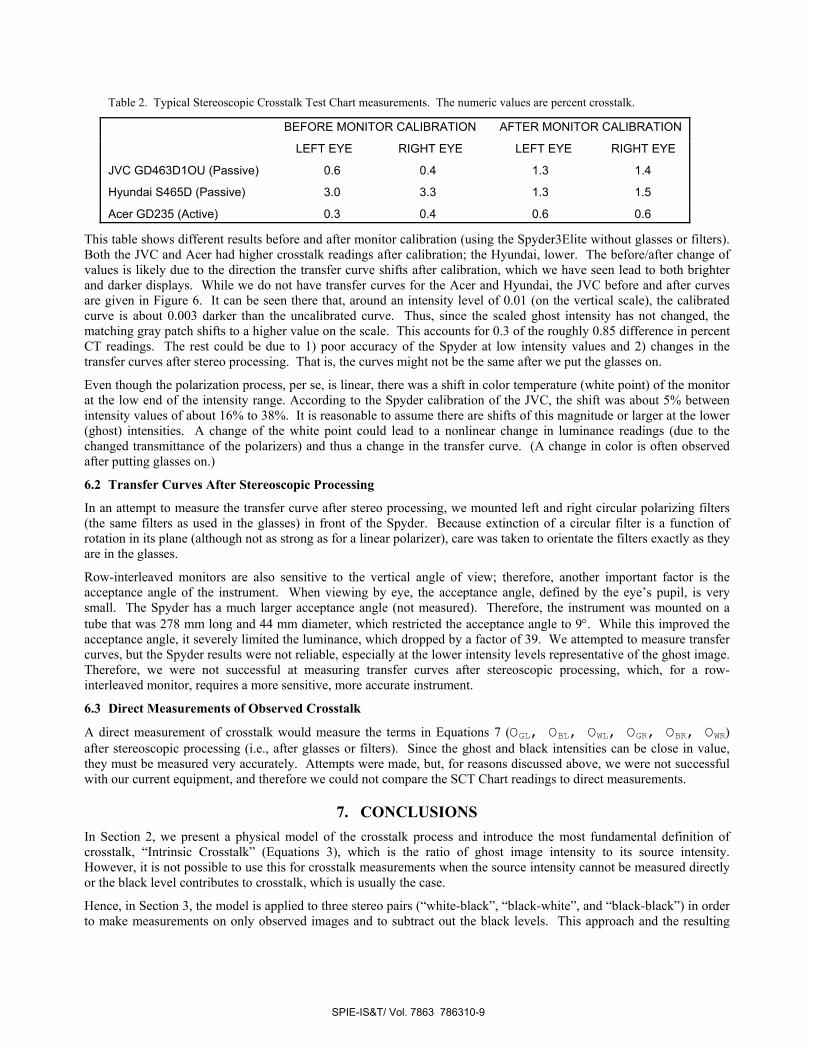
Table 2. Typical Stereoscopic Crosstalk Test Chart measurements. The numeric values are percent crosstalk.
BEFORE MONITOR CALIBRATION AFTER MONITOR CALIBRATION
LEFT EYE RIGHT EYE LEFT EYE RIGHT EYE
JVC GD463D1OU (Passive) 0.6 0.4 1.3 1.4
Hyundai S465D (Passive) 3.0 3.3 1.3 1.5
Acer GD235 (Active) 0.3 0.4 0.6 0.6
This table shows different results before and after monitor calibration (using the Spyder3Elite without glasses or filters). Both the JVC and Acer had higher crosstalk readings after calibration; the Hyundai, lower. The before/after change of values is likely due to the direction the transfer curve shifts after calibration, which we have seen lead to both brighter and darker displays. While we do not have transfer curves for the Acer and Hyundai, the JVC before and after curves are given in Figure 6. It can be seen there that, around an intensity level of 0.01 (on the vertical scale), the calibrated curve is about 0.003 darker than the uncalibrated curve. Thus, since the scaled ghost intensity has not changed, the matching gray patch shifts to a higher value on the scale. This accounts for 0.3 of the roughly 0.85 difference in percent CT readings. The rest could be due to 1) poor accuracy of the Spyder at low intensity values and 2) changes in the transfer curves after stereo processing. That is, the curves might not be the same after we put the glasses on.
Even though the polarization process, per se, is linear, there was a shift in color temperature (white point) of the monitor at the low end of the intensity range. According to the Spyder calibration of the JVC, the shift was about 5% between intensity values of about 16% to 38%. It is reasonable to assume there are shifts of this magnitude or larger at the lower (ghost) intensities. A change of the white point could lead to a nonlinear change in luminance readings (due to the changed transmittance of the polarizers) and thus a change in the transfer curve. (A change in color is often observed after putting glasses on.)
6.2 Transfer Curves After Stereoscopic Processing
In an attempt to measure the transfer curve after stereo processing, we mounted left and right circular polarizing filters (the same filters as used in the glasses) in front of the Spyder. Because extinction of a circular filter is a function of rotation in its plane (although not as strong as for a linear polarizer), care was taken to orientate the filters exactly as they are in the glasses.
Row-interleaved monitors are also sensitive to the vertical angle of view; therefore, another important factor is the acceptance angle of the instrument. When viewing by eye, the acceptance angle, defined by the eye’s pupil, is very small. The Spyder has a much larger acceptance angle (not measured). Therefore, the instrument was mounted on a tube that was 278 mm long and 44 mm diameter, which restricted the acceptance angle to 9°. While this improved the acceptance angle, it severely limited the luminance, which dropped by a factor of 39. We attempted to measure transfer curves, but the Spyder results were not reliable, especially at the lower intensity levels representative of the ghost image. Therefore, we were not successful at measuring transfer curves after stereoscopic processing, which, for a row-interleaved monitor, requires a more sensitive, more accurate instrument.
6.3 Direct Measurements of Observed Crosstalk
A direct measurement of crosstalk would measure the terms in Equations 7 (OGL, OBL, OWL, OGR, OBR, OWR) after stereoscopic processing (i.e., after glasses or filters). Since the ghost and black intensities can be close in value, they must be measured very accurately. Attempts were made, but, for reasons discussed above, we were not successful with our current equipment, and therefore we could not compare the SCT Chart readings to direct measurements.
7. CONCLUSIONS In Section 2, we present a physical model of the crosstalk process and introduce the most fundamental definition of crosstalk, “Intrinsic Crosstalk” (Equations 3), which is the ratio of ghost image intensity to its source intensity. However, it is not possible to use this for crosstalk measurements when the source intensity cannot be measured directly or the black level contributes to crosstalk, which is usually the case.
Hence, in Section 3, the model is applied to three stereo pairs (“white-black”, “black-white”, and “black-black”) in order to make measurements on only observed images and to subtract out the black levels. This approach and the resulting
SPIE-IS&T/ Vol. 7863 786310-9
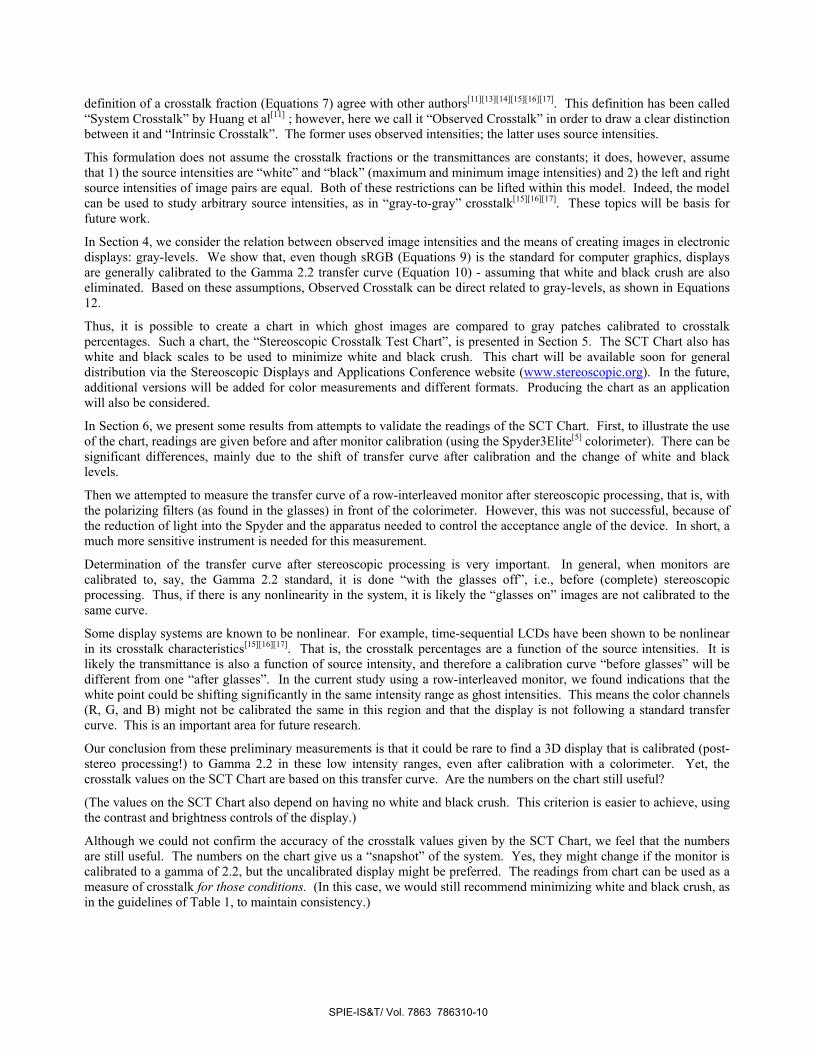
definition of a crosstalk fraction (Equations 7) agree with other authors[11][13][14][15][16][17]. This definition has been called “System Crosstalk” by Huang et al[11] ; however, here we call it “Observed Crosstalk” in order to draw a clear distinction between it and “Intrinsic Crosstalk”. The former uses observed intensities; the latter uses source intensities.
This formulation does not assume the crosstalk fractions or the transmittances are constants; it does, however, assume that 1) the source intensities are “white” and “black” (maximum and minimum image intensities) and 2) the left and right source intensities of image pairs are equal. Both of these restrictions can be lifted within this model. Indeed, the model can be used to study arbitrary source intensities, as in “gray-to-gray” crosstalk[15][16][17]. These topics will be basis for future work.
In Section 4, we consider the relation between observed image intensities and the means of creating images in electronic displays: gray-levels. We show that, even though sRGB (Equations 9) is the standard for computer graphics, displays are generally calibrated to the Gamma 2.2 transfer curve (Equation 10) - assuming that white and black crush are also eliminated. Based on these assumptions, Observed Crosstalk can be direct related to gray-levels, as shown in Equations 12.
Thus, it is possible to create a chart in which ghost images are compared to gray patches calibrated to crosstalk percentages. Such a chart, the “Stereoscopic Crosstalk Test Chart”, is presented in Section 5. The SCT Chart also has white and black scales to be used to minimize white and black crush. This chart will be available soon for general distribution via the Stereoscopic Displays and Applications Conference website (www.stereoscopic.org). In the future, additional versions will be added for color measurements and different formats. Producing the chart as an application will also be considered.
In Section 6, we present some results from attempts to validate the readings of the SCT Chart. First, to illustrate the use of the chart, readings are given before and after monitor calibration (using the Spyder3Elite[5] colorimeter). There can be significant differences, mainly due to the shift of transfer curve after calibration and the change of white and black levels.
Then we attempted to measure the transfer curve of a row-interleaved monitor after stereoscopic processing, that is, with the polarizing filters (as found in the glasses) in front of the colorimeter. However, this was not successful, because of the reduction of light into the Spyder and the apparatus needed to control the acceptance angle of the device. In short, a much more sensitive instrument is needed for this measurement.
Determination of the transfer curve after stereoscopic processing is very important. In general, when monitors are calibrated to, say, the Gamma 2.2 standard, it is done “with the glasses off”, i.e., before (complete) stereoscopic processing. Thus, if there is any nonlinearity in the system, it is likely the “glasses on” images are not calibrated to the same curve.
Some display systems are known to be nonlinear. For example, time-sequential LCDs have been shown to be nonlinear in its crosstalk characteristics[15][16][17]. That is, the crosstalk percentages are a function of the source intensities. It is likely the transmittance is also a function of source intensity, and therefore a calibration curve “before glasses” will be different from one “after glasses”. In the current study using a row-interleaved monitor, we found indications that the white point could be shifting significantly in the same intensity range as ghost intensities. This means the color channels (R, G, and B) might not be calibrated the same in this region and that the display is not following a standard transfer curve. This is an important area for future research.
Our conclusion from these preliminary measurements is that it could be rare to find a 3D display that is calibrated (post-stereo processing!) to Gamma 2.2 in these low intensity ranges, even after calibration with a colorimeter. Yet, the crosstalk values on the SCT Chart are based on this transfer curve. Are the numbers on the chart still useful?
(The values on the SCT Chart also depend on having no white and black crush. This criterion is easier to achieve, using the contrast and brightness controls of the display.)
Although we could not confirm the accuracy of the crosstalk values given by the SCT Chart, we feel that the numbers are still useful. The numbers on the chart give us a “snapshot” of the system. Yes, they might change if the monitor is calibrated to a gamma of 2.2, but the uncalibrated display might be preferred. The readings from chart can be used as a measure of crosstalk for those conditions. (In this case, we would still recommend minimizing white and black crush, as in the guidelines of Table 1, to maintain consistency.)
SPIE-IS&T/ Vol. 7863 786310-10

Whether the display is calibrated or uncalibrated, the SCT Chart indicates the “strength” of the crosstalk component of the image as compared to the maximum image intensity. That is, it is a measure of the influence of the ghost image compared to the intended image, which is, after all, viewed with the same transfer curve, whatever it is. The readings from the SCT Chart express this measure as if the transfer curve were Gamma 2.2.
In addition, the chart can always be used in a comparative way. Comparing monitors, changing display parameters, trying different glasses, comparing viewing positions and angles, etc., are all common needs when working with a stereoscopic display system. The chart provides a simple way to do this. If there are special requirements, such as determining the crosstalk at the top of the screen, the chart may be resized and repositioned; however, it is important to keep the two views matched in size and in perfect alignment.
The difficulty we had using a low-end colorimeter (the Spyder) verifies the premise we put forward in the introduction: that measurements of crosstalk are difficult and generally not accessible to users. The SCT Chart alleviates these issues and provides a means to achieve better consistence and performance of stereoscopic 3D displays.
REFERENCES
[1] M. A. Weissman, “A simple measurement of extinction ratio” presented at Stereoscopic Displays and Applications XVIII, San Jose (2007).
[2] W. Bloos, “Ghosting test - standard method for determining ghost image,” Stereo Forum, online, dated 5 June 2008. http://www.stereoforum.org/viewtopic.php?f=16&t=53.
[3] A. J. Woods, “How are Crosstalk and Ghosting Defined in the Stereoscopic Literature” in Proc. SPIE Stereoscopic Displays and Applications XXII (in press), Burlingame, 7863, (2011).
[4] Wikipedia, http://en.wikipedia.org/wiki/SRGB_color_space [5] DataColor AG, http://spyder.datacolor.com/product-mc-s3elite.php [6] N. Koren, http://www.normankoren.com/makingfineprints1A.html [7] Woods, A. J., Harris, C. R., “Comparing levels of crosstalk with red/cyan, blue/yellow, and green/magenta anaglyph
3D glasses” in Proc. SPIE Stereoscopic Displays and Applications XXI, 7253, 0Q1-0Q12 (2010). [8] Chu, Y.-M., Chien, K.-W., Shieh, H.-P. D., Chang, J.-M., Hu, A., and Yang, V., “3D Mobile Display Based on Dual
Directional Lightguides” in 4th International Display Manufacturing Conference, Taipei, Taiwan, 799-801 (2005). [9] Hong, H.-K., Jang, J.-W., Lee, D.-G., Lim, M.-J., Shin, H.-H., “Analysis of angular dependence of 3-D technology
using polarized eyeglasses,” in Journal of the SID, 18(1), 8-12 (2010). [10] Huang, K.-C., Tsai, C.-H., Lee, K., Hsueh, W.-J., “Measurement of Contrast Ratios for 3D Display” in Proc. SPIE
Input/Output and Imaging Technologies II, 4080, 78-86 (2000). [11] Huang, K.-C., Lee, K., Lin, H.-Y., “Crosstalk issue in stereo/autostereoscopic display” in Proc. Int. Display
Manufacturing Conference, 2–18 (2009). [12] Pala, S., Stevens, R., Surman, P., “Optical crosstalk and visual comfort of a stereoscopic display used in a real-time
application” in Proc. SPIE Stereoscopic Displays and Virtual Reality Systems XIV, 6490, 111-1112 (2007). [13] Liou, J.-C., Lee, K., Tseng, F.-G., Huang, J.-F., Yen, W.-T., Hsu, W.-L., “Shutter Glasses Stereo LCD with a
Dynamic Backlight” in Proc. SPIE Stereoscopic Displays and Applications XX, 7237, 72370X (2009). [14] Boher, P., Leroux, T., Bignon, T., Collomb-Patton, V., “Multispectral polarization viewing angle analysis of circular
polarized stereoscopic 3D displays” in Proc. SPIE Stereoscopic Displays and Applications XXI, 7253, 0R1-0R12 (2010).
[15] S.-M. Jung, et al, “Improvement of 3-D Crosstalk with Over-Driving Method for the Active Retarder 3-D Displays” in SID Digest 2010, Seattle, 1264-1267 (2010).
[16] S. Shestak, et al, “Measuring of Gray-to-Gray Crosstalk in a LCD Based Time-Sequential Stereoscopic Display” in SID Digest 2010, Seattle, 132-135 (2010).
[17] C.-C. Pan, et al, “Cross-Talk Evaluation of Shutter-Type Stereoscopic 3D Display” in SID Digest 2010, Seattle, 128-131 (2010).
SPIE-IS&T/ Vol. 7863 786310-11

Paper 16 A. J. Woods (2011) “How are crosstalk and ghosting defined in the stereoscopic
literature?” in Stereoscopic Displays and Applications XXII, Proceedings of IS&T/SPIE Electronic Imaging, SPIE Vol. 7863, pp. 78630Z‐1 to ‐12, Burlingame, California, January 2011.
How are Crosstalk and Ghosting defined in the Stereoscopic Literature?
Andrew J. Woods*
Centre for Marine Science & Technology, Curtin University, GPO Box U1987, Perth 6845 Australia
ABSTRACT
Crosstalk is a critical factor determining the image quality of stereoscopic displays. Also known as ghosting or leakage, high levels of crosstalk can make stereoscopic images hard to fuse and lack fidelity; hence it is important to achieve low levels of crosstalk in the development of high-quality stereoscopic displays. In the wider academic literature, the terms crosstalk, ghosting and leakage are often used interchangeably and unfortunately very few publications actually provide a descriptive or mathematical definition of these terms. Additionally the definitions that are available are sometimes contradictory. This paper reviews how the terms crosstalk, ghosting and associated terms (system crosstalk, viewer crosstalk, gray-to-gray crosstalk, leakage, extinction and extinction ratio, and 3D contrast) are defined and used in the stereoscopic literature. Both descriptive definitions and mathematical definitions are considered.
Keywords: stereoscopic, crosstalk, cross talk, cross-talk, ghosting, leakage, extinction, 3d contrast.
1. INTRODUCTION Crosstalk (sometimes also known as ghosting or leakage) is a critical factor affecting the image quality of stereoscopic 3D displays. Crosstalk is the incomplete isolation of the left and right image channels so that one image leaks into the other. This paper reviews the literature on crosstalk and related terms in stereoscopic displays and provides a useful basis for the understanding, further analysis and standardization of the terminology relating to 3D crosstalk. Crosstalk is present in most stereoscopic displays and is often the most important factor affecting the 3D image quality.
To have a constructive discussion about crosstalk, it is necessary to have a common understanding. Surprisingly, very few early papers actually define crosstalk and related terms when they are discussed, many papers use crosstalk and ghosting interchangeably, and even where there are definitions, the definitions are not always consistent between papers.
This paper is related to an earlier paper which reviewed the definition, measurement and mechanisms of crosstalk[1] but this paper focuses more on the definitions given in the published literature.
Stereoscopic terminology can be used to describe a principle in general terms and can also be used to quantify a physical property – this paper will review both the descriptive and mathematical definitions where applicable.
To obtain an idea of the commonality of the various terms related to crosstalk across the stereoscopic literature, a keyword search was performed across the 1273 documents on the SD&A (Stereoscopic Displays and Applications) 20-year DVD-ROM[2] for various terms relevant to this paper. The results are detailed in Table 1. Importantly, the use of the term crosstalk is very common, present in over 10% of all stereoscopic documents in the collection.
2. TERMINOLOGY AND DEFINITIONS 2.1 Crosstalk - Descriptive Definition
The term ‘crosstalk’ (also often written as ‘cross-talk’[3], ‘cross talk’[24] or even ‘X-talk’[3]) is very widely used in the stereoscopic literature (see Table 1). The term ‘crosstalk’ without an intermediate space or hyphen, is the more commonly used variant so that is what will be used in this paper. It is recommended that authors adopt this as the standard form.
* A.Woods curtin.edu.au; phone +61 8 9266 7920; www.AndrewWoods3D.com
Stereoscopic Displays and Applications XXII, edited by Andrew J. Woods, Nicolas S. Holliman,Neil A. Dodgson, Proceedings of SPIE-IS&T Electronic Imaging, SPIE Vol. 7863, 78630Z
© 2011 SPIE-IS&T · CCC code: 0277-786X/11/$18 · doi: 10.1117/12.877045
SPIE-IS&T/ Vol. 7863 78630Z-1
A. J. Woods (2011) “How are crosstalk and ghosting defined in the stereoscopic literature?” in Stereoscopic Displays and Applications XXII, Proceedings of IS&T/SPIE Electronic Imaging, SPIE Vol. 7863, pp. 78630Z‐1 to ‐12, Burlingame, California, January 2011.

The term crosstalk has been described variously – here are some examples:
Lipton (1987)[5]: “Incomplete left and right channel isolation, or crosstalk, is of great concern to the designer of a stereoscopic system.”
Veron, et al (1990)[6]: “The phenomenon of "bleed through" occurs when the left eye also sees the right image, or vice versa. Bleed through is also referred to as optical crosstalk between the two images. The metric that characterizes this phenomena is called the interocular crosstalk ratio.”
Montgomery, et al (2001)[7]: “Cross talk represents leakage of the left eye image data to the right eye and vice versa as a fraction of the window brightness.”
Stevenson, et al (2004)[8]: “3D crosstalk is a measure of how much of the left eye image gets into the right eye and vice versa.”
Stevens (2004)[9]: “Cross-talk … describes the leakage of the optical signal in one channel of the viewing pupil to an adjoining channel”
Kaptein, et al (2007)[10]: “imperfect separation of the left and right images, a phenomenon known as crosstalk”
Pala, et al (2007)[11]: “optical crosstalk … is leakage of the optical signal from the channel corresponding to the right eye to the channel corresponding to the left eye and vice versa.”
Uehara, et al (2008)[12]: “3D crosstalk is defined as the leakage of left-eye image to the right eye and vice versa, and is calculated as the ratio of luminance profiles.”
Lipton (2009)[28]: “Crosstalk. Incomplete isolation of the left and right image channels so that one leaks (leakage) or bleeds into the other.”
Despite some variations in wording, there is a common theme across these definitions – i.e. the light from one image channel leaking into another.
The terms ‘3D crosstalk’ and ‘interocular crosstalk’ are also sometimes used but they are usually synonymous with ‘crosstalk’.
The following dictionary definition “Cross-talk: unwanted interference between two neighbouring electronic circuits”[44] is not inconsistent with the definitions quoted above.
In this paper the following descriptive definition will be used (based on Lipton 2009):
Crosstalk: the incomplete isolation of the left and right image channels so that one image leaks into the other.
2.2 Ghosting
In the general stereoscopic literature and the lay media, the terms ‘crosstalk’ and ‘ghosting’ have often been used interchangeably[24][25][26][27], but in scientific discussion, it is worthwhile to differentiate these terms.
Table 1: Occurrence of stereoscopic terms across the 1273 documents in the SD&A 20-year DVD-ROM[2]
Crosstalk 125 documents with 1092 instances
Cross talk and Cross-talk 95 documents with 325 instances
Ghosting 117 documents with 589 instances
Ghost images 30 documents with 56 instances
Leakage 33 documents with 104 instances
Extinction 30 documents with 83 instances
Extinction Ratio 11 documents with 28 instances
3D Contrast 1 document with 30 instances
SPIE-IS&T/ Vol. 7863 78630Z-2
Crosstalk and ghosting appear to have been first documented as separate terms in 1987 by Lenny Lipton: “If the left eye, for example, also sees the right there will be a perceived doubling of the image or "ghosting." Incomplete left and right channel isolation, or crosstalk, is of great concern to the designer of a stereoscopic system”[5]
In 2009, Lipton[28] provided a more formal definition of the two terms: “Crosstalk. Incomplete isolation of the left and right image channels so that one leaks (leakage) or bleeds into the other. Looks like a double exposure. Crosstalk is a physical entity and can be objectively measured, whereas ghosting is a subjective term.” and “Ghosting. The perception of crosstalk is called ghosting.”
‘Ghost’, ‘Ghost Image’ and ‘Ghosting’ have all been used in the stereoscopic literature and are usually used in the context of the perception of crosstalk.
2.3 Leakage
A formal definition for the term “leakage” was not found in the stereoscopic literature as part of this study, however the term is often used within descriptive definitions of “crosstalk”[7][9][11][12][28] (as summarized in Section 2.1). The Macquarie dictionary definition of “leakage” is “1. the act of leaking; leak. 2. that which leaks in or out. 3. the amount that leaks in or out.”[44] Without a formal definition of leakage in the stereoscopic literature, it therefore seems appropriate to provide the following definition:
Leakage: the (amount of) light that leaks from one stereoscopic image channel to another.
The term ‘crossover contribution’ has also been used.[45]
Contrary to this definition: Bos[46] used the term ‘cell leakage ratio’ but it was undefined in the paper and by usage it appears very similar to what most papers call crosstalk. Walworth, et al[47] used the sentence “visible leakage is least at 560 nm and no more than 0.2% in the red and blue regions” but this usage appears to be the same as the term crosstalk defined above.
2.4 Crosstalk - Mathematical Definition
Crosstalk can also be used as a metric to express how much crosstalk occurs in a particular stereoscopic display system. When expressed as a metric, ‘crosstalk’ is sometimes called ‘crosstalk ratio’.[6][11] There are two mathematical definitions of crosstalk ratio which will be explained below, so when quoting crosstalk values it is important to specify which crosstalk definition is being used. Unfortunately several papers have quoted values of crosstalk without specifying the actual crosstalk definition they are using.[3][8][13][14][15]
Definition 1: In its simplest form crosstalk can be defined[16] as:
Crosstalk (%) = leakage / signal × 100 (1)
Where: ‘leakage’ is used here to mean the maximum luminance of light that leaks from the unintended channel to the intended channel, and ‘signal’ is the maximum luminance of the intended channel.
In practice, two luminance measurements are taken (from the intended eye position): (a) black in the intended channel and white in the unintended channel (this corresponds with leakage), and (b) white in the intended channel and black in the unintended channel (this corresponds with signal).
The following two mathematical definitions of crosstalk from the literature essentially agree with this basic definition:
Chu, et al[17] define:
Crosstalk ≡ luminance measured at one eye / luminance measured at the other eye (2)
Note that this definition has been developed for a two-view autostereoscopic display and unfortunately uses rather imprecise language. A close look at the paper suggests that they actually mean “luminance of the other channel at the original eye position” for the denominator of (2).
Hong, et al[18] provides this definition in the context of a micropolarized display: “one test image consists of black data for the even horizontal lines and white data for the odd horizontal lines” (equating to black in the intended eye and white in the unintended eye) … “the other test image of black data for the odd horizontal lines and white data for even
SPIE-IS&T/ Vol. 7863 78630Z-3

VGL (9 'L)yGL (9 'L),y 1LKRW LKRK\ L
ILL = VGL (9 c0L)yGL (9 c0L)1LWRK LKRK\ L
VGR In1Lffflkt'R,'PR -vGR In1LKRW WR
VGR In1LKRK t'RvGR in
- LKRK
horizontal lines” (equating to black in the unintended eye and white in the intended eye) … “The ratio of the measured luminance using these two test images corresponds to 3-D crosstalk.”
The shortcoming of these definitions is that they don’t include the effect of black level. Some displays are incapable of outputting zero luminance for full black (e.g. LCDs†) and other displays which can output zero luminance (e.g. CRT, PDP, and OLED displays†) might be incorrectly calibrated such that zero pixel value does not output zero luminance. The presence of non-zero black level does not contribute to visible crosstalk / ghosting and if present it would bias the crosstalk calculation using this first definition. If the black level is set at zero luminance, there would be no problem.
Definition 2: The second mathematical definition of crosstalk takes into consideration non-zero black level by subtracting the black level luminance:
Crosstalk (%) = ( leakage – black level ) / ( signal – black level) × 100 (3)
Several papers support this formulation (but with different variable names):
Pala, et al[11] wrote: “In this work we define the optical crosstalk C as follows.
(4)
Where LM = Luminance of main image, LG = Luminance of crosstalk (ghost) image, LBL = LCD background luminance”
Liou, et al[19] provide the following equations:
and (5,6)
Where: “WB = a video stream with all white as left-eye images, and all-black as right-eye images, BW = a video stream with all-black as left-eye images and all-white as right eye images, BB = a video stream with all-black for both left and right eyes (i.e. the black level of the display), and CL and CR = the crosstalk experienced by the left eye and the right eye.” [19]
Boher, et al[20] also provide similar equations (reworked here for clarity and also note that the numerator of (8) has been corrected[21]):
and (7,8)
Where: “3D crosstalk of right and left eyes χR and χL” and “(θR, φR) and (θL, φL) are the right and left eye positions in polar coordinates with regards to the measurement location”. “YKLRW is the luminance for white view on right eye and black view on left eye, YGL
LWRK and YGRLWRK are the luminances for black view on right eye and white view on
left eye using GL and GR filters respectively, YGLRKLK and YGR
RKLK are the luminance for black view on both eyes”[20]
Additionally, Weissman, et al[45] use a different technique to obtain a similar result:
CTRL = (OGL – OBL) / (OWL – OBL) and CTLR = (OGR – OBR) / (OWR – OBR) (9,10)
Where: CTRL is crosstalk from right channel to left channel (modified here for clarity), OGL is the luminance of the ghost image (black in the left eye and white in the right eye) as measured from the left eye position, OBL is the luminance of the black level as measured from the left eye position, OWL is the luminance of white in the left eye and black in the right eye as measured from the left eye position, and so on.
This definition is sometimes called ‘black-white crosstalk’ since it uses full-black and full-white images in the testing scheme.[22] Full-white and full-black are used because maximum ghosting usually occurs when the pixels in the desired eye-channel are full-black and the same pixels in the opposite eye-channel are full-white.
† LCD = Liquid Crystal Display; CRT = Cathode Ray Tube; PDP = Plasma Display Panel; OLED = Organic Light Emitting Diode.
SPIE-IS&T/ Vol. 7863 78630Z-4
Salk SCTRLKWR
LRLR
Crosstalk can initially be thought of as a fairly simple concept but now things start to get more complicated. On some displays crosstalk can vary with: (a) pixel position on the screen, (b) viewing angle (as expressed in equations (7,8)[20])[23], and (c) properties of the eyewear.
In most 3D displays crosstalk is an additive process and is roughly linear. The maximum leakage usually occurs in high-contrast (black/white) areas so measuring black-white crosstalk often determines the display’s overall crosstalk, but, this is not true for all 3D displays, particularly time-sequential 3D on LCDs using active-shutter glasses, or PDPs, and perhaps other stereoscopic displays. This is discussed further in Section 2.6.
2.5 System Crosstalk and Viewer Crosstalk
In 2000, Kuo-Chung Huang, et al[29] defined two new terms (System Crosstalk and Viewer Crosstalk) in an attempt to disambiguate the terminology relating to crosstalk at that time:
System Crosstalk: the degree of the unexpected leaking image from the other eye.
Viewer Crosstalk: the crosstalk perceived by the viewer.[30]
It is important to note that System Crosstalk is independent of the content (determined only by the display), whereas Viewer Crosstalk varies depending upon the content.
These definitions have similarities to the definitions of Crosstalk and Ghosting provided by Lipton[28] – but are not exactly the same. The definition of Viewer Crosstalk includes the effect of contrast (and indirectly the effect of parallax) but Lipton’s definition of ghosting includes any perception effect.
Mathematical definitions were also provided[29]:
System Crosstalk (left eye) = β2 / α1 (11)
Where: “α1 describes the percentage part of the left-eye image observed at the left eye position”, and “β2 describes the percentage part of the right-eye image leaked to the left-eye position”[29] and vice versa for the other eye.
Viewer Crosstalk is “defined as the ratio of the luminance of unwanted ghost image, which leaks from the image for the other eye, to the luminance of the correct information received by the viewer’s eyes.” [29] i.e.
Viewer Crosstalk (left eye) = B β2 / A α1 (12)
Where: A is the luminance of a particular point in the left eye image, and B is the luminance of the same corresponding point (same x,y location on the screen) in the right-eye image.
The term Co-location Image Contrast was also introduced to describe the contrast between image points at the same (x,y) location on screen between the left and right eyes, and mathematically defined as:
Co-location Image Contrast = B / A (13)
And hence:
Viewer Crosstalk = Co-location Image Contrast × System Crosstalk (14)
It is worth noting that equation (11) is similar to crosstalk definition 1 (equation (1)) in that it does not include the effect of black level, however black level is indirectly included in the definition of Viewer Crosstalk by way of the Co-Location Image Contrast term.
In 2009, Huang, et al[31] provided a revised definition of System Crosstalk which includes the effect of black level:
and (15)
Where: SCTL and SCTR are the system crosstalk for the left and right eyes, LKWL is the luminance measured from the left eye position with black in the left eye image and white in the right eye image, and so on.
As a result of this change it is important to establish which definition of system crosstalk (2000 or 2009) is being used when it appears in a publication.
SPIE-IS&T/ Vol. 7863 78630Z-5
(ZJj'lb)13
2.6 Gray-to-Gray Crosstalk
As mentioned in the end of Section 2.4, crosstalk occurs in some displays (particularly time-sequential 3D LCDs) in a non-linear and non-additive fashion. The term ‘gray-to-gray crosstalk’ was therefore developed as a metric to quantify crosstalk in such displays. In essence gray-to-gray crosstalk is the matrix of values of crosstalk ratio for all gray level transition combinations on a display. On a display with linear crosstalk, all the values in the matrix would be the same, however with a 3D display which exhibits non-linearity of crosstalk, the values in the matrix would be mostly different. In the case of time-sequential 3D LCDs, the non-linearity is due in part to the period of time that it takes an LCD pixel to transition from one gray level to another (the pixel response rate), and the fact that the pixel response rate is different for different gray level transitions (i.e. it is a matrix).
Surprisingly, the term gray-to-gray crosstalk was first introduced and defined by three separate papers[22][32][33] very recently at the same conference in May 2010. The three definitions are provided below:
Shestak, et al[22] defined:
(16)
Jung, et al[32] defined:
(17)
Pan, et al[33] defined:
(18)
Where the variables are defined as follows:
Shestak (2010) Samsung, Korea[22]
Jung (2010) LG, Korea[32]
Pan (2010) Chi Mei Innolux, Taiwan[33]
Variable definitions:
q1 and q2 i and j i and j are the two specified gray levels between which the gray-to-gray crosstalk is being calculated/measured
Cl(q1,q2) and Cr(q1,q2) CTi,j C.T.i j is the gray-to-gray crosstalk between the specified gray levels (for left (l) and right (r) eyes)
Wl(q1,q2) and Wr(q1,q2) Gi,j Li j is the luminance measurement obtained when the two channels are set to the specified gray levels
The three equations are very similar and apart from minor differences such as the sign of the result, the use of percent notation and variable names, the only difference of significance is that the denominator in equation (17) is slightly different to the denominator of (16) and (18). Specifically, if the denominator in (17) was the same as (16) and (18) it would be written as “ Gj,j – Gi,i ” rather than the existing “ Gj,i – Gi,i ”. The existing arrangement of the denominator of (17) is similar in formulation to equations (5,6) used in the definition 2 of crosstalk. The significance of this difference is yet to be fully investigated.
Remembering that the mathematical definition of gray-to-gray crosstalk is a ratio, this formulation needs to be extended to determine the amount of visible crosstalk for different gray levels. The maximum visible crosstalk will not necessarily occur at the same gray levels as the maximum gray-to-gray crosstalk since the co-location image contrast also needs to be considered. To date the extension of ‘gray-to-gray crosstalk’ to ‘gray-to-gray visible crosstalk’ does not appear to have been published.
SPIE-IS&T/ Vol. 7863 78630Z-6
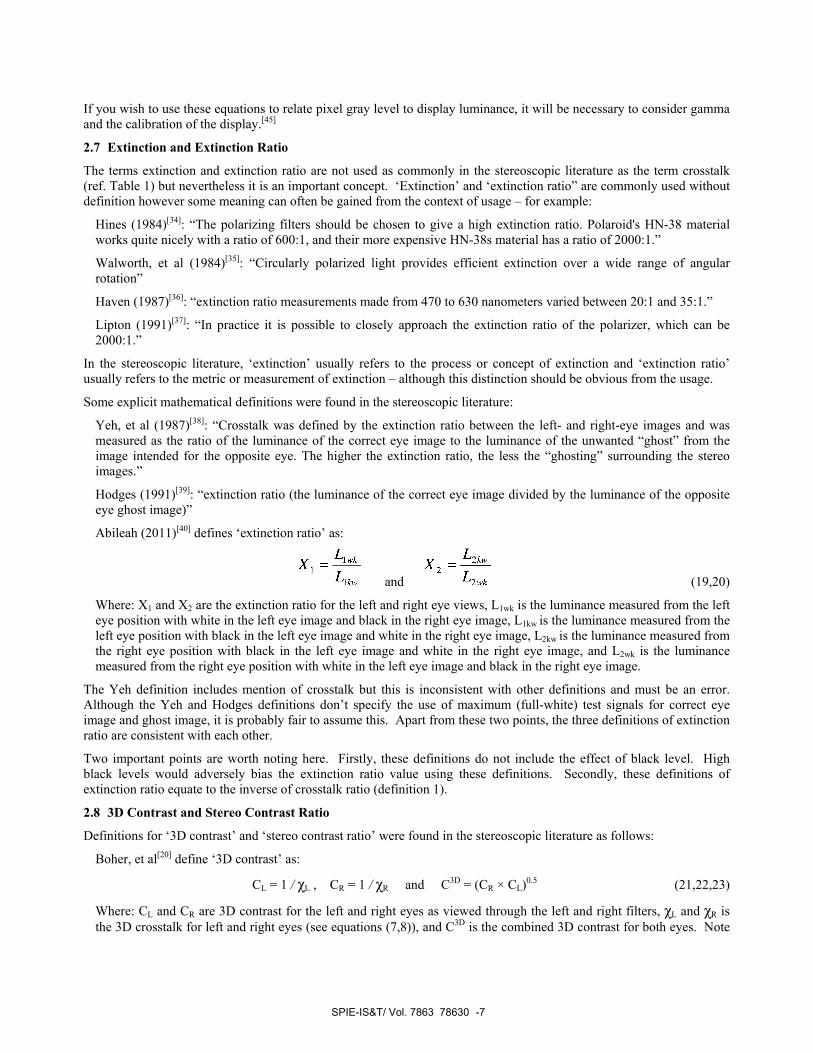
If you wish to use these equations to relate pixel gray level to display luminance, it will be necessary to consider gamma and the calibration of the display.[45]
2.7 Extinction and Extinction Ratio
The terms extinction and extinction ratio are not used as commonly in the stereoscopic literature as the term crosstalk (ref. Table 1) but nevertheless it is an important concept. ‘Extinction’ and ‘extinction ratio” are commonly used without definition however some meaning can often be gained from the context of usage – for example:
Hines (1984)[34]: “The polarizing filters should be chosen to give a high extinction ratio. Polaroid's HN-38 material works quite nicely with a ratio of 600:1, and their more expensive HN-38s material has a ratio of 2000:1.”
Walworth, et al (1984)[35]: “Circularly polarized light provides efficient extinction over a wide range of angular rotation”
Haven (1987)[36]: “extinction ratio measurements made from 470 to 630 nanometers varied between 20:1 and 35:1.”
Lipton (1991)[37]: “In practice it is possible to closely approach the extinction ratio of the polarizer, which can be 2000:1.”
In the stereoscopic literature, ‘extinction’ usually refers to the process or concept of extinction and ‘extinction ratio’ usually refers to the metric or measurement of extinction – although this distinction should be obvious from the usage.
Some explicit mathematical definitions were found in the stereoscopic literature:
Yeh, et al (1987)[38]: “Crosstalk was defined by the extinction ratio between the left- and right-eye images and was measured as the ratio of the luminance of the correct eye image to the luminance of the unwanted “ghost” from the image intended for the opposite eye. The higher the extinction ratio, the less the “ghosting” surrounding the stereo images.”
Hodges (1991)[39]: “extinction ratio (the luminance of the correct eye image divided by the luminance of the opposite eye ghost image)”
Abileah (2011)[40] defines ‘extinction ratio’ as:
and (19,20)
Where: X1 and X2 are the extinction ratio for the left and right eye views, L1wk is the luminance measured from the left eye position with white in the left eye image and black in the right eye image, L1kw is the luminance measured from the left eye position with black in the left eye image and white in the right eye image, L2kw is the luminance measured from the right eye position with black in the left eye image and white in the right eye image, and L2wk is the luminance measured from the right eye position with white in the left eye image and black in the right eye image.
The Yeh definition includes mention of crosstalk but this is inconsistent with other definitions and must be an error. Although the Yeh and Hodges definitions don’t specify the use of maximum (full-white) test signals for correct eye image and ghost image, it is probably fair to assume this. Apart from these two points, the three definitions of extinction ratio are consistent with each other.
Two important points are worth noting here. Firstly, these definitions do not include the effect of black level. High black levels would adversely bias the extinction ratio value using these definitions. Secondly, these definitions of extinction ratio equate to the inverse of crosstalk ratio (definition 1).
2.8 3D Contrast and Stereo Contrast Ratio
Definitions for ‘3D contrast’ and ‘stereo contrast ratio’ were found in the stereoscopic literature as follows:
Boher, et al[20] define ‘3D contrast’ as:
CL = 1 / χL , CR = 1 / χR and C3D = (CR × CL)0.5 (21,22,23)
Where: CL and CR are 3D contrast for the left and right eyes as viewed through the left and right filters, χL and χR is the 3D crosstalk for left and right eyes (see equations (7,8)), and C3D is the combined 3D contrast for both eyes. Note
SPIE-IS&T/ Vol. 7863 78630Z-7
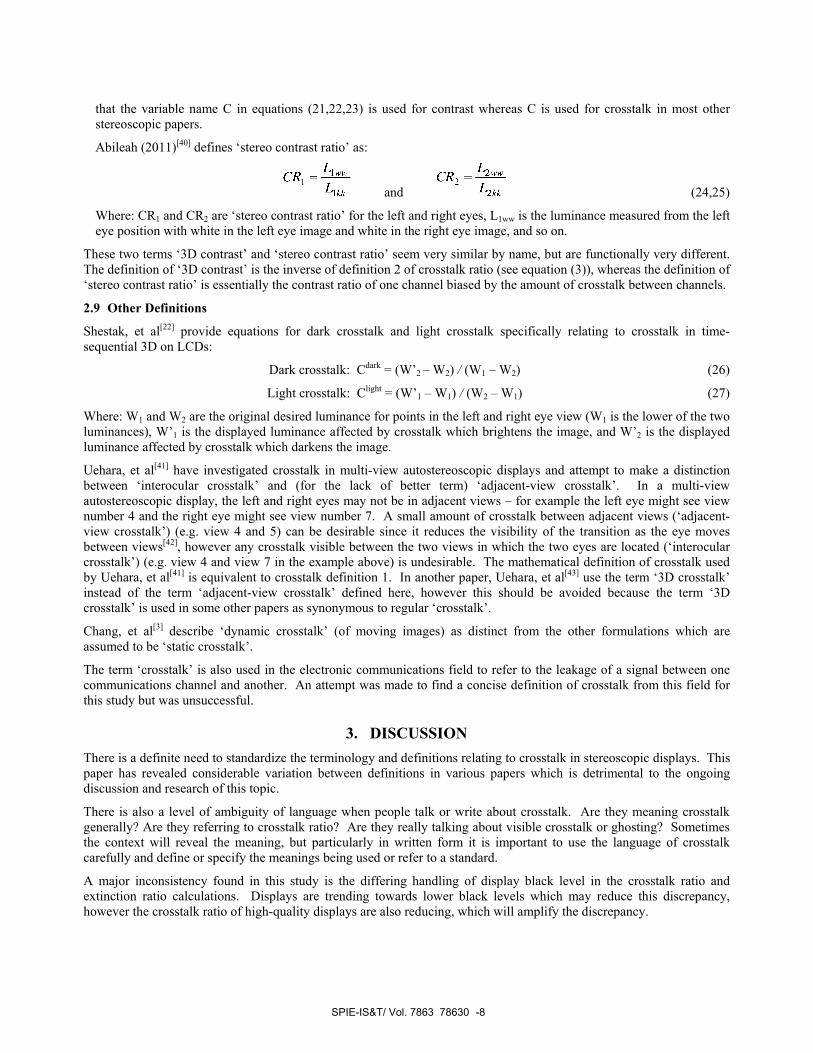
that the variable name C in equations (21,22,23) is used for contrast whereas C is used for crosstalk in most other stereoscopic papers.
Abileah (2011)[40] defines ‘stereo contrast ratio’ as:
and (24,25)
Where: CR1 and CR2 are ‘stereo contrast ratio’ for the left and right eyes, L1ww is the luminance measured from the left eye position with white in the left eye image and white in the right eye image, and so on.
These two terms ‘3D contrast’ and ‘stereo contrast ratio’ seem very similar by name, but are functionally very different. The definition of ‘3D contrast’ is the inverse of definition 2 of crosstalk ratio (see equation (3)), whereas the definition of ‘stereo contrast ratio’ is essentially the contrast ratio of one channel biased by the amount of crosstalk between channels.
2.9 Other Definitions
Shestak, et al[22] provide equations for dark crosstalk and light crosstalk specifically relating to crosstalk in time-sequential 3D on LCDs:
Dark crosstalk: Cdark = (W’2 – W2) / (W1 – W2) (26)
Light crosstalk: Clight = (W’1 – W1) / (W2 – W1) (27)
Where: W1 and W2 are the original desired luminance for points in the left and right eye view (W1 is the lower of the two luminances), W’1 is the displayed luminance affected by crosstalk which brightens the image, and W’2 is the displayed luminance affected by crosstalk which darkens the image.
Uehara, et al[41] have investigated crosstalk in multi-view autostereoscopic displays and attempt to make a distinction between ‘interocular crosstalk’ and (for the lack of better term) ‘adjacent-view crosstalk’. In a multi-view autostereoscopic display, the left and right eyes may not be in adjacent views – for example the left eye might see view number 4 and the right eye might see view number 7. A small amount of crosstalk between adjacent views (‘adjacent-view crosstalk’) (e.g. view 4 and 5) can be desirable since it reduces the visibility of the transition as the eye moves between views[42], however any crosstalk visible between the two views in which the two eyes are located (‘interocular crosstalk’) (e.g. view 4 and view 7 in the example above) is undesirable. The mathematical definition of crosstalk used by Uehara, et al[41] is equivalent to crosstalk definition 1. In another paper, Uehara, et al[43] use the term ‘3D crosstalk’ instead of the term ‘adjacent-view crosstalk’ defined here, however this should be avoided because the term ‘3D crosstalk’ is used in some other papers as synonymous to regular ‘crosstalk’.
Chang, et al[3] describe ‘dynamic crosstalk’ (of moving images) as distinct from the other formulations which are assumed to be ‘static crosstalk’.
The term ‘crosstalk’ is also used in the electronic communications field to refer to the leakage of a signal between one communications channel and another. An attempt was made to find a concise definition of crosstalk from this field for this study but was unsuccessful.
3. DISCUSSION There is a definite need to standardize the terminology and definitions relating to crosstalk in stereoscopic displays. This paper has revealed considerable variation between definitions in various papers which is detrimental to the ongoing discussion and research of this topic.
There is also a level of ambiguity of language when people talk or write about crosstalk. Are they meaning crosstalk generally? Are they referring to crosstalk ratio? Are they really talking about visible crosstalk or ghosting? Sometimes the context will reveal the meaning, but particularly in written form it is important to use the language of crosstalk carefully and define or specify the meanings being used or refer to a standard.
A major inconsistency found in this study is the differing handling of display black level in the crosstalk ratio and extinction ratio calculations. Displays are trending towards lower black levels which may reduce this discrepancy, however the crosstalk ratio of high-quality displays are also reducing, which will amplify the discrepancy.
SPIE-IS&T/ Vol. 7863 78630Z-8

It would be worth having a considered discussion about whether the effect of non-zero black level should be included or removed from the mathematical definition of crosstalk ratio – i.e. should definition 1 or definition 2 be used moving forward.
It would be worth analyzing the effect of non-zero black level of current displays on the results of using these definitions to determine how significant the effect is.
The brightness and contrast settings on a display may affect the measurement of crosstalk and would probably need to be calibrated before conducting testing – particularly for the use of test charts to measure crosstalk[45] and the measurement of gray-to-gray crosstalk.
It is not only important to provide standardized descriptive and mathematical definitions – it is also important to define standardized techniques of measuring these important 3D display quality parameters.
There are a number of standardization efforts underway at the time of writing this paper which may address some of the terminology and definition problems identified in this paper. Activities include:
• The ICDM (International Committee on Display Metrology) (part of SID) is currently working on the “Display Measurements Standard” of which version 1.0 is expected to be released mid-2011. This standard will include a section on 3D display measurement standards.
• The IEC (International Electrotechnical Commission) has established technical committee TC110 (Flat Panel Display Devices) to establish standards relating to “optical measurement methods for 3D displays”. This work includes some coverage of crosstalk measurement.
• The SEMI (Semiconductor Equipment and Materials International) has been working on a document “3D Display Terminology” which includes some definitions of crosstalk related terms.
It will be worth watching for the results of these standardization efforts.
Lastly an open question: How should crosstalk be measured in 3D display systems employing crosstalk cancellation[1]? Should the crosstalk cancellation be turned off before conducting the measurements or should it be left on? What if the crosstalk cancellation cannot be turned off? In cases where crosstalk cancellation is used, crosstalk will still be present but ghosting may not be visible.
4. TERMINOLOGY SUMMARY This paper has reviewed the historical meaning of a range of terms in the stereoscopic literature. A summary of descriptive definitions of various stereoscopic terms is offered here for clarity. The definitions provided here are by no means final and the author would welcome the further improvement of these definitions. One shortcoming of some of these definitions is that they may not be easily extensible to multi-view autostereoscopic displays.
Crosstalk: the incomplete isolation of the left and right image channels so that one image leaks into the other.
Crosstalk Ratio: (specifically) the metric of crosstalk.
Ghosting: the perception of crosstalk.
Leakage: the (amount of) light that leaks from one stereoscopic image channel to another.
System Crosstalk: in general terms the same as Crosstalk, but as a metric it specifies the degree of the unexpected leaking image from the other eye using one of two equations (11) or (15).[29][31]
Viewer Crosstalk: a measure of the crosstalk perceived by the viewer. cf: ghosting. (See (14))
Extinction, Extinction Ratio: a measure of how well the opposite view is blocked in a stereoscopic display; the inverse of crosstalk.
Gray-to-Gray Crosstalk: the matrix of values of crosstalk ratio for all gray level transition combinations on a stereoscopic display.
Cross-talk, Cross Talk, X-talk, Interocular Crosstalk, 3D Crosstalk: see/use Crosstalk.
SPIE-IS&T/ Vol. 7863 78630Z-9
A summary of mathematical definitions is not provided here because there is too much variation in the current mathematical definitions and arbitrary choice of variable names to be able to logically recommend a preferred usage here, apart from saying that: (a) the choice of variable names should follow a logical pattern and avoid overlaps with similar variables in related areas, (b) metrics should account for the presence of display black level, and (c) the standardization of new definitions should take into consideration historical usage. Additionally I don’t wish to cut across the results of the standardization efforts currently underway.
5. CONCLUSION This paper has reviewed the descriptive and mathematical definitions of crosstalk and related terms (ghosting, leakage, system crosstalk, viewer crosstalk, extinction, extinction ratio, and 3D contrast) in the stereoscopic literature. The relatively new term “gray-to-gray crosstalk” has also been described.
The understanding/definition/measurement of crosstalk on 3D displays are all improving rapidly – spurred on by rapid development and deployment of 3D displays and related technologies.
This paper has revealed a high level of ambiguity in relation to the mathematical definition of the crosstalk and extinction terms, and the variables used in these definitions. A well-written and well-researched standard would provide significant benefit to the industry as a whole and the onward improvement of stereoscopic display quality.
Ultimately we need stereoscopic displays which have low crosstalk, and we need the terminology and standards to support that.
6. ACKNOWLEDGEMENTS The author would like to thank WA:ERA and iVEC for their support of this work. The author would also like to thank the SPIE for producing the SD&A 20-year DVD-ROM[2], and the SID for making available the SID member publication library, both of which have been incredibly valuable in researching this paper.
REFERENCES
[1] Woods, A. J., “Understanding Crosstalk in Stereoscopic Displays” (Keynote Presentation) at 3DSA (Three-Dimensional Systems and Applications) conference, Tokyo, Japan (2010). http://www.cmst.curtin.edu.au/publicat/2010-23_understanding_crosstalk_woods.pdf [2] Woods, A. J., Merritt, J. O., Fisher, S. S., Bolas, M. T., Benton, S. A., Holliman, N. S., Dodgson, N. A., McDowall, I. E., Dolinsky, M., (editors) [Stereoscopic Displays and Applications 1990-2009: A Complete 20-Year Retrospective and The Engineering Reality of Virtual Reality 1994-2009 (Special Collection)] (DVD-ROM), SPIE (2010). [3] Chang, Y.-C., Chiang, C.-Y., Chen, K.-T., Huang, Y.-P., “Investigation of Dynamic Crosstalk for 3D Display” in 2009 International Display Manufacturing Conference, 3D Systems and Applications, and Asia Display (IDMC/3DSA/Asia Display 2009), Taipei, Taiwan, (2009). [4] Meyer, L., "Monitor selection criteria for stereoscopic displays" in Proc. SPIE Stereoscopic Displays and Applications III, 1669, 211-214 (1992). [5] Lipton, L., “Factors affecting "ghosting" in time-multiplexed piano-stereoscopic CRT display systems” in Proc. SPIE True Three-Dimensional Imaging Techniques and Display Technologies, ed. D.F. McAllister, W.E. Robbins, 0761, 75-78 (1987). [6] Veron, H., Southard, D. A., Leger, J. R., Conway, J. L., “Stereoscopic Displays for Terrain Database Visualization” in Proc. SPIE Stereoscopic Displays and Applications, 1256, 124-135 (1990). [7] Montgommery, D. J., Woodgate, G. J., Jacobs, A., Harrold, J., Ezra, D., “Analysis of the performance of a flat panel display system convertible between 2D and autostereoscopic 3D modes” in Proc. SPIE Stereoscopic Displays and Virtual Reality Systems VIII, 4297, 148-159 (2001) [8] Stevenson, H. and Khazova, M., “Patterned Grating Alignment of Reactive Mesogens for Phase Retarders” in Proceedings of the 24th International Display Research Conference (IDRC) with the 4th International Meeting on Information Display (IMID), Daegu Korea (2004). [9] Stevens, R. F., [Cross-talk in 3D displays] Report CETM 56, National Physical Laboratory UK (2004).
SPIE-IS&T/ Vol. 7863 78630Z-10

[10] Kaptein, R. and Heynderickx, I., “Effect of Crosstalk in Multi-View Autostereoscopic 3D Displays on Perceived Image Quality” in SID ’07 Digest, 1220-1223 (2007). [11] Pala, S., Stevens, R., Surman, P., “Optical crosstalk and visual comfort of a stereoscopic display used in a real-time application” in Proc. SPIE Stereoscopic Displays and Virtual Reality Systems XIV, 6490, 1101-1112 (2007). [12] Uehara, S., Hiroya, T., Kusanagi, H., Shigemura, K. and Asada, H., "High-visibility 2D/3D LCD with HDDP Arrangement and its Optical Characterization Methods" in IMID/IDMC/ASIA DISPLAY '08 Digest, 147-150 (2008). [13] Ealasubramonian, K. and Rajappan, R.P., “Compatible 3-D television: the state of the art” in Proc. SPIE Three-Dimensional Imaging, ed. J.P. Ebbeni, A. Monfils, 0402, 100-106 (1983). [14] Morishama, H., Nose, H., Taniguchi, N., Inoguchi, K., Matsumura, S., “An Eyeglass-Free Rear-Cross-Lenticular 3-D Display” in SID Digest 1998, 923-926 (1998). [15] Chien, K.-W. and Shieh, H.-P. D., “3D Mobile Display Based on Sequentially Switching Backlight with Focusing Foil” in SID 2004 Digest, 1434-1437 (2004). [16] Woods, A. J., Harris, C. R., “Comparing levels of crosstalk with red/cyan, blue/yellow, and green/magenta anaglyph 3D glasses” in Proc. SPIE Stereoscopic Displays and Applications XXI, 7253, 0Q1-0Q12 (2010). http://cmst.curtin.edu.au/publicat/2010-11.pdf [17] Chu, Y.-M., Chien, K.-W., Shieh, H.-P. D., Chang, J.-M., Hu, A., and Yang, V., “3D Mobile Display Based on Dual Directional Lightguides” in 4th International Display Manufacturing Conference, Taipei, Taiwan, 799-801 (2005). [18] Hong, H.-K., Jang, J.-W., Lee, D.-G., Lim, M.-J., Shin, H.-H., “Analysis of angular dependence of 3-D technology using polarized eyeglasses” in Journal of the SID, 18(1), 8-12 (2010). [19] Liou, J.-C., Lee, K., Tseng, F.-G., Huang, J.-F., Yen, W.-T., Hsu, W.-L., “Shutter Glasses Stereo LCD with a Dynamic Backlight” in Proc. SPIE Stereoscopic Displays and Applications XX, 7237, 72370X (2009). [20] Boher, P., Leroux, T., Bignon, T., Collomb-Patton, V., “Multispectral polarization viewing angle analysis of circular polarized stereoscopic 3D displays,” in Proc. SPIE Stereoscopic Displays and Applications XXI, 7253, 0R1-0R12 (2010). [21] Boher, P., ELDIM, personal communication, 13 April 2010. [22] Shestak, S., et al, “Measuring of Gray-to-Gray Crosstalk in a LCD Based Time-Sequential Stereoscopic Display” in SID 2010, Seattle, 132-135 (2010). [23] Boev, A., Gotchev, A., Egiazarian, K., “Crosstalk measurement methodology for autostereoscopic screens” in 3DTV Conference, Kos Island (2007). [24] Lane, B., “Stereoscopic displays” in Proc. SPIE Processing and Display of Three-Dimensional Data, ed. J.J. Pearson, 0367, 20-32 (1982) [25] Meyer, L., "Monitor selection criteria for stereoscopic displays" in Proc. SPIE Stereoscopic Displays and Applications III, 1669, 211-214 (1992). [26] Gorski, A. M., "User evaluation of a stereoscopic display for space training applications" in Proc. SPIE Stereoscopic Displays and Applications III, 1669, 236-243 (1992). [27] Woods, A. J. and Tan, S. S. L., “Characterising sources of ghosting in time-sequential stereoscopic video displays” in Proc. SPIE Stereoscopic Displays and Virtual Reality Systems IX, 4660, 66-77 (2002). http://cmst.curtin.edu.au/publicat/2002-09.pdf [28] Lipton, L., “Glossary” in Lenny Lipton’s Blog, online, dated 16 March 2009, accessed 19 March 2010. http://lennylipton.wordpress.com/2009/03/16/glossary/ [29] Huang, K.-C., Tsai, C.-H., Lee, K., Hsueh, W.-J., “Measurement of Contrast Ratios for 3D Display” in Proc. SPIE Input/Output and Imaging Technologies II, 4080, 78-86 (2000). [30] Huang, K.-C., Yuan, J.-C., Tsai, C.-H., Hsueh, W.-J., Wang, N.-Y., “A study of how crosstalk affects stereopsis in stereoscopic displays” in Proc. SPIE Stereoscopic Displays and Virtual Reality Systems X, 5006, 247-253 (2003). [31] Huang, K.-C., Lee, K., Lin, H.-Y., “Crosstalk issue in stereo/autostereoscopic display” in Proc. Int. Display Manufacturing Conference, 2–18 (2009). [32] Jung, S.-M., Lee, Y.-B., Park, H.-J., Lee, S.-C., Jeong, W.-N., Shin, J.-K., Chung, I.-J., “Improvement of 3-D Crosstalk with Over-Driving Method for the Active Retarder 3-D Displays” in SID Digest 2010, Seattle, 1264-1267 (2010). [33] Pan, C.-C., Lee, Y.-R., Huang, K.-F., Huang, T.-C., “Cross-Talk Evaluation of Shutter-Type Stereoscopic 3D Display” in SID Digest 2010, Seattle, 128-131 (2010). [34] Hines, S. P., "Three-Dimensional Cinematography" in Proc. SPIE Optics in Entertainment II, ed. C.S. Outwater, 0462, 41-47 (1984).
SPIE-IS&T/ Vol. 7863 78630Z-11
[35] Walworth, V., Bennett, S., Trapani, G., "Three-dimensional projection with circular polarizers" in Proc. SPIE Optics in Entertainment II, ed. C.S. Outwater, 0462, 64-68 (1984). [36] Haven, T. J., "A liquid-crystal video stereoscope with high extinction ratios, a 28 % transmission state, and one-hundred-microsecond switching" in Proc. SPIE True 3D Imaging Techniques and Display Technologies, 761, 23-26 (1987). [37] Lipton, L., "Selection devices for field-sequential stereoscopic displays: a brief history" in Proc. SPIE Stereoscopic Displays and Applications II, 1457, 274-282 (1991). [38] Yeh, Y.-Y., Silverstein, L. D., “Using electronic stereoscopic color displays: Limits of fusion and depth discrimination” in Proc. SPIE Three-Dimensional Visualization and Display Technologies, ed. S S Fisher, W E Robbins, 1083, 196-204 (1989). [39] Hodges, L. F., “Basic principles of stereographic software development” in Proc. SPIE Stereoscopic Displays and Applications II, 1457, 9-17 (1991). [40] Abileah, A., “3D Displays – Technologies & Testing Methods” at 3D Imaging Workshop, Stanford University (2011). [41] Uehara, S., Ujike, H., Hamagishi, G., Taira, K., Koike, T., Kato, C., Nomura, T., Horikoshi, T., Mashitani, K., Yuuki, A., Izumi, K., Hisatake, Y., Watanabe, N., Umezu, N., Nakano, Y., "Standardization based on human factors for 3D display: performance characteristics and measurement methods" in Proc. SPIE Stereoscopic Displays and Applications XXI, 7524 , 7524071-12 (2010). [42] Jain, A., Konrad, J., "Crosstalk in automultiscopic 3-D displays: Blessing in disguise?" in Proc. SPIE Stereoscopic Displays and Virtual Reality Systems XIV, 6490, 6490121-12 (2007). [43] Uehara, S., Koike, T., Kato, C., Uchidoi, M., Horikoshi, T., Hamagishi, G., Hisatake, Y., Ujike, H., "Development of Performance Characteristics for 3D Displays" in IMID/IDMC/ASIA DISPLAY 2010 DIGEST, 245-246 (2010). [44] [The Macquarie Encyclopedic Dictionary], Macquarie University, Australia (1990). [45] Weissman, M. A., Woods, A. J., “A simple method for measuring crosstalk in stereoscopic displays” in Proc. SPIE Stereoscopic Displays and Applications XXII, San Francisco, 7863, (2011). (in press) [46] Bos, P. J., “Time sequential stereoscopic displays: The contribution of phosphor persistence to the "ghost" image intensity” in Proc. ITEC’91 Annual Conf., Three-Dimensional Image Tech., H. Kusaka, ed., 603-606 (1991). [47] Walworth, V., Bennett, S. and Trapani, G., “Three-dimensional projection with circular polarizers” in Proc. SPIE Optics in Entertainment II, ed. C.S. Outwater, 0462, 64-68 (1984).
SPIE-IS&T/ Vol. 7863 78630Z-12

Paper 17 [Refereed Conference Paper]
A. J. Woods, J. Helliwell (2012) “Investigating the cross‐compatibility of IR‐controlled active shutter glasses” in Stereoscopic Displays and Applications XXIII, Proceedings of IS&T/SPIE Electronic Imaging, SPIE Vol. 8288, pp. 82881C‐1 to ‐10, Burlingame, California, January 2012.
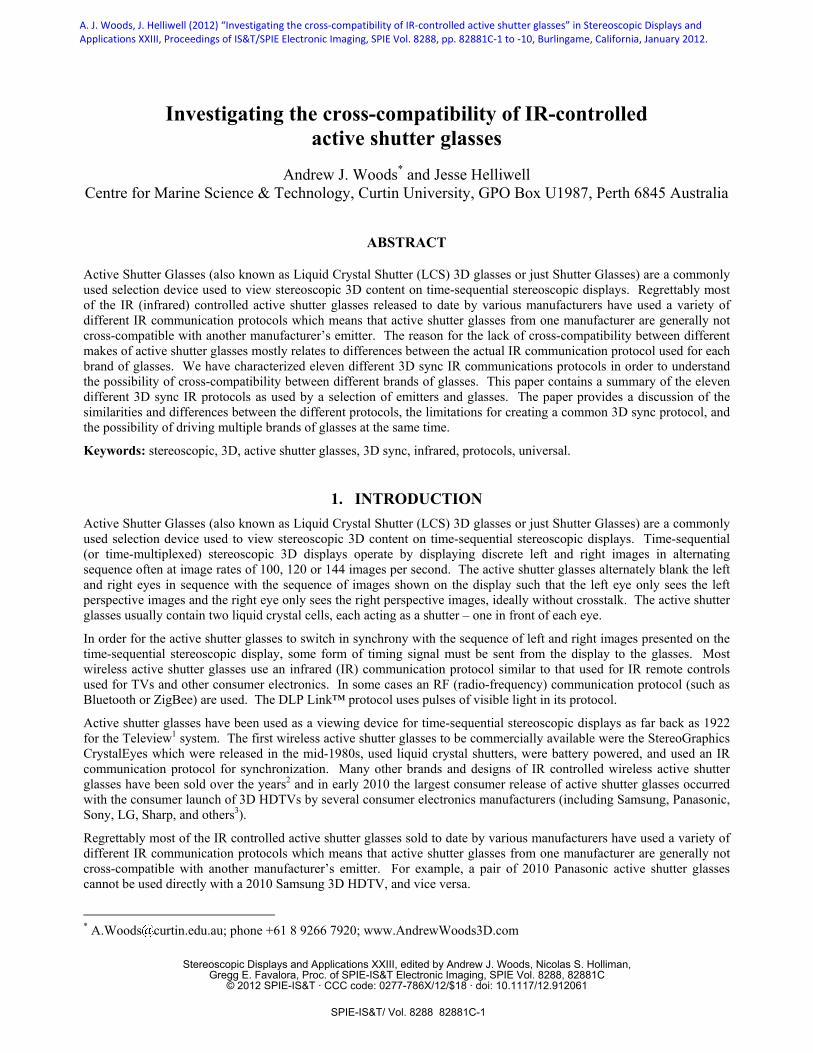
Investigating the cross-compatibility of IR-controlled active shutter glasses
Andrew J. Woods* and Jesse Helliwell
Centre for Marine Science & Technology, Curtin University, GPO Box U1987, Perth 6845 Australia
ABSTRACT
Active Shutter Glasses (also known as Liquid Crystal Shutter (LCS) 3D glasses or just Shutter Glasses) are a commonly used selection device used to view stereoscopic 3D content on time-sequential stereoscopic displays. Regrettably most of the IR (infrared) controlled active shutter glasses released to date by various manufacturers have used a variety of different IR communication protocols which means that active shutter glasses from one manufacturer are generally not cross-compatible with another manufacturer’s emitter. The reason for the lack of cross-compatibility between different makes of active shutter glasses mostly relates to differences between the actual IR communication protocol used for each brand of glasses. We have characterized eleven different 3D sync IR communications protocols in order to understand the possibility of cross-compatibility between different brands of glasses. This paper contains a summary of the eleven different 3D sync IR protocols as used by a selection of emitters and glasses. The paper provides a discussion of the similarities and differences between the different protocols, the limitations for creating a common 3D sync protocol, and the possibility of driving multiple brands of glasses at the same time.
Keywords: stereoscopic, 3D, active shutter glasses, 3D sync, infrared, protocols, universal.
1. INTRODUCTION Active Shutter Glasses (also known as Liquid Crystal Shutter (LCS) 3D glasses or just Shutter Glasses) are a commonly used selection device used to view stereoscopic 3D content on time-sequential stereoscopic displays. Time-sequential (or time-multiplexed) stereoscopic 3D displays operate by displaying discrete left and right images in alternating sequence often at image rates of 100, 120 or 144 images per second. The active shutter glasses alternately blank the left and right eyes in sequence with the sequence of images shown on the display such that the left eye only sees the left perspective images and the right eye only sees the right perspective images, ideally without crosstalk. The active shutter glasses usually contain two liquid crystal cells, each acting as a shutter – one in front of each eye.
In order for the active shutter glasses to switch in synchrony with the sequence of left and right images presented on the time-sequential stereoscopic display, some form of timing signal must be sent from the display to the glasses. Most wireless active shutter glasses use an infrared (IR) communication protocol similar to that used for IR remote controls used for TVs and other consumer electronics. In some cases an RF (radio-frequency) communication protocol (such as Bluetooth or ZigBee) are used. The DLP Link™ protocol uses pulses of visible light in its protocol.
Active shutter glasses have been used as a viewing device for time-sequential stereoscopic displays as far back as 1922 for the Teleview1 system. The first wireless active shutter glasses to be commercially available were the StereoGraphics CrystalEyes which were released in the mid-1980s, used liquid crystal shutters, were battery powered, and used an IR communication protocol for synchronization. Many other brands and designs of IR controlled wireless active shutter glasses have been sold over the years2 and in early 2010 the largest consumer release of active shutter glasses occurred with the consumer launch of 3D HDTVs by several consumer electronics manufacturers (including Samsung, Panasonic, Sony, LG, Sharp, and others3).
Regrettably most of the IR controlled active shutter glasses sold to date by various manufacturers have used a variety of different IR communication protocols which means that active shutter glasses from one manufacturer are generally not cross-compatible with another manufacturer’s emitter. For example, a pair of 2010 Panasonic active shutter glasses cannot be used directly with a 2010 Samsung 3D HDTV, and vice versa.
* A.Woods curtin.edu.au; phone +61 8 9266 7920; www.AndrewWoods3D.com
Stereoscopic Displays and Applications XXIII, edited by Andrew J. Woods, Nicolas S. Holliman,Gregg E. Favalora, Proc. of SPIE-IS&T Electronic Imaging, SPIE Vol. 8288, 82881C
© 2012 SPIE-IS&T · CCC code: 0277-786X/12/$18 · doi: 10.1117/12.912061
SPIE-IS&T/ Vol. 8288 82881C-1
A. J. Woods, J. Helliwell (2012) “Investigating the cross‐compatibility of IR‐controlled active shutter glasses” in Stereoscopic Displays and Applications XXIII, Proceedings of IS&T/SPIE Electronic Imaging, SPIE Vol. 8288, pp. 82881C‐1 to ‐10, Burlingame, California, January 2012.

The technical reason for the lack of cross-compatibility between different brands of active shutter glasses mostly relates to differences between the IR communication protocol used for each brand of glasses (other reasons for incompatibility which are discussed in Section 4.1). In this study we have characterized eleven different 3D sync IR communications protocols in order to understand the possibility for implementing cross-compatibility between different brands of 3D glasses and 3D displays.
2. EXPERIMENTAL METHOD The protocols were measured by connecting the IR protocol emitter (either a stand-alone emitter or an emitter integrated into a 3D display/projector) to a 3D video or 3D sync source. In the case where the IR emitter was integrated into the 3D display/projector, the 3D display/projector was switched into a 3D mode. A high-speed IR photo-sensor (Osram Opto-Semiconductors SFH213 Silicon PIN Photodiode – wavelength range 400-1100nm, 5ns response time) was aimed at the IR emitter and analyzed using a digital storage oscilloscope (TiePie Engineering Handyscope HS3 – 50MHz bandwidth). The timing of the IR pulses was measured relative to the 3D sync signal, the light field emitted by the display, and/or the timing of the shuttering of the eyewear.
Eleven pairs of active shutter glasses were tested in this study and ten of them are shown in Figure 1. Some of the stand-alone emitters tested in this study are shown in Figure 2.
Figure 1: Ten of the eleven active shutter glasses tested in this study: (a) StereoGraphics CrystaleEyes CE-1,
(b) ELSA/H3D, (c) NuVision 60GX, (d) NVIDIA 3D Vision, (e) Panasonic TY-EW3D10U, (f) Samsung 2007, (g) Samsung (2010) SSG-2100AB, (h) Sony TDG-BR100, (i) Viewsonic PGD-150 DLP Link, and (j) Xpand X103 Universal. Sharp AN3DG10 not shown.
Figure 2: Some of the stand-alone IR 3D emitters tested: (a) Samsung 2007, (b) NuVision, (c) NVIDIA 3D VISION, (d) CrystalEyes 1, and (e) H3D/ELSA.
In order to verify the accuracy of the protocol measurements, a custom-built universal IR emitter was constructed4 and used to send a regenerated version of the various IR protocols to the various active shutter glasses. We were able to reliably drive all of the tested active shutter glasses using the appropriate measured IR protocol. There was only one exception to this testing, which was that we were unable to reliably drive the Xpand X103 universal glasses in the Samsung (2010) protocol mode using our regenerated Samsung 2010 protocol. This might indicate a slight timing error
SPIE-IS&T/ Vol. 8288 82881C-2
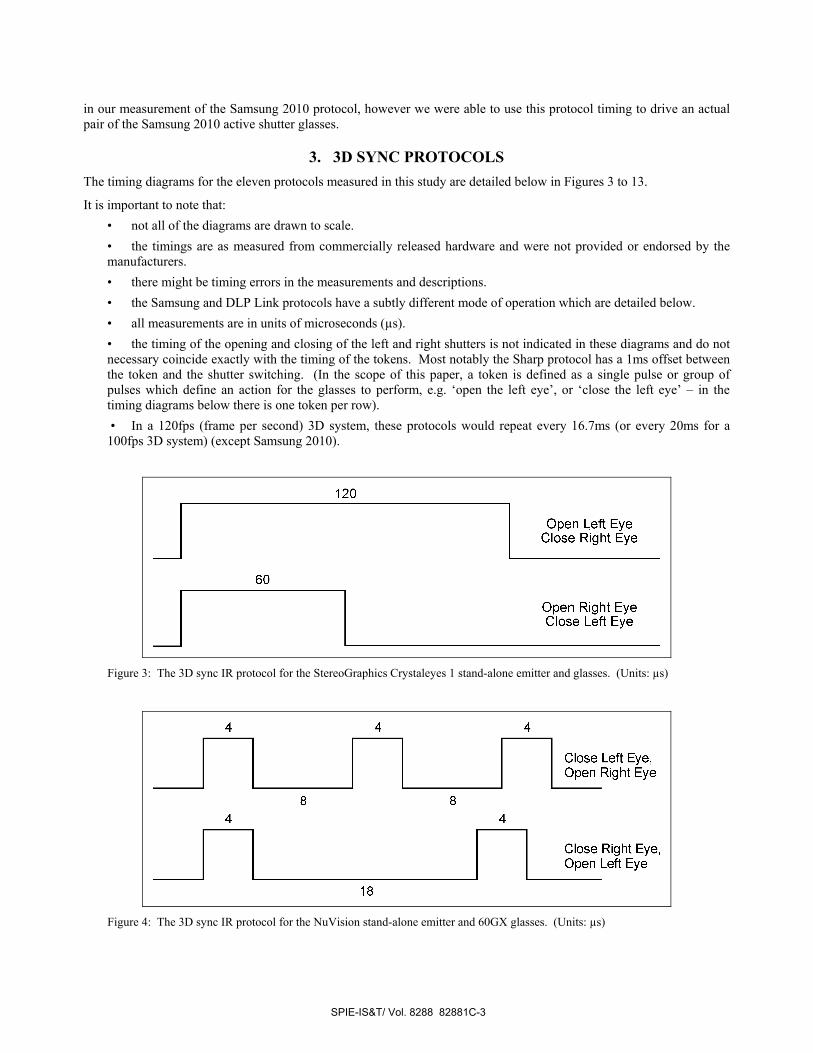
120
Open Left EyeClose Right Eye
60
Open Right EyeClose Left Eye
4 4 4
Close Left Eye,Open Right Eye
4 4
Close Right Eye,Open Left Eye
18
in our measurement of the Samsung 2010 protocol, however we were able to use this protocol timing to drive an actual pair of the Samsung 2010 active shutter glasses.
3. 3D SYNC PROTOCOLS The timing diagrams for the eleven protocols measured in this study are detailed below in Figures 3 to 13.
It is important to note that: • not all of the diagrams are drawn to scale. • the timings are as measured from commercially released hardware and were not provided or endorsed by the manufacturers. • there might be timing errors in the measurements and descriptions. • the Samsung and DLP Link protocols have a subtly different mode of operation which are detailed below. • all measurements are in units of microseconds (µs). • the timing of the opening and closing of the left and right shutters is not indicated in these diagrams and do not necessary coincide exactly with the timing of the tokens. Most notably the Sharp protocol has a 1ms offset between the token and the shutter switching. (In the scope of this paper, a token is defined as a single pulse or group of pulses which define an action for the glasses to perform, e.g. ‘open the left eye’, or ‘close the left eye’ – in the timing diagrams below there is one token per row). • In a 120fps (frame per second) 3D system, these protocols would repeat every 16.7ms (or every 20ms for a 100fps 3D system) (except Samsung 2010).
Figure 3: The 3D sync IR protocol for the StereoGraphics Crystaleyes 1 stand-alone emitter and glasses. (Units: µs)
Figure 4: The 3D sync IR protocol for the NuVision stand-alone emitter and 60GX glasses. (Units: µs)
SPIE-IS&T/ Vol. 8288 82881C-3
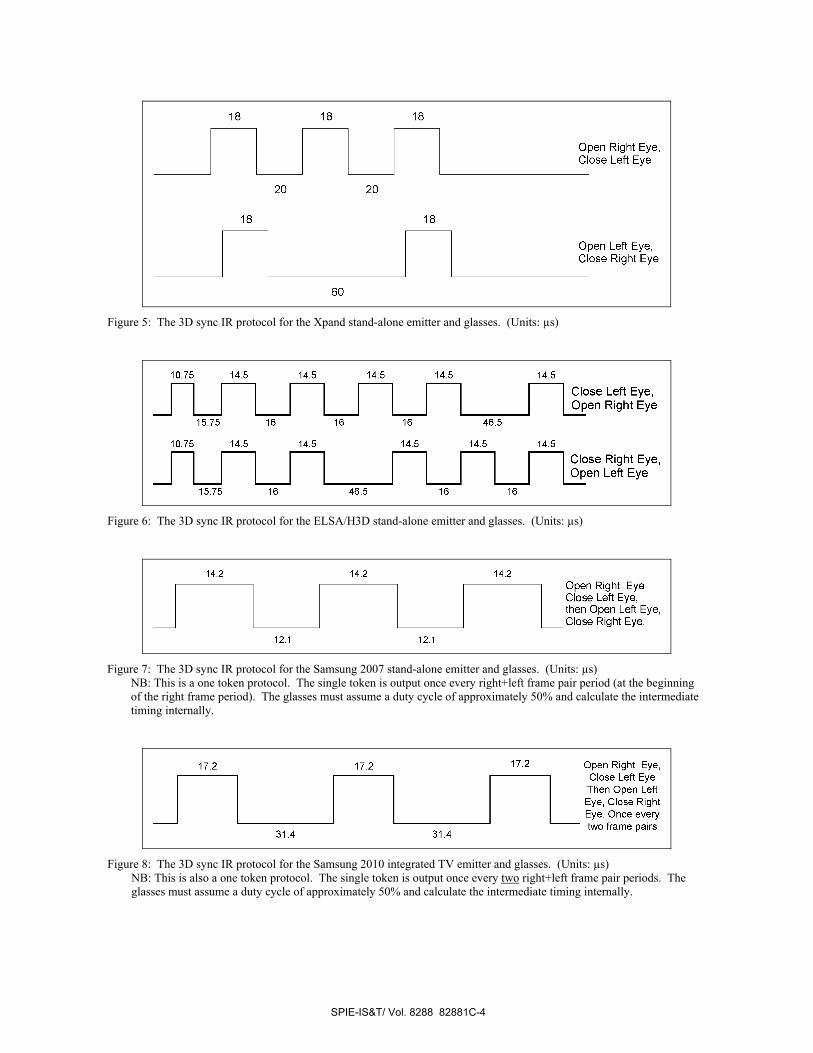
18 18 18
Open Right Eye,Close Left Eye
20 20
60
Open Left Eye,Close Right Eye
15.75 16 16 16 46.5
Close Left Eye,Open Right Eye
10.75 14.5 14.5 14.5 14.5 14.5
15.75 16 46.5 16 16
Close Right Eye,Open Left Eye
0.75 14.5 14.5 14.5 14.5 14.5
14.2 14.2 14.2
12.1 12.1
Open Right EyeClose Left Eye,then Open Left Eye,Close Right Eye.
31.4 31.4
Open Right Eye,Close Left EyeThen Open LeftEye, Close RightEye. Once everytwo frame pairs
17.2 17.2 17.2
Figure 5: The 3D sync IR protocol for the Xpand stand-alone emitter and glasses. (Units: µs)
Figure 6: The 3D sync IR protocol for the ELSA/H3D stand-alone emitter and glasses. (Units: µs)
Figure 7: The 3D sync IR protocol for the Samsung 2007 stand-alone emitter and glasses. (Units: µs)
NB: This is a one token protocol. The single token is output once every right+left frame pair period (at the beginning of the right frame period). The glasses must assume a duty cycle of approximately 50% and calculate the intermediate timing internally.
Figure 8: The 3D sync IR protocol for the Samsung 2010 integrated TV emitter and glasses. (Units: µs)
NB: This is also a one token protocol. The single token is output once every two right+left frame pair periods. The glasses must assume a duty cycle of approximately 50% and calculate the intermediate timing internally.
SPIE-IS&T/ Vol. 8288 82881C-4
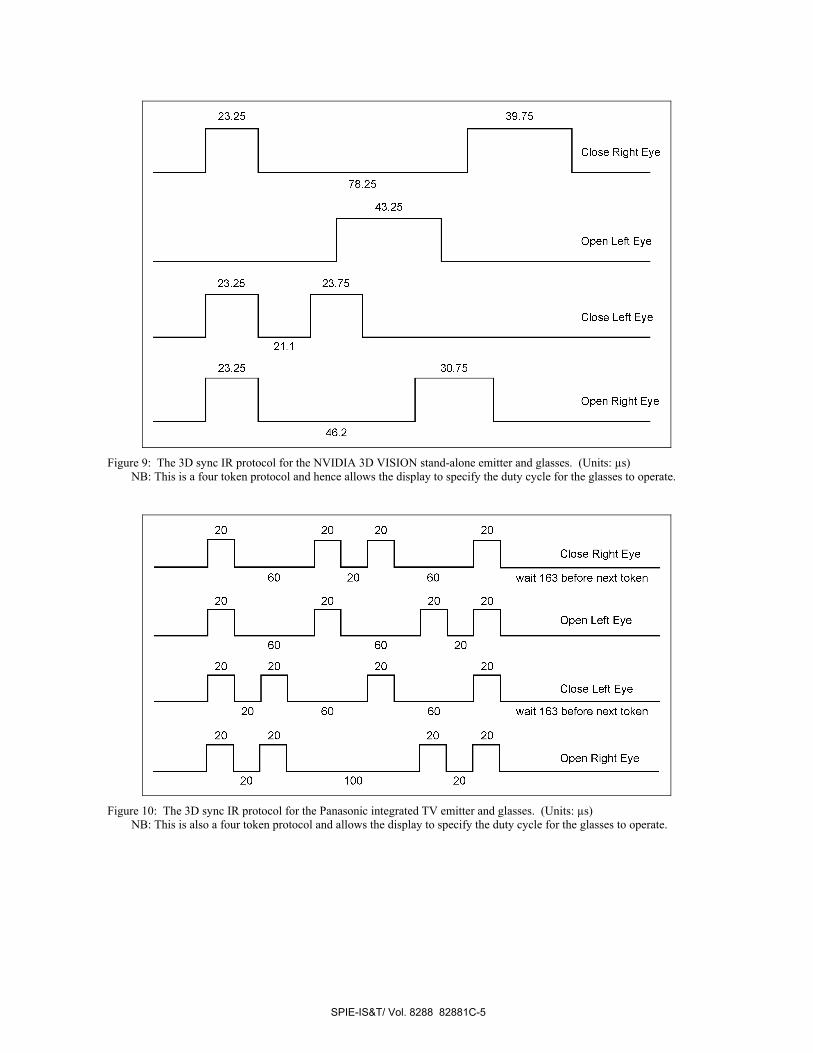
Close Right Eye
23.25
78.25
39.75
Open Left Eye
43.25
Close Left Eye
23.25 23.75
21.1
Open Right Eye
23.25 30.75
46.2
20 20 20 20
Close Right Eye
60 20 60 wait 163 before next token
20 20 20 20
60 60 20
20 20 20 20
Open Left Eye
Close Left Eye
20 60 60 wait 163 before next token
20 20 20 20
20 100 20
Open Right Eye
Figure 9: The 3D sync IR protocol for the NVIDIA 3D VISION stand-alone emitter and glasses. (Units: µs)
NB: This is a four token protocol and hence allows the display to specify the duty cycle for the glasses to operate.
Figure 10: The 3D sync IR protocol for the Panasonic integrated TV emitter and glasses. (Units: µs)
NB: This is also a four token protocol and allows the display to specify the duty cycle for the glasses to operate.
SPIE-IS&T/ Vol. 8288 82881C-5
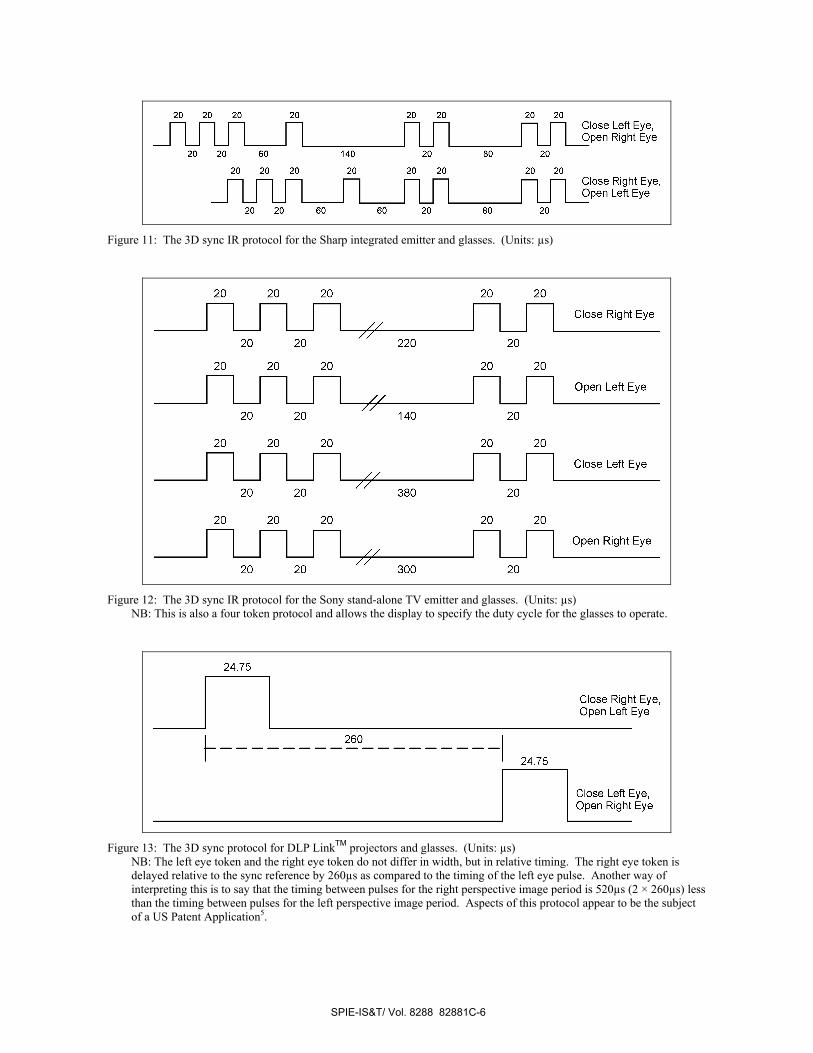
20 20 20 20 20 20 20 20
20 20 60 140 20 80 20
Close Left Eye,Open Right Eye
20 20 20 20 20 20 20 20
20 20 60 60 20 80 20
Close Right Eye,Open Left Eye
20 20//
220 20
Close Right Eye
20 20 20 20 20
20 20 20 20 20
20 20/
140 20
Open Left Eye
20 20 380 20
Close Left Eye
20 20 20 20 20
20 20 20 20 20
20 20//
300 20
Open Right Eye
Close Right Eye,
Open Left Eye
24.75
2fS0 I
b 24.75
Close Left Eye,
Open Right Eye
Figure 11: The 3D sync IR protocol for the Sharp integrated emitter and glasses. (Units: µs)
Figure 12: The 3D sync IR protocol for the Sony stand-alone TV emitter and glasses. (Units: µs)
NB: This is also a four token protocol and allows the display to specify the duty cycle for the glasses to operate.
Figure 13: The 3D sync protocol for DLP LinkTM projectors and glasses. (Units: µs)
NB: The left eye token and the right eye token do not differ in width, but in relative timing. The right eye token is delayed relative to the sync reference by 260µs as compared to the timing of the left eye pulse. Another way of interpreting this is to say that the timing between pulses for the right perspective image period is 520µs (2 × 260µs) less than the timing between pulses for the left perspective image period. Aspects of this protocol appear to be the subject of a US Patent Application5.
SPIE-IS&T/ Vol. 8288 82881C-6
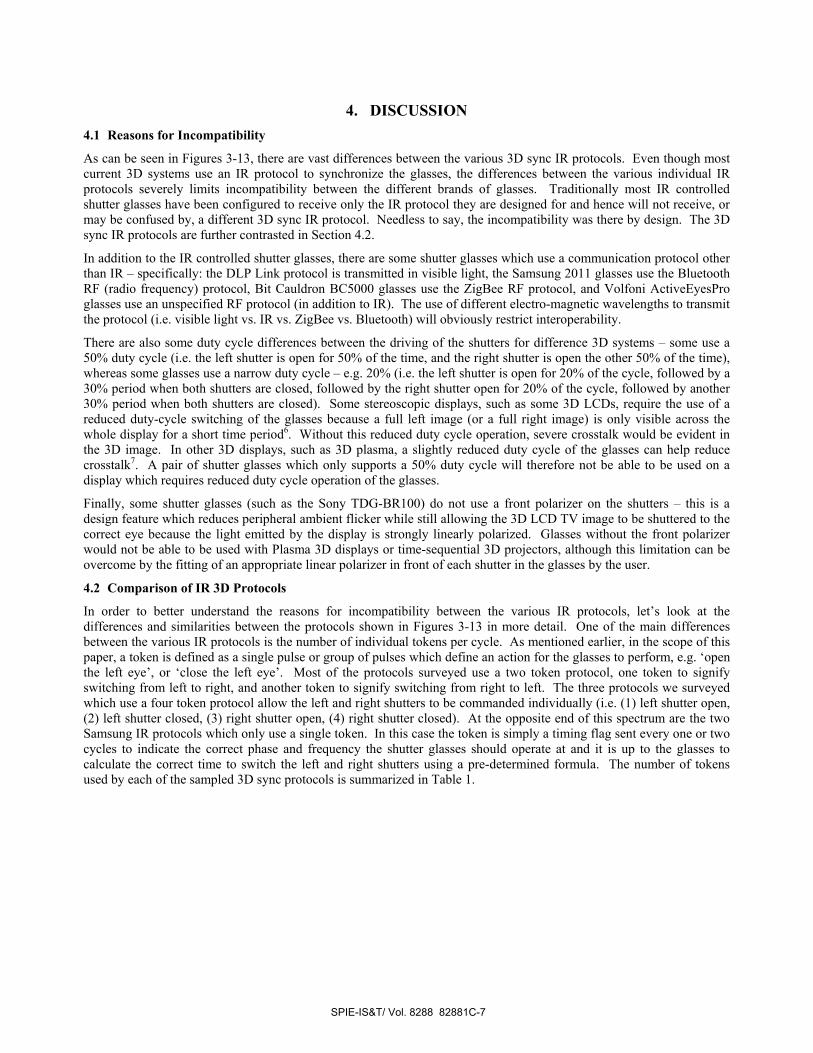
4. DISCUSSION 4.1 Reasons for Incompatibility
As can be seen in Figures 3-13, there are vast differences between the various 3D sync IR protocols. Even though most current 3D systems use an IR protocol to synchronize the glasses, the differences between the various individual IR protocols severely limits incompatibility between the different brands of glasses. Traditionally most IR controlled shutter glasses have been configured to receive only the IR protocol they are designed for and hence will not receive, or may be confused by, a different 3D sync IR protocol. Needless to say, the incompatibility was there by design. The 3D sync IR protocols are further contrasted in Section 4.2.
In addition to the IR controlled shutter glasses, there are some shutter glasses which use a communication protocol other than IR – specifically: the DLP Link protocol is transmitted in visible light, the Samsung 2011 glasses use the Bluetooth RF (radio frequency) protocol, Bit Cauldron BC5000 glasses use the ZigBee RF protocol, and Volfoni ActiveEyesPro glasses use an unspecified RF protocol (in addition to IR). The use of different electro-magnetic wavelengths to transmit the protocol (i.e. visible light vs. IR vs. ZigBee vs. Bluetooth) will obviously restrict interoperability.
There are also some duty cycle differences between the driving of the shutters for difference 3D systems – some use a 50% duty cycle (i.e. the left shutter is open for 50% of the time, and the right shutter is open the other 50% of the time), whereas some glasses use a narrow duty cycle – e.g. 20% (i.e. the left shutter is open for 20% of the cycle, followed by a 30% period when both shutters are closed, followed by the right shutter open for 20% of the cycle, followed by another 30% period when both shutters are closed). Some stereoscopic displays, such as some 3D LCDs, require the use of a reduced duty-cycle switching of the glasses because a full left image (or a full right image) is only visible across the whole display for a short time period6. Without this reduced duty cycle operation, severe crosstalk would be evident in the 3D image. In other 3D displays, such as 3D plasma, a slightly reduced duty cycle of the glasses can help reduce crosstalk7. A pair of shutter glasses which only supports a 50% duty cycle will therefore not be able to be used on a display which requires reduced duty cycle operation of the glasses.
Finally, some shutter glasses (such as the Sony TDG-BR100) do not use a front polarizer on the shutters – this is a design feature which reduces peripheral ambient flicker while still allowing the 3D LCD TV image to be shuttered to the correct eye because the light emitted by the display is strongly linearly polarized. Glasses without the front polarizer would not be able to be used with Plasma 3D displays or time-sequential 3D projectors, although this limitation can be overcome by the fitting of an appropriate linear polarizer in front of each shutter in the glasses by the user.
4.2 Comparison of IR 3D Protocols
In order to better understand the reasons for incompatibility between the various IR protocols, let’s look at the differences and similarities between the protocols shown in Figures 3-13 in more detail. One of the main differences between the various IR protocols is the number of individual tokens per cycle. As mentioned earlier, in the scope of this paper, a token is defined as a single pulse or group of pulses which define an action for the glasses to perform, e.g. ‘open the left eye’, or ‘close the left eye’. Most of the protocols surveyed use a two token protocol, one token to signify switching from left to right, and another token to signify switching from right to left. The three protocols we surveyed which use a four token protocol allow the left and right shutters to be commanded individually (i.e. (1) left shutter open, (2) left shutter closed, (3) right shutter open, (4) right shutter closed). At the opposite end of this spectrum are the two Samsung IR protocols which only use a single token. In this case the token is simply a timing flag sent every one or two cycles to indicate the correct phase and frequency the shutter glasses should operate at and it is up to the glasses to calculate the correct time to switch the left and right shutters using a pre-determined formula. The number of tokens used by each of the sampled 3D sync protocols is summarized in Table 1.
SPIE-IS&T/ Vol. 8288 82881C-7
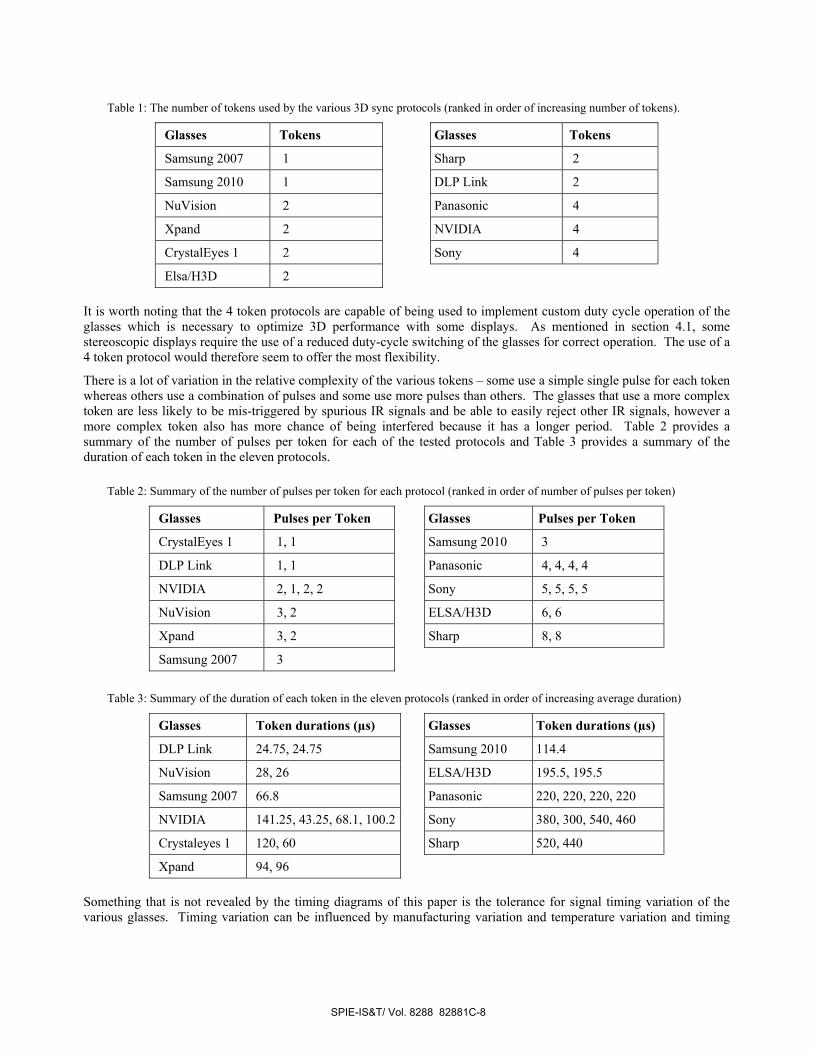
Table 1: The number of tokens used by the various 3D sync protocols (ranked in order of increasing number of tokens).
Glasses Tokens Glasses Tokens
Samsung 2007 1 Sharp 2
Samsung 2010 1 DLP Link 2
NuVision 2 Panasonic 4
Xpand 2 NVIDIA 4
CrystalEyes 1 2 Sony 4
Elsa/H3D 2 It is worth noting that the 4 token protocols are capable of being used to implement custom duty cycle operation of the glasses which is necessary to optimize 3D performance with some displays. As mentioned in section 4.1, some stereoscopic displays require the use of a reduced duty-cycle switching of the glasses for correct operation. The use of a 4 token protocol would therefore seem to offer the most flexibility.
There is a lot of variation in the relative complexity of the various tokens – some use a simple single pulse for each token whereas others use a combination of pulses and some use more pulses than others. The glasses that use a more complex token are less likely to be mis-triggered by spurious IR signals and be able to easily reject other IR signals, however a more complex token also has more chance of being interfered because it has a longer period. Table 2 provides a summary of the number of pulses per token for each of the tested protocols and Table 3 provides a summary of the duration of each token in the eleven protocols.
Table 2: Summary of the number of pulses per token for each protocol (ranked in order of number of pulses per token)
Glasses Pulses per Token Glasses Pulses per Token
CrystalEyes 1 1, 1 Samsung 2010 3
DLP Link 1, 1 Panasonic 4, 4, 4, 4
NVIDIA 2, 1, 2, 2 Sony 5, 5, 5, 5
NuVision 3, 2 ELSA/H3D 6, 6
Xpand 3, 2 Sharp 8, 8
Samsung 2007 3
Table 3: Summary of the duration of each token in the eleven protocols (ranked in order of increasing average duration)
Glasses Token durations (µs) Glasses Token durations (µs)
DLP Link 24.75, 24.75 Samsung 2010 114.4
NuVision 28, 26 ELSA/H3D 195.5, 195.5
Samsung 2007 66.8 Panasonic 220, 220, 220, 220
NVIDIA 141.25, 43.25, 68.1, 100.2 Sony 380, 300, 540, 460
Crystaleyes 1 120, 60 Sharp 520, 440
Xpand 94, 96 Something that is not revealed by the timing diagrams of this paper is the tolerance for signal timing variation of the various glasses. Timing variation can be influenced by manufacturing variation and temperature variation and timing
SPIE-IS&T/ Vol. 8288 82881C-8
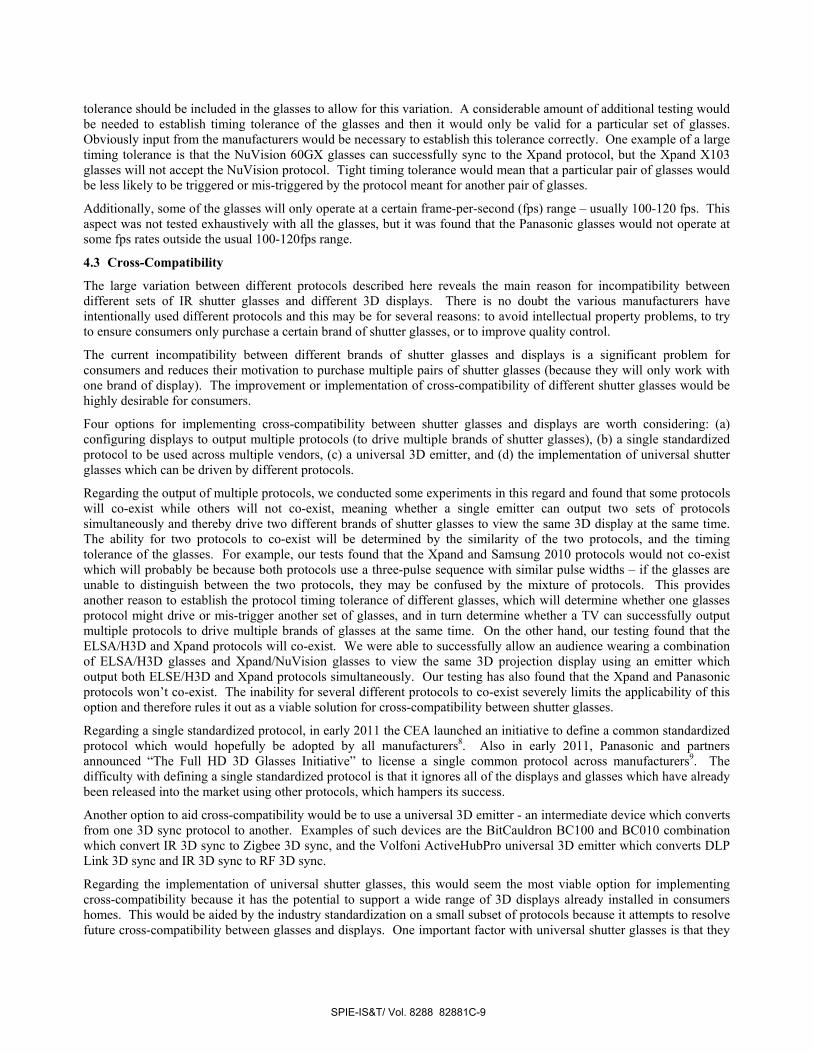
tolerance should be included in the glasses to allow for this variation. A considerable amount of additional testing would be needed to establish timing tolerance of the glasses and then it would only be valid for a particular set of glasses. Obviously input from the manufacturers would be necessary to establish this tolerance correctly. One example of a large timing tolerance is that the NuVision 60GX glasses can successfully sync to the Xpand protocol, but the Xpand X103 glasses will not accept the NuVision protocol. Tight timing tolerance would mean that a particular pair of glasses would be less likely to be triggered or mis-triggered by the protocol meant for another pair of glasses.
Additionally, some of the glasses will only operate at a certain frame-per-second (fps) range – usually 100-120 fps. This aspect was not tested exhaustively with all the glasses, but it was found that the Panasonic glasses would not operate at some fps rates outside the usual 100-120fps range.
4.3 Cross-Compatibility
The large variation between different protocols described here reveals the main reason for incompatibility between different sets of IR shutter glasses and different 3D displays. There is no doubt the various manufacturers have intentionally used different protocols and this may be for several reasons: to avoid intellectual property problems, to try to ensure consumers only purchase a certain brand of shutter glasses, or to improve quality control.
The current incompatibility between different brands of shutter glasses and displays is a significant problem for consumers and reduces their motivation to purchase multiple pairs of shutter glasses (because they will only work with one brand of display). The improvement or implementation of cross-compatibility of different shutter glasses would be highly desirable for consumers.
Four options for implementing cross-compatibility between shutter glasses and displays are worth considering: (a) configuring displays to output multiple protocols (to drive multiple brands of shutter glasses), (b) a single standardized protocol to be used across multiple vendors, (c) a universal 3D emitter, and (d) the implementation of universal shutter glasses which can be driven by different protocols.
Regarding the output of multiple protocols, we conducted some experiments in this regard and found that some protocols will co-exist while others will not co-exist, meaning whether a single emitter can output two sets of protocols simultaneously and thereby drive two different brands of shutter glasses to view the same 3D display at the same time. The ability for two protocols to co-exist will be determined by the similarity of the two protocols, and the timing tolerance of the glasses. For example, our tests found that the Xpand and Samsung 2010 protocols would not co-exist which will probably be because both protocols use a three-pulse sequence with similar pulse widths – if the glasses are unable to distinguish between the two protocols, they may be confused by the mixture of protocols. This provides another reason to establish the protocol timing tolerance of different glasses, which will determine whether one glasses protocol might drive or mis-trigger another set of glasses, and in turn determine whether a TV can successfully output multiple protocols to drive multiple brands of glasses at the same time. On the other hand, our testing found that the ELSA/H3D and Xpand protocols will co-exist. We were able to successfully allow an audience wearing a combination of ELSA/H3D glasses and Xpand/NuVision glasses to view the same 3D projection display using an emitter which output both ELSE/H3D and Xpand protocols simultaneously. Our testing has also found that the Xpand and Panasonic protocols won’t co-exist. The inability for several different protocols to co-exist severely limits the applicability of this option and therefore rules it out as a viable solution for cross-compatibility between shutter glasses.
Regarding a single standardized protocol, in early 2011 the CEA launched an initiative to define a common standardized protocol which would hopefully be adopted by all manufacturers8. Also in early 2011, Panasonic and partners announced “The Full HD 3D Glasses Initiative” to license a single common protocol across manufacturers9. The difficulty with defining a single standardized protocol is that it ignores all of the displays and glasses which have already been released into the market using other protocols, which hampers its success.
Another option to aid cross-compatibility would be to use a universal 3D emitter - an intermediate device which converts from one 3D sync protocol to another. Examples of such devices are the BitCauldron BC100 and BC010 combination which convert IR 3D sync to Zigbee 3D sync, and the Volfoni ActiveHubPro universal 3D emitter which converts DLP Link 3D sync and IR 3D sync to RF 3D sync.
Regarding the implementation of universal shutter glasses, this would seem the most viable option for implementing cross-compatibility because it has the potential to support a wide range of 3D displays already installed in consumers homes. This would be aided by the industry standardization on a small subset of protocols because it attempts to resolve future cross-compatibility between glasses and displays. One important factor with universal shutter glasses is that they
SPIE-IS&T/ Vol. 8288 82881C-9

must correctly implement each of the protocols that they reportedly support. One example of incorrect support is that at least two models of universal shutter that we have tested have not correctly implemented the Sharp 3D sync IR protocol with what should be a 1ms delay between the token and the shutter switching.
In later announcements, the Full HD 3D Glasses Initiative indicated that other protocols have been included in the licensing program which also suggests the use of universal shutter glasses. It will be interesting to see whether the manufacturers support these standardization initiatives and answer consumers’ calls for cross-compatibility between shutter glasses.
5. CONCLUSION The analysis of the various 3D sync IR protocols has certainly been an interesting revelation into what is normally an invisible process. The results have revealed a considerable amount of variation between different 3D sync IR protocols and also some overlap. The paper has outlined options and limitations for cross-compatibility between different brands of 3D displays and 3D shutter glasses.
Please note that the protocol measurements outlined in the document have been provided for research and discussion purposes only. The protocol measurements may be subject to error and should not be used as an actual technical definition of each of the protocols.
6. ACKNOWLEDGEMENTS We wish to acknowledge the support of iVEC in conducting this research. Product names and trademarks are the property of their respective owners. An earlier version of this manuscript was published as a Curtin University White Paper10 and submitted to the CEA to assist with their protocol standardization efforts8.
REFERENCES
[1] Symmes, D. L. (2006) “The Chopper” Online: http://www.3dmovingpictures.com/chopper.html Dated: 14 November 2006. Accessed: 29 March 2011.
[2] Bungert, C. (2005) “Shutterglasses Comparison Chart” Online: http://stereo3d.com/shutter.htm Dated: 1 April 2005. Accessed: 29 March 2011.
[3] Woods, A. J. (2011) “The Illustrated 3D HDTV list” Online: http://www.3dmovielist.com/3dhdtvs.html Dated: 28 March 2011. Accessed: 29 March 2011.
[4] Petrus (2011) “Universal sutterglasses controller” (sic) in MTBS3D Forums. Online: http://www.mtbs3d.com/phpBB/viewtopic.php?p=55149#p55149 Dated: 10 Jan 2011. Accessed: 29 March 2011.
[5] Basile, G. R. and Poradish, F. J. (2006) “System and Method for Synchronizing a Viewing Device” US Patent Application 2008/0151112 A1, dated 22 Dec 2006.
[6] Woods, A.J., Yuen, K.-L. (2006) "Compatibility of LCD Monitors with Frame-Sequential Stereoscopic 3D Visualisation" (Invited Paper), in IMID/IDMC '06 Digest, (The 6th International Meeting on Information Display, and The 5th International Display Manufacturing Conference), pg 98-102, Daegu, South Korea, 22-25 August 2006. http://www.cmst.curtin.edu.au/local/docs/pubs/2006-30.pdf
[7] Woods, A. J., Karvinen, K. S. (2008) "The compatibility of consumer plasma displays with time-sequential stereoscopic 3D visualization" in Stereoscopic Displays and Applications XIX, Proceedings of SPIE Vol. 6803, SPIE, Bellingham, WA, USA. http://www.cmst.curtin.edu.au/local/docs/pubs/2008-01_3d-plasma_woods_karvinen.pdf
[8] CEA (Consumer Electronics Association) (2011) “R4WG16: Active Eyewear Standards IR Sync Request for Proposal (RFP)”
[9] The Full HD 3D Glasses Initiative. Online: http://www.fullhd3dglasses.com/ Accessed: 16 December 2011. [10] Woods, A.J., and Helliwell, J. (2011) “White Paper: A Survey of 3D Sync IR Protocols”, Curtin University,
March 2011. http://www.cmst.curtin.edu.au/local/docs/pubs/2011-17-woods-helliwell-3D-Sync-IR.pdf
SPIE-IS&T/ Vol. 8288 82881C-10

Paper 18 [Refereed Journal Paper]
A. J. Woods (2013) “3D or 3‐D: a study of terminology, usage and style” European Science Editing, 39(3), pp. 59‐62, August 2013.

European Science Editing 59 August 2013; 39(3)
MethodsWe start this examination by looking at the house styles of various publications relevant to the stereoscopic imaging field. We then consider current trends of usage of language in print. Finally we consider the implications of choosing one style or the other.
ResultsFirst we present the results of the house style survey, and subsequently present the statistical occurrence of the two styles over the past 30 years.
House stylesMany publications have a house style that prescribes the use of the hyphenated version “3-D.” A number of publications were surveyed to determine their policy.IEEE’s senior copy editor for IEEE Spectrum magazine, Joe Levine,3 wrote:
IEEE publications like standards, transactions, and proceedings use a more formal style than IEEE Spectrum. While Spectrum doesn’t take up all the latest trends, we do consider the styles of mainstream magazines and newspapers. We’re encouraged to use a conversational tone. The traditional practice in most house styles is to spell out “three-dimensional” on first reference and then to use “3-D.” We only recently started allowing “3-D” to be used in all cases. Our editors urged me to change this, arguing that most of the time people hear in their heads “three dee.” And in certain contexts it just sounds odd to spell it out: For example, “three-dimensional television” seems to refer to the object rather than the technology.
I don’t think there’s an explicit policy on “3-D” vs. “3D” throughout [IEEE] and all [its] societies. I have found that the IEEE Computer Society has its own style guide: http://www.computer.org/portal/web/publications/styleguide and they have indeed adopted the no-hyphen style.
With regard to publications from the Society for Information Display (SID), Jay Morreale,4 Managing Editor of the Journal of the SID (JSID) wrote:
In both [Information Display] Magazine and JSID, we have been using “3-D” since ID’s inception in 1987 and since I became Managing Editor of the Journal back in 1978. My goal is to be consistent until the style dictates a change.
As far as references are concerned, it is policy NOT to change references because it is understood that searches need to be based on “original” paper titles, although I must admit the urge is definitely there to edit the titles of papers in the references.
Abstract The terms “3D” and “3-D” are two alternative acronyms for the term “three-dimensional”. In the published literature both variants are commonly used but what is the derivation of the two forms and what are the drivers of usage? This paper surveys the published stereoscopic literature and examines publication-style policies to understand forces and trends.
Keywords Stereoscopic, 3D, 3-D, three-dimensional, style, terminology.
BackgroundThe term “three-dimensional” has probably been with us since philosophers discovered and discussed the concept of dimensions. The term can be used to refer to anything that has height, width and depth – three dimensions. Conveniently, “three-dimensional” can also be abbreviated to “3-D” or “3D.”
The earliest example of the use of the term “three-dimensional” in relation to photography I have been able to locate is Kennedy (1936),1 who wrote: “It is true that the most fantastic proposals purporting to disclose a short-cut to three-dimensional photography are repeatedly made by persons who claim that by chance or ingenuity they can produce a stereoscopic effect - note the word effect - without taking two pictures and particularly without providing adequate means whereby each eye sees its proper image.” However, he doesn’t use the abbreviation “3D” or “3-D” in the article.
The earliest example of the abbreviation “3-D” I have located is Spottiswoode et al. (1952),2 who wrote: “Up to now the production of three-dimensional (3-D) films has been sporadic.” Perhaps there are earlier examples.
Although the acronym “3D” was first used in relation to stereoscopic 3D movies, and can also be used to refer to other stereoscopic topics including 3DTV, 3D displays, 3D cameras and 3D vision, it can also be used to refer to non-stereoscopic technologies including 3D printing (additive manufacturing), 3D computer graphics (using monoscopic depth cues to give a computer-generated image added realism), 3D laser scanning, 3D computer-aided design (CAD), 3D modelling, and DirectX 3D. In order to distinguish stereoscopic 3D from other uses of “3D” some authors use the term “s3D”, short for stereoscopic 3D.
It is apparent from the literature that in early times the hyphenated form of “3-D” was used predominantly. For at least the past 30 years, both the hyphenated and non-hyphenated forms “3-D” and “3D” have been in common usage. It seems formal English tends to prefer the hyphenated form, whereas modern usage tends to use the non-hyphenated form, but is there a right and a wrong? Can the two styles co-exist?
3D or 3-D: a study of terminology, usage and styleAndrew J. WoodsCentre for Marine Science & Technology, Curtin University, Perth, Australia
Original articles
A. J. Woods (2013) “3D or 3‐D: a study of terminology, usage and style” European Science Editing, 39(3), pp. 59‐62, August 2013.

European Science Editing 60 August 2013; 39(3)
John Dennis,5 the editor of the National Stereoscopic Association magazine Stereo World, said:
We follow a style of using “3-D” in articles except when “3D” is used as part of a movie or book title or product name.
Most newspapers use the “3-D” style – although there are some exceptions, or even inconsistencies within the same publication or article. Most newspapers appear to follow The Associated Press Stylebook,6 which recommends the “3-D” form. In contrast, The Yahoo! Style Guide,7 which is primarily intended for online publishing, recommends the “3D” form.
SPIE does not apply a preferred style of either “3-D” or “3D” in their proceedings or journals. In the proceedings volumes, the authors are free to choose the form they wish. The same is intended to apply to their journals, however my experience is that well-meaning sub-contracted proof editors often apply “3-D” style unless the author makes a representation otherwise. The editor of SPIE Professional, Kathy Sheehan,8 wrote:
Our magazine generally follows AP style. We have a small style list that sometimes over-rides the AP style, which we do in the case of “3D”. Although we would edit an author’s copy, we would not change the name of a previously published book title, article, etc.
Mark Fihn,9 editor of 3rd Dimension newsletter, wrote:We try to always use “3D”. We don’t give authors any sort of style guide, so we get inputs using either “3D”, “3-D”, or both.
I [usually] do a final edit to change “3-D” to “3D”.
We use “3D” because frequently there’s another hyphen in the equation, such as “3D-enabled” or “pseudo-3D” or some such… It seems awkward to have “3-D-enabled” or “pseudo-3-D”
The evolution of languageLanguages evolve over time. Strunk and White11, in their book “The Elements of Style,” wrote: “Do not use a hyphen between words that can better be written as one word: water-fowl, waterfowl. Common sense will aid you in the decision, but a dictionary is more reliable.” and particularly “The steady evolution of the language seems to favor union: two words eventually becoming one, usually after a period of hyphenation.”
A survey of 1293 stereoscopic focused papers10 published by SD&A, IS&T and SPIE over the period 1977-2009 reveals a trend towards the use of the non-hyphenated form. It is important to note that a house style was not applied to these papers so this provides a good unbiased survey of usage amongst a scientific audience. The survey is broken down into roughly decade-long periods:
1977-1989: (231 papers containing 1567 pages) “3D” 921 instances in 91 papers “3-D” 1623 instances in 131 papers 1990-1989: (407 papers containing 3535 pages) “3D” 3318 instances in 307 papers “3-D” 2003 instances in 165 papers 2000-2009: (655 papers containing 6229 pages) “3D” 11627 instances in 573 papers “3-D” 2827 instances in 263 papers
These statistics are illustrated in Figure 1 and Figure 2:
Figure 1: Number of papers in the SD&A 20-year DVD-ROM10 containing the term “3D” or “3-D” in roughly decade period groups.
Figure 2: Percentage of number of papers in the SD&A 20-year DVD-ROM10 containing the term “3D” or “3-D” in roughly decade period groups.
According to this publication record, the “3-D” form was favoured in the 70s and 80s, but over the past couple of decades the unhyphenated “3D” form has become more favoured by scientific authors.
Our next statistic considers the occurrence of “3D” and “3-D” in the May (or April) 2013 issue of several professionally produced publications relevant to the 3D field. Table 1 summarizes counts of “3D” and “3-D”. The count is conducted separately for the text of the publication, which will be affected by the publication’s house style, and in advertisements (adverts), which will not be affected by the publication’s house style.
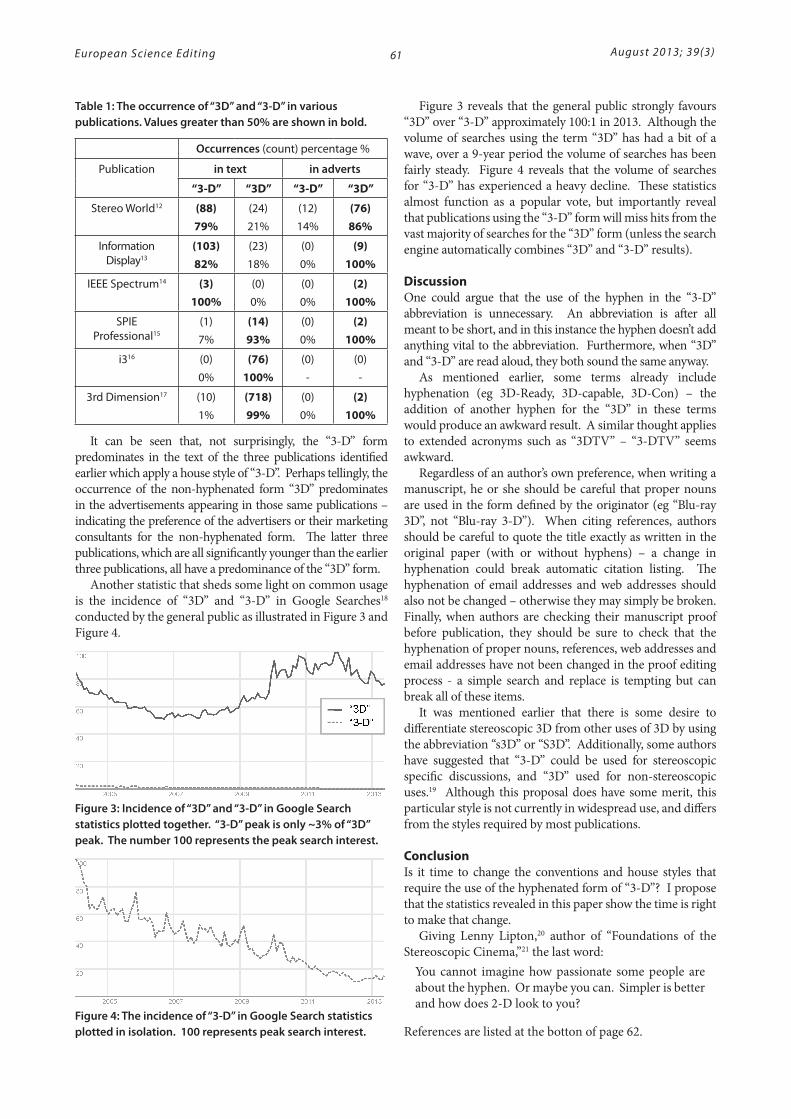
European Science Editing 61 August 2013; 39(3)
Table 1: The occurrence of “3D” and “3-D” in various publications. Values greater than 50% are shown in bold.
Occurrences (count) percentage %
Publication in text in adverts
“3-D” “3D” “3-D” “3D”
Stereo World12 (88)79%
(24)
21%
(12)
14%
(76)86%
Information Display13
(103)82%
(23)
18%
(0)
0%
(9)100%
IEEE Spectrum14 (3)100%
(0)
0%
(0)
0%
(2)100%
SPIE Professional15
(1)
7%
(14)93%
(0)
0%
(2)100%
i316 (0)
0%
(76)100%
(0)
-
(0)
-
3rd Dimension17 (10)
1%
(718)99%
(0)
0%
(2)100%
It can be seen that, not surprisingly, the “3-D” form predominates in the text of the three publications identified earlier which apply a house style of “3-D”. Perhaps tellingly, the occurrence of the non-hyphenated form “3D” predominates in the advertisements appearing in those same publications – indicating the preference of the advertisers or their marketing consultants for the non-hyphenated form. The latter three publications, which are all significantly younger than the earlier three publications, all have a predominance of the “3D” form.
Another statistic that sheds some light on common usage is the incidence of “3D” and “3-D” in Google Searches18 conducted by the general public as illustrated in Figure 3 and Figure 4.
Figure 3: Incidence of “3D” and “3-D” in Google Search statistics plotted together. “3-D” peak is only ~3% of “3D” peak. The number 100 represents the peak search interest.
Figure 4: The incidence of “3-D” in Google Search statistics plotted in isolation. 100 represents peak search interest.
Figure 3 reveals that the general public strongly favours “3D” over “3-D” approximately 100:1 in 2013. Although the volume of searches using the term “3D” has had a bit of a wave, over a 9-year period the volume of searches has been fairly steady. Figure 4 reveals that the volume of searches for “3-D” has experienced a heavy decline. These statistics almost function as a popular vote, but importantly reveal that publications using the “3-D” form will miss hits from the vast majority of searches for the “3D” form (unless the search engine automatically combines “3D” and “3-D” results).
DiscussionOne could argue that the use of the hyphen in the “3-D” abbreviation is unnecessary. An abbreviation is after all meant to be short, and in this instance the hyphen doesn’t add anything vital to the abbreviation. Furthermore, when “3D” and “3-D” are read aloud, they both sound the same anyway.
As mentioned earlier, some terms already include hyphenation (eg 3D-Ready, 3D-capable, 3D-Con) – the addition of another hyphen for the “3D” in these terms would produce an awkward result. A similar thought applies to extended acronyms such as “3DTV” – “3-DTV” seems awkward.
Regardless of an author’s own preference, when writing a manuscript, he or she should be careful that proper nouns are used in the form defined by the originator (eg “Blu-ray 3D”, not “Blu-ray 3-D”). When citing references, authors should be careful to quote the title exactly as written in the original paper (with or without hyphens) – a change in hyphenation could break automatic citation listing. The hyphenation of email addresses and web addresses should also not be changed – otherwise they may simply be broken. Finally, when authors are checking their manuscript proof before publication, they should be sure to check that the hyphenation of proper nouns, references, web addresses and email addresses have not been changed in the proof editing process - a simple search and replace is tempting but can break all of these items.
It was mentioned earlier that there is some desire to differentiate stereoscopic 3D from other uses of 3D by using the abbreviation “s3D” or “S3D”. Additionally, some authors have suggested that “3-D” could be used for stereoscopic specific discussions, and “3D” used for non-stereoscopic uses.19 Although this proposal does have some merit, this particular style is not currently in widespread use, and differs from the styles required by most publications.
ConclusionIs it time to change the conventions and house styles that require the use of the hyphenated form of “3-D”? I propose that the statistics revealed in this paper show the time is right to make that change.
Giving Lenny Lipton,20 author of “Foundations of the Stereoscopic Cinema,”21 the last word:
You cannot imagine how passionate some people are about the hyphen. Or maybe you can. Simpler is better and how does 2-D look to you?
References are listed at the botton of page 62.

European Science Editing 62 August 2013; 39(3)
References - continued from page 611 Kennedy C. The Development and Use of Stereo Photography for
Educational Purposes. Journal of the Society for Motion Picture Engineers 1936;26:3-17. doi: 10.5594/J01280
2 Spottiswoode R, Spottiswoode NL, Smith C. Basic Principles of the Three Dimensional Film. Journal of the Society for Motion Picture and Television Engineers 1952;59:249-286. doi: 10.5594/J01778
3 Joe Levine, IEEE, personal communication, 23 September 2011.4 Jay Morreale, SID, personal communication, 1 September 2011.5 John Dennis, NSA, personal communication, 1 September 2011.6 The Associated Press Stylebook and Briefing on Media Law. New York:
Associated Press; 2013. ISBN 978-0-917360-57-2.7 The Yahoo! Style Guide. New York: Yahoo! Inc; 2010. p. 483. ISBN
978-0312569846.8 Kathy Sheehan, SPIE, personal communication, 29 May 2013.9 Mark Fihn, Veritas et Visus, personal communication, 28 May 2013.10 Woods AJ, Merritt JO, Fisher S, Bolas M, Benton S, Holliman NS,
et al. (eds). Selected SPIE/IS&T papers on DVD-ROM: Stereoscopic Displays and Applications 1990-2009: A Complete 20-Year Retrospective - and The Engineering Reality of Virtual Reality 1994-2009 (CDP51). Bellingham (WA): SPIE; 2010. ISBN: 978-0-8194-7659-3
11 Strunk W, White EB. The Elements of Style. 4th ed. Boston, Massachusetts: Allyn & Bacon; 2000. ISBN: 0-205-30902-X
12 Stereo World. 38(6) (May/June 2013). Portland, Oregon: National Stereoscopic Association (NSA); 2013. Available at http://www.stereoworld.org/ [Accessed 19 June 2013].
13 Information Display. 9(3) (May/June 2013). Campbell, California: Society for Information Display (SID); 2013. Available at http://informationdisplay.org/ [Accessed 19 June 2013].
14 IEEE Spectrum. 50(5) (INT) (May 2013). New York: Institute of Electrical and Electronics Engineers (IEEE); 2013. Available at http://spectrum.ieee.org/ [Accessed 19 June 2013].
15 SPIE Professional. 8(2) (April 2013). Bellingham, Washington: SPIE; 2013.16 It Is Innovation (i3). 1(3) (May 2013). Arlington, Virginia: Consumer
Electronics Association (CEA); 2013. Available at http://www.ce.org/i3 [Accessed 19 June 2013].
17 3rd Dimension. 8(2) (May 2013). Temple, Texas: Veritas et Visus; 2013. Available at http://www.veritasetvisus.com/3rd_dimension.htm [Accessed 19 June 2013]
18 Google Trends [Internet]. Mountain View, California: Google Inc.; 2013. [updated 30 May 2013; cited 30 May 2013]. Available at www.google.com/trends
19 Eric Kurland, 3-DIY, personal communication, 28 May 2013.20 Lenny Lipton, Leonardo IP, personal communication, 8 Nov 2011.21 Lipton L. Foundations of the Stereoscopic Cinema – A Study in Depth.
New York: Van Nostrand Reinhold Company; 1978.

This is a separator page and is intentionally blank.
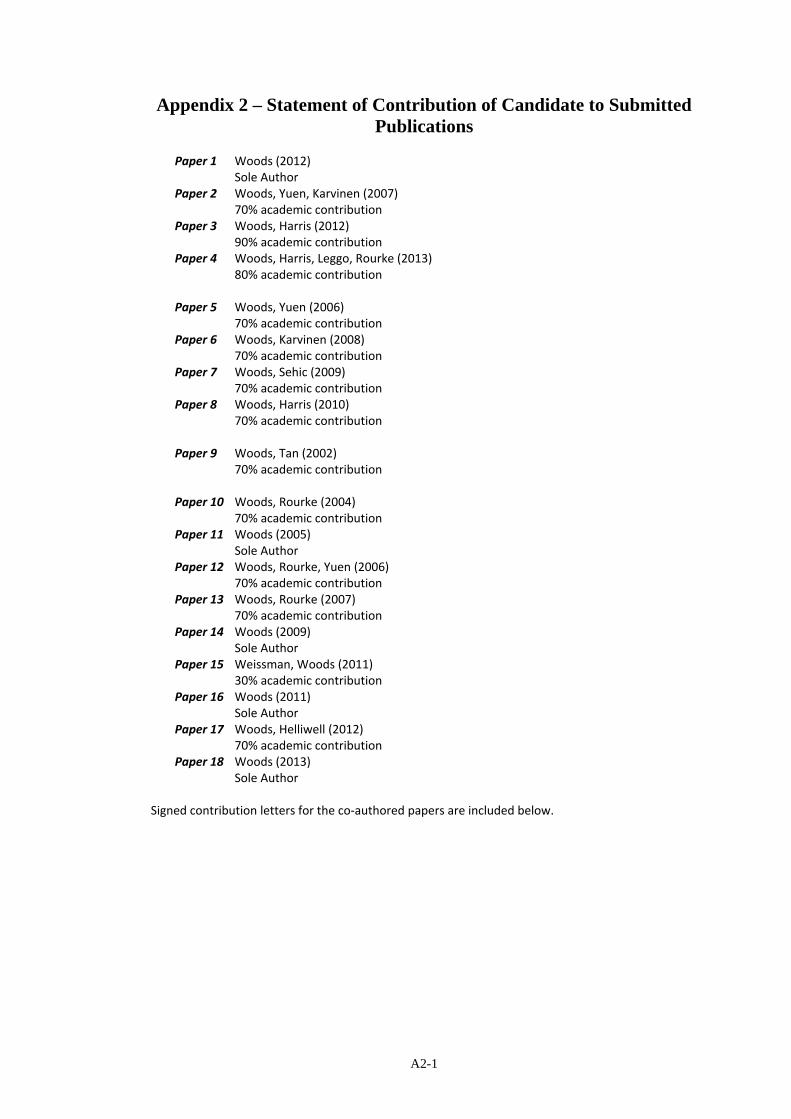
A2-1
Appendix 2 – Statement of Contribution of Candidate to Submitted Publications
Paper 1 Woods (2012)
Sole Author Paper 2 Woods, Yuen, Karvinen (2007)
70% academic contribution Paper 3 Woods, Harris (2012)
90% academic contribution Paper 4 Woods, Harris, Leggo, Rourke (2013)
80% academic contribution
Paper 5 Woods, Yuen (2006) 70% academic contribution
Paper 6 Woods, Karvinen (2008) 70% academic contribution
Paper 7 Woods, Sehic (2009) 70% academic contribution
Paper 8 Woods, Harris (2010) 70% academic contribution
Paper 9 Woods, Tan (2002) 70% academic contribution
Paper 10 Woods, Rourke (2004)
70% academic contribution Paper 11 Woods (2005)
Sole Author Paper 12 Woods, Rourke, Yuen (2006)
70% academic contribution Paper 13 Woods, Rourke (2007)
70% academic contribution Paper 14 Woods (2009)
Sole Author Paper 15 Weissman, Woods (2011)
30% academic contribution Paper 16 Woods (2011)
Sole Author Paper 17 Woods, Helliwell (2012)
70% academic contribution Paper 18 Woods (2013)
Sole Author Signed contribution letters for the co‐authored papers are included below.
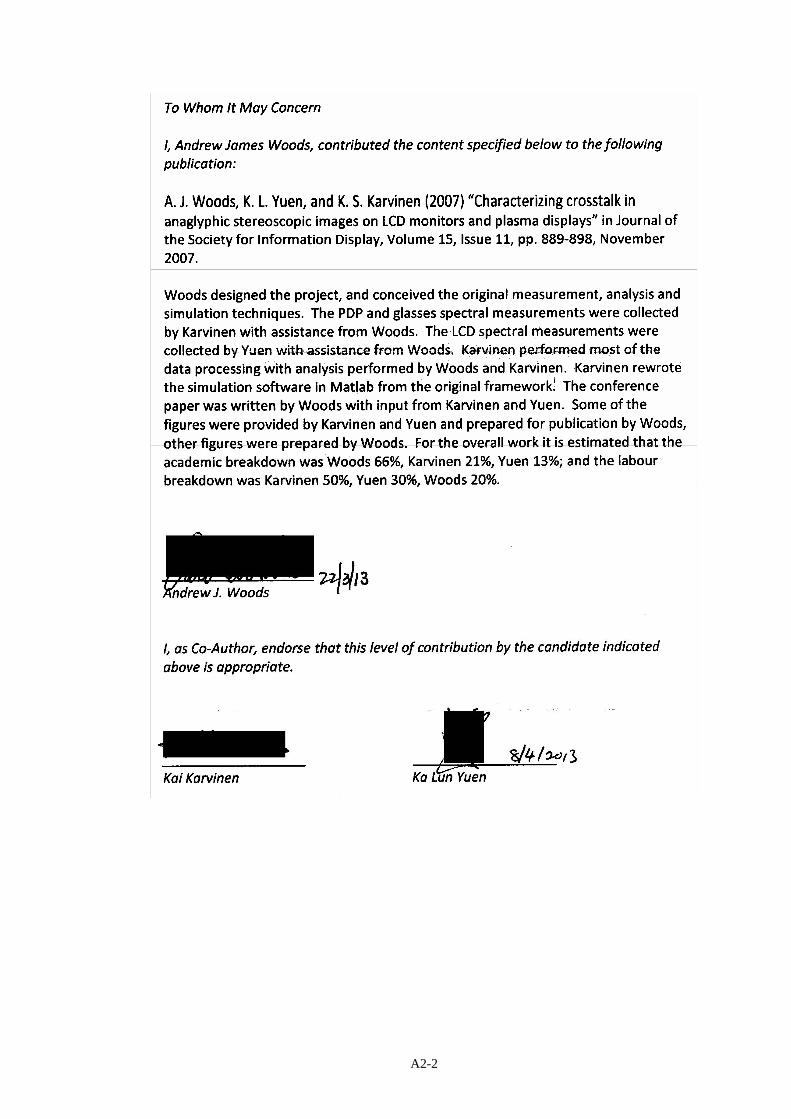
A2-2

A2-3
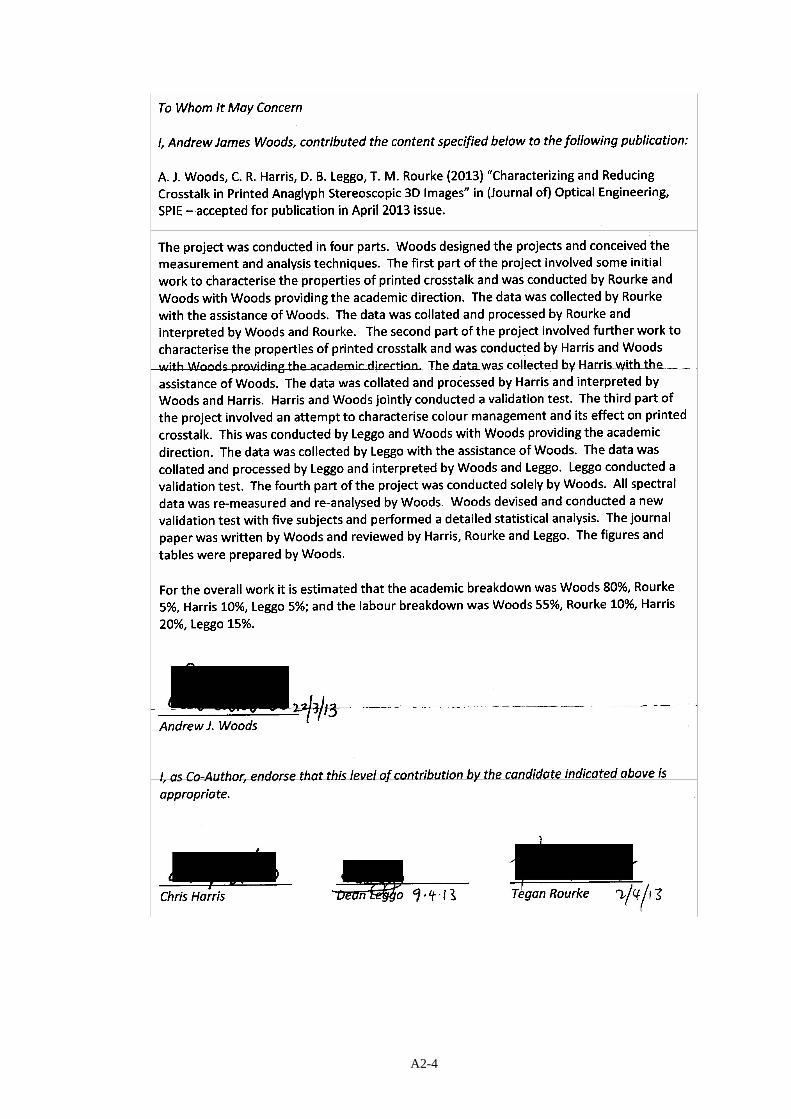
A2-4
A2-5
A2-6

A2-7
A2-8
A2-9
A2-10
A2-11
A2-12

A2-13
A2-14
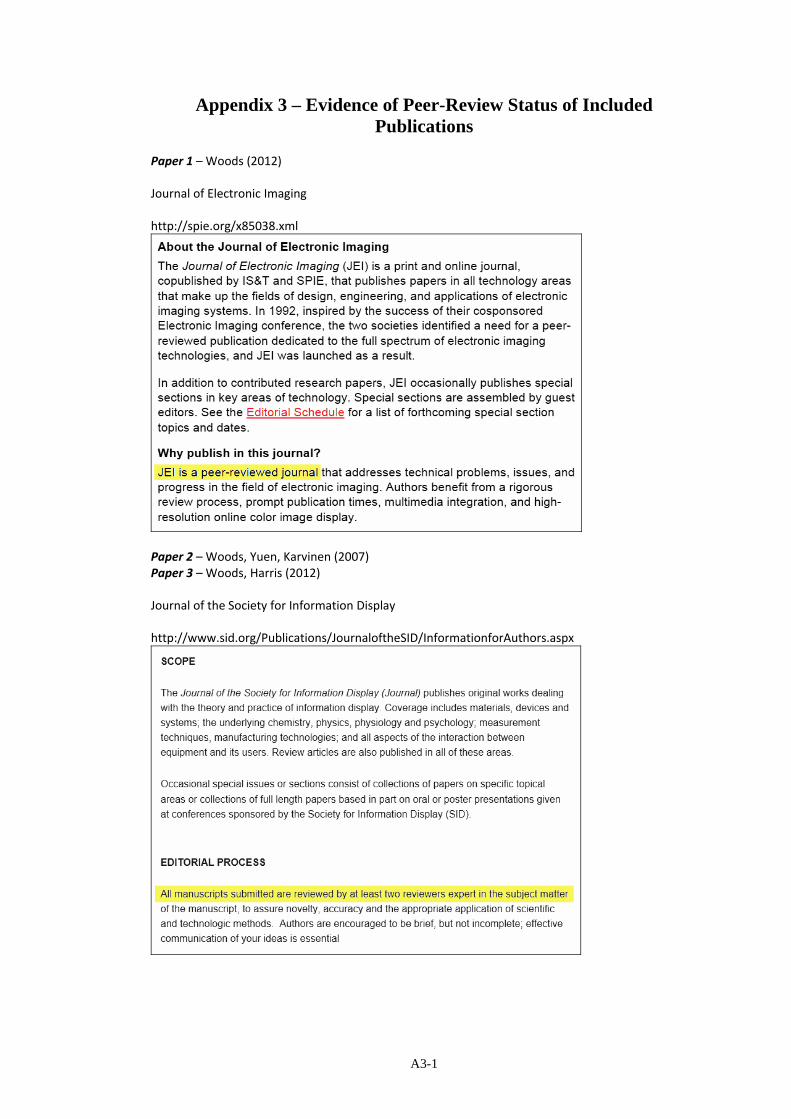
A3-1
Appendix 3 – Evidence of Peer-Review Status of Included Publications
Paper 1 – Woods (2012)
Journal of Electronic Imaging
http://spie.org/x85038.xml
Paper 2 – Woods, Yuen, Karvinen (2007) Paper 3 – Woods, Harris (2012)
Journal of the Society for Information Display
http://www.sid.org/Publications/JournaloftheSID/InformationforAuthors.aspx

A3-2
Paper 4 – Woods, Harris, Leggo, Rourke (2013)
Optical Engineering journal
http://spie.org/x85027.xml
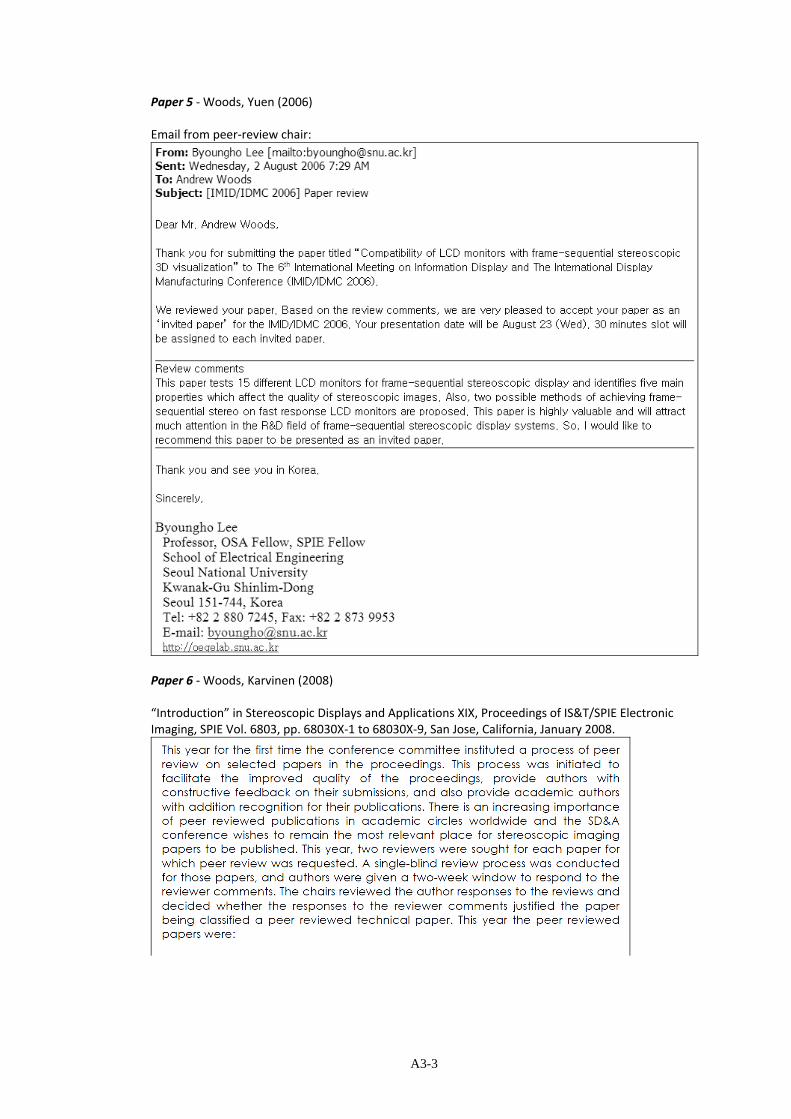
A3-3
Paper 5 ‐ Woods, Yuen (2006)
Email from peer‐review chair:
Paper 6 ‐ Woods, Karvinen (2008)
“Introduction” in Stereoscopic Displays and Applications XIX, Proceedings of IS&T/SPIE Electronic Imaging, SPIE Vol. 6803, pp. 68030X‐1 to 68030X‐9, San Jose, California, January 2008.

A3-4
Paper 7 ‐ Woods, Sehic (2009)
Email from peer‐review chair:
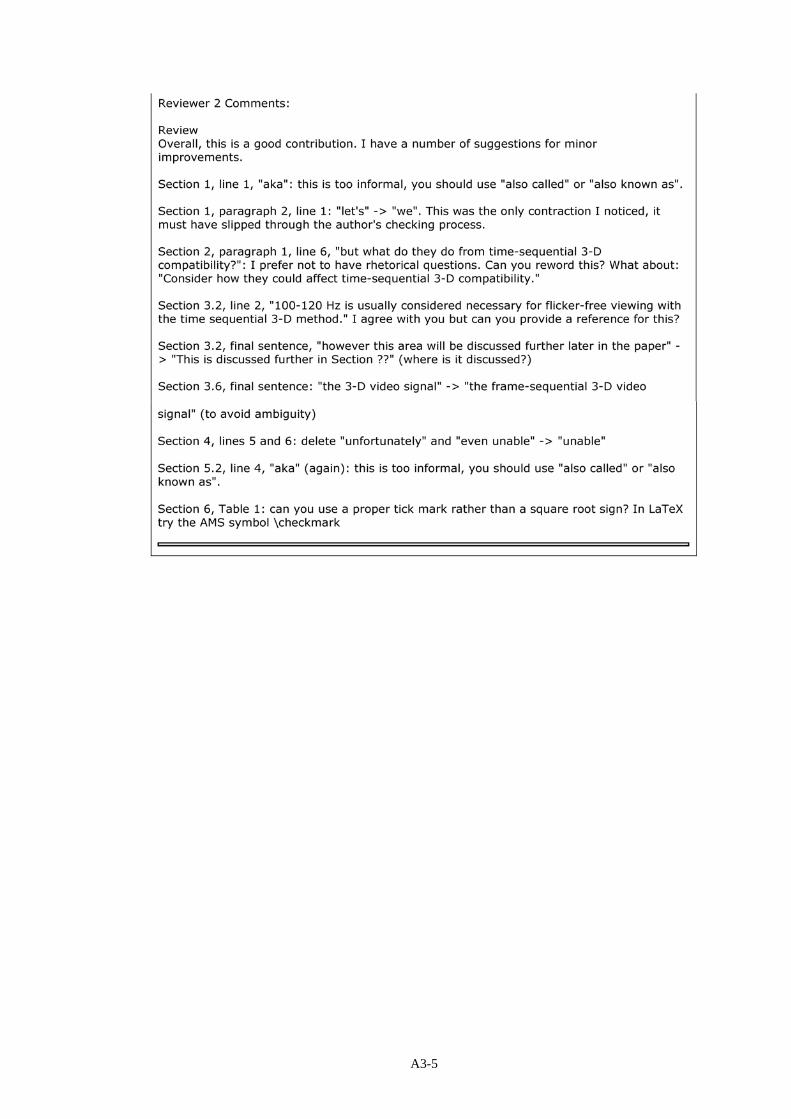
A3-5
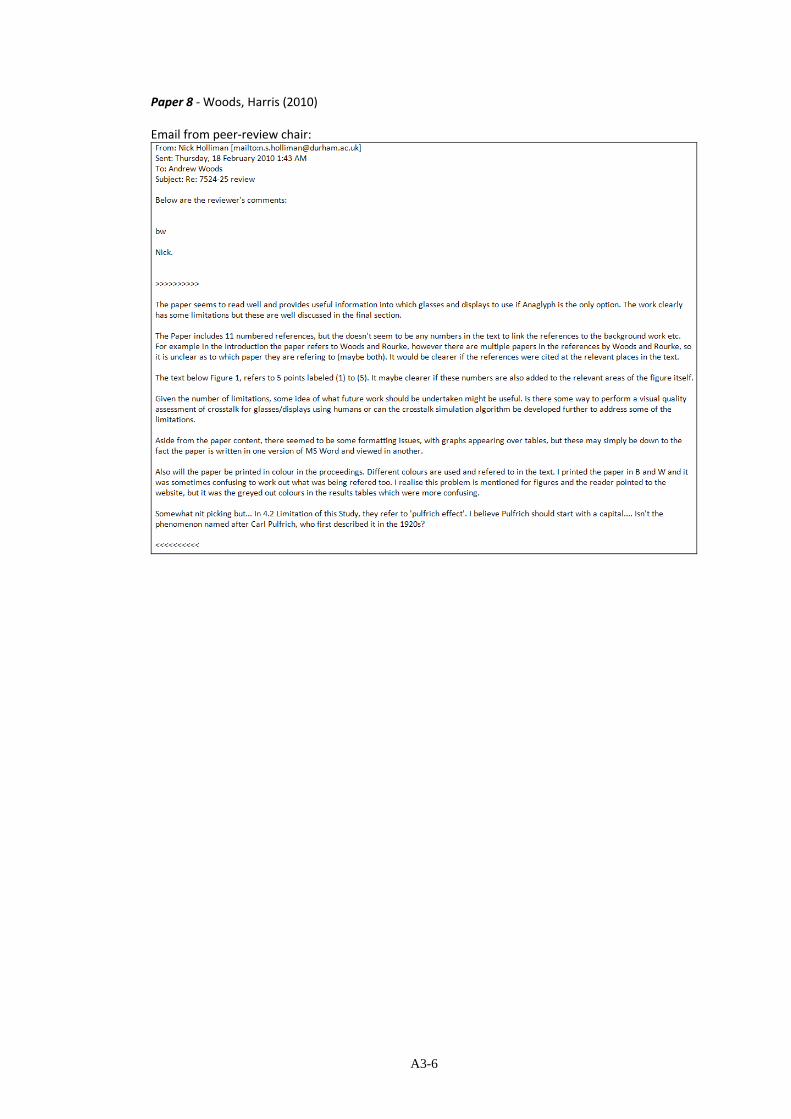
A3-6
Paper 8 ‐ Woods, Harris (2010)
Email from peer‐review chair:

A3-7
Paper 14 ‐ Woods (2009)
Email from special issue associate editor:
From: Brian Schowengerdt Sent: Wednesday, 27 May 2009 7:45 AM To: Andrew Woods Subject: Re: 3D Displays article for ID
Hi Andrew,
The article looks great! Thanks for putting it together under a tight time schedule.
You've presented a very nice cross‐section of the relevant technologies. I think the article could be passed along to the copy editors at this point, but I do have a few content‐related suggestions that you might consider before we pass it along.
1) Do you think it would be appropriate to include one or two figures and a couple of paragraphs summarizingyour findings from your two recent SD&A papers that tested the performance of commercially‐available 3D displays? I think that data would nicely compliment the higher‐level survey of 3D display options. Perhaps you prefer not to include that data because it's already been published, but if you omitted that element to keep the word count within bounds, I think we can be flexible there.
2) I like your bracketed recommendations for figures. In particular, the figures that present the general layoutof the technologies will be quite helpful, I think. The product pictures are less critical, in my view.
3) Currently, you discuss time‐sequential stereo on LCDs in two separate sections of your article. First, youmention the NVIDIA effort. Later, you discuss the problems with using conventional 2D‐market LCDs. I think it might be helpful to move the paragraph that discusses the NVIDIA effort, to place it directly behind the discussion of the challenges of using LCDs for time‐sequential stereo. That way, the logical flow would be 1) many people have LCDs now, so it is tempting to try to use them for stereo, 2) it turns out that LCDs that haven't been specifically engineered for stereo cannot be used successfully, 3) even the newer fast refresh rate LCDs have issues because they are hold‐type displays, 4) despite these challenges, some companies are working to enable 3D‐ready LCDs. NVIDIA has spearheaded an effort, mostly for the 3D gaming market, while Samsung, Toshiba, and others are demonstrating solutions in the lab (but it is unclear how long it will take to transition them to commercial products).
4) As a follow‐on to the above suggestion, you might consider a general merging of your "3D Displays in theHome" section with your "Can I use my existing home TV for 3D purposes?" section, into a single section that surveys the relevant display technologies (both those marketed for 3D applications and those not). This would allow you to group discussions by technology. E.g., regarding plasma TVs, you could start with your paragraph that conventional plasma displays can't be used successfully for stereo, and follow it with your paragraph about the special Samsung plasma television that overcomes limitation of conventional plasmas.
5) I have mixed feelings about the paragraph on the Infitec/Dolby glasses. It might be more detail than isnecessary for this 3D home entertainment oriented article. I think it may be sufficient to state that the Dolby glasses are incompatible with all current Home 3D displays. If you would prefer to leave it in, then it might be helpful to expand the discussion to include the possibility of future Dolby‐compatible displays. A custom 6‐color LCD color filter could be used to create two separate RGB sets for LCD panels, and I recall seeing DLP‐based displays that used more than 3 color primaries (I've found some papers out of Samsung on multi‐primary displays. Mitsubishi might have also done some work in this area).
The editors are currently reviewing the article by Bill Zou, so I think we are ok for time. If any of my suggestions resonate, or if you would like to make any other revisions, I think a week would be fine‐‐though of course the sooner, the better.
Thanks again,
Brian

A3-8
Paper 17 ‐ Woods, Helliwell (2012)
Email from peer‐review chair:
Paper 18 – Woods (2013)
Journal of European Science Editing
http://www.ease.org.uk/sites/default/files/ese_instructions_for_authors_june_2012.pdf
A3-9
Statement of independence between manager of the peer‐review process and the other conference chairs of the Stereoscopic Displays and Applications conference for Paper 6, Paper 7, Paper 8 and Paper 17:

A4-1
Appendix 4 – Copyright Permissions
A4-2
A4-3
Permission to include Paper 18 from European Science Editing journal by President of the European Association of Science Editing:
PERMISSION TO USE COPYRIGHT MATERIAL AS SPECIFIED BELOW:
A. J. Woods (2013) “3D or 3-D: a study of terminology, usage and style” European ScienceEditing, 39(3), pp. 59-62, August 2013.
I hereby give permission for Andrew Woods to include the below‐mentioned materials in his doctoral thesis for Curtin University of Technology, and to communicate this material via the Australasian Digital Thesis Program. This permission is granted on a non‐exclusive basis and for an indefinite period.
I confirm that EASE is the copyright owner of the specified materials.
Permission to use this material is subject to the following conditions: [Delete if not applicable]
Signed: Joan Marsh
Name: Joan Marsh Position: EASE President Date: 16th October 2013
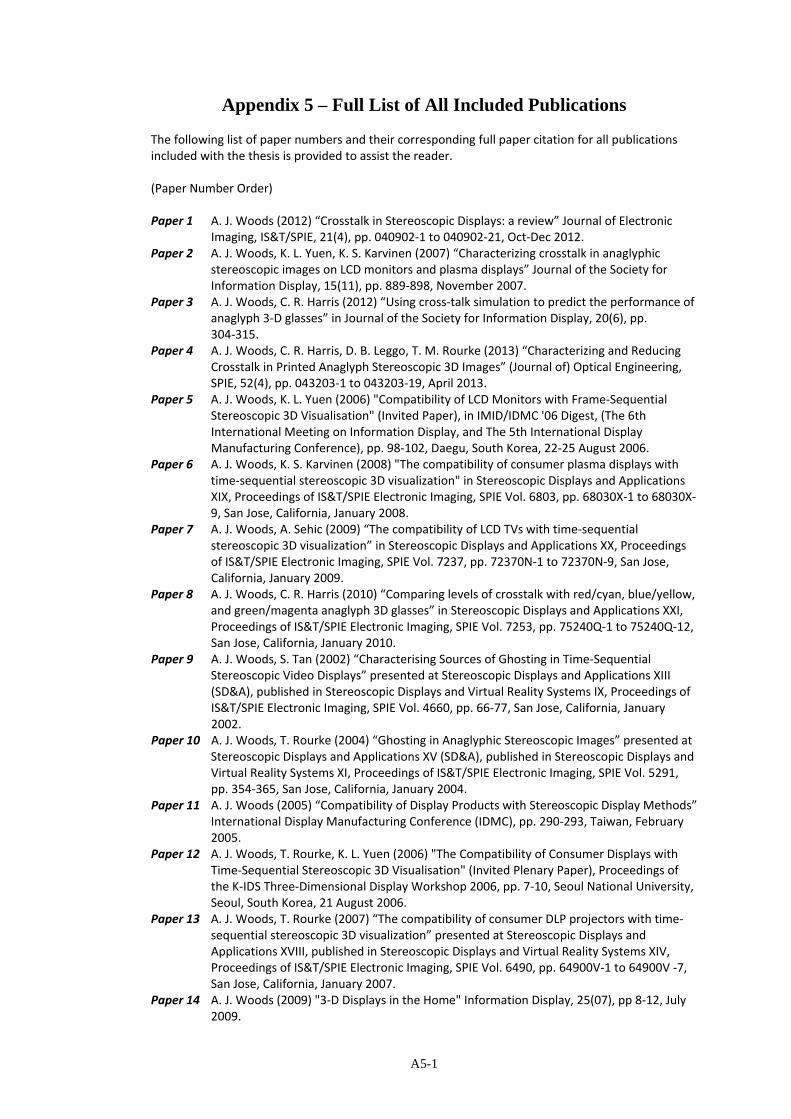
A5-1
Appendix 5 – Full List of All Included Publications
The following list of paper numbers and their corresponding full paper citation for all publications included with the thesis is provided to assist the reader.
(Paper Number Order)
Paper 1 A. J. Woods (2012) “Crosstalk in Stereoscopic Displays: a review” Journal of Electronic Imaging, IS&T/SPIE, 21(4), pp. 040902‐1 to 040902‐21, Oct‐Dec 2012.
Paper 2 A. J. Woods, K. L. Yuen, K. S. Karvinen (2007) “Characterizing crosstalk in anaglyphic stereoscopic images on LCD monitors and plasma displays” Journal of the Society for Information Display, 15(11), pp. 889‐898, November 2007.
Paper 3 A. J. Woods, C. R. Harris (2012) “Using cross‐talk simulation to predict the performance of anaglyph 3‐D glasses” in Journal of the Society for Information Display, 20(6), pp. 304‐315.
Paper 4 A. J. Woods, C. R. Harris, D. B. Leggo, T. M. Rourke (2013) “Characterizing and Reducing Crosstalk in Printed Anaglyph Stereoscopic 3D Images” (Journal of) Optical Engineering, SPIE, 52(4), pp. 043203‐1 to 043203‐19, April 2013.
Paper 5 A. J. Woods, K. L. Yuen (2006) "Compatibility of LCD Monitors with Frame‐Sequential Stereoscopic 3D Visualisation" (Invited Paper), in IMID/IDMC '06 Digest, (The 6th International Meeting on Information Display, and The 5th International Display Manufacturing Conference), pp. 98‐102, Daegu, South Korea, 22‐25 August 2006.
Paper 6 A. J. Woods, K. S. Karvinen (2008) "The compatibility of consumer plasma displays with time‐sequential stereoscopic 3D visualization" in Stereoscopic Displays and Applications XIX, Proceedings of IS&T/SPIE Electronic Imaging, SPIE Vol. 6803, pp. 68030X‐1 to 68030X‐9, San Jose, California, January 2008.
Paper 7 A. J. Woods, A. Sehic (2009) “The compatibility of LCD TVs with time‐sequential stereoscopic 3D visualization” in Stereoscopic Displays and Applications XX, Proceedings of IS&T/SPIE Electronic Imaging, SPIE Vol. 7237, pp. 72370N‐1 to 72370N‐9, San Jose, California, January 2009.
Paper 8 A. J. Woods, C. R. Harris (2010) “Comparing levels of crosstalk with red/cyan, blue/yellow, and green/magenta anaglyph 3D glasses” in Stereoscopic Displays and Applications XXI, Proceedings of IS&T/SPIE Electronic Imaging, SPIE Vol. 7253, pp. 75240Q‐1 to 75240Q‐12, San Jose, California, January 2010.
Paper 9 A. J. Woods, S. Tan (2002) “Characterising Sources of Ghosting in Time‐Sequential Stereoscopic Video Displays” presented at Stereoscopic Displays and Applications XIII (SD&A), published in Stereoscopic Displays and Virtual Reality Systems IX, Proceedings of IS&T/SPIE Electronic Imaging, SPIE Vol. 4660, pp. 66‐77, San Jose, California, January 2002.
Paper 10 A. J. Woods, T. Rourke (2004) “Ghosting in Anaglyphic Stereoscopic Images” presented at Stereoscopic Displays and Applications XV (SD&A), published in Stereoscopic Displays and Virtual Reality Systems XI, Proceedings of IS&T/SPIE Electronic Imaging, SPIE Vol. 5291, pp. 354‐365, San Jose, California, January 2004.
Paper 11 A. J. Woods (2005) “Compatibility of Display Products with Stereoscopic Display Methods” International Display Manufacturing Conference (IDMC), pp. 290‐293, Taiwan, February 2005.
Paper 12 A. J. Woods, T. Rourke, K. L. Yuen (2006) "The Compatibility of Consumer Displays with Time‐Sequential Stereoscopic 3D Visualisation" (Invited Plenary Paper), Proceedings of the K‐IDS Three‐Dimensional Display Workshop 2006, pp. 7‐10, Seoul National University, Seoul, South Korea, 21 August 2006.
Paper 13 A. J. Woods, T. Rourke (2007) “The compatibility of consumer DLP projectors with time‐sequential stereoscopic 3D visualization” presented at Stereoscopic Displays and Applications XVIII, published in Stereoscopic Displays and Virtual Reality Systems XIV, Proceedings of IS&T/SPIE Electronic Imaging, SPIE Vol. 6490, pp. 64900V‐1 to 64900V ‐7, San Jose, California, January 2007.
Paper 14 A. J. Woods (2009) "3‐D Displays in the Home" Information Display, 25(07), pp 8‐12, July 2009.
A5-2
Paper 15 M. A. Weissman, A. J. Woods (2011) “A simple method for measuring crosstalk in stereoscopic displays” Stereoscopic Displays and Applications XXII, Proceedings of IS&T/SPIE Electronic Imaging, SPIE Vol. 7863, pp. 786310‐1 to ‐11, Burlingame, California, January 2011.
Paper 16 A. J. Woods (2011) “How are crosstalk and ghosting defined in the stereoscopic literature?” Stereoscopic Displays and Applications XXII, Proceedings of IS&T/SPIE Electronic Imaging, SPIE Vol. 7863, pp. 78630Z‐1 to 78630Z‐12, Burlingame, California, January 2011.
Paper 17 A. J. Woods, J. Helliwell (2012) “Investigating the cross‐compatibility of IR‐controlled active shutter glasses” Stereoscopic Displays and Applications XXIII, Proceedings of IS&T/SPIE Electronic Imaging, SPIE Vol. 8288, pp. 82881C‐1 to 82881C‐10, Burlingame, California, January 2012.
Paper 18 A. J. Woods, (2013) “3D or 3‐D: A study of terminology, usage and style” European Science Editing, 39(3), pp. 59‐62, August 2013.

A5-3
(Chronological Order)
Paper 9 A. J. Woods, S. Tan (2002) “Characterising Sources of Ghosting in Time‐Sequential Stereoscopic Video Displays” presented at Stereoscopic Displays and Applications XIII (SD&A), published in Stereoscopic Displays and Virtual Reality Systems IX, Proceedings of IS&T/SPIE Electronic Imaging, SPIE Vol. 4660, pp. 66‐77, San Jose, California, January 2002.
Paper 10 A. J. Woods, T. Rourke (2004) “Ghosting in Anaglyphic Stereoscopic Images” presented at Stereoscopic Displays and Applications XV (SD&A), published in Stereoscopic Displays and Virtual Reality Systems XI, Proceedings of IS&T/SPIE Electronic Imaging, SPIE Vol. 5291, pp. 354‐365, San Jose, California, January 2004.
Paper 11 A. J. Woods (2005) “Compatibility of Display Products with Stereoscopic Display Methods” International Display Manufacturing Conference (IDMC), pp. 290‐293, Taiwan, February 2005.
Paper 12 A. J. Woods, T. Rourke, K. L. Yuen (2006) "The Compatibility of Consumer Displays with Time‐Sequential Stereoscopic 3D Visualisation" (Invited Plenary Paper), Proceedings of the K‐IDS Three‐Dimensional Display Workshop 2006, pp. 7‐10, Seoul National University, Seoul, South Korea, 21 August 2006.
Paper 5 A. J. Woods, K. L. Yuen (2006) "Compatibility of LCD Monitors with Frame‐Sequential Stereoscopic 3D Visualisation" (Invited Paper), in IMID/IDMC '06 Digest, (The 6th International Meeting on Information Display, and The 5th International Display Manufacturing Conference), pp. 98‐102, Daegu, South Korea, 22‐25 August 2006.
Paper 13 A. J. Woods, T. Rourke (2007) “The compatibility of consumer DLP projectors with time‐sequential stereoscopic 3D visualization” presented at Stereoscopic Displays and Applications XVIII, published in Stereoscopic Displays and Virtual Reality Systems XIV, Proceedings of IS&T/SPIE Electronic Imaging, SPIE Vol. 6490, pp. 64900V‐1 to 64900V ‐7, San Jose, California, January 2007.
Paper 2 A. J. Woods, K. L. Yuen, K. S. Karvinen (2007) “Characterizing crosstalk in anaglyphic stereoscopic images on LCD monitors and plasma displays” Journal of the Society for Information Display, 15(11), pp. 889‐898, November 2007.
Paper 6 A. J. Woods, K. S. Karvinen (2008) "The compatibility of consumer plasma displays with time‐sequential stereoscopic 3D visualization" in Stereoscopic Displays and Applications XIX, Proceedings of IS&T/SPIE Electronic Imaging, SPIE Vol. 6803, pp. 68030X‐1 to 68030X‐9, San Jose, California, January 2008.
Paper 7 A. J. Woods, A. Sehic (2009) “The compatibility of LCD TVs with time‐sequential stereoscopic 3D visualization” in Stereoscopic Displays and Applications XX, Proceedings of IS&T/SPIE Electronic Imaging, SPIE Vol. 7237, pp. 72370N‐1 to 72370N‐9, San Jose, California, January 2009.
Paper 14 A. J. Woods (2009) "3‐D Displays in the Home" Information Display, 25(07), pp 8‐12, July 2009.
Paper 8 A. J. Woods, C. R. Harris (2010) “Comparing levels of crosstalk with red/cyan, blue/yellow, and green/magenta anaglyph 3D glasses” in Stereoscopic Displays and Applications XXI, Proceedings of IS&T/SPIE Electronic Imaging, SPIE Vol. 7253, pp. 75240Q‐1 to 75240Q‐12, San Jose, California, January 2010.
Paper 15 M. A. Weissman, A. J. Woods (2011) “A simple method for measuring crosstalk in stereoscopic displays” Stereoscopic Displays and Applications XXII, Proceedings of IS&T/SPIE Electronic Imaging, SPIE Vol. 7863, pp. 786310‐1 to ‐11, Burlingame, California, January 2011.
Paper 16 A. J. Woods (2011) “How are crosstalk and ghosting defined in the stereoscopic literature?” Stereoscopic Displays and Applications XXII, Proceedings of IS&T/SPIE Electronic Imaging, SPIE Vol. 7863, pp. 78630Z‐1 to 78630Z‐12, Burlingame, California, January 2011.
Paper 17 A. J. Woods, J. Helliwell (2012) “Investigating the cross‐compatibility of IR‐controlled active shutter glasses” Stereoscopic Displays and Applications XXIII, Proceedings of IS&T/SPIE Electronic Imaging, SPIE Vol. 8288, pp. 82881C‐1 to 82881C‐10, Burlingame, California, January 2012.
A5-4
Paper 3 A. J. Woods, C. R. Harris (2012) “Using cross‐talk simulation to predict the performance of anaglyph 3‐D glasses” in Journal of the Society for Information Display, 20(6), pp. 304‐315.
Paper 1 A. J. Woods (2012) “Crosstalk in Stereoscopic Displays: a review” Journal of Electronic Imaging, IS&T/SPIE, 21(4), pp. 040902‐1 to 040902‐21, Oct‐Dec 2012.
Paper 4 A. J. Woods, C. R. Harris, D. B. Leggo, T. M. Rourke (2013) “Characterizing and Reducing Crosstalk in Printed Anaglyph Stereoscopic 3D Images” (Journal of) Optical Engineering, SPIE, 52(4), pp. 043203‐1 to 043203‐19, April 2013.
Paper 18 A. J. Woods, (2013) “3D or 3‐D: A study of terminology, usage and style” European Science Editing, 39(3), pp. 59‐62, August 2013.
A5-5
(Alphabetical Order by Title) Paper 18 A. J. Woods (2013) “3D or 3‐D: A study of terminology, usage and style”, European
Science Editing, 39(3), pp. 59‐62, August 2013. [REFEREED JOURNAL PAPER] Paper 14 A. J. Woods (2009) "3‐D Displays in the Home" Information Display, 25(07), pp 8‐12, July
2009. [REVIEWED ARTICLE] Paper 15 M. A. Weissman, A. J. Woods (2011) “A simple method for measuring crosstalk in
stereoscopic displays” in Stereoscopic Displays and Applications XXII, Proceedings of IS&T/SPIE Electronic Imaging, SPIE Vol. 7863, pp. 786310‐1 to ‐11, Burlingame, California, January 2011. [NON‐REFEREED CONFERENCE PAPER]
Paper 5 A. J. Woods, K. L. Yuen (2006) "Compatibility of LCD Monitors with Frame‐Sequential Stereoscopic 3D Visualisation" (Invited Paper), in IMID/IDMC '06 Digest, (The 6th International Meeting on Information Display, and The 5th International Display Manufacturing Conference), pp. 98‐102, Daegu, South Korea, 22‐25 August 2006.
Paper 9 A. J. Woods, S. Tan (2002) “Characterising Sources of Ghosting in Time‐Sequential Stereoscopic Video Displays” presented at Stereoscopic Displays and Applications XIII (SD&A), published in Stereoscopic Displays and Virtual Reality Systems IX, Proceedings of IS&T/SPIE Electronic Imaging, SPIE Vol. 4660, pp. 66‐77, San Jose, California, January 2002. [NON REFEREED CONFERENCE PAPER]
Paper 4 A. J. Woods, C. R. Harris, D. B. Leggo, T. M. Rourke (2013) “Characterizing and Reducing Crosstalk in Printed Anaglyph Stereoscopic 3D Images” (Journal of) Optical Engineering, SPIE, 52(4), pp. 043203‐1 to 043203‐19, April 2013.
Paper 2 A. J. Woods, K. L. Yuen, K. S. Karvinen (2007) “Characterizing crosstalk in anaglyphic stereoscopic images on LCD monitors and plasma displays” Journal of the Society for Information Display, 15(11), pp. 889‐898, November 2007.
Paper 8 A. J. Woods, C. R. Harris (2010) “Comparing levels of crosstalk with red/cyan, blue/yellow, and green/magenta anaglyph 3D glasses” in Stereoscopic Displays and Applications XXI, Proceedings of IS&T/SPIE Electronic Imaging, SPIE Vol. 7253, pp. 75240Q‐1 to 75240Q‐12, San Jose, California, January 2010.
Paper 11 A. J. Woods (2005) “Compatibility of Display Products with Stereoscopic Display Methods” International Display Manufacturing Conference (IDMC), pp. 290‐293, Taiwan, February 2005. [NON‐REFEREED CONFERENCE PAPER]
Paper 1 A. J. Woods (2012) “Crosstalk in Stereoscopic Displays: a review” Journal of Electronic Imaging, IS&T/SPIE, 21(4), pp. 040902‐1 to 040902‐21, Oct‐Dec 2012.
Paper 10 A. J. Woods, T. Rourke (2004) “Ghosting in Anaglyphic Stereoscopic Images” presented at Stereoscopic Displays and Applications XV (SD&A), published in Stereoscopic Displays and Virtual Reality Systems XI, Proceedings of IS&T/SPIE Electronic Imaging, SPIE Vol. 5291, pp. 354‐365, San Jose, California, January 2004. [NON‐REFEREED CONFERENCE PAPER]
Paper 16 A. J. Woods (2011) “How are crosstalk and ghosting defined in the stereoscopic literature?” in Stereoscopic Displays and Applications XXII, Proceedings of IS&T/SPIE Electronic Imaging, SPIE Vol. 7863, pp. 78630Z‐1 to ‐12, Burlingame, California, January 2011. [NON‐REFEREED CONFERENCE PAPER]
Paper 17 A. J. Woods, J. Helliwell (2012) “Investigating the cross‐compatibility of IR‐controlled active shutter glasses” in Stereoscopic Displays and Applications XXIII, Proceedings of IS&T/SPIE Electronic Imaging, SPIE Vol. 8288, pp. 82881C‐1 to ‐10, Burlingame, California, January 2012. [REFEREED CONFERENCE PAPER]
Paper 12 A. J. Woods, T. Rourke, K. L. Yuen (2006) "The Compatibility of Consumer Displays with Time‐Sequential Stereoscopic 3D Visualisation" (Plenary Paper), in Proceedings of the K‐IDS Three‐Dimensional Display Workshop 2006, pp. 7‐10, Seoul National University, Seoul, South Korea, 21 August 2006. [NON‐REFEREED CONFERENCE PAPER]
Paper 13 A. J. Woods, T. Rourke (2007) “The compatibility of consumer DLP projectors with time‐sequential stereoscopic 3D visualization”, presented at Stereoscopic Displays and Applications XVIII, published in Stereoscopic Displays and Virtual Reality Systems XIV, Proceedings of IS&T/SPIE Electronic Imaging, SPIE Vol. 6490, pp. 64900V‐1 to ‐7, San Jose, California, January 2007. [NON‐REFEREED CONFERENCE PAPER]
A5-6
Paper 7 A. J. Woods, A. Sehic (2009) “The compatibility of LCD TVs with time‐sequential stereoscopic 3D visualization” in Stereoscopic Displays and Applications XX, Proceedings of IS&T/SPIE Electronic Imaging, SPIE Vol. 7237, pp. 72370N‐1 to 72370N‐9, San Jose, California, January 2009.
Paper 6 A. J. Woods, K. S. Karvinen (2008) "The compatibility of consumer plasma displays with time‐sequential stereoscopic 3D visualization" in Stereoscopic Displays and Applications XIX, Proceedings of IS&T/SPIE Electronic Imaging, SPIE Vol. 6803, pp. 68030X‐1 to 68030X‐9, San Jose, California, January 2008.
Paper 3 A. J. Woods, C. R. Harris (2012) “Using cross‐talk simulation to predict the performance of anaglyph 3‐D glasses” in Journal of the Society for Information Display, 20(6), pp. 304‐315.
Related Documents