Crossley, Richard James (2011) Characterisation of track for automated tape laying. PhD thesis, University of Nottingham. Access from the University of Nottingham repository: http://eprints.nottingham.ac.uk/13983/1/546293.pdf Copyright and reuse: The Nottingham ePrints service makes this work by researchers of the University of Nottingham available open access under the following conditions. · Copyright and all moral rights to the version of the paper presented here belong to the individual author(s) and/or other copyright owners. · To the extent reasonable and practicable the material made available in Nottingham ePrints has been checked for eligibility before being made available. · Copies of full items can be used for personal research or study, educational, or not- for-profit purposes without prior permission or charge provided that the authors, title and full bibliographic details are credited, a hyperlink and/or URL is given for the original metadata page and the content is not changed in any way. · Quotations or similar reproductions must be sufficiently acknowledged. Please see our full end user licence at: http://eprints.nottingham.ac.uk/end_user_agreement.pdf A note on versions: The version presented here may differ from the published version or from the version of record. If you wish to cite this item you are advised to consult the publisher’s version. Please see the repository url above for details on accessing the published version and note that access may require a subscription. For more information, please contact [email protected]

Welcome message from author
This document is posted to help you gain knowledge. Please leave a comment to let me know what you think about it! Share it to your friends and learn new things together.
Transcript

Crossley, Richard James (2011) Characterisation of track for automated tape laying. PhD thesis, University of Nottingham.
Access from the University of Nottingham repository: http://eprints.nottingham.ac.uk/13983/1/546293.pdf
Copyright and reuse:
The Nottingham ePrints service makes this work by researchers of the University of Nottingham available open access under the following conditions.
· Copyright and all moral rights to the version of the paper presented here belong to
the individual author(s) and/or other copyright owners.
· To the extent reasonable and practicable the material made available in Nottingham
ePrints has been checked for eligibility before being made available.
· Copies of full items can be used for personal research or study, educational, or not-
for-profit purposes without prior permission or charge provided that the authors, title and full bibliographic details are credited, a hyperlink and/or URL is given for the original metadata page and the content is not changed in any way.
· Quotations or similar reproductions must be sufficiently acknowledged.
Please see our full end user licence at: http://eprints.nottingham.ac.uk/end_user_agreement.pdf
A note on versions:
The version presented here may differ from the published version or from the version of record. If you wish to cite this item you are advised to consult the publisher’s version. Please see the repository url above for details on accessing the published version and note that access may require a subscription.
For more information, please contact [email protected]
The University of
Nottingham
University of Nottingham
Polymer Composites Group
Division of Materials, Mechanics and Structures
Faculty of Engineering
Characterisation of Tack for Automated Tape Laying
January 2011
By
Richard James CrossleyMEng. (Hons.)
GEORGE GREEN LIBRARY OFSCIENCE AND ENGINEERING
Thesis submitted to the University of Nottingham for the degree of Doctor of Philosophy
Abstract
Automated Tape Laying (ATl) trials using low cost wind energy suitable material and
mould tools have been conducted. New materials proved problematic during ATllay-up
and observations of the ATl processshow that the prepreg tack and stiffness properties
significantly affect lay-up performance. Prepreg tack has not been widely researched
within the composites industry due to the absence of a standardised method for
characterisation. A new tack and stiffness test has therefore been developed which is
representative of the ATl process.The new test was used to investigate the responseto
process and material variables. Two failure modes were observed and compared to
those found in Pressure Sensitive Adhesives (PSA). Failure modes are associated with
the viscoelastic stiffness of the resin. High stiffness appears to result In interfacial failure
turning to cohesive failure when stiffness is reduced. A peak in tack is observed to
correspond with the transition In failure mode leading to the conclusion that prepreg
tack Is the result of a chain system rather than a single property. The chain system
consists of an interface and bulk components each having individual time and physical
variable dependant properties.
Tack and stiffness Is shown to conform to the Williams-Landel-Ferry (WlF) tlme-
temperature superposition principle for both cohesive and interfacial failure modes.
Cohesive viscoelastic and surface energy interface failure mechanisms may be
theoretically linked via the lennard-Jones energy well with molecular jumps triggered
by thermal vibrations. This analogy allows both failure phenomenon to simultaneously
follow the time temperature superposition principle and is typically demonstrated in U
dynamic mechanical modelling. The theoretical analogy is used in the explanation of
experimental results where tack is essentially thought of as a low energy non-covalent
molecular bond or reaction.
The experimental technique developed here could allow for the standardisation of tack
and stiffness specification for manufacturers. The application of results to ATl
production Is explored and demonstrated using ATl equipment. The results show that
optimum lay-up conditions may be explored offline using the new tack and stiffness
test. Results also show promising signs that the WlF relationship could be exploited to
greatly Increase lay-up speed and consistency, increasing the attractiveness of the
process to wind turbine blade manufacturers. A theoretical results curve Is also
presented which may allow manufacturers to determine the effect of changes in surface
conditions and resin properties on tack.
R J Crossley 2
Acknowledgements
The author would like to thank his academic supervisors Dr Peter Schubel and Professor
Nick Warrior for their advice and support during this work and Dr Davlde De Focatlls for
his guidance and interest.
I would also like to thank all the partners of the Affordable Innovative Rapid Production
of Wind Energy Rotor-blades (AIRPOWER) project under which this work was carried
out. The AIRPOWER project was co-funded by the Technology Strategy Board's
Collaborative Research and Development program, following open competition.
The Technology Strategy Board is an executive body established by the Government to
drive Innovation. It promotes and invests in research, development and the exploitation
of science, technology and new ideas for the benefit of business. Increasing sustainable
economic growth In the UK and improving quality of life. For more information visit
www.innovateuk.org
I would also like to thank my. partner Ruth Elmer for all her support and
encouragement.
R J Crossley 3
Nomenclature
Abbreviations
AFP
AIRPOWER
APL
ATL
ATW
BEM
BIAX
BPA
CFW
CSM
CTL
DC
DSC
FAW
FW
GFRP
GPC
HLU
LJ
OCA
PSAPU
PVC
RH
RIFT
SAOS
THF
TRIAX
TSB
TIS
UD
UV
VART
VF
VI
VOC
WBL
WE
WLF
R J Crossley
Automated Fibre Placement
Affordable Innovative Rapid Production of Offshore Wind Energy Rotor-blades
Automated Ply Lamination
Automated Tape Laying
Automated Tape Winding
Blade Element Momentum theory
BI-axial
Bisphenol-A
Continuous Filament Winding
Chopped Strand Mat
Contour Tape Laying
Dahlquist's Criterion
Differential scanning calorimetry
Fibre Areal weight
Filament Winding
Glass Fibre Reinforced Plastic
Gel Permeation Chromatography
Hand Lay-Up
Lennard-Jones two parameter molecular adhesion model
Occupational Contact Allergy
Pressure Sensitive Adhesives
Polyurethane
Poly Vinyl Chloride
Relative Humidity
Resin Infusion under Flexible Tooling
Small Amplitude Oscillatory Shear rheometry
Tetrahydrofuran
Tri-axial
Technology Strategy Board
Time Temperature Superposition
Unidirectional
Ultra Violet
Vacuum Assisted Resin Transfusion
Volume Fraction
Vacuum InfUSion
Volatile Organic Compound
Weak Boundary Layer
Wind Energy
Wllllams-Landel-Ferry time temperature superposition equation
4

Symbols
A Area [m2]
at Time shift /octor (WLF)
b Tape width [mm]
Cl WLFconstant
Cl WLFconstant
E Young's Modulus [GPa]
E. activation energy [kJ/mol]
Fp Average peel/orce [N]
F Force [N]
G Work of adhesion [J/m2]
G' Shear storage modulus [Pa]
Gil Shear loss modulus [Pa]
h Layer thickness [mm]
Mn Number average molecular weight [g/mol]
Mw Weight average molecular weight [g/mol]
p pressure [MPa]
P peel Resistance [N/mm]
P Polydisperslty
R Universal gas constant [J/mol KJRa Surface roughness average [j.U1l]
RH Relative humidity [%]
S Shear stress [N/m2]
T Temperature [-e]
To Reference temperature [-e]
T. Gloss transition temperature (-e]
V Separation velocity [mm/mln]
Wedh Work of adhesion [J/m2]
Z Extension [mm]
E Strain
1'1 Viscosity [MPas]
p Density [kg/m5]
0 Standard deviation
0 Tensile strength (MPa]
CAl Frequency [Rad/s]
i Strain rate [5.1]
is Phose angle n
R J Crossley 5
Contents
~1Js;trCl~ • • • • • • • • • • • • • • • • • • • • • • • • • • • • • • • • • • • • • • • • • • • • • • • • • •• • • • • • • • • • • • • • • • • • • • • • • • • • • • • • • • • • • • •:2
Acknowledgements • • • • •11• • • • • II • • • • 11• • • • • 11• • • • • • • • • • • • • • • II. II • • 11• • • • • • • • • • • • •• 11• • •3
~()I11E!I1c:ICltlJrt!• • • • • • • • • • • • • • • • • • • • • • • • • • • • • • • • • • • • • • • • • • • • • • • • • •• • • • • • • • • • • • • • • • • • • • • • • • • • • • •~
1 Introdu~lon 91.11.2
Turbine bladeTurbine blade
1.2.11.2.21.2.3
design • • • • • • • • • • • • • • • • • • • • • • • • • • • • • • • • • • • • • • • • • • • • • • • • • •• • • • • • • • • • • • • • • • • • • • • • • • • •1111
cl4!II1IlI1c1 • • • • • • • • • • • • • • • • • • • • • • • • • • • • • • • • • • • • • • • • • • • • • • • • • •• • • • • • • • • • • • • • • • • • • • • • • • • • ~
Size • • .• • .• • • .• • .• • .• • • • • • • .• .• • • • • • • • • • • • • • • .• • • • .• • ..• • ..• • .• • • • .• •• • • • • .• • • .• • .• • • • • ..• ..• • •Geometry ...................................• .• .• .....• .• ....• ..• • ...• ..• • • • .• .• .• • .• • ...• .•12Materials 13
1.31.41.51.6
Existing production methods • • • • • • • • • • • • • • • • • • • • • • • • • • • • • • • • • • • • • • • • • • • • • • • •• • • • • • • • • • • • • • • •20Automated forming processes • • • • • • • • • • • • • • • • • • • • • • • • • • • • • • • • • • • • • • • • • • • • • • • •• • • • • • • • • • • • • •25Aim. and objectlve • • • • • • • • • • • • • • • • • • • • • • • • • • • • • • • • • • • • • • • • • • • • • • • •• • • • • • • • • • • • • • • • • • • • • • • • • • • • • • •30Theme of thl. work • • • • • • • • • • • • • • • • • • • • • • • • • • • • • • • • • • • • • • • • • • • • • • •• • • • • • • • • • • • • • • • • • • • • • • • • • • • • • • •31
2 Literature review • • • • • • • • • • • • • • • • • • • • • • • • • • • • • • • • • • • • • • • • • • • • • • • • •• • • • • • • • • • • • • • • • •322.1 Pr.pr.g materials • .• • .........• ......• • .• .• • .• • • .• • ......• • ...• .............• ..• ..• .• • • • .........•32
2.1.1 Production...................................................• ....................• ......... 322.1.2 Speclflcationand supply ...............................• .......................• .• ..... 332.1.3 Resinchemistry and cure 36Automated tape laying • • • • • • • • • • • • • • • • • • • • • • • • • • • • • • • • • • • • • • • • • • • • • • • •• • • • • • • • • • • • • • • • • • • • • • • • •37Preprag flexural rigidity • • • • • • • • • • • • • • • • • • • • • • • • • • • • • • • • • • • • • • • • • • • • • • • •• • • • • • • • • • • • • • • • • • • • • • •40Prepr_g tack • • • • • • • • • • • • • • • • • • • • • • • • • • • • • • • • • • • • • • • • • • • • • • • • •• • • • • • • • • • • • • • • • • • • • • •,• • • • • • • • • • • • • • • • •41
2.4.1 Deflnition............................................• ............................• .......... 412.4.2 Commercialcharacterisation 422.4.3 Experimentalcharacterisation....................................................• ... 43
Pressure sensitive adhesives • • • • • • • • • • • • • • • • • • • • • • • • • • • • • • • • • • • • • • • • • • • • • • • •• • • • • • • • • • • • • • • •44
2.22.32.4
2.5
2.62.72.8
2.5.1 Probetesting..• ....................• ..............................................• ........ 442.5.2 Peel testing 532.5.3 Shear testing 63
FtI1.. .,I()II" • • • • • • • • • • • • • • • • • • • • • • • • • • • • • • • • • • • • • • • • • • • • • • • •• • • • • • • • • • • • • • • • • • • • • • • • • • • • • • • • • • • • • • • • • • • • • •ti~Adhesives theory • • • • • • • • • • • • • • • • • • • • • • • • • • • • • • • • • • • • • • • • • • • • • • • • •• • • • • • • • • • • • • • • • • • • • • • • • • • • • • • • • •6tPolymer melts • • • • • • • • • • • • • • • • • • • • • • • • • • • • • • • • • • • • • • • • • • • • • • • • •• • • • • • • • • • • • • • • • • • • • • • • • • • • • • • • • • • • • •71
2.8.1 Basicmolecularprinciples 712.8.2 Molecular description • • • • • • • • • • ...• .• ...• • .• • • • • • • • .• • • .• ..........• • • • • .• .....• .• • .• • • .•732.8.3 Melt behaviour ..............................................• ..............• ............... 742.8.4 Diffusion.........• ...................................................................• .• ..... 762.8.52.8.62.8.72.8.82.8.9
Time-temperature dependant behaviour 7678788081
Mathematical models ..• ...................• • • • ...• .......• .• • • ....• • • ..• ................Molecular adheslon ......• • • .......• .• ......• • • ....• ....• • • • .• ..• • • • • • • • • • • • • • .• • • • • • • • • .•Dynamic molecular modelllng .Molecular characterisation ...• .• .......• .• .• ..• .• • • • • • .• • .• • • .• • ..• • .• • • .• • • • • • • • .• • • .•
3 Experimental methodology • • • • • • • • • • • • • • • • • • • • • • • • • • • • • • • • • • • • • • • • • • • • • • • • •• •83
3.13.2
General approach • • • • • • • • • • • • • • • • • • • • • • • • • • • • • • • • • • • • • • • • • • • • • • • • •• • • • • • • • • • • • • • • • • • • • • • • • • • • • • • • •83ATL feasibility study • • • • • • • • • • • • • • • • • • • • • • • • • • • • • • • • • • • • • • • • • • • • • • • •• • • • • • • • • • • • • • • • • • • • • • • • • • • • •84
3.2.1 Materia/s........................................................................• • ........... 853.2.2Tack
3.3.13.3.2
3.3Equipment • • ..• • • • .• • ......• ..... ·..• .• .• • .• • ..• • • • .....• • ......• ..• • • • .• • .• • • .• • • • • • • • .• • • .• 85
andItlffne • • te.t • • • • • • • • • • • .• • • • • • • • • • • .• • • • • • • .• • • • • • • .• • • • • • • • • • .• • • •• • • • • • • • • • • • • • • • • .•888889
Operation • • • ..• • • .• • • • • .• • • • • • • • • .• • • • • • • .• • • • • • • .• .• • .• • • • • .• • • • .• • ..• •• .• • .• • • • • • • • • .• • • • •Equipment • ..• .• ....• ..• ...• ....• .• .....• .....• • • ...• ...• .......• .• ....• .......• ............
R J Crossley
3.43.5
3.3.3 Specimens 913.3.4 Accuracy.• ......• ..........................................................• .• • .• ..........• •913.3.5 Analysis...................• .................... ,.................• ........................... 933.3.6 Repeatability study ..........• ...........................• • .............................. 953.3.7 Controlling uncertainty .....• ...... , ,...................• ...............• .• . 96Commercial prepreg tack characterisation 99Effect of variables on tack and stiffness 101
3.5.13.5.2
Tackand stiffness tests ...................• • .1, • • • • • , • • • • • • • • 1, • • • • • • 1, • • • • • • • • • • • • • • •101Control of variables .• .• ...........• .......• .• .• .• • • • .• • .• • • • • ..• .• ......• • • • ...• .• • • • ...103
3.63.73.8
Rheology • • • • • • • • • • • • • • • • • • • • • • • • • • • • • • • • • • • • • • • • • • • • • • • • • •• • • • • • • • • • • • • • • • • • • • • • • • • • • • • • • • • • • • • • • • • •106Time temperature superposition Investigation 107ATL applicability study • • • • • • • • • • • • • • • • • • • • • • • • • • • • • • • • • • • • • • • • • • • • • • • •• • • • • • • • • • • • • • • • • • • • • • • •109
4 Results and observatlons 1124.14.2
ATLfeasibility trlal • • • • • • • • • • • • • .• • • • • • • • • • • • • • • • • • • • • • • • • • • • • • • • • • •• • • • • • • • • • • • • • • • • • • • • • • • • • • •112Commercial prepreg characterisation 117
4.2.1 Roll position effects ..................................• ....................• .• ......• .... 1174.2.2 Faceposition effects..............................• ..............• .• .....• .............. 1184.2.3 Overall characterisation.............................• .• ............................... 118Effect of tack variables • • • • • • • • • • • • • • • • • • • • • • • • • • • • • • • • • • • • • • • • • • • • • • •• • • • • • • • • • • • • • • • • • • • • • • •1204.3
Temperature ................• • .• ..........• .• • .• .......• • • • ...• .• • • • • • .• • • • • • • • • • ....• .• • • 120
4.44.5
4.3.14.3.24.3.34.3.44.3.54.3.64.3.74.3.84.3.94.3.104.3.114.3.124.3.13 Stiffness summary ....................• ......• ..• .................• ......• • • • • ....• • • .• .1394.3.14 Tacksummary 140
Rheology • • • • • • • • • • • • • • • • • • • • • • • • • • • • • • • • • • • • • • • • • • • • • • • • • •• • • • • • • • • • • • • • • • • • • • • • • • • • • • • • • • • • • • • • • • • •142.Time temperature superposition 143
4.5.1 Gel permeation chromatography 1434.5.2 Differential scanning calorimetry 1454.5.3 Rheology.......• .........................................................................• . 1454.5.4 Peeltestlng..........................................• .............• .....• • ............• .• . 148ATL applicability .tudy • • • • • • • • • • • • • • • • • • • • • • • • • • • • • • • • • • • • • • • • • • • • • • • •• • • • • • • • • • • • • • • • • • • • • • • •154
4.6.1 Prepreg tack in commercial conditions 1544.6.2 ATLtrials :......................................................• ...............• ...• ....... 157
Feed rate • ...• ......• .• .......• • .• ...• • ........• • • ..• .....• .• ....• • • • • • • .• • ..• • ....• • • • • .• • •123SurrBce roughness • ..• ...• .......• ....................• ......• ............• .• ........... 124Release agents • • • • • • .• • .....• ....• • • .• ...• .......• • • • • • ..• • • .• • • .• • .• ..• • • • • • • • • • .• ......127Compaction force .• .......• ....• • • • • • • • ..• • .• .• • ....• • • • .• • • • • • • .• • • .• • ..• .• ..• • • • • • ..• • . 128Surface material • • • • .• • .• • .• .• ...• .• .• • • , ,.....• . ,.. , ,........• ..• • • • ........ 130Contact temperature ,.........................................• ...........132Resin type , 133Fibre areal weight • • ...• • .• • .• ..• • • • ...• ..• • .• ...• .• .• • ...• ......• • • • • • • • ...• • • • ..• • • .• • • 134Fibre type ................................................................• ......• .......... 134Resin content , 136Fibre architecture • • ...• • • • • • ..• • • • ...• .• • • • .• .• . ,.• .• ....• • • .• • .• • .....• • • • • ...........• .137
4.6
5 Discussion • • • • • • • • • • • • • • • • • • • • • • • • • • • • • • • • • • • • • • • • • • • • • • • • • •• • • • • • • • • • • • • • • • • • • • • • • •1595.15.2
Tack and stlffne • • methodology • • • • • • • • • • • • • • • • • • • • • • • • • • • • • • • • • • • • • • • • • • • • •• • • • • • • • • • • •151Effect of variables on tack and stiffness 161
5.2.15.2.25.2.35.2.45.2.55.2.65.2.75.2.85.2.95.2.10
Temperature • • .• .• • • ....• • • ..• • ..• .• .....• • • • • • • ..• • • .• • • .• • • .• • • • • • • .• • • .• ..• • • ..• • • • • ..• 161Feed rate • • • • • • ....• ...• • • .• • • • • .• .• • • • • • • • ....• • ...• • • • .• • • • • • .• • • .• • • .• • • • • • •• • • .• • • • .• • • • 162Surface roughness • • .• .• .• • • • • .• • • • .• • .....• • • • • • • • .• • ..• .• .• • • .• • .• • • • • • . ,• • .• • • • ..• • •. 163Release agent .• • • • • • • • • ..• • • • • • • .• • • • .• • .• • ....• ..................• • • • .• ....• • • • • • • • • • • • • • 163Compaction force .• • • .• .• • • • ....• • ...• ..• • • • .• .......• ........• ...• ...• .....• • • ,• • • • ...• •164Surface type.......• ..• ...• ........• .• ..........• .• • • .............• • .• ..• ...• ..• .• ...• .• ...165Resin type..• .....• ...........................• .• ....• .....• ..• .• .....• .• ...• ...• .• ...• .• ...165Contact temperature 166FAW • .• • • • • • • • • • • • • • • • • • • • • • • • • • • • • • • • • • • • • • • • • • • • .• • • • •• • • • .• • • • • • • • • • • • • • • • • • • • • • • • • • • • • • • • •166Fibre type ......................................................................• ........... 167
R J Crossley 7

5.3
5.2.11 Resincontent , , 1695.2.12 Fibrearchitecture 170Time temperature superposition Investigation 171
5.3.1 DSC..............• .• ................................................................• ........ 1715.3.2 GPC• ......• • ..........• ................................• ...................• ..• ...• .• ..• ..... 1715.3.3 Rheology1, • • • • • • • • II II II II II • • • • • • • • • • • • • • • • • • II II II • • • II • • • • • • • • • • • •• • • • • • • • • • • • II II II I • • •1715.3.4 Tackand stiffness results 172Results Summary • • • • • • • • • • • • • • • • • • • • • • • • • • • • • • • • • • • • • • • • • • • • • • • • •• • • • • • • • • • • • • • • • • • • • • • • • • • • • • • •1735.4
Stiffness ... t • • • t • • • • • t. tt • • t • • • • t • • t. t • • t • • t. t. t • • • • t. t. t. t • • • • • • • t • • •• • • • • • t • • t • • t .t • • t.t. t173
5.55.6
5.4.15.4.25.4.3 Mo/ecu/ar theory • • • • • • • • .• • • .• • • ....• .• .• • • • • • .• .• • ...• .• • • • .......• ......• • • ....• • ...... 178Commercial prepreSi • • • • • • • • • • • • • • • • • • • • • • • • • • • • • • • • • • • • • • • • • • • • • • • • •• • • • • • • • • • • • • • • • • • • • • • • • • •182ATL feasibility and application 183
5.6.1 Performance observations .............................................• ....• .....• .• . 1835.6.25.6.3
Tack• .• .• • ..• ....• .• .• ..• • • • • .• • • • .• • • • • ....• ..• ....• ..• • ..• • • ..• • • • ....• • • ..• .• • .• • • ..• • ....• 173
Applicability results • ..• .• .....• ....• .• .......• ........• ............• .....• ...• • • • • ..• • • • 184Tape performance .................................................................• ..... 186
6 Conclusions • • • • • • • • • • • • • • • • • • • • • • • • • • • • • • • • • • • • • • •aa • • • • • • • • • • • • • • • • • • • • • • • • • • • • • • •189
6.1 Tack and .tlffn 1896.1.1 Method and observations .......................................• .................• .• . 1896.1.2 Variable effects ...................• .....• .....• ......• .• ....• .....................• .• ..• .. 1906.1.3 Time temperature superposition ..... II • • • II • • • 11 • • • • • • • • • • • • • • • • • • • • II • • • 11 • • • • • • •1926.1.4 Moleculartheory ......................................• ...........• ...........• ......• ... 192Prepr_g characterisation • • • • • • • • • • • • • • • • • • • • • • • • • • • • • • • • • • • • • • • • • • • • • • • • •• • • • • • • • • • • • • • • • • • •193ATL dev.lopment • • • • • • • • • • • • • • • • • • • • • • • • • • • • • • • • • • • • • • • • • • • • • • • • •• • • • • • • • • • • • • • • • • • • • • • • • • • • • • • •11:4
6.3.1 Feaslbllity .• .• .• .....• .• .• ...............• .......• • ....• ...• ...• .• • .• • • ..• • • • • • .• • • .• .• .• • • • 1946.3.2 Appllcation .....• ...• .........• .....• ..• • ........• .• ......• .• ....• .• • • • ....• • .• .• • • • ....• • • . 195Major conclusion • • • • • • • • • • • • • • • • • • • • • • • • • • • • • • • • • • • • • • • • • • • • • • • • •• • • • • • • • • • • • • • • • • • • • • • • • • • • • • • •19&
6.26.3
6.4
7 Recommendations and future work 199
7.17.27.3
Tack and .tlffne • • • • • • • • • • • • • • • • • • • • • • • • • • • • • • • • • • • • • • • • • • • • • • • •• • • • • • • • • • • • • • • • • • • • • • • • • • • • • • • • •199Prepreg • • • • • • • • • • • • • • • • • • • • • • • • • • • • • • • • • • • • • • • • • • • • • • • • • •• • • • • • • • • • • • • • • • • • • • • • • • • • • • • • • • • • • • • • • • • • • • •200~1rL. • • • • • • • • • • • • • • • • • • • • • • • • • • • • • • • • • • • • • • • • • • • • • • • • • •• • • • • • • • • • • • • • • • • • • • • • • • • • • • • • • • • • • • • • • • • • • • • • • • • • •:lc)CJ
~J)I)E!I1c1I)( • • • • • • • • • • • • • • • • • • • • • • • • • • • • • • • • • • • • • • • • • • • • • • • • • •• • • • • • • • • • • • • • • • • • • • • • • • • • • • • • • •:t():t
A. Publications arising from this thesis 2()2
B. Calibration of rolling friction and backing film 2()3
C. ~nalysis of single level results 2()4
D. Analysis of temperature sweep results 2()S
E. Statistical confidence • • • • • • • • • • • • • • • • • • • • • • • • • • • • • • • • • • • • • • • • • • • • • • • •• • • • • • • • • •206
Ftt!fE!rE!I1C:E!!I • • • • • • • • • • • • • • • • • • • • • • • • • • • • • • • • • • • • • • • • • • • • • • • • • •• • • • • • • • • • • • • • • • • • • • • • • • • • • • •:2ClIl
R J Crossley 8
Chapter 1 - Introduction
1 Introduction
The Increasing demand for wind turbines has lead to a shortage In turbine blade supply
(Chapter 1.1). Current turbine blade production Involves a significant amount of manual
glass fibre placement leading to long production times, high labour costs and poor part
consistency (Chapter 1.3). Manufacturers are now seeking to improve production by
utilising automated production methods. However, for reasons of design and effiCiency
suitable automated processes are limited to those capable of producing large blade
components (>60m long) with unidirectional fibres running along the length (Chapter
1.2). Automated Tape Lay-up (ATL), traditionally utilised for aerospace applications, is
believed to be the most appropriate candidate for development.
1.1 Turbine blade demand
The release of CO2 gasses into the atmosphere when burning fossil fuels is now
recognised as a major contributor towards global warming [1]. The United Nations have
agreed through the Kyoto protocol to reduce emissions In the developed world with a
cost penalty for every tonne of C02 produced exceeding agreed limits [2]. The tax
penalty for CO2emissions coupled with Increasing cost of 011 and gas, as finite resources
become depleted, have allowed emission free renewable energy resources to increase in
affordability. Therefore, wind power has become increasingly popuiar as a zero
emissions means of generating electricity. Wind power has proven to be cost effective
and reliable In comparison to other renewable energy sources. For the year 2008, 36%
(8,484 MW) of the European Union's (EU) newly Installed capacity was wind energy,
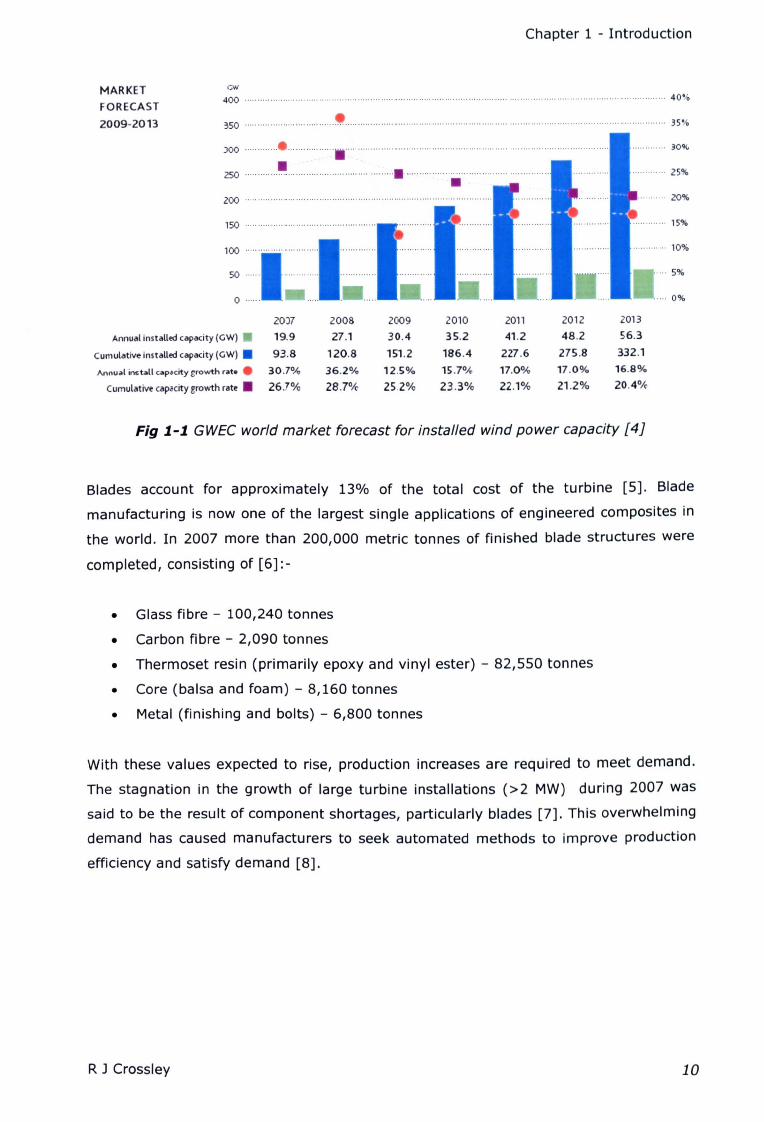
making it the fastest growing electricity source [3]. Wind power has seen an exponential
growth in demand for Installed capacity which Is set to continue with annual growth of
17%, hampered marginally by the financial crisis In 2009 (Fig 1-1).
R J Crossley 9
Chapter 1 - Introduction
MARKET
FORECAST
2009-2013
GW
400 ............................................................................................................................................ 40'10
350 .. ..... 35'10
150 ..
····25%
JOO ..
250 ..•200
15%
100 ... '150 ·1
O' - ......
... 10%
5%
··0%
20)7 200S
Annual instelled capacity (GW) • 19.9 27.1
cumulative install.d capacity (GW) • 93.8 120.8
Annual install cap.city growth rato • 30.7% 36.2%
Cumulative capacity growth rate. 26.7% 28.7%
2009 2010
30.4 35.2
151.2 186.4
12.5% 15.7%
25.2% 23.3%
2011
41.2
227.6
17.0%
22.1%
2012 2013
48.2 56.3
275.8 332.1
17.0% 16.8%
21.2% 20.4%
Fig 1.-1. GWECworld market forecast for installed wind power capacity [4J
Blades account for approximately 13% of the total cost of the turbine [5]. Blade
manufacturing is now one of the largest single applications of engineered composites in
the world. In 2007 more than 200,000 metric tonnes of finished blade structures were
completed, consisting of [6]:-
• Glass fibre - 100,240 tonnes
• Carbon fibre - 2,090 tonnes
• Thermoset resin (primarily epoxy and vinyl ester) - 82,550 tonnes
• Core (balsa and foam) - 8,160 tonnes
• Metal (finishing and bolts) - 6,800 tonnes
With these values expected to rise, production increases are required to meet demand.
The stagnation in the growth of large turbine installations (>2 MW) during 2007 was
said to be the result of component shortages, particularly blades [7]. This overwhelming
demand has caused manufacturers to seek automated methods to improve production
efficiency and satisfy demand [8].
R J Crossley 10
Chapter 1 - Introduction
1.2 Turbine blade design
1.2.1 Size
The kinetic energy or power contained in moving air is a function of velocity and swept
area [9]. An increase in turbine diameter results in a squared increase in power output.
This relationship allows a greater power yield per installation cost, reducing the overall
cost per kW. This saving drives manufacturers to produce turbines with increasingly
large rotor diameters. Reducing the blade mass is necessary to allow production of
larger turbines. Simple scaling laws suggest that the turbine blade mass should increase
at a cubed rate proportionally with rotor diameter [10]. However, a 2.65 exponential
mass increase has been observed in practice [9, 11]. This favourable deviation is
attributed to improvements in blade materials, mostly the strength to weight ratio of
composites [11]. Technological advances in materials have allowed the wind energy
market to capitalise on larger turbines with a significant increase in large (>2MW)
turbine installations accounting for more than half of all installed capacity across Europe
in 2006 [7].
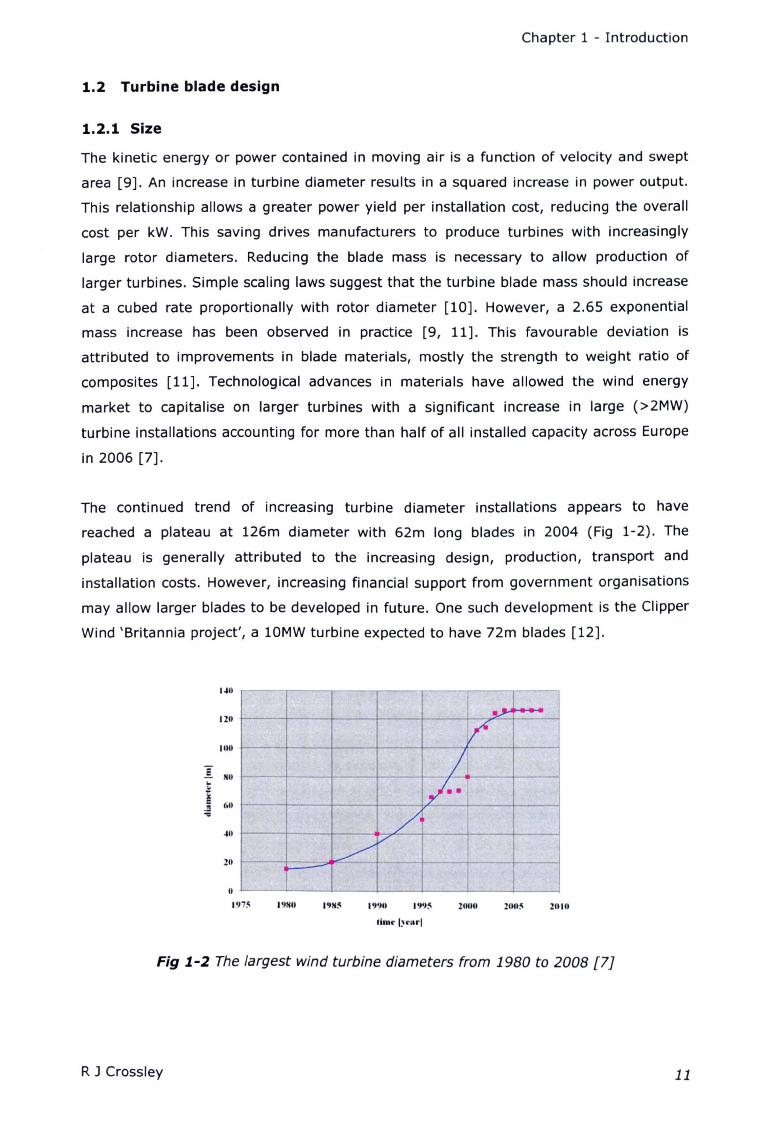
The continued trend of increasing turbine diameter installations appears to have
reached a plateau at 126m diameter with 62m lcnq blades in 2004 (Fig 1-2). The
plateau is generally attributed to the increasing design, production, transport and
installation costs. However, increasing financial support from government organisations
may allow larger blades to be developed in future. One such development is the Clipper
Wind 'Britannia project', a 10MW turbine expected to have 72m blades [12].
1..10
120
lOll
I HO..i 60..:;
~o
211
- ~.~
IV'
II"
II~ f-
.>V
(I
I'n:" 19HO 19911 19'):'1 211011 lUll:" 21110
Fig 1-2 The largest wind turbine diameters from 1980 to 2008 [7J
R J Crossley 11
Chapter 1 - Introduction
1.2.2 Geometry
High rotor aerodynamic efficiency Is desirable and Is typically maximised within the
limits of affordable production. It is widely accepted that not all of the winds kinetic
energy may be utilised and that wind turbine efficiency cannot exceed 59.3%,
commonly referred to as the Betz limit [10, 13]. This concept along with tip losses and
rotational losses Is embodied In the Blade Element Momentum (BEM) method, which Is
used to define the optimum blade geometry for aerodynamic performance [14]. The
BEM method Is also used to define the aerodynamic loads. The blade may then be
modelled as a simple encastre beam [9]. The main aerodynamic load causes the blade
to deflect towards the tower in the 'flatwise' direction. The Increasing bending moment
towards the root indicates that structural requirements also determine blade shape, with
Increasing Influence towards the hub. Areas approaching the hub require thicker
aerofoils to Increase structural effiCiency [15]. Other operational loads tend be
proportional to blade mass under gravitational, centrifugal and inertial forces [16].
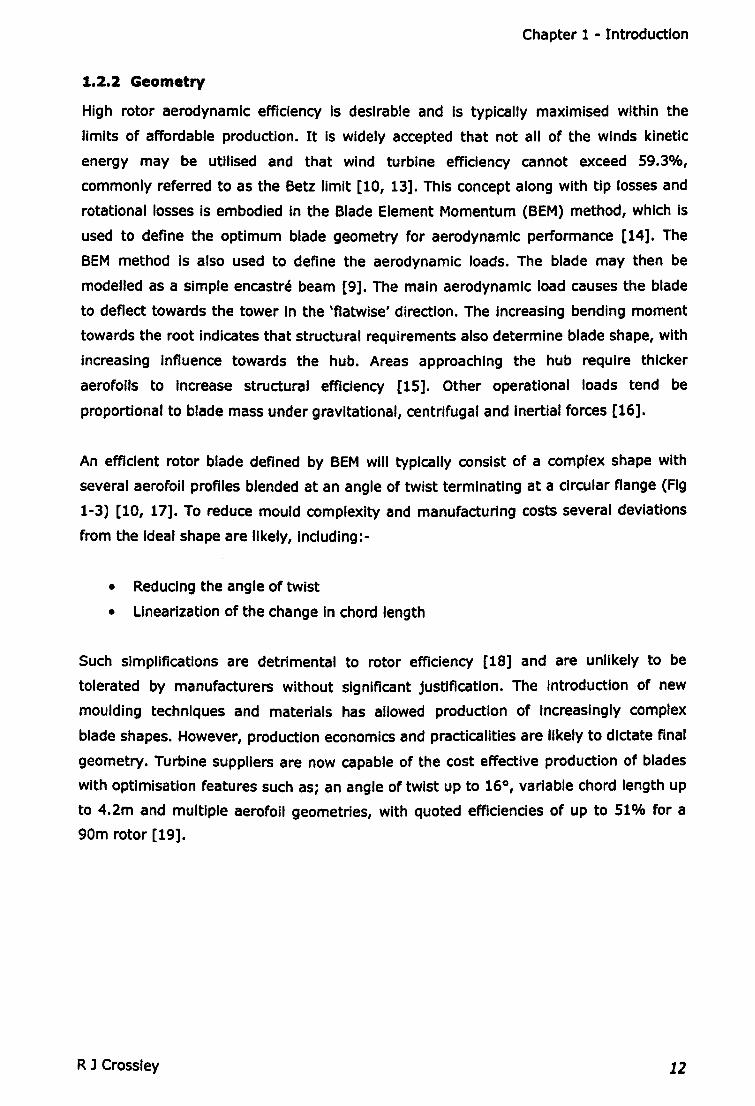
An efficient rotor blade defined by BEM will typically consist of a complex shape with
several aerofoil profiles blended at an angle of twist terminating at a circular flange (Fig
1-3) [10, 17]. To reduce mould complexity and manufacturing costs several deviations
from the Ideal shape are likely, including:-
• Reducing the angle of twist
• linearization of the change in chord length
Such simplifications are detrimental to rotor efficiency [18] and are unlikely to be
tolerated by manufacturers without significant justification. The introduction of new
moulding techniques and materials has allowed production of Increasingly complex
blade shapes. However, production economiCSand practicalities are likely to dictate final
geometry. Turbine suppliers are now capable of the cost effective production of blades
with optimisation features such as; an angle of twist up to 16°, variable chord length up
to 4.2m and multiple aerofoil geometries, with quoted efficiencies of up to 51% for a
90m rotor [19].
R l Crossley 12
Chapter 1 - Introduction
Linearchord length
! (simplified for manufacture)
III I I I I II=:JAngle of twist
!
x
/x7
~ ----FFA-W3-301 Structural aerofoil
DU93-W-210 performance aerofoil
Fig 1-3A typical modern commercial blade with multiple aerofoil profiles, angle of twist
and linear chord length increase
1.2.3 Materials
Composite materials allow the necessary complex aerofoil blade shapes to be formed
and are used by all wind turbine market leaders. They also offer superior structural
capabilities and resistance to corrosion. They are generally formed into a laminate which
consists of layers of fibres encased in a polymer resin matrix. Two laminates may be
separated by a foam core to form a sandwich panel which increases flexural rigidity with
minimal weight increase. An almost endless combination of sandwich configurations,
matrix, fibres and foam core components are utilised, tailored to suit the application and
load case. The typical component and laminate configuration for wind turbine blades is
reviewed here in order to assess the ability of automation methods to handle such
materials.
Resin Matrix
Thermoset resins are the only resin type currently utilised by mainstream turbine
manufacturers. Thermoset resins can be formed easily and then cured at elevated
temperature, solidifying in the required shape by an irreversible chemical reaction.
These isotropic materials allow load transfer between the reinforcement fibres, other
duties include [20]:-
• Protecting notch sensitive fibres from abrasion
R J Crossley 13
Chapter 1 - Introduction
• Protecting fibres from moisture, oxidation and chemicals
• Providing shear, transverse tensile and compression properties
• Governing the thermo-mechanical performance
Epoxy and polyester resin systems are favoured by rotor blade manufacturers for their
widespread existing working knowledge, availability, performance and ease of
production. They are general purpose resins with Inapplicable alternatives selected for
their fire and chemical resistance. Polyester resins offer versatility, good physical and
mechanical properties, are readily available and cost effective [20]. Polyester resins
were once the most popular resin type for rotor blade manufacture. However, their use
has declined in all but one leading supplier of rotor blades, generally due to the Increase
In performance demands and the reduction In cost of superior epoxy resins.
Additionally, polyester resins are Incompatible with desirable higher modulus carbon
fibres with mainstream surface treatments. A major contribution to the decline In
polyester use can be attributed to health and safety risks [21]. Epoxy resins now
dominate consumption, superior In most respects to polyester resins, which are
generally preferred simply on the grounds of cost [22]. They are typically tougher than
polyesters, shrink less and have good reststence to heat distortion. The ability of epoxy
resins to be partially cured so that prepregs can be supplied offers Increased flexibility In
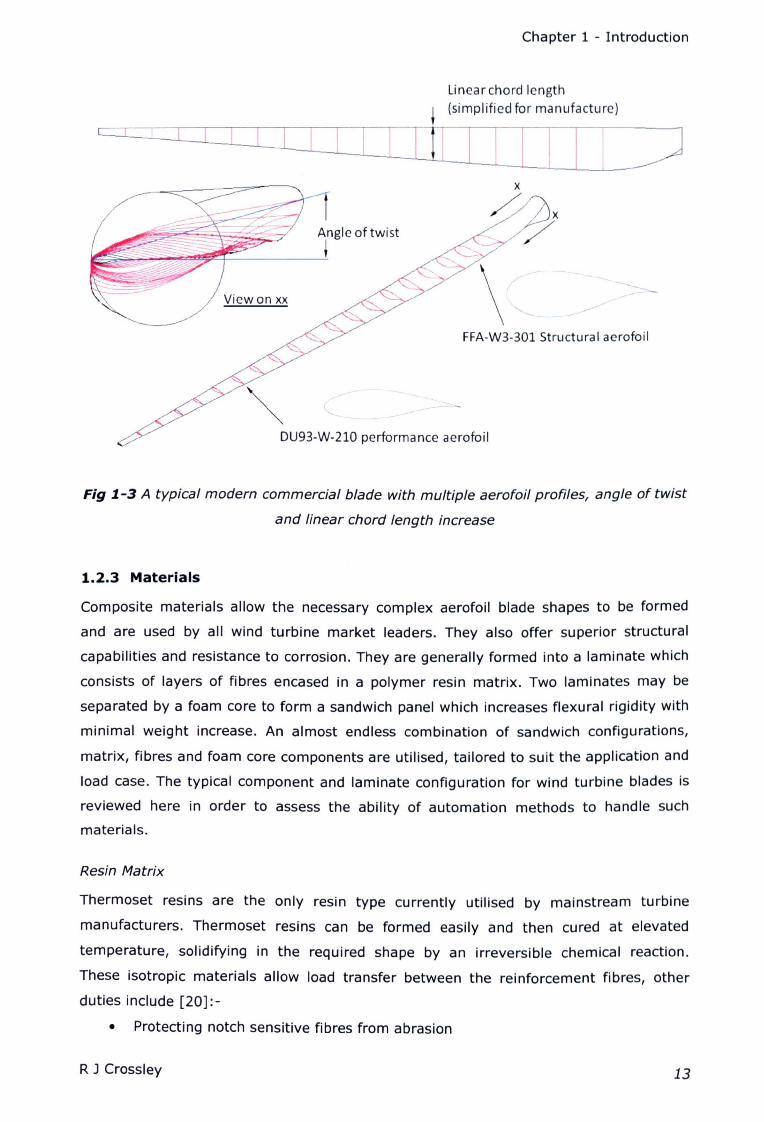
manufacturing. A direct comparison of properties (Table 1-1) highlights the advantages
of epoxy.
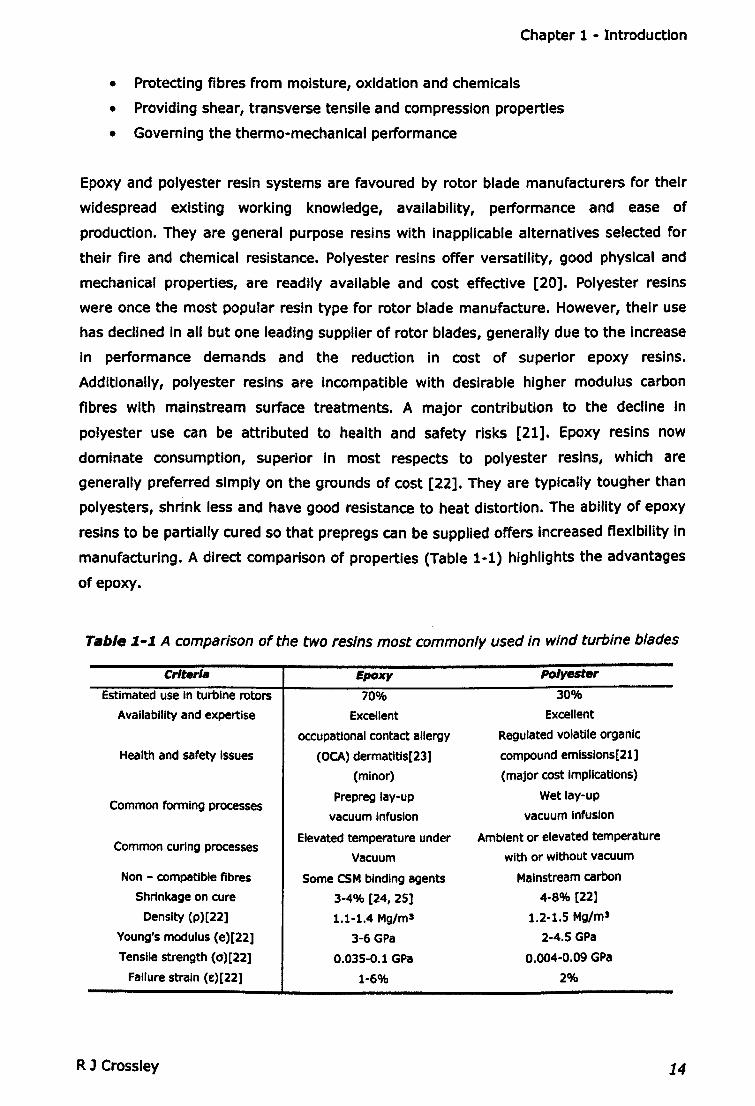
Table :1.-:1. A comparison of the two resins most commonly used in wind turbine blades
Crlterl. Epoxy Polyester
Estimated use in turbine rotors 70% 30%
Availability and expertise Excellent Excellent
occupational contact allergy Regulated volatile organic
Health and safety Issues (OCA) dermatltls[23] compound emlsslons[21]
(minor) (major cost Implications)
Common forming processesPrepreg lay-up Wet lay-up
vacuum Infusion vacuum Infusion
Common curing processesElevated temperature under Ambient or elevated temperature
Vacuum with or without vacuum
Non - compatible fibres Some CSMbinding agents Mainstream carbon
Shrinkage on cure 3-4% [24, 25) 4-8% [22]
Density (p)[22] 1.1-1.4 Mg/ml 1.2-1.5 Mg/ml
Young's modulus (e)[22] 3-6 GPa 2-4.S GPa
Tensile strength (0')[22) 0.03S-0.1 GPa 0.004-0.09 GPa
Failure strain (£)[22] 1-6% 2%
R J Crossley 14
Chapter 1 - Introduction
Fibres
Fibres carry the majority of the structural load. Consequently, the essential property of
a fibre is defined as the elastic modulus. It must be significantly stiffer than the matrix,
which allows It to carry and transfer the load applied to the composite [20]. Since the
fibre is the main load bearing component It must also have sufficient strength to avoid
failure. Glass fibres are the most popular fibre reinforcement utilised by all of the
leading rotor blade producers [26]. There are several types of glass fibres available each
with a unique chemical composition and favourable properties. Although E-glass was
originally designated by Its excellent electrical Insulation properties it also offers
relatively high mechanical strength, durability at low cost with good availability and
working knowledge [27]. Therefore, E-glass dominates consumption in both the rotor
blade and general composite market. S-glass is deSignated for its increased strength
and is likely to be limited to local reinforcement of highly stressed areas due to higher
cost. S-glass Is mostly used by manufacturers using polyester resins since those using
epoxy are likely to prefer superior carbon fibres which are not compatible with polyester
resins [28]. Carbon fibres are the predominant reinforcement material used to achieve
high stiffness and strength. These fibres offer superior mechanical and fatigue
properties In comparison to glass fibre [20]. At present, due to increased cost, carbon
fibres are restricted In use to local reinforcement of highly stressed areas. However,
recent large blade designs with complete carbon slender spars have been produced
[28]. Therefore, the focus of wind energy carbon fibre has been on moderate to low
stiffness and high failure strain properties, which better conform to the glass fibre
properties of which they are to be integrated [11]. An extensive range of commercially
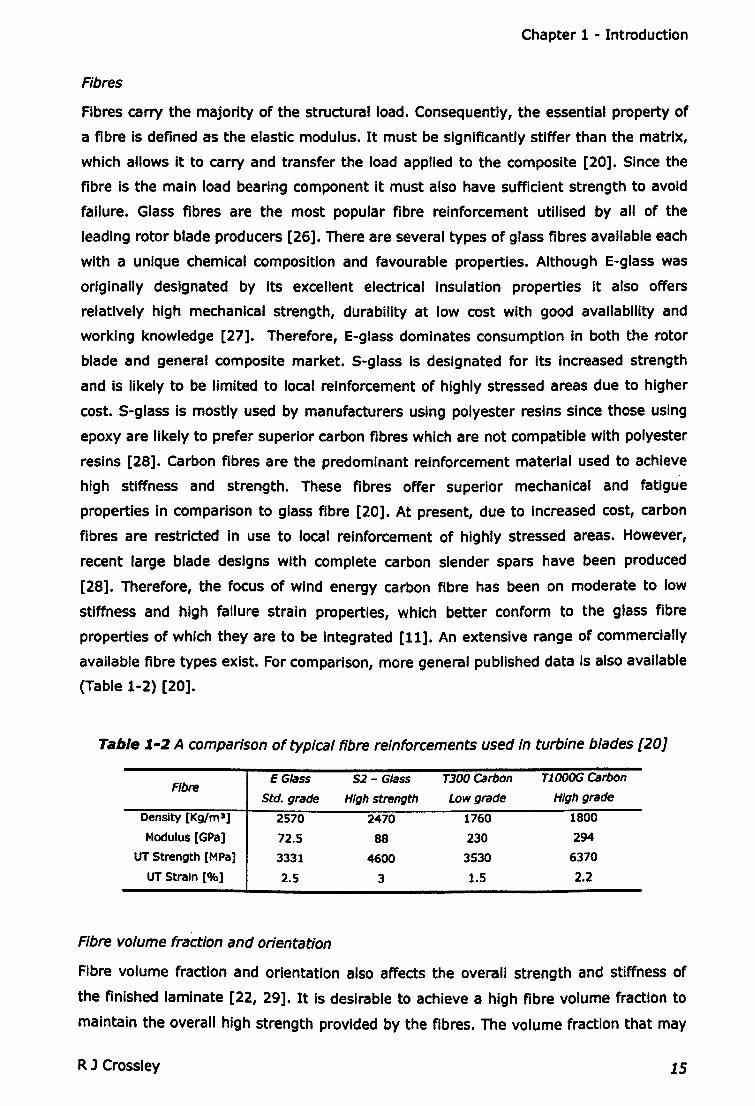
available fibre types exist. For comparison, more general published data is also available
(Table 1-2) [20].
Tabl. 1.-2 A comparison of typical fibre reinforcements used In turbine blades [201
EGlass S2 - Glass T300 carbon Tl000G carbonFibre
Std. grade High strength Low grade High grade
Density [Kg/ml] 2570 2470 1760 1800
Modulus [GPa] 72.5 88 230 294
UT Strength [MPa] 3331 4600 3530 6370
UT Strain [%] 2.5 3 1.S 2.2
Fibre volume fraction and orientation
Fibre volume fraction and orientation also affects the overall strength and stiffness of
the finished laminate [22, 29]. It is desirable to achieve a high fibre volume fraction to
maintain the overall high strength provided by the fibres. The volume fraction that may
R J Crossley 15
Chapter 1 - Introduction
be achieved Is typically dependent on the fibres and forming process [30]. Recently
implemented vacuum infusion processes offer superior VF of 50-60% when compared to
40% achievable by hand lay-up. Mechanical performance is also effected by processing
defects such as voids, resin rich or dry fibre areas [31]. The highest fibre volume
fraction and laminate mechanical performance Is typically achieved using continuous
unidirectional fibres. Short fibre composites generally have reduced performance due to
reduced volume fraction and alignment [22]. The prediction of composite strength in
transverse and shear loading is also possible [22]. These predictions and experimental
results indicate that composite materials are considerably stronger in the fibre direction.
Fibre architecture is therefore chosen carefully to suit loading conditions with a range of
commercially available formats:-
• Unidirectional (UD), Continuous fibres lie in a single direction held In position by
a minimal amount of cross stitching or a binding agent. Ideally suited for polar
axial loading conditions the finished composite Is highly anisotropic. This fibre
orientation Is utilised In the spar cap region of the rotor blade well suited to the
Intensive loads which run along the blade length.
• Bidirectional (Biax), Continuous fibres are situated normal to each other achieved
by either a woven fabric or by layering unidirectional fabrics. Bidirectional fabrics
are used In two dimensional and shear loading conditions to avoid transverse
loading of the fibres. They may be utilised In shear webs and within laminates of
other blade components. Biax and UD fibres may also be combined to produce a
tri-axial (trlax) fabric with Improved strength in the UD fibre direction.
• Random, Fibres are randomly orientated and can be either continuous or
chopped, known as chopped strand mat (CSM). This type of fibre alignment
typically results in Inferior mechanical properties. Randomly orientated fibres
have the advantage of being In plane IsotropiC facilitating simpler stress
predictions with lower material costs. They may be utilised In non-structural
areas.
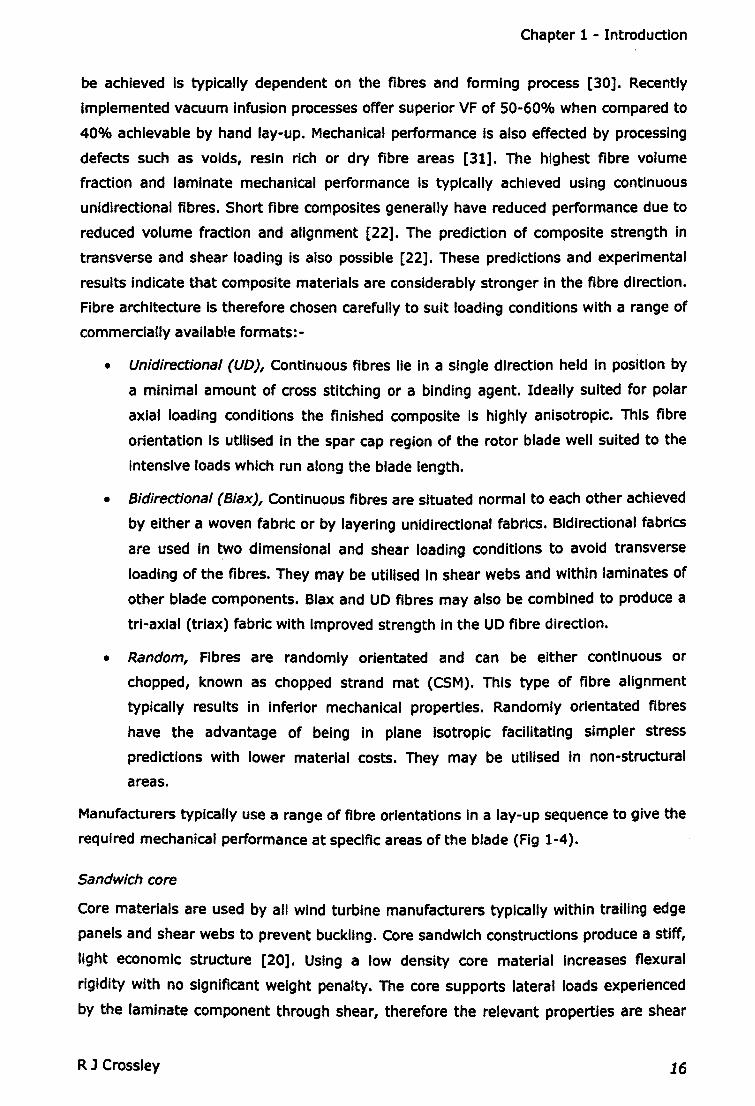
Manufacturers typically use a range of fibre orientations In a lay-up sequence to give the
required mechanical performance at specific areas of the blade (Fig 1-4).
Sandwich core
Core materials are used by all wind turbine manufacturers typically within trailing edge
panels and shear webs to prevent buckling. Core sandwich constructions produce a stiff,
light economic structure [20]. Using a low density core material increases flexural
rigidity with no significant weight penalty. The core supports lateral loads experienced
by the laminate component through shear, therefore the relevant properties are shear
R J Crossley 16
Chapter 1 - Introduction
strength and modulus [27]. The sandwich concept relies on the laminates being kept at
constant thickness under loading, a small degree of compression of the core material
causes a significant decrease in flexural rigidity [27]. Traditional methods for calculating
the flexural rigidity of sandwich beams and shear stress of their core material are well
defined [20]. Four types of core materials exist; honeycomb, corrugated, foam and
balsa. Corrugated and honeycomb cores are not typically used in turbine blades due to
their high cost and incompatibility with vacuum resin infusion methods. Mostly foam or
cellular plastic cores are utilised. Any polymer, thermoset and thermoplastic alike can be
expanded in several different manners. The density ranges available signify that a
nearly limitless scope of properties are achievable to suit any application [27]. Two
common foam materials used in the manufacture of blades are Poly Vinyl Chloride (PVC)
foam and Polyurethane CPU) foam [16]. PVC is usually favoured due to its superior
mechanical properties and temperature tolerance. Both balsa and foam may be used
depending on the material cost and availability. Foam is usually favoured as it is in line
with expertise and supply chain. Similarly, manufacturers utilising wood hybrids are
likely to prefer balsa.
IUOl21 Plies (12 18t)
[UOI 3 Piles (1.74t)
t.;r ;;;;~<J~~5=~::::;;~~=~=' IUOl2 Plies (1.16t)
} rUDI 8 PII" (4.~t)
[UO}8 Piles (4.~t)
(UO) 1 Ply (0.58t)
[UO}5 Plies (2.91)
1. "CQ # = ;_-- [UO} 1 Ply (0.58t)
(UO)2 Ply (1.16t)
IUOI 2 Ply (1.16t)
Fig 1-4 Typical fibre lay-up sequence for a 23m blade [17J
R J Crossley 17
Chapter 1 - Introduction
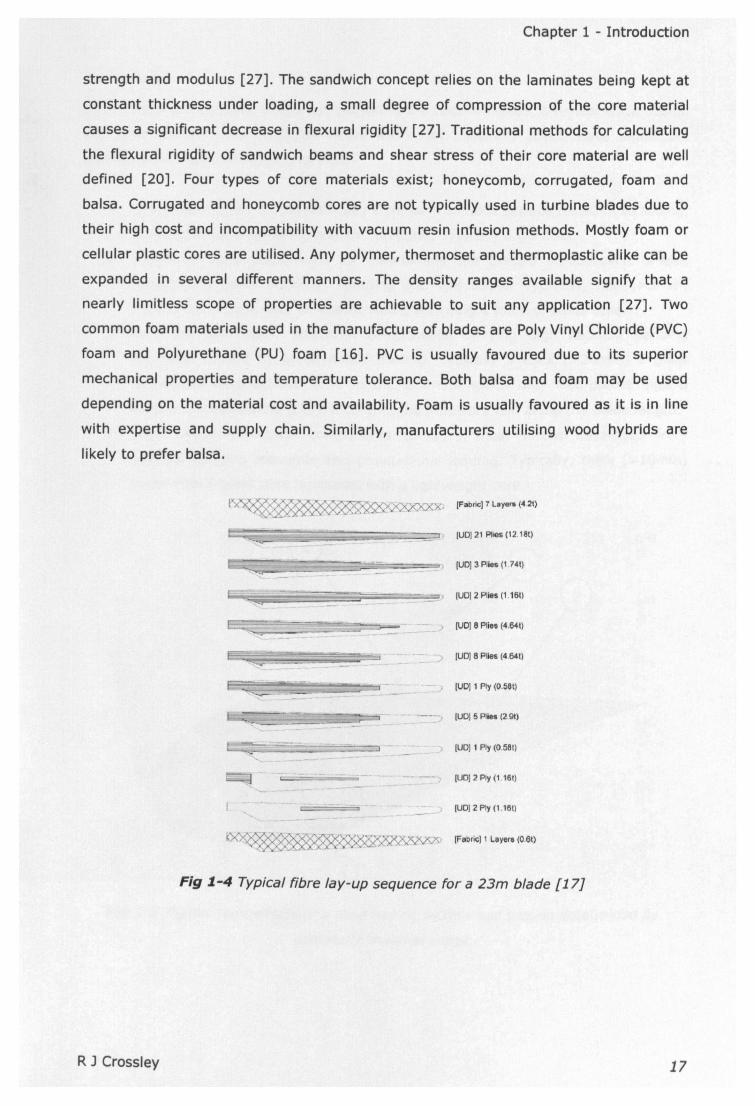
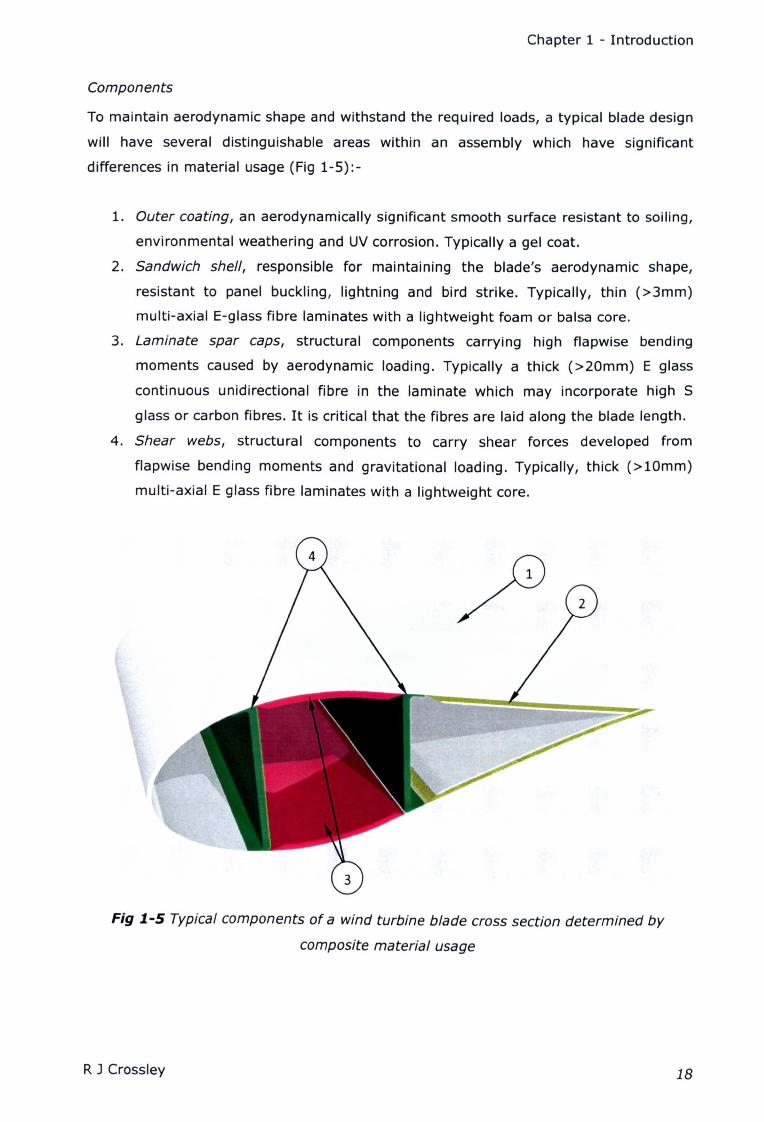
Components
To maintain aerodynamic shape and withstand the required loads, a typical blade design
will have several distinguishable areas within an assembly which have significant
differences in material usage (Fig 1-5):-
1. Outer coating, an aerodynamically significant smooth surface resistant to soiling,
environmental weathering and UV corrosion. Typically a gel coat.
2. Sandwich shell, responsible for maintaining the blade's aerodynamic shape,
resistant to panel buckling, lightning and bird strike. Typically, thin (>3mm)
multi-axial E-glass fibre laminates with a lightweight foam or balsa core.
3. Laminate spar caps, structural components carrying high flapwise bending
moments caused by aerodynamic loading. Typically a thick (>20mm) E glass
continuous unidirectional fibre in the laminate which may incorporate high 5
glass or carbon fibres. It is critical that the fibres are laid along the blade length.
4. Shear webs, structural components to carry shear forces developed from
flapwise bending moments and gravitational loading. Typically, thick (>10mm)
multi-axial E glass fibre laminates with a lightweight core.
Fig 1.-5 Typical components of a wind turbine blade cross section determined by
composite material usage
RJ Crossley 18
Chapter 1 - Introduction
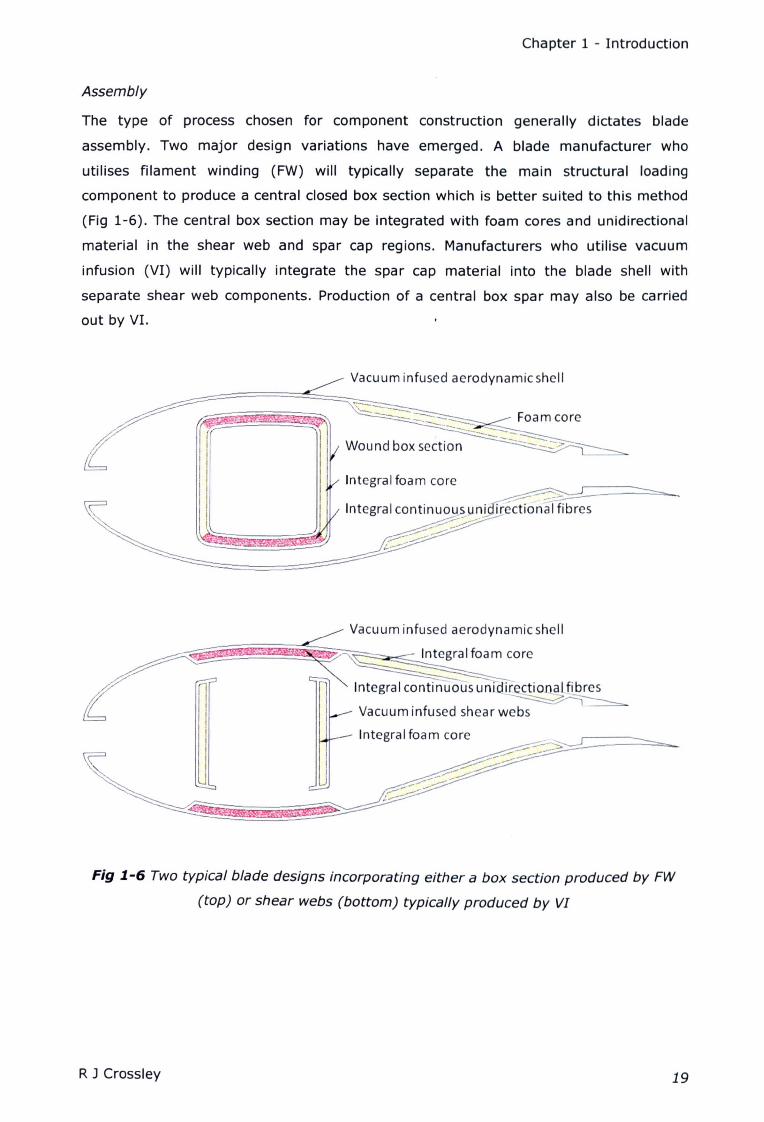
Assembly
The type of process chosen for component construction generally dictates blade
assembly. Two major design variations have emerged. A blade manufacturer who
utilises filament winding (FW) will typically separate the main structural loading
component to produce a central closed box section which is better suited to this method
(Fig 1-6). The central box section may be integrated with foam cores and unidirectional
material in the shear web and spar cap regions. Manufacturers who utilise vacuum
infusion (VI) will typically integrate the spar cap material into the blade shell with
separate shear web components. Production of a central box spar may also be carried
out by VI.
Vacuum infused aerodynamic shell
V Integral foam core
Vacuum infused aerodynamicshell
Integral continuous unidir ctio al fibres~~
Vacuum infused shear webs
Integral foam core
Fig 1.-6 Two typical blade designs incorporating either a box section produced by FW
(top) or shear webs (bottom) typically produced by VI
R J Crossley 19
Chapter 1 - Introduction
1.3 Existing production methods
Prepreg and vacuum Infusion (VI) have mostly replaced wet lay-up as the mainstream
manufacturing process for rotor blade production. These methods are flexible but rely
on the manual positioning of materials. Filament winding is the most successful
historical attempt at automation. However, difficulties in forming the trailing edge
prevented large scale production of the full blade component. Despite this drawback,
many blades with filament wound structural box section spars have been produced.
Therefore, fibre winding is included within existing production methods.
Wet/ay-up
Until recentJy wet Jay-up techniques, used traditionally in the boat building Industry
[11], were favoured for turbine blade production. Wet Jay-up production suffers from
poor repeatability, high labour content and health Issues. This process has now been
replaced by vacuum resin Infusion or prepreg methods In all of the top ten suppliers.
Low volume production may stili continue In smaller companies or to cover excess
production. Wet lay-up Is the simplest method used for forming composite materials.
The fibres are laid out over a mould and wetted out with a premixed resin by hand using
a brush or roller. This method demands longer curing times as the resin needs to
remain viscous throughout the lengthy rolling process. The quality and strength of the
laminate relies heavily on the skill of the workforce. It has no guaranteed repeatability
and produces relatively low fibre volume fractions [32]. A typical cycle time for using
wet lay-up techniques on a 40m blade Is 2 days [33] with increased scrap and re-work
due to human error. The wet lay-up process results In parts with Inconsistent fibre
orientations with strands separating from the fibre preform mat due to excess handling.
The process also results In an uneven surface on the Inner skin resulting In poor bonding
of the blade shells In final assembly [32].
Significant health and safety risks are associated with polyester wet lay-up techniques.
Harmful Volatile Organic Compounds (VOCS), primarily styrene, are released during the
curing process [21]. New and Increasingly tightening legislation exists limiting the
styrene content In air. The clean air requirement for workshops has offset the cost of
Investing In Improved forming methods against the cost of newly required ventilation
equipment [32]. Despite Its drawbacks the process remains attractive for Its simplicity
and low cost (Table 1-3).
R J Crossley 20
Chapter 1 - Introduction
Table 1.-3A summary of the wet lay-up forming process
Advantages Disadvantages
Low investment cost
Simple to learn
Wide choice of materials
and resins
Poor repeatability
Labour intensive
Quality is worker skill dependant
Costly ventilation equipment required to meet health and safety legislation
Low fibre volume fractions (30 - 40%)
Long cure times (48hr cycle time)
Uneven bonding surface
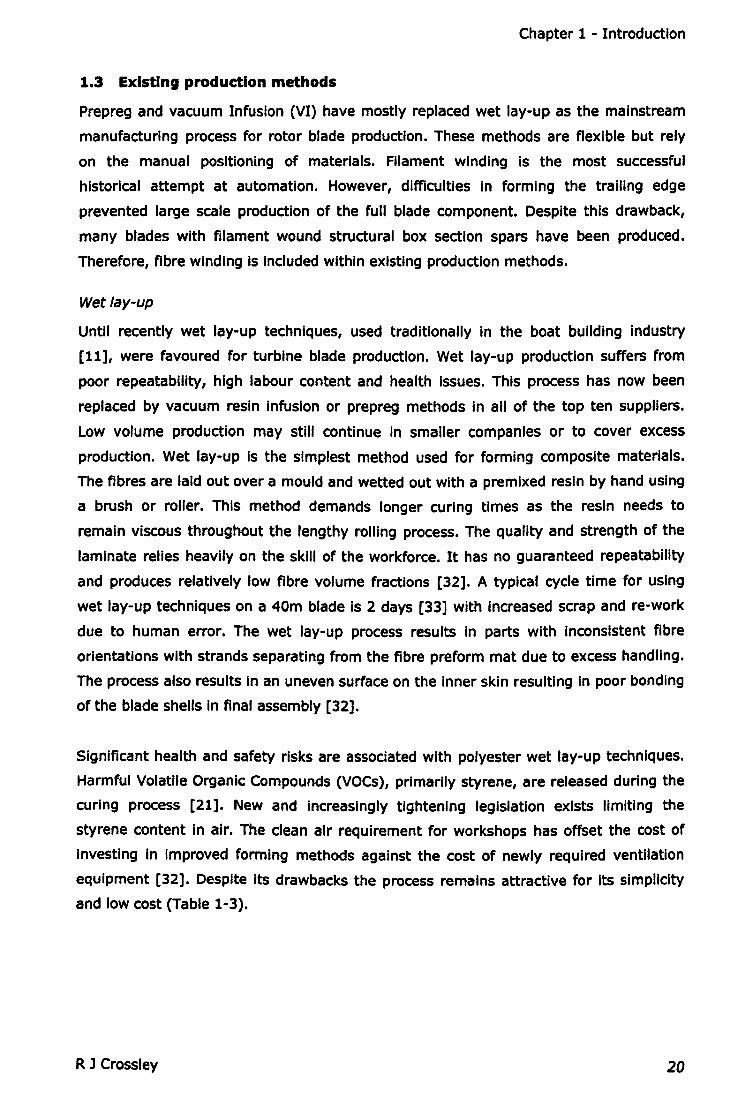
Vacuum infusion
Vacuum infusion moulding has recently increased in popularity in turbine blade
production due to desires to improve working conditions, increase structural integrity
and repeatability. A number of acronyms, patented technologies and processes have
evolved relating to differences in the technical approach to resin infusion. Vacuum
assisted resin transfer moulding (VARTM) has been used to describe the infusion
process without reference to tooling. Resin infusion under flexible tooling (RIFT) is used
to define a resin infusion process which involves a flexible surface such as a bagging
film [34]. All such processes may be referred to as vacuum infusion (VI). VI turbine
production involves arranging the dry fibres in a female mould tool (Fig 1-7) which may
include channels or porous layers to facilitate resin flow. The mould tool and dry fibres
are then covered with a sealed bag. The air between the bag and mould tool is removed
creating a vacuum which draws the resin into the mould (Fig 1-8). The resultant
component will have a single quality surface matching the mould tool and an inner
surface suitable for bonding internal structural components.
Fig 1.-7 Hand lay-up of dry fibres in a turbine blade mould [LM GlassfibreJ
R J Crossley 21

Chapter 1 - Introduction
Fig 1-8 Resin impregnation during VI of a turbine blade shell [Tygavac]
Individual processes are distinguished by the methods used to ensure resin flows evenly
to all areas without voids. The dominant impregnation mechanism is through thickness
flow, thus the flow path through the relatively low permeability reinforcement is very
short, and a high vacuum is relied upon to ensure that voids are reduced [30]. As the
resin no longer needs to remain fluid throughout the lay-up process faster curing times
can be achieved. Therefore, an overall cycle time of 24 hours is obtainable for a 40m
blade [33]. The VI process has a reasonable level of flexibility with a novel approach
being adopted by one manufacturer using a closed mould bladder process (Fig 1-9).
Fig 1-9 Hand lay-up of the laminate material in the open mould which is then closed
ready for inflation of the bladder type vacuum bag [Siemens Wind]
In comparison to wet lay-up, VI processing has improved; cycle times, repeatability,
working conditions, volume fractions and component quality. However, several
difficulties remain (Table 1-4). In particular ensuring all fibres are fully wet-out by the
resin [11]. Other negative attributes such as a high labour content and component
inconsistencies result from the hand assembly of dry fibres which can also move during
resin infusion.
RJ Crossley 22
Chapter 1 - Introduction
Table 1-4Characteristics of the Vacuum resin infusion process [34]
Advantages Disadvantages
Compatible with epoxy and polyester resin systems.
Compatible with most conventional fabric
reinforcements.
Lower cost materials compared to prepreg.
Fewer health and safety Issues.
Relatively low tooling costs.
Faster cure and cycle times (24hr).
Superior repeatability to hand lay-up (HLU).
Superior achievable volume fraction to HLU.
Microstructure Is more uniform with reduced void
content compared to HLU.
Complex process with additional skills required
compared to HLU.
Sensitive to leaks.
Low viscosity requirements of resin may
compromise mechanical and thermal properties.
Uneven flow may result In dry fabric areas and
expensive scrap parts.
Poor repeatability due to hand positioning of
fabrics which may move during resin flow.
High labour content.
The prepreg process
Prepreg hand lamination involves cutting plies into the required shape, removing the
backing paper and placing them into a mould. Pressure is manually applied to ensure
the ply conforms to the mould surface. Tack levels are formulated such that the material
will remain In place throughout the lamination process but can be repositioned If
necessary.
Prepreg Is typically manufactured by laying fibres and resin between sheets of silicone
paper or plastic film. The layers are then pressed or rolled, to ensure consolidation and
wetting of the fibres, then partially cured to produce a flexible pre-impregnated
aggregate [22]. The additional processing leads to an increased cost. Nevertheless,
prepreg Is stili favoured for guaranteed resin matrix fibre compatibility, optimum volume
fractions, reduced variability, ease of handling and improved placement accuracy [35].
Prepreg use is generally associated with high performance applications In the aerospace
Industry, which require high pressure and temperature cure in an autoclave [22]. An
autoclave suitably sized for wind turbine rotor blades would incur excessive costs.
Therefore, prepregs used by wind turbine manufacturers are cured under vacuum In a
similar arrangement to vacuum resin infusion without gross resin flow. The prepreg
material is laid up by hand, held In place due to Its tacky consistency. Curing takes
place at 80-1200C under vacuum. Limited harmful emissions are associated with
prepreg, health concerns over occupational contact allergy dermatitis can be easily
overcome [23].
Prepreg materials effectively begin to cure slowly at room temperature, limiting the
shelf life. Therefore, freezer storage is required at additional cost. Prepreg material use
R J Crossley 23
Chapter 1 - Introduction
is somewhat restricted in blade production due to the associated additional costs (Table
1-5). However, prepreg offers the advantage of good fibre alignment during processing
resulting in parts with lower fibre flaws and excellent predicted properties [32]. Again,
this process suffers from a high labour content and inconsistencies associated with hand
placement of fabrics.
Table 1-5 A summary of the prepreg forming process [11, 35J
DllIlIdvantllll_
Consistency in resin quality and material properties.
Improved repeatability.
Optimum fibre volume fractions.
Easler to cut and place accurately.
Minimal health and safety Issues.
Increased materials cost compared to VI and hand
lay-up.
May require freezer storage at Increased cost.
Hand assembly leading to high labour content and
repeatability issues.
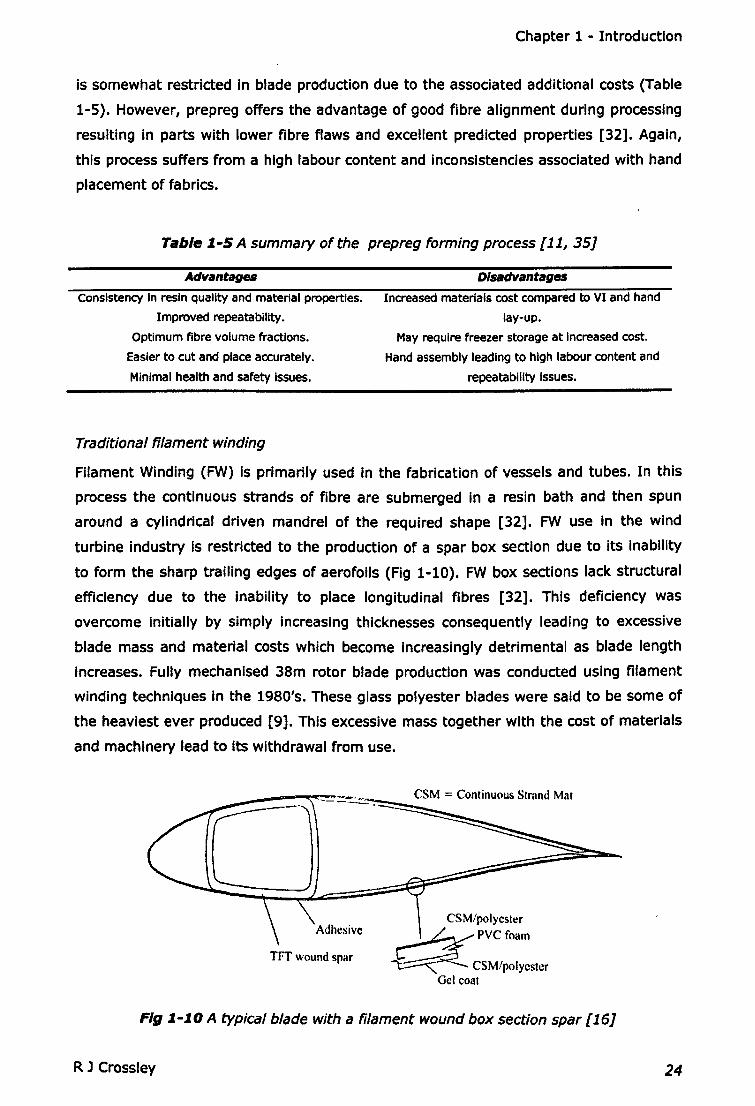
Traditional filament winding
Filament Winding (FW) Is primarily used in the fabrication of vessels and tubes. In this
process the continuous strands of fibre are submerged In a resin bath and then spun
around a cylindrical driven mandrel of the required shape [32]. FW use in the wind
turbine industry is restricted to the production of a spar box section due to its Inability
to form the sharp trailing edges of aerofoils (Fig 1-10). FW box sections lack structural
efficiency due to the inability to place longitudinal fibres [32]. This deficiency was
overcome initially by simply Increasing thicknesses consequently leading to excessive
blade mass and material costs which become increasingly detrimental as blade length
Increases. Fully mechanised 38m rotor blade production was conducted using filament
winding techniques in the 1980's. These glass polyester blades were said to be some of
the heaviest ever produced [9]. This excessive mass together with the cost of materials
and machinery lead to its withdrawal from use.
CSM = Continuous Strand Mat
TFT wound spar
CSM/polycsler
~PVCfoam
~ CSM/polycsterGel coat
Fig 1-10 A typical blade with a filament wound box section spar [16J
R J Crossley 24
Chapter 1 - Introduction
1.4 Automated forming processes
With hand lay-up, considerable time is spent in the manual positioning of plies and
accuracy Is subject to the laminator's skill. Therefore, the process Is labour intensive,
lacks consistency and would benefit considerably from automation [36] (Table 1-6).
Automated ply lamination (APL) seeks to resolve these issues by automated cutting,
picking and placement of complete plies. Considerable technical difficulty Is attributed to
the prepreg tack level which must be low to allow backing paper removal but remain
high enough to hold the lay-up together [37]. In general slow and complex development
of automated lay-up has been attributed to the tacky and flexible nature of prepreg
[36]. The APL method Is unsuitable for the large curved surfaces of wind turbine blades
and still requires significant manual intervention. Continuous lamination processes
Involve feeding prepreg from a roll and cutting and placing prepreg whilst traversing the
mould surface in a layer by layer process. These processes are suitable, since the
laminating head is able to follow the contours of the mould surface and remove backing
paper In-situ. A suitable automated process would Ideally meet the following criteria
(Chapter 1.2):-
• Capable of producing components above 42m in length
• Capable of complex curved and twisted geometry
• Ability to lay unidirectional fibres along the length
• Capable of incorporating foam cores
• Ability to lay multiple fibre types in multiple directions
• Capable of achieving a high fibre volume fraction
A number of automated methods which have potential to produce turbine blade
components are outlined (Table 1-7).
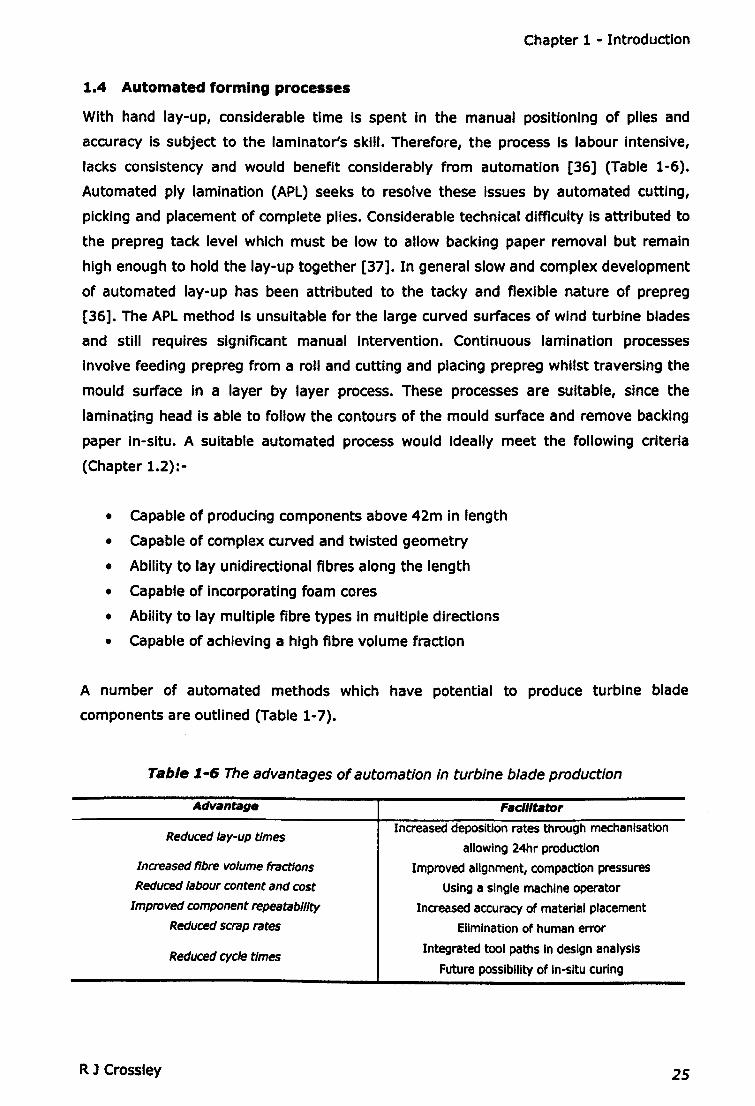
Tilble 1-6 The advantages of automat/on /n turbine blade production
Reduced cycle times
Increased deposition rates through mechanisation
allowing 24hr production
Improved alignment, compaction pressures
Using a single machine operator
Increased accuracy of material placement
Elimination of human error
Integrated tool paths In design analysis
Future possibility of In-situ curing
Reduced lay-up times
Increased fibre volume fractions
Reduced labour content and cost
Improved component repeatability
Reduced scrap rates
R 1 Crossley 25
Chapter 1 - Introduction
Table 1.-7 Automated methods with potential for turbine blade production
Typical size Geometric flexibilityMethod Typical product
(S,M,L)
Automated Tape Laying (ATL) ALL Curved surfaces /
Automated Fibre Placement (AFP)Aerospace structural
hollow sections
Automated tape or tow windingcomponents S,M
Smooth hollow
Filament winding Pressure vessel ALL sections only
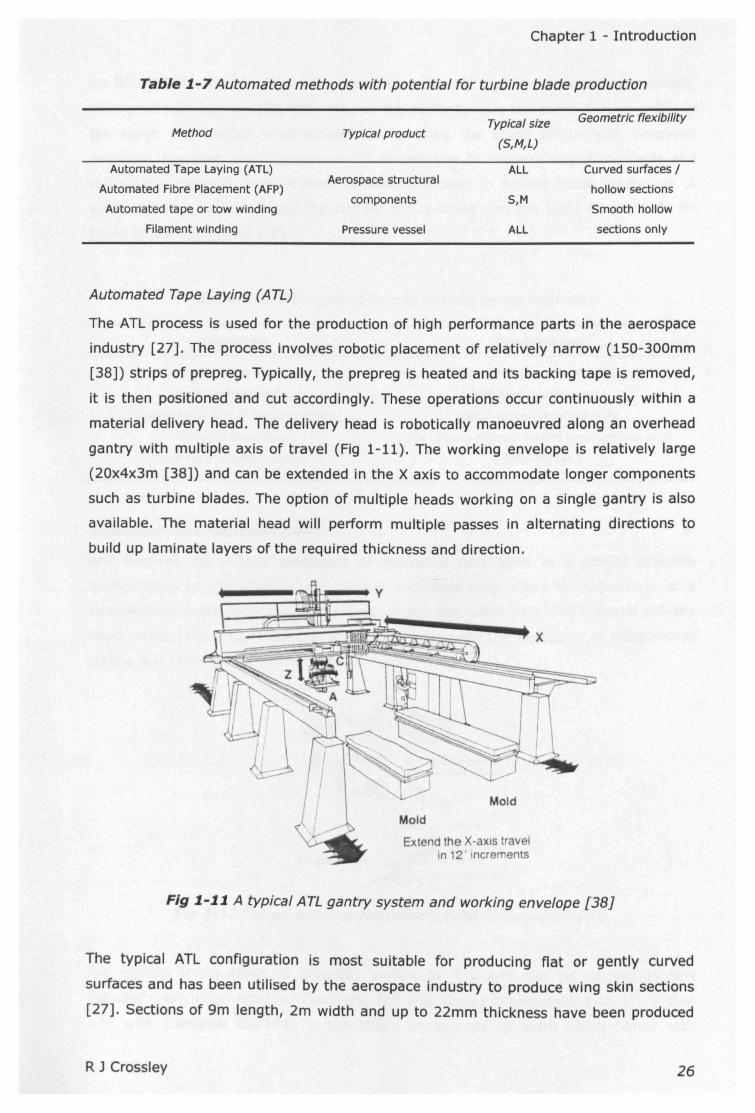
Automated Tape Laying (ATL)
The ATL process is used for the production of high performance parts in the aerospace
industry [27]. The process involves robotic placement of relatively narrow (lS0-300mm
[38]) strips of prepreg. Typically, the prepreg is heated and its backing tape is removed,
it is then positioned and cut accordingly. These operations occur continuously within a
material delivery head. The delivery head is robotically manoeuvred along an overhead
gantry with multiple axis of travel (Fig 1-11). The working envelope is relatively large
(20x4x3m [38]) and can be extended in the X axis to accommodate longer components
such as turbine blades. The option of multiple heads working on a single gantry is also
available. The material head will perform multiple passes in alternating directions to
build up laminate layers of the required thickness and direction.
4 X
Mold
Mold
Extend the X-axrs travelin 12 ' increments
Fig 1.-1.1. A typical ATL gantry system and working envelope [38]
The typical ATL configuration is most suitable for producing flat or gently curved
surfaces and has been utilised by the aerospace industry to produce wing skin sections
[27]. Sections of 9m length, 2m width and up to 22mm thickness have been produced
RJ Crossley 26
Chapter 1 - Introduction
by Airbus [38]. Typical deposition rates are relatively high for aerospace production,
between 16-26 kg/hour [38, 39]. ATL has the ability to form the gently curved profile of
the blade and deposit unidirectional fibres along the blade length with increased
accuracy. However, modifications would be required to increase deposition rates and
reduce raw material costs in order to ensure success in turbine blade production. A
comparison is made between the current ATL process and the hand VI methods for
blade production (Table 1-8).
Table J-8 ATL in comparison to VI hand Jay-up methods
Advantages Disadvantages
Reduced labour content.
Improved repeatability.
Improved accuracy of fibre placement.
Reduced scrap rate.
High fibre volume fractions.
High initial investment costs.
Increased material costs.
Additional programming costs.
Low relative deposition rates in comparison to VI
hand lay-up.
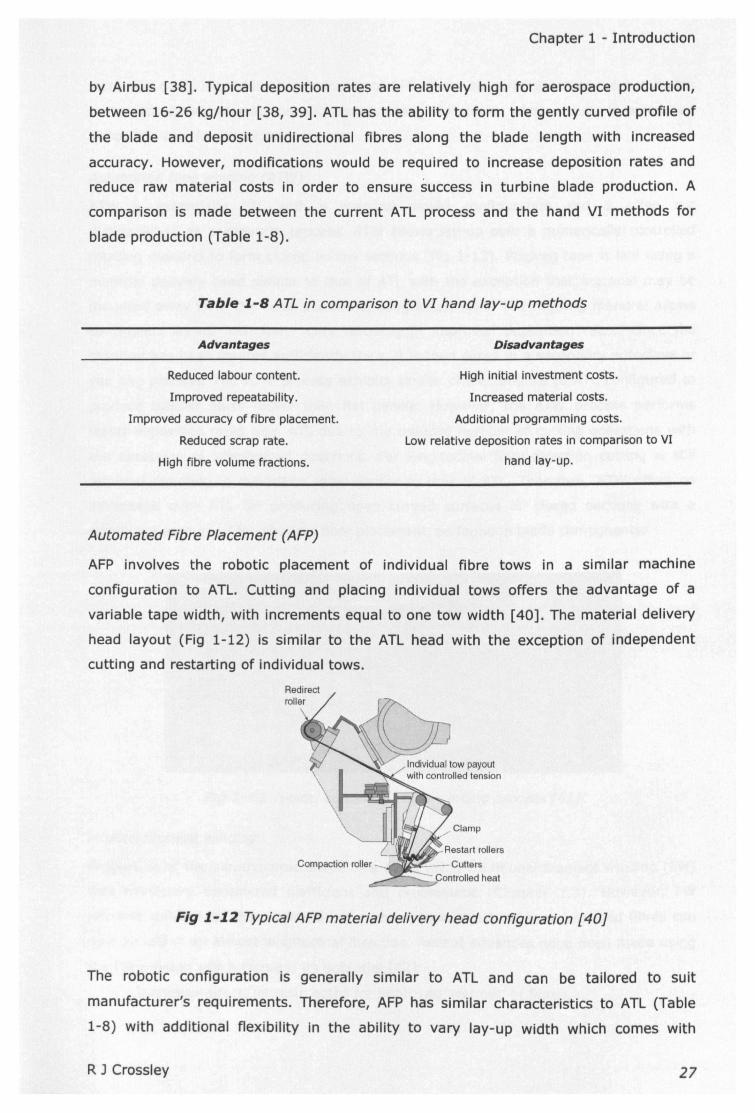
Automated Fibre Placement (AFP)
AFP involves the robotic placement of individual fibre tows in a similar machine
configuration to ATL. Cutting and placing individual tows offers the advantage of a
variable tape width, with increments equal to one tow width [40]. The material delivery
head layout (Fig 1-12) is similar to the ATL head with the exception of independent
cutting and restarting of individual tows.
Fig 1-12 Typical AFP material delivery head configuration [40J
The robotic configuration is generally similar to ATL and can be tailored to suit
manufacturer's requirements. Therefore, AFP has similar characteristics to ATL (Table
1-8) with additional flexibility in the ability to vary lay-up width which comes with
R J Crossley 27
Chapter 1 - Introduction
increased cost. The additional flexibility of AFP allows the production of more complex
parts with increased machine and programming complexity which results in a reduced
deposition rate for larger components.
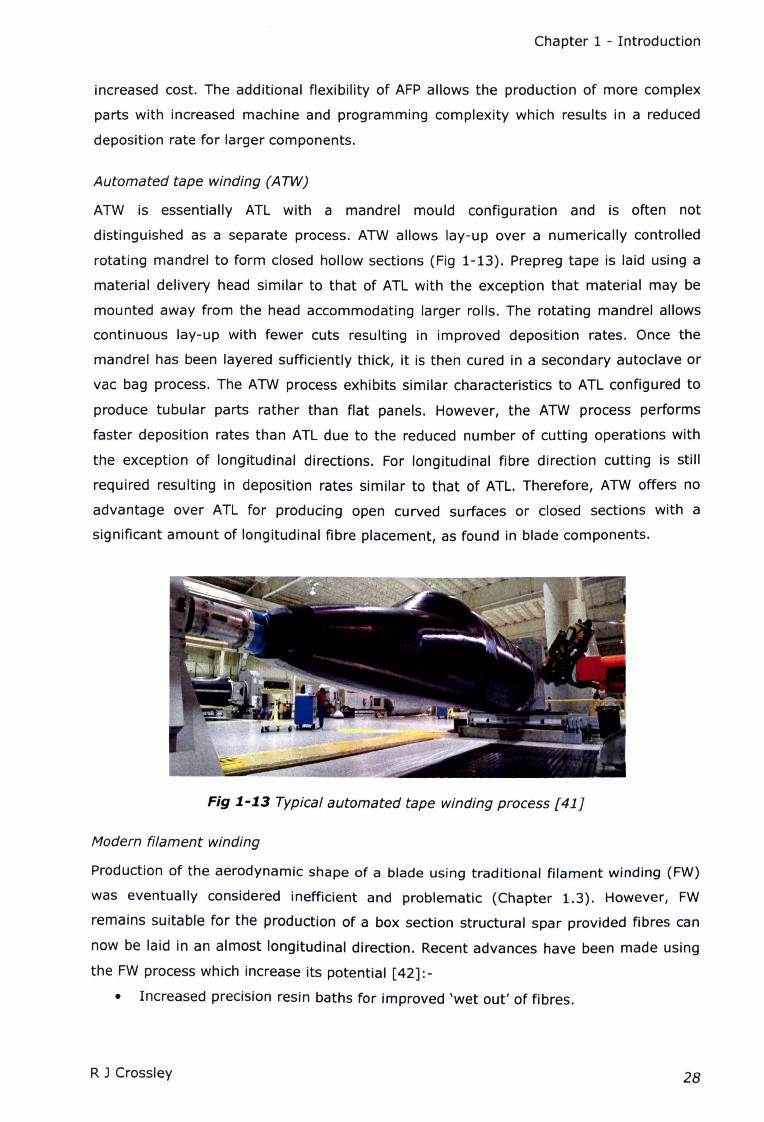
Automated tape winding (ATW)
ATW is essentially ATL with a mandrel mould configuration and is often not
distinguished as a separate process. ATW allows lay-up over a numerically controlled
rotating mandrel to form closed hollow sections (Fig 1-13). Prepreg tape is laid using a
material delivery head similar to that of ATL with the exception that material may be
mounted away from the head accommodating larger rolls. The rotating mandrel allows
continuous lay-up with fewer cuts resulting in improved deposition rates. Once the
mandrel has been layered sufficiently thick, it is then cured in a secondary autoclave or
vac bag process. The ATW process exhibits similar characteristics to ATL configured to
produce tubular parts rather than flat panels. However, the ATW process performs
faster deposition rates than ATL due to the reduced number of cutting operations with
the exception of longitudinal directions. For longitudinal fibre direction cutting is still
required resulting in deposition rates similar to that of ATL. Therefore, ATW offers no
advantage over ATL for producing open curved surfaces or closed sections with a
significant amount of longitudinal fibre placement, as found in blade components.
Fig 1-13 Typical automated tape winding process [41J
Modern filament winding
Production of the aerodynamic shape of a blade using traditional filament winding (FW)
was eventually considered inefficient and problematic (Chapter 1.3). However, FW
remains suitable for the production of a box section structural spar provided fibres can
now be laid in an almost longitudinal direction. Recent advances have been made using
the FW process which increase its potential [42]:-
• Increased precision resin baths for improved 'wet out' of fibres.
R] Crossley 28
Chapter 1 - Introduction
• A pin ring system to improve low winding angles (near longitudinal fibre
directions).
• Online monitoring of fibre resin volume fractions.
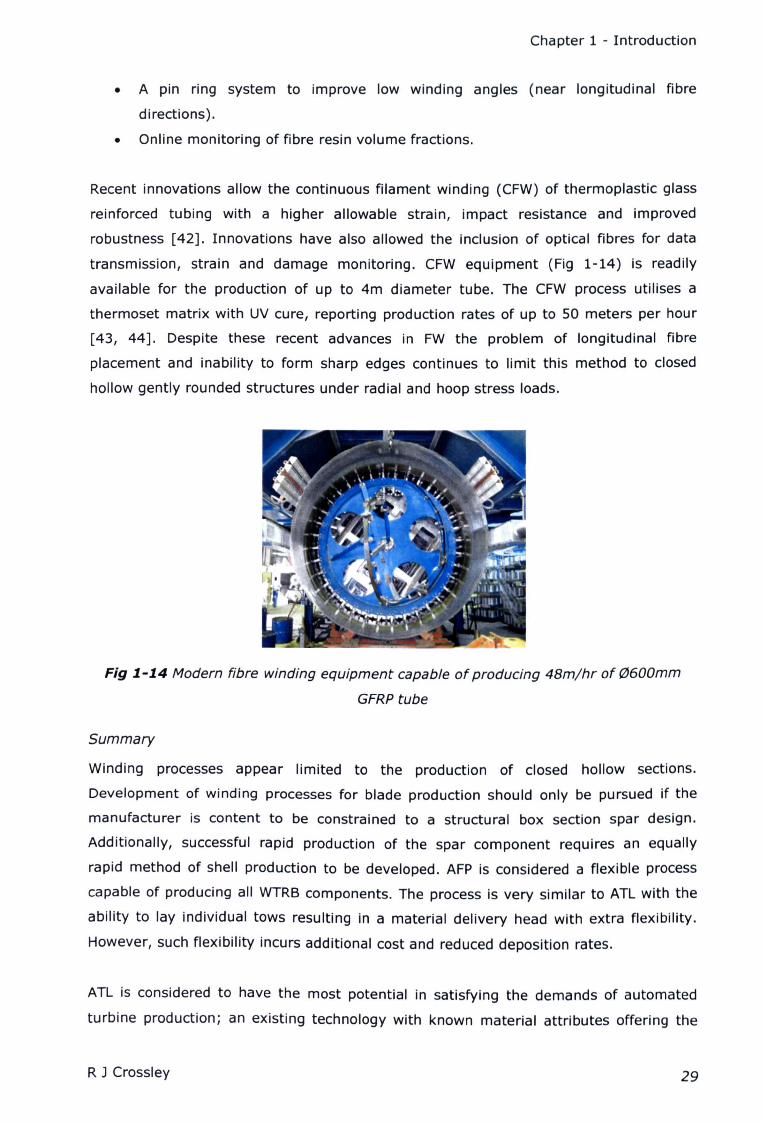
Recent innovations allow the continuous filament winding (CFW) of thermoplastic glass
reinforced tubing with a higher allowable strain, impact resistance and improved
robustness [42]. Innovations have also allowed the inclusion of optical fibres for data
transmission, strain and damage monitoring. CFW equipment (Fig 1-14) is readily
available for the production of up to 4m diameter tube. The CFW process utilises a
thermoset matrix with UV cure, reporting production rates of up to 50 meters per hour
[43, 44]. Despite these recent advances in FW the problem of longitudinal fibre
placement and inability to form sharp edges continues to limit this method to closed
hollow gently rounded structures under radial and hoop stress loads.
Fig 1-14 Modern fibre winding equipment capable of producing 48m/hr of (2J600mm
GFRPtube
Summary
Winding processes appear limited to the production of closed hollow sections.
Development of winding processes for blade production should only be pursued if the
manufacturer is content to be constrained to a structural box section spar design.
Additionally, successful rapid production of the spar component requires an equally
rapid method of shell production to be developed. AFP is considered a flexible process
capable of producing all WTRB components. The process is very similar to ATL with the
ability to lay individual tows resulting in a material delivery head with extra flexibility.
However, such flexibility incurs additional cost and reduced deposition rates.
ATL is considered to have the most potential in satisfying the demands of automated
turbine production; an exlstlnq technology with known material attributes offering the
R J Crossley 29
Chapter 1 - Introduction
flexibility to produce all blade components. ATL has proven capability In producing
similar geometry aerospace components. However, the typical wind turbine component
size and material thickness has yet to be achieved. Increased deposition rates and a
reduction In material costs are required for the successful Implementation of ATL in
turbine blade production. Successful development has predicted cost savings of 8% per
annum [45] In addition to; reduced labour content, Improved repeatability, improved
accuracy of fibre placement, reduced scrap rate and higher fibre volume fraction in
laminates.
1.5 Alms and objectives
The primary aim of this project was to develop ATL for wind turbine blade production,
requiring:-
• A reduction In material cost, switching from high cost toughened aerospace
resins with carbon fibres to low cost simple epoxy BPAresins with E-glass fibres.
• Wind turbine compatible materla/s, Using low exotherm resins to allow the curing
of thick laminates.
• An increase in deposition rates, Facilitated by increasing the FAW thickness of
prepregs.
• A reduction In tooling cost, To produce low cost fibreglass tooling using typical
wind turbine industry methods suitable for ATL.
Alms and objectives evolved with the project In reaction to problems which occurred in
satisfying the primary aim. During the trials of these new materials tack and stiffness
properties of the ATL prepreg were found to significantly affect lay-up performance.
However, a reliable method of quantifying tack limited the understanding of the process
and the ability to develop new materials. Therefore, a number of secondary aims
emerged:-
• Develop a new method to quantify prepreg tack and stiffness
• Characterise existing prepreg
• Study the effects of variables
Throughout the experimental study results were occasionally confusing and
contradictory to current composites Industrial experience. However, greater
understanding of tack was found within the Pressure Sensitive Adhesives (PSA) field
where results were often related to polymer melt behaviour and rheology. These
additional alms were then set to establish the applicability of PSA and polymer melt
theories to prepreg tack and stlffness:-
R J Crossley 30
Chapter 1 - Introduction
• Relate results to PSA research
• Relate results to resin rheology
• Establish the applicability of the tlme-temperature-superposltlon principle
• Relate results to molecular theory
1.6 Theme of this work
The work presented here has formed part of a TSB funded research project entitled
AIRPOWER. Several publications have resulted from this thesis (Appendix A). The
project was concerned with the development of rapid automated techniques for the
production of large scale off shore turbine blades with the Integration of optical fibre
sensors. The aim of this thesis was the development of ATL for wind turbine blade
production. New low cost low exotherm ATL materials were developed but proved
problematic in production and feasibility trials (Chapter 4.1). A review of the ATL
process Indicated that the success and performance of ATL is particularly sensitive to
the tack and stiffness properties of prepreg materials (Chapter 5.6). However, the lack
of a reliable method for quantifying tack limits the understanding of the process and
ability to develop new materials. Therefore, a new test was developed which quantifies
tack and stiffness during a simulated ATL application process (Chapter 3.3). The new
tack and stiffness test was then used to investigate the effect of process and material
variables (Chapter 3.5).
Greater understanding and explanation could be found In the comparison of results to
those found in Pressure Sensitive Adhesives (PSA) research where results are related to
polymer melt theory and rheology. The time temperature superposition principle, found
applicable to PSAs, was also discovered to be applicable to the tack and stiffness of
prepregs (Chapter 4.5). The theoretical implications of this relationship and
rationalisation of results are then discussed (Chapter 5.4.3). Tack and stiffness results
were then related to material tack performance during ATL lay-up in experimental trials.
The application of the new characterisation method and newly discovered time
temperature relationship for prepreg speCification and ATL performance are discussed
(Chapter 5). Major conclusions are then drawn on all aspects of this work suggesting
standardisation of prepreg tack characterisation and significant Improvements to
automated prepreg procesSing may now be possible (Chapter 6 at 7).
R J Crossley 31
Chapter 2 - Literature review
2 Literature review
Review of literature and commercial experience regarding prepreg and the ATL process
indicates that tack to the mould surface is considered to be a major component of
successful lay-up. The ATL feasibility study confirms that both tack and stiffness of the
prepreg playa vital role. Tack Is also considered of equal Importance in AFP and to a
lesser extent In prepreg hand lay-up and fibre winding processes. Therefore, existing
commercial and scientific back ground literature is reviewed for both prepreg tack and
stiffness. The results and methods applied in the study of prepreg tack appear to have
stemmed from the study of pressure sensitive adhesives (PSA) where tack has been
studied more Intensely. In the study of PSAs tack has been related to the rheological
and molecular properties of the resin. An important relationship between the effects of
time and temperature on PSA tack has been observed during cohesive failure which
allows tack to be rationalised based on molecular theory. A background to molecular
theory Is required to discuss results from tack testing which are difficult to explain on
the macro scale.
2.1 Prepreg materials
An overview of prepreg component materials and production processes utilising prepreg
are available In the introduction (Chapter 1.2.3 and 1.3). The details of prepreg resin,
Impregnation methods and specification are discussed here.
2.1.1 Production
Prepreg Is produced by impregnating reinforcement fibres with resin to form a pre-
Impregnated, hence 'prepreg', fabric which can be cut and positioned easily. Four types
of prepreg production methods are typically utilised [46]; solution dip, solution spray,
direct hot melt coat and film calendaring. Filming processes are said to be faster and
cheaper, with solution methods utilised only when certain resin formulations prevent
filming [46]. In each of the methods the resin is partially reacted, termed beta or b-
stage, to give the correct degree of tack [46]. The hot melt film Impregnation method
was utilised for the production of prepregs used In this study. Hot melt film transfer
prepregging consists of four basic operations [47]:-
1. A resin film of uniform thickness is produced on backing paper. Precise control
of film thickness Is essential to control final prepreg resin content.
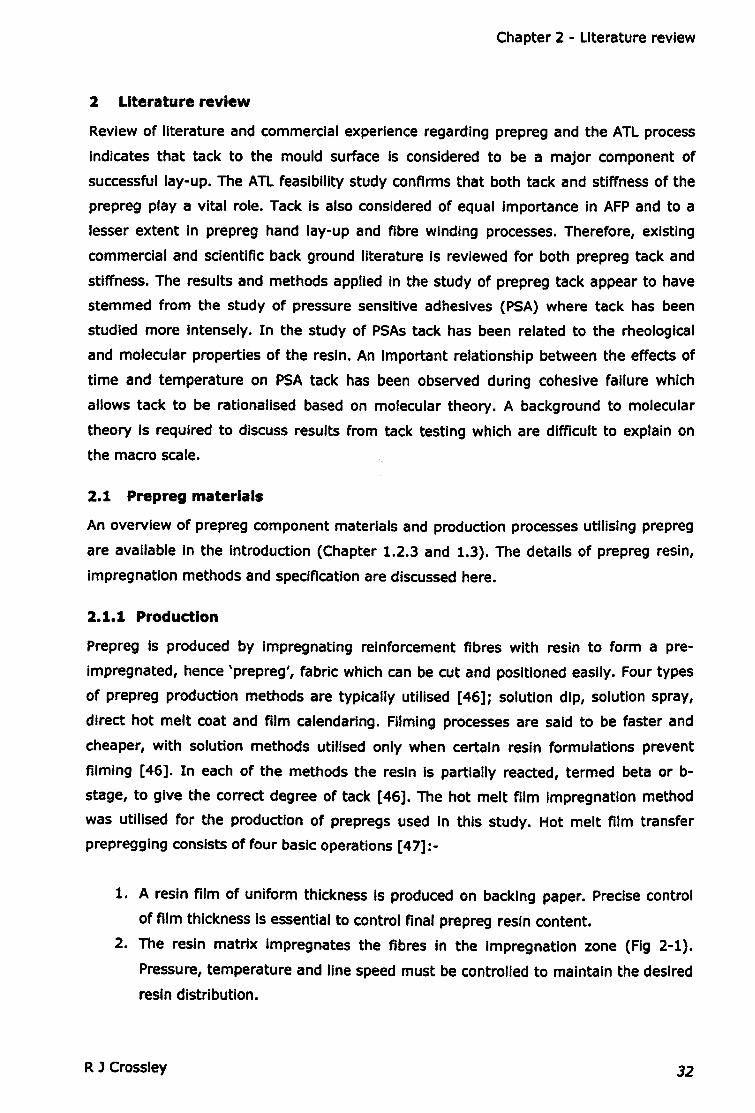
2. The resin matrix Impregnates the fibres in the Impregnation zone (Fig 2-1).
Pressure, temperature and line speed must be controlled to maintain the desired
resin distribution.
R J Crossley 32
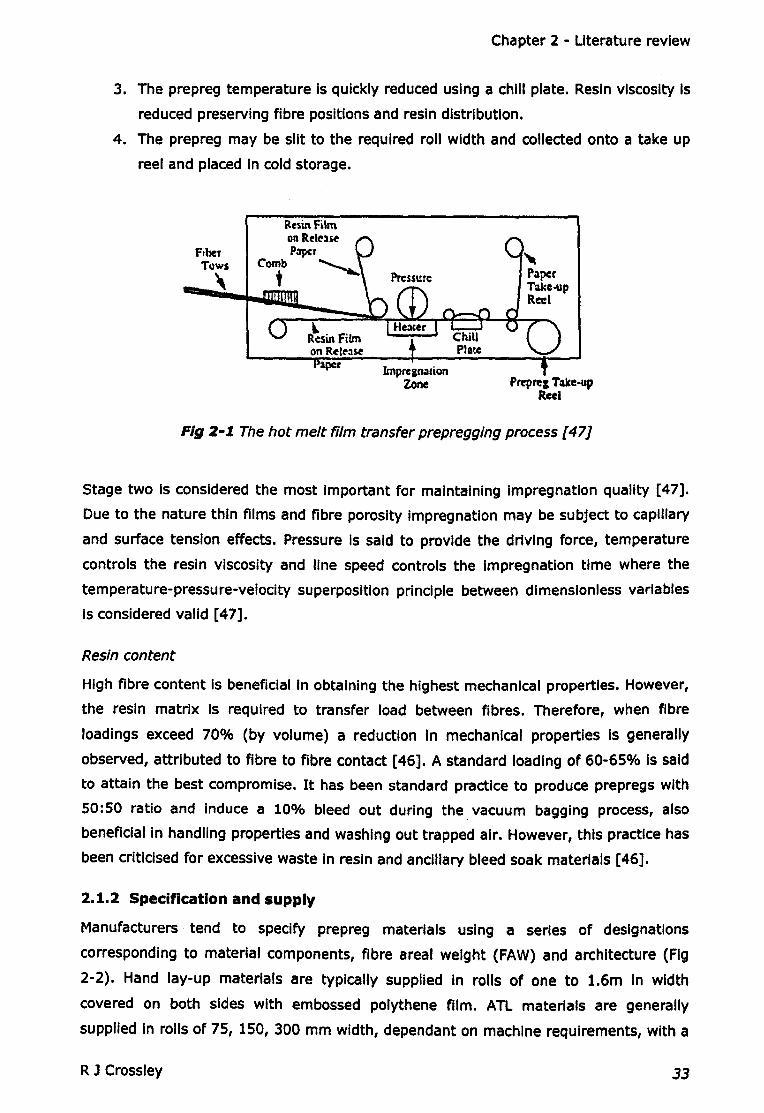
Chapter 2 - Literature review
3. The prepreg temperature Is quickly reduced using a chili plate. Resin viscosity Is
reduced preserving fibre positions and resin distribution.
4. The prepreg may be slit to the required roll width and collected onto a take up
reel and placed In cold storage.
rhSin Filmon Releos.e
Fig 2-1 The hot melt film transfer prepregging process [47]
Stage two Is considered the most Important for maintaining Impregnation quality [47].
Due to the nature thin films and fibre porosity Impregnation may be subject to capillary
and surface tension effects. Pressure Is said to provide the driving force, temperature
controls the resin viscosity and line speed controls the Impregnation time where the
temperature-pressure-veloclty superposition principle between dimensionless variables
is considered valid [47].
Resin content
High fibre content Is beneficial In obtaining the highest mechanical properties. However,
the resin matrix Is required to transfer load between fibres. Therefore, when fibre
loadings exceed 70% (by volume) a reduction In mechanical properties Is generally
observed, attributed to fibre to fibre contact [46]. A standard loading of 60-65% Is said
to attain the best compromise. It has been standard practice to produce prepregs with
50:50 ratio and Induce a 10% bleed out during the vacuum bagging process, also
benefiCial in handling properties and washing out trapped air. However, this practice has
been criticised for excessive waste In resin and ancillary bleed soak materials [46].
2.1.2 Specification and supply
Manufacturers tend to specify prepreg materials using a series of designations
corresponding to material components, fibre areal weight (FAW) and architecture (Fig
2-2). Hand lay-up materials are typically supplied In rolls of one to 1.6m In width
covered on both sides with embossed polythene film. ATL materials are generally
supplied in rolls of 75, 150, 300 mm width, dependant on machine requirements, with a
R J Crossley 33
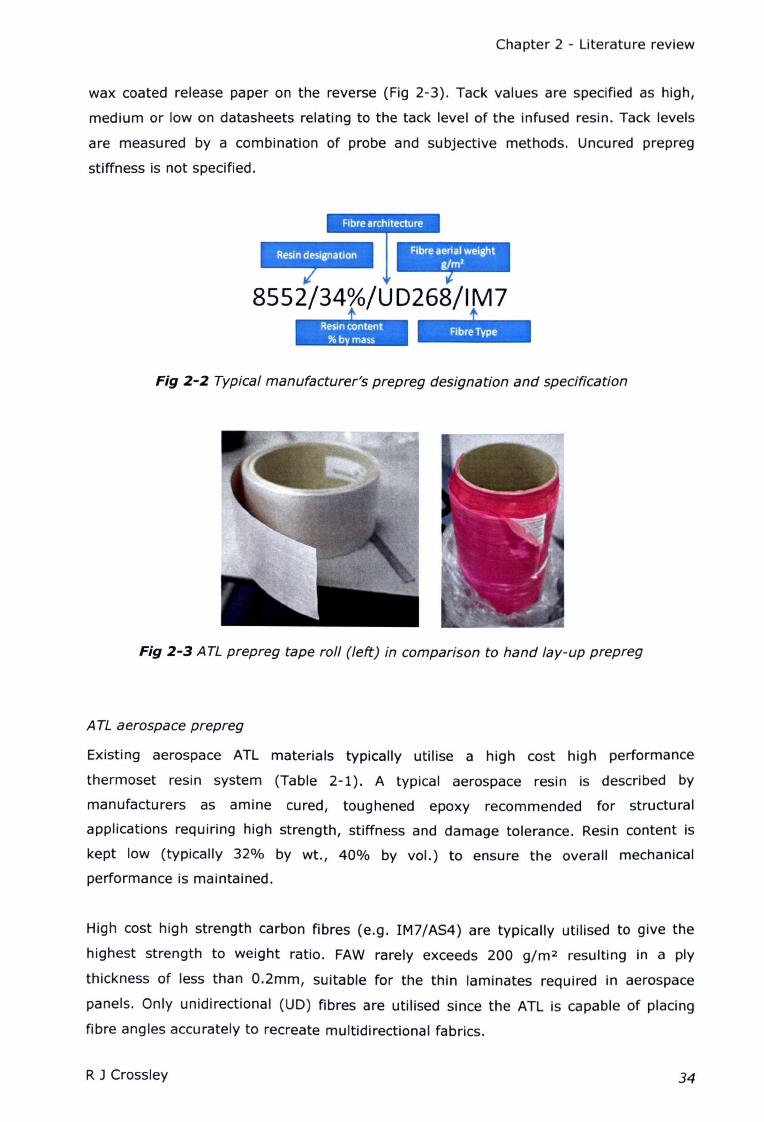
Chapter 2 - Literature review
wax coated release paper on the reverse (Fig 2-3). Tack values are specified as high,
medium or low on datasheets relating to the tack level of the infused resin. Tack levels
are measured by a combination of probe and subjective methods. Uncured prepreg
stiffness is not specified.
Fibre architecture
aerial weightg/m2
/UD268/IM7
--Fig 2-2 Typical manufacturer's prepreg designation and specification
Fig 2-3 ATL prepreg tape roll (left) in comparison to hand lay-up prepreg
ATL aerospace prepreg
Existing aerospace ATL materials typically utilise a high cost high performance
thermoset resin system (Table 2-1). A typical aerospace resin is described by
manufacturers as amine cured, toughened epoxy recommended for structural
applications requiring high strength, stiffness and damage tolerance. Resin content is
kept low (typically 32% by wt., 40% by vol.) to ensure the overall mechanical
performance is maintained.
High cost high strength carbon fibres (e.g. 1M7IAS4) are typically utilised to give the
highest strength to weight ratio. FAW rarely exceeds 200 g/m2 resulting in a ply
thickness of less than 0.2mm, suitable for the thin laminates required in aerospace
panels. Only unidirectional (UD) fibres are utilised since the ATL is capable of placing
fibre angles accurately to recreate multidirectional fabrics.
R J Crossley 34
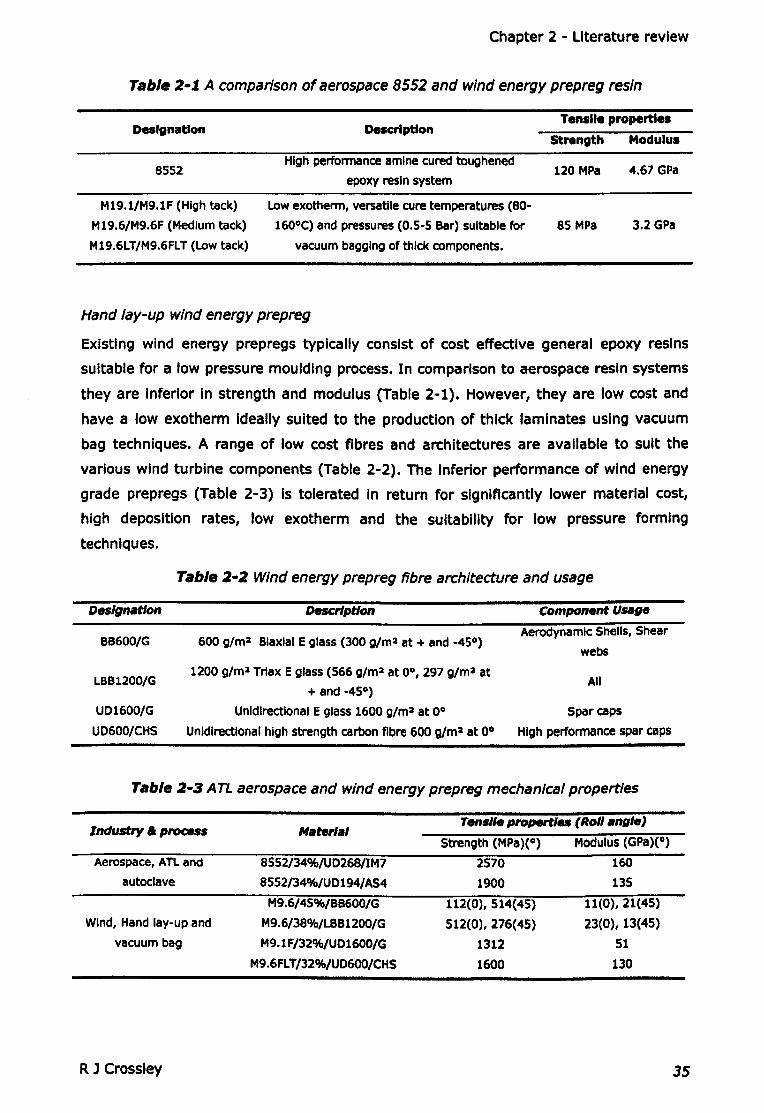
Chapter 2 - Literature review
Table 2-1 A comparison of aerospace 8552and wind energy prepreg resin
Designation DescriptionTensl'e propertl ..
Strength Modulu.
8552High performance amine cured toughened
epoxy resin system120 MPa 4.67 GPa
M19.1/M9.1F (High tack) Low exotherrn, versatile cure temperatures (SO-
M19.6/M9.6F (Medium tack) 160°C) and pressures (0.5-5 Bar) suitable for 85 MPa 3.2 GPa
M19.6LT/M9.6FLT (Low tack) vacuum bagging of thick components.
Hand lay-up wind energy prepreg
Existing wind energy prepregs typically consist of cost effective general epoxy resins
suitable for a low pressure moulding process. In comparison to aerospace resin systems
they are Inferior in strength and modulus (Table 2-1). However, they are low cost and
have a low exotherm Ideally suited to the production of thick laminates using vacuum
bag techniques. A range of low cost fibres and architectures are available to suit the
various wind turbine components (Table 2-2). The Inferior performance of wind energy
grade prepregs (Table 2-3) Is tolerated In return for significantly lower material cost,
high deposition rates, low exotherm and the suitability for low pressure forming
techniques.
Table 2-2 Wind energy prepreg fibre architecture and usage
DesIgnation DeKrlption Component u..".
BB600/G 600 g/m2 Biaxial E glass (300 glm2 at + and -45°)Aerodynamic Shells, Shear
webs
LBB1200/G1200 g/m'1.Trlax Eglass (566 glm'1.at 0°,297 g/m 2 at
All+ and -45°)
UD1600/G Unidirectional E glass 1600 glm'1.at 0° Spar caps
UD600/CHS Unidirectional high strength carbon fibre 600 91m2 at 0° High performance spar caps
Table 2-3 ATL aerospace and wind energy prepreg mechanical properties
Industry. procea I4lJterlalTen.,1e propertIa (Roll angle)
Strength (MPa)(O) Modulus (GPa)(O)
Aerospace, ATL and S552/34%/UD268/IM7 2570 160
autoclave 8552/34%/UD194/AS4 1900 135
M9.6/45%/BB600/G 112(0), 514(45) 11(0), 21(45)
Wind, Hand lay-up and M9.6/38%/LBB1200/G 512(0),276(45) 23(0), 13(45)
vacuum bag M9.1F/32%/UD1600/G 1312 51
M9.6FLT/32%/UD600/CHS 1600 130
R J Crossley 35
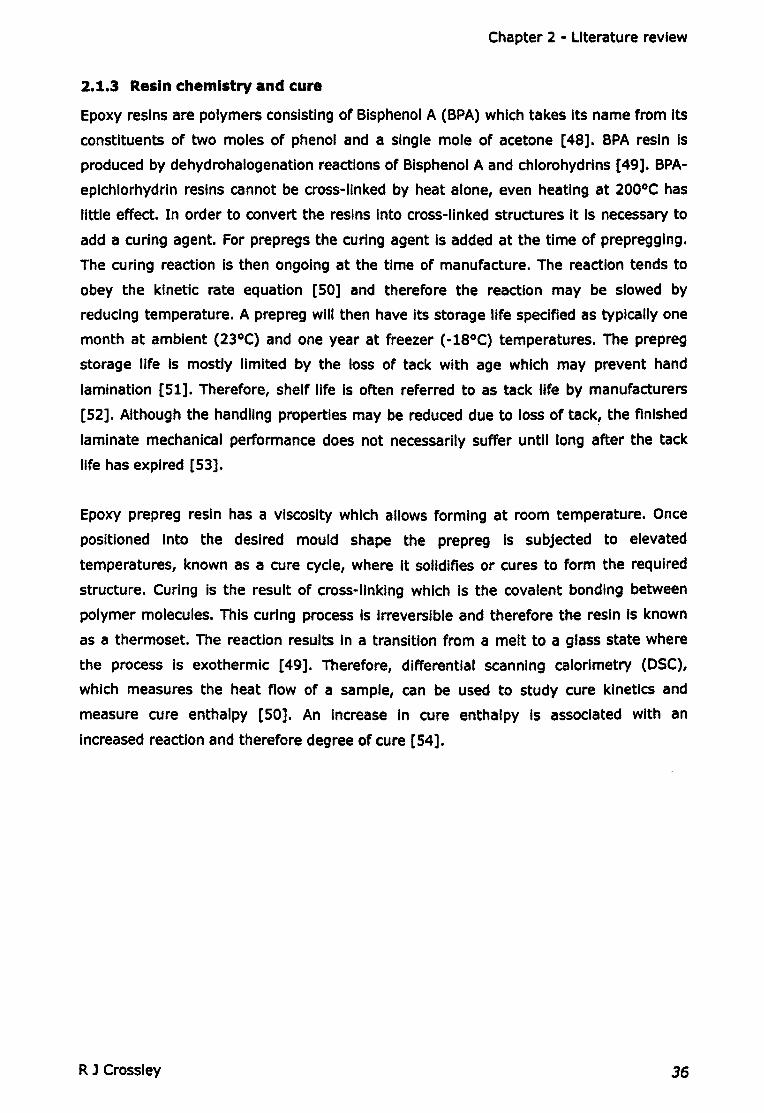
Chapter 2 - Literature review
2.1.3 Resin chemistry and cure
Epoxy resins are polymers consisting of Blsphenol A (BPA) which takes Its name from Its
constituents of two moles of phenol and a single mole of acetone [48]. BPA resin Is
produced by dehydrohalogenatlon reactions of Blsphenol A and chlorohydrlns [49]. BPA-
eplchlorhydrln resins cannot be cross-linked by heat alone, even heating at 200°C has
little effect. In order to convert the resins into cross-linked structures It Is necessary to
add a curing agent. For prepregs the curing agent Is added at the time of prepregging.
The curing reaction Is then ongoing at the time of manufacture. The reaction tends to
obey the kinetic rate equation [50] and therefore the reaction may be slowed by
reducing temperature. A prepreg will then have Its storage life specified as typically one
month at ambient (23°C) and one year at freezer (-18°C) temperatures. The prepreg
storage life Is mostly limited by the loss of tack with age which may prevent hand
lamination [51]. Therefore, shelf life Is often referred to as tack life by manufacturers
[52]. Although the handling properties may be reduced due to loss of tack, the finished
laminate mechanical performance does not necessarily suffer until long after the tack
life has expired [53].
Epoxy prepreg resin has a viscosity which allows forming at room temperature. Once
positioned Into the desired mould shape the prepreg Is subjected to elevated
temperatures, known as a cure cycle, where It solidifies or cures to form the required
structure. Curing Is the result of cross-linking which Is the covalent bonding between
polymer molecules. This curing process Is Irreversible and therefore the resin Is known
as a thermoset. The reaction results In a transition from a melt to a glass state where
the process Is exothermic [49]. Therefore, differential scanning calorimetry (DSC),
which measures the heat flow of a sample, can be used to study cure kinetics and
measure cure enthalpy [50]. An Increase In cure enthalpy Is assoclated with an
Increased reaction and therefore degree of cure [54].
R J Crossley 36
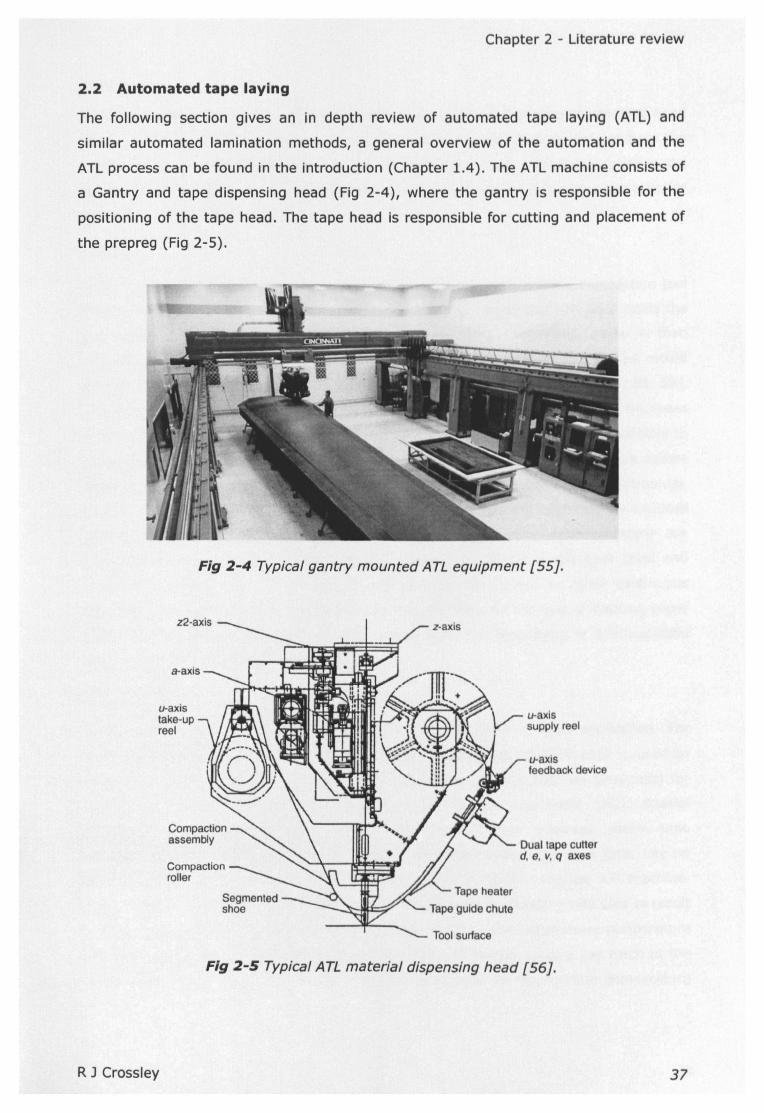
Chapter 2 - Literature review
2.2 Automated tape laying
The following section gives an in depth review of automated tape laying (ATL) and
similar automated lamination methods, a general overview of the automation and the
ATL process can be found in the introduction (Chapter 1.4). The ATL machine consists of
a Gantry and tape dispensing head (Fig 2-4), where the gantry is responsible for the
positioning of the tape head. The tape head is responsible for cutting and placement of
the prepreg (Fig 2-5).
Fig 2-4 Typical gantry mounted ATL equipment [55].
Compactionassembly
u-axlsfeedback device
u-axistake-upreel
Compactionroller
Dual tape cutterd, e, v, q axes
Tool surface
Fig 2-5 Typical ATL material dispensing head [56].
R J Crossley 37
Chapter 2 - Literature review
Cutting
Older machines such as the one used In this study utilise pneumatically operated fixed
blades. Prepreg is held against a wear resistant plate by tape tension and cut from the
prepreg side. The blades require accurate depth settings such that the prepreg Is cut
but the backing paper remains Intact. Newer machines utilise ultrasonic cutting knifes
for Improved performance [36, 57].
Lamination
In the lay-up process prepreg tape Is guided off the spool and under a compaction tool
head with the uncovered surface facing the mould. The compaction tool then holds the
tape against the mould surface under a compaction force. The release paper Is then
removed onto a take up spool In a continuous process. Sufficient tack to the mould
surface and subsequent plies is considered essential for successful lay-up [55, 58, 59].
It Is also suggested that 'the tack levels should remain constant through the thickness
of the ATL tape to ensure splitting does not occur' [55]. However, it is more sensible to
define tape splitting as a result of poor impregnation leading to dry fibre bulk failure
rather than 'Internal tack failure'. Trapped air during lay-up Is considered detrimental,
related to Increase void content within the finished laminate resulting in reduced
mechanical strength [60]. Temperature, feed rate and compaction pressure are
controlled throughout the process and are thought to influence the tack level and
lamination quality. The ATL lamination process may be likened to other continuous
placement methods like AFP, with subtle differences, such as the lack of backing paper
[59] (Chapter 1.4). Similarities are also drawn with the laminating of thermoplastic
tapes which occur at higher temperatures.
Temperature
Lay-up temperature may be Increased 'Iocally at the point of tape application. For
thermoset aerospace prepreg a typical fixed temperature of 26-43°C [55] Is used to
Improve tack [61, 62]. It Is recommended that temperature Is reduced (low tack) for
cutting operations and Increased (high tack) for lay-up operations [58]. Special
temperature conSiderations have been made for low tack prepregs where tape
temperature was slightly increased (37-43°C) proportionately with feed rate. Lay-up
temperatures on such occasions were found by experimentation using the ATL machine.
Excessively low temperatures resulted In lack of tack and overheating was said to result
In tape splitting [63]. The tack of AFP fibre tows are also controlled using temperature
where tow guide chutes are chilled to prevent tack but heated using a gas torch at the
point of lamination [59]. Again, there are no guidelines for appropriate temperature
settings.
R J Crossley 38

Chapter 2 - Literature review
Feed rate and performance
Increased feed rate Is generally desirable as It Is directly proportional to deposition rate,
where deposition rate may be used as an Indicator of performance. Typical lay-up rates
are between 16-26 kg/hour [39, 55]. However, there Is said to be a critical minimum
contact time which places a practical upper bound limit on the lay-up speed, greatly
limiting the cost effectiveness of automated machines [64]. However, the author does
not Identify any changes in the critical contact time which may occur with changes In
material temperature. Feed rate Is adjusted throughout lay-up (Typical range 1-47,900
rnm/rnln) to suit the difficulty of the particular operation and Is usually reduced during
cutting and at the start of lay-up. Dwelling or reducing feed rate over the ends or start
of tape Is recommended for Improved tack performance [64].
Compaction force
A significant compaction force Is applied using a roller or segmented shoe normal to the
mould surface which Is believed to Increase tack and remove trapped air [61]. The
compaction force Is typically fixed throughout lay-up but may change between
machines. A compaction force of 265-1300N Is typical for a 150mm wide segmented
shoe or roller [55]. Two lay-up behaviours have been Identified as pressure and surface
tension driven, where conformed or tacked area Is dependent on either the applied
contact pressure or the surface tension of the resin or rigid surface. In pressure driven
lay-up a force velocity superposition principle Is established, however, in the surface
tension driven behaviour the applied force Is considered unimportant [64]. In AFP the
compaction roller Is said to perform the function of bonding, tacking and de-bulking
which prevents residual stresses, voids and warping by squeezing out trapped air
pockets and Increasing contact area [59].
Mould tooling
High cost, high tolerance (:l::0.035mm [65]), stiff alloy tooling Is typically utilised which
can withstand the compaction pressure of the ATL head. Mould contour angles may be
limited to 15° from the horizontal which could easily be Improved by demand since It Is
a mechanical configuration constraint Imposed by the rotation limits of the delivery
head. Surface energy of the mould Is also considered applicable, since surface tension
driven lay-up behaviour has been Identified where It Is suggested that lay-up on a low
energy surface could be problematic [64]. The thermal properties of the tool material
should also be considered If Increased temperature lay-up Is required. It Is
recommended that materials which act as a heat sink are best avotded. Such mould
materials are blamed for rapid COOlingof the relatively thin matrix preventing good
R J Crossley 39
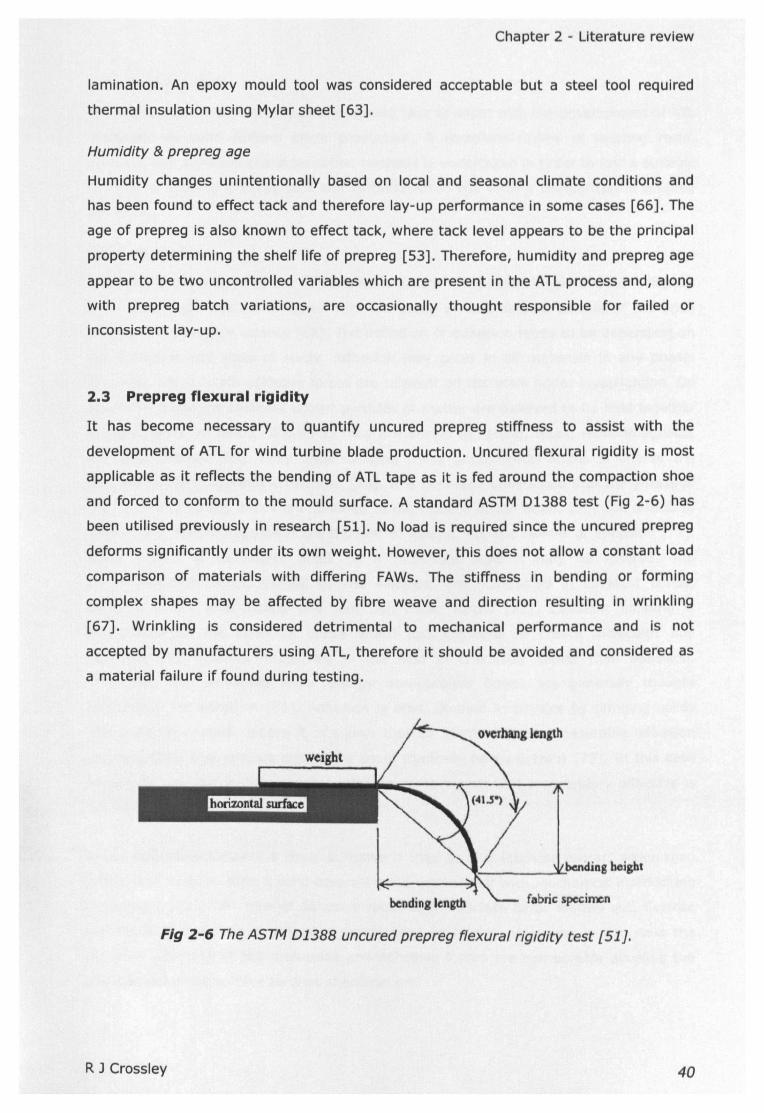
Chapter 2 - Literature review
lamination. An epoxy mould tool was considered acceptable but a steel tool required
thermal insulation using Mylar sheet [63].
Humidity & prepreg age
Humidity changes unintentionally based on local and seasonal climate conditions and
has been found to effect tack and therefore lay-up performance in some cases [66]. The
age of prepreg is also known to effect tack, where tack level appears to be the principal
property determining the shelf life of prepreg [53]. Therefore, humidity and prepreg age
appear to be two uncontrolled variables which are present in the ATL process and, along
with prepreg batch variations, are occasionally thought responsible for failed or
inconsistent lay-up.
2.3 Prepreg flexural rigidity
It has become necessary to quantify uncured prepreg stiffness to assist with the
development of ATL for wind turbine blade production. Uncured flexural rigidity is most
applicable as it reflects the bending of ATL tape as it is fed around the compaction shoe
and forced to conform to the mould surface. A standard ASTM 01388 test (Fig 2-6) has
been utilised previously in research [51]. No load is required since the uncured prepreg
deforms significantly under its own weight. However, this does not allow a constant load
comparison of materials with differing FAWs. The stiffness in bending or forming
complex shapes may be affected by fibre weave and direction resulting in wrinkling
[67]. Wrinkling is considered detrimental to mechanical performance and is not
accepted by manufacturers using ATL, therefore it should be avoided and considered as
a material failure if found during testing.
fabric specimen
Fig 2-6 The ASTM 01388 uncured prepreg flexural rigidity test [51}.
RJ Crossley 40
Chapter 2 - Literature review
2.4 Prepreg tack
It has become necessary to quantify prepreg tack to assist with the development of ATL
materials for wind turbine blade production. A complete review of existing resin,
prepreg, and adhesive characterisation methods Is undertaken In order to find a suitable
method to quantify prepreg tack and stiffness which will allow a comparison of prepreg
materials.
2.4.1 Definition
The term tack Is used In the composites Industry to describe Instantaneous adhesion
before the resin has set or cured with the study of tack said to be one of the open
problems In adhesion science [68]. The definition of adhesion tends to be dependent on
the discipline and scale of study. Adhesion may occur In all materials In any phase.
However, only certain adhesive forces are relevant on the scale under Investigation. On
an atomic scale the smallest known particles of matter are believed to be held together
by four forces, or fields, of nature. They are known as strong, weak, electromagnetic,
and gravitational [69]. Fully understanding these fundamental forces Is one of the
greatest modern scientific challenges [70]. It Is generally understood that the effects of
the weak and strong forces are confined to the nucleus of the atom. Only the effects of
gravity and electromagnetism are thought to extend Into the realms of adhesion [71].
Since gravity Is considered weak on a molecular scale It may be Ignored. The
electromagnetic forces, carried by the electron, are manifested In covalent bonds,
coulomb force, Ionic bonds and Van der Waals forces [71]. Covalent bonding Is
responsible for the chemical bonds which join elements to create molecules and
polymers [72] studied Intensively In the field of chemistry rather than adhesion.
Therefore, the remaining lower energy non-covalent bonds are generally thought
responsible for adhesion [71]. Adhesion Is often studied In physics by bringing solids
Into Intimate contact, where It Is shown that all atoms display measurable adhesion
provided their true contact distance Is small (typically below O.lnm) [73]. In this case
extremely polished surfaces enable Intimate contact such that a secondary adhesive Is
not required.
In the adhesives Industry a liquid adhesive Is used to give Intimate contact which then
hardens or cures to form a solid covalent bond within Itself with mechanical Interlocking
at surfaces [73]. This type of adhesive requires the surface to be wetted out. Surface
wetting is also a type of adhesion experienced by liquids. However, In this case the
cohesive adhesion of like molecules and adhesive forces are comparable allowing the
observation of the surface tension phenomenon.
R J Crossley 41
Chapter 2 - Literature review
The greatest appreciation of tack comes from the pressure sensitive adhesives (PSA)
Industry, where multiple definitions of tack are offered, generally defined as the
resistance of an adhesive film to detachment of a substrate [74]. This resistance
includes the effects of cohesive separation of the adhesive itself and adhesive
separation of the resin and the substrate surface. PSA tack is regarded to be
Instantaneous adhesion occurring with short application times that generally result In
adhesive rather than cohesive failure. For this reason tack Is more likely to be
associated with the probe test because of short application times [75]. Names such as
quick stick, wet tack, finger tack, thumb tack, quick grab, quick adhesion and wettability
have also been used In an attempt to better define tack as an Instantaneous attractive
force obtainable under light pressure application conditions [74].
The definition of prepreg tack originates from Its handling characteristics, which are the
prepregs ability to adhere to the mould and Itself. However, tack should not be so
overwhelming that a misplaced ply cannot be relocated easily [76]. Perceived tack may
also be related to the ability of the prepreg to deform to the mould shape due to the
presence of the fibres [77]. Historically, tack has been defined from a human
perspective to describe adhesion which occurs quickly at room temperature, without
special surface preparation, under finger application pressure. The term tack Is now
extended to Include Instantaneous adhesion which occurs within the ATL production
environment.
2.4.2 Commercial characterl.atlon
A search of International standards reveals the absence of a standardised method for
determining prepreg tack [51]. However, several simple British standard methods exist
relating to PSAs (Fig 2-7), with mechanised commercial versions also available at
Increased cost. These existing standardised methods bear little resemblance to the ATL
process with the exception of the floating roller method. However, this method requires
a separate application stage. The separate application stage signifies that only long
contact times can be Investigated, unreflective of the ATL process. A commercial
prepreg tack testing machine Is available from Accutac Inc. USA, which claims to be the
Industry standard for aeronautics utilised by Boeing [78]. However, there Is an absence
of published material detailing the operational method and supporting such claims. The
excessive cost (>$100k) of this machine also excludes It from use due to budget
constraints.
R J Crossley 42
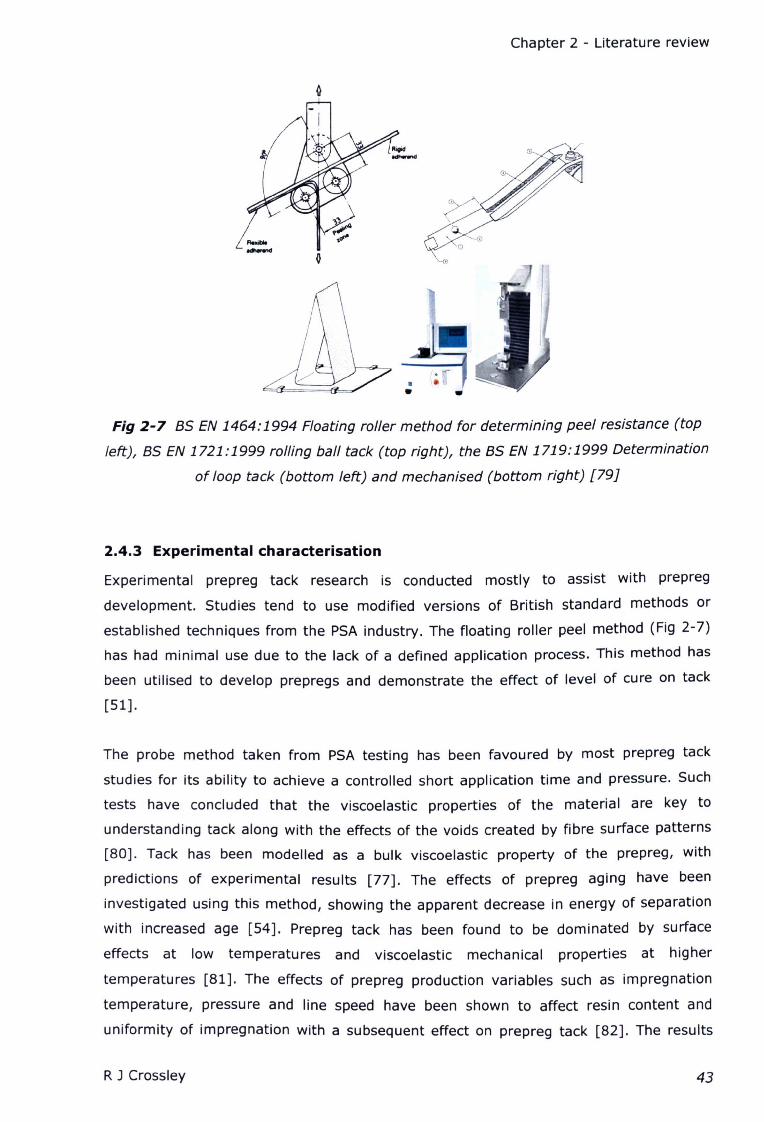
Chapter 2 - Literature review
Fig 2-7 as EN 1464:1994Floating roller method for determining peel resistance (top
left), as EN 1721:1999rolling ball tack (top right), the as EN 1719:1999Determination
of loop tack (bottom left) and mechanised (bottom right) [79]
2.4.3 Experimental characterisation
Experimental prepreg tack research is conducted mostly to assist with prepreg
development. Studies tend to use modified versions of British standard methods or
established techniques from the PSA industry. The floating roller peel method (Fig 2-7)
has had minimal use due to the lack of a defined application process. This method has
been utilised to develop prepregs and demonstrate the effect of level of cure on tack
[51].
The probe method taken from PSA testing has been favoured by most prepreg tack
studies for its ability to achieve a controlled short application time and pressure. Such
tests have concluded that the viscoelastic properties of the material are key to
understanding tack along with the effects of the voids created by fibre surface patterns
[80]. Tack has been modelled as a bulk viscoelastic property of the prepreg, with
predictions of experimental results [77]. The effects of prepreg aging have been
investigated using this method, showing the apparent decrease in energy of separation
with increased age [54]. Prepreg tack has been found to be dominated by surface
effects at low temperatures and viscoelastic mechanical properties at higher
temperatures [81]. The effects of prepreg production variables such as impregnation
temperature, pressure and line speed have been shown to affect resin content and
uniformity of impregnation with a subsequent effect on prepreg tack [82]. The results
R J Crossley 43
Chapter 2 - Literature review
then allow prepreg manufacturers to adjust tack accordingly In a controllable scientific
and experimentally verifiable manner correlated by selecting probe test settings verified
by the study of human tack perception [76, 82]. Recent studies distinguish the effects
of fibres on prepreg tack In comparison to resin films such as surface roughness caused
by fibre patterns, Irregular resin layer thickness and lack of cavitation [83].
2.5 Pressure sensitive adhesives
The Pressure Sensitive Adhesives (PSA) Industry Is thought to be worth $26 billion [84];
major competitors such as BASFand 3M offer products with a range of applications from
packaging to surgical tapes [85]. Generally, a greater depth of research Is carried out,
since the product performance Is dictated by tack properties. PSA tack Is studied using
adhesive resin films and flexible backing substrates. PSA probe, peel and shear tests are
the most commonly used experimental methods for tack testing. Each method Is used
to determine a particular property relating to the function of the product. PSA tack is
considered to be the ability to stick to a surface with light applied pressure and contact
times, therefore, the probe test is favoured [75] (Chapter 2.5.1). Peel tests are used to
quantify the ability of a tape to be peeled easily and cleanly or retained depending on
the Intended application [74, 75] (Chapter 2.5.2). Shear resistance Is considered a
purely cohesive property and is used to determine holding power under constant force,
considered a creep property of the bulk resin [74] (Chapter 0).
2.5.1 Probe testing
The probe test has emerged as a popular analytical tool to evaluate the adhesive
properties of PSAs. A thin resin layer Is placed between two typically flat cylindrical
parallel surfaces under quantified pressure and deflection (Fig 2-8). The tack and
extension Is then recorded during the separation of the two surfaces under a constant
rate. Early versions of the test suffered from surface misalignment resulting in poor
reproducibility. Alignment problems were improved In the mid 1980's. The ability to
visualize the probe surface using a transparent contact and 45° mirror gave greater
Insight In the late 1990's.
R J Crossley 44
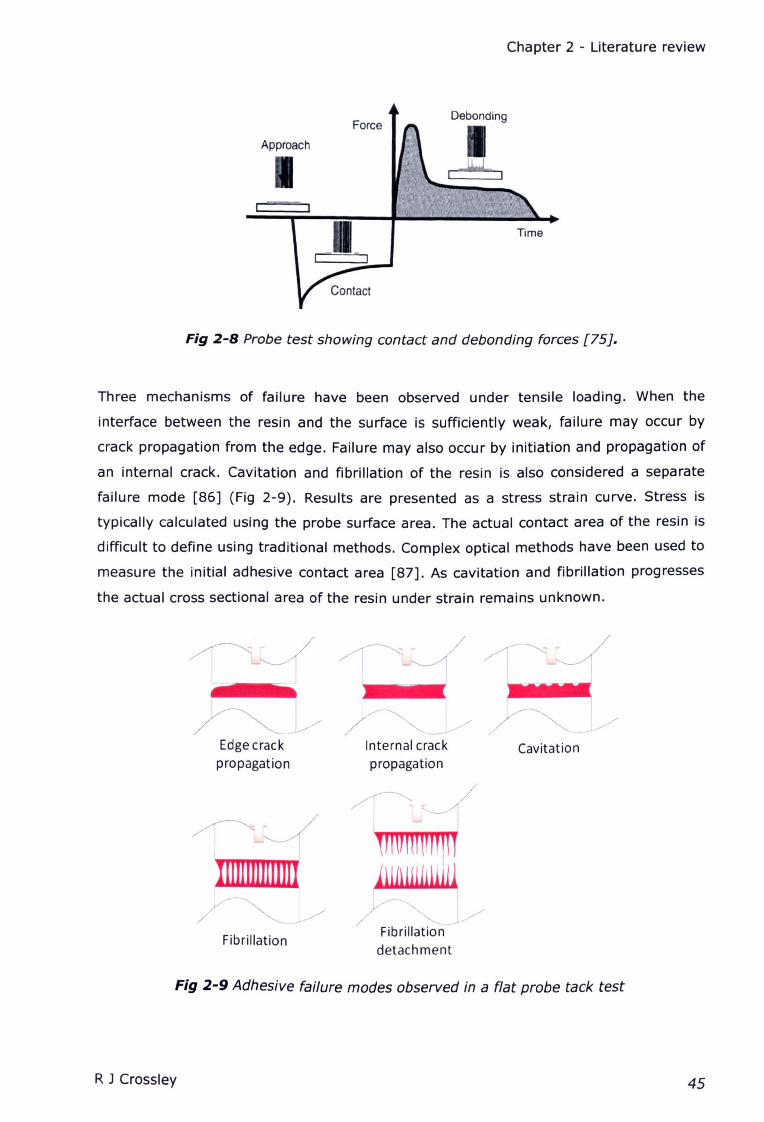
Chapter 2 - Literature review
Approach
ForceDebonding
Fig 2-8 Probe test showing contact and debonding forces [75J.
Three mechanisms of failure have been observed under tensile loading. When the
interface between the resin and the surface is sufficiently weak, failure may occur by
crack propagation from the edge. Failure may also occur by initiation and propagation of
an internal crack. Cavitation and fibrillation of the resin is also considered a separate
failure mode [86] (Fig 2-9). Results are presented as a stress strain curve. Stress is
typically calculated using the probe surface area. The actual contact area of the resin is
difficult to define using traditional methods. Complex optical methods have been used to
measure the initial adhesive contact area [87]. As cavitation and fibrillation progresses
the actual cross sectional area of the resin under strain remains unknown.
Edgecrackpropagation
Internal crackpropagation
Cavitation
_J//
Fibrillationdetachment
Fibrillation
Fig 2-9 Adhesive failure modes observed in a flat probe tack test
R J Crossley 45
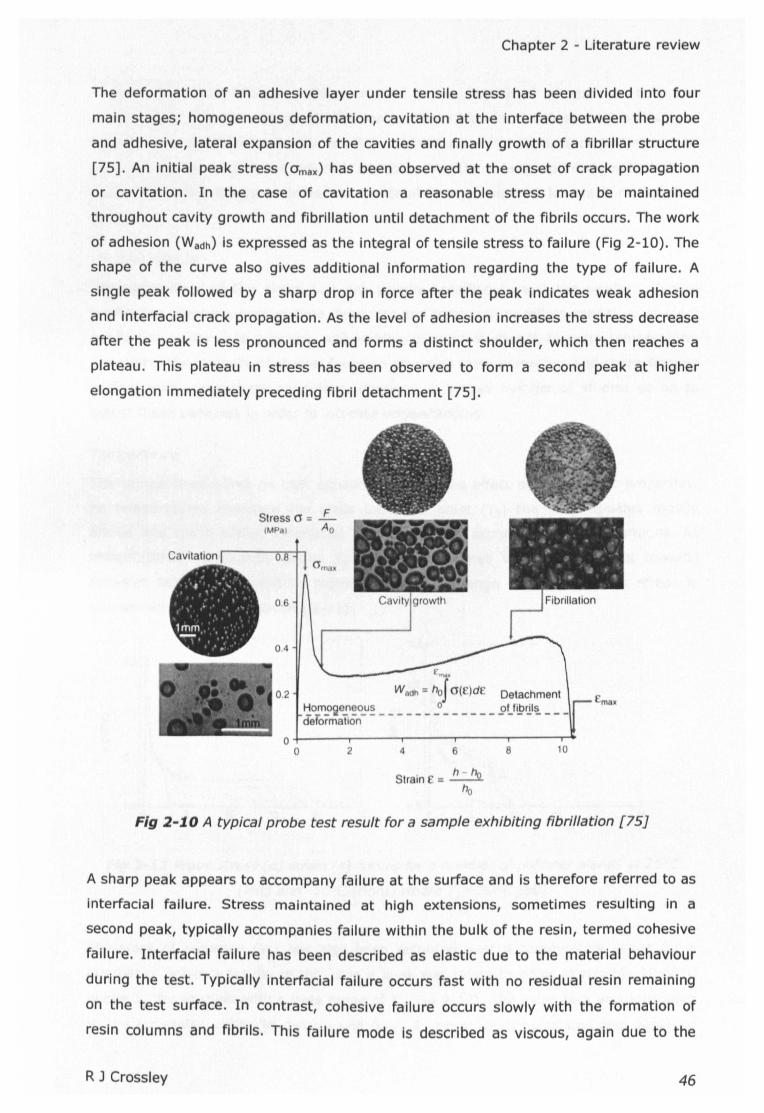
Chapter 2 - Literature review
The deformation of an adhesive layer under tensile stress has been divided into four
main stages; homogeneous deformation, cavitation at the interface between the probe
and adhesive, lateral expansion of the cavities and finally growth of a fibrillar structure
[75]. An initial peak stress (omax) has been observed at the onset of crack propagation
or cavitation. In the case of cavitation a reasonable stress may be maintained
throughout cavity growth and fibrillation until detachment of the fibrils occurs. The work
of adhesion (Wadh) is expressed as the integral of tensile stress to failure (Fig 2-10). The
shape of the curve also gives additional information regarding the type of failure. A
single peak followed by a sharp drop in force after the peak indicates weak adhesion
and interfacial crack propagation. As the level of adhesion increases the stress decrease
after the peak is less pronounced and forms a distinct shoulder, which then reaches a
plateau. This plateau in stress has been observed to form a second peak at higher
elongation immediately preceding fibril detachment [75].
c"""
0.2 Wadh = hoJ cr( )dE Detachment~o~..?2e_n~o_u~ 0 .9UlPQ.l~ __deformalton
Stress o = E:(MPa) Ao
o+-----~----r-----r_----r_---- ..o 2 8 104 6
StrainE= ~ho
Fig 2-.10 A typical probe test result for a sample exhibiting fibrillation [75J
A sharp peak appears to accompany failure at the surface and is therefore referred to as
interfacial failure. Stress maintained at high extensions, sometimes resulting in a
second peak, typically accompanies failure within the bulk of the resin, termed cohesive
failure. Interfacial failure has been described as elastic due to the material behaviour
during the test. Typically interfacial failure occurs fast with no residual resin remaining
on the test surface. In contrast, cohesive failure occurs slowly with the formation of
resin columns and fibrils. This failure mode is described as viscous, again due to the
R J Crossley 46
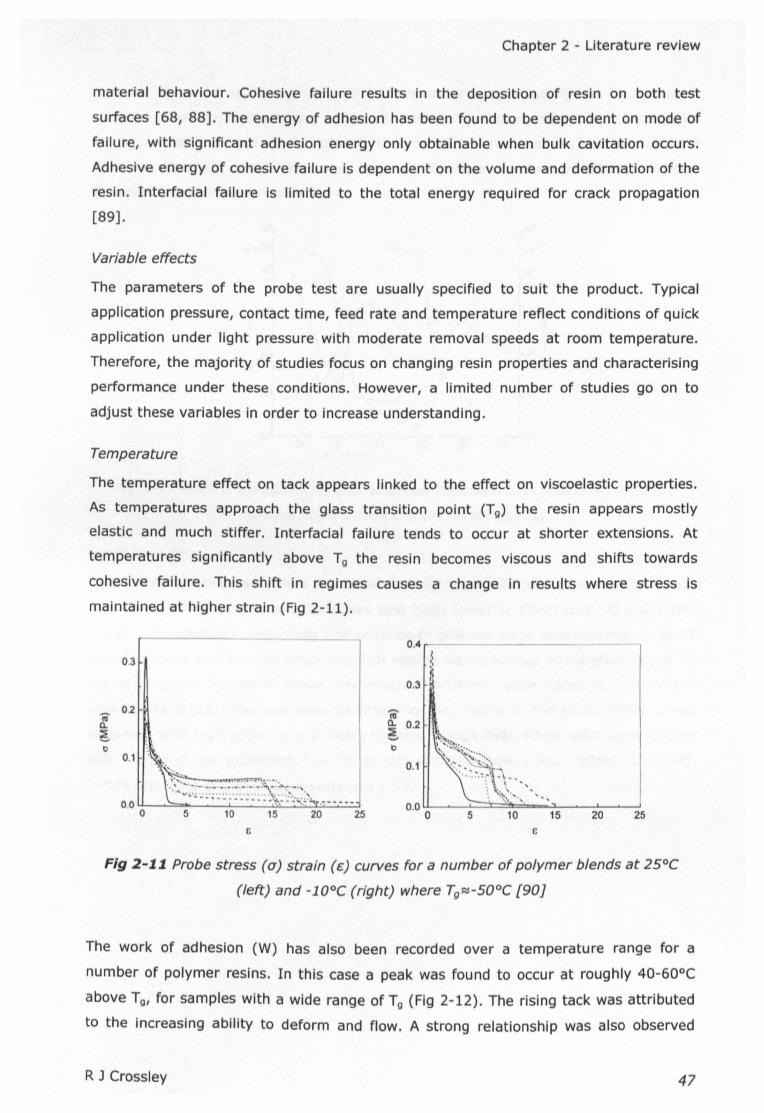
Chapter 2 - Literature review
material behaviour. Cohesive failure results in the deposition of resin on both test
surfaces [68, 88]. The energy of adhesion has been found to be dependent on mode of
failure, with significant adhesion energy only obtainable when bulk cavitation occurs.
Adhesive energy of cohesive failure is dependent on the volume and deformation of the
resin. Interfacial failure is limited to the total energy required for crack propagation
[89].
Variable effects
The parameters of the probe test are usually specified to suit the product. Typical
application pressure, contact time, feed rate and temperature reflect conditions of quick
application under light pressure with moderate removal speeds at room temperature.
Therefore, the majority of studies focus on changing resin properties and characterising
performance under these conditions. However, a limited number of studies go on to
adjust these variables in order to increase understanding.
Temperature
The temperature effect on tack appears linked to the effect on viscoelastic properties.
As temperatures approach the glass transition point (Tg) the resin appears mostly
elastic and much stiffer. Interfacial failure tends to occur at shorter extensions. At
temperatures significantly above Tg the resin becomes viscous and shifts towards
cohesive failure. This shift in regimes causes a change in results where stress is
maintained at higher strain (Fig 2-11).
0.3
to0.2
a..ee
0.1
0.00
. ~.t::::::;':~:-.~:~·i:~·~~~~~~)."._5 10 15 20
e
0.4{
0.3 ~
Iia.. 0.2:!:,_.b
0.1
25 20 25
c
Fig 2-11. Probe stress (a) strain (e) curves for a number of polymer blends at 25°e
(left) and -10oe (right) where Tg';:j-50oe [90]
The work of adhesion (W) has also been recorded over a temperature range for a
number of polymer resins. In this case a peak was found to occur at roughly 40-60oC
above Tg, for samples with a wide range of Tg (Fig 2-12). The rising tack was attributed
to the Increasing ability to deform and flow. A strong relationship was also observed
R J Crossley 47
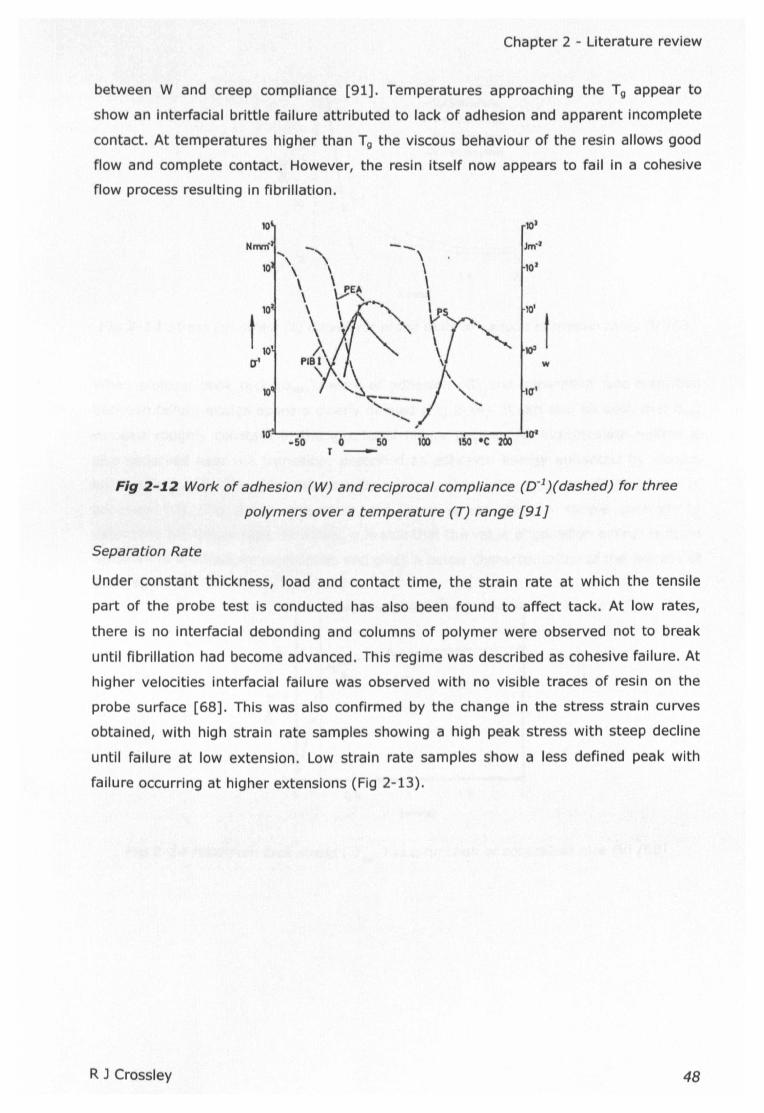
Chapter 2 - Literature review
between Wand creep compliance [91]. Temperatures approaching the Tg appear to
show an Interfacial brittle failure attributed to lack of adhesion and apparent incomplete
contact. At temperatures higher than Tg the viscous behaviour of the resin allows good
flow and complete contact. However, the resin itself now appears to fall in a cohesive
flow process resulting in fibrillation.
10 10'
Nmm"
"-_ Jm·J.... \\
10 \, \ 10J
\ \JE~ \\10J \ \ " v/ :1t 10'
\\ "\ <,), \
0'1 PIa I
\\~--j\"w
\
10 U1'
" ..................
10",
too 150 ·C0"
w50 0 50T-
Fig 2-12 Work of adhesion (W) and reciprocal compliance (D-1)(dashed) for three
polymers over a temperature (T) range [91]
Separation Rate
Under constant thickness, load and contact time, the strain rate at which the tensile
part of the probe test is conducted has also been found to affect tack. At low rates,
there is no interfacial debondlng and columns of polymer were observed not to break
until fibrillation had become advanced. This regime was described as cohesive failure. At
higher velocities interfacial failure was observed with no visible traces of resin on the
probe surface [68]. This was also confirmed by the change in the stress strain curves
obtained, with high strain rate samples showing a high peak stress with steep decline
until failure at low extension. Low strain rate samples show a less defined peak with
failure occurring at higher extensions (Fig 2-13).
R J Crossley 48

Chapter 2 - Literature review
30 I
-V= 5 mm/min
-v = 10 mm/min
V= 20 mm/min20 -v = 50 mm/min
';'~~e
10
o .o 0.5 1
Z[mmJ
1.5 2
Fig 2-1.3 Stress (a) strain (z) curves for probe tests of various extension rates (V)[68J
When plotting peak tack (omax), work of adhesion (G) and separation rate transition
between failure modes appears clearly defined (Fig 2-14). It can also be seen that Omax
remains roughly constant in the interfacial failure regime. An intermediate regime is
also observed near the transition, described as adhesion energy enhanced by viscous
losses in the bulk. This third failure regime is only observable when considering work of
adhesion (G) (Fig 2-15). Therefore, the peak stress gives a simple criterion to
determine the failure type. However, it is said that the value of adhesion energy is more
sensitive to the fracture mechanism and gives a better characterisation of the process of
tack [68].
40
30 •fti"
~Q.
~)(20III
Et)
10
0
0 0,5 1,5 2
V (mm/s)
Fig 2-1.4 Maximum tack stress ( (J'max) as a function of separation rate (V) [68J
RJ Crossley 49
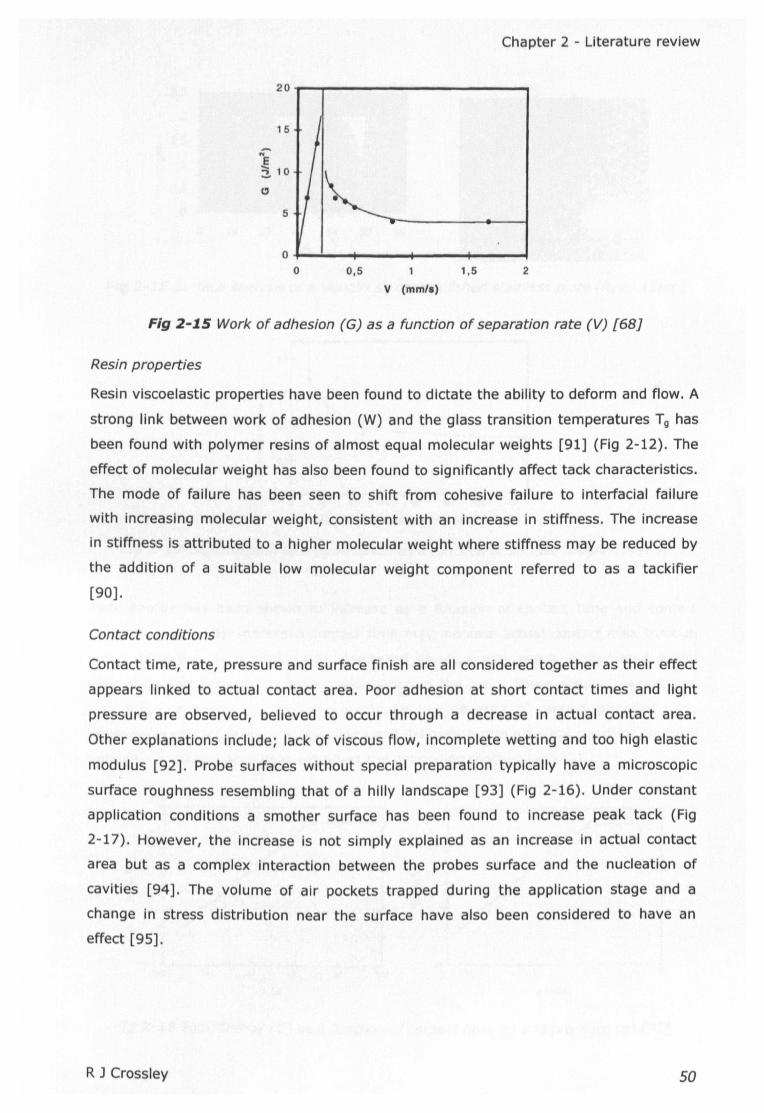
Chapter 2 - Literature review
20
15
-...E~ 10
e
5
0
0 0,5 1 1,5 2
V (mm/.)
Fig 2-l5 Work of adhesion (G) as a function of separation rate (V) [68J
Resin properties
Resin viscoelastic properties have been found to dictate the ability to deform and flow. A
strong link between work of adhesion (W) and the glass transition temperatures Tg has
been found with polymer resins of almost equal molecular weights [91] (Fig 2-12). The
effect of molecular weight has also been found to significantly affect tack characteristics.
The mode of failure has been seen to shift from cohesive failure to interfacial failure
with increasing molecular weight, consistent with an increase in stiffness. The increase
in stiffness is attributed to a higher molecular weight where stiffness may be reduced by
the addition of a suitable low molecular weight component referred to as a tackifier
[90].
Contact conditions
Contact time, rate, pressure and surface finish are all considered together as their effect
appears linked to actual contact area. Poor adhesion at short contact times and light
pressure are observed, believed to occur through a decrease in actual contact area.
Other explanations include; lack of viscous flow, incomplete wetting and too high elastic
modulus [92]. Probe surfaces without special preparation typically have a microscopic
surface roughness resembling that of a hilly landscape [93] (Fig 2-16), Under constant
application conditions a smother surface has been found to Increase peak tack (Fig
2-17). However, the increase Is not simply explained as an increase in actual contact
area but as a complex interaction between the probes surface and the nucleation of
cavities [94]. The volume of air pockets trapped during the application stage and a
change In stress distribution near the surface have also been considered to have an
effect [95].
R J Crossley 50
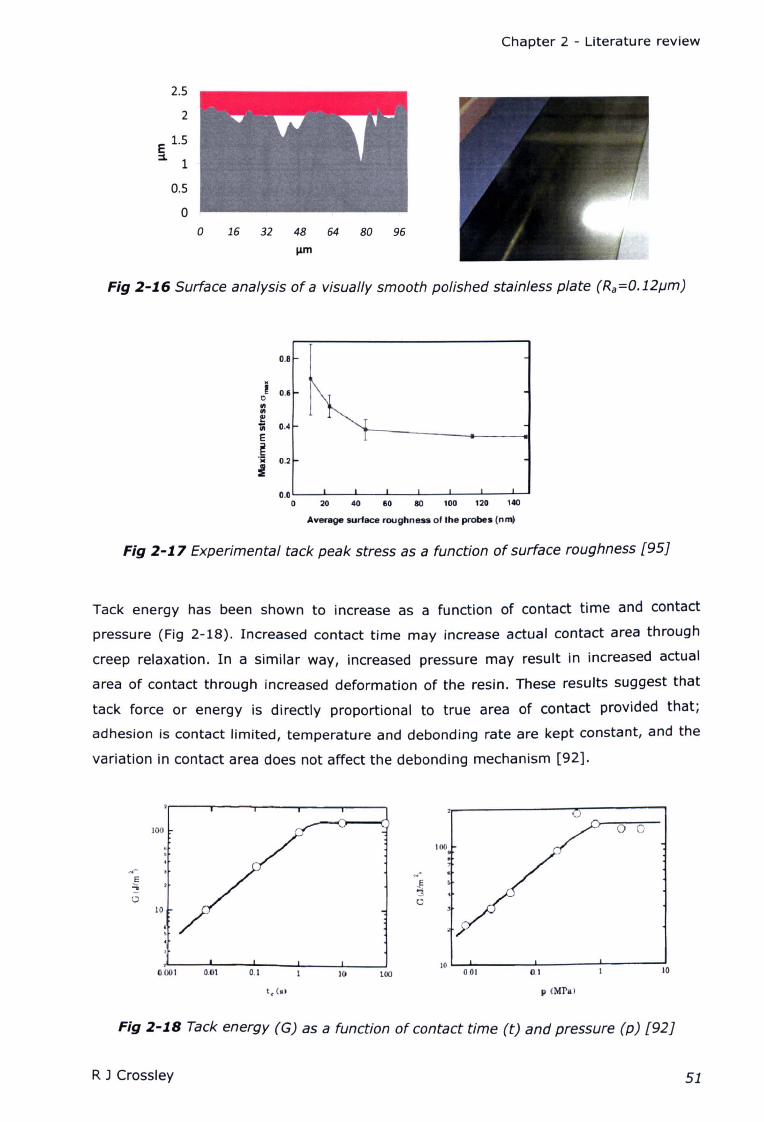
2.5
2
E 1.5:::1
1
0.5
00 16 32 48 64 80 96
11m
Chapter 2 - Literature review
Fig 2-16 Surface analysis of a visually smooth polished stainless plate (Ra=O.12J,JmJ
0.8
ie O.fi
<II<II
e'1ii 004
E
~j 0.2
0.0 L_--I_----I..._-L _ _l..__..I...-_I--_J.__J
o 20 40 sn 80 100 120 140
Average surface roughness of the probes (nm,)
Fig 2-17 Experimental tack peak stress as a function of surface roughness [95]
Tack energy has been shown to increase as a function of contact time and contact
pressure (Fig 2-18). Increased contact time may increase actual contact area through
creep relaxation. In a similar way, increased pressure may result in increased actual
area of contact through increased deformation of the resin. These results suggest that
tack force or energy is directly proportional to true area of contact provided that;
adhesion is contact limited, temperature and debonding rate are kept constant, and the
variation in contact area does not affect the debonding mechanism [92].
lOO 0 0
~-~ .!='3o '3
010
O.()()I 0.01 lOO0.1 1010L.-O.i..OI---....IIl.-1 --_..1...- __ --1
11,)
P (MPs)
Fig 2-18 Tack energy (G) as a function of contact time (t) and pressure (p) [92]
R J Crossley 51
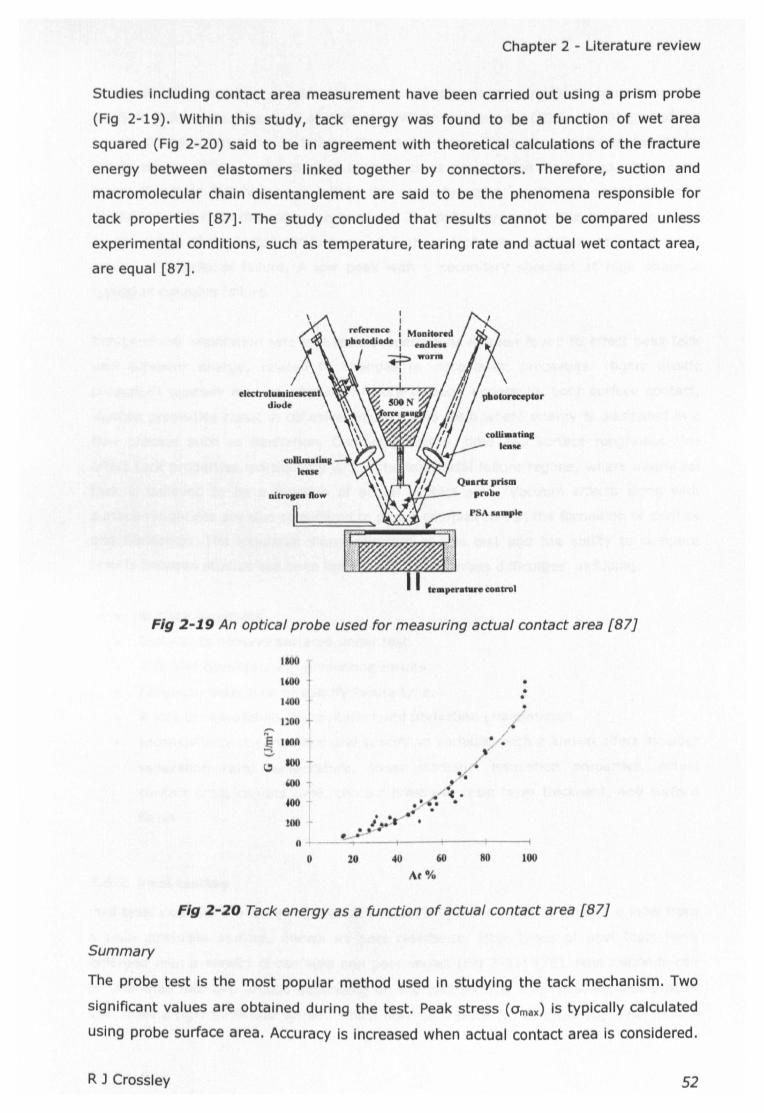
Chapter 2 - Literature review
Studies including contact area measurement have been carried out using a prism probe
(Fig 2-19). Within this study, tack energy was found to be a function of wet area
squared (Fig 2-20) said to be In agreement with theoretical calculations of the fracture
energy between elastomers linked together by connectors. Therefore, suction and
macromolecular chain disentanglement are said to be the phenomena responsible for
tack properties [87]. The study concluded that results cannot be compared unless
experimental conditions, such as temperature, tearing rate and actual wet contact area,
are equal [87].
II
reference : MOllitoredphotocllode: etldle ..
j +p ~fBrm
I
nitroaen now
Fig 2-19 An optical probe used for measuring actual contact area [87J
I~ jI~ ••1400 •
•nee ,.....
~/.€ lt1l00- "100'" /c / .."
'6Oi • •,./".c •
400 • ~1t. •
tOO ~... .
l.:r• • •• .-
0 -0 20 40 60 flO 100
M%
Fig 2-20 Tack energy as a function of actual contact area [87J
Summary
The probe test is the most popular method used in studying the tack mechanism. Two
significant values are obtained during the test. Peak stress (Omax) is typically calculated
using probe surface area. Accuracy is increased when actual contact area is considered.
R J Crossley 52
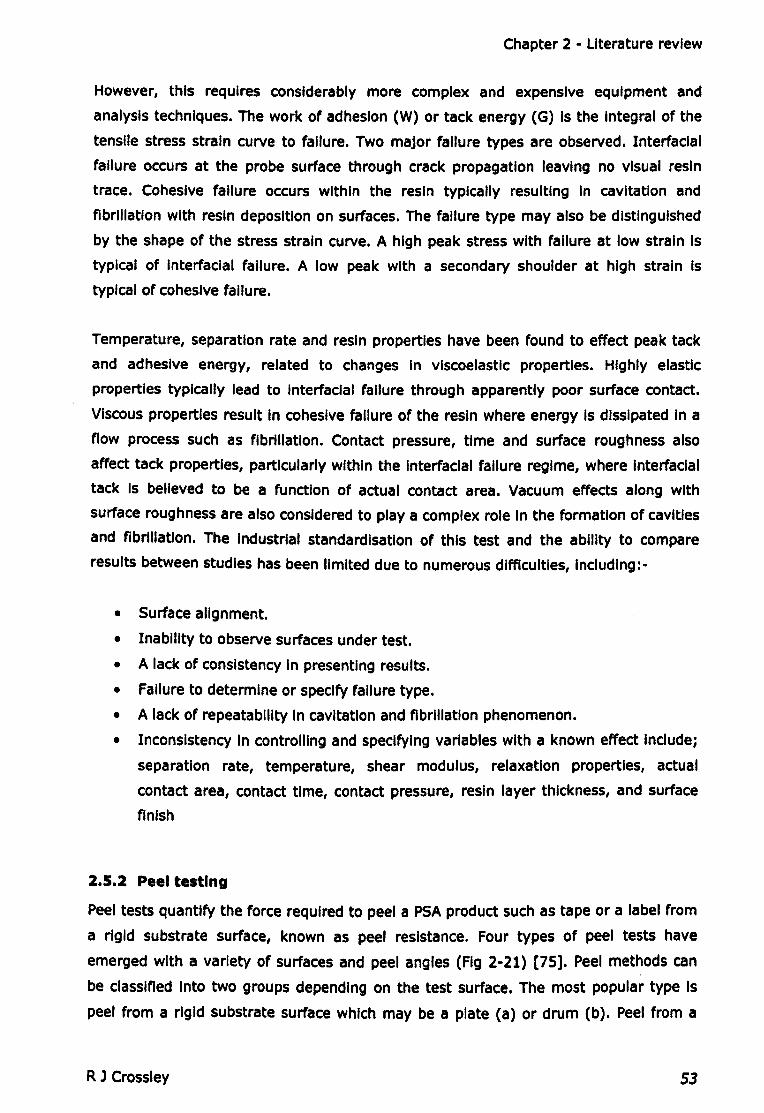
Chapter 2 - Literature review
However, this requires considerably more complex and expensive equipment and
analysis techniques. The work of adhesion (W) or tack energy (G) Is the Integral of the
tensile stress strain curve to failure. Two major failure types are observed. Interfacial
failure occurs at the probe surface through crack propagation leaving no visual resin
trace. Cohesive failure occurs within the resin typically resulting In cavitation and
fibrillation with resin deposition on surfaces. The failure type may also be distinguished
by the shape of the stress strain curve. A high peak stress with failure at low strain Is
typical of Interfacial failure. A low peak with a secondary shoulder at high strain Is
typical of cohesive failure.
Temperature, separation rate and resin properties have been found to effect peak tack
and adhesive energy, related to changes In viscoelastic properties. Highly elastic
properties typically lead to Interfacial failure through apparently poor surface contact.
Viscous properties result In cohesive failure of the resin where energy Is dissipated In a
flow process such as fibrillation. Contact pressure, time and surface roughness also
affect tack properties, particularly within the Interfacial failure regime, where Interfacial
tack Is believed to be a function of actual contact area. Vacuum effects along with
surface roughness are also considered to playa complex role In the formation of cavities
and fibrillation. The Industrial standardisation of this test and the ability to compare
results between studies has been limited due to numerous difficulties, Includlng:-
• Surface alignment.
• Inability to observe surfaces under test.
• A lack of consistency In presenting results.
• Failure to determine or specify failure type.
• A lack of repeatability In cavitation and fibrillation phenomenon.
• Inconsistency In controlling and specifying variables with a known effect Include;
separation rate, temperature, shear modulus, relaxation properties, actual
contact area, contact time, contact pressure, resin layer thickness, and surface
finish
2.5.2 Peel teatlng
Peel tests quantify the force required to peel a PSA product such as tape or a label from
a rigid substrate surface, known as peel resistance. Four types of peel tests have
emerged with a variety of surfaces and peel angles (Fig 2-21) [75]. Peel methods can
be classified Into two groups depending on the test surface. The most popular type Is
peel from a rigid substrate surface which may be a plate (a) or drum (b). Peel from a
R J Crossley 53
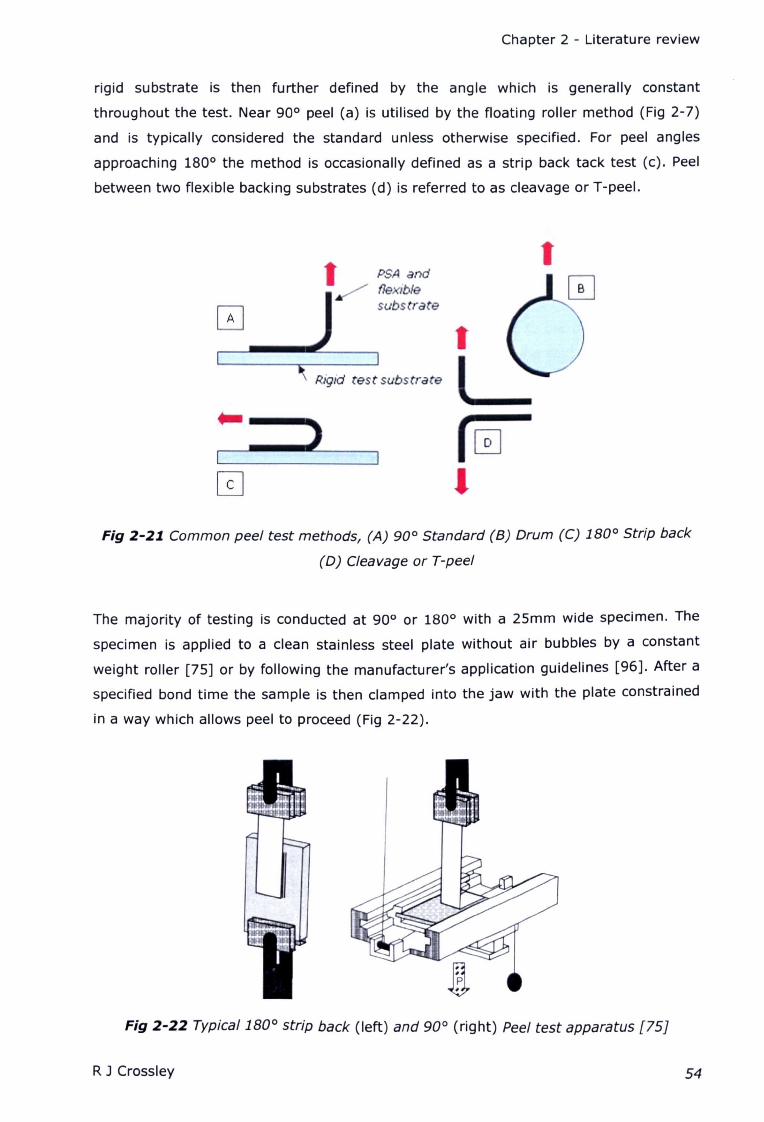
Chapter 2 - Literature review
rigid substrate is then further defined by the angle which is generally constant
throughout the test. Near 900 peel (a) is utilised by the floating roller method (Fig 2-7)
and is typically considered the standard unless otherwise specified. For peel angles
approaching 1800 the method is occasionally defined as a strip back tack test (c). Peel
between two flexible backing substrates (d) is referred to as cleavage or T-peel.
..--....
tPSAandflexiblesubstrate
t
Fig 2-21 Common peel test methods, (A) 900 Standard (8) Drum (C) 1800 Strip back
(D) Cleavage or T-peel
The majority of testing is conducted at 900 or 1800 with a 25mm wide specimen. The
specimen is applied to a clean stainless steel plate without air bubbles by a constant
weight roller [75] or by following the manufacturer's application guidelines [96]. After a
specified bond time the sample is then clamped into the jaw with the plate constrained
in a way which allows peel to proceed (Fig 2-22).
Fig 2-22 Typical 1800 strip back (left) and 900 (right) Peel test apparatus [75J
R J Crossley 54
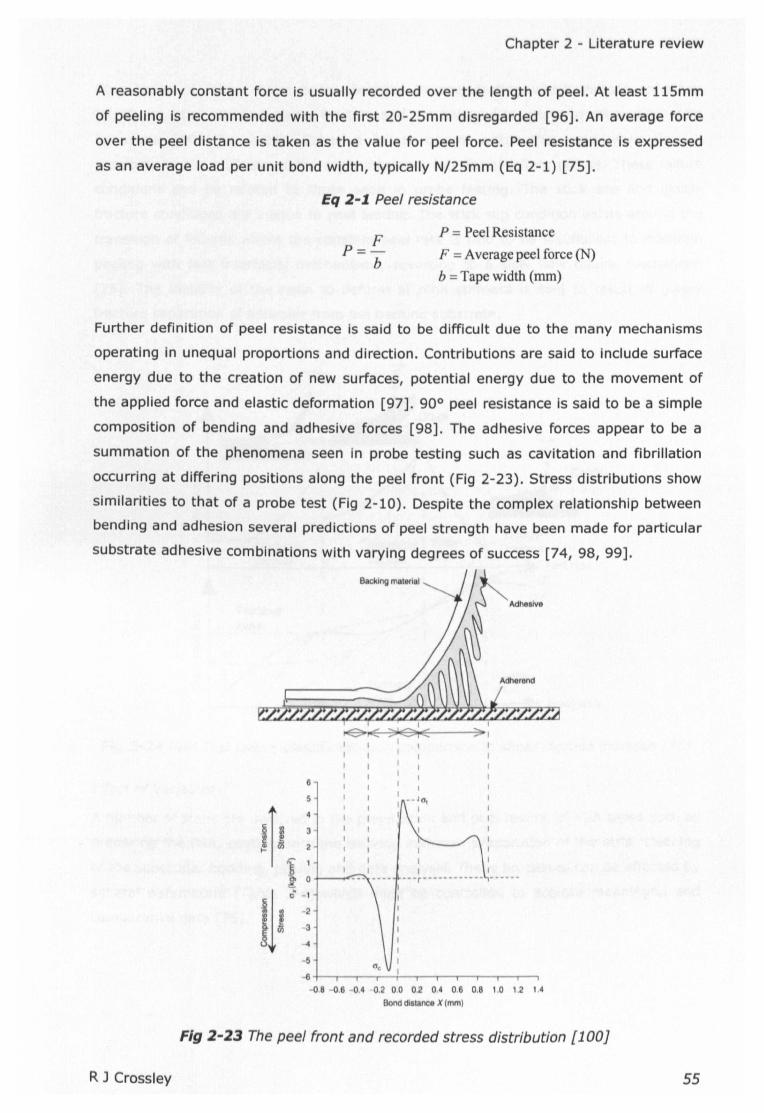
Chapter 2 - Literature review
A reasonably constant force is usually recorded over the length of peel. At least 115mm
of peeling is recommended with the first 20-25mm disregarded [96]. An average force
over the peel distance Is taken as the value for peel force. Peel resistance is expressed
as an average load per unit bond width, typically N/25mm CEq2-1) [75].
Eq 2-1. Peel resistance
Fp=-
b
P = Peel Resistance
F = Average peel force(N)
b = Tape width (mm)
Further definition of peel resistance is said to be difficult due to the many mechanisms
operating in unequal proportions and direction. Contributions are said to include surface
energy due to the creation of new surfaces, potential energy due to the movement of
the applied force and elastic deformation [97]. 90° peel resistance is said to be a simple
composition of bending and adhesive forces [98]. The adhesive forces appear to be a
summation of the phenomena seen In probe testing such as cavitation and fibrillation
occurring at differing positions along the peel front (Fig 2-23). Stress distributions show
similarities to that of a probe test (Fig 2-10). Despite the complex relationship between
bending and adheslon several predictions of peel strength have been made for particular
substrate adhesive combinations with varying degrees of success [74, 98, 99].
6
5
JII :jo.-.-c
IV_i
,,,···r············ .
I
I
5
6+-~~~~~--r-~~~~~08 0.6 0.4 0.2 0.0 0.2 0.4 0.6 0.8 1.0 1.2 1.4
Bond dlatal1Ce X (mm)
Fig 2-23 The peel front and recorded stress distribution [100J
R J Crossley 55
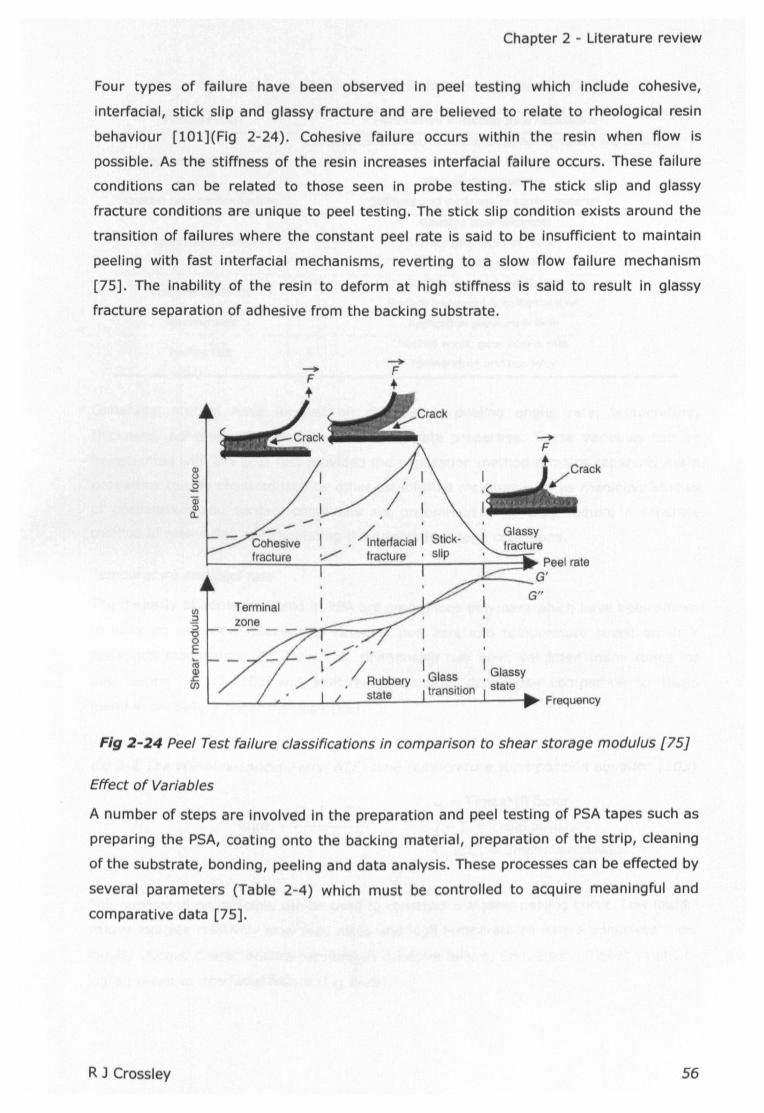
Chapter 2 - Literature review
Four types of failure have been observed in peel testing which Include cohesive,
interfacial, stick slip and glassy fracture and are believed to relate to rheological resin
behaviour [lOl](Fig 2-24). Cohesive failure occurs within the resin when flow is
possible. As the stiffness of the resin Increases interfacial failure occurs. These failure
conditions can be related to those seen in probe testing. The stick slip and glassy
fracture conditions are unique to peel testing. The stick slip condition exists around the
transition of failures where the constant peel rate is said to be Insufficient to maintain
peeling with fast interfacial mechanisms, reverting to a slow flow failure mechanism
[75]. The inability of the resin to deform at high stiffness is said to result in glassy
fracture separation of adhesive from the backing substrate.
-+
- FF..-+F
,
/._' GlassyI ,Interfacial I fracture
I-- _ __;_;_=:..:..::.._,v fra:...;c__tu_re;...,._r-__ .---::::::IP' Peel rate
~-_G'
Terminal
I Glassy, state
Fig 2-24 Peel Test failure classifications in comparison to shear storage modulus [75]
Effect of Variables
A number of steps are involved in the preparation and peel testing of PSA tapes such as
preparing the PSA, coating onto the backing material, preparation of the strip, cleaning
of the substrate, bonding, peeling and data analysis. These processes can be effected by
several parameters (Table 2-4) which must be controlled to acquire meaningful and
comparative data [75].
R J Crossley 56
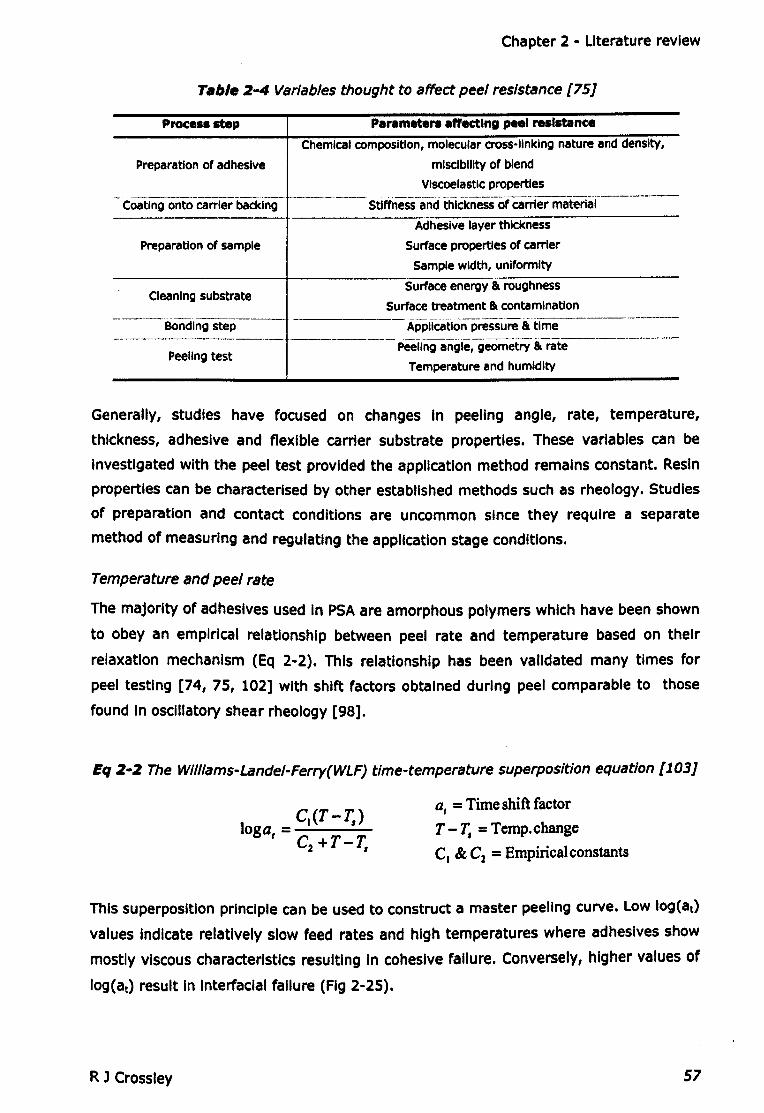
Chapter 2 - Literature review
Tabl.2-4 Variables thought to affect peel resistance [75J
Peeling test
Parameters affecting peel .... IstanceProceu8tep
Chemical composition, molecular cross-linking nature and density,
miscibility of blend
Viscoelastic properties
-Coat-In-go-ntO-ca-rrl-erbacki-ng----------- StiffneSS-andthickness ofca.TIer materla-r---
Preparation of adhesive
Preparation of sample
Adhesive layer thickness
Surface properties of carrier
Sample width, uniformity
Surface energy 8Lroughness
Surface treatment 8Lcontamination---- BOndln-g-s-te-p--- --------- Appifcatton pressure &t--Im-e-----------
Cleaning substrate
---------- Peellngangle,geometrY &rate---------
Temperature and humidity
Generally, studies have focused on changes In peeling angle, rate, temperature,
thickness, adhesive and flexible carrier substrate properties. These variables can be
Investigated with the peel test provided the application method remains constant. Resin
properties can be characterised by other established methods such as rheology. Studies
of preparation and contact conditions are uncommon since they require a separate
method of measuring and regulating the application stage conditions.
Temperature and peel rate
The majority of adhesives used In PSA are amorphous polymers which have been shown
to obey an empirical relationship between peel rate and temperature based on their
relaxation mechanism (Eq 2-2). This relationship has been validated many times for
peel testing [74, 75, 102]with shift factors obtained during peel comparable to those
found In oscillatory shear rheology [98].
Eq 2-2 The Wllllams-Landel-Ferry(WLF) time-temperature superposition equation [103J
a, = Time shift factor
T - T, = Temp.change
Cl & C2 = Empiricalconstants
This superposition principle can be used to construct 8 master peeling curve. Low log(at)
values Indicate relatively slow feed rates and high temperatures where adhesives show
mostly viscous characteristics resulting In cohesive failure. Conversely, higher values of
log (at) result In Interfacial failure (Fig 2-25).
R J Crossley 57
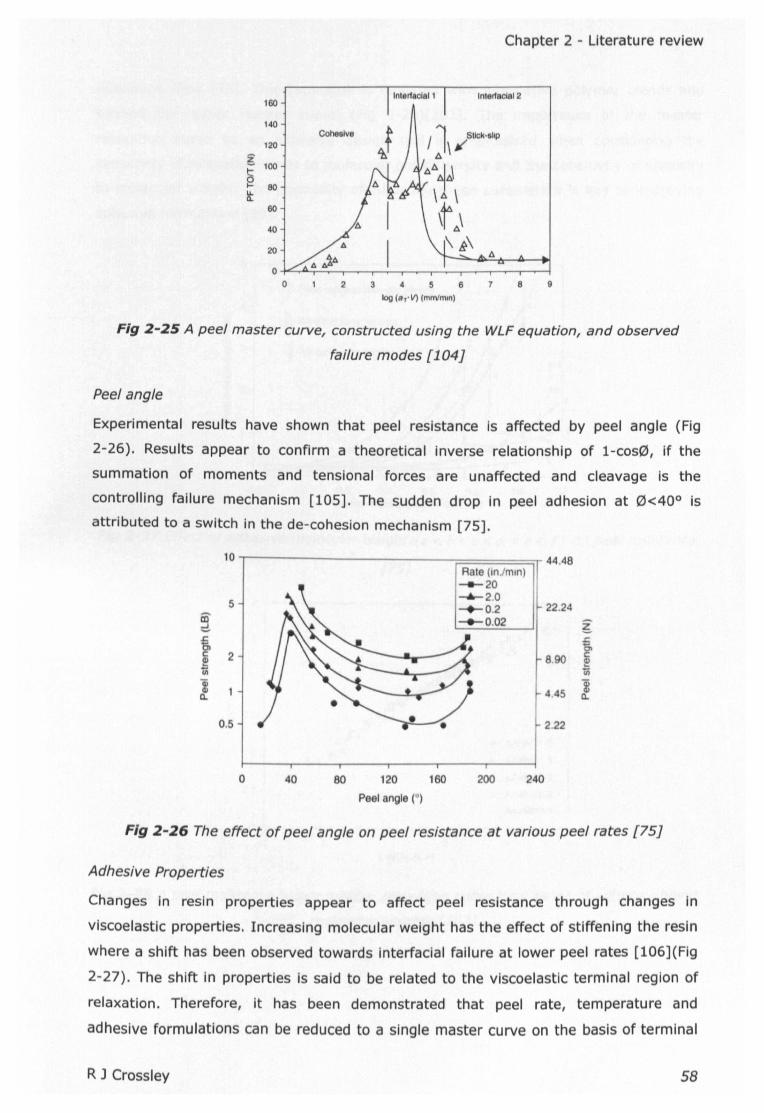
Chapter 2 - Literature review
Inter1aclal2160
140
Il\¥'SIICk'8I1PCohesive120
g t.~
100A616\
It80
\ \60
\ft.\40
20\ ~\
A
2 3 4 5 6 7 8 9
log (BT' V) (mm/mln)
Fig 2-25 A peel master curve, constructed using the WLF equation, and observed
failure modes [104J
Peel angle
Experimental results have shown that peel resistance is affected by peel angle (Fig
2-26). Results appear to confirm a theoretical inverse relationship of r-eese, if the
summation of moments and tensional forces are unaffected and cleavage is the
controlling failure mechanism [105]. The sudden drop in peel adhesion at 121<40°is
attributed to a switch in the de-cohesion mechanism [75].
10 44.48Rate (in.lmln)---20-6-2.0
5 0.2 22.24
~ --'-0.02 ~
~.:;C7I
2 8.90 c:~ ~iii u;
1l 4.45 tCL CL
0.5 2.22
o 40 80 120 160 200 240
Peel angle (0)
Fig 2-26 The effect of peel angle on peel resistance at various peel rates [75J
Adhesive Properties
Changes in resin properties appear to affect peel resistance through changes in
viscoelastic properties. Increasing molecular weight has the effect of stiffening the resin
where a shift has been observed towards interfacial failure at lower peel rates [106](Flg
2-27). The shift In properties Is said to be related to the viscoelastic terminal region of
relaxation. Therefore, it has been demonstrated that peel rate, temperature and
adhesive formulations can be reduced to a single master curve on the basis of terminal
R J Crossley 58
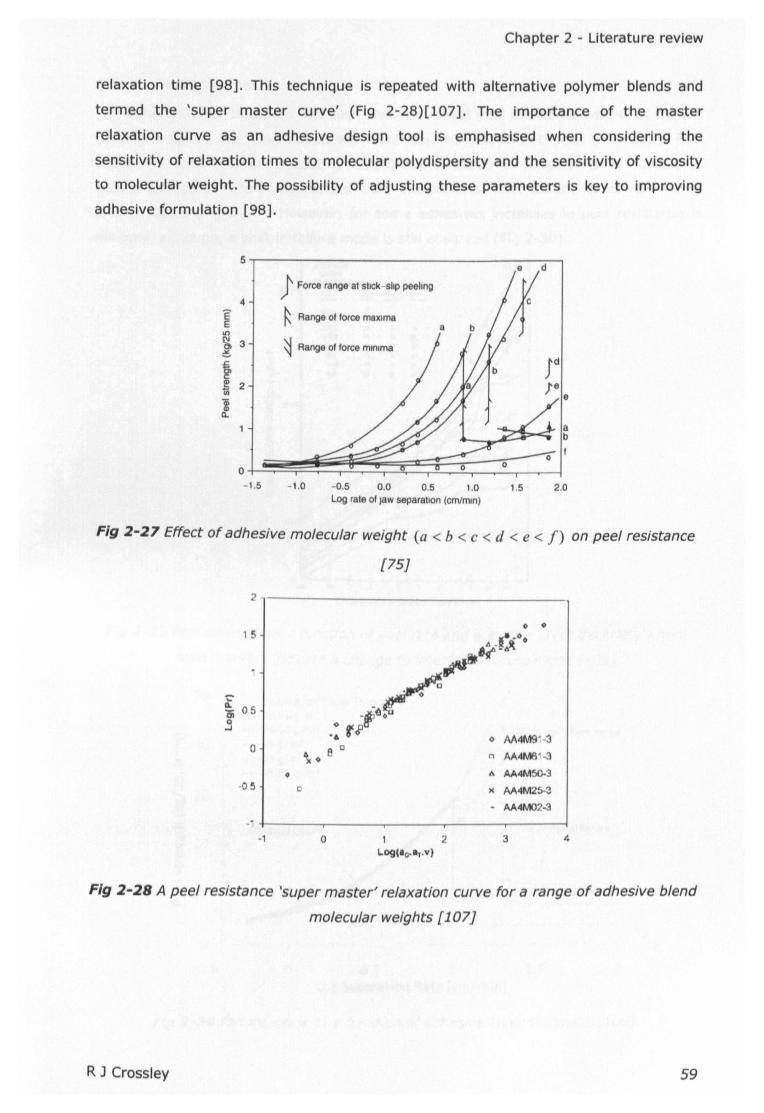
Chapter 2 - Literature review
relaxation time [98]. This technique is repeated with alternative polymer blends and
termed the 'super master curve' (Fig 2-28)[107]. The importance of the master
relaxation curve as an adhesive design tool is emphasised when considering the
sensitivity of relaxation times to molecular polydispersity and the sensitivity of viscosity
to molecular weight. The possibility of adjusting these parameters is key to improving
adhesive formulation [98].
4
EEII')
~ 3~
J' Force range at stick shp peeling
~ Range 01 force maxima
~ Range 01 force minima
0~~~~::I;:~~-1.5 -1.0 -0.5 0.0 0.5 1.0
Log rate of Jaw separation (em/min)1.5 2.0
Fig 2-27 Effect of adhesive molecular weight (a < b < c < d < e < f) on peel resistance
[75J
-~ 0501
.3
·05
?-----------------------------------1 5
o M4M91·3o e C
\0 n AA4M6'...3
" AA4M50-3
)( AA4M25-3
- AA4M02...3
o
c
·1 3 4o 2
Fig 2-28A peel resistance 'super master' relaxation curve for a range of adhesive blend
molecular weights [107J
RJ Crossley 59
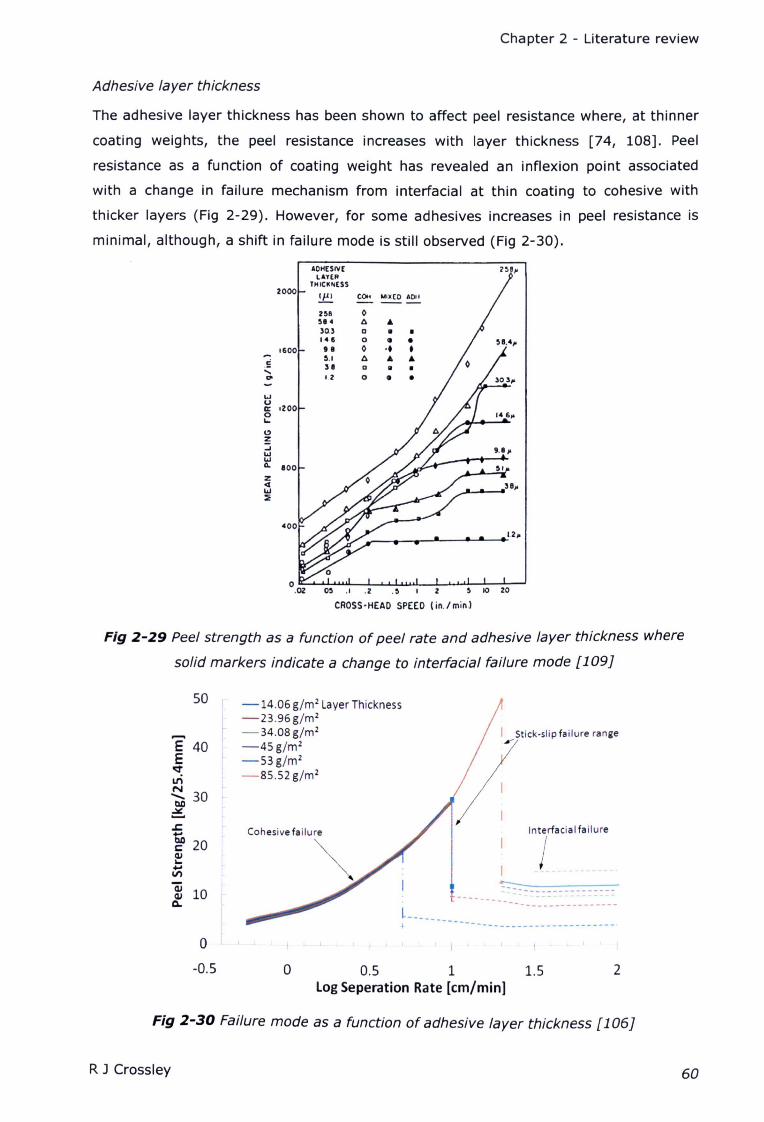
Chapter 2 - Literature review
Adhesive layer thickness
The adhesive layer thickness has been shown to affect peel resistance where, at thinner
coating weights, the peel resistance increases with layer thickness [74, 108]. Peel
resistance as a function of coating weight has revealed an inflexion point associated
with a change in failure mechanism from interfacial at thin coating to cohesive with
thicker layers (Fig 2-29). However, for some adhesives increases in peel resistance is
minimal, although, a shift in failure mode is still observed (Fig 2-30).
ACHESIVELAY(,.
THICKNESS
IP)2000
CO" t.lIXCO ACII
2~e 0514 lJ. •303 0 II II
148 0 at II
1600 II 0 • • •- ~.I lJ. ... •.!E 31 a " II...,12 0 at II'"-
wua: 12000
'""o~...JWW0.. 100%.qW::e
.e z
CROSS·HEADSPEED (in./minl
Fig 2-29 Peel strength as a function of peel rate and adhesive layer thickness where
solid markers indicate a change to interfacial failure mode [109J
50 r
E 40 rE
o;t
LnN.......30 L
~s:
~ 20IQ.l... L
+"'V') IQjQ.l 10 te,
II
0
-0.5
-14.06 g/m2 LayerThickness-23.96g/m2
-34.08g/m2
-45g/m2
-53g/m2
-85.52g/m2
I Stick-slip failure rangeI'
Cohesive failure
~
Interfacial failure
/~---------------
j I I , i t 'I ' , I '
o 0.5 1 1.5log Seperation Rate [em/min]
2
Fig 2-30 Failure mode as a function of adhesive layer thickness [106J
R J Crossley 60
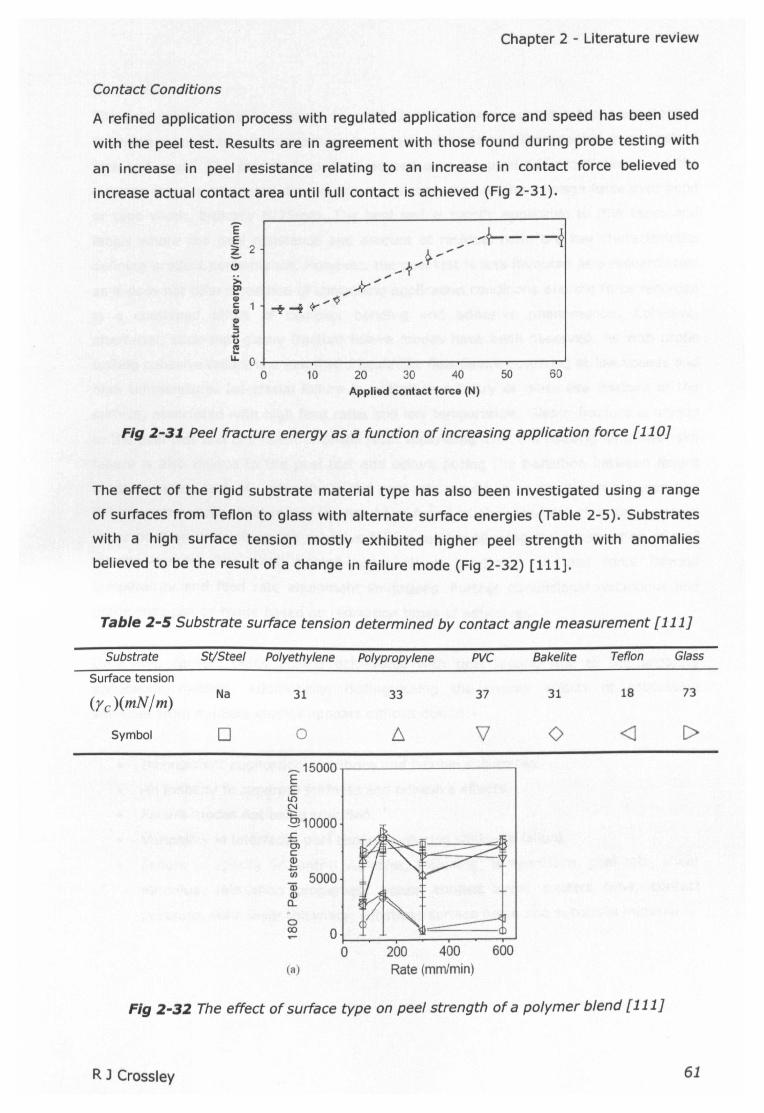
Chapter 2 - Literature review
Contact Conditions
A refined application process with regulated application force and speed has been used
with the peel test. Results are in agreement with those found during probe testing with
an increase in peel resistance relating to an increase in contact force believed to
increase actual contact area until full contact is achieved (Fig 2-31).
EE! 2
Applied contact force (N)
Fig 2-3J Peel fracture energy as a function of increasing application force [110J
The effect of the rigid substrate material type has also been investigated using a range
of surfaces from Teflon to glass with alternate surface energies (Table 2-5). Substrates
with a high surface tension mostly exhibited higher peel strength with anomalies
believed to be the result of a change in failure mode (Fig 2-32) [111].
Table 2-5 Substrate surface tension determined by contact angle measurement [lllJ
Substrate PVC Bakelite TeflonSt/Steel Polyethylene Polypropylene Glass
Surface tension
(yc)(mN/m)
Symbol
Na 31
0 0
_15000EE
L()
Ni;::
~10000s:rnc:~u;
5000QiQ)
n,
0co 0
0(a)
18 7333 37 31
o <l C>
200 400Rate (mm/min)
Fig 2-32 The effect of surface type on peel strength of a polymer blend [lllJ
R J Crossley 61
Chapter 2 - Literature review
Summary
The peel test is relatively simple to conduct and analyse; adhesive tapes are applied
following manufacturer's instructions to a rigid substrate and then peeled at a constant
rate and angle. The peeling force is measured over a typical 115mm distance and the
average force is calculated. Peel resistance is expressed as the average force over bond
or tape width, typically N/25mm. The peel test is mostly applicable to PSA tapes and
labels where the peel reSistance and amount of residual resin are key characteristics
defining product performance. However, the peel test is less favoured as a research tool
as it does not offer a method of controlling application conditions and the force recorded
is a combined effect of complex bending and adhesive phenomenon. Cohesive,
interfacial, stick-slip, glassy fracture failure modes have been observed. As with probe
testing cohesive failure is a result of a liquid like flow failure occurring at low speeds and
high temperature. Interfacial failure is related to rubbery or glass like fracture at the
surface, associated with high feed rates and low temperature. Glassy fracture is unique
to the peel test and is a result of brittle resin separating from the backing film. Stick-slip
failure is also unique to the peel test and occurs during the transition between failure
modes where a lack of uniformity in the peel rate results in an oscillation between two
failure mechanisms. Peel resistance has been found to obey the WLF time temperature
super position principle In the cohesive failure regime allowing the construction of peel
master curves. The peel master curve allows prediction of peel force beyond
temperature and feed rate equipment limitations. Further dimensional reductions and
predictions can be made based on relaxation times of adhesives.
Only long contact times appear achievable with peel testing due to the separate
application method. Additionally, distinguishing the overall effects of processing
variables from multiple studies appears difficult due to:-
• Inconsistent application conditions and flexible substrates.
• An inability to separate stiffness and adhesive effects.
• Failure modes not being specified.
• Variability in interfacial peel especially during stick-slip failure.
• Failure to specify or control variables, Including; temperature, peel rate, shear
modulus, relaxation properties, actual contact area, contact time, contact
pressure, resin layer thickness, substrate surface finish and substrate material.
R J Crossley 62

Chapter 2 - Literature review
2.5.3 Shear testing
PSAs In shear demonstrate creep behaviour that can lead to failure of the adhesive joint
[75]. The PSA shear test Is generally a measure of the adhesives rheological properties.
However, the test Is adapted to suit failures of PSA tape which occur over grater
deflection and time scales. Typically, a weight Is hung from an adhesive tape with the
deflection recorded over time. The behaviour of PSAs under shear has been
characterised using Maxwell and Kelvin-Voigt fluid models, using springs and dashpots
to account for the elastic and viscous behaviour of the fluid. However, other viscoelastic
models are available and are generally chosen to suit the experimental results [75, 98].
The loading conditions seen In shear testing can be compared to those found In plate
rheology. Therefore, PSA shear testing Is limited to Industrial applications with shear
research typically carried out using rheometers which offer greater flexibility and
accuracy In results and analysis.
2.6 Rheology
PSAs and polymer resins are viscoelastic materials possessing both flow and elastic
properties which playa key role In bond forming and debonding [74]. Comparisons
made with rheology, peel and probe results reveal that the adhesives solid or molten
state dictates tack failure type and magnitude [75, 101]. Rheology Is now a well
established laboratory method for determining viscoelastic properties. Many tack studies
and properties are related to the rheology of the adhesive component. Although stress
relaxation and creep experiments are used extensively, the small amplitude oscillatory
shear experiment Is the most commonly used method for determining the linear
viscoelastic properties of polymer melts [112].
Method
Typically a constant thickness disc of viscoelastic material is placed between a fixed
surface and a surface with a sinusoidal applied stress (Fig 2-33). A load cell and optical
encoder are used to measure force and displacement response. In steady state shear
the rate and stress are simply defined as a function of layer height, force and velocity
(Fig 2-34). Typically, parallel plate geometry Is used where the strain rate Is a function
of the radial position (Fig 2-35). However, small angle cone and plate geometry may be
used to achieve a constant shear rate throughout the specimen. This uniform flow Is
advantageous when working with non-linear materials which are strain rate sensitive
[113]. For viscoelastic characterisation the standardised small amplitude oscillatory
shear (SAOS) experiment is commonly used. A small oscillatory shear strain is applied
R J Crossley 63
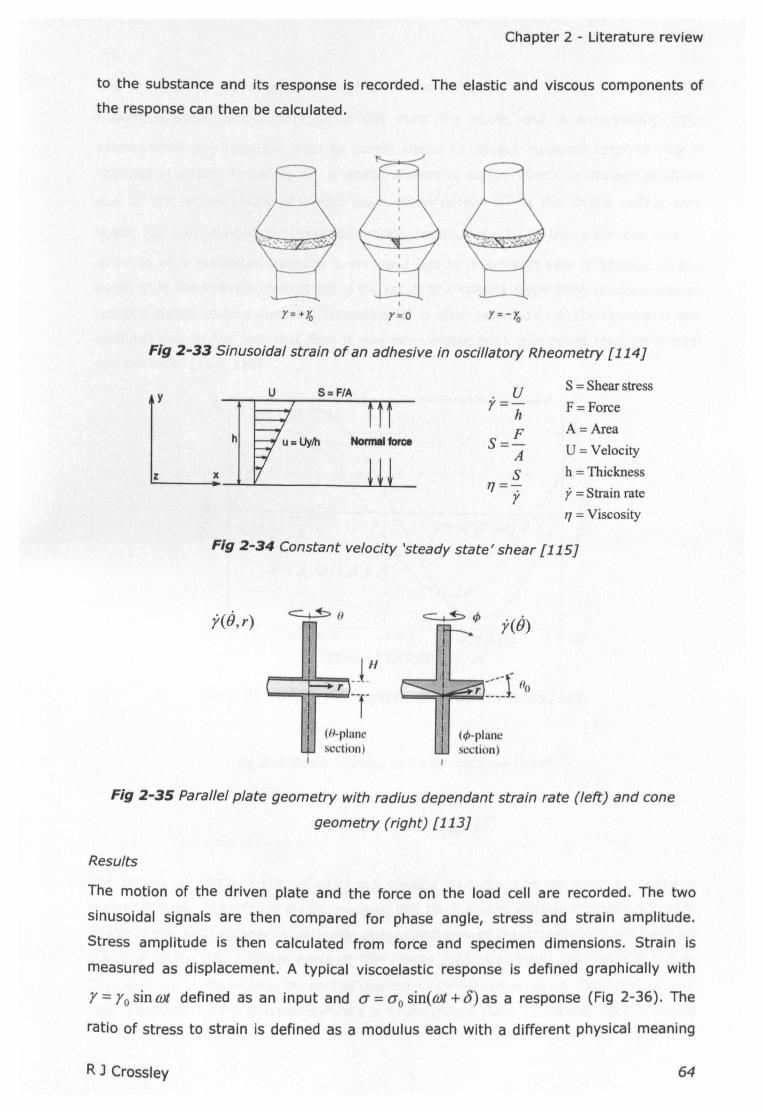
Chapter 2 - Literature review
to the substance and its response is recorded. The elastic and viscous components of
the response can then be calculated.
y=+Yo y=o r=-Yo
Fig 2-33 Sinusoidal strain of an adhesive in oscillatory Rheometry [l14J
S=F/A U S = Shear stressy
r=- F =Forceh
S=FA =Area
h NonnaJ force
A U = Velocity
z x S h = Thickness7]=-:- r = Strain rater
1] = Viscosity
Fig 2-34 Constant velocity 'steady state' shear [l15J
y(O,r)
(H-planesection)
y(O)
(<I>-planesection)
Fig 2-35 Parallel plate geometry with radius dependant strain rate (left) and cone
geometry (right) [l13J
Results
The motion of the driven plate and the force on the load cell are recorded. The two
sinusoidal signals are then compared for phase angle, stress and strain amplitude.
Stress amplitude is then calculated from force and specimen dimensions. Strain is
measured as displacement. A typical viscoelastic response is defined graphically with
y=yosincot defined as an input and a=O'osin(mt+o)as a response (Fig 2-36). The
ratio of stress to strain is defined as a modulus each with a different physical meaning
R J Crossley 64
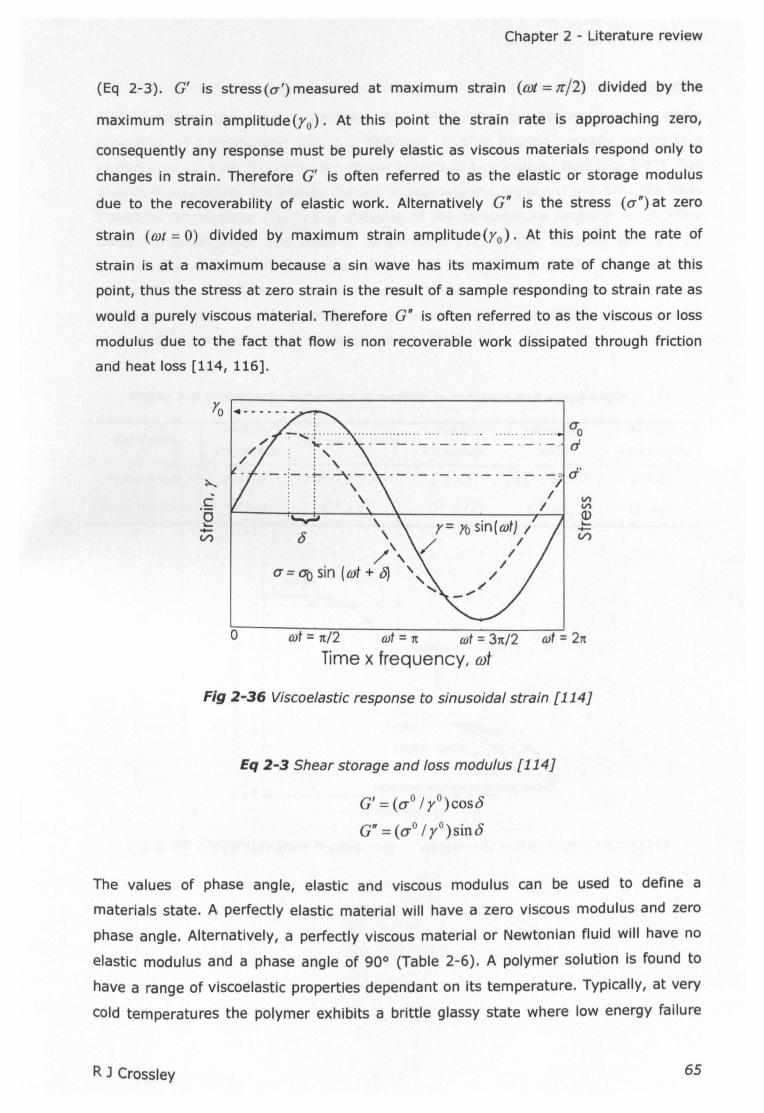
Chapter 2 - Literature review
(Eq 2-3). G' is stress (a') measured at maximum strain (aJt = 1C/2) divided by the
maximum strain amplitude(yo). At this point the strain rate is approaching zero,
consequently any response must be purely elastic as viscous materials respond only to
changes in strain. Therefore G' is often referred to as the elastic or storage modulus
due to the recoverability of elastic work. Alternatively G" is the stress (a") at zero
strain (OJI = 0) divided by maximum strain amplitude(yo). At this point the rate of
strain is at a maximum because a sin wave has its maximum rate of change at this
paint, thus the stress at zero strain is the result of a sample responding to strain rate as
would a purely viscous material. Therefore G" is often referred to as the viscous or loss
modulus due to the fact that flow is non recoverable work dissipated through friction
and heat loss [114, 116].
.... .. (Tod
\\
/',(T= (TO sin (OJt + b1 "
.....
V'lV'l
~-(/)
o wt = 1t/2 wt = 1t wt = 31t/2Time x frequency, cot
wt = 21t
Fig 2-36 Viscoelastic response to sinusoidal strain [114]
Eq 2-3 Shear storage and loss modulus [114]
G' = (To / yO)coso
G" = (0-0 / l)sino
The values of phase angle, elastic and viscous modulus can be used to define a
materials state. A perfectly elastic material will have a zero viscous modulus and zero
phase angle. Alternatively, a perfectly viscous material or Newtonian fluid will have no
elastic modulus and a phase angle of 90° (Table 2-6). A polymer solution is found to
have a range of viscoelastic properties dependant on its temperature. Typically, at very
cold temperatures the polymer exhibits a brittle glassy state where low energy failure
R J Crossley 65
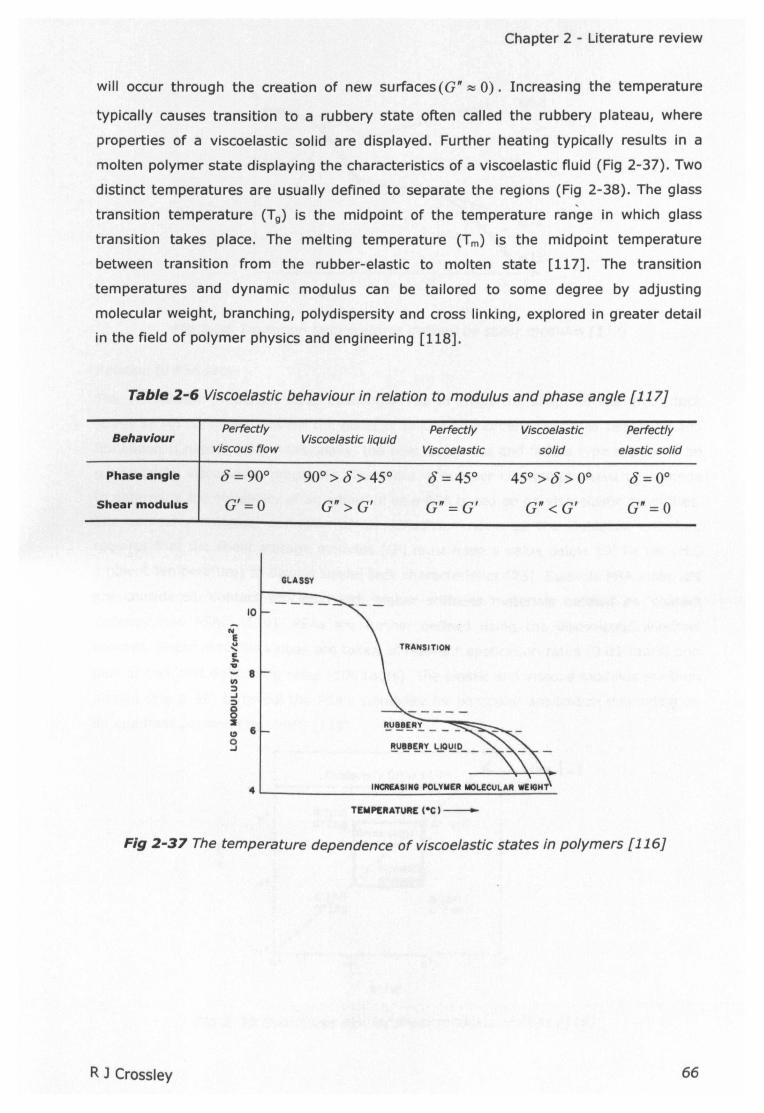
Chapter 2 - Literature review
will occur through the creation of new surfaces (G" ~ 0). Increasing the temperature
typically causes transition to a rubbery state often called the rubbery plateau, where
properties of a viscoelastic solid are displayed. Further heating typically results in a
molten polymer state displaying the characteristics of a viscoelastic fluid (Fig 2-37). Two
distinct temperatures are usually defined to separate the regions (Fig 2-38). The glass
transition temperature (Tg) is the midpoint of the temperature range in which glass
transition takes place. The melting temperature (Tm) is the midpoint temperature
between transition from the rubber-elastic to molten state [117]. The transition
temperatures and dynamic modulus can be tailored to some degree by adjusting
molecular weight, branching, polydispersity and cross linking, explored in greater detail
in the field of polymer physics and engineering [U8].
Table 2-6 Viscoelastic behaviour in relation to modulus and phase angle [117J
BehaviourPerfectly Perfectly Viscoelastic Perfectly
viscous flowViscoelastic liquid
Viscoelastic solid elastic solid
Phase angle 8=90° 90° > 0 > 45° 0=45° 45° > 0> 0° 0=0°
Shear modulus G'=O G">G' G"=G' G" <G' G"=O
GLASSY
N
e~c..."0
- 8III~oJ:)
~Cl 6
9
TRANSITION
Fig 2-37 The temperature dependence of viscoelastic states in polymers [116J
R J Crossley 66
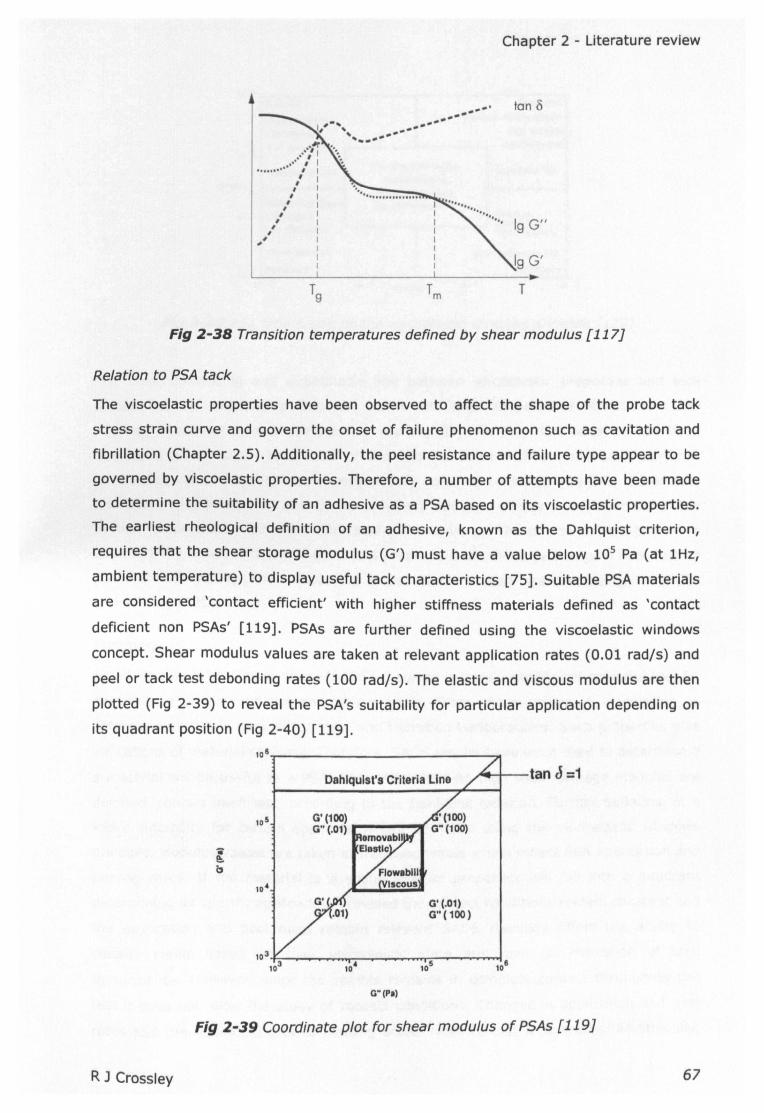
Chapter 2 - Literature review
..:r• • • •, I
• • • • , I......... ; I
, I
" I# I, I
/ I, I
/ I..' :II
..'..--""........, ..----' ...---
tan 8
19 Gil
Fig 2-38 Transition temperatures defined by shear modulus [117]
Relation to PSA tack
The viscoelastic properties have been observed to affect the shape of the probe tack
stress strain curve and govern the onset of failure phenomenon such as cavitation and
fibrillation (Chapter 2.5). Additionally, the peel resistance and failure type appear to be
governed by viscoelastic properties. Therefore, a number of attempts have been made
to determine the suitability of an adhesive as a PSA based on its viscoelastic properties.
The earliest rheological definition of an adhesive, known as the Dahlquist criterion,
requires that the shear storage modulus (G') must have a value below 105Pa (at 1Hz,
ambient temperature) to display useful tack characteristics [75]. Suitable PSA materials
are considered 'contact efficient' with higher stiffness materials defined as 'contact
deficient non PSAs' [119]. PSAs are further defined using the viscoelastic windows
concept. Shear modulus values are taken at relevant application rates (0.01 rad/s) and
peel or tack test debonding rates (100 rad/s). The elastic and viscous modulus are then
plotted (Fig 2-39) to reveal the PSA's suitability for particular application depending on
its quadrant position (Fig 2-40) [119].108~ "f1
G' (.01)G"(1oo)
G"(P.)
Fig 2-39 Coordinate plot for shear modulus of PSAs [119]
R J Crossley 67
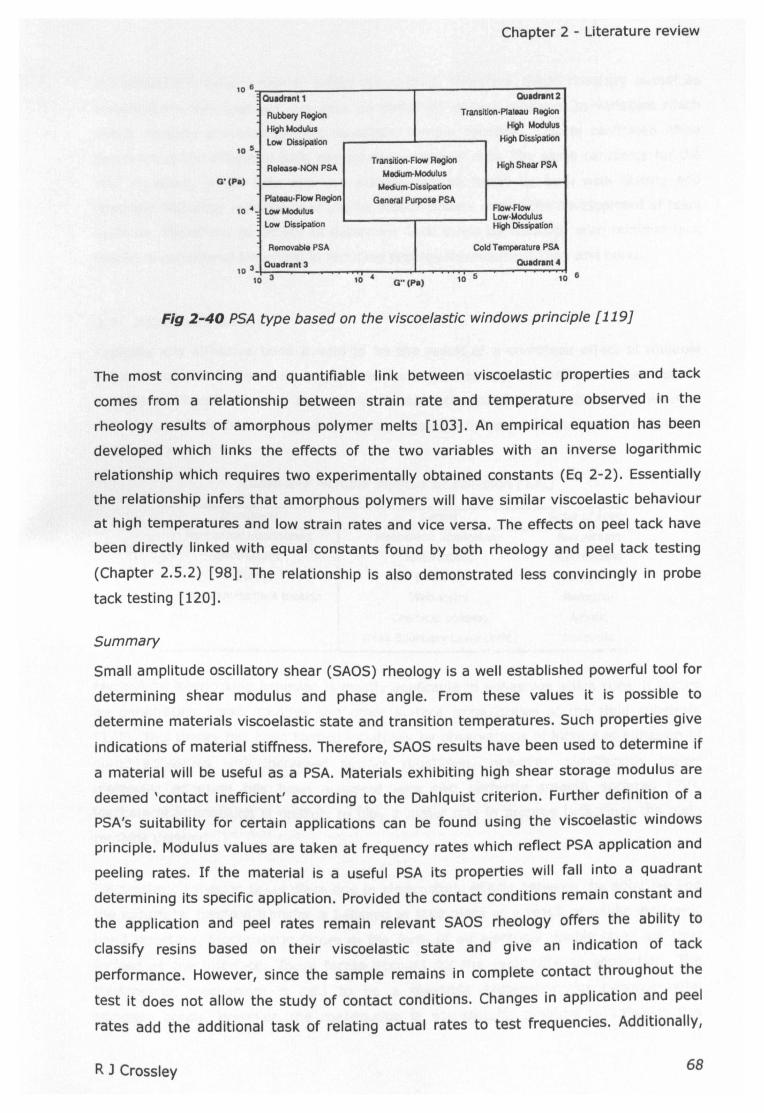
Chapter 2 - Literature review
106
Quldranl1 Quldranl2
Rubbery Region TransiUon·Plateau Region
High Modulus High Modulus
Low Dissipation High Dissipation
Release·NON PSATransition·FIow Region High Shear PSA
Medium·ModulusMedium-Dissipation
Plateau·FIow Region GenOl'alPurpose PSALow Modulus Flow·Flow
Low·ModulusLow Dissipation High Dissipation
RemovablePSA Cold Temperature PSA
OUad,.nt 3 Quldrant 4
10 '
G'(PI)
10 •
10310 3
10 • G" (PI)10 5 10 6
Fig 2-40 PSA type based on the viscoelastic windows principle [119J
The most convincing and quantifiable link between viscoelastic properties and tack
comes from a relationship between strain rate and temperature observed in the
rheology results of amorphous polymer melts [103]. An empirical equation has been
developed which links the effects of the two variables with an inverse logarithmic
relationship which requires two experimentally obtained constants (Eq 2-2). Essentially
the relationship infers that amorphous polymers will have similar viscoelastic behaviour
at high temperatures and low strain rates and vice versa. The effects on peel tack have
been directly linked with equal constants found by both rheology and peel tack testing
(Chapter 2.5.2) [98]. The relationship is also demonstrated less convincingly in probe
tack testing [120].
Summary
Small amplitude oscillatory shear (SAOS) rheology is a well established powerful tool for
determining shear modulus and phase angle. From these values it is possible to
determine materials viscoelastic state and transition temperatures. Such properties give
indications of material stiffness. Therefore, SAOS results have been used to determine if
a material will be useful as a PSA. Materials exhibiting high shear storage modulus are
deemed 'contact inefficient' according to the Dahlquist criterion. Further definition of a
PSA's suitability for certain applications can be found using the viscoelastic windows
principle. Modulus values are taken at frequency rates which reflect PSA application and
peeling rates. If the material is a useful PSA its properties will fall into a quadrant
determining its specific application. Provided the contact conditions remain constant and
the application and peel rates remain relevant SAOS rheology offers the ability to
classify resins based on their viscoelastic state and give an indication of tack
performance. However, since the sample remains in complete contact throughout the
test it does not allow the study of contact conditions. Changes in application and peel
rates add the additional task of relating actual rates to test frequencies. Additionally,
R J Crossley 68
Chapter 2 - Literature review
the adhesive is never taken to actual failure limit. Therefore, SAOS rheology cannot be
considered a tack test but may give an indication of tack response to variables which
affect viscosity provided contact conditions remain constant. This is confirmed when
determining the effects of both temperature and peel rate. The same constants for the
WLF equation, which links the two effects, can be found by both peel testing and
rheology. Rheology Is in constant use by manufacturers during the development of resin
systems. Therefore, an ability to determine tack levels by rheology with minimal tack
testing Is considered benefiCial In reducing prepreg development time and costs.
2.7 Adhesivestheory
Typically any adhesive bond Is said to be the result of a combined effect of multiple
mechanisms [121]. However, certain mechanisms may appear dominant under certain
conditions. Therefore, many theories have been postulated to describe mechanisms of
adhesion, with each one supported by experimental evidence under certain conditions
(Table 2-7).
Table 2-7Multiple theories of adhesion [121]
Traditional Recent Scale of actionMechanical Interlocking Mechanical Interlocking Microscopic
Electrostatic Electrostatic MacroscopicDiffUSion Diffusion Molecular
Adsorption/surface tension Wettability Molecular
Chemical bonding AtomiC
Weak Boundary Layer (WBl) Molecular
Mechanical Interlocking adhesion is mostly applicable to adhesives which cure. It occurs
by penetrating pores, cavities and other surface Irregularities of the rigid substrate
[121]. This theory has been formed Intuitively by observations of Increased adhesion of
cured adhesives with Increased surface roughness. However, significantly higher
molecular adheston has been achieved with two perfectly smooth surfaces [73].
Mechanical Interlocking is unlikely to playa major role In prepreg tack since the resin
remains uncured.
Electrostatic adhesion takes place due to electrostatic effects between the adhesive and
the substrate. Electron transfer Is believed to take place as a result of unlike electronic
band structure. Electrostatic forces in the form of an electrical double layer are thus
formed at the Interface. These forces account for the resistance to separation. The
electrostatic mechanism Is said to be a plausible explanation for polymer-metal
adhesion bonds. However, the contribution In non-metallic systems to adhesion has
R 1 Crossley 69
Chapter 2 - Literature review
been calculated and found to be small when compared to that of chemical bonding
[121].
In diffusion theory, adhesion Is achieved through the interdiffusion of molecules
between the adhesive and the substrate. The diffusion theory is most prevalent when
both surfaces are relatively long chain dynamic molecules [121]. Interdiffusion of
molecular chain elements across a polymer-polymer interface (polymer healing) Is
considered to be the controlling factor for tack and green strength of uncured linear
elastomers. Variables which control molecular diffusion may also control adhesion.
Increasing temperature Increases the average interdiffusion length but also decreases
the stress required to pull the segment out [71].
Wetting theory proposes that adhesion results from molecular contact between two
materials and the surface forces that develop. The process of establishing continuous
contact between two substances is called wetting. For an adhesive to wet a solid
surface, the adhesive should have a lower surface tension than the critical surface
tension of the solid [121].
Chemical bonding Is a general term used to describe the molecular chemical Interactions
which may occur at the interface. Four interactions are thought to take place during
chemical bonding; covalent bonds, hydrogen bonds, lifshitz-Van der Waals forces and
acid-base interactions. The exact nature of the Interactions that hold the adhesive bond
depends on the chemical composition of the Interface [121]. Acid-base adhesion is
based on a chemical concept of polar attraction between lewis acids and bases due to
electron imbalances [121].
Weak Boundary Layer (WBl) theory dictates that any adhesive failure which is not
cohesive is the result of a weak surface layer. This layer can be caused by
environmental contaminates, impurities in or at the surface of the adhesive or
substrate. When failure takes place, it is the weak boundary layer that fails, although
failure may appear to take place at the interface [121]. Air, moisture, oxidisation may
all contribute to a WBl, therefore, exceptional adhesion occurring on spacecraft
components such as door hinges have been attributed to the absence of a WBL normally
present in earth's atmosphere [73].
R J Crossley 70
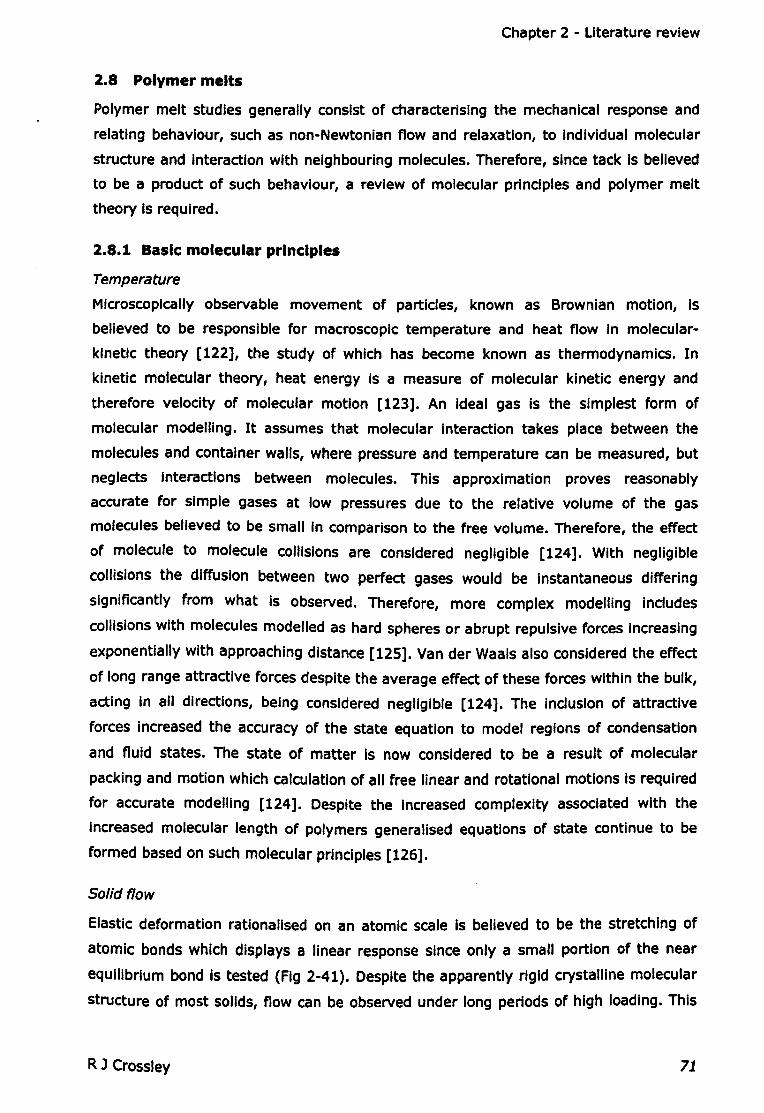
Chapter 2 - Literature review
2.8 Polymer melts
Polymer melt studies generally consist of characterising the mechanical response and
relating behaviour, such as non-Newtonian flow and relaxation, to Individual molecular
structure and Interaction with neighbouring molecules. Therefore, since tack is believed
to be a product of such behaviour, a review of molecular principles and polymer melt
theory Is required.
2.8.1 Basic molecular principles
Temperature
Microscopically observable movement of particles, known as Brownian motion, Is
believed to be responsible for macroscopic temperature and heat flow In molecular-
kinetic theory [122], the study of which has become known as thermodynamics. In
kinetic molecular theory, heat energy Is a measure of molecular kinetic energy and
therefore velocity of molecular motion [123]. An Ideal gas Is the simplest form of
molecular modelling. It assumes that molecular Interaction takes place between the
molecules and container walls, where pressure and temperature can be measured, but
neglects Interactions between molecules. This approximation proves reasonably
accurate for simple gases at low pressures due to the relative volume of the gas
molecules believed to be small In comparison to the free volume. Therefore, the effect
of molecule to molecule collisions are considered negligible [124]. With negligible
collisions the diffusion between two perfect gases would be Instantaneous differing
Significantly from what is observed. Therefore, more complex modelling Includes
collisions with molecules modelled as hard spheres or abrupt repulsive forces Increasing
exponentially with approaching distance [125]. Van der Waals also considered the effect
of long range attractive forces despite the average effect of these forces within the bulk,
acting In all directions, being considered negligible [124]. The Inclusion of attractive
forces increased the accuracy of the state equation to model regions of condensation
and fluid states. The state of matter Is now considered to be a result of molecular
packing and motion which calculation of all free linear and rotational motions Is required
for accurate modelling [124]. Despite the Increased complexity assoclated with the
Increased molecular length of polymers generalised equations of state continue to be
formed based on such molecular principles [126].
Solid flow
Elastic deformation rationalised on an atomic scale Is believed to be the stretching of
atomic bonds which displays a linear response since only a small portion of the near
equilibrium bond Is tested (Fig 2-41). Despite the apparently rigid crystalline molecular
structure of most solids, flow can be observed under long periods of high loading. This
R J Crossley 71
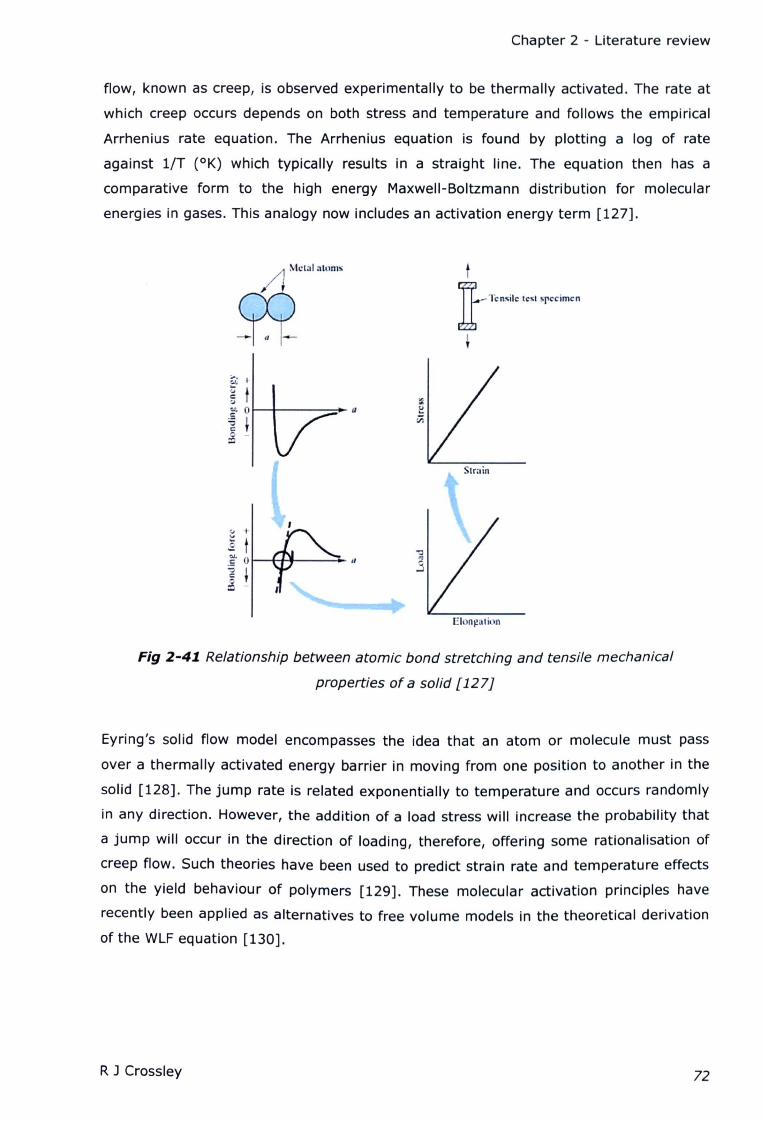
Chapter 2 - Literature review
flow, known as creep, is observed experimentally to be thermally activated. The rate at
which creep occurs depends on both stress and temperature and follows the empirical
Arrhenius rate equation. The Arrhenius equation is found by plotting a log of rate
against liT (OK) which typically results in a straight line. The equation then has a
comparative form to the high energy Maxwell-Boltzmann distribution for molecular
energies in gases. This analogy now includes an activation energy term [127].
ll-T,,"', ". specimen
t
Elon~alil,)ll
Fig 2-4J Relationship between atomic bond stretching and tensile mechanical
properties of a solid [127]
Eyring's solid flow model encompasses the idea that an atom or molecule must pass
over a thermally activated energy barrier in moving from one position to another in the
solid [128]. The jump rate is related exponentially to temperature and occurs randomly
in any direction. However, the addition of a load stress will increase the probability that
a jump will occur in the direction of loading, therefore, offering some rationalisation of
creep flow. Such theories have been used to predict strain rate and temperature effects
on the yield behaviour of polymers [129]. These molecular activation principles have
recently been applied as alternatives to free volume models in the theoretical derivation
of the WLF equation [130].
RJ Crossley 72
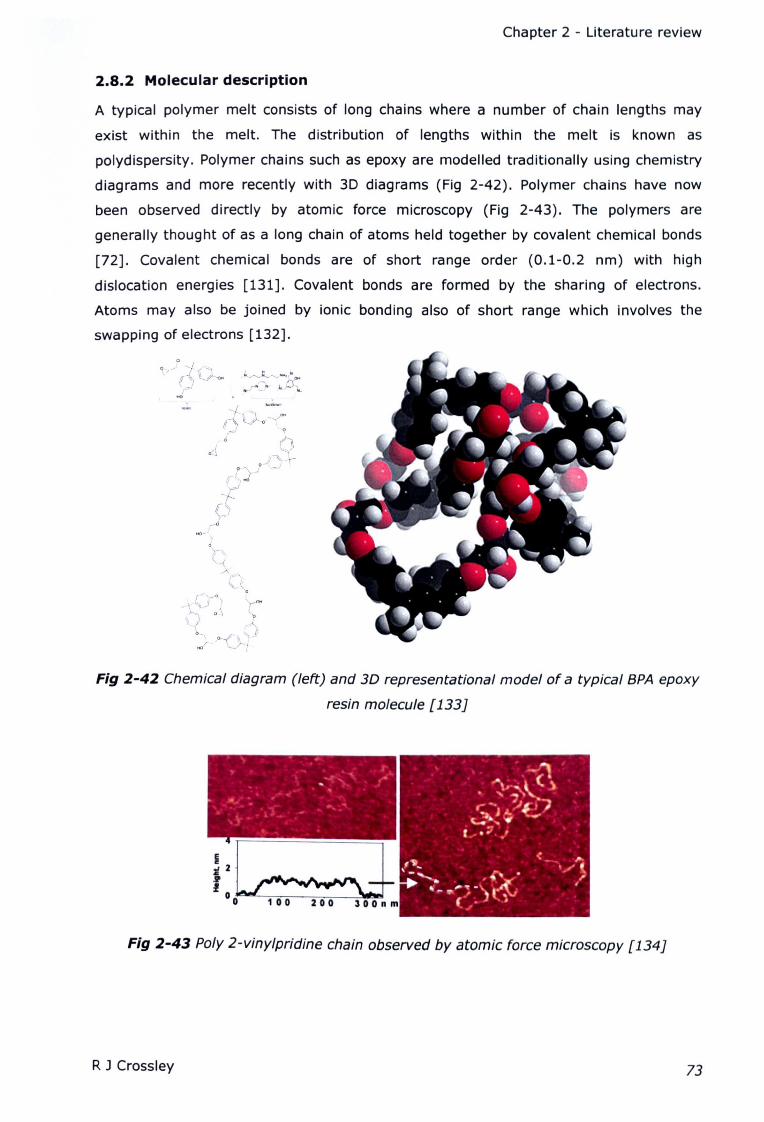
Chapter 2 - Literature review
2.8.2 Molecular description
A typical polymer melt consists of long chains where a number of chain lengths may
exist within the melt. The distribution of lengths within the melt is known as
polydispersity. Polymer chains such as epoxy are modelled traditionally using chemistry
diagrams and more recently with 3D diagrams (Fig 2-42). Polymer chains have now
been observed directly by atomic force microscopy (Fig 2-43). The polymers are
generally thought of as a long chain of atoms held together by covalent chemical bonds
[72]. Covalent chemical bonds are of short range order (0.1-0.2 nm) with high
dislocation energies [131]. Covalent bonds are formed by the sharing of electrons.
Atoms may also be joined by ionic bonding also of short range which involves the
swapping of electrons [132].
Fig 2-42 Chemical diagram (left) and 3D representational model of a typical BPA epoxy
resin molecule [133J
Fig 2-43 Poly 2-vinylpridine chain observed by atomic force microscopy [134J
R J Crossley 73

Chapter 2 - Uterature review
Covalent and ionic bonds are tightly held together and require a significant amount of
energy to break. Since the energy Involved In peeling Is relatively low, It Is assumed
that the polymer chain bonds remain unbroken. These bonds are however, flexible and
subject to deformation mainly through a variation In torsion angles [72]. Provided the
activation energy Is not reached they will return to their original bond length once the
force is removed. Non-covalent attractive bonds such as van der Waals are also believed
to be In effect between molecules. The van der Waals repulsive forces along with
thermal vibration motions are represented as an effective co-volume In the 'vaguely
defined concept' of free volume [135]. The attractive force receive little consideration
since, as with a fluid, the average effect of a completely surrounded molecule vanishes
[124].
2.8.3 Melt behaviour
Polymers typically have a complex mechanical behaviour resulting in strain rate, strain
history and temperature sensitivity [135]. Typical polymers are also subject to
relaxation processes with some polymers capable of returning to their original shape at
viSible rates and deflections. These properties and many others are known to relate to
Its molecular polymer chain structure and how the chains Interact within the melt or
solid state (Table 2-8).
Table 2-8 Typical polymer properties related to molecular structure [136J
+ Increase, - decrease, Oi little change,
I ~ ele,
~c
Hi passes through a maximum, *for e~
~ m i E i ~0
~s
~
5amorphous polymers, B; result depends
.,i e Cl 'iJ sttlIII
Es: cu 'E c
:::JJ! 1 ~ ,~ j
s:~ ~on melting point, C; temperature 't:J «I :!:! ~'iii w li 10 :: cu Ec I! :Edependant ~ >= cu
~ s::.U
Increase molecular weight* + + + + + + + + + - + -Reduce poIydlsperslty + - . + . . + + + . + 0
Increase branching I cross linking M - + . M + + + + - · M
Add polar chain units + + + + + + + B + + · +Add polar side chains + + + + + + + + + + · +
Stiffen main chain + - + - + + . + + - + -Increase crystallinity . . + - . + + + + - + -
Add crystallisable branches + + + + + + + 0 c 0 · +
Polymer melt theory Is concerned with relating viscoelastic properties to molecular
structure and dynamics. Viscoelastic polymers display both elastic and viscous
deformations under applied stress. Perfectly elastic deformation Is proportional to the
applied stress. Once stress is removed the structure will return to Its original position.
Perfectly elastic behaviour Is associated with high energy chemical bonds or constrained
R J Crossley 74
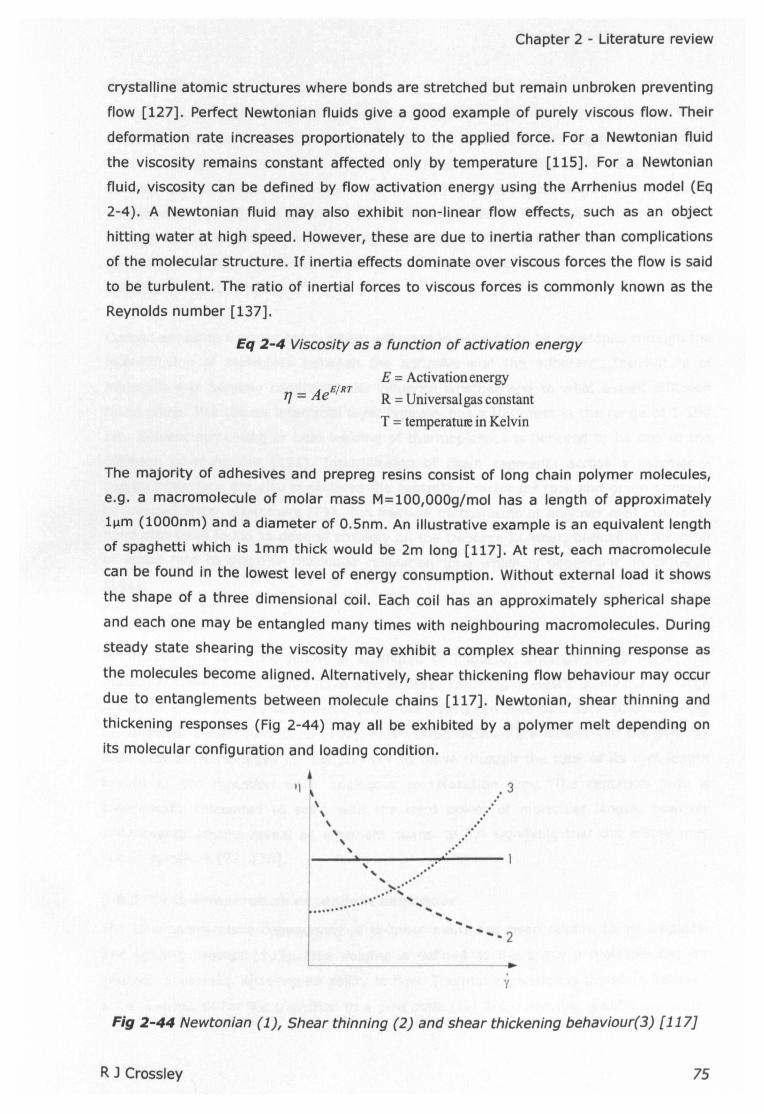
Chapter 2 - Literature review
crystalline atomic structures where bonds are stretched but remain unbroken preventing
flow [127]. Perfect Newtonian fluids give a good example of purely viscous flow. Their
deformation rate increases proportionately to the applied force. For a Newtonian fluid
the viscosity remains constant affected only by temperature [115]. For a Newtonian
fluid, viscosity can be defined by flow activation energy using the Arrhenius model (Eq
2-4). A Newtonian fluid may also exhibit non-linear flow effects, such as an object
hitting water at high speed. However, these are due to inertia rather than complications
of the molecular structure. If inertia effects dominate over viscous forces the flow is said
to be turbulent. The ratio of inertial forces to viscous forces is commonly known as the
Reynolds number [137].
Eq 2-4 Viscosity as afunction of activation energy
E = Activation energy
R = Universal gas constant
T = temperature in Kelvin
The majority of adhesives and prepreg resins consist of long chain polymer molecules,
e.g. a macromolecule of molar mass M=100,OOOg/mol has a length of approximately
Lum (1000nm) and a diameter of O.Snm. An illustrative example is an equivalent length
of spaghetti which is 1mm thick would be 2m long [117]. At rest, each macromolecule
can be found in the lowest level of energy consumption. Without external load it shows
the shape of a three dimensional coil. Each coil has an approximately spherical shape
and each one may be entangled many times with neighbouring macromolecules. During
steady state shearing the viscosity may exhibit a complex shear thinning response as
the molecules become aligned. Alternatively, shear thickening flow behaviour may occur
due to entanglements between molecule chains [117]. Newtonian, shear thinning and
thickening responses (Fig 2-44) may all be exhibited by a polymer melt depending on
its molecular configuration and loading condition.
\\\,,,
. /3....
" "," .....,.',,- ".... "............ ..... ...... ......."-2
y
Fig 2-44 Newtonian (1), Shear thinning (2) and shear thickening behaviour(3) [117J
R J Crossley 75
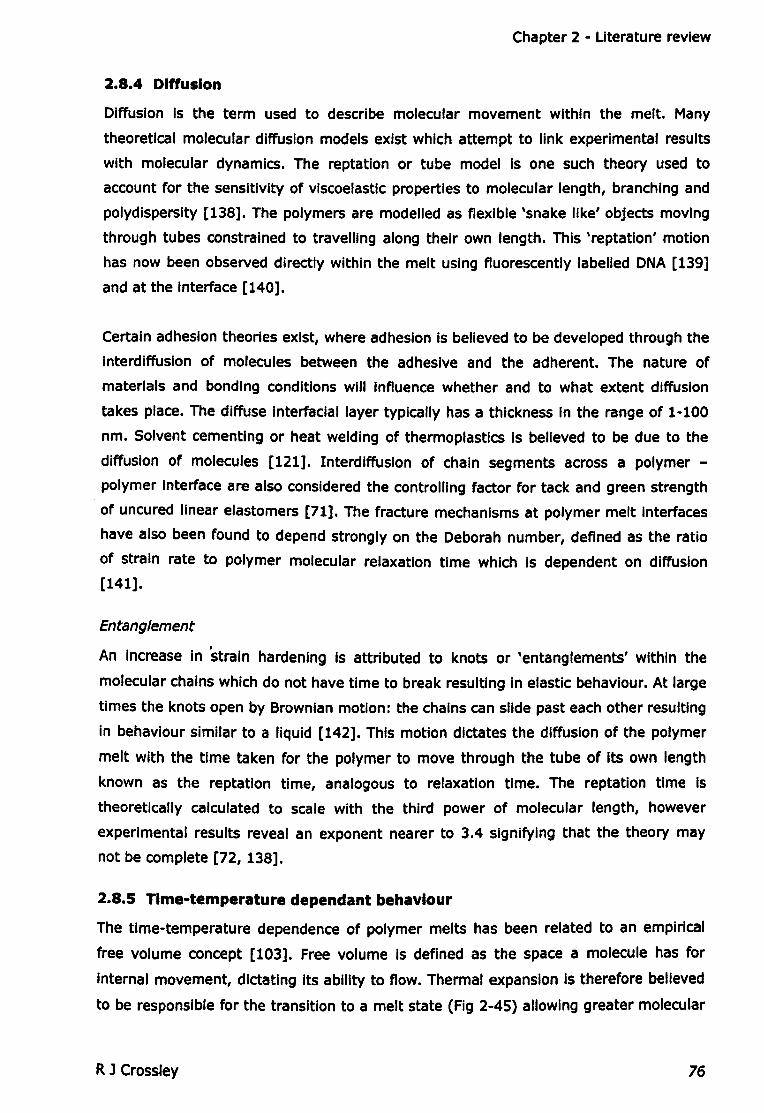
Chapter 2 - Uterature review
2.8.4 Diffusion
Diffusion Is the term used to describe molecular movement within the melt. Many
theoretical molecular diffusion models exist which attempt to link experimental results
with molecular dynamics. The reptatlon or tube model Is one such theory used to
account for the sensitivity of viscoelastic properties to molecular length, branching and
polydisperslty [138]. The polymers are modelled as flexible 'snake like' objects moving
through tubes constrained to travelling along their own length. This 'reptation' motion
has now been observed directly within the melt using fluorescently labelled DNA [139]
and at the interface [140].
Certain adhesion theories exist, where adhesion Is believed to be developed through the
interdiffuslon of molecules between the adhesive and the adherent. The nature of
materials and bonding conditions will Influence whether and to what extent diffusion
takes place. The diffuse Interfacial layer typically has a thickness In the range of 1-100
nm. Solvent cementing or heat welding of thermoplastics Is believed to be due to the
diffusion of molecules [121]. Interdiffuslon of chain segments across a polymer -
polymer Interface are also considered the controlling factor for tack and green strength
of uncured linear elastomers [71]. The fracture mechanisms at polymer melt Interfaces
have also been found to depend strongly on the Deborah number, defined as the ratio
of strain rate to polymer molecular relaxation time which Is dependent on diffusion
[141].
Entanglement
An increase in 'strain hardening is attributed to knots or 'entanglements' within the
molecular chains which do not have time to break resulting in elastic behaviour. At large
times the knots open by Brownian motion: the chains can slide past each other resulting
In behaviour similar to a liquid [142]. This motion dictates the diffusion of the polymer
melt with the time taken for the polymer to move through the tube of its own length
known as the reptatlon time, analogous to relaxation time. The reptation time is
theoretically calculated to scale with the third power of molecular length, however
experimental results reveal an exponent nearer to 3.4 signifying that the theory may
not be complete [72, 138].
2.8.5 Time-temperature dependant behaviour
The time-temperature dependence of polymer melts has been related to an empirical
free volume concept [103]. Free volume Is defined as the space a molecule has for
internal movement, dictating Its ability to flow. Thermal expansion is therefore believed
to be responsible for the transition to a melt state (Fig 2-45) allowing greater molecular
R J Crossley 76
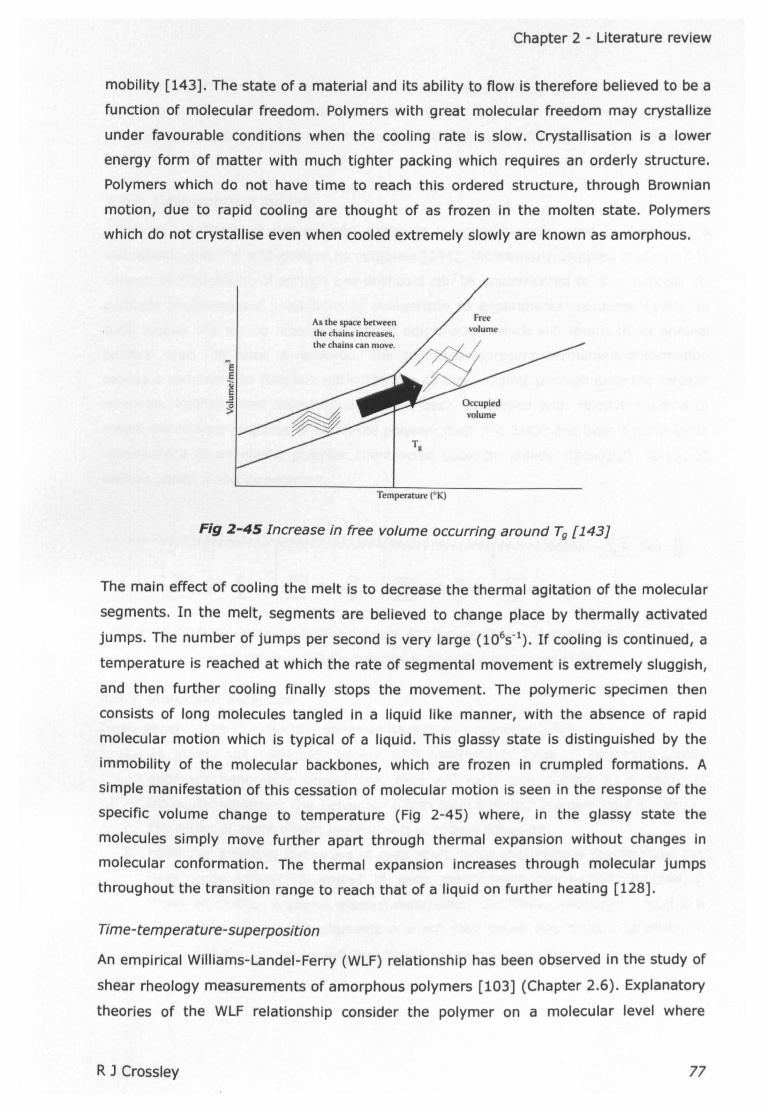
Chapter 2 - Literature review
mobility [143]. The state of a material and its ability to flow is therefore believed to be a
function of molecular freedom. Polymers with great molecular freedom may crystallize
under favourable conditions when the cooling rate is slow. Crystallisation is a lower
energy form of matter with much tighter packing which requires an orderly structure.
Polymers which do not have time to reach this ordered structure, through Brownian
motion, due to rapid cooling are thought of as frozen in the molten state. Polymers
which do not crystallise even when cooled extremely slowly are known as amorphous.
..,ee1~
As the space betweenthe chains increases,the chains can move.
Temperature(OK)
Fig 2-45 Increase in free volume occurring around Tg [143J
The main effect of cooling the melt is to decrease the thermal agitation of the molecular
segments. In the melt, segments are believed to change place by thermally activated
jumps. The number of jumps per second is very large (106s-1). If cooling is continued, a
temperature is reached at which the rate of segmental movement is extremely sluggish,
and then further cooling finally stops the movement. The polymeric specimen then
consists of long molecules tangled in a liquid like manner, with the absence of rapid
molecular motion which is typical of a liquid. This glassy state is distinguished by the
immobility of the molecular backbones, which are frozen in crumpled formations. A
simple manifestation of this cessation of molecular motion is seen in the response of the
specific volume change to temperature (Fig 2-45) where, in the glassy state the
molecules simply move further apart through thermal expansion without changes in
molecular conformation. The thermal expansion increases through molecular jumps
throughout the transition range to reach that of a liquid on further heating [128].
Time-temperature-superposition
An empirical Williams-Landel-Ferry (WLF) relationship has been observed in the study of
shear rheology measurements of amorphous polymers [103] (Chapter 2.6). Explanatory
theories of the WLF relationship consider the polymer on a molecular level where
RJ Crossley 77
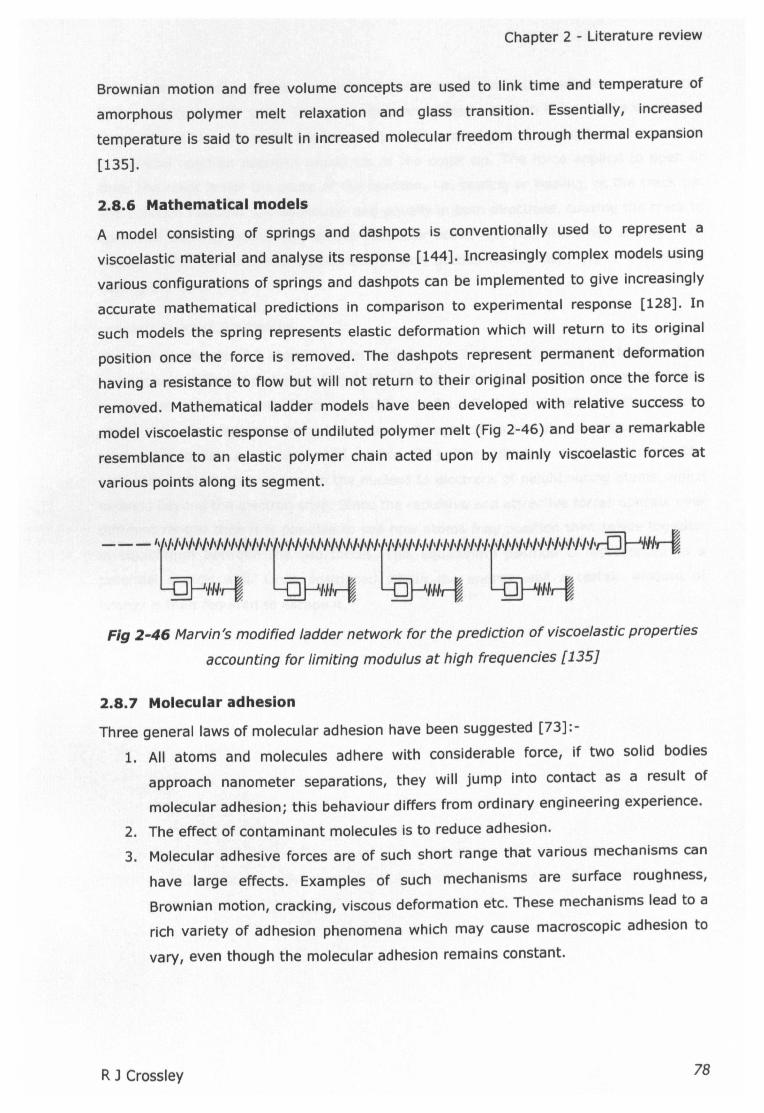
Chapter 2 - Literature review
Brownian motion and free volume concepts are used to link time and temperature of
amorphous polymer melt relaxation and glass transition. Essentially, increased
temperature is said to result in increased molecular freedom through thermal expansion
[135].
2.8.6 Mathematical models
A model consisting of springs and dash pots is conventionally used to represent a
viscoelastic material and analyse its response [144]. Increasingly complex models using
various configurations of springs and dashpots can be implemented to give increasingly
accurate mathematical predictions in comparison to experimental response [128]. In
such models the spring represents elastic deformation which will return to its original
position once the force is removed. The dashpots represent permanent deformation
having a resistance to flow but will not return to their original position once the force is
removed. Mathematical ladder models have been developed with relative success to
model viscoelastic response of undiluted polymer melt (Fig 2-46) and bear a remarkable
resemblance to an elastic polymer chain acted upon by mainly viscoelastic forces at
various points along its segment.
Fig 2-46 Marvin's modified ladder network for the prediction of viscoelastic properties
accounting for limiting modulus at high frequencies [135J
2.8.7 Molecular adhesion
Three general laws of molecular adhesion have been suggested [73]:-
1. All atoms and molecules adhere with considerable force, if two solid bodies
approach nanometer separations, they will jump into contact as a result of
molecular adhesion; this behaviour differs from ordinary engineering experience.
2. The effect of contaminant molecules is to reduce adhesion.
3. Molecular adhesive forces are of such short range that various mechanisms can
have large effects. Examples of such mechanisms are surface roughness,
Brownian motion, cracking, viscous deformation etc. These mechanisms lead to a
rich variety of adhesion phenomena which may cause macroscopic adhesion to
vary, even though the molecular adhesion remains constant.
R J Crossley 78

Chapter 2 - Uterature review
Further consideration of Brownian motion gives rise to a model of adhesion which Is not
static on a molecular scale. The crack tip In an adhesive system Is said to be wandering
kinetically as the molecules spontaneously break and rebond. Cracking is thus viewed as
a chemical reaction between molecules at the crack tip. The force applied to open or
close the crack is not the cause of the reaction, i.e. peeling or healing, at the crack tip.
The reaction happens spontaneously and equally In both directions, causing the crack to
open and close spontaneously at the molecular scale. Applying the crack driving force
merely shifts the chemical equilibrium in one particular direction, either opening or
closing the crack [73].
Lennard-Jones(V) potential
The two parameter U atomic model Includes attractive and repulsive forces which
operate over different distances (Fig 2-47). The repulsive force is short range, attributed
to electron to electron repulsion, related to the Pauli Exclusion Principle in the electron
shell [145]. The repulsive force is generally thought of as the atomic radius when the
atom Is modelled as a semi-solid sphere [73]. The adhesion term represents the
attraction between the protons In the nucleus to electrons of neighbouring atoms, which
extends beyond the electron shell. Since the repulsive and attractive forces operate over
different ranges then It is possible to see how atoms may position themselves together
In equilibrium between the two forces. This equilibrium position is represented as a
potential energy well. Once positioned within the energy well a certain amount of
energy is then required to escape it.
R J Crossley 79
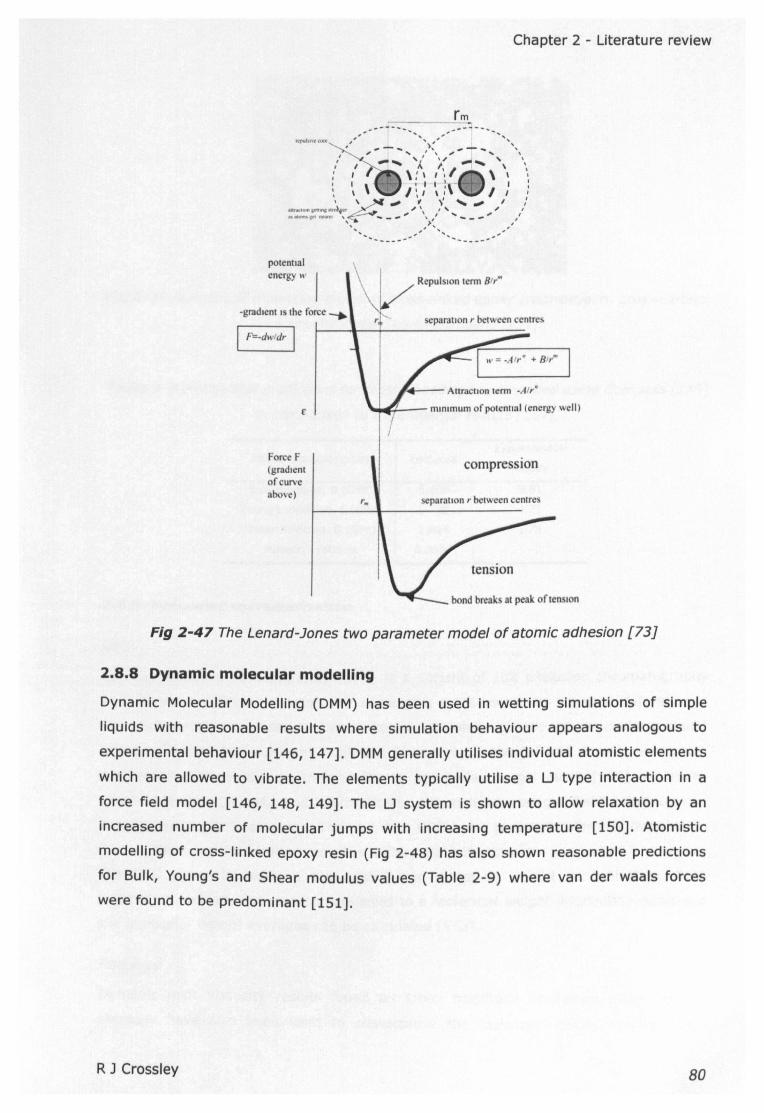
Chapter 2 - Literature review
r--__ ~r:.:.:m.,,...-_ ......
potennalenergy w
-gradrent I the force-.
I F=·dwfdr I
Force F
(gradientof curveabove)
Repulsion term81rM
r.
compression
r.. separationr between centres
tension
bond breaks at peak of tension
Fig 2-47 The Lenard-Jones two parameter model of atomic adhesion [73J
2.8.8 Dynamic molecular modelling
Dynamic Molecular Modelling (DMM) has been used in wetting simulations of simple
liquids with reasonable results where simulation behaviour appears analogous to
experimental behaviour [146, 147]. DMM generally utilises individual atomistic elements
which are allowed to vibrate. The elements typically utilise a LJ type interaction in a
force field model [146, 148, 149]. The LJ system is shown to allow relaxation by an
increased number of molecular jumps with increasing temperature [150]. Atomistic
modelling of cross-linked epoxy resin (Fig 2-48) has also shown reasonable predictions
for Bulk, Young's and Shear modulus values (Table 2-9) where van der waals forces
were found to be predominant [151].
R J Crossley 80
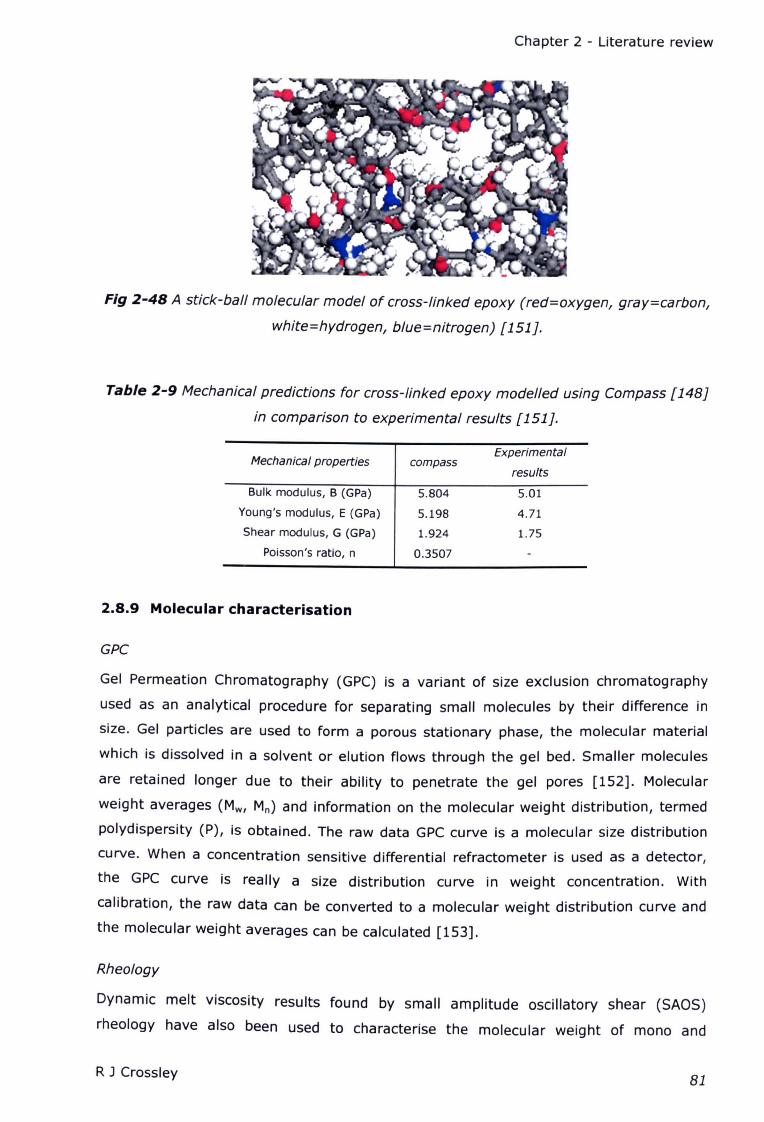
Chapter 2 - Literature review
Fig 2-48A stick-ball molecular model of cross-linked epoxy (red=oxygen, gray=carbon,
white=hydrogen, blue=nitrogen) [151}.
Table 2-9 Mechanical predictions for cross-linked epoxy modelled using Compass [148}
in comparison to experimental results [151}.
Mechanical propertiesExperimental
compassresults
Bulk modulus, B (GPa) 5.804 5.01
Young's modulus, E (GPa) 5.198 4.71
Shear modulus, G (GPa) 1.924 1.75
Poisson's ratio, n 0.3507
2.8.9 Molecular characterisation
GPC
Gel Permeation Chromatography (GPC) is a variant of size exclusion chromatography
used as an analytical procedure for separating small molecules by their difference in
size. Gel particles are used to form a porous stationary phase, the molecular material
which is dissolved in a solvent or elution flows through the gel bed. Smaller molecules
are retained longer due to their ability to penetrate the gel pores [152]. Molecular
weight averages (Mw, Mn) and information on the molecular weight distribution, termed
polydispersity (P), is obtained. The raw data GPC curve is a molecular size distribution
curve. When a concentration sensitive differential refractometer is used as a detector,
the GPC curve is really a size distribution curve in weight concentration. With
calibration, the raw data can be converted to a molecular weight distribution curve and
the molecular weight averages can be calculated [153].
Rheology
Dynamic melt viscosity results found by small amplitude oscillatory shear (SAOS)
rheology have also been used to characterise the molecular weight of mono and
R J Crossley81
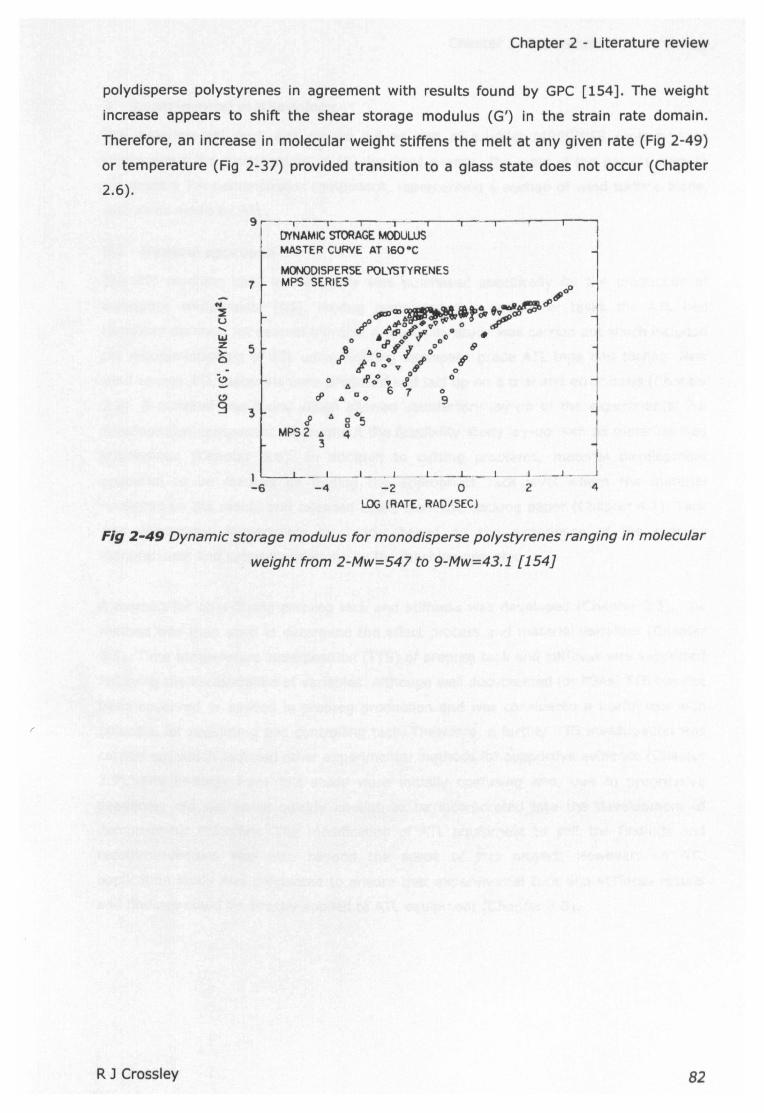
Chapter 2 - Literature review
polydisperse polystyrenes in agreement with results found by GPC [154]. The weight
increase appears to shift the shear storage modulus (G') in the strain rate domain.
Therefore, an increase in molecular weight stiffens the melt at any given rate (Fig 2-49)
or temperature (Fig 2-37) provided transition to a glass state does not occur (Chapter
2.6).
9~--,I DYNAMIC STORAGE t.1OOULU$
MASTER CURVE AT 160·C
7
o A <-er g 5
MPS 2 A 43
MONODISPERSE POLYSTYRENESMPS SERIES
...~u.....wz15-(,!)
o9
5
o
1 1__ 1_..1 __L _L. __ 1_ __L_
-6 -4 -2 0 2 4
LOG (RATE, RAD/SECl
Fig 2-49 Dynamic storage modulus for monodisperse polystyrenes ranging in molecular
weight from 2-Mw=547 to 9-Mw=43.1 [154]
R J Crossley 82
Chapter 3- Experimental methodology
3 Experimental methodology
The experimental work was carried out as part of a wider AIRPOWER project which
Incorporated the development of ATL for wind energy. The aims of the project were to
construct a 7m demonstrator component, representing a section of wind turbine blade,
with skins made by ATL.
3.1 General approach
The ATL machine used in this study was purchased specifically for the production of
aerospace components [65]. Having completed this and other tasks the ATL had
remained dormant for several months. A feasibility study was carried out which Included
the recommissioning of ATL using existing aerospace grade ATL tape and tooling. New
wind energy ATL materials were produced and laid up on a trial and error basis (Chapter
3.2). A material was found which allowed satisfactory lay-up of the experimental 7m
demonstrator component. Throughout the feasibility study lay-up with all materials was
problematic (Chapter 5.6). In addition to cutting problems, material development
appeared to be focused on finding the appropriate tack level where the material
remained on the mould and released easily from the backing paper (Chapter 4.1). Tack
was determined subjectively by touch, based on the experience of the prepreg
manufacturer and recommendations by the machine operator.
A method for quantifying prepreg tack and stiffness was developed (Chapter 3.3). The
method was then used to determine the effect process and material variables (Chapter
3.5). Time temperature superposition (ITS) of prepreg tack and stiffness was suspected
following the Investigation of variables. Although well documented for PSAs, ITS has not
been observed or applied In prepreg production and was considered a useful tool with
potential for regulating and controlling tack. Therefore, a further ITS Investigation was
carried out which Included other experimental methods for supportive evidence (Chapter
3.7). The findings from this study were Initially confusing and, due to progressive
deadlines, did not come quickly enough to be Incorporated Into the development of
demonstrator materials. The modification of ATL equipment to suit the findings and
recommendations was also beyond the scope of this project. However, an ATL
application study was conducted to ensure that experimental tack and stiffness results
and findings could be directly applied to ATL equipment (Chapter 3.8).
R 1 Crossley 83
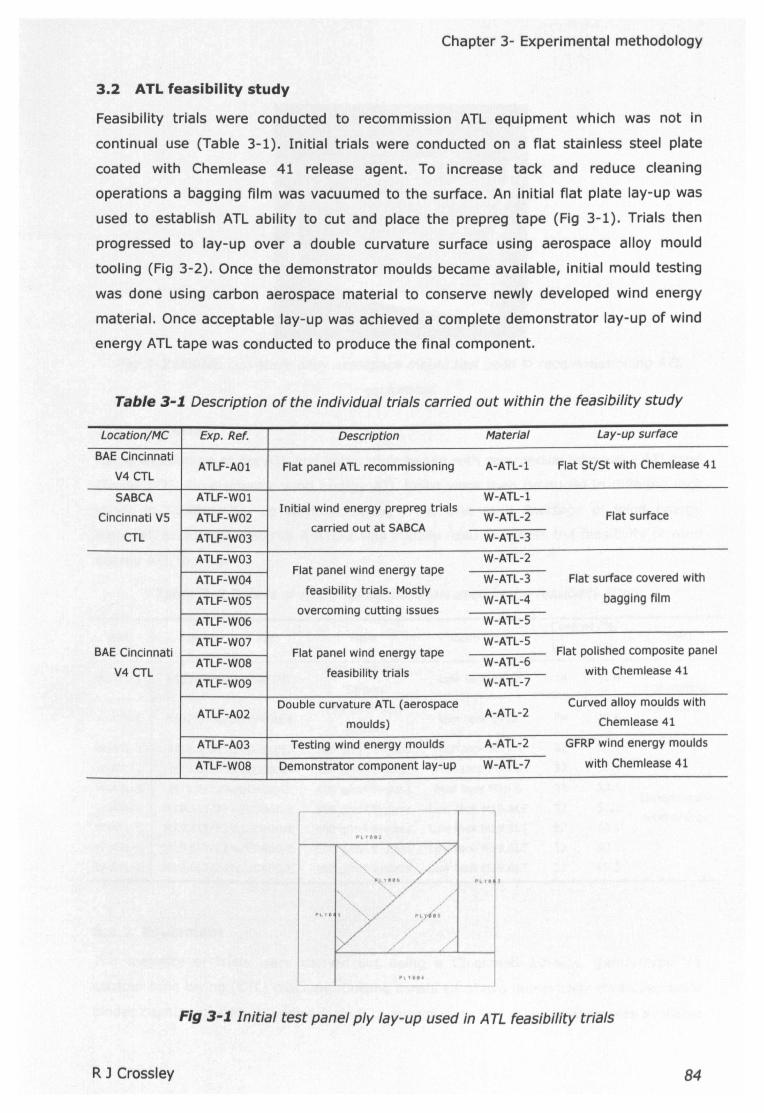
Chapter 3- Experimental methodology
3.2 ATL feasibility study
Feasibility trials were conducted to recommission ATL equipment which was not in
continual use (Table 3-1). Initial trials were conducted on a flat stainless steel plate
coated with Chemlease 41 release agent. To increase tack and reduce cleaning
operations a bagging film was vacuumed to the surface. An initial flat plate lay-up was
used to establish ATL ability to cut and place the prepreg tape (Fig 3-1). Trials then
progressed to lay-up over a double curvature surface using aerospace alloy mould
tooling (Fig 3-2). Once the demonstrator moulds became available, initial mould testing
was done using carbon aerospace material to conserve newly developed wind energy
material. Once acceptable lay-up was achieved a complete demonstrator lay-up of wind
energy ATL tape was conducted to produce the final component.
Table 3-1 Description of the individual trials carried out within the feasibility study
Location/MC Exp. Ref. Description Material Lay-up surface
BAE CincinnatiATLF-A01 Flat panel ATL recommissioning A-ATL-1 Flat St/St with Chemlease 41
V4 CTL
SABCA ATLF-W01 W-ATL-1
Cincinnati VS ATLF-W02Initial wind energy prepreg trials
W-ATL-2 Flat surfacecarried out at SABCA
CTL ATLF-W03 W-ATL-3
ATLF-W03 W-ATL-2
ATLF-W04Flat panel wind energy tape
W-ATL-3 Flat surface covered with
ATLF-WOSfeasibility trials. Mostly
W-ATL-4 bagging filmovercoming cutting Issues
ATLF-W06 W-ATL-S
ATLF-W07 W-ATL-SBAE Cincinnati Flat panel wind energy tape Flat polished composite panel
ATLF-W08 W-ATL-6V4 CTL feasibility trials with Chemlease 41
ATLF-W09 W-ATL-7
Double curvature ATL (aerospace Curved alloy moulds withATLF-A02 A-ATL-2
moulds) Chemlease 41
ATLF-A03 Testing wind energy moulds A-ATL-2 GFRP wind energy moulds
ATLF-W08 Demonstrator component lay-up W-ATL-7 with Chemlease 41
Plo v e e a
.P.,:.)/ /Y /'
P1.j"" ,
,// /
PL \. J
Fig 3-1 Initial test panel ply lay-up used in ATL feasibility trials
R J Crossley 84

Chapter 3- Experimental methodology
Fig 3-2 Double curvature al/oy aerospace mould tool used in recommissioning A TL
equipment
3.2.1 Materials
Recommissioning of the ATL and initial trials began with commercial aerospace ATL tape
(Table 3-2). Experimental wind energy ATL tapes were then produced in differing tack
levels to facilitate lay-up with increasing FAW. Due to a shortage of wind energy
material, aerospace material A-ATL-2 was initially used to assess the feasibility of wind
energy ATL tooling.
Table 3-2 Details of ATL prepreg materials used in the feasibility study
Ref. Manufacturer Ref. Fibre
A-ATL-1 8552/34%/UD268/1M7268 g/m2 IM7
Carbon
A-ATL-2 8552/34%/UD1941 AS4194 g/m2 AS4
Carbon
W-ATL-l M19.1/32%/UD200/E 200 g/m2 E-glass
W-ATL-2 M19.6/32%/UD200/E 200 g/m2 E-glass
W-ATL-3 M19.6/32%/UD400/E 400 g/m2 E-glass
W-ATL-4 M19.6LT/32%/UD300/E 300 g/m2 E-glass
W-ATL-5 M19.6LT/32%/UD400/E 400 g/m2 E-glass
W-ATL-6 M19.6LT/32%/UD600/E 600 g/m2 E-glass
W-ATL-7 M19.6LT/28%/UD400/E 400 g/m2 E-glass
Resin type
Low tack 8552 34
Low tack 8552 34
High tack M19.1 32
Med tack M19.6 32
Med tack M19.6 32
Low tack M19.6LT 32
Low tack M19.6LT 32
Low tack M19.6LT 32
Low tack M19.6LT 28
Content [%]
wt. Vol.Use
41.4Commercial
Aerospace41.4
50.1
50.1
50.1Experimental
50.1wind energy
50.1
50.1
45.3
3.2.2 Equipment
The majority of trials were carried out using a Cincinnati 10-axis, gantry-type V4
contour tape laying (CTL) machine. Cutting consisted of two numerically controlled knife
blades capable of cutting angles from 0 to approaching 90°. Tape heating was available
R J Crossley 85
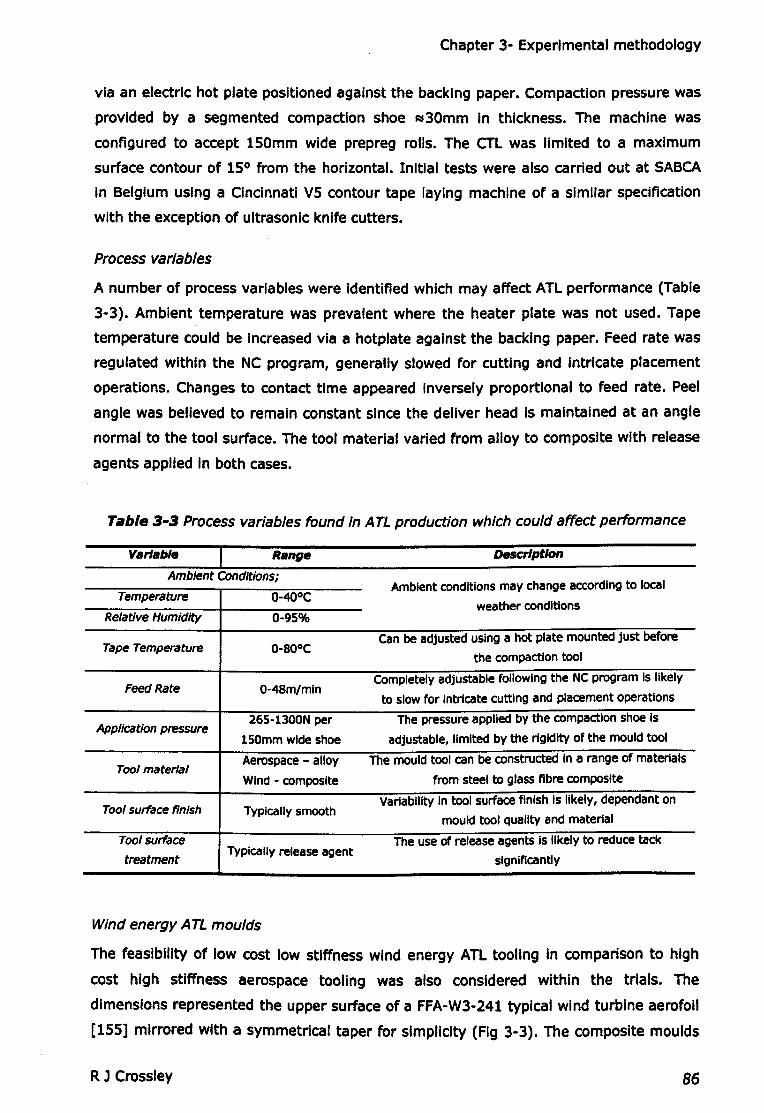
Chapter 3- Experimental methodology
via an electric hot plate positioned against the backing paper. Compaction pressure was
provided by a segmented compaction shoe ~30mm In thickness. The machine was
configured to accept ls0mm wide prepreg rolls. The CTL was limited to a maximum
surface contour of 150 from the horizontal. Initial tests were also carried out at SABCA
In Belgium using a Cincinnati VS contour tape laying machine of a similar specification
with the exception of ultrasonic knife cutters.
Process variables
A number of process variables were identified which may affect ATL performance (Table
3-3). Ambient temperature was prevalent where the heater plate was not used. Tape
temperature could be increased via a hotplate against the backing paper. Feed rate was
regulated within the NC program, generally slowed for cutting and Intricate placement
operations. Changes to contact time appeared Inversely proportional to feed rate. Peel
angle was believed to remain constant since the deliver head Is maintained at an angle
normal to the tool surface. The tool material varied from alloy to composite with release
agents applied in both cases.
Table 3-3Process variables found In A TL production which could affect performance
VlIrllIb/e I RlInge Desalptlon
Ambient Conditions;Ambient conditions may change according to local
Temperature 0-400Cweather conditions
Re/ative Humidity 0-95%
Tape Temperature 0-800Ccan be adjusted using a hot plate mounted just before
the compaction tool
Feed Rate 0-48m/mlnCompletely adjustable following the NC program Is likely
to slow for Intricate cutting and placement operations
Application pressure26S-1300N per The pressure applied by the compaction shoe Is
lSOmm wide shoe adjustable, limited by the rigidity of the mould tool
Too/ materialAerospace - alloy The mould tool can be constructed in a range of materials
Wind - compoSite from steel to glass fibre composite
Too/ surface finish Typically smoothVariability In tool surface finish is likely, dependant on
mould tool Quality and material
Too/ surface The use of release agents is likely to reduce tack
treatmentTypically release agent
significantly
Wind energy A TL moulds
The feasibility of low cost low stiffness wind energy ATL tooling in comparison to high
cost high stiffness aerospace tooling was also considered within the trials. The
dimensions represented the upper surface of a FFA-W3-241 typical wind turbine aerofoil
[155] mirrored with a symmetrical taper for simplicity (Fig 3-3). The composite moulds
R J Crossley 86

Chapter 3- Experimental methodology
with steel lattice structure are typical of those used in the wind turbine industry with the
following novel exceptions:-
• Low energy heating elements embedded within the mould laminate.
• Facility plates and blocks for post automation forming operations to overcome
the 15° angle limitation of the ATL machine.
Novel low energy heating elements were used to improve temperature control and
reduce thermal lag in comparison to traditional externally mounted elements. Facility
plates and blocks were used in post ATL manual handling operations to form leading and
trailing edge features which exceeded the 15° surface limitation. Lay-up was firstly
carried out on a gently curved surface not exceeding angle limitations then blocks were
inserted under the laminate to post-form the leading and trailing edge geometries (Fig
3-4).
45m 2MW typical commercial blade
\\__ - - -- - ,.---"
-J
I'
-- -,- - _ _.. ~.=--::::;J
Tipsection from35 to 42m bladeradius withFFA-W3-210aerofoils
Symmetrical uniform taperdemonstrator component
J
with mirrored FFA-W3-210
\
7m
Fig 3-3 The demonstrator component which is a representative section of a typical
commercial 45m turbine blade
All rights reserved
Fig 3-4 Demonstrator moulds with plates to allow ATL lay-up on surfaces below 15°
(left), blocks are then inserted to form leading and trailing edges (right)
R J Crossley 87
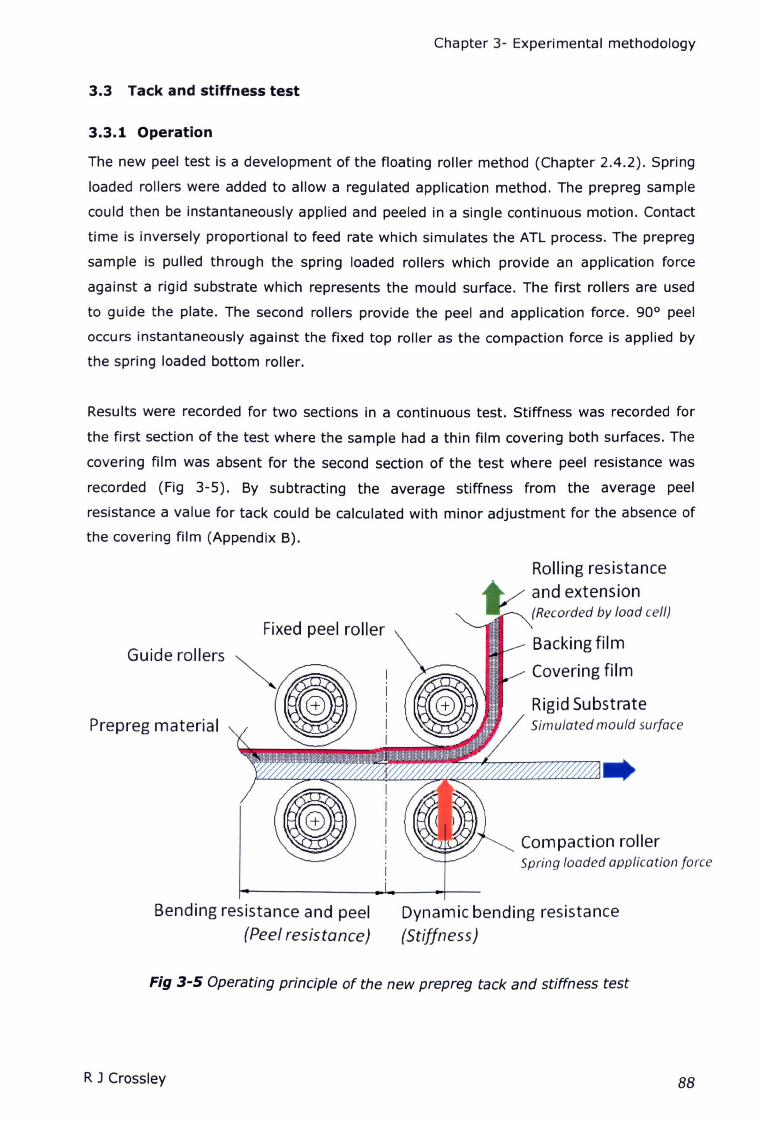
Chapter 3- Experimental methodology
3.3 Tack and stiffnesstest
3.3.1 Operation
The new peel test is a development of the floating roller method (Chapter 2.4.2). Spring
loaded rollers were added to allow a regulated application method. The prepreg sample
could then be instantaneously applied and peeled in a single continuous motion. Contact
time is inversely proportional to feed rate which simulates the ATL process. The prepreg
sample is pulled through the spring loaded rollers which provide an application force
against a rigid substrate which represents the mould surface. The first rollers are used
to guide the plate. The second rollers provide the peel and application force. 90° peel
occurs instantaneously against the fixed top roller as the compaction force is applied by
the spring loaded bottom roller.
Results were recorded for two sections in a continuous test. Stiffness was recorded for
the first section of the test where the sample had a thin film covering both surfaces. The
covering film was absent for the second section of the test where peel resistance was
recorded (Fig 3-5). By subtracting the average stiffness from the average peel
resistance a value for tack could be calculated with minor adjustment for the absence of
the covering film (Appendix B).
Guide rollers
Rolling resistance
and extension(Recorded by load cell)
Fixed peel roller
Prepreg material
Covering film
Rigid SubstrateSimulated mould surface
Compaction rollerSpring loaded application force
Bending resistance and peel
(Peel resistance)Dynamic bending resistance
(Stiffness)
Fig 3-5 Operating principle of the new prepreg tack and stiffness test
R J Crossley 88
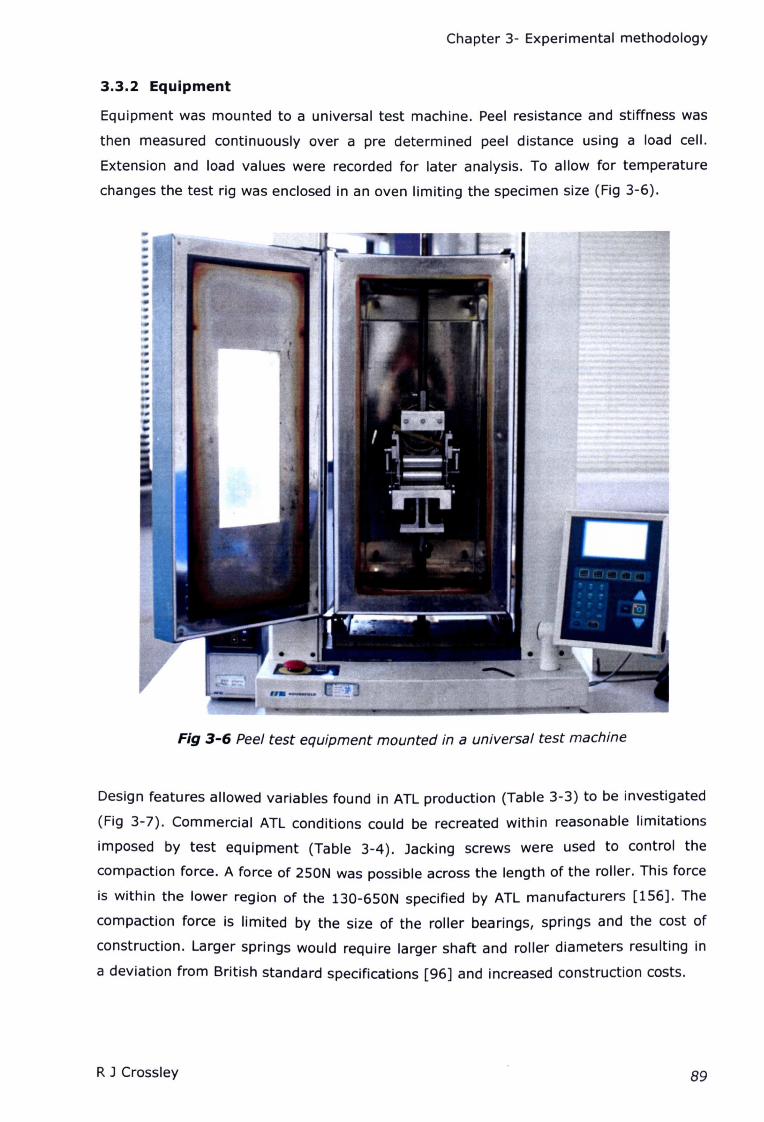
Chapter 3- Experimental methodology
3.3.2 Equipment
Equipment was mounted to a universal test machine. Peel resistance and stiffness was
then measured continuously over a pre determined peel distance using a load cell.
Extension and load values were recorded for later analysis. To allow for temperature
changes the test rig was enclosed in an oven limiting the specimen size (Fig 3-6).
Fig 3-6 Peel test equipment mounted in a universal test machine
Design features allowed variables found in ATL production (Table 3-3) to be investigated
(Fig 3-7). Commercial ATL conditions could be recreated within reasonable limitations
imposed by test equipment (Table 3-4). Jacking screws were used to control the
compaction force. A force of 250N was possible across the length of the roller. This force
is within the lower region of the 130-650N specified by ATL manufacturers [156]. The
compaction force is limited by the size of the roller bearings, springs and the cost of
construction. Larger springs would require larger shaft and roller diameters resulting in
a deviation from British standard specifications [96] and increased construction costs.
R J Crossley 89

To suit load cell fixture
Fixed peel roller
Rigid substrate
(simulating mouldsurface)
Spreader bar
(for easy
material loading)
Chapter 3- Experimental methodology
Material clamp
Jacking screws
Spring loaded
Compaction roller(hidden below)
Guide rollers
with adjustable
clearance
To suit base mount holes
Fig 3-7 Features of the new tack and stiffness test
An environmental chamber was unavailable due to budget constraints. Therefore,
relative humidity was recorded but not controlled. Feedrate was adjusted via controlling
software, limited to a maximum of lOOOmm/min. The solid substrate plate could be
made from any rigid mould material and treated with release agents to simulate mould
conditions. Adjustable clearance between the rollers allows for up to 6mm thickness of
substrate and prepreg material.
Table 3-4 Production variables in comparison to test limitations
Production variable Test range LimitationProduction
range
Temperature Ambient-BOOC Ambient-150°C Oven capabilities
Environmental chamber
absentRelative humidity
Feed rate
Application pressure
Mould surface
ATL tape thickness
5-95% uncontrolled
0.01-
1000mmlmin
25-250N
Any plate and
prep reg
Test mic
Springs, construction costs130-650N
Unlimited
0- >lmm6mm total roller clearance
R J Crossley 90
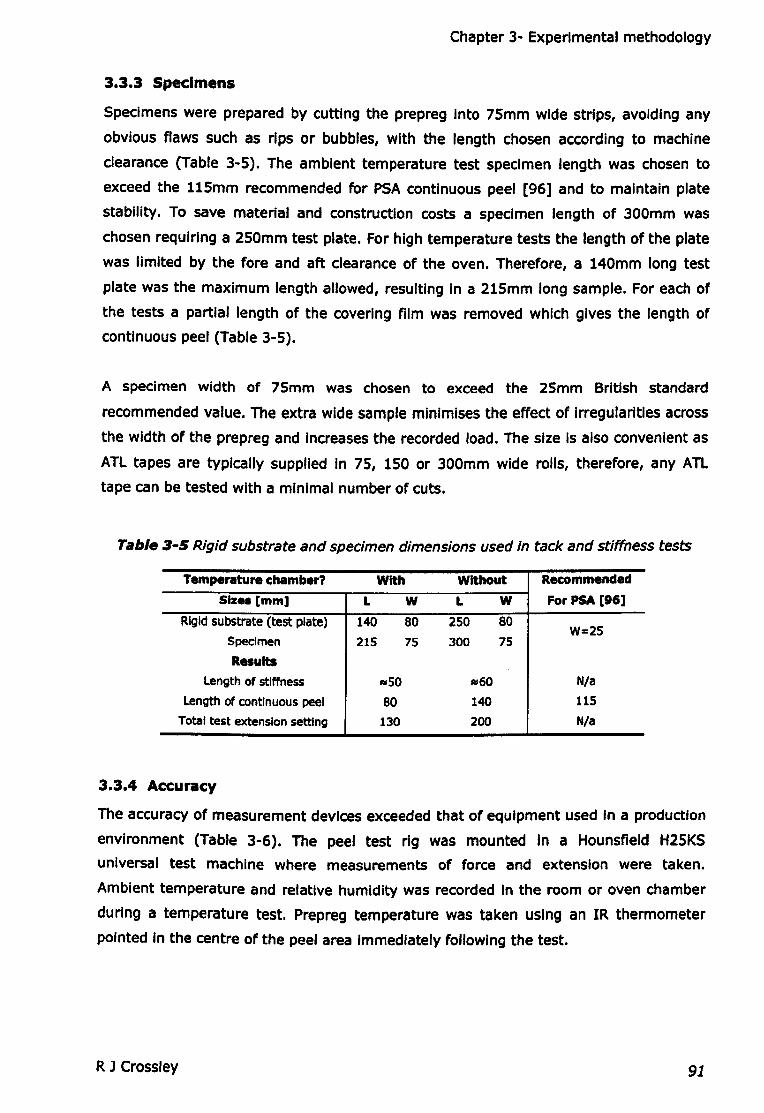
Chapter 3- Experimental methodology
3.3.3 Specimens
Specimens were prepared by cutting the prepreg Into 7smm wide strips, avoiding any
obvious flaws such as rips or bubbles, with the length chosen according to machine
clearance (Table 3-5). The ambient temperature test specimen length was chosen to
exceed the 11smm recommended for PSA continuous peel [96] and to maintain plate
stability. To save material and construction costs a specimen length of 300mm was
chosen requiring a 2s0mm test plate. For high temperature tests the length of the plate
was limited by the fore and aft clearance of the oven. Therefore, a 140mm long test
plate was the maximum length allowed, resulting In a 21smm long sample. For each of
the tests a partial length of the covering film was removed which gives the length of
continuous peel (Table 3-5).
A specimen width of 7Smm was chosen to exceed the 2smm British standard
recommended value. The extra wide sample minimises the effect of irregularities across
the width of the prepreg and increases the recorded load. The size Is also convenient as
ATL tapes are typically supplied in 75, 150 or 300mm wide rolls, therefore, any ATL
tape can be tested with a minimal number of cuts.
Table 3-5Rigid substrate and specimen dimensions used in tack and stiffness tests
Temperature chamber? With Without Recommended
Siz_ [mm] L W L W For PSA [9.]
Rigid substrate (test plate) 140 80 250 80W-25
Specimen 215 75 300 75
Results
Length of stiffness 11150 11160 Nla
Length of continuous peel 80 140 115
Total test extension setting 130 200 N/a
3.3.4 Accuracy
The accuracy of measurement devices exceeded that of equipment used In a production
environment (Table 3-6). The peel test rig was mounted In a Hounsfleld H25KS
universal test machine where measurements of force and extension were taken.
Ambient temperature and relative humidity was recorded In the room or oven chamber
during a temperature test. Prepreg temperature was taken using an IR thermometer
pointed In the centre of the peel area Immediately following the test.
R J Crossley 91
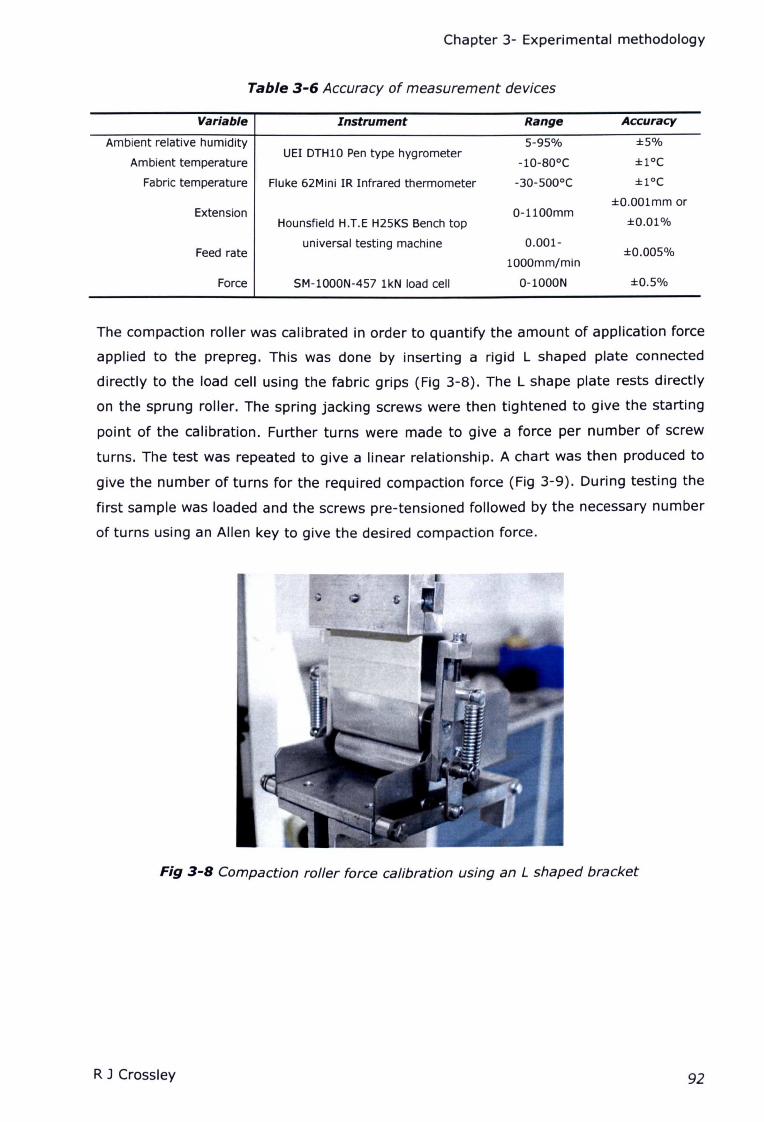
Chapter 3- Experimental methodology
Table 3-6 Accuracy of measurement devices
Variable Instrument Range
Ambient relative humidity S-9S%
Ambient temperatureUEI DTH10 Pen type hygrometer
-10-80oe
Fabric temperature Fluke 62Mini IR Infrared thermometer -30-S00oe
Extension O-llOOmmHounsfield H.T.E H25KS Bench top
universal testing machine 0.001-Feed rate
lOOOmm/min
Force SM-1000N-4S7 1kN load cell 0-1000N
Accuracy
±S%
±loe
±loe
±O.OOlmm or
±O.Ol%
±O.OOS%
±O.S%
The compaction roller was calibrated in order to quantify the amount of application force
applied to the prepreg. This was done by inserting a rigid L shaped plate connected
directly to the load cell using the fabric grips (Fig 3-8). The L shape plate rests directly
on the sprung roller. The spring jacking screws were then tightened to give the starting
point of the calibration. Further turns were made to give a force per number of screw
turns. The test was repeated to give a linear relationship. A chart was then produced to
give the number of turns for the required compaction force (Fig 3-9). During testing the
first sample was loaded and the screws pre-tensioned followed by the necessary number
of turns using an Allen key to give the desired compaction force.
Fig 3-8 Compaction roller force calibration using an L shaped bracket
R J Crossley 92
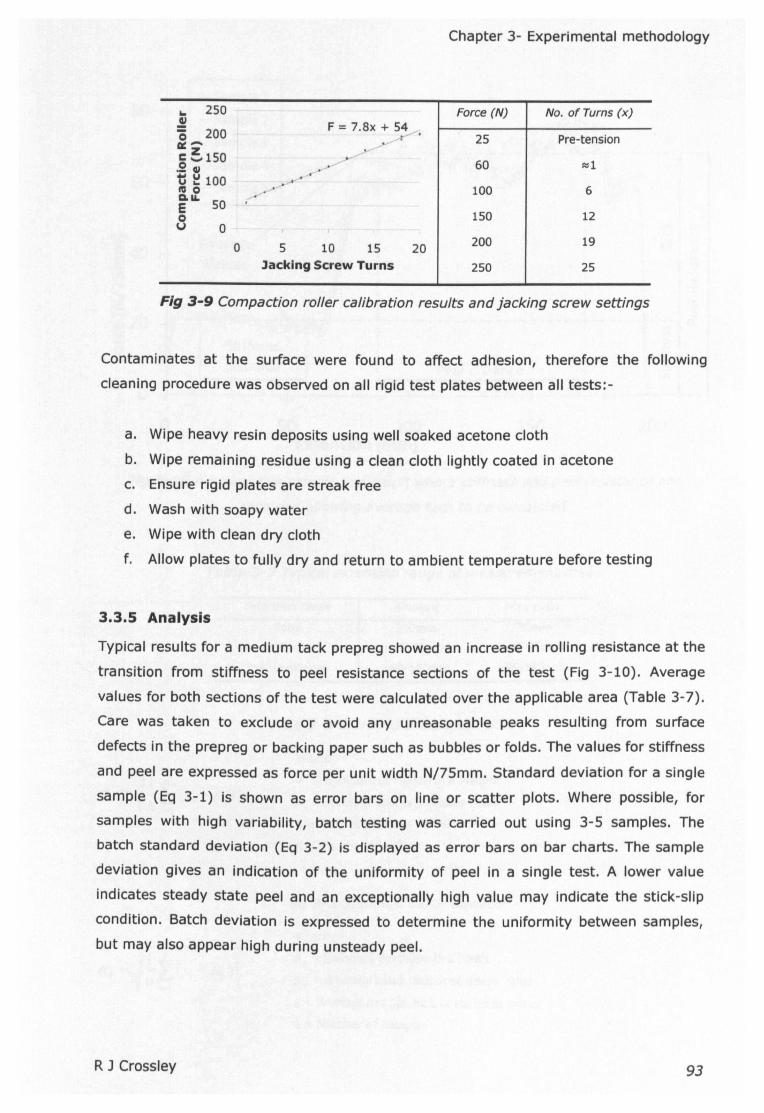
Chapter 3- Experimental methodology
.. 250 Force (N) No. of Turns (x).!! F = 7.8x + 54'0 200 :- 25 Pre-tensiona:: ...... _-'g !.150
r-' 60 Rjl._ GI
t ~100 ~-'.'-la 0 .~. 100 6Q.&&.
SO rE0 150 12v 0
0 5 10 15 20 200 19
Jacking Screw Turns 250 25
Fig 3-9 Compaction roller calibration results and jacking screw settings
Contaminates at the surface were found to affect adhesion, therefore the following
cleaning procedure was observed on all rigid test plates between all tests:-
a. Wipe heavy resin deposits using well soaked acetone cloth
b. Wipe remaining residue using a clean cloth lightly coated in acetone
c. Ensure rigid plates are streak free
d. Wash with soapy water
e. Wipe with clean dry cloth
f. Allow plates to fully dry and return to ambient temperature before testing
3.3.5 Analysis
Typical results for a medium tack prepreg showed an increase in rolling resistance at the
transition from stiffness to peel resistance sections of the test (Fig 3-10). Average
values for both sections of the test were calculated over the applicable area (Table 3-7).
Care was taken to exclude or avoid any unreasonable peaks resulting from surface
defects in the prepreg or backing paper such as bubbles or folds. The values for stiffness
and peel are expressed as force per unit width N/75mm. Standard deviation for a single
sample (Eq 3-1) is shown as error bars on line or scatter plots. Where possible, for
samples with high variability, batch testing was carried out using 3-5 samples. The
batch standard deviation (Eq 3-2) is displayed as error bars on bar charts. The sample
deviation gives an indication of the uniformity of peel in a single test. A lower value
indicates steady state peel and an exceptionally high value may indicate the stick-slip
condition. Batch deviation is expressed to determine the uniformity between samples,
but may also appear high during unsteady peel.
R J Crossley 93
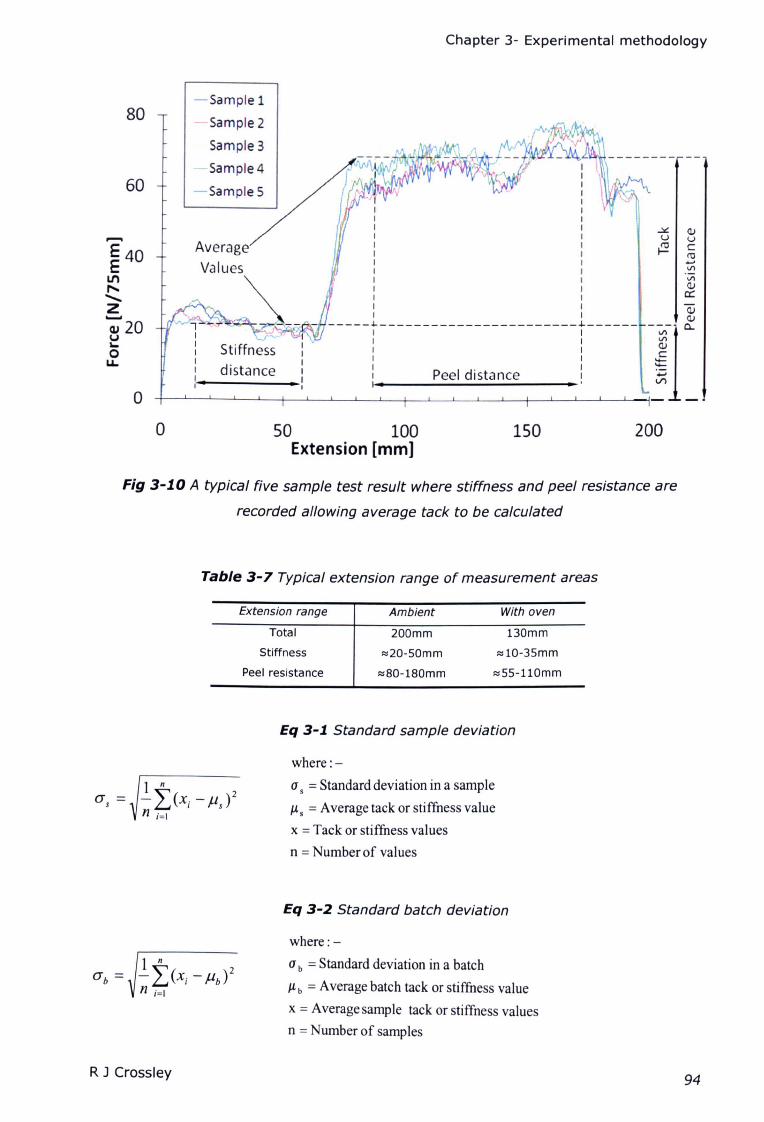
Chapter 3- Experimental methodology
80-Sample 1
-Sample2
Sample3
-Sample4
-SampleS60
o
<IJucre.......VI
VI<IJ
Cl:
<IJ
~~ __~_~t~i~_::_nn~ec_~-+__~_~- __--~-_-_rL-_-_-r-_-_-L~_~_:L~_:_:L:_:~:L:_e-~-r-_-~ __--J-_r_-J-_-_-~-_-~-i~ ~ .
AverageValues
o 150 20050 100Extension [mm]
Fig 3-1.0 A typical five sample test result where stiffness and peel resistance are
recorded aI/owing average tack to be calculated
Table 3-7 Typical extension range of measurement areas
Extension range
200mm
~20-50mm
~80-180mm
130mm
~10-35mm
~55-110mm
Ambient With oven
Total
Stiffness
Peel resistance
Eq 3-1. Standard sample deviation
where :-
a.= Standard deviation in a sample
fl. = Average tack or stiffness value
x = Tack or stiffness values
n = Number of values
Eq 3-2 Standard batch deviation
where: -
ab = Standard deviation in a batch
flb = Average batch tack or stiffness value
x = Average sample tack or stiffness values
n = Number of samples
R J Crossley 94
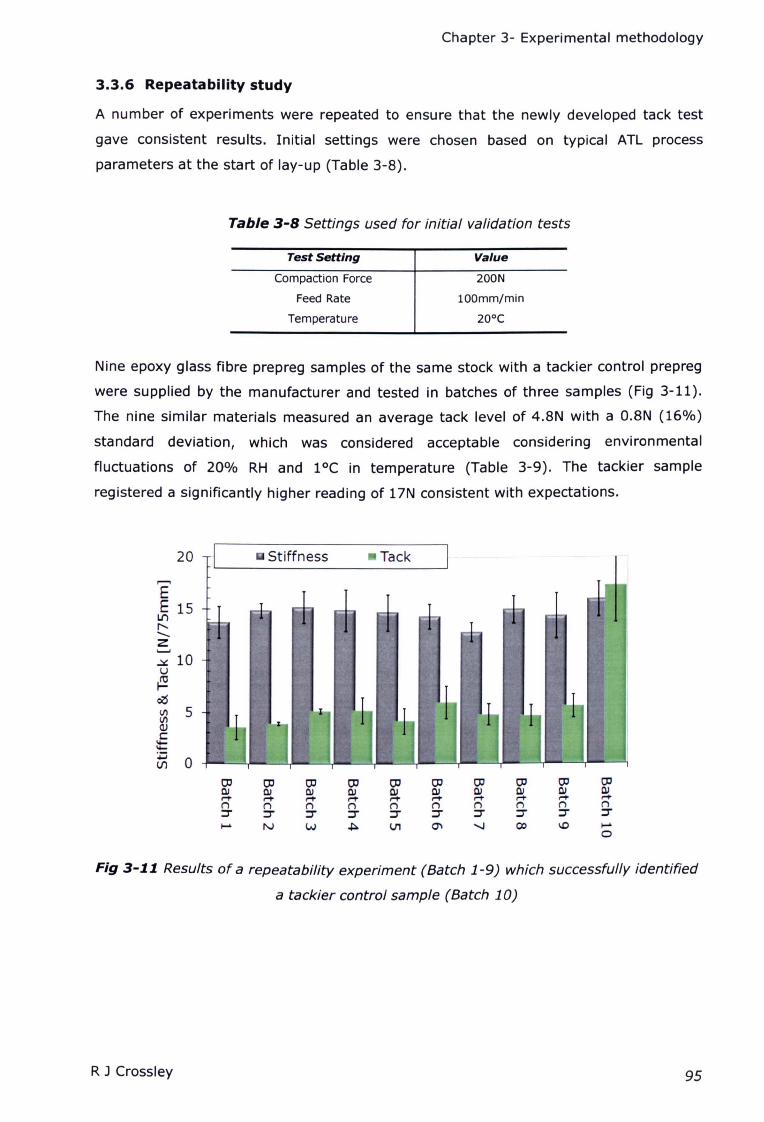
Chapter 3- Experimental methodology
3.3.6 Repeatability study
A number of experiments were repeated to ensure that the newly developed tack test
gave consistent results. Initial settings were chosen based on typical ATL process
parameters at the start of lay-up (Table 3-S).
Table 3-8Settings used for initial validation tests
Test Setting
200N
roomrn/mm
20°C
Value
Compaction Force
Feed Rate
Temperature
Nine epoxy glass fibre prepreg samples of the same stock with a tackier control prepreg
were supplied by the manufacturer and tested in batches of three samples (Fig 3-11).
The nine similar materials measured an average tack level of 4.SN with a O.SN (16%)
standard deviation, which was considered acceptable considering environmental
fluctuations of 20% RH and 1°C in temperature (Table 3-9). The tackier sample
registered a significantly higher reading of 17N consistent with expectations.
20 Stiffness Tack
,......,EE 15
Lt')r-,-Z...._,~ 10u~a.sIII 5IIICl)c:t::p
0(.f)
co co co co co co co co co coOJ OJ OJ OJ OJ OJ OJ OJ OJ OJ~ ~ ~ ~ ~ ~ ~ ~ I"'+' I"'+'(') (') (') (') (') (') (') (') (') (')
~ tr ~ :J' :J' :J' :J' :J' :J' :J',_..N W ~ V1 Cl' -...J ce 1.0 ,_..
0
Fig 3-11 Results of a repeatability experiment (Batch 1-9) which successfully identified
a tackier control sample (Batch 10)
R J Crossley 95
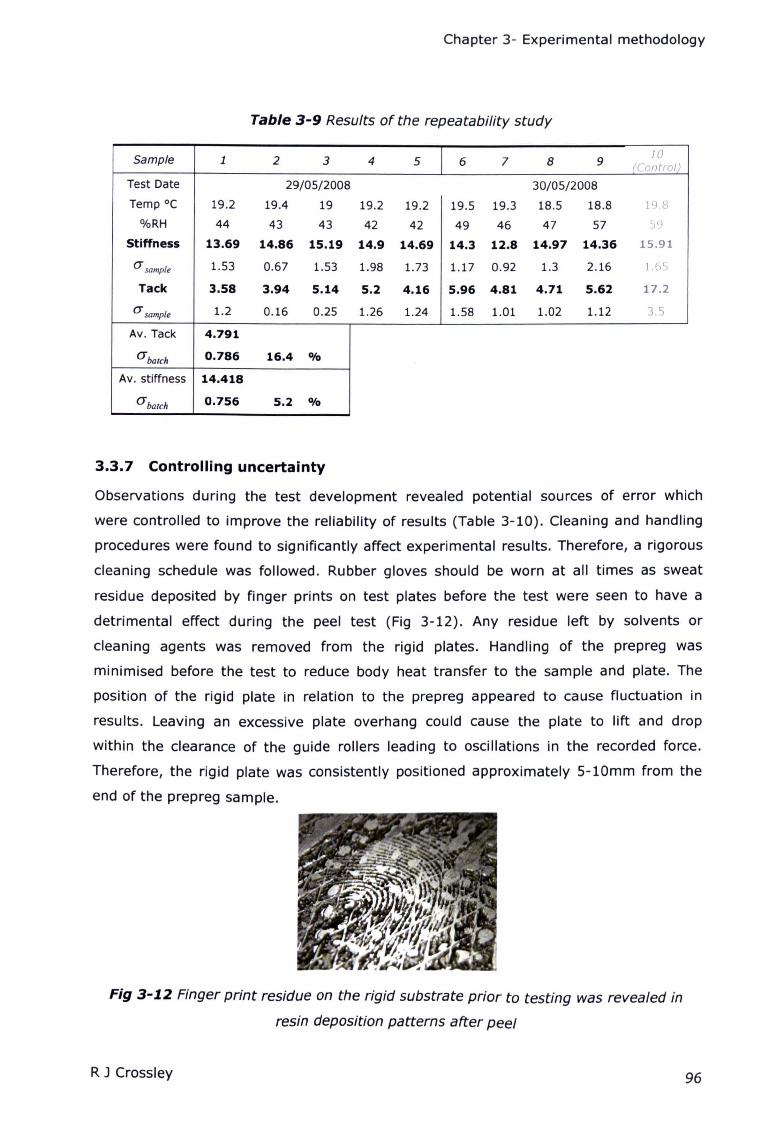
Chapter 3- Experimental methodology
Table 3-9 Results of the repeatability study
Sample 1 2 3 4 5 6 7 8 910
(Control)
Test Date 29/05/2008 30/05/2008
Temp °c 19.2 19.4 19 19.2 19.2 19.5 19.3 18.5 18.8 19.8
%RH 44 43 43 42 42 49 46 47 57 59
Stiffness 13.69 14.86 15.19 14.9 14.69 14.3 12.8 14.97 14.36 15.91
(J sample 1.53 0.67 1.53 1.98 1.73 1.17 0.92 1.3 2.16 1.65
Tack 3.58 3.94 5.14 5.2 4.16 5.96 4.81 4.71 5.62 17.2
(J sample 1.2 0.16 0.25 1.26 1.24 1.58 1.01 1.02 1.12 3.5
Av. Tack 4.791
aba/ch 0.786 16.4 Ofo
Av. stiffness 14.418
aba/ch 0.756 5.2 Ofo
3.3.7 Controlling uncertainty
Observations during the test development revealed potential sources of error which
were controlled to improve the reliability of results (Table 3-10). Cleaning and handling
procedures were found to significantly affect experimental results. Therefore, a rigorous
cleaning schedule was followed. Rubber gloves should be worn at all times as sweat
residue deposited by finger prints on test plates before the test were seen to have a
detrimental effect during the peel test (Fig 3-12). Any residue left by solvents or
cleaning agents was removed from the rigid plates. Handling of the prepreg was
minimised before the test to reduce body heat transfer to the sample and plate. The
position of the rigid plate in relation to the prepreg appeared to cause fluctuation in
results. Leaving an excessive plate overhang could cause the plate to lift and drop
within the clearance of the guide rollers leading to oscillations in the recorded force.
Therefore, the rigid plate was consistently positioned approximately 5-10mm from the
end of the prepreg sample.
Fig 3-1.2Finger print residue on the rigid substrate prior to testing was revealed in
resin deposition patterns after peel
R J Crossley 96
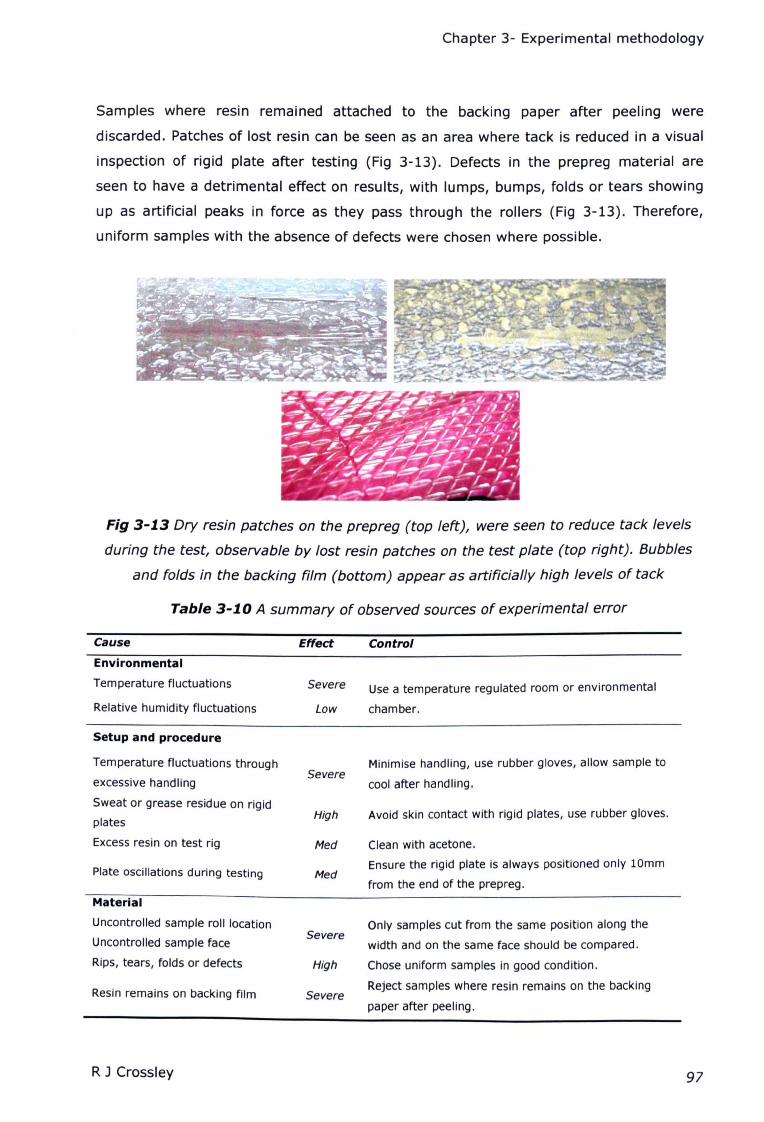
Chapter 3- Experimental methodology
Samples where resin remained attached to the backing paper after peeling were
discarded. Patches of lost resin can be seen as an area where tack is reduced in a visual
inspection of rigid plate after testing (Fig 3-13). Defects in the prepreg material are
seen to have a detrimental effect on results, with lumps, bumps, folds or tears showing
up as artificial peaks in force as they pass through the rollers (Fig 3-13). Therefore,
uniform samples with the absence of defects were chosen where possible.
Fig 3-13Dry resin patches on the prepreg (top left), were seen to reduce tack levels
during the test, observable by lost resin patches on the test plate (top right). Bubbles
and folds in the backing film (bottom) appear as artificially high levels of tack
Table 3-10 A summary of observed sources of experimental error
Cause Effect Control
Environmental
Temperature fluctuations
Relative humidity fluctuations
Severe Use a temperature regulated room or environmental
Low chamber.
Setup and procedure
Temperature fluctuations through
excessive handling
Sweat or grease residue on rigid
plates
Excess resin on test rig
SevereMinimise handling, use rubber gloves, allow sample to
cool after handling.
High Avoid skin contact with rigid plates, use rubber gloves.
Med Clean with acetone.
Ensure the rigid plate is always positioned only lOmm
from the end of the prepreg.Plate oscillations during testing Med
Material
Uncontrolled sample roll location
Uncontrolled sample face
Rips, tears, folds or defects
Severe
High
Only samples cut from the same position along the
width and on the same face should be compared.
Chose uniform samples in good condition.
Reject samples where resin remains on the backing
paper after peeling.Resin remains on backing film Severe
R J Crossley 97

Chapter 3- Experimental methodology
Dwell time
Once the prepreg is loaded it is allowed to rest on the rigid substrate until the start of
the test. This dwell time could potentially affect results since contact occurs. Therefore,
a dwell time test was conducted over three levels; zero, two and ten minutes. The
results show no noticeable effect on prepreg tack and stiffness exceeding experimental
error (Table 3-11). However, a negligible rise in compliance is attributed to the
formation of excess resin squeezed out in front of the compaction roller during the dwell
period. A raised pull force was recorded during this initial compliance stage which is
mostly outside the area of analysis but may affect the results. Therefore, although
significant effects are not observed, dwell time is minimised during testing.
Table 3-1.1. Dwell Time Results
Dwell Time (Mins) 0 2 10 [%]
Stiffness [N/75mm] 34.06 37.2 38.32 Effect 11.1
a 1.77 1.33 1.33 a 4
Tack [N/75mm] 65.42 50.07 56.9 Effect 23.5
a 24.73 21.14 23.76 a 40.4
Radius of bending
Previously, separating material stiffness from peel resistance required a significant
number of calculations and additional measurements [98]. However, in the new test,
stiffness was measured during the first stage of the test where a thin film covers the
tack surface. The radius of bending was seen to change between the stiffness and peel
sections of the test when the peel force is high. For the stiffness section the sample
typically followed the radius of the roller. During the peeling section the prepreg may be
retained on the plate surface extending away from the roller, resulting in a reduced
bending radius (Fig 3-14). The presence of the fibres ensures that the change in radius
remains small in all but the highest tack situations, in which the bending force is
considerably lower than tack. The effects of a change in radius are therefore considered
negligible in the comparison of prepregs with similar stiffness.
Fig 3-1.4 Deviation in bending radius from the roller radius during high tack peel
R J Crossley 98
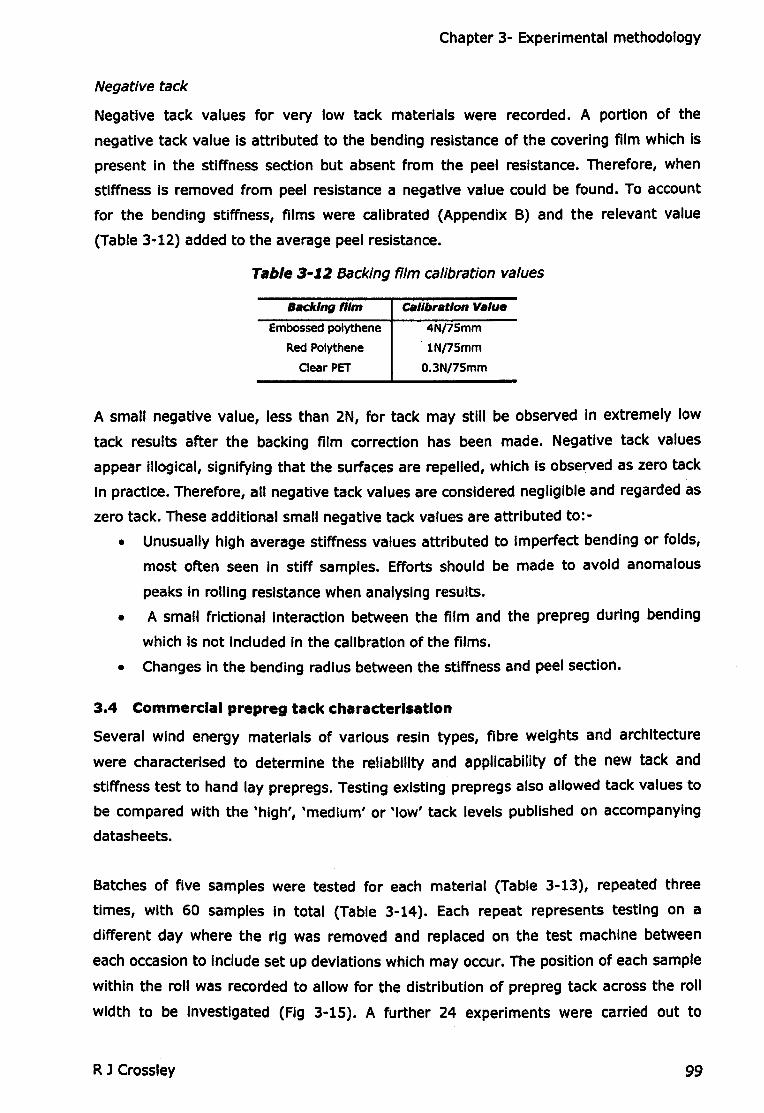
Chapter 3- Experimental methodology
Negative tack
Negative tack values for very low tack materials were recorded. A portion of the
negative tack value Is attributed to the bending resistance of the covering film which Is
present In the stiffness section but absent from the peel resistance. Therefore, when
stiffness is removed from peel resistance a negative value could be found. To account
for the bending stiffness, films were calibrated (Appendix B) and the relevant value
(Table 3-12) added to the average peel resistance.
Table 3-12 Backing film calibration values
4N/7Smm
·IN/7Smm
O.3N/7Smm
Embossed polythene
Red Polythene
Clear PET
A small negative value, less than 2N, for tack may still be observed In extremely low
tack results after the backing film correction has been made. Negative tack values
appear illogical, signifying that the surfaces are repelled, which is observed as zero tack
In practice. Therefore, all negative tack values are considered negligible and regarded as
zero tack. These additional small negative tack values are attributed to:-
• Unusually high average stiffness values attributed to imperfect bending or folds,
most often seen in stiff samples. Efforts should be made to avoid anomalous
peaks in rolling resistance when analysing results.
• A small frictional interaction between the film and the prepreg during bending
which is not Included in the calibration of the films.
• Changes in the bending radius between the stiffness and peel section.
3.4 Commercial prepreg tack characterl.atlon
Several wind energy materials of various resin types, fibre weights and architecture
were characterised to determine the reliability and applicability of the new tack and
stiffness test to hand lay prepregs. Testing existing prepregs also allowed tack values to
be compared with the 'high', 'medium' or 'low' tack levels published on accompanying
datasheets.
Batches of five samples were tested for each material (Table 3-13), repeated three
times, with 60 samples In total (Table 3-14). Each repeat represents testing on a
different day where the rig was removed and replaced on the test machine between
each occasion to Include set up deviations which may occur. The position of each sample
within the roll was recorded to allow for the distribution of prepreg tack across the roll
width to be Investigated (Fig 3-15). A further 24 experiments were carried out to
R J Crossley 99
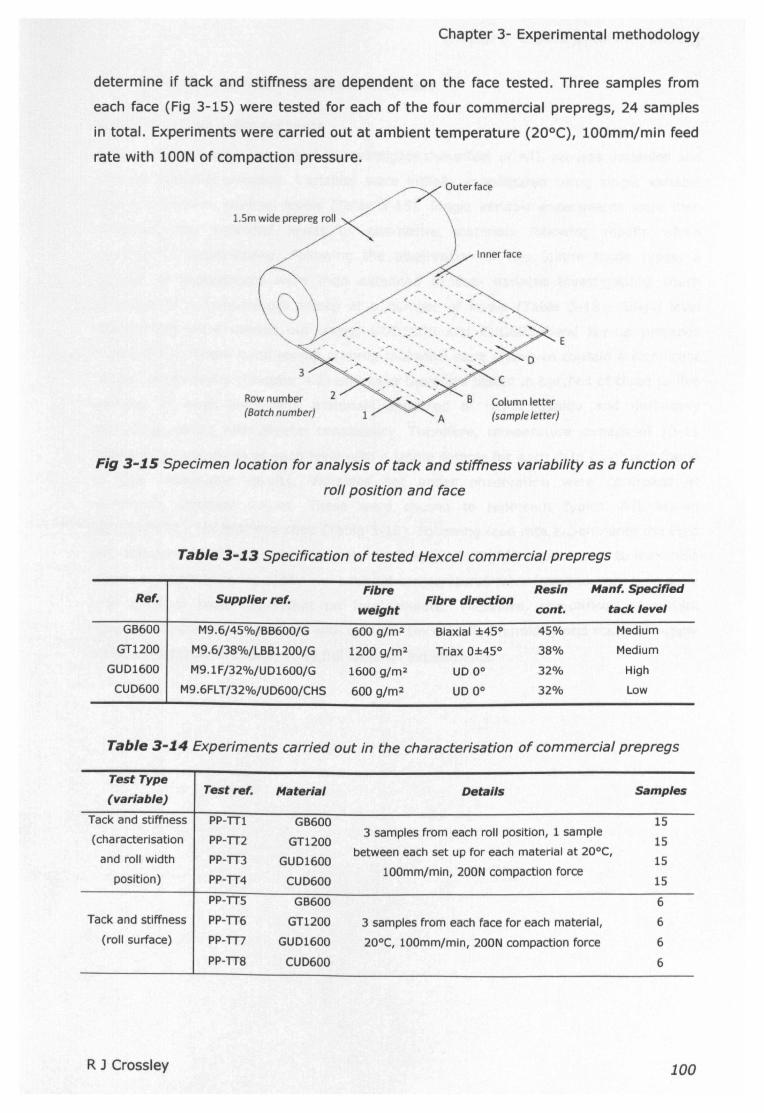
Chapter 3- Experimental methodology
determine if tack and stiffness are dependent on the face tested. Three samples from
each face (Fig 3-15) were tested for each of the four commercial prepregs, 24 samples
in total. Experiments were carried out at ambient temperature (20°C), 100mm/min feed
rate with lOON of compaction pressure.
l.5m wide prepreg roll
Inner face
E
Row number
(Batch number)Column letter
(sample letter)
Fig 3-15Specimen location for analysis of tack and stiffness variability as a function of
roll position and face
Table 3-13Specification of tested Hexcel commercial prepregs
Fibre Resin Hanf. SpecifiedRef. Supplier ref. Fibre direction
weight cont. tack level
GB600 M9.6/45%/BB600/G 600 g/m2 Biaxial :1::450 45% Medium
GT1200 M9.6/38%/LBB1200/G 1200 g/m2 Triax 0:1::450 3S% Medium
GUD1600 M9.1F/32%/UD1600/G 1600 g/m2 UD 0° 32% High
CUD600 M9.6FL T/32%/UD600/CHS 600 g/m2 UD 0° 32% Low
Table 3-14 Experiments carried out in the characterisation of commercial prepregs
Test TypeTest ref. Samples
(variable)Haterial Details
Tack and stiffness PP-TT1 GB600 15
(characterisation PP-TT2 GT12003 samples from each roll position, 1 sample
15
and roll width PP-TT3 GUD1600between each set up for each material at 200C,
15
position) PP-TT4 CUD600100mm/min, 200N compaction force
15
PP-TT5 GB600 6
Tack and stiffness PP-TT6 GT1200 3 samples from each face for each material, 6
(roll surface) PP-TT7 GUD1600 200C, 100mm/min, 200N compaction force 6
PP-TTS CUD600 6
R J Crossley 100
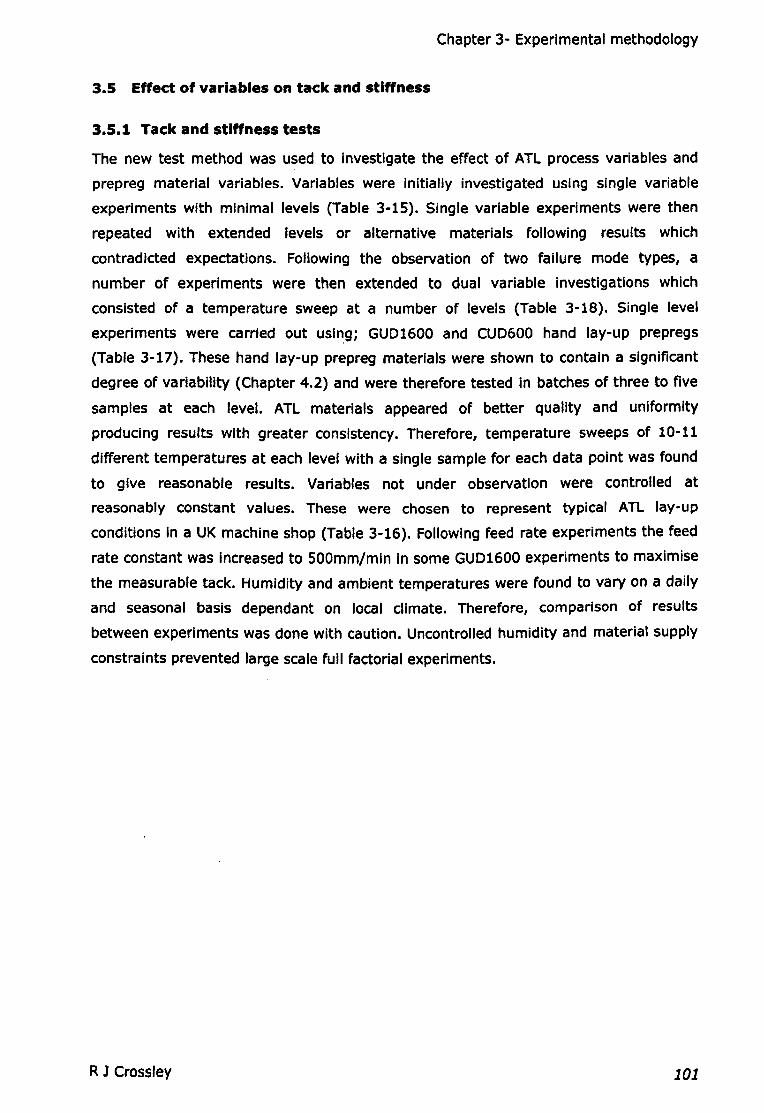
Chapter 3- Experimental methodology
3.5 Effect of variables on tack and stiffness
3.5.1 Tack and stiffness tests
The new test method was used to investigate the effect of ATL process variables and
prepreg material variables. Variables were initially investigated using single variable
experiments with minimal levels (Table 3-15). Single variable experiments were then
repeated with extended levels or alternative materials following results which
contradicted expectations. Following the observation of two failure mode types, a
number of experiments were then extended to dual variable investigations which
consisted of a temperature sweep at a number of levels (Table 3-18). Single level
experiments were carried out uSi~g; GUD1600 and CUD600 hand lay-up prepregs
(Table 3-17). These hand lay-up prepreg materials were shown to contain a significant
degree of variability (Chapter 4.2) and were therefore tested In batches of three to five
samples at each level. ATL materials appeared of better quality and uniformity
producing results with greater consistency. Therefore, temperature sweeps of 10-11
different temperatures at each level with a single sample for each data point was found
to give reasonable results. Variables not under observation were controlled at
reasonably constant values. These were chosen to represent typical ATL lay-up
conditions in a UK machine shop (Table 3-16). Following feed rate experiments the feed
rate constant was increased to 500mm/min in some GUD1600 experiments to maximise
the measurable tack. Humidity and ambient temperatures were found to vary on a daily
and seasonal basis dependant on local climate. Therefore, comparison of results
between experiments was done with caution. Uncontrolled humidity and material supply
constraints prevented large scale full factorial experiments.
R J Crossley 101
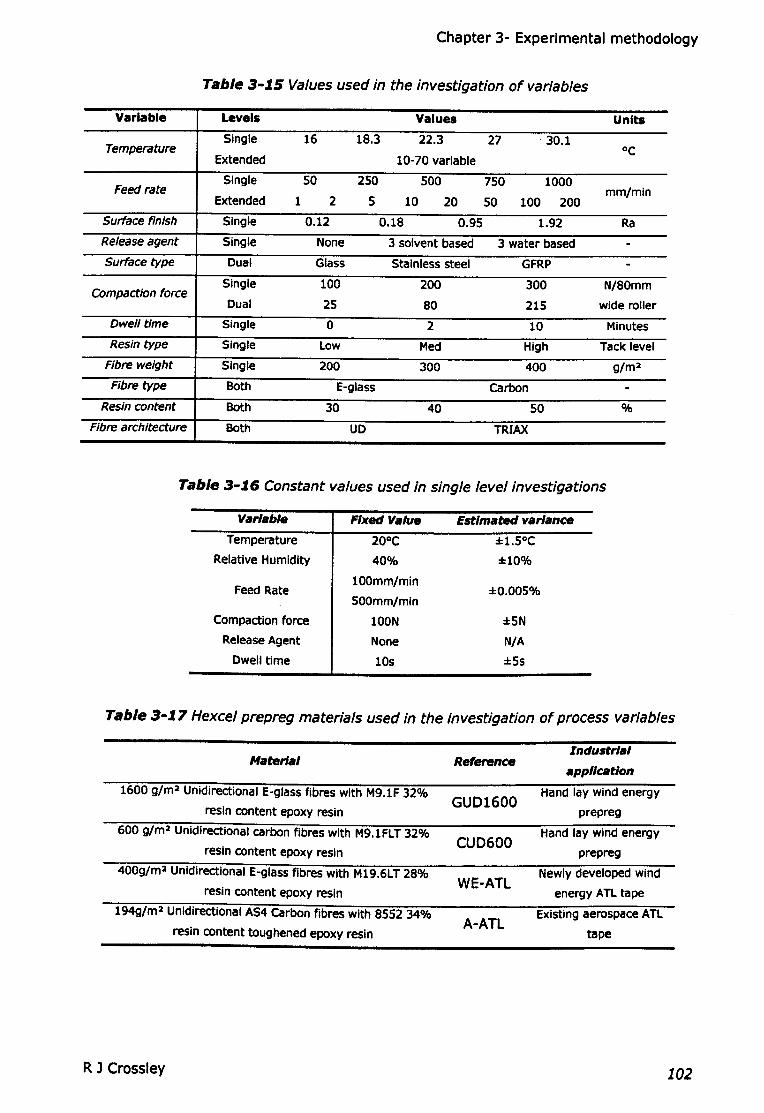
Chapter 3- Experimental methodology
Table 3-15 Values used in the investigation of variables
Variable Levels Values Units
Single 16 18.3 22.3 27 ·30.1Temperature °C
Extended 10-70 variable
Single 50 250 500 750 1000Feed rate mm/mm
Extended 1 2 5 10 20 50 100 200
Surface finish Single 0.12 0.18 0.95 1.92 Ra
Release agent Single None 3 solvent based 3 water based -Surface type Dual Glass Stainless steel GFRP -
Single 100 200 300 N/80mmCompaction force
Dual 25 80 215 wide roller
Dwell time Single 0 2 10 Minutes
Resin type Single Low Med High Tack level
Fibre weight Single 200 300 400 g/m2
Fibre type Both E-glass Carbon -Resin content Both 30 40 50 %
Fibre architecture Both UD TRIAX
Table 3-16 Constant values used in single level investigations
Variable Fixed Value Estimated variance
Temperature 20°C :l:1.5°C
Relative Humidity 40% :UO%
Feed Rateloommlmln
:1:0.005%5OOmm/mln
Compaction force lOON ±5N
ReleaseAgent None NIA
Dwell time lOs ±5s
Table 3-17 Hexcel prepreg materials used in the investigation of process variables
Industrial"'aterlal Reference
application
1600 g/m2 Unidirectional E-glass fibres with M9.1F 32%GUD1600
Hand lay wind energy
resin content epoxy resin prepreg
600 91m2 Unidirectional carbon fibres with M9.1FLT32%CUD600
Hand lay wind energy
resin content epoxy resin prepreg
400g/m2 Unidirectional E-glass fibres with M19.6LT 28%WE-ATL
Newly developed wind
resin content epoxy resin energy ATL tape
1949/m2 Unidirectional AS4 carbon fibres with 8552 34%A-ATL
Existing aerospace ATL
resin content toughened epoxy resin tape
R J Crossley 102
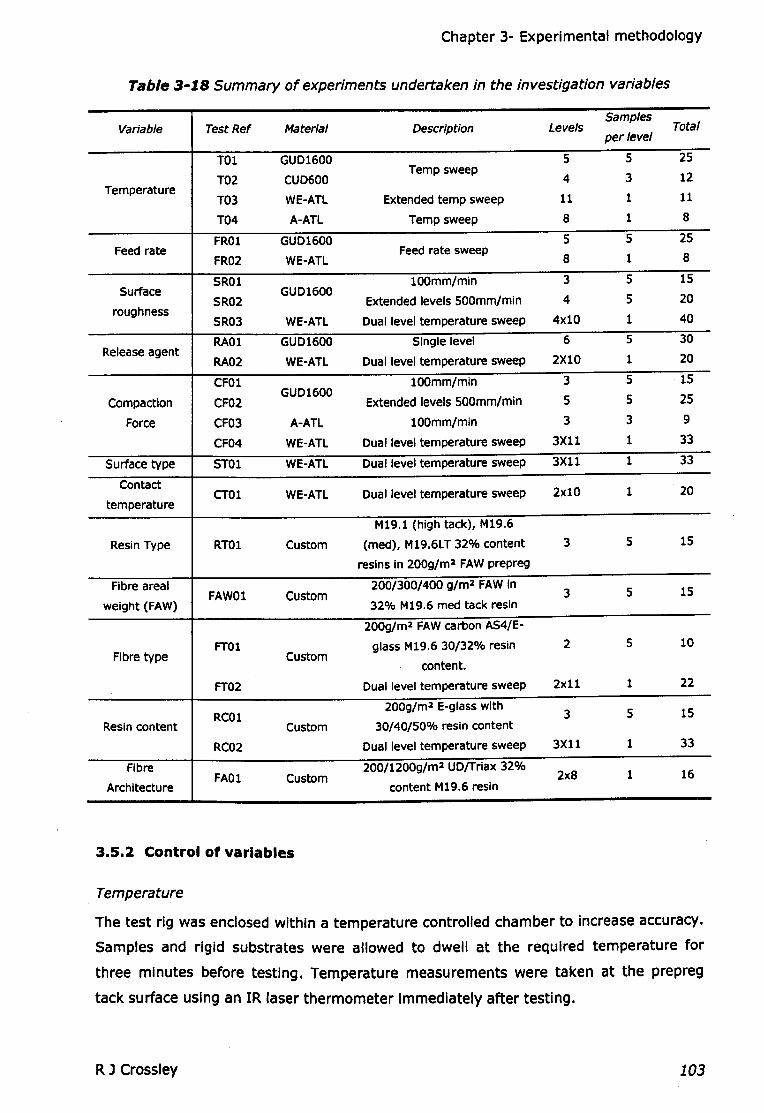
Chapter 3- Experimental methodology
Table 3-18 Summary of experiments undertaken in the investigation variables
Variable Test Ref Material LevelsSamples
TotalDescriptionper level
TOI GUD1600 5 5 25
T02 CUD600Temp sweep
4 3 12Temperature
T03 WE-ATl Extended temp sweep 11 1 11
T04 A-ATl Temp sweep 8 1 8
FROl GUD1600 5 5 25Feed rate Feed rate sweep
8FR02 WE-ATL 8 1
SROl iuomm/mm 3 5 15Surface GUD1600
SR02 Extended levels 500mm/min 4 5 20roughness
SR03 WE-ATl Dual level temperature sweep 4x10 1 40
RAOI GUD1600 Single level 6 5 30Release agent
RA02 WE-ATl Dual level temperature sweep 2XI0 1 20
CFOl 100mm/min 3 5 15GUD1600
5 5 25Compaction CF02 Extended levels 500mm/min
Force CF03 A-ATL loomm/min 3 3 9
CF04 WE-ATl Dual level temperature sweep 3Xll 1 33
Surface type STOl WE-ATl Dual level temperature sweep 3X11 1 33
Contact2xlO 1 20cror WE-ATl Dual level temperature sweep
temperature
M19.1 (high tack), M19.6
Resin Type RTOI Custom (med), M19.6lT 32% content 3 5 15
resins in 200g/m2 FAWprepreg
Fibre areal 200/300/400 g/m2 FAWIn3 5 15FAWOl Custom
weight (FAW) 32% M19.6 med tack resin
200g/m2 FAWcarbon AS4/E-
FTOl glass M19.6 30/32% resin 2 5 10Fibre type Custom
content.
FT02 Dual level temperature sweep 2x11 1 22
RCOl200g/m2 E-glass with
3 5 15Resin content Custom 30/40/50% resin content
RC02 Dual level temperature sweep 3X11 1 33
Fibre 2oo/1200g/m2 UD/Trlax 32%1 16FAOl Custom 2x8
Architecture content M19.6 resin
3.5.2 Control of variables
Temperature
The test rig was enclosed within a temperature controlled chamber to Increase accuracy.
Samples and rigid substrates were allowed to dwell at the required temperature for
three minutes before testing. Temperature measurements were taken at the prepreg
tack surface using an IR laser thermometer immediately after testing.
R J Crossley 103
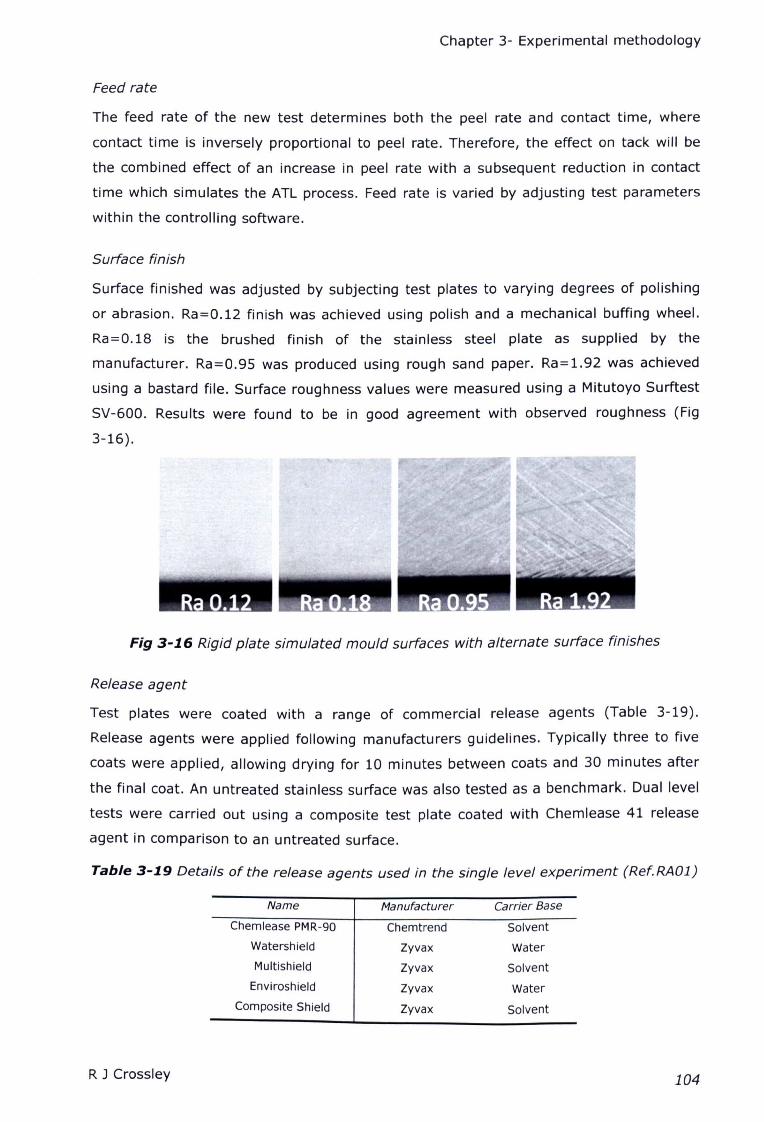
Chapter 3- Experimental methodology
Feed rate
The feed rate of the new test determines both the peel rate and contact time, where
contact time is inversely proportional to peel rate. Therefore, the effect on tack will be
the combined effect of an increase in peel rate with a subsequent reduction in contact
time which simulates the ATL process. Feed rate is varied by adjusting test parameters
within the controlling software.
Surface finish
Surface finished was adjusted by subjecting test plates to varying degrees of polishing
or abrasion. Ra=0.12 finish was achieved using polish and a mechanical buffing wheel.
Ra=0.18 is the brushed finish of the stainless steel plate as supplied by the
manufacturer. Ra=0.95 was produced using rough sand paper. Ra=1.92 was achieved
using a bastard file. Surface roughness values were measured using a Mitutoyo Surf test
SV-600. Results were found to be in good agreement with observed roughness (Fig
3-16).
Ra 0.12
Fig 3-16 Rigid plate simulated mould surfaces with alternate surface finishes
Release agent
Test plates were coated with a range of commercial release agents (Table 3-19).
Release agents were applied following manufacturers guidelines. Typically three to five
coats were applied, allowing drying for 10 minutes between coats and 30 minutes after
the final coat. An untreated stainless surface was also tested as a benchmark. Dual level
tests were carried out using a composite test plate coated with Chemlease 41 release
agent in comparison to an untreated surface.
Table 3-19 Details of the release agents used in the single level experiment (Ref.RA01)
Name Manufacturer Carrier Base
Chemlease PMR-90 Chemtrend Solvent
Watershield Zyvax Water
Multishield Zyvax Solvent
Enviroshield Zyvax Water
Composite Shield Zyvax Solvent
R J Crossley 104
Chapter 3- Experimental methodology
Compaction force
Compaction force was varied by adjusting the tension of the springs connected to the
compaction roller using jacking screws. The total force acting over the 7Smm wide
02Smm roller was calibrated using the load cell (Chapter 3.3.4). To Improve
repeatability the jacking screws were set using the first sample and remained in a fixed
position for the duration of the experiment. The test rig allowed the springs to be spread
for sample loading without tension adjustment.
Contact temperature
Contact temperature was adjusted by pre-applying prepreg samples to the test plates
using the test rig without peeling. This was achieved by placing a thin film into the jaws
of the test rig and through the rollers. The test plate and sample were then loaded into
the rig without clamping onto the prepreg. The plate and sample and test rig were
contained within the oven heated to 40°C. A dwell time of 10 minutes was allowed for
the sample to reach the required temperature. The film was then pulled at SOOmmlmin
using the universal testing machine. The result was 40°C, SOOmmlmin applied samples
under lOON compaction force without peeling. Samples were then allowed to cool to
ambient temperature before testing proceeded as normal. Samples were compared to
standard testing where application is instantaneous under the compaction roller at the
time of and temperature of peeling.
Surface type
Additional test plates were manufactured from tempered glass and glass fibre reinforced
epoxy composite. Composite plates were constructed and finished to match the mould
surface typically found with wind energy mould tools. Test plates were compared with
stainless steel plates used throughout other experiments.
Resin Type
Prepreg samples were prepared by the manufacturer using unidirectional E-glass 200
g/m2 Impregnated with 32% SPA epoxy resin content with varying degrees of S stage
reaction. Three resin types, distinguished by their tack properties, were Impregnated
using similar methods and equipment; M19.6LT (Low tack), M19.6 (Medium tack) and
M19.1 (High tack).
Fibre areal weight (FAW)
Three prepreg materials with M19.6 resin at 32% content were supplied. FAWs were
adjusted to 200, 300 and 400 g/m2• Five samples were tested for each fibre weight
variant. Error bars represent batch deviation within the five samples.
R J Crossley 105
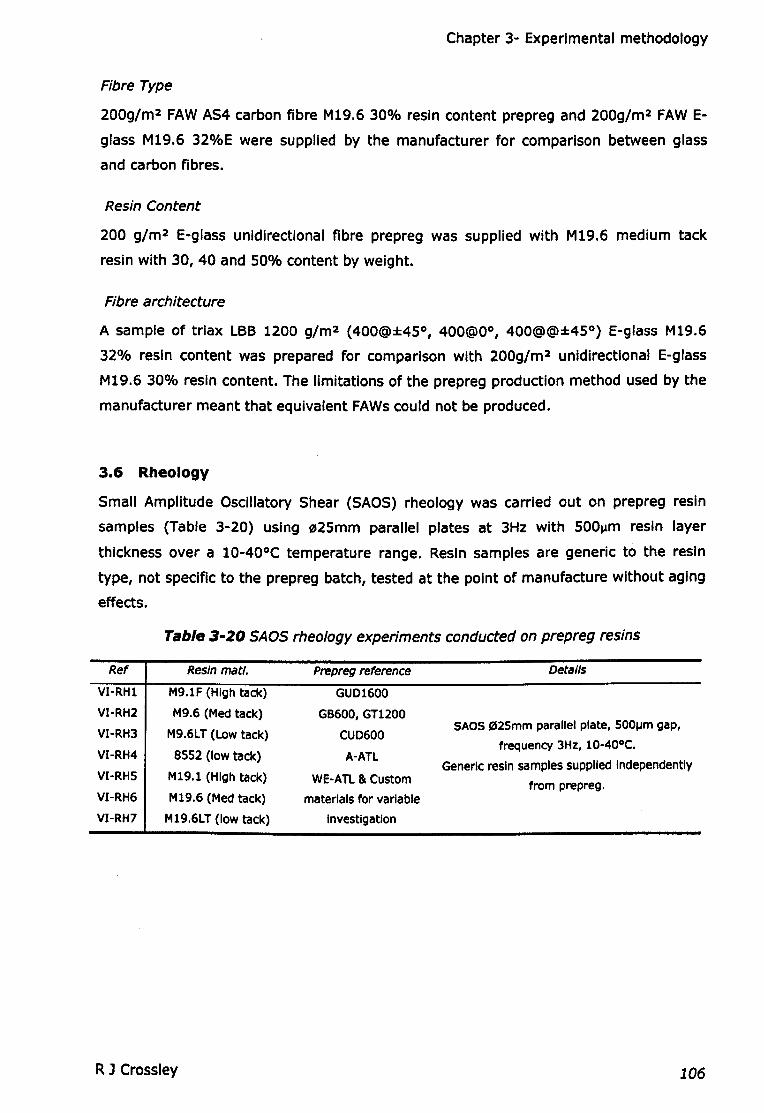
Chapter 3- Experimental methodology
Fibre Type
200g/m2 FAWAS4 carbon fibre M19.6 30% resin content prepreg and 200g/m2 FAW E-
glass M19.6 32%E were supplied by the manufacturer for comparison between glass
and carbon fibres.
Resin Content
200 g/m2 E-glass unidirectional fibre prepreg was supplied with M19.6 medium tack
resin with 30,40 and 50% content by weight.
Fibre architecture
A sample of triax LBB 1200 g/m2 (400@±45°, 400@Oo, 400@@±45°) E-glass M19.6
32% resin content was prepared for comparison with 200g/m2 unidirectional E-glass
M19.6 30% resin content. The limitations of the prepreg production method used by the
manufacturer meant that equivalent FAWscould not be produced.
3.6 Rheology
Small Amplitude OSCillatory Shear (SAOS) rheology was carried out on prepreg resin
samples (Table 3-20) using 025mm parallel plates at 3Hz with 500~m resin layer
thickness over a 10-40oC temperature range. Resin samples are generic to the resin
type, not specific to the prepreg batch, tested at the point of manufacture without aging
effects.
Table 3-20 SAOS rheology experiments conducted on prepreg resins
Ref Resin mati. Prepreg reference
VI-RHl M9.lF (High tack) GUDl600
VI-RH2 M9.6 (Med tack) GB600, GTl200
VI-RH3 M9.6LT (Low tack) CUD600
VI-RH4 8552 (low tack) A-ATL
VI-RH5 Ml9.l (High tack) WE-ATL& Custom
VI-RH6 Ml9.6 (Med tack) materials for variable
VI-RH7 Ml9.6LT (low tack) Investigation
Details
SAOS02Smm parallel plate, SOO~mgap,
frequency 3Hz, lO-40oC.
Generic resin samples supplied Independently
from prepreg.
R J Crossley 106
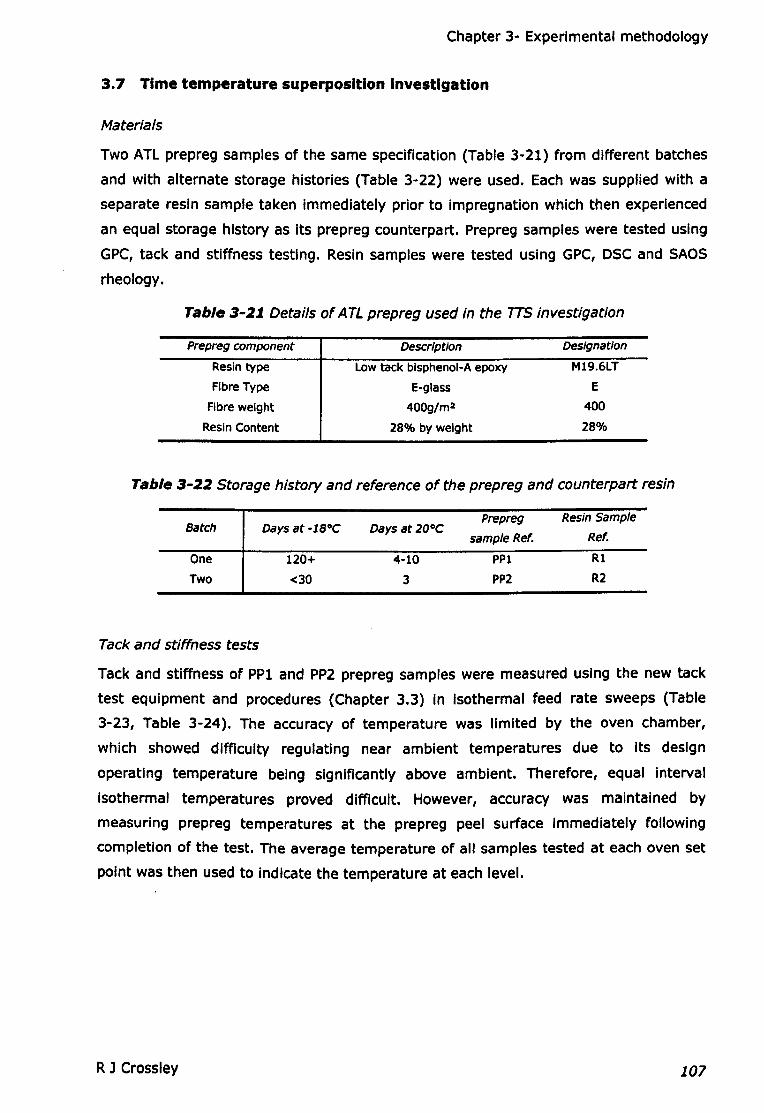
Chapter 3- Experimental methodology
3.7 Time temperature superposition Investigation
Materials
Two ATL prepreg samples of the same specification (Table 3-21) from different batches
and with alternate storage histories (Table 3-22) were used. Each was supplied with a
separate resin sample taken immediately prior to impregnation which then experienced
an equal storage history as Its prepreg counterpart. Prepreg samples were tested using
GPC, tack and stiffness testing. Resin samples were tested using GPC, DSC and SAOS
rheology.
Table 3-21 Details of ATLprepreg used in the 7TSinvestigation
Prepreg component Description Designation
Resin type Low tack bisphenol-A epoxy M19.6LT
Fibre Type E-glass E
Fibre weight 400g/m2 400
Resin Content 28% by weight 28%
Table 3-22 Storage history and reference of the prepreg and counterpart resin
BatchPrepreg Resin Sample
Days at -18°C Days at 20°Csample Ref. Ref.
One 120+ 4-10 PP1 Ri
Two <30 3 PP2 R2
Tack and stiffness tests
Tack and stiffness of PPl and PP2 prepreg samples were measured using the new tack
test equipment and procedures (Chapter 3.3) In Isothermal feed rate sweeps (Table
3-23, Table 3-24). The accuracy of temperature was limited by the oven chamber,
which showed difficulty regulating near ambient temperatures due to its design
operating temperature being significantly above ambient. Therefore, equal Interval
Isothermal temperatures proved difficult. However, accuracy was maintained by
measuring prepreg temperatures at the prepreg peel surface Immediately following
completion of the test. The average temperature of all samples tested at each oven set
point was then used to indicate the temperature at each level.
R 1 Crossley 107
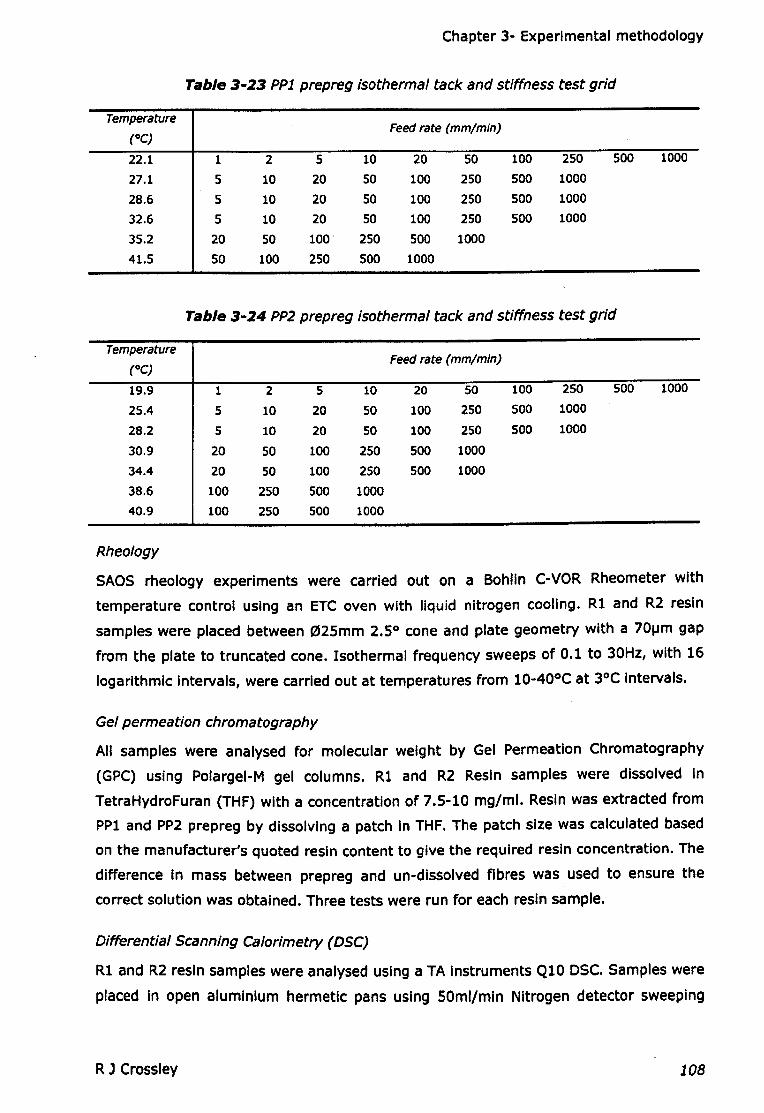
Chapter 3- Experimental methodology
Table 3-23 PPI prepreg isothermal tack and stiffness test grid
TemperatureFeed rate {mm/mm)
(OC)
22.1 1 2 5 10 20 50 100 250 500 1000
27.1 5 10 20 50 100 250 500 1000
28.6 5 10 20 50 100 250 500 1000
32.6 5 10 20 50 100 250 500 1000
35.2 20 50 100 250 500 1000
41.5 50 100 250 500 1000
Table 3-24 PP2prepreg isothermal tack and stiffness test grid
TemperatureFeed rate (mm/mm)
(0C)
19.9 1 2 5 10 20 SO 100 250 500 1000
25.4 5 10 20 50 100 250 500 1000
28.2 5 10 20 SO 100 250 500 1000
30.9 20 SO 100 250 500 1000
34.4 20 SO 100 250 500 1000
38.6 100 250 500 1000
40.9 100 250 500 1000
Rheology
SAOS rheology experiments were carried out on a Bohlin C-VOR Rheometer with
temperature control using an ETC oven with liquid nitrogen cooling. Rl and R2 resin
samples were placed between 02Smm 2.5° cone and plate geometry with a 7 0l.lm gap
from the plate to truncated cone. Isothermal frequency sweeps of 0.1 to 30Hz, with 16
logarithmic Intervals, were carried out at temperatures from 10-400C at 3°C Intervals.
Gel permeation chromatography
All samples were analysed for molecular weight by Gel Permeation Chromatography
(GPC) using Polargel-M gel columns. Rl and R2 Resin samples were dissolved In
TetraHydroFuran (THF) with a concentration of 7.5-10 mg/ml. Resin was extracted from
PPl and PP2 prepreg by dissolving a patch In THF. The patch size was calculated based
on the manufacturer's quoted resin content to give the required resin concentration. The
difference In mass between prepreg and un-dissolved fibres was used to ensure the
correct solution was obtained. Three tests were run for each resin sample.
Differential Scanning CalOrimetry (DSC)
Rl and R2 resin samples were analysed using a TA Instruments Q10 DSC. Samples were
placed In open aluminium hermetic pans using SOml/mln Nitrogen detector sweeping
R J Crossley 108
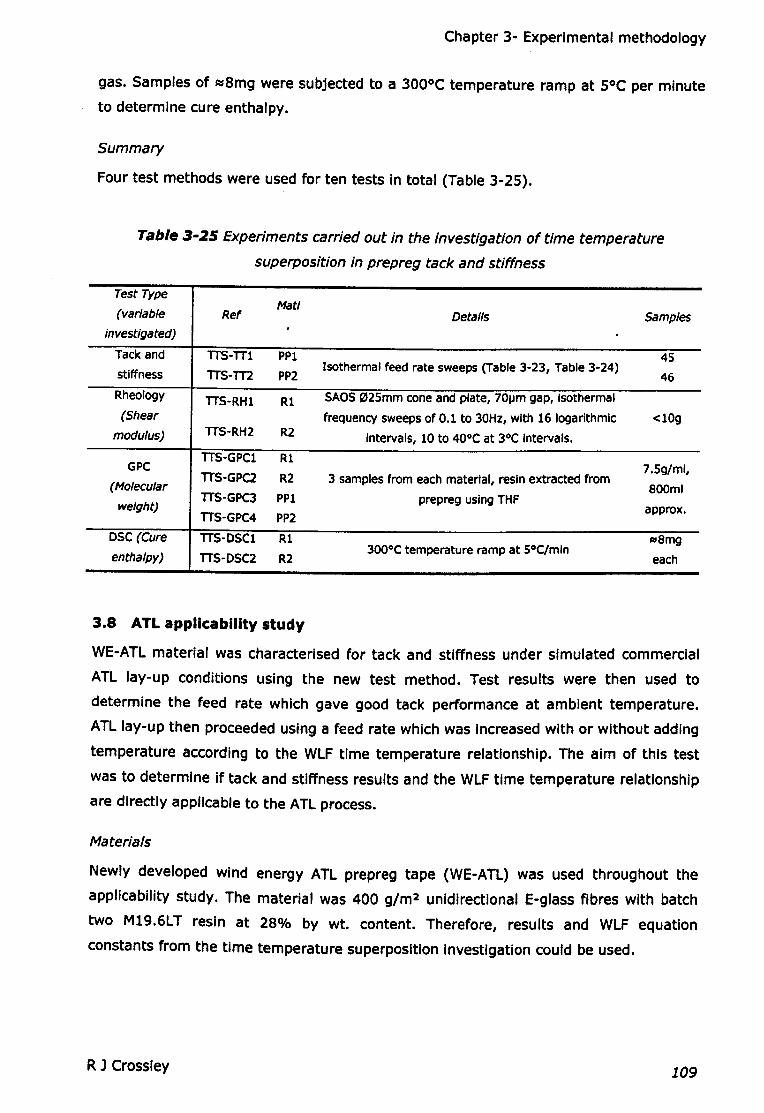
Chapter 3- Experimental methodology
gas. Samples of ~8mg were subjected to a 300°C temperature ramp at 5°C per minute
to determine cure enthalpy.
Summary
Four test methods were used for ten tests in total (Table 3-25).
Table 3-25 Experiments carried out in the investigation of time temperature
superposition in prepreg tack and stiffness
Test TypeMatI
(variable Ref Details Samplesinvestigated)
Tack and TIS-TIl PPl 45stiffness TIS-TI2 PP2
Isothermal feed rate sweeps (Table 3-23, Table 3-24)46
Rheology TTS-RHl Rl SAOS02Smm cone and plate, 70l.lm gap, isothermal
(Shear frequency sweeps of 0.1 to 30Hz, with 16 logarithmic <lOgmodulus) TIS-RH2 R2 intervals, 10 to 40°C at 3°C Intervals.
TTS-GPCl Rl7.Sg/ml,GPC
(MolecularTIS-GPC2 R2 3 samples from each material, resin extracted from
800mlTTS-GPC3 PPl prepreg using THFweight) approx.TTS-GPC4 PP2
DSC (Cure TIS-DSCl Rl Rl8mg
enthalpy) TTS-DSC2 R2300°C temperature ramp at SOC/min
each
3.8 ATLapplicability study
WE-ATL material was characterised for tack and stiffness under simulated commercial
ATL lay-up conditions using the new test method. Test results were then used to
determine the feed rate which gave good tack performance at ambient temperature.
ATL lay-up then proceeded using a feed rate which was Increased with or without adding
temperature according to the WLF time temperature relationship. The aim of this test
was to determine If tack and stiffness results and the WLF time temperature relationship
are directly applicable to the ATL process.
Materials
Newly developed wind energy ATL prepreg tape (WE-ATL) was used throughout the
applicability study. The material was 400 g/m2 unidirectional E-glass fibres with batch
two M19.6LT resin at 28% by wt. content. Therefore, results and WLF equation
constants from the time temperature superposition Investigation could be used.
R J Crossley 109
Chapter 3- Experimental methodology
Tack tests under ATL production conditions
The following production mould surface conditions were simulated and investigated
using the new tack and stiffness test (Table 3-27):-
• Untreated composite test plates replicated the mould material and surface
roughness. Rigid plates were cut from the actual ATL lay-up surface and used as
a baseline comparison. This surface Is not currently viable In production since a
release agent is needed for the removal of cured components (Ref. ATL-TT1).
• Chemlease 41 release agent was applied using the recommended application
method recreating production conditions without tackifier (Ref. ATL-TT2).
• Chemlease was applied as above. Plates were then brushed with
dichloromethane and allowed to dry. This test is used to assess the possible
degradation effects on release agent caused by dichloromethane (Ref. ATL-TT3).
• Chemlease was applied as above. Plates were then brushed with tackifier and
allowed to dry. Tackifier consisted of 0.16 g/ml of M19.6LT resin dissolved in
dichloromethane (Ref. ATL-TT4).
The exact compaction pressure of the ATL head was unknown. Therefore, a roller force
of lOON was used to allow for comparison between existing results. A feed rate of 500
mm/mln was used as an estimate of ATL speed and to give a comparison between
existing results. A temperature sweep of ~20-4SoC was carried out with a single sample
at each temperature, 10-12 samples in total per temperature sweep. Temperatures
were recorded at the peel surface using an IR thermometer immediately following the
test.
ATL trials
The lay-up of WE-ATL tape at ambient temperature proved problematic and required
mould surface tackifier. Tack testing at SOOmm/min revealed that a peak tack is
obtainable without tackifier at a higher temperature (~34°C) exceeding the tack
available with tacklfier at ambient (200C) temperature (Chapter 4.6.1). To validate the
tack and stiffness results ATL lay-up was attempted at this higher peak tack level
without tackifler. To validate the use of time-temperature superposition the WLF
equation with constants taken from rheology (Chapter 3.7) were used to determine this
peak tack feed rate at ambient temperature. Lay-up began at this feed rate increasing
until lay-up failure occurred by lack of mould tack. The experiment was then repeated
with temperature Increased according to the WLF relationship, where tack was expected
to remain constant (Table 3-27).
R J Crossley 110
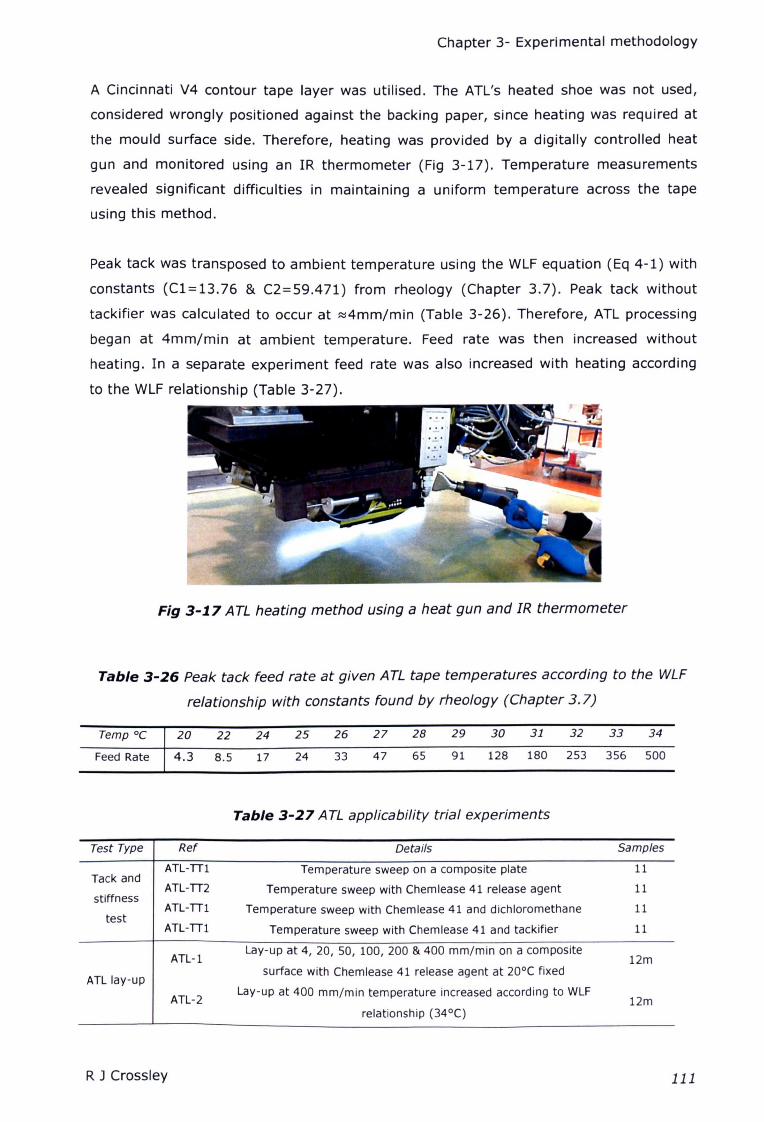
Chapter 3- Experimental methodology
A Cincinnati V4 contour tape layer was utilised. The ATL's heated shoe was not used,
considered wrongly positioned against the backing paper, since heating was required at
the mould surface side. Therefore, heating was provided by a digitally controlled heat
gun and monitored using an IR thermometer (Fig 3-17). Temperature measurements
revealed significant difficulties in maintaining a uniform temperature across the tape
using this method.
Peak tack was transposed to ambient temperature using the WLF equation (Eq 4-1) with
constants (C1=13.76 & C2=59.471) from rheology (Chapter 3.7). Peak tack without
tackifier was calculated to occur at ::::4mm/min (Table 3-26). Therefore, ATL processing
began at 4mm/min at ambient temperature. Feed rate was then increased without
heating. In a separate experiment feed rate was also increased with heating according
to the WLF relationship (Table 3-27).
Fig 3-17 ATL heating method using a heat gun and IR thermometer
Table 3-26 Peak tack feed rate at given ATL tape temperatures according to the WLF
relationship with constants found by rheology (Chapter 3.7)
Temp °C 20 22 24 25 26 27 28 29 30 31 32 33 34
Feed Rate 4.3 8.5 17 24 33 47 65 91 128 180 253 356 500
Table 3-27 ATL applicability trial experiments
Test Type Ref
ATL-TIlTack and
ATL-TI2stiffness
ATL-TIltest
ATL-TI1
ATL-1
ATL lay-up
ATL-2
Details Samples
Temperature sweep on a composite plate
Temperature sweep with Chemlease 41 release agent
Temperature sweep with Chemlease 41 and dichloromethane
Temperature sweep with Chemlease 41 and tackifier
11
11
11
11
Lay-up at 4, 20, 50, 100, 200 & 400 mrn/rnln on a composite
surface with Chemlease 41 release agent at 20°C fixed
Lay-up at 400 rnrn/rnin temperature increased according to WLF
relationship (34°C)
12m
12m
R J Crossley 111
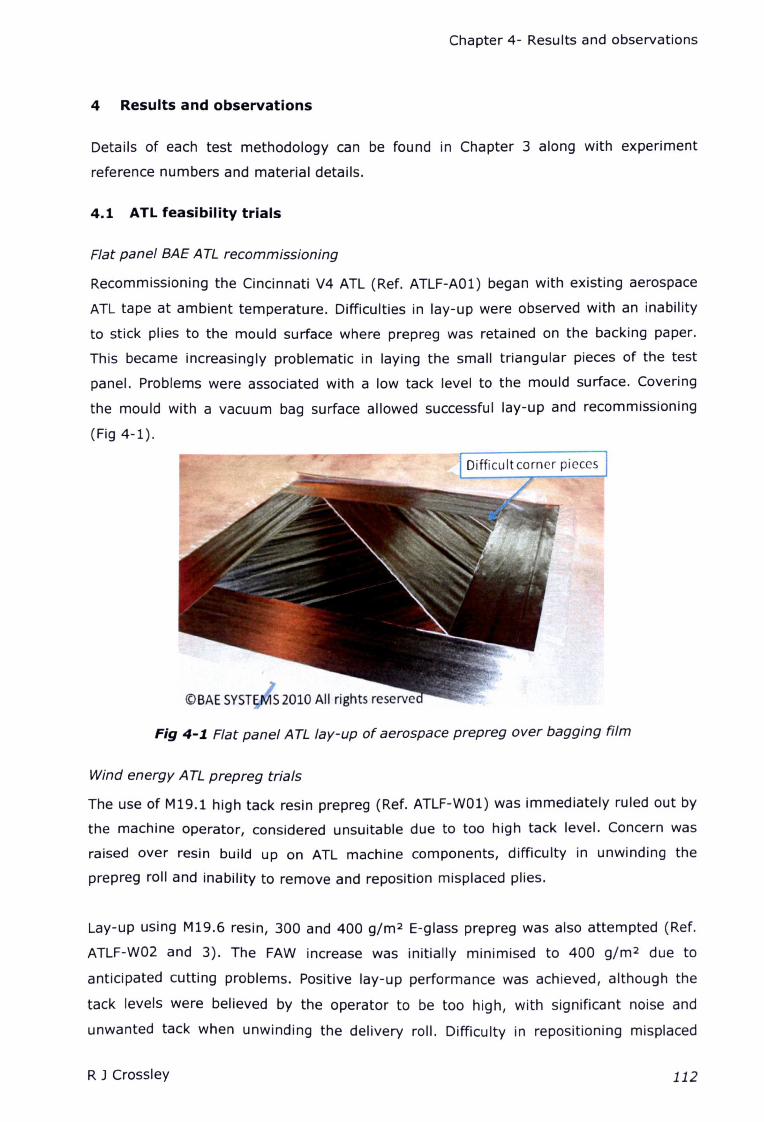
Chapter 4- Results and observations
4 Results and observations
Details of each test methodology can be found in Chapter 3 along with experiment
reference numbers and material details.
4.1 ATL feasibility trials
Flat panel BAE ATL recommissioning
Recommissioning the Cincinnati V4 ATL (Ref. ATLF-A01) began with existing aerospace
ATL tape at ambient temperature. Difficulties in lay-up were observed with an inability
to stick plies to the mould surface where prepreg was retained on the backing paper.
This became increasingly problematic in laying the small triangular pieces of the test
panel. Problems were associated with a low tack level to the mould surface. Covering
the mould with a vacuum bag surface allowed successful lay-up and recommissioning
(Fig 4-1).
Fig 4-1. Flat panel ATL lay-up of aerospace prepreg over bagging film
Wind energy A TL prepreg trials
The use of M19.1 high tack resin prepreg (Ref. ATLF-W01) was immediately ruled out by
the machine operator, considered unsuitable due to too high tack level. Concern was
raised over resin build up on ATL machine components, difficulty in unwinding the
prepreg roll and inability to remove and reposition misplaced plies.
Lay-up using M19.6 resin, 300 and 400 g/m2 E-glass prepreg was also attempted (Ref.
ATLF-W02 and 3). The FAW increase was initially minimised to 400 g/m2 due to
anticipated cutting problems. Positive lay-up performance was achieved, although the
tack levels were believed by the operator to be too high, with significant noise and
unwanted tack when unwinding the delivery roll. Difficulty in repositioning misplaced
R J Crossley 112
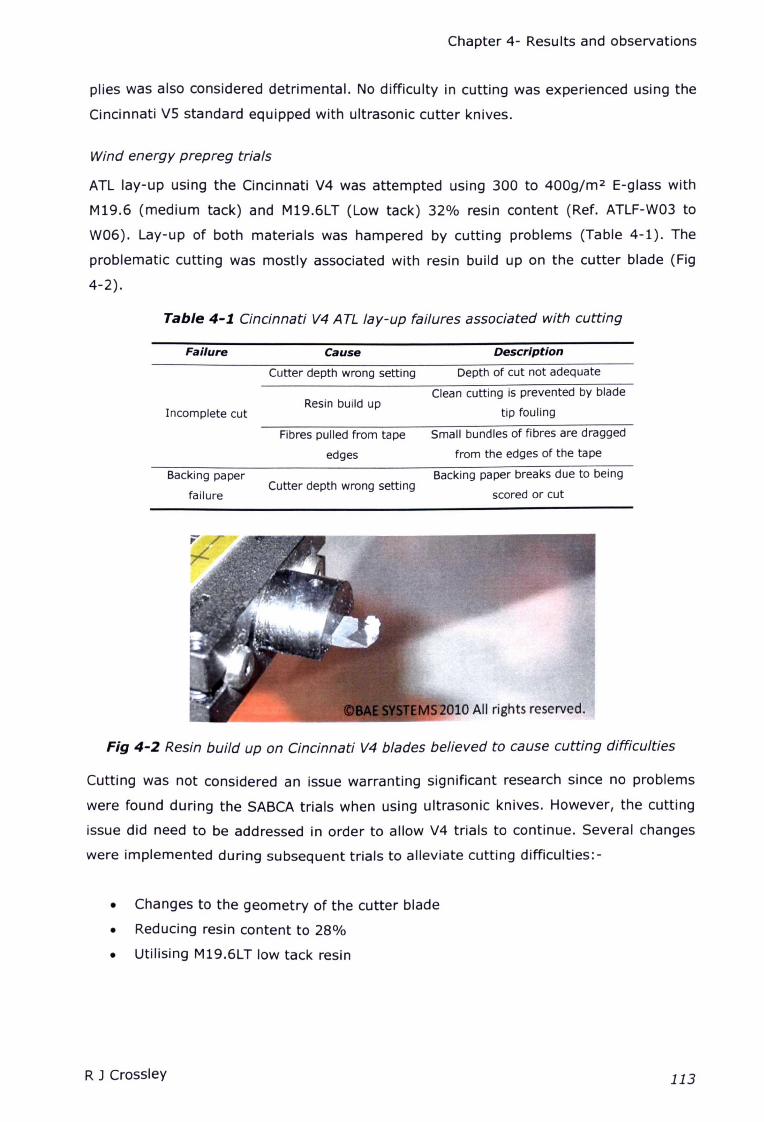
Chapter 4- Results and observations
plies was also considered detrimental. No difficulty in cutting was experienced using the
Cincinnati VS standard equipped with ultrasonic cutter knives.
Wind energy prepreg trials
ATL lay-up using the Cincinnati V4 was attempted using 300 to 400g/m2 E-glass with
M19.6 (medium tack) and M19.6LT (Low tack) 32% resin content (Ref. ATLF-W03 to
W06). Lay-up of both materials was hampered by cutting problems (Table 4-1). The
problematic cutting was mostly associated with resin build up on the cutter blade (Fig
4-2).
Table 4-1 Cincinnati V4 A TL lay-up failures associated with cutting
Failure Cause Description
Cutter depth wrong setting Depth of cut not adequate
Incomplete cutResin build up
Clean cutting is prevented by blade
tip fouling
Fibres pulled from tape
edges
Small bundles of fibres are dragged
from the edges of the tape
Backing paper
failureCutter depth wrong setting
Backing paper breaks due to being
scored or cut
Fig 4-2 Resin build up on Cincinnati V4 blades believed to cause cutting difficulties
Cutting was not considered an issue warranting significant research since no problems
were found during the SABCA trials when using ultrasonic knives. However, the cutting
issue did need to be addressed in order to allow V4 trials to continue. Several changes
were implemented during subsequent trials to alleviate cutting difficulties:-
• Changes to the geometry of the cutter blade
• Reducing resin content to 28%
• Utilising M19.6LT low tack resin
R J Crossley 113
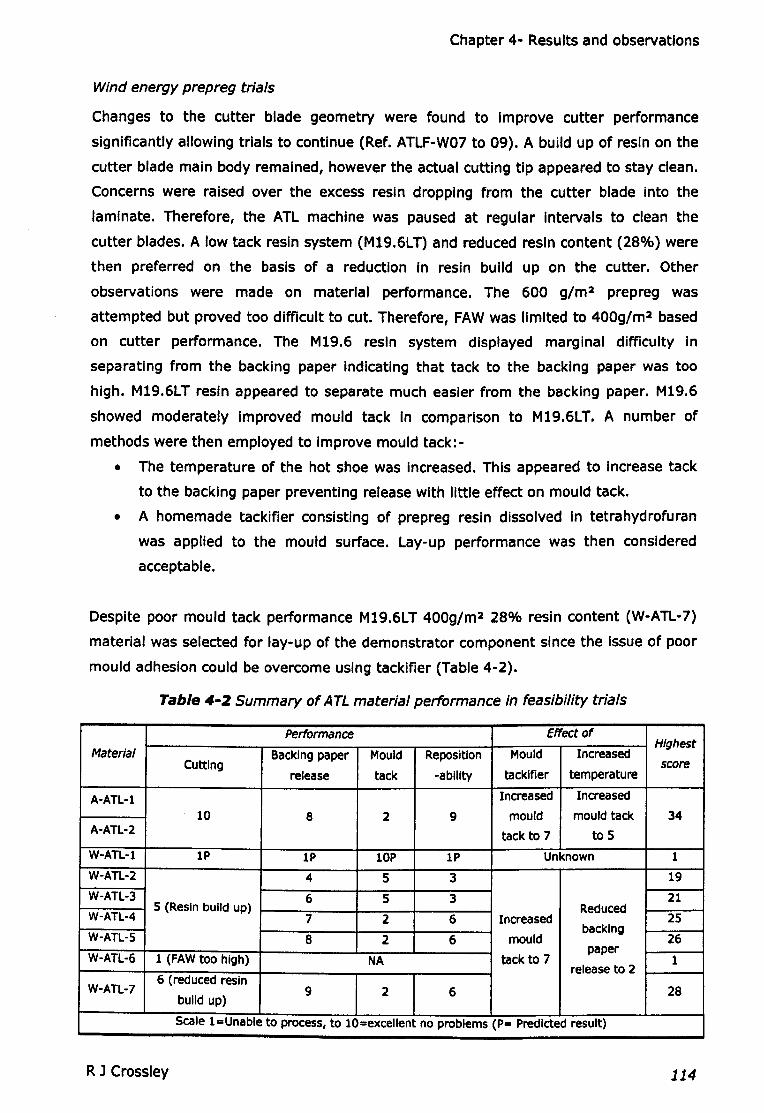
Chapter 4- Results and observations
Wind energy prepreg trials
Changes to the cutter blade geometry were found to improve cutter performance
significantly allowing trials to continue (Ref. ATLF-W07 to 09). A build up of resin on the
cutter blade main body remained, however the actual cutting tip appeared to stay clean.
Concerns were raised over the excess resin dropping from the cutter blade Into the
laminate. Therefore, the ATL machine was paused at regular intervals to clean the
cutter blades. A low tack resin system (M19.6LT) and reduced resin content (28%) were
then preferred on the basis of a reduction in resin build up on the cutter. Other
observations were made on material performance. The 600 g/m2 prepreg was
attempted but proved too difficult to cut. Therefore, FAW was limited to 400g/m2 based
on cutter performance. The M19.6 resin system displayed marginal difficulty In
separating from the backing paper indicating that tack to the backing paper was too
high. M19.6LT resin appeared to separate much easier from the backing paper. M19.6
showed moderately improved mould tack in comparison to M19.6LT. A number of
methods were then employed to improve mould tack:-
• The temperature of the hot shoe was increased. This appeared to increase tack
to the backing paper preventing release with little effect on mould tack.
• A homemade tackifier conSisting of prepreg resin dissolved in tetrahydrofuran
was applied to the mould surface. Lay-up performance was then considered
acceptable.
Despite poor mould tack performance M19.6LT 400g/m2 28% resin content (W-ATL-7)
material was selected for lay-up of the demonstrator component since the Issue of poor
mould adhesion could be overcome using tacklfier (Table 4-2).
Table 4-2 Summary of ATL material performance in feasibility trials
Performance Effect ofHighest
Material Backing paper Mould Reposition Mould IncreasedCutting score
release tack -ability tacklfler temperature
A-ATL-1 Increased Increased
10 8 2 9 mould mould tack 34A-ATL-2 tack to 7 to S
W-ATL-l IP IP lOP IP Unknown 1
W-ATL-2 4 S 3 19
W-ATL-3 6 S 3 21
W-ATL-45 (Resin build up) Reduced
2S7 2 6 Increased
W-ATL-S 8 mouldbacking
262 6paper
W-ATL-6 1 (FAW too high) NA tack to 7 1release to 2
W-ATL-76 (reduced resin
28build up)
9 2 6
Scale I-Unable to process, to 10-excelient no problems (p. Predicted result)
R J Crossley 114
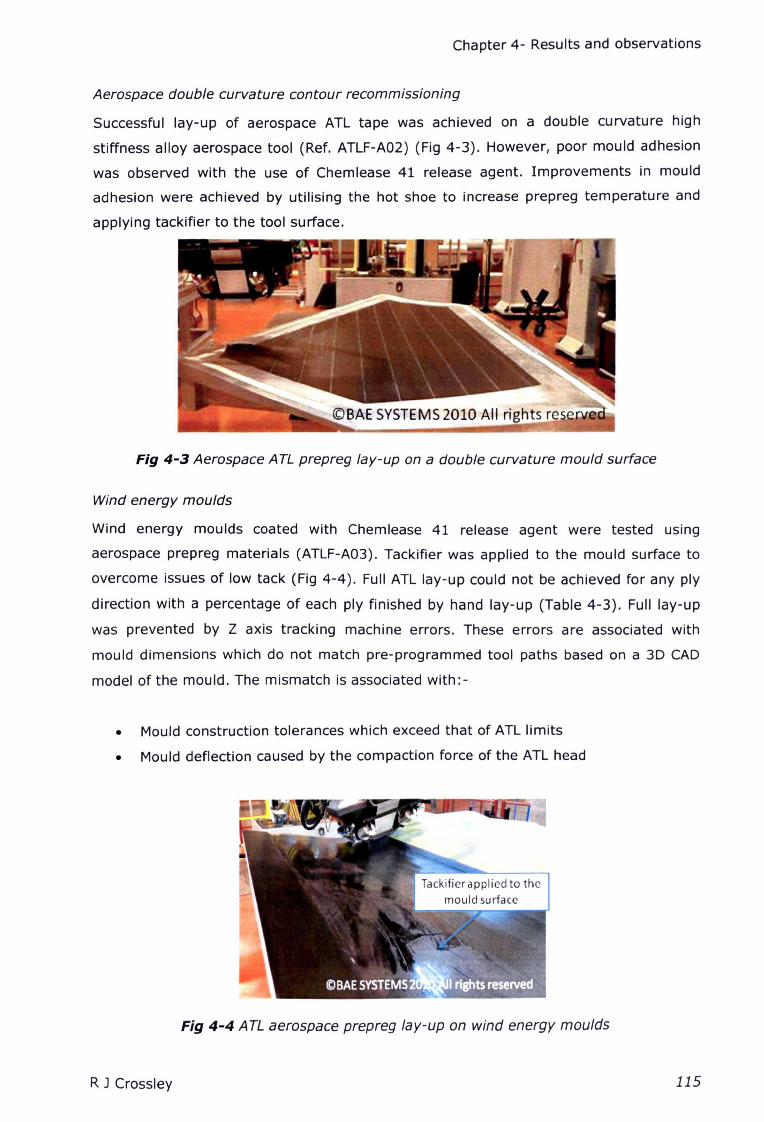
Chapter 4- Results and observations
Aerospace double curvature contour recommissioning
Successful lay-up of aerospace ATL tape was achieved on a double curvature high
stiffness alloy aerospace tool (Ref. ATLF-A02) (Fig 4-3). However, poor mould adhesion
was observed with the use of Chemlease 41 release agent. Improvements in mould
adhesion were achieved by utilising the hot shoe to increase prepreg temperature and
applying tackifier to the tool surface.
Fig 4-3 Aerospace A TL prepreg lay-up on a double curvature mould surface
Wind energy moulds
Wind energy moulds coated with Chemlease 41 release agent were tested using
aerospace prepreg materials (ATLF-A03). Tackifier was applied to the mould surface to
overcome issues of low tack (Fig 4-4). Full ATL lay-up could not be achieved for any ply
direction with a percentage of each ply finished by hand lay-up (Table 4-3). Full lay-up
was prevented by Z axis tracking machine errors. These errors are associated with
mould dimensions which do not match pre-programmed tool paths based on a 3D CAD
model of the mould. The mismatch is associated with:-
• Mould construction tolerances which exceed that of ATL limits
• Mould deflection caused by the compaction force of the ATL head
Fig 4-4 ATL aerospace prepreg lay-up on wind energy moulds
R J Crossley 115
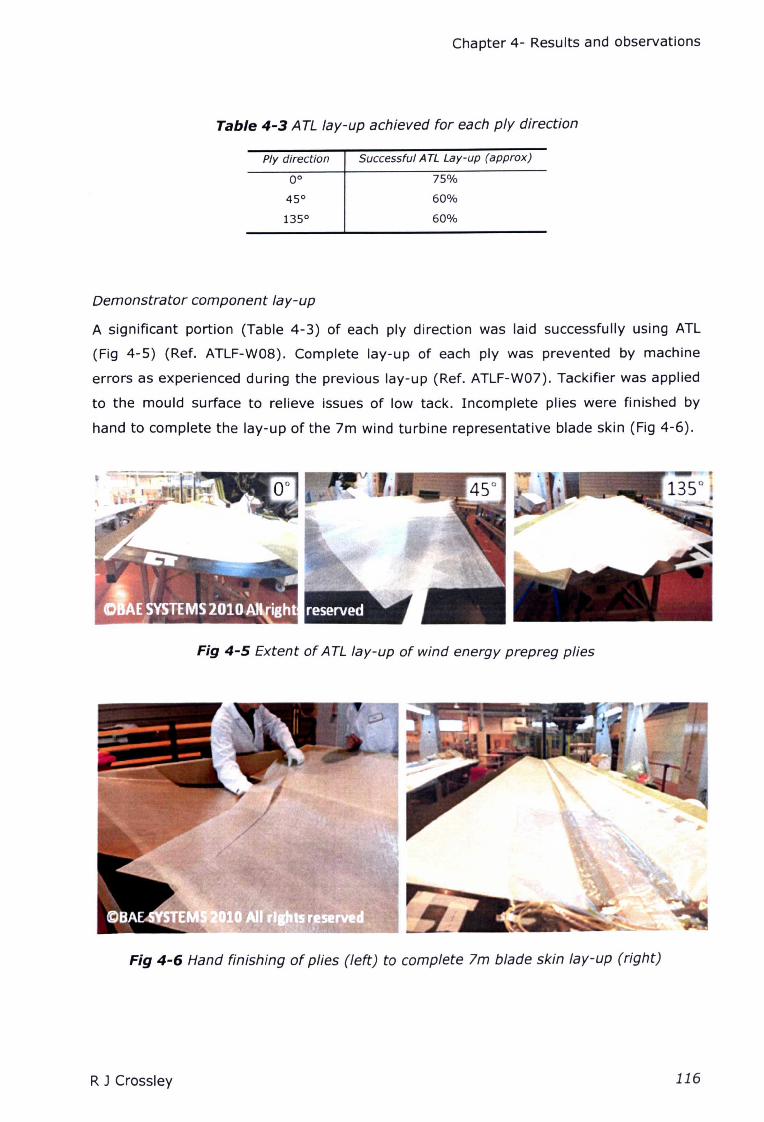
Chapter 4- Results and observations
Table 4-3ATL lay-up achieved for each ply direction
75%
60%
60%
Ply direction Successful ATL Lay-up (approx)
Demonstrator component lay-up
A significant portion (Table 4-3) of each ply direction was laid successfully using ATL
(Fig 4-5) (Ref. ATLF-W08). Complete lay-up of each ply was prevented by machine
errors as experienced during the previous lay-up (Ref. ATLF-W07). Tackifier was applied
to the mould surface to relieve issues of low tack. Incomplete plies were finished by
hand to complete the lay-up of the 7m wind turbine representative blade skin (Fig 4-6).
Fig 4-5 Extent of ATL lay-up of wind energy prepreg plies
Fig 4-6 Hand finishing of plies (left) to complete 7m blade skin lay-up (right)
R J Crossley 116
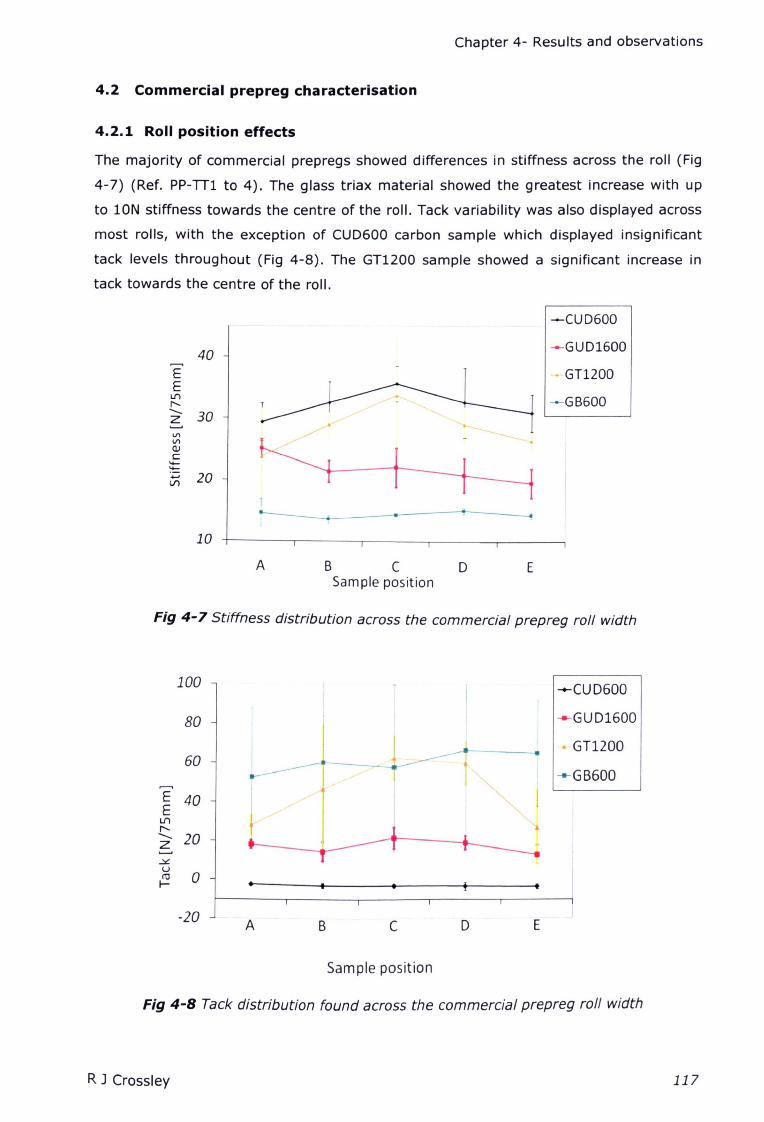
Chapter 4- Results and observations
4.2 Commercial prepreg characterisation
4.2.1 Roll position effects
The majority of commercial prepregs showed differences in stiffness across the roll (Fig
4-7) (Ref. PP-TIl to 4). The glass triax material showed the greatest increase with up
to lON stiffness towards the centre of the roll. Tack variability was also displayed across
most rolls, with the exception of CUD600 carbon sample which displayed insignificant
tack levels throughout (Fig 4-8). The GTl200 sample showed a significant increase in
tack towards the centre of the roll.
--CUD600
40--GUD1600
E ~ GT1200E
L.()
~GB600r-,<,
30z'"
-__'"(1)c:.....~
20......L.()
10
A BCDSample position
E
Fig 4-7 Stiffness distribution across the commercial prepreg ro/l width
100
80
60
E 40E /
LI'lr--.-.. 20z~uro 0I-
-20A B C D E
Sample position
--CUD600
--GUD1600
.. GT1200
-+-GB600
Fig 4-8 Tack distribution found across the commercial prepreg roll width
R J Crossley 117
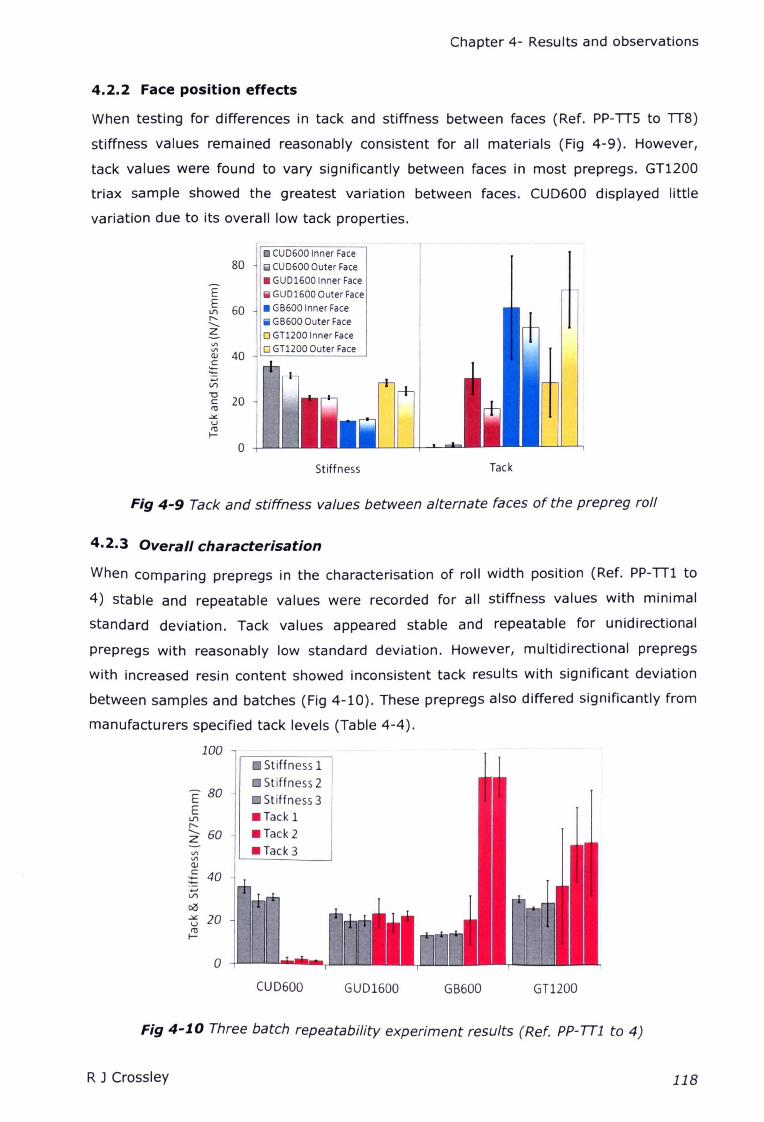
Chapter 4- Results and observations
4.2.2 Face position effects
When testing for differences in tack and stiffness between faces (Ref. PP-TTS to TT8)
stiffness values remained reasonably consistent for all materials (Fig 4-9). However,
tack values were found to vary significantly between faces in most prepregs. GT1200
triax sample showed the greatest variation between faces. CUD600 displayed little
variation due to its overall low tack properties.
CUD600 Inner Face80 .. CUD600 Outer Face
• GUD1600 Inner FaceE Iii GUD1600 Outer FaceE
60 • GB600 Inner FaceIf'Ir-,
Iii GB600 Outer Face-......Z
'"'" 40(J)c.....~Vi"C
20ctil
.:.:.u
~0
Stiffness Tack
Fig 4-9 Tack and stiffness values between alternate faces of the prepreg roll
4.2.3 Overall characterisation
When comparing prepregs in the characterisation of roll width position (Ref. PP-TT! to
4) stable and repeatable values were recorded for all stiffness values with minimal
standard deviation. Tack values appeared stable and repeatable for unidirectional
prepregs with reasonably low standard deviation. However, multidirectional prepregs
with increased resin content showed inconsistent tack results with significant deviation
between samples and batches (Fig 4-10). These prepregs also differed significantly from
manufacturers specified tack levels (Table 4-4).
100Stiffness 1
Stiffness 2E 80 Stiffness 3E .Tack 1IJ'l
"z- 60 .Tack 2
VI • Tack 3II'!<I.JC 40._._....Vl
o(l.:.:. 20uIIIf-
0
CUD600 GUD1600 GB600 GT1200
Fig 4-J 0 Three batch repeatability experiment results (Ref. PP-TTl to 4)
RJ Crossley 118

Chapter 4- Results and observations
Table 4-4 Tack and stiffness characterisation results (Ref. PP-TTl to 4) for existing
wind energy prepreg in comparison to specified tack levels
Stiffness Tack Specified tackRef. a [ct,b] a[%]
[N/75mm] [N/75mm] level
GB600 14.4 7.4 60 56.2 Medium
GT1200 28.4 20.9 44.4 48.8 Medium
GUD1600 21.8 12.9 17.22 28.44 High
CUD600 32.2 11.9 0 37.9 Low
When comparing the two characterisation studies (Ref. PP-TTl to 4 and PP-TTs to 8),
the values for prepreg stiffness appeared logical and were consistent between roll
position and face studies (Table 4-5). The highest stiffness was measured for CUD600
due to the increased stiffness of carbon fibres In comparison to E-glass. It may be
logical for the stiffness of glass fibre prepreg to be directly proportional to material
weight. However, GT1200 showed increased stiffness in comparison to GUD1600.
Therefore, fibre architecture and Increased resin fraction also have an effect. The values
for tack are repeatable experimentally but are not always consistent with
manufacturer's specified values (Table 4-5). Manufacturers specify tack values based on
results of constituent resin tests without the presence of fibres. Multidirectional fabrics
display the highest deviation. Therefore, it is likely that fibre direction and resin content
also contribute to tack, possibly changing the surface resin layer characteristics,
consistent with the findings of prepreg probe test results [83].
Table 4-5 Commercial stiffness and tack results compared to manufacturers values
Stiffness TaeleRe.ln Fibre Hanufacturel'$
Hatl. Fibre [N/7SmmJ [N/7SmmJSpecified tack
Ref. typeContent weight
position Face position Facelevel[%J [Si/mIlJ
study study study study
GB600 Glass 45 600 14.4 12 60 52.2 Medium
GT1200 Glass 38 1200 28.4 26.7 44.4 43.9 Medium
GUD1600 Glass 32 1600 21.8 21.9 17.22 18.6 High
CUD600 Carbon 32 600 32.2 33.7 0 0 Low
R J Crossley 119
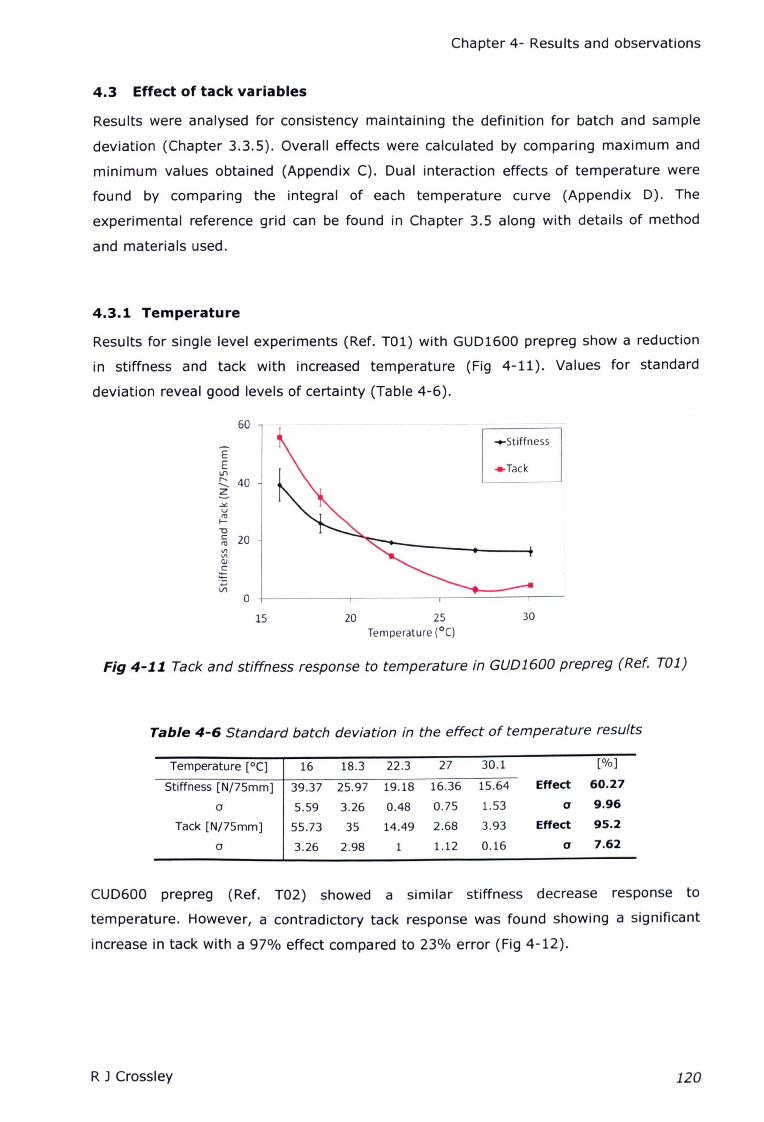
Chapter 4- Results and observations
4.3 Effect of tack variables
Results were analysed for consistency maintaining the definition for batch and sample
deviation (Chapter 3.3.5). Overall effects were calculated by comparing maximum and
minimum values obtained (Appendix C). Dual interaction effects of temperature were
found by comparing the integral of each temperature curve (Appendix D). The
experimental reference grid can be found in Chapter 3.5 along with details of method
and materials used.
4.3.1 Temperature
Results for single level experiments (Ref. T01) with GUD1600 prepreg show a reduction
in stiffness and tack with increased temperature (Fig 4-11). Values for standard
deviation reveal good levels of certainty (Table 4-6).
60
-e-StiffnessEE _Tack
II)
I' 40<,
Z
.:.tUttlI-"0c 20ttl
'"'"QJ
~Vl
0
15 20 25 30
Temperature (OC)
Fig 4-1.1. Tack and stiffness response to temperature in GUD1600 prepreg (Ref. Tal)
Table 4-6 Standard batch deviation in the effect of temperature results
Temperature [0C] 16 18.3 22.3 27 30.1 [%]
Stiffness [N/75mm] 39.37 25.97 19.18 16.36 15.64 Effect 60.27
a 5.59 3.26 0.48 0.75 1.53 a 9.96
Tack [N/75mm] 55.73 35 14.49 2.68 3.93 Effect 95.2
a 3.26 2.98 1 1.12 0.16 a 7.62
CUD600 prepreg (Ref. T02) showed a similar stiffness decrease response to
temperature. However, a contradictory tack response was found showing a significant
increase in tack with a 97% effect compared to 23% error (Fig 4-12).
R J Crossley 120
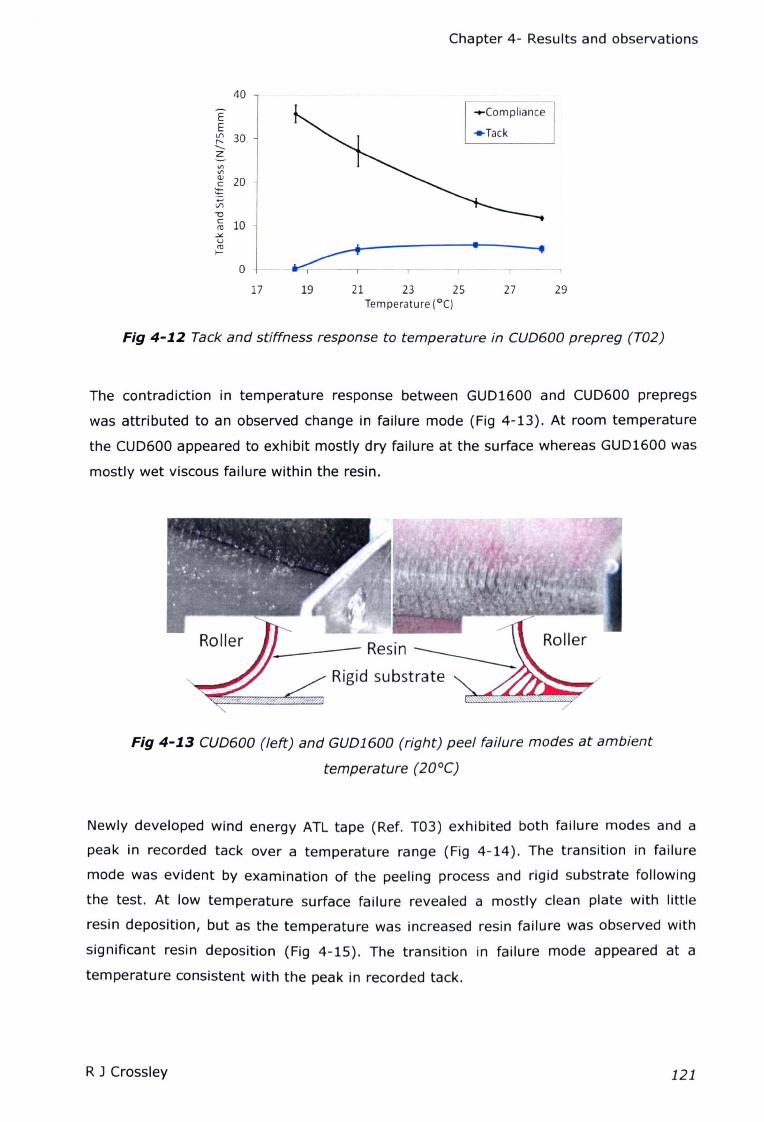
40
EE'" 301'-<,
Z
VlVl
<li 20c~+-'
'""0C 10ro
.0.::urof-
0
17
Chapter 4- Results and observations
-e-Compliance
.. Tack
19 21 23 27 2925Temperature (0C)
Fig 4-1.2 Tack and stiffness response to temperature in CUD600 prepreg (T02)
The contradiction in temperature response between GUD1600 and CUD600 prepregs
was attributed to an observed change in failure mode (Fig 4-13). At room temperature
the CUD600 appeared to exhibit mostly dry failure at the surface whereas GUD1600 was
mostly wet viscous failure within the resin.
Fig 4-1.3 CUD600 (left) and GUD1600 (right) peel failure modes at ambient
temperature (20°C)
Newly developed wind energy ATL tape (Ref. T03) exhibited both failure modes and a
peak in recorded tack over a temperature range (Fig 4-14). The transition in failure
mode was evident by examination of the peeling process and rigid substrate following
the test. At low temperature surface failure revealed a mostly clean plate with little
resin deposition, but as the temperature was increased resin failure was observed with
significant resin deposition (Fig 4-15). The transition in failure mode appeared at a
temperature consistent with the peak in recorded tack.
R J Crossley 121
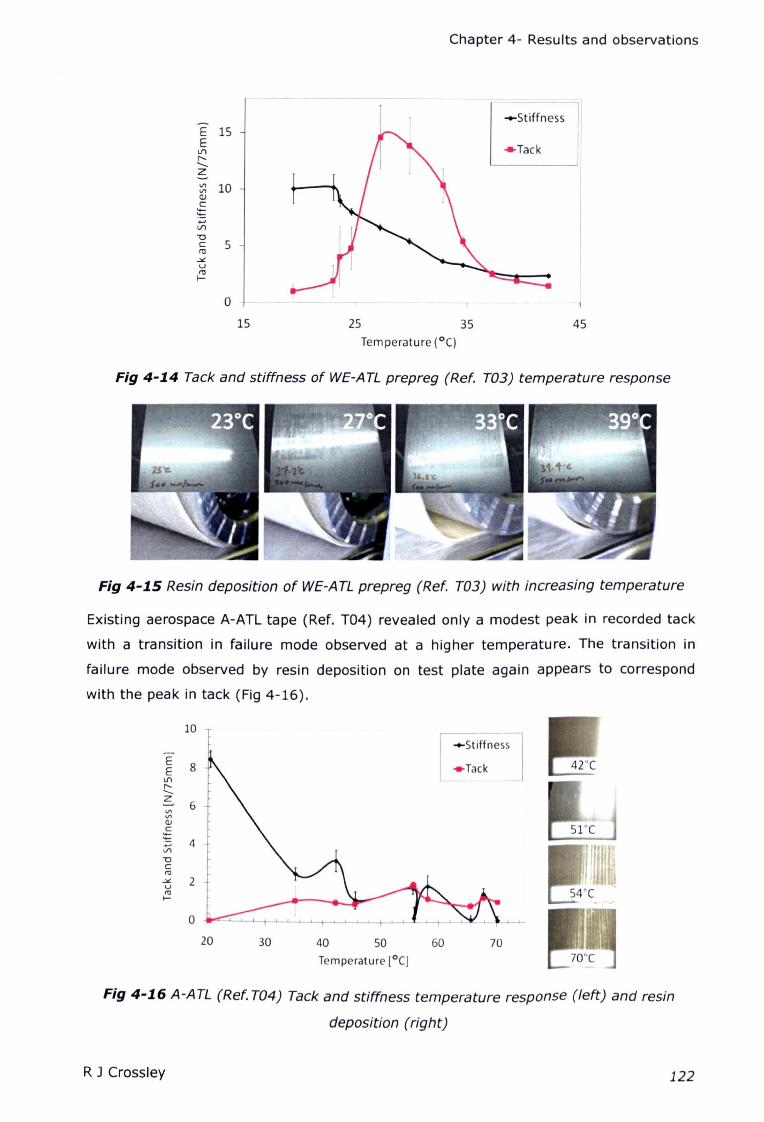
Chapter 4- Results and observations
- -~ -~---
-StiffnessE 15E
LI'lr-,......_ZV'I 10V'IQ)
C._~'"'VI
"c 5ro~u
~
0
15 25 35 45Temperature (0C)
Fig 4-14 Tack and stiffness of WE-ATL prepreg (Ref. T03) temperature response
Fig 4-15 Resin deposition of WE-ATL prepreg (Ref. T03) with increasing temperature
Existing aerospace A-ATL tape (Ref. T04) revealed only a modest peak in recorded tack
with a transition in failure mode observed at a higher temperature. The transition in
failure mode observed by resin deposition on test plate again appears to correspond
with the peak in tack (Fig 4-16).
E 8ELI'lr--......_Z
6'"'"Q)
~ 4V;-0C
'"~ 2u
'"f-0
20 30 40
10
-Stiffness
50
Temperature rOC]
60 70
Fig 4-16A-ATL (Ref. T04) Tack and stiffness temperature response (left) and resin
deposition (right)
R J Crossley 122
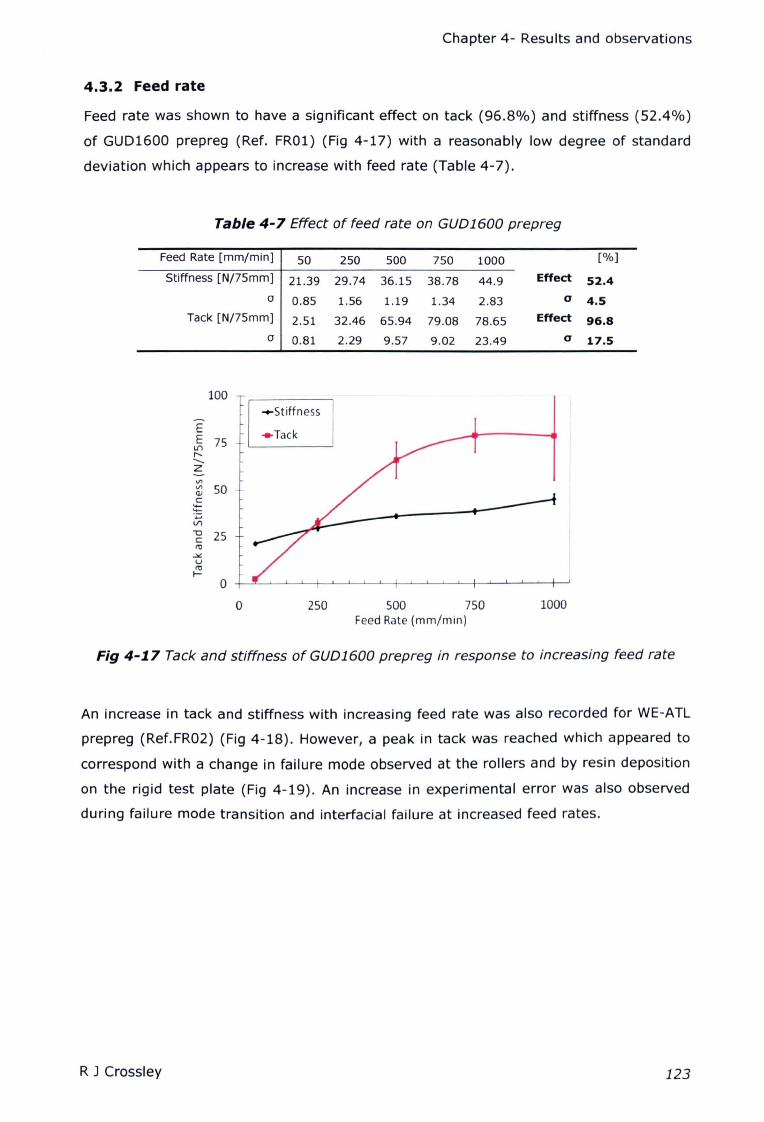
Chapter 4- Results and observations
4.3.2 Feed rate
Feed rate was shown to have a significant effect on tack (96.8%) and stiffness (52.4%)
of GUD1600 prepreg (Ref. FR01) (Fig 4-17) with a reasonably low degree of standard
deviation which appears to increase with feed rate (Table 4-7).
Table 4-7 Effect of feed rate on GUD1600 prepreg
Feed Rate [rnrn/rnin] 50 250 500 750 1000 [%]
Stiffness [N/75mm] 21.39 29.74 36.15 38.78 44.9 Effect 52.4
a 0.85 1.56 1.19 1.34 2.83 a 4.5
Tack [N/75mm] 2.51 32.46 65.94 79.08 78.65 Effect 96.S
a 0.81 2.29 9.57 9.02 23.49 a 17.5
100
-e-StitfnessEE 75
U"\,..._.......zVIVI 50Q)
r::._..._''::;Vl
'0 25r::ro
-""uroI-
0
0 250 500 750 1000Feed Rate (mm/min)
Fig 4-1.7 Tack and stiffness of GUD1600 prepreg in response to increasing feed rate
An increase in tack and stiffness with increasing feed rate was also recorded for WE-ATL
prepreg (Ref.FR02) (Fig 4-18). However, a peak in tack was reached which appeared to
correspond with a change in failure mode observed at the rollers and by resin deposition
on the rigid test plate (Fig 4-19). An increase in experimental error was also observed
during failure mode transition and interfacial failure at increased feed rates.
R J Crossley 123

Chapter 4- Results and observations
20
......StiffnessEE 15l/')r-,-ZIIIIII(J) 10c.......~...,
VI
"0C
5III~uIIIf-
a1 10 100
Feed rate (mm/min)
Fig 4-1.8 WE-ATL prepreg tack and stiffness response to feed rate (Ref. FR02)
Fig 4-1.9 WE-ATL prepreg failure mode and deposition feed rate response (Ref. FR02)
4.3.3 Surface roughness
The results of the initial surface roughness investigation (Ref. SR01) showed no
significant effect. However, the Ra=1.92I.lm plate appeared to show a 20% rise in tack
with a 10% experimental error (Table 4-8).
Table 4-8 GUD1600 prepreg surface roughness response (ioomm/min) (Ref. FR01)
Av. Surface Roughness (Ra) [lJm) 0.12 0.18 1.92 [%]
Stiffness [N/75mm] 20.9 18.56 22.24 Effect 16.5
a 0.28 2.08 1.54 a 6.4Tack [N/75mm] 10.72 10.03 12.79 Effect 21.6
a 0.39 1.89 1.39 a 10.9
R J Crossley 124
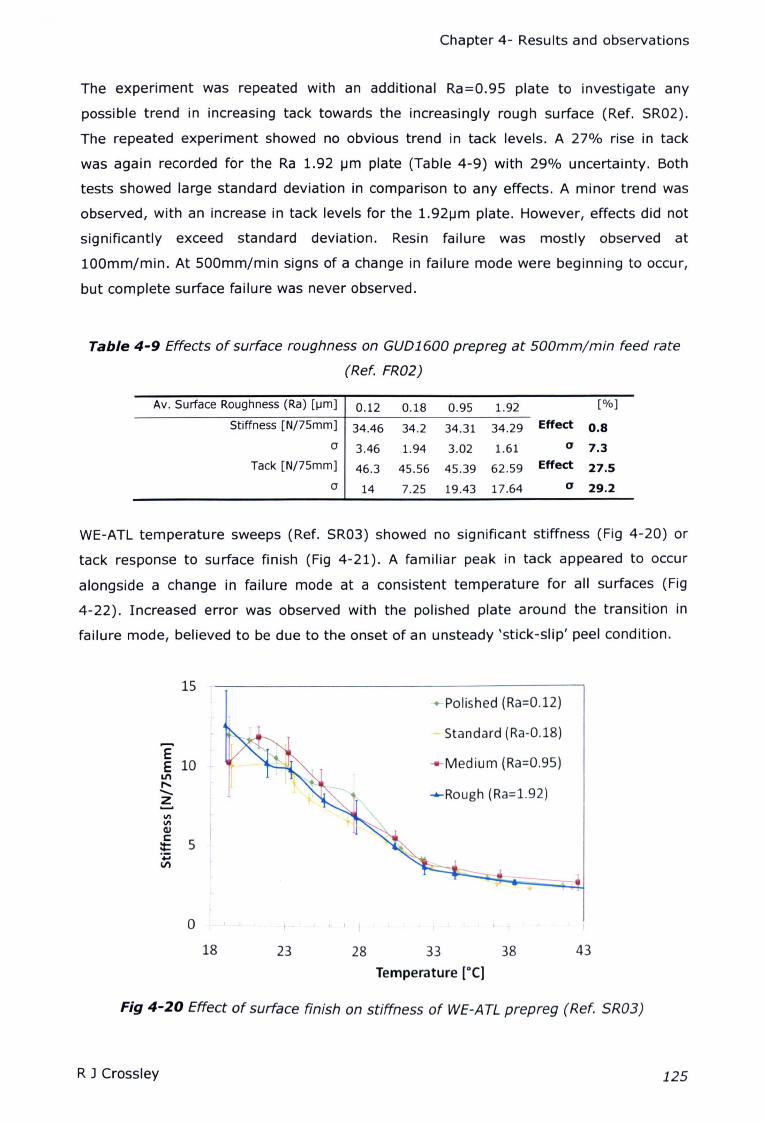
Chapter 4- Results and observations
The experiment was repeated with an additional Ra=0.95 plate to investigate any
possible trend in increasing tack towards the increasingly rough surface (Ref. SR02).
The repeated experiment showed no obvious trend in tack levels. A 27% rise in tack
was again recorded for the Ra 1.92 IJm plate (Table 4-9) with 29% uncertainty. Both
tests showed large standard deviation in comparison to any effects. A minor trend was
observed, with an increase in tack levels for the 1.92IJm plate. However, effects did not
significantly exceed standard deviation. Resin failure was mostly observed at
100mm/min. At 500mm/min signs of a change in failure mode were beginning to occur,
but complete surface failure was never observed.
Table 4-9 Effects of surface roughness on GUD1600 prepreg at 500mm/min feed rate
(Ref. FR02)
Av. Surface Roughness (Ra) [urn] 0.12 0.18 0.95 1.92 [%]
Stiffness [N/75mm] 34.46 34.2 34.31 34.29 Effect O.S
a 3.46 1.94 3.02 1.61 a 7.3
Tack [N/75mm] 46.3 45.56 45.39 62.59 Effect 27.5
a 14 7.25 19.43 17.64 a 29.2
WE-ATL temperature sweeps (Ref. SR03) showed no significant stiffness (Fig 4-20) or
tack response to surface finish (Fig 4-21). A familiar peak in tack appeared to occur
alongside a change in failure mode at a consistent temperature for all surfaces (Fig
4-22). Increased error was observed with the polished plate around the transition in
failure mode, believed to be due to the onset of an unsteady 'stick-slip' peel condition.
15 I~--------------------------------------'
.......EE 10
LI\,.....-z......IIIIIIQ)
:E 5.z;V'l
+-Polished (Ra=0.12)
- Standard (Ra-0.18)
---Medium (Ra=0.95)
........Rough (Ra=1.92)
o I I I I J, I J I
18 23 28 33
Temperature [0C]
38 43
Fig 4-20 Effect of surface finish on stiffness of WE-ATL prepreg (Ref. SR03)
RJ Crossley 125
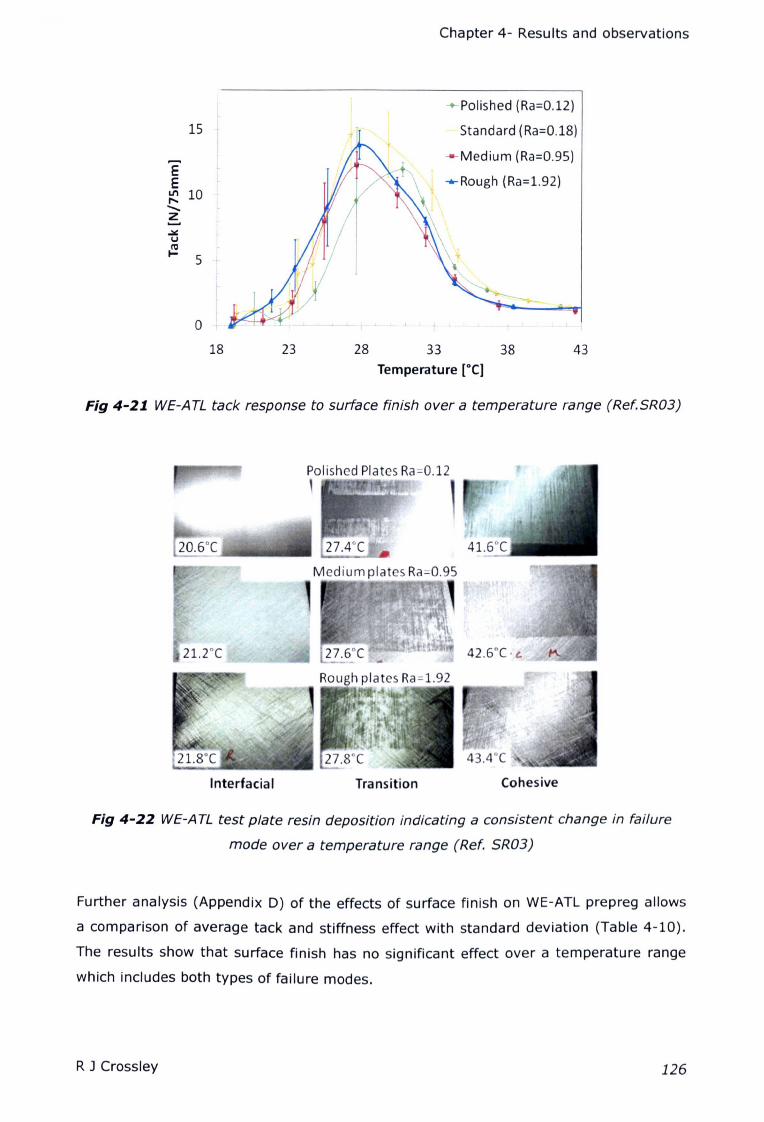
Chapter 4- Results and observations
-EE~ 10.......z......
fI
-+-Polished (Ra=0.12)
Standard (Ra=0.18)
--Medium (Ra=0.95)
"}, ~Rough (Ra=L92J
\
\
15
Io .-18 23 28 33
Temperature [0C]38 43
Fig 4-21 WE-ATL tack response to surface finish over a temperature range (Ref.SR03)
Polished Plates Ra=O.12,
Medium plates Ra=O.95
'''1HHIt'~t~
Interfacial Transition Cohesive
Fig 4-22 WE-ATL test plate resin deposition indicating a consistent change in failure
mode over a temperature range (Ref. SR03)
Further analysis (Appendix D) of the effects of surface finish on WE-ATL prepreg allows
a comparison of average tack and stiffness effect with standard deviation (Table 4-10).
The results show that surface finish has no significant effect over a temperature range
which includes both types of failure modes.
R J Crossley 126

Chapter 4- Results and observations
Table 4-1.0 WE-ATL prepreg tack and stiffness response over a temperature range
including average standard deviation (Ref. SR03)
Av. Surface Roughness (Ra) [urn]0.12 0.18 0.95 1.92 [%]
Tack [N/75mm] 4.77 6.32 4.71 5.22 Effect 25.5
a 1.19 1.30 0.88 0.79 a 19.8
Stiffness [N/75mm] 6.28 5.48 6.16 5.71 Effect 12.7
a 0.59 0.39 0.70 0.55 a 9.5
4.3.4 Release agents
The stiffness of GUD1600 prepreg at 20°C (Ref. RA01) appears unaffected by release
agents, with minor effect attributed to experimental error (Table 4-11). A significant
reduction in tack, with 99.5% effect, can be seen with all release agents indicating a
significant effect in comparison to 31.4% standard deviation (Fig 4-23). Additionally,
solvent based composite, Multishield and PMR-90 release agents showed a higher
residual tack than water based types. A change in failure mode was also observed.
Heavy resin deposition seen on untreated test plates is not present on those treated
with release agent.
Table 4-1.1. GUD1600 prepreg response to re/ease agents (Ref. RA01)
ReleaseWater Hulti Enviro
Composite PHR-None {%]
agent Shield Shield Shield Shield 90
Stiffness 31.47 30.31 29.17 31.05 30.8 30.55 Effect 7.3
[N/mm] C1 2.53 1.84 0.61 1.77 0.82 4.94 a 6.8
Tack 58.29 1.38 8.62 0.27 8.78 3.95 Effect 99.5
[N/mm] C1 8.64 1.96 5.35 0.49 6.35 2.71 a 31.4
-EE 60
LI'I,.....-ZIII 40OJc:::~"C 20c:It!
,:,tU
~
Tack
• Stiffness
zo::lro
~ ~ m::::ltu C ~......
rlro ....,....,
II> 0V\ zs: II>tr zriii' ro iii'Cl..
a::o,
no
~3ro -0
oCl..II>
;:::+:ro
Fig 4-23 GUD1600 prepreg tack and stiffness response to release agents (Ref. RA01)
R J Crossley 127
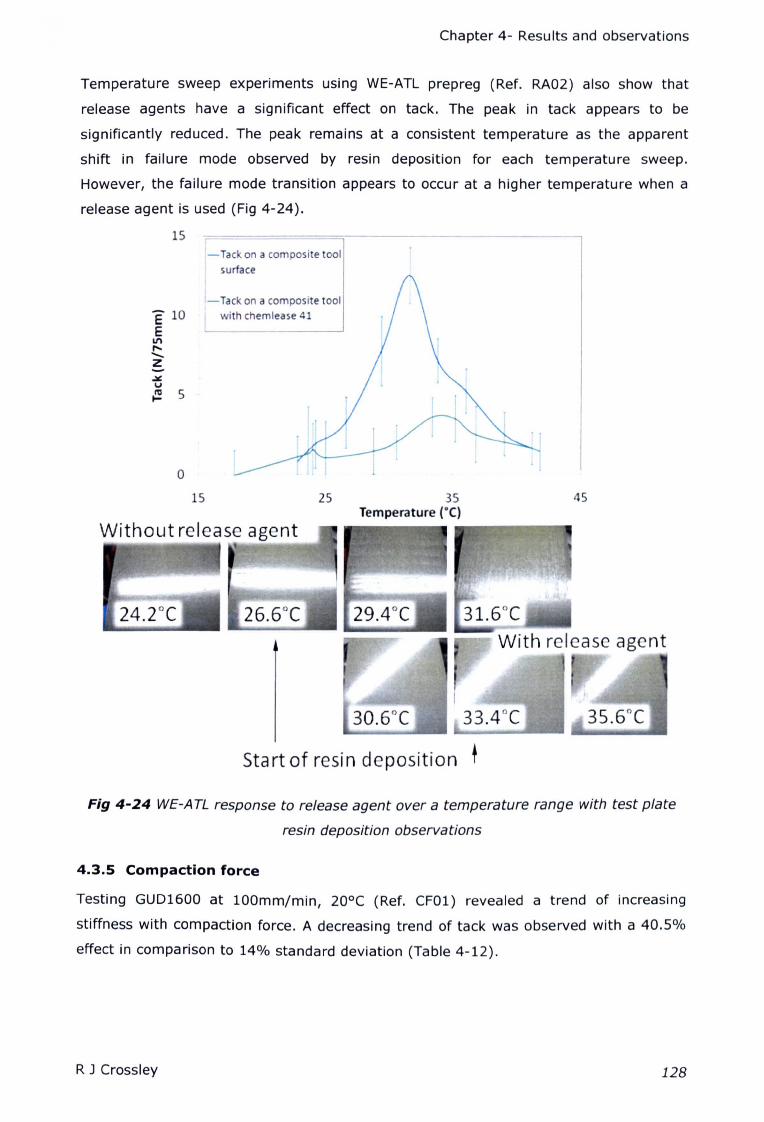
Chapter 4- Results and observations
Temperature sweep experiments using WE-ATL prepreg (Ref. RA02) also show that
release agents have a significant effect on tack. The peak in tack appears to be
significantly reduced. The peak remains at a consistent temperature as the apparent
shift in failure mode observed by resin deposition for each temperature sweep.
However, the failure mode transition appears to occur at a higher temperature when a
release agent is used (Fig 4-24).
15-Tack on a composite tool
surface
o15
I-Tack on a composite toolE 10 with chemtease41
ELn,...-Z~u~ 5
25 3STemperature ("C)
Without release agent
4S
Start of resin deposition t
Fig 4-24 WE-A TL response to release agent over a temperature range with test plate
resin deposition observations
4.3.5 Compaction force
Testing GUD1600 at 100mm/min, 20°C (Ref. CF01) revealed a trend of increasing
stiffness with compaction force. A decreasing trend of tack was observed with a 40.5%
effect in comparison to 14% standard deviation (Table 4-12).
R J Crossley 128
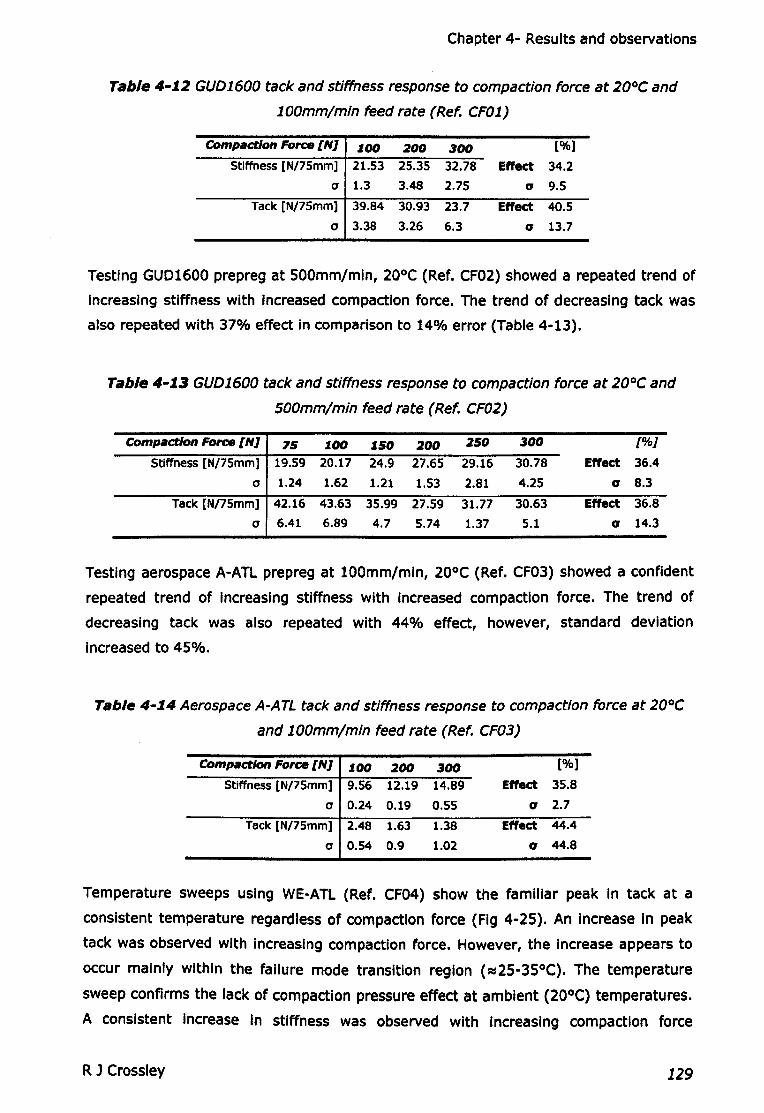
Chapter 4- Results and observations
Table 4-12GUD1600 tack and stiffness response to compaction force at 20°C and
toomm/ratn feed rate (Ref. CF01)
ComPllction Force [N1 lOO :ZOO 300 [%]
Stiffness [N/75mm] 21.53 25.35 32.78 Effect 34.2
0 1.3 3.48 2.75 fI 9.5
Tack [N/75mm] 39.84 30.93 23.7 Effect 40.5
0 3.38 3.26 6.3 fI 13.7
Testing GUD1600 prepreg at 500mm/min, 20°C (Ref. CF02) showed a repeated trend of
increasing stiffness with increased compaction force. The trend of decreasing tack was
also repeated with 37% effect In comparison to 14% error (Table 4-13).
Table 4-13GUD1600 tack and stiffness response to compaction force at 20°C and
SOOmm/min feed rate (Ref. CF02)
Comf'lldlon Force [N1 75 lOO 150 :ZOO :Z50 300 [%]
Stiffness [N/75mm] 19.59 20.17 24.9 27.65 29.16 30.78 Effect 36.4
0 1.24 1.62 1.21 1.53 2.81 4.25 fI 8.3
Tack [Nl75mm] 42.16 43.63 35.99 27.59 31.77 30.63 Effect 36.8
0 6.41 6.89 4.7 5.74 1.37 5.1 fI 14.3
Testing aerospace A-ATL prepreg at 100mm/min, 20°C (Ref. CF03) showed a confident
repeated trend of increasing stiffness with increased compaction force. The trend of
decreasing tack was also repeated with 44% effect, however, standard deviation
Increased to 45%.
Table 4-14Aerospace A-ATL tack and stiffness response to compaction force at 20°C
and lOOmm/min feed rate (Ref. CF03)
Compaction Force [N1 lOO 200 300 [%]
Stiffness [N/7Smm] 9.56 12.19 14.89 Effect 35.8
0 0.24 0.19 0.55 fI 2.7
Tack [N/75mm] VI8 1.63 1.38 Effect 44.4
0 0.54 0.9 1.02 fI 44.S
Temperature sweeps using WE-ATL (Ref. CF04) show the familiar peak In tack at a
consistent temperature regardless of compaction force (Fig 4-25). An Increase In peak
tack was observed with Increasing compaction force. However, the Increase appears to
occur mainly within the failure mode transition region (~25-35°C). The temperature
sweep confirms the lack of compaction pressure effect at ambient (200C) temperatures.
A consistent Increase In stiffness was observed with Increasing compaction force
R J Crossley 129
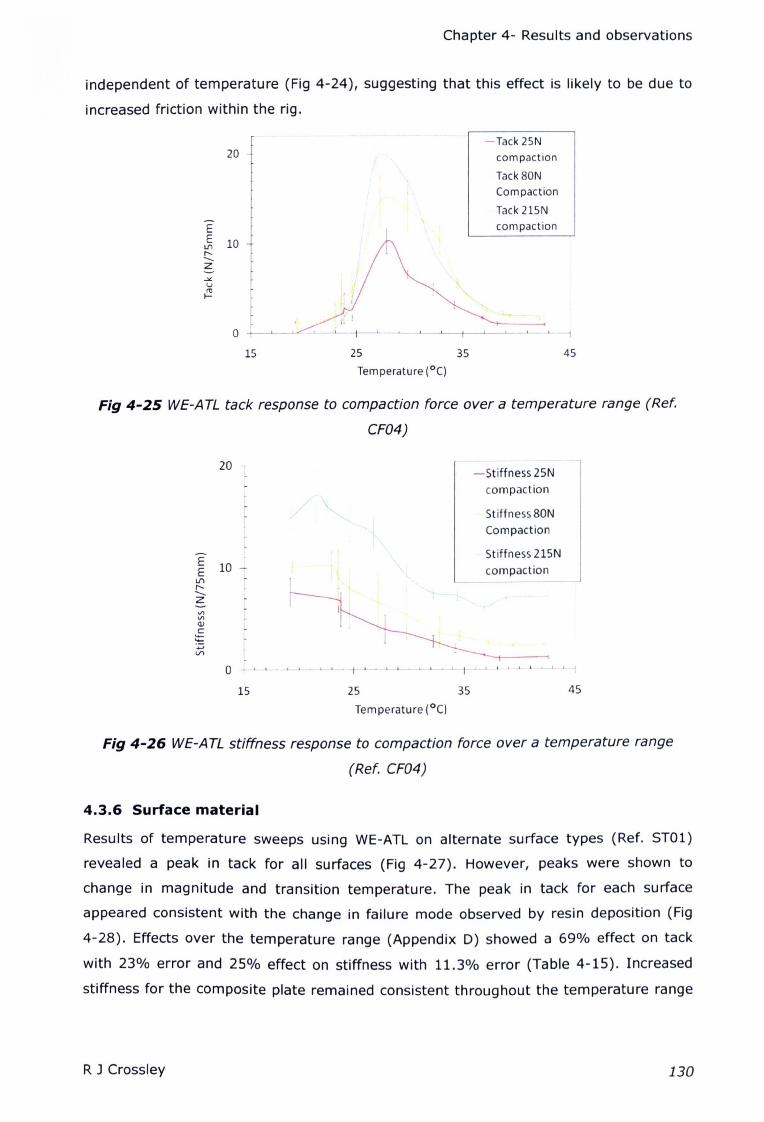
Chapter 4- Results and observations
independent of temperature (Fig 4-24), suggesting that this effect is likely to be due to
increased friction within the rig.
EE 10lI'\r-,-.....Z
~UIIIf-
0
15
20-Tack 25N
compaction
Tack BON
Compaction
Tack 215N
compaction
25
Temperature (0C)
35 45
Fig 4-25 WE-ATL tack response to compaction force over a temperature range (Ref.
CF04)
20-Stiffness 25N
compaction
Stiffness BON
Compaction
EStiffness 215N
E 10 - compactionIn - - -r-,-.....ZVlVlQ)
.E...'zVl
0 ~'~ I~ L I .J. J. , ~ " I ' i
15 25 35 45
Temperature (0C)
Fig 4-26 WE-ATL stiffness response to compaction force over a temperature range
(Ref. CF04)
4.3.6 Surface material
Results of temperature sweeps using WE-ATL on alternate surface types (Ref. STD1)
revealed a peak in tack for all surfaces (Fig 4-27). However, peaks were shown to
change in magnitude and transition temperature. The peak in tack for each surface
appeared consistent with the change in failure mode observed by resin deposition (Fig
4-28). Effects over the temperature range (Appendix D) showed a 69% effect on tack
with 23% error and 25% effect on stiffness with 11.3% error (Table 4-15). Increased
stiffness for the composite plate remained consistent throughout the temperature range
R J Crossley 130
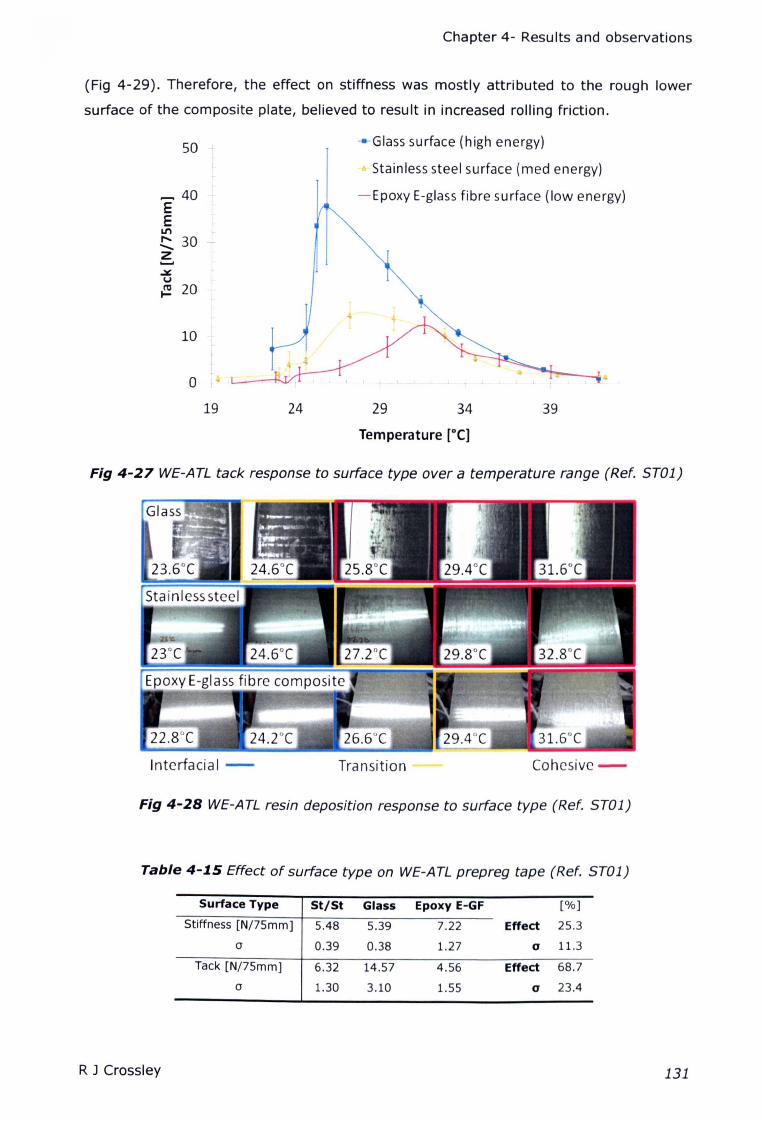
Chapter 4- Results and observations
(Fig 4-29). Therefore, the effect on stiffness was mostly attributed to the rough lower
surface of the composite plate, believed to result in increased rolling friction.
......40EE
LI'I
!::. 30 -t-
Z.......:.:.u~ 20
----Glasssurface (high energy)
_'_Stainlesssteel surface (med energy)
-Epoxy E-glass fibre surface (low energy)
50
10
o19 24 29 34 39
Temperature rOC]
Fig 4-27 WE-ATL tack response to surface type over a temperature range (Ref. ST01)
Interfacial - Transition - Cohcsivc-
Fig 4-28 WE-ATL resin deposition response to surface type (Ref. ST01)
Table 4-15 Effect of surface type on WE-ATL prepreg tape (Ref. ST01)
Surface Type StjSt Glass Epoxy E-GF [%]
Stiffness [N/75mm] 5.48 5.39 7.22 Effect 25.3
a 0.39 0.38 1.27 a 11.3
Tack [N/75mm] 6.32 14.57 4.56 Effect 68.7
a 1.30 3.10 1.55 a 23.4
R J Crossley 131

Chapter 4- Results and observations
15 --Glass surface
• Stainless steel surface
-Epoxy E-glass fibre surface
E 10 '1
EIn
"<,
~IIIIII
5Q)
c::::..In
0
19 24 29 34 39
Temperature [DC]
Fig 4-29 WE-ATL stiffness response to surface type over a temperature range (Ref.
ST01)
4.3.7 Contact temperature
The contact temperature experiment (Ref. CT01) revealed a significant effect of 69%
overall average increase in tack with a 40°C, lOON, 500mm/min pre-application stage
(Table 4-16). A low standard deviation of 5.3% indicates a good degree of confidence in
the observed effect. Observations over the peel temperature range show that tack is
significantly increased mostly at a lower temperature. Both failure modes are observed
in the standard test. However, only cohesive failure was observed in the pre-applied
high contact temperature sample displayed which did not exhibit a peak in tack (Fig
4-30). No effect was observed on prepreg stiffness.
60
'\~40°C, lOON compaction, SOOmm/min
pre-application using test rig
=-No pre-application
_ 40 I
EEIn
"......z-.:.:u
{2 20 I
28 33 38 43
Peel temperature [DC]
Fig 4-30 Effect of a 40°C pre-application on tack over a subsequent peel temperature
range (Ref. CT01)
R J Crossley 132
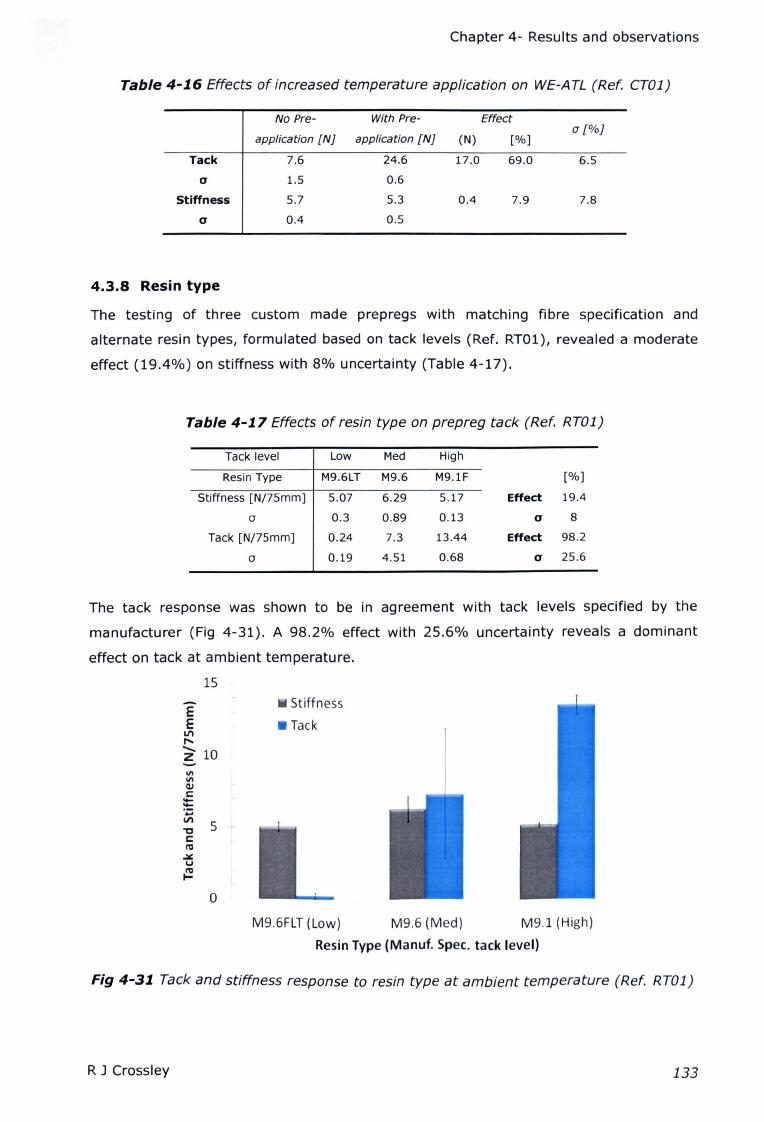
Chapter 4- Results and observations
Table 4-1.6 Effects of increased temperature application on WE-ATL (Ref. CT01)
No Pre- With Pre- Effect
application [N] application [N] (N) [%]a[%]
Tack 7.6 24.6 17.0 69.0 6.5
a 1.5 0.6
Stiffness 5.7 5.3 0.4 7.9 7.8
a 0.4 0.5
4.3.8 Resin type
The testing of three custom made prepregs with matching fibre specification and
alternate resin types, formulated based on tack levels (Ref. RT01), revealed a moderate
effect (19.4%) on stiffness with 8% uncertainty (Table 4-17).
Table 4-1.7 Effects of resin type on prepreg tack (Ref. RT01)
Tack level Low Med High
Resin Type M9.6LT M9.6 M9.1F [%]
Stiffness [N/7Smm] 5.07 6.29 5.17 Effect 19.4
a 0.3 0.89 0.13 a 8
Tack [N/7Smm] 0.24 7.3 13.44 Effect 98.2
0 0.19 4.51 0.68 a 25.6
The tack response was shown to be in agreement with tack levels specified by the
manufacturer (Fig 4-31). A 98.2% effect with 25.6% uncertainty reveals a dominant
effect on tack at ambient temperature.
15
-EE
LI'I
"z- 10
Stiffness
.Tack
5 -
oM9.6FLT (Low) M9.6 (Med)
Resin Type (Manuf. Spec. tack level)
M9.1 (High)
Fig 4-31. Tack and stiffness response to resin type at ambient temperature (Ref. RT01)
R J Crossley 133
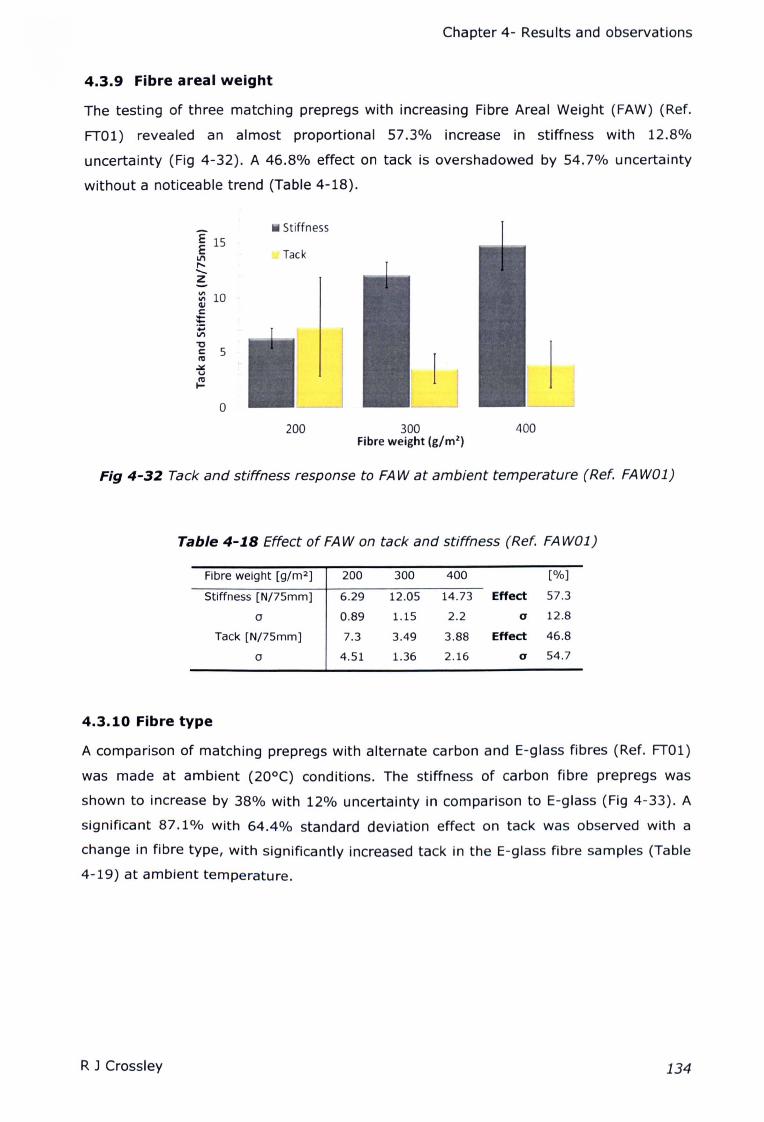
Chapter 4- Results and observations
4.3.9 Fibre areal weight
The testing of three matching prepregs with increasing Fibre Areal Weight (FAW) (Ref.
FT01) revealed an almost proportional 57.3% increase in stiffness with 12.8%
uncertainty (Fig 4-32). A 46.8% effect on tack is overshadowed by 54.7% uncertainty
without a noticeable trend (Table 4-18).
E 15E
LI'I,...<,z~1OQJ
t::::'0:;V"I
"0t: 5til
""u~
iii Stiffness
• Tack
o300
Fibre weight (g/m2)
400
Fig 4-32 Tack and stiffness response to FAW at ambient temperature (Ref. FAW01)
200
Table 4-1.8 Effect of FAW on tack and stiffness (Ref. FAW01)
Fibre weight [g/m2] 200 300 400 [%]
Stiffness [N/75mm] 6.29 12.05 14.73 Effect 57.3
a 0.89 1.15 2.2 a 12.8
Tack [N/75mm] 7.3 3.49 3.88 Effect 46.8
a 4.51 1.36 2.16 a 54.7
4.3.10 Fibre type
A comparison of matching prepregs with alternate carbon and E-glass fibres (Ref. FT01)
was made at ambient (200C) conditions. The stiffness of carbon fibre prepregs was
shown to increase by 38% with 12% uncertainty in comparison to E-glass (Fig 4-33). A
significant 87.1% with 64.4% standard deviation effect on tack was observed with a
change in fibre type, with significantly increased tack in the E-glass fibre samples (Table
4-19) at ambient temperature.
R J Crossley 134
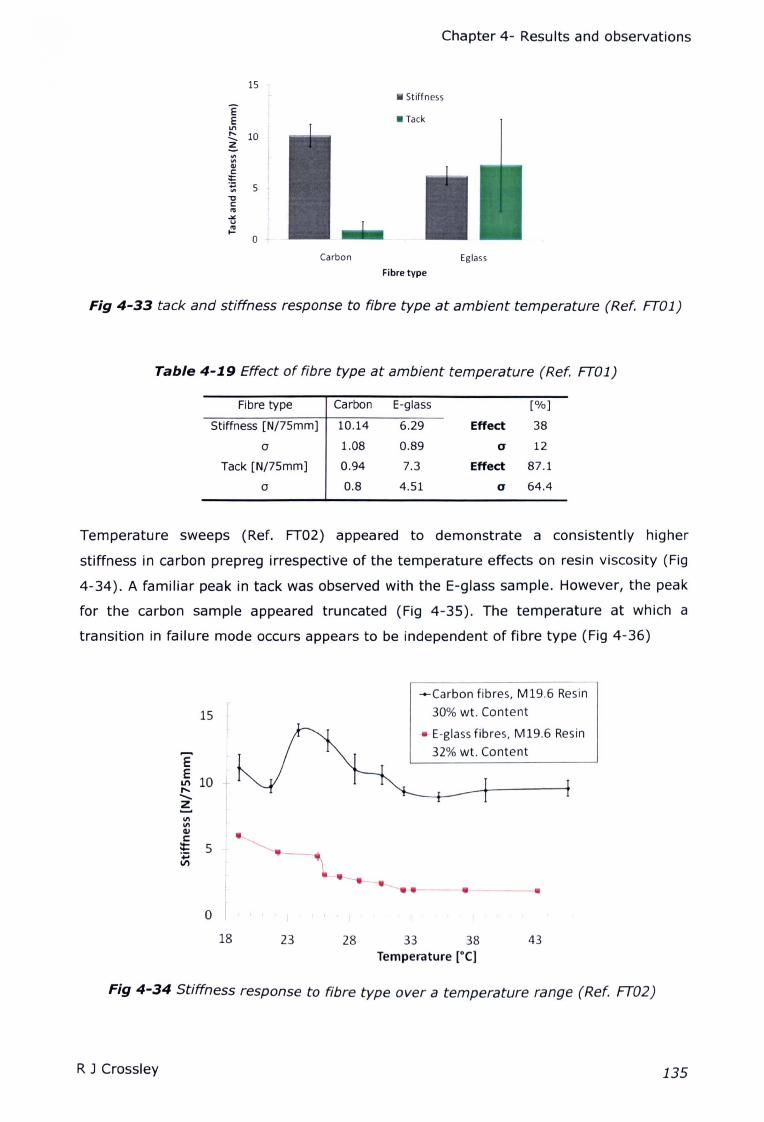
Chapter 4- Results and observations
EEIII
!:::. 10z
15 1
t• Stiffness
• Tack
'"'"Cl)
e:::'t; 5"Cc:
'"...u~ Io ,
Carbon Eglass
Fibre type
Fig 4-33 tack and stiffness response to fibre type at ambient temperature (Ref. FT01)
Table 4-19 Effect of fibre type at ambient temperature (Ref. FT01)
Fibre type Carbon E-glass [%]
Stiffness [N/75mm] 10.14 6.29 Effect 38
a 1.08 0.89 a 12
Tack [N/75mm] 0.94 7.3 Effect 87.1
a 0.8 4.51 a 64.4
Temperature sweeps (Ref. FT02) appeared to demonstrate a consistently higher
stiffness in carbon prepreg irrespective of the temperature effects on resin viscosity (Fig
4-34). A familiar peak in tack was observed with the E-glass sample. However, the peak
for the carbon sample appeared truncated (Fig 4-35). The temperature at which a
transition in failure mode occurs appears to be independent of fibre type (Fig 4-36)
+-Carbon fibres, M19.6 Resinr
15I
30% wt. Content
-. E-glassfibres, M19.6 Resin...... 32% wt. ContentE
~ 10,...-~1/11/14JC::: 5'+,II)
• .-. •0
18 23 28 33 38 43Temperature [GC}
Fig 4-34 Stiffness response to fibre type over a temperature range (Ref. FT02)
R J Crossley 135
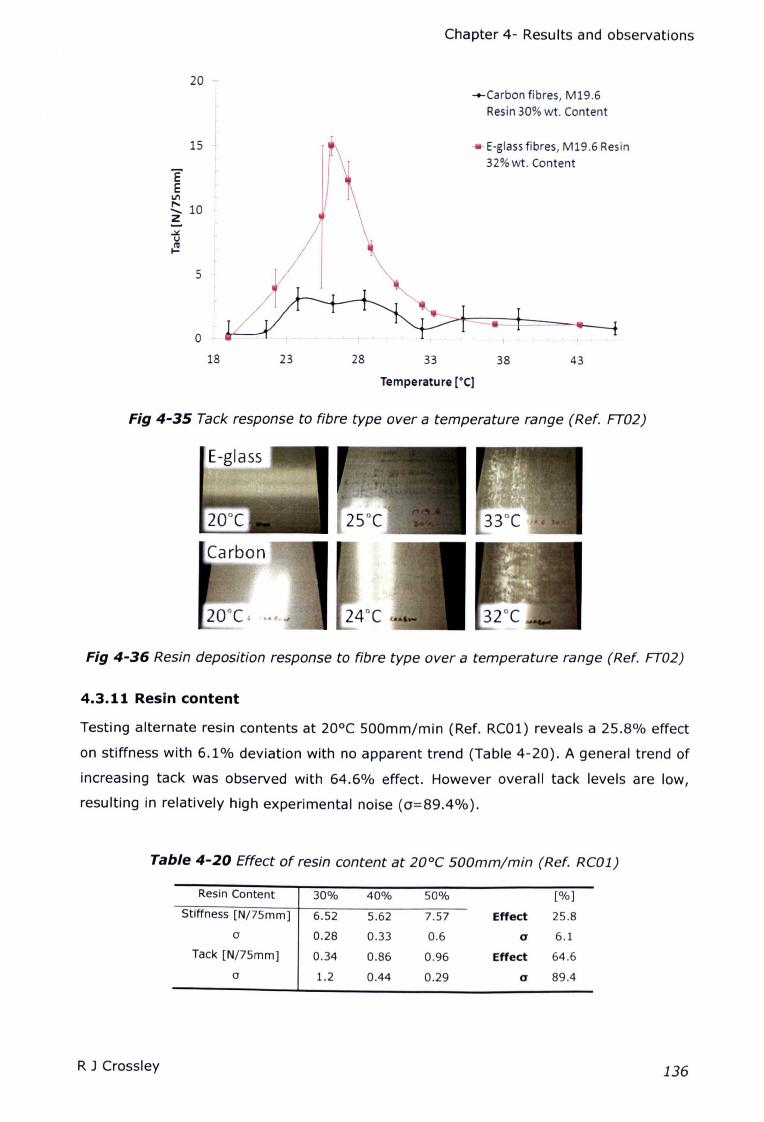
Chapter 4- Results and observations
20 Ti
-+-Carbon fibres, M19.6Resin30% wt. Content
r15
5
"E-glass fibres, M19.6 Resin32%wt. Content
EEIII
!::. 10Z
o18 23 28 33
Temperature [OCl
38 43
Fig 4-35 Tack response to fibre type over a temperature range (Ref. FT02)
E-glass
Fig 4-36 Resin deposition response to fibre type over a temperature range (Ref. FTD2)
4.3.11 Resin content
Testing alternate resin contents at 20°C 500mm/min (Ref. RC01) reveals a 25.8% effect
on stiffness with 6.1% deviation with no apparent trend (Table 4-20). A general trend of
increasing tack was observed with 64.6% effect. However overall tack levels are low,
resulting in relatively high experimental noise (0'=89.4%).
Table 4-20 Effect of resin content at 20°C 5DOmm/min (Ref. RCD1)
Resin Content 30% 40% 50% [%]
Stiffness [N/7Smm] 6.52 5.62 7.57 Effect 25.8
a 0.28 0.33 0.6 a 6.1
Tack [N/7Smm] 0.34 0.86 0.96 Effect 64.6
a 1.2 0.44 0.29 a 89.4
R] Crossley 136
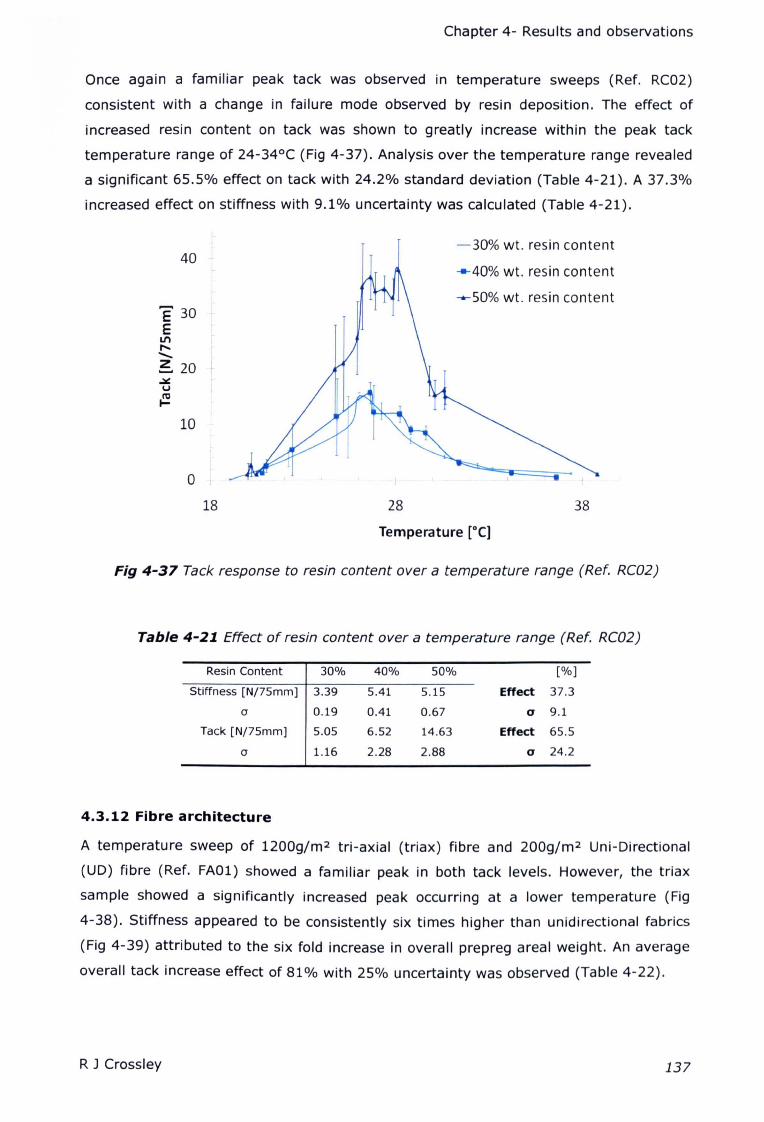
Chapter 4- Results and observations
Once again a familiar peak tack was observed in temperature sweeps (Ref. RC02)
consistent with a change in failure mode observed by resin deposition. The effect of
increased resin content on tack was shown to greatly increase within the peak tack
temperature range of 24-34°C (Fig 4-37). Analysis over the temperature range revealed
a significant 65.5% effect on tack with 24.2% standard deviation (Table 4-21). A 37.3%
increased effect on stiffness with 9.1% uncertainty was calculated (Table 4-21).
40
E 30 'E
LI'I,............~ 20.:.:.u{:!
10
o !
-30% wt. resin content
.......40% wt. resin content
--50% wt. resin content
18 28
Temperature [DC]
38
Fig 4-37 Tack response to resin content over a temperature range (Ref. RC02)
Table 4-21 Effect of resin content over a temperature range (Ref. RC02)
Resin Content 30% 40% 50% [%]
Stiffness [N/7Smm] 3.39 5.41 5.15 Effect 37.3
0 0.19 0.41 0.67 a 9.1
Tack [N/7Smm] 5.05 6.52 14.63 Effect 65.5
0 1.16 2.28 2.88 a 24.2
4.3.12 Fibre architecture
A temperature sweep of 1200g/m2 tri-axial (triax) fibre and 200g/m2 Uni-Directional
(UD) fibre (Ref. FA01) showed a familiar peak in both tack levels. However, the triax
sample showed a significantly increased peak occurring at a lower temperature (Fig
4-38). Stiffness appeared to be consistently six times higher than unidirectional fabrics
(Fig 4-39) attributed to the six fold increase in overall prepreg areal weight. An average
overall tack increase effect of 81% with 25% uncertainty was observed (Table 4-22).
R J Crossley 137
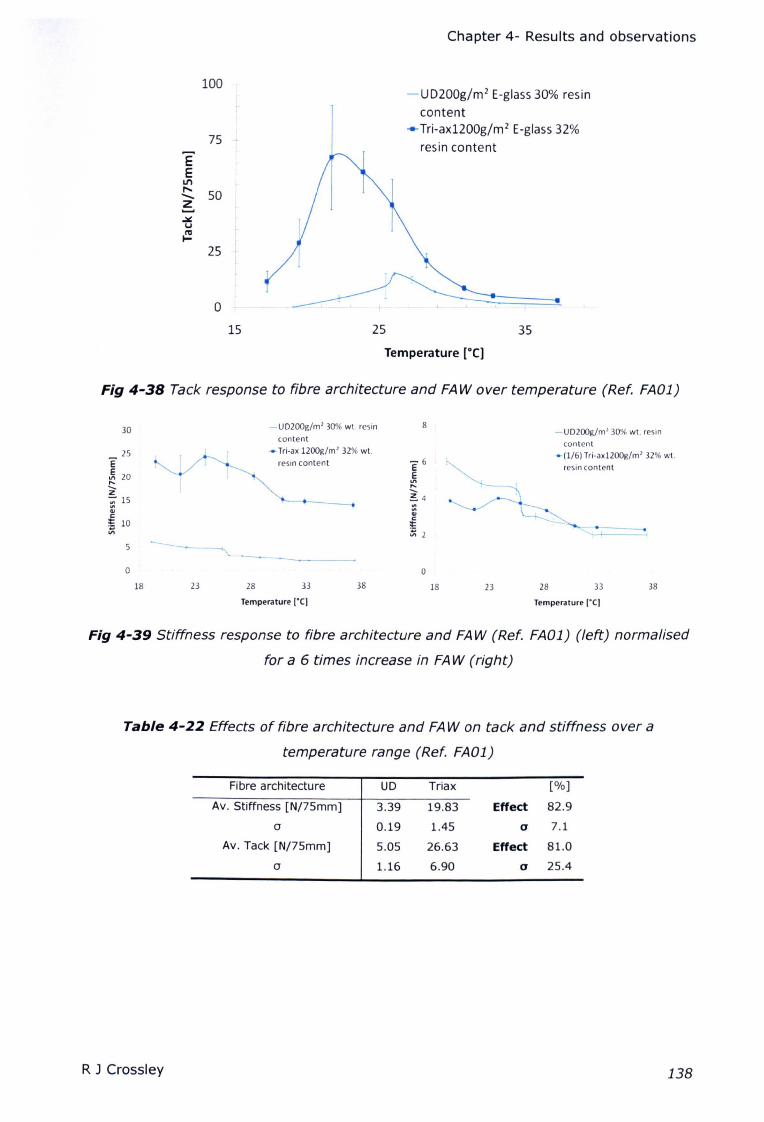
Chapter 4- Results and observations
100
o
-UD200g/m2 E-glass 30% resin
content....Tri-ax1200g/m2 E-glass 32%
resin content75 +
EEIII
!:::. 50z.......
2S
15 25
Temperature [GC]
35
Fig 4-38 Tack response to fibre architecture and FAW over temperature (Ref. FA01)
18 23 33
8
E'6~..........~4....QIC:;:;; 1
0
18
-UD200g/m' 30",(,wt. resin-UD200g/m' 30% wt. resin
content
- Tri-ax 1200g/m' 32% wt.resin content
content
30
25E'~ 20..........z~ 15QI
"!E 10
'"
-(1/6) Tri-ax1200g/m' 32% wt.
resin content
o28 38 23 28 33 38
Temperature [0C) Temperature (0C)
Fig 4-39 Stiffness response to fibre architecture and FA W (Ref. FA01) (left) normalised
for a 6 times increase in FA W (right)
Table 4-22 Effects of fibre architecture and FA W on tack and stiffness over a
temperature range (Ref. FA01)
Fibre architecture UD Triax [%]
Av. Stiffness [N/7smm] 3.39 19.83 Effect 82.9
0 0.19 1.45 a 7.1
Av. Tack [N/7smm] 5.05 26.63 Effect 81.0
0 1.16 6.90 a 25.4
RJ Crossley 138
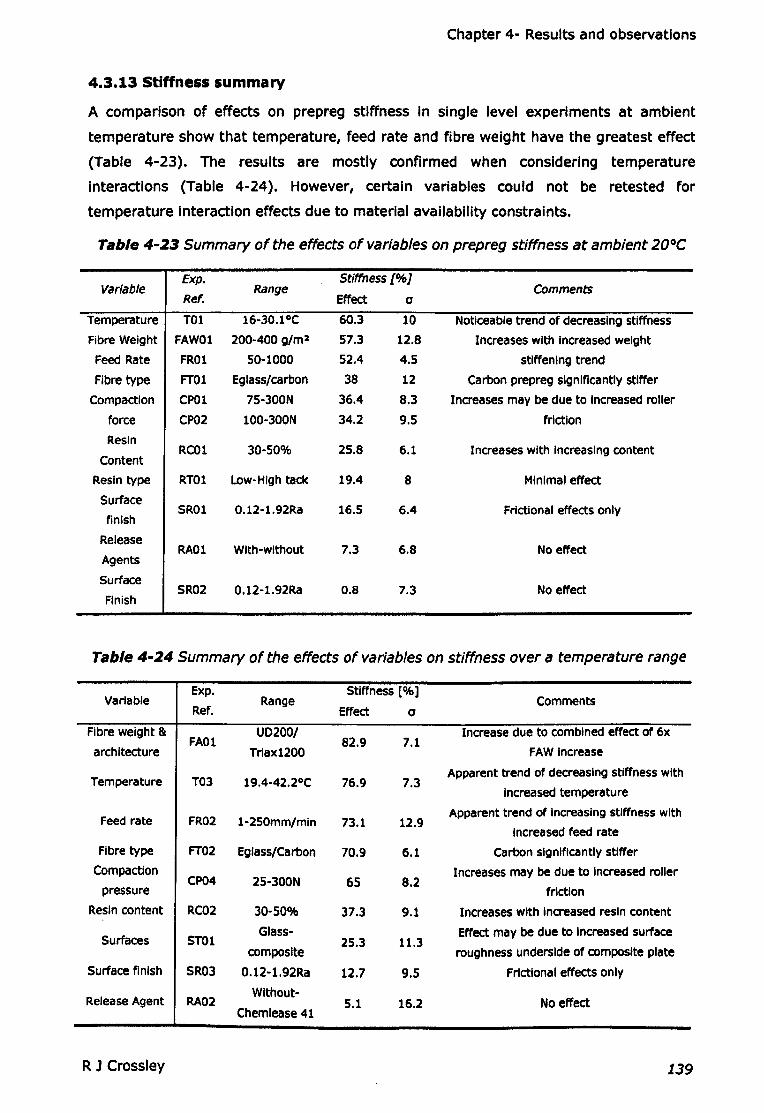
Chapter 4- Results and observations
4.3.13 Stiffness summary
A comparison of effects on prepreg stiffness In single level experiments at ambient
temperature show that temperature, feed rate and fibre weight have the greatest effect
(Table 4-23). The results are mostly confirmed when considering temperature
interactions (Table 4-24). However, certain variables could not be retested for
temperature Interaction effects due to material availability constraints.
Table 4-23 Summary of the effects of variables on prepreg stiffness at ambient 20°C
VariableExp.
RangeStiffness [%]
CommentsRef. Effect 0
Temperature TOl 16-30.10C 60.3 10 Noticeable trend of decreasing stiffness
Fibre Weight FAWOl 200-400 g/m2 57.3 12.8 Increases with Increased weight
Feed Rate FROl 50-1000 52.4 4.5 stiffening trend
Fibre type FTOl Eglass/carbon 38 12 Carbon prepreg Significantly stiffer
Compaction CPOl 75-300N 36.4 8.3 Increases may be due to Increased roller
force CP02 100-JOON 34.2 9.5 friction
ResinRCOl 30-50% 25.8 6.1 Increases with Increasing content
Content
Resin type RTOl low-High tack 19.4 8 Minimal effect
SurfaceSROl 0.12-1.92Ra 16.5 6.4 Frictional effects only
finish
ReleaseRAOl With-without 7.3 6.8 No effect
Agents
SurfaceSR02 0.12-1.92Ra 0.8 7.3 No effect
Finish
Table 4-24 Summary of the effects of variables on stiffness over a temperature range
VariableExp.
RangeStiffness [%]
CommentsRef. Effect 0
Fibre weight & UD200/ Increase due to combined effect of 6xFAOl 82.9 7.1
architecture Triax1200 FAW increase
Temperature T03 19.4-42.2°C 76.9 7.3Apparent trend of decreasing stiffness with
Increased temperature
Feed rate FR02 1-250mm/min 73.1 12.9Apparent trend of increasing stiffness with
increased feed rate
Fibre type FT02 Eglass/Carbon 70.9 6.1 Carbon significantly stiffer
CompactionCP04 25-300N
Increases may be due to increased roller65 8.2
pressure friction
Resin content RC02 30-50% 37.3 9.1 Increases with Increased resin content
Surfaces STOlGlass- Effect may be due to Increased surface
25.3 11.3compcstte roughness underside of composite plate
Surface finish SR03 0.12-1.92Ra 12.7 9.5 Frictional effects only
Release Agent RA02Without-
5.1 16.2 No effectChemlease 41
R J Crossley 139
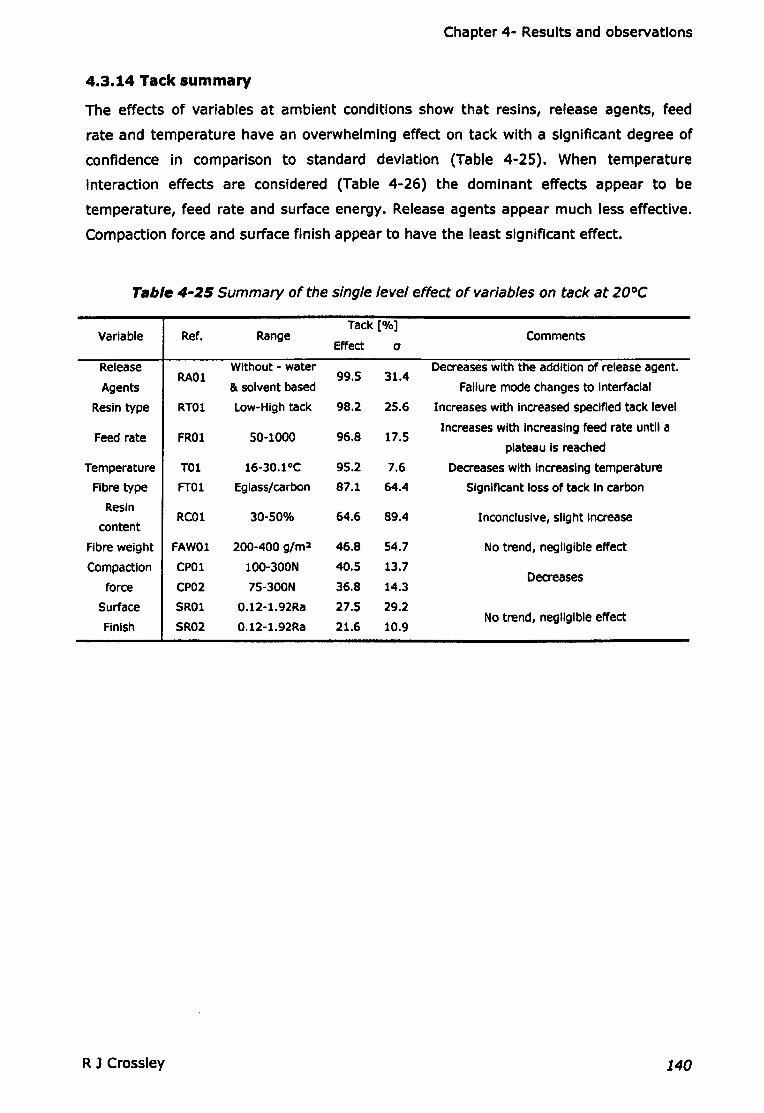
Chapter 4- Results and observations
4.3.14 Tack summary
The effects of variables at ambient conditions show that resins, release agents, feed
rate and temperature have an overwhelming effect on tack with a significant degree of
confidence in comparison to standard deviation (Table 4-25). When temperature
Interaction effects are considered (Table 4-26) the dominant effects appear to be
temperature, feed rate and surface energy. Release agents appear much less effective.
Compaction force and surface finish appear to have the least significant effect.
Table 4-25 Summary of the single level effect of variables on tack at 20°C
Variable Ref. RangeTack [%]
CommentsEffect a
Release Without - water Decreases with the addition of release agent.RAO! 99.5 31.4
Agents & solvent based Failure mode changes to Interfacial
Resin type RTOl Low-High tack 98.2 25.6 Increases with Increased specified tack level
Feed rate FRO! 50-1000 96.8 17.5Increases with Increasing feed rate until a
plateau Is reached
Temperature TOl 16-30.1oC 95.2 7.6 Decreases with Increasing temperature
Fibre type FTOl Eglass/carbon 87.1 64.4 Significant loss of tack In carbon
ResinRCOl 30-50% 64.6 89.4 Inconclusive, slight Increase
content
Fibre weight FAWOl 200-400 91m2 46.8 54.7 No trend, negligible effect
Compaction CPOl 100-300N 40.5 13.7Decreases
force CP02 7S-300N 36.8 14.3
Surface SROl 0.12-1.92Ra 27.5 29.2
Finish SR02 0.12-1.92Ra 21.6 10.9No trend, negligible effect
R J Crossley 140

Chapter 4- Results and observations
Table 4-26 Summary of the effect of variables on tack including temperature
interaction effects
Variable Ref. RangeTack [%]
CommentsEffect 0
Increases with Increasing temperature during
Temperature T03 19.4-42.2°C 93.1 23.2 Interfacial failure then reaches a peak at
transmon, failing during cohesive failure
Increases with Increasing feed rate during
Feed rate FR02 1-250mm/min 88.6 20.2 cohesive failure, decreases during Interfacial
failure
Fibre weightIncreases with trlax, most likely due to
& FA01 UD200/ Trlax1200 81 25.4combined effects of a 6x FAW Increase
architecture
Glass-St/St-Increases with increased surface energy, the
Surfaces ST01 6S.7 23.4 onset of cohesive failure is delayed with lowcomposite
surface energy surfaces
Resin Generally increasing with significant increaseRC02 30-50% 65.5 24.2
content between 40-50%
Release None-Chemlease Decreases with the addition of release agent,RA02 61.3 51.9
agent 41 delays the onset of cohesive failure
Fibre type FT02 E-glass/Carbon 5S.S 29.5 Significant loss of tack In carbon prepreg
CompactionCF04 25-300N 48.2 18.4
Increases with increased pressure around the
force peak only
SurfaceSR03 0.12-1.92Ra 25.5 19.8 No trend, negligible effect
finish
R J Crossley 141
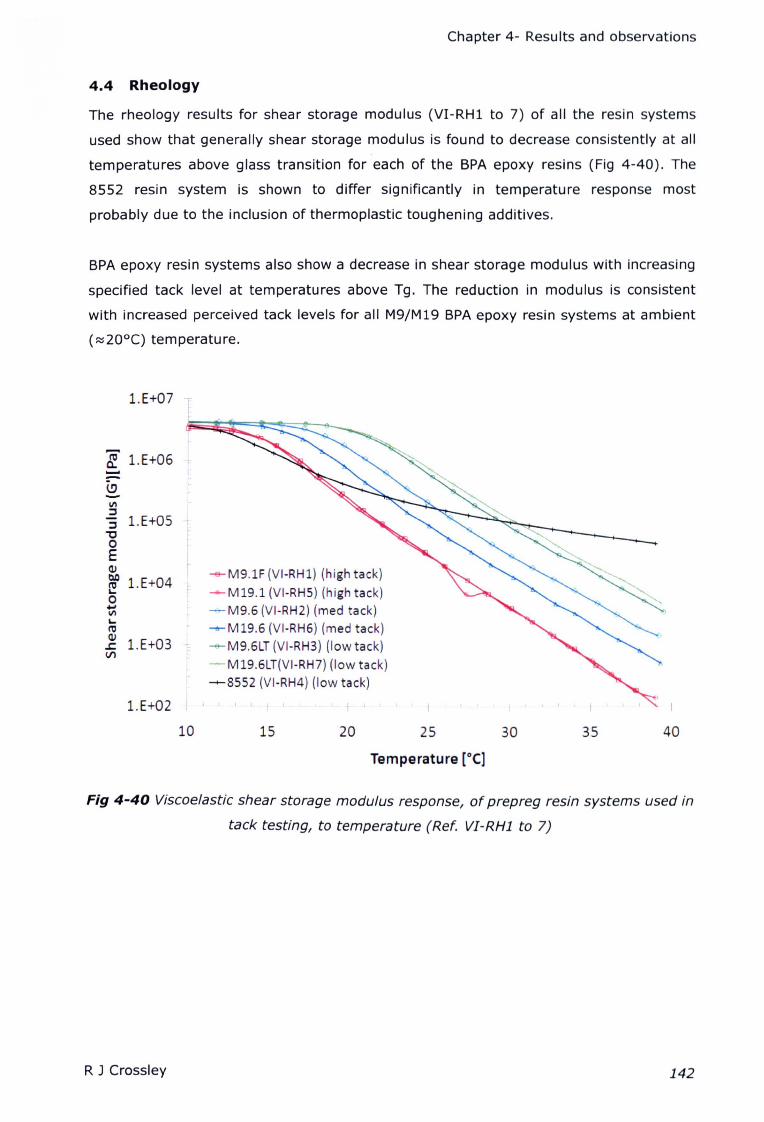
Chapter 4- Results and observations
4.4 Rheology
The rheology results for shear storage modulus (VI-RHl to 7) of all the resin systems
used show that generally shear storage modulus is found to decrease consistently at all
temperatures above glass transition for each of the BPA epoxy resins (Fig 4-40). The
8552 resin system is shown to differ significantly in temperature response most
probably due to the inclusion of thermoplastic toughening additives.
BPA epoxy resin systems also show a decrease in shear storage modulus with increasing
specified tack level at temperatures above Tg. The reduction in modulus is consistent
with increased perceived tack levels for all M9/M19 BPA epoxy resin systems at ambient
(:::::20°C) temperature.
l.E+07
"l l.E+06
-19-1/1::J::J l.E+OS -t
"0 "0EQ)
--e- M9.1F (VI-RH1) (h igh tack)tl.O l.E+04e --M19.1 (VI-RH5) (high tack)0.... -M9.6 (VI-RH2) (med tack)1/1
lI--M19.6 (VI-RH6) (med tack)ro
Q)
l.E+03r
-&-M9.6LT (VI-RH3) (low tack)s:Vl
-M19.6LT(VI-RH7) (low tack)
t --8552 (VI-RH4) (low tack)
l.E+02 , I , , , , , ,
10 15 20 25 30 35 40
Temperature [DC]
Fig 4-40 Viscoelastic shear storage modulus response, of prepreg resin systems used in
tack testing, to temperature (Ref. VI-RH1 to 7)
R J Crossley 142
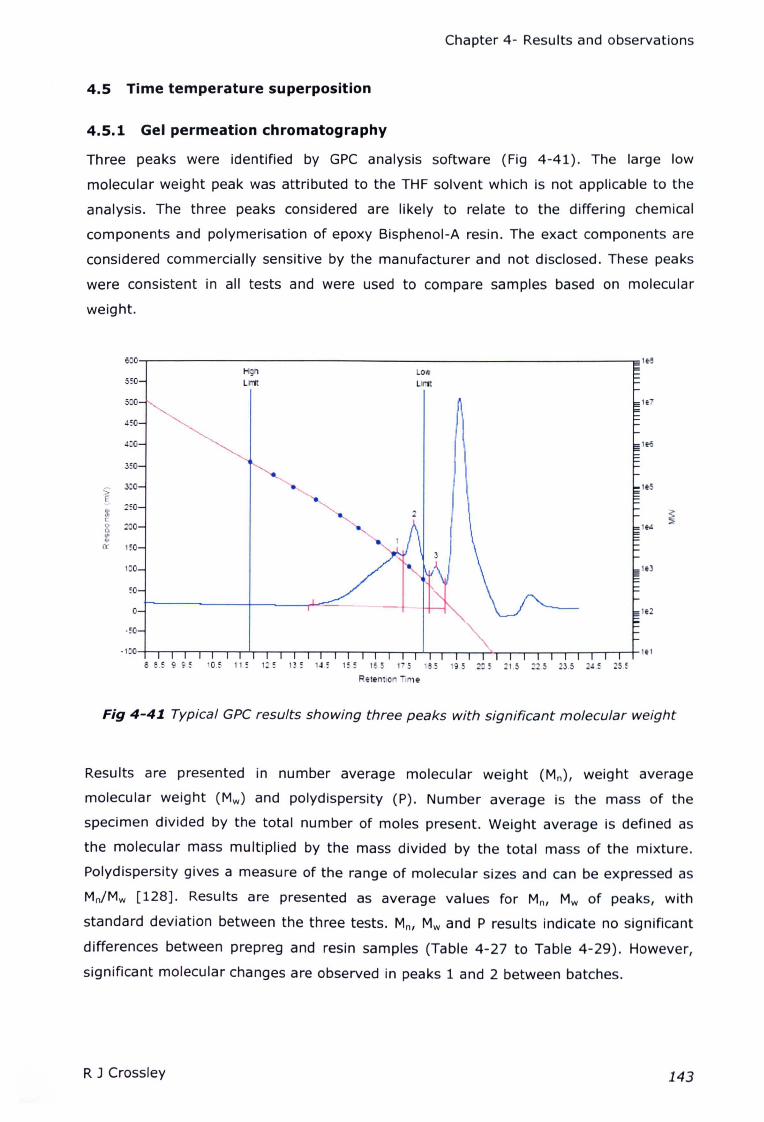
Chapter 4- Results and observations
4.5 Time temperature superposition
4.5.1 Gel permeation chromatography
Three peaks were identified by GPC analysis software (Fig 4-41). The large low
molecular weight peak was attributed to the THF solvent which is not applicable to the
analysis. The three peaks considered are likely to relate to the differing chemical
components and polymerisation of epoxy Bisphenol-A resin. The exact components are
considered commercially sensitive by the manufacturer and not disclosed. These peaks
were consistent in all tests and were used to compare samples based on molecular
weight.
3:&'"..r(
RElemio Ii, e
Fig 4-41. Typical GPCresults showing three peaks with significant molecular weight
Results are presented in number average molecular weight (Mn), weight average
molecular weight (Mw) and polydispersity (P). Number average is the mass of the
specimen divided by the total number of moles present. Weight average is defined as
the molecular mass multiplied by the mass divided by the total mass of the mixture.
Polydispersity gives a measure of the range of molecular sizes and can be expressed as
Mn/Mw [128]. Results are presented as average values for Mn, Mw of peaks, with
standard deviation between the three tests. Mn, Mw and P results indicate no significant
differences between prepreg and resin samples (Table 4-27 to Table 4-29). However,
significant molecular changes are observed in peaks 1 and 2 between batches.
R J Crossley 143
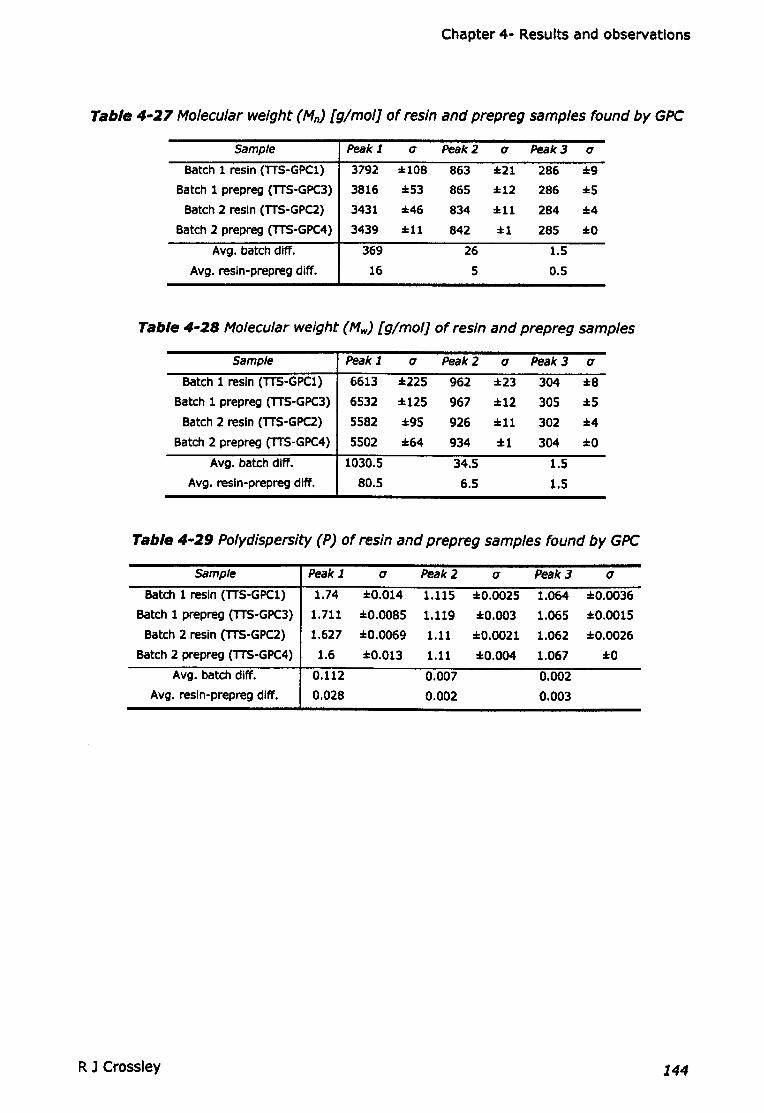
Chapter 4- Results and observations
Table 4-27 Molecular weight (MnJ[g/mol] of resin and prepreg samples found by GPC
Sample Peak 1. (J Peak2 (J Peak3 (J
Batch 1 resin (TTS-GPC1) 3792 :108 863 :21 286 :9
Batch 1 prepreg (TTS-GPC3) 3816 :53 865 :12 286 :5
Batch 2 resin (TTS-GPC2) 3431 :46 834 :11 284 :4
Batch 2 prepreg (TTS-GPC4) 3439 :11 842 :1 285 :0
Avg. batch diff. 369 26 1.5
Avg. resin-prepreg diff. 16 5 0.5
Table 4-28 Molecular weight (Mw) [g/mol] of resin and prepreg samples
Sample Peak 1. (J Peak2 (J Peak3 (J
Batch 1 resin (TTS-GPC1) 6613 :225 962 :23 304 :8
Batch 1 prepreg (TTS-GPC3) 6532 :125 967 :1:12 305 :5
Batch 2 resin (TTS-GPC2) 5582 :95 926 :11 302 :4
Batch 2 prepreg (TTS-GPC4) 5502 :64 934 :1:1 304 :0
Avg. batch dlff. 1030.5 34.5 1.5Avg. resin-prepreg dlff. 80.5 6.5 1.5
Table 4-29 Polydispersity (PJ of resin and prepreg samples found by GPC
Sample Peak 1. (J Peak2 (J Peak3 (J
Batch 1 resin (TTS-GPC1) 1.74 :0.014 1.115 :0.0025 1.064 :to.0036
Batch 1 prepreg (TTS-GPC3) 1.711 :to.008S 1.119 :to.003 1.065 :to.001S
Batch 2 resin (TTS-GPC2) 1.627 :to.0069 1.11 :to.0021 1.062 :to.0026
Batch 2 prepreg (TTS-GPC4) 1.6 :to.013 1.11 :to.OO4 1.067 :to
Avg. batch dlff. 0.112 0.007 0.002Avg. resin-prepreg dlff. 0.028 0.002 0.003
R J Crossley 144
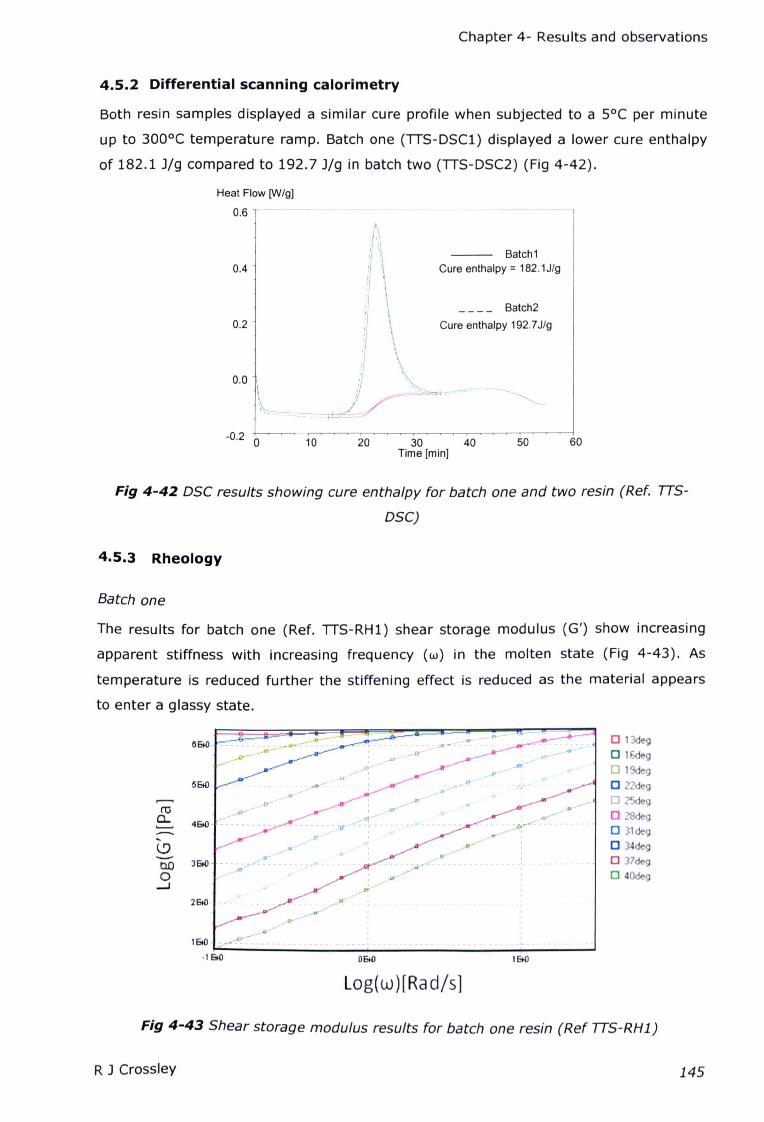
Chapter 4- Results and observations
4.5.2 Differential scanning calorimetry
Both resin samples displayed a similar cure profile when subjected to a SoC per minute
up to 300°C temperature ramp. Batch one (TTS-DSC1) displayed a lower cure enthalpy
of 182.1 J/g compared to 192.7 J/g in batch two (TTS-DSC2) (Fig 4-42).
Heat Flow [WIg]
0.6 --
0.4Batch1
Cure enthalpy = 1B2.1J/g
0.2
_ _ _ _ Batch2
Cure enthalpy 192.7J/g
0.0
\ I /'
'------:-7~ :/
-0.2 0 10 20 30 40Time [min]
50 60
Fig 4-42 DSC results showing cure enthalpy for batch one and two resin (Ref. rrs-DSC)
4.5.3 Rheology
Batch one
The results for batch one (Ref. TTS-RH1) shear storage modulus (G') show increasing
apparent stiffness with increasing frequency (w) in the molten state (Fig 4-43). As
temperature is reduced further the stiffening effect is reduced as the material appears
to enter a glassy state.
rnc,
,...-
o 13deg
o 16deg
o 19deg
o 22deg
o 25deg
o 2'8deo 31de
o de
o 37d I)
o 40de-0.0o
.....J
2E1O
-Q_''-.
1 EIO __ -":~-
-1 EIO OEIO lEIO
Log( w )[Ra dis]
Fig 4-43 Shear storage modulus results for batch one resin (Ref rrS-RH1)
R J Crossley 145

Chapter 4- Results and observations
The results indicate characteristics of time temperature superposition. Recently
developed Reptate [157] software was used to establish WLF parameters (Table 4-30)
for the WLF equation as presented by Reptate authors (Eq 4-1). Once shifted using
these parameters, a master curve could be compiled which indicates a molten to glass
transition within the strain rate and temperature range of the experiment (Fig 4-44).
Table 4-30 Batch one resin (R1) WLFparameters
Parameter Value
Cl 12.8
C2 46.8
To 20°C
Eq 4-1 The WLF equation as implemented by Reptate software [157J
- 5E+O,---------.-------
,,
, ,• I • I
- r - - - - - - - - - ,- - - - - - - - - - r - - - - - - - - - T - - - - - - - - -
6E+O ---------,----------,--, ,, ', ', ,, ,
reo,--...... 4E+O
_________ !.. , t.. ! _
I I I I
I I I tI I I I
I , ' I
I I , I, , ,I I I I I_____ ~ l ~ l I _
I , I I I
, I I I ,
I I I , I
I I t I I
I I I I I
I I I I I
2E+O - - - - - - - - -:- - - - - - - - - - ~ - - - - - - - - - ~ - - - - - - - - ~ - - - - - - - - ,- - - - - - - - ~ - - - - - - - - -, ,
, ,
1.9... ...
1.9-0.0o
......J
// I I I I
/ I I I I1E+O ~f:- - - - - __1 L. L. - - - - - - - - - I-
-3E+0 -1E+0 1E+O 2E+-0-2E+-0 OE+O
Log(w)(Rad/s)
o 1300g
o 11ldeg.
o 19deg.
o 22deg
o 25dego 28deg
o 31deg
o 34deg
o 37c!eo Odeg
Fig 4-44 Viscoelastic master curve for batch one resin (R1) obtained by WLF time
temperature superposition
Batch two
The procedure was repeated for batch two (Ref. TIS-RH2) and showed similar results
(Fig 4-45). However, marginal differences in WLF constants are observed (Table 4-31).
Construction of a reasonable master curve using the WLF equation was again possible
(Fig 4-46).
R J Crossley 146
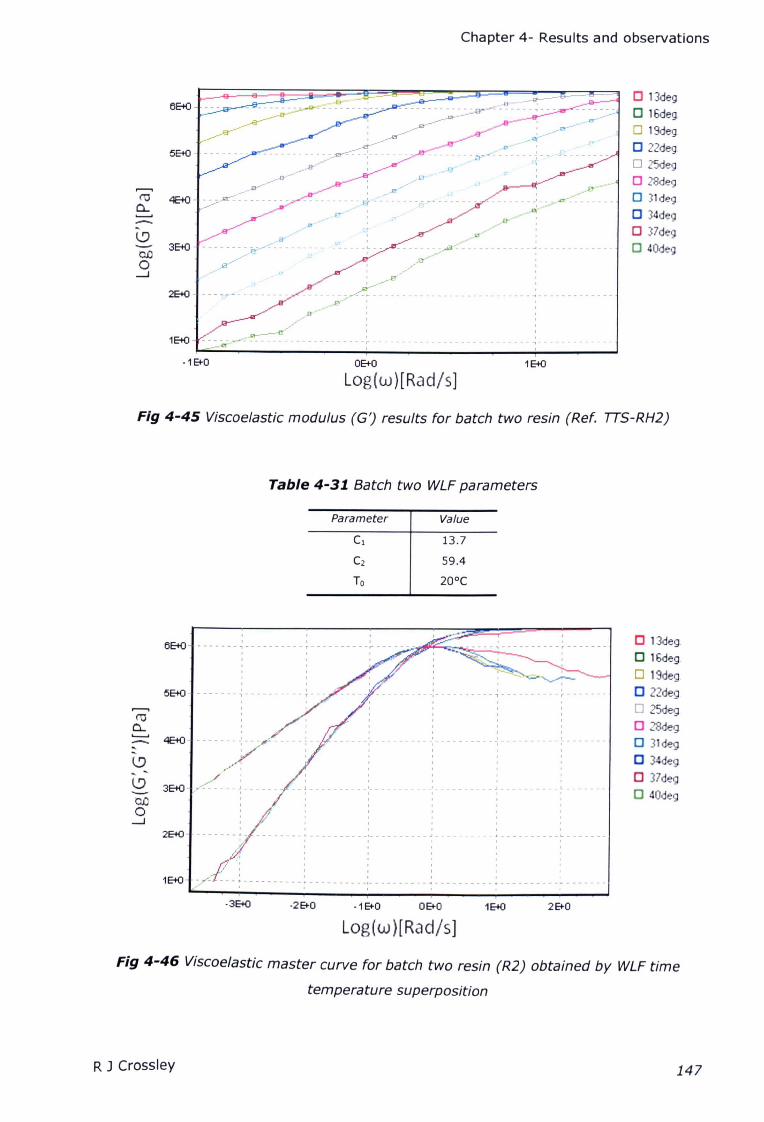
Chapter 4- Results and observations
o 13deg
o 16deg
o 19deg
o Z2deg
o .?5deg
o 2'8deg
o Jldeg
o deg
o J7d 9
o 40deg
680
__£r---
----,,--.-...-
_.e------I _o---
- - - - - - - - -' - - ~~~- - - - - - -.a--------~-.---
___1OT-----?
- - - - - - - - ,.i;.1(~-:~- - - - - - - - - - - ~ - - - - - - - - - - - - - -. .-o-..--_..----
Fig 4-45 Viscoelastic modulus (G') results for batch two resin (Ref. TTS-RH2)
380______ L. __
,
o 13deg.
o 16deg
o 19deg
o lldeg
o Djeg
o 28deg
o 31deg
o d
o 37d «;I
o 40d «;I
__2-------
Fig 4-46 Viscoelastic master curve for batch two resin (R2) obtained by WLF time
temperature superposition
RJ Crossley
280
: _-_..--8"-__s;,.-- ,
- - - - - - - -__....-::;.-I- .... _
_£I--- ,
»<:............J--
_o----tf
- :__-_~ ...--~ - - - - - - - - - - - - - - - - - - - r - -180
-1 E+-O 080
Log(w)[Rad/s]180
Table 4-31.Batch two WLF parameters
Parameter Value
Cl 13.7
C2 59.4
To 20°C
680 - - - - - -. ~- - - . ~ ~- .. - -,..-.~:;::;....~~~.:..::.-, ,
-..
,580- - -- - - --~-- --- - -- - -~- -- .
, , ,- - - -,- - - - - - - - - -, - - - - - - - - - - r - - - - - --
,-j -----------------
(.9
coo_J
380 ,.-:~~-.~ ... --,
__ I J L_
, ,
280 -- - : / - - _l _ _ _ _ _i_ _ :; _ _ __ ; __y.._" ..~-f .1 _.t j .. _ _ . j ._ _. i ~ _.
.....-. I I , I I I
180
-380 -2E+-0 -1 E+-O OE+-O 180 2E+-0
Log(w}[Radjs]
147
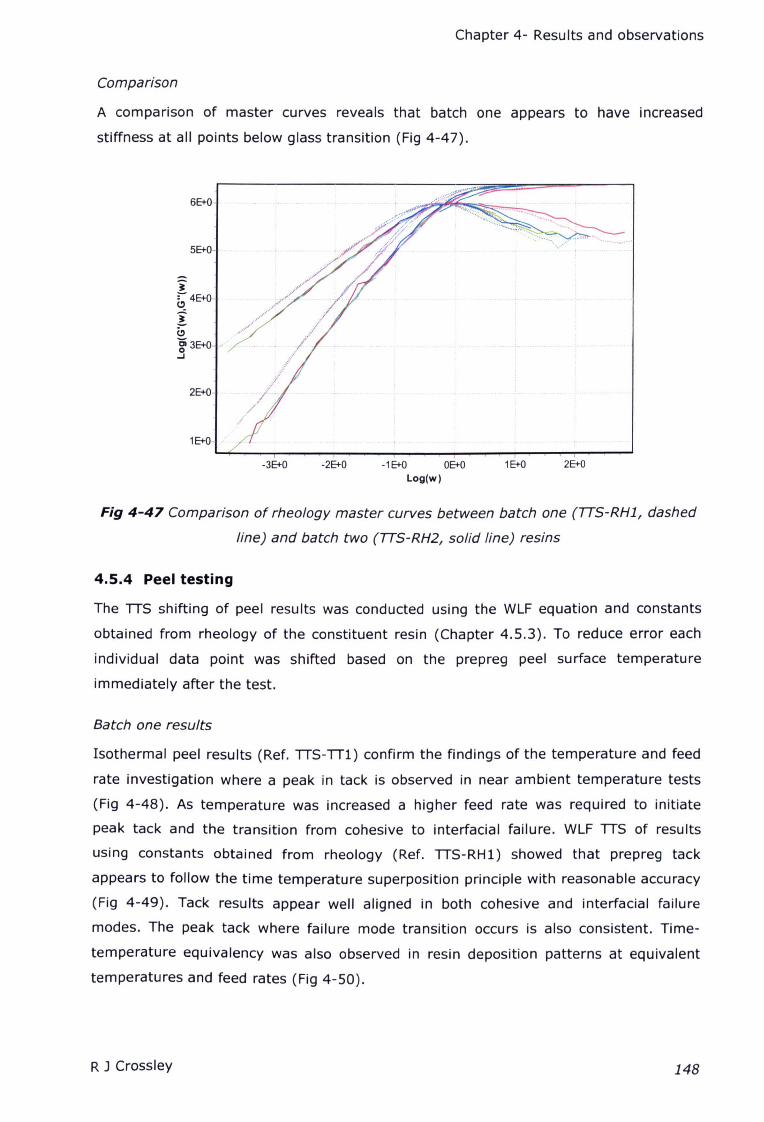
Chapter 4- Results and observations
Comparison
A comparison of master curves reveals that batch one appears to have increased
stiffness at all polnts below glass transition (Fig 4-47).
6E+O
......, . ............. _ .5E+O
'i:- 4E+O~:!Clg 3E+O -oJ
2E+O
1E+O-
-3E+O -2E+O -1 E+O OE+OLog(w)
1E+O 2E+O
Fig 4-47 Comparison of rheology master curves between batch one (TTS-RH1, dashed
line) and batch two (TTS-RH2, solid line) resins
4.5.4 Peel testing
The TTS shifting of peel results was conducted using the WLF equation and constants
obtained from rheology of the constituent resin (Chapter 4.5.3). To reduce error each
individual data point was shifted based on the prepreg peel surface temperature
immediately after the test.
Batch one results
Isothermal peel results (Ref. TTS-TT1) confirm the findings of the temperature and feed
rate investigation where a peak in tack is observed in near ambient temperature tests
(Fig 4-48). As temperature was increased a higher feed rate was required to initiate
peak tack and the transition from cohesive to interfacial failure. WLF TTS of results
using constants obtained from rheology (Ref. TTS-RH1) showed that prepreg tack
appears to follow the time temperature superposition principle with reasonable accuracy
(Fig 4-49). Tack results appear well aligned in both cohesive and interfacial failure
modes. The peak tack where failure mode transition occurs is also consistent. Time-
temperature equivalency was also observed in resin deposition patterns at equivalent
temperatures and feed rates (Fig 4-50).
R J Crossley 148
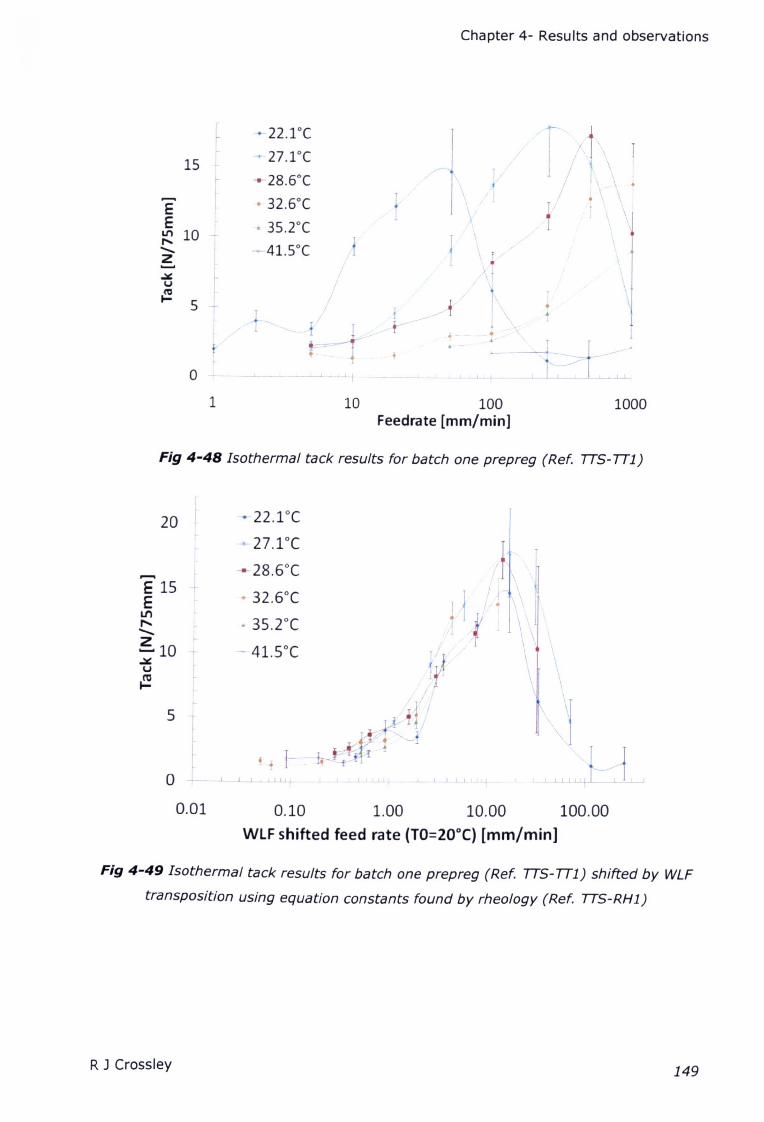
~
---22.1°C
T 27.1°C15 I
r ----28.6°C......
• 32.6°CE ~E • 35.2°CLn 10 +............. -41.5°Cz ~......
~~v{!
5 _j_
Il-
f
0 ,.... - _--"_ - ~_ .-Lj
1 10
Chapter 4- Results and observations
\
\,
" f
•· --I_
t,---L-j- _ ~..L _ ~ ---'----'------L.L
100Feedrate [mm/min]
1000
Fig 4-48 Isothermal tack results for batch one prepreg (Ref. TTS-TTl)
20
-E 15E
Ln
.t:. I
~10 ~..:.::v
~
5 f
ro i-
0.01
-- 22.1oC
-4 27.1°C
--28.6°C
• 32.6°C
• 3S.2°C
-41.soC
f + I-l 1..1. .,..lL t L
0.10
! L r ..I.. ..L..l ! _ L L 11!.L
1.00 100.00
WlF shifted feed rate (TO=20oq [mm/min]
10.00
Fig 4-49 Isothermal tack results for batch one prepreg (Ref. TTS-TTl) shifted by WLF
transposition using equation constants found by rheology (Ref. TTS-RH1)
R J Crossley 149
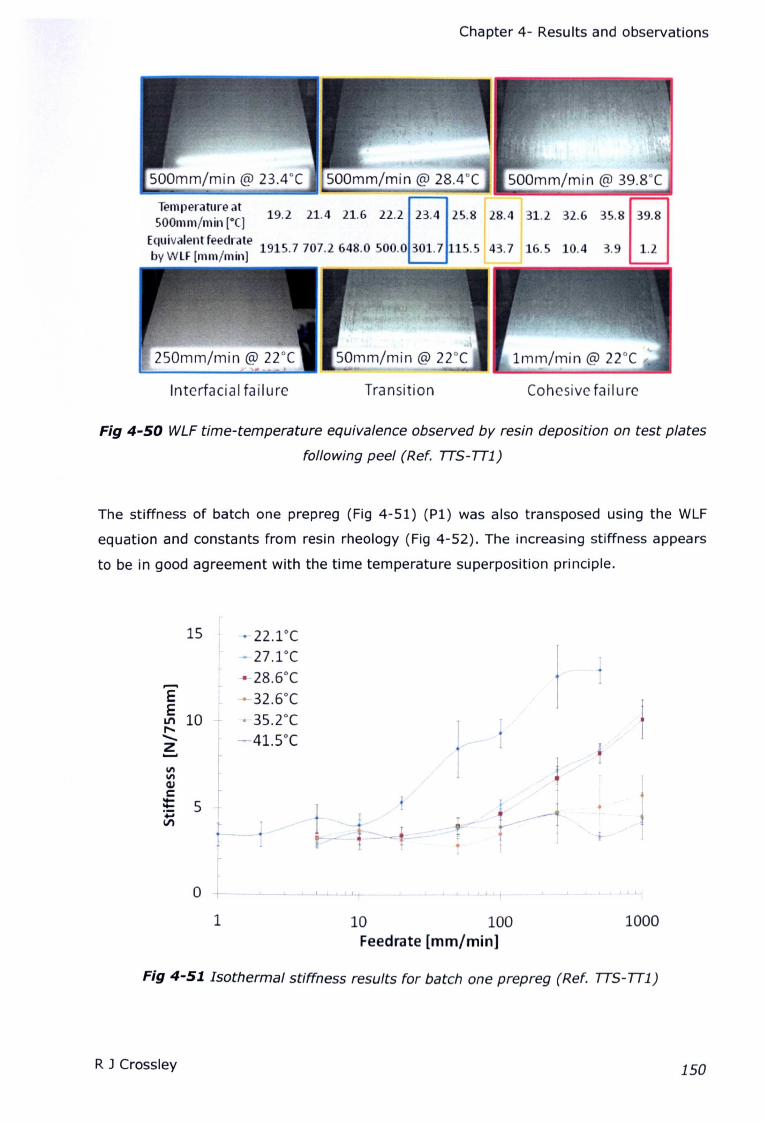
Chapter 4- Results and observations
31.2 32.6 35.8 39.8
I
SOmm/min @ 22°C
Interfacial failure Transition Cohesive failure
Fig 4-50 WLF time-temperature equivalence observed by resin deposition on test plates
following peel (Ref. TTS- TTl)
The stiffness of batch one prepreg (Fig 4-51) (Pl) was also transposed using the WLF
equation and constants from resin rheology (Fig 4-52). The increasing stiffness appears
to be in good agreement with the time temperature superposition principle.
15 .-22.1°C
• 27.1°C
-28.6°C
--32.6°C,.........
E~ 10 Ir--........Z.......
~ 3S.rC
51 ~41.5"C
- -1 f-
j I I Ll
1 10 100Feedrate [mm/min]
1000
Fig 4-51. Isothermal stiffness results for batch one prepreg (Ref. TTS- TTl)
R J Crossley 150
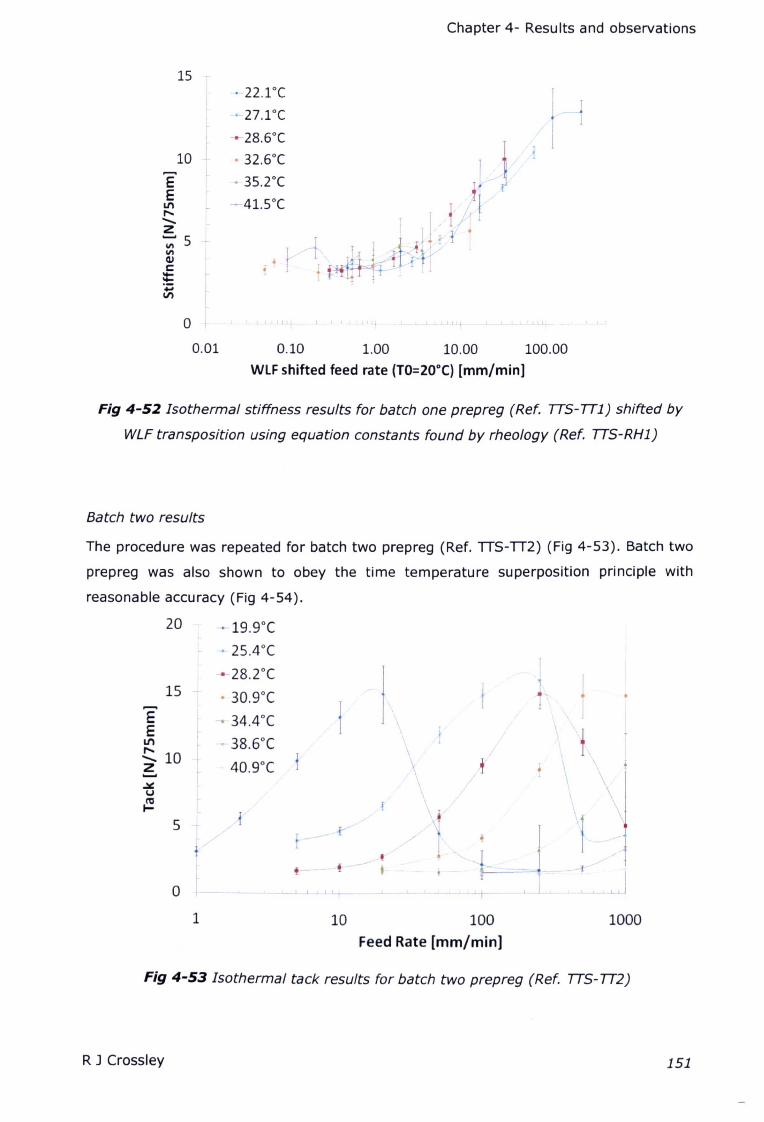
15 -
I
10 [........EELn L......
'"z';'5VI(1J
c:::::.;:In
o 1
~22.rc-~27.1 °C
--e-28.6°C
• 32.6°C
-ss.z:c~41.5°C
t.! I ~j
0.01
Chapter 4- Results and observations
j - -I
Tr /11
• J J/t~{ 1: t"¥H-t~t- t· ."
" j ,J l l J, I
0.10 10.00 100.001.00
WLF shifted feed rate (TO=20oq [mm/minJ
~ 34.4°(
. 38.6°(
40.9°(
Fig 4-52 Isothermal stiffness results for batch one prepreg (Ref. TTS-TTl) shifted by
WLF transposition using equation constants found by rheology (Ref. TTS-RH1)
j j
The procedure was repeated for batch two prepreg (Ref. TTS-TT2) (Fig 4-53). Batch two
prepreg was also shown to obey the time temperature superposition principle with
reasonable accuracy (Fig 4-54).
20 . 19.9°(
- 25.4°(
---28.2°(
• 30.9°(
Batch two results
15.......EEIn
!::: 10z.......~u{2
5
t0 t
1
\ '. 'f\ \
\ \
! 11 ~L-=--- -- - ! 1
~; J I I < -L L
\
..i J J. 1 L ..
10 1000100
Feed Rate [mm/min]
Fig 4-53 Isothermal tack results for batch two prepreg (Ref. TTS-TT2)
RJ Crossley 151
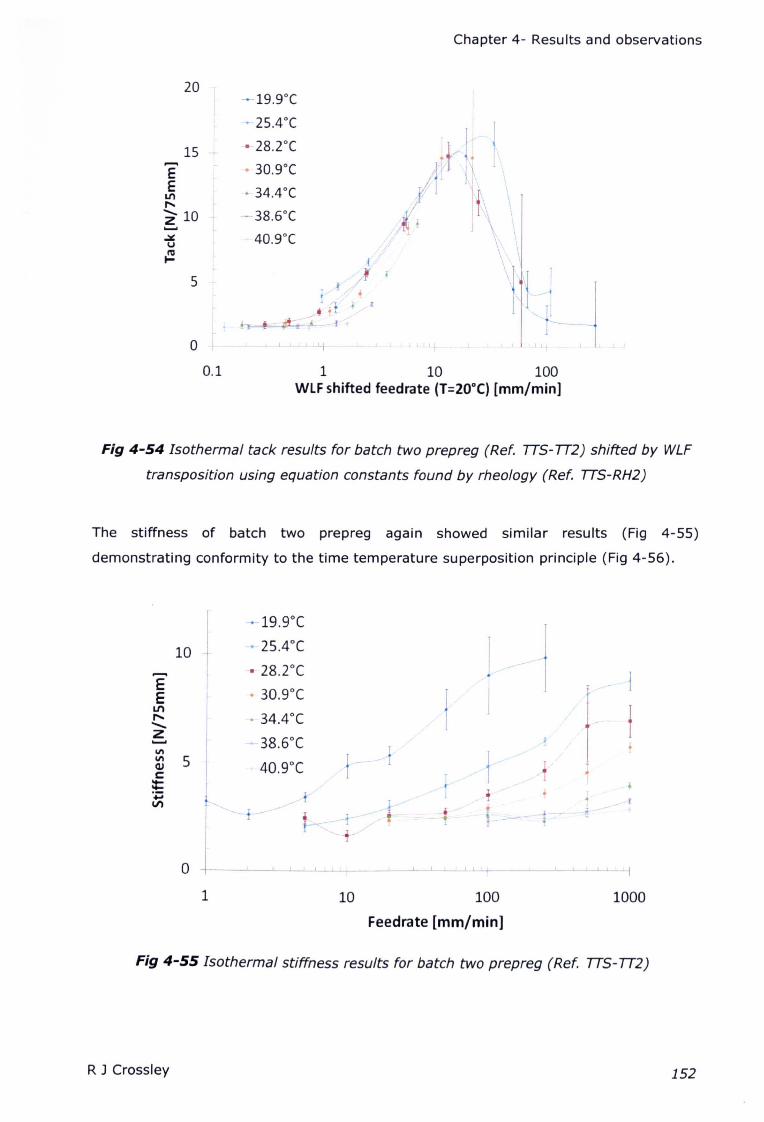
Chapter 4- Results and observations
20~19.9°C
- 2S.4°C
15 -rt--28.2°C
...... • 30.9°CEE • 34.4 °Can
"~ 10 - -38.6°C.......
'"" 40.9°Cu{J. r
5 j( .-1 I",, n ! I
-' ., i~' _L_. i
o .1. 1. _l J.1 ---Lj
0.1 1 10 100WLF shifted feedrate (T=20oq [mm/min]
Fig 4-54 Isothermal tack results for batch two prepreg (Ref. TTS-TT2) shifted by WLF
transposition using equation constants found by rheology (Ref. TTS-RH2)
The stiffness of batch two prepreg again showed similar results (Fig 4-55)
demonstrating conformity to the time temperature superposition principle (Fig 4-56).
-+-19.9°C
10 • 2S.4°C
....... • 28.rc IE• 30.9°C
!E
LIl
t" • 34.4°("'-z
---38.6°C {III !- tIII 5 ;!Cl) 40.9°Cc +:::.~ ~ f"
, •LIl <,
i f..r
- t- i _1 ;> ,f~. + _, ; -e
'- ,~0
1 10 100 1000
Feedrate [mm/min]
Fig 4-55 Isothermal stiffness results for batch two prepreg (Ref. TTS-TT2)
R J Crossley 152
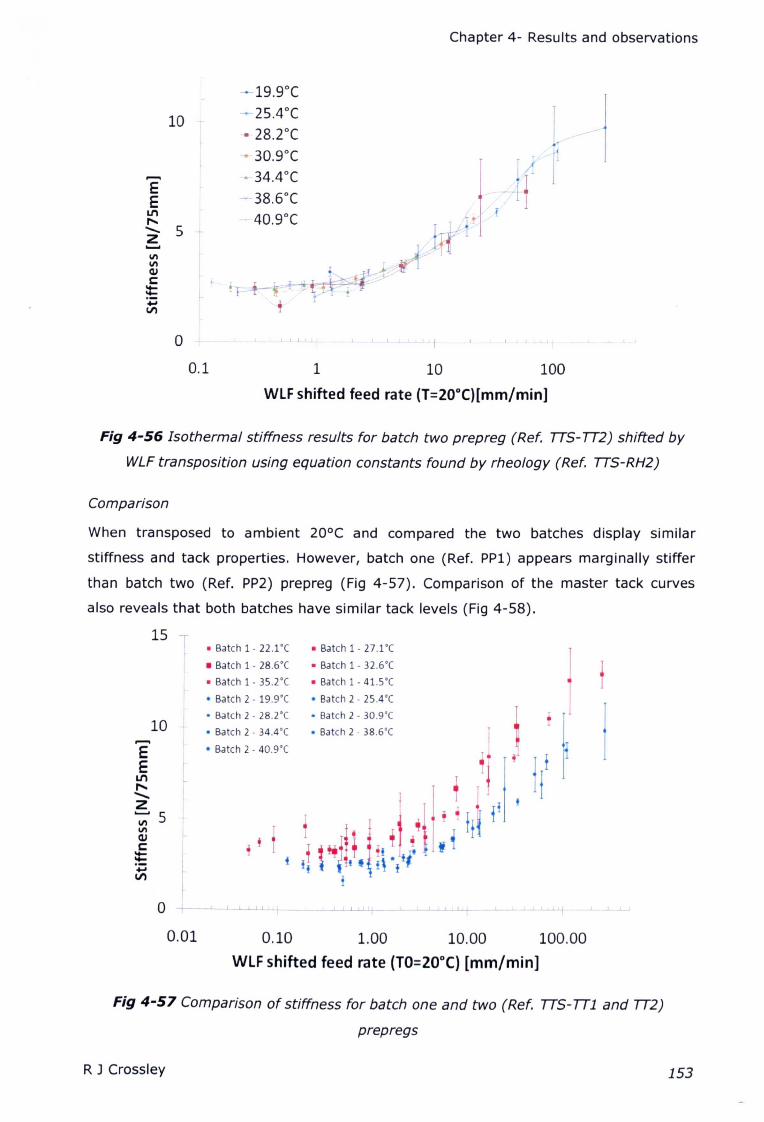
Chapter 4- Results and observations
~19.9°e
- 110
~25.4°e--tI 28.2°e-. 30.goe
,~
1...... • 34.4°eE
-38.6°eEL1'I 40.goe ,r+ !fi!r-..
......... 5 -+-z......1/11/1QJ ~~ • !I~f-,.f '::t~ L+i ;VI
0 I j I J I Li- l 1 .t ~ I I t I I j L j It
0.1 1 10 100
WLF shifted feed rate (T=20°C)[mm/min]
Fig 4-56 Isothermal stiffness results for batch two prepreg (Ref. TTS- TT2) shifted by
WLF transposition using equation constants found by rheology (Ref. TTS-RH2)
Comparison
When transposed to ambient 20°C and compared the two batches display similar
stiffness and tack properties. However, batch one (Ref. PP!) appears marginally stiffer
than batch two (Ref. PP2) prepreg (Fig 4-57). Comparison of the master tack curves
also reveals that both batches have similar tack levels (Fig 4-58).
15 T • Batch 1 - 22.1°( • Batch 1- 27.1°(
l • Batch 1 - 28.6°( • Batch 1 - 32.6°(
tI • Batch 1 - 3S.2°( • Batch 1- 41.S0(
f • Batch 2 - 19.9°( • Batch 2 - 2S.4°(
-+• Batch 2 - 28.2°( • Batch 2 - 30.9°(
1/ j j II r10 • Batch 2 - 34.4°( • Batch 2 - 38.6°(,......, fE • Batch 2 - 40.9°(
E lL1'Ir-.. I j f i I I.........z
! ' "!f il...... 51/1
! · ,It '*~.+.k,.;1 ¥!1/1QJ
!~~~.;;VI i
0 ' -----'---_~ ___L.L.L.L.L.l.j------'. .LJ..j-- --'- ~ J_ _J
0.01 0.10 1.00 10.00 100.00
WLF shifted feed rate (TO=20°C) [mm/min]
Fig 4-57 Comparison of stiffness for batch one and two (Ref. TTS- TTl and TT2)
prep regs
RJ Crossley 153
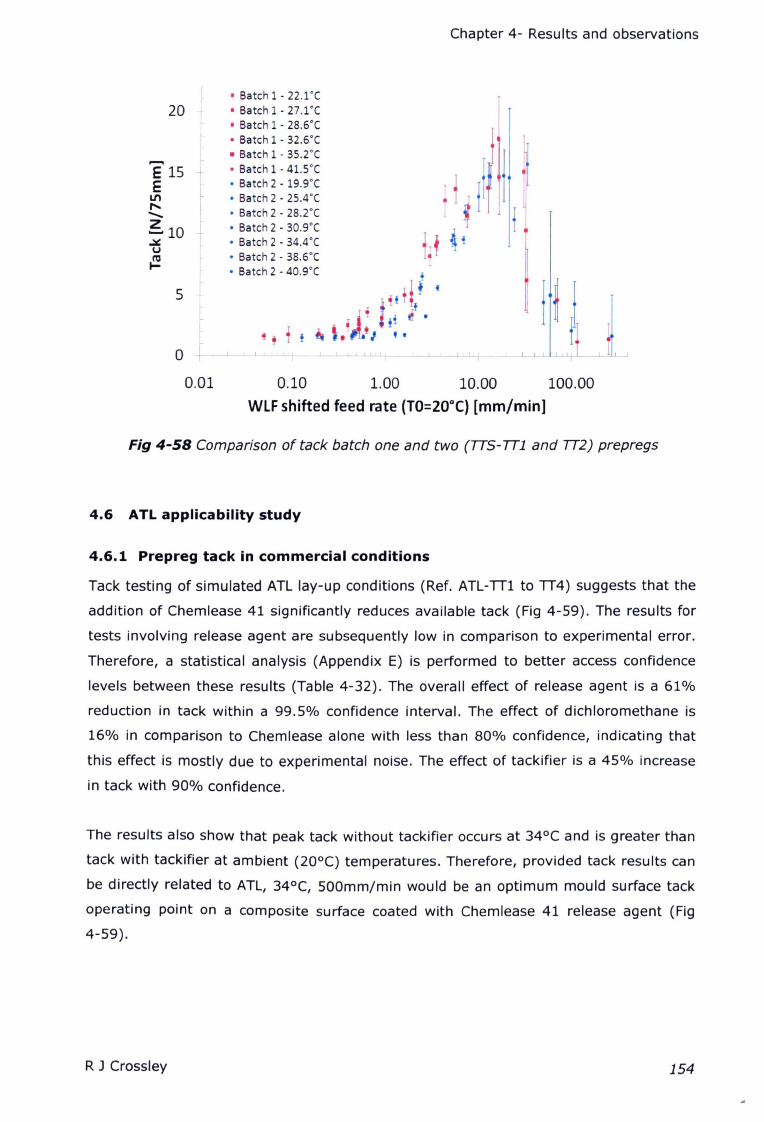
Chapter 4- Results and observations
......E 15E
11'1,..."~10~u{J.
~ • Batch 1 - 22.1·C
20 I ·Batchl-27.1·C• Batch 1 - 28.6·C
• Batch 2 - 25.4·C• Batch 2 - 28.2°C
t . Batch 2 - 30.9·C
• Batch 2 - 34.4°C id ~fr . Batch 2 - 38.6·C I[ • Batch 2 - 40.9·C t
5 t !!.II,1 • jll.lo L~-i-'!_t....1.__Lt '-L".LJ.V--,-,-J4h_: • '. ~L --'--'-LL~J...U.t-Lf_,__L
0.01 0.10 1.00 10.00 100.00
WLF shifted feed rate (TO=20 oq [mm/min]
Fig 4-58 Comparison of tack batch one and two (TTS- TTl and TT2) prepregs
4.6 ATL applicability study
4.6.1 Prepreg tack in commercial conditions
Tack testing of simulated ATL lay-up conditions (Ref. ATL-TT1 to TT4) suggests that the
addition of Chemlease 41 significantly reduces available tack (Fig 4-59). The results for
tests involving release agent are subsequently low in comparison to experimental error.
Therefore, a statistical analysis (Appendix E) is performed to better access confidence
levels between these results (Table 4-32). The overall effect of release agent is a 61%
reduction in tack within a 99.5% confidence interval. The effect of dichloromethane is
16% in comparison to Chemlease alone with less than 80% confidence, indicating that
this effect is mostly due to experimental noise. The effect of tackifier is a 45% increase
in tack with 90% confidence.
The results also show that peak tack without tackifier occurs at 34°C and is greater than
tack with tackifier at ambient (20°C) temperatures. Therefore, provided tack results can
be directly related to ATL, 34°C, 500mm/min would be an optimum mould surface tack
operating point on a composite surface coated with Chemlease 41 release agent (Fig
4-59).
R J Crossley 154
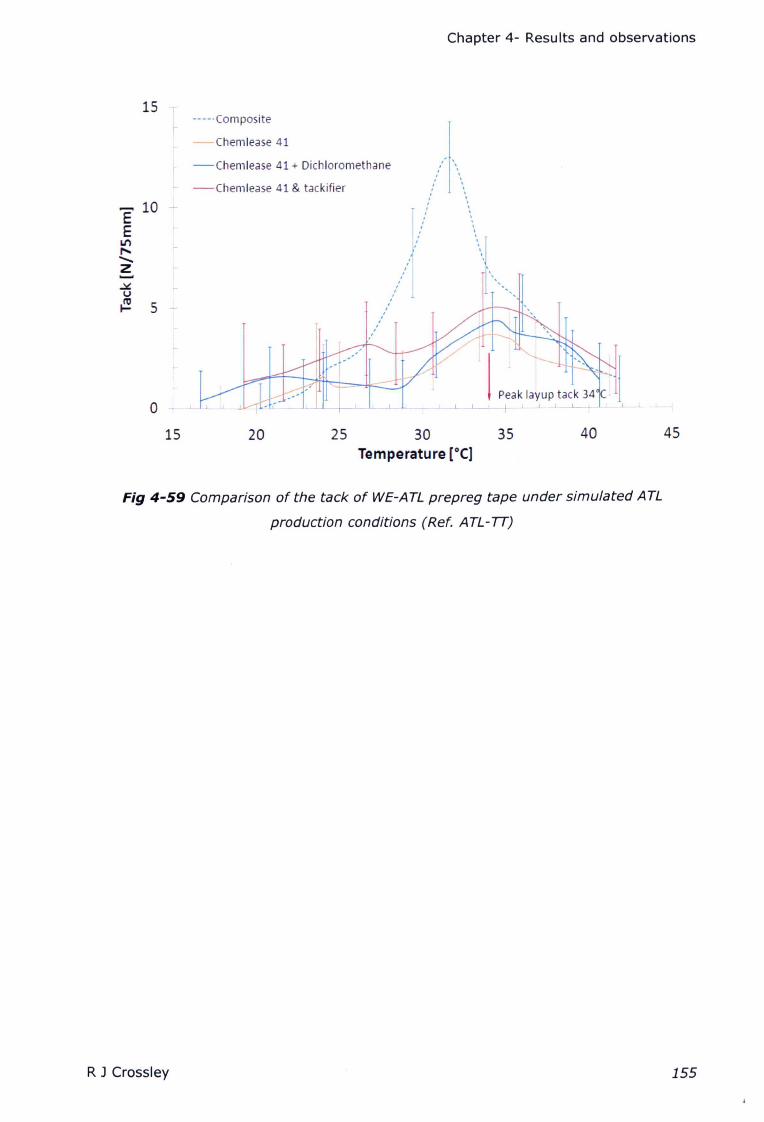
Chapter 4- Results and observations
15-----Composite
r--Chemlease 41
,,\\
\\.
\
\.\\.\\
\'1------ -,
-Chemlease 41 + Dichloromethane
- -Chemlease 41 & tackifier
......10 ..L-
EE r
a.n
".......Z r
I-
,,,,,,,
r,,,
o
J I 1----'Peak layup tack'~4 -c
.LL._-,---l.L._-t- _j__J_ {__j_ --t----"-..L....J. _J_ +...LL......L._j_ L._,
15 20 25 30Temperature [OC]
35 40 45
Fig 4-59 Comparison of the tack of WE-ATL prepreg tape under simulated ATL
production conditions (Ref. ATL- TT)
R J Crossley 155
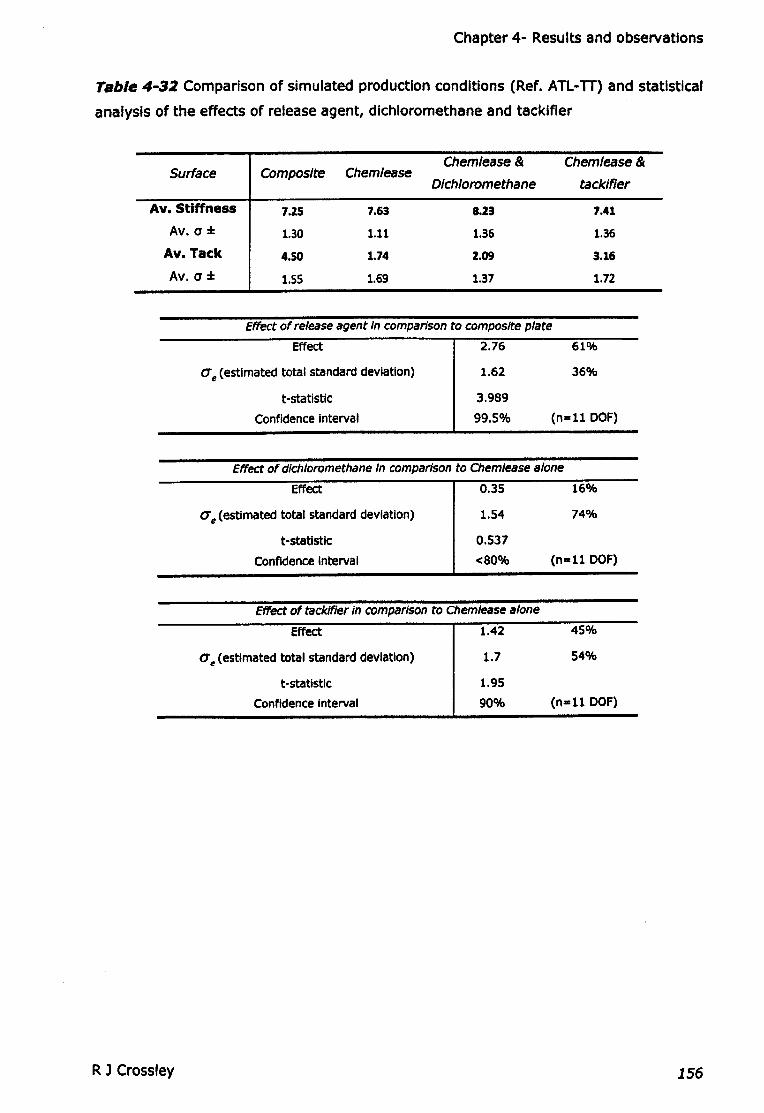
Chapter 4- Results and observations
Table 4-32 Comparison of simulated production conditions (Ref. ATL-TT) and statistical
analysis of the effects of release agent, dlchloromethane and tacklfler
Chemlease& Chemlease&Surface Composite Chemlease
D/chloromethane tack/fier
Av. Stiffness 7.25 7.63 8.23 7.41
Av. a::f:: 1.30 1.11 1.36 1.36
Av.Tack 4.50 1.74 2.09 3.16
Av. a::f:: 1.55 1.69 1.37 1.72
Effect of release agent In comparison to composite plate
Effect 2.76 61%
O'e (estimated total standard deviation)
t-statistic
Confidence Interval
1.62 36%
3.989
99.5% (n=l1 OOF)
Effect of dich/oromethane In comparison to Chem/ease a/one
Effect 0.35 16%
0'e(estimated total standard deviation)
t-statlstlc
Confidence Interval
74%1.54
0.537
<80% (n=l1 DOF)
Effect of tacldfler In comparfson to Chem/ease alone
Effect 1.42 45%
a,(estimated total standard deviation)
t-statlstlc
Confidence Interval
54%1.7
1.95
90% (n=l1 OOF)
R 1 Crossley 156
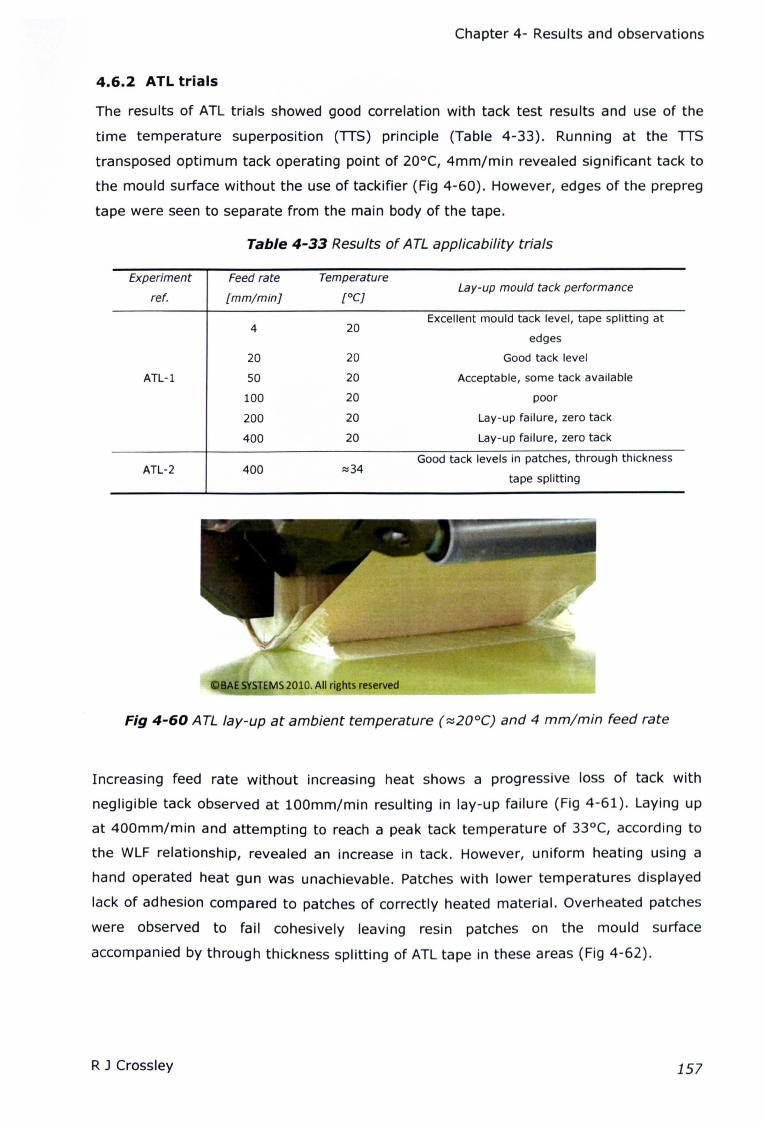
Chapter 4- Results and observations
4.6.2 ATL trials
The results of ATL trials showed good correlation with tack test results and use of the
time temperature superposition (TIS) principle (Table 4-33). Running at the TIS
transposed optimum tack operating point of 20°C, 4mm/min revealed significant tack to
the mould surface without the use of tackifier (Fig 4-60). However, edges of the prepreg
tape were seen to separate from the main body of the tape.
Table 4-33 Results of ATL applicability trials
ATL-1
Feed rate Temperature
[mm/mini [0C]Lay-up mould tack performance
4 20Excellent mould tack level, tape splitting at
edges
20 20 Good tack level
50 20 Acceptable, some tack available
100 20 poor
200 20 Lay-up failure, zero tack
400 20 Lay-up failure, zero tack
Good tack levels in patches, through thickness400 :::l34
tape splitting
Experiment
ref.
ATL-2
o ~ STEMS2010. All rights reserv_e_d _'
Fig 4-60 ATL lay-up at ambient temperature (~20°C) and 4 mm/min feed rate
Increasing feed rate without increasing heat shows a progressive loss of tack with
negligible tack observed at 100mm/min resulting in lay-up failure (Fig 4-61). Laying up
at 400mm/min and attempting to reach a peak tack temperature of 33°C, according to
the WLF relationship, revealed an increase in tack. However, uniform heating using a
hand operated heat gun was unachievable. Patches with lower temperatures displayed
lack of adhesion compared to patches of correctly heated material. Overheated patches
were observed to fail cohesively leaving resin patches on the mould surface
accompanied by through thickness splitting of ATL tape in these areas (Fig 4-62).
R J Crossley 157

Chapter 4- Results and observations
Fig 4-61. ATL lay-up at 200e and 100 mm/min feed rate (Ref. ATL-l)
Cohesive failure
through thickness surface resin layer(residual resin)
©BAE SYSTEMS 2010.
Fig 4-62 ATL lay-up at a non-uniform optimised temperature of 25-45°e and 400
mm/min feed rate (Ref. ATL-2)
R J Crossley158
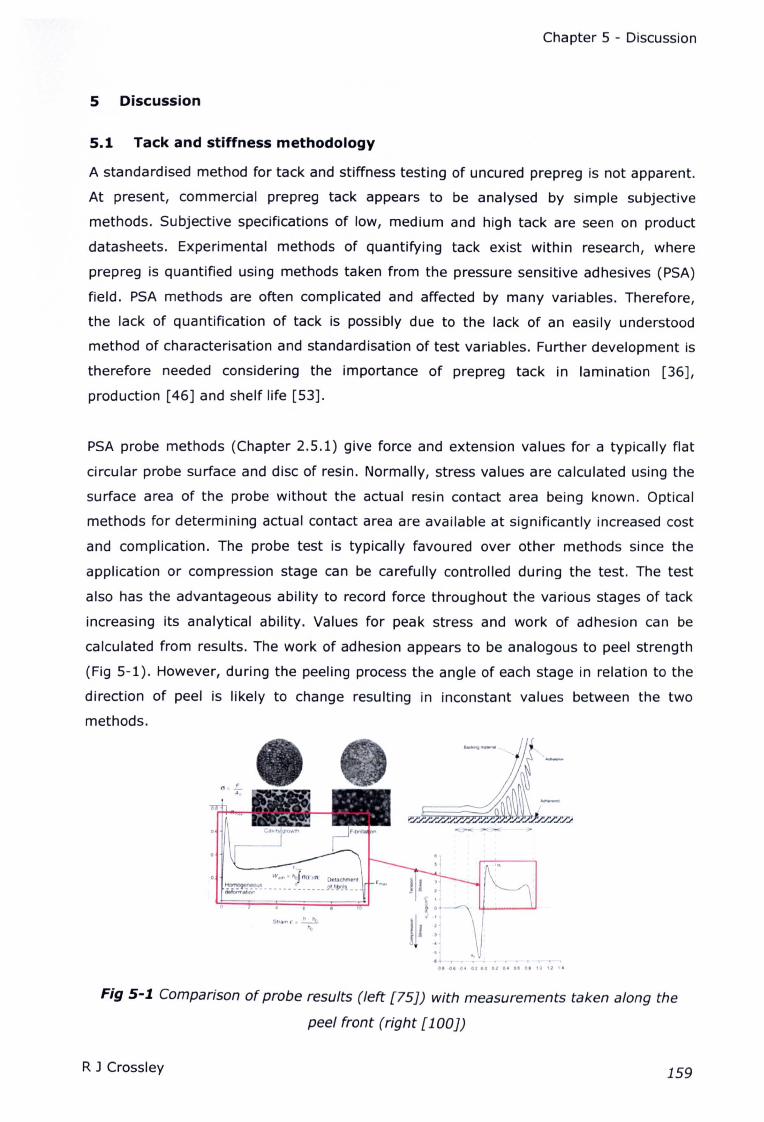
Chapter 5 - Discussion
5 Discussion
5.1 Tack and stiffness methodology
A standardised method for tack and stiffness testing of uncured prepreg is not apparent.
At present, commercial prepreg tack appears to be analysed by simple subjective
methods. Subjective specifications of low, medium and high tack are seen on product
datasheets. Experimental methods of quantifying tack exist within research, where
prepreg is quantified using methods taken from the pressure sensitive adhesives (PSA)
field. PSA methods are often complicated and affected by many variables. Therefore,
the lack of quantification of tack is possibly due to the lack of an easily understood
method of characterisation and standardisation of test variables. Further development is
therefore needed considering the importance of prepreg tack in lamination [36],
production [46] and shelf life [53].
PSA probe methods (Chapter 2.5.1) give force and extension values for a typically flat
circular probe surface and disc of resin. Normally, stress values are calculated using the
surface area of the probe without the actual resin contact area being known. Optical
methods for determining actual contact area are available at significantly increased cost
and complication. The probe test is typically favoured over other methods since the
application or compression stage can be carefully controlled during the test. The test
also has the advantageous ability to record force throughout the various stages of tack
increasing its analytical ability. Values for peak stress and work of adhesion can be
calculated from results. The work of adhesion appears to be analogous to peel strength
(Fig 5-1). However, during the peeling process the angle of each stage in relation to the
direction of peel is likely to change resulting in inconstant values between the two
methods.
I • I , , • I .,
U 01 04 0100 OJ 04 ot 01 10,2 I.
Fig 5-1. Comparison of probe results (left [75]) with measurements taken along the
peel front (right [lOO))
R J Crossley 159

Chapter 5 - Discussion
Probe results may be complicated due to phenomenon such as cavitation and fibrillation,
thought to be effected by vacuum pressure and surface irregularities. The effects of
these complications are likely to be increased by surface patterns of fibres in prepreg
[83]. The probe method also appears to be Significantly affected by alignment issues
[158].
The peel test was favoured in this study mostly for its similarity to the ATL process.
However, the peel test Is considered inferior to probe testing as an analytical tool due to
an inability to:-
• control application conditions
• analyse individual stages of separation
• separate the effects of peel from bending stiffness
The newly designed peel method allows control of application conditions and has the
ability to isolate peel and bending stiffness effects. A single value for peel resistance,
considered analogous to work of adhesion in probe testing (Fig 5-1), was considered
acceptable since this study sought to compare the tack of materials rather than study
the tack mechanism.
The new peel method also allowed the investigation of a number of variables which are
found within the ATL process (Table 3-3). In addition to these variables humidity Is
believed to effect tack and the aging of prepreg materials [159]. An environmental
chamber was unavailable to control humidity and quantify its effect. The humidity was
found to change 15-80% R.H. depending on weather conditions. Therefore, tests for
establishing the effects of variables were carried out within the shortest time period
possible limiting full factorial experiments. Comparisons between variable Investigations
are therefore made with caution.
The level of repeatability was found to be good. Low rig friction was recorded >0.7N and
variability in rolling tests of thin films was less than 0.3N. The higher variability found in
tack testing was attributed to the material Itself and the nature of the peeling process.
Variability could be reduced somewhat by stringent handling and cleaning methods
(Chapter 3.3.4). However, variability was found to Increase when approaching the
interfacial failure domain and is believed to be an Inherent property of the InterfaCial
peeling process through the storage and sudden release of elastic energy. Overall,
results were comparable to perceived tack levels and the repeatability was considered
acceptable for materials characterisation.
R J Crossley 160
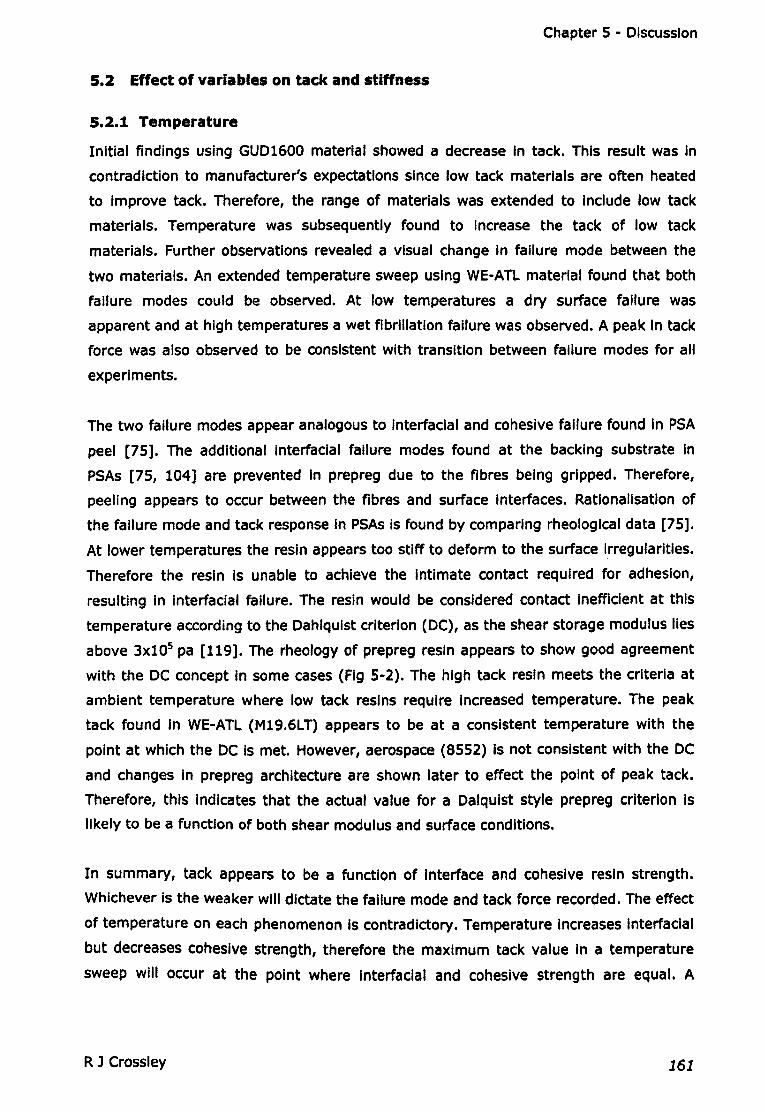
Chapter 5 - Discussion
5.2 Effect of variables on tack and stiffness
5.2.1 Temperature
Initial findings using GUD1600 material showed a decrease In tack. This result was In
contradiction to manufacturer's expectations since low tack materials are often heated
to Improve tack. Therefore, the range of materials was extended to Include low tack
materials. Temperature was subsequently found to Increase the tack of low tack
materials. Further observations revealed a visual change In failure mode between the
two materials. An extended temperature sweep using WE-ATL material found that both
failure modes could be observed. At low temperatures a dry surface failure was
apparent and at high temperatures a wet fibrillation failure was observed. A peak in tack
force was also observed to be consistent with transition between failure modes for all
experiments.
The two failure modes appear analogous to interfacial and cohesive failure found in PSA
peel [75]. The additional interfacial failure modes found at the backing substrate in
PSAs [75, 104] are prevented In prepreg due to the fibres being gripped. Therefore,
peeling appears to occur between the fibres and surface Interfaces. Rationalisation of
the failure mode and tack response in PSAs Is found by comparing rheological data [75].
At lower temperatures the resin appears too stiff to deform to the surface Irregularities.
Therefore the resin is unable to achieve the Intimate contact required for adhesion,
resulting in Interfacial failure. The resin would be considered contact inefficient at this
temperature according to the Dahlquist criterion (DC), as the shear storage modulus lies
above 3x10s pa [119]. The rheology of prepreg resin appears to show good agreement
with the DC concept in some cases (Fig 5-2). The high tack resin meets the criteria at
ambient temperature where low tack resins require Increased temperature. The peak
tack found In WE-ATL (M19.6LT) appears to be at a consistent temperature with the
point at which the DC Is met. However, aerospace (8552) Is not consistent with the DC
and changes in prepreg architecture are shown later to effect the point of peak tack.
Therefore, this indicates that the actual value for a Dalqulst style prepreg criterion Is
likely to be a function of both shear modulus and surface conditions.
In summary, tack appears to be a function of Interface and cohesive resin strength.
Whichever Is the weaker will dictate the failure mode and tack force recorded. The effect
of temperature on each phenomenon Is contradictory. Temperature Increases Interfacial
but decreases cohesive strength, therefore the maximum tack value In a temperature
sweep will occur at the point where Interfacial and cohesive strength are equal. A
R J Crossley 161
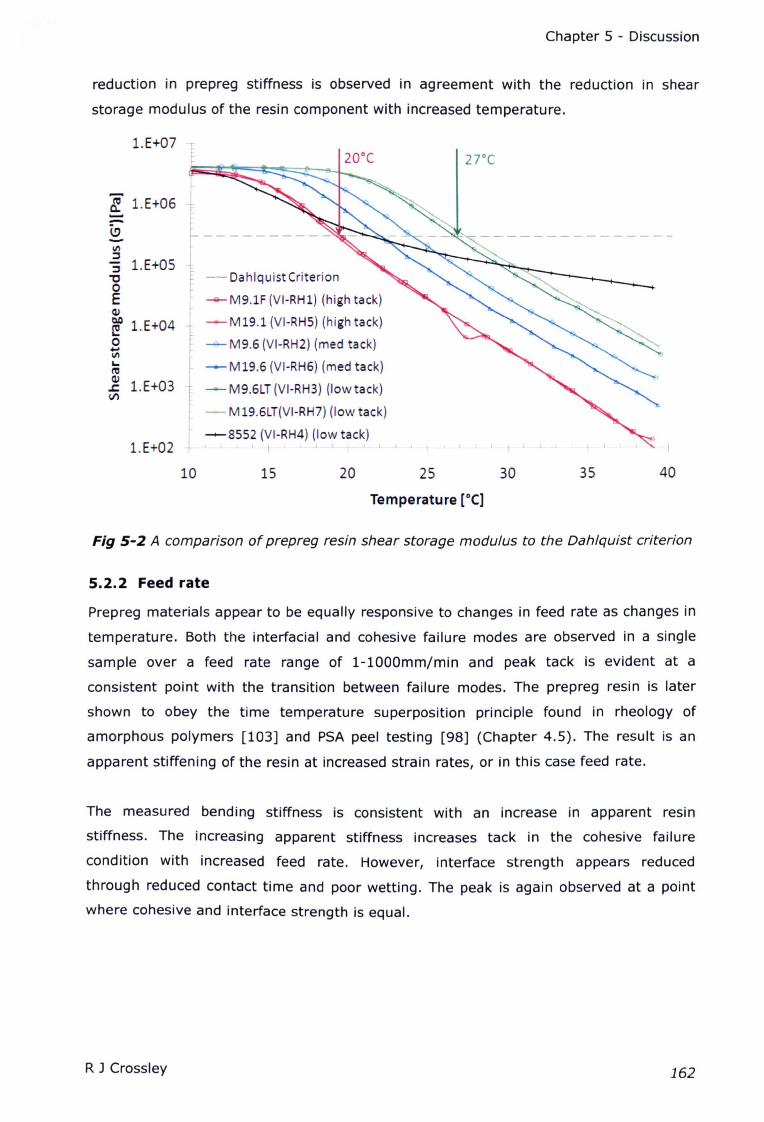
Chapter 5 - Discussion
reduction in prepreg stiffness is observed in agreement with the reduction in shear
storage modulus of the resin component with increased temperature.
l.E+07
"i. 1.E+06---VI:::J:::J l.E+05'0oEQ)
& l.E+04otil-re~ l.E+03II)
l.E+02
-- Dahlquist Criterion
-- M9.1F (VI-RH1) (high tack)
--M19.1 (VI-RH5) (high tack)
-A- M9.6 (VI-RH2) (med tack)
--M19.6 (VI-RH6) (med tack)
-- M9.6LT (VI-RH3) (low tack)
- M 19.6LT(VI-RH7) (Iow tack)
---8552 (VI-RH4) (low tack)1 I t J. J
, ,l I L t L I
10 15 20 4025
Temperature [0C]
30 35
Fig 5-2 A comparison of prepreg resin shear storage modulus to the Dahlquist criterion
5.2.2 Feed rate
Prepreg materials appear to be equally responsive to changes in feed rate as changes in
temperature. Both the interfacial and cohesive failure modes are observed in a single
sample over a feed rate range of 1-1000mm/min and peak tack is evident at a
consistent point with the transition between failure modes. The prepreg resin is later
shown to obey the time temperature superposition principle found in rheology of
amorphous polymers [103] and PSA peel testing [98] (Chapter 4.5). The result is an
apparent stiffening of the resin at increased strain rates, or in this case feed rate.
The measured bending stiffness is consistent with an increase in apparent resin
stiffness. The increasing apparent stiffness increases tack in the cohesive failure
condition with increased feed rate. However, interface strength appears reduced
through reduced contact time and poor wetting. The peak is again observed at a point
where cohesive and interface strength is equal.
R J Crossley 162
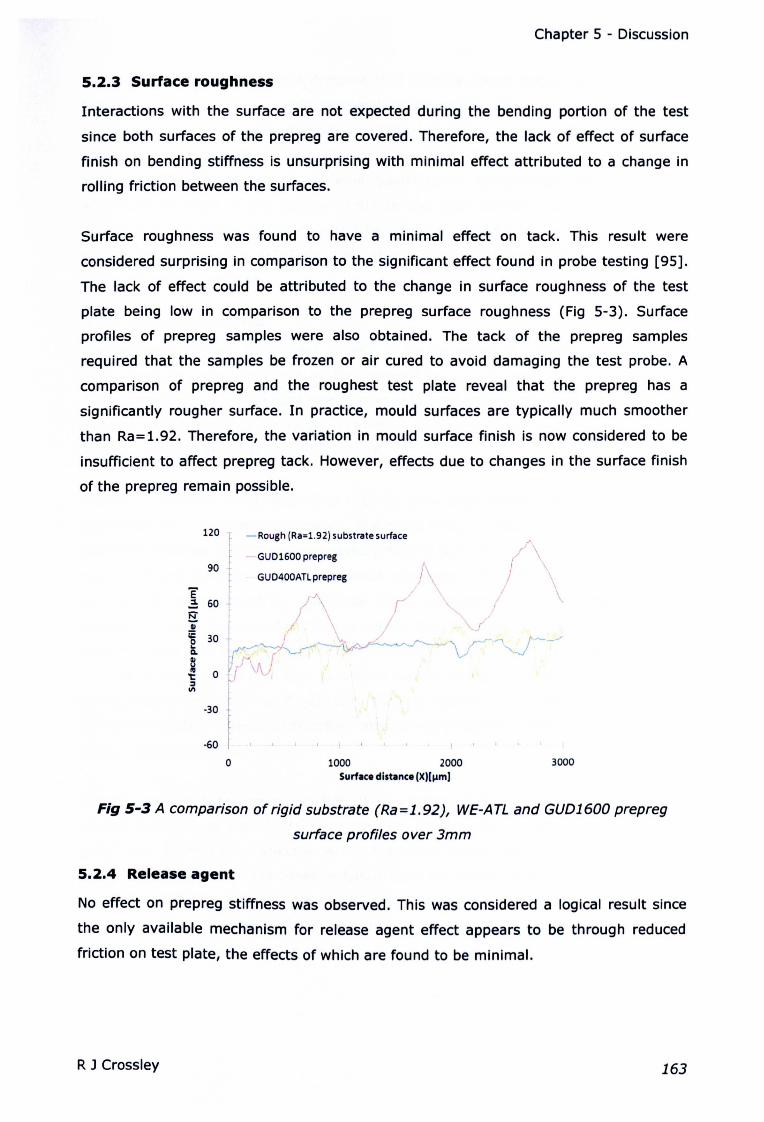
Chapter 5 - Discussion
5.2.3 Surface roughness
Interactions with the surface are not expected during the bending portion of the test
since both surfaces of the prepreg are covered. Therefore, the lack of effect of surface
finish on bending stiffness is unsurprising with minimal effect attributed to a change in
rolling friction between the surfaces.
Surface roughness was found to have a minimal effect on tack. This result were
considered surprising in comparison to the significant effect found in probe testing [95].
The lack of effect could be attributed to the change in surface roughness of the test
plate being low in comparison to the prepreg surface roughness (Fig 5-3). Surface
profiles of prepreg samples were also obtained. The tack of the prepreg samples
required that the samples be frozen or air cured to avoid damaging the test probe. A
comparison of prepreg and the roughest test plate reveal that the prepreg has a
significantly rougher surface. In practice, mould surfaces are typically much smoother
than Ra=1.92. Therefore, the variation in mould surface finish is now considered to be
insufficient to affect prepreg tack. However, effects due to changes in the surface finish
of the prepreg remain possible.
120 I-ROUgh (Ra=1.92) substrate surface
-GUD1600 prepreg (.\.
90 )1\GUD400ATLprepreg / \
~ 60 I r/ \~f / \
~ 30 1 I J"\ r:" ~ t----J
~ ~~~~ V '.-J~ oif'vJ
~ -30 1-60 r
o 1000 2000 3000
Surface distance (XHl'mJ
Fig 5-3 A comparison of rigid substrate (Ra=1.92), WE-ATL and GUD1600 prepreg
surface profiles over 3mm
5.2.4 Release agent
No effect on prepreg stiffness was observed. This was considered a logical result since
the only available mechanism for release agent effect appears to be through reduced
friction on test plate, the effects of which are found to be minimal.
RJ Crossley 163
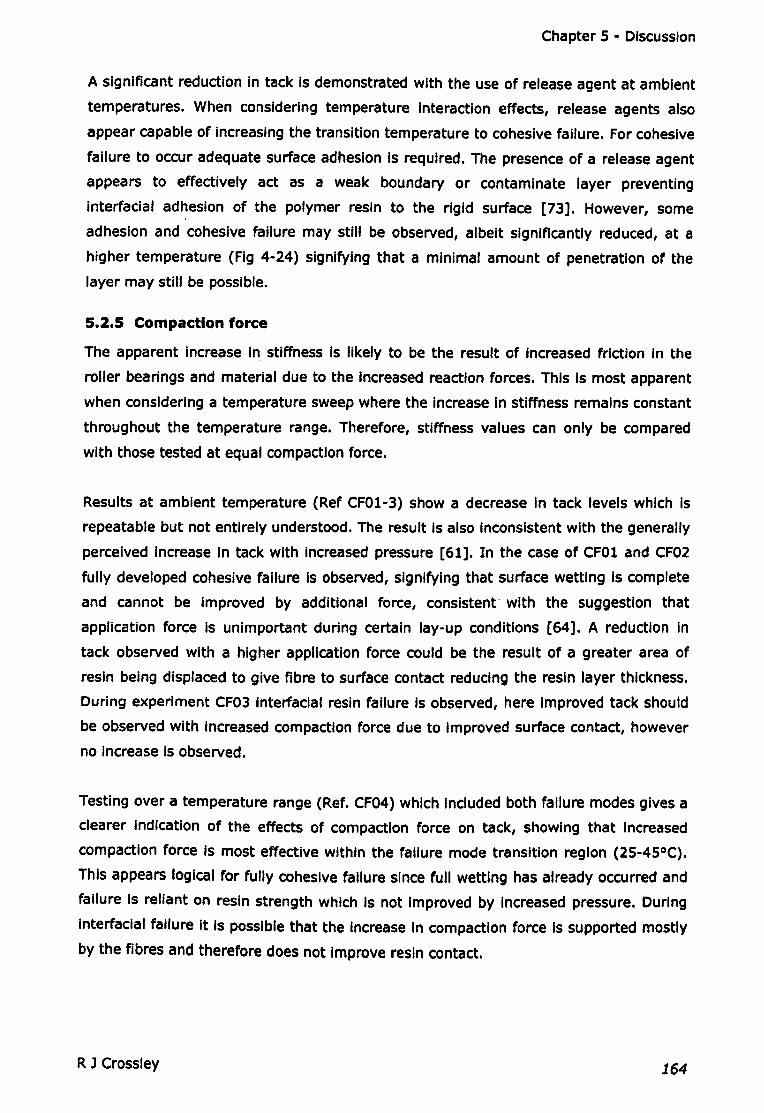
Chapter 5 - Discussion
A significant reduction in tack Is demonstrated with the use of release agent at ambient
temperatures. When considering temperature interaction effects, release agents also
appear capable of Increasing the transition temperature to cohesive failure. For cohesive
failure to occur adequate surface adhesion is required. The presence of a release agent
appears to effectively act as a weak boundary or contaminate layer preventing
Interfacial adhesion of the polymer resin to the rigid surface [73]. However, some
adhesion and cohesive failure may stili be observed, albeit Significantly reduced, at a
higher temperature (Fig 4-24) signifying that a minimal amount of penetration of the
layer may still be possible.
5.2.5 Compaction force
The apparent Increase In stiffness Is likely to be the result of increased friction in the
roller bearings and material due to the increased reaction forces. This Is most apparent
when considering a temperature sweep where the Increase in stiffness remains constant
throughout the temperature range. Therefore, stiffness values can only be compared
with those tested at equal compaction force.
Results at ambient temperature (Ref CFOl-3) show a decrease In tack levels which is
repeatable but not entirely understood. The result is also inconsistent with the generally
perceived increase In tack with increased pressure [61]. In the case of CF01 and CF02
fully developed cohesive failure Is observed, signifying that surface wetting is complete
and cannot be improved by additional force, consistent' with the suggestion that
application force is unimportant during certain lay-up conditions [64]. A reduction in
tack observed with a higher application force could be the result of a greater area of
resin being displaced to give fibre to surface contact reducing the resin layer thickness.
During experiment CF03 interfacial resin failure Is observed, here improved tack should
be observed with Increased compaction force due to Improved surface contact, however
no Increase is observed.
Testing over a temperature range (Ref. CF04) which included both failure modes gives a
clearer Indication of the effects of compaction force on tack, showing that Increased
compaction force is most effective within the failure mode transition region (2S-4S°C).
This appears logical for fully cohesive failure since full wetting has already occurred and
failure is reliant on resin strength which Is not improved by Increased pressure. During
interfacial failure it Is possible that the increase in compaction force is supported mostly
by the fibres and therefore does not improve resin contact.
R J Crossley 164
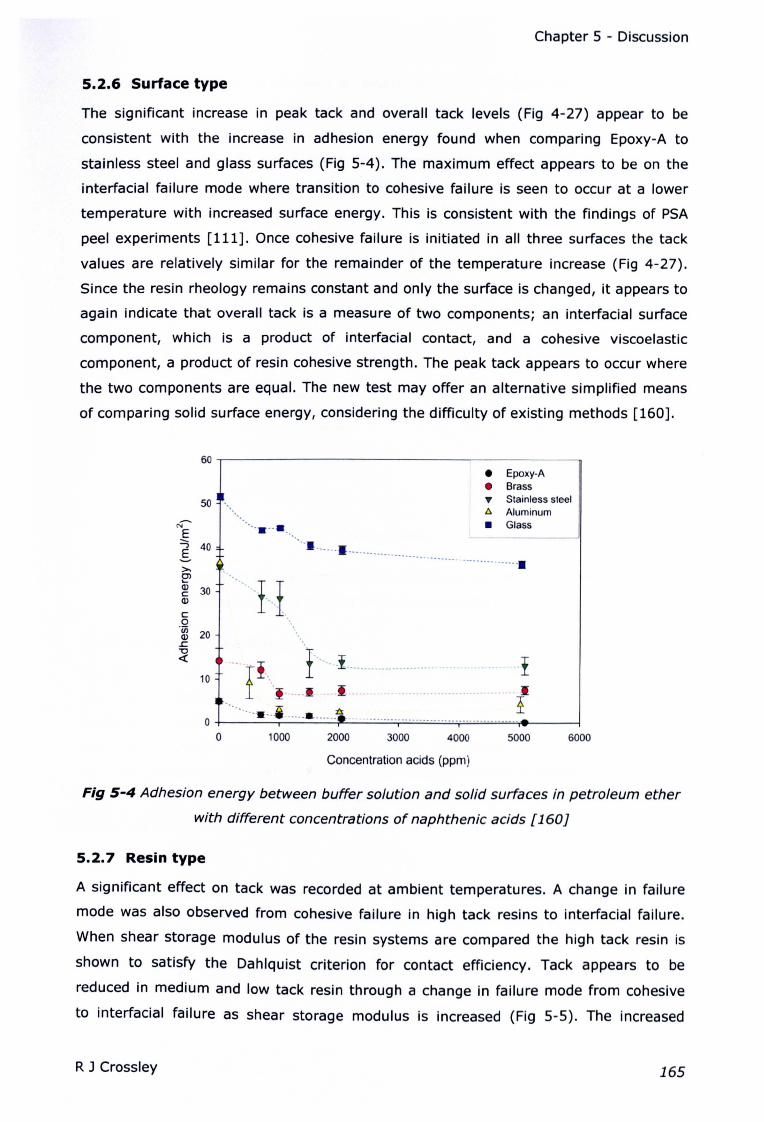
Chapter 5 - Discussion
5.2.6 Surface type
The significant increase in peak tack and overall tack levels (Fig 4-27) appear to be
consistent with the increase in adhesion energy found when comparing Epoxy-A to
stainless steel and glass surfaces (Fig 5-4). The maximum effect appears to be on the
interfacial failure mode where transition to cohesive failure is seen to occur at a lower
temperature with increased surface energy. This is consistent with the findings of PSA
peel experiments [111]. Once cohesive failure is initiated in all three surfaces the tack
values are relatively similar for the remainder of the temperature increase (Fig 4-27).
Since the resin rheology remains constant and only the surface is changed, it appears to
again indicate that overall tack is a measure of two components; an interfacial surface
component, which is a product of interfacial contact, and a cohesive viscoelastic
component, a product of resin cohesive strength. The peak tack appears to occur where
the two components are equal. The new test may offer an alternative simplified means
of comparing solid surface energy, considering the difficulty of existing methods [160].
50 ~"'"
60~--------------------------~------------,
I • Epoxy-A• Brass
I T Stainless steel/),. Aluminum• Glass......• .
>-
:
3011\.~ 20~
~ • '-"! 1"'-' i _.!10 I""'1' ...I .'~.'.-.'.'.'.'.".".-.-'_'.-.-.'.-.'.':'~.'~............. I
I~.........:o: 1o ···.j ··• ··..·1 -.
o 1000 2000 3000 4000 5000
...........................................................
~N
E:::; 40E-
6000
Concentration acids (ppm)
Fig 5-4 Adhesion energy between buffer solution and solid surfaces in petroleum ether
with different concentrations of naphthenic acids [160]
5.2.7 Resin type
A significant effect on tack was recorded at ambient temperatures. A change in failure
mode was also observed from cohesive failure in high tack resins to interfacial failure.
When shear storage modulus of the resin systems are compared the high tack resin is
shown to satisfy the Dahlquist criterion for contact efficiency. Tack appears to be
reduced in medium and low tack resin through a change in failure mode from cohesive
to interfacial failure as shear storage modulus is increased (Fig 5-5). The increased
RJ Crossley 165
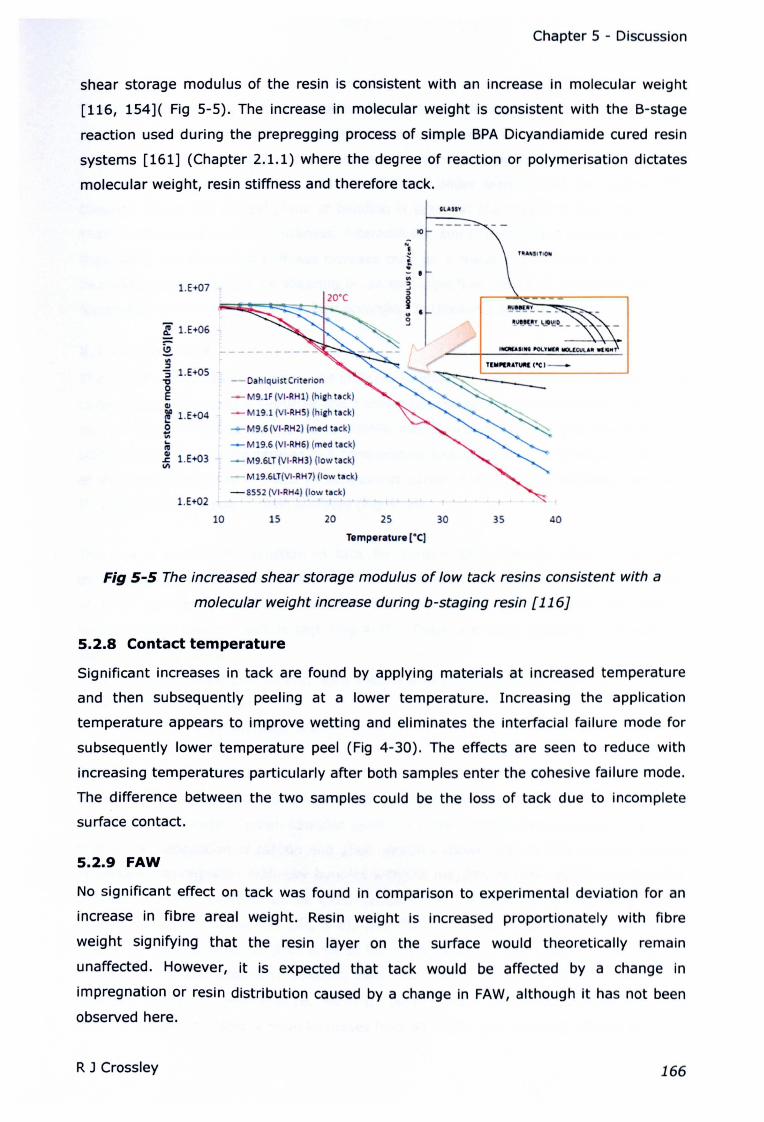
Chapter 5 - Discussion
shear storage modulus of the resin is consistent with an increase in molecular weight
[116, 154]( Fig 5-5). The increase in molecular weight is consistent with the B-stage
reaction used during the prepregging process of simple BPA Dicyandiamide cured resin
systems [161] (Chapter 2.1.1) where the degree of reaction or polymerisation dictates
molecular weight, resin stiffness and therefore tack.
4LAUY
NI1'ItAN,ITI()tII~
:.~ ...
1.Et07 ".J~.. ,
'i 1.E+069
~III::l"5 1.EtOS
-- Dahlquist Criterion"0E ~ M9.1F (VI·RH1) (hillh tack)CII
~ 1.Et04 ~M19.1 (VI·RHS) (hiih tack)
0 _"_M9.6(VI·RH2) (med tack)...III... -M19.6 (VI·RH6) (med tack)tV
~ 1.E+03 ~ M9.6LT (VI·RH3) (tow tack)11'1
-M 19.6lT(VI·RH7) (Iow tack)
-8552 (VI.RH<1) (low tack)l.Et02
10 15 20 25 30 35 40
Temperature (·C)
Fig 5-5 The increased shear storage modulus of low tack resins consistent with a
molecular weight increase during b-staging resin [116J
5.2.8 Contact temperature
Significant increases in tack are found by applying materials at increased temperature
and then subsequently peeling at a lower temperature. Increasing the application
temperature appears to improve wetting and eliminates the interfacial failure mode for
subsequently lower temperature peel (Fig 4-30). The effects are seen to reduce with
increasing temperatures particularly after both samples enter the cohesive failure mode.
The difference between the two samples could be the loss of tack due to Incomplete
surface contact.
5.2.9 FAW
No significant effect on tack was found in comparison to experimental deviation for an
increase in fibre areal weight. Resin weight is increased proportionately with fibre
weight signifying that the resin layer on the surface would theoretically remain
unaffected. However, it is expected that tack would be affected by a change in
impregnation or resin distribution caused by a change in FAW, although it has not been
observed here.
R J Crossley 166
Chapter 5 - Discussion
There appears to be a linear relationship between Increasing FAW and Increasing
stiffness. This relationship is not consistent with basic beam bending principles where a
cubed Increase In stiffness would be expected with Increased thickness. However, the
behaviour would be consistent with a membrane under tension and the parallel axis
theorem where the central plane of bending Is taken at the centre of the roller rather
than the centre of material thickness. Alternatively, since the problem Is dynamic rather
than static the measured stiffness Increase may be a result of Increased roller friction,
Increased Internal friction by shearing or, as with pipe flow problems, Increased reaction
forces due to the Increased mass flow according to Newton's second law.
5.2.10 Fibre type
The significant increase in measured stiffness is attributed to the increased stiffness of
carbon fibres. Typically a 1900MPa and 135GPa tensile strength and modulus Is found In
carbon fibres in comparison to the 1300MPa and 51GPa of E-glass. The effect of fibre
stiffness is further demonstrated In a temperature sweep covering a change in viscosity
of the resin where the Increase In stiffness of carbon fibre remains relatively constant
throughout the change In resin stiffness (Fig 4-34).
There is a significant reduction In tack for carbon fibre prepreg which Is apparent
throughout the temperature sweep. Both failure modes are observed In resin deposition
of both specimens with the exception that the carbon sample does not have a
corresponding distinct peak In tack (Fig 4-35). There are three possible hypotheses to
account for the effect:-
• Differing Impregnation and resin volume affecting the surface resin layer
• Electrostatic effect
• Failure at the fibre interface
Impregnation effects
Differences In resin deposition patterns on rigid test plates are observed between glass
and carbon prepregs. Carbon samples exhibit a more defined stripe pattern (Fig 5-6).
Microscopic Inspection of carbon and glass samples shows that carbon samples consist
of variably Impregnated resin-dry bundles with the majority of resin occupying trenches
between bundles (Fig 5-7) unlike glass samples which show less defined bundles and
greater resin layer uniformity (Fig 5-8). Therefore, It Is likely that difference In tack Is
due to a reduced actual contact area of the resin as the carbon fibre bundles support
the majority of the applied compaction load. The change In Impregnation Is most likely
due to a change In resin volume. Although resin content by weight Increases by only
2%, the volumetric ratio of resin Increases from 41.4% In the carbon to 50.1 % in the E-
R J Crossley 167
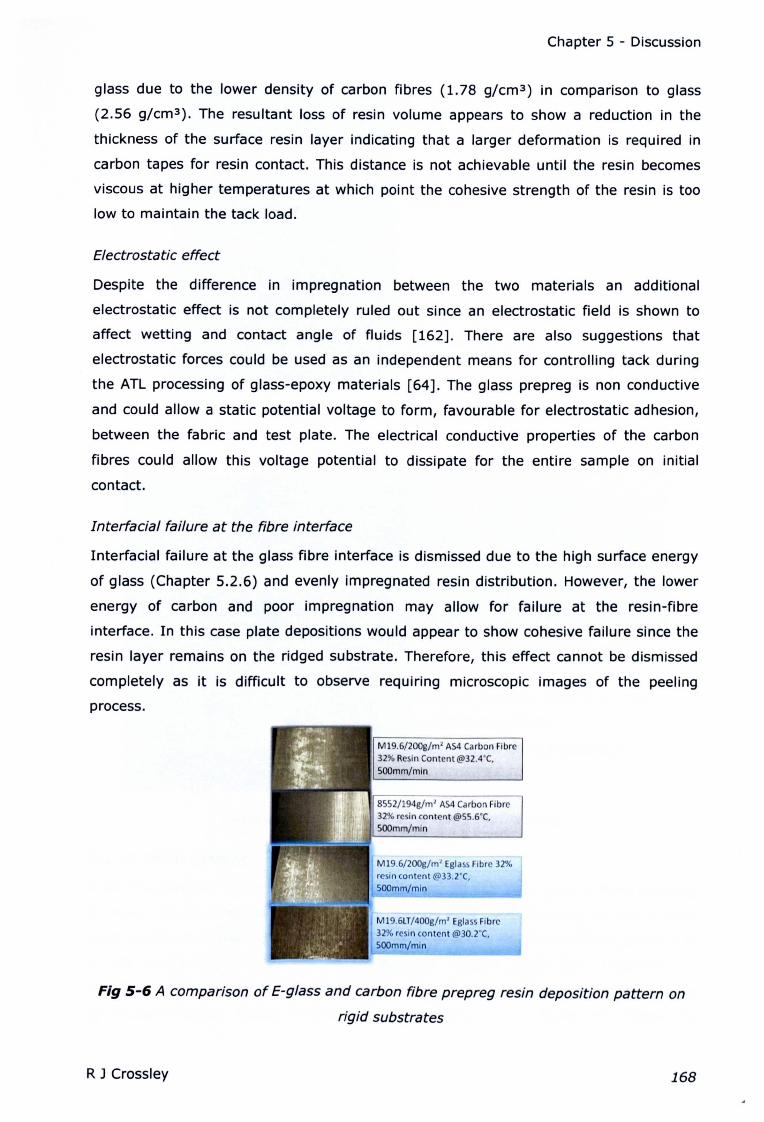
Chapter 5 - Discussion
glass due to the lower density of carbon fibres (1.78 g/cm3) in comparison to glass
(2.56 g/cm3). The resultant loss of resin volume appears to show a reduction in the
thickness of the surface resin layer indicating that a larger deformation is required in
carbon tapes for resin contact. This distance is not achievable until the resin becomes
viscous at higher temperatures at which point the cohesive strength of the resin is too
low to maintain the tack load.
Electrostatic effect
Despite the difference in impregnation between the two materials an additional
electrostatic effect is not completely ruled out since an electrostatic field is shown to
affect wetting and contact angle of fluids [162]. There are also suggestions that
electrostatic forces could be used as an independent means for controlling tack during
the ATL processing of glass-epoxy materials [64]. The glass prepreg is non conductive
and could allow a static potential voltage to form, favourable for electrostatic adhesion,
between the fabric and test plate. The electrical conductive properties of the carbon
fibres could allow this voltage potential to dissipate for the entire sample on initial
contact.
Interfacial failure at the fibre interface
Interfacial failure at the glass fibre interface is dismissed due to the high surface energy
of glass (Chapter 5.2.6) and evenly impregnated resin distribution. However, the lower
energy of carbon and poor impregnation may allow for failure at the resin-fibre
interface. In this case plate depositions would appear to show cohesive failure since the
resin layer remains on the ridged substrate. Therefore, this effect cannot be dismissed
completely as it is difficult to observe requiring microscopic images of the peeling
process.
M19.6/200g/rn' AS4 Carbon Fibre
32% Resin Content @32.4·C.
SOOmm/mln
8SS2/194g/m' AS4 Carbon Fibre
32% resin content @SS.6·C.
SOOmm/min
M19.6/200g/m' Eglass Fibre 32%
resin content @33.2·C.
SOOmm/mln
M19.6LT/400g/m' Eglass Fibre
32% resin content @30.2"C.
SOOmm/min
Fig 5-6 A comparison of E-glass and carbon fibre prepreg resin deposition pattern on
rigid substrates
R J Crossley 168
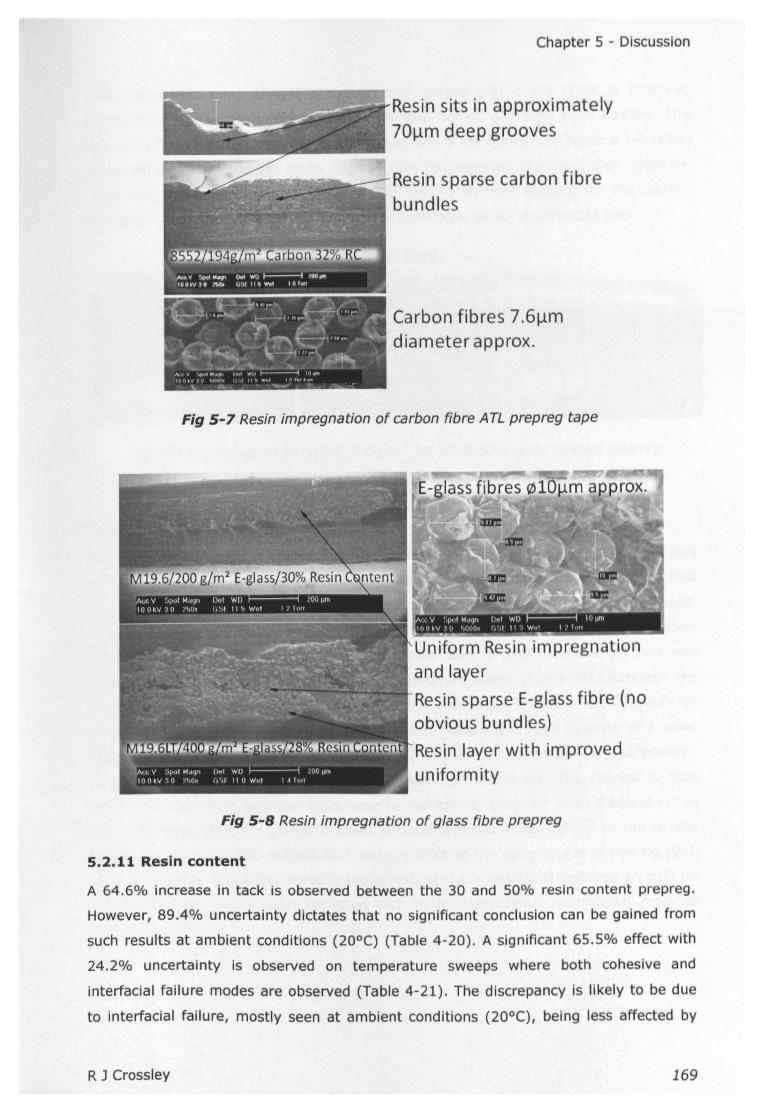
Chapter 5 - Discussion
Resin sits in approximately
70~m deep grooves
Resin sparse carbon fibre
bundles
Carbon fibres 7 .Sumdiameter approx.
Fig 5-7 Resin impregnation of carbon fibre ATL prepreg tape
Uniform Resin impregnation
and layer
Resin sparse E-glass fibre (no
obvious bundles)
Resin layer with improved
uniformity
Fig 5-8 Resin impregnation of glass fibre prepreg
5.2.11 Resin content
A 64.6% increase in tack is observed between the 30 and 50% resin content prepreg.
However, 89.4% uncertainty dictates that no significant conclusion can be gained from
such results at ambient conditions (200C) (Table 4-20). A significant 65.5% effect with
24.2% uncertainty is observed on temperature sweeps where both cohesive and
interfacial failure modes are observed (Table 4-21). The discrepancy is likely to be due
to interfacial failure, mostly seen at ambient conditions (20°C), being less affected by
R J Crossley 169
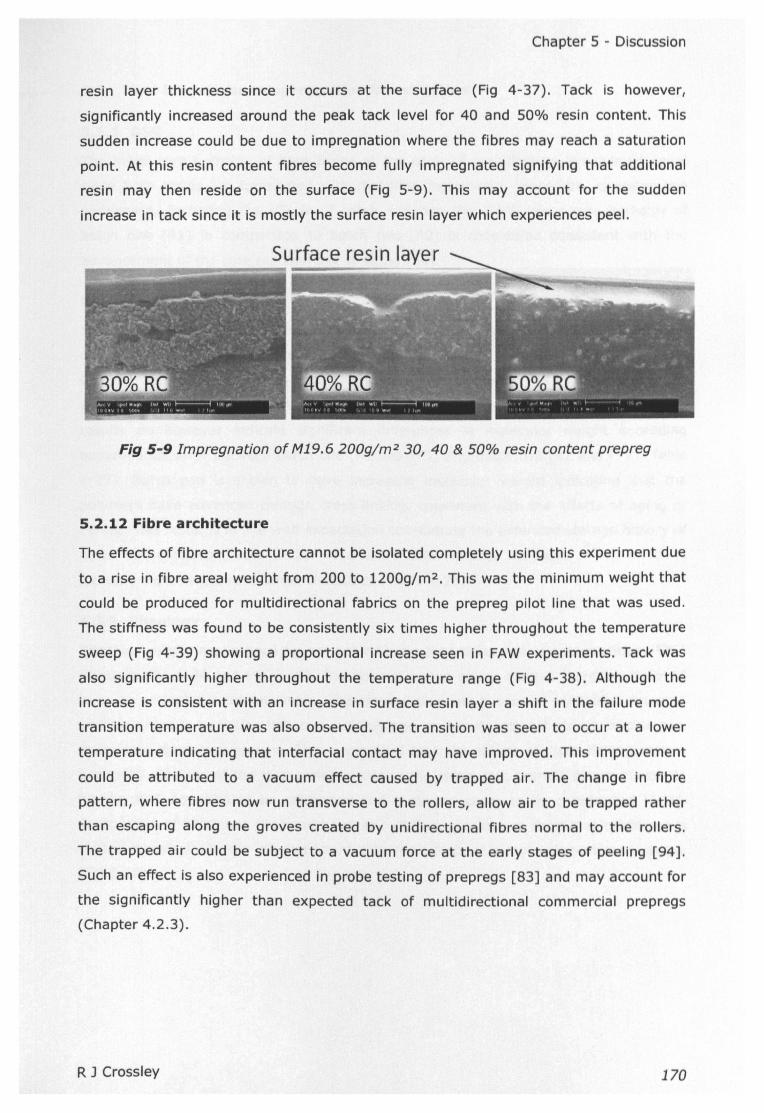
Chapter 5 - Discussion
resin layer thickness since it occurs at the surface (Fig 4-37). Tack is however,
significantly increased around the peak tack level for 40 and 50% resin content. This
sudden increase could be due to impregnation where the fibres may reach a saturation
point. At this resin content fibres become fully impregnated signifying that additional
resin may then reside on the surface (Fig 5-9). This may account for the sudden
increase in tack since it is mostly the surface resin layer which experiences peel.
Surface resin layer---.,
Fig 5-9 Impregnation of M19.6 200g/m2 30, 40 & 50% resin content prepreg
5.2.12 Fibre architecture
The effects of fibre architecture cannot be isolated completely using this experiment due
to a rise in fibre areal weight from 200 to 1200g/m2• This was the minimum weight that
could be produced for multidirectional fabrics on the prepreg pilot line that was used.
The stiffness was found to be consistently six times higher throughout the temperature
sweep (Fig 4-39) showing a proportional increase seen in FAW experiments. Tack was
also significantly higher throughout the temperature range (Fig 4-38). Although the
increase is consistent with an increase in surface resin layer a shift in the failure mode
transition temperature was also observed. The transition was seen to occur at a lower
temperature indicating that interfacial contact may have improved. This improvement
could be attributed to a vacuum effect caused by trapped air. The change in fibre
pattern, where fibres now run transverse to the rollers, allow air to be trapped rather
than escaping along the groves created by unidirectional fibres normal to the rollers.
The trapped air could be subject to a vacuum force at the early stages of peeling [94].
Such an effect is also experienced in probe testing of prepregs [83] and may account for
the significantly higher than expected tack of multidirectional commercial prepregs
(Chapter 4.2.3).
RJ Crossley 170
Chapter 5 - Discussion
5.3 Time temperature superposition Investigation
5.3.1 DSC
The initial cure enthalpy of both resins at the pelnt of manufacture is assumed equal
since both resins are formulated with matching ingredients, procedure, operator and
equipment. Excluding the effects of batch variation the 5.5% lower cure enthalpy of
batch one (Rl) in comparison to batch two (R2) is considered consistent with the
advancement of the cure reaction due to aging [54].
5.3.2 GPC
Molecular weight and polydispersity (Mw, Mn, and P) results Indicate Insignificant
differences in molecular weight between prepreg resins (PPl-2) and resins taken
directly before impregnation (Rl-2) (Table 4-27 to Table 4-29). Therefore, the
prepregglng process Is shown not to significantly alter the resins molecular state. Mn
results do however Indicate significant differences in molecular weight exceeding
experimental error between batch one (Rl and PP1) and batch two (R2 and PP2) (Table
4-27). Batch one is shown to have Increased molecular weight Indicating that the
polymers have advanced through cross linking, consistent with the effects of aging or
curing. This result is in line with expectation considering the extended storage history of
batch one samples (Table 3-22). Results are confirmed by increases In Mw, which Is
typically more sensitive to larger molecules (Table 4-28).
5.3.3 Rheology
Rheology results are in good agreement with the time temperature superposition (TIS)
principle (Fig 4-44 and Fig 4-46). The uncross-linked epoxy resin is therefore believed
to be an amorphous polymer melt. Therefore, It does not possess a crystalline structure
and may readily transition between a glassy and meit state without structural changes,
dependent upon temperature. This is provided that the effects of cross linking remain
negligible. Shifting of the isothermal curves in the strain rate domain allows constants
for the WLF equation to be calculated and a master curve to be constructed [103].
Comparison of batch one (R1) and batch two (R2) master curves show that batch one is
shifted marginally to the left consistent with the effects of a molecular weight Increase
(Fig 5-10).
R J Crossley 171
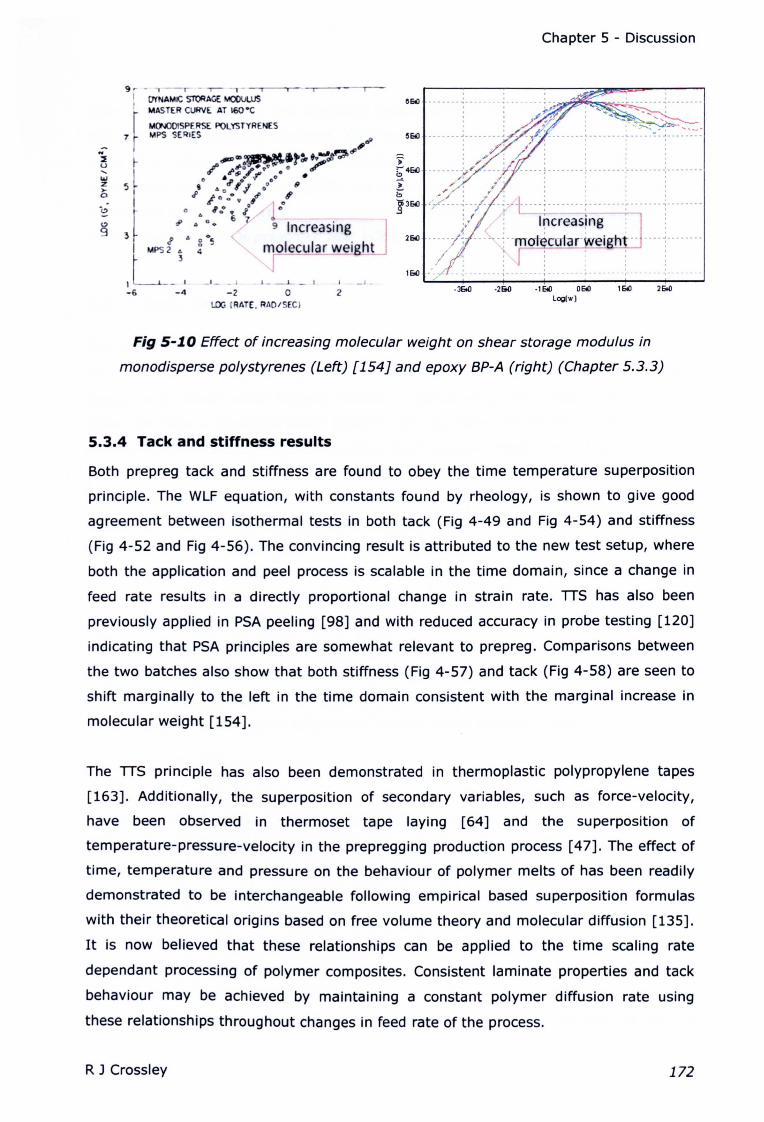
Chapter 5 - Discussion
9 r - ._-,_. - ..- _. - ---,--,- ~---,---
l (]I'NAMIC STORAGE MOOUUJS. MASTER CURVE AT 160·C
M(XI.()OlSPERSE POLYSTYRENESMPS SERIES7
'2 t-u.....wz 5>-0
-Cl
Cl
9 ~
- I
-4
--1- ~,
-2
, , , , I ,
- - ~- - - - - - - -, - -- - - - - - 1 _. - - - - - - r - - - - - - - -,- - - - - - - - "')-- - - - - -
I-6 o 2 ·3&0 ·2&0 ·1E40 000
Log(w)
1E40
LOG [RATE. RAO/SEC)
Fig 5-1.0 Effect of increasing molecular weight on shear storage modulus in
monodisperse polystyrenes (Left) [154J and epoxy BP-A (right) (Chapter 5.3.3)
5.3.4 Tack and stiffness results
Both prepreg tack and stiffness are found to obey the time temperature superposition
principle. The WLF equation, with constants found by rheology, is shown to give good
agreement between isothermal tests in both tack (Fig 4-49 and Fig 4-54) and stiffness
(Fig 4-52 and Fig 4-56). The convincing result is attributed to the new test setup, where
both the application and peel process is scalable in the time domain, since a change in
feed rate results in a directly proportional change in strain rate. TIS has also been
previously applied in PSA peeling [98] and with reduced accuracy in probe testing [120]
indicating that PSA principles are somewhat relevant to prepreg. Comparisons between
the two batches also show that both stiffness (Fig 4-57) and tack (Fig 4-58) are seen to
shift marginally to the left in the time domain consistent with the marginal increase in
molecular weight [154].
The TIS principle has also been demonstrated in thermoplastic polypropylene tapes
[163]. Additionally, the superposition of secondary variables, such as force-velocity,
have been observed in thermoset tape laying [64] and the superposition of
temperature-pressure-velocity in the prepregging production process [47]. The effect of
time, temperature and pressure on the behaviour of polymer melts of has been readily
demonstrated to be interchangeable following empirical based superposition formulas
with their theoretical origins based on free volume theory and molecular diffusion [135].
It is now believed that these relationships can be applied to the time scaling rate
dependant processing of polymer composites. Consistent laminate properties and tack
behaviour may be achieved by maintaining a constant polymer diffusion rate using
these relationships throughout changes in feed rate of the process.
RJ Crossley 172
Chapter 5 - Discussion
TTS also appears valid in the Interfacial failure domain (Fig 4-49 and Fig 4-54) which
has not been previously observed. This result is considered more difficult to explain
since It is believed that molecular diffusion through free volume within the melt is
responsible for TTS behaviour [135], yet molecular diffusion is not necessarily required
for contact adhesion to occur. A brief attempt at a satisfactory molecular explanation for
TTS without diffusion is presented later (Chapter 5.4.3).
5.4 ResultsSummary
5.4.1 Stiffness
Any variable which results in an increase in fabric, fibre or resin stiffness or thickness
results in an overall stiffer prepreg. Therefore, temperature, fibre weight, feed rate and
fibre type have a significant effect (Table 4-23). Typically, factors which affect only the
surface such as release agents and surface finish show no effect. This is logical since the
prepreg is covered with resin film preventing surface interaction during the stiffness
section of the test. Anomalous results such as compaction force, surface type (Table
4-24) and finish do show an unexpected effect on stiffness. However, this effect can be
attributed to an Increase in roiling friction caused by Increased reaction forces or
increasingly rough surfaces. This may signify that stiffness values are not comparable
between alternate plates and compaction pressures without correction. However, tack
values remain comparative since stiffness is removed from peel resistance highlighting
the self-corrective nature of the test with regards to quantifying tack. A linear increase
in stiffness has been observed with Increased thickness (Ref. FAW01 and FA01)
Indicating that stiffness Is a complex problem which better resembles a membrane,
shear, frictional or flow issue rather than a simple beam bending problem.
5.4.2 Tack
Throughout all of the tack tests two failure modes have become apparent and shown to
be affected differently by each variable (Table 5-1). The first failure mode Is
characterised by poor surface contact resulting In very low values of tack and negligible
resin deposition on the rigid test plate and is likened to Interfacial failure found In PSA's.
The second failure mode Is characterised by good surface contact and the formation of
resin fibrillations which eventually fail leaving significant resin deposition on the rigid
test surface. The second failure mode is likened to cohesive failure found In PSA's [75].
Other failure modes found in PSA's are generally essoctated with failure at the flexible
tape substrate interface [75, 104]. Since the fibres are gripped during prepreg peeling,
R J Crossley 173
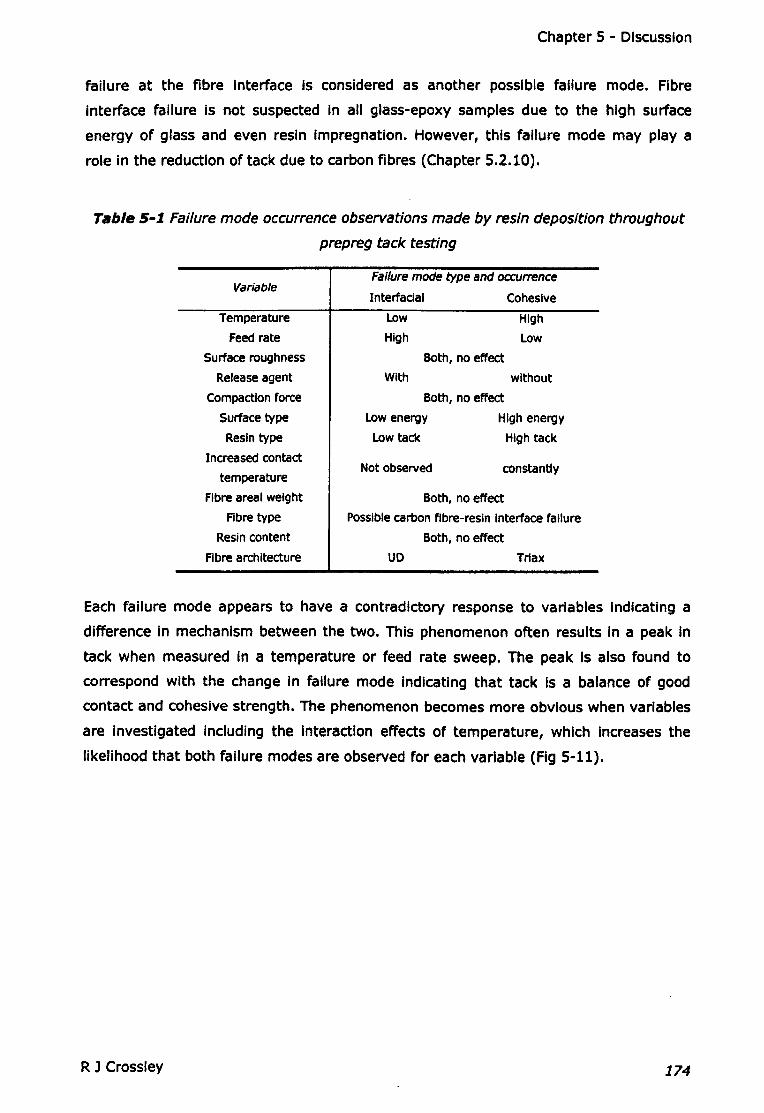
Chapter 5 - Discussion
failure at the fibre interface is considered as another possible failure mode. Fibre
interface failure is not suspected in all glass-epoxy samples due to the high surface
energy of glass and even resin Impregnation. However, this failure mode may play a
role in the reduction of tack due to carbon fibres (Chapter 5.2.10).
Table 5-1 Failure mode occurrence observations made by resin deposition throughout
prepreg tack testing
VariableCohesive
Failure mode type and occurrence
Interfacial
Temperature
Feed rate
Surface roughness
Releaseagent
Compaction force
Surface type
Resin type
Increased contact
temperature
Fibre areal weight
Fibre type
Resin content
Fibre architecture
Low
High
High
Low
Both, no effect
With without
Both, no effect
Low energy High energy
Low tack High tack
Not observed constantly
Both, no effect
Possiblecarbon fibre-resin Interface failure
Both, no effect
UD Trlax
Each failure mode appears to have a contradictory response to variables Indicating a
difference in mechanism between the two. This phenomenon often results in a peak in
tack when measured in a temperature or feed rate sweep. The peak is also found to
correspond with the change In failure mode Indicating that tack is a balance of good
contact and cohesive strength. The phenomenon becomes more obvious when variables
are investigated Including the interaction effects of temperature, which Increases the
likelihood that both failure modes are observed for each variable (Fig 5-11).
R J Crossley 174
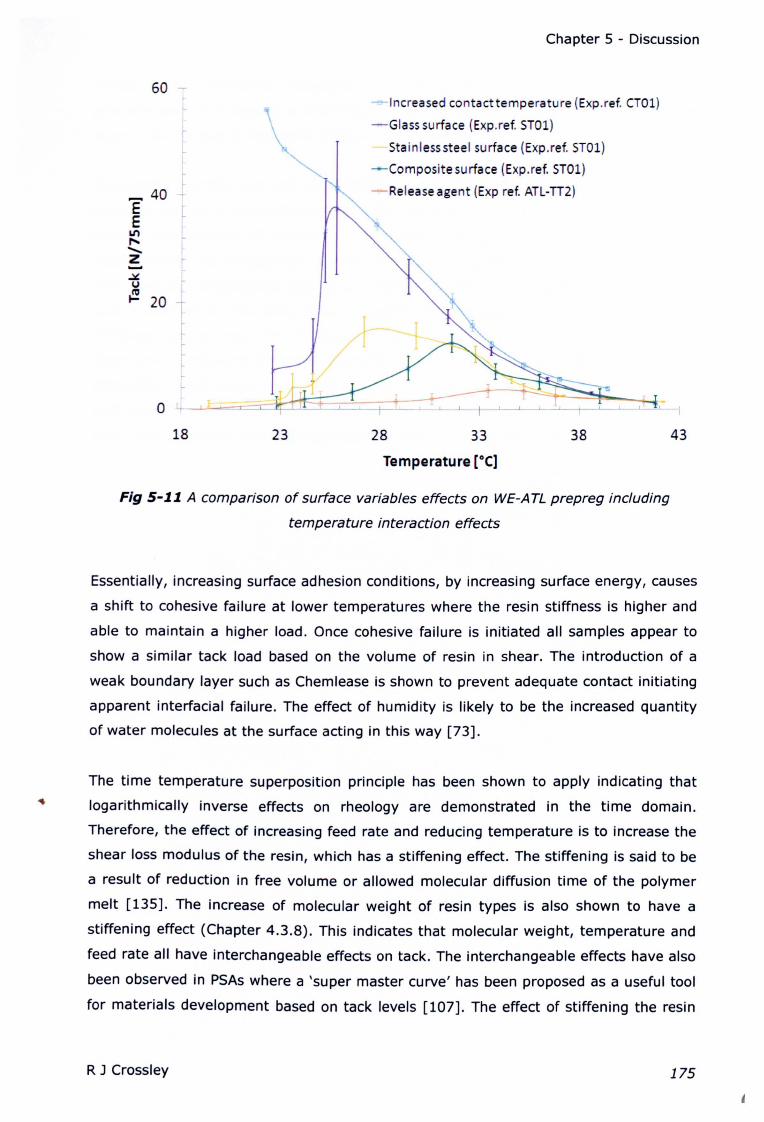
Chapter 5 - Discussion
60L
Ir-
e
I_ 40 --rE ~E
U') f-"........Z~u~~ 20
-e-lncreased contacttemperature (Exp.ref. CT01)
-Glass surface (Exp.ref. STOll
-Stainlesssteel surface (Exp.ref. STOll
-r-Composlte surface (Exp.ref. STOll
-Release agent (Exp ref. ATL-TI2)
o18 23 28 33 38 43
Temperature [OC]
Fig 5-11 A comparison of surface variables effects on WE-ATL prepreg including
temperature interaction effects
Essentially, increasing surface adhesion conditions, by increasing surface energy, causes
a shift to cohesive failure at lower temperatures where the resin stiffness is higher and
able to maintain a higher load. Once cohesive failure is initiated all samples appear to
show a similar tack load based on the volume of resin in shear. The introduction of a
weak boundary layer such as Chemlease is shown to prevent adequate contact initiating
apparent interfacial failure. The effect of humidity is likely to be the increased quantity
of water molecules at the surface acting in this way [73].
The time temperature superposition principle has been shown to apply indicating that
logarithmically inverse effects on rheology are demonstrated in the time domain.
Therefore, the effect of increasing feed rate and reducing temperature is to increase the
shear loss modulus of the resin, which has a stiffening effect. The stiffening is said to be
a result of reduction in free volume or allowed molecular diffusion time of the polymer
melt [135]. The increase of molecular weight of resin types is also shown to have a
stiffening effect (Chapter 4.3.8). This indicates that molecular weight, temperature and
feed rate all have interchangeable effects on tack. The interchangeable effects have also
been observed in PSAs where a 'super master curve' has been proposed as a useful tool
for materials development based on tack levels [107]. The effect of stiffening the resin
R J Crossley 175
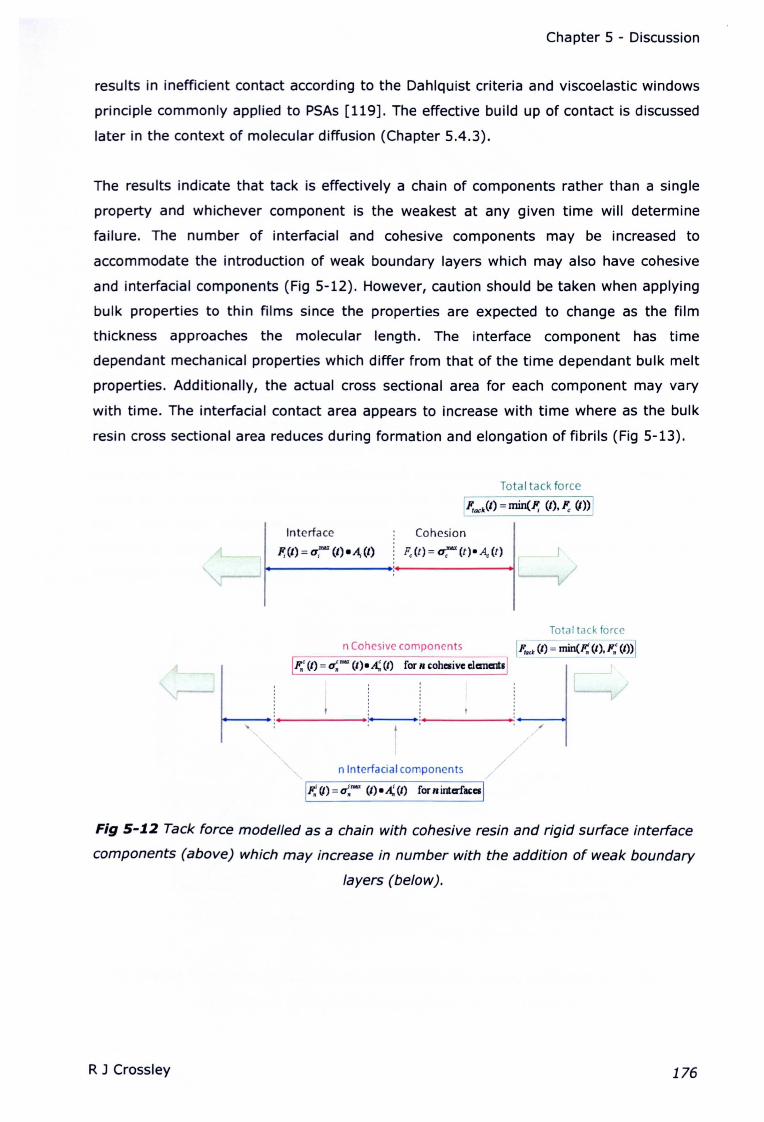
Chapter 5 - Discussion
results in inefficient contact according to the Dahlquist criteria and viscoelastic windows
principle commonly applied to PSAs [119]. The effective build up of contact is discussed
later in the context of molecular diffusion (Chapter 5.4.3).
The results indicate that tack is effectively a chain of components rather than a single
property and whichever component is the weakest at any given time will determine
failure. The number of interfacial and cohesive components may be increased to
accommodate the introduction of weak boundary layers which may also have cohesive
and interfacial components (Fig 5-12). However, caution should be taken when applying
bulk properties to thin films since the properties are expected to change as the film
thickness approaches the molecular length. The interface component has time
dependant mechanical properties which differ from that of the time dependant bulk melt
properties. Additionally, the actual cross sectional area for each component may vary
with time. The interfacial contact area appears to increase with time where as the bulk
resin cross sectional area reduces during formation and elongation of fibrils (Fig 5-13).
Total tack force
Interface
F; (t) = CT;lIW (t) • A, (t)
Cohesion
F.(t)=CT,IMX(t).A.(t) [ ~
Total tack force
n Cohesive components /Fta<t(I) = min(F.' (/),F: (m//F,,'(t)=o;mox(t).~(I) forncohClivcclc:mall:ll ~ r- :
I :: t----v/I : i I
: :----~ /
//
n Interfacial components //
IF: (t) = u~""" (I). A! (I) for n intafacCiI
Fig 5-1.2 Tack force modelled as a chain with cohesive resin and rigid surface interface
components (above) which may increase in number with the addition of weak boundary
layers (below).
R J Crossley 176
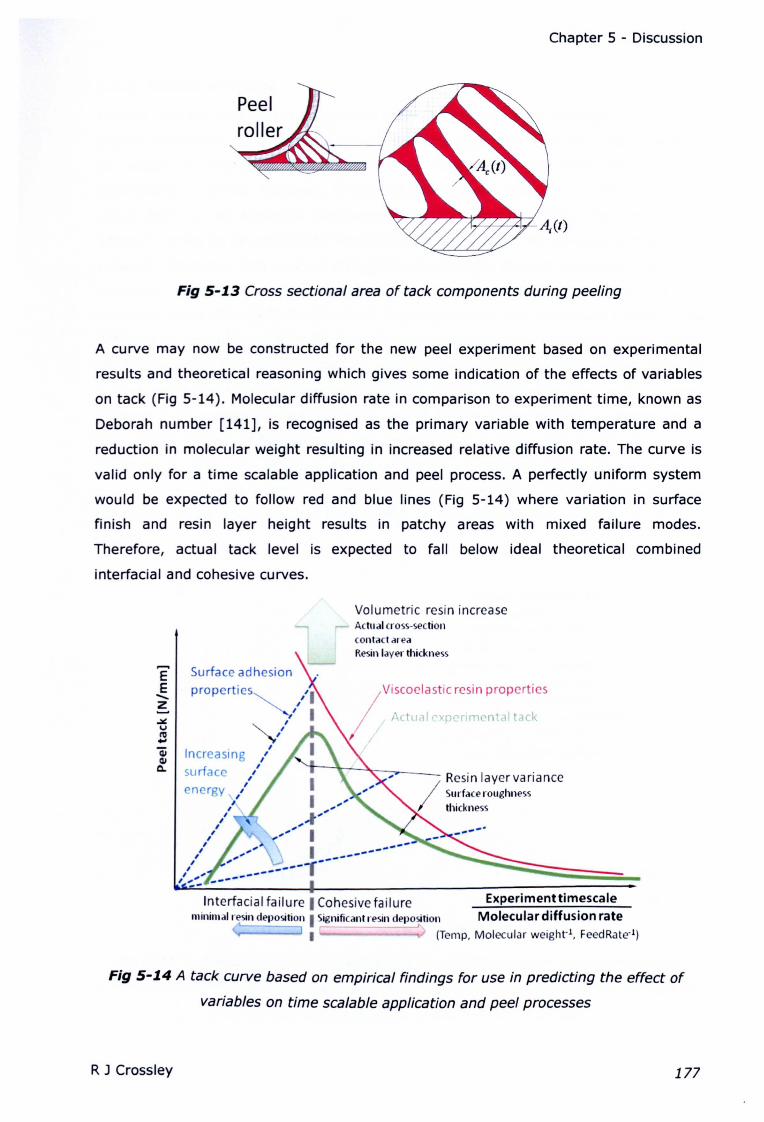
Chapter 5 - Discussion
Peel
Fig 5-13 Cross sectional area of tack components during peeling
A curve may now be constructed for the new peel experiment based on experimental
results and theoretical reasoning which gives some indication of the effects of variables
on tack (Fig 5-14). Molecular diffusion rate in comparison to experiment time, known as
Deborah number [141], is recognised as the primary variable with temperature and a
reduction in molecular weight resulting in increased relative diffusion rate. The curve is
valid only for a time scalable application and peel process. A perfectly uniform system
would be expected to follow red and blue lines (Fig 5-14) where variation in surface
finish and resin layer height results in patchy areas with mixed failure modes.
Therefore, actual tack level is expected to fall below ideal theoretical combined
interfacial and cohesive curves.
.:.t.uIV..] Increasing0.. surface
Volumetric resin increase...., Actual cross-section
contact areaResin layer thickness
E Surface adhesion
! propertiesZ
/
ViscoClastic resin properties
Actual cxpcnmcntal tack
Resin layer variance
/Surface roughnessthickness
Interfacial failure ICohesive failure Experimenttimescaleminimal resin depositionISignificant resin deposition Molecular diffusion rate
-----' I (Temp, Molecular weight-i, FeedRate-1)
Fig 5-14A tack curve based on empirical findings for use in predicting the effect of
variables on time scalable application and peel processes
R J Crossley 177
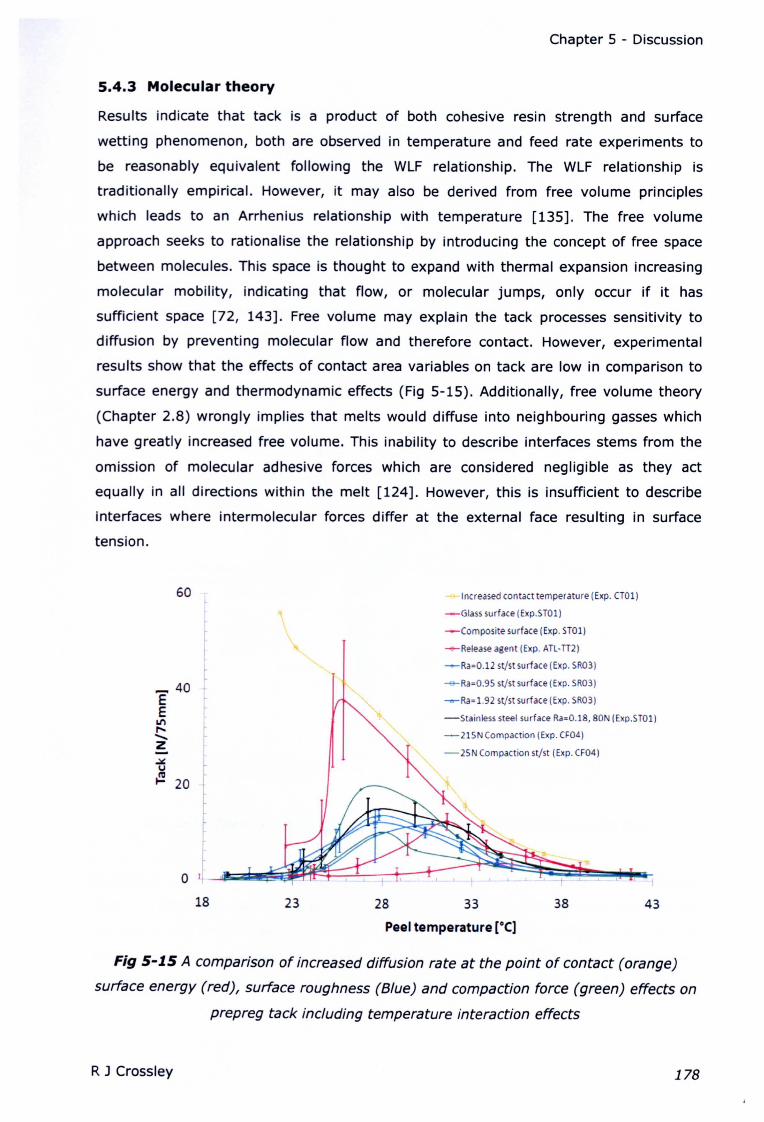
Chapter 5 - Discussion
5.4.3 Molecular theory
Results indicate that tack is a product of both cohesive resin strength and surface
wetting phenomenon, both are observed in temperature and feed rate experiments to
be reasonably equivalent following the WLF relationship. The WLF relationship is
traditionally empirical. However, it may also be derived from free volume principles
which leads to an Arrhenius relationship with temperature [135]. The free volume
approach seeks to rationalise the relationship by introducing the concept of free space
between molecules. This space is thought to expand with thermal expansion increasing
molecular mobility, indicating that flow, or molecular jumps, only occur if it has
sufficient space [72, 143]. Free volume may explain the tack processes sensitivity to
diffusion by preventing molecular flow and therefore contact. However, experimental
results show that the effects of contact area variables on tack are low in comparison to
surface energy and thermodynamic effects (Fig 5-15). Additionally, free volume theory
(Chapter 2.8) wrongly implies that melts would diffuse into neighbouring gasses which
have greatly increased free volume. This inability to describe interfaces stems from the
omission of molecular adhesive forces which are considered negligible as they act
equally in all directions within the melt [124]. However, this is insufficient to describe
interfaces where intermolecular forces differ at the external face resulting in surface
tension.
60 -
lt
---Increased contact temperature (Exp. crOl)
-Glass surface (Exp.ST01)
--Composite surface (Exp. STOll
--Release agent (Exp. ATL· TT2)
--Ra=O.12 st/st surface (Exp. SR03)
-&-Ra=O.95 st/st surface [Exp. SR03)
--Ra=1.92 st/st surface (Exp. SR03)
-Stainless steel surface Ra=O.lS, SON (Exp.ST01)
-21SN Compaction (Exp. CF04)
-25N Compaction st/st (Exp. CF04)
_ 40EE
U"I,.........Z
18 23 28 33 38 43
Peel temperature [OC]
Fig 5-15 A comparison of increased diffusion rate at the point of contact (orange)
surface energy (red), surface roughness (Blue) and compaction force (green) effects on
prepreg tack including temperature interaction effects
R J Crossley 178
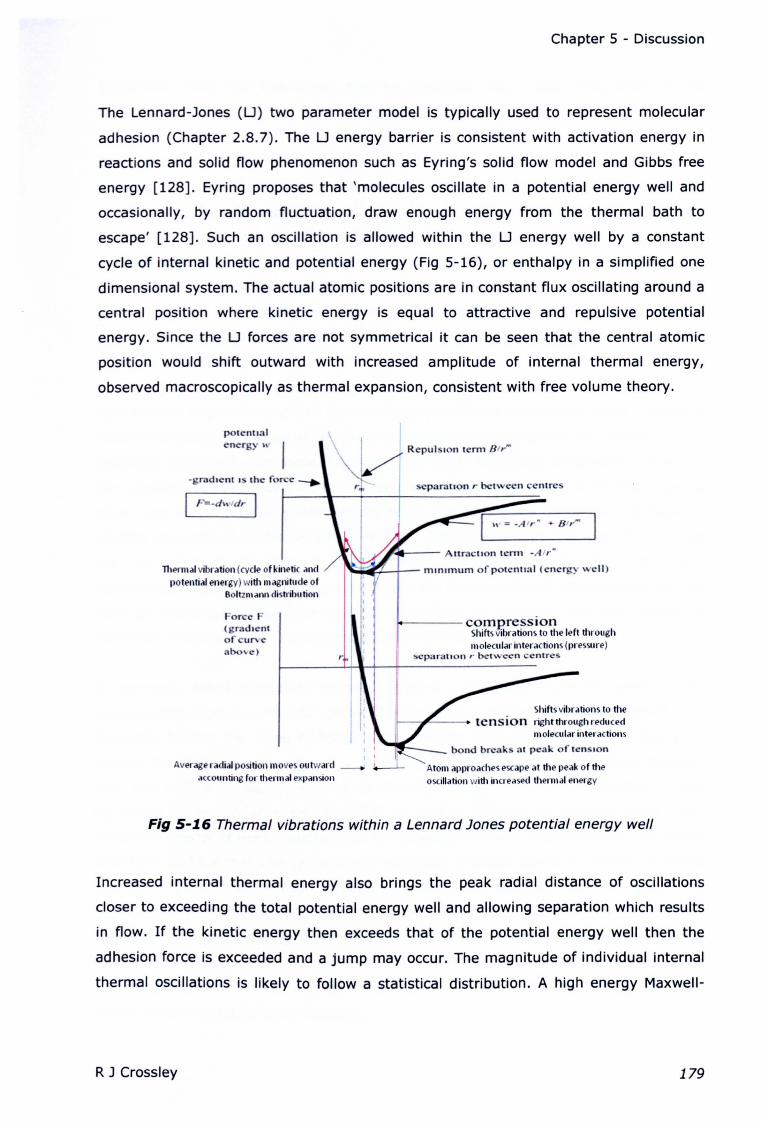
Chapter 5 - Discussion
The Lennard-Jones (U) two parameter model is typically used to represent molecular
adhesion (Chapter 2.8.7). The U energy barrier is consistent with activation energy in
reactions and solid flow phenomenon such as Eyring's solid flow model and Gibbs free
energy [128]. Eyring proposes that 'molecules oscillate in a potential energy well and
occasionally, by random fluctuation, draw enough energy from the thermal bath to
escape' [128]. Such an oscillation is allowed within the U energy well by a constant
cycle of internal kinetic and potential energy (Fig 5-16), or enthalpy in a simplified one
dimensional system. The actual atomic positions are in constant flux oscillating around a
central position where kinetic energy is equal to attractive and repulsive potential
energy. Since the U forces are not symmetrical it can be seen that the central atomic
position would shift outward with increased amplitude of internal thermal energy,
observed macroscopically as thermal expansion, consistent with free volume theory.
porennalenergy ...
Fs=-dwrdr
Thermal vibration (cyde of kinetic andpotential energy) with magnitude of
Boltzm ann distribu tion
For e F(gradientof curve
above)
Average radial position moves outwardaccounting for thermal expansion
\ I Repul Ion term BII·~
1<111---- Arrracuon term -Atr"
~~~-+-- rmrnrnurn of potenttal (energy \ ell)
II
Ii!o----compression
Shifts vibrations to the left throughmolecular interactions (pressure)
~eparotlon r bet wce n entre,.
Shifts vibrations to theIr-~~-- tensionrightthroughreduc.ed
molecular interactions
bond break at peak of ten Ion
Atom approaches escape at the peak of the
oscillation with increased thermal energy
Fig 5-16 Thermal vibrations within a Lennard Jones potential energy well
Increased internal thermal energy also brings the peak radial distance of oscillations
closer to exceeding the total potential energy well and allowing separation which results
in flow. If the kinetic energy then exceeds that of the potential energy well then the
adhesion force is exceeded and a jump may occur. The magnitude of individual internal
thermal oscillations is likely to follow a statistical distribution. A high energy Maxwell-
R J Crossley 179
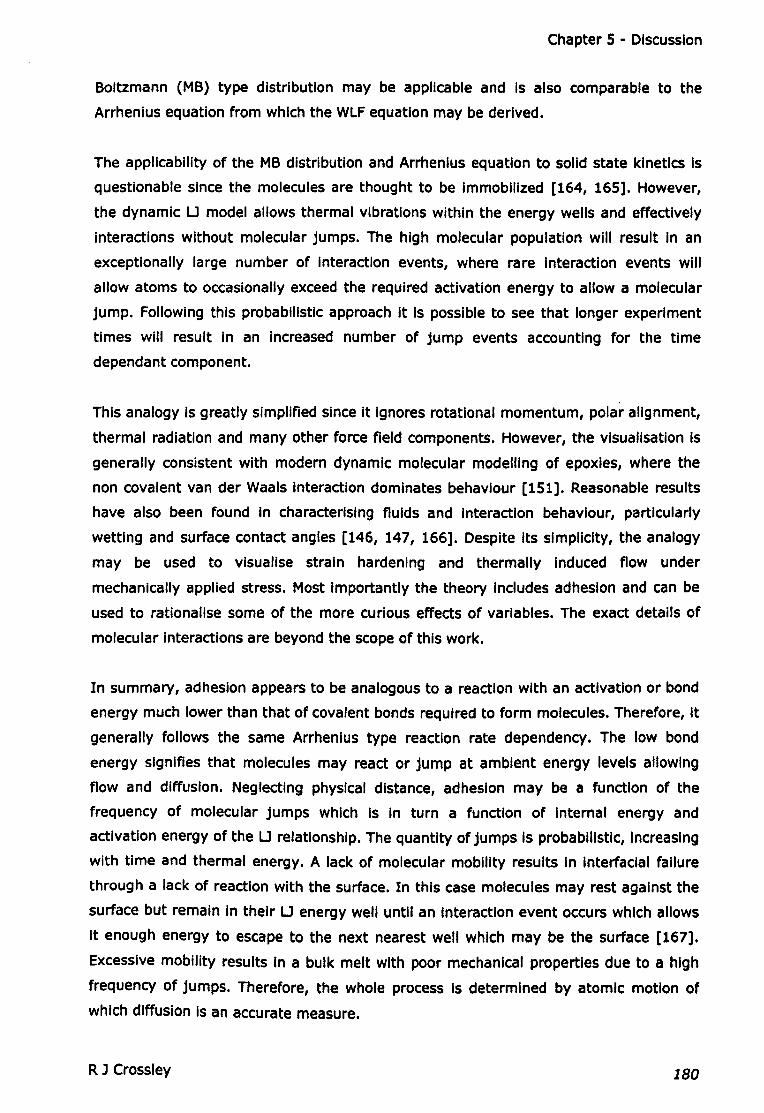
Chapter 5 - Discussion
Boltzmann (MB) type distribution may be applicable and Is also comparable to the
Arrhenius equation from which the WlF equation may be derived.
The applicability of the MB distribution and Arrhenius equation to solid state kinetics Is
questionable since the molecules are thought to be Immobilized [164, 165]. However,
the dynamic U model allows thermal vibrations within the energy wells and effectively
Interactions without molecular jumps. The high molecular population will result In an
exceptionally large number of Interaction events, where rare Interaction events will
allow atoms to occasionally exceed the required activation energy to allow a molecular
jump. Following this probabilistic approach it Is possible to see that longer experiment
times will result in an increased number of jump events accounting for the time
dependant component.
This analogy Is greatly simplified since It Ignores rotational momentum, polar alignment,
thermal radiation and many other force field components. However, the visualisation is
generally consistent with modern dynamic molecular modelling of epoxies, where the
non covalent van der Waals Interaction dominates behaviour [151]. Reasonable results
have also been found in characterising fluids and interaction behaviour, particularly
wetting and surface contact angles [146, 147, 166]. Despite Its simplicity, the analogy
may be used to visualise strain hardening and thermally Induced flow under
mechanically applied stress. Most Importantly the theory Includes adhesion and can be
used to rationalise some of the more curious effects of variables. The exact details of
molecular Interactions are beyond the scope of this work.
In summary, adheslcn appears to be analogous to a reaction with an activation or bond
energy much lower than that of covalent bonds required to form molecules. Therefore, It
generally follows the same Arrhenius type reaction rate dependency. The low bond
energy signifies that molecules may react or jump at ambient energy levels allowing
flow and diffusion. Neglecting physical distance, adhesion may be a function of the
frequency of molecular jumps which Is In turn a function of Internal energy and
activation energy of the U relationship. The quantity of jumps Is probabilistic, Increasing
with time and thermal energy. A lack of molecular mobility results In Interfacial failure
through a lack of reaction with the surface. In this case molecules may rest against the
surface but remain In their U energy well until an Interaction event occurs which allows
It enough energy to escape to the next nearest well which may be the surface [167].
Excessive mobility results In a bulk melt with poor mechanical properties due to a high
frequency of jumps. Therefore, the whole process is determined by atomic motion of
which diffusion Is an accurate measure.
R J Crossley 180
Chapter 5 - Discussion
Increased molecular weight (without branching)
Covalent bonds may also be modelled using the U equation. The atoms may share one
or more electrons allowing closer attraction before the repulsion term becomes
effective. As a result a higher potential energy well and shorter bond distance Is
achieved. Since the covalent bonds now require greater energy to escape they can
accommodate Increased thermal energy. The polymer chain Is considered to be a chain
of covalently bonded atoms immersed In non-covalent bonds. It Is then possible that
once a single atom in a chain reaches an energy state higher than the non-covalent
bonds of Its neighbours It Is held In position In a higher state of thermal oscillation by
the covalent bond. Once all atoms of the polymer chain exceed the non-covalent energy
of their neighbours the entire chain may jump. Allowing for a flexible backbone and
without applied stress, segments of the polymer chain are most likely to escape non-
covalent bonds by rotating and diffusing randomly around covalent bonds. Once stress
is applied, the polymers are now most likely to jump non-covalent bonds In the direction
of the applied stress. This would eventually lead to an aligned polymer which requires
all atoms to reach the required energy for the complete chain to make a non-covalent
jump.
Weak boundary layers
The dominant effect of release agents (Chapter 4.3.4) and surface contaminants
(Chapter 3.3.7) can be attributed to the weak boundary layer (WBL) principle. The U
attractive forces are most significant over a distance of a few atomic diameters.
Therefore, the presence of an apparently invisible atomically thin layer can significantly
affect tack. The atomic layer may work by positioning Itself over the surface creating a
layer with a low U potential energy. Alternatively, If the surface energy is suffiCient, a
sufficiently thick contaminant layer may fall cohesively. It may also be possible for such
molecular layers to be squeezed out or penetrated during molecular jumps [73]. This
offers some explanation as to why peak tack may be observed at higher temperatures,
with increased energy molecular jumps, where a WBL is present. The significant effect
of water molecules and oxide layers [73] may also account for some variability In tack
observed by manufacturers in climates with differing humidity.
Surface energy and finish
Dynamic molecular analysis using U interactions have been used to model surface
adhesion [73] with simplifications allowing an effective analysis [168]. It Is assumed
that the atomic radius at which the repulsive term becomes significant Is determined by
the electron shell which varies between atomic and molecular species [73]. The values
for the atomic radius, also known as the equilibrium distance, are believed to have a
R J Crossley 181
Chapter 5 - Discussion
significant effect on the prediction of adhesion [169]. It can now be seen that surfaces
consisting of molecules with a greater attractive force may attract molecules and
subsequently retain them within a deeper potential energy well. Therefore, the
interfacial bond is achievable with reduced thermal energy.
5.5 Commercial prepreg
Production process variability
Variation in commercial prepreg stiffness along the width of the roll has been found to In
most samples (Fig 4-7). This is likely to be the result of variations in fibre tows
according to manufacturer's tolerances. The way in which fibre tows are spread across
the roll may also be subject to some degree of variance. However, variance appears to
be contained to the roll width rather than through thickness, since the prepreg
demonstrates minimal variance in stiffness between bending direction when faces are
reversed (Fig 4-9).
Minimal variance in tack is shown across the roll width for most specimens with the
exception of triax 1200g/m2 E-glass which shows significantly reduced tack towards the
edges of the roll (Fig 4-8). This could be due to poor wetting, uneven roller pressure or
resin bleed-out from the edges in the production process. The greatest variance In
prepreg tack comes from the testing of alternate faces shown In all samples (Fig 4-9).
The greatest effect in the change of tack between faces is seen In triax 1200g/m2 which
has alternate fibre directions at each surface Indicating that fibre pattern at the surface
also affects tack.
Characterisation
When the roll position and face position studies are compared an overall repeatable
value for tack and stiffness is found (Table 4-5). This indicates that the new test Is a
useful tool for quantifying tack and stiffness. However, these repeated values are not In
complete agreement with specified values. The 'low tack' CUD600 is In good agreement.
However, 'medium tack' multidirectional higher resin content prepregs exhibit a higher
value than 'high tack' unidirectional glass fabrics. Prepreg tack levels are specified based
on resin tack level. However, temperature, feed rate, fibre surface pattern, fibre type
and resin content have all shown some effect on tack over a temperature range
(Chapter 4.3). Therefore, tack would be better specified based on actual prepreg
measurements. The test has also shown sensitivity to prepreg quality Issues such as
rips, bubbles and resin layer Variations which result in lost resin on peeling of the
backing film (Chapter 3.3.7). Therefore, quality, or uniformity Is shown to affect tack
and may be quantified in terms of experimental noise over a larger sample base to fully
R J Crossley 182

Chapter 5 - Discussion
characterise prepreg. In this case visible quality variations were screened out of the
sample group before testing to Increase the effect of variables in comparison to
experimental noise.
5.6 ATL feasibility and application
5.6.1 Performance observations
The feasibility study identified four key problem areas; cutting, backing paper release,
mould tack and repositionability (Chapter 4.1). The cutting performance was related In
some way to material properties, with increased fibre areal weight (FAW) proving more
difficult to cut due to the increased thickness. Fibre bundling, seen in early versions of
experimental E-glass prepreg, was also problematic where bundles were pulled from the
edge of the tape by the blade without being cut. This was relieved by improved tow
spreading during prepregging. The cutting configuration of the V4 machine limited
material weight (FAW:S400g/m2) with resin content minimised (28% wt.) to prevent
build up on the cutters. Overall, cutting was considered to be a mechanical design Issue
which could be remedied with the ultrasonic cutter knives of the latest machines.
Therefore, these material limitations were expected not to apply to newer machines and
further cutter Investigations were not warranted.
Reposltionability was considered to be a product of the materials tack level and
considered important only for manual handling, which is what automation seeks to
avoid. Lowering the tack level improves repositionabllity yet it also increases the
probability that manual intervention is required, since a ply Is more likely to move out of
position after being laid. Therefore, aiming for good material reposltlonability Is counter
Intuitive to the automation process. However, hand lay-up of the ATL material was
required to finish plies as a result of mould tracking machine errors. Therefore, for this
experimental program repositionabillty was considered favourable and preferred by
operators.
Backing paper release and mould tack are considered fundamental to the lay-up
process. However, the tack and removal mechanism and the Interaction of stiffness are
not clearly defined. Closer Inspection of the material head accompanied by a force
diagram (Fig 5-17) allows the following observatlons:-
• Peel appears to be the dominant removal mechanism.
• Application and peel appear Instantaneous In a continuous process.
• Contact time is inversely proportional to feed rate.
• Application pressure Is maintained by the tool head compaction shoe.
R J Crossley 183
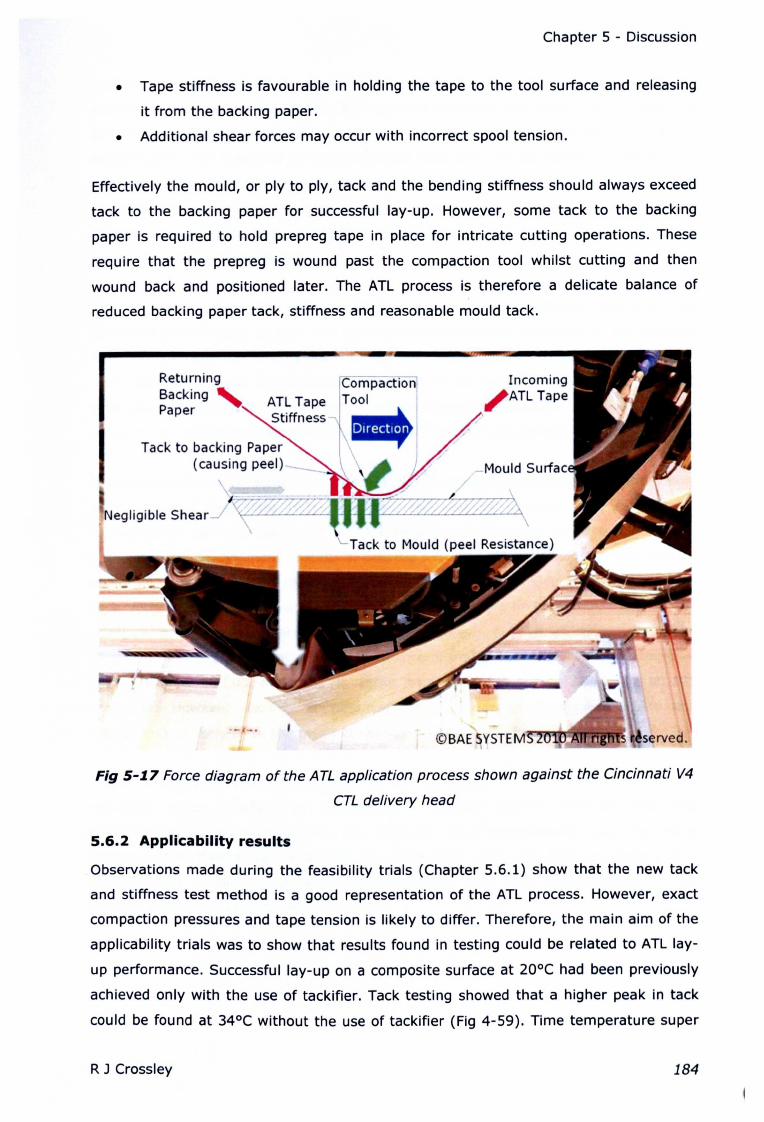
Chapter 5 - Discussion
• Tape stiffness is favourable in holding the tape to the tool surface and releasing
it from the backing paper.
• Additional shear forces may occur with incorrect spool tension.
Effectively the mould, or ply to ply, tack and the bending stiffness should always exceed
tack to the backing paper for successful lay-up. However, some tack to the backing
paper is required to hold prepreg tape in place for intricate cutting operations. These
require that the prepreg is wound past the compaction tool whilst cutting and then
wound back and positioned later. The ATL process is therefore a delicate balance of
reduced backing paper tack, stiffness and reasonable mould tack.
ReturningBacking'Paper
CompactionTool
Incoming;ATL Tape
.. _,- ..
Fig 5-1.7 Force diagram of the ATL application process shown against the Cincinnati V4
CTL delivery head
5.6.2 Applicability results
Observations made during the feasibility trials (Chapter 5.6.1) show that the new tack
and stiffness test method is a good representation of the ATL process. However, exact
compaction pressures and tape tension is likely to differ. Therefore, the main aim of the
applicability trials was to show that results found in testing could be related to ATL lay-
up performance. Successful lay-up on a composite surface at 20°C had been previously
achieved only with the use of tackifier. Tack testing showed that a higher peak in tack
could be found at 34°C without the use of tackifier (Fig 4-59). Time temperature super
R J Crossley 184
Chapter 5 - Discussion
position was used to find the equivalent feed rate at which this peak would occur (4
mm/rnln). Running the ATL at this feed rate was found to give good results, Increasing
the feed rate showed progressive loss of tack. Increasing the feed rate with heat added
according to TIS appeared to give Improved tack but unpredictability In the heating
method resulted in uneven tack levels and tape splitting. Splitting was believed to occur
In overheated sections of the tape which failed cohesively. Without cross-stitching the
resin is responsible for prepreg Integrity, therefore cohesive failure of the resin would be
expected to cause tape splitting.
The application study was believed to be a success since It showed that high tack
operating points found by tack and stiffness testing could be exploited on the machine
and that the results of testing could be applied directly to the ATL procedure. The test
also appeared to show the practical applicability of the time temperature transposition
principle, indicating that constant tack levels and possibly lamination conditions could be
achieved by regulating temperature according to the WLF parameters of the resin.
It has been known for some time that ATL lay-up benefits from Increased temperature
with increased feed rate [63]. However, the rate of Increase and Ideal lay-up
temperatures can now be found by tack testing and rheology, thereby significantly
improving the development process of prepreg materials. The relationship may also be
exploited to increase feed rates of processes which have previously been limited by
tack. Although lay-up and testing speeds have been limited to 1000 mm/mln, the WLF
relationship is logarithmic and appears valid for several decades of strain rate [135].
Therefore, it is expected that results will scale comfortably over the two decade increase
(from 500 to 50,000 mm/mm) to reach the maximum lay-up capability of ATL
machines. However, testing at Increased rates Is now recommended where any
discrepancy is likely to be the result of increased Inertial effects.
The consistency of lamination quality may also be regulated by this method since TIS
regulated lay-up Is effectively maintaining a constant polymer diffusion rate. TTS
regulated lay-up of thermoplastics may possibly yield Improvements since they have
demonstrated mechanical properties In agreement with the TIS principle [163].
Transposition of time-temperature variables have also been demonstrated In the
prepreg production process [47].
R J Crossley 185

Chapter 5 - Discussion
5.6.3 Tape performance
A comparison of experimental ATL materials at ambient lay-up conditions shows that
'high' and 'medium' tack resins (W-ATL-l to W-ATL-3) are abandoned in favour of less
problematic lower tack high stiffness tapes (W-ATL-7) which better match the properties
of existing aerospace (A-ATL-l & 2) materials (Fig 5-18). The results of tack under
commercial conditions (Fig 4-59) show that limited tack is available at the mould
surface due to the use of mould release agent. Therefore, low tack stiff prepreg appears
to be preferred on the basis of improved release from the backing paper. The lack of
tack to the mould surface can then be overcome with the use of tackifier. Therefore, a
study of tack to the release paper would be beneficial. However, this would require
increased sensitivity in measuring equipment.
15 ,---------------------------------------------
i
~~,
• Tack
ill Stiffness
·Switch to Short lightweight test plates
for temper ature sweeps
(Stiffness Vii lues cornpar ativlv
low due to reduced rig friction)
EEz- 10
0.-t N .-t N M ~ * *I I I I ...J I u:' '"...J ...J ...J ...J ...J I
~ ~ ~ ~ ~ ~...J ...J
I
<! ~I
~I ~ ~<t ~ ~ I I
~ ~
Fig 5-1.8 Tack and stiffness of experimental wind energy ATL prep regs (W-ATL) in
comparison to existing aerospace (A-ATL) prepreg at ambient conditions
Temperature effect
Increased temperature of 40-50oC was found to be beneficial in the lay-up of 8552
aerospace (A-ATL1 and 2) tapes. Tack appeared to be moderately increased without
significant decrease in the material stiffness. When the same level of heat was applied
to wind energy tapes the tapes became overly flexible and showed difficulty releasing
from the backing paper. The effect is attributed to the resin shear storage modulus
response to temperature (Chapter 5.2.1). The position of the heater plate against the
R J Crossley 186
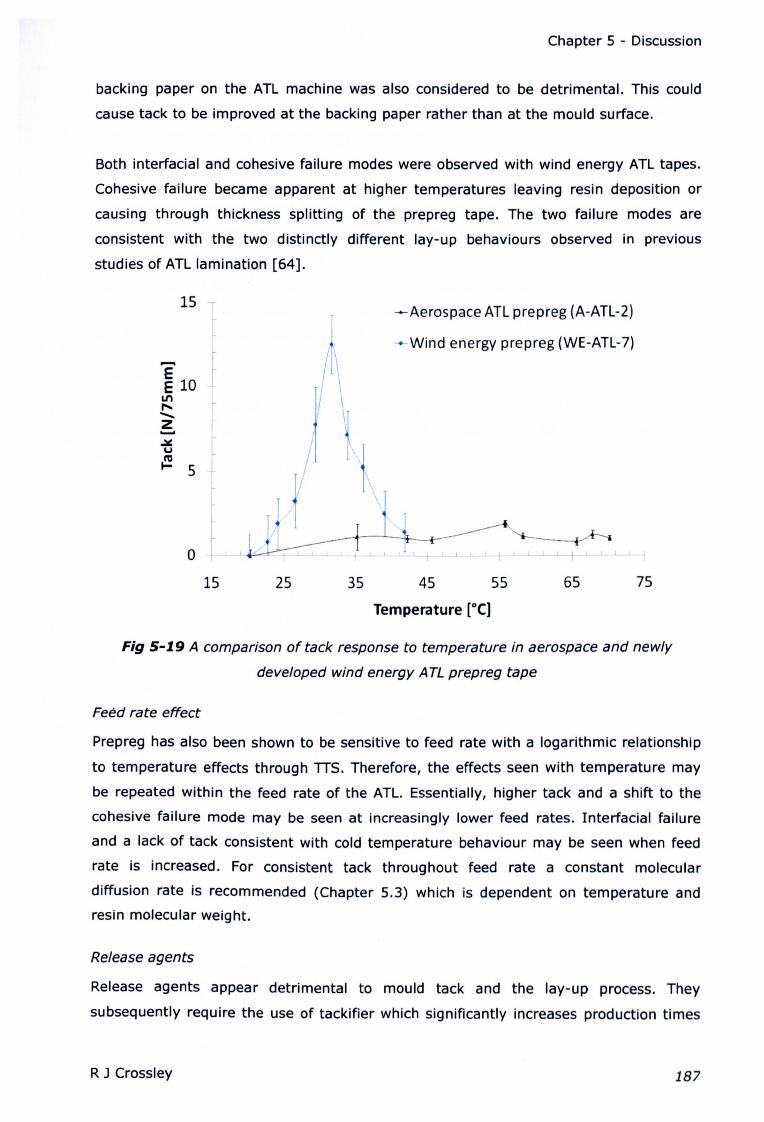
Chapter 5 - Discussion
backing paper on the ATL machine was also considered to be detrimental. This could
cause tack to be improved at the backing paper rather than at the mould surface.
Both interfacial and cohesive failure modes were observed with wind energy ATL tapes.
Cohesive failure became apparent at higher temperatures leaving resin deposition or
causing through thickness splitting of the prepreg tape. The two failure modes are
consistent with the two distinctly different lay-up behaviours observed in previous
studies of ATL lamination [64].
15
1,-- {EE 10
LI'\
"._Z......:iJ(.u{2
5
0 L15 25
=-Aerospace ATL prepreg (A-ATL-2)
Wind energy prepreg (WE-ATL-7)
35 65 7545 55
Temperature [DC]
Fig 5-1 9 A comparison of tack response to temperature in aerospace and newly
developed wind energy ATL prep reg tape
Feed rate effect
Prepreg has also been shown to be sensitive to feed rate with a logarithmic relationship
to temperature effects through TIS. Therefore, the effects seen with temperature may
be repeated within the feed rate of the ATL. Essentially, higher tack and a shift to the
cohesive failure mode may be seen at increasingly lower feed rates. Interfacial failure
and a lack of tack consistent with cold temperature behaviour may be seen when feed
rate is increased. For consistent tack throughout feed rate a constant molecular
diffusion rate is recommended (Chapter 5.3) which is dependent on temperature and
resin molecular weight.
Release agents
Release agents appear detrimental to mould tack and the lay-up process. They
subsequently require the use of tackifier which significantly increases production times
R J Crossley 187

Chapter 5 - Discussion
by increasing the number of mould coating and drying operations. The ATL process
would benefit from a speCifically designed mould release agent, which allowed residual
tack, or a gel coat with a high energy surface finish.
Compaction force
Compaction force was found to be ineffective at increasing tack outside of the failure
mode transition zone (2S-35°C) (Chapter 4.3.5). Significant levels of tack could be
found with BONcompaction. This value is much lower In comparison to the 265-1300N
typically applied by the ATL [SS]. Therefore, compaction pressures could be reduced to
eliminate the mould deflection found when using low cost wind energy tooling provided
it Is not detrimental to laminate quality.
Contact temperature
Significantly higher tack could be found by hot application and cold peel of the backing
paper (Chapter 4.3.7). ATL equipment may be redesigned to take advantage of this
effect.
R J Crossley 188
Chapter 6 - Conclusions
6 Conclusions
6.1 Tack and stiffness
6.1.1 Method and observations
A new tack and stiffness test has been developed which Is an extension of the floating
roller peel method. Peel methods have been less favoured in the past due to lack of a
controlled application method and difficulty in Isolating adhesion and bending forces
from the results. This new method allows simultaneous application under a controlled
force. Bending and tack forces are also Isolated In separate stages of the test. The test
was originally designed to replicate the ATL application method but has also been used
to characterise hand lay-up prepregs. Consistent results were found In the
characterisation of wind energy grade prepreg materials despite an overall high level of
uncertainty. Repeatable results have also been produced with a standard deviation of
5.2% in stiffness and 16.4% in tack over 27 samples. A tackier control sample was
correctly identified. The test method may also be applied to PSA tapes and surface
adhesion with further refinement.
The new test method allowed for the Investigation of the effects of twelve variables on
both tack and stiffness. During this Investigation interfacial and cohesive failure modes
were observed. These failure modes appear analogous to those found In PSA peel
testing where any additional modes, not observed in E-glass prepreg, are believed to be
associated with failure at the flexible substrate prevented from occurring In prepregs
since the fibres are gripped. The equivalent failure In prepreg would be at the fibre
interface. However, this is believed not to occur in E-glass since the resin Is assumed to
be well Impregnated within the fibres resulting in a poorly defined interface. However,
the fibre-resin interface failure is one of the possible scenarios offered to account for the
reduction in tack found In carbon prepregs. Typical interfacial failure Is attributed to
failure at the interface between the polymer melt and the rigid test plate resulting In a
mostly clean surface. Cohesive failure appears to occur within the resin polymer melt
and Is attributed to the viscoelastic properties of the resin resulting In significant resin
deposition on the test plate. A patchy mix of failure modes can be observed over the
peel area, particularly around the point of transttton between failure modes. This Is
attributed to the variability in resin layer thickness and contact. Increased
unpredictability is also observed during interfacial failure attributed to the elastic
storage and sudden release of energy, known as the stick-slip condition when observed
in PSAs.
R J Crossley 189
Chapter 6 - Conclusions
In all experiments where a peak In tack was recorded, It was found to be consistent with
the transition point between failure modes. This is believed to be the point where
contact adhesion and cohesive resin strength are equal. This Indicated that tack Is a
function of two mechanisms rather than a property Itself. A chain model Is now
considered the most appropriate method to represent prepreg tack. The number of
interfacial and cohesive components will depend on the number of layers and Interfaces
within the boundary of the applied force. Relative molecular diffusion rate, often
referred to as the Deborah number, was found to have opposing effects on the two
failure phenomenon. An empirical tack curve has been produced for a two component
system to assist with the prediction of the response of prepreg tack to a number of
variables. Short relative diffusion times result in mostly Interfacial failure which may be
affected by surface conditions. Long relative diffusion times result In mostly cohesive
failure which Is affected mostly by resin properties. The variation found in the resin
layer and surfaces is likely to account for mixed or patchy failure modes. The whole
curve appears to scale upward depending on the volumetric Increase In resin Involved In
the peeling process.
6.1.2 Variable effects
Temperature, feed rate and resin type
The effect of changes In temperature on tack appeared to be dependent on the dynamic
shear storage response of the resin. The results are supportive of the PSA Dahlquist
criterion concept which states that the dynamic shear storage must fall below a value ~
3xlOsPa to become contact efficient. However, the actual value for prepreg contact
efficiency also appears to be a function of surface conditions, specific to each surface
and prepreg. Resln type Investigations show that with constant fibres, surfaces and
resin Impregnation, tack can be controlled by increasing molecular weight. The
molecular weight Increase is typically achieved through a secondary reaction which In
turn stiffens the resin and reduces tack at a particular operating temperature. Similar
effects were found with Inverse changes in feed rate leading to the discovery of time
temperature superposition applicability In prepreg tack and stiffness.
Re/ease agents
Release agents were shown to virtually eliminate all useful tack. They appeared to lower
surface energy and prevent the onset of cohesive failure. They appear to act by either
reducing surface energy or producing a weak boundary layer with low cohesive strength
that is easily sheared. Residual tack was observed to be higher at Increased
R J Crossley 190

Chapter 6 - Conclusions
temperature and with solvent based release agents in comparison to water based.
Humidity is also thought to affect tack in a similar manner.
Surface roughness and energy
Surface roughness was found to have minimal effect. This could be attributed to the
surface roughness of the prepreg which was found to be large in comparison to all the
substrate surfaces tested. Changes in surface energy were found to be significantly
greater, leading to the possibility that tack could be a thermodynamically molecular
adhesion controlled mechanism rather than a diffusion controlled physical mechanism of
surface contact spreading.
Fibre type
carbon fibre prepregs were found to have significantly reduced tack In comparison to
equivalent E-glass prepregs. The effect was attributed to a difference in Impregnation,
an electrostatic effect, failure at the fibre-resin interface or a combination of all three.
Fibre areal weight (FAW)
Increasing fibre areal weight showed no effect on tack. However, a proportional increase
in prepreg stiffness was observed.
Resin Content
Resin content was found to have minimal effect on tack during fully interfacial failure.
However, increasing tack was found with increasing resin content throughout the failure
mode transition region and during cohesive failure.
Fibre architecture
The fibre architecture effects were difficult to isolate due to an unwanted increase In
FAW imposed by the manufacturing process. However, early onset of cohesive failure
appears to have occurred which could possibly be attributed to a vacuum effect of
trapped air due to a change in resin layer surface pattern.
Contact temperature
Hot application cold peel was found to significantly improve tack by Improving Interfacial
strength. The interfacial failure mode appeared to be eliminated from peeling at a lower
temperature.
Compaction force
R J Crossley 191
Chapter 6 - Conclusions
Compaction force was found to have minimal effect on tack outside of the failure mode
transition region (2S-3S°C) where significant tack could be found with BON compaction
force.
General
Overall variables which were found to affect the apparent shear storage modulus and
therefore stiffness of the resin were found to show the greatest magnitude of effect on
tack. Changing the apparent shear storage modulus and subsequently diffusion rate of
the resin is able to affect both the build up of interfacial strength and the cohesive
strength of the resin. Yet changes to surface contact conditions are only able to affect
the Interfacial failure mode mostly by delaying the onset of cohesive failure. Therefore,
surface variables can also appear dominant at certain low temperatures but appear less
effective over a temperature sweep which encompasses both failure modes.
Stiffness was found to be unaffected by changes In surface conditions. Only variables
which affect the thickness of the prepreg or the stiffness of fibre or resin components
are shown to effect prepreg stiffness.
6.1.3 Time temperature superposition
The effects of feed rate and temperature on both tack and stiffness were found to
conform to the time-temperature superposition (TTS) principle using the Willlams-
Landel-Ferry (WLF) equation, previously observed in rheology and PSA peel testing.
Constants for the WLF equation can be found using rheology and used to superposition
prepreg peel and stiffness results. This method then allows for the construction of
prepreg peel and stiffness master curves and the prediction of feed rate response based
on temperature response and vice versa. A tack Investigation of resin formulation also
shows promising signs in supporting the 'super master curve principle' allowing tack
predictions to be made based on molecular weight.
6.1.4 Molecular theory
A thermodynamic Lenard-Jones (U) model, typical of that utilised In molecular
dynamics, Is proposed to descriptively rationalise results. Adhesion and flow Is
essentially envisaged as a reaction with a low activation energy and relatively long bond
length. Therefore, a molecular jump Is required for Initiation of both adhesion and flow
signifying that both processes are governed by an Arrhenius type relationship, such as
WLF. Surface energy, thermal expansion and thermally Induced flow under stress may
also be accounted for. A semi-empirical model based on the dynamic U relationship
may offer reasonable predictions for the future In the absence of true molecular
modelling, which may be limited by a lack of computational power and molecular
R J Crossley 192
Chapter 6 - Conclusions
information. Simplifications to the U relationship and increased time step Intervals,
useful in reducing computations, should be made with caution. They may result In an
Inability to capture the true nature of the molecular jump and associated thermal
vibrations.
6.2 Prepreg characterisation
The new tack test method is considered equally applicable to hand-lay and ATL prepreg
characterisation since It quantifies both tack and stiffness, giving an indication of its
ability to stick and be formed around the mould surface.
A degree of variability was found in the tack levels of commercial prepregs dependant
on roll position and which face was tested. Repeatable results for tack and stiffness
could be found in large batch sizes containing an equal number of samples taken from
each face and roll position. Tack levels were not always in agreement with specified
levels. The most significant discrepancies are found in prepregs with multidirectional
fibres. Therefore, the fibres are believed to playa complex role In determining tack.
Prepreg tack is typically specified as 'high', 'medium' or 'low' based on the tack level of
the constituent resin. Fibre type and resin content have also been shown to have an
effect. Therefore, testing of the prepreg is preferable to resin only tests.
GPC analysis of prepreg resin and constituent resin has shown that no significant
molecular changes have occurred during the prepregging process. Therefore, aging and
cross linking of the resin can be presumed negligible. This allows for the rheological
analysis of resin samples, taken immediately before the prepregging process, to be
compared to the properties of the prepreg. Molecular differences are recorded between
batches with alternate storage histories. Increased molecular weight and reduced cure
enthalpy is observed with longer storage, consistent with increased cross linking
through aging. A stiffening of the prepreg resin is observed with aging which appears
analogous to the stiffening seen in increasingly low tack resin formulations suggesting
that molecular weight Is used as a control of resin tack by manufacturers. Therefore, a
molecular diffuSion based time-temperature-super position principle could also apply to
resin formulation and aging.
R J Crossley 193

Chapter 6 - Conclusions
6.3 ATLdevelopment
6.3.1 Feasibility
The following material developments were made to facilitate the use of ATL as a wind
turbine production method:-
• An increase in fibre areal weight (FAW) from 200 to 400g/m2, Improving
deposition rates.
• High performance aerospace toughened epoxy 8552 resin has been replaced with
lowexotherm low cost epoxy M19.6LT resin system, allowing the cost effective
production of thick laminates using vacuum bagging.
• High cost carbon fibres have been replaced with cost effective e-glass fibres.
• High cost, high accuracy alloy aerospace mould tooling has been replaced with a
cost effective mould construction typical of that found In the wind turbine
industry.
ATL Materials were developed and evaluated based on cutting performance, tack to the
mould surface, backing paper release and repositionabillty. Cutting problems were
alleviated by changing the mechanical design of the cutter. Repositionabllity was found
to be a counterproductive method for evaluation since designing materials to be easily
repositioned results in an increase In the likelihood that they will move out of place after
lay-up. Observation and a force diagram of the ATL process reveal that:-
• Peel appears to be the dominant failure mechanism.
• Application and peel appear Instantaneous in a continuous process.
• Contact time Is inversely proportional to feed rate.
• Tape stiffness is favourable in holding the tape to the tool surface.
Therefore, backing paper release and tack to the mould surface are believed to be
fundamental In the lay-up process and subsequently a product of prepreg tack and
stiffness. A new peel method which simulates the ATL process was developed and used
to characterise tack and stiffness where values obtained were compared to ATL
performance. High tack levels were found to be detrimental due to poor release from
the backing paper and inability to be repositioned should an error occur. Existing
aerospace materials were shown to be much lower tack than that of wind energy
prepreg. A low tack stiff prepreg was eventually favoured by ATL operators with the use
of an In-house tackifier to alleviate the problem of poor mould adhesion
R J Crossley 194
Chapter 6 - Conclusions
Compatibility problems arose between low cost mould tooling typical of that used In
wind turbine blade manufacture and ATL machinery. The wind turbine blade moulds
were found to deform under the compaction pressure of the ATl head. The deformations
and large tolerances (±15mm) exceeded that of typical aerospace mould accuracy with
stiff high cost alloy tooling. These out of tolerance deviations from the programmed
surfaces caused the ATL to generate errors. The ATl was eventually reprogrammed
using actual surfaces measured from the mould, resolving the error. Therefore, a
reduction In compaction pressure and an ability to map actual mould surfaces In situ
would be benefiCial when using low cost mould tooling.
6.3.2 Application
Manufacturing conditions were recreated In tack and stiffness testing using a composite
mould surface rigid substrate coated with release agent. A peak mould tack was
Identified and considered an optimum lay-up point for increased tack. The optimum
point was recreated using ATl equipment and found to give increased tack. Increasing
feed rate showed loss of tack. Increasing feed rate with temperature Increases
according to the time temperature superposition principle showed signs that the
optimum tack conditions could be maintained. Therefore, results Indicate that tack and
stiffness test results can be directly related to ATl performance and the time
temperature superposition principle can be applied to stabilise tack levels throughout
the feed rate range.
Interfacial and cohesive failure modes observed In tack testing could also be observed
during ATllay-up and can be seen to correspond to pressure driven and surface tension
driven behaviours previously Identified [64]. Cohesive failure during lay-up was believed
to result in tape splitting due to low resin stiffness. Therefore, the optimum lay-up
condition appears to be in the interfacial failure domain at the point closely before
failure mode transttlon, when tack to the mould surface Is high. The ability to relate tack
and stiffness results to ATl performance allows the effect of variables on ATl to be
discussed based on tack and stiffness test findings.
Temperature, feed rate and resin type
Tack appears to be sensitive to shear storage modulus of the resin. The effect of
stiffening the resin by lowering the temperature, Increasing the feed rate or the
molecular weight of the resin results In a shift to Interfacial failure and a stiffer prepreg.
The three variables appear to be linked by the relative diffusion rate of the polymer. The
relative diffusion rate may be held constant during the change In one variable by
R J Crossley 195
Chapter 6 - Conclusions
adjusting another. For example, a higher molecular weight prepreg may display similar
tack properties as a low molecular weight polymer at higher temperatures. Additionally,
tack properties at low feed rates can be recreated at higher feed rates with Increased
temperature. Essentially, the effects of resin aging, which changes molecular weight and
changes in feed rate, required for various mechanical operations of ATL, could be
compensated for by changes in temperature to maintain consistent laminating
conditions. Resins such as that used in existing aerospace ATL tapes appear less
sensitive to changes in temperature and demonstrate Improved lay-up consistency.
Therefore, an alternative strategy would be to formulate resins which are less sensitive
to temperature and therefore feed rate changes.
Release agents
Release agents were found to significantly reduce available mould tack, which Is
detrimental to ATL performance. Therefore, development of an ATL friendly release
agent or gel coat would be benefiCial.
Compaction force
Compaction force appeared to be Ineffective at Increasing mould tack outside of the
failure mode transition region (2S-3S°C). Within this region significant tack could be
found with as little as BON. Therefore, compaction pressure could be reduced to
facilitate the use of reduced stiffness low cost mould tools.
Contact temperature
Hot application cold peel showed significantly Improved tack and could therefore be
utilised for future ATL designs.
Fibre areal weight (FAW)
Increasing fibre FAW results in a stiffer prepreg with no significant Increase in tack,
thought to be beneficial In Improving backing paper release.
6.4 Major conclusions
This section contains a summary of the major conclusions arising from the work
described In this thesls:-
I. Development of new wind energy E-glass fibre ATL tape has been achieved with
significant difficulty to produce a 7m representative section of a 4Sm commercial
wind turbine blade using ATL and low cost mould tooling.
R J Crossley 196
Chapter 6 - Conclusions
Ii. Tack and stiffness properties were found to be critical In achieving good ATL lay-
up performance. Tack to the mould surface combined with material stiffness
must exceed tack to the backing paper for successful lay-up.
III. A new prepreg tack and stiffness test has been developed. The test Is
advantageous due to a regulated application force, the ability to differentiate
between tack and bending stiffness, and a contact time which Is proportionate to
peel rate, simulating the ATL process.
Iv. The effects of temperature, feed rate, surface finish, release agents, compaction
pressure, surface energy, resin type, fibre weight, fibre type, resin content and
fibre architecture have been investigated with most variables demonstrating
significant effect on either tack, stiffness or both.
v, Tack variables were found to be effected either by changing surface properties or
the shear storage modulus of the melt.
vi. Two failure modes were observed. Interfacial failure appeared to occur at the
surface leaving little resin deposition on rigid test plates. Cohesive failure
appeared to occur within the bulk resulting in significant resin deposition and
fibril formation.
vii. During temperature or feed rate sweeps a peak in peel tack was recorded and
observed to occur at the transition between failure modes. The peak occurred
against a trend of falling stiffness for the resin component and was somewhat
supportive of the Dahlquist criterion concept. However, the actual value of the
criterion for prepreg is believed to be dependent on contact conditions.
viII. Both the tack and stiffness response of prepreg to feed rate and temperature
were found to follow the time temperature superposition principle using the WLF
equation. Consistent WLF constants could be found from rheology of the resin
component before impregnation.
ix. The impregnation process was found, by GPC and DSC, not to affect the
molecular size and distribution of the resin melt. Aging was found to Increase
molecular weight believed to be the result of cross-linking.
R J Crossley 197
Chapter 6 - Conclusions
x. Results from the tack and peel test were related directly to ATL performance.
Optimum high tack operating points were located by tack testing and recreated
on ATL equipment. Operating points were then transposed using the WLF
equation showing reasonable signs that the WLF relationship can be used to
improve ATL tack conststencv and increase feed rates.
xl. It Is proposed that engineering tack Is not a single property but a chain of
Interfacial and cohesive components. Each Is believed to have time dependant
properties and cross sectional area. Experiment time should begin at the point of
Influential molecular contact. Whichever component is weakest at any given time
will determine failure. To account for the effect of contaminates, the chain should
be extended to Include Interfacial and cohesive components of any weak
boundary layer.
xII. A descriptive engineering tack curve has been devised where tack Is normalised
against relative diffusion rate. Increasing Interfacial and reducing viscoelastic
curves are believed to meet at a point of peak tack where actual experimental
tack Is thought to fall below the lower of the two curves.
xiii. The apparent ability of an Arrhenius type equation to govern both viscoelastic
and interfacial properties has been discussed. The traditional free volume theory
was not considered satisfactory In accounting for Interface behaviour.
Alternatively, a thermodynamic Lennard-Jones molecular approach has been
proposed to account for experimental results.
R J Crossley 198

cnapter 7 - Recommendations and future work
7 Recommendations and future work
7.1 Tack and stiffne ..
The tack and stiffness test is proposed for use In other fields such as PSAs and surface
energy studies. The study of polymers In accurate dimensionally controlled resin films
without fibre effects may allow for improved isolation of variable effects. Surface energy
may also be correlated using standardised resin films.
Uniform resin films with perfectly smooth surfaces could be investigated to confirm the
lack of surface finish effect observed here. The results may help to determine whether
tack is diffusion or thermodynamically controlled.
The electrostatic effect requires further investigation since It could yield a useful tool In
automated handling of prepregs. It would also be useful to quantify the effects of
humidity as it Is considered an Important factor effecting lay-up performance.
The effect of molecular length and configuration on viscoelasticity and tack could be
investigated. A number of molecular configurations and dispersions could be tested to
gain an accurate picture of how features such as molecular weight, branching and
polymeric disperslty effect tack. The differing melts may also be tested to confirm the
validity of the WLF time temperature relationship in both tack and rheology.
The effects of surface energy also require further Investigation. It Is likely that the
gradient at which Interfacial failure meets cohesive failure in a tack temperature sweep
may be directly correlated to surface energy.
Molecular changes during aging and Its effect on tack would also benefit from
investigation. The results may lead to the possibility of extending prepreg out life which
Is generally determined by useful tack.
Thermodynamic Lenard lones modelling Is recommended as the method most likely to
yield accurate results. However, this type of modelling requires accuracy on an atomic
scale Including contaminant layers. Prediction of WLF constants could offer a Simplified
test of bulk dynamic properties of the model before moving on to contact Simulations.
Testing In a vacuum may also offer a Simplified experimental comparison.
R 1 Crossley 199

Chapter 7 - Recommendations and future work
7.2 Prepreg
The adoption and standardisation of the tack and stiffness test method for prepregs Is
recommended. For maximum benefit, resin manufacturers could include a tack and
stiffness to temperature plot using a standardised feed rate, application pressure,
humidity level, and surface. Inclusion of the resin's WLF constants, found by rheology,
would allow the superposition of tack and stiffness levels to suit the production
environment by adjusting lay-up feed rates or temperature. The standardisation of
measurement, calculation and specification of data is recommended and could lead to
the development of a British standard with the help of manufacturers and consumers.
The effects of aging would also require that tack properties be given some adjustment
depending on their storage history. Alternatively, Since tack appears to be the variable
limiting shelf life, manufacturers may wish to consider producing all prepreg at the
highest possible tack level and allowing it to age during transport and storage to give
the required tack level at the time of lamination. A time temperature indicator could be
Included in the packaging to show when the prepreg Is ready. Alternatively, customers
could perform their own b-staging within a short cycle in a low temperature oven
essentially accelerating the aging procedure. This method would take advantage of the
curing process, increasing the molecular weight to give the required tack level, and
could remove the need for freezer delivery and storage, further reducing the cost of
prepreg.
7.3 ATL
Modification of ATL equipment is proposed in an attempt to Improve performance.
Essentially, a favourable tack gradient through the prepreg thickness could be
attempted, where the tack to the mould surface exceeds that of the backing paper. The
tack gradient may be created by tailoring viscoelastic properties. This may be done by
resin formulation, where resin at the mould surface has a lower shear storage modulus
than that of the backing paper side. Alternatively, the favourable tack gradient could be
Induced by a temperature gradient with heat applied at the mould surface side which
would require repositioning of the heater element.
Significantly improved ATL feed rates could be attempted by exploring the limits and
application of the WLF relationship (Chapter 4.5). Control of the heater element via the
CNC program is recommended. Changing temperature with feed rate according to the
WLF relationship, and relevant constants for a particular material, should enable any
successful operating point to be maintained at a significantly higher feed rate,
R J Crossley 200
\..napt:er I - xecommenaenons ana future work
approaching that of the machines feed rate limit. For Example If M19.6LT 400g/m2 28%
resin content ATL prepreg was B-staged to give an optimum tack operating point of 100
mm/mm at 20°C then a temperature increase of 19.5 oC Is required to maintain this
operating point at a maximum output of 50,000 mm/min. At this speed, approximately
1.4 kW of heat Is needed to achieve the required temperature. Therefore, a 3kW heater
element positioned against the mould side of the prepreg would be recommended based
on a heating efficiency of around 50%. The difficulty of delivering such a rapid
temperature increase may be overcome with the use of laser, microwave or electron
beam heating.
In addition to maintaining tack performance the constant diffusion rate may also
produce a laminate with more consistent mechanical properties and is recommended for
further investigation. An alternative strategy may also be employed in formulating ATL
prepreg resins with reduced response to temperature and strain rate changes.
Essentially a reduced gradient of shear storage modulus response to temperature Is
required for more reduced sensitivity to feed rate changes. More flexibility In tracking of
the mould surface and a reduced compaction pressure are also recommended to
facilitate the use of low cost mould tooling.
R J Crossley 201
Appendix
Appendix
A. publications arising from this thesis
*Crossley, RJ., Schubel, P. J., Warrior, N. A. The Experimental Determination and
Control of Prepreg Tack for Automated Manufacture. In 14th European Conference on
Composite Materials (ECCM), June 2010, Budapest, Paper ID.403-ECCM14.
*The paper has been accepted for publication in the journal of Plastics, Rubber and
Composites ECCM14 special edition, Due 2011.
Crossley, R.J., Schubel P.J., Warrior N.A., Automated tape lay-up (ATL) of wind energy
grade materials, in the 2010 European Wind energy conference (EWEA 2010), May
2010, Warsaw, Poland.
Crossley, R.J., Schubel, P.J., Warrior, N.A., The experimental characterisation of prepreg
tack, in The 17th International Conference on Composite Materials (ICCM-17), 2009,
10M Communications Ltd, Edinburgh.
Crossley, RJ., Kemp, G., Hudson, N., Schubel, P., AIRPOWER** - Materials
Development and Strain Sensor Integration, July 2009, Technology Strategy Board
(TSB): SWindon.
Crossley, R.J., Schubel P.J., Mead F., AIRPOWER** - Response to Breakpoint Conditions
milestone report WP1, 2007, Technology Strategy Board (TSB): Swindon.
**The AIRPOWER project was selected as a finalist in the wind energy category of the
iec composttes2011 Innovation awards
R J Crossley 202
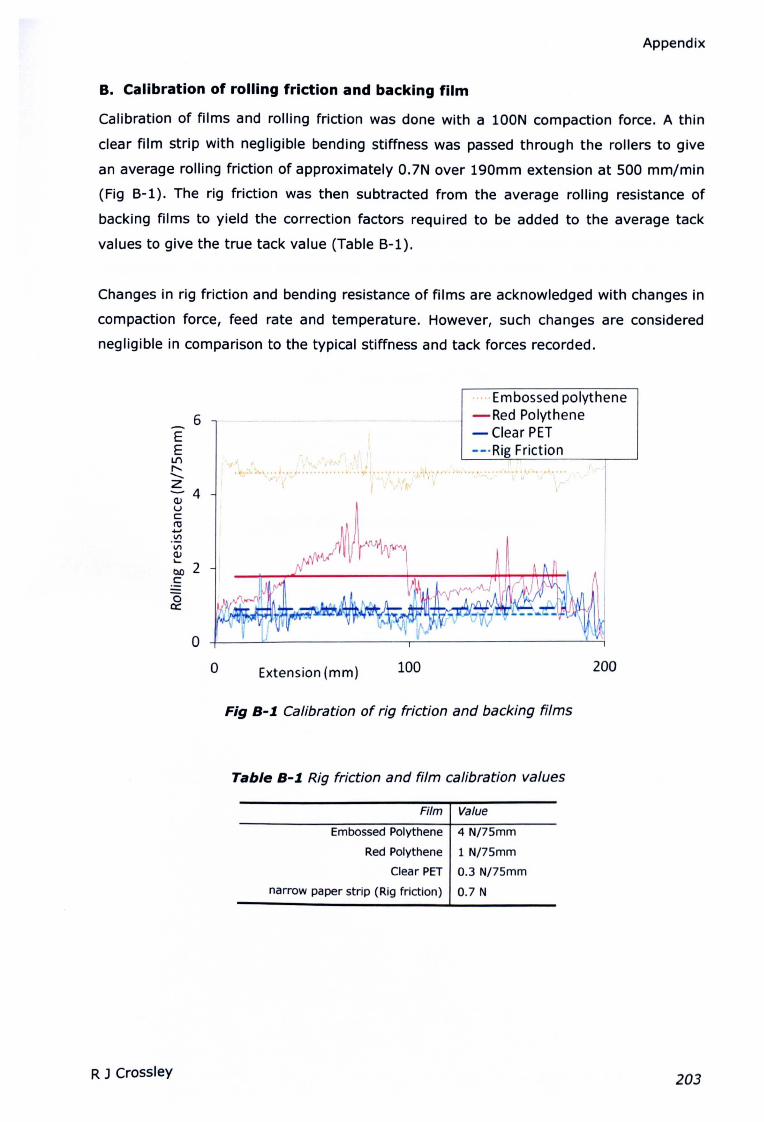
Appendix
B. Calibration of rolling friction and backing film
Calibration of films and rolling friction was done with a lOON compaction force. A thin
clear film strip with negligible bending stiffness was passed through the rollers to give
an average rolling friction of approximately 0.7N over 190mm extension at 500 rnrn/rnln
(Fig 8-1). The rig friction was then subtracted from the average rolling resistance of
backing films to yield the correction factors required to be added to the average tack
values to give the true tack value (Table 8-1).
Changes in rig friction and bending resistance of films are acknowledged with changes in
compaction force, feed rate and temperature. However, such changes are considered
negligible in comparison to the typical stiffness and tack forces recorded.
EE
Lf)r-,-zOJ 4ucro.....VI
VIOJ
~ 2c
(50:::
6
- -Ernbossed polythene-Red Polythene- Clear PET--·Rig Friction
~• f!I~........ ~ .• • 1• • • • • • • • • • • • • • • • •.;.i OIL., 0",
• ,I, I
oo 100 200Extension (mm)
Fig 8-1. Calibration of rig friction and backing films
Table 8-1. Rig friction and film calibration values
Film Value
Embossed Polythene 4 N/75mm
Red Polythene 1 N/75mm
Clear PET 0.3 N/75mm
narrow paper strip (Rig friction) 0.7 N
R J Crossley 203
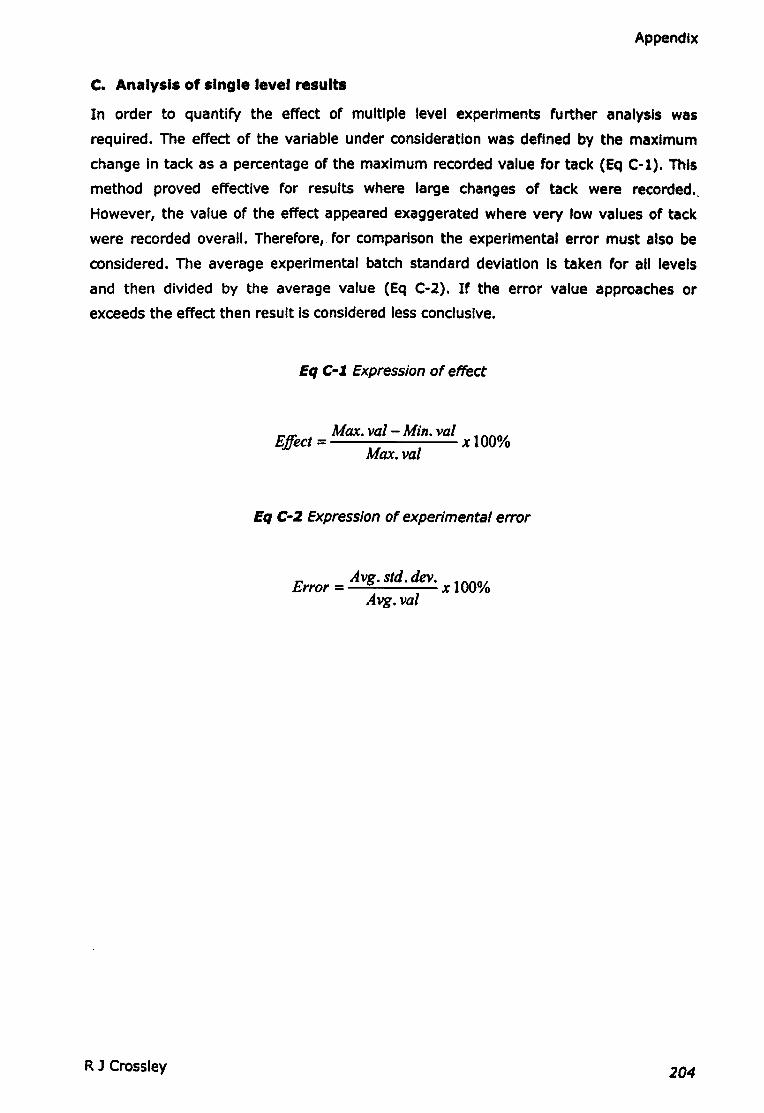
Appendix
c. Analysis of single level result.
In order to quantify the effect of multiple level experiments further analysis was
required. The effect of the variable under consideration was denned by the maximum
change In tack as a percentage of the maximum recorded value for tack (Eq C-l). This
method proved effective for results where large changes of tack were recorded -;
However, the value of the effect appeared exaggerated where very low values of tack
were recorded overall. Therefore,. for comparison the experimental error must also be
considered. The average experimental batch standard deviation Is taken for all levels
and then divided by the average value (Eq C-2). If the error value approaches or
exceeds the effect then result Is considered less conclusive.
Eq C-l Expression of effect
E~n; Max. val-Min. val 100°.1-weet = x 70
Max. val
Eq C-Z Expression of experimental error
E Avg. std. dev. 10001rror = x 70
Avg. val
R J Crossley 204

App ndlx
D. Analysis of temperature sweep results
In order to quantify the effect of multiple level experiments over a temperature sw p
range further analysis was required. The average tack level over a temperatur sw p
range encompassing both failure modes is considered (Fig 0-1). The av rage ck Is
expressed as the average integral of tack CEq 0-1). The overall experiment I rror Is
expressed in the same manner taking error values at y" and Y,,+1 ensuring that high
values of error which occur over a short temperature range are not over emphasised.
Tack (N175rmn)
Yntl _
y'l _
Temperature(0C)
X to X N (N = Range of points covering both failure modes)
Fig 0-1 Numerical analysis of results for temperature sweeps at a number of veri bl
levels
Eq D-1 The average tack of a temperature sweep experiment
Av.Tack =---. r~y.a·X
N- ll/l
R J Crossley 20
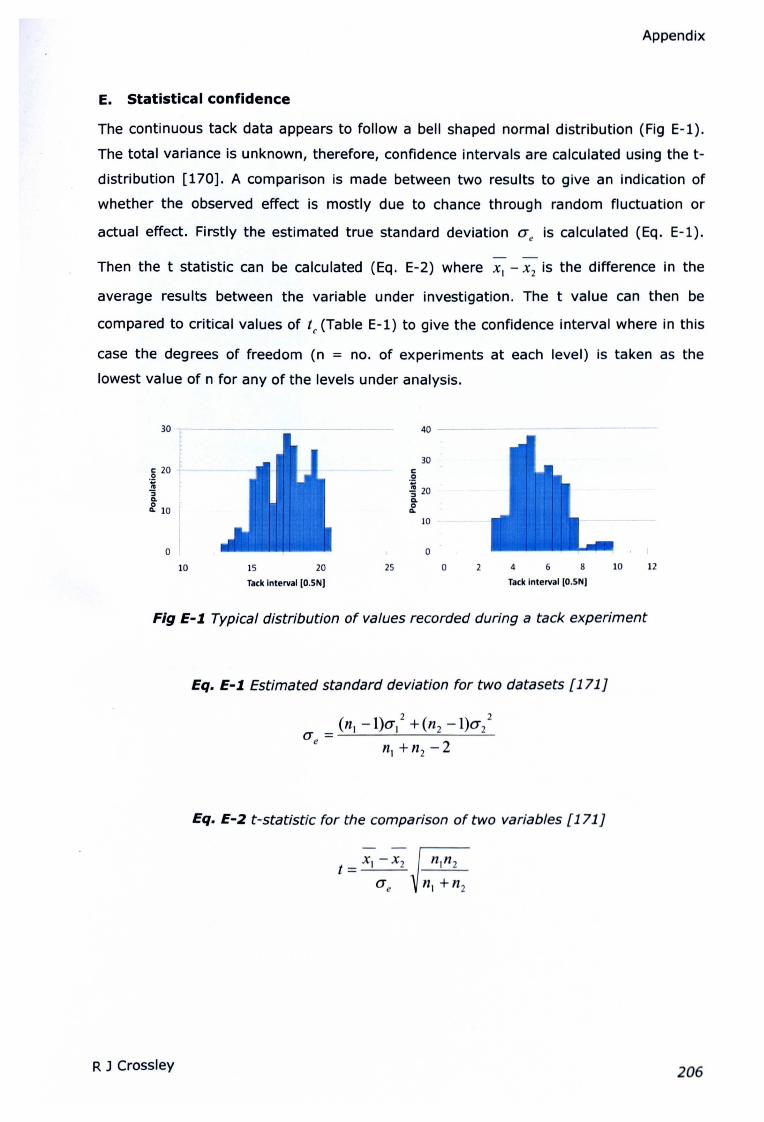
E. Statistical confidence
Appendix
The continuous tack data appears to follow a bell shaped normal distribution (Fig E-l).
The total variance is unknown, therefore, confidence intervals are calculated using the t-
distribution [170]. A comparison is made between two results to give an indication of
whether the observed effect is mostly due to chance through random fluctuation or
actual effect. Firstly the estimated true standard deviation a, is calculated (Eq. E-l).
Then the t statistic can be calculated (Eq. E-2) where XI - x2 is the difference in the
average results between the variable under investigation. The t value can then be
compared to critical values of Ie (Table E-1) to give the confidence interval where in this
case the degrees of freedom (n = no. of experiments at each level) is taken as the
lowest value of n for any of the levels under analysis.
c: 20.s1;:;Q.oQ. 10
10 15 20
Tack interval [O.SN)
30c:.2
~ 20Q.0...
10
0
25 0 2 4 6 8 10 12
Tack Interval [O.SN)
Fig E-1. Typical distribution of values recorded during a tack experiment
Eq. E-1. Estimated standard deviation for two datasets [171J
Eq. E-2 t-stetistic for the comparison of two variables [171J
I = _X.:_I _-_X..::,_2
R J Crossley 206
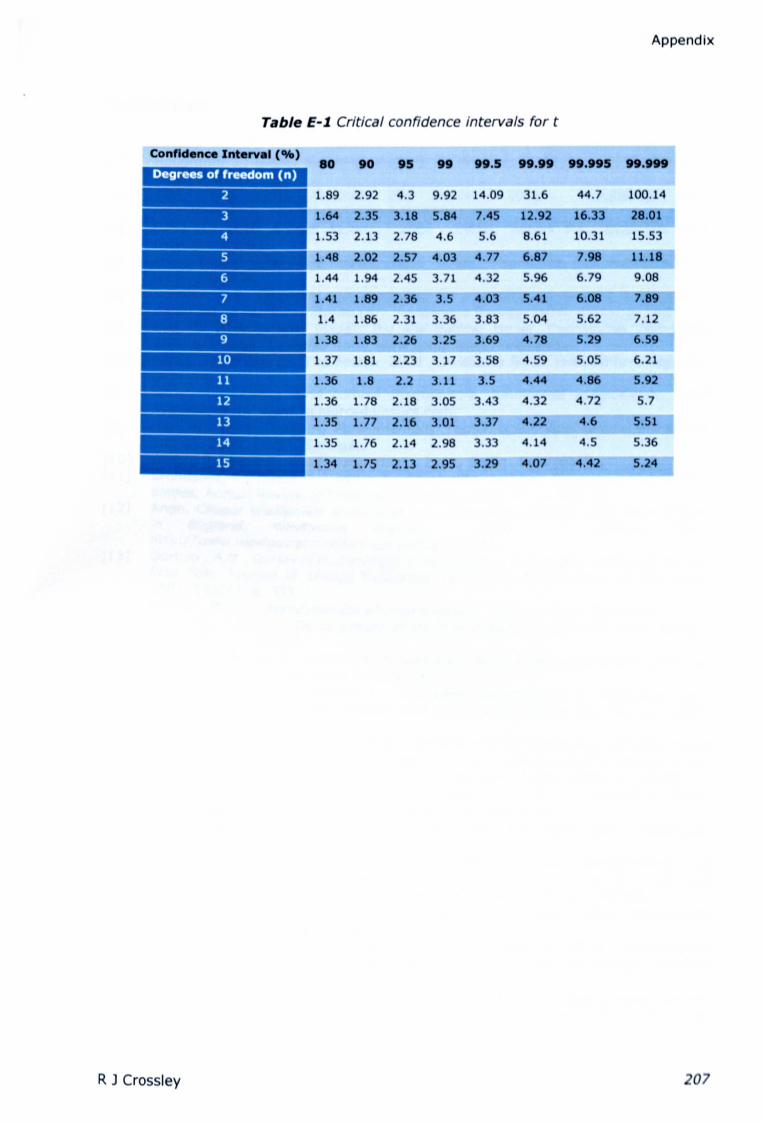
App nd x
Table E-J Critical confld nee Int rvals for t
Confidence Interv.' (CM.>80 to t, tt tt.5 tt." tt.tt, ",tH
1.89 2.92 4.3 9.92 14.09 31.6 44.7 100.14
1.64 2.J5 J.18 5.84 7.45 12.92 16.33 28.01
1.53 2.13 2.78 4.6 5.6 8.61 10.31 15.53
1.48 2.02 2.57 4.03 4.77 6.87 7.98 11.18
1.44 1.94 2.45 3.71 4.32 5.96 6.79 9.08
1.41 1.89 2.36 3.5 4.03 5.41 6.08 7.89
1.4 1.86 2.31 3.36 3.83 5.04 5.62 7.12
1.38 1.83 2.26 3.25 3.69 4.78 5.29 6.59
1.37 1.81 2.23 3.17 3.58 4.59 5.05 6.21
1.36 1.8 2.2 3.11 3.5 4.44 4.86 5.92
1.36 1.78 2.18 3.05 3.43 4.32 4.72 5.7
1.35 1.77 2.16 3.01 3.37 4.22 4.6 5.51
1.35 1.76 2.14 2.98 3.33 4.14 4.5 5.36
1.34 1.75 2.13 2.95 3.29 4.07 4.42 5.24
R J Crossley 07
References
References
[1] Houghton, J., Global warming. Reports on Progress in Physics, 2005. 6S(6): p.1343-403.
[2] Q&A: The Kyoto Protocol. BBC News 2005 Available from:http://news.bbc.co.uk/l/hi/sci/tech/4269921.stm.
[3] Rose, C. 2008 Annual Report. 200S EWEA, Report No., Available from:www.ewea.org.
[4] Anon. Global Wind 2008 Report. 2009 GWEC, Report No. N/a, Available from:www.gwec.net.
[5] Schubel, PJ., Technical cost modelling for a generic 4S-m wind turbine bladeproduced by vacuum infusion (VI). Renewable Energy, 2010. 35(1): p. 183-9.
[6] Red, C. Wind turbine blades: Big and getting bigger. Composites Technology200S 6/1/200S Available from: www.compositesworld.com.
[7] EWEA. Wind Energy, The Facts. 200S Available from: www.wind-energy-the-facts.org.
[S] Anon. Automating wind turbine manufacture. Reinforced plastics.com 2009Available from: www.reinforcedplastics.com.
[9] Hau, E., Wind Turbines, Fundamentals, Technologies, Application, Economics.2nd ed. 2006, Berlin: Springer.
[10] Gasch, R.,Twele J., Wind Power Plants. 2002, Berlin: Solarpraxis.[11] Brondsted, P., Lilholt H.,Lystrup A., Composite materials for wind power turbine
blades. Annual Review of Materials Research, 2005. 35: p. 505-3S.[12] Anon. Clipper Windpower announces groundbreaking offshore wind blade factory
in England. Windpower Monthly 2010 Available from:http://www.windpowermonthly.com/news/9S5112.
[13] Gorban', A.N., Gorlov A.M.,Silantyev V.M., Limits of the turbine efficiency for freefluid flow. Journal of Energy Resources Technology-Transactions of the Asme,2001. 123(4): p. 311-7.
[14] Hansen, M.O.L., Aerodynamics of wind turbines. 200S, London: Earthscan.[15] Fuglsang, P.,Bak c., Development of the Riso wind turbine airfoils. Wind Energy,
2004. 7(2): p. 145-62.[16] Burton, T., Sharp D., Jenkins N.,Bossanyi E., Wind Energy Handbook. 2006 ed.
2001, Chichester: John wiley & Sons Ltd.[17] Kong, C., Bang J.,Sugiyama Y., Structural investigation of composite wind
turbine blade considering various load cases and fatigue life. Energy, 2005.30{11-12): p. 2101-14.
[lS] Habali, S.M.,Saleh LA., Local aestqn, testing and manufacturing of small mixedairfoil wind turbine blades of glass fiber reinforced plastics Part I: Design of theblade and root. Energy Conversion and Management, 2000. 41(3): p. 249-80.
[19] Anon. Euros blades production catalogue. 2010 Available from:http://www.euros.de/en/products_blades_productlon.html.
[20] Quinn, J.A., Composites Design Manual. 1999, Lancaster, USA: TechnomlcPublishing.
[21] Schubel, P.J., Parsons A.J., Lester E.H.,Warrlor N.A., Characterisation ofthermoset laminates for cosmetic automotive applications: Part II - Cure andresidual volatile assessment. Composites, 2005. Part A(37): p. 1747-56.
[22] Hull, D.,Clyne T.W., An Introduction to Composite Materials. 2002, Cambridge,UK: Cambridge University Press.
[23] Ponten, A., Carstensen 0., Rasmussen K., Gruvberger B., et et, Epoxy-basedproduction of wind turbine rotor blades: occupational dermatoses. ContactDermatitis, 2004. 50(6): p. 329-3S.
[24] Khoun, L.,Hubert P., Cure Shrinkage Characterization of an Epoxy Resin Systemby Two in Situ Measurement Methods. Polymer Composites, 2010. 31(9): p.1603-10.
R J Crossley 208
References
[25] Adams, R.D., Yu H.,Karachalios V.F., Cure shrinkage in epoxy adhesIves, InEURADH 2000 5th European adhesion conference. 2000, SFV, Paris: lyon,France.
[26] Veers, P.S., Ashwill T.D., Sutherland HJ., laird D.L., et al., Trends in the desIgn,manufacture and evaluation of wind turbine blades. Wind Energy, 2003. 6(3): p.245-59.
[27] Astrom, B.T., Manufacturing of Polymer Composites. 1997, London: Chapman &Hall.
[28] Griffin, D.A., Cost & performance tradeoffs for carbon fibers in wInd turbineblades. Sampe Journal, 2004. 40(4): p. 20-8.
[29] Harris, B., Engineering Composite Materials. 1999, london: 10M Communicationsltd.
[30] Rudd, C.D., long A.C.,Kendail K.N., Liquid moulding technologies. 1997,Cambridge, England: Woodhead Publishing ltd.
[31] Chambers, A.R., Earl J.S., Squires C.A.,Suhot M.A., The effect of voids on theflexural fatigue performance of unidirectional carbon fibre composites developedfor wind turbine applications. International Journal of Fatigue, 2006. 28(10): p.1389-98.
[32] Cairns, D.S.,Skramstad J.D., Evaluation of hand lay-up and resin transfermoulding in composite wind turbine blade structures, in 45th InternationalSAMPEsymposium. 2000: Long Beach, CA, USA.
[33] Chatting, I. Resin Infusion Project. 2002 Department of Trade & Industry,Report No. ETSU W/45/00542/00/REP.
[34] Summerscales, J.,Searle TJ., Low-pressure (vacuum infusion) techniques formoulding large composite structures. Proceedings of the Institution of MechanicalEngineers Part l-Journal of Materials-Design and Applications, 2005. 219(ll): p.45-58.
[35] long, A.C., Design and manufacture of textile composites. 2005, CRC Press:Cambridge.
[36] Newell, G.C., Buckingham R.O.,Khodabandehloo K., The automated manufactureof prepreg broadgoods components - A review of literature. Composites Part A -Applied Science and Manufacturing, 1996.27(3): p. 211-7.
[37] Goode, K., Automated Ply Lamination, in ASM Handbook volume 21, Composites.1987, ASM International.
[38] Grimshaw, M.N., Grant C.G.,Diaz J.M.L., Advanced technology tape layIng foraffordable manufacturing of large composite structures. Polymer Composites,2007. 13(3): p. 197-206.
[39] lubin, G., Handbook of composites. 1982, london: Chapman & Hall.[40] Evans, D.O., Fiber Placement. ASM International, 2001. 1: p. 477-9.[41] Black, S. Getting to know "Black Aluminium". Modern Machine Shop 2008
Available from: http://www.mmsonllne.com/artlcles/gettlng-to-know-bl ck-aluminum.
[42] Skinner, M.L., Trends, advances and innovations in filament winding. Relnforc dPlastics, 2006. Feb(Feb): p. 28-33.
[43] sri, C.T.S. Lamellar line for the continuous production of GRP/GREPipe ND 100 •600mm. 2007 Available from: www.clmtec-holding.lt/lamellar.htm.
[44] Technobell, L. Continuous Filament Winding machine CFW4000. 2007 Av II blfrom: http://www.technobell.info/.
[45] Crossley, R.J., Schubel PJ.,Mead F. AIRPOWER - response to er, akpolntconditions milestone report WP1. 2007 01/11/2007 Technology Strategy Bo rd,Report No.
[46] Molyneux, M., Prepreg, Tape and Fabric Technology for Advanc d compost: .Composites, 1983. 14(2): p. 87-91.
[47] Ahn, KJ.,Seferis J.e., Prepreg Process Analysis. Polymer Composlt 5, 1993.14(4): p. 349-60.
[48] Saunders, KJ., Organic polymer chemistry. 1994: Chapman & Hall.[49] Allcock, H.R., Introduction to materials chemistry. 2008: John Wiley & Sons.
R J Crossley 209
References
[50] Rosu, D., Cascaval C.N., Mustata F.,Ciobanu C., Cure kinetics of epoxy resinsstudied by non-isothermal DSC data. Thermochimica Acta, 2002. 383(1-2): p.119-27.
[51] Banks, R., Mouritz A.P., John 5., Coman F., et al., Development of a newstructural prepreg: characterisation of handling, drape and tack properties.Composite Structures, 2004. 66(1-4): p. 169-74.
[52] Anon. Prepreg Technology. 2011 Available from: www.hexcel.com.[53] Akay, M., Effects of Prepreg Aging and Post-Cure Hygrothermal Conditioning on
the Mechanical-Behavior of Carbon-Fiber Epoxy Laminates. Composites Scienceand Technology, 1990.38(4): p. 359-70.
[54] Ahn, KJ., Peterson L., Seferis J.C., Nowacki D., et al., Prepreg Aging In Relationto Tack. Journal of Applied Polymer SCience, 1992.45(3): p. 399-406.
[55] Grimshaw, M.N., Automated Tape Laying, in ASM Handbook volume 21,Composites. 2001, ASM International. p. 480-5.
[56] Grimshaw, M., Grant C.,Diaz J., Advanced technology tape laying for affordablemanufacturing of large composite structures, in 46th International SAMPESymposium. 2001: Long Beach, CA.
[57] Sloan, J., ATL and AFP: Defining megatrends in composite aerostructures. Hlgh-Performance Composites, 2008. July 2008.
[58] Repecka, L., Prepreg Characteristics and Their Effects on Automated Tape LayingMachines, in SAMPE88. 1988, New Generation Materials and Processes: Milan. p.55-64.
[59] Shirinzadeh, B., Alici G., Foong C.W.,Cassidy G., Fabrication process of opensurfaces by robotic fibre placement. Robotics and Computer-IntegratedManufacturing, 2004. 20(1): p. 17-28.
[60] Lukaszewicz, D.H.-J.A.,Potter K.D., The internal structure and confirmation ofprepreg with respect to reliable automated processing. Composites Part a-Applied Science and Manufacturing, 2010. Online(Awaiting publication).
[61] Olsen, H.B.,Craig JJ., Automated Composite Tape Lay-up USing Robotic Devices.Proceedings: Ieee International Conference on Robotics and Automation, Vols 1-3, 1993: p. C291-7.
[62] Ruth, D.E.,Mulgaonkar P. Robotic lay-up of prepreg composIte plies. In Roboticsand automation, IEEE international conference on. 1990. Cincinnati: IEEE Xplore.
[63] Schulz, M.D., Grimshaw M.N.,Beard J. Tape Temperature Control System ForAutomated Tape-Laying of Low Tack Prepregs. in 33rd InternatIonal SAMPESymposium. 1988. California: SAMPE.
[64] Gutowski, T.G.,Bonhomme L., The Mechanics of Prepreg Conformance. Journal ofComposite Materials, 1988. 22(3): p. 204-23.
[65] Owen, P.S. Eurofighter Typhoon production. 2005 Available from:www.typhoon.starstreak.net/Eurofighter/production.html.
[66] Benson, V.M.,Arnold J. Automated fiber placement of advanced materials. 2006Wright-Patterson airforce base, Report No. AFRL-ML-WP-TP-2006-424.
[67] Un, H., Wang J., Long A.C., Clifford M.J., et al., Predictive modelling foroptimization of textile composite forming. Composites Science and Technology,2007.67(15-16): p. 3242-52.
[68] Ondarcuhu, T., Tack of a polymer melt: Adhesion measurements and fracturprofile observations. Journal De Physique n, 1997. 7(12): p. 1893-916.
[69] Cottingham, W.N.,Greenwood D.A., An introduction to the standard mod I ofparticle physics. 2nd ed. 2007, Cambridge: Cambridge University Press.
[70] Anon. Brian Cox: Large Hadron Collider is all about understanding th fore ofnature. 2009 Available from: http://www.belfasttelegraph.co.uk.
[71] Lee, L.-H., Fundamentals of adhesion. 1991, New York: Plenum Press.[72] Rubinstein, M.,Colby R.H., Polymer physics. 2006, Oxford: Oxford unlv rstty
press.[73] Kendall, K., Molecular Adhesion and its Applications, The Sticky Universe. 2001,
London: Plenum Publishers.
R J Crossley 210
References
[74] Benedek, I., Pressure sensitive adhesives and applications. 2nd ed. 2004,Wuppertal, Germany: Marcel Dekker Inc.
[75] Benedek, I.,Feldstein M.M., Fundamentals of pressure sensitivity. 2009, London:CRC Press.
[76] Putnam, J.W., Seferis J.C., Pelton T.,Wilhelm M., Perceptions of Prepreg Tack forManufacturability in Relation to Experimental Measures. Science and Engineeringof Composite Materials, 1995. 4(3): p. 143-54.
[77] Ahn, K.J., Seferis J.c., Pelton T.,Wilhelm M., Analysis and characterization ofprepreg tack. 1992. 13(3): p. 197-206.
[78] McMcMurtrie, R. Accutac Inc. 2009 Available from:http://www.antronics.com/accutac/ .
[79] Inc., T.M. Lab Master Loop Tack Tester. 2009 Available from:http://www.testingmachines.com/80-94-lab-master-loop-tack-tester.html.
[SO] Seferis, J.C.,Meissonnier J., Development of a Tack and Drape Test for PrepregsBased on Viscoelastic Principles. Sampe Quarterly-Society for the Advancementof Material and Process Engineering, 1989. 20(3): p. 55-64.
[81] Ahn, K,J., Seferis J.C., Pelton T.,Wilhelm M., Deformation Parameters InfluencingPrepreg Tack. Sampe Quarterly-Society for the Advancement of Material andProcess Engineering, 1992. 23(2): p. 54-64.
[S2] Putnam, J.W., Hayes B.S.,Seferis J.C., Prepreg process-structure-propertyanalysis and scale-up for manufacturing and performance. Journal of AdvancedMaterials, 1996. 27(4): p. 47-57.
[S3] oubois, a., Cam J.B.L.,Beakou A., Experimental Analysis of Prepreg Tack.Experimental Mechanics, 2009. Online.
[S4] Anon. World pressure sensitive tapes to 2012. 2009 Freedonla, Report No.,Available from: www.freedoniagroup.com.
[85] Gierenz, G.,Karmann W., Adhesives and Adhesive Tapes. 2001, New York: Wlley-VCH.
[86] Un, Y.Y., Hui C.Y.,Conway H.D., A detailed elastic analysis of the flat punch(Tack) test for pressure-sensitive adhesives. Journal of Polymer Science Part B-Polymer Physics, 2000. 38(21): p. 2769-84.
[S7] Tordjeman, P., Papon E.,Villenave J,J., Tack properties of pressure-sensitiveadhesives. Journal of Polymer Science Part B-Polymer Physics, 2000. 38(9): p.1201-8.
[88] Good, R.J., Theory of Cohesive Vs Adhesive Separation in an Adhering System.Journal of Adhesion, 1972.4(2): p. 133-&.
[89] Creton, C., Hooker J.,Shull K.R., Bulk and interfacial contributions to thedebonding mechanisms of soft adhesives: Extension to large strains. Langmu r,2001. 17(16): p. 4948-54.
[90] O'Connor, A.E., Willenbacher N., The effect of molecular weight and temperaturon tack properties of model polyisobutylenes. International Journal of Adh slonand Adhesives, 2004. 24(4): p. 335-46.
[91] Zosel, A., Adhesion and Tack of Polymers - Influence of Mechanical-Propertiesand Surface Tensions. Colloid and Polymer Science, 1985. 263(7): p. 541-53.
[92] Creton, C.,Leibler L., How does tack depend on time of contact and contactpressure? Journal of Polymer Science Part B-Polymer Physics, 1996. 34(3): p.545-54.
[93] Gay, C., Stickiness - Some fundamentals of adhesion. Integratlv ndComparative Biology, 2002. 42(6): p. 1123-6.
[94] Gay, C.,Leibler L., Theory of tackiness. Physical Review Letters, 1999. 82(5): p.936-9.
[95] Chiche, A., Pareige P.,Creton c., Role of surface roughness in controlling thedhesion of a soft adhesive on a hard surface. Comptes Rendus De L Ac d mlDes Sciences Serie Iv Physique Astrophysique, 2000. 1(9): p. 1197-204.
[96] Anon, Adhesives - Determination of peel resistance, floating roll r m thod.British standards institute, 1995. BS EN 1464: 1995.
R J Crossley211
[97]
[98]
[99]
[100]
[101]
[102]
[103]
[104]
[105]
[106]
[107]
[108]
[109]
[110]
[111]
[112]
[113]
[114]
[115][116]
[117]
[118][119]
[120]
References
Kendall, K., Thin-Film Peeling - Elastic Term. Journal of Physics D-AppliedPhysics, 1975. 8(13): p. 1449-52.Derail, c., Allal A., Marin G.,Tordjeman P., Relationship between viscoelastic andpeeling properties of model adhesives. Part 1. Cohesive fracture. Journal ofAdhesion, 1997. 61(1-4): p. 123-57.Christensen, S.F.,McKinley G.H., Rheological modelling of the peeling ofpressure-sensitive adhesives and other elastomers. International Journal ofAdhesion and Adhesives, 1998. 18(5): p. 333-43.Kaelble, D.H., Peel adhesion: Micro-fracture mechanics of interfacial unbondingof polyers. Transactions of the society of rheology, 1965.9(2): p. 135-63.Gibert, F.X., Allal A., Marin G.,Derail C., Effect of the rheological properties ofindustrial hot-melt and pressure-sensitive adhesives on the peel behavior.Journal of Adhesion Science and Technology, 1999. 13(9): p. 1029-44.Gent, A.N.,Petrich R.P. Adhesion of viscoelastic materials to rigid substrates. InRoyal Society of London 1969.Williams, M.L., Landel R.F.,Ferry J.~., The Temperature Dependence ofRelaxation Mechanisms in Amorphous Polymers and Other Glass-FormingLiquids. Physical Review, 1955.98(5): p. 3701-7.Aubrey, D.W.,Sherriff M., Peel Adhesion and Viscoelasticity of Rubber-ResinBlends. Journal of Polymer Science Part a-Polymer Chemistry, 1980. 18(8): p.2597-608.Kaelble, D.H., Theory and Analysis of Peel Adhesion - Bond Stresses andDistributions. Transactions of the Society of Rheology, 1960.4: p. 45-73.Aubrey, D.W., Welding G.N.,Wong T., Failure Mechanisms in Peeling of Pressure-Sensitive Adhesive Tape. Journal of Applied Polymer SCience, 1969. 13(10): p.2193-&.Gower, M.D.,Shanks R.A., The effect of chain transfer agent level on adhesiveperformance and peel master-curves for acrylic pressure sensitive adhesives.Macromolecular Chemistry and Physics, 2004. 205(16): p. 2139-50.Poh, B.T.,Yong A.T., Dependence of Peel Adhesion on Molecular Weight ofEpoxidized Natural Rubber. Journal of Adhesion. 2009. 85(7): p. 435-46.Gardon, J.L., Peel Adhesion. I. Some phenomenological Aspects of the Test.Journal of Applied Polymer SCience, 1963.7(1): p. 625-41.Horgnies, M., Darque-Ceretti E.,Felder E., Relationship between the fractureenergy and the mechanical behaviour of pressure-sensitive adhesives.International Journal of Adhesion and Adhesives, 2007. 27(8): p. 661-8.Kim, D.J., Kim H.J.,Yoon G.H., Effect of substrate and tackifier on peel strengthof SIS (styrene-isoprene-styrene)-based HMPSAs. International Journal ofAdhesion and Adhesives, 2005. 25(4): p. 288-95.Mark, J.E., Eisenberg A., Graessley W.W., Mandelkern L., et al., PhysicalProperties of Polymers. 2nd ed. 1993, Washington DC: American Chemicalsociety.Morrison, F.A., Understanding Rheology. 1st ed. 2001, Oxford: Oxford UniversityPress Inc.Shaw, M.T.,MacKnight W.J., Introduction to polymer viscoelasticity. 3rd ed.2005, Hoboken. New Jersey: John Wiley & Sons.Phan-thien, N., Understanding Viscoelasticity. 2002, Berlin: Springer.Rudin, A., The Elements of Polymer Science and Engineering. 2nd ed. 1999,London: Academic Press.Mezger, T.G., The Rheology Handbook. 2nd ed. 2006, Hannover, Germ ny:Vincentz Network GMBH.Gedde, U.W., Polymer Physics. 1995, London: Chapman & Hall.Chang, E.P., Viscoelastic Windows of Pressure-Sensitive Adhesives. Journal ofAdheslon, 1991. 34(1-4): p. 189-200.Lakrout, H., Sergot P.,Creton C., Direct observation of cavitation and fibrillatIonin a probe tack experiment on model acrylic Pressure-Sensitlve-Adheslv s.Journal of Adhesion, 1999. 69(3-4): p. 307-59.
R J Crossley212
References
[121] Ebnesajjad, S., Adhesives Technology Handbook. 2nd ed. 2008, New York:William Andrew Inc.
[122] Einstein, A., Investigations on the Theory of Brownian Movement, ed. Furth R.1926, London: Methuen & Co. ltd.
[123] Malone, L.J.,Dolter T.O., Basic Concepts of Chemistry. 8th ed. 2010, Hoboken,New Jersey, USA: John Wiley & Sons.
[124] Helrich, C.S., Modern Thermodynamics with Statistical Mechanics. 2009, Berlin:Springer-Verlag.
[125] Blundell, SJ.,Blundell K.M., Concepts in Thermal Physics. 2nd ed. 2010, Oxford:Oxford University Press.
[126] Sabbagh, H.,Eu B.C., Generic van der Waals equation of state for polymers,modified free volume theory, and the self-diffusion coefficient of polymericliquids. Physica a-Statistical Mechanics and Its Applications, 2010. 389( 12): p.2325-38.
[127] Shackleford, J.F., Introduction to materials science for engineers. 7th ed. 2009,Upper Saddle River N.J.: Pearson Prentice Hall.
[128] McCrum, N.G., Buckley C.P.,Bucknall C.B., Principles of Polymer Engineering. 2nded. 1997, Oxford: Oxford University Press.
[129] Richeton, J., Ahzi S., Daridon L.,Remond Y., Modeling of strain rates andtemperature effects on the yield behavior of amorphous polymers. Journal DePhysique Iv, 2003. 110: p. 39-44.
[130] van der Put, T.A.C.M., Theoretical derivation of the WLF- and annealingequations. Journal of Non-Crystalline Solids, 2010. 356(6-8): p. 394-9.
[131] Lide, D.R.,Hayes W.M., CRC Handbook of chemistry and physics. 2009, London:CRC press.
[132] Puddephatt, R.J.,Monaghan P.K., The periodic table of the elements. 1994,Oxford: Clarendon press.
[133] Harrison, K. Epoxy Resin @ 3Dchem.com. 2007 Available from:http://www.3dchem.com/molecules.asp?ID=326.
[134] Kiriy, A., Gorodyska G., Minko 5., Tsitsilianis C., et al., Chemical contrasting in asingle polymer molecule AFM experiment. Journal of the American ChemicalSociety, 2003. 125(37): p. 11202-3.
[135] Ferry, J.D., Viscoelastic properties of polymers. Third ed. 1980, New York: JohnWiley & Sons.
[136] Collins, E.A., Bares J.,Bilimeyer F.W., Experiments in polymer science. 1973,New York: John Wiley & Sons.
[137] Severs, E.T., Rheology of polymers. 1962, New York: Reinhold Publishing corp.[138] Degennes, P.G.,Leger L., Dynamics of Entangled Polymer-Chains. Annual Review
of Physical Chemistry, 1982. 33: p. 49-61.[139] Perkins, T.T., Smith D.E.,Chu 5., Direct Observation of Tube-Like MotIon of a
Single Polymer-Chain. SCience, 1994. 264(5160): p. 819-22.[140] Russell, T.P., Deline V.R., Dozier W.O., Felcher G.P., et al., Direct Observation of
Reptation at Polymer Interfaces. Nature, 1993. 365(6443): p. 235-7.[141] Schach, R.,Creton C., Adhesion at interfaces between highly entangled polym r
melts. Journal of Rheology, 2008. 52(3): p. 749-67.[142] DeGennes, P.G., Introduction to polymer dynamics. 1990, Cambrldg
Cambridge university press.[143] Menard, K.P., Dynamic Mechanical Analysis, A practical IntroductIon. 2008,
London: CRC Press.[144] Lakes, R.S., Viscoelastic solids. 1999: CRC press.[145] Israelachvili, J., Intermolecular & surface forces. 2nd ed. 2007, London:
Academic press.[146] De Coninck, J.,Blake T.D., Wetting and molecular dynamics simulatIons of lrno!
liquids. Annual Review of Materials Research, 2008. 38: p. 1-22.[147] Ingebrigtsen, T.,Toxvaerd 5., Contact angles of Lennard-Jones liquId neJ
droplets on planar surfaces. Journal of Physical Chemistry C, 2007. 111(24): p.8518-23.
R J Crossley 213
[148]
[149]
[150]
[151]
[152]
[153]
[154]
[155]
[156]
[157]
[158]
[159]
[160]
[161][162]
[163]
[164]
[165]
[166]
[167]
[168]
[169]
[170]
[171]
References
Sun, H., COMPASS:An ab initio force-field optimized for condensed-phaseapplications - Overview with details on alkane and benzene compounds. Journalof Physical Chemistry B, 1998. 102(38): p. 7338-64.MacKerell, A.D., Bashford D., Bellott M., Dunbrack R.L., et al., All-atom empiricalpotential for molecular modeling and dynamics studies of proteins. Journal ofPhysical Chemistry B, 1998. 102(18): p. 3586-616.Vollmayr-Lee, K., Single particle jumps in a binary Lennard-Jones system belowthe glass transition. Journal of Chemical Phvslcs, 2004. 121(10): p. 4781-94.Wu, C.F.,Xu W,J., Atomistic molecular modelling of crosslinked epoxy resin.Polymer, 2006. 47(16): p. 6004-9.L.Fischer, An introduction to gel chromatography, in Labratory techniques inbiochemistry and molecular biology, Work TS,Work E, Editors. 1969, NorthHolland Publishing Company: Amsterdam.Striegel, A.M., Yau W.W., Kirkland J.J.,Bly D.D., Modern Size-Exclusion LiquidChromatography. 2nd ed. 2009, New York: John Wily & Sons.Wu, S.H., Polymer Molecular-Weight Distribution from Dynamic MeltViscoelasticity. Polymer Engineering and Science, 1985. 25(2): p. 122-8.Timmer, W.A.,van Rooij R.P.J.O.M., Summary of the Delft University windturbine dedicated airfoils. Journal of Solar Energy Engineering-Transactions ofthe Asme, 2003. 125(4): p. 488-96.Grimshaw, M.N. Automated Tape Laying. 2007 Available from:http://www.cincinnatilamb.com/downloads/AutomatedTapeLaylng.pdf.Ramirez, J.,Likhtmen A. Reptate: Rheology of Entangled Polymers Toolkit forAnalysis of Theory and Experiment. 2009 Available from: www.reptate.com.Gillanders, A.M., Determination of prepreg tack. Int. J. Adhesion and adhesives,1981. 1(3): p. 125-34.Sanjana, S.N., Overage Indicators for Prepreg Products. Sampe Journal, 1980.16(1): p. 5-11.Aspenes, G., Hoiland S., Barth T.,Askvik K.M., The influence of petroleum acidsand solid surface energy on pipeline wettability in relation to hydrate deposition.Journal of Colloid and Interface SCience, 2009. 333(2): p. 533-9.Murphy, J., Additives for Plastics. 2nd ed. 2001, Oxford: Elsevier Science Ltd.Kang, K.H., How electrostatic fields change contact angle in electrowetting.Langmuir, 2002. 18(26): p. 10318-22.Abraham, T., Banik K.,Karger-Kocsis J., All-PP composites (PURE (R)) withunidirectional and cross-ply lay-ups: dynamic mechanical thermal analysis.Express Polymer Letters, 2007. 1(8): p. 519-26.Galwey, A.K.,Brown M.E., A Theoretical Justification for the Application of theArrhenius Equation to Kinetics of Solid-State Reactions (Mainly Ionic-Crystals).Proceedings of the Royal Society of London Series a-Mathematical and Physic ISCiences, 1995.450(1940): p. 501-12.Galwey, A.K.,Brown M.E., Application of the Arrhenius equation to solid statkinetics: can this be justified? Thermochimica Acta, 2002. 386(1): p. 91-8.Johnson, J.K., Muller E.A.,Gubbins K.E., Equation of State for L nnerd-Ion 5Chains. Journal of Physical Chemistry, 1994.98(25): p. 6413-9.Larson, R.S.,Lightfoot E.J., Thermally Activated Escape from a Lenn rd-Ionpotential Well. Physica A, 1988. 149(1-2): p. 296-312.Johnson, K.L., Mechanics of adhesion. Tribology International, 1998. 31(8): o.413-8.Yu, N.,Polycarpou A.A., Adhesive contact based on the tennsra-ion spot ntl l:a correction to the value of the equilibrium distance as used In tn pot ntl I.Journal of Colloid and Interface SCience, 2004. 278(2): p. 428-35.Box, G.E.P., Hunter J.S.,Hunter W.G., Statistics for Experiment rs. 200 t
Hoboken, New Jersey: John Wiley & Sons.Hodgkinson, J.M., Mechanical testing of advanced fibre compo It s. 2000,Cambridge, England: Woodhead publishing Ltd.
R J Crossley 214
Related Documents