Deutsche Bank Markets Research Industry Solar Date 27 February 2015 North America United States Industrials Clean Technology F.I.T.T. for investors Crossing the Chasm Solar Grid Parity in a Low Oil Price Era Despite the recent drop in oil price, we expect solar electricity to become competitive with retail electricity in an increasing number of markets globally due to declining solar panel costs as well as improving financing and customer acquisition costs. Unsubsidized rooftop solar electricity costs between $0.08-$0.13/kWh, 30-40% below retail price of electricity in many markets globally. In markets heavily dependent on coal for electricity generation, the ratio of coal based wholesale electricity to solar electricity cost was 7:1 four years ago. This ratio is now less than 2:1 and could likely approach 1:1 over the next 12-18 months. Vishal Shah Research Analyst (+1) 212 250-0028 [email protected] Jerimiah Booream-Phelps Research Associate (+1) 212 250-3037 [email protected] ________________________________________________________________________________________________________________ Deutsche Bank Securities Inc. Deutsche Bank does and seeks to do business with companies covered in its research reports. Thus, investors should be aware that the firm may have a conflict of interest that could affect the objectivity of this report. Investors should consider this report as only a single factor in making their investment decision. DISCLOSURES AND ANALYST CERTIFICATIONS ARE LOCATED IN APPENDIX 1. MCI (P) 148/04/2014.

Crossing the chasm: solar grid parity in a low oil price era
Jul 30, 2015
Welcome message from author
This document is posted to help you gain knowledge. Please leave a comment to let me know what you think about it! Share it to your friends and learn new things together.
Transcript

Deutsche Bank Markets Research
Industry
Solar
Date
27 February 2015
North America
United States
Industrials
Clean Technology
F.I.T.T. for investors
Crossing the Chasm
Solar Grid Parity in a Low Oil Price Era Despite the recent drop in oil price, we expect solar electricity to become competitive with retail electricity in an increasing number of markets globally due to declining solar panel costs as well as improving financing and customer acquisition costs. Unsubsidized rooftop solar electricity costs between $0.08-$0.13/kWh, 30-40% below retail price of electricity in many markets globally. In markets heavily dependent on coal for electricity generation, the ratio of coal based wholesale electricity to solar electricity cost was 7:1 four years ago. This ratio is now less than 2:1 and could likely approach 1:1 over the next 12-18 months.
Vishal Shah
Research Analyst
(+1) 212 250-0028
Jerimiah Booream-Phelps
Research Associate
(+1) 212 250-3037
________________________________________________________________________________________________________________
Deutsche Bank Securities Inc.
Deutsche Bank does and seeks to do business with companies covered in its research reports. Thus, investors should be aware that the firm may have a conflict of interest that could affect the objectivity of this report. Investors should consider this report as only a single factor in making their investment decision. DISCLOSURES AND ANALYST CERTIFICATIONS ARE LOCATED IN APPENDIX 1. MCI (P) 148/04/2014.


Deutsche Bank Markets Research
North America
United States
Industrials
Clean Technology
Industry
Solar
Date
27 February 2015
FITT Research
Crossing the Chasm
Solar Grid Parity in a Low Oil Price Era
________________________________________________________________________________________________________________
Deutsche Bank Securities Inc.
Deutsche Bank does and seeks to do business with companies covered in its research reports. Thus, investors should be aware that the firm may have a conflict of interest that could affect the objectivity of this report. Investors should consider this report as only a single factor in making their investment decision. DISCLOSURES AND ANALYST CERTIFICATIONS ARE LOCATED IN APPENDIX 1. MCI (P) 148/04/2014.
Vishal Shah
Research Analyst
(+1) 212 250-0028
Jerimiah Booream-Phelps
Research Associate
(+1) 212 250-3037
Despite the recent drop in oil price, we expect solar electricity to become competitive with retail electricity in an increasing number of markets globally due to declining solar panel costs as well as improving financing and customer acquisition costs. Unsubsidized rooftop solar electricity costs between $0.08-$0.13/kWh, 30-40% below retail price of electricity in many markets globally. In markets heavily dependent on coal for electricity generation, the ratio of coal based wholesale electricity to solar electricity cost was 7:1 four years ago. This ratio is now less than 2:1 and could likely approach 1:1 over the next 12-18 months.
Electricity Prices are Increasing, Despite Nat Gas Price Swings Peak to trough, average monthly natural gas prices have decreased ~86% over the past 10 years. Yet, during this time period, average electricity prices have increased by ~20% in the US. The main driver for rising electricity bill is that T&D investments which represent 50% of bill have continued to ramp and have accelerated recently. In 2010, T&D capex levels of for US Utilities ~$27B were ~300% higher than 1981 levels. We expect electricity prices worldwide to double over the next 10-15 years making the case for solar grid parity even stronger.
Solar System Costs Could Continue to Decline The economics of solar have improved significantly due to the reduction in solar panel costs, financing costs and balance of system costs. Overall solar system costs have declined at ~15% CAGR over the past 8 years and we expect another 40% cost reduction over the next 4-5 years. YieldCos have been a big driver in reducing the cost of capital and we expect emergence of international yieldcos to act as a significant catalyst in lowering the cost of solar power in emerging markets such as India.
How to Make Hay While the Sun Shines? The solar sector has been generally under owned by institutional investors and we expect greater institutional ownership to drive positive momentum for the sector over the next 12-18 months. We expect a number of new business models focused on the downstream part of the value chain to emerge and expect innovative private companies to drive cost improvement/solar adoption. We believe companies involved in financing/downstream part of the value chain stand to generate the most significant shareholder value in the near
term. Our top picks include SUNE, SCTY, SPWR, TSL, FSLR and VSLR.

27 February 2015
Clean Technology
Solar
Page 2 Deutsche Bank Securities Inc.
Table Of Contents
The New Dawn .................................................................... 4
Solar Total Addressable Market is Massive ........................ 6
Grid Parity is Here ............................................................... 9 Over 50% of Countries Under Review are Likely at Grid Parity Today ................ 9
Electricity: Capacity and Demand Increasing .................... 13 Electricity Demand Growth Will Continue to Rise ............................................. 13
Solar Can Still Grow in Low Oil Price Era: ......................... 22 Worldwide Oil Use in Electricity Generation ...................................................... 22 Cost of Oil Based Electricity Generation? .......................................................... 23 Long Term Relationship between Oil and Electricity ......................................... 25 What Makes an Electricity Bill? .......................................................................... 27 Forget Oil, Even Nat Gas Has Limited Impact on Retail Electricity Prices ........ 29 T&D Capex is a Significant Driver of End-User Electricity Bills ......................... 30 Electricity Prices Are Increasing ......................................................................... 31
Solar “System” Costs Could Continue to Decline ............. 34 Where Are We Today: Our Take ........................................................................ 34
YieldCos: Enabling The Transition To Grid Parity Growth . 42 What are the benefits of YieldCos to the parent companies? ........................... 42 How Does a Yieldco – Parentco Create Value? .................................................. 43
Storage: The Missing Link of Solar Adoption .................... 44
How To Make Hay While the Sun Shines? ....................... 57 Long Term Risk: Evolving Utility Business Models ............................................ 58
Key Solar Markets – Multi GW ..................................... 59 USA ..................................................................................................................... 59 Five Reasons Why Growth in the U.S Solar Market Could Exceed Expectations ............................................................................................................................ 59 2016, 2017 and Beyond: Our Outlook ................................................................ 76 2016 Scenario: 47 States at Grid Parity ............................................................. 78 2017+: 41 States at Grid Parity .......................................................................... 80 China ................................................................................................................... 83 Japan .................................................................................................................. 91 India .................................................................................................................... 98 Germany ........................................................................................................... 107 UK ..................................................................................................................... 113
Key Markets – The ~1GW Club ....................................... 118 Mexico .............................................................................................................. 118 Philippines ........................................................................................................ 121 France ............................................................................................................... 125 Chile .................................................................................................................. 130 South Africa ...................................................................................................... 136 Australia ............................................................................................................ 139
Key Markets: ~500MW Club ........................................... 144 Brazil ................................................................................................................. 144 Canada .............................................................................................................. 148 Thailand ............................................................................................................ 154 Saudi Arabia ..................................................................................................... 159
27 February 2015
Clean Technology
Solar
Deutsche Bank Securities Inc. Page 3
Table Of Contents (Cont'd))
Key Markets: <500MW ................................................... 163 Italy ................................................................................................................... 163 UAE ................................................................................................................... 167 Jordan ............................................................................................................... 170 Demand Overview ............................................................................................ 174
Supply .............................................................................. 176
Supply .............................................................................. 178 Supply Demand: Could Be Tight ...................................................................... 179

27 February 2015
Clean Technology
Solar
Page 4 Deutsche Bank Securities Inc.
The New Dawn
We write this report because we think solar has now become an investable
sector and over the next 5-10 years, we expect new business models to
generate a significant amount of economic and shareholder value.
Looking back 8-10 years ago, the solar industry was in the primitive stages and
mostly dependant on government subsidies. Most companies that came to the
public market were manufacturing businesses earning above-average returns
due to unsustainable government subsidies.
The global financial crisis which resulted in the demise of several solar
companies was really a blessing in disguise. The financial crisis really acted as
a catalyst that resulted in reduction of solar hardware costs. Emergence of
innovative financing models by companies such as SolarCity and NRG really
acted as the second catalyst for further reduction in solar financing costs.
As we look out over the next 5 years, we believe the industry is set to
experience the final piece of cost reduction - customer acquisition costs for
distributed generation are set to decline by more than half as customer
awareness increases, soft costs come down and more supportive policies are
announced.
While the outlook for small scale distributed solar generation looks promising,
we remain equally optimistic over the prospects of commercial and utility scale
solar markets. We believe utility scale solar demand is set to accelerate in both
the US and emerging markets due to a combination of supportive policies and
ongoing solar electricity cost reduction. We remain particularly optimistic over
growth prospects in China, India, Middle East, South Africa and South
America.
Several companies are working on improving the cost of energy storage and
we expect significant progress on this front over the next 5 years. Solar plus
storage is the next killer app that could significantly accelerate global solar
penetration in our view. Solar is competitive in many markets globally today.
But difficulty in accessing the grid and lack of net metering policies globally
make the penetration of current technology relatively challenging despite
attractive economics. We believe reduction in solar storage costs could act as
a significant catalyst for global solar adoption, particularly in high electricity
markets such as Europe.
While it is becoming increasingly clear that solar is now competitive with
conventional electricity generation in many global markets, we believe there is
still some policy uncertainty that could impact investor sentiment and overall
supply/demand fundamentals. That said, we believe the dependence on
subsidies has decreased significantly compared to a few years ago and
demand drivers are also increasingly more diverse as well as sustainable. We
expect solar sector's dependence on subsidies to gradually decrease over time,
policy outlook to become more supportive and economics to take over politics
over the next 3 years.
27 February 2015
Clean Technology
Solar
Deutsche Bank Securities Inc. Page 5
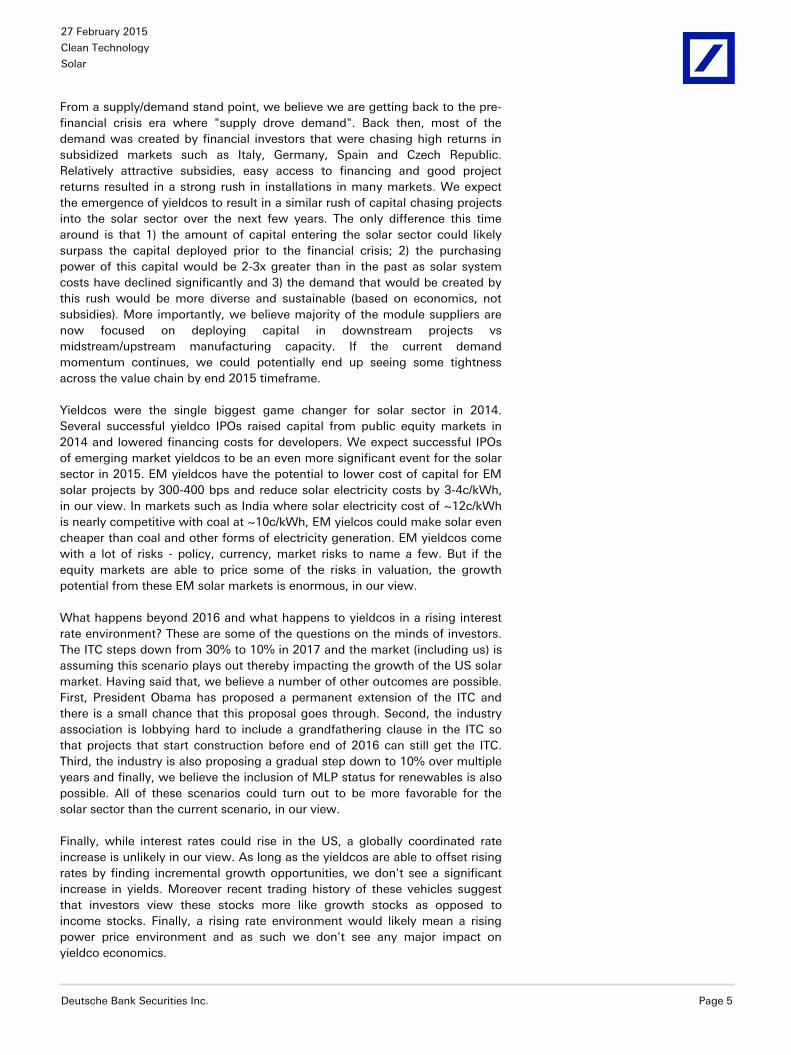
From a supply/demand stand point, we believe we are getting back to the pre-
financial crisis era where "supply drove demand". Back then, most of the
demand was created by financial investors that were chasing high returns in
subsidized markets such as Italy, Germany, Spain and Czech Republic.
Relatively attractive subsidies, easy access to financing and good project
returns resulted in a strong rush in installations in many markets. We expect
the emergence of yieldcos to result in a similar rush of capital chasing projects
into the solar sector over the next few years. The only difference this time
around is that 1) the amount of capital entering the solar sector could likely
surpass the capital deployed prior to the financial crisis; 2) the purchasing
power of this capital would be 2-3x greater than in the past as solar system
costs have declined significantly and 3) the demand that would be created by
this rush would be more diverse and sustainable (based on economics, not
subsidies). More importantly, we believe majority of the module suppliers are
now focused on deploying capital in downstream projects vs
midstream/upstream manufacturing capacity. If the current demand
momentum continues, we could potentially end up seeing some tightness
across the value chain by end 2015 timeframe.
Yieldcos were the single biggest game changer for solar sector in 2014.
Several successful yieldco IPOs raised capital from public equity markets in
2014 and lowered financing costs for developers. We expect successful IPOs
of emerging market yieldcos to be an even more significant event for the solar
sector in 2015. EM yieldcos have the potential to lower cost of capital for EM
solar projects by 300-400 bps and reduce solar electricity costs by 3-4c/kWh,
in our view. In markets such as India where solar electricity cost of ~12c/kWh
is nearly competitive with coal at ~10c/kWh, EM yielcos could make solar even
cheaper than coal and other forms of electricity generation. EM yieldcos come
with a lot of risks - policy, currency, market risks to name a few. But if the
equity markets are able to price some of the risks in valuation, the growth
potential from these EM solar markets is enormous, in our view.
What happens beyond 2016 and what happens to yieldcos in a rising interest
rate environment? These are some of the questions on the minds of investors.
The ITC steps down from 30% to 10% in 2017 and the market (including us) is
assuming this scenario plays out thereby impacting the growth of the US solar
market. Having said that, we believe a number of other outcomes are possible.
First, President Obama has proposed a permanent extension of the ITC and
there is a small chance that this proposal goes through. Second, the industry
association is lobbying hard to include a grandfathering clause in the ITC so
that projects that start construction before end of 2016 can still get the ITC.
Third, the industry is also proposing a gradual step down to 10% over multiple
years and finally, we believe the inclusion of MLP status for renewables is also
possible. All of these scenarios could turn out to be more favorable for the
solar sector than the current scenario, in our view.
Finally, while interest rates could rise in the US, a globally coordinated rate
increase is unlikely in our view. As long as the yieldcos are able to offset rising
rates by finding incremental growth opportunities, we don't see a significant
increase in yields. Moreover recent trading history of these vehicles suggest
that investors view these stocks more like growth stocks as opposed to
income stocks. Finally, a rising rate environment would likely mean a rising
power price environment and as such we don't see any major impact on
yieldco economics.

27 February 2015
Clean Technology
Solar
Page 6 Deutsche Bank Securities Inc.
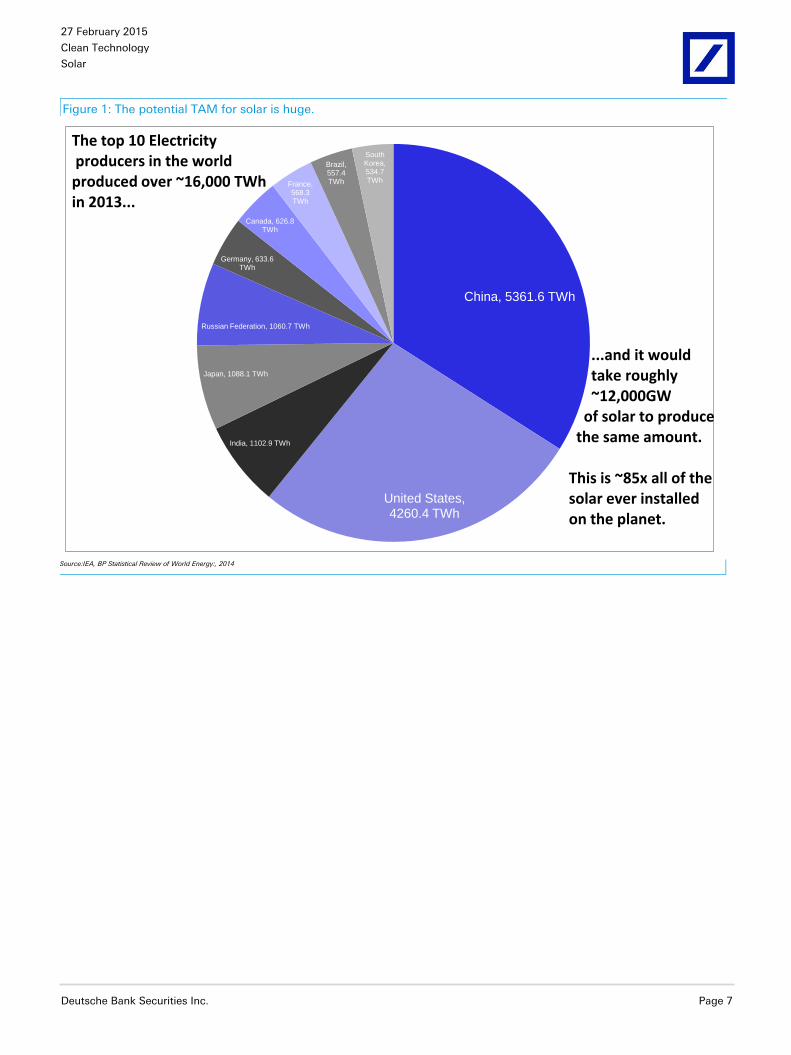
Solar Total Addressable Market is Massive
So how big could the solar market get? What is a reasonable medium term
growth expectation? How about the near term growth outlook? Could our
growth assumptions prove to be conservative? These are some of the
commonly asked questions by investors. First, we believe if the entire global
electricity generation were to be from solar, existing installed base (of solar)
would need to be expanded by 120x. The top 10 electricity producing nations
in the world generated over 16,000 TWh of electricity in 2013 and it would
take roughly 12,000GW of solar to produce the same amount of electricity.
Clearly, the total addressable market size is huge.
Despite the 30% CAGR over the past 20 years, the solar industry is still roughly
1% of the 6,000 GW or $2 trillion electricity market. Over the next 20 years, we
expect the electricity market to double to $4 trillion and expect the solar
industry to increase by a factor of 10. During this timeframe, the solar industry
is expected to generate $5 trillion of cumulative revenue. By the year 2050, we
expect global solar penetration rates to increase to 30%. We also see solar
penetration rates increasing more rapidly in developing economies. India for
example has recently announced targets to reach 100GW of solar capacity by
2022. Current installed generating capacity in India is ~280GW and the total
installed generating capacity is estimated to reach 800GW by 2035. Assuming
installed generating capacity reaches 400GW by 2022 timeframe, solar
penetration would reach 25% of total capacity and nearly 60% of new installed
capacity would be from solar sector. We believe the opportunity would be
even bigger if companies start adding services to the solar PV offering and
venture into adjacent markets such as wind and hydro.
In the year 2000, solar was installed on roughly 100,000 homes and facilities.
Over the last 15 years through 2015, solar has been installed on roughly 6
million homes and facilities. Nearly 200 GW of solar or roughly $900 billion of
value was installed, but solar is still less than 1% of global electricity
production. Over the next 20 years, we expect over 100 million new customers
to deploy solar and roughly $4 trillion of value to be created during this
timeframe. Over the next 20 years, we expect nearly 10% of global electricity
production to come from solar. Bottom line: we believe the solar industry is
going through fundamental change and the opportunity is bigger than it has
ever been before.
27 February 2015
Clean Technology
Solar
Deutsche Bank Securities Inc. Page 7
Figure 1: The potential TAM for solar is huge.
China, 5361.6 TWh
United States, 4260.4 TWh
India, 1102.9 TWh
Japan, 1088.1 TWh
Russian Federation, 1060.7 TWh
Germany, 633.6 TWh
Canada, 626.8 TWh
France, 568.3 TWh
Brazil, 557.4 TWh
South Korea, 534.7 TWh
The top 10 Electricityproducers in the worldproduced over ~16,000 TWhin 2013...
...and it would take roughly~12,000GW
of solar to producethe same amount.
This is ~85x all of thesolar ever installedon the planet.
Source:IEA, BP Statistical Review of World Energy:, 2014
27 February 2015
Clean Technology
Solar
Page 8 Deutsche Bank Securities Inc.
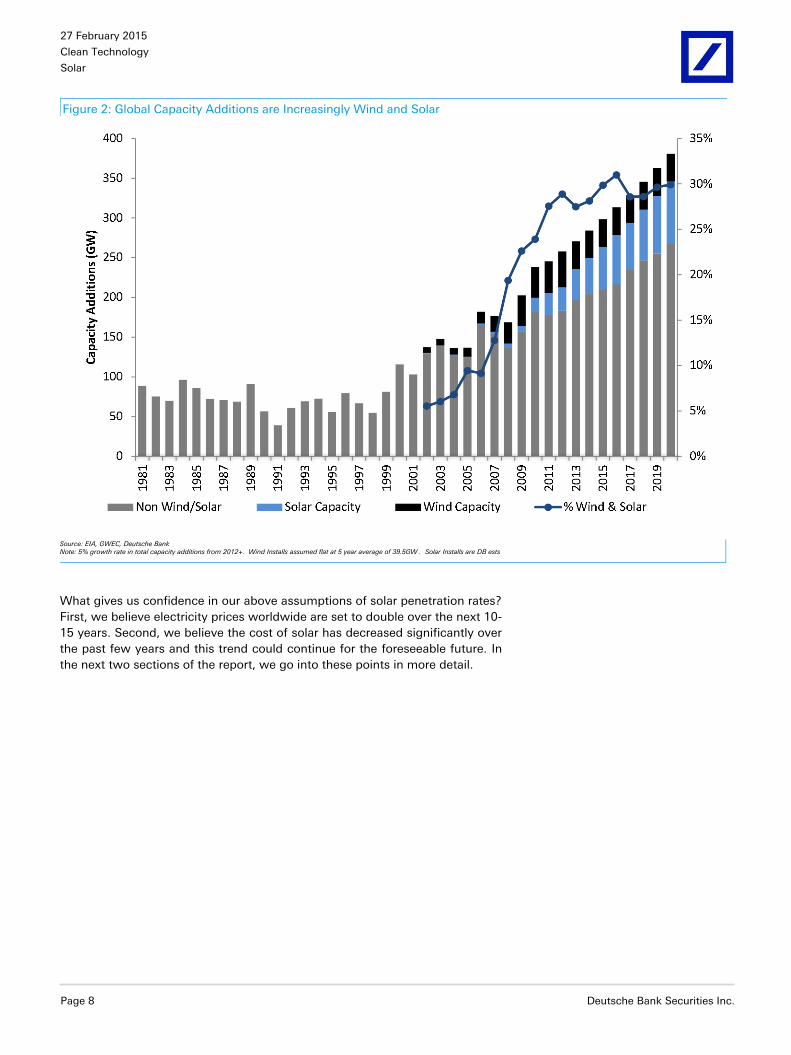
Figure 2: Global Capacity Additions are Increasingly Wind and Solar
Source: EIA, GWEC, Deutsche Bank Note: 5% growth rate in total capacity additions from 2012+. Wind Installs assumed flat at 5 year average of 39.5GW . Solar Installs are DB ests
What gives us confidence in our above assumptions of solar penetration rates?
First, we believe electricity prices worldwide are set to double over the next 10-
15 years. Second, we believe the cost of solar has decreased significantly over
the past few years and this trend could continue for the foreseeable future. In
the next two sections of the report, we go into these points in more detail.
27 February 2015
Clean Technology
Solar
Deutsche Bank Securities Inc. Page 9
Grid Parity is Here
Over 50% of Countries Under Review are Likely at Grid Parity Today
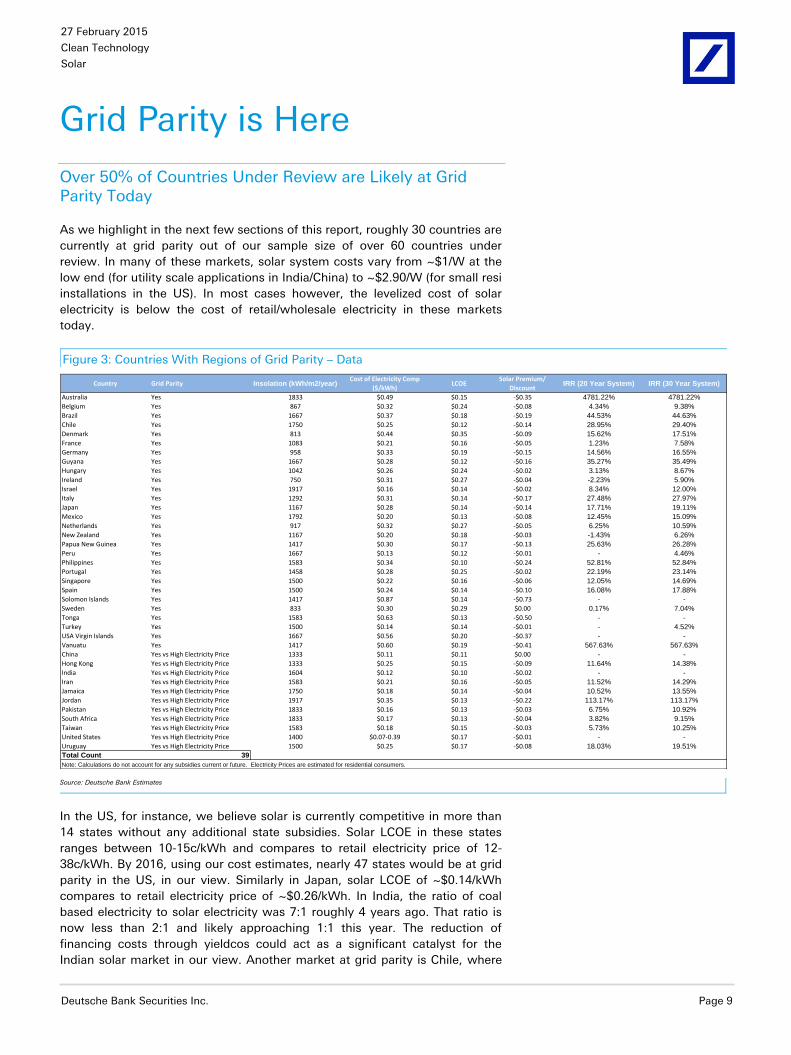
As we highlight in the next few sections of this report, roughly 30 countries are
currently at grid parity out of our sample size of over 60 countries under
review. In many of these markets, solar system costs vary from ~$1/W at the
low end (for utility scale applications in India/China) to ~$2.90/W (for small resi
installations in the US). In most cases however, the levelized cost of solar
electricity is below the cost of retail/wholesale electricity in these markets
today.
Figure 3: Countries With Regions of Grid Parity – Data
Country Grid Parity Insolation (kWh/m2/year)Cost of Electricity Comp
($/kWh)LCOE
Solar Premium/
DiscountIRR (20 Year System) IRR (30 Year System)
Australia Yes 1833 $0.49 $0.15 -$0.35 4781.22% 4781.22%
Belgium Yes 867 $0.32 $0.24 -$0.08 4.34% 9.38%
Brazil Yes 1667 $0.37 $0.18 -$0.19 44.53% 44.63%
Chile Yes 1750 $0.25 $0.12 -$0.14 28.95% 29.40%
Denmark Yes 813 $0.44 $0.35 -$0.09 15.62% 17.51%
France Yes 1083 $0.21 $0.16 -$0.05 1.23% 7.58%
Germany Yes 958 $0.33 $0.19 -$0.15 14.56% 16.55%
Guyana Yes 1667 $0.28 $0.12 -$0.16 35.27% 35.49%
Hungary Yes 1042 $0.26 $0.24 -$0.02 3.13% 8.67%
Ireland Yes 750 $0.31 $0.27 -$0.04 -2.23% 5.90%
Israel Yes 1917 $0.16 $0.14 -$0.02 8.34% 12.00%
Italy Yes 1292 $0.31 $0.14 -$0.17 27.48% 27.97%
Japan Yes 1167 $0.28 $0.14 -$0.14 17.71% 19.11%
Mexico Yes 1792 $0.20 $0.13 -$0.08 12.45% 15.09%
Netherlands Yes 917 $0.32 $0.27 -$0.05 6.25% 10.59%
New Zealand Yes 1167 $0.20 $0.18 -$0.03 -1.43% 6.26%
Papua New Guinea Yes 1417 $0.30 $0.17 -$0.13 25.63% 26.28%
Peru Yes 1667 $0.13 $0.12 -$0.01 - 4.46%
Philippines Yes 1583 $0.34 $0.10 -$0.24 52.81% 52.84%
Portugal Yes 1458 $0.28 $0.25 -$0.02 22.19% 23.14%
Singapore Yes 1500 $0.22 $0.16 -$0.06 12.05% 14.69%
Spain Yes 1500 $0.24 $0.14 -$0.10 16.08% 17.88%
Solomon Islands Yes 1417 $0.87 $0.14 -$0.73 - -
Sweden Yes 833 $0.30 $0.29 $0.00 0.17% 7.04%
Tonga Yes 1583 $0.63 $0.13 -$0.50 - -
Turkey Yes 1500 $0.14 $0.14 -$0.01 - 4.52%
USA Virgin Islands Yes 1667 $0.56 $0.20 -$0.37 - -
Vanuatu Yes 1417 $0.60 $0.19 -$0.41 567.63% 567.63%
China Yes vs High Electricity Price 1333 $0.11 $0.11 $0.00 - -
Hong Kong Yes vs High Electricity Price 1333 $0.25 $0.15 -$0.09 11.64% 14.38%
India Yes vs High Electricity Price 1604 $0.12 $0.10 -$0.02 - -
Iran Yes vs High Electricity Price 1583 $0.21 $0.16 -$0.05 11.52% 14.29%
Jamaica Yes vs High Electricity Price 1750 $0.18 $0.14 -$0.04 10.52% 13.55%
Jordan Yes vs High Electricity Price 1917 $0.35 $0.13 -$0.22 113.17% 113.17%
Pakistan Yes vs High Electricity Price 1833 $0.16 $0.13 -$0.03 6.75% 10.92%
South Africa Yes vs High Electricity Price 1833 $0.17 $0.13 -$0.04 3.82% 9.15%
Taiwan Yes vs High Electricity Price 1583 $0.18 $0.15 -$0.03 5.73% 10.25%
United States Yes vs High Electricity Price 1400 $0.07-0.39 $0.17 -$0.01 - -
Uruguay Yes vs High Electricity Price 1500 $0.25 $0.17 -$0.08 18.03% 19.51%
Total Count 39
Note: Calculations do not account for any subsidies current or future. Electricity Prices are estimated for residential consumers.
Source: Deutsche Bank Estimates
In the US, for instance, we believe solar is currently competitive in more than
14 states without any additional state subsidies. Solar LCOE in these states
ranges between 10-15c/kWh and compares to retail electricity price of 12-
38c/kWh. By 2016, using our cost estimates, nearly 47 states would be at grid
parity in the US, in our view. Similarly in Japan, solar LCOE of ~$0.14/kWh
compares to retail electricity price of ~$0.26/kWh. In India, the ratio of coal
based electricity to solar electricity was 7:1 roughly 4 years ago. That ratio is
now less than 2:1 and likely approaching 1:1 this year. The reduction of
financing costs through yieldcos could act as a significant catalyst for the
Indian solar market in our view. Another market at grid parity is Chile, where
27 February 2015
Clean Technology
Solar
Page 10 Deutsche Bank Securities Inc.
the electricity prices are high and solar resources are abundant. Chile's
electricity use per capita increased at a 33% CAGR between 2000 and 2010
and growth is expected to continue. According to Chile's Energy Minister,
power prices are expected to increase by 30% in the next 7 years. Current
unsubsidized solar LCOE of $0.12-0.18/kWh is well below the electricity price
of ~$0.25/kWh.
Mexico is also emerging as an attractive growth market for solar, especially
after the 2014 energy reforms that now allow private companies to build and
operate power plants. In most regions, retail customers pay the DAC rate of
~22c/kWh once consumption increases above 150kWh compared to solar
LCOE of ~$0.13/kWh. Moreover, electricity prices in Mexico are increaseing at
8-10% per annum due to strong demand growth and high prices for imported
natural gas. We expect this trend to significantly impact grid parity economics
in Mexico.
In Philippines, there is no national grid and peak power is often generated from
diesel. The generation cost of coal electricity is $0.12/kWh. On top of that, T&D
costs another $0.14/kWh resulting in total electricity cost of $0.26/kWh. Solar
electricity on the other hand costs only $0.10/kWh in the Philippines.
Finally, Italy is another example of market at grid parity. According to an
industry survey published in Sept '14, about 700MW of unsubsidized solar was
connected to the grid in 2013. The government recently increased the net
metering threshold from 200KW to 500KW and solar with net metering is
currently 30-40% cheaper than electricity generated using fossil fuels. Solar
LCOE of large project (where net metering is not available) is less than
€100/MWh compared to retail electricity price of €130-150/MWh. Grid parity in
Italy has been possible because of a significant reduction in system costs. Cost
of ground based systems is €0.8/W whereas cost of ~200KW system is
~€1.15/W. With this kind of cost profile, increased consumer awareness and
greater availability of institutional financing, we expect the unsubsidized solar
market in Italy to experience significant growth over the next 3-5 years.

So
lar
Cle
an
Tech
no
log
y
27
Feb
ruary
20
15
Deu
tsch
e B
an
k S
ecu
rities In
c.
Pag
e 1
1
Figure 4: Overview of Key Countries – Key Metrics
Country
Today 2017 2020 Today Future (2020) Today Future (2017-2020) Price Today CAGR 2011A 10-Year CAGR 2015 Future (2020)
United States $0.19 $0.13 $0.11 $0.33 $0.13 7% $0.18 3.3% (10 Yr) 1053 2% 12.00 12.78
China $0.11 $0.10 $0.09 $0.25 $0.11 7% $0.11 1100 12% 13.00 18.09
Japan $0.14 $0.13 $0.11 $0.28 $0.13 4% $0.28 287 1% 9.00 4.76
India $0.10 $0.08 $0.08 $0.24 $0.09 12% 10% $0.12 238 7% 2.00 4.92
Germany $0.19 $0.17 $0.15 $0.33 $0.17 5% $0.33 5.6% (6 yr) 160 3% 2.04 2.45
UK $0.23 $0.20 $0.18 $0.37 $0.20 5% $0.21 9.2% (6 yr) 93 2% 2.25 2.19
Mexico $0.13 $0.10 $0.09 $0.27 $0.11 9% 7% $0.20 62 4% 0.25 3.00
Philippines $0.10 $0.09 $0.08 $0.24 $0.10 7% $0.34 16 2% 0.50 1.20
France $0.16 $0.15 $0.13 $0.31 $0.15 5% $0.21 4.7% (6 yr) 130 1% 0.92 2.29
Chile $0.12 $0.10 $0.09 $0.26 $0.11 7% $0.25 18 6% 1.00 1.20
South Africa $0.13 $0.11 $0.09 $0.27 $0.11 10% 8% $0.17 44 1% 0.80 1.00
Australia $0.15 $0.13 $0.11 $0.29 $0.13 6% $0.49 62 3% 0.85 1.26
Brazil $0.18 $0.14 $0.12 $0.32 $0.14 14% 11% $0.37 119 5% 0.04 0.85
Canada $0.18 $0.16 $0.14 $0.32 $0.16 5% $0.13 5.2% (8 yr) 139 2% 0.59 0.59
Thailand $0.13 $0.13 $0.13 $0.27 $0.14 7% $0.11 49 5% 0.60 0.90
Saudi Arabia $0.11 $0.10 $0.09 $0.25 $0.11 7% $0.07 51 7% 0.30 5.00
Italy $0.14 $0.12 $0.11 $0.28 $0.13 5% $0.31 3.1% (6 yr) 118 5% 0.40 0.44
UAE $0.12 $0.10 $0.09 $0.26 $0.11 7% $0.08 26 12% 0.10 0.30
Jordan $0.13 $0.11 $0.10 $0.27 $0.12 7% $0.35 3 7% 0.15 0.30
*Source: EIA*LCOE based on 5% yoy
system cost reduction
*US Est based on our cost
curve through 2017 then 5%
declines to 2020
*Highlighted = grid parity with
storage vs electricity price
today. We est storage costs at
~14 cents/kWh today and ~2
Cents in ~5 years
*Electricity prices are
averages of retail price
and are high end of
range in some markets
*Solar market size are
DB ests
LCOE Today Solar + Storage Cost of Financing Electricity Market Size (GW Capacity) Solar Market Size (GW)
Source: Deutsche Bank, EIA

27 February 2015
Clean Technology
Solar
Page 12 Deutsche Bank Securities Inc.
The figure below shows the cost of solar today versus other costs of electricity
generation.
Figure 5: Solar Today Vs Other Forms of Utility Scale Electricity Generation (Cents/KwH)
6.0
5.7
1.7
3.2
0.9
22.5
3.3
3.9
10.1
3.5
10.2
7.0
7.0
4.0
12.6
18.2
7.7
20.0
16.0
24.5
12.0
15.0
25.0
11.1
21.3
25.0
10.0
7.0
0.0 5.0 10.0 15.0 20.0 25.0 30.0
Nuclear
Coal
Nat Gas (Combined Cycle)
Nat Gas (Combustion Turbine)
Biopower
Ocean
Hydropower
Geothermal
CSP
Wind (Onshore)
Wind (OffShore)
Solar (Residential)
Solar (Commercial)
Solar (Utility)
Cents/KwH
Source: Deutsche Bank, OpenEI Transparent Cost Database

27 February 2015
Clean Technology
Solar
Deutsche Bank Securities Inc. Page 13
Electricity: Capacity and Demand Increasing
Electricity Demand Growth Will Continue to Rise
Figure 6: Electricity Use is Rising
-
5000
10000
15000
20000
25000
30000
To
tal E
lectr
icity G
en
era
tio
n (
Tw
H)
OECD Non-OECD European Union Former Soviet Union
Worldwide electricity generationhas increased over 130% since 1985.
Source: BP Statistical Review of World Energy 2014, Deutsche Bank
We continue to expect overall electricity demand to increase, despite energy
efficiency measures. The Middle East and South/Central America in particular
represent significant sources of growth in electricity demand with high quality
solar resources. As these regions mature and costs come down further, the
TAM will continue to expand.
Figure 7: TWh Used and CAGR (North America) Figure 8: TWh Used and CAGR (South/Central America)
♦
1.0%
2.0%
3.0%
4.0%
5.0%
6.0%
7.0%
-
1000
2000
3000
4000
5000
6000
19
85
19
87
19
89
19
91
19
93
19
95
19
97
19
99
20
01
20
03
20
05
20
07
20
09
20
11
20
13
Ele
ctri
city
Ge
ne
rati
on
(Tw
H)
US Canada Mexico Total CAGR (%)
♦
1.0%
2.0%
3.0%
4.0%
5.0%
6.0%
7.0%
-
200
400
600
800
1000
1200
1400
19
85
19
87
19
89
19
91
19
93
19
95
19
97
19
99
20
01
20
03
20
05
20
07
20
09
20
11
20
13
Ele
ctri
city
Ge
ne
rati
on
(Tw
H)
Argentina Brazil Chile
Colombia Others Total CAGR (%)
Source: BP Statistical Review of World Energy:, 2014, Deutsche Bank
Source: BP Statistical Review of World Energy:, 2014, Deutsche Bank

27 February 2015
Clean Technology
Solar
Page 14 Deutsche Bank Securities Inc.
Figure 9: TWh Used and CAGR (Europe/Eurasia) Figure 10: TWh Used and CAGR (Middle East)
♦
1.0%
2.0%
3.0%
4.0%
5.0%
6.0%
7.0%
-
1000
2000
3000
4000
5000
6000
19
85
19
87
19
89
19
91
19
93
19
95
19
97
19
99
20
01
20
03
20
05
20
07
20
09
20
11
20
13El
ect
rici
ty G
en
era
tio
n (
TwH
)
France Germany Italy
Russia Spain UK
Others Total CAGR (%)
♦
1.0%
2.0%
3.0%
4.0%
5.0%
6.0%
7.0%
-
200
400
600
800
1000
1200
19
85
19
87
19
89
19
91
19
93
19
95
19
97
19
99
20
01
20
03
20
05
20
07
20
09
20
11
20
13
Ele
ctri
city
Ge
ne
rati
on
(Tw
H)
Iran Saudi Arabia UAE
Others Total CAGR (%)
Source: BP Statistical Review of World Energy:, 2014, Deutsche Bank
Source: BP Statistical Review of World Energy:, 2014, Deutsche Bank
Further, while policy incentives and regulatory framework will ultimately
matter for any form of electricity generation, the real driver behind capacity
additions generally is the need to replace old, inefficient generation and to
meet incremental electricity needs. Even today, ~20% of the world’s
population does not have access to grid electricity. Due to declining costs and
ability to deploy the technology without really developing the grid, we expect
policy makers in developing countries to proactively promote solar.
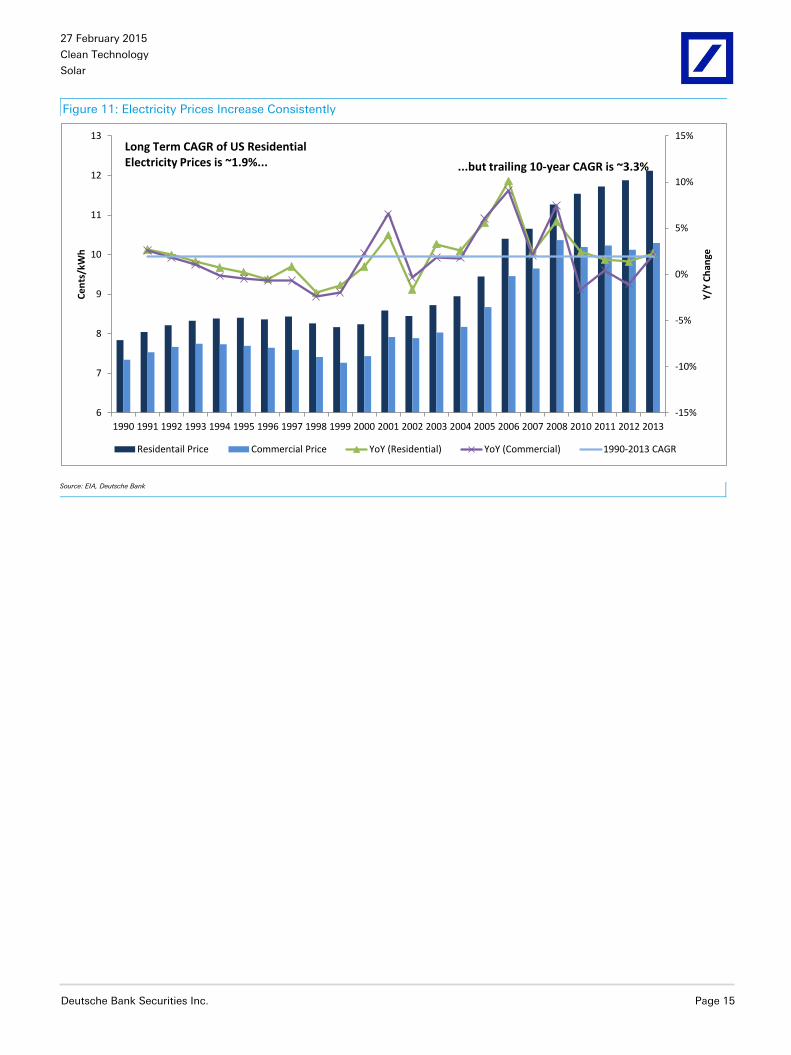
Electricity Prices Will Continue to Rise
Our relatively bullish view on solar is based on the assumption that retail
electricity prices will continue to rise over the next few years. As can be seen
from the chart below, residential electricity prices in the US have consistently
increased every year since 2002, and have only decreased (on a national
blended basis) in 4 out of the last 24 years. We expect ongoing investment in
transmission, distribution and utility scale generation to continue to fuel
upward price momentum.
27 February 2015
Clean Technology
Solar
Deutsche Bank Securities Inc. Page 15
Figure 11: Electricity Prices Increase Consistently
-15%
-10%
-5%
0%
5%
10%
15%
6
7
8
9
10
11
12
13
1990 1991 1992 1993 1994 1995 1996 1997 1998 1999 2000 2001 2002 2003 2004 2005 2006 2007 2008 2010 2011 2012 2013
Y/Y
Ch
ange
Ce
nts
/kW
h
Residentail Price Commercial Price YoY (Residential) YoY (Commercial) 1990-2013 CAGR
Long Term CAGR of US Residential Electricity Prices is ~1.9%... ...but trailing 10-year CAGR is ~3.3%
Source: EIA, Deutsche Bank
27 February 2015
Clean Technology
Solar
Page 16 Deutsche Bank Securities Inc.
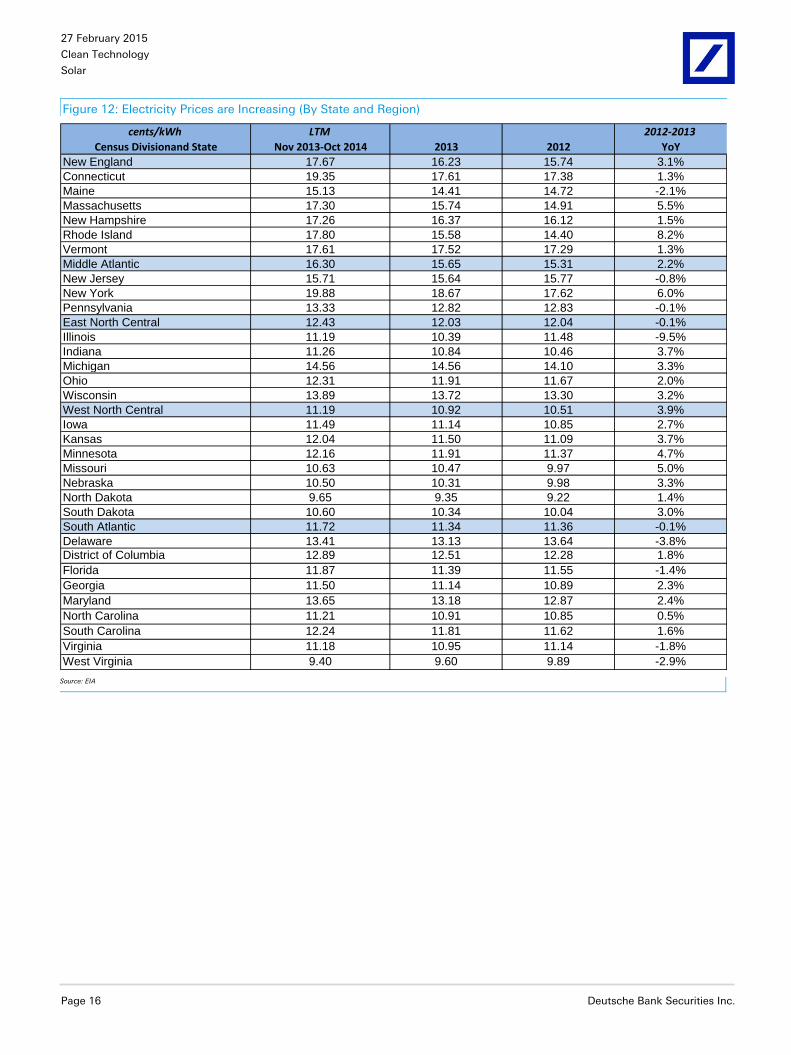
Figure 12: Electricity Prices are Increasing (By State and Region)
cents/kWh LTM 2012-2013
Census Divisionand State Nov 2013-Oct 2014 2013 2012 YoY
New England 17.67 16.23 15.74 3.1%
Connecticut 19.35 17.61 17.38 1.3%
Maine 15.13 14.41 14.72 -2.1%
Massachusetts 17.30 15.74 14.91 5.5%
New Hampshire 17.26 16.37 16.12 1.5%
Rhode Island 17.80 15.58 14.40 8.2%
Vermont 17.61 17.52 17.29 1.3%
Middle Atlantic 16.30 15.65 15.31 2.2%
New Jersey 15.71 15.64 15.77 -0.8%
New York 19.88 18.67 17.62 6.0%
Pennsylvania 13.33 12.82 12.83 -0.1%
East North Central 12.43 12.03 12.04 -0.1%
Illinois 11.19 10.39 11.48 -9.5%
Indiana 11.26 10.84 10.46 3.7%
Michigan 14.56 14.56 14.10 3.3%
Ohio 12.31 11.91 11.67 2.0%
Wisconsin 13.89 13.72 13.30 3.2%
West North Central 11.19 10.92 10.51 3.9%
Iowa 11.49 11.14 10.85 2.7%
Kansas 12.04 11.50 11.09 3.7%
Minnesota 12.16 11.91 11.37 4.7%
Missouri 10.63 10.47 9.97 5.0%
Nebraska 10.50 10.31 9.98 3.3%
North Dakota 9.65 9.35 9.22 1.4%
South Dakota 10.60 10.34 10.04 3.0%
South Atlantic 11.72 11.34 11.36 -0.1%
Delaware 13.41 13.13 13.64 -3.8%District of Columbia 12.89 12.51 12.28 1.8%
Florida 11.87 11.39 11.55 -1.4%
Georgia 11.50 11.14 10.89 2.3%
Maryland 13.65 13.18 12.87 2.4%
North Carolina 11.21 10.91 10.85 0.5%
South Carolina 12.24 11.81 11.62 1.6%
Virginia 11.18 10.95 11.14 -1.8%
West Virginia 9.40 9.60 9.89 -2.9% Source: EIA
27 February 2015
Clean Technology
Solar
Deutsche Bank Securities Inc. Page 17
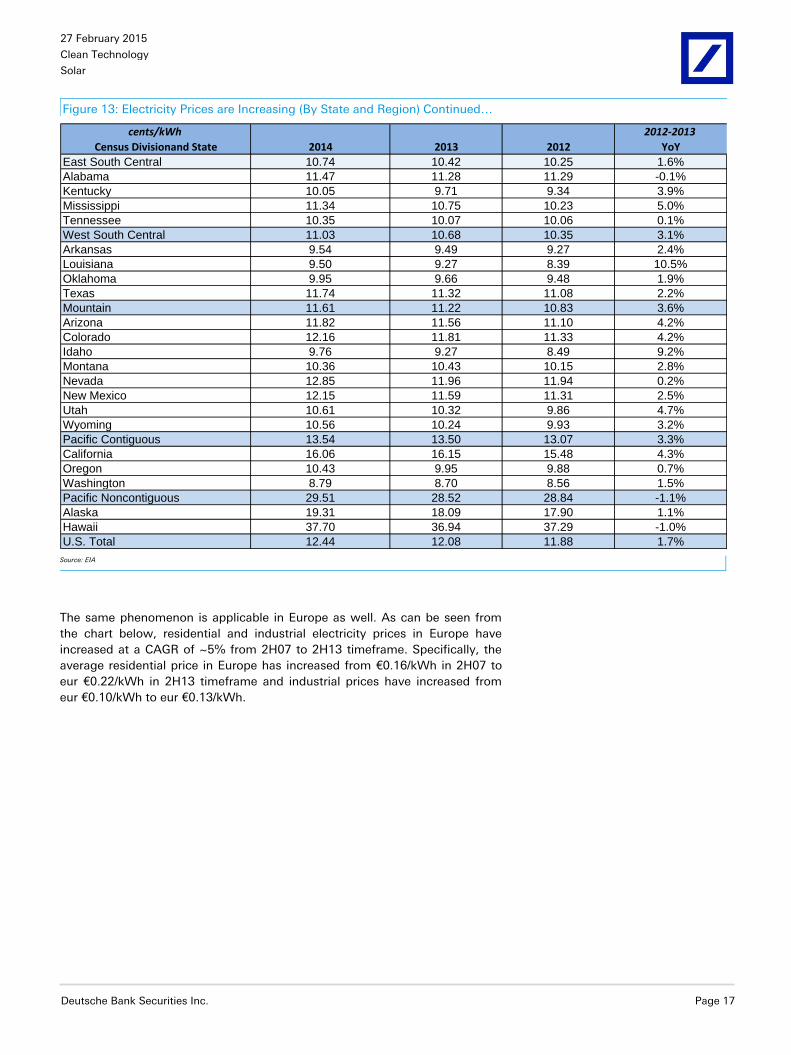
Figure 13: Electricity Prices are Increasing (By State and Region) Continued…
cents/kWh 2012-2013
Census Divisionand State 2014 2013 2012 YoY
East South Central 10.74 10.42 10.25 1.6%
Alabama 11.47 11.28 11.29 -0.1%
Kentucky 10.05 9.71 9.34 3.9%
Mississippi 11.34 10.75 10.23 5.0%
Tennessee 10.35 10.07 10.06 0.1%
West South Central 11.03 10.68 10.35 3.1%
Arkansas 9.54 9.49 9.27 2.4%
Louisiana 9.50 9.27 8.39 10.5%
Oklahoma 9.95 9.66 9.48 1.9%
Texas 11.74 11.32 11.08 2.2%
Mountain 11.61 11.22 10.83 3.6%
Arizona 11.82 11.56 11.10 4.2%
Colorado 12.16 11.81 11.33 4.2%
Idaho 9.76 9.27 8.49 9.2%
Montana 10.36 10.43 10.15 2.8%
Nevada 12.85 11.96 11.94 0.2%
New Mexico 12.15 11.59 11.31 2.5%
Utah 10.61 10.32 9.86 4.7%
Wyoming 10.56 10.24 9.93 3.2%
Pacific Contiguous 13.54 13.50 13.07 3.3%
California 16.06 16.15 15.48 4.3%
Oregon 10.43 9.95 9.88 0.7%
Washington 8.79 8.70 8.56 1.5%
Pacific Noncontiguous 29.51 28.52 28.84 -1.1%
Alaska 19.31 18.09 17.90 1.1%
Hawaii 37.70 36.94 37.29 -1.0%
U.S. Total 12.44 12.08 11.88 1.7% Source: EIA
The same phenomenon is applicable in Europe as well. As can be seen from
the chart below, residential and industrial electricity prices in Europe have
increased at a CAGR of ~5% from 2H07 to 2H13 timeframe. Specifically, the
average residential price in Europe has increased from €0.16/kWh in 2H07 to
eur €0.22/kWh in 2H13 timeframe and industrial prices have increased from
eur €0.10/kWh to eur €0.13/kWh.
27 February 2015
Clean Technology
Solar
Page 18 Deutsche Bank Securities Inc.
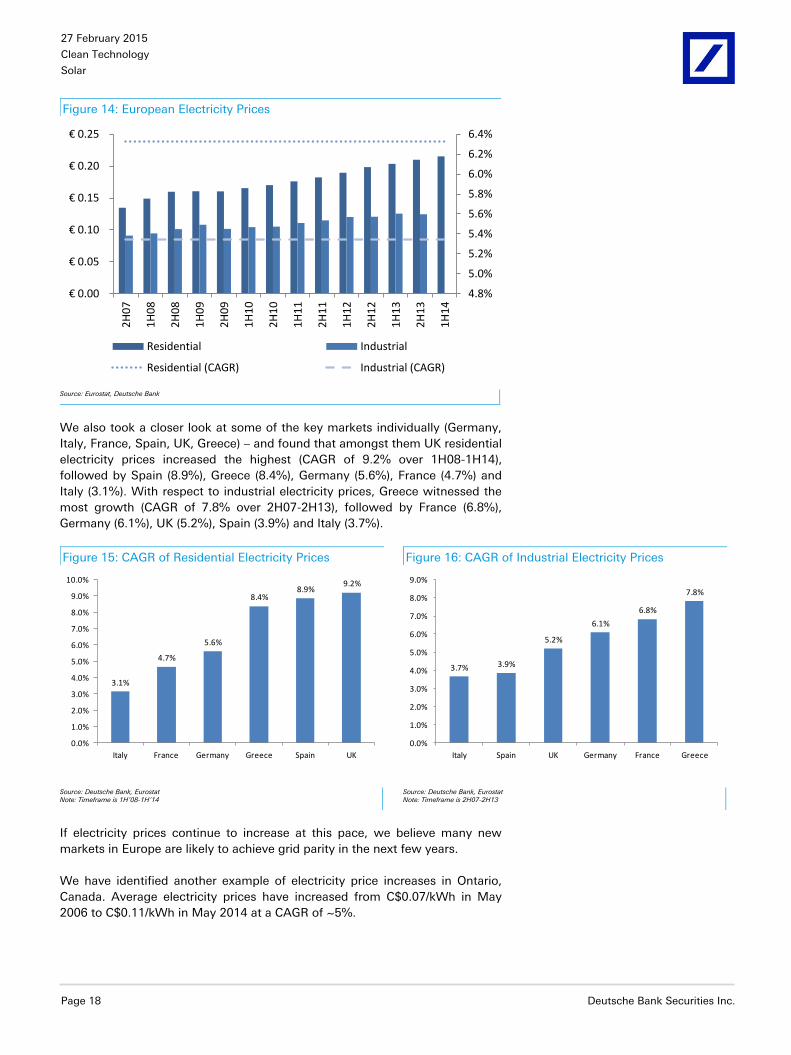
Figure 14: European Electricity Prices
4.8%
5.0%
5.2%
5.4%
5.6%
5.8%
6.0%
6.2%
6.4%
€ 0.00
€ 0.05
€ 0.10
€ 0.15
€ 0.20
€ 0.25 2
H0
7
1H
08
2H
08
1H
09
2H
09
1H
10
2H
10
1H
11
2H
11
1H
12
2H
12
1H
13
2H
13
1H
14
Residential Industrial
Residential (CAGR) Industrial (CAGR)
Source: Eurostat, Deutsche Bank
We also took a closer look at some of the key markets individually (Germany,
Italy, France, Spain, UK, Greece) – and found that amongst them UK residential
electricity prices increased the highest (CAGR of 9.2% over 1H08-1H14),
followed by Spain (8.9%), Greece (8.4%), Germany (5.6%), France (4.7%) and
Italy (3.1%). With respect to industrial electricity prices, Greece witnessed the
most growth (CAGR of 7.8% over 2H07-2H13), followed by France (6.8%),
Germany (6.1%), UK (5.2%), Spain (3.9%) and Italy (3.7%).
Figure 15: CAGR of Residential Electricity Prices Figure 16: CAGR of Industrial Electricity Prices
3.1%
4.7%
5.6%
8.4%8.9%
9.2%
0.0%
1.0%
2.0%
3.0%
4.0%
5.0%
6.0%
7.0%
8.0%
9.0%
10.0%
Italy France Germany Greece Spain UK
3.7% 3.9%
5.2%
6.1%
6.8%
7.8%
0.0%
1.0%
2.0%
3.0%
4.0%
5.0%
6.0%
7.0%
8.0%
9.0%
Italy Spain UK Germany France Greece
Source: Deutsche Bank, Eurostat Note: Timeframe is 1H’08-1H’14
Source: Deutsche Bank, Eurostat Note: Timeframe is 2H07-2H13
If electricity prices continue to increase at this pace, we believe many new
markets in Europe are likely to achieve grid parity in the next few years.
We have identified another example of electricity price increases in Ontario,
Canada. Average electricity prices have increased from C$0.07/kWh in May
2006 to C$0.11/kWh in May 2014 at a CAGR of ~5%.

27 February 2015
Clean Technology
Solar
Deutsche Bank Securities Inc. Page 19
Figure 17: Ontario Electricity Prices
0.0%
1.0%
2.0%
3.0%
4.0%
5.0%
6.0%
$0.06
$0.07
$0.08
$0.09
$0.10
$0.11
CA
D$/K
wH
Average CAGR
Source: Deutsche Bank, Ontario Energy Board
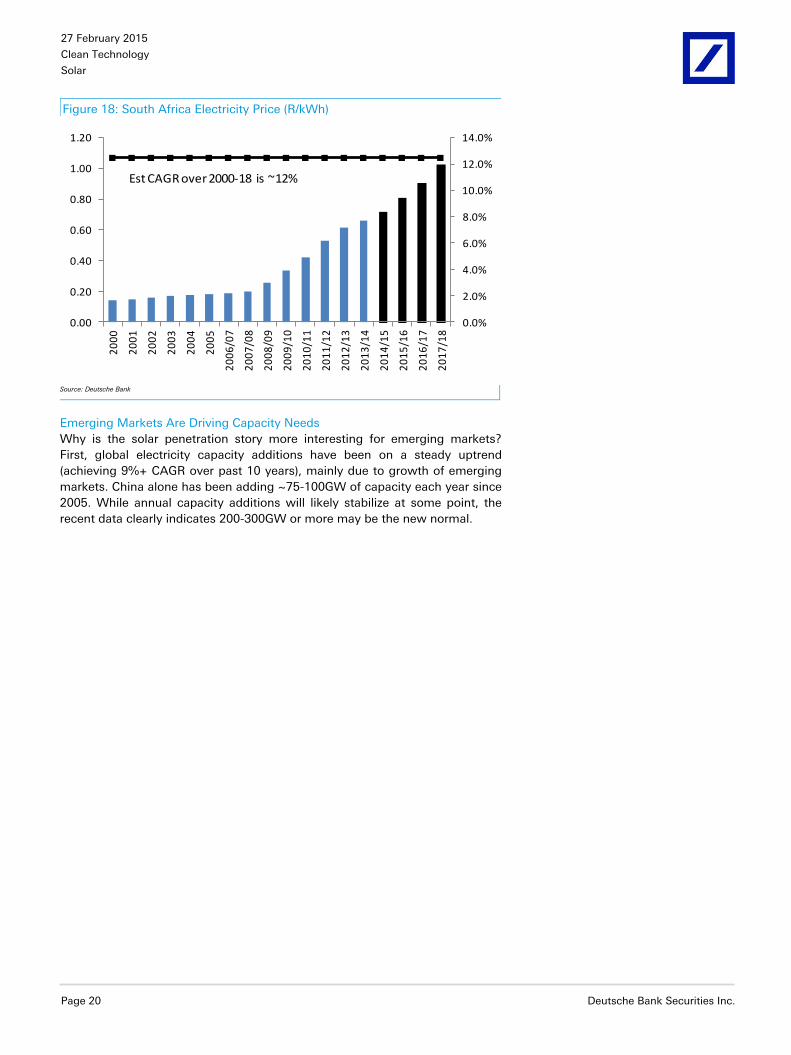
South Africa is another market that we believe has achieved residential grid
parity for solar, but with rising grid prices, we expect grid parity over the next
few years. We believe solar LCOE in the country is currently in the range of
~$0.13/kWh compared to avg. electricity price of ~$0.07-$0.17/kWh. We
examined avg. electricity price trends since 2000, and found that prices have
grown at a CAGR of ~13% through 2013/14 – from ~R0.14/kWh to ~R0.7/kWh.
In Sep 2014, a committee of the country’s energy regulator NERS
recommended that Eskom (the state utility) under-recovered ~R7.8B of
revenue in the previous tariff period, which could indicate that average tariffs
could be set to increase by 12%+ through 2018 (NERSA had earlier granted
8% annual increase through 2018). If the recommendations are accepted, avg.
electricity price in the country could go up to ~R1.02/kWh ($0.09/kWh). Given
the expected rise in electricity prices, we expect solar to be increasingly
competitive in the future.
27 February 2015
Clean Technology
Solar
Page 20 Deutsche Bank Securities Inc.
Figure 18: South Africa Electricity Price (R/kWh)
0.0%
2.0%
4.0%
6.0%
8.0%
10.0%
12.0%
14.0%
0.00
0.20
0.40
0.60
0.80
1.00
1.20
20
00
20
01
20
02
20
03
20
04
20
05
20
06
/07
20
07
/08
20
08
/09
20
09
/10
20
10
/11
20
11
/12
20
12
/13
20
13
/14
20
14
/15
20
15
/16
20
16
/17
20
17
/18
Est CAGR over 2000-18 is ~12%
Source: Deutsche Bank
Emerging Markets Are Driving Capacity Needs
Why is the solar penetration story more interesting for emerging markets?
First, global electricity capacity additions have been on a steady uptrend
(achieving 9%+ CAGR over past 10 years), mainly due to growth of emerging
markets. China alone has been adding ~75-100GW of capacity each year since
2005. While annual capacity additions will likely stabilize at some point, the
recent data clearly indicates 200-300GW or more may be the new normal.

27 February 2015
Clean Technology
Solar
Deutsche Bank Securities Inc. Page 21
Figure 19: Worldwide Electricity Generating Capacity Additions
0.0
50.0
100.0
150.0
200.0
250.0
300.0
Yearly C
apacity A
dditio
ns (
YoY
Change in G
W)
World Capacity Additions
Worldwide Capacityadditions were relativelysteady in the past...
...but have recently increasedto over 9% 10-year CAGR
Source: IEA, Deutsche Bank

27 February 2015
Clean Technology
Solar
Page 22 Deutsche Bank Securities Inc.
Solar Can Still Grow in Low Oil Price Era:
Worldwide Oil Use in Electricity Generation
Most Countries Generate Less than 5% of their Electricity From Oil
In aggregate, the world generates ~3.9% of electricity from oil. However, the
US generates only 0.9% of electricity from oil and China generates even less –
0.17%.
Figure 20: Oil Use for Electricity Generation has Declined Substantially
0%
5%
10%
15%
20%
25%
% E
lectr
icity G
enera
tio
n fro
m O
il -
World
wid
e
Electricity production from Oilhas decreased to less than 4% globally
Source: World Bank, 2011 Data
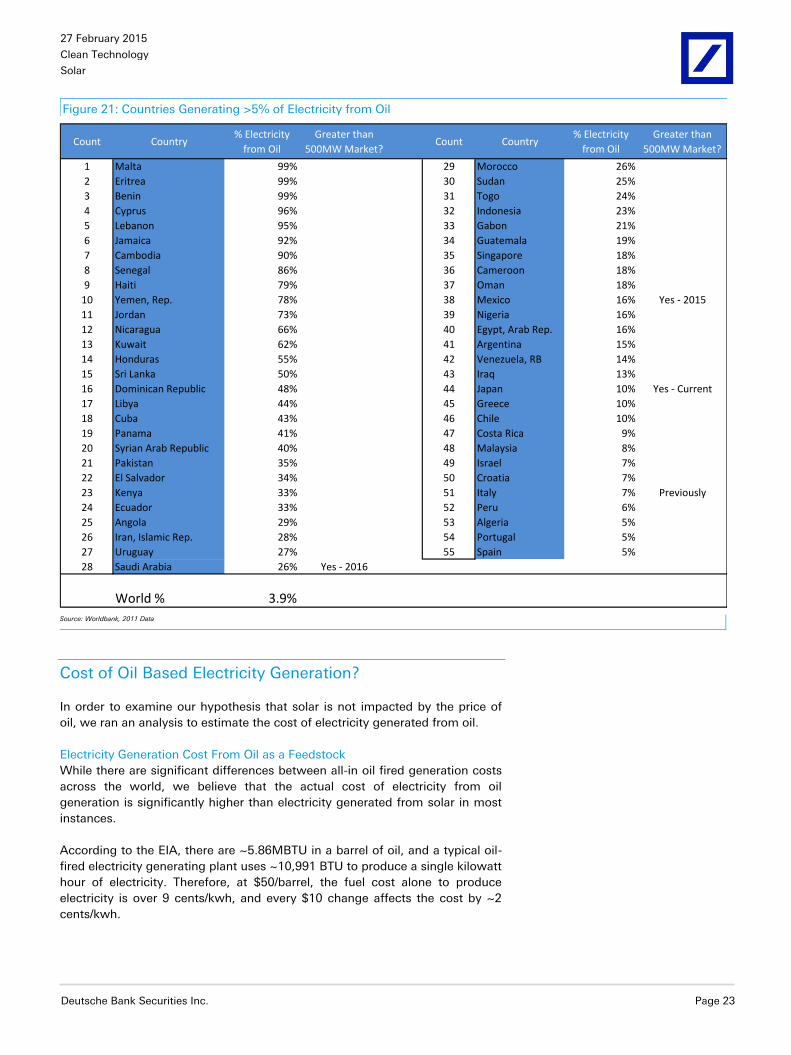
Furthermore, the majority of the countries which generate greater than 5% of
their energy generation from oil are not expected to be notable solar markets.
The only truly notable solar market where oil accounts for double digit (10%)
percent of total generation is Japan. The Japanese solar market is largely
influenced by constructive government policy and generates significant
portions of total installs in non-utility scale solar (which is the only segment
that would compete with oil fired generation).
27 February 2015
Clean Technology
Solar
Deutsche Bank Securities Inc. Page 23
Figure 21: Countries Generating >5% of Electricity from Oil
Count Country% Electricity
from Oil
Greater than
500MW Market?Count Country
% Electricity
from Oil
Greater than
500MW Market?
1 Malta 99% 29 Morocco 26%
2 Eritrea 99% 30 Sudan 25%
3 Benin 99% 31 Togo 24%
4 Cyprus 96% 32 Indonesia 23%
5 Lebanon 95% 33 Gabon 21%
6 Jamaica 92% 34 Guatemala 19%
7 Cambodia 90% 35 Singapore 18%
8 Senegal 86% 36 Cameroon 18%
9 Haiti 79% 37 Oman 18%
10 Yemen, Rep. 78% 38 Mexico 16% Yes - 2015
11 Jordan 73% 39 Nigeria 16%
12 Nicaragua 66% 40 Egypt, Arab Rep. 16%
13 Kuwait 62% 41 Argentina 15%
14 Honduras 55% 42 Venezuela, RB 14%
15 Sri Lanka 50% 43 Iraq 13%
16 Dominican Republic 48% 44 Japan 10% Yes - Current
17 Libya 44% 45 Greece 10%
18 Cuba 43% 46 Chile 10%
19 Panama 41% 47 Costa Rica 9%
20 Syrian Arab Republic 40% 48 Malaysia 8%
21 Pakistan 35% 49 Israel 7%
22 El Salvador 34% 50 Croatia 7%
23 Kenya 33% 51 Italy 7% Previously
24 Ecuador 33% 52 Peru 6%
25 Angola 29% 53 Algeria 5%
26 Iran, Islamic Rep. 28% 54 Portugal 5%
27 Uruguay 27% 55 Spain 5%
28 Saudi Arabia 26% Yes - 2016
World % 3.9% Source: Worldbank, 2011 Data
Cost of Oil Based Electricity Generation?
In order to examine our hypothesis that solar is not impacted by the price of
oil, we ran an analysis to estimate the cost of electricity generated from oil.
Electricity Generation Cost From Oil as a Feedstock
While there are significant differences between all-in oil fired generation costs
across the world, we believe that the actual cost of electricity from oil
generation is significantly higher than electricity generated from solar in most
instances.
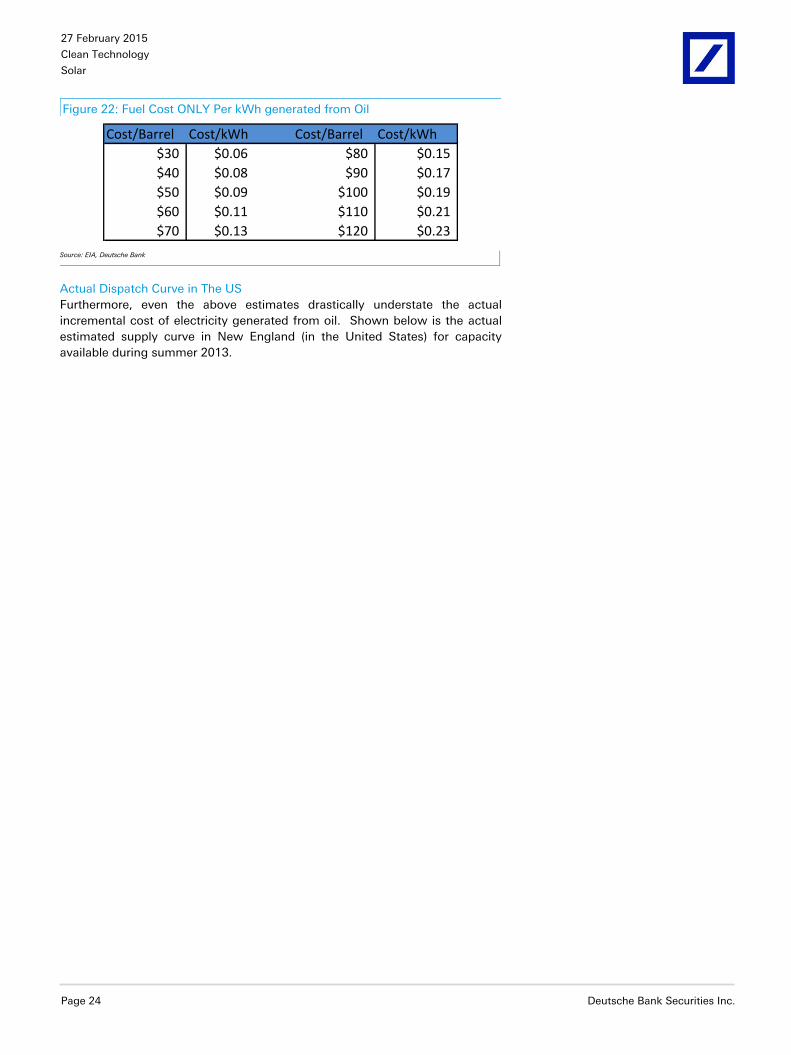
According to the EIA, there are ~5.86MBTU in a barrel of oil, and a typical oil-
fired electricity generating plant uses ~10,991 BTU to produce a single kilowatt
hour of electricity. Therefore, at $50/barrel, the fuel cost alone to produce
electricity is over 9 cents/kwh, and every $10 change affects the cost by ~2
cents/kwh.
27 February 2015
Clean Technology
Solar
Page 24 Deutsche Bank Securities Inc.
Figure 22: Fuel Cost ONLY Per kWh generated from Oil
Cost/Barrel Cost/kWh Cost/Barrel Cost/kWh
$30 $0.06 $80 $0.15
$40 $0.08 $90 $0.17
$50 $0.09 $100 $0.19
$60 $0.11 $110 $0.21
$70 $0.13 $120 $0.23
Source: EIA, Deutsche Bank
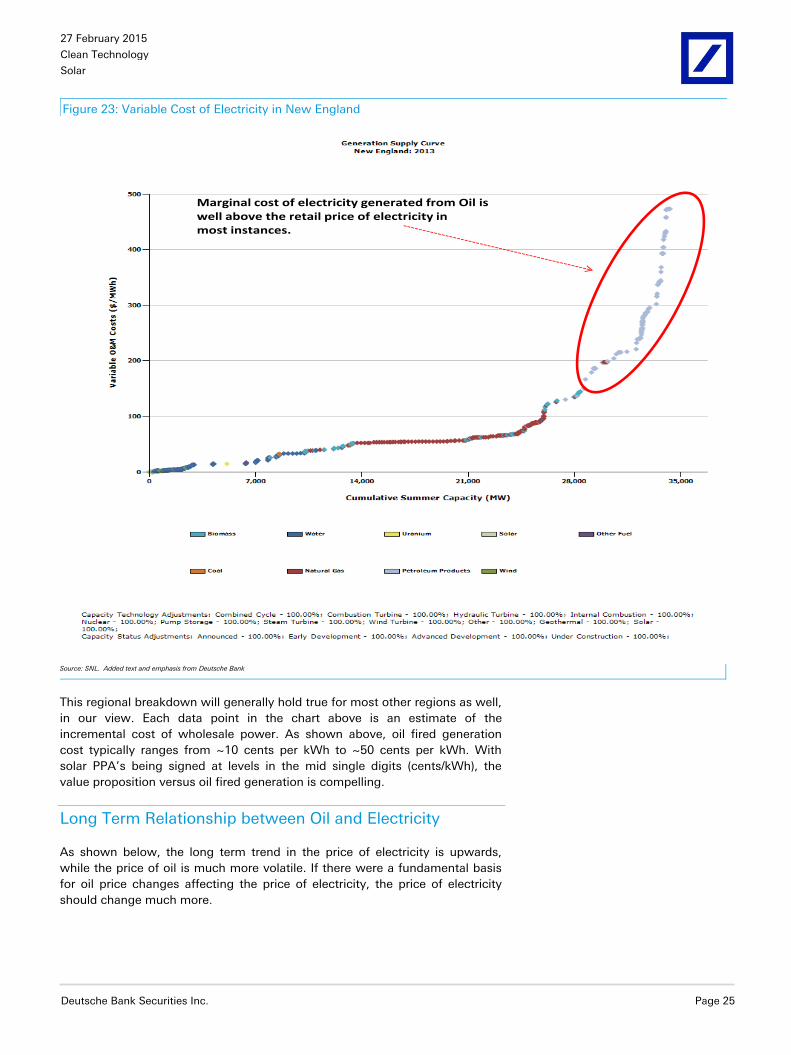
Actual Dispatch Curve in The US
Furthermore, even the above estimates drastically understate the actual
incremental cost of electricity generated from oil. Shown below is the actual
estimated supply curve in New England (in the United States) for capacity
available during summer 2013.
27 February 2015
Clean Technology
Solar
Deutsche Bank Securities Inc. Page 25
Figure 23: Variable Cost of Electricity in New England
Marginal cost of electricity generated from Oil iswell above the retail price of electricity inmost instances.
Source: SNL. Added text and emphasis from Deutsche Bank
This regional breakdown will generally hold true for most other regions as well,
in our view. Each data point in the chart above is an estimate of the
incremental cost of wholesale power. As shown above, oil fired generation
cost typically ranges from ~10 cents per kWh to ~50 cents per kWh. With
solar PPA’s being signed at levels in the mid single digits (cents/kWh), the
value proposition versus oil fired generation is compelling.
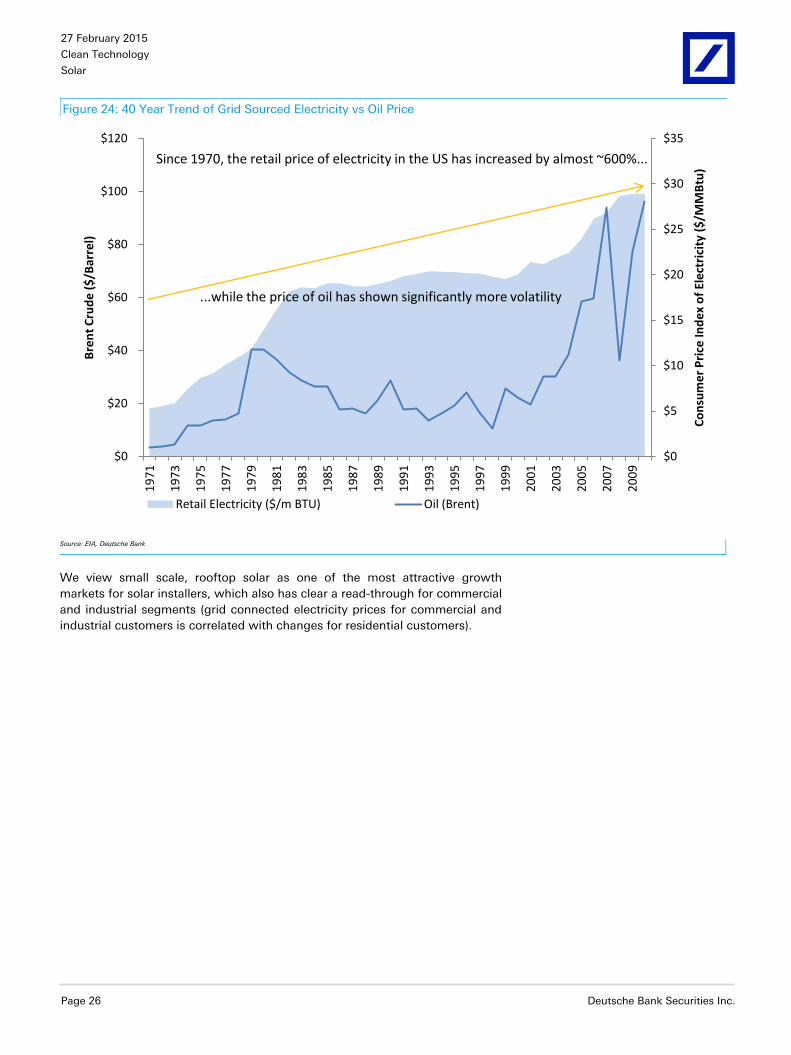
Long Term Relationship between Oil and Electricity
As shown below, the long term trend in the price of electricity is upwards,
while the price of oil is much more volatile. If there were a fundamental basis
for oil price changes affecting the price of electricity, the price of electricity
should change much more.
27 February 2015
Clean Technology
Solar
Page 26 Deutsche Bank Securities Inc.
Figure 24: 40 Year Trend of Grid Sourced Electricity vs Oil Price
$0
$5
$10
$15
$20
$25
$30
$35
$0
$20
$40
$60
$80
$100
$120 1
97
1
19
73
19
75
19
77
19
79
19
81
19
83
19
85
19
87
19
89
19
91
19
93
19
95
19
97
19
99
20
01
20
03
20
05
20
07
20
09
Co
nsu
me
r P
rice
Ind
ex
of
Ele
ctri
city
($
/MM
Btu
)
Bre
nt
Cru
de
($
/Bar
rel)
Retail Electricity ($/m BTU) Oil (Brent)
Since 1970, the retail price of electricity in the US has increased by almost ~600%...
...while the price of oil has shown significantly more volatility
Source: EIA, Deutsche Bank
We view small scale, rooftop solar as one of the most attractive growth
markets for solar installers, which also has clear a read-through for commercial
and industrial segments (grid connected electricity prices for commercial and
industrial customers is correlated with changes for residential customers).

27 February 2015
Clean Technology
Solar
Deutsche Bank Securities Inc. Page 27
Figure 25: Electricity Prices Across Consumer Segments Trend Together
0
2
4
6
8
10
12
14
0
20
40
60
80
100
120
140
160
Jan
-90
May
-91
Sep
-92
Jan
-94
May
-95
Sep
-96
Jan
-98
May
-99
Sep
-00
Jan
-02
May
-03
Sep
-04
Jan
-06
May
-07
Sep
-08
Jan
-10
May
-11
Sep
-12
Jan
-14
Ele
ctri
city
Pri
ce (
Ce
nts
/kW
h)
Oil
Pri
ce (
$/B
arre
l)
Brent WTI
Elec Price (Residential) Elec Price (Commercial)
Elec Price (Industrial)
Source: EIA, Deutsche Bank
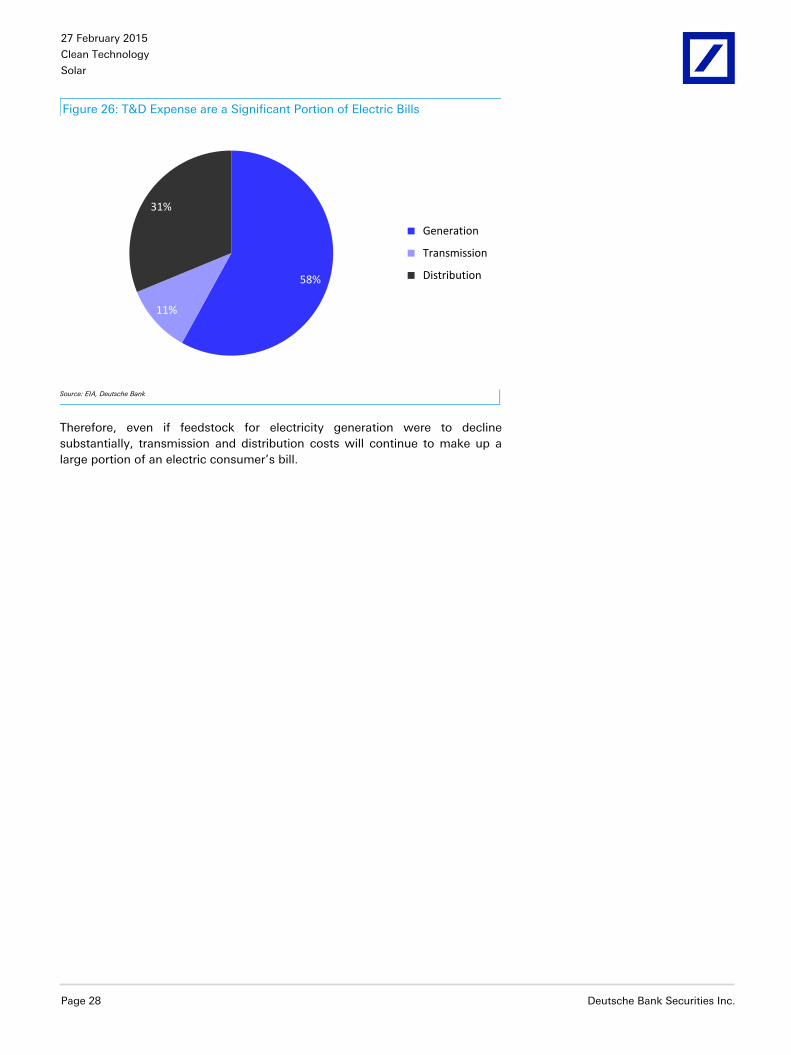
What Makes an Electricity Bill?
While much of the previous analysis has centered around generation costs
from oil and all in electric costs, we note that over 40% of the average electric
bill in the US can be attributed to transmission and distribution (T&D) costs.
This is because the structure of most mature electric markets allow utilities to
recoup costs for large upfront capital expenditures from transmission and
distribution. This system has developed over the last century as the modern
electric cost-recovery method.
Most investor owned regulated utilities are allowed to generate a regulated
return over a multi-year timeframe. This system has facilitated grid build out
across the US and other countries (although specific cost recovery
mechanisms vary) as utilities are allowed to operate as a natural monopoly and
are financially incentivized to build infrastructure (in the form of long term
returns on upfront capital investment). Hence, the cost recovery for all
necessary infrastructure – including but not limited to electric generation
assets – necessitates the inclusion of T&D costs in the consumer’s electric bill.
27 February 2015
Clean Technology
Solar
Page 28 Deutsche Bank Securities Inc.
Figure 26: T&D Expense are a Significant Portion of Electric Bills
58%
11%
31%
Generation
Transmission
Distribution
Source: EIA, Deutsche Bank
Therefore, even if feedstock for electricity generation were to decline
substantially, transmission and distribution costs will continue to make up a
large portion of an electric consumer’s bill.

27 February 2015
Clean Technology
Solar
Deutsche Bank Securities Inc. Page 29
Forget Oil, Even Nat Gas Has Limited Impact on Retail Electricity Prices
Electricity Prices are Increasing, Despite Nat Gas Price Swings
As shown below, average US electricity prices are increasing (with average
swings for seasonality) consistently over the last several years. In the first two
years of the graph (2006-2008) Gas prices were generally above $6/MMBTU at
the Henry Hub. Conversely, the most recent two years of data have yielded
nat gas prices as low as sub-$2/MMBTU and generally below
$4/MMBTU. Peak to trough, average monthly nat gas prices have decreased
~86% from $13.28/MMBTU (July 2008) to $1.88/MMBTU (April 2012). Yet, in
this same time period between 2006 and 2015, average electricity prices
increased ~20%.
Figure 27: Average US Retail Price of Electricity Continues to Increase
$0.00
$2.00
$4.00
$6.00
$8.00
$10.00
$12.00
$14.00
8
9
10
11
12
13
14
Jan-0
6
Mar-
06
May-0
6
Jul-06
Sep-0
6
Nov-0
6
Jan-0
7
Mar-
07
May-0
7
Jul-07
Sep-0
7
Nov-0
7
Jan-0
8
Mar-
08
May-0
8
Jul-08
Sep-0
8
Nov-0
8
Jan-0
9
Mar-
09
May-0
9
Jul-09
Sep-0
9
Nov-0
9
Jan-1
0
Mar-
10
May-1
0
Jul-10
Sep-1
0
Nov-1
0
Jan-1
1
Mar-
11
May-1
1
Jul-11
Sep-1
1
Nov-1
1
Jan-1
2
Mar-
12
May-1
2
Jul-12
Sep-1
2
Nov-1
2
Jan-1
3
Mar-
13
May-1
3
Jul-13
Sep-1
3
Nov-1
3
Jan-1
4
Mar-
14
May-1
4
Jul-14
Sep-1
4
Hen
ry H
ub
Nat
Ga
s (
$/M
MB
TU
)
Ele
ctr
icity P
rice (
Cents
/kW
h)
Nat Gas Price ($/MMBTU) U.S. Total (Cents/kWh)
Despite significant swingsin nat gas prices and sustained lownatgat periods...
....average US Retail price of electricityhas increased ~20% since 2006
Source: EIA, Thomson Reuters
While there are regional variations on this theme and not every region or state
has seen electricity price increases every year, the trend is clear and we believe
natural gas prices are not the dominant factor in retail electricity prices.
27 February 2015
Clean Technology
Solar
Page 30 Deutsche Bank Securities Inc.
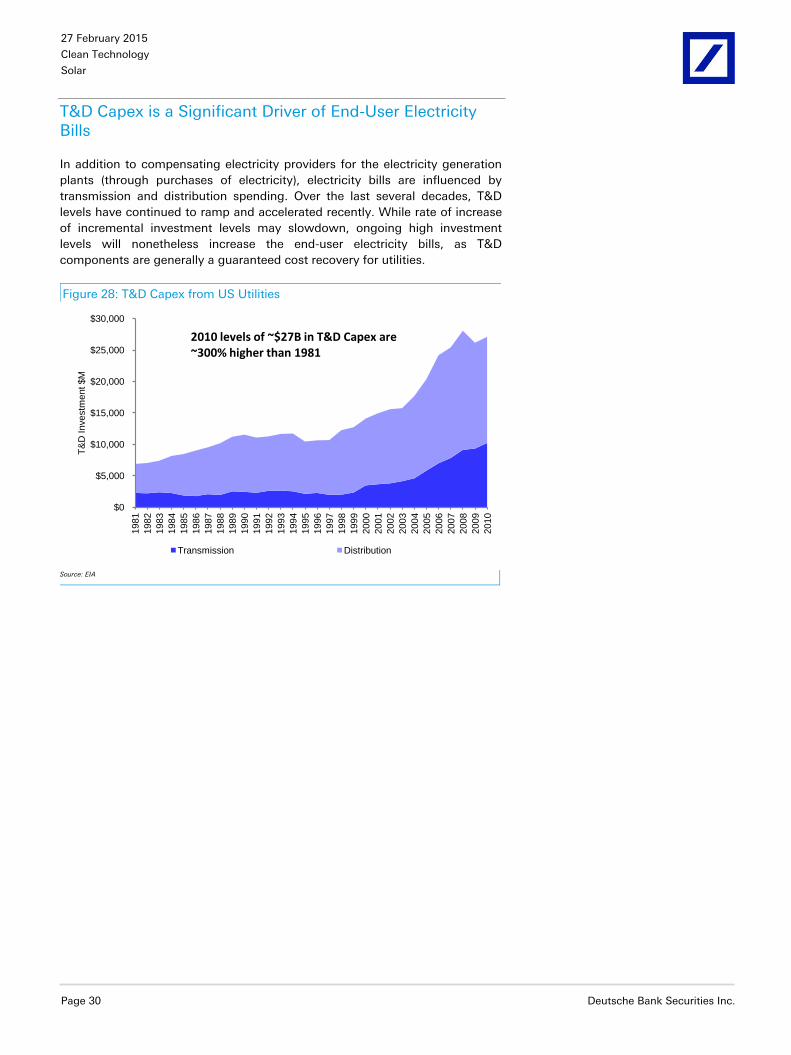
T&D Capex is a Significant Driver of End-User Electricity Bills
In addition to compensating electricity providers for the electricity generation
plants (through purchases of electricity), electricity bills are influenced by
transmission and distribution spending. Over the last several decades, T&D
levels have continued to ramp and accelerated recently. While rate of increase
of incremental investment levels may slowdown, ongoing high investment
levels will nonetheless increase the end-user electricity bills, as T&D
components are generally a guaranteed cost recovery for utilities.
Figure 28: T&D Capex from US Utilities
$0
$5,000
$10,000
$15,000
$20,000
$25,000
$30,000
1981
1982
1983
1984
1985
1986
1987
1988
1989
1990
1991
1992
1993
1994
1995
1996
1997
1998
1999
2000
2001
2002
2003
2004
2005
2006
2007
2008
2009
2010
T&
D Investm
ent $M
Transmission Distribution
2010 levels of ~$27B in T&D Capex are~300% higher than 1981
Source: EIA

27 February 2015
Clean Technology
Solar
Deutsche Bank Securities Inc. Page 31
Electricity Prices Are Increasing
As shown in the following graphs the majority of states and regions have
higher electricity prices.
Figure 29: Electricity Prices are Increasing (By Region)
Average Residential Electricity Prices 2013 vs 2012Region # States Increase # States Decrease % Increasing
New England 5 1 83%
Middle Atlantic 1 2 33%
East North Central 4 1 80%
West North Central 7 0 100%
South Atlantic 5 4 56%
East South Central 3 1 75%
West South Central 4 0 100%
Mountain 8 0 100%
Pacific Contiguous 3 0 100%
Pacific Noncontiguous1 1 50%
U.S. Total 41 10 80%
Average Residential Electricity Prices 2014 vs 2013Region # States Increase # States Decrease % Increasing
New England 6 0 100%
Middle Atlantic 3 0 100%
East North Central 4 1 80%
West North Central 7 0 100%
South Atlantic 8 1 89%
East South Central 4 0 100%
West South Central 4 0 100%
Mountain 7 1 88%
Pacific Contiguous 2 1 67%
Pacific Noncontiguous2 0 100%
U.S. Total 47 4 92% Source: EIA

27 February 2015
Clean Technology
Solar
Page 32 Deutsche Bank Securities Inc.
Figure 30: Electricity Prices are Increasing (By State and Region)
cents/kWh LTM 2012-2013
Census Divisionand State Nov 2013-Oct 2014 2013 2012 YoY
New England 17.67 16.23 15.74 3.1%
Connecticut 19.35 17.61 17.38 1.3%
Maine 15.13 14.41 14.72 -2.1%
Massachusetts 17.30 15.74 14.91 5.5%
New Hampshire 17.26 16.37 16.12 1.5%
Rhode Island 17.80 15.58 14.40 8.2%
Vermont 17.61 17.52 17.29 1.3%
Middle Atlantic 16.30 15.65 15.31 2.2%
New Jersey 15.71 15.64 15.77 -0.8%
New York 19.88 18.67 17.62 6.0%
Pennsylvania 13.33 12.82 12.83 -0.1%
East North Central 12.43 12.03 12.04 -0.1%
Illinois 11.19 10.39 11.48 -9.5%
Indiana 11.26 10.84 10.46 3.7%
Michigan 14.56 14.56 14.10 3.3%
Ohio 12.31 11.91 11.67 2.0%
Wisconsin 13.89 13.72 13.30 3.2%
West North Central 11.19 10.92 10.51 3.9%
Iowa 11.49 11.14 10.85 2.7%
Kansas 12.04 11.50 11.09 3.7%
Minnesota 12.16 11.91 11.37 4.7%
Missouri 10.63 10.47 9.97 5.0%
Nebraska 10.50 10.31 9.98 3.3%
North Dakota 9.65 9.35 9.22 1.4%
South Dakota 10.60 10.34 10.04 3.0%
South Atlantic 11.72 11.34 11.36 -0.1%
Delaware 13.41 13.13 13.64 -3.8%District of Columbia 12.89 12.51 12.28 1.8%
Florida 11.87 11.39 11.55 -1.4%
Georgia 11.50 11.14 10.89 2.3%
Maryland 13.65 13.18 12.87 2.4%
North Carolina 11.21 10.91 10.85 0.5%
South Carolina 12.24 11.81 11.62 1.6%
Virginia 11.18 10.95 11.14 -1.8%
West Virginia 9.40 9.60 9.89 -2.9% Source: EIA

27 February 2015
Clean Technology
Solar
Deutsche Bank Securities Inc. Page 33
Figure 31: Electricity Prices are Increasing (By State and Region) Continued…
cents/kWh 2012-2013
Census Divisionand State 2014 2013 2012 YoY
East South Central 10.74 10.42 10.25 1.6%
Alabama 11.47 11.28 11.29 -0.1%
Kentucky 10.05 9.71 9.34 3.9%
Mississippi 11.34 10.75 10.23 5.0%
Tennessee 10.35 10.07 10.06 0.1%
West South Central 11.03 10.68 10.35 3.1%
Arkansas 9.54 9.49 9.27 2.4%
Louisiana 9.50 9.27 8.39 10.5%
Oklahoma 9.95 9.66 9.48 1.9%
Texas 11.74 11.32 11.08 2.2%
Mountain 11.61 11.22 10.83 3.6%
Arizona 11.82 11.56 11.10 4.2%
Colorado 12.16 11.81 11.33 4.2%
Idaho 9.76 9.27 8.49 9.2%
Montana 10.36 10.43 10.15 2.8%
Nevada 12.85 11.96 11.94 0.2%
New Mexico 12.15 11.59 11.31 2.5%
Utah 10.61 10.32 9.86 4.7%
Wyoming 10.56 10.24 9.93 3.2%
Pacific Contiguous 13.54 13.50 13.07 3.3%
California 16.06 16.15 15.48 4.3%
Oregon 10.43 9.95 9.88 0.7%
Washington 8.79 8.70 8.56 1.5%
Pacific Noncontiguous 29.51 28.52 28.84 -1.1%
Alaska 19.31 18.09 17.90 1.1%
Hawaii 37.70 36.94 37.29 -1.0%
U.S. Total 12.44 12.08 11.88 1.7% Source: EIA

27 February 2015
Clean Technology
Solar
Page 34 Deutsche Bank Securities Inc.
Solar “System” Costs Could Continue to Decline
Our constructive view on solar is largely dependent on the improving cost
curve of the underlying technology. Overall solar system costs have declined at
~15% CAGR over the past 8 years and we expect 40% cost reduction over the
next 4-5 years as a solar module costs continue to decline, panel efficiencies
gradually improve, balance of system costs decline due to scale and
competition, global financing costs decline due to development of new
business models and customer acquisition costs decline as a result of
increasing customer awareness and more seamless technology adoption
enabled by storage solutions.
Where Are We Today: Our Take
One of the most prevalent metrics for direct cost comparison is cost per watt,
which we have estimated for various regions throughout the world.
While cost per watt is an appropriate measure to normalize cost comparisons,
we note that economies of scale present in different segments/markets will
skew cost per watt within regions. While some markets like the US and Japan
will have a large portion of residential installations with less economies of
scale, Utility scale or large DG markets like India and China will inherently
achieve a lower cost per watt. Therefore, we have provided a starting point for
analysis coupled with a scenario at different cost points in the previous
section.
Module Cost of Production Today
As shown in the chart below, total module costs of leading Chinese solar
companies have decreased from ~$1.31/W in 2011 to ~$0.53/W in 2014
primarily due to reduction in processing costs and polysilicon costs and
improvement in conversion efficiencies.

27 February 2015
Clean Technology
Solar
Deutsche Bank Securities Inc. Page 35
Figure 32: Canadian Solar Cost Reduction History
Source: Canadian Solar
We see total costs coming down 30-40% over the next several years
We think it is realistic to expect at least 30-40% reduction in cost per watt in
key solar markets, while the greatest cost reductions are likely to come from
the residential segments as scale and operating efficiencies improve. There is
historical precedent for this in the oldest major solar market in the world –
Germany. In fact, costs today are well below costs in the United States and
other less mature markets.

27 February 2015
Clean Technology
Solar
Page 36 Deutsche Bank Securities Inc.
Figure 33: German Cost Per Watt for Solar Arrays is Significantly Lower than other Markets
0.00 €
0.50 €
1.00 €
1.50 €
2.00 €
2.50 €
3.00 €
3.50 €
4.00 €June
Au
gust
Octo
ber
Decem
ber
Fe
bru
ary
April
June
August
Octo
ber
Decem
ber
Fe
bru
ary
April
June
August
Octo
ber
Decem
ber
Fe
bru
ary
April
June
August
Octo
ber
Decem
ber
Fe
bru
ary
Ap
ril
June
August
Octo
ber
Decem
ber
Fe
bru
ary
April
June
August
2009 2010 2011 2012 2013 2014
Cost P
er
Watt
(G
erm
any)
US cost per watt is several years behind Germany
Today, German PV costindex is ~$1.65/w for residentialand small commercial <100kw
Source: Data sourced from www.photovoltaik-guide.de, Chart made by Deutsche Bank
The exact drivers behind cost declines may vary between countries, but we
believe the German example continues to prove that overall system costs have
yet to reach a bottom even in comparatively mature markets.
Total Cost Reduction Will Be Multi-Faceted: Mostly Not From Polysilicon
While much of the cost reduction over the last 5-10 years has resulted from
polysilicon price reductions, future cost reductions will necessarily come from
non panel related balance of system costs. Polysilicon price reductions have
accounted for significant portions of cost reductions, and were once the
largest single cost component in panels, but this has changed drastically and
rapidly over the last decade. In 2014, polysilicon represented no more than 10-
11 cents per watt so even if costs are halved, the effect on the total system
cost would be incremental – not revolutionary.
However, there are significant other cost drivers that we believe the industry
will leverage to drive down LCOE over the next several years. We have
outlined our estimates of current and future cost trajectory in the US below,
which we expect to mirror other regions’ cost roadmaps.

27 February 2015
Clean Technology
Solar
Deutsche Bank Securities Inc. Page 37
Figure 34: SolarCity 2017 Cost Targets
Source: SolarCity Investor Presentation
Panels: $0.75/W $0.50/W
Panel prices in the US are already among the highest in the world today, so
there would likely be price reductions simply through price arbitrage on a
multi-year time horizon. However, we also believe there are fundamental
reasons that panel prices worldwide are likely to trend lower over the next
several years. While overhangs like trade cases or minimum price agreements
could cloud the near term, we believe market inefficiencies will be worked out
over the long term and the clearing price will reach $0.50 or lower within the
next several years.
Companies like SunEdison have publically targeted $0.40/W panels by the end
of 2016, and many Tier 1 Chinese manufacturers are achieving sub $0.50/W
already in 2014. Given that most manufacturers are improving 1-2 cents per
quarter, less than ten cents improvement (to reach $0.40) over the next 12
quarters is likely conservative. If panels are sold at a 10 cent gross margin for
a total cost of $0.50/W, manufacturers would achieve 20% gross margin – well
above recent historic averages. Furthermore, transportation costs and ‘soft
costs’ which inefficiently raise the price of panels should gradually improve as
governments work through trade issues

27 February 2015
Clean Technology
Solar
Page 38 Deutsche Bank Securities Inc.
Figure 35: SUNE 40 cent 400 Watt Panel Goal
Source: Sunedison 2013 Capital Markets Day
Inverter: $0.25/W $0.17/W
Inverter prices typically decline 10-15% per year, and we expect this trend to
continue into the future. Large solar installers are already achieving ~$0.25/W
or lower on large supply deals, and we expect additional savings will be found
over the next several years. Component cost reduction, next generation
improvements, and incremental production efficiencies will drive savings on
the manufacturing side, while new entrants and ongoing price competition
among incumbents will likely keep margins competitive and pass on much of
the savings to installers.
Racking/Other Bos: $0.25/W$0.16/W (Racking) and $0.30/W$0.17/W
(Other)
While racking is often overlooked as a source of cost reduction, we expect
ongoing efficiency improvements, streamlining, and potential advances in
materials to lead to incremental improvements. As standardization becomes
more normalized in the industry, balance of system costs should decline.
Installation: $0.65/W $0.45/W
Cost reduction on the installation side will come primarily from scale benefits,
as we do not expect wage reductions. In fact, solar installation jobs are likely
27 February 2015
Clean Technology
Solar
Deutsche Bank Securities Inc. Page 39
to increase substantially to keep pace with demand, but more experienced
installers using better tools and techniques on larger systems are likely to more
than offset any wage growth through efficiency gains.
Sales/Customer Acquisition Cost: $0.50/W $0.20/W
We see substantial room for improvement over the longer term in cost per
watt terms as solar gains mainstream acceptance is recognized as a cost
competitive source of electricity, and companies develop new/improved
methods to interact with customers.
Already, we are seeing domestic US firms develop automated online systems
for customer sourcing, and these systems alone should allow substantial
further automation as solar begins to ‘sell itself’. Although adoption is still in
the early stages in most markets, we think costs could reach the level in the
next several years where homeowners begin to recognize inherent value of
solar self generation. We believe this will have two effects: 1) customers who
prefer to own their own systems and have the ability to do so could finance
their solar installation through multiple types of solar loans which are already
gaining in popularity and 2) customers who focus on the monthly electricity bill
will continue to sign PPA’s for solar priced below the retail electricity price
curve.
Furthermore, the wild card for a third prong of the solar explosion lies in the
regulatory environment. If utilities begin to offer competitive solar installations
regardless of credit quality (under a third party ownership model), this would
open the market to another vast source of potential customers.
We expect all of these factors to converge to drive substantial volume
improvements over the next several years. Despite the potential for utility
scale choppiness in yearly installs, residential and commercial installations
have strong fundamental underpinnings which should continue to drive
volume higher as costs reduce, LCOE is more competitive, and the customer
base expands (which has a compounding effect as neighbors see each other
installing solar).
Lastly, the power of all in cost should not be underestimated. A typical
residential US-based system costs around ~$25-35K today, but we believe that
comparable residential systems could easily dip into the $10-15K range over
the next 5 years if market forces driving cost reduction are allowed to progress
without substantial policy/exogenous shocks. If interest rates are reasonable
and a homeowner takes out a loan, upfront capital investment would be as
little as a few thousand dollars.

27 February 2015
Clean Technology
Solar
Page 40 Deutsche Bank Securities Inc.
As shown below, total customer acquisition LCOE effect is in the 2-3 cent
range (2.7 cents/kwh in our example). If costs come down substantially as we
expect, this will have a self-reinforcing effect on solar deployments.
Figure 36: Customer Acquisition Cost LCOE Effect
Customer
Acquisition ($/w)Total Cost ($/w)* LCOE Difference
$0.50 $2.90 $0.173
$0.30 $2.70 $0.163 $0.011
$0.20 $2.60 $0.157 $0.005
$0.00 $2.40 $0.147 $0.011
Total Difference --> $0.027
*Holding other costs constant Source: Deutsche Bank
Figure 37: Vivint Solar Cost Trend
Source: Vivint Solar
Other/Soft Costs: $0.20/w $0.12/w
“Other” costs including soft costs of permitting, incentive collecting, etc
account for at least 20 cents/w currently, although ‘all in’ soft costs from other
parts of the cost stack would likely amount to a notably higher number.
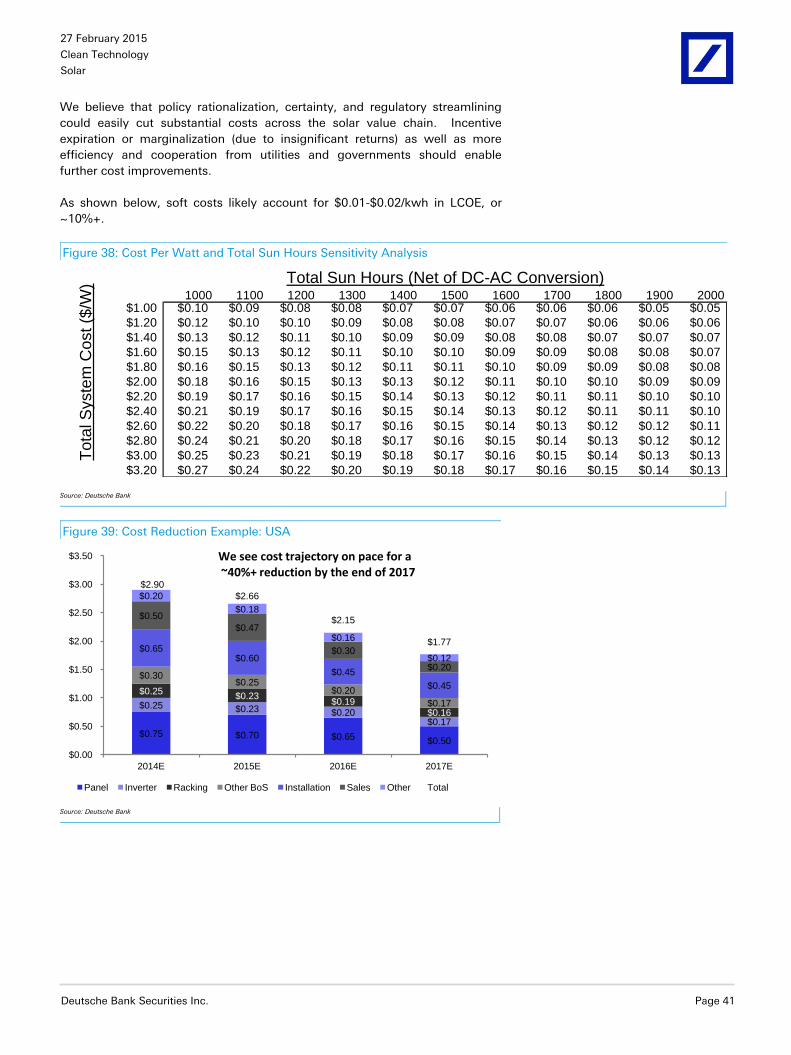
27 February 2015
Clean Technology
Solar
Deutsche Bank Securities Inc. Page 41
We believe that policy rationalization, certainty, and regulatory streamlining
could easily cut substantial costs across the solar value chain. Incentive
expiration or marginalization (due to insignificant returns) as well as more
efficiency and cooperation from utilities and governments should enable
further cost improvements.
As shown below, soft costs likely account for $0.01-$0.02/kwh in LCOE, or
~10%+.
Figure 38: Cost Per Watt and Total Sun Hours Sensitivity Analysis
Equity Investment1000 1100 1200 1300 1400 1500 1600 1700 1800 1900 2000$1.00 $0.10 $0.09 $0.08 $0.08 $0.07 $0.07 $0.06 $0.06 $0.06 $0.05 $0.05
$1.20 $0.12 $0.10 $0.10 $0.09 $0.08 $0.08 $0.07 $0.07 $0.06 $0.06 $0.06
$1.40 $0.13 $0.12 $0.11 $0.10 $0.09 $0.09 $0.08 $0.08 $0.07 $0.07 $0.07
$1.60 $0.15 $0.13 $0.12 $0.11 $0.10 $0.10 $0.09 $0.09 $0.08 $0.08 $0.07
$1.80 $0.16 $0.15 $0.13 $0.12 $0.11 $0.11 $0.10 $0.09 $0.09 $0.08 $0.08
$2.00 $0.18 $0.16 $0.15 $0.13 $0.13 $0.12 $0.11 $0.10 $0.10 $0.09 $0.09
$2.20 $0.19 $0.17 $0.16 $0.15 $0.14 $0.13 $0.12 $0.11 $0.11 $0.10 $0.10
$2.40 $0.21 $0.19 $0.17 $0.16 $0.15 $0.14 $0.13 $0.12 $0.11 $0.11 $0.10
$2.60 $0.22 $0.20 $0.18 $0.17 $0.16 $0.15 $0.14 $0.13 $0.12 $0.12 $0.11
$2.80 $0.24 $0.21 $0.20 $0.18 $0.17 $0.16 $0.15 $0.14 $0.13 $0.12 $0.12
$3.00 $0.25 $0.23 $0.21 $0.19 $0.18 $0.17 $0.16 $0.15 $0.14 $0.13 $0.13
$3.20 $0.27 $0.24 $0.22 $0.20 $0.19 $0.18 $0.17 $0.16 $0.15 $0.14 $0.13
Total Sun Hours (Net of DC-AC Conversion)
Tota
l S
yste
m C
ost ($
/W)
Source: Deutsche Bank
Figure 39: Cost Reduction Example: USA
$0.75 $0.70 $0.65 $0.50
$0.25 $0.23 $0.20 $0.17
$0.25 $0.23
$0.19 $0.16
$0.30 $0.25
$0.20
$0.17
$0.65 $0.60
$0.45
$0.45
$0.50
$0.47
$0.30
$0.20
$0.20
$0.18
$0.16
$0.12
$2.90
$2.66
$2.15
$1.77
$0.00
$0.50
$1.00
$1.50
$2.00
$2.50
$3.00
$3.50
2014E 2015E 2016E 2017E
Panel Inverter Racking Other BoS Installation Sales Other Total
We see cost trajectory on pace for a~40%+ reduction by the end of 2017
Source: Deutsche Bank

27 February 2015
Clean Technology
Solar
Page 42 Deutsche Bank Securities Inc.
YieldCos: Enabling The Transition To Grid Parity Growth
We believe the successful IPOs of some of the recent YieldCo offerings is a
significant positive for the overall solar/renewables sector and a key catalyst
enabling the sector's transition from subsidies to grid parity. We believe
management teams can create greater long term shareholder value by
spinning off projects into a new YieldCo vehicle versus selling projects.
What are some of the key positives of YieldCos for the solar sector? First, new
YieldCo structure offers the company significantly lower cost of capital. Not
only do YieldCos reduce the cost of equity from 10%+ to less than 5% but
because in many cases, equity is trading at a lower cost than debt, YieldCos
also offer the potential to change the capital structure which should enable
further reduction in cost of capital. Second, YieldCos with scale and
development capability have the option to grow into international solar
markets or move into residential solar (where cost of capital is higher) and also
potentially grow into wind/hydro/transmission segments. There is a significant
amount of installed renewables/transmission that is capacity available for sale
and a lot of that capacity could be acquired/dropped down into existing
YieldCos.
Solar costs are set to decline further whereas electricity prices could rise in
many markets globally. We expect the addressable market for YieldCos to only
get bigger over time driving further interest from MLP/yield investors.
What are the benefits of YieldCos to the parent companies?
1) YieldCos enable investors to better value the company's ability to grow
assets and assign a multiple on cashflows.
2) By creating a YieldCo, solar companies have the option to create an IDR
structure and potentially benefit from growth of the YieldCo in the longer term.
Solar companies were previously not able to benefit from this strategy by
simply selling projects to a YieldCo.
3) More revenue streams can be dropped down into the YieldCos especially as
assets continue to grow. One specific example is inclusion of O&M revenues
from installed base of operating assets.
4) YieldCos expand the investor base and contribute to valuation multiple
expansion. Several energy/MLP/utility investors are looking to invest in solar
companies that have announced plans to form a YieldCo.

27 February 2015
Clean Technology
Solar
Deutsche Bank Securities Inc. Page 43
Within the US, we see increasing odds of renewables being treated as
MLPs/REITs post 2016 timeframe. YieldCos with first mover advantage maybe
able to grow significantly faster in that scenario, could potentially get acquired
by MLPs that maybe looking for growth or see the value of their developed
projects increase significantly.
That said, not all companies may be able to execute on the growth strategy.
Only companies with strong development capability would get credit from
investors in our view and would likely trade at better yields compared to
YieldCos without strong development capability. We also like the equity of the
"parent" vs YieldCo where YieldCos have an IDR structure (SUNE for example
is likely to benefit from growth of TERP). Debt financing constraints, especially
in international markets may also prevent several companies from achieving
scale. Finally, cash generated by sale of projects to YieldCos in international
markets could arguably be deployed for deployed for international project
development without any tax implications whereas new YieldCos would likely
have to pay taxes while repatriating cash to the US.
How Does a Yieldco – Parentco Create Value?
The Key is Cost of Capital Arbitrage
Assuming a typical YieldCo Vehicle is structured as a parent-subsidiary
relationship, we believe a cost of capital arbitrage exists as long as the yield
company’s cost of capital is lower than the parent company’s. This will likely
remain the case given that one of the key aspects of a YieldCo is long term
stable contracted cash flows with relatively low risk profiles.
Given high risk development profile, the parent equity generally trades at a
lower multiple than YieldCo (say 8X EBITDA). Conversely, the YieldCo is
assumed to contain long term highly contracted cash flows with strong (10-
20%) growth prospects and generally trades at a higher multiple (say 12x
EBITDA). In the event that parentco offers to sell 50MW of finished projects at
10x EBITDA to YieldCo, the parent company is able to sell a project above its
own trading range and cost of project development, while the yield vehicle is
buying assets below. Hence, both parent and yieldco receive a benefit from the
transaction.

27 February 2015
Clean Technology
Solar
Page 44 Deutsche Bank Securities Inc.
Storage: The Missing Link of Solar Adoption
Batteries delivered at an economically competitive price are the holy grail of
solar penetration, and we believe the industry will begin deploying on a large
scale within the next ~5 years or less. We expect battery deployment to occur
primarily where there is a clear economic rationale. One of the clearest
examples is commercial scale battery deployment, which is already occurring
today in several countries. Commercial customers are often subject to demand
based charges, which can account for as much as half of the electric bill in
some months. We think companies with differentiated battery solutions
coupled with intelligent software and predictive analytics that work with the
grid to avoid these charges and smooth electric demand will pave the way for
mass adoption. Additionally, we expect utilities worldwide to pursue batteries
on a large scale as costs drop over the next several years and
renewable/intermittent generation deployments increase. Residential
customers without proper pricing mechanisms in place (for example, peak
demand charges) are unlikely to pursue energy storage in the short term,
although we believe solar leasing companies and other energy service
companies could shift towards offering batteries as part of energy packages
designed to integrate more intelligently with the grid and address utility
concerns around distributed generation. We expect this trend to likely
accelerate if positive incentive mechanisms are put in place, such as
guaranteed interconnection timelines, effective utility-side deployment
mechanisms, or tax/rebate incentives.
Cost for the large majority of available technologies is often economically
prohibitive, although pumped hydro is an exception to the rule (however, we
do not expect any notable increases in pumped hydro storage and it cannot be
deployed in many instances).
Summarized below is an overview of some of the key technologies that are
being considered as potential longer term energy storage solutions. Based on
our checks, many of these costs are already lower than published literature
would suggest. Therefore, the costs below are likely conservative.

27 February 2015
Clean Technology
Solar
Deutsche Bank Securities Inc. Page 45
Figure 40: Overview of Storage Techniques
Technology Maturity Cost ($/kW) Cost ($/kWh) Efficiency Cycle Limited Response Time
Pumped Hydro Mature 1,500-2,700 138 - 338 80-82% No Seconds to Minutes
Compressed Air (underground Demo to Mature 960-1,250 60 - 150 60-70% No Seconds to Minutes
Compressed Air (Aboveground) Demo to Deploy 1,950-2,150 390 - 430 60-70% No Seconds to Minutes
Flywheels Demo to Mature 1,950-2,200 7,800 - 8,800 85-87% >100,000 Instantaneous
Lead Acid Batteries Demo to Mature 950-5,800 350 - 3,800 75-90% 2,200 - >100,000 Milliseconds
Lithium-Ion Demo to Mature 1,085-4,100 900 - 6,200 87-94% 4,500 - >100,000 Milliseconds
Flow Batteries (Vanadium Redox) Develop to Demo 3,000-3,700 620 - 830 65-75% >10,000 Milliseconds
Flow Batteries (Zinc Bromide) Demo to Deploy 1,450-2,420 290 - 1,350 60-65% >10,000 Milliseconds
Sodium Sulfur Demo to Deploy 3,100-4,000 445 - 555 75% 4500 Milliseconds
Power to Gas Demo 1,370-2,740 NA 30-45% No 10 Minutes
Capacitors Develop to Demo 90-94% No Milliseconds
SMES Develop to Demo 95% No Instantaneous
Source: State Utility Forecasting Group
Figure 41: Blended Battery Price Projections
Source: Rocky Mountain Institute

27 February 2015
Clean Technology
Solar
Page 46 Deutsche Bank Securities Inc.
The upfront cost for a typical Lead-acid battery may be as low as ~$200/kWh,
while best in class lithium ion integrators are producing commercial/utility
packages in the ~$500/kWh range exiting 2014, as compared to the upfront
cost of ~$1000/kWh 12 months prior. We believe 20-30% yearly cost reduction
is likely, which could bring conventional lithium ion batteries at
commercial/utility scale to the point of mass adoption potential before 2020.
Tesla Motors, in partnership with Panasonic, is constructing the ‘Gigafactory’
in Nevada which aims to achieve these economies of scale and better. Tesla
estimates that Gigafactory could drive down the cost of its own Li-ion batteries
by more than 30% in its first year of production (the factory is scheduled to
open in 2017) – which could reduce costs to the ~$150/kWh range. Separately,
the US Department of energy has targeted battery cost levels of $300/kWh by
2015 and $125/kWh by 2022. Under this scenario, we believe the value
proposition for behind the meter solar + battery is significantly more
compelling.
Figure 42: Historical Battery Prices; DOE/Tesla Targets ($/kWh)
1000
500
325 300
150 125 100
0
200
400
600
800
1000
1200
20
08
20
09
20
10
20
11
20
12
20
13
20
14
20
15
20
16
20
17
20
18
20
19
20
20
20
21
20
22
20
23
20
24
Tesla Targets
DOE Targets
Source: Deutsche Bank, DOE, Tesla
Effect on LCOE
While current battery costs are relatively high, cost roadmaps that we have
outlined show significant cost reduction over the next ~5 years. In turn,
batteries paired with solar may become significantly more economical in the
future on an LCOE basis.

27 February 2015
Clean Technology
Solar
Deutsche Bank Securities Inc. Page 47
Figure 43: Illustrative Solar + Battery LCOE
Today Future
Cost per KwH $1,500 Cost per KwH $150
Battery Size (kwh) 10 Battery Size (kwh) 10
Total Battery Cost $15,000 Total Battery Cost $1,500
System Size (w) 6400 System Size (w) 6400
Battery Cost/W $2.34 Cost/W $0.23
System Cost/W $2.90
Total System Cost $5.24 Total With Future Battery* $3.13
LCOE in the US (no battery) $0.17
With Battery $0.31 LCOE With Future Battery* $0.19
LCOE Improvement $0.12 *assumes static system cost
*15% yearly battery cost/w declines from today scenario, 5% in future scenario. 10-year replacement. Source: Deutsche Bank
Using conservative assumptions and no incentives, our model indicates that
the incremental cost of storage will decrease from ~14c/kWh today to
~2c/kWh within the next five years. When overall system cost decreases are
considered, we believe solar + batteries will be a clear financial choice in
mature solar markets in the future.
Figure 44: Illustrative example of System with Batteries at Grid Parity Assuming 10% total system cost reduction YoY
$0.00
$0.05
$0.10
$0.15
$0.20
$0.25
$0.30
$0.35
20
14
20
15
20
16
20
17
20
18
20
19
20
20
20
21
LCOE
Electricity Price (7% YoY)
Electricity Price (5% YoY)
Electricity Price (3% YoY)
Source: Deutsche Bank

27 February 2015
Clean Technology
Solar
Page 48 Deutsche Bank Securities Inc.
Overview of Mainstream (Electrochemical) Technologies
1. Lead-acid: Lead-acid batteries are the world’s most commonly used
batteries given lower cost, maturity of technology, and ease of availability.
While lead acid batteries have been utilized in the past for grid storage,
average life of 6-15 years does not match with solar panel life spans.
Furthermore, lead-acid batteries have recharge/discharge characteristics which
are less preferable for grid deployment (lifespan is shortened if the battery is
not fully discharged).
2. Lithium-ion (Li-ion): Lithium ion batteries are considerably more widespread
since the proliferation of cell phones, as they are well suited to mobile
applications. Currently, they are primarily used for small portable applications
given ease of ongoing recharge, higher energy storage potential, and longer
lifespan. However, current cost structure is prohibitively high for large scale
deployment for home storage, but scale manufacturing is likely to help bring
down costs substantially over the medium term. Companies like Solarcity (via
Tesla) plan to use lithium ion batteries as storage systems for home solar.
Figure 45: EIA Rough Cost Projections
$0
$200
$400
$600
$800
$1,000
$1,200
2013 2016 2019 2022 2025 2028 2031 2034 2037 2040
$/K
wh
Source: EIA
3. Flow battery: Flow batteries as a commercial technology are relatively new
but theoretically well suited to large scale utility storage. A flow battery
typically consists of two tanks of liquids (electrolytes) which are pumped past
a membrane held between two electrodes to store and generate electricity.
This is in contrast with a Li-ion battery, where the energy-storing materials and
electrolyte are enclosed in a cell. Key advantages of flow batteries include,
ease of scaling, reliability, and long life. Flow batteries are used in various
forms including Iron-Chromium flow batteries, Vanadium Redox flow batteries
and Zinc-Bromine flow batteries. Recently, EnerVault dedicated its first
commercial flow battery-based energy storage system in California. The
project was funded in part by over $4.7M from US DOE and $476,000 from the
California Energy Commission (CEC), and meant to demonstrate the feasibility
of iron-chromium flow batteries as reliable utility-scale storage resources. We
do not expect flow batteries to make a significant impact on grid storage in the
next several years, but see potential for long term adoption as the technology
and scale application matures.

27 February 2015
Clean Technology
Solar
Deutsche Bank Securities Inc. Page 49
Other Technologies
While electrochemical batteries are the most familiar examples of storage, a
wide range of options exist with varying degrees of success. They typically fall
into 5 buckets outlined below.
Figure 46: Storage Technologies
Electrical Energy Storage Technologies
Mechanical Electrochemical Electric Thermal Chemical
Pumped Storage
(PHS)
Conventional (Lead
Acid, NiCad, Lithium
Ion)
Capacitors Molten Salts Hydrogen
Flywheel (FES)
High Temperature
Batteries ( NAS,
NaNiCl)
Superconducting
Magnetic Coil
(SMES)
Chillers Methane
Compressed Air
(CAES)
Flow Batteries
(Vanadium Redox,
Zinc Bromine) Source: Deutsche Bank, State Utility Forecasting Group
Figure 47: Est Global Energy Storage
Source: StrateGen Consulting 2011
The US alone is estimated to have ~22K+ MW of pumped hydro power, versus
50-100MW of lithium ion battery storage. Most importantly for the future of
energy storage, pumped hydro causes significant environmental impacts
which most countries are shying away from. Conventional batteries are
considerably easier to package, distribute, and scale over the long term.
However, current costs need to come down.
Although lithium ion and other electrochemical based batteries are the most
commonly discussed, we see a wide range of potential new technologies
available to fill the need for on grid storage. For example, Southern California
27 February 2015
Clean Technology
Solar
Page 50 Deutsche Bank Securities Inc.
Edison (SCE) recently procured ~26MW of storage based on commercial scale
ice cooling from Ice Energy. This is an innovative use of well established
technologies (in this case, freezing water). We have listed several of the
companies to have commercial success with SCE below.
Ice Energy Holdings (25.6MW win from SCE): Rather than the typical chemical based batteries that many would think of, Ice Energy is focused on thermal ice based energy storage to reduce air conditioning energy peak energy use. By freezing liquid at night, retrofitting existing commercial AC systems and integrating with the grid, Ice Bear units are able to smooth peak demand by circulating the already-cooled liquid through the system to cool the air which is then used in the building HVAC system. Ice Energy is able to manufacture 10MW+ per month, and has over 24 million hours of fleet operation across 40+ utilities.
Advanced Microgrid Solutions (50MW win from SCE): Previously unknown before the SCE project win, the company plans to focus on stackable large scale commercially deployed, utility-facing battery systems for use in dense urban or Class A office regions. Similar to other winners, AMS will charge their batteries at night then deploy during a 2-4 hour peak demand interval as the utility needs to dispatch this demand-side management tool. AMS is assuming that lithium ion costs (or others – the company is technology agnostic) will continue to fall over the next several years and is pricing contract bidding appropriately, which likely helped it win. Furthermore, the appeal for the utilities is clear (they control everything about the system) while the appeal for commercial customers is also compelling (spend less on peak charges).
Stem (85MW win from SCE): This battery integrator company is primarily focused on commercial scale or larger installations which are able to shave peak charges in markets where commercial users may be subject to rapidly shifting electricity rates. In addition to integrating battery packages, Stem uses intelligent software analytics to predict grid charges and counteract them proactively. The company is backed by investors like Angeleno Group, Constellation Energy, GE Ventures, Iberdrola, and Jagen Pty. Stem focuses primarily on energy management and may pair its batteries with solar (such as a partnership with Kyocera in California, New York, and Hawaii) but the key focus for the company is on targeted software for demand management. This can generate immediate returns for commercial companies that are able to offset peak charges, and Stem is reported to have financed its own systems (similar to solar leasing companies) through utility payment savings. While improving battery technology is an important driver of driving systems at grid parity, Stem’s business model appears to show that intelligent grid management will be just as important.
AES (100MW win from SCE): AES is a medium sized publically traded IPP/energy company with ~36GW in operation, several GW under construction, 10 million + customers, and a diverse range of energy sources. As an established energy company that is developing storage solutions, it is not surprising that they were able to bid successfully. The company’s 100MW, 20 year PPA with SCE will provide a 100MW battery-based storage solution which can flex to 200MW as needed (400MWh).

27 February 2015
Clean Technology
Solar
Deutsche Bank Securities Inc. Page 51
Several storage start-ups have recently raised funding in order to
commercialize technology and ramp up manufacturing. For instance, EOS
energy storage is raising $25M in order to scale up manufacturing of hybrid
Zinc cathode, aqueous electrolyte based battery. Once fully ramped, the
battery would have 75% round trip efficiency, 30 year lifetime, $160/kWh cost.
Zinc is much cheaper than lithium but the problem with Zinc is electrode
corrosion and build-up. EOS solves this problem by a proprietary coating that
creates a permanently conductive and non-corrosive surface.
Another start-up, Aquion Energy has raised more than $150M in equity and
debt in order to deploy more than 1MW of sodium-ion batteries at $300/kWh
price point.
Flow batteries from Imergy, UniEnergy, Cell-cube American Vandium and ViZn
Energy are all targeting low price points.
Besides these start-ups, larger companies such as Panasonic, Mitsubishi, LG
Chem, Samsung, Saft and A123 owner NEC are also targeting grid storage.
AES Energy storage calls li-ion as the chemistry of choice for the next decade.
Figure 48: Emerging Battery Companies
Current Future
Company Name Technology Type Cost ($/kwh) Cost ($/Kw) Cost ($/kwh) Cost ($/Kw)Aquion Energy Sodium-Ion $500 $250
Eos Energy Storage Zinc Air $160
Primus Power Flow (Zinc Halogen with zinc plating and de-plating) $500
EnerVault Flow (Iron Chromium) $250
Imergy Power (Deeya Energy) Flow (Vanadium Based) $500 $300
Prudent Energy Flow
Redflow (Australia) Flow (Zinc-Bromide) $875 $525
Cellstrom Flow
Gildemeister (EU) Flow (Vanadium Based) $1,000
ZBB Flow (Zinc-Bromide) $3,175* $1,2700*
EnStorage (Israel) Flow $738 $307
Premium Power Flow
Ice Energy Thermal (water)
Alevo Lithium-iron-phosphate $100
Advanced Microgrid Solutions
AES Energy Storage Lithium-ion $1,000
Stem
Ambri Liquid Metal Battery $500
ELIIY Power Lithium-iron-phosphate
Sonnenbatterie Lithium-iron-phosphate $2,100-$2,888*
Bloom energy
Intelligent Energy
Coda Energy
Green Charge Networks
Combined Energies
Eonix
Hollingsworth & Vose
Bettergy
Lionano
Raymond Corp
Graphenix Development
* cost of entire PV+Battery system Source: Deutsche Bank, GTM, Energystorage.org
Why Develop Battery Technology
The primary reasons for the necessity of energy storage additions include: 1)
growth in renewables implies intermittent spikes or troughs in power

27 February 2015
Clean Technology
Solar
Page 52 Deutsche Bank Securities Inc.
generation and voltage, which could lead to grid instability at higher
penetration rates (~10-15%+ grid capacity or generation). This was notably
illustrated by the California Independent System Operator (CAISO) in late 2013
as it modeled issues in achieving 33% renewable energy by 2020. The
implication is that a 100%+ increase in capacity needs in the span of 1-2 hours
as renewable penetration grows will create significant challenges for grid
stability under current norms. Behind the meter batteries would smooth the
peak demand during the evening, while utility scale batteries could provide the
rapid response time and fluctuation response necessary to support large scale
variable generation.
Figure 49: Increasing Levels of Renewables = Difficulties for ISO’s
Source: CAISO
Other reasons include: 2) increased shift towards distributed generation; which
is prompting some utilities to fight net metering, interconnection, or other solar
incentives 3) increase in electricity prices; which makes systems with grid
storage more economical 4) outages caused by natural disasters like hurricane
Sandy (stand-alone microgrids that could fuel emergency infrastructure or
individual communities). 5) Electrification of underserved areas of the world
can be implemented effectively through micro-grids.
Benefits include – 1) providing backup power to homes, businesses or utilities;
2) cutting peak-demand charges; 3) providing firm peak capacity to the grid; 4)
providing frequency regulation and improving relationship between distributed
generation producer and utility with smart grid implementation.
Benefits: Residential + Utility
The current model for utilities necessitates planning for extreme scenarios.
Specifically, all utilities must build enough capacity to handle extreme demand
levels – for instance, consumers coming home on a hot day and all turning on
their air conditioners, TV’s, lights, etc on around the same time. This leads to a
load curve as shown below:
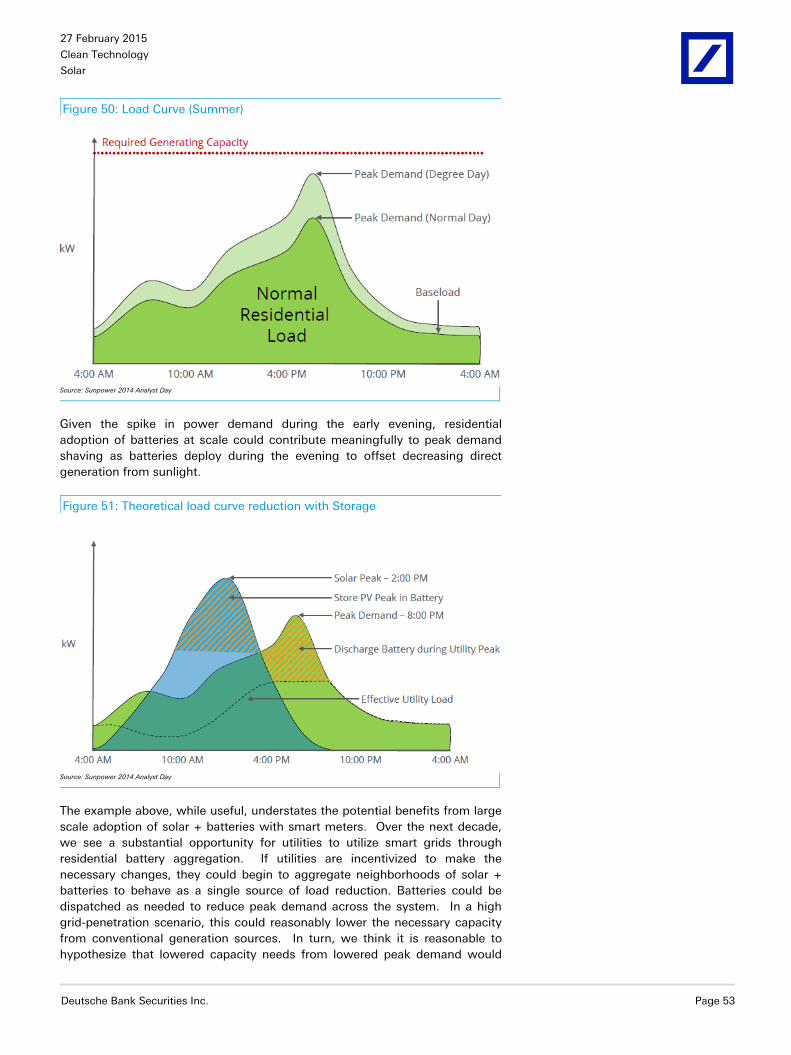
27 February 2015
Clean Technology
Solar
Deutsche Bank Securities Inc. Page 53
Figure 50: Load Curve (Summer)
Source: Sunpower 2014 Analyst Day
Given the spike in power demand during the early evening, residential
adoption of batteries at scale could contribute meaningfully to peak demand
shaving as batteries deploy during the evening to offset decreasing direct
generation from sunlight.
Figure 51: Theoretical load curve reduction with Storage
Source: Sunpower 2014 Analyst Day
The example above, while useful, understates the potential benefits from large
scale adoption of solar + batteries with smart meters. Over the next decade,
we see a substantial opportunity for utilities to utilize smart grids through
residential battery aggregation. If utilities are incentivized to make the
necessary changes, they could begin to aggregate neighborhoods of solar +
batteries to behave as a single source of load reduction. Batteries could be
dispatched as needed to reduce peak demand across the system. In a high
grid-penetration scenario, this could reasonably lower the necessary capacity
from conventional generation sources. In turn, we think it is reasonable to
hypothesize that lowered capacity needs from lowered peak demand would

27 February 2015
Clean Technology
Solar
Page 54 Deutsche Bank Securities Inc.
simultaneously lower the need for large up front capital investment in peaker
plants. Two likely scenarios for this scale deployment include 1) Third party
leasing companies and individuals install solar + smart meters to work with the
utilities or 2) the regulatory framework shifts and utilities begin including
residential solar in their rate base. Both of these scenarios would likely
significantly improve reliability, enable microgrids to function as needed, and
improve grid resiliency during emergency situations.
Figure 52: Utilities Could Dispatch Batteries on Demand in the Future
Source: Sunpower Analyst Day - 2014
Benefits: Commercial Customers Avoid Peak Charges
In addition to the potential uses on the residential side, commercial customers
could significantly reduce their electric bill under time of use pricing or other
pricing scenarios where demand charges make up a significant portion of the
bill. During peak usage scenarios, batteries could be deployed immediately to
shave the demand profile below the utility threshold.

27 February 2015
Clean Technology
Solar
Deutsche Bank Securities Inc. Page 55
Figure 53: Commercial Users Could Smooth Their Usage Profile
Source: Sunpower Analyst Day
Current Policy Incentives
1. Germany: Germany launched an energy storage subsidy in 2013 (effective
since May 2013), under which, KfW Bankengruppe and the Federal Ministry
for the Environment are supporting the increased use of energy storage in
conjunction with solar PV systems linked to the electricity grid. The program
aims to encourage further technical development of storage battery systems
for solar PV installations. The program provides low-interest loans and
repayment subsidies for new solar PV installations which incorporate a fixed
battery storage system, and for the retrofit of such systems to solar PV
installations commissioned after 31 Dec 2012. The subsidy amounts to a
maximum of 30% of the investment cost for the energy storage system. In
May 2014, BSW Solar reported that more than 4,000 new solar plus battery
systems have been installed in the country. BSW Solar also noted that
~EUR66M in low-interest loans were distributed by the development bank and
~EUR10M was given out in grants.
2. Japan: In Mar 2014, Japan launched a subsidy program to support the
installation of Li-ion battery-based stationary storage systems, offering to pay
individuals and entities up to two-thirds of their purchase price. Japan’s
Ministry of Economy, Trade and Industry (METI) announced that a budget of
JPY10B (~$98M) had been earmarked for the program. Subsidy payouts are
capped at JPY1M ($10k) for individuals and at JPY100M for businesses,
available for the installation of battery systems of 1kWh capacity or more.
3. US: California - California’s AB 2514 energy storage procurement program
requires California Public Utilities Commission (CPUC) to consider creating an
energy storage procurement mandate for utilities. CPUC has approved a
mandate that will require the state’s big three investor-owned utilities to add
1.3GW of energy storage to their grids by the end of 2020 (SCE – 580MW,
PG&E – 580MW, SDG&E – 165MW). Additionally, the state’s Self-Generation
Incentive Program (SGIP) provides financial incentives for the installation of
clean and efficient distributed generation technologies. New York - New York
Battery and Energy Storage Technology (NY-BEST) consortium was created in

27 February 2015
Clean Technology
Solar
Page 56 Deutsche Bank Securities Inc.
2010 with a $25M grant from New York State Energy Research and
Development Authority (NYSERDA) to position New York State as a global
leader in energy storage technology. In Jan 2014, Consolidated Edison and
NYSERDA announced that they intend to reduce peak energy demands during
the summer. The announcement proposed a reduction of the load by 100MW,
partly through the use of energy storage systems. Under the program, grants
for thermal storage units increased from $600/kW to $2,600/kW, and grants
for battery storage increased from $600/kW to $2,100/kW. The funding is
capped at 50% of the project’s costs. Washington - Washington State enacted
two laws related to energy storage – 1) the first enables qualifying utilities to
credit energy storage output of renewable sourced energy at 2.5 times the
normal value; and 2) the second requires electric utilities to include energy
storage in all integrated resource plans.
4. Canada: Under Ontario’s long term energy plan (LTEP), the government
intends to address regulatory barriers that limit the ability of energy storage
technologies to compete in Ontario’s electricity market. By the end of 2014,
the government will include storage technologies in its procurement process -
starting with 50MW. LTEP states that the new procurement process for
renewable energy projects larger than 500kW will also provide an opportunity
to consider proposals that integrate energy storage with renewable energy
generation.
27 February 2015
Clean Technology
Solar
Deutsche Bank Securities Inc. Page 57
How To Make Hay While the Sun Shines?
What does it take to win in the solar sector?
Scale: Cost competitive and scalable technology solutions stand to gain share
over the next growth phase of the solar sector. Most companies have been
focused on scaling midstream parts of the value chain. We believe successful
companies would be able to cost effectively scale the entire value chain
(including downstream).
Capital: Access to low cost capital would be a significant competitive
advantage for companies, especially as growth will come from new markets
with no established financing solutions.
Technology: Not only companies with high efficiency would do well, we expect
companies providing integrated products with micro-inverter solutions to also
have a competitive advantage. Increasing functionality in the form of
embedded hardware and software would be the primary differentiator of
successful midstream solar companies. Over time, the integration of storage
and energy management would become the primary differentiator for solar
companies.
Diversification: We expect companies with diversified geographic and segment
exposure to be in a better position to deal with changing policy environment.
While incentives will continue to diminish over time, government policies will
continue to impact the sector in a positive or negative way. Some countries
may provide easy access to the grid for solar projects while others may make
the rules on how solar companies access the grid more difficult. As such,
being overly dependent on one market despite the significant size of the
industry is not a good strategy in our view.
Policy Focus will Remain Front and Center in Many Markets
Within the US, the extension of ITC (set to expire in 2016), extending the MLP
status to renewables, net metering 2.0 in California, grid integration in Hawaii
and grid access charges in several states would be some of the policy items
impacting solar supply chain. Additionally, trade case development in China,
US and other global markets would be an important theme to watch in 2015.
Adverse trade policies certainly pose the risk of slowing down growth in
important solar markets, especially in light of the recent gas price weakness.
That said, we believe a positive resolution of these trade disputes is likely and
would set the stage for stronger growth in 2016.
Picking Winners/Losers
The solar sector has been generally under owned by institutional investors and
expect greater institutional ownership to drive near term positive momentum
for the sector. We expect a number of new business models focused on the
downstream part of the value chain to emerge and expect innovative private
companies to drive cost improvement/solar adoption. Both of these set of
companies stand to generate significant shareholder value, in our view. We
believe companies involved in financing/downstream part of the value chain

27 February 2015
Clean Technology
Solar
Page 58 Deutsche Bank Securities Inc.
stand to generate the most significant shareholder value in the near term. We
expect these companies to be in a unique position to take advantage of the
financing arbitrage offered by inefficient private markets and publicly trade
"yield" vehicles. Solar is achieving grid parity in a number of new markets
globally and we expect companies involved in project development/financing
to benefit the most from the significant volume growth over the next few
years. As storage costs start to improve we expect companies with cost
competitive storage solutions to create the most shareholder value.
Long Term Risk: Evolving Utility Business Models
Based on ongoing disputes in Arizona, California, and Colorado, we see the
beginnings of what could indicate a long term shift in how utilities and their
regulatory commissions interact with solar. In 2015, we expect several key
decisions from utility regulators to continue shaping this debate.
Certain utilities are currently arguing that owners of solar installations are not
paying enough to support the grid, because transmission and distribution
charges are generally based on metered electricity use. When a solar
installation connects to the grid, it generates a portion of the owners electricity
use and effectively acts as a reduction in grid demand. In most cases, this
leads to a proportional decrease in the dollar charge for grid-sourced electricity
(which includes a proportional charge for T&D cost recovery).
Solar companies, individual users, and freedom-of-choice advocates believe
this representation does not accurately account for the positive external
contributions that solar installations provide. Theoretically, large scale
distributed generation adoption should lower peak electricity demand, reduce
strain on the grid, provide emissions-free electricity with no fuel cost, and
lower the amount of necessary future investment in the grid on all fronts. In a
scenario where ‘smart grids’ allow distributed solar resources to be dispatched
as requested by the grid operator, the benefits from DG installations should
increase.
These debates are ongoing and unlikely to be finalized in the short term. On
one hand, Arizona has already implemented a ‘grid access’ charge of $0.70/kw
(~$4-5 dollars per month for a typical residential system), which was still
considerably lower than the ~$20/month grid charge requested by the utility.
On the other hand, key states like California and New York continue to provide
a constructive regulatory environment that favors solar.
Long term, we believe the business models for solar and utility companies will
necessarily shift as grid penetration rates increase (currently no more than 1-
2% in even the high penetration states). Grid access charges could increase,
utilities may start to compete more directly with solar installers, and cost
recovery mechanisms generally will go through a rigorous analysis in most
major solar markets.
Arizona is generally considered one of the most contentious regions for debate
in the US, yet solar leasing companies like SCTY have continued to ramp their
installation rates despite this.
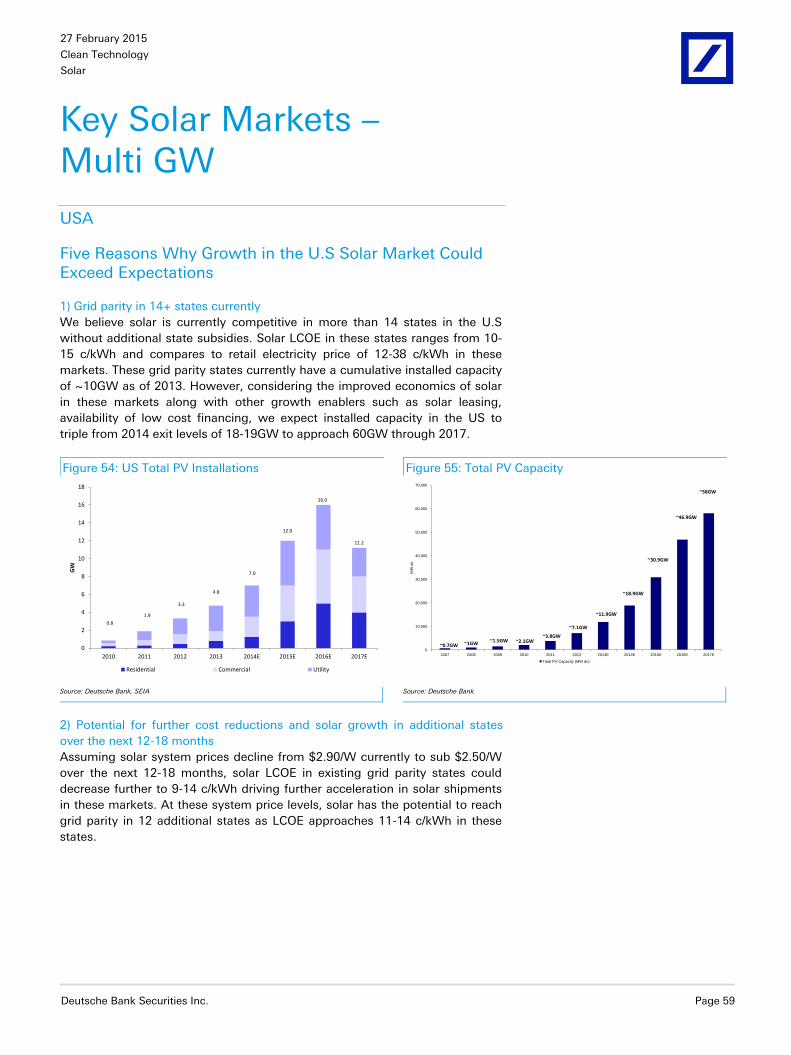
27 February 2015
Clean Technology
Solar
Deutsche Bank Securities Inc. Page 59
Key Solar Markets – Multi GW
USA
Five Reasons Why Growth in the U.S Solar Market Could Exceed Expectations
1) Grid parity in 14+ states currently
We believe solar is currently competitive in more than 14 states in the U.S
without additional state subsidies. Solar LCOE in these states ranges from 10-
15 c/kWh and compares to retail electricity price of 12-38 c/kWh in these
markets. These grid parity states currently have a cumulative installed capacity
of ~10GW as of 2013. However, considering the improved economics of solar
in these markets along with other growth enablers such as solar leasing,
availability of low cost financing, we expect installed capacity in the US to
triple from 2014 exit levels of 18-19GW to approach 60GW through 2017.
Figure 54: US Total PV Installations Figure 55: Total PV Capacity
0
2
4
6
8
10
12
14
16
18
2010 2011 2012 2013 2014E 2015E 2016E 2017E
GW
Residential Commercial Utility
0.8
1.9
3.3
4.8
7.0
12.0
11.2
16.0
0
10,000
20,000
30,000
40,000
50,000
60,000
70,000
2007 2008 2009 2010 2011 2012 2013E 2014E 2015E 2016E 2017E
MW
dc
Total PV Capacity (MW dc)
~0.7GW
~7.1GW
~3.8GW~2.1GW~1.5GW
~1GW
~46.9GW
~30.9GW
~18.9GW
~11.9GW
~58GW
Source: Deutsche Bank, SEIA
Source: Deutsche Bank
2) Potential for further cost reductions and solar growth in additional states
over the next 12-18 months
Assuming solar system prices decline from $2.90/W currently to sub $2.50/W
over the next 12-18 months, solar LCOE in existing grid parity states could
decrease further to 9-14 c/kWh driving further acceleration in solar shipments
in these markets. At these system price levels, solar has the potential to reach
grid parity in 12 additional states as LCOE approaches 11-14 c/kWh in these
states.

27 February 2015
Clean Technology
Solar
Page 60 Deutsche Bank Securities Inc.
Figure 56: States Currently at Grid Parity Figure 57: Additional States Poised to Reach Grid Parity
Grid Parity at $2.90
($2.03 w/ ITC)LCOE ($/KWh)
Average Cost of
Electricity ($/KWh)
Hawaii 0.11 0.38
New York 0.14 0.20
California 0.11 0.16
Connecticut 0.14 0.19
Rhode Island 0.14 0.18
Nevada 0.10 0.13
Massachusetts 0.14 0.17
New Hampshire 0.14 0.17
Vermont 0.15 0.18
New Mexico 0.10 0.12
Arizona 0.10 0.12
New Jersey 0.14 0.16
Colorado 0.11 0.12
Maryland 0.13 0.14
Grid Parity at $2.50
($1.75 w/ ITC)LCOE ($/KWh)
Average Cost of
Electricity ($/KWh)
Michigan $0.13 $0.15
Delaware $0.12 $0.13
Kansas $0.11 $0.12
South Carolina $0.11 $0.12
Wisconsin $0.13 $0.14
Pennsylvania $0.12 $0.13
District of Columbia $0.12 $0.13
Florida $0.11 $0.12
Maine $0.14 $0.15
Georgia $0.11 $0.12
Utah $0.10 $0.11
Texas $0.12 $0.12
North Carolina $0.11 $0.11
Mississippi $0.11 $0.11 Source: Deutsche Bank, EIA
Source: Deutsche Bank, EIA
3) Lower financing costs could provide additional growth kicker
We believe the broader acceptance of yieldco type
structures could lower solar financing costs by ~200-300
bps in addition to providing significant amount of
liquidity within the solar sector. Every 100 bps reduction
in financing costs results in 1 c/kWh reduction of LCOE,
in our view. We believe solar LCOE could potentially
decrease from 9-15 c/kWh to 7-13 c/kWh as a result of
wider acceptance of yieldco type structures. Wider
availability of financing options could provide project
developers some cushion in a rising interest rate
environment.
4) ITC expiration could act as another catalyst
Current forms of federal investment tax credits are set to expire in 2016.
Without any ITC, solar LCOE increases from 10-16 c/kWh to 15-21c/kWh and
only 1 state (Hawaii) screening at grid parity states vs ~10 states currently. In a
2017+ 10% ITC environment, solar would be at grid parity in ~36 states (vs
~47 states with 30% ITC), assuming system prices and financing costs decline
although the economics for solar would not be as attractive. Consequently, we
expect to see a big rush of new installations ahead of the 2016 ITC expiration.
Figure 58: Shift in LCOE for 100bps Reduction
Cost of Debt/Discount
Rate
Average LCOE
($2.03 w/ITC)
Reduction per
100bps
7% $0.14
6% $0.13 $0.0093
5% $0.12 $0.0091
4% $0.11 $0.0089
3% $0.10 $0.0086
2% $0.09 $0.0082
Source: Deutsche Bank Note: Average of all 50 states and DC for current net system LCOE (with ITC)
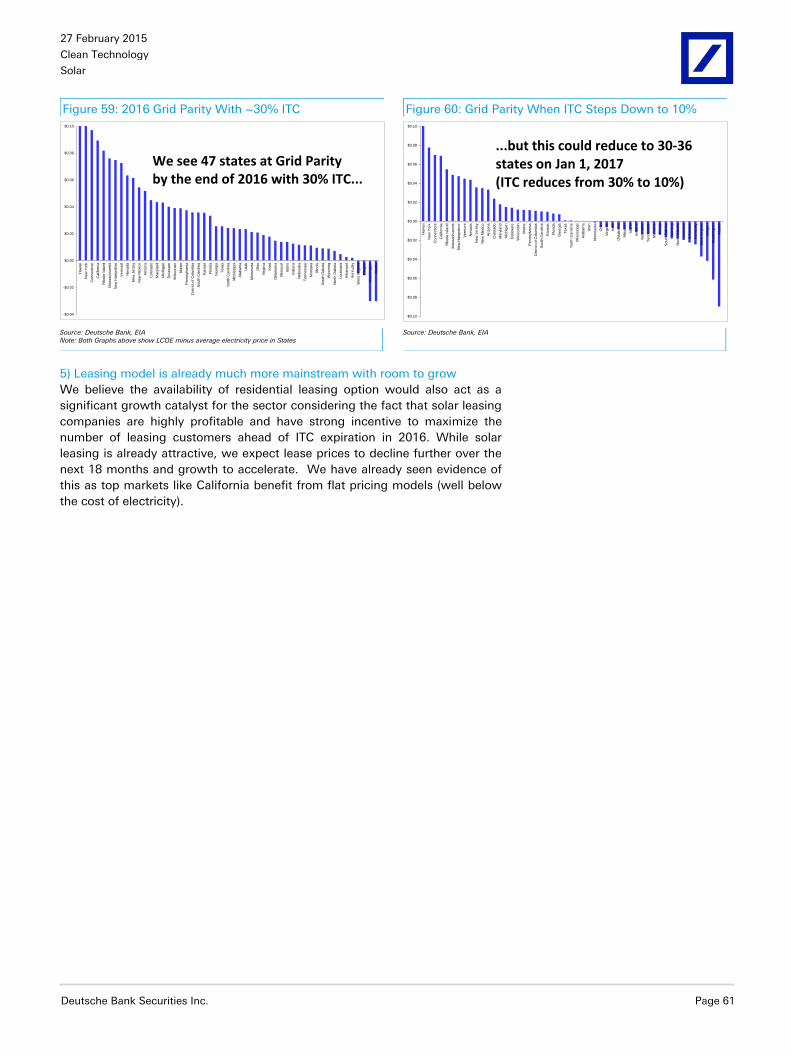
27 February 2015
Clean Technology
Solar
Deutsche Bank Securities Inc. Page 61
Figure 59: 2016 Grid Parity With ~30% ITC Figure 60: Grid Parity When ITC Steps Down to 10%
-$0.04
-$0.02
$0.00
$0.02
$0.04
$0.06
$0.08
$0.10
Haw
aii
New
York
Connecticut
Calif
orn
ia
Rhode Isla
nd
Massachusett
s
New
Ham
pshire
Verm
ont
Nevada
New
Jers
ey
New
Mexic
o
Arizona
Colo
rado
Ma
ryla
nd
Mic
hig
an
Dela
ware
Wis
consin
Main
e
Pennsylv
ania
Dis
tric
t of C
olu
mbia
South
Caro
lina
Kansas
Flo
rid
a
Georg
ia
Te
xas
Nort
h C
aro
lina
Mis
sis
sip
pi
Ala
bam
a
Uta
h
Min
nesota
Ohio
Virgin
ia
Iow
a
Okla
hom
a
Mis
souri
Idaho
India
na
Nebra
ska
Te
nnessee
Monta
na
Illin
ois
South
Dakota
Wyom
ing
Nort
h D
akota
Louis
iana
Ark
ansas
Kentu
cky
West V
irgin
ia
Ore
gon
Washin
gto
n
Ala
ska
We see 47 states at Grid Parity by the end of 2016 with 30% ITC...
-$0.10
-$0.08
-$0.06
-$0.04
-$0.02
$0.00
$0.02
$0.04
$0.06
$0.08
$0.10
Haw
aii
New
York
Connecticut
Calif
orn
ia
Rhode Isla
nd
Massachusett
s
New
Ham
pshire
Verm
ont
Nevada
New
Jers
ey
New
Mexic
o
Arizona
Colo
rado
Mary
land
Mic
hig
an
Dela
ware
Wis
consin
Main
e
Pennsylv
ania
Dis
tric
t of C
olu
mbia
South
Caro
lina
Kansas
Flo
rida
Georg
ia
Texas
Nort
h C
aro
lina
Mis
sis
sip
pi
Ala
bam
a
Uta
h
Min
nesota
Ohio
Virgin
ia
Iow
a
Okla
hom
a
Mis
souri
Idaho
India
na
Nebra
ska
Tennessee
Monta
na
Illin
ois
South
Dakota
Wyom
ing
Nort
h D
akota
Louis
iana
Ark
ansas
Kentu
cky
West V
irgin
ia
Ore
gon
Washin
gto
n
Ala
ska
...but this could reduce to 30-36states on Jan 1, 2017 (ITC reduces from 30% to 10%)
Source: Deutsche Bank, EIA Note: Both Graphs above show LCOE minus average electricity price in States
Source: Deutsche Bank, EIA
5) Leasing model is already much more mainstream with room to grow
We believe the availability of residential leasing option would also act as a
significant growth catalyst for the sector considering the fact that solar leasing
companies are highly profitable and have strong incentive to maximize the
number of leasing customers ahead of ITC expiration in 2016. While solar
leasing is already attractive, we expect lease prices to decline further over the
next 18 months and growth to accelerate. We have already seen evidence of
this as top markets like California benefit from flat pricing models (well below
the cost of electricity).

27 February 2015
Clean Technology
Solar
Page 62 Deutsche Bank Securities Inc.
Overview
The US market has over 17.5GW of installed solar capacity and nearly 5GW of
solar capacity was added in 2013. While the historic data shows a focus on
utility scale installations, distributed generation (both residential and
commercial) continues to make notable progress. We estimate that ~800MW
of residential systems were installed in 2013 and expect this number to reach
5GW as solar securitization increases and more states continue to reach grid
parity. We believe regions within 10+ states are at grid parity already, while
more states will follow suit as cost per watt continues to decline fueled by BoS
cost reductions, making solar more competitive with rising electricity rates
over the long term.
Despite near term overhang from trade cases, we believe medium and long
term market fundamentals remain intact and continue to see a notable ramp in
installations in the 2015/2016 timeframe. While the distributed generation
market will likely continue to expand rapidly, we see increasing signs of utility
scale strength as coal plant retirements and EPA rules drive increasing
installations ahead of 2017. Beyond 2016, we see the EPA’s Clean Power Plan
as an important multi-year driver for the utility scale market. The recently
finalized Mercury and Air Toxics Standards Rule is generally expected to result
in the retirement of an extensive number of coal plants over the next 1-2 years.
We expect that this will provide a boost to potential utility scale solar,
particularly when considered in the context of the upcoming carbon emissions
rule. Through 2018 there are already ~25GW of plants scheduled for
retirement, but this could prove to be conservative.
Figure 61: Coal Unit Retirement Summary (by NERC Region)
0.00
1,000.00
2,000.00
3,000.00
4,000.00
5,000.00
6,000.00
7,000.00
8,000.00
2011 2012 2013 2014 2015 2016 2017 2018 2019 2020
Cu
rren
t U
nit
Op
era
tin
g C
ap
acit
y (
MW
)
Year Unit Retired from Service
Coal Unit Retirement SummaryASCC TRE FRCC HI MRO NPCC RFC SERC SPP WECC
Source: SNL
The vast majority of these plants are scheduled to come from RFC and SERC
regions, which constitute the majority of the east coast. Particularly in
southern states, we see potential for utility scale solar to help coal plant
replacement. One of the most commonly discussed US incentives is the 30%
investment tax credit, which is expected to drive levels of solar investment
through the end of 2016. Currently planned medium to large scale investment
is shown below, and drops off steeply in 2017.

27 February 2015
Clean Technology
Solar
Deutsche Bank Securities Inc. Page 63
Figure 62: 1MW+ Capacity Additions
0
1,000
2,000
3,000
4,000
5,000
6,000
7,000
8,000
9,000
2006 2007 2008 2009 2010 2011 2012 2013 2014 2015 2016 2017 2018 2019 2020
Pla
nned C
apacity A
dditio
ns (
1M
W+
)
Currently Planned Medium-Large Scale Solar
Source: SNL, As of 9.9.14
The breakdown of our US installation outlook is shown below. The drop from
2016 to 2017 will likely be driven by a drop in the large scale utility market,
given the drop in the investment tax credit.
Figure 63: US Solar Installations Outlook
0
2
4
6
8
10
12
14
16
18
2010 2011 2012 2013 2014E 2015E 2016E 2017E
GW
Residential Commercial Utility
0.8
1.9
3.3
4.8
7.0
12.0
11.2
16.0
Source: Deutsche Bank, SEIA

27 February 2015
Clean Technology
Solar
Page 64 Deutsche Bank Securities Inc.
Figure 64: Total State Capacity/Installs
0
1000
2000
3000
4000
5000
6000
New Solar Power Capacity in 2013 (MW) Total Solar Power Capacity at Year End (MW)
In 2013, the top 10 statesaccounted for ~90%+ of US installations
Source: Deutsche Bank, SEIA

27 February 2015
Clean Technology
Solar
Deutsche Bank Securities Inc. Page 65
State Economics
Figure 65: Dispersion of Electricity Prices in the US
Source: National Renewable Energy Laboratory
As shown above, the electricity price within any given state is often highly
variable (we estimate many states are +/- 3 cents from the mean), while the
vast number of rate structures can provide for further complications (fixed or
variable pricing, time of use, demand response, volume pricing, etc). We have
compiled the average state electric prices on a monthly basis and used the
LTM average for our model.

27 February 2015
Clean Technology
Solar
Page 66 Deutsche Bank Securities Inc.
Figure 66: Most Expensive Electricity (Residential) Figure 67: Least Expensive Electricity (Residential)
Rank StateResidential
($/kWh)
Commercial
($/kWh)
Industrial
($/kWh)1 Hawaii 0.38 $0.35 $0.31
2 New York 0.20 $0.16 $0.06
3 Connecticut 0.19 $0.15 $0.13
4 Alaska 0.19 $0.17 $0.16
5 Rhode Island 0.18 $0.15 $0.13
6 Vermont 0.18 $0.15 $0.10
7 Massachusetts 0.17 $0.15 $0.13
8 New Hampshire 0.17 $0.14 $0.12
9 California 0.16 $0.15 $0.12
10 New Jersey 0.16 $0.13 $0.12
11 Maine 0.15 $0.13 $0.09
12 Michigan 0.15 $0.11 $0.08
13 Wisconsin 0.14 $0.11 $0.08
14 Maryland 0.14 $0.11 $0.09
15 Delaware 0.13 $0.11 $0.09
16 Pennsylvania 0.13 $0.10 $0.07
17 District of Columbia 0.13 $0.12 $0.08
18 Nevada 0.13 $0.10 $0.07
19 Ohio 0.12 $0.10 $0.07
20 South Carolina 0.12 $0.10 $0.06
21 Colorado 0.12 $0.10 $0.07
22 Minnesota 0.12 $0.10 $0.07
23 New Mexico 0.12 $0.10 $0.07
24 Kansas 0.12 $0.10 $0.07
25 Florida 0.12 $0.10 $0.08
Last 12 Month Average Electricity Price
Rank StateResidential
($/kWh)
Commercial
($/kWh)
Industrial
($/kWh)26 Arizona 0.12 $0.10 $0.07
27 Texas 0.12 $0.08 $0.06
28 Georgia 0.12 $0.10 $0.06
29 Iowa 0.11 $0.09 $0.06
30 Alabama 0.11 $0.11 $0.06
31 Mississippi 0.11 $0.11 $0.07
32 Indiana 0.11 $0.10 $0.07
33 North Carolina 0.11 $0.09 $0.06
34 Illinois 0.11 $0.09 $0.06
35 Virginia 0.11 $0.08 $0.07
36 Missouri 0.11 $0.09 $0.06
37 Utah 0.11 $0.09 $0.06
38 South Dakota 0.11 $0.09 $0.07
39 Wyoming 0.11 $0.09 $0.07
40 Nebraska 0.10 $0.09 $0.07
41 Oregon 0.10 $0.09 $0.06
42 Montana 0.10 $0.10 $0.05
43 Tennessee 0.10 $0.10 $0.07
44 Kentucky 0.10 $0.09 $0.06
45 Oklahoma 0.10 $0.08 $0.06
46 Idaho 0.10 $0.08 $0.06
47 North Dakota 0.10 $0.09 $0.08
48 Arkansas 0.10 $0.08 $0.06
49 Louisiana 0.09 $0.09 $0.06
50 West Virginia 0.09 $0.08 $0.06
51 Washington 0.09 $0.08 $0.04
Last 12 Month Average Electricity Price
Source: Deutsche Bank, EIA
Source: Deutsche Bank, EIA
In the absence of outside incentives, utility electricity prices are the main form
of competition a residential/commercial solar project must face. We believe
the top 10-15 states provide the most compelling possibilities for unaided cost
parity, particularly as fossil fuel based generation has been in relative
oversupply and this environment begins to shift. In a 2012 paper (U.S.
Renewable Energy Technical Potentials: A GIS-Based Analysis) the US National
Renewable Energy Laboratory (NREL) conducted a study on the technical
potential for various renewable energy technologies. Using data from the EIA,
McGraw-Hill, and Denholm and Margolis, NREL concluded that ~664GW of
potential capacity could be realized by the rooftop market alone, versus <1%
penetration currently.

27 February 2015
Clean Technology
Solar
Deutsche Bank Securities Inc. Page 67
Figure 68: Technical Rooftop Capacity Vs Electricity Price
0
10
20
30
40
50
60
70
80
$0.00
$0.05
$0.10
$0.15
$0.20
$0.25
$0.30
$0.35
$0.40A
labam
a
Ala
ska
Arizona
Ark
ansas
Calif
orn
ia
Colo
rado
Connecticut
Dela
ware
Dis
tric
t of C
olu
mbia
Flo
rida
Georg
ia
Haw
aii
Idaho
Illin
ois
India
na
Iow
a
Kansas
Kentu
cky
Louis
iana
Main
e
Mary
land
Massachusett
s
Mic
hig
an
Min
nesota
Mis
sis
sip
pi
Mis
souri
Monta
na
Nebra
ska
Nevada
New
Ham
pshire
New
Jers
ey
New
Mexic
o
New
York
Nort
h C
aro
lina
Nort
h D
akota
Ohio
Okla
hom
a
Ore
gon
Pennsylv
ania
Rhode Isla
nd
South
Caro
lina
South
Dakota
Tennessee
Texas
Uta
h
Verm
ont
Vir
gin
ia
Washin
gto
n
West V
irgin
ia
Wis
consin
Wyom
ing
Technic
al C
apacity P
ote
ntial (G
W)
Ele
ctr
icity P
rice (
$/k
Wh)
Potential Rooftop PV Capacity (GW) 12 Month Residential Electricity Price ($/kWh) Median Electricity Price ($/kWh)
Source: Deutsche Bank, NREL, EIA, McGraw Hill, Denholm and Margolis,
From their analysis, we see that ~51% (343GW) of the technical potential lies
in states with electricity prices above the median electricity price
($0.1128/kWh) while, ~19% of the potential (~128GW) lies in states with
residential electricity prices already above $0.15/kwh – primarily California
(~76GW), New York (~25GW), New Jersey(13.7GW) and Connecticut(5.9GW).

27 February 2015
Clean Technology
Solar
Page 68 Deutsche Bank Securities Inc.
Grid Parity Increasing
We believe that the US is at grid parity various regions where high electricity
prices and the declining cost of solar has made investments increasingly
attractive. By default our model takes into account the gross lifetime cost of
the system and the lifetime electricity production, but we have assumed ITC
inclusion (effectively 30% less system cost) in our LCOE analysis.
Below, we show the states which we believe have likely reached grid parity,
depending on the region, electricity price, and type of consumption. Hawaii
and California are consistently shown towards the top of the list due to high
insolation (a measure of the sun’s radiation) and high electricity prices, but
different pricing schemes for types of electricity within state markets causes
divergences thereafter.
Figure 69: States At or Near Grid Parity
Rank Residential Commercial Industrial
1 Hawaii Hawaii Hawaii
2 New York California California
3 California New York Rhode Island
4 Connecticut Connecticut Connecticut
5 Rhode Island Rhode Island Massachusetts
6 Nevada Massachusetts New Jersey
7 Massachusetts New Hampshire New Hampshire
8 New Hampshire New Mexico Nevada
9 New Mexico Vermont Arizona
10 Vermont Arizona New Mexico
11 Arizona Nevada Colorado
12 New Jersey New Jersey Maryland
13 Colorado District of Columbia Florida
14 Maryland Colorado Vermont Source: Deutsche Bank, EIA
While Hawaii is an outlier due to drastically higher electricity prices, The next
10+ states closest to grid parity reinforce our view that high electricity prices
provide the most compelling argument in favor of PV self generation. There is
often a direct correlation between population centers and high electricity
prices (more resources required to generate/transmit electricity equates to a
higher rate base) which implies upside bias to our estimates as customer
awareness increases and the financial viability of solar passes further into
mainstream decision making.
Furthermore, we have conducted a similar analysis for Commercial and
Industrial sectors and with the ITC. While we assumed $2.03/w ($2.90/w ex
ITC) for residential, we have used $1.61/w ($2.30/w ex ITC) and $1.44/w
($2.05/w ex ITC) for commercial and industrial systems (given economies of
scale). Our analysis shows that despite lower electricity prices to compete
with compared to residential prices, the commercial market appears
particularly attractive and should continue to be a solid growth driver for the
US market. The residential market retains the most markets at grid parity in
the current ITC environment.

27 February 2015
Clean Technology
Solar
Deutsche Bank Securities Inc. Page 69
Based on our analysis we believe 13+ States in the US are at grid parity in
certain regions (depending on the local electricity price). Our base case model
uses the 12 month rolling average electricity price for each state. However,
given notable volatility in electricity prices within states, we have also tested
our assumptions compared to a high band (+$0.03) above average. Our
analysis shows that 20-40% of US States appear to be at or near to grid parity.
Industrial electricity prices are the most difficult to compete with (as they are
lowest) but are likely biased to the upside if our analysis considered other
incentives in the LCOE calculation.
Key States – Distance from Grid Parity
Figure 70: Residential Parity @ $2.03 Net Cost (w/ ITC. $2.90/w Gross)
-$0.10
-$0.08
-$0.06
-$0.04
-$0.02
$0.00
$0.02
$0.04
$0.06
$0.08
$0.10
Haw
aii
New
York
Calif
orn
ia
Connecticut
Rhode Isla
nd
Nevada
Massachusett
s
New
Ham
pshire
Verm
ont
New
Mexic
o
Arizona
New
Jers
ey
Colo
rado
Mary
land
Wyom
ing
Dela
ware
Kansas
South
Caro
lina
Mic
hig
an
Flo
rida
State Average ($/kwh)
High Band ($0.03)
We believe 13+ statesare at grid parityin some regions
Source: Deutsche Bank, EIA Note: These three successive graphs show LCOE minus electricity price (average and +3 cents)
Figure 71: Commercial Parity @ $1.61/w Net Cost (w/ITC. $2.30/w Gross)
-$0.10
-$0.08
-$0.06
-$0.04
-$0.02
$0.00
$0.02
$0.04
$0.06
$0.08
$0.10
Haw
aii
Calif
orn
ia
New
York
Connecticut
Rhode Isla
nd
Massachusett
s
New
Ham
pshire
New
Mexic
o
Verm
ont
Arizona
Nevada
New
Jers
ey
Dis
tric
t o
f C
olu
mb
ia
Colo
rado
Mis
sis
sip
pi
Mary
land
Ala
bam
a
Kansas
South
Caro
lina
Flo
rid
a
State Average ($/kwh)
High Band (+$0.03)
Source: Deutsche Bank, EIA

27 February 2015
Clean Technology
Solar
Page 70 Deutsche Bank Securities Inc.
Figure 72: Industrial Parity @ $1.44/w Net Cost (w/ ITC. $2.05/w Gross)
-$0.10
-$0.08
-$0.06
-$0.04
-$0.02
$0.00
$0.02
$0.04
$0.06
$0.08
$0.10
Haw
aii
Calif
orn
ia
Rhode Isla
nd
Connecticut
Massachusett
s
New
Jers
ey
New
Ham
pshire
Nevada
Arizona
New
Mexic
o
Colo
rado
Mary
land
Flo
rid
a
Verm
ont
Dela
ware
Kansas
Nort
h D
akota
Dis
tric
t o
f C
olu
mb
ia
Nebra
ska
Idaho
State Average ($/kwh)
High Band (+$0.03)
Source: Deutsche Bank, EIA

27 February 2015
Clean Technology
Solar
Deutsche Bank Securities Inc. Page 71
Inputs/Methodology
For our analysis we have considered systems using a traditional string inverter
(replaced after 10 years). We assume a 1% production decrease every year, an
80% DC to AC efficiency conversion, and 365 days of electricity production. A
yearly power price escalator (3%) is used to account for general price inflation
or rising fuel costs.
Electricity production from the sample solar array was estimated using a point
average insolation level from NREL’s Solar Prospector (we have used levels for
each State’s most populous city) multiplied by the system size. We use the
total system cost, the yearly operation & maintenance, inverter replacement
costs, and debt payments to arrive at total cost for a year. We apply a
discount rate equal to the total financing cost in order to arrive at a discounted
total costs and production. LCOE is calculated as gross total lifetime costs
divided by total lifetime electricity production (both are discounted at the cost
of debt). Our model spans a 20 and 30 year lifespan.
Methodology
Furthermore, we have modeled out the cash flows of each system to arrive at
unlevered IRR’s ranging from 0 to 47%. Our model assumes that the
electricity is either self used (representing an avoided cost) or sold back into
the grid at the prevailing electricity price. The Solar Energy Industries
Association (SEIA) reports that 43 of the 50 states + DC currently have some
form of net metering in place. Despite some recent challenges to policies, we
believe that net metering policies are likely to stay in place for the foreseeable
future. The table below represents an unlevered system.

27 February 2015
Clean Technology
Solar
Page 72 Deutsche Bank Securities Inc.
Figure 73: LCOE and IRR in USA’s Most Populous Cities (100% equity, including ITC)
StateInsolation
(kWh/m2/year)Cost of Electricity
LCOE ($2.03 w/
ITC)IRR (20 Year System) IRR (30 Year System)
Hawaii 1816 $0.38 $0.11 41.12% 41.17%
California 1843 $0.16 $0.11 11.71% 13.13%
New York 1405 $0.20 $0.14 10.61% 12.17%
Connecticut 1381 $0.19 $0.14 9.80% 11.48%
Nevada 2047 $0.13 $0.10 9.52% 11.24%
Rhode Island 1396 $0.18 $0.14 8.53% 10.42%
New Mexico 2008 $0.12 $0.10 8.22% 10.15%
Massachusetts 1390 $0.17 $0.14 7.98% 9.95%
Arizona 2032 $0.12 $0.10 7.96% 9.94%
New Hampshire 1381 $0.17 $0.14 7.83% 9.83%
Vermont 1308 $0.18 $0.15 7.28% 9.37%
New Jersey 1420 $0.16 $0.14 6.77% 8.96%
Colorado 1779 $0.12 $0.11 6.28% 8.56%
Maryland 1475 $0.14 $0.13 5.20% 7.69%
Delaware 1463 $0.13 $0.14 4.81% 7.38%
Michigan 1341 $0.15 $0.15 4.75% 7.33%
Kansas 1621 $0.12 $0.12 4.74% 7.33%
South Carolina 1588 $0.12 $0.12 4.68% 7.27%
Wisconsin 1381 $0.14 $0.14 4.48% 7.12%
Florida 1615 $0.12 $0.12 4.47% 7.11%
Pennsylvania 1436 $0.13 $0.14 4.46% 7.10%
District of Columbia 1481 $0.13 $0.13 4.42% 7.07%
Maine 1229 $0.15 $0.16 4.04% 6.77%
Georgia 1548 $0.12 $0.13 3.43% 6.29%
Utah 1676 $0.11 $0.12 3.41% 6.28%
Wyoming 1682 $0.11 $0.11 3.40% 6.27%
Texas 1509 $0.12 $0.13 3.35% 6.23%
North Carolina 1579 $0.11 $0.13 3.34% 6.22%
Mississippi 1554 $0.11 $0.13 3.28% 6.18%
Alabama 1521 $0.11 $0.13 3.14% 6.07%
Minnesota 1387 $0.12 $0.14 2.66% 5.70%
Virginia 1500 $0.11 $0.13 2.58% 5.64%
Ohio 1363 $0.12 $0.15 2.58% 5.64%
Iowa 1436 $0.11 $0.14 2.35% 5.46%
Oklahoma 1646 $0.10 $0.12 2.25% 5.39%
Idaho 1667 $0.10 $0.12 2.16% 5.32%
Missouri 1512 $0.11 $0.13 1.99% 5.19%
Indiana 1399 $0.11 $0.14 1.72% 4.99%
Nebraska 1500 $0.10 $0.13 1.71% 4.98%
Tennessee 1518 $0.10 $0.13 1.68% 4.96%
Montana 1515 $0.10 $0.13 1.66% 4.95%
South Dakota 1445 $0.11 $0.14 1.33% 4.70%
Illinois 1369 $0.11 $0.14 1.33% 4.70%
North Dakota 1570 $0.10 $0.13 1.19% 4.59%
Louisiana 1557 $0.09 $0.13 0.86% 4.35%
Arkansas 1515 $0.10 $0.13 0.55% 4.13%
Kentucky 1430 $0.10 $0.14 0.47% 4.07%
West Virginia 1369 $0.09 $0.14 -1.03% 3.01%
Oregon 1229 $0.10 $0.16 -1.07% 2.98%
Alaska 636 $0.19 $0.31 -1.66% 2.57%
Washington 1211 $0.09 $0.16 -3.62% 1.29% Source: Deutsche Bank, NREL, EIA Note: Includes 30% ITC for all states

27 February 2015
Clean Technology
Solar
Deutsche Bank Securities Inc. Page 73
SREC Markets
State renewable energy certificates (SRECs) have helped to push New Jersey
into one of the top solar markets in the country, and several other states have
followed suit. While California does not currently utilize SREC markets the
same way that other states do, we believe these market based instruments can
be an effective means to increase ROI and enhance solar adoption rates.
Overview – Active Markets
New Jersey, Maryland, Delaware, Massachusetts, Ohio, Pennsylvania, North
Carolina and Washington DC all employ active SREC markets currently.
Indiana, Kentucky, West Virginia, and North Carolina also have marginal SREC
markets because they have territory located within the PJM Regional
Transmission Organization, which allows them to trade into active SREC
markets like Ohio and Pennsylvania. Furthermore, California allows tradable
renewable energy credits (TRECs) which are considerably different from SRECs
and less likely to directly benefit distributed generation.
What is an SREC?
SREC’s have been implemented to provide a partially market based incentive
for solar capacity additions, particularly for distributed generation. 1 SREC is
created for every 1 MWh of electricity generated from a solar installation.
Using a Newark, NJ example, a 5kw system would generate ~6-8 SREC’s per
year. At current average wholesale prices, a residential system could generate
incremental yearly income of ~$1,000-$1,500 per year.
SREC markets are primarily based on supply and demand, although the
demand is essentially state mandated. The specifics vary across states, but
there is generally a target renewable portfolio standard (RPS) with a specific
carve out for solar generation over the next 10+ years as either a percentage of
total electricity use or total GWh generated from solar. For example, the
requirements for NJ are shown below, which have changed from absolute
generation targets to % generation targets as shown.
Figure 74: New Jersey RPS Solar Mandate
Energy
Year
Old Solar
Carve-Out
New Solar
Carve Out
Energy
Year
OldSolar
Carve-Out
New Solar
Carve Out
EY 2011 306 GWh 306 GWh EY 2020 2,164 GWh 3.38%
EY 2012 442 GWh 442 GWh EY 2021 2,518 GWh 3.47%
EY 2013 596 GWh 596 GWh EY 2022 2,928 GWh 3.56%
EY 2014 772 GWh 2.05% EY 2023 3,433 GWh 3.65%
EY 2015 965 GWh 2.45% EY 2024 3,989 GWh 3.74%
EY 2016 1,150 GWh 2.75% EY 2025 4,610 GWh 3.83%
EY 2017 1,357 GWh 3.00% EY 2026+ 5,316 GWh 3.92%
EY 2018 1,591 GWh 3.20% EY 2027 5,316 GWh 4.01%
EY 2019 1,858 GWh 3.29% EY 2028 + 5,316 GWh 4.10%
*Note: Energy Year Begins June 1st of the prior calendar year in NJ
Source: NJ State Legislature Bills, DSIRE Note: “Old Solar Carve Out” refers to A.B. 3520, while “New Solar Carve Out” refers to S.B. 1925

27 February 2015
Clean Technology
Solar
Page 74 Deutsche Bank Securities Inc.
Eligibility and SACP
SREC’s are generally designed to increase distributed generation market
penetration and focus specifically on smaller system sizes more suited to
residential or commercial scale. In some states, residential systems (<10-
20kw) can use estimated generation for SREC credits but this is starting to
change.
Solar Alternative Compliance Payments (SACPs) are effectively a price ceiling
for SREC’s, as they are the price a utility would pay if it cannot purchase
SRECs for a lower price. The existence of this mechanism encourages market
development but we believe it is unlikely that longer-term prices will rise above
a certain discount to these levels, given the attractive economics from SRECs
and relatively high prices for SACPs (~$300-400).
SRECs in Perspective
One of the most obvious benefits of an SREC is a notable reduction in the
payback time for a solar system. Given that 1 SREC is created for 1MWh, each
$100 in SREC prices is effectively equal to 10 cents per kwh. The average US
retail electricity price is only 12 cents per kwh, so we can see that the
economics improve with a functioning SREC market which is not dramatically
in oversupply. This has happened before which can cause a precipitous
decline in SREC prices and hurt the economics of legacy projects. However,
state legislatures which choose to implement RPS with a solar carve out may
be more likely than others to revise as needed.
SRECs in our Model
States with high insolation levels showed the greatest improvement in IRRs
because they produced the most SRECs.

27 February 2015
Clean Technology
Solar
Deutsche Bank Securities Inc. Page 75
Figure 75: Theoretical $100 SREC Project IRR
StateInsolation
(kWh/m2/year)Cost of Electricity
LCOE ($2.03
w/ ITC)
IRR (20
Year
System)
IRR (30
Year
System)
IRR (20 Year
System)
IRR (30
Year
System)
Alabama 1521 $0.11 $0.13 2.80% 5.88% 7.55% 9.53%
Alaska 636 $0.19 $0.32 -2.31% 2.33% -0.69% 3.41%
Arizona 2032 $0.12 $0.10 7.78% 9.82% 15.67% 16.53%
Arkansas 1515 $0.10 $0.13 0.06% 3.91% 4.54% 7.15%
California 1843 $0.16 $0.11 11.58% 13.02% 19.47% 20.05%
Colorado 1779 $0.12 $0.11 6.08% 8.44% 12.39% 13.61%
Connecticut 1381 $0.19 $0.15 9.64% 11.37% 14.83% 15.81%
Delaware 1463 $0.13 $0.14 4.55% 7.23% 9.29% 10.98%
District of Columbia 1481 $0.13 $0.14 4.14% 6.91% 8.90% 10.65%
Florida 1615 $0.12 $0.12 4.20% 6.95% 9.50% 11.14%
Georgia 1548 $0.12 $0.13 3.10% 6.12% 8.00% 9.89%
Hawaii 1816 $0.38 $0.11 41.08% 41.14% 59.59% 59.60%
Idaho 1667 $0.10 $0.12 1.77% 5.12% 6.97% 9.05%
Illinois 1369 $0.11 $0.15 0.89% 4.49% 4.91% 7.44%
Indiana 1399 $0.11 $0.14 1.30% 4.78% 5.46% 7.87%
Iowa 1436 $0.11 $0.14 1.97% 5.27% 6.32% 8.54%
Kansas 1621 $0.12 $0.12 4.48% 7.17% 9.85% 11.43%
Kentucky 1430 $0.10 $0.14 -0.03% 3.84% 4.14% 6.85%
Louisiana 1557 $0.09 $0.13 0.39% 4.13% 5.05% 7.53%
Maine 1229 $0.15 $0.16 3.74% 6.60% 7.51% 9.52%
Maryland 1475 $0.14 $0.14 4.95% 7.54% 9.80% 11.40%
Massachusetts 1390 $0.17 $0.14 7.80% 9.84% 12.72% 13.93%
Michigan 1341 $0.15 $0.15 4.49% 7.18% 8.76% 10.54%
Minnesota 1387 $0.12 $0.14 2.29% 5.51% 6.50% 8.69%
Mississippi 1554 $0.11 $0.13 2.94% 5.99% 7.84% 9.76%
Missouri 1512 $0.11 $0.13 1.59% 4.99% 6.18% 8.43%
Montana 1515 $0.10 $0.13 1.24% 4.74% 5.82% 8.14%
Nebraska 1500 $0.10 $0.13 1.29% 4.78% 5.82% 8.14%
Nevada 2047 $0.13 $0.10 9.36% 11.13% 17.74% 18.43%
New Hampshire 1381 $0.17 $0.15 7.65% 9.71% 12.51% 13.75%
New Jersey 1420 $0.16 $0.14 6.58% 8.84% 11.43% 12.81%
New Mexico 2008 $0.12 $0.10 8.04% 10.04% 15.87% 16.71%
New York 1405 $0.20 $0.14 10.46% 12.06% 15.90% 16.78%
North Carolina 1579 $0.11 $0.13 3.01% 6.04% 8.01% 9.90%
North Dakota 1570 $0.10 $0.13 0.73% 4.38% 5.47% 7.86%
Ohio 1363 $0.12 $0.15 2.21% 5.45% 6.32% 8.55%
Oklahoma 1646 $0.10 $0.12 1.87% 5.20% 7.00% 9.07%
Oregon 1229 $0.10 $0.16 -1.67% 2.74% 1.74% 5.09%
Pennsylvania 1436 $0.13 $0.14 4.18% 6.94% 8.77% 10.54%
Rhode Island 1396 $0.18 $0.14 8.36% 10.30% 13.40% 14.53%
South Carolina 1588 $0.12 $0.13 4.41% 7.12% 9.63% 11.25%
South Dakota 1445 $0.11 $0.14 0.89% 4.49% 5.19% 7.65%
Tennessee 1518 $0.10 $0.13 1.26% 4.76% 5.85% 8.16%
Texas 1509 $0.12 $0.13 3.02% 6.05% 7.75% 9.69%
Utah 1676 $0.11 $0.12 3.08% 6.10% 8.48% 10.28%
Vermont 1308 $0.18 $0.15 7.09% 9.25% 11.56% 12.93%
Virginia 1500 $0.11 $0.13 2.21% 5.45% 6.83% 8.94%
Washington 1211 $0.09 $0.17 -4.47% 1.02% -1.16% 3.13%
West Virginia 1369 $0.09 $0.15 -1.63% 2.77% 2.25% 5.45%
Wisconsin 1381 $0.14 $0.15 4.21% 6.96% 8.59% 10.39%
Wyoming 1682 $0.11 $0.11 3.07% 6.09% 8.49% 10.28%
No SREC $100 SREC
Source: Deutsche Bank, NREL
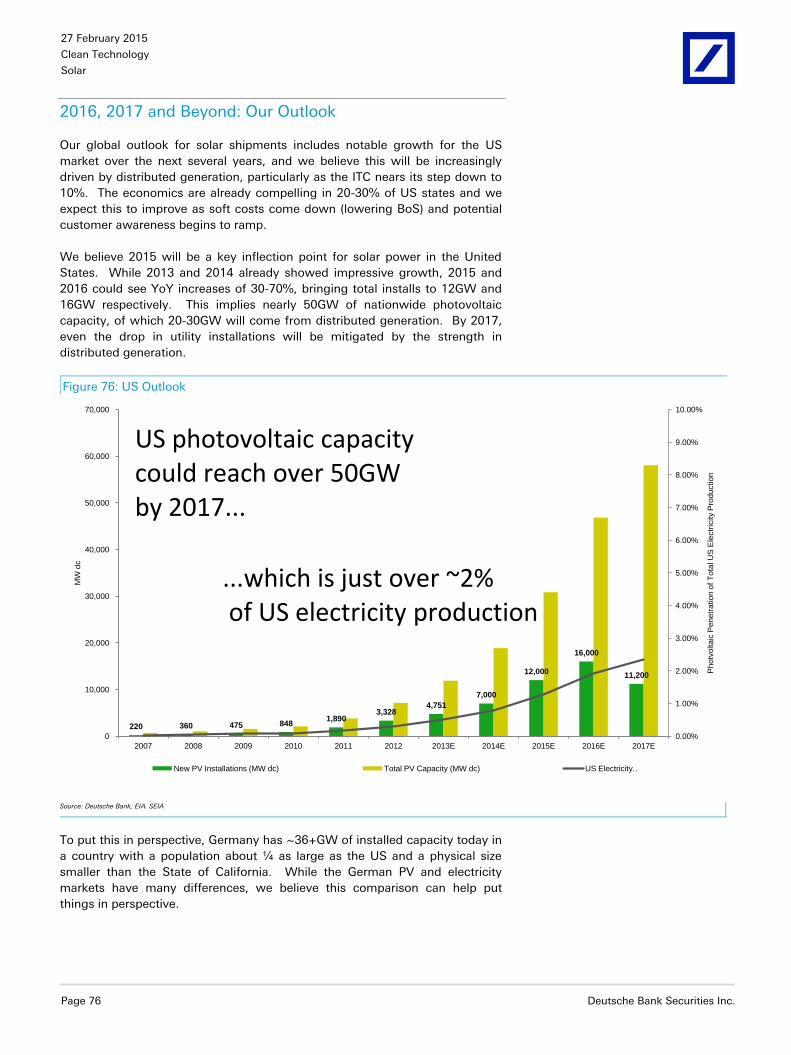
27 February 2015
Clean Technology
Solar
Page 76 Deutsche Bank Securities Inc.
2016, 2017 and Beyond: Our Outlook
Our global outlook for solar shipments includes notable growth for the US
market over the next several years, and we believe this will be increasingly
driven by distributed generation, particularly as the ITC nears its step down to
10%. The economics are already compelling in 20-30% of US states and we
expect this to improve as soft costs come down (lowering BoS) and potential
customer awareness begins to ramp.
We believe 2015 will be a key inflection point for solar power in the United
States. While 2013 and 2014 already showed impressive growth, 2015 and
2016 could see YoY increases of 30-70%, bringing total installs to 12GW and
16GW respectively. This implies nearly 50GW of nationwide photovoltaic
capacity, of which 20-30GW will come from distributed generation. By 2017,
even the drop in utility installations will be mitigated by the strength in
distributed generation.
Figure 76: US Outlook
220 360 475 848 1,890
3,328 4,751
7,000
12,000
16,000
11,200
0.00%
1.00%
2.00%
3.00%
4.00%
5.00%
6.00%
7.00%
8.00%
9.00%
10.00%
0
10,000
20,000
30,000
40,000
50,000
60,000
70,000
2007 2008 2009 2010 2011 2012 2013E 2014E 2015E 2016E 2017E
Photv
oltaic
Penetr
atio
n o
f T
ota
l U
S E
lectr
icity P
roductio
n
MW
dc
New PV Installations (MW dc) Total PV Capacity (MW dc) US Electricity…
US photovoltaic capacitycould reach over 50GWby 2017...
...which is just over ~2%of US electricity production
Source: Deutsche Bank, EIA. SEIA
To put this in perspective, Germany has ~36+GW of installed capacity today in
a country with a population about ¼ as large as the US and a physical size
smaller than the State of California. While the German PV and electricity
markets have many differences, we believe this comparison can help put
things in perspective.
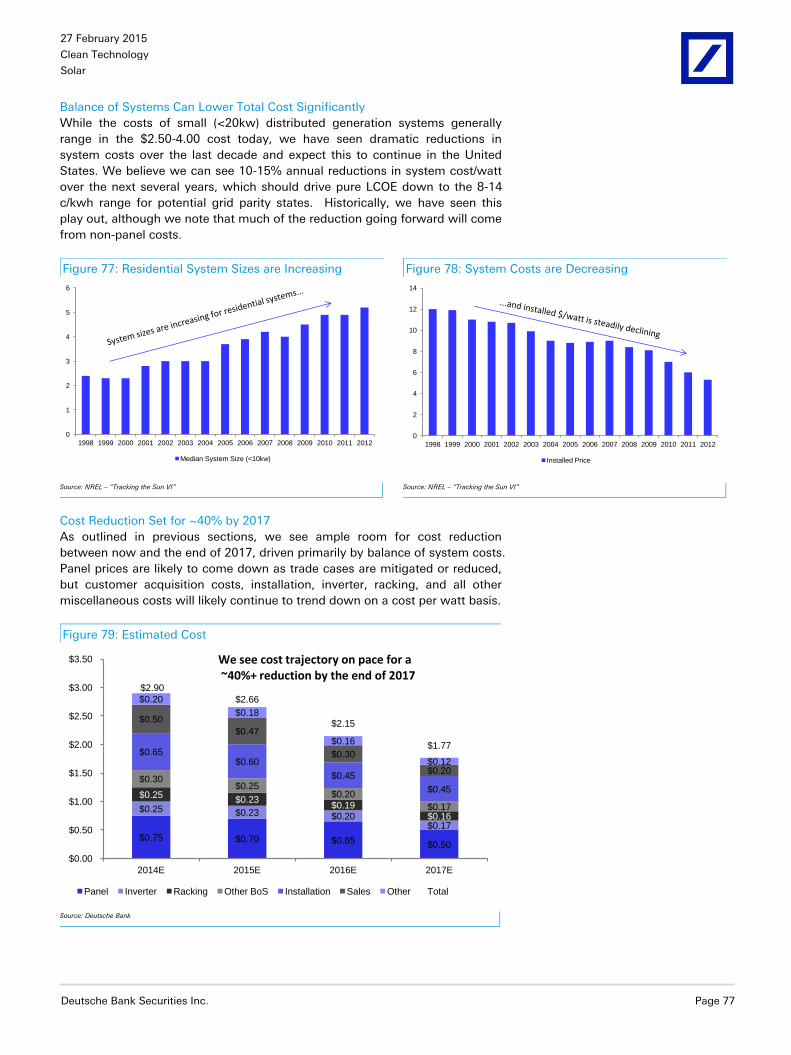
27 February 2015
Clean Technology
Solar
Deutsche Bank Securities Inc. Page 77
Balance of Systems Can Lower Total Cost Significantly
While the costs of small (<20kw) distributed generation systems generally
range in the $2.50-4.00 cost today, we have seen dramatic reductions in
system costs over the last decade and expect this to continue in the United
States. We believe we can see 10-15% annual reductions in system cost/watt
over the next several years, which should drive pure LCOE down to the 8-14
c/kwh range for potential grid parity states. Historically, we have seen this
play out, although we note that much of the reduction going forward will come
from non-panel costs.
Figure 77: Residential System Sizes are Increasing Figure 78: System Costs are Decreasing
0
1
2
3
4
5
6
1998 1999 2000 2001 2002 2003 2004 2005 2006 2007 2008 2009 2010 2011 2012
Median System Size (<10kw)
0
2
4
6
8
10
12
14
1998 1999 2000 2001 2002 2003 2004 2005 2006 2007 2008 2009 2010 2011 2012
Installed Price
Source: NREL – “Tracking the Sun VI”
Source: NREL – “Tracking the Sun VI”
Cost Reduction Set for ~40% by 2017
As outlined in previous sections, we see ample room for cost reduction
between now and the end of 2017, driven primarily by balance of system costs.
Panel prices are likely to come down as trade cases are mitigated or reduced,
but customer acquisition costs, installation, inverter, racking, and all other
miscellaneous costs will likely continue to trend down on a cost per watt basis.
Figure 79: Estimated Cost
$0.75 $0.70 $0.65 $0.50
$0.25 $0.23 $0.20 $0.17
$0.25 $0.23
$0.19 $0.16
$0.30 $0.25
$0.20
$0.17
$0.65 $0.60
$0.45
$0.45
$0.50
$0.47
$0.30
$0.20
$0.20
$0.18
$0.16
$0.12
$2.90
$2.66
$2.15
$1.77
$0.00
$0.50
$1.00
$1.50
$2.00
$2.50
$3.00
$3.50
2014E 2015E 2016E 2017E
Panel Inverter Racking Other BoS Installation Sales Other Total
We see cost trajectory on pace for a~40%+ reduction by the end of 2017
Source: Deutsche Bank

27 February 2015
Clean Technology
Solar
Page 78 Deutsche Bank Securities Inc.
2016 Scenario: 47 States at Grid Parity
Utilizing our 2016 estimates outlined below, we believe ~47 states (including
Washington DC) will be at grid parity exiting 2016 when the 30% ITC is
factored in. Therefore, we expect a significant rush particularly in the
residential segment, as large installers rush to complete as many installations
as possible while the economics are best.
Figure 80: 2016 Assumptions
Assumptions Value
Gross System Cost $2.15
Net System Cost (Net 30% ITC) $1.51
Inverter Cost $0.16
ITC 30%
Cost of Debt/Discount Rate 7%
Equity 100%
Annual Electricity Price Increase 3%
SRECs None
Source: Deutsche Bank
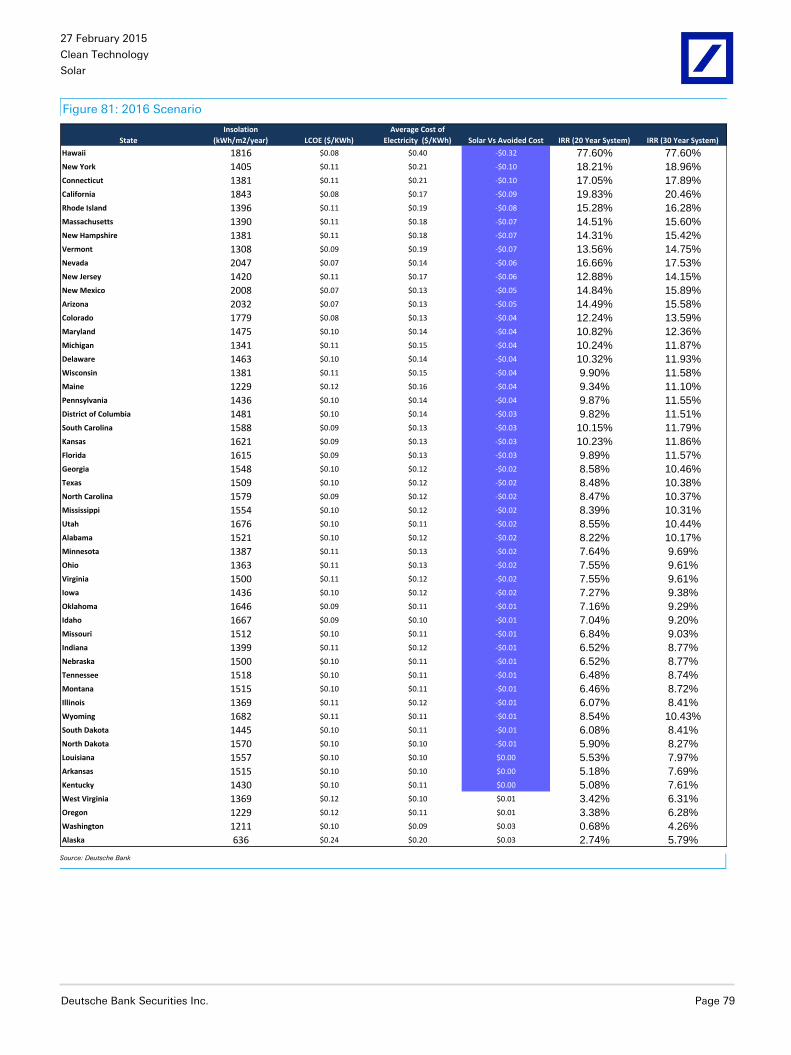
27 February 2015
Clean Technology
Solar
Deutsche Bank Securities Inc. Page 79
Figure 81: 2016 Scenario
State
Insolation
(kWh/m2/year) LCOE ($/KWh)
Average Cost of
Electricity ($/KWh) Solar Vs Avoided Cost IRR (20 Year System) IRR (30 Year System)
Hawaii 1816 $0.08 $0.40 -$0.32 77.60% 77.60%
New York 1405 $0.11 $0.21 -$0.10 18.21% 18.96%
Connecticut 1381 $0.11 $0.21 -$0.10 17.05% 17.89%
California 1843 $0.08 $0.17 -$0.09 19.83% 20.46%
Rhode Island 1396 $0.11 $0.19 -$0.08 15.28% 16.28%
Massachusetts 1390 $0.11 $0.18 -$0.07 14.51% 15.60%
New Hampshire 1381 $0.11 $0.18 -$0.07 14.31% 15.42%
Vermont 1308 $0.09 $0.19 -$0.07 13.56% 14.75%
Nevada 2047 $0.07 $0.14 -$0.06 16.66% 17.53%
New Jersey 1420 $0.11 $0.17 -$0.06 12.88% 14.15%
New Mexico 2008 $0.07 $0.13 -$0.05 14.84% 15.89%
Arizona 2032 $0.07 $0.13 -$0.05 14.49% 15.58%
Colorado 1779 $0.08 $0.13 -$0.04 12.24% 13.59%
Maryland 1475 $0.10 $0.14 -$0.04 10.82% 12.36%
Michigan 1341 $0.11 $0.15 -$0.04 10.24% 11.87%
Delaware 1463 $0.10 $0.14 -$0.04 10.32% 11.93%
Wisconsin 1381 $0.11 $0.15 -$0.04 9.90% 11.58%
Maine 1229 $0.12 $0.16 -$0.04 9.34% 11.10%
Pennsylvania 1436 $0.10 $0.14 -$0.04 9.87% 11.55%
District of Columbia 1481 $0.10 $0.14 -$0.03 9.82% 11.51%
South Carolina 1588 $0.09 $0.13 -$0.03 10.15% 11.79%
Kansas 1621 $0.09 $0.13 -$0.03 10.23% 11.86%
Florida 1615 $0.09 $0.13 -$0.03 9.89% 11.57%
Georgia 1548 $0.10 $0.12 -$0.02 8.58% 10.46%
Texas 1509 $0.10 $0.12 -$0.02 8.48% 10.38%
North Carolina 1579 $0.09 $0.12 -$0.02 8.47% 10.37%
Mississippi 1554 $0.10 $0.12 -$0.02 8.39% 10.31%
Utah 1676 $0.10 $0.11 -$0.02 8.55% 10.44%
Alabama 1521 $0.10 $0.12 -$0.02 8.22% 10.17%
Minnesota 1387 $0.11 $0.13 -$0.02 7.64% 9.69%
Ohio 1363 $0.11 $0.13 -$0.02 7.55% 9.61%
Virginia 1500 $0.11 $0.12 -$0.02 7.55% 9.61%
Iowa 1436 $0.10 $0.12 -$0.02 7.27% 9.38%
Oklahoma 1646 $0.09 $0.11 -$0.01 7.16% 9.29%
Idaho 1667 $0.09 $0.10 -$0.01 7.04% 9.20%
Missouri 1512 $0.10 $0.11 -$0.01 6.84% 9.03%
Indiana 1399 $0.11 $0.12 -$0.01 6.52% 8.77%
Nebraska 1500 $0.10 $0.11 -$0.01 6.52% 8.77%
Tennessee 1518 $0.10 $0.11 -$0.01 6.48% 8.74%
Montana 1515 $0.10 $0.11 -$0.01 6.46% 8.72%
Illinois 1369 $0.11 $0.12 -$0.01 6.07% 8.41%
Wyoming 1682 $0.11 $0.11 -$0.01 8.54% 10.43%
South Dakota 1445 $0.10 $0.11 -$0.01 6.08% 8.41%
North Dakota 1570 $0.10 $0.10 -$0.01 5.90% 8.27%
Louisiana 1557 $0.10 $0.10 $0.00 5.53% 7.97%
Arkansas 1515 $0.10 $0.10 $0.00 5.18% 7.69%
Kentucky 1430 $0.10 $0.11 $0.00 5.08% 7.61%
West Virginia 1369 $0.12 $0.10 $0.01 3.42% 6.31%
Oregon 1229 $0.12 $0.11 $0.01 3.38% 6.28%
Washington 1211 $0.10 $0.09 $0.03 0.68% 4.26%
Alaska 636 $0.24 $0.20 $0.03 2.74% 5.79% Source: Deutsche Bank

27 February 2015
Clean Technology
Solar
Page 80 Deutsche Bank Securities Inc.
2017+: 41 States at Grid Parity
We have applied the assumptions below to our model and found 41 states +
DC (~80%) will be at grid parity, while only Washington and Alaska are more
than 3 cents per kwh away. Therefore, we believe Solar can achieve cost
competitiveness in most states even with a step down in the ITC. While there
must be several more years of cost reductions, efficiency gains, and
marketplace acceptance (which leads to lower overall costs) we see solar
becoming increasingly mainstream as it passes cost competitiveness with
traditional forms of generation. While we will likely see some utilities fight at
every step of the way (because it threatens their business model), we expect
system economics will ultimately win in the longer run and yearly installations
will continue the general upward trajectory (although a 2016 rush is likely).
Already we are hearing of the challenges that drastically increased solar
penetration will have for the electricity grid, and we expect these discussions
to become increasingly necessary as solar continues its path.
Figure 82: 2017 Assumptions
Assumptions Value
System Cost $1.77
Inverter Cost $0.12
ITC 10%
Cost of Debt/Discount Rate 7%
Equity 100%
Annual Electricity Price Increase 3%
SRECs None
Source: Deutsche Bank

27 February 2015
Clean Technology
Solar
Deutsche Bank Securities Inc. Page 81
Figure 83: 2017 Scenario.
State
Insolation
(kWh/m2/year) LCOE ($/KWh)
Average Cost of
Electricity ($/KWh) Solar Vs Avoided Cost IRR (20 Year System) IRR (30 Year System)
Hawaii 1816 $0.09 $0.41 -$0.32 73.57% 73.57%
New York 1405 $0.12 $0.22 -$0.10 17.69% 18.46%
Connecticut 1381 $0.12 $0.21 -$0.09 16.57% 17.44%
California 1843 $0.09 $0.18 -$0.08 19.25% 19.91%
Rhode Island 1396 $0.12 $0.19 -$0.07 14.86% 15.90%
Massachusetts 1390 $0.12 $0.19 -$0.07 14.12% 15.24%
New Hampshire 1381 $0.12 $0.19 -$0.06 13.93% 15.06%
Vermont 1308 $0.13 $0.19 -$0.06 13.21% 14.42%
Nevada 2047 $0.08 $0.14 -$0.06 16.19% 17.10%
New Jersey 1420 $0.12 $0.17 -$0.05 12.55% 13.84%
New Mexico 2008 $0.09 $0.13 -$0.05 14.44% 15.52%
Arizona 2032 $0.08 $0.13 -$0.04 14.10% 15.21%
Colorado 1779 $0.10 $0.13 -$0.04 11.93% 13.30%
Maryland 1475 $0.12 $0.15 -$0.03 10.55% 12.11%
Michigan 1341 $0.13 $0.16 -$0.03 10.00% 11.64%
Delaware 1463 $0.12 $0.15 -$0.03 10.07% 11.70%
Wisconsin 1381 $0.12 $0.15 -$0.03 9.67% 11.35%
Pennsylvania 1436 $0.12 $0.15 -$0.03 9.64% 11.33%
Kansas 1621 $0.11 $0.13 -$0.03 9.99% 11.63%
Maine 1229 $0.14 $0.17 -$0.03 9.13% 10.89%
South Carolina 1588 $0.11 $0.13 -$0.03 9.91% 11.56%
District of Columbia 1481 $0.12 $0.14 -$0.03 9.59% 11.29%
Florida 1615 $0.11 $0.13 -$0.02 9.66% 11.35%
Georgia 1548 $0.11 $0.13 -$0.02 8.39% 10.27%
Texas 1509 $0.11 $0.13 -$0.01 8.30% 10.20%
North Carolina 1579 $0.11 $0.12 -$0.01 8.29% 10.19%
Utah 1676 $0.10 $0.12 -$0.01 8.37% 10.25%
Mississippi 1554 $0.11 $0.12 -$0.01 8.21% 10.12%
Alabama 1521 $0.11 $0.13 -$0.01 8.05% 9.99%
Wyoming 1682 $0.10 $0.12 -$0.01 8.35% 10.24%
Minnesota 1387 $0.12 $0.13 -$0.01 7.49% 9.52%
Ohio 1363 $0.13 $0.13 -$0.01 7.40% 9.45%
Virginia 1500 $0.11 $0.12 -$0.01 7.40% 9.45%
Iowa 1436 $0.12 $0.13 -$0.01 7.13% 9.23%
Oklahoma 1646 $0.10 $0.11 $0.00 7.02% 9.13%
Idaho 1667 $0.10 $0.11 $0.00 6.91% 9.05%
Missouri 1512 $0.11 $0.12 $0.00 6.72% 8.89%
Indiana 1399 $0.12 $0.12 $0.00 6.41% 8.63%
Nebraska 1500 $0.11 $0.11 $0.00 6.40% 8.63%
Tennessee 1518 $0.11 $0.11 $0.00 6.37% 8.60%
Montana 1515 $0.11 $0.11 $0.00 6.35% 8.58%
South Dakota 1445 $0.12 $0.12 $0.00 5.98% 8.28%
Illinois 1369 $0.13 $0.12 $0.00 5.98% 8.28%
North Dakota 1570 $0.11 $0.11 $0.00 5.81% 8.15%
Louisiana 1557 $0.11 $0.10 $0.01 5.45% 7.85%
Arkansas 1515 $0.11 $0.10 $0.01 5.12% 7.58%
Kentucky 1430 $0.12 $0.11 $0.01 5.02% 7.51%
West Virginia 1369 $0.13 $0.10 $0.02 3.45% 6.26%
Oregon 1229 $0.14 $0.11 $0.03 3.40% 6.22%
Washington 1211 $0.14 $0.10 $0.05 0.91% 4.30%
Alaska 636 $0.27 $0.21 $0.06 2.80% 5.76% Source: Deutsche Bank. See table on previous page for key assumptions

27 February 2015
Clean Technology
Solar
Page 82 Deutsche Bank Securities Inc.
Figure 84: Country Snapshot
United States2014 2017
Yearly Sun Hours (Net 20% Conversion Loss) 1,458 1,458
System Cost ($/W) $2.90 $1.77
Discount Rate 7% 7%
Unsubsidized LCOE ($/kWh) $0.19 $0.13
LCOE With 30% ITC (2014 est) $0.14
Electricity Price - High Residential ($/kWh) $0.18 $0.21
Electricity Price - Low Residential($/kWh) $0.08 $0.10
Electricity Market Size (GW) ~1040 GW
2014 Est Solar Installs (MW) 7,000
2015 Est Solar Installs (MW) 12,000
2016 Est Solar Installs (MW) 16,000
Cumulative Solar Installs at end of 2016 47,086
Policy Climate
Other Remarks*LCOE for US is DB est of Residential LCOE
ITC step-down from 30% to 10% in 2017 is challenging, but potential MLP
status and continued success of Yieldco's improve investment climate and
lower cost of capital. State incentives helped previously but are less
important today as most goals have been met.
Source: Deutsche Bank
Figure 85: USA LCOE Scenario Analysis
$0.06
$0.11
$0.16
$0.21
$0.26
$0.31
2014
2015
2016
2017
2018
2019
2020
2021
LCOE
Electricity Price (7% YoY)
Electricity Price (5% YoY)
Electricity Price (3% YoY)
Source: Deutsche Bank

27 February 2015
Clean Technology
Solar
Deutsche Bank Securities Inc. Page 83
China
We believe China will continue to be one of the most important markets in the
world over the next several years. 2014 was marked by continued investor
uncertainty or skepticism around installation mix and targets, but we believe
actual installations will continue at double digit GW levels on a yearly basis. A
document released in September 2014 outlines specific policy support
mechanisms for distributed generation that should help the country achieve
ambitious solar installs goals.
Figure 86: Chinese Solar Targets are a Rapidly Moving Target…
5 G
W
10 G
W
15 G
W
20 G
W
35 G
W
70 G
W
100 G
W
0
20
40
60
80
100
120
Initial 5 year plan
Jun-11 Dec-11 Jun-12 Jul-13 Mar-14 Feb-15
2015 T
arg
et C
apacity (
GW
)
By 2017
By 2020
Source: Deutsche Bank, NEA
While we expect the Chinese govt to continue fine tuning policy which could
create a certain level of near term uncertainty, we believe long term Chinese
policy fundamentals and support remains in place given the country’s
continued growing need for electricity demand, pollution concerns and vast
domestic manufacturing industry. Furthermore, the release of the next 5 year
plan in 2015-2016 timeframe could likely facilitate another increase in Solar
targets, as could the implementation of the planned carbon trading scheme in
2016.

27 February 2015
Clean Technology
Solar
Page 84 Deutsche Bank Securities Inc.
National Policy Initiatives Continue to Fuel Robust Growth
Figure 87: Utility Scale FiT
Previous Fit - Utility Scale
All Regions ¥1.00
New FiT - Utility Scale
Zone 1 - Western ¥0.90
Zone 2 - Northern ¥0.95
Zone 3 - All Others ¥1.00
Source: Deutsche Bank, Chinese Govt
Small Scale Subsidies in Place and Increasing
In addition to utility scale feed in tariffs, China offers a more robust FiT for
distributed generation under 20MW (Previously 6MW, clarified in late 2014).
Distributed generation users are awarded a ¥0.42/kwh FiT, which is on top of
the reduction in electricity use inherent in having a distributed system.
Residential electricity prices generally range between ¥0.60 and ¥0.80/kWh,
while commercial prices are in the higher ¥0.90-¥1.20/kWh range. We expect
the commercial segment to ramp over the next several years as the recently
announced DG policies take hold. Since commercial users are often large
electricity consumers, it is reasonable to assume that all the electricity
production will be consumed, which minimizes grid connection issues and will
likely be supported by local policies as well.

So
lar
Cle
an
Tech
no
log
y
27
Feb
ruary
20
15
Deu
tsch
e B
an
k S
ecu
rities In
c.
Pag
e 8
5
Figure 88: Map of the National Utility FiT Structure
Source: Map by Deutsche Bank. from Official Announcements Note: Tibet (Xizang) will have a separate policy announced
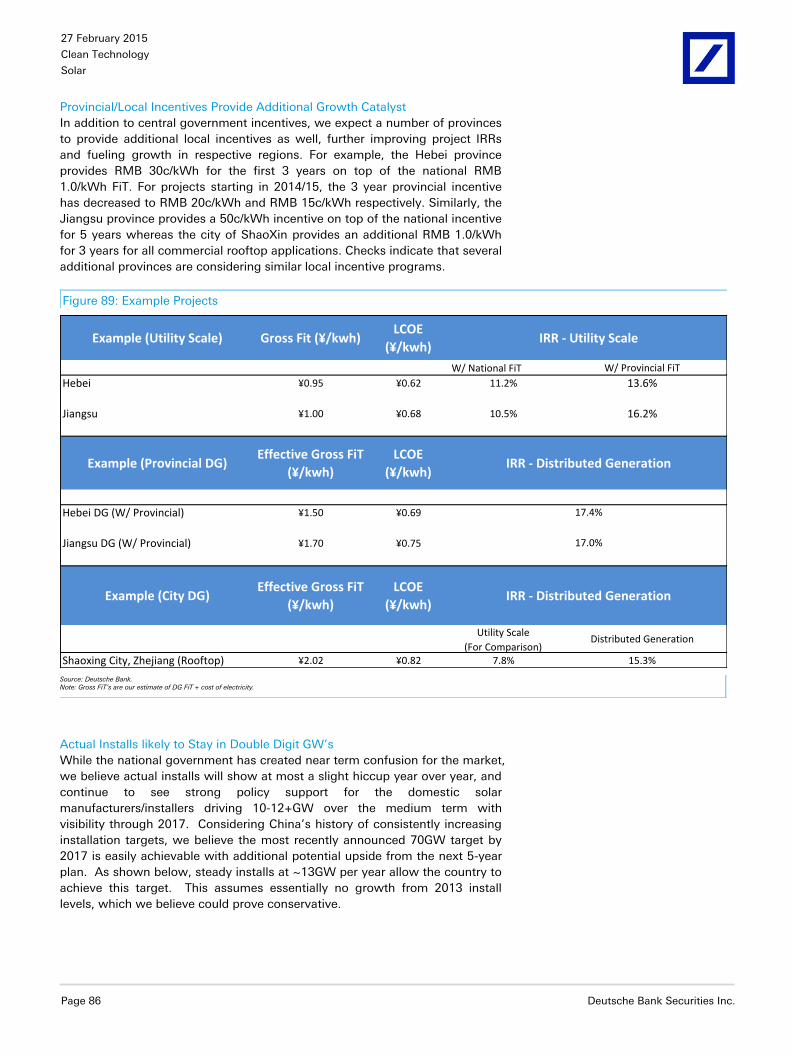
27 February 2015
Clean Technology
Solar
Page 86 Deutsche Bank Securities Inc.
Provincial/Local Incentives Provide Additional Growth Catalyst
In addition to central government incentives, we expect a number of provinces
to provide additional local incentives as well, further improving project IRRs
and fueling growth in respective regions. For example, the Hebei province
provides RMB 30c/kWh for the first 3 years on top of the national RMB
1.0/kWh FiT. For projects starting in 2014/15, the 3 year provincial incentive
has decreased to RMB 20c/kWh and RMB 15c/kWh respectively. Similarly, the
Jiangsu province provides a 50c/kWh incentive on top of the national incentive
for 5 years whereas the city of ShaoXin provides an additional RMB 1.0/kWh
for 3 years for all commercial rooftop applications. Checks indicate that several
additional provinces are considering similar local incentive programs.
Figure 89: Example Projects
Example (Utility Scale) Gross Fit (¥/kwh)LCOE
(¥/kwh)IRR - Utility Scale
W/ National FiT W/ Provincial FiT
Hebei ¥0.95 ¥0.62 11.2% 13.6%
Jiangsu ¥1.00 ¥0.68 10.5% 16.2%
Example (Provincial DG)Effective Gross FiT
(¥/kwh)
LCOE
(¥/kwh)IRR - Distributed Generation
Hebei DG (W/ Provincial) ¥1.50 ¥0.69
Jiangsu DG (W/ Provincial) ¥1.70 ¥0.75
Example (City DG)Effective Gross FiT
(¥/kwh)
LCOE
(¥/kwh)IRR - Distributed Generation
Utility Scale
(For Comparison)Distributed Generation
Shaoxing City, Zhejiang (Rooftop) ¥2.02 ¥0.82 7.8% 15.3%
17.0%
17.4%
Source: Deutsche Bank. Note: Gross FiT’s are our estimate of DG FiT + cost of electricity.
Actual Installs likely to Stay in Double Digit GW’s
While the national government has created near term confusion for the market,
we believe actual installs will show at most a slight hiccup year over year, and
continue to see strong policy support for the domestic solar
manufacturers/installers driving 10-12+GW over the medium term with
visibility through 2017. Considering China’s history of consistently increasing
installation targets, we believe the most recently announced 70GW target by
2017 is easily achievable with additional potential upside from the next 5-year
plan. As shown below, steady installs at ~13GW per year allow the country to
achieve this target. This assumes essentially no growth from 2013 install
levels, which we believe could prove conservative.

27 February 2015
Clean Technology
Solar
Deutsche Bank Securities Inc. Page 87
China Electricity Market Overview
In 1973, China accounted for 17 TWh of electricity
generation (2.8% of worldwide production) versus
~4,200+ TWh (~20%) in 2010, according to the IEA.
Growth in capacity has been similarly robust,
accelerating rapidly in recent years. The Government has
outlined plans to reach ~1400 GW of capacity in its 12 th
5 year plan, which implies 200-300 GW of additional
capacity growth by 2015. However, the majority (70%+)
of the electricity is generated by coal, which has helped
contribute to recent reports of worsening air quality and
environmental/health concerns.
Resources aren’t in population centers
In China, the majority of the coal (60%+) and hydropower
(80%+) are located in the north and west respectively,
while the majority of the population and manufacturing
centers are not. As shown below, the primary energy use
in China is firmly coal based.
Figure 91: Primary Energy Consumption
Oil18%
Gas5%
Coal68%
Nuclear1%
Hydro7%
Solar0%
Wind1%
Geo, Biomass, Other0%
Source: BP Statistical Review of World Energy 2013
We expect policy will continue to attempt to change this makeup into the
future, which will be constructive for Solar.
Transmission Corridors
In order to transmit electricity to the eastern population centers, China outlined
the West-East Electricity Transfer project in the Tenth Five-Year Plan, which
was designed to create three massive transmission corridors. These will not
be complete until 2020 but are integral to moving power from the West and
North regions to the population centers along the eastern coast and other
manufacturing areas. As shown below, the most attractive solar resources are
located far away from the population centers. The majority (~80%) of coal and
hydropower are also located in this region.
Figure 90: Generation Capacity
0
200
400
600
800
1000
1200
1980
1981
1982
1983
1984
1985
1986
1987
1988
1989
1990
1991
1992
1993
1994
1995
1996
1997
1998
1999
2000
2001
2002
2003
2004
2005
2006
2007
2008
2009
2010
2011
2012
China
China has ~1,200 GW of Generating Capacity
Source: Deutsche Bank

27 February 2015
Clean Technology
Solar
Page 88 Deutsche Bank Securities Inc.
Figure 92: China Solar Resource Map
Source: SolarGIS © 2013 GeoModel Solar s.r.o.; Modified by Deutsche Bank
Much of the state focus is centered around a shift in generating mix. China
would like to reduce its reliance on coal as a percent of total generation mix,
which requires a massive investment in transmission infrastructure. There are
multiple ultra high voltage (UHV) lines being built currently, which will facilitate
this shift.
Wholesale Prices
Below are examples of desulphurized prices of wholesale electricity in various
regions in China as of 2011-2012. Central and East China have higher prices,
which indicate more attractive economics for distributed generation in these
regions.

27 February 2015
Clean Technology
Solar
Deutsche Bank Securities Inc. Page 89
Figure 93: Desulphurized Coal Price – 2012
North China ¥ / kwh Central China ¥ / kwh
Beijing ¥0.400 Hubei ¥0.478
Tianjin ¥0.412 Hunan ¥0.501
Hebei North ¥0.424 Jiangxi ¥0.485
Hebei South ¥0.430 Henan ¥0.419
Shanxi ¥0.374 Sichuan ¥0.449
Shandong ¥0.445 Chongqing ¥0.444
Inner Mongolia Self-Use ¥0.311
Inner Mongolia to Beijing Grid ¥0.374
South China ¥ / kwh
East China ¥ / kwh Guangdong ¥0.521
Shanghai ¥0.477 Guangxi ¥0.477
Jiangsu ¥0.455 Yunnan ¥0.353
Zheijiang ¥0.482 Guizhou internal use ¥0.373
Anhui ¥0.446 Guizhou To Guangdong ¥0.383
Fujian ¥0.445 Hainan ¥0.490 Source: EPA, NDRC, Shanghai Price Bureau, Suzhou Municipal Price Burea, Xinhuanet
Figure 94: Country Snapshot
China2014 2017
Yearly Sun Hours (Net 20% Conversion Loss) 1,333 1,333
System Cost ($/W) $1.30 $1.11
Discount Rate 7% 7%
LCOE ($/kWh) $0.11 $0.10
Electricity Price - High Residential ($/kWh) $0.11 $0.13
Electricity Price - Low Residential($/kWh) $0.08 $0.09
Electricity Market Size (GW) ~1250GW
2014 Est Solar Installs (MW) 10,000
2015 Est Solar Installs (MW) 13,000
2016 Est Solar Installs (MW) 13,000
Cumulative Solar Installs at end of 2016 55,745
Policy Climate
Other Remarks*Electricity price is est of resi price, but majority of installs likely to be larger scale. Assumes 5% system price reduction YoY
The release of the next 5 year plan in 2015-2016 timeframe could likely
facilitate another increase in Solar targets
Long term policy fundamentals and support remains in place given the
country’s continued electricity demand increases, pollution concerns, and
vast domestic industry needs
2014 Target: 13GW
2017 Target: 70GW
2020 Target: 100GW
Source: Deutsche Bank
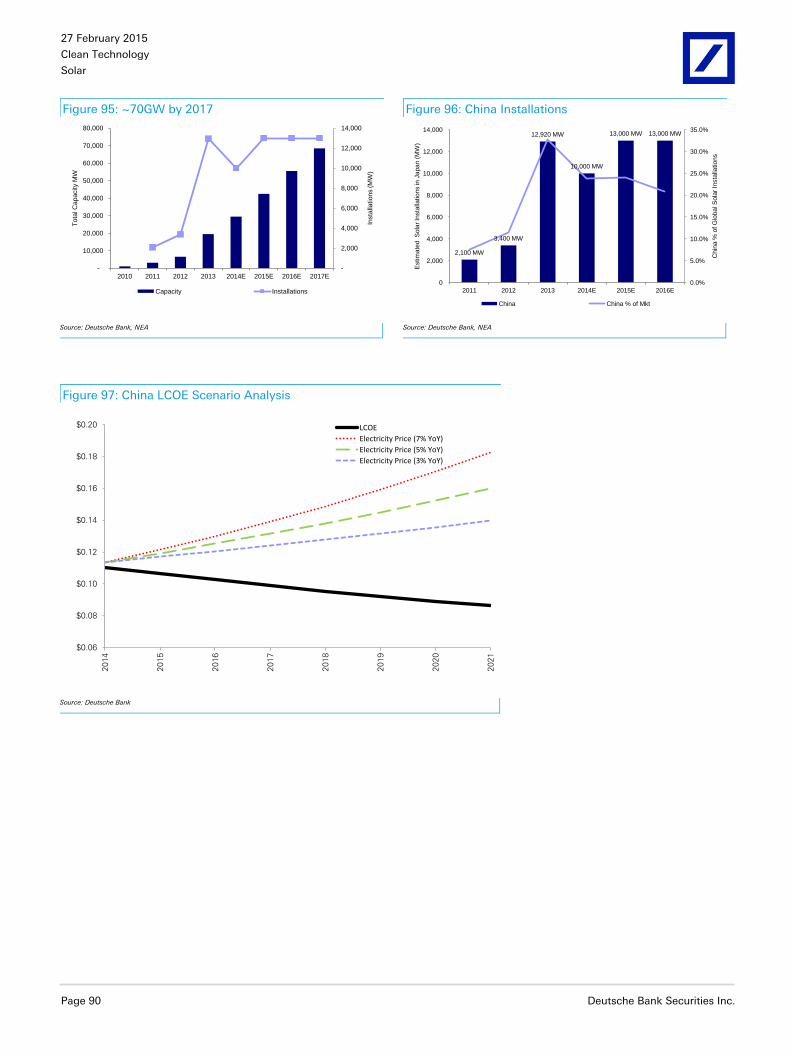
27 February 2015
Clean Technology
Solar
Page 90 Deutsche Bank Securities Inc.
Figure 95: ~70GW by 2017 Figure 96: China Installations
-
2,000
4,000
6,000
8,000
10,000
12,000
14,000
-
10,000
20,000
30,000
40,000
50,000
60,000
70,000
80,000
2010 2011 2012 2013 2014E 2015E 2016E 2017E
Insta
llatio
ns (M
W)
To
tal C
apacity M
W
Capacity Installations
2,100 MW
3,400 MW
12,920 MW
10,000 MW
13,000 MW 13,000 MW
0.0%
5.0%
10.0%
15.0%
20.0%
25.0%
30.0%
35.0%
0
2,000
4,000
6,000
8,000
10,000
12,000
14,000
2011 2012 2013 2014E 2015E 2016E
Chin
a %
of G
lobal S
ola
r In
sta
llatio
ns
Estim
ate
d S
ola
r In
sta
llatio
ns in
Japan (
MW
)
China China % of Mkt
Source: Deutsche Bank, NEA
Source: Deutsche Bank, NEA
Figure 97: China LCOE Scenario Analysis
$0.06
$0.08
$0.10
$0.12
$0.14
$0.16
$0.18
$0.20
2014
2015
2016
2017
2018
2019
2020
2021
LCOE
Electricity Price (7% YoY)
Electricity Price (5% YoY)
Electricity Price (3% YoY)
Source: Deutsche Bank

27 February 2015
Clean Technology
Solar
Deutsche Bank Securities Inc. Page 91
Japan
Japan is well positioned to continue the build out of solar installations for the
foreseeable future, although we expect land and grid concerns could moderate
growth rate over the medium term. The Fukushima nuclear disaster coupled
with the country’s relatively high solar resources have helped incentivize the
government to enact favorable policies which have helped drive a significant
increase in installations during the last several years.
Figure 98: Japan Solar Resources (Horizontal Radiance)
Source: SolarGIS © 2014 GeoModel Solar
Domestic Energy is Scarce
Relative lack of domestic energy sources provides further long term support
for Solar installations in Japan. Japan is a high-technology, well developed
country with high electricity needs and minimal ability to produce this with
domestic resources. We believe this significantly enhances solar’s popularity
with domestic policy makers.
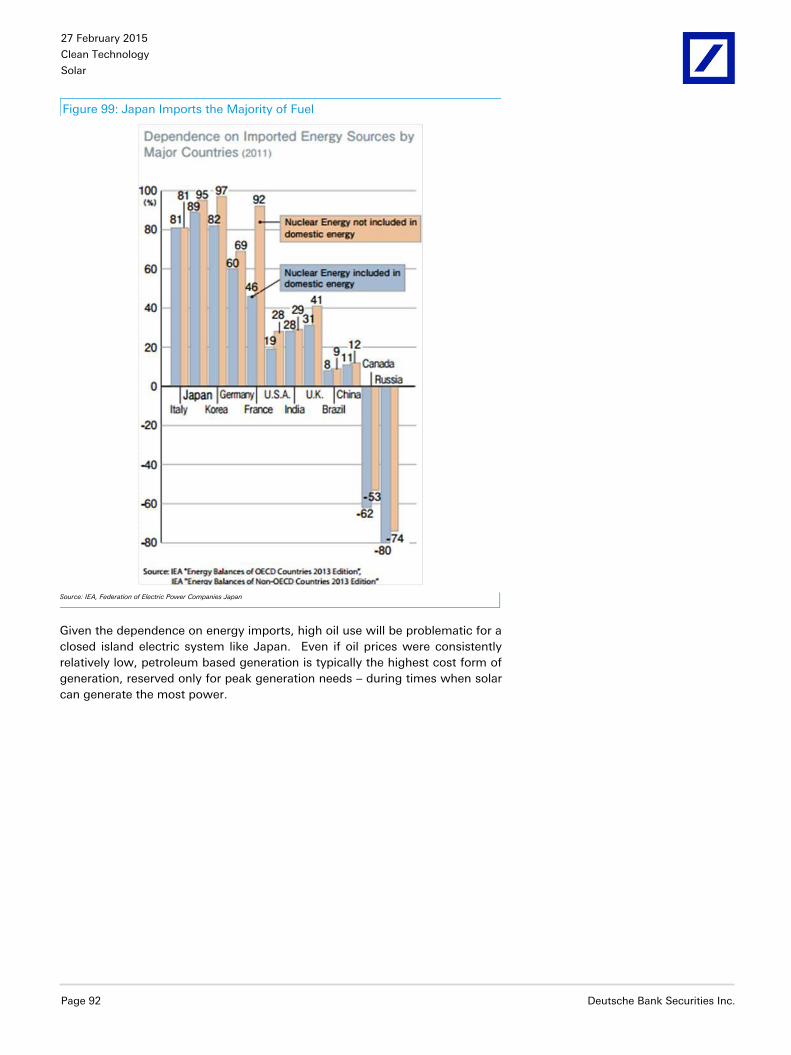
27 February 2015
Clean Technology
Solar
Page 92 Deutsche Bank Securities Inc.
Figure 99: Japan Imports the Majority of Fuel
Source: IEA, Federation of Electric Power Companies Japan
Given the dependence on energy imports, high oil use will be problematic for a
closed island electric system like Japan. Even if oil prices were consistently
relatively low, petroleum based generation is typically the highest cost form of
generation, reserved only for peak generation needs – during times when solar
can generate the most power.

27 February 2015
Clean Technology
Solar
Deutsche Bank Securities Inc. Page 93
Figure 100: Example of Hourly Electricity Generation
Fuels
Figure 101: Oil Use is Increasing
Source: Federation of Electric Power Companies Japan
Source: EIA
Oil represents ~47% of total energy consumption in Japan, and the amount
used in electricity generation has been increasing substantially in recent years
as the country has shut down nuclear generation.
Furthermore, the average cost for utilities to produce one unit of electricity has
increased, which will likely lead to increasing electricity costs over time for
consumers.
Figure 102: Electricity Price (Yen/Kwh) – Average of Utilities
¥8.0
¥9.4
¥10.7
¥8.4 ¥8.6
¥11.8
¥13.5
¥0.0
¥2.0
¥4.0
¥6.0
¥8.0
¥10.0
¥12.0
¥14.0
¥16.0
2006 2007 2008 2009 2010 2011 2012
Source :Utility Data, Institute of Energy Economics Japan

27 February 2015
Clean Technology
Solar
Page 94 Deutsche Bank Securities Inc.
Retail Grid Parity, But Challenges
Today, Japan has one of the highest retail costs of electricity in the world -
~$0.26/kWh on average and there are few fundamental drivers that could
bring this cost down. Based on our analysis, Japan has reached grid parity
with an estimated solar LCOE of ~$0.14/kWh compared to existing electricity
prices of $0.23-$0.28/kWh.
Figure 103: Japan LCOE Scenario Analysis
$0.06
$0.11
$0.16
$0.21
$0.26
$0.31
$0.36
$0.41
$0.46
$0.51
2014
2015
2016
2017
2018
2019
2020
2021
LCOE
Electricity Price (7% YoY)
Electricity Price (5% YoY)
Electricity Price (3% YoY)
Source: Deutsche Bank
While rooftop/retail electricity is likely at grid parity already, we believe the
next 5+ years could yield solar installations at costs below other forms of
generation for wholesale electricity generation, given high input costs in the
country.
However, Japanese grids face significant challenges integrating solar and
shifting dynamics of regionally different east/west grids (which use different
electricity frequencies due to historic differences).
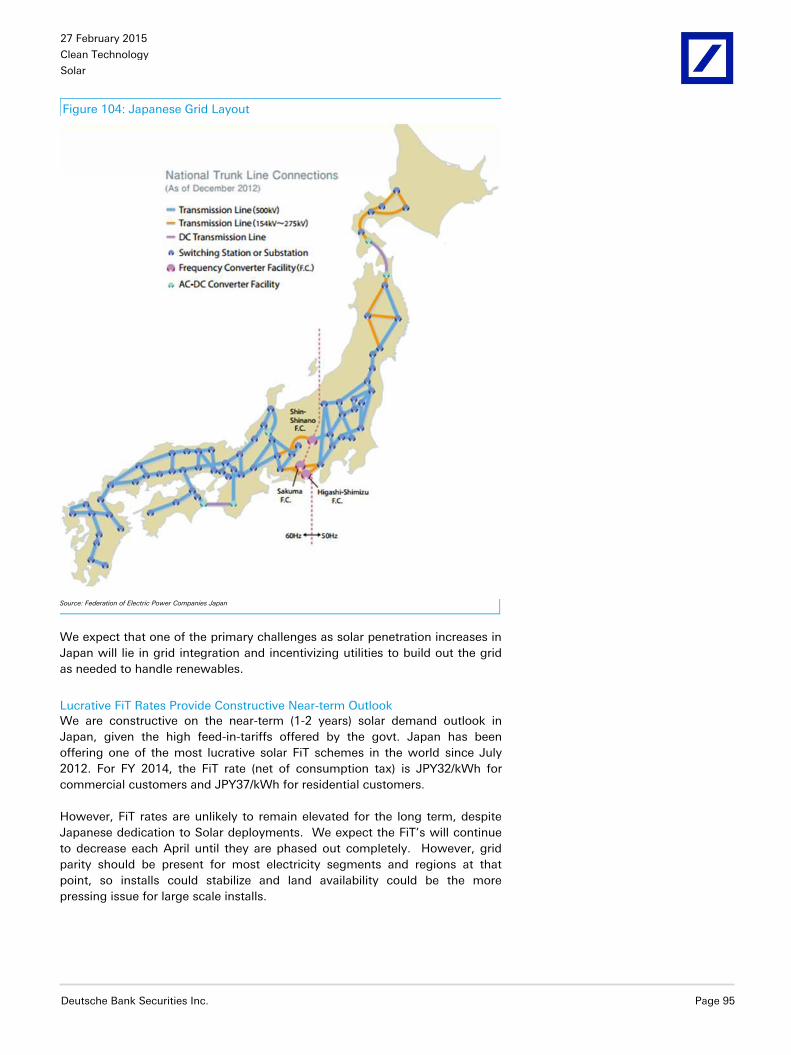
27 February 2015
Clean Technology
Solar
Deutsche Bank Securities Inc. Page 95
Figure 104: Japanese Grid Layout
Source: Federation of Electric Power Companies Japan
We expect that one of the primary challenges as solar penetration increases in
Japan will lie in grid integration and incentivizing utilities to build out the grid
as needed to handle renewables.
Lucrative FiT Rates Provide Constructive Near-term Outlook
We are constructive on the near-term (1-2 years) solar demand outlook in
Japan, given the high feed-in-tariffs offered by the govt. Japan has been
offering one of the most lucrative solar FiT schemes in the world since July
2012. For FY 2014, the FiT rate (net of consumption tax) is JPY32/kWh for
commercial customers and JPY37/kWh for residential customers.
However, FiT rates are unlikely to remain elevated for the long term, despite
Japanese dedication to Solar deployments. We expect the FiT’s will continue
to decrease each April until they are phased out completely. However, grid
parity should be present for most electricity segments and regions at that
point, so installs could stabilize and land availability could be the more
pressing issue for large scale installs.
27 February 2015
Clean Technology
Solar
Page 96 Deutsche Bank Securities Inc.
However, Grid-connection Issues Could Slowdown Installations in the Medium Term
Although the near term outlook for solar demand remains robust, in our view,
the installations could witness a slow-down in the medium-term (3-4 years), as
focus shifts to other renewable and some nuclear plants resume operations. In
Sep 2014, five of the country’s leading utilities began restricting access to their
grids citing rapid expansion of solar installations. Japan has approved ~72GW
of renewable projects since the inception of the FiT program, of which solar
accounted for ~96%. However, most solar projects have witnessed significant
delays in grid-connection (only ~15% of approved projects have been
connected, as of Mar 2014). In the coming years, more emphasis might be
given to other renewable like wind to offset bottlenecks associated with
installing solar, in our view. However, we believe the above mentioned
concerns are not likely to affect the country’s DG market as rooftop is likely at
grid parity.
Current Policies
Japan offers one of the most lucrative solar feed-in-tariff schemes in the world
– JPY32/kWh for commercial customers (contract term of 20 years) and
JPY37/kWh for residential customers (contract term of 10 years). Commercial
customers are defined as systems >10kW in capacity, while residential
customers are those with <10kW systems.
Additionally, Japan's Ministry of the Environment (MoE) plans to offer policy
support to ground-mount solar projects (greater than 350kW in size) being
built on dormant landfill sites. According to a study commissioned by the
ministry in early 2014, landfill sites in Japan can accommodate ~7.4GW of
extra solar capacity. This support is expected to last 3 years and will see MoE
carry out feasibility studies on landfill sites and offer subsidies to local
governments/ private companies, in order to encourage solar installations on
landfill sites that have reached full capacity.
Although the high FiT rates have resulted in a surge in solar installations
(~7GW in the year ending Mar’14), several projects have been witnessed
significant delays in breaking ground. As of 2014 year-end ~70GW of solar
projects were approved under the FiT scheme, but a good portion (20-30%)
may not be built and only ~9.6GW of them were operational as of April 2014.
However, Japan’s Ministry of Economy, Trade and Industry (METI) is trying to
expedite FiT approved solar projects and has put in place a 6-month deadline
for approved projects to secure land and equipment.
Outlook
Given the 6-month deadline and continued lucrative FiT rates, our estimates
assume that Japan sees continued strength in installations.
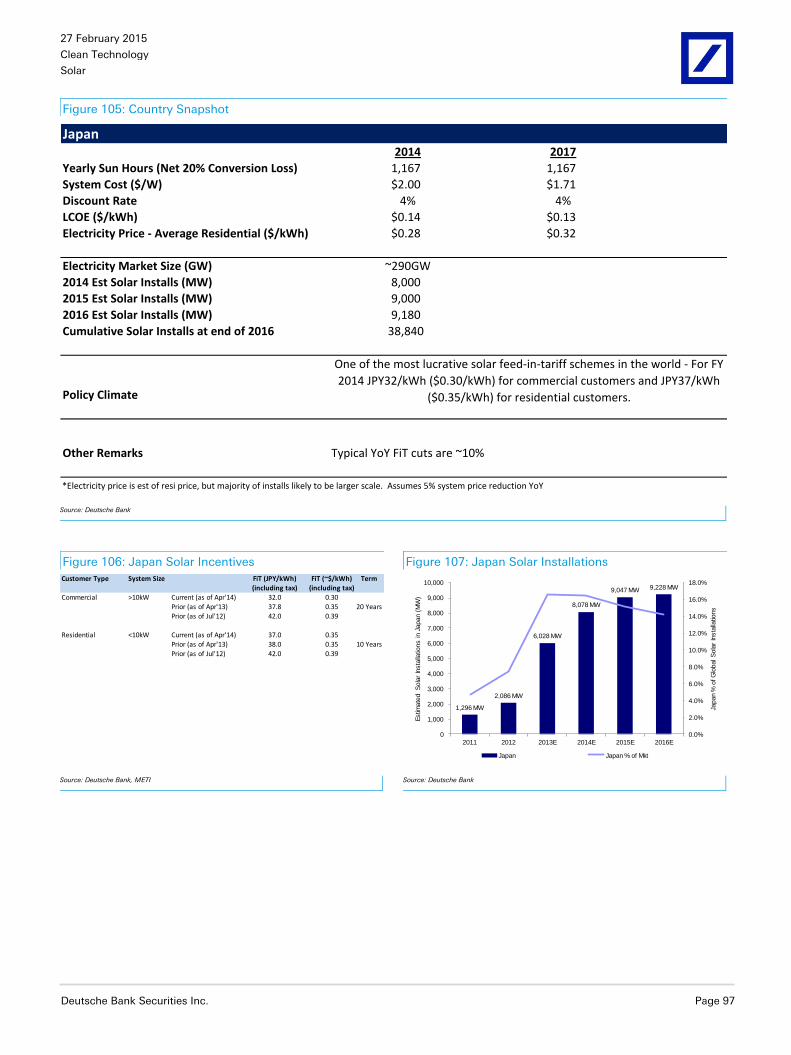
27 February 2015
Clean Technology
Solar
Deutsche Bank Securities Inc. Page 97
Figure 105: Country Snapshot
Japan2014 2017
Yearly Sun Hours (Net 20% Conversion Loss) 1,167 1,167
System Cost ($/W) $2.00 $1.71
Discount Rate 4% 4%
LCOE ($/kWh) $0.14 $0.13
Electricity Price - Average Residential ($/kWh) $0.28 $0.32
Electricity Market Size (GW) ~290GW
2014 Est Solar Installs (MW) 8,000
2015 Est Solar Installs (MW) 9,000
2016 Est Solar Installs (MW) 9,180
Cumulative Solar Installs at end of 2016 38,840
Policy Climate
Other Remarks Typical YoY FiT cuts are ~10%
*Electricity price is est of resi price, but majority of installs likely to be larger scale. Assumes 5% system price reduction YoY
One of the most lucrative solar feed-in-tariff schemes in the world - For FY
2014 JPY32/kWh ($0.30/kWh) for commercial customers and JPY37/kWh
($0.35/kWh) for residential customers.
Source: Deutsche Bank
Figure 106: Japan Solar Incentives Figure 107: Japan Solar Installations
Customer Type System Size FiT (JPY/kWh) FiT (~$/kWh) Term(including tax) (including tax)
Commercial >10kW Current (as of Apr'14) 32.0 0.30
Prior (as of Apr'13) 37.8 0.35Prior (as of Jul'12) 42.0 0.39
Residential <10kW Current (as of Apr'14) 37.0 0.35Prior (as of Apr'13) 38.0 0.35
Prior (as of Jul'12) 42.0 0.39
20 Years
10 Years
1,296 MW
2,086 MW
6,028 MW
8,078 MW
9,047 MW 9,228 MW
0.0%
2.0%
4.0%
6.0%
8.0%
10.0%
12.0%
14.0%
16.0%
18.0%
0
1,000
2,000
3,000
4,000
5,000
6,000
7,000
8,000
9,000
10,000
2011 2012 2013E 2014E 2015E 2016E
Japan %
of G
lobal S
ola
r In
sta
llatio
ns
Estim
ate
d S
ola
r In
sta
llatio
ns in J
apan (
MW
)
Japan Japan % of Mkt
Source: Deutsche Bank, METI
Source: Deutsche Bank

27 February 2015
Clean Technology
Solar
Page 98 Deutsche Bank Securities Inc.
India
India has long been considered one of the highest-potential solar markets but
development has been slow due in part to thin profit margins, uncertain
regulatory environment and lack of high level focus on solar. Recently this has
started to shift, but we expect policy implementation and installation uptick to
be gradual. Most recently, the government has targeted ~100GW of solar by
2022.
High Dependence on Imports to Drive Growth in Renewable Capacity
India’s dependence on imported fossil fuels has increased significantly over
the last several decades – from ~15% in 1990 to ~38% in 2012. However,
members of the Indian government have stated aims to become energy self-
sufficient by 2030.
Figure 108: Dependence on Imported Fossil Fuels
Source: Deutsche Bank, US EIA
India’s total installed power generating capacity stood at ~255GW as of Oct’14
– of which renewable energy accounted for just 13% (solar was 1%).
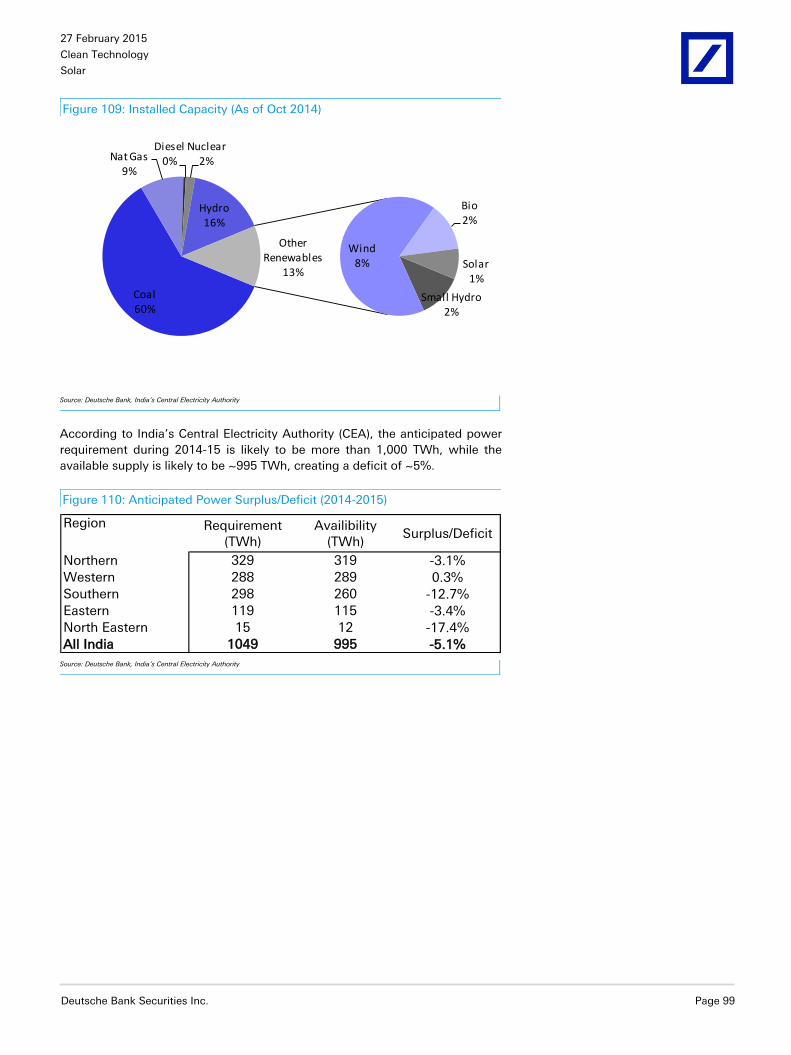
27 February 2015
Clean Technology
Solar
Deutsche Bank Securities Inc. Page 99
Figure 109: Installed Capacity (As of Oct 2014)
Coal60%
Nat Gas9%
Diesel0%
Nuclear2%
Hydro16%
Small Hydro2%
Wind8%
Bio2%
Solar1%
Other Renewables
13%
Source: Deutsche Bank, India’s Central Electricity Authority
According to India’s Central Electricity Authority (CEA), the anticipated power
requirement during 2014-15 is likely to be more than 1,000 TWh, while the
available supply is likely to be ~995 TWh, creating a deficit of ~5%.
Figure 110: Anticipated Power Surplus/Deficit (2014-2015)
Region Requirement (TWh)
Availibility (TWh)
Surplus/Deficit
Northern 329 319 -3.1%Western 288 289 0.3%
Southern 298 260 -12.7%
Eastern 119 115 -3.4%North Eastern 15 12 -17.4%
All India 1049 995 -5.1% Source: Deutsche Bank, India’s Central Electricity Authority

27 February 2015
Clean Technology
Solar
Page 100 Deutsche Bank Securities Inc.
Figure 111: Per-capita Consumption of Electricity (kWh)
631
672
717734
779
819
884
917
600
650
700
750
800
850
900
9502
00
5-0
6
20
06
-07
20
07
-08
20
08
-09
20
09
-10
20
10
-11
20
11
-12
20
12
-13
kWh
Source: Deutsche Bank, India’s Central Electricity Authority
Moreover, the country has an overall electrification rate of ~75%, which
implies ~300-400M Indians are not connected to the grid. According to IEA,
India would require another ~680GW of capacity additions during 2014-35.
Under its 12th 5-year plan (2012-17), the country is targeting additions of
120GW of power capacity, of which >40GW was brought online in 2014. We
believe solar and other renewables are well positioned to compose a notable
share of this new capacity. India’s power minister recently noted that the
country needs to invest $250B in the energy sector over the next 5 years, of
which the govt is targeting ~$100B of investment in renewables.
Underutilized Fossil Fuel Capacity Makes Renewables Attractive
India has suffered from serious power deficits, particularly when the fossil fuel-
based capacity remains under-utilized due to fuel shortages and T&D losses.
According to US EIA, utilization rates in fossil fuel-based power plants in India
have fallen steadily since 2007 (from a peak of ~79%) to ~70% in 2013. We
believe disruptions in steady domestic fuel supplies could make renewable
capacity more attractive.
Solar Comes to Forefront, as New Govt Targets 100GW in 10 Years
The new Indian govt, which took office in May’14, has taken several steps to
accelerate deployment of renewables, particularly solar, in the country. The
new energy minister recently announced that the country’s solar target will be
increased to 100GW by 2022 – notably more than the previous target of
20GW. Given current installed capacity of ~3GW, the target implies an annual
run rate of ~12GW for the next 8 years, although actual installs will likely ramp
differently. Although the 100GW target looks quite ambitious, we believe it is
achievable if the following issues are addressed timely and appropriately – 1)
easing land acquisition requirements; 2) lowering cost of financing; 3) making
long-term stable policies that can attract consistent investments. Although the
govt has not yet announced a final framework/plan on how it wishes to
achieve this target, it has announced plans to build 25 large solar parks that
will house 20GW of capacity by 2020. MNRE has already identified 12 of the
25 sites where it will establish solar parks with capacities of between 500MW-
1GW.
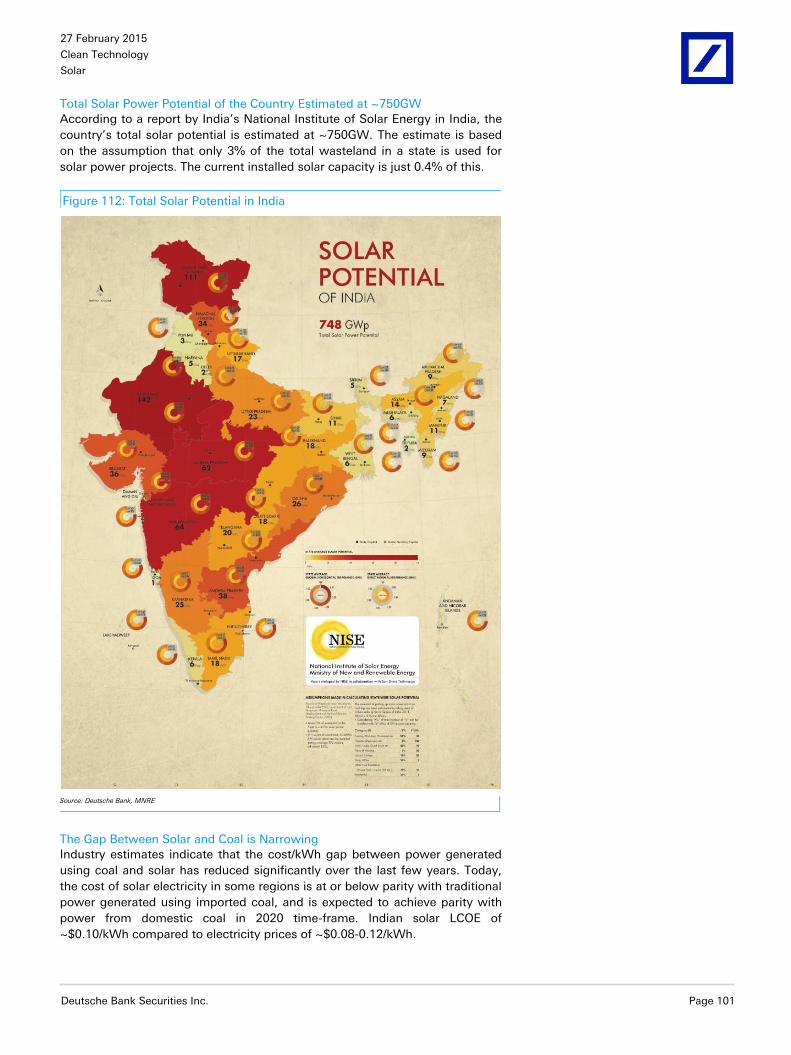
27 February 2015
Clean Technology
Solar
Deutsche Bank Securities Inc. Page 101
Total Solar Power Potential of the Country Estimated at ~750GW
According to a report by India’s National Institute of Solar Energy in India, the
country’s total solar potential is estimated at ~750GW. The estimate is based
on the assumption that only 3% of the total wasteland in a state is used for
solar power projects. The current installed solar capacity is just 0.4% of this.
Figure 112: Total Solar Potential in India
Source: Deutsche Bank, MNRE
The Gap Between Solar and Coal is Narrowing
Industry estimates indicate that the cost/kWh gap between power generated
using coal and solar has reduced significantly over the last few years. Today,
the cost of solar electricity in some regions is at or below parity with traditional
power generated using imported coal, and is expected to achieve parity with
power from domestic coal in 2020 time-frame. Indian solar LCOE of
~$0.10/kWh compared to electricity prices of ~$0.08-0.12/kWh.
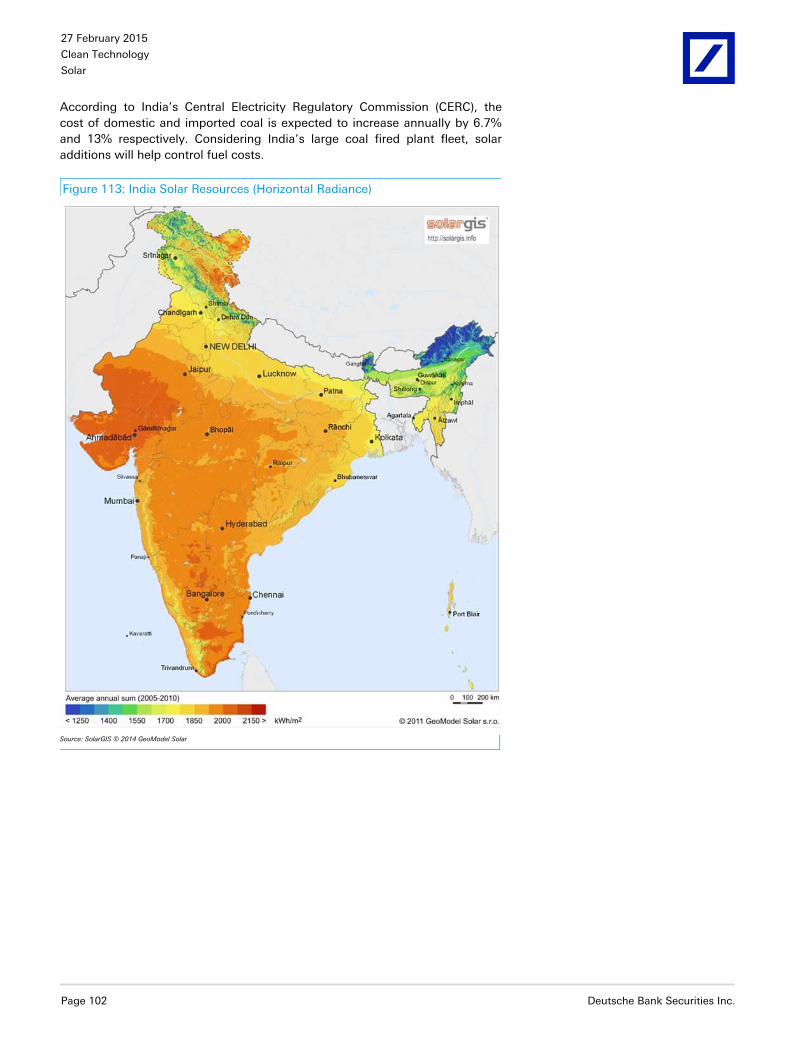
27 February 2015
Clean Technology
Solar
Page 102 Deutsche Bank Securities Inc.
According to India’s Central Electricity Regulatory Commission (CERC), the
cost of domestic and imported coal is expected to increase annually by 6.7%
and 13% respectively. Considering India’s large coal fired plant fleet, solar
additions will help control fuel costs.
Figure 113: India Solar Resources (Horizontal Radiance)
Source: SolarGIS © 2014 GeoModel Solar

27 February 2015
Clean Technology
Solar
Deutsche Bank Securities Inc. Page 103
Figure 114: India LCOE Scenario Analysis
$0.04
$0.06
$0.08
$0.10
$0.12
$0.14
$0.16
$0.18
$0.20
$0.22
20
14
20
15
20
16
20
17
20
18
20
19
20
20
20
21
LCOE
Electricity Price (7% YoY)
Electricity Price (5% YoY)
Electricity Price (3% YoY)
Source: Deutsche Bank
Current Policies (Federal Level)
The new government in India (elected May’14) has stated plans to increase
focus on renewables, particularly solar, to help deal with the country’s power
deficit. Recently, cooperation with the US govt has increased and India chose
not to implement anti-dumping duties on imported modules, which should
help pricing in the country (and by extension, installation economics). The
government announced several key measures to promote the industry in its
budget for FY14/15, including –; 1) Proposal to begin Ultra Mega Solar Power
Projects in the states of Rajasthan, Gujarat, Tamil Nadu, and Laddakh in J&K.
The plan sets aside INR 5B (~$84M) for this purpose; 2) Funding for
agricultural pumps (~100k target) (INR 4B (~$66M)); 3) INR 1B (~$17M) for the
development of 1 MW Solar Parks on the banks of canals; 4) Accelerating
implementation of the Green Energy Corridor Project, which is designed to
increase transmission and distribution infrastructure for renewable energy; and
5) Potential domestic manufacturing incentives.
Initially, India targeted 20GW of grid-connected solar capacity by 2022 under
its Jawaharlal Nehru National Solar Mission (NSM) that was launched in 2010.
However, the energy minister recently signaled intentions to raise the target to
100GW by 2022.
Under the initial NSM framework (20GW), deployment was set to occur in 3
phases: 1GW in Phase 1 (2012-13), 9GW in Phase 2 (2013-17)and 10GW in
Phase 3 (2017-22). Phase 2 was further divided into 2 batches. Under batch 1,
Solar Energy Corporation of India (SECI) invited bids in Oct 2013 in two
categories - 375MW under DCR (Domestic Content Requirement) and 375MW
under open category. PPAs with the successful bidders/ developers were
signed in Mar 2014. For batch 2, the Ministry of New and Renewable Energy
(MNRE) has proposed ~15GW in three tranches (this compares to original plan
of 9GW under Phase 2 of NSM) - (i) Tranche - 1 3GW (2014-15 to 2016-17); (ii)
Tranche - 2: 5GW (2015-16 to 2017-18); (iii) Tranche - 3: 7GW (2016-17 to
2018-19)

27 February 2015
Clean Technology
Solar
Page 104 Deutsche Bank Securities Inc.
Renewable Targets: Recently, India’s power minister suggested that a rule may
be implemented where the addition of new coal plants would require the
simultaneous investment in renewable capacity equal to ~5% of the traditional
capacity. For example, a 4GW coal plant would have to also create ~200MW
of renewable capacity.
Ultra Mega Solar Projects: The Indian government is planning to create
incentives, (low-cost loans and grants) to set up 25 new solar power parks
across the country to host close to 20GW of capacity by 2020. Each park will
host large plants ranging between 500MW - 1GW that will feed power into the
grid. Government programs will keep the price of land within the parks low to
contain project costs, and the goal is to produce power at INR5.5/kWh
($0.09/kWh). India’s Ministry of New and Renewable Energy (MNRE) released
a draft policy for this program, under which – 1) states would supply the land
and set up the infrastructure for the solar parks; 2) states will be obliged to buy
at least 20% of the electricity from the projects; 3) MNRE would provide grants
up to INR2M/MW ($33k/MW) or 30% of costs for setting up the parks, as well
as grants of INR2.5M ($41k) per park for related expenses. MNRE has
budgeted more than INR40B (~$655M) to develop these projects. The power
minister recently announced that 12 states have been identified for ~22GW of
PV capacity as part of this project (see details below).
Figure 115: Proposed Solar Parks/ Potential for Key States
State
Capacity of
Proposed
Plant (GW) State
Estimated
Potential
(GW)
J&K 7.5 Rajasthan 142
Rajasthan 3.7 J&K 111
Andhra Pradesh 2.5 Madhya Pradesh 60
Telangana 1.0 Gujarat 36
Gujarat 0.8 Others 401
Others 6.6 Total 750
Total 22.0
Source: Deutsche Bank, MNRE
Examples of State Level Policies
Several Indian state governments have declared their state-level solar policies.
We’ve outlined a few examples below:
Rajasthan: Rajasthan is targeting ~25GW over the next 7-8 years, through
State or Private Enterprises or through Public Private Partnerships. In Oct 2014,
SunEdison signed an MoU with the govt. of the state for 5GW of solar power
plants.
Andhra Pradesh: In August 2014, media reports (PV-Magazine) suggested that
the state government may unveil plans to target ~5GW solar power capacity
by 2019. Following this in mid-Sep 2014, NTPC Ltd. signed an agreement with
the state government to develop 1GW solar power projects in the state.

27 February 2015
Clean Technology
Solar
Deutsche Bank Securities Inc. Page 105
Tamil Nadu: In 2012, Tamil Nadu implemented a 3GW target by 2015. Of the
3GW target, 350MW was reserved for rooftop. In addition, the Tamil Nadu
Energy Development Agency (TEDA) announced plans to set up solar rooftop
projects at about 300 government buildings across the states that requested
tender offers. However, the state has made little progress towards the 3GW
goal and had an installed capacity of only ~109MW as of late 2014. To
increase the pace of installations, Tamil Nadu’s electricity regulator ordered the
state’s distribution utility to pay a tariff of INR7.01/kWh ($0.11/kWh) for power
from solar PV plants and INR11.03/kWh ($0.18/kWh) to plants using solar-
thermal technology (or less depending on treatment of depreciation benefits).
Karnataka: The state government has announced a 2GW target by 2022, which
would be in addition to solar capacity coming from private project developers.
Under the policy, the government would auction 1.6GW capacity for utility-
scale projects, while ~400MW would be added in the form of rooftop grid-
connected projects. The government also plans to implement a net metering
policy to complement this program and provide financial incentives to
households and commercials buildings.
Punjab: The Indian government recently announced plans to set up a 2GW
solar power plant in the state of Punjab. Additionally, the state government is
planning to set up 100 MW of rooftop solar power projects on all government
buildings, and to install 10,000 solar-powered irrigation pumps.
Uttar Pradesh: The state government has targeted 500MW of PV capacity by
2017.
Outlook
Cumulatively, India has installed ~2.8GW of solar power capacity (as of 30 Sep,
2014), most of which (~2GW) was installed in the last two years. While India
has been slower to expand than some expected, we see long term potential in
the country and favorable regulatory shifts help to accelerate growth in the
sector. Recent announcements from private companies like SunEdison
coupled with talk of further cooperation with the US government and local
policy announcements support our view that India is beginning to ramp
installations and could become one of the top markets in the world.
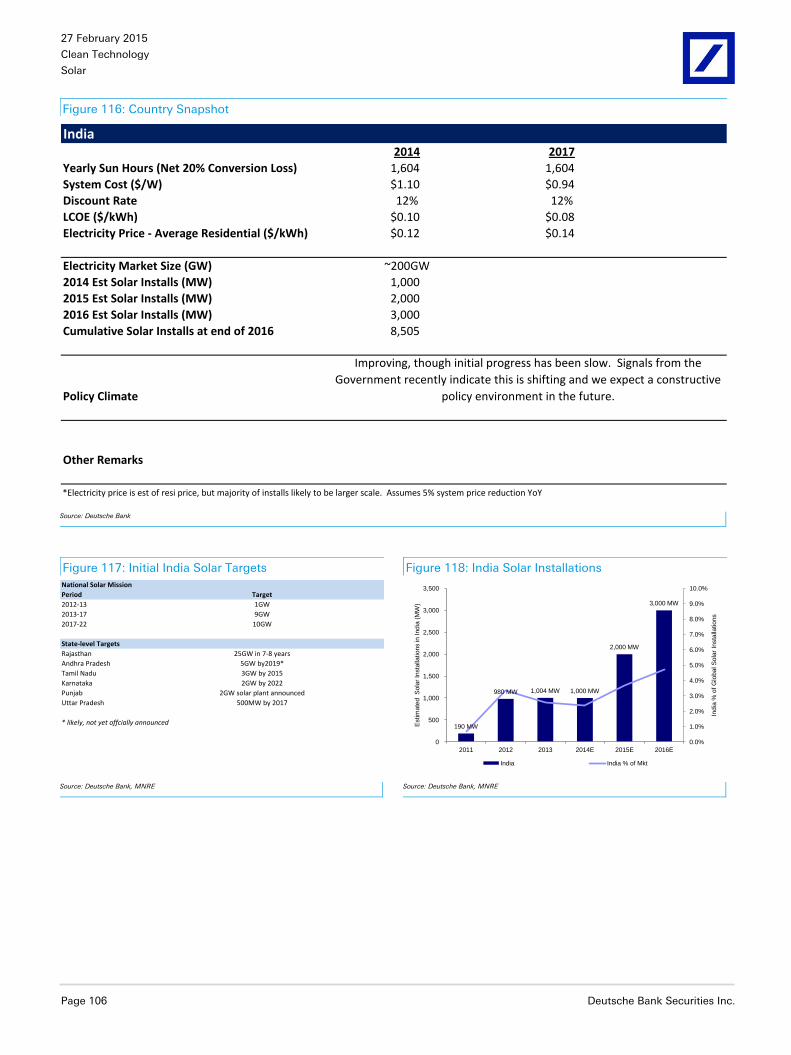
27 February 2015
Clean Technology
Solar
Page 106 Deutsche Bank Securities Inc.
Figure 116: Country Snapshot
India2014 2017
Yearly Sun Hours (Net 20% Conversion Loss) 1,604 1,604
System Cost ($/W) $1.10 $0.94
Discount Rate 12% 12%
LCOE ($/kWh) $0.10 $0.08
Electricity Price - Average Residential ($/kWh) $0.12 $0.14
Electricity Market Size (GW) ~200GW
2014 Est Solar Installs (MW) 1,000
2015 Est Solar Installs (MW) 2,000
2016 Est Solar Installs (MW) 3,000
Cumulative Solar Installs at end of 2016 8,505
Policy Climate
Improving, though initial progress has been slow. Signals from the
Government recently indicate this is shifting and we expect a constructive
policy environment in the future.
Other Remarks
*Electricity price is est of resi price, but majority of installs likely to be larger scale. Assumes 5% system price reduction YoY
Source: Deutsche Bank
Figure 117: Initial India Solar Targets Figure 118: India Solar Installations
National Solar Mission
Period Target
2012-13 1GW
2013-17 9GW
2017-22 10GW
State-level Targets
Rajasthan 25GW in 7-8 years
Andhra Pradesh 5GW by2019*
Tamil Nadu 3GW by 2015
Karnataka 2GW by 2022
Punjab 2GW solar plant announced
Uttar Pradesh 500MW by 2017
* likely, not yet offcially announced
190 MW
980 MW 1,004 MW 1,000 MW
2,000 MW
3,000 MW
0.0%
1.0%
2.0%
3.0%
4.0%
5.0%
6.0%
7.0%
8.0%
9.0%
10.0%
0
500
1,000
1,500
2,000
2,500
3,000
3,500
2011 2012 2013 2014E 2015E 2016E
India
% o
f G
lobal S
ola
r In
sta
llatio
ns
Estim
ate
d S
ola
r In
sta
llatio
ns in
India
(M
W)
India India % of Mkt
Source: Deutsche Bank, MNRE
Source: Deutsche Bank, MNRE

27 February 2015
Clean Technology
Solar
Deutsche Bank Securities Inc. Page 107
Germany
Although Germany was once the largest market in the world, recent shifts
indicate economics of systems are significantly reduced from the past when
high feed in tariffs dominated the national policy. We expect the majority of
installations to come from the small scale rooftop segment going forward,
given the country’s high electricity price.
EEG Reforms Dramatically Slowdown Installations
The reform of Germany’s renewable energy law (EEG), which came into effect
in Aug 2014, includes charges for self-consumed PV systems (owners of
>10kW PV systems will have to pay up to 30% of the EEG levy by the end of
2015, 35% by the end of 2016, eventually capped at 40% in 2017). This,
coupled with a steady decline in FiT rates has slowed down installations in the
country significantly.
Figure 119: Monthly Installations (MW)
0
200
400
600
800
1,000
1,200
1,400
1,600
1,800
2,000
Jan
-12
Feb
-12
Ma
r-1
2A
pr-
12
Ma
y-1
2Ju
n-1
2Ju
l-1
2A
ug-
12
Sep
-12
Oct
-12
No
v-1
2D
ec-1
2Ja
n-1
3Fe
b-1
3M
ar-
13
Ap
r-1
3M
ay-
13
Jun
-13
Jul-
13
Au
g-1
3Se
p-1
3O
ct-1
3N
ov-
13
Dec
-13
Jan
-14
Feb
-14
Ma
r-1
4A
pr-
14
Ma
y-1
4Ju
n-1
4Ju
l-1
4A
ug-
14
Sep
-14
Oct
-14
MW
Monthly PV Installs (MW)
Source: Deutsche Bank, bundesnetzagentur
Going forward, we expect small-scale installations to increase their share in the
total installation mix. Personal systems under 10KW can still self-consume
without an additional charge.
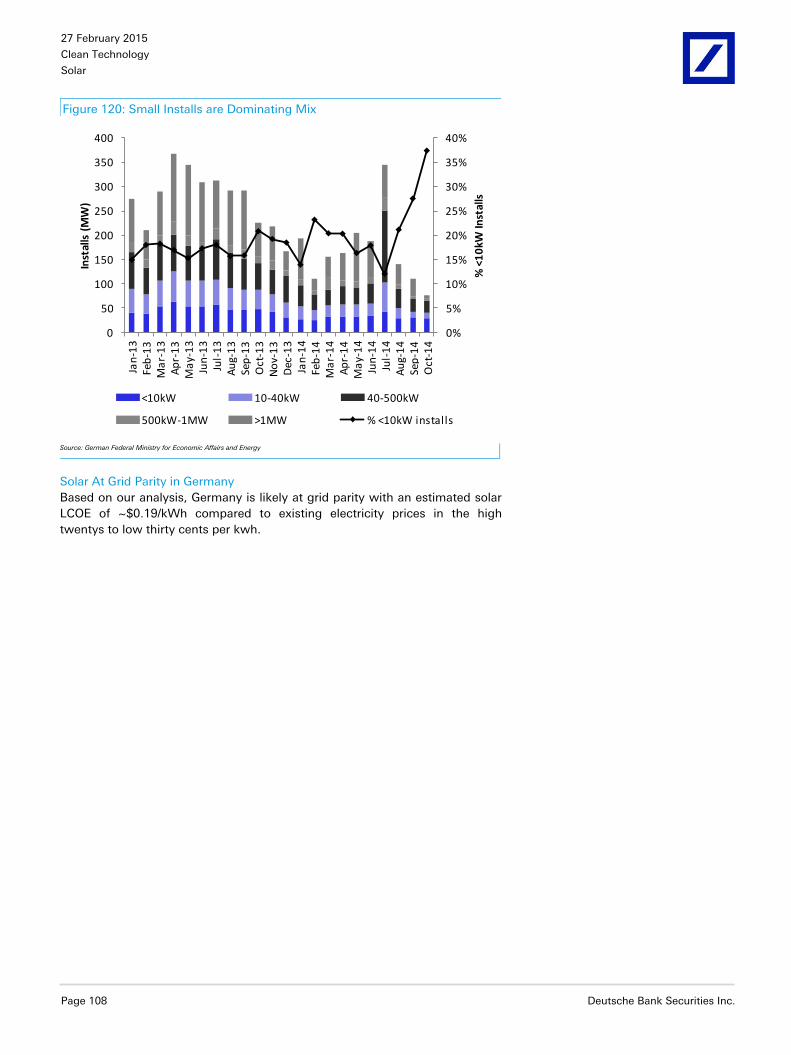
27 February 2015
Clean Technology
Solar
Page 108 Deutsche Bank Securities Inc.
Figure 120: Small Installs are Dominating Mix
0%
5%
10%
15%
20%
25%
30%
35%
40%
0
50
100
150
200
250
300
350
400Ja
n-1
3Fe
b-1
3M
ar-
13
Ap
r-1
3M
ay-
13
Jun
-13
Jul-
13
Au
g-1
3Se
p-1
3O
ct-1
3N
ov-
13
Dec
-13
Jan
-14
Feb
-14
Ma
r-1
4A
pr-
14
Ma
y-1
4Ju
n-1
4Ju
l-1
4A
ug-
14
Sep
-14
Oct
-14
% <
10
kW In
stal
ls
Inst
alls
(M
W)
<10kW 10-40kW 40-500kW
500kW-1MW >1MW % <10kW installs
Source: German Federal Ministry for Economic Affairs and Energy
Solar At Grid Parity in Germany
Based on our analysis, Germany is likely at grid parity with an estimated solar
LCOE of ~$0.19/kWh compared to existing electricity prices in the high
twentys to low thirty cents per kwh.
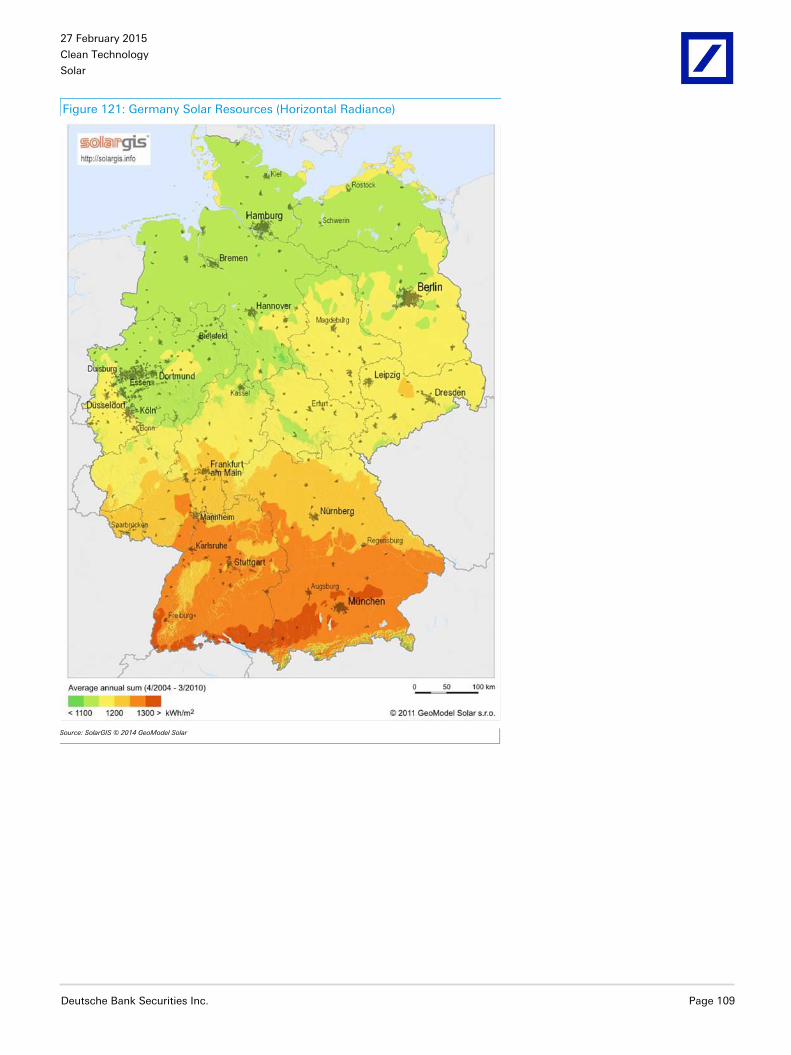
27 February 2015
Clean Technology
Solar
Deutsche Bank Securities Inc. Page 109
Figure 121: Germany Solar Resources (Horizontal Radiance)
Source: SolarGIS © 2014 GeoModel Solar
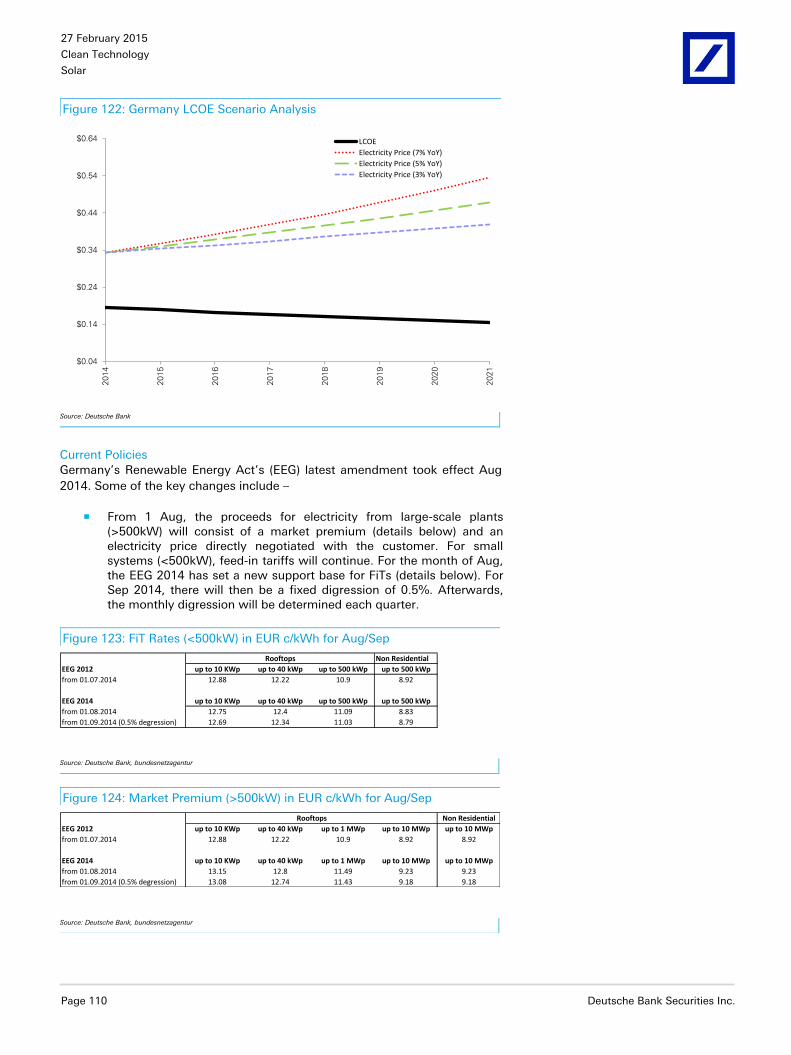
27 February 2015
Clean Technology
Solar
Page 110 Deutsche Bank Securities Inc.
Figure 122: Germany LCOE Scenario Analysis
$0.04
$0.14
$0.24
$0.34
$0.44
$0.54
$0.64
2014
2015
2016
2017
2018
2019
2020
2021
LCOE
Electricity Price (7% YoY)
Electricity Price (5% YoY)
Electricity Price (3% YoY)
Source: Deutsche Bank
Current Policies
Germany’s Renewable Energy Act’s (EEG) latest amendment took effect Aug
2014. Some of the key changes include –
From 1 Aug, the proceeds for electricity from large-scale plants (>500kW) will consist of a market premium (details below) and an electricity price directly negotiated with the customer. For small systems (<500kW), feed-in tariffs will continue. For the month of Aug, the EEG 2014 has set a new support base for FiTs (details below). For Sep 2014, there will then be a fixed digression of 0.5%. Afterwards, the monthly digression will be determined each quarter.
Figure 123: FiT Rates (<500kW) in EUR c/kWh for Aug/Sep
Non Residential
EEG 2012 up to 10 KWp up to 40 kWp up to 500 kWp up to 500 kWp
from 01.07.2014 12.88 12.22 10.9 8.92
EEG 2014 up to 10 KWp up to 40 kWp up to 500 kWp up to 500 kWp
from 01.08.2014 12.75 12.4 11.09 8.83
from 01.09.2014 (0.5% degression) 12.69 12.34 11.03 8.79
Rooftops
Source: Deutsche Bank, bundesnetzagentur
Figure 124: Market Premium (>500kW) in EUR c/kWh for Aug/Sep
Non Residential
EEG 2012 up to 10 KWp up to 40 kWp up to 1 MWp up to 10 MWp up to 10 MWp
from 01.07.2014 12.88 12.22 10.9 8.92 8.92
EEG 2014 up to 10 KWp up to 40 kWp up to 1 MWp up to 10 MWp up to 10 MWp
from 01.08.2014 13.15 12.8 11.49 9.23 9.23
from 01.09.2014 (0.5% degression) 13.08 12.74 11.43 9.18 9.18
Rooftops
Source: Deutsche Bank, bundesnetzagentur

27 February 2015
Clean Technology
Solar
Deutsche Bank Securities Inc. Page 111
Calculation of monthly digression for FiT: The regular monthly reduction of 0.5% will be increased or decreased depending on newly commissioned capacity in the preceding reference 12 months. Digression will increase if the installed capacity of PV installations exceeds the target corridor (2.4-2.6GW), and will decrease if it falls below the target corridor. The tables below shows the digression rates both under the previous EEG 2012 and the new EEG 2014.
Figure 125: Digression Calculation
> 7,500 MW 2.8% > 7,500 MW 2.8%
> 6,500 MW 2.5% > 6,500 MW 2.5%
> 5,500 MW 2.2% > 5,500 MW 2.2%
> 4,500 MW 1.8% > 4,500 MW 1.8%
> 3,500 MW 1.4% > 3,500 MW 1.4%
Target corridor: 2500 to 3500 MW 1.0% > 2,600 MW 1.0%
< 2,500 MW 0.8% Target corridor: 2,400 to 2,600 MW 0.5%
< 2,000 MW 0.5% < 2,400 MW 0.3%
< 1,500 MW 0.0% < 1,500 MW 0.0%
< 1,000 MW -0.5% (increase) < 1,000 MW
0.0% plus
increase 1.5%
once at beginning
of quarter
EEG 2012 EEG 2014
Source: Deutsche Bank, bundesnetzagentur
The maximum of 52GWp at which support for new PV systems will be stopped has remained unchanged.
EEG Levy: Electricity consumers in Germany will be charged proportionally per kWh used for the costs of supporting renewable energy (currently ~6.24 euro c/kWh). For self-generated electricity from systems larger than 10kW commissioned after Aug 1, 2014, a reduced EEG levy of first 30% and later 40% will be charged. Small systems (<10kW) remain exempt.
Outlook
Given target installation corridor of 2.4-2.6GW and reduction in large scale
project economics, we do not expect installs to shift significantly and will likely
stay around the ~2GW range.

27 February 2015
Clean Technology
Solar
Page 112 Deutsche Bank Securities Inc.
Figure 126: Country Snapshot
Germany2014 2017
Yearly Sun Hours (Net 20% Conversion Loss) 958 958
System Cost ($/W) $2.00 $1.71
Discount Rate 5% 5%
LCOE ($/kWh) $0.19 $0.17
Electricity Price - Average Residential ($/kWh) $0.33 $0.39
Electricity Market Size (GW) ~180GW
2014 Est Solar Installs (MW) 2,145
2015 Est Solar Installs (MW) 2,038
2016 Est Solar Installs (MW) 2,000
Cumulative Solar Installs at end of 2016 41,457
Policy Climate Policy environment is less constructive than several years ago, but likely
attractive enough to support small system installations on an ongoing
basis.
Other Remarks
Source: Deutsche Bank
Figure 127: Germany Solar Installations
7,485 MW 7,604 MW
3,300 MW
2,145 MW 2,038 MW 2,000 MW
0.0%
5.0%
10.0%
15.0%
20.0%
25.0%
30.0%
0
1,000
2,000
3,000
4,000
5,000
6,000
7,000
8,000
2011 2012 2013 2014E 2015E 2016E
Germ
any%
of G
lobal S
ola
r In
sta
llations
Estim
ate
d S
ola
r In
sta
llations in
Germ
any (
MW
)
Germany Germany
Source: Deutsche Bank, bundesnetzagentur

27 February 2015
Clean Technology
Solar
Deutsche Bank Securities Inc. Page 113
UK
Although the UK govt appears willing to support long term solar installation
goals, shifts towards DG-only policies and relative lack of near-term grid parity
lead us to believe that the UK market will likely be relevant on a global scale
but decreasing on an absolute basis once the large scale incentives shift in
early 2015.
Furthermore, electricity use is relatively flat in recent memory. Therefore, the
potential for incremental utility scale generation is not significant.
Figure 128: UK Solar Resources (Horizontal Radiance)
Source: SolarGIS © 2014 GeoModel Solar

27 February 2015
Clean Technology
Solar
Page 114 Deutsche Bank Securities Inc.
Figure 129: Electricity Use in the UK (TwH)
-
50
100
150
200
250
300
350
400
1990
1991
1992
1993
1994
1995
1996
1997
1998
1999
2000
2001
2002
2003
2004
2005
2006
2007
2008
2009
2010
2011
2012
2013
Ele
ctr
icity U
se (
TW
h)
Industrial Domestic Other
Source: UK Department of Energy & Climate Change
We see support for retail additions over the longer term, as the retail price of
electricity continues to trend up over time.
Figure 130: Retail Price of Electricity (UK)
£0.14 £0.14£0.14 £0.14
£0.16
£0.17
£0.18£0.17
£0.18
£0.19
£0.00
£0.05
£0.10
£0.15
£0.20
£0.25
2H09 1H10 2H10 1H11 2H11 1H12 2H12 1H13 2H13 1H14
United Kingdom
Source: Eurostat
Not Quite at Grid Parity, but Potential for Retail
Retail electricity prices of ~$0.21/kWh are still below unsubsidized solar cost in
the low 20 cent/kWh range, but system cost reductions could change this
dynamic over the next several years as the market develops.
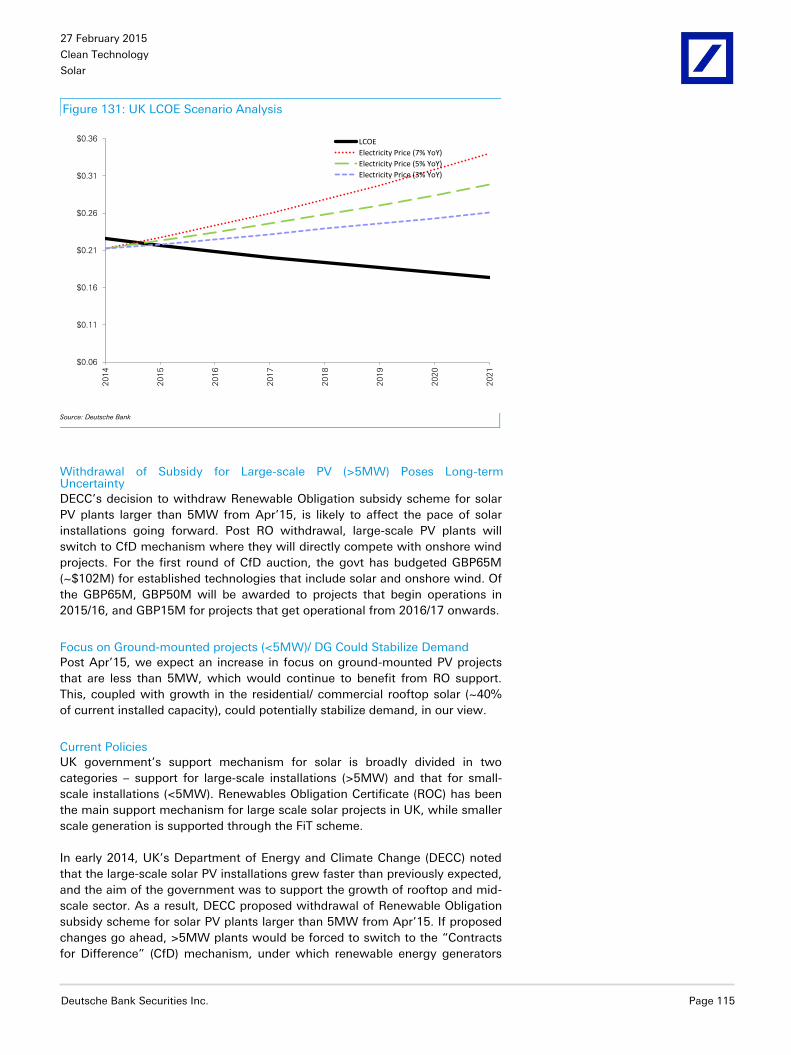
27 February 2015
Clean Technology
Solar
Deutsche Bank Securities Inc. Page 115
Figure 131: UK LCOE Scenario Analysis
$0.06
$0.11
$0.16
$0.21
$0.26
$0.31
$0.36
2014
2015
2016
2017
2018
2019
2020
2021
LCOE
Electricity Price (7% YoY)
Electricity Price (5% YoY)
Electricity Price (3% YoY)
Source: Deutsche Bank
Withdrawal of Subsidy for Large-scale PV (>5MW) Poses Long-term Uncertainty
DECC’s decision to withdraw Renewable Obligation subsidy scheme for solar
PV plants larger than 5MW from Apr’15, is likely to affect the pace of solar
installations going forward. Post RO withdrawal, large-scale PV plants will
switch to CfD mechanism where they will directly compete with onshore wind
projects. For the first round of CfD auction, the govt has budgeted GBP65M
(~$102M) for established technologies that include solar and onshore wind. Of
the GBP65M, GBP50M will be awarded to projects that begin operations in
2015/16, and GBP15M for projects that get operational from 2016/17 onwards.
Focus on Ground-mounted projects (<5MW)/ DG Could Stabilize Demand
Post Apr’15, we expect an increase in focus on ground-mounted PV projects
that are less than 5MW, which would continue to benefit from RO support.
This, coupled with growth in the residential/ commercial rooftop solar (~40%
of current installed capacity), could potentially stabilize demand, in our view.
Current Policies
UK government’s support mechanism for solar is broadly divided in two
categories – support for large-scale installations (>5MW) and that for small-
scale installations (<5MW). Renewables Obligation Certificate (ROC) has been
the main support mechanism for large scale solar projects in UK, while smaller
scale generation is supported through the FiT scheme.
In early 2014, UK’s Department of Energy and Climate Change (DECC) noted
that the large-scale solar PV installations grew faster than previously expected,
and the aim of the government was to support the growth of rooftop and mid-
scale sector. As a result, DECC proposed withdrawal of Renewable Obligation
subsidy scheme for solar PV plants larger than 5MW from Apr’15. If proposed
changes go ahead, >5MW plants would be forced to switch to the “Contracts
for Difference” (CfD) mechanism, under which renewable energy generators
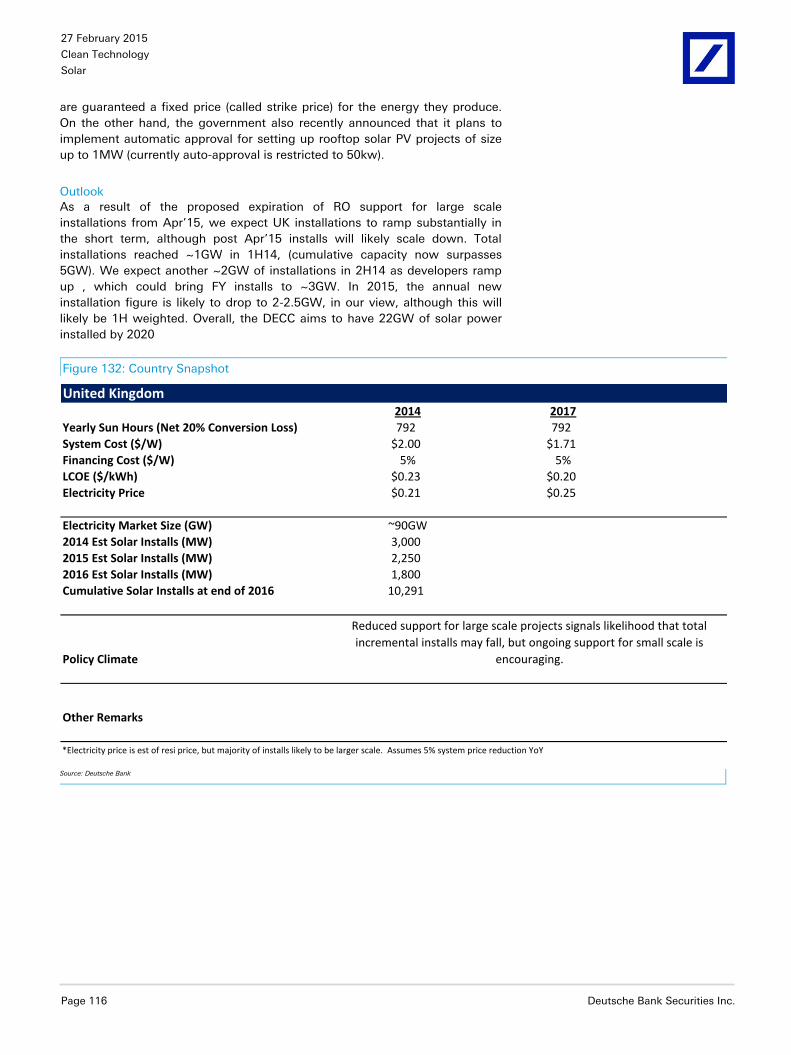
27 February 2015
Clean Technology
Solar
Page 116 Deutsche Bank Securities Inc.
are guaranteed a fixed price (called strike price) for the energy they produce.
On the other hand, the government also recently announced that it plans to
implement automatic approval for setting up rooftop solar PV projects of size
up to 1MW (currently auto-approval is restricted to 50kw).
Outlook
As a result of the proposed expiration of RO support for large scale
installations from Apr’15, we expect UK installations to ramp substantially in
the short term, although post Apr’15 installs will likely scale down. Total
installations reached ~1GW in 1H14, (cumulative capacity now surpasses
5GW). We expect another ~2GW of installations in 2H14 as developers ramp
up , which could bring FY installs to ~3GW. In 2015, the annual new
installation figure is likely to drop to 2-2.5GW, in our view, although this will
likely be 1H weighted. Overall, the DECC aims to have 22GW of solar power
installed by 2020
Figure 132: Country Snapshot
United Kingdom2014 2017
Yearly Sun Hours (Net 20% Conversion Loss) 792 792
System Cost ($/W) $2.00 $1.71
Financing Cost ($/W) 5% 5%
LCOE ($/kWh) $0.23 $0.20
Electricity Price $0.21 $0.25
Electricity Market Size (GW) ~90GW
2014 Est Solar Installs (MW) 3,000
2015 Est Solar Installs (MW) 2,250
2016 Est Solar Installs (MW) 1,800
Cumulative Solar Installs at end of 2016 10,291
Policy Climate
Reduced support for large scale projects signals likelihood that total
incremental installs may fall, but ongoing support for small scale is
encouraging.
Other Remarks
*Electricity price is est of resi price, but majority of installs likely to be larger scale. Assumes 5% system price reduction YoY
Source: Deutsche Bank

27 February 2015
Clean Technology
Solar
Deutsche Bank Securities Inc. Page 117
Figure 133: UK Solar Incentives Figure 134: UK Solar Installations ROCs/MWh 2013/14 2014/15 2015/16 2016/17Building-mounted
solar PV 1.7 1.6 1.5 1.4Ground-mounted
solar PV 1.6 1.4 1.3 1.2
* ROC support for >5MW likely to end from Apr'14
FiT Scheme
Band
Tariff (Jul-Dec 2014) in
p/kWh
Tariff (from 1 Jan 2015)
in p/kWh
Tariff (from 1 Jan
2015) in $
cents/kWh
<=4kW 14.38 13.88 22.06
>4-10kW 13.03 12.57 19.99
>10-50kW 12.13 11.71 18.61
>50-100kW 10.34 10.34 16.44
>100-150kW 10.34 10.34 16.44
>150-250kW 9.89 9.89 15.73
>250kW-5MW 6.38 6.38 10.14
Stand alone 6.38 6.38 10.14
Export tariff 4.77 4.77 7.58
762 MW925 MW
1,500 MW
3,000 MW
2,250 MW
1,800 MW
0.0%
1.0%
2.0%
3.0%
4.0%
5.0%
6.0%
7.0%
8.0%
9.0%
10.0%
0
500
1000
1500
2000
2500
3000
3500
2011 2012 2013E 2014E 2015E 2016E
UK
% o
f G
lobal S
ola
r In
sta
llatio
ns
Estim
ate
d S
ola
r In
sta
llatio
ns in T
he U
K (
MW
)
United Kingdom UK % of Mkt
Source: Deutsche Bank, DECC
Source: Deutsche Bank

27 February 2015
Clean Technology
Solar
Page 118 Deutsche Bank Securities Inc.
Key Markets – The ~1GW Club
Mexico
Solid Fundamentals, Energy Reforms Make Mexico an Attractive Market
Mexico is an emerging attractive market for both utility scale and distributed
generation. Virtual net metering was established in Mexico in 2007 and is
administered by the CFE, Mexico's state owned utility. This effectively allows
companies to buy power from solar plants anywhere else in the country.
Therefore, users in high priced electricity regions can use power from solar
plants in areas with low development costs. This is an important policy that
should help drive solar investment in the country.
While CFE has owned and operated most power plants in the past,
independent power producers (IPPs) are starting to gain traction in Mexico -
often through renewables. Given high insolation levels (>4.5kWh/m²/day in
~70% of the country) and high energy prices for commercial/industrial
consumers, we believe key fundamentals in Mexico’s renewable energy sector
are already in place. Previously, Mexico has set the goal to generate 35% of its
energy from renewable sources by 2024 (vs. ~14% currently).
Figure 135: Mexico Solar Resources (Horizontal Radiance)
Source: SolarGIS © 2014 GeoModel Solar
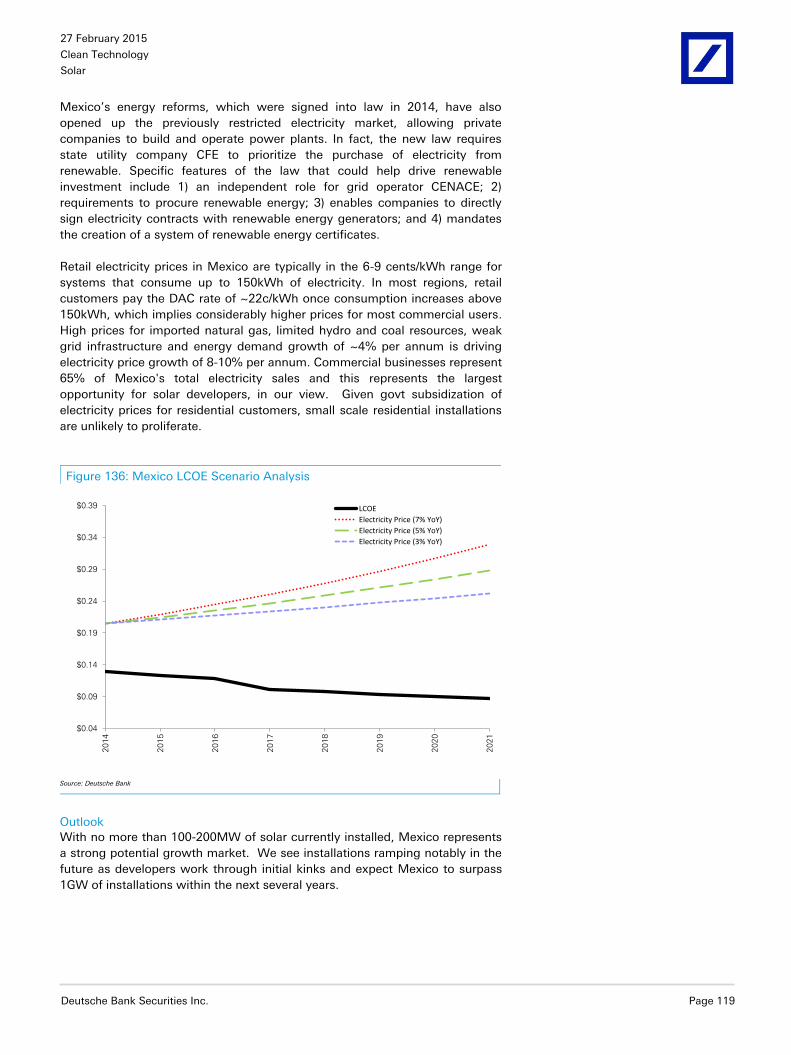
27 February 2015
Clean Technology
Solar
Deutsche Bank Securities Inc. Page 119
Mexico’s energy reforms, which were signed into law in 2014, have also
opened up the previously restricted electricity market, allowing private
companies to build and operate power plants. In fact, the new law requires
state utility company CFE to prioritize the purchase of electricity from
renewable. Specific features of the law that could help drive renewable
investment include 1) an independent role for grid operator CENACE; 2)
requirements to procure renewable energy; 3) enables companies to directly
sign electricity contracts with renewable energy generators; and 4) mandates
the creation of a system of renewable energy certificates.
Retail electricity prices in Mexico are typically in the 6-9 cents/kWh range for
systems that consume up to 150kWh of electricity. In most regions, retail
customers pay the DAC rate of ~22c/kWh once consumption increases above
150kWh, which implies considerably higher prices for most commercial users.
High prices for imported natural gas, limited hydro and coal resources, weak
grid infrastructure and energy demand growth of ~4% per annum is driving
electricity price growth of 8-10% per annum. Commercial businesses represent
65% of Mexico's total electricity sales and this represents the largest
opportunity for solar developers, in our view. Given govt subsidization of
electricity prices for residential customers, small scale residential installations
are unlikely to proliferate.
Figure 136: Mexico LCOE Scenario Analysis
$0.04
$0.09
$0.14
$0.19
$0.24
$0.29
$0.34
$0.39
2014
2015
2016
2017
2018
2019
2020
2021
LCOE
Electricity Price (7% YoY)
Electricity Price (5% YoY)
Electricity Price (3% YoY)
Source: Deutsche Bank
Outlook
With no more than 100-200MW of solar currently installed, Mexico represents
a strong potential growth market. We see installations ramping notably in the
future as developers work through initial kinks and expect Mexico to surpass
1GW of installations within the next several years.

27 February 2015
Clean Technology
Solar
Page 120 Deutsche Bank Securities Inc.
Figure 137: Country Snapshot
Mexico2014 2017
Yearly Sun Hours (Net 20% Conversion Loss) 1,792 1,792
System Cost ($/W) $2.00 $1.71
Discount Rate 9% 7%
LCOE ($/kWh) $0.13 $0.10
Electricity Price - Average Residential ($/kWh) $0.20 $0.24
Electricity Market Size (GW) ~65GW
2014 Est Solar Installs (MW) 120
2015 Est Solar Installs (MW) 250
2016 Est Solar Installs (MW) 1,500
Cumulative Solar Installs at end of 2016 1,948
Policy Climate
Other Remarks
*Electricity price is est of resi price, but majority of installs likely to be larger scale. Assumes 5% system price reduction YoY
Recent energy reforms and virtual net metering coupled with solid
fundamentals provide an attractive investment environment for
developers
Source: Deutsche Bank
Figure 138: Mexico Solar Installations
7 MW 1 MW70 MW
120 MW
250 MW
1,500 MW
0.0%
1.0%
2.0%
3.0%
4.0%
5.0%
6.0%
7.0%
8.0%
9.0%
10.0%
0
200
400
600
800
1,000
1,200
1,400
1,600
2011 2012 2013 2014E 2015E 2016E
Mexic
o %
of G
lobal S
ola
r In
sta
llations
Estim
ate
d S
ola
r In
sta
llations in
Mexic
o (
MW
)
Mexico Mexico % of Mkt
Source: Deutsche Bank ests

27 February 2015
Clean Technology
Solar
Deutsche Bank Securities Inc. Page 121
Philippines
The Philippines is a notable attractive market for solar. The country is is
experiencing rapid electricity demand growth coupled with substantial (~90%)
energy import requirements. The Philippines also has relatively high solar
insolation levels of ~1,600 kWh/kW/year and in an effort to address the
growing energy needs, the country increased focus on renewables.
Renewable sources currently account for ~30% overall energy mix and are
targeted to represent 50% by 2030.
Figure 139: Philippines Solar Resources (Horizontal Radiance)
Source: NREL
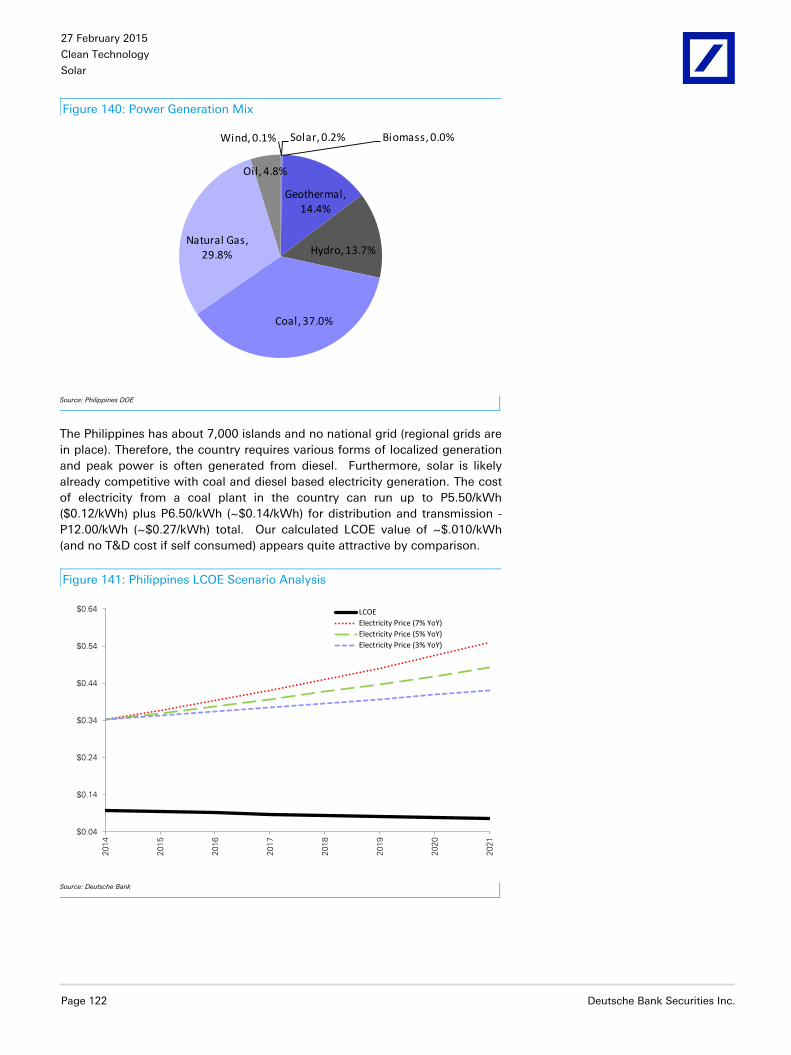
27 February 2015
Clean Technology
Solar
Page 122 Deutsche Bank Securities Inc.
Figure 140: Power Generation Mix
Wind, 0.1% Solar, 0.2% Biomass, 0.0%
Geothermal, 14.4%
Hydro, 13.7%
Coal, 37.0%
Natural Gas, 29.8%
Oil, 4.8%
Source: Philippines DOE
The Philippines has about 7,000 islands and no national grid (regional grids are
in place). Therefore, the country requires various forms of localized generation
and peak power is often generated from diesel. Furthermore, solar is likely
already competitive with coal and diesel based electricity generation. The cost
of electricity from a coal plant in the country can run up to P5.50/kWh
($0.12/kWh) plus P6.50/kWh (~$0.14/kWh) for distribution and transmission -
P12.00/kWh (~$0.27/kWh) total. Our calculated LCOE value of ~$.010/kWh
(and no T&D cost if self consumed) appears quite attractive by comparison.
Figure 141: Philippines LCOE Scenario Analysis
$0.04
$0.14
$0.24
$0.34
$0.44
$0.54
$0.64
2014
2015
2016
2017
2018
2019
2020
2021
LCOE
Electricity Price (7% YoY)
Electricity Price (5% YoY)
Electricity Price (3% YoY)
Source: Deutsche Bank
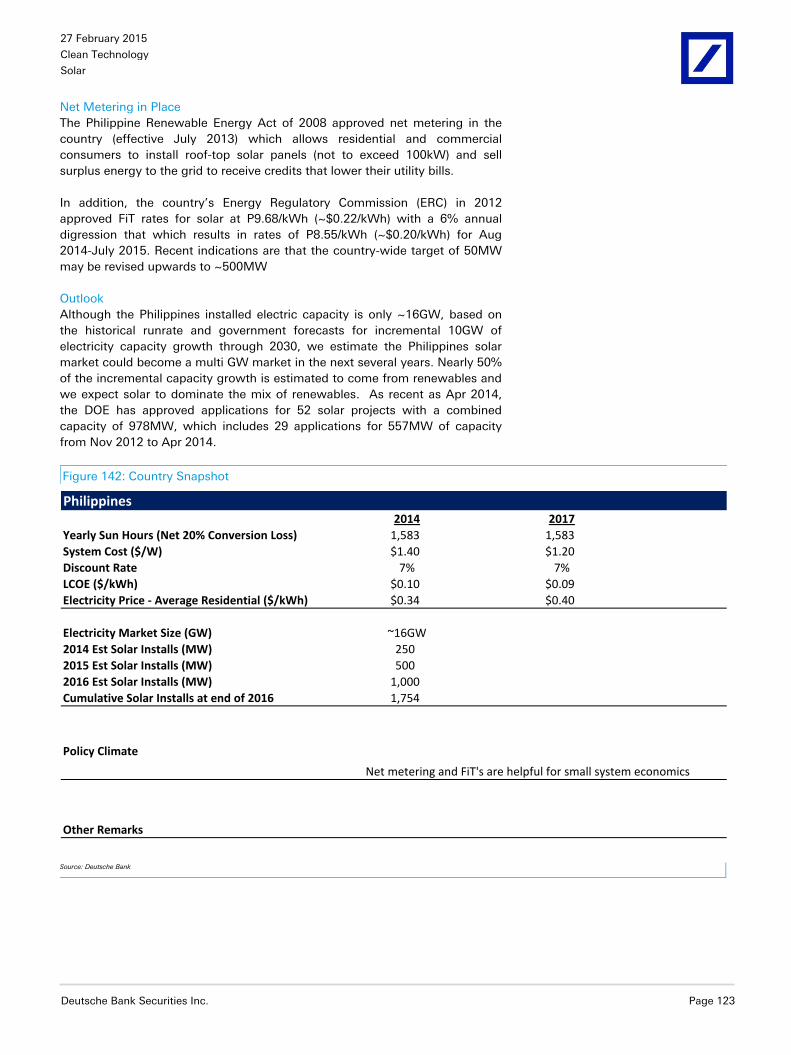
27 February 2015
Clean Technology
Solar
Deutsche Bank Securities Inc. Page 123
Net Metering in Place
The Philippine Renewable Energy Act of 2008 approved net metering in the
country (effective July 2013) which allows residential and commercial
consumers to install roof-top solar panels (not to exceed 100kW) and sell
surplus energy to the grid to receive credits that lower their utility bills.
In addition, the country’s Energy Regulatory Commission (ERC) in 2012
approved FiT rates for solar at P9.68/kWh (~$0.22/kWh) with a 6% annual
digression that which results in rates of P8.55/kWh (~$0.20/kWh) for Aug
2014-July 2015. Recent indications are that the country-wide target of 50MW
may be revised upwards to ~500MW
Outlook
Although the Philippines installed electric capacity is only ~16GW, based on
the historical runrate and government forecasts for incremental 10GW of
electricity capacity growth through 2030, we estimate the Philippines solar
market could become a multi GW market in the next several years. Nearly 50%
of the incremental capacity growth is estimated to come from renewables and
we expect solar to dominate the mix of renewables. As recent as Apr 2014,
the DOE has approved applications for 52 solar projects with a combined
capacity of 978MW, which includes 29 applications for 557MW of capacity
from Nov 2012 to Apr 2014.
Figure 142: Country Snapshot
Philippines2014 2017
Yearly Sun Hours (Net 20% Conversion Loss) 1,583 1,583
System Cost ($/W) $1.40 $1.20
Discount Rate 7% 7%
LCOE ($/kWh) $0.10 $0.09
Electricity Price - Average Residential ($/kWh) $0.34 $0.40
Electricity Market Size (GW) ~16GW
2014 Est Solar Installs (MW) 250
2015 Est Solar Installs (MW) 500
2016 Est Solar Installs (MW) 1,000
Cumulative Solar Installs at end of 2016 1,754
Policy Climate
Other Remarks
Net metering and FiT's are helpful for small system economics
Source: Deutsche Bank

27 February 2015
Clean Technology
Solar
Page 124 Deutsche Bank Securities Inc.
Figure 143: Philippines Solar Installations
0 MW 2 MW 2 MW
250 MW
500 MW
1,000 MW
0.0%
0.2%
0.4%
0.6%
0.8%
1.0%
1.2%
1.4%
1.6%
1.8%
0
200
400
600
800
1,000
1,200
2011 2012 2013 2014E 2015E 2016E
Japan %
of G
lobal S
ola
r In
sta
llatio
ns
Estim
ate
d S
ola
r In
sta
llatio
ns in J
apan (
MW
)
Phillipines Phillipines
Source: Deutsche Bank, ERC

27 February 2015
Clean Technology
Solar
Deutsche Bank Securities Inc. Page 125
France
Proposed €10B Energy Law/ Clear Policy Climate to Spur Solar Growth
In a bid to reduce France’s reliance on nuclear power from ~75% currently to
50% by 2025, the govt is indicating an increased focus on renewable
deployments. Specifically, the environment minister signaled intentions to
mobilize €10B in investment through tax credits and low-interest loans. While
€5B will of the targeted investment will come from govt-owned lender Caisse
des Depots et Consignations, the rest will come from non- state banks.
Moreover, the govt is now targeting 32% of energy from renewables by 2030
(vs. 14% in 2012), and 75% cut in emissions by 2050.
Figure 144: Electricity Mix in France (TWh)
Nuclear Generation
73%
Non-Nuclear27%
Source: OECD
France has ~5GW of solar installations and the rate of installs has slowed
considerably since 2011 – current installs accounted for only ~1% of its
electricity use in 1H14. However, we believe installations are likely to pick up
going forward. While small-scale installations are able to receive relatively high
FiT rates, large-scale installations typically use tenders (govt recently launched
a new 400MW RfP for >200Kw solar PV projects).
Furthermore, the country’s electricity prices have consistently increased over
the past 7-8 years (where data was available). Residential electricity prices in
France increased at a ~5% CAGR over 1H08-1H14, while industrial electricity
prices increased at a ~7% CAGR during 2H07-2H13.
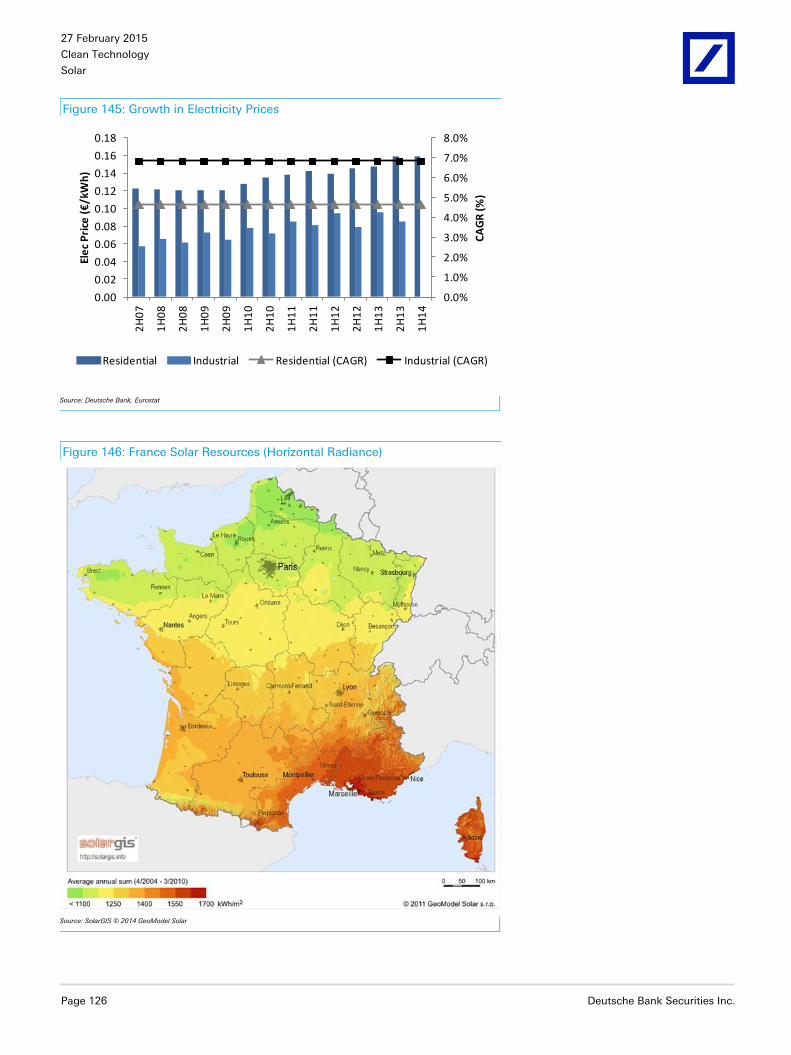
27 February 2015
Clean Technology
Solar
Page 126 Deutsche Bank Securities Inc.
Figure 145: Growth in Electricity Prices
0.0%
1.0%
2.0%
3.0%
4.0%
5.0%
6.0%
7.0%
8.0%
0.00
0.02
0.04
0.06
0.08
0.10
0.12
0.14
0.16
0.182
H0
7
1H
08
2H
08
1H
09
2H
09
1H
10
2H
10
1H
11
2H
11
1H
12
2H
12
1H
13
2H
13
1H
14
CA
GR
(%
)
Ele
c P
rice
(€
/kW
h)
Residential Industrial Residential (CAGR) Industrial (CAGR)
Source: Deutsche Bank, Eurostat
Figure 146: France Solar Resources (Horizontal Radiance)
Source: SolarGIS © 2014 GeoModel Solar

27 February 2015
Clean Technology
Solar
Deutsche Bank Securities Inc. Page 127
Furthermore, our analysis indicates parts of the country may be at grid parity
today.
Figure 147: France LCOE Scenario Analysis
$0.04
$0.09
$0.14
$0.19
$0.24
$0.29
$0.34
$0.39
2014
2015
2016
2017
2018
2019
2020
2021
LCOE
Electricity Price (7% YoY)
Electricity Price (5% YoY)
Electricity Price (3% YoY)
Source: Deutsche Bank
Current Policies
Under the France’s policy framework, small PV systems (up to 100kW) benefit
from higher FiT rates, but larger systems receive significantly lower rates.
However, larger installations (>100kW) are also eligible to participate in the
tender process, which will help drive installations. Specifically, all rooftop
projects 100kW-250kW will use a "simplified” call-for-tender; while rooftop
projects >250kW, and ground-mounted projects of any size can respond to a
more conventional request-for-proposal (RFP). The move to switch to tenders
for >100kW installations was initially designed to allow greater control over
large scale installations.
There have been several attempts in recent years to provide policy support in
the country. For example, in late 2014, France announced a new 400MW RFP
for solar projects larger than 250kW. Prior to that in Apr 2013, the country
announced plans to tender 120MW of 100-250kW rooftop PV installations by
2015 (tenders of 40MW per year). In Mar 2013, the country announced tender
for 400MW of >250kW installations. In Jan 2013, France doubled its annual
minimum installation rate, from 500MW in 2012 to 1GW in 2013, but that goal
was not achieved. In 2014, France's Energy Regulatory Authority (CRE)
announced new feed-in tariff rates for 1Q14 at EUR0.0736–0.2851 per kWh
(see below).

27 February 2015
Clean Technology
Solar
Page 128 Deutsche Bank Securities Inc.
Figure 148: France FiT (1Q14)
Installation Type Capacity
Jan-Mar 2014
(EUR/kWh)
Jan-Mar 2014
(~$/kWh)
BIPV 0-9kW 0.2851 0.37
0-36 kW 0.1454 0.19
36-100 kW 0.1381 0.18
0.10
Simplified BIPV
0-12MW 0.0736Without integration or
outside above criteria or Source: Deutsche Bank, CRE
Outlook for 2014/15
Annual installations in France declined in 2012 and 2013 – likely due to the
switch from FiT’s to tenders. Installations have declined in the last several
years (to 613MW in 2013), but the market showed signs of recovery in 2014,
with installations of ~672MW in the first 3 quarters (192MW in 1Q14, 194MW
in 2Q14 and ~286MW in 3Q14). Quarterly run rate of 200-300MW indicates
that policy support mechanisms are beginning to help more, and the country
could reach a yearly run rate above 1GW in the future. We do not expect the
country to provide major surprises, but should remain a relatively sustainable
market.
Figure 149: Country Snapshot
France2014 2017
Yearly Sun Hours (Net 20% Conversion Loss) 1,083 1,083
System Cost ($/W) $2.00 $1.71
Discount Rate 5% 5%
LCOE ($/kWh) $0.16 $0.15
Electricity Price - Average Residential ($/kWh) $0.21 $0.25
Electricity Market Size (GW) ~125GW
2014 Est Solar Installs (MW) 766
2015 Est Solar Installs (MW) 920
2016 Est Solar Installs (MW) 1,103
Cumulative Solar Installs at end of 2016 12,025
Policy Climate Generally improving policy climate should support yearly installs in the
~1GW range. We do not expect a major shift in installations.
Other Remarks
*Electricity price is est of resi price. Assumes 5% system price reduction YoY
Source: Deutsche Bank

27 February 2015
Clean Technology
Solar
Deutsche Bank Securities Inc. Page 129
Figure 150: France Solar Installations
1,777 MW
1,115 MW
613 MW
766 MW
920 MW
1,103 MW
0.0%
1.0%
2.0%
3.0%
4.0%
5.0%
6.0%
7.0%
0
200
400
600
800
1,000
1,200
1,400
1,600
1,800
2,000
2011 2012 2013 2014E 2015E 2016E
Fra
nce %
of G
lobal S
ola
r In
sta
llatio
ns
Estim
ate
d S
ola
r In
sta
llatio
ns in F
rance (M
W)
France France
Source: Deutsche Bank, EPIA

27 February 2015
Clean Technology
Solar
Page 130 Deutsche Bank Securities Inc.
Chile
As home to one of the most attractive solar resources in the world, Chile was
among the first self-sustaining solar markets where new projects are already
being produced at or below grid parity. We expect installations to continue
ramping as high electricity prices coupled with unique opportunities in the
mining sector create a robust environment for most of the top solar companies
in the world to continue building large scale commercial or utility projects. In
addition, expected addition of the net metering policy for projects under
100KW should act as a catalyst for rooftop generation.
Figure 151: Chile Solar Resources
Source: SolarGIS © 2014 GeoModel Solar
The Chilean electricity market is characterized by high prices, near complete
private ownership, and extensive industrial sector demand particularly from the
mining sector. There is currently almost 20GW of installed capacity dominated
by natural gas, hydro and coal generation.

27 February 2015
Clean Technology
Solar
Deutsche Bank Securities Inc. Page 131
Figure 152: Chile Generation Capacity
Oil Derived13%
Natural Gas30%
Biomass2%
Coal20%
Hydro-Flow12%
Hydro-Dam22%
Wind1%
Source: Centro de Despacho Economico (CDEC)
However, there are notable differences between the north and south in terms
of electricity generation within the country. While 33% of overall capacity is
hydro based, the north section of the country has much less rainfall and
consequently, almost no hydropower. We expect the majority of solar
installations coming online over the next several years to be located in the
SING (northern grid), which is much drier and, consequently, cannot support
the level of hydro generation present in the SIC.
Electricity Use is Expanding Rapidly
Based on historic trends, it is evident that electricity demand is expanding
rapidly in the country.
Figure 153: Electricity Use Per Capita – US vs Chile
0
500
1000
1500
2000
2500
3000
3500
0
2000
4000
6000
8000
10000
12000
14000
16000
Chile
's k
Wh/p
ers
on
US
kW
h/p
ers
on
United States Chile Electricity Use Per Capita
Chile's electricity use per capitagrew ~33%from 2000-2010
The US uses 4Xmore electricityper capita
Source: World Bank, Deutsche Bank

27 February 2015
Clean Technology
Solar
Page 132 Deutsche Bank Securities Inc.
Significant progress in the past year
While the solar market was almost nonexistent before 2013, recent progress
has been rapid and drastic. Total installations have increased from less than
4MW in mid 2013 to 222MW as of November 2014. More importantly, ~8GW
of solar plants have been approved, with another 2.6GW under review. This is
more than double the capacity approved/pending as recently as a year prior.
Figure 154: Past Projects Pipeline Was Robust… Figure 155: …And is Significantly Expanded
0
2000
4000
6000
8000
10000
12000
Mini-Hydro Wind Biomass Solar Geothermal
Capacity (
kw
)
Operating Construction Approved Pending
There were 3GW+ of approved solarprojects in August 2013, with less than 4 MW built in the country...
0
2000
4000
6000
8000
10000
12000
Biomass Biogas Wind Mini-Hydro Solar-PV Solar-CSP GeothermalC
apacity (
kw
)
Operating Construction Approved Pending
...and in just over a year, approved projects have reached 8GW, with hundreds of MW under constructionand several hundred MW completed
Source: Centro de Energias Renovables
Source: Centro de Energias Renovables
In the longer term, high energy prices and near ideal environmental conditions
will allow extensive solar development in a rapidly developing economy. The
mining companies will play a key role in furthering the economic interests of
the country and the energy needs in the north, which should help spur long
term investment and construction. We favor strategies that begin partnerships
with mining companies as a bridge to further development in the country. With
overall system costs at ~$2-3/W, we expect to see development ramp quickly.
Figure 156: Chile LCOE Scenario Analysis
$0.04
$0.09
$0.14
$0.19
$0.24
$0.29
$0.34
$0.39
$0.44
2014
2015
2016
2017
2018
2019
2020
2021
LCOE
Electricity Price (7% YoY)
Electricity Price (5% YoY)
Electricity Price (3% YoY)
Source: Deutsche Bank

27 February 2015
Clean Technology
Solar
Deutsche Bank Securities Inc. Page 133
We believe Chile’s notable ramp from almost no capacity to a likely yearly
install rate in the 1GW+ range can be attributed in part the electric-intensive
mining industry.
Figure 157: Mining Sector Activity Correlates to Electricity Use
0.0
1,000.0
2,000.0
3,000.0
4,000.0
5,000.0
6,000.0
0
500
1000
1500
2000
2500
3000
3500
1971
1972
1973
1974
1975
1976
1977
1978
1979
1980
1981
1982
1983
1984
1985
1986
1987
1988
1989
1990
1991
1992
1993
1994
1995
1996
1997
1998
1999
2000
2001
2002
2003
2004
2005
2006
2007
2008
2009
2010
Tonnes o
f C
opper
Pro
duced in C
hile
Chile
Ele
ctr
icity U
se p
er
Capita (
kW
h/p
ers
on)
Chile Copper Produced Chile Electricity Use Per Capita
Source: World Bank, Cochilco
While the pipeline of solar projects in Chile may face some regulatory and
logistic hurdles, we expect strategic partnerships with mining companies to be
a good source of growth for solar companies. Mining companies appear to be
among first movers helping to bring projects to completion as they seek to
shore up their long term electricity needs and improve their environmental
image. Long term PPA’s have been signed in the $100-120/MWh range which
is competitive with gas (~$120s/MWh) and coal (~$80s/MWh), with no
commodity risk.
The Risk is Transmission
Much like other countries experiencing rapid growth in renewables, the
electric grid will need significant investment. Chile is uniquely challenging
because the two major electric grids in the north and south of the country are
not connected. Much of the generation potential for solar lies in the north, but
a large portion of the energy use is in the south. While there are plans to
change this and improve the grid, pace of installation growth could be
constrained in the future if interconnection is not possible. However, mining
company partnerships will help offset this.
Current Policies
Chile has updated its renewable-related policies several times in recent
memory in recognition of the country’s significant potential.
In Oct 2013, Chilean President signed into law a bill which mandates that
utilities source 20% of their electricity from non-conventional renewable
energy (NCRE) by 2025. Under the new law, the Ministry of Energy will hold
annual bidding for utilities to purchase electricity from NCRE sources.
Additionally, the president also signed a law making changes to the permitting
process – with an aim to reduce estimated permitting time from 700 to 150
days.
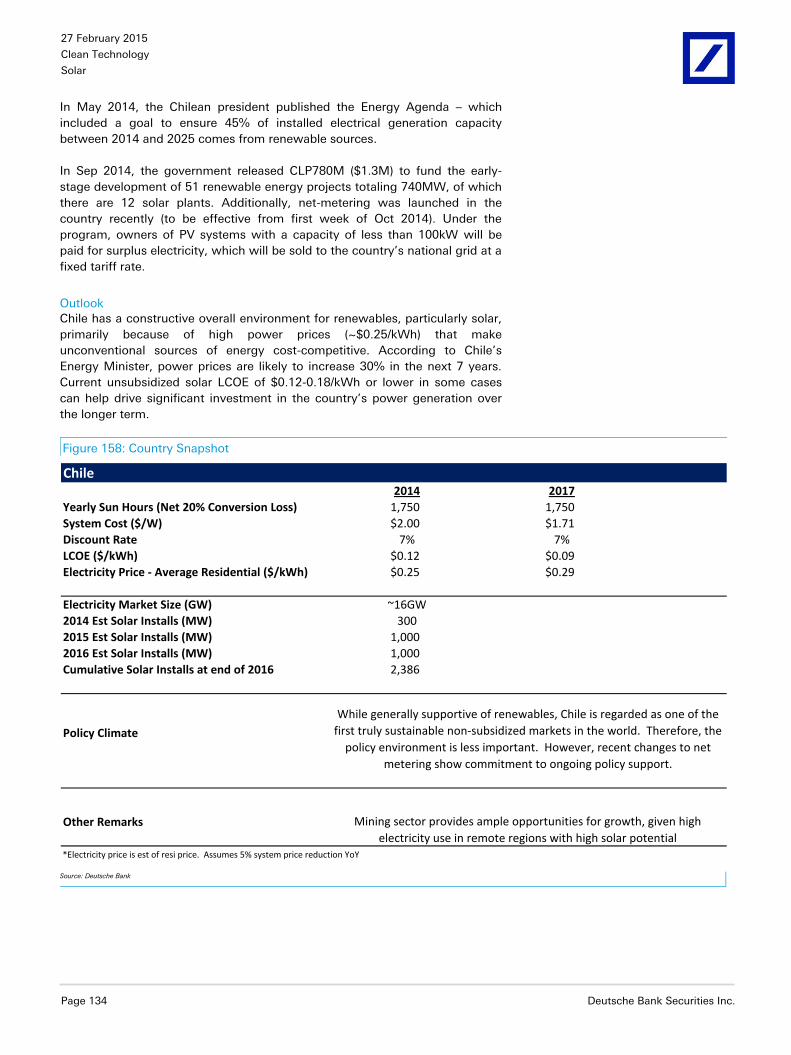
27 February 2015
Clean Technology
Solar
Page 134 Deutsche Bank Securities Inc.
In May 2014, the Chilean president published the Energy Agenda – which
included a goal to ensure 45% of installed electrical generation capacity
between 2014 and 2025 comes from renewable sources.
In Sep 2014, the government released CLP780M ($1.3M) to fund the early-
stage development of 51 renewable energy projects totaling 740MW, of which
there are 12 solar plants. Additionally, net-metering was launched in the
country recently (to be effective from first week of Oct 2014). Under the
program, owners of PV systems with a capacity of less than 100kW will be
paid for surplus electricity, which will be sold to the country’s national grid at a
fixed tariff rate.
Outlook
Chile has a constructive overall environment for renewables, particularly solar,
primarily because of high power prices (~$0.25/kWh) that make
unconventional sources of energy cost-competitive. According to Chile’s
Energy Minister, power prices are likely to increase 30% in the next 7 years.
Current unsubsidized solar LCOE of $0.12-0.18/kWh or lower in some cases
can help drive significant investment in the country’s power generation over
the longer term.
Figure 158: Country Snapshot
Chile2014 2017
Yearly Sun Hours (Net 20% Conversion Loss) 1,750 1,750
System Cost ($/W) $2.00 $1.71
Discount Rate 7% 7%
LCOE ($/kWh) $0.12 $0.09
Electricity Price - Average Residential ($/kWh) $0.25 $0.29
Electricity Market Size (GW) ~16GW
2014 Est Solar Installs (MW) 300
2015 Est Solar Installs (MW) 1,000
2016 Est Solar Installs (MW) 1,000
Cumulative Solar Installs at end of 2016 2,386
Policy Climate
While generally supportive of renewables, Chile is regarded as one of the
first truly sustainable non-subsidized markets in the world. Therefore, the
policy environment is less important. However, recent changes to net
metering show commitment to ongoing policy support.
Other Remarks
*Electricity price is est of resi price. Assumes 5% system price reduction YoY
Mining sector provides ample opportunities for growth, given high
electricity use in remote regions with high solar potential
Source: Deutsche Bank

27 February 2015
Clean Technology
Solar
Deutsche Bank Securities Inc. Page 135
Figure 159: Chile Solar Installations
0 MW 6 MW
80 MW
300 MW
1,000 MW 1,000 MW
0.0%
1.0%
2.0%
3.0%
4.0%
5.0%
6.0%
7.0%
8.0%
9.0%
10.0%
0
200
400
600
800
1,000
1,200
2011 2012 2013 2014E 2015E 2016E
Chile
% o
f G
lobal S
ola
r In
sta
llations
Estim
ate
d S
ola
r In
sta
llations in
Chile
(M
W)
Chile Chile % of Mkt
Source: Deutsche Bank
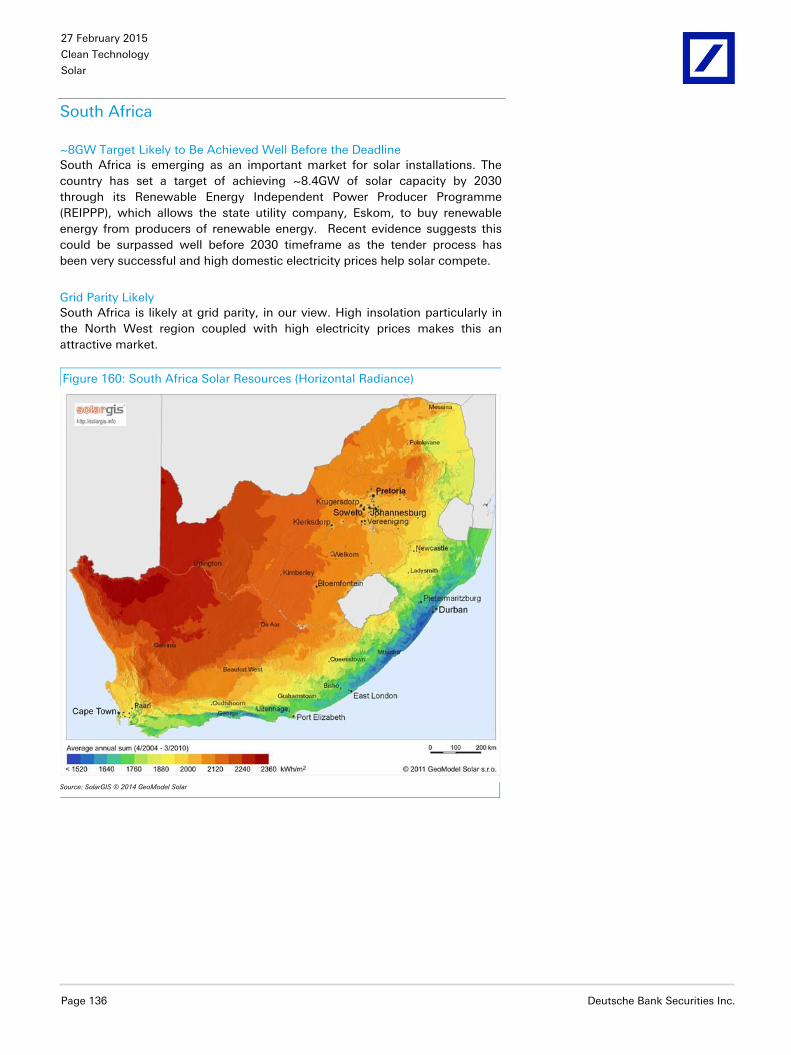
27 February 2015
Clean Technology
Solar
Page 136 Deutsche Bank Securities Inc.
South Africa
~8GW Target Likely to Be Achieved Well Before the Deadline
South Africa is emerging as an important market for solar installations. The
country has set a target of achieving ~8.4GW of solar capacity by 2030
through its Renewable Energy Independent Power Producer Programme
(REIPPP), which allows the state utility company, Eskom, to buy renewable
energy from producers of renewable energy. Recent evidence suggests this
could be surpassed well before 2030 timeframe as the tender process has
been very successful and high domestic electricity prices help solar compete.
Grid Parity Likely
South Africa is likely at grid parity, in our view. High insolation particularly in
the North West region coupled with high electricity prices makes this an
attractive market.
Figure 160: South Africa Solar Resources (Horizontal Radiance)
Source: SolarGIS © 2014 GeoModel Solar
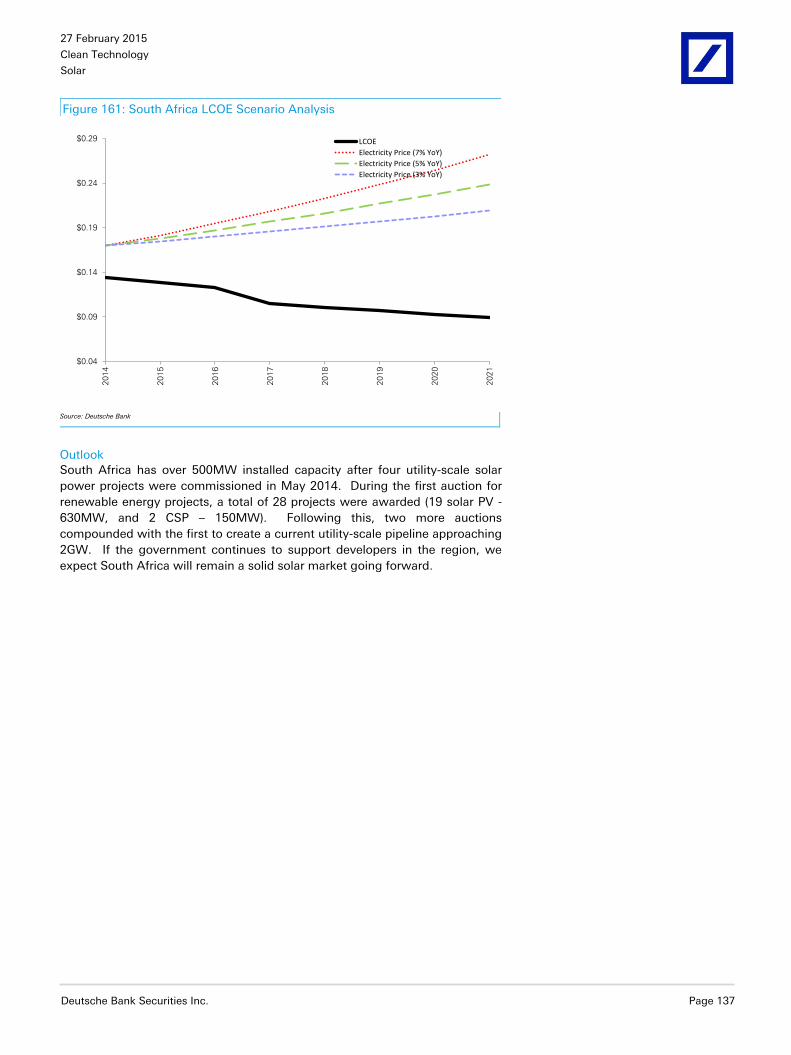
27 February 2015
Clean Technology
Solar
Deutsche Bank Securities Inc. Page 137
Figure 161: South Africa LCOE Scenario Analysis
$0.04
$0.09
$0.14
$0.19
$0.24
$0.29
2014
2015
2016
2017
2018
2019
2020
2021
LCOE
Electricity Price (7% YoY)
Electricity Price (5% YoY)
Electricity Price (3% YoY)
Source: Deutsche Bank
Outlook
South Africa has over 500MW installed capacity after four utility-scale solar
power projects were commissioned in May 2014. During the first auction for
renewable energy projects, a total of 28 projects were awarded (19 solar PV -
630MW, and 2 CSP – 150MW). Following this, two more auctions
compounded with the first to create a current utility-scale pipeline approaching
2GW. If the government continues to support developers in the region, we
expect South Africa will remain a solid solar market going forward.

27 February 2015
Clean Technology
Solar
Page 138 Deutsche Bank Securities Inc.
Figure 162: Country Snapshot
South Africa2014 2017
Yearly Sun Hours (Net 20% Conversion Loss) 1,833 1,833
System Cost ($/W) $2.00 $1.71
Discount Rate 10% 8%
LCOE ($/kWh) $0.13 $0.11
Electricity Price - High Residential ($/kWh) $0.17 $0.20
Electricity Price - Low Residential($/kWh) $0.08 $0.10
Electricity Market Size (GW) ~45GW
2014 Est Solar Installs (MW) 300
2015 Est Solar Installs (MW) 800
2016 Est Solar Installs (MW) 1,200
Cumulative Solar Installs at end of 2016 2,441
Policy Climate
Other Remarks*Electricity price is est of resi price, but majority of installs likely to be larger scale. Assumes 5% system price reduction YoY
The country has set a target of achieving ~8.4GW of solar capacity by 2030
through its Renewable Energy Independent Power Producer Programme
(REIPPP),
Source: Deutsche Bank
Figure 163: South Africa REIPPP Results Figure 164: South Africa Solar Installations
REIPPP PV (MW) CSP (MW)
Round 1 630 150
Round 2 460 50
Round 3 450 200
Total 1540 400
1 MW40 MW
100 MW
400 MW
800 MW
1,200 MW
0.0%
1.0%
2.0%
3.0%
4.0%
5.0%
6.0%
7.0%
8.0%
9.0%
10.0%
0
200
400
600
800
1,000
1,200
1,400
2011 2012 2013 2014E 2015E 2016E
South
Afr
ica %
of G
lobal S
ola
r In
sta
llatio
ns
Estim
ate
d S
ola
r In
sta
llatio
ns in S
outh
Afr
ica (M
W)
South Africa South Africa % of Mkt
Source: Deutsche Bank, South Africa Government
Source: Deutsche Bank

27 February 2015
Clean Technology
Solar
Deutsche Bank Securities Inc. Page 139
Australia
Despite high sunlight and electricity needs, policy support in Australia has
been waning quickly. However, we believe grid parity for small systems is
already in place in the country, which will support a relatively stable long term
installations outlook. Electricity prices for residential customers reach well into
the double digits, and a notable mining sector in the country provides future
opportunities similar to the Chilean market.
Figure 165: Australia Solar Resources (Horizontal Radiance)
Source: SolarGIS © 2014 GeoModel Solar

27 February 2015
Clean Technology
Solar
Page 140 Deutsche Bank Securities Inc.
Figure 166: Australia LCOE Scenario
$0.06
$0.16
$0.26
$0.36
$0.46
$0.56
$0.66
$0.76
$0.86
2014
2015
2016
2017
2018
2019
2020
2021
LCOE
Electricity Price (7% YoY)
Electricity Price (5% YoY)
Electricity Price (3% YoY)
Source: Deutsche Bank
Policy Uncertainty Over LRET Likely to Affect >100kW Installations
The Australian govt has proposed scaling-down the 2020 Large-scale
Renewable Energy Target to ~26TWh from 41TWh, although recent indications
suggest there may be a compromise somewhere in the mid 30’sTWH.
Although the proposed change is pending final approval and implementation
(due to a stiff resistance from the Opposition Labor party), it has created
enough uncertainty that many large scale projects are stalled. We believe
there are ~1GW worth solar projects in early stages of development that may
not continue should the proposed change be implemented. Below is a list of
some projects that are at risk.
Figure 167: Solar Projects At Risk Due To Proposed Scale-down of LRET
Company/ Organization
State Project Capacity (MW) Comments
Neoen NSW - 115 115MW of large scale solar proposed
- QLD Kilcoy solar project
400
Recurrent Energy QLD RE Oakey solar project
80
Sunshine Coast Council
QLD - 15
Neoen WA Mungari solar project
50
Neoen WA Chapman solar project
30
- WA - 30 Perth region
- WA - 20 mid west region
- WA - 20 Two 10MW solar PV plants in mid
west region Source: Deutsche Bank, RenewEconomy: http://reneweconomy.com.au/2014/the-wind-and-solar-projects-that-would-disappear-along-with-ret-24255

27 February 2015
Clean Technology
Solar
Deutsche Bank Securities Inc. Page 141
However, Residential/Commercial Solar Installs Likely to Witness Steady Growth
Although there are risks to the progress of large-scale solar installations, we
believe small-scale installs are likely to continue upward trajectory. In fact,
most of solar installations in Australia are small-scale residential/commercial
rooftop systems, which are unaffected by the proposed changes. According to
Australian Bureau of Statistics, currently 14% of Australian households have
rooftop PV – implying significant room for further growth, given grid parity in
the country.
Current Policies (Federal Level)
The main solar incentive scheme in Australia at the federal level is the
Renewable Energy Target (RET), which is divided into two segments - the
Small-scale Renewable Energy Scheme (SRES) and the Large-scale Renewable
Energy Target (LRET). SRES works by issuing Small-scale Technology
Certificates (STCs) to eligible households, based on the expected output of the
solar system over a 15-year period, (1MWh = 1 STC). STCs can be traded and
sold, which provides an up-front cash stream for solar system owners.
Meanwhile, LRET provide for Large-scale Generation Certificates (LGCs) that
can be generated by commercial and utility-scale systems over 100kW. LGCs
are produced on an ongoing basis after the system starts producing power,
and therefore provide an ongoing revenue stream for their operators.
In 2010, the govt set RET at 20% of renewable by 2020. The govt also set a
target for LRET at 41TWh, while SRET was just given a notional target of 4TWh.
The Australian government recently constituted an expert panel to review RETs.
The panel has recommended two options for the LRET (currently set at 41,000
GWh of electricity from large-scale renewable energy by 2020) – 1) the scheme
should be closed to new investment within a month of the change; or 2) the
target should be set at 20% and subsequently be reset each year and new
renewable energy power stations be given approval only if electricity demand
increased. The panel recommended two options for SRES: – 1) it should be
abolished immediately; or 2) it should be quickly phased-out by cutting the
period of subsidies from 15 to 10 years immediately, reducing the period
further by 1-year every year after 2016, and phasing out the program to new
entrants in 2020 instead of 2030. Additionally, the Climate Change Authority
reviewed the SRES program and recommended no changes, primarily because
it is already set to begin phase out in 2017.
In Oct 2014, Industry Minister Ian Macfarlane announced that the govt. would
seek to cut the 2020 RET for large-scale developers (LRET) to ~26TWh by 2020
(from 41TWh previously), which he said represents the “real 20%” (previous
target of 41TWh is likely to represent ~27% of the energy mix). The changes
would need support of the opposition in the Senate to become a law.
Macfarlane noted that there will be no changes to household solar scheme,
which means that the upfront subsidy in the form of certificates will still be
available for systems under 10kW. However, there is uncertainty whether
commercial-scale solar (10-100kW) will continue to receive certificates.
Current Policies (State Level)
Over the last couple of years, most states in Australia have either cut the FiTs
paid for solar energy, or abolished them completely. The current FiT schemes
prevalent in the major solar states are listed below.

27 February 2015
Clean Technology
Solar
Page 142 Deutsche Bank Securities Inc.
Queensland (QLD): In 2014r, QLD closed its solar bonus program for new
applicants. The program offered a government mandated solar FiT of
A$0.44/kWh, which is paid to eligible customers (who applied before 10 July
2012 and consume <100MWh/year) for the surplus electricity generated from
solar PV systems, which is exported to the Queensland electricity grid. New
customers are required to negotiate directly with retailers over a price for the
energy they produce.
New South Wales (NSW): The state of NSW has closed its solar bonus scheme
to new applicants. However, NSW residents can choose to use a “Voluntary
Solar Buyback”. NSW’s Independent Pricing and Regulatory Tribunal (IPART)
announced the Solar Bonus Scheme benchmark buyback rate range of 4.9-
9.3c/kWh for solar power fed into the electricity grid for 2014/15. The rate
range is the benchmark for the unsubsidized FiTs that retailers may
“voluntarily” offer PV customers who are not part of the Solar Bonus Scheme.
Under the previous scheme, the state pays FiT of A$0.60 or A$0.20 per kWh
(depending on the date of application) to those customers who connected
systems by June 2012.
Victoria (VIC): Victoria offers incentives to solar customers in the form of FiT
payments, which will be reviewed/ updated annually until 2016 by the
Essential Services Commission (ESC). Currently, the FiT offers a minimum of
A$0.08/kWh for 2014 for excess electricity fed back into the grid. The FiT is
only available to solar systems with a capacity of <100kW. ESC has released a
draft decision to adopt a minimum FiT rate of A$0.062/kWh to apply from 1
Jan 2015 (the rate was lowered from A$0.074/kWh as the Australian
government decided to repeal the carbon price). Previously, the state offered
Transitional and Standard FiT schemes (closed on 31 Dec 2012) with rates of
A$0.25/kWh or 1:1 buy back.
South Australia (SA): Households and small businesses with solar PV systems
in South Australia may receive a FiT for the electricity they export to the
distribution network. All residential and small business PV customers can
receive a retailer-paid feed-in tariff (R-FiT) from their electricity retailer. Some
customers also receive a distributor-paid feed-in tariff (D-FiT) of either A$0.16
A$0.44 per /kWh from SA Power Networks. Residential and small business PV
customers are entitled to receive a minimum R-FiT from 1 July 2014 until 31
Dec 2014. The minimum to be paid by retailers is A$0.06/kWh for electricity
fed into SA Power Networks’ distribution network.
Western Australia (WA): WA government stopped its FiT scheme for new
applicants. Under the previous scheme, the state pays FiT of A$0.40 or A$0.20
per kWh (depending on the date of application) to those customers who
connected systems by mid-2011. Synergy, Western Australia’s largest energy
retailer, offers a Renewable Energy Buyback Scheme. As of 2014, Synergy
bought renewable energy from customer at ~A$0.089/kWh.
Outlook
According to the Australian PV Institute, cumulative PV installations in
Australia reached ~4GW as of Nov’14, (~448MW installed during 1H14). Given
policy uncertainty and relative negative sentiment, we expect more future
installations to be focused on clear grid-parity segments such as residential.
Longer term, we see potential for commercial/industrial customers.
Furthermore, there is a notable pro-solar contingent in the country, which
could shift policy direction in the future. However, short-medium term
momentum appears to be against large scale projects.

27 February 2015
Clean Technology
Solar
Deutsche Bank Securities Inc. Page 143
Figure 168: Country Snapshot
Australia2014 2017
Yearly Sun Hours (Net 20% Conversion Loss) 1,833 1,833
System Cost ($/W) $3.00 $2.85
Discount Rate 6% 6%
LCOE ($/kWh) $0.15 $0.14
Electricity Price - High Residential ($/kWh) $0.49 $0.57
Electricity Price - Low Residential($/kWh) $0.23 $0.27
Electricity Market Size (GW) ~60GW
2014 Est Solar Installs (MW) 1,100
2015 Est Solar Installs (MW) 850
2016 Est Solar Installs (MW) 893
Cumulative Solar Installs at end of 2016 6,030
Policy Climate
Other Remarks*Assumes 5% system price reduction YoY
Govt has signaled intentions to cut RET for large-scale developers to
~26TWh by 2020 (from 41TWh previously). Currently, the move has been
rejected by the opposition.
Source: Deutsche Bank
Figure 169: Australia Solar Incentives Figure 170: Australia Solar Installations Federal Incentives Comments
SREC For small-scale customers. STCs issued based on the expected output of the solar
system over a 15-year period
LRETLGCs can be generated by commercial and utility-scale systems over 100kW
*in August 2014, A govt sponsored "Report of the Expert Panel" recommended cuts to incentives
State Incentives Comments
QLD Solar Bonus Scheme closed for new applicants.
NSWSolar Bonus Scheme closed for new applicants. Customers can use "Voluntary Solar
Buyback", benchmark rate of 4.9-9.3c/kWh (~US$0.04-0.08/kWh) for 2014/15.
VIC FiT payments of A$0.08/kWh (~US$0.07/kWh) for 2014 . Draft decision of
A$0.062/kWh (~US$0.06/kWh) to apply from 1 Jan 2015
SAretailer-paid feed-in tariff (R-FiT) of A$0.06/kWh (~US$0.05/kWh) from 1 July 2014
until 31 Dec 2014.
WA Solar Bonus Scheme closed for new applicants. Synergy, Western Australia’s largest
energy retailer, offers a Renewable Energy Buyback Scheme.
874 MW
1,049 MW
757 MW
1,100 MW
850 MW893 MW
0.0%
1.0%
2.0%
3.0%
4.0%
5.0%
6.0%
7.0%
8.0%
9.0%
10.0%
0
200
400
600
800
1,000
1,200
2011 2012 2013 2014E 2015E 2016E
Austr
alia
% o
f G
lobal S
ola
r In
sta
llatio
ns
Estim
ate
d S
ola
r In
sta
llatio
ns in A
ustr
alia
(M
W)
Australia Australia % of Mkt
Source: Deutsche Bank, State Govt Websites
Source: Deutsche Bank, Australian PV Institute (APVI) Solar Map, funded by the Australian Renewable Energy Agency, accessed frompv-map.apvi.org.au on Nov 3, 2014

27 February 2015
Clean Technology
Solar
Page 144 Deutsche Bank Securities Inc.
Key Markets: ~500MW Club
Brazil
Brazil has the largest electricity capacity in South America with over ~125GW
installed, primarily composed of hydro-power (~73%+) and expectations to
increase to ~200GW in the next ten years (~7GW each year). Solar resources
are robust in the country and we expect that the targets may shift to
accommodate more resource diversity over the medium term.
Figure 171: Brazil Solar Resources
Source: SolarGIS © 2014 GeoModel Solar
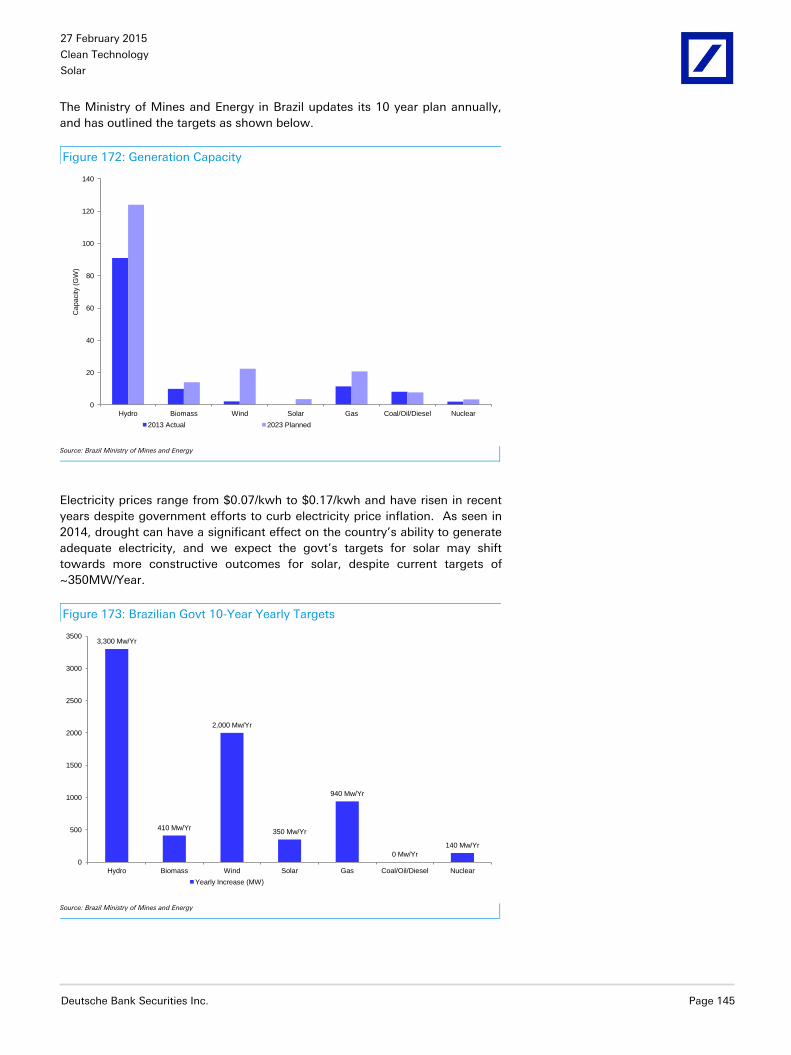
27 February 2015
Clean Technology
Solar
Deutsche Bank Securities Inc. Page 145
The Ministry of Mines and Energy in Brazil updates its 10 year plan annually,
and has outlined the targets as shown below.
Figure 172: Generation Capacity
0
20
40
60
80
100
120
140
Hydro Biomass Wind Solar Gas Coal/Oil/Diesel Nuclear
Capacity (
GW
)
2013 Actual 2023 Planned
Source: Brazil Ministry of Mines and Energy
Electricity prices range from $0.07/kwh to $0.17/kwh and have risen in recent
years despite government efforts to curb electricity price inflation. As seen in
2014, drought can have a significant effect on the country’s ability to generate
adequate electricity, and we expect the govt’s targets for solar may shift
towards more constructive outcomes for solar, despite current targets of
~350MW/Year.
Figure 173: Brazilian Govt 10-Year Yearly Targets
3,300 Mw/Yr
410 Mw/Yr
2,000 Mw/Yr
350 Mw/Yr
940 Mw/Yr
0 Mw/Yr
140 Mw/Yr
0
500
1000
1500
2000
2500
3000
3500
Hydro Biomass Wind Solar Gas Coal/Oil/Diesel Nuclear
Yearly Increase (MW)
Source: Brazil Ministry of Mines and Energy

27 February 2015
Clean Technology
Solar
Page 146 Deutsche Bank Securities Inc.
Current Policies/Events
Brazil has set a target to add 3.5GW of solar capacity by 2023. In Oct 2014, the
country held an auction to negotiate energy to be produced exclusively by
solar farms. The govt. granted contracts for the 31 solar parks with a combined
capacity of over 1GW, which was notably above market expectations of
~500MW. The final price for solar power came at ~BRL220/MWh (~$89/MWh).
The country’s energy regulator Aneel had set a BRL262/MWh (~$106/MWh)
ceiling price for solar power. Brazil’s Solatio Energia and Renova Energia,
along with Italy’s Enel Green Power won contracts to deliver >70% of the solar
capacity awarded in the auction.
In Nov 2014, Renova Energia and SunEdison agreed to jointly build 1GW of PV
plants in Brazil (over a period of 4-5 years).
Brazil's state-owned development bank BNDES has announced that it will offer
loans to power companies to cover up to 65% of the cost of new solar projects
in the country. BNDES also said that developers proposing solar projects at the
auction will have the cost of borrowing lowered in proportion to the local
content that they commit to use.
Outlook
We believe Brazil represents a notable potential solar market, and recent policy
movements coupled with success in neighboring countries should help
position the country for future growth. While current installed base of 100-
200MW may be slow to begin significant growth, we expect growth rates to
pick up substantially over the next several years.
Figure 174: Brazil LCOE Scenario Analysis
$0.04
$0.14
$0.24
$0.34
$0.44
$0.54
$0.64
2014
2015
2016
2017
2018
2019
2020
2021
LCOE
Electricity Price (7% YoY)
Electricity Price (5% YoY)
Electricity Price (3% YoY)
Source: Deutsche Bank
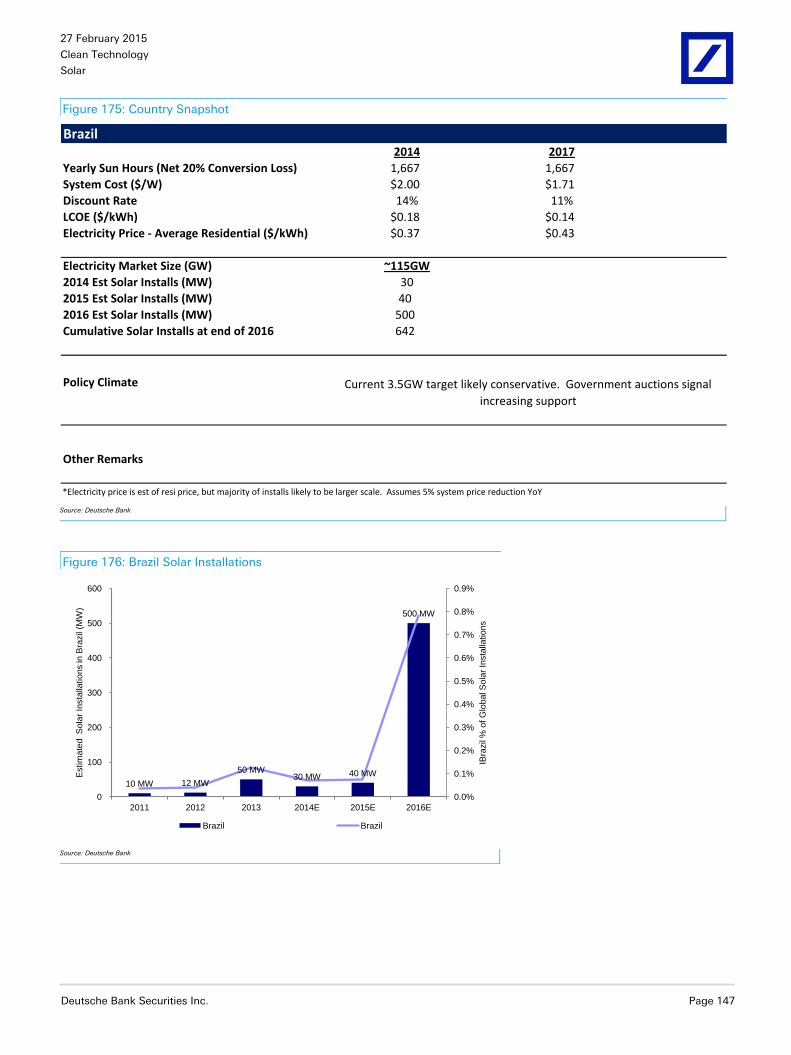
27 February 2015
Clean Technology
Solar
Deutsche Bank Securities Inc. Page 147
Figure 175: Country Snapshot
Brazil2014 2017
Yearly Sun Hours (Net 20% Conversion Loss) 1,667 1,667
System Cost ($/W) $2.00 $1.71
Discount Rate 14% 11%
LCOE ($/kWh) $0.18 $0.14
Electricity Price - Average Residential ($/kWh) $0.37 $0.43
Electricity Market Size (GW) ~115GW
2014 Est Solar Installs (MW) 30
2015 Est Solar Installs (MW) 40
2016 Est Solar Installs (MW) 500
Cumulative Solar Installs at end of 2016 642
Policy Climate Current 3.5GW target likely conservative. Government auctions signal
increasing support
Other Remarks
*Electricity price is est of resi price, but majority of installs likely to be larger scale. Assumes 5% system price reduction YoY Source: Deutsche Bank
Figure 176: Brazil Solar Installations
10 MW 12 MW
50 MW30 MW 40 MW
500 MW
0.0%
0.1%
0.2%
0.3%
0.4%
0.5%
0.6%
0.7%
0.8%
0.9%
0
100
200
300
400
500
600
2011 2012 2013 2014E 2015E 2016E
IBra
zil
% o
f G
lobal S
ola
r In
sta
llations
Estim
ate
d S
ola
r In
sta
llations in
Bra
zil
(MW
)
Brazil Brazil
Source: Deutsche Bank

27 February 2015
Clean Technology
Solar
Page 148 Deutsche Bank Securities Inc.
Canada
As we have seen in Germany and the UK, countries with modest solar
resources can still be major solar hubs under friendly policy environments and
falling installation costs. In 2010 the cost of solar electricity was ~$300-410
per MwH, while our current cost estimate of ~$200/MwH has already reached
previous industry estimates of ~$146-200/MwH by 2025.
Residential electricity prices in Canada range between 8-16 cents/kwh, and we
believe that prices could reach grid parity by the ~2017-18 timeframe using
conservative assumptions. In higher electricity regions, we could see grid
parity even sooner.
Figure 177: Canada LCOE Scenario Analysis
$0.04
$0.06
$0.08
$0.10
$0.12
$0.14
$0.16
$0.18
$0.20
$0.22
20
14
20
15
20
16
20
17
20
18
20
19
20
20
20
21
LCOE
Electricity Price (7% YoY)
Electricity Price (5% YoY)
Electricity Price (3% YoY)
Source: Deutsche Bank
Over the past 8 years, the cost of electricity in Ontario has increased at an
average ~6%+ CAGR, and we expect Canadian electricity prices will continue
to increase over the longer term as demand increases
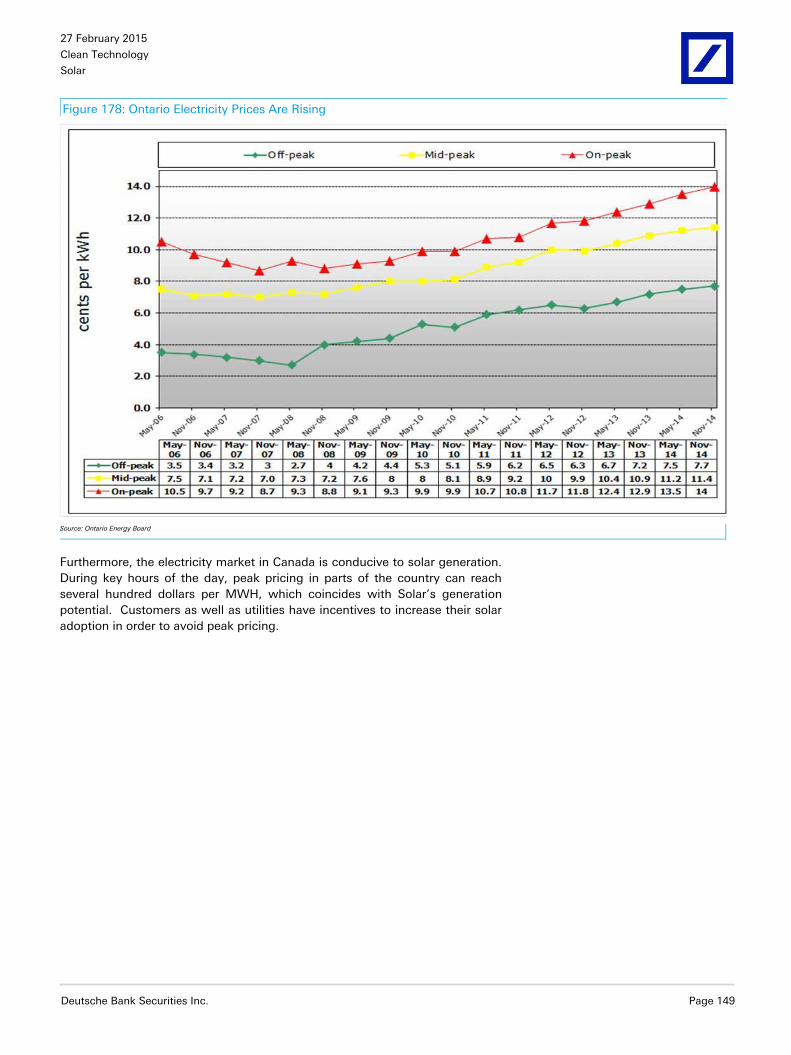
27 February 2015
Clean Technology
Solar
Deutsche Bank Securities Inc. Page 149
Figure 178: Ontario Electricity Prices Are Rising
Source: Ontario Energy Board
Furthermore, the electricity market in Canada is conducive to solar generation.
During key hours of the day, peak pricing in parts of the country can reach
several hundred dollars per MWH, which coincides with Solar’s generation
potential. Customers as well as utilities have incentives to increase their solar
adoption in order to avoid peak pricing.

27 February 2015
Clean Technology
Solar
Page 150 Deutsche Bank Securities Inc.
Figure 179: Peak Electricity Cost
Source: Earnst and Young Via the Canadian Solar Industries Association
Solar currently accounts for almost no generation in the country, and the
ongoing dependence on hydro indicates that there are opportunities for solar
to continue to gain share as utilities diversify and invest in peak load balancing.
Figure 180: Electricity Source
Source: Statistics Canada
Ontario and Quebec produce over half of the available electricity in the
country, and we see the greatest potential for solar adoption in these regions –
particularly Ontario given the friendly policy environment.

27 February 2015
Clean Technology
Solar
Deutsche Bank Securities Inc. Page 151
Figure 181: Generation by Region in Canada
Source: Statistics Canada, Electric Power and Generation - Annual (CANSIM 127-0007), 2013. Retrieved 25 May 2014, Canadian Electricity Association
Since we are not currently at grid parity in Canada, we expect important solar-
friendly policies such as the Ontario feed in tariff should help fuel further
investment in the country. While FiT’s have provided attractive project returns
(high teens or better, in many cases) which have caused large Canadian
companies like TransCanada to invest in the business, we expect a transition
to net metering in the future would help avoid a boom-bust cycle as the
economics continue to improve.
Current Policies The Ontario Power Authority (OPA) administers FIT Program, which is open to
projects with nameplate capacity between 10kW-500kW. For small projects
(<10kW), OPA implemented a microFIT Program; while for those >500kW,
OPA is developing a new procurement process called Large Renewable
Procurement (LRP). The current FiT pricing by project size is shown in the table
below.
Figure 182: Ontario FiT (effective Sep 30, 2014 for FIT and Jan 1, 2015 for
microFIT)
Project Size*
FiT Price (CAD$
c/kwh)
FiT Price (~US$
c/kwh)
≤ 10 kW 38.4 34.1
>10 ≤ 100 kW 34.3 30.5
> 100 kW ≤ 500 kW 31.6 28.1
≤ 10 kW 28.9 25.7
> 10 kW ≤ 500 kW 27.5 24.4
Solar (PV)
(Rooftop)
Solar (PV)
(Non-Rooftop)
Source: Deutsche Bank, OPA, * The FiT Program is available to Small FIT projects (generally ≤ 500kW
Additionally, some projects are offered “price adders” to reflect higher
development and operation/ maintenance costs. The “price adder” is an
incremental increase in the price paid per kWh of electricity (paid in addition to
the contracted FiT price). Price adders are available to projects that have a
minimum15% participation level from municipalities, public sector entities,
communities, or Aboriginal groups. These are not applicable for rooftop PV
projects.

27 February 2015
Clean Technology
Solar
Page 152 Deutsche Bank Securities Inc.
Figure 183: Ontario FiT Price Adders
CAD$ c/kWh ~US$ c/kWh CAD$ c/kWh ~US$ c/kWh
Maximum Aboriginal
Price Adder 0.8 0.7 1.5 1.4
Maximum Community
Price Adder 0.5 0.5 1.0 0.9
Maximum Municipal or
Public Sector Entity Price
Adder 0.5 0.5 1.0 0.9
>50% Participation15-50% Participation
Equity Participation
Source: Deutsche Bank, OPA, *not applicable for PV rooftop projects
The Large Renewable Procurement (LRP) is a competitive process for
procuring renewable energy projects >500 kW in capacity. The LRP is currently
in the Request for Qualifications (RFQ) stage. Evaluation of specific large
renewable projects will occur at the Request for Proposals (RFP) stage,
wherein only qualified applicants who have met the requirements of the RFQ
may submit proposals. After the RFP stage, OPA may award contracts for
successful projects up to specified procurement targets for each renewable
fuel (140MW for solar).
Outlook for 2014/15
As of 1Q14, OPA was managing 2.1GW of combined capacity from solar PV
projects – of which ~1.2GW is in commercial operation and 998MW under
development. All projects that are under development are scheduled to be in-
service before the end of 2017. We expect annual installations in Canada to
increase marginally over the next few years.

27 February 2015
Clean Technology
Solar
Deutsche Bank Securities Inc. Page 153
Figure 184: Country Snapshot
Canada2014 2017
Yearly Sun Hours (Net 20% Conversion Loss) 1,000 1,000
System Cost ($/W) $2.00 $1.71
Discount Rate 5% 5%
LCOE ($/kWh) $0.18 $0.16
Electricity Price - Average Residential ($/kWh) $0.13 $0.14
Electricity Market Size (GW) ~140GW
2014 Est Solar Installs (MW) 533
2015 Est Solar Installs (MW) 586
2016 Est Solar Installs (MW) 586
Cumulative Solar Installs at end of 2016 3,012
Policy ClimateOntario has a FIT Program for 10kW-500kW systems and a microFIT
Program for <10kW systems. OPA is also developingnew procurement
process called Large Renewable Procurement (LRP) for >500kW systems.
Other Remarks
*Electricity price is est of resi price, but majority of installs likely to be larger scale. Assumes 5% system price reduction YoY Source: Deutsche Bank
Figure 185: Canada Solar Installations
297 MW268 MW
444 MW
533 MW
586 MW 586 MW
0.0%
0.2%
0.4%
0.6%
0.8%
1.0%
1.2%
1.4%
0
100
200
300
400
500
600
700
2011 2012 2013 2014E 2015E 2016E
Canada %
of G
lobal S
ola
r In
sta
llatio
ns
Estim
ate
d S
ola
r In
sta
llatio
ns in C
anada (
MW
)
Canada Canada
Source: Deutsche Bank, OPA

27 February 2015
Clean Technology
Solar
Page 154 Deutsche Bank Securities Inc.
Thailand
Although the Thai government is not as stable as other countries we’ve
profiled, it is still emerging as an attractive market for growth. The govt is
attempting to cut reliance on energy imports (mostly oil and natural gas),
which account for almost 50% of the country’s primary energy supply. During
Q1’14, renewable accounted for ~14% of the primary energy supply and ~18%
of the final energy consumption.
Figure 186: Thailand – Final Energy Consumption – Q1’14
49%
18%
7%
7%
18%
Petrolium Products Electricity* Coal & its Products
Natural Gas Renewable Energy
Source: Deutsche Bank, DEDE, *Including off grid power generation
Under its Alternative Energy Development Plan 2012-2021, the govt has set a
25% renewable target by 2021 (or ~14GW renewable capacity).
Figure 187: Renewable Deployment vs. Target
As of Q1'14 2021 Target
Solar 961 3000
Wind 223 1800
Small Hydro Power 112 324
Biomass 2351 4800
Biogas 275 3600
MSW 47 400
New Energy 0 3 Source: Deutsche Bank, DEDE
Not Quite at Grid Parity
Although the country has generally good solar resources, low electricity prices
make grid parity difficult. Our current est of ~$0.13/kwh will likely approach
lower electricity prices within the next few years, however.

27 February 2015
Clean Technology
Solar
Deutsche Bank Securities Inc. Page 155
Figure 188: Thailand Solar Resources (Horizontal Radiance)
Source: SolarGIS © 2014 GeoModel Solar

27 February 2015
Clean Technology
Solar
Page 156 Deutsche Bank Securities Inc.
Figure 189: Thailand LCOE Scenario Analysis
$0.04
$0.06
$0.08
$0.10
$0.12
$0.14
$0.16
$0.18
2014
2015
2016
2017
2018
2019
2020
2021
LCOE
Electricity Price (7% YoY)
Electricity Price (5% YoY)
Electricity Price (3% YoY)
Source: Deutsche Bank
Current Policies and History
In July 2013, Thailand’s government increased its target for solar installations
to 3GW by 2021 (from 2GW previously). While the original 2GW target was to
be achieved only from large scale solar (from a policy initiated in 2006), the
incremental 1GW will be achieved by two new programs, mentioned below.
Solar Rooftop Program (200MW): In 2013, the government announced that the rooftop program would have a quota/target of 200MW (see details in figure below) and all the systems were required to start commercial operations by 31 Dec 2013. These systems will be eligible for feed-in tariffs for a period of 25 years. Although the country was able to achieve the quota of commercial projects (100MW), it only achieved 30MW of residential rooftop installations at the time. Thai National Energy Policy Commission (NEPC) recently announced that 70MW of residential rooftop capacity will be opened up for applications receiving a FiT rate of 6.85 Baht/kWh for 25 years.
Figure 190: Rooftop FiT and Quota
Classification Scale Quota FiT (baht/kWh) FiT ($/kWh)
Residential 0-10kW 100MW 6.96 0.22
Small and Medium Commercial >10-250kW 6.55 0.20
Medium and Large Commercial >250kW-MW 6.16 0.19
* This is for systems that were required to start operations by Dec 2013
100MW
Source: Deutsche Bank, DEDE
Community-based Ground-mounted Systems (800MW): The second program announced by the government is designed to utilize a special feed-in tariff for community-based ground-mounted solar systems with a quota/target of 800MW, and a minimum project size of ~1MW. Projects were required to start commercial operations by 31 Dec 2014. It is expected that ~60 villages would need to cooperate to provide the equity share of 15M Thai Baht for one project, while the debt share (estimated at ~45M Thai Baht) shall come from two national banks –
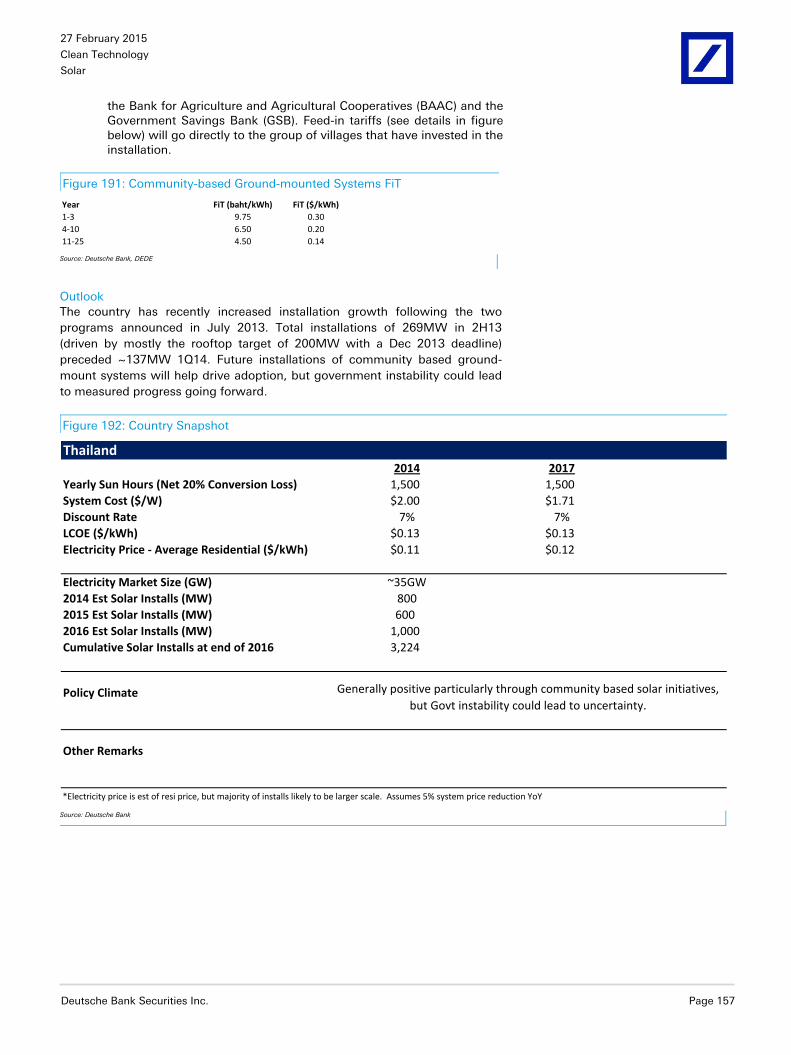
27 February 2015
Clean Technology
Solar
Deutsche Bank Securities Inc. Page 157
the Bank for Agriculture and Agricultural Cooperatives (BAAC) and the Government Savings Bank (GSB). Feed-in tariffs (see details in figure below) will go directly to the group of villages that have invested in the installation.
Figure 191: Community-based Ground-mounted Systems FiT
Year FiT (baht/kWh) FiT ($/kWh)
1-3 9.75 0.30
4-10 6.50 0.20
11-25 4.50 0.14 Source: Deutsche Bank, DEDE
Outlook
The country has recently increased installation growth following the two
programs announced in July 2013. Total installations of 269MW in 2H13
(driven by mostly the rooftop target of 200MW with a Dec 2013 deadline)
preceded ~137MW 1Q14. Future installations of community based ground-
mount systems will help drive adoption, but government instability could lead
to measured progress going forward.
Figure 192: Country Snapshot
Thailand2014 2017
Yearly Sun Hours (Net 20% Conversion Loss) 1,500 1,500
System Cost ($/W) $2.00 $1.71
Discount Rate 7% 7%
LCOE ($/kWh) $0.13 $0.13
Electricity Price - Average Residential ($/kWh) $0.11 $0.12
Electricity Market Size (GW) ~35GW
2014 Est Solar Installs (MW) 800
2015 Est Solar Installs (MW) 600
2016 Est Solar Installs (MW) 1,000
Cumulative Solar Installs at end of 2016 3,224
Policy Climate Generally positive particularly through community based solar initiatives,
but Govt instability could lead to uncertainty.
Other Remarks
*Electricity price is est of resi price, but majority of installs likely to be larger scale. Assumes 5% system price reduction YoY Source: Deutsche Bank

27 February 2015
Clean Technology
Solar
Page 158 Deutsche Bank Securities Inc.
Figure 193: Thailand Solar Installations
79 MW
298 MW
447 MW
800 MW
600 MW
1,000 MW
0.0%
0.2%
0.4%
0.6%
0.8%
1.0%
1.2%
1.4%
1.6%
1.8%
2.0%
0
200
400
600
800
1,000
1,200
2011 2012 2013 2014E 2015E 2016E
Thaila
nd %
of G
lobal S
ola
r In
sta
llations
Estim
ate
d S
ola
r In
sta
llations in
Thaila
nd (
MW
)
Thailand Thailand
Source: Deutsche Bank, DEDE, *2011 number is cumulative installations until 2011

27 February 2015
Clean Technology
Solar
Deutsche Bank Securities Inc. Page 159
Saudi Arabia
Saudi Arabia has one of the highest insolation levels in the world and a
substantial open desert area. However, government subsidization, rising
domestic energy use, and population shifts/increases are making ongoing oil
use for electricity increasingly difficult. For long term resource planning, we
expect the Saudi Government to begin implementing national solar installation
goals which could likely ramp in conjunction with other forms of renewable
additions.
Figure 194: Middle East Solar Resources (Horizontal Radiance)
Source: SolarGIS © 2014 GeoModel Solar
Retail price of electricity in Saudi Arabia ranges from roughly ~$0.01/kWh to
~$0.07/kWh due to ~70%+ government subsidization. While this makes purely
economic competitiveness unlikely in the near term, we believe LCOE could
reach as low as low to mid single digit cents per kwh.
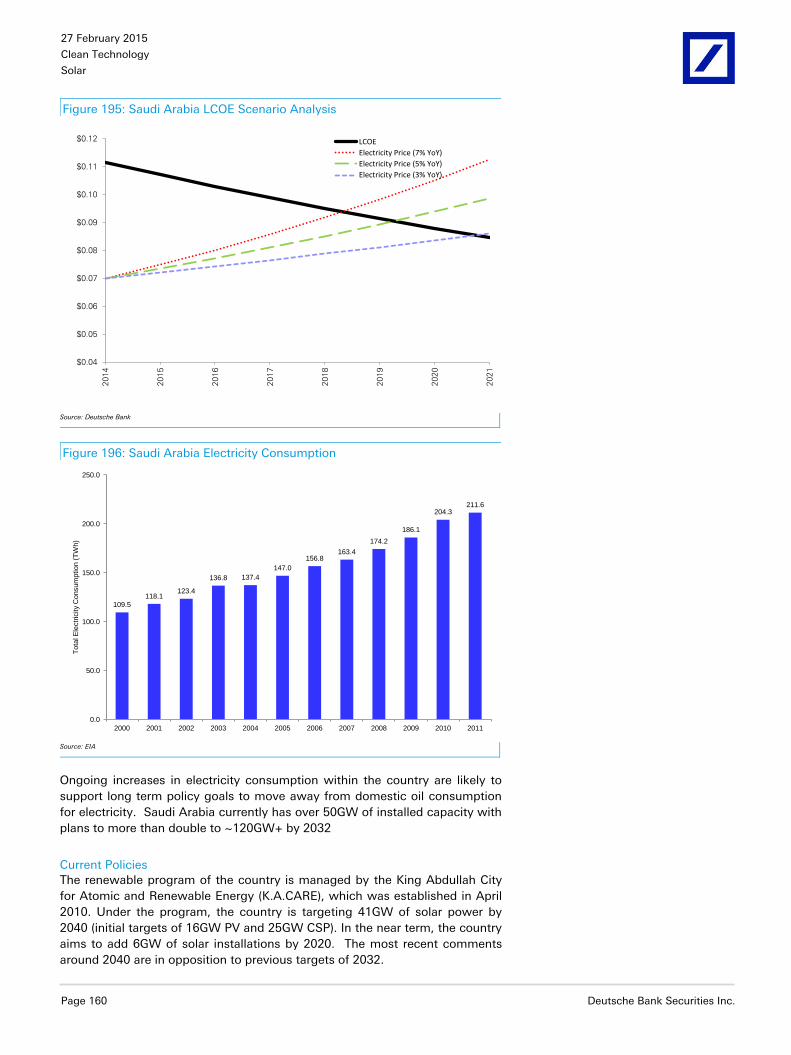
27 February 2015
Clean Technology
Solar
Page 160 Deutsche Bank Securities Inc.
Figure 195: Saudi Arabia LCOE Scenario Analysis
$0.04
$0.05
$0.06
$0.07
$0.08
$0.09
$0.10
$0.11
$0.12
2014
2015
2016
2017
2018
2019
2020
2021
LCOE
Electricity Price (7% YoY)
Electricity Price (5% YoY)
Electricity Price (3% YoY)
Source: Deutsche Bank
Figure 196: Saudi Arabia Electricity Consumption
109.5
118.1123.4
136.8 137.4
147.0
156.8163.4
174.2
186.1
204.3211.6
0.0
50.0
100.0
150.0
200.0
250.0
2000 2001 2002 2003 2004 2005 2006 2007 2008 2009 2010 2011
To
tal E
lectr
icity C
onsum
ptio
n (
TW
h)
Source: EIA
Ongoing increases in electricity consumption within the country are likely to
support long term policy goals to move away from domestic oil consumption
for electricity. Saudi Arabia currently has over 50GW of installed capacity with
plans to more than double to ~120GW+ by 2032
Current Policies
The renewable program of the country is managed by the King Abdullah City
for Atomic and Renewable Energy (K.A.CARE), which was established in April
2010. Under the program, the country is targeting 41GW of solar power by
2040 (initial targets of 16GW PV and 25GW CSP). In the near term, the country
aims to add 6GW of solar installations by 2020. The most recent comments
around 2040 are in opposition to previous targets of 2032.

27 February 2015
Clean Technology
Solar
Deutsche Bank Securities Inc. Page 161
In early 2014, Saudi Aramco announced that it plans to look into solar
investments with a greater interest. Additionally, Chinese National Nuclear
Corporation (CNNC) has also signed a partnership agreement with K.A.CARE
to cooperate on the development of renewable and nuclear energy in the
country.
Outlook
The Middle East Solar Industry Association (MESIA), has recently claimed that
Saudi Arabia will launch 700-1000MW, which could mark the beginning of a
larger scale deployment but timing is uncertain. Given the recent push out of
targets, this may be more of a longer term target. Currently, the country has
~20MW of solar installed capacity but we may start to see the state owned
companies explore additional options in the short to medium term.
Figure 197: Country Snapshot
Saudi Arabia2014 2017
Yearly Sun Hours (Net 20% Conversion Loss) 1,833 1,833
System Cost ($/W) $2.00 $1.71
Discount Rate 7% 7%
LCOE ($/kWh) $0.11 $0.09
Electricity Price - Average Residential ($/kWh) $0.07 $0.08
Electricity Market Size (GW) ~51GW
2014 Est Solar Installs (MW) 50
2015 Est Solar Installs (MW) 300
2016 Est Solar Installs (MW) 600
Cumulative Solar Installs at end of 2016 950
Policy Climate
Other Remarks
Targets have been pushed out from 2032 to 2040, but recent leadership
transition could open up the country to further changes
Source: Deutsche Bank
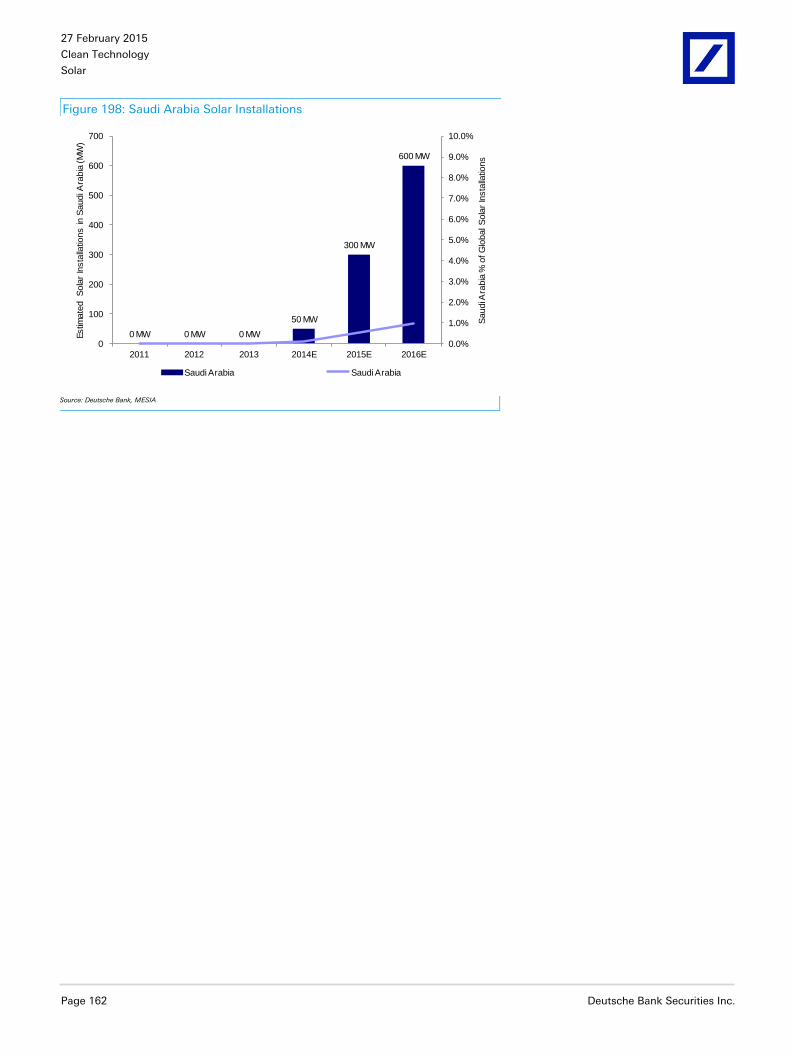
27 February 2015
Clean Technology
Solar
Page 162 Deutsche Bank Securities Inc.
Figure 198: Saudi Arabia Solar Installations
0 MW 0 MW 0 MW
50 MW
300 MW
600 MW
0.0%
1.0%
2.0%
3.0%
4.0%
5.0%
6.0%
7.0%
8.0%
9.0%
10.0%
0
100
200
300
400
500
600
700
2011 2012 2013 2014E 2015E 2016E
Saudi A
rabia
% o
f G
lobal S
ola
r In
sta
llatio
ns
Estim
ate
d S
ola
r In
sta
llatio
ns in S
audi A
rabia
(M
W)
Saudi Arabia Saudi Arabia
Source: Deutsche Bank, MESIA

27 February 2015
Clean Technology
Solar
Deutsche Bank Securities Inc. Page 163
Key Markets: <500MW
Italy
Retroactive FiT Cuts/ Tax on Self-consumed Solar Power Jeopardize Outlook
After discontinuing FiT for new solar installations (from July 2013), Italian
parliament has now approved retroactive FiT cuts and new taxes for self-
consumed solar electricity. We believe retroactive cuts are likely to deter new
investments in the country, which could significantly slowdown the pace of
new installations, particularly large-scale systems. Installations reached only
~1.2GW in 2013 (vs. ~3.6GW in 2012), and have slowed down further in 2014
– with only ~89MW installed under the subsidization program in the first seven
months. Some of the more dire predictions suggest that there will be a large
number of solar arrays put up for sale or foreclosed on due to the retroactive
cuts.
However, Expansion of Net Metering Policy Likely to Drive DG Installs
In a positive move for the industry, the Italian parliament has approved
expansion in the net metering policy, which raises the limit from
200kW/installation to 500kW to be eligible for net metering. From Jan- July
2014, 53% of the new installations were sub 200kW systems, which indicates
net metering is helping. Future installs in the sub 500kW range should be more
attractive.
Figure 199:PV Installation Mix (Tracked Systems)
0%
10%
20%
30%
40%
50%
60%
70%
80%
90%
100%
2006 2007 2008 2009 2010 2011 2012 2013 2014
1-3kW 3-20kW 20-200kW 200kW-1MW 1-5MW >5MW
Source: Deutsche Bank, GSE, 2014 mix is from Jan-Jul, 2014
Due to high electricity prices and solid solar fundamentals, we expect Italy has
already reached grid parity for non-utility scale systems.
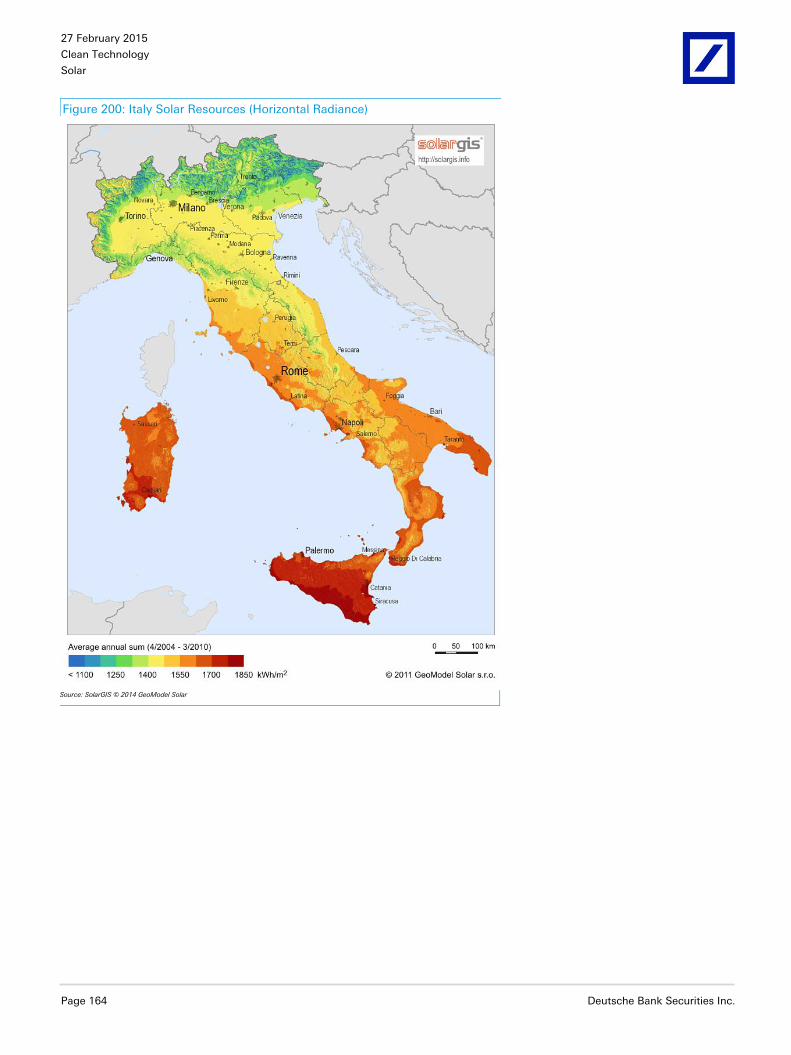
27 February 2015
Clean Technology
Solar
Page 164 Deutsche Bank Securities Inc.
Figure 200: Italy Solar Resources (Horizontal Radiance)
Source: SolarGIS © 2014 GeoModel Solar

27 February 2015
Clean Technology
Solar
Deutsche Bank Securities Inc. Page 165
Figure 201: Italy LCOE Scenario Analysis
$0.04
$0.09
$0.14
$0.19
$0.24
$0.29
$0.34
$0.39
$0.44
$0.49
$0.54
2014
2015
2016
2017
2018
2019
2020
2021
LCOE
Electricity Price (7% YoY)
Electricity Price (5% YoY)
Electricity Price (3% YoY)
Source: Deutsche Bank
Current Policies
In August 2014 the Italian Parliament approved a decree that retroactively cut
FiTs for PV plants larger than 200kW. Otherwise, state company Gestore
Servizi Energetici (GSE) pays a fixed rate to PV plant operators for 20 years, but
recent retroactive cuts have targeted changes. Under the new law, existing
solar power generators have three options – 1) voluntarily accept a flat
reduction of 6-9% in the tariff, depending on the size of the system; 2) accept a
bigger cut in FiT rates by 2019 and receive higher rates as compensation after
that; and 3) extend their existing FiT contracts from 20 to 24 years and see the
rate fall by 17-25%. The new law will also see GSE pay a fixed monthly
payment of only 90% of the plant’s estimated annual electricity production, the
remaining 10% will be paid up in full in June of the following year. The
parliament also decided to raise the upper limit for net metering in the country
from 200kW to 500kW per installation. We believe this move will drive rooftop
installations in the country.
Outlook
Negative policy shifts are a headwind for large scale installations, but we
expect to see more DG installs given the shifts towards larger net metered
systems.
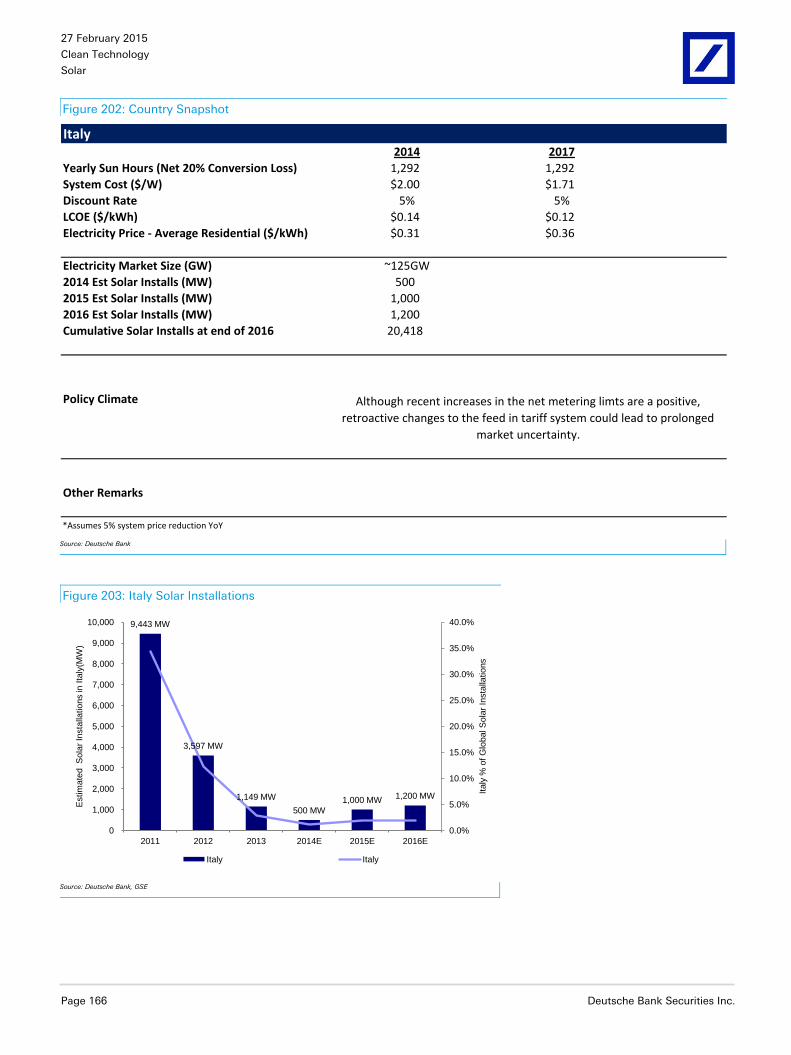
27 February 2015
Clean Technology
Solar
Page 166 Deutsche Bank Securities Inc.
Figure 202: Country Snapshot
Italy2014 2017
Yearly Sun Hours (Net 20% Conversion Loss) 1,292 1,292
System Cost ($/W) $2.00 $1.71
Discount Rate 5% 5%
LCOE ($/kWh) $0.14 $0.12
Electricity Price - Average Residential ($/kWh) $0.31 $0.36
Electricity Market Size (GW) ~125GW
2014 Est Solar Installs (MW) 500
2015 Est Solar Installs (MW) 1,000
2016 Est Solar Installs (MW) 1,200
Cumulative Solar Installs at end of 2016 20,418
Policy Climate Although recent increases in the net metering limts are a positive,
retroactive changes to the feed in tariff system could lead to prolonged
market uncertainty.
Other Remarks
*Assumes 5% system price reduction YoY Source: Deutsche Bank
Figure 203: Italy Solar Installations
9,443 MW
3,597 MW
1,149 MW
500 MW
1,000 MW1,200 MW
0.0%
5.0%
10.0%
15.0%
20.0%
25.0%
30.0%
35.0%
40.0%
0
1,000
2,000
3,000
4,000
5,000
6,000
7,000
8,000
9,000
10,000
2011 2012 2013 2014E 2015E 2016E
Italy
% o
f G
lobal S
ola
r In
sta
llations
Estim
ate
d S
ola
r In
sta
llations in
Ita
ly(M
W)
Italy Italy
Source: Deutsche Bank, GSE
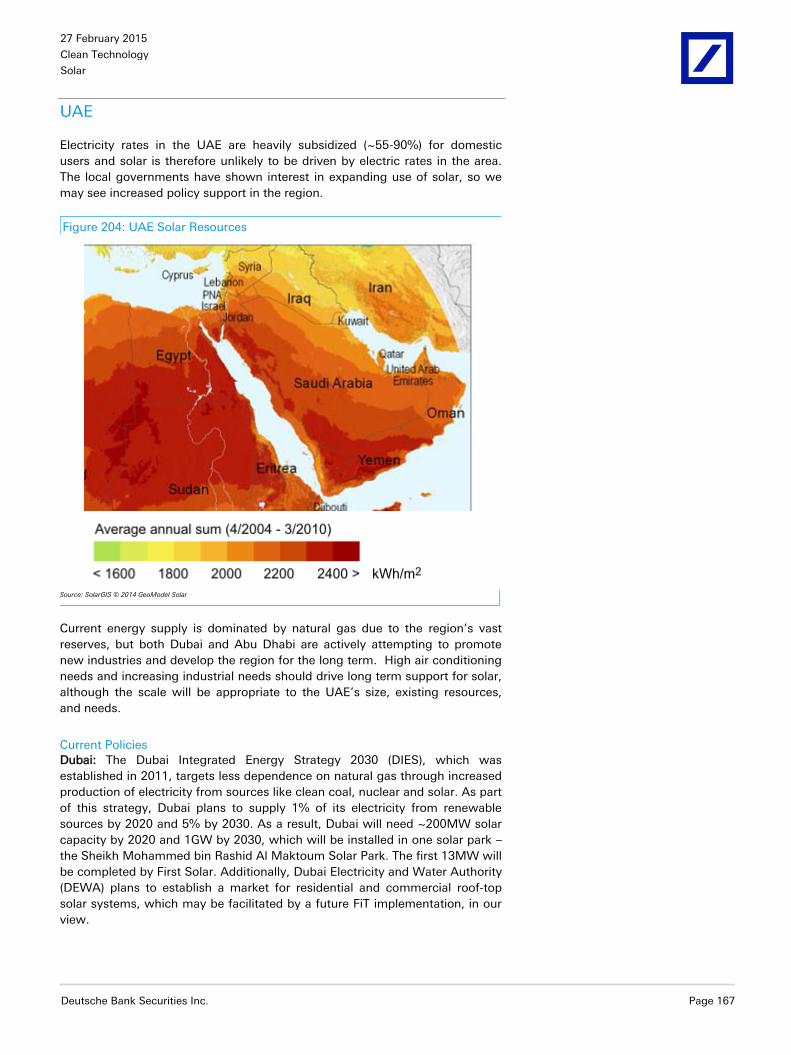
27 February 2015
Clean Technology
Solar
Deutsche Bank Securities Inc. Page 167
UAE
Electricity rates in the UAE are heavily subsidized (~55-90%) for domestic
users and solar is therefore unlikely to be driven by electric rates in the area.
The local governments have shown interest in expanding use of solar, so we
may see increased policy support in the region.
Figure 204: UAE Solar Resources
Source: SolarGIS © 2014 GeoModel Solar
Current energy supply is dominated by natural gas due to the region’s vast
reserves, but both Dubai and Abu Dhabi are actively attempting to promote
new industries and develop the region for the long term. High air conditioning
needs and increasing industrial needs should drive long term support for solar,
although the scale will be appropriate to the UAE’s size, existing resources,
and needs.
Current Policies
Dubai: The Dubai Integrated Energy Strategy 2030 (DIES), which was
established in 2011, targets less dependence on natural gas through increased
production of electricity from sources like clean coal, nuclear and solar. As part
of this strategy, Dubai plans to supply 1% of its electricity from renewable
sources by 2020 and 5% by 2030. As a result, Dubai will need ~200MW solar
capacity by 2020 and 1GW by 2030, which will be installed in one solar park –
the Sheikh Mohammed bin Rashid Al Maktoum Solar Park. The first 13MW will
be completed by First Solar. Additionally, Dubai Electricity and Water Authority
(DEWA) plans to establish a market for residential and commercial roof-top
solar systems, which may be facilitated by a future FiT implementation, in our
view.

27 February 2015
Clean Technology
Solar
Page 168 Deutsche Bank Securities Inc.
Abu Dhabi: Abu Dhabi is targeting 7% of its energy from renewables by 2020.
Abu Dhabi has also set up Masdar, a green-energy firm (also known as Abu
Dhabi Future Energy Company) which is investing in a number of renewable
energy projects in the UAE. In 2013, Masdar, in partnership with Total and
Abengoa, launched the 100MW CSP plant Shams 1 in Abu Dhabi. Currently,
Masdar is awaiting approval for its Noor 1 PV plant that has a capacity of
100MW. In the future, Masdar also plans Noor 2 that will have a capacity of
100-200MW. Moreover, energy regulators in Abu Dhabi have announced that
they will submit a proposal to develop a 500MW solar rooftop scheme to the
Executive Council in 2014.
Outlook
Currently, the UAE has ~20MW capacity installed, but we believe installs could
begin to ramp as Dubai and Abu Dhabi move to diversify their electricity
generation.
Figure 205: Country Snapshot
UAE2014 2017
Yearly Sun Hours (Net 20% Conversion Loss) 2,083 2,083
System Cost ($/W) $2.50 $2.14
Discount Rate 7% 7%
LCOE ($/kWh) $0.12 $0.10
Electricity Price - Average Residential ($/kWh) $0.08 $0.10
Electricity Market Size (GW) ~25GW
2014 Est Solar Installs (MW) 50
2015 Est Solar Installs (MW) 100
2016 Est Solar Installs (MW) 150
Cumulative Solar Installs at end of 2016 320
Policy Climate
Dubai plans to supply 1% of its electricity from renewable sources by 2020
and 5% by 2030; while Abu Dhabi is targeting 7% of its energy from
renewables by 2020
Other Remarks
*Electricity price is est of resi price, but majority of installs likely to be larger scale. Assumes 5% system price reduction YoY
Source: Deutsche Bank

27 February 2015
Clean Technology
Solar
Deutsche Bank Securities Inc. Page 169
Figure 206: UAE LCOE Scenario Analysis
$0.04
$0.05
$0.06
$0.07
$0.08
$0.09
$0.10
$0.11
$0.12
$0.13
$0.14
2014
2015
2016
2017
2018
2019
2020
2021
LCOE
Electricity Price (7% YoY)
Electricity Price (5% YoY)
Electricity Price (3% YoY)
Source: Deutsche Bank
Figure 207: UAE Solar Installations
0 MW 0 MW
20 MW
50 MW
100 MW
150 MW
0.0%
0.1%
0.1%
0.2%
0.2%
0.3%
0
20
40
60
80
100
120
140
160
2011 2012 2013 2014E 2015E 2016E
UA
E %
of G
lobal S
ola
r In
sta
llatio
ns
Estim
ate
d S
ola
r In
sta
llatio
ns in U
AE (
MW
)
UAE UAE
Source: Deutsche Bank
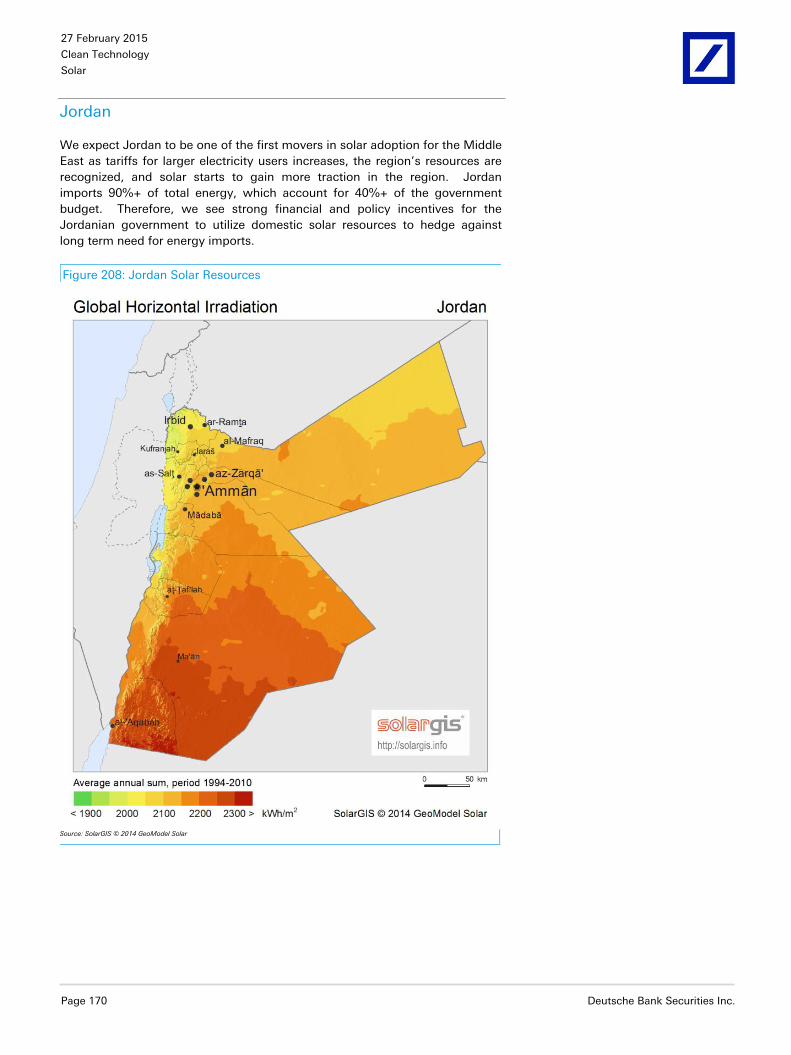
27 February 2015
Clean Technology
Solar
Page 170 Deutsche Bank Securities Inc.
Jordan
We expect Jordan to be one of the first movers in solar adoption for the Middle
East as tariffs for larger electricity users increases, the region’s resources are
recognized, and solar starts to gain more traction in the region. Jordan
imports 90%+ of total energy, which account for 40%+ of the government
budget. Therefore, we see strong financial and policy incentives for the
Jordanian government to utilize domestic solar resources to hedge against
long term need for energy imports.
Figure 208: Jordan Solar Resources
Source: SolarGIS © 2014 GeoModel Solar
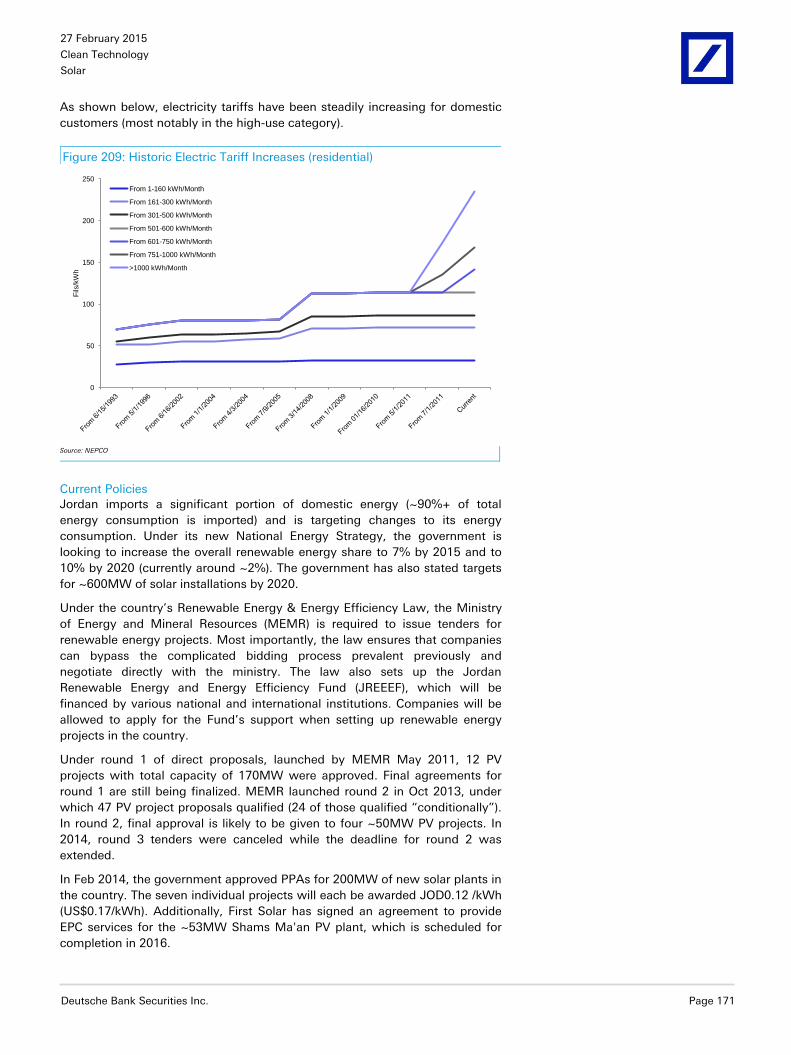
27 February 2015
Clean Technology
Solar
Deutsche Bank Securities Inc. Page 171
As shown below, electricity tariffs have been steadily increasing for domestic
customers (most notably in the high-use category).
Figure 209: Historic Electric Tariff Increases (residential)
0
50
100
150
200
250
Fils
/kW
h
From 1-160 kWh/Month
From 161-300 kWh/Month
From 301-500 kWh/Month
From 501-600 kWh/Month
From 601-750 kWh/Month
From 751-1000 kWh/Month
>1000 kWh/Month
Source: NEPCO
Current Policies
Jordan imports a significant portion of domestic energy (~90%+ of total
energy consumption is imported) and is targeting changes to its energy
consumption. Under its new National Energy Strategy, the government is
looking to increase the overall renewable energy share to 7% by 2015 and to
10% by 2020 (currently around ~2%). The government has also stated targets
for ~600MW of solar installations by 2020.
Under the country’s Renewable Energy & Energy Efficiency Law, the Ministry
of Energy and Mineral Resources (MEMR) is required to issue tenders for
renewable energy projects. Most importantly, the law ensures that companies
can bypass the complicated bidding process prevalent previously and
negotiate directly with the ministry. The law also sets up the Jordan
Renewable Energy and Energy Efficiency Fund (JREEEF), which will be
financed by various national and international institutions. Companies will be
allowed to apply for the Fund’s support when setting up renewable energy
projects in the country.
Under round 1 of direct proposals, launched by MEMR May 2011, 12 PV
projects with total capacity of 170MW were approved. Final agreements for
round 1 are still being finalized. MEMR launched round 2 in Oct 2013, under
which 47 PV project proposals qualified (24 of those qualified “conditionally”).
In round 2, final approval is likely to be given to four ~50MW PV projects. In
2014, round 3 tenders were canceled while the deadline for round 2 was
extended.
In Feb 2014, the government approved PPAs for 200MW of new solar plants in
the country. The seven individual projects will each be awarded JOD0.12 /kWh
(US$0.17/kWh). Additionally, First Solar has signed an agreement to provide
EPC services for the ~53MW Shams Ma'an PV plant, which is scheduled for
completion in 2016.

27 February 2015
Clean Technology
Solar
Page 172 Deutsche Bank Securities Inc.
Outlook
Given the relatively successful direct rounds of bidding coupled with high
electricity prices and several high profile developers entering the market, we
expect Jordan could be one of the first notable solar markets in the Middle
East. However, given the relatively small market size, absolute installs may not
exceed a several hundred MW run rate in the short-medium term
Figure 210: Country Snapshot
Jordan2014 2017
Yearly Sun Hours (Net 20% Conversion Loss) 1,917 1,917
System Cost ($/W) $2.50 $2.14
Discount Rate 7% 7%
LCOE ($/kWh) $0.13 $0.11
Electricity Price - Average Residential ($/kWh) $0.35 $0.41
Electricity Market Size (GW) ~3GW
2014 Est Solar Installs (MW) 80
2015 Est Solar Installs (MW) 150
2016 Est Solar Installs (MW) 150
Cumulative Solar Installs at end of 2016 765
Policy Climate
Jordan imports ~96% of its domestic energy, and is targeting changes to its
energy consumption. The country aims to increase the overall renewable
energy share in the energy mix to 7% by 2015 and to 10% by 2020 (vs. ~2%
currently). The govt aims to have 600MW of solar installations by 2020.
Other Remarks
*Electricity price is est of resi price, but majority of installs likely to be larger scale. Assumes 5% system price reduction YoY Source: Deutsche Bank

27 February 2015
Clean Technology
Solar
Deutsche Bank Securities Inc. Page 173
Figure 211: Jordan Solar Installations
0 MW 2 MW
60 MW
80 MW
150 MW 150 MW
0.0%
0.1%
0.1%
0.2%
0.2%
0.3%
0.3%
0
20
40
60
80
100
120
140
160
2011 2012 2013 2014E 2015E 2016E
Jord
an %
of G
lobal S
ola
r In
sta
llatio
ns
Estim
ate
d S
ola
r In
sta
llatio
ns in J
ord
an (M
W)
Jordan Jordan
Source: Deutsche Bank
Figure 212: Jordan LCOE Scenario Analysis
$0.04
$0.14
$0.24
$0.34
$0.44
$0.54
$0.64
20
14
20
15
20
16
20
17
20
18
20
19
20
20
20
21
LCOE
Electricity Price (7% YoY)
Electricity Price (5% YoY)
Electricity Price (3% YoY)
Source: Deutsche Bank

27 February 2015
Clean Technology
Solar
Page 174 Deutsche Bank Securities Inc.
Demand Overview
We are introducing our estimates through 2020 and tweaking estimates for
several other years. We are adjusting our 2016 and 2017 estimates from
62GW and 59GW to ~63.9GW and ~64.7GW respectively. Our 2018-2020
estimates are 72.7GW, 86.2GW, and 96.7GW.
Figure 213: Demand Overview
NEW PV INSTALLATIONS BREAKDOWN (MW)
MW 2011 2012 2013 2014E 2015E 2016E 2017E 2018E 2019E 2020E
Asia
China 2,100 3,400 12,920 10,000 13,000 13,000 13,000 14,950 16,445 18,090
y/y (%) 110% 62% 280% -23% 30% 0% 0% 15% 10% 10%
Japan 1,296 2,086 6,028 8,000 9,000 9,180 7,344 5,875 5,288 4,759
y/y (%) 31% 70% 189% 33% 13% 2% -20% -20% -10% -10%
India 190 980 1004 1,000 2,000 3,000 4,000 5,000 6,000 7,000
y/y (%) 20% 416% 2% 0% 100% 50% 33% 25% 20% 17%
Thailand 79 298 447 800 600 1,000 1,500 2,000 2,500 2,500
y/y (%) 277% 50% 79% -25% 67% 50% 33% 25% 0%
Philippines 0 2 2 250 500 1,000 1,050 1,100 1,150 1,200
y/y (%) 0% 12400% 100% 100% 5% 5% 5% 4%
Rest of Asia 1,000 2500 3,250 3,750 3,800 4,500 4,700 4,900 5,000
y/y (%) 150% 30% 15% 1% 18% 4% 4% 2%
Asia Subtotal 3,665 7,764 22,899 23,050 28,350 29,980 30,344 32,525 35,133 37,348
% of World 26% 58% 55% 52% 47% 47% 45% 41% 39%
Americas 2011 2012 2013 2014E 2015E 2016E 2017E 2018E 2019E 2020E
US 1,600 3,313 4,751 7,000 12,000 16,000 11,200 12,880 14,812 17,034
y/y (%) 82% 67% 43% 47% 71% 33% -30% 15% 15% 15%
Canada 297 268 444 533 586 586 586 586 586 586
y/y (%) 100% 20% -17% 20% 10% 0% 0% 0% 0% 0%
Mexico 7 1 70 120 250 1,500 2,000 2,000 3,000 3,000
y/y (%) -86% 6900% 71% 108% 500% 33% 0% 50% 0%
Chile 0 6 80 300 1,000 1,000 1,500 1,500 2,000 2,500
y/y (%) 1233% 275% 233% 0% 50% 0% 33% 25%
Brazil 10 12 50 30 40 500 600 700 800 850
y/y (%) 20% 317% -40% 33% 1150% 20% 17% 14% 6%
Central America 300 400 500 700 1,000 1,500 2,000
y/y (%) 33% 25% 40% 43% 50% 33%
Rest of Americas 300 1000 1,225 1,860 2,100 2,900 3,000 3,100 3,200
y/y (%) 233% 23% 52% 13% 38% 3% 3% 3%
Americas Subtotal 1,914 3,900 6,395 9,508 16,136 22,186 19,486 21,666 25,798 29,170
% of World 13% 16% 23% 29% 35% 30% 30% 30% 30% Source: Deutsche Bank
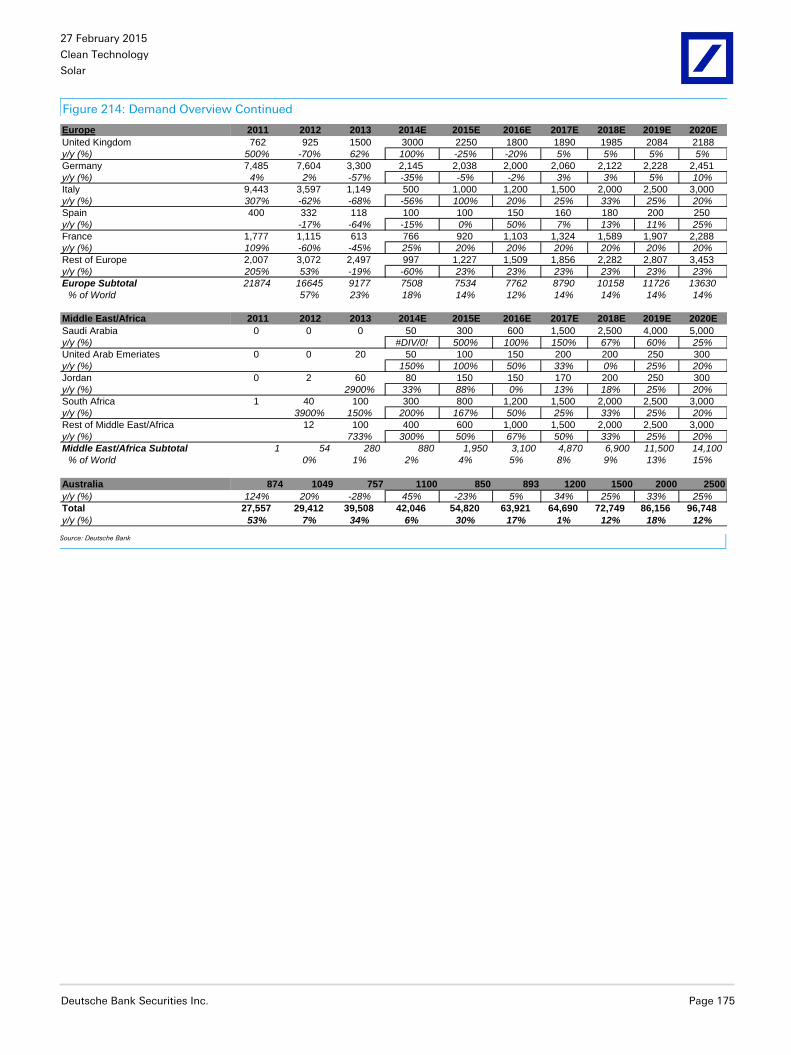
27 February 2015
Clean Technology
Solar
Deutsche Bank Securities Inc. Page 175
Figure 214: Demand Overview Continued
Europe 2011 2012 2013 2014E 2015E 2016E 2017E 2018E 2019E 2020E
United Kingdom 762 925 1500 3000 2250 1800 1890 1985 2084 2188
y/y (%) 500% -70% 62% 100% -25% -20% 5% 5% 5% 5%
Germany 7,485 7,604 3,300 2,145 2,038 2,000 2,060 2,122 2,228 2,451
y/y (%) 4% 2% -57% -35% -5% -2% 3% 3% 5% 10%
Italy 9,443 3,597 1,149 500 1,000 1,200 1,500 2,000 2,500 3,000
y/y (%) 307% -62% -68% -56% 100% 20% 25% 33% 25% 20%
Spain 400 332 118 100 100 150 160 180 200 250
y/y (%) -17% -64% -15% 0% 50% 7% 13% 11% 25%
France 1,777 1,115 613 766 920 1,103 1,324 1,589 1,907 2,288
y/y (%) 109% -60% -45% 25% 20% 20% 20% 20% 20% 20%
Rest of Europe 2,007 3,072 2,497 997 1,227 1,509 1,856 2,282 2,807 3,453
y/y (%) 205% 53% -19% -60% 23% 23% 23% 23% 23% 23%
Europe Subtotal 21874 16645 9177 7508 7534 7762 8790 10158 11726 13630
% of World 57% 23% 18% 14% 12% 14% 14% 14% 14%
Middle East/Africa 2011 2012 2013 2014E 2015E 2016E 2017E 2018E 2019E 2020E
Saudi Arabia 0 0 0 50 300 600 1,500 2,500 4,000 5,000
y/y (%) #DIV/0! 500% 100% 150% 67% 60% 25%
United Arab Emeriates 0 0 20 50 100 150 200 200 250 300
y/y (%) 150% 100% 50% 33% 0% 25% 20%
Jordan 0 2 60 80 150 150 170 200 250 300
y/y (%) 2900% 33% 88% 0% 13% 18% 25% 20%
South Africa 1 40 100 300 800 1,200 1,500 2,000 2,500 3,000
y/y (%) 3900% 150% 200% 167% 50% 25% 33% 25% 20%
Rest of Middle East/Africa 12 100 400 600 1,000 1,500 2,000 2,500 3,000
y/y (%) 733% 300% 50% 67% 50% 33% 25% 20%
Middle East/Africa Subtotal 1 54 280 880 1,950 3,100 4,870 6,900 11,500 14,100
% of World 0% 1% 2% 4% 5% 8% 9% 13% 15%
Australia 874 1049 757 1100 850 893 1200 1500 2000 2500
y/y (%) 124% 20% -28% 45% -23% 5% 34% 25% 33% 25%
Total 27,557 29,412 39,508 42,046 54,820 63,921 64,690 72,749 86,156 96,748
y/y (%) 53% 7% 34% 6% 30% 17% 1% 12% 18% 12% Source: Deutsche Bank
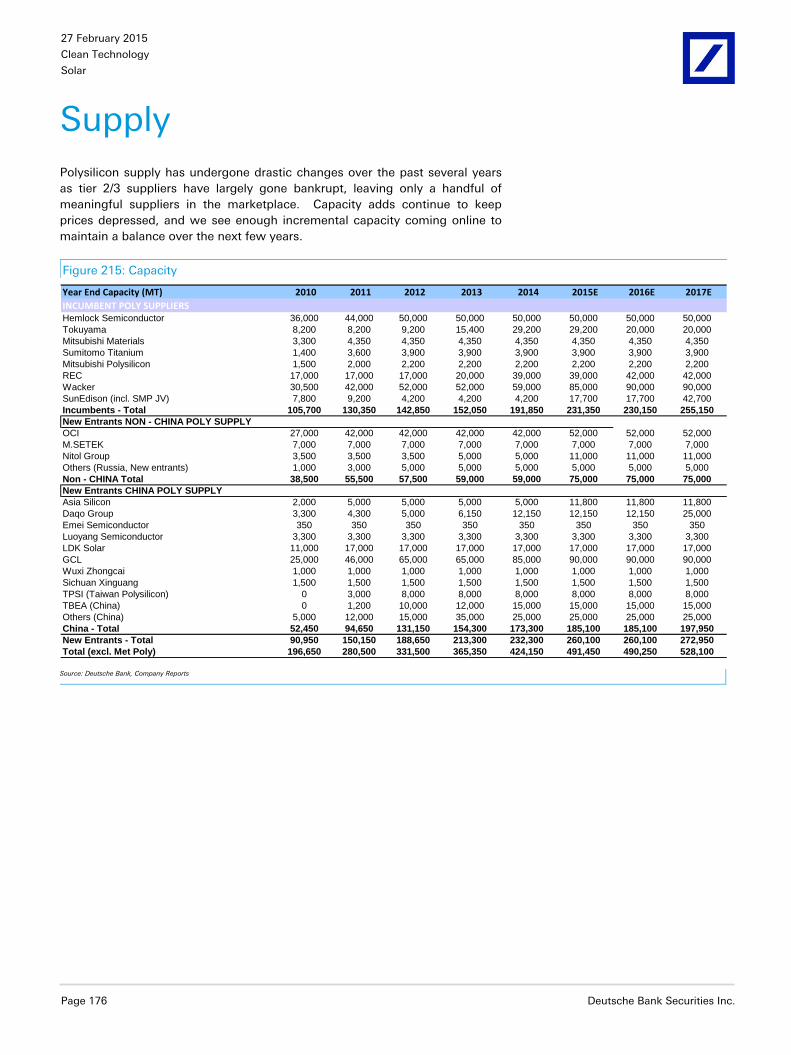
27 February 2015
Clean Technology
Solar
Page 176 Deutsche Bank Securities Inc.
Supply
Polysilicon supply has undergone drastic changes over the past several years
as tier 2/3 suppliers have largely gone bankrupt, leaving only a handful of
meaningful suppliers in the marketplace. Capacity adds continue to keep
prices depressed, and we see enough incremental capacity coming online to
maintain a balance over the next few years.
Figure 215: Capacity
Year End Capacity (MT) 2010 2011 2012 2013 2014 2015E 2016E 2017E
INCUMBENT POLY SUPPLIERSHemlock Semiconductor 36,000 44,000 50,000 50,000 50,000 50,000 50,000 50,000
Tokuyama 8,200 8,200 9,200 15,400 29,200 29,200 20,000 20,000
Mitsubishi Materials 3,300 4,350 4,350 4,350 4,350 4,350 4,350 4,350
Sumitomo Titanium 1,400 3,600 3,900 3,900 3,900 3,900 3,900 3,900
Mitsubishi Polysilicon 1,500 2,000 2,200 2,200 2,200 2,200 2,200 2,200
REC 17,000 17,000 17,000 20,000 39,000 39,000 42,000 42,000
Wacker 30,500 42,000 52,000 52,000 59,000 85,000 90,000 90,000
SunEdison (incl. SMP JV) 7,800 9,200 4,200 4,200 4,200 17,700 17,700 42,700
Incumbents - Total 105,700 130,350 142,850 152,050 191,850 231,350 230,150 255,150
New Entrants NON - CHINA POLY SUPPLY
OCI 27,000 42,000 42,000 42,000 42,000 52,000 52,000 52,000
M.SETEK 7,000 7,000 7,000 7,000 7,000 7,000 7,000 7,000
Nitol Group 3,500 3,500 3,500 5,000 5,000 11,000 11,000 11,000
Others (Russia, New entrants) 1,000 3,000 5,000 5,000 5,000 5,000 5,000 5,000
Non - CHINA Total 38,500 55,500 57,500 59,000 59,000 75,000 75,000 75,000
New Entrants CHINA POLY SUPPLY
Asia Silicon 2,000 5,000 5,000 5,000 5,000 11,800 11,800 11,800
Daqo Group 3,300 4,300 5,000 6,150 12,150 12,150 12,150 25,000
Emei Semiconductor 350 350 350 350 350 350 350 350
Luoyang Semiconductor 3,300 3,300 3,300 3,300 3,300 3,300 3,300 3,300
LDK Solar 11,000 17,000 17,000 17,000 17,000 17,000 17,000 17,000
GCL 25,000 46,000 65,000 65,000 85,000 90,000 90,000 90,000
Wuxi Zhongcai 1,000 1,000 1,000 1,000 1,000 1,000 1,000 1,000
Sichuan Xinguang 1,500 1,500 1,500 1,500 1,500 1,500 1,500 1,500
TPSI (Taiwan Polysilicon) 0 3,000 8,000 8,000 8,000 8,000 8,000 8,000
TBEA (China) 0 1,200 10,000 12,000 15,000 15,000 15,000 15,000
Others (China) 5,000 12,000 15,000 35,000 25,000 25,000 25,000 25,000
China - Total 52,450 94,650 131,150 154,300 173,300 185,100 185,100 197,950
New Entrants - Total 90,950 150,150 188,650 213,300 232,300 260,100 260,100 272,950
Total (excl. Met Poly) 196,650 280,500 331,500 365,350 424,150 491,450 490,250 528,100
Source: Deutsche Bank, Company Reports

27 February 2015
Clean Technology
Solar
Deutsche Bank Securities Inc. Page 177
Figure 216: Supply
Annual Supply (MT) 2010 2011 2012 2013 2014 2015E 2016E 2017E
INCUMBENT POLY SUPPLIERSHemlock Semiconductor 27,900 34,000 36,000 42,500 42,500 42,500 45,000 45,000
Tokuyama 7,300 8,200 4,500 5,000 10,035 16,060 16,974 15,000
Mitsubishi Materials 2,168 3,251 2,000 3,800 4,133 4,133 4,133 4,133
Sumitomo Titanium 1,190 2,125 3,188 3,315 3,315 3,315 3,315 3,315
Mitsubishi Polysilicon 1,275 1,488 1,785 1,870 1,870 1,870 1,870 1,870
REC 10,500 16,672 18,790 19,764 18,600 21,450 27,945 33,600
Wacker 30,500 35,500 38,000 49,000 48,840 57,600 70,000 72,000
SunEdison (incl. SMP JV) 6,102 5,950 5,360 4,200 3,990 7,665 12,390 21,140
Traditional Poly Suppliers - Total 86,934 107,186 109,623 129,449 133,283 154,593 181,627 196,058
Non-China Poly Supply
OCI 18,000 35,000 40,000 25,935 37,800 44,650 49,400 49,400
M.SETEK 5,400 7,000 7,000 6,300 6,300 6,300 6,300 6,300
Nitol Group 760 3,500 3,500 2,125 2,500 3,200 4,400 4,400
Others (New entrants) 917 2,000 5,000 5,000 4,750 4,500 4,500 4,500
Non - China Total 25,077 47,500 55,500 39,360 51,350 58,650 64,600 64,600
China Poly Supply
Asia Silicon 1,200 2,400 4,500 2,000 1,500 2,520 3,540 3,540
Daqo Group 3,650 4,300 3,568 4,805 6,150 9,720 9,720 13,003
Emei Semiconductor 329 350 350
Luoyang Semiconductor 1,588 2,475 3,300
LDK Solar 5,000 10,220 17,000 0 1,020 4,250 5,950 7,650
GCL 17,040 29,414 37,055 50,440 67,500 78,750 81,000 81,000
Wuxi Zhongcai 1,000 1,000 1,000
Sichuan Xinguang 1,708 1,500 1,500
TPSI (Taiwan Polysilicon) 0 1,500 1,500
TBEA (China) 0 600 1,000 6,600 10,125 12,000 13,500 13,500
Others (China) 4,555 8,500 16,230 33,250 21,000 17,500 17,500 17,500
China - Total 36,070 62,259 87,003 97,095 107,295 124,740 131,210 136,193
Total (excl. Met Poly) 148,081 216,945 252,126 265,904 291,928 337,983 377,437 396,850
Source: Deutsche Bank, Company Reports
27 February 2015
Clean Technology
Solar
Page 178 Deutsche Bank Securities Inc.
Supply
GCL Poly
GCL Poly aims to add a total of 25k MTpa FBR capacity by end-2015. It also
plans to expand its existing Siemens facility by 10,000 MTpa in 2015, so that
total poly capacity could increase from 65k MTpa by 3Q14 to 100k MTpa by
end-2015. (source: GCL Poly: Inflection point – upgrading to Buy, Feb 11, 2015)
Wacker
Wacker has increased utilization levels recently. Wacker’s Polysilicon’s sales in
2Q14 increased ~34% Y/Y driven by a significant increase in volumes and
better pricing. Wacker has voiced expectations that prices will remain strong
driven by solid demand environment. The company is building a new poly
plant in the US (20K MT capacity), which is scheduled to be commissioned in
2H15. The company’s poly capacity was ~52K MT as of 2013-end. We expect
debottlenecking activities and US plant to take poly capacity to 59K MT in
2014, 85K MT in 2015 and 90K MT in 2016. We expect utilization levels to be
high in ~80% range over the next few years.
OCI Co.
OCI recently decided to restart a project which will supply ~20KMT (expected
to come online in mid-2015), overall, bringing total poly capacity from ~42K
MT to ~52K MT. We expect high utilization levels particularly as OCI is
generally not subject to Chinese tariffs
Daqo
Daqo shipped 1.4K MT of poly in 2Q14 (up 3% Y/Y) and expects shipments in
3Q14 to be 1.45-1.50K MT. The company decreased production costs to
~$14/kg and expects further decreases by mid-2015 to ~$12/kg. Poly ASP in
2Q14 increased to $22/kg, and the company expects poly ASP to increase
further in 4Q13 and beyond, driven by robust end-market demand. Company
anticipates high utilization rates for poly production in 2014 – with poly volume
expected to be close to the nameplate capacity of ~6K MT. In 2014, Daqo
raised ~$55M through a follow-on public offering, which will be used for the
expansion at the company’s Xinjiang poly facility. Daqo expects construction
to finish by the end of 2014 – taking the poly capacity to ~12K MT.
Subsequently, the company plans to increase its poly capacity to 25K MT,
which we believe could complete in 2017.
REC Silicon
REC produced ~4.4K MT (~3.7K MT of FBR, ~0.4K MT of Semi-grade, ~0.3K
MT of Siemens Solar) and sold ~4.2K MT of poly in 2Q14. REC targets ~5K MT
of poly production for 3Q14 (~4.3K MT of FBR) and ~18.6K MT for full year
2014 (~15.7K MT of FBR). The company benefitted from high poly ASP during
the quarter (spot price for solar-grade poly up 4% Q/Q to ~$21/kg), driven by
strong demand. As such, the company expects poly market to remain
balanced during 2H14, and expects flat to modest increase in poly prices
through 2H14. In 2014, REC entered into a JV with Shaanxi Non-Ferrous Tian
Hong New Energy to build a poly plant with a nameplate capacity of 18K MT.
REC’s poly capacity currently stands at ~20K MT and the new JV will increase
the capacity to ~39K MT by 2014-end. The company also plans to expand
capacity at its Moses Lake facility by 3K MT, which would raise poly capacity
to 42K MT in the second half of 2016.
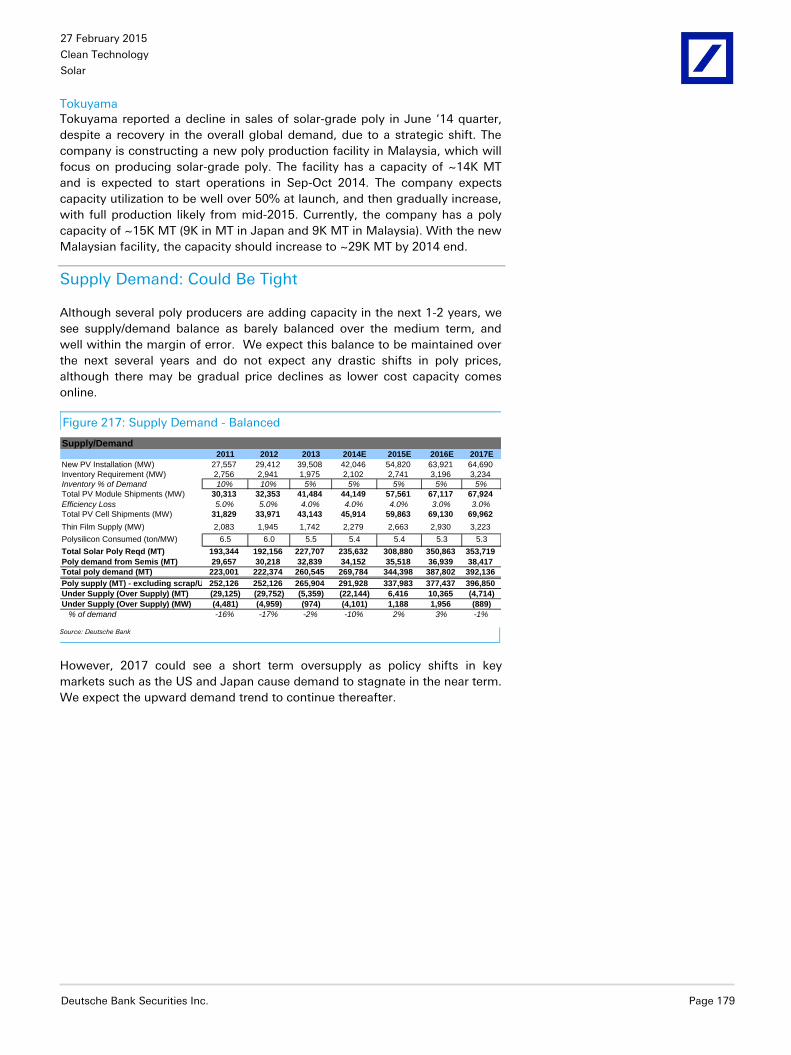
27 February 2015
Clean Technology
Solar
Deutsche Bank Securities Inc. Page 179
Tokuyama
Tokuyama reported a decline in sales of solar-grade poly in June ‘14 quarter,
despite a recovery in the overall global demand, due to a strategic shift. The
company is constructing a new poly production facility in Malaysia, which will
focus on producing solar-grade poly. The facility has a capacity of ~14K MT
and is expected to start operations in Sep-Oct 2014. The company expects
capacity utilization to be well over 50% at launch, and then gradually increase,
with full production likely from mid-2015. Currently, the company has a poly
capacity of ~15K MT (9K in MT in Japan and 9K MT in Malaysia). With the new
Malaysian facility, the capacity should increase to ~29K MT by 2014 end.
Supply Demand: Could Be Tight
Although several poly producers are adding capacity in the next 1-2 years, we
see supply/demand balance as barely balanced over the medium term, and
well within the margin of error. We expect this balance to be maintained over
the next several years and do not expect any drastic shifts in poly prices,
although there may be gradual price declines as lower cost capacity comes
online.
Figure 217: Supply Demand - Balanced
Supply/Demand2011 2012 2013 2014E 2015E 2016E 2017E
New PV Installation (MW) 27,557 29,412 39,508 42,046 54,820 63,921 64,690
Inventory Requirement (MW) 2,756 2,941 1,975 2,102 2,741 3,196 3,234
Inventory % of Demand 10% 10% 5% 5% 5% 5% 5%
Total PV Module Shipments (MW) 30,313 32,353 41,484 44,149 57,561 67,117 67,924
Efficiency Loss 5.0% 5.0% 4.0% 4.0% 4.0% 3.0% 3.0%
Total PV Cell Shipments (MW) 31,829 33,971 43,143 45,914 59,863 69,130 69,962
Thin Film Supply (MW) 2,083 1,945 1,742 2,279 2,663 2,930 3,223
Polysilicon Consumed (ton/MW) 6.5 6.0 5.5 5.4 5.4 5.3 5.3
Total Solar Poly Reqd (MT) 193,344 192,156 227,707 235,632 308,880 350,863 353,719
Poly demand from Semis (MT) 29,657 30,218 32,839 34,152 35,518 36,939 38,417
Total poly demand (MT) 223,001 222,374 260,545 269,784 344,398 387,802 392,136
Poly supply (MT) - excluding scrap/UMG252,126 252,126 265,904 291,928 337,983 377,437 396,850
Under Supply (Over Supply) (MT) (29,125) (29,752) (5,359) (22,144) 6,416 10,365 (4,714)
Under Supply (Over Supply) (MW) (4,481) (4,959) (974) (4,101) 1,188 1,956 (889)
% of demand -16% -17% -2% -10% 2% 3% -1% Source: Deutsche Bank
However, 2017 could see a short term oversupply as policy shifts in key
markets such as the US and Japan cause demand to stagnate in the near term.
We expect the upward demand trend to continue thereafter.

27 February 2015
Clean Technology
Solar
Page 180 Deutsche Bank Securities Inc.
Appendix 1
Important Disclosures
Additional information available upon request
Disclosure checklist
Company Ticker Recent price* Disclosure
Vivint Solar VSLR.N 8.07 (USD) 27 Feb 15 1,7,8 *Prices are current as of the end of the previous trading session unless otherwise indicated and are sourced from local exchanges via Reuters, Bloomberg and other vendors . Data is sourced from Deutsche Bank and subject companies.
Important Disclosures Required by U.S. Regulators
Disclosures marked with an asterisk may also be required by at least one jurisdiction in addition to the United States. See Important Disclosures Required by Non-US Regulators and Explanatory Notes.
1. Within the past year, Deutsche Bank and/or its affiliate(s) has managed or co-managed a public or private offering for this company, for which it received fees.
7. Deutsche Bank and/or its affiliate(s) has received compensation from this company for the provision of investment banking or financial advisory services within the past year.
8. Deutsche Bank and/or its affiliate(s) expects to receive, or intends to seek, compensation for investment banking services from this company in the next three months.
Important Disclosures Required by Non-U.S. Regulators
Please also refer to disclosures in the Important Disclosures Required by US Regulators and the Explanatory Notes.
1. Within the past year, Deutsche Bank and/or its affiliate(s) has managed or co-managed a public or private offering for this company, for which it received fees.
7. Deutsche Bank and/or its affiliate(s) has received compensation from this company for the provision of investment banking or financial advisory services within the past year.
For disclosures pertaining to recommendations or estimates made on securities other than the primary subject of this research, please see the most recently published company report or visit our global disclosure look-up page on our website at http://gm.db.com/ger/disclosure/DisclosureDirectory.eqsr
Analyst Certification
The views expressed in this report accurately reflect the personal views of the undersigned lead analyst about the subject issuers and the securities of those issuers. In addition, the undersigned lead analyst has not and will not receive any compensation for providing a specific recommendation or view in this report. Vishal Shah
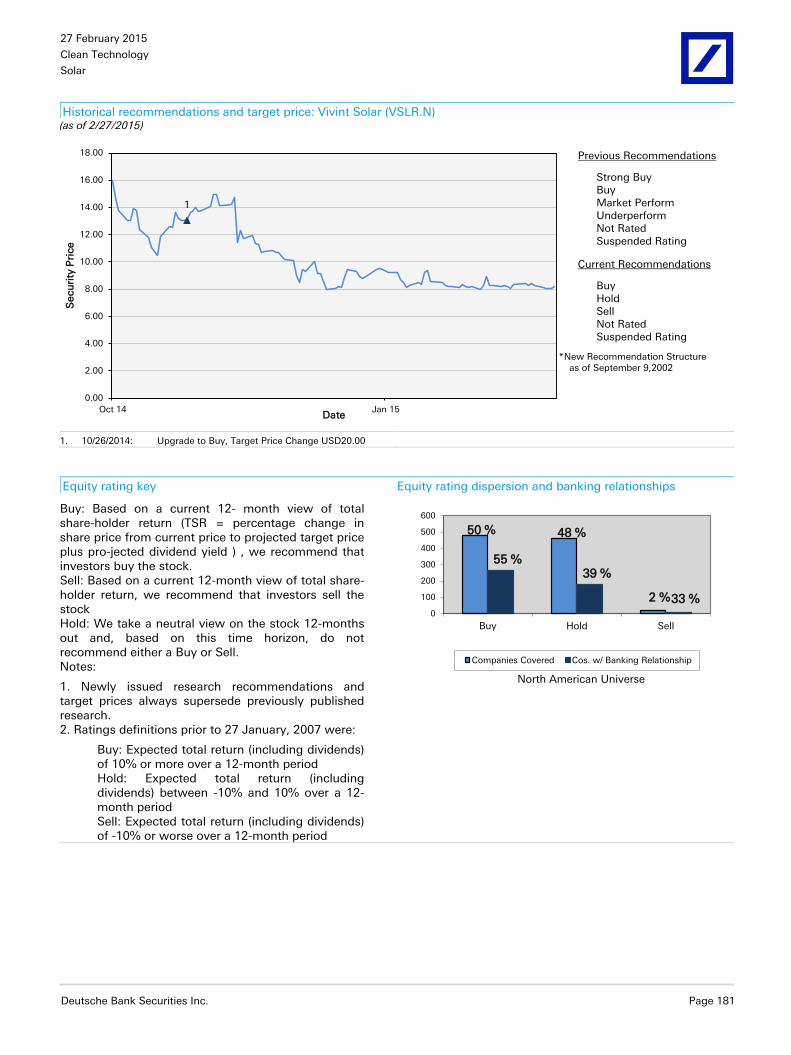
27 February 2015
Clean Technology
Solar
Deutsche Bank Securities Inc. Page 181
Historical recommendations and target price: Vivint Solar (VSLR.N) (as of 2/27/2015)
1
0.00
2.00
4.00
6.00
8.00
10.00
12.00
14.00
16.00
18.00
Oct 14 Jan 15
Secu
rity
Pri
ce
Date
Previous Recommendations
Strong Buy Buy Market Perform Underperform Not Rated Suspended Rating
Current Recommendations
Buy Hold Sell Not Rated Suspended Rating
*New Recommendation Structure as of September 9,2002
1. 10/26/2014: Upgrade to Buy, Target Price Change USD20.00
Equity rating key Equity rating dispersion and banking relationships
Buy: Based on a current 12- month view of total share-holder return (TSR = percentage change in share price from current price to projected target price plus pro-jected dividend yield ) , we recommend that investors buy the stock. Sell: Based on a current 12-month view of total share-holder return, we recommend that investors sell the stock Hold: We take a neutral view on the stock 12-months out and, based on this time horizon, do not recommend either a Buy or Sell. Notes:
1. Newly issued research recommendations and target prices always supersede previously published research. 2. Ratings definitions prior to 27 January, 2007 were:
Buy: Expected total return (including dividends) of 10% or more over a 12-month period Hold: Expected total return (including dividends) between -10% and 10% over a 12-month period Sell: Expected total return (including dividends) of -10% or worse over a 12-month period
50 % 48 %
2 %
55 %39 %
33 %0
100
200
300
400
500
600
Buy Hold Sell
North American Universe
Companies Covered Cos. w/ Banking Relationship

27 February 2015
Clean Technology
Solar
Page 182 Deutsche Bank Securities Inc.
Regulatory Disclosures
1. Important Additional Conflict Disclosures Aside from within this report, important conflict disclosures can also be found at https://gm.db.com/equities under the
"Disclosures Lookup" and "Legal" tabs. Investors are strongly encouraged to review this information before investing.
2. Short-Term Trade Ideas Deutsche Bank equity research analysts sometimes have shorter-term trade ideas (known as SOLAR ideas) that are
consistent or inconsistent with Deutsche Bank's existing longer term ratings. These trade ideas can be found at the
SOLAR link at http://gm.db.com.
3. Country-Specific Disclosures Australia and New Zealand: This research, and any access to it, is intended only for "wholesale clients" within the
meaning of the Australian Corporations Act and New Zealand Financial Advisors Act respectively.
Brazil: The views expressed above accurately reflect personal views of the authors about the subject company(ies) and
its(their) securities, including in relation to Deutsche Bank. The compensation of the equity research analyst(s) is
indirectly affected by revenues deriving from the business and financial transactions of Deutsche Bank. In cases where
at least one Brazil based analyst (identified by a phone number starting with +55 country code) has taken part in the
preparation of this research report, the Brazil based analyst whose name appears first assumes primary responsibility for
its content from a Brazilian regulatory perspective and for its compliance with CVM Instruction # 483.
EU countries: Disclosures relating to our obligations under MiFiD can be found at
http://www.globalmarkets.db.com/riskdisclosures.
Japan: Disclosures under the Financial Instruments and Exchange Law: Company name - Deutsche Securities Inc.
Registration number - Registered as a financial instruments dealer by the Head of the Kanto Local Finance Bureau
(Kinsho) No. 117. Member of associations: JSDA, Type II Financial Instruments Firms Association, The Financial Futures
Association of Japan, Japan Investment Advisers Association. Commissions and risks involved in stock transactions - for
stock transactions, we charge stock commissions and consumption tax by multiplying the transaction amount by the
commission rate agreed with each customer. Stock transactions can lead to losses as a result of share price fluctuations
and other factors. Transactions in foreign stocks can lead to additional losses stemming from foreign exchange
fluctuations. "Moody's", "Standard & Poor's", and "Fitch" mentioned in this report are not registered credit rating
agencies in Japan unless Japan or "Nippon" is specifically designated in the name of the entity. Reports on Japanese
listed companies not written by analysts of Deutsche Securities Inc. (DSI) are written by Deutsche Bank Group's analysts
with the coverage companies specified by DSI.
Malaysia: Deutsche Bank AG and/or its affiliate(s) may maintain positions in the securities referred to herein and may
from time to time offer those securities for purchase or may have an interest to purchase such securities. Deutsche Bank
may engage in transactions in a manner inconsistent with the views discussed herein.
Qatar: Deutsche Bank AG in the Qatar Financial Centre (registered no. 00032) is regulated by the Qatar Financial Centre
Regulatory Authority. Deutsche Bank AG - QFC Branch may only undertake the financial services activities that fall
within the scope of its existing QFCRA license. Principal place of business in the QFC: Qatar Financial Centre, Tower,
West Bay, Level 5, PO Box 14928, Doha, Qatar. This information has been distributed by Deutsche Bank AG. Related
financial products or services are only available to Business Customers, as defined by the Qatar Financial Centre
Regulatory Authority.
Russia: This information, interpretation and opinions submitted herein are not in the context of, and do not constitute,
any appraisal or evaluation activity requiring a license in the Russian Federation.
Kingdom of Saudi Arabia: Deutsche Securities Saudi Arabia LLC Company, (registered no. 07073-37) is regulated by the
Capital Market Authority. Deutsche Securities Saudi Arabia may only undertake the financial services activities that fall
within the scope of its existing CMA license. Principal place of business in Saudi Arabia: King Fahad Road, Al Olaya
District, P.O. Box 301809, Faisaliah Tower - 17th Floor, 11372 Riyadh, Saudi Arabia.
United Arab Emirates: Deutsche Bank AG in the Dubai International Financial Centre (registered no. 00045) is regulated
by the Dubai Financial Services Authority. Deutsche Bank AG - DIFC Branch may only undertake the financial services
activities that fall within the scope of its existing DFSA license. Principal place of business in the DIFC: Dubai
International Financial Centre, The Gate Village, Building 5, PO Box 504902, Dubai, U.A.E. This information has been
distributed by Deutsche Bank AG. Related financial products or services are only available to Professional Clients, as
defined by the Dubai Financial Services Authority.

GRCM2015PROD033635
David Folkerts-Landau
Group Chief Economist Member of the Group Executive Committee
Raj Hindocha
Global Chief Operating Officer Research
Marcel Cassard Global Head
FICC Research & Global Macro Economics
Richard Smith and Steve Pollard Co-Global Heads Equity Research
Michael Spencer Regional Head
Asia Pacific Research
Ralf Hoffmann Regional Head
Deutsche Bank Research, Germany
Andreas Neubauer Regional Head
Equity Research, Germany
Steve Pollard Regional Head
Americas Research
International locations
Deutsche Bank AG Deutsche Bank Place Level 16 Corner of Hunter & Phillip Streets Sydney, NSW 2000 Australia Tel: (61) 2 8258 1234
Deutsche Bank AG Große Gallusstraße 10-14 60272 Frankfurt am Main Germany Tel: (49) 69 910 00
Deutsche Bank AG Filiale Hongkong International Commerce Centre, 1 Austin Road West,Kowloon, Hong Kong Tel: (852) 2203 8888
Deutsche Securities Inc. 2-11-1 Nagatacho Sanno Park Tower Chiyoda-ku, Tokyo 100-6171 Japan Tel: (81) 3 5156 6770
Deutsche Bank AG London 1 Great Winchester Street London EC2N 2EQ United Kingdom Tel: (44) 20 7545 8000
Deutsche Bank Securities Inc. 60 Wall Street New York, NY 10005 United States of America Tel: (1) 212 250 2500
Global Disclaimer The information and opinions in this report were prepared by Deutsche Bank AG or one of its affiliates (collectively "Deutsche Bank"). The information herein is believed to be reliable and has been obtained from public sources believed to be reliable. Deutsche Bank makes no representation as to the accuracy or completeness of such information.
Deutsche Bank may engage in securities transactions, on a proprietary basis or otherwise, in a manner inconsistent with the view taken in this research report. In addition, others within Deutsche Bank, including strategists and sales staff, may take a view that is inconsistent with that taken in this research report.
Opinions, estimates and projections in this report constitute the current judgement of the author as of the date of this report. They do not necessarily reflect the opinions of Deutsche Bank and are subject to change without notice. Deutsche Bank has no obligation to update, modify or amend this report or to otherwise notify a recipient thereof in the event that any opinion, forecast or estimate set forth herein, changes or subsequently becomes inaccurate. Prices and availability of financial instruments are subject to change without notice. This report is provided for informational purposes only. It is not an offer or a solicitation of an offer to buy or sell any financial instruments or to participate in any particular trading strategy. Target prices are inherently imprecise and a product of the analyst judgement.
In August 2009, Deutsche Bank instituted a new policy whereby analysts may choose not to set or maintain a target price of certain issuers under coverage with a Hold rating. In particular, this will typically occur for "Hold" rated stocks having a market cap smaller than most other companies in its sector or region. We believe that such policy will allow us to make best use of our resources. Please visit our website at http://gm.db.com to determine the target price of any stock.
The financial instruments discussed in this report may not be suitable for all investors and investors must make their own informed investment decisions. Stock transactions can lead to losses as a result of pricefluctuations and other factors. If a financial instrument is denominated in a currency other than an investor's currency, a change in exchange rates may adversely affect the investment. Past performance is not necessarily indicative of future results. Deutsche Bank may with respect to securities covered by this report, sell to or buy from customers on a principal basis, and consider this report in deciding to trade on a proprietary basis. Prices are current as of the end of the previous trading session unless otherwise indicated and are sourced from local exchanges via Reuters, Bloomberg and other vendors. Data is sourced from Deutsche Bank and subject companies.
Unless governing law provides otherwise, all transactions should be executed through the Deutsche Bank entity in the investor's home jurisdiction. In the U.S. this report is approved and/or distributed by Deutsche Bank Securities Inc., a member of the NYSE, the NASD, NFA and SIPC. In Germany, this report is approved and/or communicated by Deutsche Bank AG, a joint stock corporation with limited liability incorporated in the Federal Republic of Germany with its principal office in Frankfurt am Main. Deutsche Bank AG is authorised under German Banking Law (competent authority: European Central Bank) and is subject to supervision by the European Central Bank and by BaFin, Germany’s Federal Financial Supervisory Authority. In the United Kingdom, this report is approved and/or communicated by Deutsche Bank AG acting through its London Branch at Winchester House, 1 Great Winchester Street, London EC2N 2DB. Deutsche Bank AG in the United Kingdom is authorised by the Prudential Regulation Authority and is subject to limited regulation by the Prudential Regulation Authority and Financial Conduct Authority. Details about the extent of our authorisation and regulation by the Prudential Regulation Authority, and regulation by the Financial Conduct Authority are available from us on request. This report is distributed in Hong Kong by Deutsche Bank AG, Hong Kong Branch, in Korea by Deutsche Securities Korea Co. This report is distributed in Singapore by Deutsche Bank AG, Singapore Branch or Deutsche Securities Asia Limited, Singapore Branch (One Raffles Quay #18-00 South Tower Singapore 048583, +65 6423 8001), and recipients in Singapore of this report are to contact Deutsche Bank AG, Singapore Branch or Deutsche Securities Asia Limited, Singapore Branch in respect of any matters arising from, or in connection with, this report. Where this report is issued or promulgated in Singapore to a person who is not an accredited investor, expert investor or institutional investor (as defined in the applicable Singapore laws and regulations), Deutsche Bank AG, Singapore Branch or Deutsche Securities Asia Limited, Singapore Branch accepts legal responsibility to such person for the contents of this report. In Japan this report is approved and/or distributed by Deutsche Securities Inc. The information contained in this report does not constitute the provision of investment advice. In Australia, retail clients should obtain a copy of a Product Disclosure Statement (PDS) relating to any financial product referred to in this report and consider the PDS before making any decision about whether to acquire the product. Deutsche Bank AG Johannesburg is incorporated in the Federal Republic of Germany (Branch Register Number in South Africa: 1998/003298/10). Additional information relative to securities, other financial products or issuers discussed in this report is available upon request. This report may not be reproduced, distributed or published by any person for any purpose without Deutsche Bank's prior written consent. Please cite source when quoting.
Copyright © 2015 Deutsche Bank AG
Related Documents