Master Thesis 2021 Crossflow microfiltration with polymeric flat sheet membrane and hollow fibre membrane in the dairy industry Lone Sørensen

Welcome message from author
This document is posted to help you gain knowledge. Please leave a comment to let me know what you think about it! Share it to your friends and learn new things together.
Transcript

Master Thesis 2021
Crossflow microfiltration with polymeric flat
sheet membrane and hollow fibre membrane
in the dairy industry
Lone Sørensen

Title: Crossflow microfiltration with polymeric flat
sheet membrane and hollow fibre membrane in the
dairy industry
Study programme: Master of Science in Engineering
(Chemistry)
Master thesis
Project period: September 1st to June 3rd
Year: 2020/2021
ECTS: 60 ECTS
Supervisors: Aamer Ali and Cejna Quist-Jensen Student: Lone Sørensen
Pages: 55
Appendices: 1 appendix
Abstract In this study, flux tendencies, rejection of fat, protein, lactose, total solids and fouling were investigated for a polymeric flat sheet membrane and a polymeric hollow fibre membrane in regard to dairy processing. This was done under different parameters such as pressure, feed velocity and fat content of feed solution. It was concluded that the degree of hydrophobicity of the membrane influences the fouling in the membranes, which influence the flux and rejection. The properties such as material and thickness of the membranes also influence the performance during filtration. The concentrations of fat, protein, lactose and total solids obtained from was compared to a qualitative FT-IR method to observe trends.

1
Preface
The thesis was made in the Department of Chemistry and Bioscience, Aalborg University, in the 3rd and 4th semester of Master of Science in Engineering in Chemistry programme. The thesis work was conducted from September 1st 2020 to June 3rd 2021. The citation style used in the project was IEEE.
I would like to express gratitude to my supervisors Aamer Ali and Cenja Quist-Jensen, for the guidance throughout the thesis period and useful discussions. I would also like to express gratitude to Timo Kirwa for help in the laboratory and to Jacob Kræmer Hansen, development engineer at FOSS, for information about the chemical composition of permeate samples.

2
Table of content Preface ............................................................................................................................................................... 1 Table of content ................................................................................................................................................. 2 List of Abbreviations ......................................................................................................................................... 3
Chapter 1 .............................................................................................................................................................. 4 Problem analysis ................................................................................................................................................ 4
1.1 Introduction .......................................................................................................................................... 4 1.2 Problem delimitation ........................................................................................................................... 9
Chapter 2 ............................................................................................................................................................ 10 Theory .............................................................................................................................................................. 10
2.1 Milk composition ............................................................................................................................... 10 2.2 Microfiltration .................................................................................................................................... 15
Chapter 3 ............................................................................................................................................................ 22 Materials and methods .................................................................................................................................... 22
3.1 Membrane characteristic ................................................................................................................... 22 3.2 Milk composition ............................................................................................................................... 23 3.3 System setup ....................................................................................................................................... 24 3.4 Filtration experiments ....................................................................................................................... 25 3.5 Explorative analysis .......................................................................................................................... 27
Chapter 4 ............................................................................................................................................................ 30 Results and discussion .................................................................................................................................... 30
4.1 Flux and permeability tendencies of the microfiltration membranes ........................................ 30 4.2 Fouling in the membranes ................................................................................................................ 38 4.3 Composition of permeate ................................................................................................................. 40
Chapter 5 ............................................................................................................................................................ 49 Conclusion ....................................................................................................................................................... 49
Chapter 6 ............................................................................................................................................................ 50 Perspectives ..................................................................................................................................................... 50
Chapter 7 ............................................................................................................................................................ 51 Bibliography .................................................................................................................................................... 51
Chapter 8 .............................................................................................................................................................. 0 Appendix ........................................................................................................................................................... 0

3
List of Abbreviations
MF Micro filtration
UF Ultra filtration
NF Nano filtration
RO Reverse osmosis
TMP Trans membrane pressure
HF Hollow fibre
FS Flat sheet
TAG Triglycerides
MFGM Milk fat globule membrane
LPL Lipoprotein lipase
MWCO Molecular weight cut-off value
PP Polypropylene
PVDF Polyvinylidene fluoride
FT-IR Fourier-transform infrared spectroscopy
ATR Attenuated total reflectance

4
Chapter 1
Problem analysis 1.1 Introduction
Milk is a complicated system with soluble molecules and suspended particles being in a wide range of sizes. This means to process milk a wide range of application is needed to fit the poly-dispersed system. [1] In the dairy industry, membrane separation is widely used throughout the processing of dairy products. It is one of the largest membrane industries using different types of membrane technology. It can be divided into four filtration methods: Microfiltration (MF), ultrafiltration (UF), nanofiltration (NF) and reverse osmosis (RO). The different filtration techniques vary in pore size range, required pressure for use and what the membrane retains. [2]
Many types of dairy products are being produced today as well as products from waste during processing. All dairy products origins from raw milk and mostly from cows. Production of milk has been increasing over the decades and in 2018, 843,000,000 tons of milk worldwide [3]. From the raw milk on the farms to the milk in cartons bought in the supermarket, the milk has been through multiple processing steps. It starts with the milk being collected from the cows and kept in cooling tanks at the farms at 4°C until it is transported to the dairy. The milk is cooled to prevent microorganisms to grow which will develop metabolic products and enzymes that can affect the end product. When arriving at the dairy a number of tests are performed on the milk to make sure the quality matches the standard. The most normal test to run is bacteria, fat, somatic cell and protein count. The raw milk is stored in silo tanks with agitation to prevent the cream from separating by gravity. [4] The processing steps vary from dairy to dairy depending on what they produce and what country the dairy is in. Anyhow there is a series of processing steps that are always performed which will be presented now with some examples of how the dairy handles their waste during processing. [4] This is illustrated in Figure 1.

5
Figure 1 - The processing steps of milk and other milk products
First, the raw milk is centrifuged, and the milk is separated into cream and milk whey. Then the milk whey is filtrated with MF to remove the bacteria and the cream is mixed back in with the milk whey in the fat fractions that can be bought at the supermarket. The milk is homogenized to make the fat globules smaller and divide them into the milk instead of the cream separating into a top layer on the milk. The last step before the milk can be put in bottles or cartons is to pasteurize it to kill bacteria. It is a quick heat treatment at 72°C for 15 seconds and then the milk is cooled down to 4°C again. These is the steps that need to be done in order to make the milk sailable. [5] [2] Milk is also used to produce cheese and the whey from cheese making has a high lactose and protein content, which can be processed into different types of whey protein and lactose concentrate with membrane technology [2]. The different filtrations methods have different purposes in the dairy industry that fits their properties. An overview of the properties of the filtration techniques is illustrated in Figure 2. MF is driven by low pressure and retains large non dissolved molecules. The use of MF to remove bacteria instead of heat is called cold pasteurization and it is an integrated part of the processing of milk due to it does not compromise the flavour of milk as a heat treatment would do. MF prevents the activity of microbial enzymes that would be if milk is heat-treated. It also prevents protein aggregation and thereby keeps the nutritional properties of milk intact. [6]
UF uses higher pressure than MF and can retain some large non-dissolved molecules. UF is used for protein standardization for both raw milk and whey, reduce lactose content in milk and are also used in the cheese making process. NF is a high-pressure driving process where monovalent ions is the only thing passing

6
through the membrane and are used as partial demineralization of whey, lactose-free milk or volume reduction of whey. RO is also a high-pressure driven filtration that only allows water through the membrane and is used for concentration or volume reduction of milk and whey. [2]
Figure 2 - Separation of four membrane processes with respect to what components in milk is rejected
The pore size of the MF membranes determines what is rejected from the milk when filtrating. A pore size from 1.4-1.8 µm can besides bacteria, remove somatic cells, fat globules from cheese whey and caseins micelles can be rejected with a 0.1-0.2 µm MF membrane. It should be possible to remove fat globules from the raw milk with MF instead of using the centrifuged which is what the dairy industry uses now, but it is not applied in the dairy industry yet. [1] This will be investigated in this project.
Filtration type is not the only important property when it comes to membrane filtration. Type of membrane play a central role when it comes to the success of the specific application it is used for. Filtration membranes can be made from organic or inorganic material where the organic membranes are of polymeric material and the inorganic membranes are made of a combination of metals. Organic membranes are available in a wide range of pore sizes and have a high packing density but are sensitive to temperature, pH, transmembrane pressure (TMP) and chemical cleaning. Inorganic membranes or ceramic membranes are resistant to temperature and chemicals. The pore size of ceramic membranes is limited and normally only used for MF and UF without further processing of the ceramic membranes. [1] [7]
Membranes also have different elements design which influence the performance of the membrane and some designs are more suitable for some applications more than

7
others. This is a short introduction to the configurations mostly used in the dairy industry. Illustrations of the different membrane designs can be seen in Figure 3. Ceramic membranes mainly have a tubular design where the feed and retentate streams flow inside the membrane and the permeate is collected on the outer shell. Organic membranes can also have a tubular design. Ceramic membranes have an accurate pore size, high chemical and temperature resistance and long membrane life. The plate-and-frame design is flat membrane sheets (FS) placed between plates to form channels for the retentate and permeate streams. This design can handle high viscosity streams and have a high temperature resistance. Spiral-wound membrane modules are membranes sheet rolled around a central permeate tube with spacers. The spacers create channels for the feed and retentate streams. This gives the membrane a high packing density and easy removal of some of the membranes if broken, but it is hard to clean, control flow and needs a clean feed since large particles can clog the membrane. This membrane design has a wide range of application in the dairy industry. Hollow fibre membranes (HF) have the same design as the tubular membranes but have a smaller diameter. These membranes are self-supporting when packed into a membrane house, and therefore reduces capital cost. This gives this type of configuration extremely high packing density and low retention volume. It also has a relatively low power consumption compared to other membrane designs, which makes it economical. HF membranes cannot operate under high pressures and are expensive to replace since the all the membrane in the module has to be changed. [7] [8]

8
Figure 3 - Different membrane designs. Top left: hollow fibre membrane. Bottom left: tubular membrane. Top right: Plate-and-frame flat sheet membrane. Bottom left: Spiral-wound membrane [7] [9]
The different membrane designs have varied applications in the dairy industry depending on membrane type, processing parameters, performance and cost-efficiency. Polymeric spiral-wound membranes are used to produce milk and whey proteins, lactose-free milk, coconut water, milk and egg whites. Plate and frame membranes are used to produce products with higher viscosity such as cream cheese, yoghurt and skyr. Ceramic tubular membranes are used to produce extended shelf lift milk, Greek yoghurt, milk and coconut water. [2] [8]

9
1.2 Problem delimitation
In this project, the performance regarding fouling behaviour, flux tendencies and rejection, of a polymeric hollow fibre membrane and a polymeric flat sheet membrane will be investigated with microfiltration in regard to dairy processing. The fouling behaviour, flux tendencies and rejection of the membrane will be compared to each other and results from the literature. The hollow fibre membrane was in-house and therefore the flat sheet membrane was chosen based on the properties of the hollow fibre membrane to match in material and pore size. The flat sheet membrane module was also in-house, so the hollow fibre membrane was assembled concerning the velocity for the flat sheet membrane. The filtration performance of the membrane will be investigated using water and milk with 0.1 and 3.5 % fat, respectively. To characterize the content of fat, protein and lactose in the permeate stream it will be analysed at FOSS with a MilkoScan-FT3 which is a Fourier-transform infrared spectroscopy (FT-IR) analysing device fit for dairy analysis. Since FT-IR is originally a qualitative method made quantitative over the years, this project will also try to calibrate a standard FT-IR device after fat, protein and lactose content by comparing the concentration results from permeate samples and FT-IR analysis performed on the device in-house.
1.2.1 Problem statement
How can the filtration performance of a flat sheet membrane and a hollow fibre membrane be compared and analysed at different pressures, flow rates and composition of milk, regarding dairy processing filtration? Can an FT-IR device be calibrated after the content of fat, protein and lactose?
- Investigate flux tendencies, rejection, fouling and cleaning of the two membranes using water and milk with 0.1 and 3.5 % fat, different pressures and flow rates
- Investigate the content of the filtration streams
- Compare the performance of flat sheet membrane with the hollow fibre membrane
- Calibrate the FT-IR device with obtained concentration of fat, protein, lactose and total solids from permeate samples

10
Chapter 2
Theory 2.1 Milk composition
Milk’s composition differs from which type of milk is in question. Humans have been using milk from cows, goats and sheep as food and it contains nutrition value to sustain life. [10] Milk consist of ~87 % water, which is also described as milk whey and 13 % is fat, proteins, lactose and minerals suspended or dissolved in the water. [4] This is defined as total solids. The composition can vary depending on cow breed, feeding and stage of lactation. The average composition is listed in Table 1.
Table 1 - Average composition of cow milk [4]
Components Average composition (%)
Water 87.5
Fat 3.9
Proteins 3.4
Lactose 4.8
Minerals (ash) 0.8
2.1.1 Fat
Milk fat is what in everyday terms is described as cream. The fat exists as globules or droplets surrounded by a milk fat globule membrane (MFGM) and emulsifies in an oil in water emulsion. [11] The sizes of the globules range from 0.1 - 20 µm, with an average of around 3.5 µm and there are ~1010 globules per mL milk. Triglycerides (TAG) is the most dominating lipid in milk fat, but it also contains di- and monoglycerides, fatty acids, sterols, carotenoids and vitamins. It consists of a glycerol backbone joined to three fatty acids where the fatty acids can be saturated or unsaturated depending on the bonding between carbon atoms. The structure of a TAG can be seen in Figure 4 [12].

11
Figure 4 - Triglyceride structure [12]
The MFGM consist of phospholipids, lipoproteins, cerebrosides, proteins, nucleic acids, enzymes, trace elements (metals) and bound water. The slight yellow colour of cream comes from carotenoids in the fat. [10] A constant exchange of the components in the MFGM and the surrounding milk changes the composition and thickness of the MFGM. The composition of a milk fat globule is illustrated in Figure 5. [4]
Figure 5 - Composition of a milk fat globule [8]

12
2.1.2 Proteins
Proteins consist of 20 α-amino acids that are linked in a specific order. The amino acids have an amino group (NH2) and a carboxyl group (COOH) bound to the same carbon. The general structure of alfa amino acids is shown in Figure 6. [4]
Figure 6 - The structure of general amino acid [4]
Casein and milk whey proteins are the major proteins of milk but there are also proteins present in the MFGM. There are 78.3 % caseins proteins, and 19 % milk whey proteins present in milk. They can be distinguished from each other by their different behaviour. Caseins can be precipitated easily while the milk-serum proteins would still be dissolved. Caseins micelles have an average diameter of 0.4 µm. The MFGM proteins are released from the membrane by mechanical action e.g., by churning cream into butter. MFGM proteins have a small count of different proteins which are gathered and constitute 2.7 % of the total protein count. [10] [4]
Caseins are mostly connected by calcium-phosphate linkages to form colloidal spherical micellar structure but up to 10 % of the total casein concentration occurs as monomers. [10] The micelles have an average diameter of about 150 nm but wary much in size which is smaller than fat globules. The internal structure of the casein micelle is still under debate and different models have been proposed with the same main characteristics. [4] αs1-casein, αs2-casein and β-casein are concentrated in the centre of the micelle due to the high content of sulphuric bridges formed between αs1-casein and αs2-casein. β-casein are the most hydrophobic casein where it has a polar head and an apolar tail like a surfactant. κ-casein are on the surface of the micelle due to its hydrophilic properties. The micelles are kept in suspension by hydrophobic interactions, electrostatic interactions by the phosphate bridges and hydrogen bonds. [10] [4] [13] The micelle is dynamic where it keeps exchanging components with surroundings. [4]

13
Milk whey proteins from cows consist mainly of β-lactoglobulin, where α-lactalbumin is present in milk from all mammals and have a high nutritional value. Immunoglobulins are antibodies synthesized in response to stimulation by specific agents. They can act against bacteria and flocculate them. [4]
Proteins in the MFGM protect the fat globule by covering the surface and stabilize it in the emulsion. The typical types of proteins in the MFGM are phospholipids, protein and glycoprotein. [4]
Enzymes
Enzymes in cow milk come from bacteria or the udder. Enzymes are types of proteins that can affect chemical reactions in terms of speed and course of the reaction. Up to 70 different enzymes have been identified in raw milk, but many of them do not have access to substrates needed to activate them. Some of the active enzymes can affect the milk during storage and processing. Pasteurization partly destroys most of the enzymes, but sometimes a higher temperature for a longer time is required. [4] [14] The enzymes in question are catalase, plasmin and lipase. Catalase can determine if the udder the milk has come from is diseased or healthy. Other bacteria can produce similar enzymes. [4] Plasmin is present in the MFGM and the caseins micelles and are secreted through the bloodstream and therefore also gives an indication of the udder’s health state. [10] [13] Lipase splits fats into glycerol and free fatty acids and for cow milk, the main lipase is lipoprotein lipase (LPL). The content of LPL is usually low, and it is connected to the casein micelles. The free fatty acids in milk result in a rancid taste. [4][10]
2.1.3 Lactose
Lactose is the main sugar in milk and is a disaccharide of galactose and glucose. It is not as sweet as other sugars, 30 timers less than cane sugar. The structure of lactose is illustrated in Figure 7. [4]

14
Figure 7 - Structure of lactose
When the milk goes scour the lactose is fermented into lactic acid. Lactose is mostly dissolved in the whey during cheese making and lactose can crystallize at 93°C. The lactose crystals are used in infant formula since human milk contains lactose. Lactose is the main substrate for starter culture microorganisms during the production of cheese, yoghurt and other fermented dairy products. [10] [4]
2.1.4 Minerals, vitamins and somatic cells
Milk contains several mineral salts where the main salts are calcium (1200 mg/L), sodium (500 mg/L), potassium (1500 mg/L) and magnesium (120 mg/L) along with some trace elements such as iron (400 µg/L), aluminium (500 µg/L), copper (120 µg/L) and zinc (4000 µg/L). The minerals can be dissolved in the milk serum or be present in casein compounds. [10] [4] Minerals are essential nutrition for human and animals.
Milk also contains several vitamins and are existential for a normal life process. Some vitamins in milk are soluble in fat (A and D) and others in water (B’s and C). Lack of vitamins for humans can among others course night blindness, indigestion and scurvy. [4] Milk also contains somatic cells which is a mix of milk-producing cells and immune cells from the cow. The content of somatic cells in the milk indicates the health of the mammary and the quality of the milk. If the content of somatic cells in milk is low the udder it came from is healthy. [4] [15]
2.1.5 Bacteria
Bacteria are unicellular organisms found in almost all environments and have a variety of functions. It classifies under the term microorganisms where bacteria range in size from 0.5-5 µm. Some bacteria cause diseases and spoil food, others are useful to manufacture food and other valuable compounds. Bacteria needs nutrition

15
to grow such as proteins, fat and carbohydrates. These organic compounds are broken down by the bacteria to help growth, which leads to spoilage of food. The most efficient way for bacteria to develop is within a certain temperature limit. [4]
Bacteria are also found in milk, however, when produced by the cow it is almost sterile but is infected with bacteria before it left the udder, because bacteria enter the udder through the teat canal. These bacteria are usually flushed out at the start of the milking process. The main source of bacterial contamination is from bad hygiene at the farm. The cleanliness of the milking machine and the cow’s udder have a large impact on the bacteria content in the milk. The temperature of the milk when stored at the farm is important since milk is highly nutritious and therefore gives s great growth factor for the bacteria under the right temperatures. Milk is being processed today to minimize the bacteria content and thereby give long shelf life because the milk does not spoil as fast when processed. Some bacteria in raw milk can cause food poisoning which is why it is not recommended to drink raw milk. [4]
2.2 Microfiltration
A membrane can be defined as a semipermeable barrier that allows passage for one or more components in a solution from one medium to another and limits the passage of other components. [16] [17] For microfiltration the driving force of the separation process is pressure across the membrane. [7] [16] In this project two different membrane types are used. The hollow fibre membrane is a microporous, symmetric membranes. If a membrane is symmetric, it has the same structure throughout the material. The flat sheet membrane used can be defined as a microporous, composite membrane that has two layers of different polymers with different thickness, pore size and porosity [18]. The active layer of the membrane is thin and dense and supported by a ticker more porous layer. The active layer provides high selectivity, and the support layer should not influence the filtration other than supporting the active layer. [7] [16] The separation mechanism is based on the size of the pores of the membrane and the size of the components filtered. [16] For MF membranes the pore size ranges from 0.1-10 µm where components smaller than pore size pass through the membrane and components larger than the pore size are retained. With a quite large pore size compared to other filtration types, the operation pressure for the separation is low and ranges from 0.1-3 bar. [7] [16]
Management of the flow direction on the membrane surface is important for the permeate flux and fouling. To manage the flow two filtration techniques, crossflow filtration and dead-end filtration have been developed. In crossflow filtration, the feed is pumped at a velocity parallel to the membrane surface and reduces the

16
formation of a cake layer on the membrane surface. In dead-end filtration, the feed is pumped straight at the membrane surface. The two filtration types are illustrated in Figure 8. [19]
Figure 8 - Dead-end filtration and crossflow filtration techniques [20]
The transport mechanism for porous MF membranes can be described with the pore flow model which is based on the pressure gradient driven convective flow of the components through the membrane pores. This can be explained by Darcy’s law which is given in equation 1
!! = #$!%&%'
(1)
Where dp/dx is the pressure gradient, ci the concentration of the component and k is the intrinsic permeability coefficient of the membrane. The simple diffusion process is slow compared to the pressure-driven convective flows across the membrane. [16] [21]
When a pressure gradient is applied, convective flow takes place and can affect the driving force meaning each component is transported through the membrane at a rate that is proportional to its mole fraction and the pressure gradient. This is called viscous flow and it is not by itself very efficient in terms of selectivity in a porous membrane. Viscous flow is present if there is a pressure drop on both sides of the membrane. [16]
Crossflow velocity is affecting the hydrodynamic conditions in the membrane cell and is defined as the is the linear velocity of the flow tangential to the membrane surface. This affects the concentration polarization and the fouling rate. [22]

17
The rate of mass transfer during the separation is defined as membrane flux and for MF membranes given as
! = ( · ∆+ (2)
Where F is the membrane flux, a the permeability constant and ∆P the transmembrane pressure. [16] The membrane flux depends on the structure of the membrane such as pore size and porosity. Therefore, the Hagen-Poiseuille and Kozeny-Carman equations can be applied to determent the membrane flux. They take into account the different ways membrane pores are structured. [16] [19] For MF membranes it is important to have a narrow pore size distribution and high porosity to get effective membrane flux. [16] The membrane flux is proportional to the membrane permeability and driving force. The flux is inversely proportional to the membrane thickness, which means the lesser the membrane thickness, the higher the membrane flux will be and vice versa. For MF the type of transport across the membrane is passive transport which is the type of transport that is totally under the influence of the driving force. [16]
As mentioned before the driving force is pressure across the membrane also defined as the TMP. It is the pressure difference between the feed side and the permeate side and is given by when filtering in crossflow mode:
,-+ =+" + +#
2− +$ (3)
Where PF is the pressure and the feed inlet, PR is the pressure of the retentate outlet and PP is the pressure on the permeate outlet. TMP for most membrane filtration systems is between 0.2 and 1 bar. [1] [19]
Performance of the membrane can be measured by measuring the permeate flux (J) of the membrane. It can be defined as the permeate volume through the membrane per unit area and is given by
1 =23
(4)
Where Q is the permeate volume (L) and A is the membrane area (m2). [16] The permeate flux is measured over a period of time, which makes the unit L (h m2)-1 in this project and indicated as LMH.
Important parameters of the membrane are selectivity and permeability. Selectivity is the ratio of the permeability of two solutes. High selectivity is desired since it results in a better separation of the two solutes. Permeability is a measure of how

18
much solution is passing through the membrane per time, surface area and pressure. Usually, a membrane with high selectivity has low water permeability and vice versa. This is called the permeability/selectivity trade-off, which means a compromise is needed between the two factors. [16] [23] The permeability is calculated as the flux divided by the corresponding pressure in this project.
Selectivity of the membrane can be measured by rejection (R), which determents which solute is detained by the membrane and is described as
4 = 51 −7%7&8 · 100% (5)
Where Cp is the concentration in the permeate (mg/L) and Cf is the concentration in the feed (mg/L). [16]
Some retention rating is based on molecular weight cut-off value (MWCO), which is the lowest molecular weight at which 90 % of the solutes are retained by the membrane [19].
Using membranes in the industry have some advantages and some drawbacks where their largest advantages are that membrane filtration does not necessarily use heat during the filtration and therefore saves a huge amount of energy. Other advantages are flexibility because the membrane plant design is simple, and the process can easily be combined with other processes which can increase the efficiency of the overall process. [7] [16] Membrane processing have some drawbacks where fouling is the biggest. Fouling affects the selectivity, permeability and performance of the membrane. Fouling occurs in different states and is a blockade of pores either on the membrane surface or in the pores of the membrane. This happens over time as the membrane is used but some degree of fouling is reversible by cleaning of membrane, where other is irreversible. The most common type of fouling is concentration polarization which occurs when filtering along the membrane retained feed solids accumulate at the surface of the membrane making the concentration of solutes higher in the surface than on in the bulk. This will make solutes adsorb on the surface of the membrane and create a Stern-layer and diffusion of solutes from the Stern-layer to the bulk on the retentate side will happen, due to the higher concentration in the Stern-layer. [7] [16] [21]. This is illustrated in Figure 9.
19
Figure 9 - Schematic of concentration polarization with cake layer formed [7]
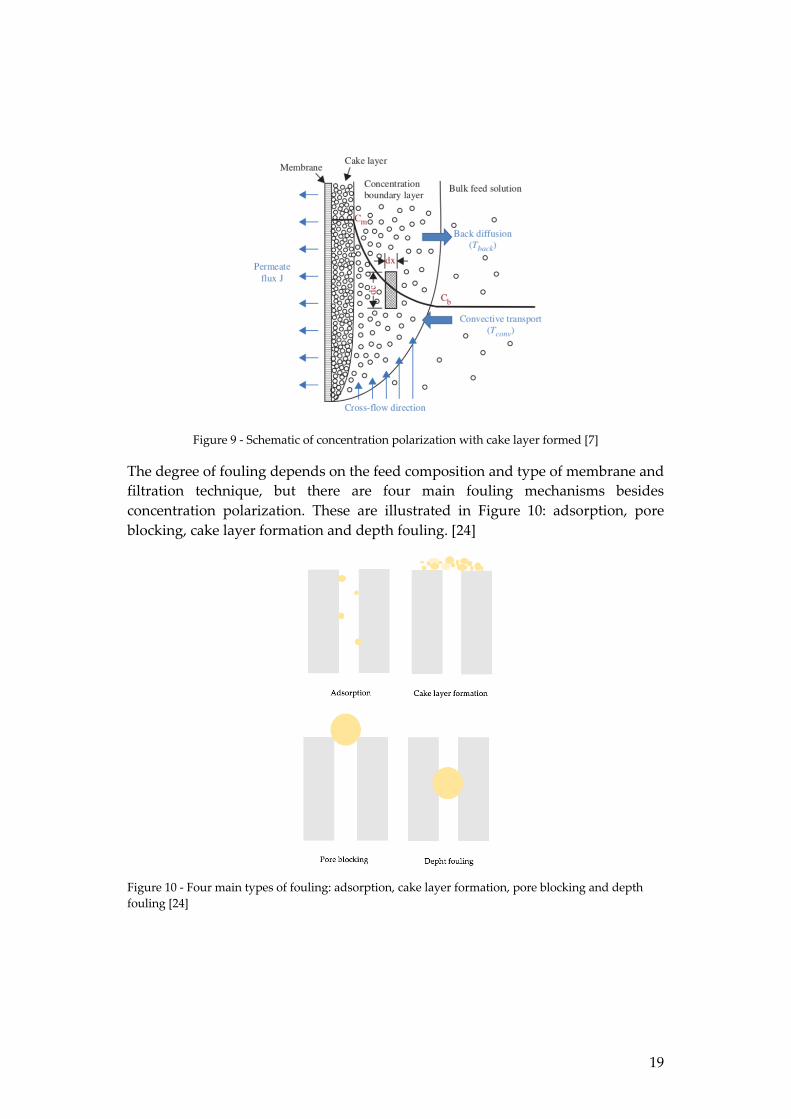
The degree of fouling depends on the feed composition and type of membrane and filtration technique, but there are four main fouling mechanisms besides concentration polarization. These are illustrated in Figure 10: adsorption, pore blocking, cake layer formation and depth fouling. [24]
Figure 10 - Four main types of fouling: adsorption, cake layer formation, pore blocking and depth fouling [24]

20
Pore blocking and cake formation are typically considered short-term reversible fouling that can cause a decrease in flux over time. This type of fouling can be reversed with a cleaning procedure. Pore blocking and depth fouling can over time cause irreversible fouling which cannot be removed by cleaning and causes the membrane to be replaced. [24] These main drawbacks will cause low membrane life and thereby needs to be replaced regularly. Polymeric membranes have the lowest life span where ceramic membranes have a longer life span due to that it is more resistance against harsh chemicals. [16] [25] Membranes needs to be cleaned after a filtration cycle. It will remove some of the fouling on the surface of the membrane and restore some of its performance. Cleaning happens when backwashing the filtration system with water typically. Chemicals can also be added to the backwashing cycle to remove even more fouling from the membrane. This will expand the membranes life even though fouling material can be adsorbed into the membrane pores and clog them over time [19].
2.2.1 Membrane material properties
Membranes are made of a certain material with the thought to make the membranes as strong and resistant as possible to prolong their life as much as possible. The membranes used in this project are both made of polypropylene (PP). Properties of the membranes can be found in Table 2 and Table 3. Both membranes have a pore size of 0.2 um, which means it should be possible to filtrate fat, bacteria and proteins with both membranes [1]. PP is one of the most used polymers for MF membrane fabrication due to its high chemical resistance, good thermal stability and low cost. The PP polymer can be seen in Figure 11.
Figure 11 - Structure of PP and PVDF
PP is hydrophobic and therefore can be modified to be more hydrophilic, so it is more suitable for aqueous solutions [26]. The hollow fibre membrane is originally made for other purposes than microfiltration such as membrane distillation and gas filtration but can be activated to make the membrane hydrophilic [27]. The flat sheet

21
membrane is made with a mix of PP and PVDF where PP acts as a support layer for the PVDF which is the active layer of the membrane and the part during the filtration [7] [28] [29]. The PVDF polymer can be seen in Figure 11. The PVDF polymer can be modified by the manufacturer to be more hydrophilic. The degree of hydrophobicity of the membranes is a relevant factor in regard to filtering organic solutions as milk, where fouling can be increased if the membrane is hydrophobic by interactions between components in the milk and the surface of the membrane. This is defined as membrane-foulant interaction where a foulant particle, which mostly is protein regarding milk composition, travels through the layer of concentration polarization to the membrane surface where non-covalent interaction such as hydrophobic interaction occurs. This interaction happens due to the hydrophobic core in the protein interacts with the surface of the hydrophobic membrane to exclude water molecules from forming hydrogen bonds with each other near the surface. [30] [31] This interaction is relatively weak as an individual but collective it is a huge driving force for adsorption to hydrophobic interactions [31]. When the membrane surface is covered with proteins that have adsorb and blocked the pores in the membrane the layer of fouling on the surface increases by foulant-foulant interactions. The proteins make a hydrophobic interaction with each other and form aggregates that further develop the layer of fouling, which can end up making a gel layer when a critical concentration is reached [30]. This influences the flux by decreasing it but increases the rejection.

22
Chapter 3
Materials and methods 3.1 Membrane characteristic
The flat sheet membrane is an MPF2 from Alfa Laval 20x20 cm sheets. The properties are listed in Table 2. The sheet is cut to fit into the flat sheet test cell. The porosity of the FS membrane is determent by the method in section 3.5.3. The crossflow velocity is calculated from the feed flow rates obtained in section 3.4.2.
Table 2 - Flat sheet membrane characteristics [28]
Support material PP
Coat material PVDF
Pore size (µm) 0.2
pH range (reference temperature 25°C) 1-11
Typical operating pressure (bar) 1-3
Temperature (°C)
Porosity (%)
5-60
42.5
Calculated membrane areal (m2) 0.00557

23
The hollow fibre membrane module contains 19 PP membranes (Hollow fibre membranes (3M, Accurel pp s6/2) cut to 19 cm. The properties are listed in Table 3.
Table 3 - Hollow fibre membrane characteristics [27]
Material Polypropylene
Wall thickness (mm) 0.45
Inner diameter (mm) 1.8
Outer diameter (mm) 2.7
Length of fibres (cm) 19
Shell diameter (cm) 2.1
No. of fibres 19
Porosity (%) 73
Average pore size (µm) 0.2
Implosion pressure (bar) 4
Calculated membrane areal (m2) 0.02041
3.2 Milk composition
For the experiments, commercial skimmed milk was used to be as gentle to the membranes as possible and to prevent fouling. The content of the skimmed and whole milk used can be seen in Table 4 and Table 5. It is taken into account that the content of carbohydrate more or less corresponds to the content of lactose. [32] The total solids content of the milk but is assumed on the bases of these sources. [33] [4]

24
Table 4 - Skimmed milk composition
Fat (%) 0.1
Lactose (%) 4.7
Protein (%) 3.5
Riboflavin (B2) (mg) 0.17
Calcium (mg) 124
Phosphor (mg)
Total solids (%)
97
13
Table 5 - Whole milk composition
Fat (%) 3.5
Lactose (%) 4.6
Protein (%) 3.4
Riboflavin (B2) (mg) 0.17
Calcium (mg) 119
Phosphor (mg)
Total solids (%)
94
13
3.3 System setup
The MF system consists of a feed stream controlled by a magnet drive gear pump (Fluid-o-Tech, Model MG309XDOPE00000), Italy). Figure 13 shows the schematic setup of the system with the HF membrane module connected to the system. The flow is measured with a flow meter (Blue-White, F-450, USA) and the permeate collector is placed on a weight ((KERN & SOHN), Serial no.: WD170057684, Germany) to measure the permeate as it increases. The membrane types are switch between hollow fibre and flat sheet membranes. The FS membrane is placed in a cell (SPINTEC Filtration, static cell, model STC) with crossflow conditions. To make the exchanging the membrane most optimal the membranes have different feed outlet

25
points on the system before entering the membrane. The difference can be seen in Figure 12.
Figure 12 - Microfiltration set-up with hollow fibre membrane attached on the left, and flat sheet membrane attached on the right. The membranes are circled out to indicate the different feed outlet.
Figure 13 - Schematic diagram of the setup
3.4 Filtration experiments
Experiments were performed with water and milk with 0.1 % and 3.5 % fat as filtrate respectively.
3.4.1 Activating membranes
The FS membrane was cleaned before use as instructed by Alfa Laval. The system was flushed with water for 10 min then flushed with water at 45°C for 10 min. 1 M

26
NaOH was added until the pH reached 9.5 and circulated in the system for 30 min. Then the system was flushed with water until pH 7 was reached. [28]
HF membrane was activated before use to make it hydrophilic. This was done by flushing the system with a solution of 50 % v/v isopropanol (100%, VWR, Germany) for 30 minutes. Then the system was flushed with water for 30 min [34]
Both membranes cannot dry out after activation and cleaning, so the flat sheet membranes were kept in a beaker filled with demi water and the hollow fibre membranes were filled with demi water on the inner shell, kept closed with parafilm and topped with demi water every 3-5 days depending on the water level in the membrane.
3.4.2 Flow rate analysis
To test the flow rate of the pump 4 L water was put in the feed tank, and the time it took for the water to run through the system without a membrane attached was determent. The test was performed with varied RPM (600, 1200, 1260, 1350, 1800, 1920, 2160, 2400, 3000, 3600 RPM)
3.4.3 Water filtration
Both membranes were tested with water as filtrate. This was done with 2 L water in the feed tank and tested at 3000 RPM with varied pressures (0.7 bar and 1.4 bar). The permeate collected was measured by weight every five minutes for one hour.
3.4.4 Milk filtration
Filtrations were performed with 2 L milk at 5°C in the feed tank and tested at 3000 RPM with varied pressures (0.7, 1.4, 2.1, 2.8, 3.1 bar). The permeate collected was measured by weight every five minutes for two hours to measure the flux. After filtration 75 mL permeate was collected for further analysis. The samples were preserved with 8 mg bronopol (98 %, Aldrich, China)
A filtration experiment with varied pressure (0.7 and 1 bar) was also performed on both membranes with 2 L skimmed milk (0.1 % fat) at 5°C and the test was performed at 3000 RPM. The permeate collected was measured by weight every ten minutes then the pressure was increased after each permeate measurement.
Filtrations for both membranes was also performed with different RPM (1260 and 3600) at 2.1 bar.

27
To test the limits of the membranes a filtration with whole milk (3.5 % fat) was performed at 3000 RPM at 2.1 bar.
Filtrations for 10 hours was performed to investigate fouling on the membrane at 1.4 bars at 3000 RPM. The permeate was measured every 5 minutes for the first 100 minutes and every 30 minutes for the rest of the filtration.
3.4.5 Cleaning procedure
The system was flushed with demi water 4-5 timers for 10 min each time. 2 L of 0.1 v/v % NaOH was flushed through the system for 20 min and after the system was flushed with demi water for a further 10 min. The water flux was measured to ensure the efficiency of the cleaning procedure. [35]
3.5 Explorative analysis
3.5.1 Chemical composition of permeate samples
The content of fat, protein, lactose and solids for 20 samples was determined at FOSS (Hillerød, Denmark). These analyses were performed with a MilkoScan-FT3 (2020).
3.5.2 Qualitative FT-IR analysis
A TENSOR II FT-IR spectrometer (Burker Optics) controlled by the OPUS software and equipped with platin diamond attenuated total reflectance (ATR) was used to analyse milk and permeate samples. The instrument was purged with nitrogen. The instrument settings use for all analyses are listed in Table 6 [36]. The region of interest for protein absorption is at 1546.8 cm-1, the region for lactose absorption is at 1039.6 cm-1 and the region for fat absorption is at 2873.6 cm-1 [36].
Table 6 - Instrumental conditions
Resolution (cm-1) 8
Number of scans 50
Beam splitter KBr
Interval of scanned data (cm-1) 4000-600
Result spectrum ATR

28
The background spectrum was scanned at the beginning of the measurement by filling the ATR cell with Millipore Q-purified water and using the same instrumental conditions for the measurement of the samples. The same procedure was used for scanning blank spectra. After each scan, the ATR cell was clean in several steps. First, the milk was wiped with a paper tissue. The plate was cleaned with 5 % w/v detergent and wiped with a paper tissue and cleaned with demi water. Thereafter the cell was coated with 10 % v/v EtOH and left to air dry before the cell was cleaned with demi water and wiped with a paper tissue. [36]
3.5.3 Porosity measurement of the flat sheet membrane
The porosity of the flat sheet membrane was measured by the gravimetric method which is based on measuring the weight of the liquid entrapped in the membrane pores. The active layer of the flat sheet membrane was peeled from the support layer, weighed and soaked in kerosene oil (99 %, Aldrich, China) for 24 hours. The membrane was wiped with a paper tissue and weighed. The overall porosity was calculated according to the following formula:
<'(%) = ?
(@1 − @2)A(
(@1 − @2)A(
+@2A%
B · 100%
Where w1 is the weight of the wet membrane and w2 is the weight of the dry membrane. Dk is the density of kerosene oil (0.82 g/cm3). Dp is the density of the polymer (PVDF 1.78 g/cm3). Three measurements were carried out and the average was calculated. [37] [38]
3.5.4 Hydrophobicity analysis
A Thetra Lite optical tensiometer (Biolin Scientific) controlled by OneAttension software was used to measure the contact angle of water in the flat sheet and the hollow fibre membrane. The instrument was calibrated with a ball where the surface and the ball need to be in the image. The camera was adjusted to optimal contrast between the ball and the background, and a calibration session was performed. The pipette was filled with demi water, and the membrane placed on the surface, so it was visual in the camera image. Instrumental settings are listed in Table 7.

29
Table 7 - Instrumental conditions
Analysis mode Contact angle (Young-Laplace)
Start saving when Stroke is at bottom
Light phase Air
Liquid Water 20°C
Drop out size (ul) 5000
The experiment was started and when the drop was formed at the tip of the pipette it was stroked on the membrane surface and the recording started. Then the recording was analysed by the software and the contact angle was calculated. [39]

30
Chapter 4
Results and discussion 4.1 Flux and permeability tendencies of the microfiltration membranes
To test the performance of the two membranes, the pure water flux was measured at different pressures for 60 minutes. Figure 14 illustrates tendencies for each membrane. For the FS membrane, the flux is relatively stable over 60 minutes and follows the tendency that an increase of pressure increases the flux [40]. The HF membrane shows a different tendency, where the pure water flux decreases over time and higher pressure decreases the flux. The flux stabilises after 35 minutes at 0.7. bar and has a 59 % decrease in flux from the start of the filtration to it stabilises over time. The HF membrane was newly activated to make it hydrophilic instead of hydrophobic, so the fibres may still have a degree of hydrophobicity which can cause adsorption of foulant on the membrane surface (concentration polarization) and decrease the hydrophilicity over time and thereby the flux [41] [42] [43]. The degree of hydrophobicity was tested for both membranes by measuring the contact angle of the membrane surface and for HF membrane C = 47,6° and FS C = 29,3°. With the highest contact angle, the HF membrane is more hydrophobic than the FS membrane and thereby more exposed to further decrease in hydrophilicity over time. Regarding the increase in pressure decreases the flux the figure shows, that at higher pressure the flux is more stable from the start of the filtration with a 30 % decrease in flux before stabilising, which can indicate the degree of hydrophobicity has stabilised after activating the membrane. The small decrease in flux at a higher pressure for the HF membrane can be due to an increase in concentration polarization when increasing pressure [41]. At 1.4 bar the HF membrane has the lowest flux compared to the FS membrane which can be due to both the degree of hydrophobicity of the material, a small temperature difference in the water used and thickness of the membranes. It has not been possible to measure the thickness of the FS membrane but a visible change in thickness can be observed, where the fibres are thickest. If the thickness of the membrane increases the flux decreases, which is the general trend where the thinnest membrane (FS) has the highest flux compared to the thicker membrane (HF) [43].

31
To investigate the influence of pressure on the flux for both membranes, a filtration with increased pressure over time was performed using skimmed milk. In other studies done on milk with ultra and microfiltration the flux is between 10 and 20 LMH depending on the pressure, which is also the case for both membranes in this project, as illustrated in [40] [44]. A decrease in flux is observed from Figure 14 to when filtering milk instead of water. For the FS membrane there is a 90 % difference and for the HF membrane 93 % difference in flux when filtering milk instead of water at 1.4 bars. This indicates that the components in milk increase resistance to permeation by deposition on the surface of the membrane as either concentration polarization, fouling or both. The FS membrane has the highest and most stable flux compared to the HF membrane. There is a small increase in the flux, from 18 LMH at no applied pressure to 22 LMH at 1.7 bar, when increasing pressure over time, but also a small drop in flux a 1 bar pressure.
As observed, the flux for HF is lower than for the FS membrane. From the average flux, there is 49 % difference between the flux. The same conditions for the thickness and material for the membranes apply to the difference in flux between the membranes. When filtering milk the degree of hydrophobicity also makes protein adsorb an aggregate on the surface causing fouling to build in and, on the membrane, which is also a reason for a lower flux for the HF membrane [45]. Figure 15 shows that the HF membrane is more sensitive to change in pressure than the FS membrane.
Figure 14 - Flux as function of time at different pressures using water as feed a) FS membrane b) HF membrane
0
100
200
300
400
500
0 10 20 30 40 50 60 70
J (LM
H)
Time (min)
HF (0.7 bar) HF (1.4 bar)
0
50
100
150
200
250
0 10 20 30 40 50 60 70
J (LM
H)
Time (min)
FS (0.7 bar) FS (1.4 bar)
a) b)

32
Figure 15 - Flux as a function of pressure for HF and FS membrane using skimmed milk
To further test pressure influence on flux when filtering milk, both membranes were exposed to filtration at pressures between 1-3 bars. The HF membrane was cleaned after each filtration, and the FS membrane was at some filtrations used twice with cleaning between them and then exchanged for a new to avoid a drastic increase in fouling of the membrane. These filtrations are illustrated in Figure 16.
0
5
10
15
20
25
0 0.2 0.4 0.6 0.8 1 1.2 1.4 1.6 1.8
J(LM
H)
P (bar)
HF FS
Figure 16 - a) Average flux as a function of pressure for HF and FS membrane using skimmed milk with added standard deviations b) Flux as a function of time for HF and FS membrane using skimmed milk at operating pressure 0.7 and 3.1 bar
5
7
9
11
13
15
17
19
21
0 0.5 1 1.5 2 2.5 3 3.5
J (LM
H)
P (bar)
HF
HF
HF
HF
HF
FS
FS
FS
FS
FS
0
5
10
15
20
25
30
0 50 100 150
J (LM
H)
Time (min)
HF (0.7 bar)
HF (3.1 bar)
FS (0.1 bar)
FS (3.1 bar)
a) b)

33
The figure a) shows the same overall tendency as , where the FS membrane has the highest flux compared to the HF membrane. As the operating pressure increases the standard deviation increases indicating an increase in concentration polarization and fouling at higher pressures. The flux does not increase as the pressure increases which can indicate that the retained solutes at the membrane surface reach a gel concentration which has a negative influence on the flux. [41] The flux for all the filtrations is not above the flux for 0.7 bar. The membrane was not changed but washed between filtrations at 0.7 and 1.4 bars and the drop in flux shows that the cleaning was not efficient for the FS membrane. For the rest of the filtrations, the membrane was changed for each filtration. The standard deviation is largest at 3.1 bar, which can be due to specifications of the FS membrane where the maximum recommended operating pressure is 3 bars, which can be seen in Table 2. This can influence the pores in the membrane by stretching so the pore size decreases, which will make the flux decrease. The HF membranes maximum recommended operating pressure is 4 bars, so the max operation pressure in this report should not influence the flux. The flux increases 0.3 LMH from 0.7 to 1.4 bar, which is the only increase in flux under different operating pressures. As the pressure increases the standard deviation increases as well, which indicates that fouling it building over the time of filtration. The decrease in flux at higher pressure can be due to gel formation on the membrane surface. It also indicates that the cleaning procedure is not efficient enough and does not remove all of the gel layer between filtrations and thereby increases the gel layer the more pressure is applied. [41]
When viewing the flux over time for the lowest and highest operating pressure there is a 9.7 % decrease in flux 0.7 to 3.1 bar for the HF membrane and a 10 % decrease in flux from 0.7 to 3.1 bar. It is also observed there is a decrease in flux over time for the five filtrations seen in Figure 16 b) which indicates an increase in concentration polarization or fouling during the filtrations and the cleaning of the HF membrane is not efficient enough.
The flowrates influence on the flux was tested by filtering skimmed milk at three different flow rates (RPM settings) at 1.4 bar for each membrane. The results are illustrated in Figure 17.

34
Figure 17 - Average flux as a function of velocity at 1.4 bar for HF and FS membrane using skimmed milk with added standard deviations
The FS membrane follows the expected trend where when the flow rate increases, the flux increases as well [45]. For the HF membrane, the flux at 0.28 m/s does not follow the trend and has a lower flux than then filtrating at 0.21 m/s. It can indicate a very thick gel layer has been built on the surface of the membrane after many filtrations, which limits the passage through the membrane [46]. This figure shows that the flow rate has an influence on the flux in both membranes.
The flux was also examined for concentrations of fat in milk which is illustrated in Figure 18.
0
5
10
15
20
25
0 0.05 0.1 0.15 0.2 0.25 0.3
J (LM
H)
Velocity (m/s)
HF
HF
HF
FS
FS
FS

35
Figure 18 - Flux as a function of time at 1.4 bar for HF and FS membrane using skimmed (0.1 % fat) and whole milk (3.5 % fat)
For both membranes, a decrease in flux is observed when filtering with whole milk, with a significant decrease in flux at 44 % for the HF membrane and a small decrease at 6 % for the FS membrane. This indicates that the Hf membrane is more sensitive fat content than the FS membrane, which can be due to the higher degree of hydrophobicity of the HF membrane which makes the lipids aggerate under ionic calcium binding as Merin et. al. claims [43]. The aggregating should help provide clear permeate, which is the case for this membrane. [30] [43]
The main difference observed when filtering with milk was the appearance of the permeate from the two membranes. Pictures of the permeate from filtrations in shown on Figure 16 can be seen in Figure 19.
0
2
4
6
8
10
12
14
16
18
0 20 40 60 80 100 120 140
J (LM
H)
Time (min)
HF (0.1 % fat)
HF (3.5 % fat)
FS (0.1 % fat)
FS (3.5 % fat)

36
Figure 19 - Pictures of permeate filtered with HF and FS membrane at different pressures, velocity and feed composition. Left: HF membrane. Right FS membrane
As mentioned before permeability and selectivity is a trade-off between each other where permeability is how fast molecules move through the membrane, and selectivity is the separation of molecules in the feed solution. If the permeability increases the selectivity decreases and vice versa. This is believed to be the case for the FS membrane when observing the appearance of the permeate. As the pressure

37
increases, more molecules are pushed through the membrane, which increases the permeability and thereby decreases the selectivity, which results in the permeate gets more and more cloudy. [16] [23] It also seems that the increase of feed velocity has an effect on the permeability/selectivity since the permeate at 0.28 m/s is cloudier than 0.12 m/s and 2.1 m/s, which has a lower flow rate. The HF membrane makes clear permeate throughout all of the filtrations which indicates a higher selectivity for the HF membrane than the FS membrane.
To support the theory about the permeability/selectivity trade-off the permeability has been calculated at the different operation pressure for both membranes and are illustrated on Figure 20.
Figure 20 - Average permeability as a function of pressure for HF and FS membrane using milk with standard deviations added
This is the opposite of what was expected. The permeability decreases when the pressure is increased even if it is observed that the selectivity decreases as well. This indicates that fouling on the membrane increases and forms a boundary layer of gelatinous material at higher operating pressure. The permeability decreases if there is fouling present at the membrane surface [46] [47]. This is the case for both membranes, but the FS membrane seems to be most affected with a decrease in permeability from 28 LMBH to 12 LMBH where the HF membrane has a smaller decrease from 16 LMBH to 8 LMBH. The fouling of the membrane will be discussed further in the next paragraph.
0
5
10
15
20
25
30
35
0 0.5 1 1.5 2 2.5 3 3.5
Perm
eabi
lity
(LM
BH)
P (bar)
HF
HF
HF
HF
HF
FS
FS
FS
FS
FS

38
4.2 Fouling in the membranes
What has been observed so far in terms of fouling is that fouling is occurring at both membranes since the permeability is decreasing for each new filtration performed as seen in Figure 20, and the flux decreases over time. For the FS membrane fouling must happen immediately as the filtration starts since the flux is mostly stable throughout the filtration time as seen in Figure 16. This type of fouling seems to be influenced by the increase of pressure since the permeability decreases more at higher pressure. The FS membrane is also changed frequently so the fouling is not building up over time if some of the fouling is irreversible. Long-time filtrations for both membranes were performed to investigate the fouling of the membranes and are illustrated in Figure 21.
Figure 21 - Flux as a function of time for HS and FS membrane using skimmed milk
The figure shows different tendencies for the membranes. The FS membrane has a small increase in flux, from 16 LMH to 18 LMH over the first 100 minutes and afterwards, the flux decreases over time, which indicates more fouling is built during filtration. The increase in flux can be due to an increase in the temperature of the milk during the initial states of the filtration, which can increase the flux. It could also be the system reaching steady-state conditions. The FS membrane seems to have the largest decrease in flux over the long period of time from 17 LMH to 11 LMH compared to the HF membrane. The HF membrane has the largest decrease in flux during the first 100 minutes from 12 LMH to 6 LMH, due to fat and protein adsorption on the membrane surface.
0
2
4
6
8
10
12
14
16
18
20
0 100 200 300 400 500 600 700
J (LM
H)
Time (min)
HF FS

39
The flux stabilises after 200 minutes and stays around 4 LMH. Taken into account the HF membrane also has a degree of fouling at the beginning of the filtration as shown in Figure 20, the flux has a significant decrease in the first 100 minutes of filtration. Fouling occurs for both membranes at the start of the filtration and over time where the HF membrane has most fouling at the beginning of the filtration where the FS creates fouling over time. The HF membrane was used to make some reference tests with water and skimmed milk before the filtrations at different pressures were performed. These are illustrated in Figure 22.
This indicates that even with cleaning between filtration the HF membrane became fouled over time and that some of the fouling is irreversible. The average pure water flux of the HF membrane has decreased by 78 % after being used for multiple milk filtrations. The pure water flux does not follow the same trend which can indicate that it has reached a stable degree of hydrophobicity.
For milk as feed solution, the flux has decreased by 19.8 % after multiple filtrations but follow the same trend as before the many filtrations. This indicates that a more efficient cleaning procedure needs to take into account or changing the membrane frequently. It could also be a possibility to pre-treat the milk and separate the fat from the milk serum which would make the feed more suitable for these types of membranes.
Figure 22 - a) Flux as a function of time at 0.7 bar with HF membrane before and after multiple filtrations and using water as feed b) Flux a function of time at 0.7 bar with HF membrane before and after multiple filtrations using skimmed milk as feed
02
468
10121416
0 20 40 60 80 100 120 140
J (LM
H)
Time (min)
HF before HF after
050
100150200250300350400450500
0 10 20 30 40 50 60 70
J (LM
H)
Time (min)
HF before HF after
a) b)

40
4.3 Composition of permeate
Permeate streams from the filtrations with different pressure, flow rate, and fat percentage for both membranes were analysed for the content of fat, protein, lactose and total solids. The composition and rejection of the permeate streams are illustrated in Figure 23. The sample at 2.8 bar for the FS membrane was spoiled and therefore not analysed.
Figure 23 - Concentration and rejection of permeate from filtrations under different pressures for HF and MF membrane for fat (purple), protein (blue), total solids (yellow) and lactose (grey), using skimmed milk
0
20
40
60
80
100
120
0
0.02
0.04
0.06
0.08
0.1
0.7 1.4 2.1 2.8 3.1
Reje
ctio
n (%
)
Con
cent
ratio
n (%
)
P (bar)
HF concentration
FS concentration
HF rejection
FS rejection
78808284868890929496
0
0.1
0.2
0.3
0.4
0.5
0.6
0.7 1.4 2.1 2.8 3.1
Reje
ctio
n (%
)
Con
cent
ratio
n (%
)
P (bar)
HF concentration
FS concentration
HF rejection
FS rejection
40
42
44
46
48
50
52
54
4.8
5
5.2
5.4
5.6
5.8
6
6.2
0.7 1.4 2.1 2.8 3.1
Reje
ctio
n (%
)
Con
cent
ratio
n (%
)
P (bar)
HF concentration
FS concentration
HF rejection
FS rejection
-12
-10
-8
-6
-4
-2
0
2
4.34.44.54.64.74.84.9
55.15.25.3
0.7 1.4 2.1 2.8 3.1
Reje
ctio
n (%
)
Con
cent
ratio
n (%
)
P (bar)
HF concentration
FS concentration
HF rejection
FS rejection

41
The composition of the feed can be seen in Table 4. In general, the different components do not follow the same trend when filtrating under different pressures due to the different size of the components and their influence on the membranes.
The HF membrane has the highest rejection for fat filtration under different pressures at 3.1 bar with a rejection of 96.7 %. There seems to be a small increase in rejection at 2.1 and 3.1 bars but a small decrease in rejection at 1.4 bar. The trend seems to be somewhat stable, with a small difference and small rejection increases as the pressure increases. This can be due to the degree of fouling building in the HF membrane over time. An increase in the gel layer will decrease the flux and increase the rejection [48]. The FS membrane has the highest rejection of fat at 1.4 bars on 84 %, which is 12.7 % lower rejection than the highest rejection from the HF membrane. The rejection at 3.1 bars is 8 %, which is very low rejection in general. The reason for this can be that the recommended maximum operating pressure is 3 bars and can affect the shape and size of the membrane pores, which affects the selectivity of the membrane. The permeate gets cloudier at higher pressures for the FS membrane as seen in Figure 19. The decrease in selectivity should also decrease the rejection.
Regarding protein rejection, the HF membrane has an increasing rejection with higher operating pressure. At 2.1 and 2.8 bars the rejection is the same at 93.3 %, which indicates the pressure increase does not have an effect in that pressure range for this system. At 3.1 bars the rejection is 94.4 %, which indicates the HF membrane filtrates fat better than protein. The FS membrane has the highest rejection of proteins at 1.4 bars at 92 %. This is 2.4 % lower compared to the HF membrane. This filtration is the exception for this trend since the rejection decreases as the pressure increases. The reason for the sudden increase in rejection is due to that the membrane has not been exchanged for this filtration but just cleaned, so fouling has built on the surface of the membrane and increasing the rejection. The decrease in selectivity at increased pressure should also decrease the rejection. The FS membrane filtrates protein better than it filtrates fat, which can be due to some of the protein content is adsorbed to the membrane.
The content of total solids in the permeate for each membrane is quite high since some of the components that are included in this group is smaller than MF membranes can filter. For the HF membrane, the rejection is decreasing at 1.4 bars but increases as more pressure is applied to the system. The highest rejection is at 52.2 % at 3.1 bars for the HF membrane. This again follows the trend with an increase in the fouling layer increases the rejection.

42
The FS membrane has an increase in rejection as more pressure is applied until 2.1 bars which indicate that fouling is building on the surface as more pressure is applied. The rejection decreases at 3.1 bars, which can be due to the pressure alter the size and shape of the pores and influence the selectivity and rejection of the membrane.
In the feed, the content of lactose is 4.7 % and as seen on the grey figure some concentrations are higher, the rejection is in the negative. This can be due to difference in the communicably bought milk and insecurities in the analysis technique. Lactose was taken into account since some are using MF to reduce the lactose content in some types of dairy products [2]. The lactose molecules are too small to be filtered with this type of filtration using this pore size, so the results are inconclusive and will not be included in the paragraph.
The feed velocity influence on the composition of the permeate was tested and are illustrated in Figure 24.

43
Some of the same trends are observed when using different feed velocities as different pressure for the analysed components.
The HF membrane has a 10 % higher rejection compared to the FS membrane when filtering fat and the rejection increases with feed velocity for the HF membrane and decreases at the highest feed velocity for the FS membrane.
For protein rejection, the trend for both membranes is that at 0.21 m/s the rejection is highest. For the HF membrane, the difference in rejection is very small 1.1 % from the highest to the lowest rejection, and for the FS membrane, the difference is larger with a 4 % difference from the highest to the lowest rejection. The reason for the
Figure 24 - Concentration and rejection of permeate from filtrations under different flow rates, at 1.4 bar for HF and MF membrane for fat (purple), protein (blue) and total solids (yellow), using skimmed milk
0
20
40
60
80
100
0
0.005
0.01
0.015
0.02
0.025
0.03
0.035
0.12 0.21 0.28
Rjec
tion
(%)
Con
cent
ratio
n (%
)
Velocity (m/s)
HF concentration
FS concentration
HF rejection
FS rejection
84858687888990919293
0
0.1
0.2
0.3
0.4
0.5
0.12 0.21 0.28
Reje
ctio
n (%
)
Con
cent
ratio
n (%
)
Velocity (m/s)
HF concentration
FS concentration
HF rejection
FS rejection
40
42
44
46
48
50
52
54
4.64.8
5
5.25.45.6
5.86
6.2
0.12 0.21 0.28
Reje
ctio
n (%
)
Con
cent
ratio
n (%
)
Velocity (m/s)
HF concentration
FS concentration
HF rejection
FS rejection

44
high rejection at 0.21 m/s could again be due to fouling because the FS membrane was cleaned and not exchanged between two filtrations.
The content of total solids in the permeate follow the opposite trend for the HF membrane when filtering proteins, where the rejection has a small decrease at 3.8 % with at 0.21 m/s. The trend for the FS membrane is identical for the filtering proteins with an increase at 0.21 m/s.
Between changing the pressure and the flow rate, increased pressure has the most positive effect on rejection when filtrating fat and protein molecules but for total solids, an increase in flow rate has the most positive effect on the rejection.
The composition in the permeate was also examined for concentrations of fat in milk which is illustrated in Figure 25.
Figure 25 - Concentration and rejection of permeate from filtrations under different flow rates, at 1.4 bar for HF and MF membrane for fat (purple), protein (blue) and total solids (yellow), using skimmed milk (0.1 % fat) and whole milk (3.5 % fat)
70
75
80
85
90
95
0
0.005
0.01
0.015
0.02
0.025
0.1 3.5
Reje
ctio
n (%
)
Con
cent
ratio
n (%
)
Fat precentage (%)
HF concentration
FS concentration
HF rejection
FS rejection
90
90.5
91
91.5
92
92.5
0
0.05
0.1
0.15
0.2
0.25
0.3
0.35
0.1 3.5
Reje
ctio
n (%
)
Con
cent
ratio
n (%
)
Fat precentage (%)
HF concentration
FS concentration
HF rejection
FS rejection
47
48
49
50
51
52
53
54
5
5.1
5.2
5.3
5.4
5.5
5.6
5.7
0.1 3.5
Reje
ctio
n (%
)
Con
cent
ratio
n (%
)
Fat precentage (%)
HF concentration
FS concentration
HF rejection
FS rejection

45
The composition of whole milk can be seen in Table 5. The HF membrane has the same rejection when filtering fat molecules from whole milk as for skimmed milk. This can be due to the size difference of MFGM. When there is more fat present in a milk type, the size distribution of the fat can be more varied. The MFGM vary in size from 0.1-20 µm [4], which indicates that a larger amount of the MFGM has a smaller size and therefore pass through the membrane when filtering whole milk. Why the rejection is the same can be due to protein adsorption from the MFGM on the surface of the membrane, which will increase the rejection of fat. The FS membrane rejection decreases when filtering fat molecules in whole milk, which follow the theory about the size distribution of MFGM just stated. The decrease in rejection when filtering whole milk is also the trend for protein rejection, which matched the statement from filtration of fat since an amount of the protein content in milk is in the MFGM [4].
There is an increase in rejection when filtering total solids in whole milk with the HF membrane and a small decrease for the FS membrane. Since the exact number of total solids in milk is not given it is assumed to be 13 % from the literature it can be a larger amount in whole milk which will give a higher rejection if the membrane can retain the components as it seems the HF membrane can [33] [4].
4.3.1 Qualitative FT-IR analysis of composition of permeate
FT-IR is normally a qualitative analysis method to investigate the composition of components. This method has been made quantitative by some companies to e.g., analyse the composition of dairy products. The permeate samples were analysed at the universities FT-IR machine to compare with the analyses performed at FOSS A/S and investigate if it was possible to calibrate the in-house FT-IR for future analysis of milk. This method can be used to determent if there are fat, protein and lactose present in dairy products. The first step was to test milk with known content to see if there was any difference between the curves in the spectra.
This was done with skimmed and whole milk which is illustrated in Figure 26. The spectra look as expected from the literature [36].

46
In the regions of interest is there a clear difference in the curves at the region where fat is located. It is not a large difference in adsorption compared to the 3.4 % difference of fat in the milk. These spectres will be used as reference samples for further analysis. As seen in section 4.3 the concentrations of the different components are close to each other regarding all three components. It is expected not to be able to define FT-IR spectres from each other since the difference in fat needs to be quite large to stand out. Lactose will not be taken into account since it is assumed that lactose is not filtered, and the concentrations are inconclusive. Some curves will be picked out and further described and compared to each other and the reference cells. These are illustrated in Figure 27 with their corresponding concentration for fat and protein in Table 8. A full-scale FT-IR spectre of Figure 27 can be seen in the appendix.
Figure 26 - Typical spectra of water (blank), skimmed and whole milk obtained by ATR-spectroscopy
-0,03
-0,02
-0,01
0
0,01
0,02
0,03
050010001500200025003000350040004500
Abs
orba
nce
Wavenumber (cm -1)
water skimmed milk whole milk
ProteinLactose
Fat

47
Table 8 - Concentrations of fat and protein in permeate and retentate for five different filtrations
Sample 1 2 3 4 5
Cfat 0.009 0.1 0.016 0.15 0.092
Cprotein 0.27 4.5 0.28 2.92 0.55
The content of fat and protein of skimmed milk can be seen in Table 4. The five samples are all samples from filtration using skim milk as feed. The spectrum for whole milk is illustrated to see if some of the samples have a higher peak, which is not the case. Sample 1 has the lowest content of fat, sample 2 has the same concentration of fat as skimmed milk and sample 5 has almost the same fat content as skimmed milk. Overall, it is observed that samples with significantly lower fat content have a lower peak compared to the peak for skimmed milk. Samples with higher concentrations of fat have a peak closer to the reference for skimmed milk. No trend is observed to distinguish the exact concentrations from each other since sample 2 with the same concentration for skimmed milk has a higher peak and sample 4 with a higher concentration of fat than skimmed milk has a lower peak. The peaks in the protein region follow the concentrations in the samples, where sample 2 and 4 have the highest concentration of protein and sample 1, 3 and 5 have the lowest concentration. Sample 2 has a higher concentration of proteins than skimmed milk, and also the highest peak in the spectra. Sample 4 has a small
Figure 27 - FT-IR spectra for five samples of both permeate and retentate for filtrations
-0,03
-0,02
-0,01
0
0,01
0,02
0,03
050010001500200025003000350040004500
Abs
orba
nce
Wavenumber (cm -1)
Water Skimmed milk Whole milk 1 2 3 4 5
Fat Protein

48
decrease in concentration than skimmed milk and the peak is a bit lower than the peak for skimmed milk. The trend continuous for samples with low concentration where sample 5 has the highest concentration in that region and sample 1 and 3 has the same concentration and their peaks overlap. This makes the FT-IR method capable of determent protein concentrations in a close range, but not fat concentrations other than an overall tendency.

49
Chapter 5
Conclusion
A flat sheet membrane and a hollow fibre membrane was used to filtrate milk with 0.1 and 3.5 % fat as feed solutions. Fluxes of approximately 10-12 LMH for the HF membrane and 17-20 LMH for the FS membrane were achieved with feed solutions of skimmed milk and a pressure range from 0.7-3.1 bars. Rejections of 91-97 % for fat, 90-94 % for protein and 49-53 % for total solids were achieved for the HF membrane and 8-84 % for fat, 84-92 % for protein and 44-52 % for total solids. The thickness of the membrane influences the flux. An increase in pressure influences the fouling building in the membrane which affects the flux negatively and the rejection positively. The degree of hydrophobicity of the membranes has an influence on the fouling in regard to protein adsorption at a higher degree of hydrophobicity. The cleaning procedure was not optimal and could be improved, however, it did remove some degree of fouling. Increasing feed velocity increases flux and lowers the rejection for the FS membrane where no link was observed between the flux and rejection for the HF membrane. Changing the fat composition of the feed solution affected both membranes with lower flux and lower rejection. This can be due to a change in the size distribution of the MFGM at higher concentrations of fat in milk.
Some general trends were observed when comparing the qualitative FT-IR method with the quantitative method. The intensity of the peaks for protein content follows the concentration of protein with higher content of protein more intense peak. The peak intensity for fat did not match the concentration of fat in the samples.

50
Chapter 6
Perspectives
The cleaning procedure of the membrane would be the main improvement in this project. The cleaning time could be increased, and some enzymatic cleaning agents can be added to remove the biofilm and still be gentle on the polymeric membranes. Fouling of both membranes was observed, however, it would be relevant to the formation of fouling in regard to the degree of hydrophobicity of the membranes but also in regard to pre-treating the milk to remove some of the components to see if the degree of fouling decreased. The content of fat, protein, lactose and total solids was investigated in this project, but it could also be interesting to investigate the content of bacteria in milk, which is what MF usually do in regard to filtration milk. It could be done with raw milk, so the milk is not processed before filtration. The membranes used for this project differ in some of their properties such as thickness, material and porosity. It could be relevant to have membranes with very similar properties but different membrane designs, and that could be hydrophilic to decrease the degree of fouling on the membranes.

51
Chapter 7
Bibliography
[1] T. T. Le, A. D. Cabaltica and V. M. Bui, “Membrane separations in dairy processing,” JOURNAL OF FOOD RESEARCH AND TECHNOLOGY, 2014.
[2] GEA, “Membrane filtration in the dairy industry,” GEA company Denmark, 2017.
[3] “Milk production,” Food and Agriculture Organisation of the United Nations , 2018 . [Online]. Available: http://www.fao.org/dairy-production-products/production/en/. [Accessed 5 January 2021].
[4] G. Bylund, Dairy Processing handbook, Tetra Pak, 1995.
[5] O. E. Hansen, “Hvordan laver man mælk?,” Arla, 30 October 2017. [Online]. Available: https://www.arla.dk/artikler/hvordan-laver-man-malk. [Accessed 15 January 2021].
[6] C. A. M., “Milk Microfiltration,” in Encyclopedia of Membranes , Springer , 2016, pp. 1310-1312.
[7] A. Y. Tamime, Membrane Processing, Blackwell Publishing Ltd, 2013.
[8] “Membrane types and application,” Tetra Pak, [Online]. Available: https://www.tetrapak.com/solutions/processing/main-technology-area/membrane-filtration/membrane-types. [Accessed 9 Marts 2021].
[9] L. M. Camacho, L. Dumèe, J. Zhang, J.-d. Li, M. Duke, J. Gomez and S. Gray, “Advances in Membrane Distillation for Water Desalination and Purification Applications,” MDPI, 2012.
[10] H. D. Belitz, W. Grosch and P. Schieberle, “Milk and Dairy Products,” in Food Chemistry, Berlin, Springer , 2009, pp. 498-543.
[11] T. T. Le, A. D. Cabalita and V. M. Bui, “Membrane separations in dairy processing,” in Journal of food research and technology , 2014.
52
[12] “Fats (Lipids),” DariyNZ, [Online]. Available: https://www.dairynz.co.nz/feed/nutrition/principles-of-nutrition/fats/. [Accessed 9 Marts 2021].
[13] P. Walstra, “Casein sub-micells: do they exist?,” in International Dairy Journal 9, Elsevier , 1999, pp. 189-192.
[14] A. L. Kelly, F. O'Flaherty and P. E. Fox, “Indigenous proteolytic enzymes in milk: A brief overwiew of the present state of knowledge,” in International Dairy Journal 16, Elsevier, 2006, pp. 563-572.
[15] M. N. Alhussien and A. K. Dang, “Milk somatic cells, factors influencing their release, future prospects, and practical utility in dairy animals: An overview,” Vet world , 2018.
[16] M. K. Purkait and R. Singh, Membrane Technology in Separation Science, Taylor & Francis Group, 2018, pp. 2-32.
[17] G. Foley, in Membrane filtration - Aproblem solving approach with MATLAB, Introduction to membrane filtration of liquids, Cambridge University Press, 2013, pp. 1-4.
[18] S. Sridhar, B. Smitha and T. M. Aminabhavi, “Separation of Carbon Dioxide from Natural Gas Mixtures through Polymeric Membranes - A Review,” Separation and Purification Reviews, pp. 129-130, 13 July 2007.
[19] J. C. Crittenden, R. R. Trussell, W. D. Hand, K. J. Howe and G. Tchobanoglous, Water treatment principles and design, John Wiley & Sons, Inc., 2012.
[20] “Gallery,” ZENA MEMBRANES, [Online]. Available: http://www.zena-membranes.cz/index.php/gallery/othergalery. [Accessed 9 Marts 2021].
[21] K. Hu and J. M. Dickson, Membrane Processing for Dairy Ingredient Separation, John Wiley & Sons, Ltd and the Institute of Food Technologists, 2015.
[22] Sterlitech, “Tech Tips: Cross Flow Velocity (CFV),” Sterlitech, 13 July 2016. [Online]. Available: https://www.sterlitech.com/blog/post/tech-tips-cross-flow-velocity-cfv. [Accessed 6 May 2021].

53
[23] H. B. Park, J. Kamcev, L. M. Robeson, M. Elimelech and B. D. Freeman, “Maximizing the right stuff: The trade-off between membrane permeability and selectivity,” Science , 2017.
[24] G. Brans, C. Schroen, R. van der Sman and R. Boom, “Membrane fractionation of milk: state of the art and challenges,” in Journal of Membrane Science, Elsevier, 2004, pp. 263-272.
[25] K. H. Clement, P. Fangel, A. D. Jensen and K. Thomsen, Kemiske Enhedsoperationer, Polyteknisk Forlag, 2017.
[26] N. F. Himma, S. Anisah, N. Prasetya and I. G. Wenten, “Advances in preparation, modification, and application of polypropylene membrane,” Journal of Polymer Engineering, September 2015.
[27] 3M Science Applied to Life , “3MTM Capillary Membrane MF-PP Series, Type S6/2,” Lenntech, 2018.
[28] Alfa Laval , “MF flat sheet,” 2015. [Online]. Available: https://www.alfalaval.dk/produkter-og-losninger/separation/membraner/flat-sheet-membraner/mf-flat-sheet/.
[29] M. Camilleri-Rumbau, B. Norddahl, J. Wei, K. Christensen and L. Søtoft, “Microfiltration and ultrafiltration as a post treatment to biogas plant digestates for producing concentrated fertilizers,” University of Southern Denmark, 2013.
[30] H. Xu, K. Xiao, X. Wang, S. Liang, C. Wei, X. Wen and X. Huang, “Outlining the Roles of Membrane- Foulant and Foulant-Foulant Interactions in Organic Fouling During Microfiltration and Ultrafiltration: A Mini-Review,” Frontiers in Chemistry, 2020.
[31] T. R.Kyriakides, “Chapter 5 - Molecular Events at Tissue–Biomaterial Interface,” in Host Respond to biomaterials , Academic Press, 2015, pp. 81-116.
[32] “Kulhydrat i mælk,” Mejeriforeningen og Landbrug & Fødevarer, 2020. [Online]. Available: https://maelken.dk/sundhed/maelkens-naeringsstoffer/kulhydrat/. [Accessed 30 April 2021].

54
[33] “Definitions,” International Dairy Foods Assosiation , 2021. [Online]. Available: https://www.idfa.org/definition. [Accessed 30 April 2021].
[34] MICRODYN-NADIR, “Handling Instructions MICRODYN-Module,” MICRODYN-NADIR.
[35] R. Schopf, F. Schmidt and U. Kulozik, “Impact of hollow fiber membrane length on the milk protein fractionation,” Elsevier, 2020.
[36] F. A. Iñón, S. Garrigues and M. de la Guardia, “Nutritional parameters of commercially available milk samples by FTIR and chemometric techniques,” in Analytica Chimica Acta 513, Elsevier, 2004, pp. 401-412.
[37] S. Simone, A. Figoli, A. Criscuoli, M. C. Carnevale, A. Rosselli and E. Drioli, “Preparation of hollow fibre membranes from PVDF/PVP blends and their application in VMD,” in Journal of Membrane Science, Elsevier, 2010, pp. 219-232.
[38] E. Drioli, A. Ali, S. Simone, F. Macedonio, S. A. AL-Jlil, F. A. Shabonah, H. Al-Romaih, O. Al-Harbi, A. Figoli and A. Criscuoli, “Novel PVDF hollow fiber membranes for vacuum and direct contact membrane distillation applications,” in Separation and Purification Technology, Elsevier, 2013, pp. 27-38.
[39] Biolin Scientific, “Thete Lite User Manual - OneAttension,” Biolin Scientific.
[40] M. Namvar-Mahboub and M. Pakizeh, “Experimental study of lactose hydrolysis and separation in CSTR-UF membrane reactor,” ResearchGate, 2012.
[41] A. Abdelrasoul, H. Doan and A. Lohi, “Fouling in Membrane Filtration and Remediation Methods,” INTECH, 2013.
[42] N. Said, Y. S. Khoo, W. J. Lau, M. Gürsoy, M. Karaman, T. M. Ting , E. Abouzari-Lotf and A. F. Ismail , “Rapid Surface Modification of Ultrafiltration Membranes for Enhanced Antifouling Properties,” MDPI, 2020.

55
[43] F. Niu, M. Huang, T. Cai and L. Meng, “Effect of Membrane Thickness on Properties of FO Membranes with Nanofibrous Substrate,” IOP Publishing, 2018.
[44] J. Zulewska, J. Kowalik and B. Dec, “Flux and transmission of β-casein during cold microfiltration of skim milk subjected to different heat treatments,” American Dairy Science Association, 2018.
[45] C. Güell and R. H. Davis, “Membrane fouling during microfiltration of protein mixtures,” in Journal of MembraneScience, Elsevier, 1996, pp. 269-284.
[46] U. Merin and G. Daufin, “Crossflow microfiltration in the dairy industry: state-of-the-art,” Elsevier, 1990.
[47] S. M. Sadr and D. P. Saroj, “Membrane technologies for municipal wastewater treatment,” in Advances in Membrane Technologies for Water Treatment : Materials, Processes and Applications, Elsevier, 2015, pp. 443-459.
[48] A. I. Schafer, A. G. Fane and T. D. Waite, “Fouling effects on rejection in the membrane filtration of natural waters,” in Desalination, Elsevier, 2000, pp. 215-224.
[49] S. Buetehorn, F. Carstensen, T. Wintgens, T. Melin, D. Volmering and K. Vossenkaul, “Permeate flux decline in cross-flow microfiltration at constant pressure,” in Desalination, Elsevier, 2009, pp. 985-990.

Chapter 8
Appendix
-0,03
-0,02
-0,01
0
0,01
0,02
0,03
050010001500200025003000350040004500
Abs
orba
nce
Wavenumber (cm-1)
Water Skimmed milk Whole milk 1 2 3 4 5
Related Documents