Cross-sectional analysis of anatomical shape change over time via statistics on 4D within-subject flows Ali R. Khan 1 , Alain Trouv´ e 2 , and Mirza Faisal Beg 1 1 School of Engineering Science, Simon Fraser University, 8888 University Drive, Burnaby BC, V5A 1S6, Canada [email protected] , [email protected] 2 CMLA, Ecole Normale Sup´ erieure, 61, Av. du Pr´ esident Wilson, 94235 Cachan C´ edex, France [email protected] Abstract. Anatomical shape change over time is a biomarker for track- ing disease progression. Given a database of anatomical images where each subject is represented by a time-series of images that have been ac- quired over time, algorithms for estimation of longitudinal progression of morphometric changes over time are required to address 1) the common practical issue where not all subjects are sampled at uniform and ho- mogenous time instants, and 2) the fact that the baseline image for each subject is different hence changes with respect to baseline for each sub- ject are with respect to a different starting frame of reference. To address the first issue, we have previously shown how to estimate the flow of vec- tor fields interpolating through the given time-series of followup images starting from each subject‘s baseline image in the large deformation dif- feomorphic metric matching (LDDMM). In this work, we show one way of addressing issue 2, namely, the normalization of the 4D within-subject flows estimated with respect to individual baseline images into a com- mon central template. We apply this method on the hippocampus shape taken from a small database of 5 controls and 5 cognitively-impaired no dementia (CIND) subjects that underwent magnetic resonance (MR) imaging every 3-6 months over 2 years. The time-series images for each subject were segmented for extracting the hippocampus using an auto- mated multi-atlas segmentation method, and these were used to generate the longitudinal within-subject flow of vector fields with reference to the baseline shape. Then, these flows were transformed into a central unbi- ased hyper-template shape created from the baseline shapes to provide a common frame of reference. In this central template frame of reference, standard statistical methods can be applied to the 4D vector fields, such as average flows and principle modes of variation in the 4D flows. We computed the means and principal modes of variations for both the con- trol and the CIND group in the central template and demonstrate their time evolution. Statistical analysis on the dimensionality-reduced flow showed significant group differences in the hippocampus shape change over time between the controls and the CIND group. With the increas- ing availability of time-series data, this method is likely to find use in

Welcome message from author
This document is posted to help you gain knowledge. Please leave a comment to let me know what you think about it! Share it to your friends and learn new things together.
Transcript
Cross-sectional analysis of anatomical shapechange over time via statistics on 4D
within-subject flows
Ali R. Khan1, Alain Trouve2, and Mirza Faisal Beg1
1 School of Engineering Science, Simon Fraser University, 8888 University Drive,Burnaby BC, V5A 1S6, Canada
[email protected] , [email protected] CMLA, Ecole Normale Superieure, 61, Av. du President Wilson, 94235 Cachan
Cedex, [email protected]
Abstract. Anatomical shape change over time is a biomarker for track-ing disease progression. Given a database of anatomical images whereeach subject is represented by a time-series of images that have been ac-quired over time, algorithms for estimation of longitudinal progression ofmorphometric changes over time are required to address 1) the commonpractical issue where not all subjects are sampled at uniform and ho-mogenous time instants, and 2) the fact that the baseline image for eachsubject is different hence changes with respect to baseline for each sub-ject are with respect to a different starting frame of reference. To addressthe first issue, we have previously shown how to estimate the flow of vec-tor fields interpolating through the given time-series of followup imagesstarting from each subject‘s baseline image in the large deformation dif-feomorphic metric matching (LDDMM). In this work, we show one wayof addressing issue 2, namely, the normalization of the 4D within-subjectflows estimated with respect to individual baseline images into a com-mon central template. We apply this method on the hippocampus shapetaken from a small database of 5 controls and 5 cognitively-impairedno dementia (CIND) subjects that underwent magnetic resonance (MR)imaging every 3-6 months over 2 years. The time-series images for eachsubject were segmented for extracting the hippocampus using an auto-mated multi-atlas segmentation method, and these were used to generatethe longitudinal within-subject flow of vector fields with reference to thebaseline shape. Then, these flows were transformed into a central unbi-ased hyper-template shape created from the baseline shapes to provide acommon frame of reference. In this central template frame of reference,standard statistical methods can be applied to the 4D vector fields, suchas average flows and principle modes of variation in the 4D flows. Wecomputed the means and principal modes of variations for both the con-trol and the CIND group in the central template and demonstrate theirtime evolution. Statistical analysis on the dimensionality-reduced flowshowed significant group differences in the hippocampus shape changeover time between the controls and the CIND group. With the increas-ing availability of time-series data, this method is likely to find use in
II
understanding the space-time patterns of evolution of anatomical changein normal control subjects and those within a disease group.
1 Introduction
Morphometric quantification of shape change over time is a potentially promis-ing tool for early detection, diagnosis, and followup of diseases that demonstratedistinguishable space-time patterns of progression in the acquired in-vivo images.With the increasing trend towards acquisition of longitudinal datasets containingseveral 3D anatomical images acquired over time for each individual, techniquesfor the analysis of shape changes occurring over time have become increasinglydesirable. Several databases now exist and are being collected that provide im-ages of human anatomy, in particular, the living human brain in controls anddisease taken at several time points for each individual. Cross-sectional analysisof these time-indexed changes is challenging as 1) images are not acquired atthe same time-instant for each individual, 2) some individuals may miss someimaging sessions, and 3) although each subject’s baseline can serve as his/herown control, relating shape changes over time computed with respect to baselineof the individual subject to changes in others across the database is challengingas each subject’s baseline image is different.
The dynamic growth model [1, 2], which constructs deformations of a base-line template image to represent the time series of images acquired over time,presents a natural choice to represent within-subject time-indexed shape changedue to it’s inherent smoothness obtained by parameterizing the deformation interms of smooth time-indexed velocity vector fields that define the deformations.Extension to interpolating and representing shape evolution in a discrete set oftime-indexed images was presented in our previous work [3] allowing the accom-modation of irregularly time-sampled or missing data. Only a few techniquesnow exist to analyze the time-series of images where more than two images aregiven for each subject. One of these recent techniques is the point-set basedtime-sequence diffeomorphic metric mapping and a parallel transport mecha-nism to compare shape change over time across subjects [4]. Another technique,also using point sets, performed longitudinal shape regression along with spatio-temporal pairwise registration to facilitate cross-subject longitudinal compar-isons [5]. Previous work in cardiac motion analysis used non-rigid registrationof end-diastolic images to compare cross-subject motion fields [6] in a commonreference frame, but did not perform quantitative analysis of the motion fields.More recently, mean motion models of respiratory lung motion [7] were gen-erated using the Log-Euclidean mean of mapped transformations obtained viaintra-subject and inter-subject diffeomorphic registration.
This paper presents a principled method for the construction and cross-sectional statistical analysis of the flow of velocity vector fields for describingshape change of volumetric 3D brain structures taken from magnetic resonancegrayscale images (MRI) acquired over time. The first step is to segment the struc-ture of interest, in this case, the hippocampus, from the time-series of in-vivo
III
brain images. The segmentation is performed with a standard multi-atlas fusionstrategy. Using these binary images representing anatomical shape, the next stepis to estimate a within-subject flow carrying the subject’s baseline segmentationimage through corresponding segmentations from each of the acquired followupimages. To account for heterogeneity in baseline images for comparison acrosssubjects in a database, an unbiased central hyper-template image is computed.The novel contribution of this paper is a method to normalize each within-subject4D flow to the frame of reference of this central template. This transfer of frameof reference creates a correspondence between different within-subject flows thatwere each constructed with respect to a different baseline image. Finally, themean and ‘principal directions’ of time evolution are computed to explore thegroup differences in the given populations. We test and evaluate our frameworkon the evolution of hippocampal shape over time in a set of 5 controls and5 patients (cognitively-impaired no dementia or CIND subjects), each scannedseveral times over 2 years.
2 Method & Materials
2.1 Automated subcortical segmentation with multi-atlas fusion
Accurate segmentation of MRI images over time within an individual is im-portant as changes due to disease processes can be subtle and easily swampedby errors in segmentation. Automated atlas-based methods for subcortical seg-mentation, in particular multi-atlas fusion, have been shown to be reasonablyaccurate [8]. In this approach, several images are designated as database tem-plates, and manually segmented to obtain accurate representations of the objectof interest. In the experiments presented here, a group of six brain MRI scansfrom elderly subjects with manually delineated segmentations were designatedas templates. Each of these templates is then used to segment each target brainimage in the database resulting in six segmentations for each target brain image,which are then fused to create a final segmentation. This step was conducted us-ing our existing large deformation atlas-based brain MRI segmentation approach[9], which used Freesurfer automated segmentation labels to initialize a region ofinterest (ROI) for subsequent grayscale image registration. The manual segmen-tation from each template was propagated using the resulting transformationafter grayscale matching to generate the target segmentation, and multiple tar-get segmentations were fused via a simple voxel-based average to create the finaltarget segmentation. Several techniques can be used to generate automated seg-mentations, and depending on the particular application, some techniques maybe more advantageous than others. The final result is a set of 3D segmentationsrepresenting the anatomy of interest as observed in each baseline and follow-upimage.
IV
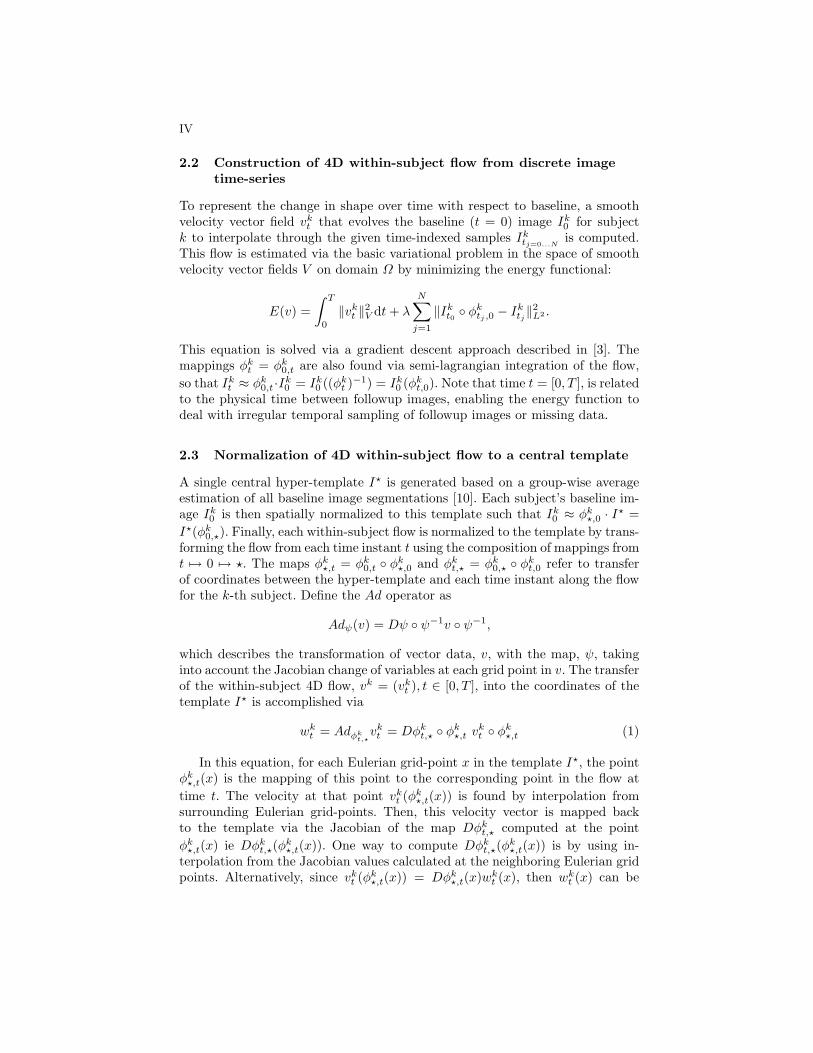
2.2 Construction of 4D within-subject flow from discrete imagetime-series
To represent the change in shape over time with respect to baseline, a smoothvelocity vector field vkt that evolves the baseline (t = 0) image Ik0 for subjectk to interpolate through the given time-indexed samples Iktj=0...N
is computed.This flow is estimated via the basic variational problem in the space of smoothvelocity vector fields V on domain Ω by minimizing the energy functional:
E(v) =∫ T
0
‖vkt ‖2V dt+ λ
N∑j=1
‖Ikt0 φktj ,0 − Iktj‖2L2 .
This equation is solved via a gradient descent approach described in [3]. Themappings φkt = φk0,t are also found via semi-lagrangian integration of the flow,so that Ikt ≈ φk0,t ·Ik0 = Ik0 ((φkt )−1) = Ik0 (φkt,0). Note that time t = [0, T ], is relatedto the physical time between followup images, enabling the energy function todeal with irregular temporal sampling of followup images or missing data.
2.3 Normalization of 4D within-subject flow to a central template
A single central hyper-template I? is generated based on a group-wise averageestimation of all baseline image segmentations [10]. Each subject’s baseline im-age Ik0 is then spatially normalized to this template such that Ik0 ≈ φk?,0 · I? =I?(φk0,?). Finally, each within-subject flow is normalized to the template by trans-forming the flow from each time instant t using the composition of mappings fromt 7→ 0 7→ ?. The maps φk?,t = φk0,t φk?,0 and φkt,? = φk0,? φkt,0 refer to transferof coordinates between the hyper-template and each time instant along the flowfor the k-th subject. Define the Ad operator as
Adψ(v) = Dψ ψ−1v ψ−1,
which describes the transformation of vector data, v, with the map, ψ, takinginto account the Jacobian change of variables at each grid point in v. The transferof the within-subject 4D flow, vk = (vkt ), t ∈ [0, T ], into the coordinates of thetemplate I? is accomplished via
wkt = Adφkt,?vkt = Dφkt,? φk?,t vkt φk?,t (1)
In this equation, for each Eulerian grid-point x in the template I?, the pointφk?,t(x) is the mapping of this point to the corresponding point in the flow attime t. The velocity at that point vkt (φk?,t(x)) is found by interpolation fromsurrounding Eulerian grid-points. Then, this velocity vector is mapped backto the template via the Jacobian of the map Dφkt,? computed at the pointφk?,t(x) ie Dφkt,?(φ
k?,t(x)). One way to compute Dφkt,?(φ
k?,t(x)) is by using in-
terpolation from the Jacobian values calculated at the neighboring Eulerian gridpoints. Alternatively, since vkt (φk?,t(x)) = Dφk?,t(x)wkt (x), then wkt (x) can be

V
computed via solving a linear system at each point x. The partial derivativesη1 = ∂/∂x1(φ?,t), η2 = ∂/∂x2(φ?,t), η3 = ∂/∂x3(φ?,t) are available at each pointx, and the velocity vkt (φk?,t(x)) = (b1 b2 b3)t is available for the point φk?,t(x).Then, vkt (φk?,t(x)) = Dφk?,t(x)wkt (x) where wkt = (a1 a2 a3)t can be written as(b1 b2 b3)t = a1η1 + a2η2 + a3η3 and solved using standard techniques.
The procedure specified by Equation 1 maps all within-subject 4D flows tothe same central hyper-template removing the individual baseline differencesfrom which the flows were built, and temporally compressing all the 4D vectorfields into the coordinates of the hyper-template. Figure 1 shows a visual repre-sentation of how 4D within-subject flows are normalized to a central template.
vt1vt2 vt3
wt1wt2
wt3 wt = Adφt,vt
!" #" $" %" &" '!" '#" '$" '%" '&" #!" ##" #$"
It0 It1 It2 It3 It4 It5 It6 I1t0 I2
t0 IN−1t0
INt0
I
!" #" $" %" &" '!" '#" '$" '%"
φ0,t
φ,0I
φt, = φ0, φt,0
It=0...T
It=0...T
Fig. 1. A schematic showing normalization of a 4D within-subject flow, starting withthe generation of the within-subject flows (upper-left), the generation of the hyper-template (upper-right), the composition of the maps from 4D flow to hyper-template(lower-left), and the normalization of the flow into the frame of reference of the centraltemplate via the Ad operator (lower-right).
Taking advantage of the vector-space properties of trajectories wkt in a com-mon hyper-template, operations such as average flow wt = (1/M)
∑Mk=1 w
kt in
the hyper-template can be performed. The average evolution can be defined to beφt, φ0 = id and follows the evolution specified by d/dt φt = Dφtwt. The cross-sectional average shape evolution over time is thus given by It = φtI
? = I?(φ−1t )
and also, the Eulerian velocity vt corresponding to the average hyper-templatevelocity wt is found by vt = Adφt
wt. The inverse maps φ−1t = φt,0 follow the
equation
∂/∂t (φt,0 φ0,t) = ∂/∂t φt,0(φ0,t) +Dφt,0(φ0,t)Dφ0,twt = 0
and therefore, ∂/∂t φt,0 = −wt(φt,0). For the average inverse map, denotingφ−1t = φt,0 = ηt, φ−1
0 = η0 = id, the equation for the average inverse map
VI
evolution becomes d/dt ηt = −wt(ηt) which is in the form of the standard ODEφt = vt(φt) implemented previously in [11].
2.4 Statistical evolution of within-subject 4D flows in thehyper-template
By placing each within-subject’s hyper-template normalized flow in a matrixW = [w1w2 · · ·wM ] of dimensionality (n = Nx × Ny × Nz × T × 3) ×M , wecan perform PCA on this database matrix to find principal components thatbest capture the variability of the database. By projecting each column of Won the subspace spanned by a reduced set of principal components, we canrepresent a within-subject 4D flow in the reduced dimensionality space, wherethe coefficients are directly amenable to statistical tests on the reduced data.
Furthermore, we can also reconstruct the within-subject flows based on asingle principal component ‘direction’. Let WPCi be the database matrix formedfrom the projection of each hyper-template-indexed within-subject flow on thesubspace of the ith principal component. The mean over a subset of columns,representing the two groups, would generate the mean trajectory of that subsetof subjects along the ith principal component. These hyper-template-indexed‘principal component flows’ can then be integrated as described above to generatetime-evolutions of the hyper-template along those ‘directions’.
2.5 Materials
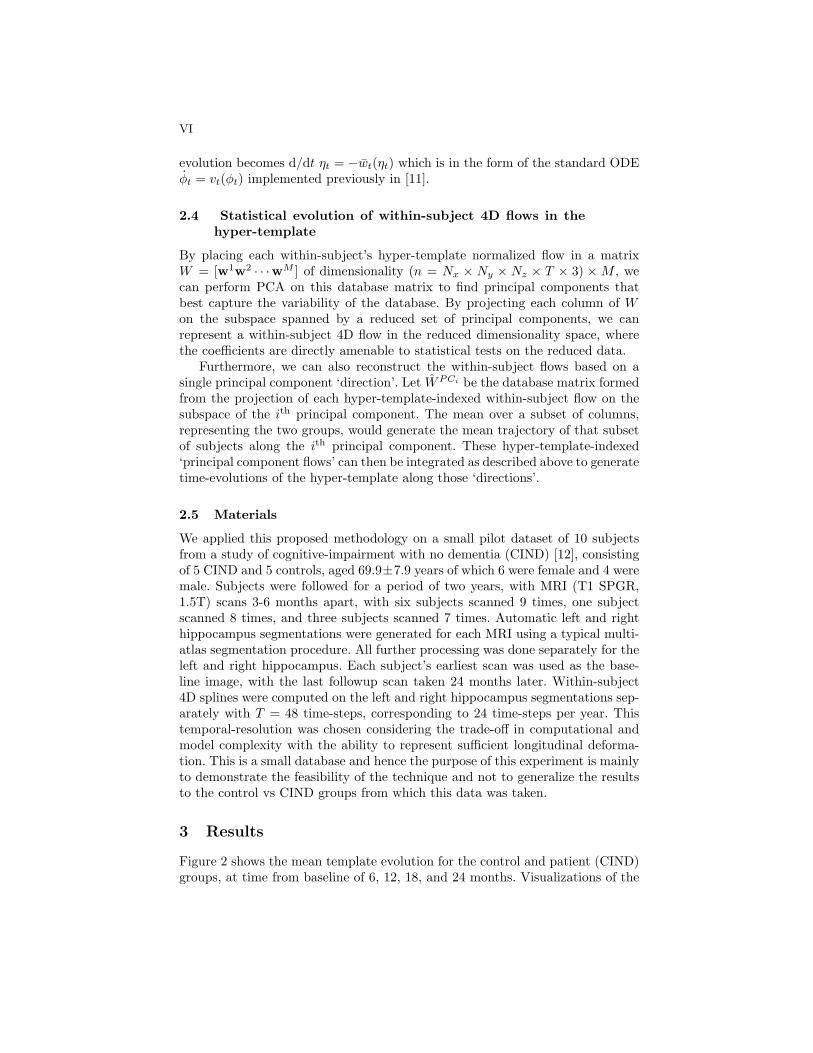
We applied this proposed methodology on a small pilot dataset of 10 subjectsfrom a study of cognitive-impairment with no dementia (CIND) [12], consistingof 5 CIND and 5 controls, aged 69.9±7.9 years of which 6 were female and 4 weremale. Subjects were followed for a period of two years, with MRI (T1 SPGR,1.5T) scans 3-6 months apart, with six subjects scanned 9 times, one subjectscanned 8 times, and three subjects scanned 7 times. Automatic left and righthippocampus segmentations were generated for each MRI using a typical multi-atlas segmentation procedure. All further processing was done separately for theleft and right hippocampus. Each subject’s earliest scan was used as the base-line image, with the last followup scan taken 24 months later. Within-subject4D splines were computed on the left and right hippocampus segmentations sep-arately with T = 48 time-steps, corresponding to 24 time-steps per year. Thistemporal-resolution was chosen considering the trade-off in computational andmodel complexity with the ability to represent sufficient longitudinal deforma-tion. This is a small database and hence the purpose of this experiment is mainlyto demonstrate the feasibility of the technique and not to generalize the resultsto the control vs CIND groups from which this data was taken.
3 Results
Figure 2 shows the mean template evolution for the control and patient (CIND)groups, at time from baseline of 6, 12, 18, and 24 months. Visualizations of the

VII
evolved template shape at each point of the flow, t = T , were generated using anisosurface of the propagated template, colored by the determinant of the Jaco-bian of the map. PCA was performed on the hyper-template indexed flows to gen-erate reconstructions using each of the 9 principal components, WPCi , i = 1 . . . 9.As described earlier, the columns corresponding to flows of the control and CINDsubjects were extracted from the database matrix to generate flows along eachprincipal component ‘direction’. The evolved hyper-template shape at the end-points of these flows are shown in Figure 3 where there are noticeable differencesin the evolution of the hyper-template along the principal directions specified bythe two groups. For example, the evolution along the left fifth principal compo-nent displays a different pattern of atrophy between the controls and the CINDgroup.
Statistics on mean coefficients along each principal component (the ‘dimensionality-reduced flows’) for each group are plotted in Figure 4. Comparing these plots tothe visualizations of Figure 3, one can see the space-time representation of thebetween-group differences. To determine if there are any statistically significantgroup differences, we performed two-sided Student t-tests on coefficients alongeach of the ‘principal directions’, with a null-hypothesis of equal means. We foundstatistically significant group differences for the left hippocampus’ 5th coefficient(p-value=0.042) and the right hippocampus’ 4th coefficient (p-value=0.0074), allother p-values were higher than 0.05 and are thus not reported.
The top 4 most significant t-test coefficients from each side, (right=[2, 4, 6, 9],left=[2, 5, 6, 9]), were selected to determine if a subset of coefficients along prin-cipal components taken together can provide evidence of statistically signifi-cant group differences. The Hotelling T 2 statistic was used with permutationtesting(n=10,000) to determine significance, resulting in significant group dif-ferences for both left (T 2=118.44, effect size=6.88, p-value=0.0104) and right(T 2=176.95, effect size=8.41, p-value=0.0060) hippocampal shape evolution overtime.
Contr
ols
1.15
0.85
1.0
CIN
D
Baseline 6 months 12 months 18 months 24 months
Fig. 2. Mean template time-evolutions for the controls and CIND subsets at timest = 0, 11, 23, 35, 47, corresponding to 0, 6, 12, 18, and 24 months, shown coloured with|D(φ0,T )| to show volumetric contraction (cool) and expansion (warm). In hippocampalcontraction representing atrophy, is observed to be more prevalent in the CIND groupin line with the expected pattern of atrophy.

VIII
Contr
ols
IPC1 IPC2 IPC3 IPC4
1.15
0.85
1.0
IPC5 IPC6 IPC7 IPC8 IPC9
CIN
D
IPC1 IPC2 IPC3 IPC4
IPC5 IPC6 IPC7 IPC8 IPC9
Fig. 3. Modes of variation of controls and CIND within-subject 4D flows in the hyper-template obtained from projections of the individual flows into subspace of single prin-cipal components of the database matrix and evolution of the average hyper-templateindexed flow (w) to mapping at final time t = T , shown coloured with |D(φ0,T )|.The color pattern (volumetric contraction (cool) and expansion (warm)) on the hyper-template for the two groups shows differences in some principal components. Theseresults are mainly illustrative of the method as due to the small size of the databaseused in this experiment, their generalization is limited.
4 Conclusions & Discussion
Construction of hyper-template normalized within-subject 4D shape represen-tations using volumetric images acquired over time is likely to be an impor-tant tool for discovering and comparing the space-time progression of variousneuro-degenerative diseases. In this paper, we show one method that uses multi-atlas segmentation of each time-series MR image to construct the within-subjectflows, followed by transforming them to a single central hyper-template. Thistemplate-normalized 4D flow can then be subjected to statistical analysis todiscover modes of variation in the database, and visualize the evolution of thehyper-template along these modes of variation.
IX
Right Hippocampus Left Hippocampus
1 2 3 4 5 6 7 8 9−60
−40
−20
0
20
40
60
Principal Component
Mea
n P
C C
oeffi
cien
ts
ControlsPatients
1 2 3 4 5 6 7 8 9−60
−40
−20
0
20
40
60
Principal Component
Mea
n P
C C
oeffi
cien
ts
ControlsPatients
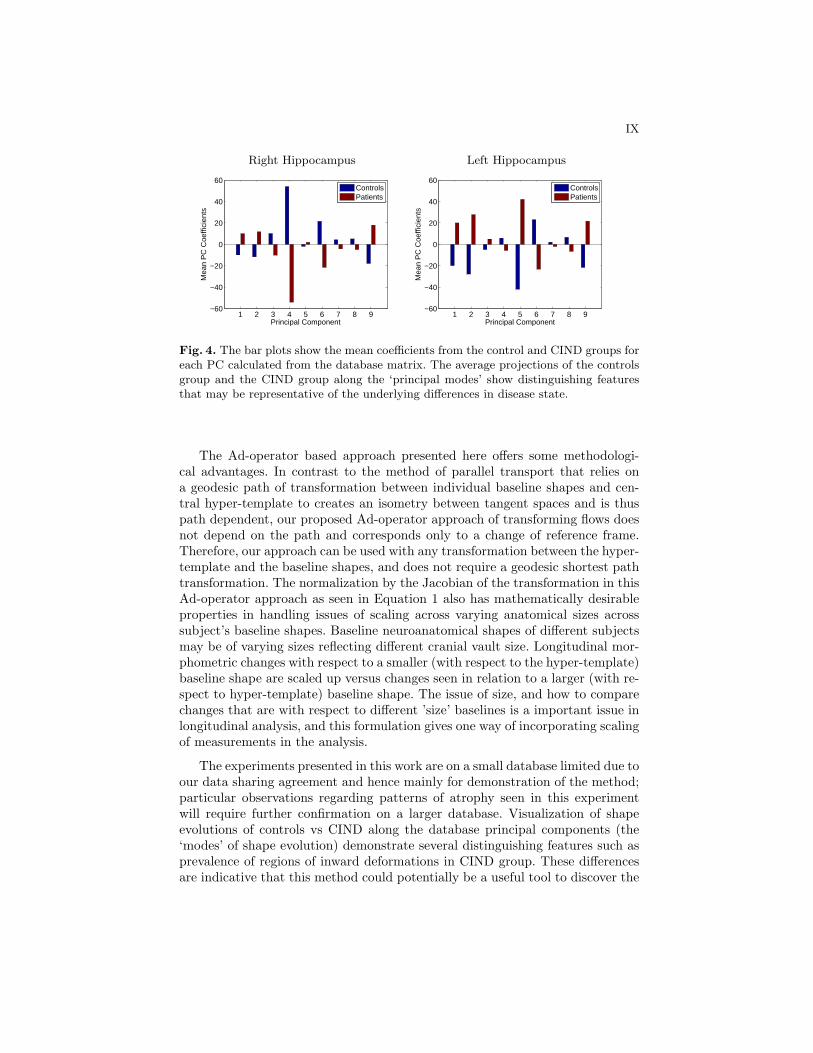
Fig. 4. The bar plots show the mean coefficients from the control and CIND groups foreach PC calculated from the database matrix. The average projections of the controlsgroup and the CIND group along the ‘principal modes’ show distinguishing featuresthat may be representative of the underlying differences in disease state.
The Ad-operator based approach presented here offers some methodologi-cal advantages. In contrast to the method of parallel transport that relies ona geodesic path of transformation between individual baseline shapes and cen-tral hyper-template to creates an isometry between tangent spaces and is thuspath dependent, our proposed Ad-operator approach of transforming flows doesnot depend on the path and corresponds only to a change of reference frame.Therefore, our approach can be used with any transformation between the hyper-template and the baseline shapes, and does not require a geodesic shortest pathtransformation. The normalization by the Jacobian of the transformation in thisAd-operator approach as seen in Equation 1 also has mathematically desirableproperties in handling issues of scaling across varying anatomical sizes acrosssubject’s baseline shapes. Baseline neuroanatomical shapes of different subjectsmay be of varying sizes reflecting different cranial vault size. Longitudinal mor-phometric changes with respect to a smaller (with respect to the hyper-template)baseline shape are scaled up versus changes seen in relation to a larger (with re-spect to hyper-template) baseline shape. The issue of size, and how to comparechanges that are with respect to different ’size’ baselines is a important issue inlongitudinal analysis, and this formulation gives one way of incorporating scalingof measurements in the analysis.
The experiments presented in this work are on a small database limited due toour data sharing agreement and hence mainly for demonstration of the method;particular observations regarding patterns of atrophy seen in this experimentwill require further confirmation on a larger database. Visualization of shapeevolutions of controls vs CIND along the database principal components (the‘modes’ of shape evolution) demonstrate several distinguishing features such asprevalence of regions of inward deformations in CIND group. These differencesare indicative that this method could potentially be a useful tool to discover the
X
modes of progression of of morphometric shape change over time given a largerdatabase.
Another important issue not addressed here before valid longitudinal com-parisons can be made across the database is the considerable heterogeneity inthe baseline image with respect to placement in time along the disease process.Although individuals in the database are grouped in overarching categories suchas controls and CIND, they are likely in different phases of the disease evolution,and the disease may also be evolving at differing rates within individuals. Thus,choosing a baseline image that represents the same stage in the disease across in-dividuals is an important consideration to compare shape evolutions over similartime-course of the disease, as well as some form of time matching to account forthe heterogeneity in the speed of evolution of the disease. These issues are notstraightforward to address as most imaging databases are acquired over a fixedduration in time with limited imaging samples. For our experiments thus, thefirst available scan of each individual was chosen as their ‘baseline’ even thoughthese baseline states represent different states for each individual. Given a longerstudy duration, a better choice would be to temporally align the longitudinaltime-sequences according to some measurable event, such as disease onset butdue to limited imaging samples, and small numbers of subjects, this may notalways be feasible.
In conclusion, this paper presents a method for the normalization of 4Dwithin-subject flows of vector fields constructed with respect to individual sub-ject baseline shapes into the frame of reference of a single central hyper-templateshape. This provides a way for the cross-sectional analysis of 4D longitudinalflows that can be used to statistically and visually investigate shape changesover time across subjects. This method was demonstrated on a small set of lon-gitudinal MR image database. Although the small size of the database precludesgeneralization of observations, and the utility is mainly in showing the feasibilityof the method, statistically significant group differences between normal controlsand cognitively-impaired patients with no dementia were found in testing forgroup differences in the dimensionality reduced coefficients along the databaseprincipal components. Future plans involve application of this methodology toa larger longitudinal dataset and exploration of the time evolution of a largernumber of brain structures.
References
1. Miller, M.I., Trouve, A., Younes, L.: On the metrics and Euler-Lagrange equationsof computational anatomy. Annu. Rev. Biomed. Eng. 4 (2002) 375–405
2. Miller, M.I.: Computational anatomy: shape, growth, and atrophy comparison viadiffeomorphisms. Neuroimage 23 Suppl 1 (2004) S19–33
3. Khan, A., Beg, M.: Representation of time-varying shapes in the large deformationdiffeomorphic framework. IEEE International Symposium on Biomedical Imaging– ISBI 2008 (2008) 1521–1524
4. Qiu, A., Albert, M., Younes, L., Miller, M.I.: Time sequence diffeomorphic metricmapping and parallel transport track time-dependent shape changes. Neuroimage45(1 Suppl) (2009) S51–60

XI
5. Durrleman, S., Pennec, X., Trouve, A., Gerig, G., Ayache, N.: Spatiotemporal atlasestimation for developmental delay detection in longitudinal datasets. MedicalImage Computing and Computer-Assisted Intervention – MICCAI 2009 LNCS5761 (2009) 297–304
6. Rao, A., Sanchez-Ortiz, G.I., Chandashekara, R., Lorenzo-Valdes, M., Mohiaddin,R., Rueckert, D.: Comparison of cardiac motion across subjects using non-rigidregistration. MICCAI 2002, LNCS 2488 (2002) 722–729
7. Ehrhardt, J., Werner, R., Schmidt-Richberg, A., Handels, H.: Prediction of Res-piratory Motion Using A Statistical 4D Mean Motion Model. Proceedings of theSecond International Workshop on Pulmonary Image Analysis (2009) 1–12
8. Heckemann, R., Hajnal, J.V., Aljabar, P., Rueckert, D., Hammers, A.: Automaticanatomical brain MRI segmentation combining label propagation and decision fu-sion. Neuroimage 33(1) (2006) 115–126
9. Khan, A.R., Wang, L., Beg, M.F.: Freesurfer-initiated fully-automated subcorticalbrain segmentation in MRI using large deformation diffeomorphic metric mapping.Neuroimage 41(3) (2008) 735–46
10. Joshi, S., Davis, B., Jomier, M., Gerig, G.: Unbiased diffeomorphic atlas construc-tion for computational anatomy. Neuroimage 23 Suppl 1 (2004) S151–60
11. Beg, M.F., Miller, M.I., Trouve, A., Younes, L.: Computing large deformationmetric mappings via geodesic flows of diffeomorphisms. International Journal ofComputer Vision 61(2) (2005) 139–157
12. Jacova, C., Peters, K.R., Beattie, B.L., Wong, E., Riddehough, A., Foti, D., Schel-tens, P., Li, D.K.B., Feldman, H.H.: Cognitive impairment no dementia – neuropsy-chological and neuroimaging characterization of an amnestic subgroup. Dement.Geriatr. Cogn. Disord. 25(3) (2008) 238–47
Related Documents