UNCORRECTED PROOF Please cite this article in press as: S. Rosa, et al., Cross-linked quaternary chitosan as an adsorbent for the removal of the reactive dye from aqueous solutions, J. Hazard. Mater. (2007), doi:10.1016/j.jhazmat.2007.11.059 ARTICLE IN PRESS +Model HAZMAT 7567 1–8 Available online at www.sciencedirect.com Journal of Hazardous Materials xxx (2007) xxx–xxx Cross-linked quaternary chitosan as an adsorbent for the removal of the reactive dye from aqueous solutions 1 2 Sirlei Rosa b , Mauro C.M. Laranjeira a , Humberto G. Riela b , Valfredo T. F´ avere a,∗ 3 a Departamento de Qu´ ımica, Universidade Federal de Santa Catarina, Florian´ opolis 88040-900, Santa Catarina, Brazil 4 b Departamento de Engenharia Qu´ ımica, Universidade Federal de Santa Catarina, Florian´ opolis 88040-900, Santa Catarina, Brazil 5 Received 17 May 2007; received in revised form 16 November 2007; accepted 19 November 2007 6 Abstract 7 Adsorption of reactive orange 16 by quaternary chitosan salt (QCS) was used as a model to demonstrate the removal of reactive dyes from textile effluents. The polymer was characterized by infrared (IR), energy dispersive X-ray spectrometry (EDXS) analyses and amount of quaternary ammonium groups. The adsorption experiments were conducted at different pH values and initial dye concentrations. Adsorption was shown to be independent of solution pH. Three kinetic adsorption models were tested: pseudo-first-order, pseudo-second-order and intraparticle diffusion. The experimental data best fitted the pseudo-second-order model, which provided a constant velocity, k 2 , of 9.18 × 10 −4 g mg −1 min −1 for a 500 mg L −1 solution and a value of k 2 , of 2.70 × 10 −5 g mg −1 min −1 for a 1000 mg L −1 solution. The adsorption rate was dependent on dye concentration at the surface of the adsorbent for each time period and on the quantity of dye adsorbed. The Langmuir isotherm model provided the best fit to the equilibrium data in the concentration range investigated and from the isotherm linear equation, the maximum absorption capacity determined was 1060 mg of reactive dye per gram of adsorbent, corresponding to 75% occupation of the adsorption sites. The results obtained demonstrate that the adsorbent material could be utilized to remove dyes from textile effluents independent of the pH of the aqueous medium. 8 9 10 11 12 13 14 15 16 17 © 2007 Published by Elsevier B.V. 18 Keywords: Chitosan; Reactive dye; Quaternary chitosan; Adsorption; Cross-linked 19 20 1. Introduction 21 The textile industry consumes a significant volume of water in 22 the process of dyeing fibers and fabrics. This water is highly col- 23 ored due to the presence of dyes and can affect the photosynthesis 24 process due to the occurrence of reduced water transparency, 25 which makes the penetration of sun rays more difficult [1]. 26 Although many organic molecules are degradable, many oth- 27 ers are stable and, due to their complex chemical structures and 28 synthetic organic origin, are not totally degradable [2]. Due to 29 their xenobiotic nature, azo reactive dyes can cause toxicity to 30 aquatic organisms [3]. 31 The classes of dyes mostly used by the textile industry are azo 32 dyes containing reactive groups. Reactive dyes are compounds 33 that contain one or more reactive groups, which form covalent 34 links with oxygen, nitrogen or sulfur atoms from cellulose fibers 35 ∗ Corresponding author. Tel.: +55 483 319 230; fax: +55 483 319 711. E-mail address: [email protected] (V.T. F´ avere). (hydroxyl group), protein fibers (amino, hydroxyl and mercap- 36 tan groups) and polyamides (amino group), providing greater 37 stability to the fabric color [4]. 38 The conventional treatment process of textile effluents 39 involves numerous stages due to the characteristics of the pro- 40 duction process. The effluents can exit the processes at high 41 temperature, between 60 and 90 ◦ C, or at ambient tempera- 42 ture. The effluents are collected and receive an injection of 43 carbon dioxide gas to neutralize the pH. In the neutralization 44 tank, new pH measurements are necessary, since the stations are 45 projected to treat effluents with pH varying between 8 and 10 46 [5]. 47 Conventional treatment involves a process of coagula- 48 tion/flocculation. This is a versatile process, which can be used 49 alone or combined with biological treatments, as a way of remov- 50 ing suspended solids and organic material, as well as promoting 51 the extensive removal of dyes from textile industry effluents 52 [6,7]. However, this approach presents the disadvantage of gen- 53 erating a large volume of sludge. This sludge is rich in dyes, 54 as well as other substances used in the textile process. This is 55 0304-3894/$ – see front matter © 2007 Published by Elsevier B.V. doi:10.1016/j.jhazmat.2007.11.059

Welcome message from author
This document is posted to help you gain knowledge. Please leave a comment to let me know what you think about it! Share it to your friends and learn new things together.
Transcript
H
1
2
3
4
5
6
A7
taieste1a
8
9
10
11
12
13
14
15
16
17
©18
K19
20
121
22
t23
o24
p25
w26
A27
e28
s29
t30
a31
32
d33
t34
l35
0d
PR
OO
F
ARTICLE IN PRESS+ModelAZMAT 7567 1–8
Available online at www.sciencedirect.com
Journal of Hazardous Materials xxx (2007) xxx–xxx
Cross-linked quaternary chitosan as an adsorbent for the removalof the reactive dye from aqueous solutions
Sirlei Rosa b, Mauro C.M. Laranjeira a, Humberto G. Riela b, Valfredo T. Favere a,∗a Departamento de Quımica, Universidade Federal de Santa Catarina, Florianopolis 88040-900, Santa Catarina, Brazil
b Departamento de Engenharia Quımica, Universidade Federal de Santa Catarina, Florianopolis 88040-900, Santa Catarina, Brazil
Received 17 May 2007; received in revised form 16 November 2007; accepted 19 November 2007
bstract
Adsorption of reactive orange 16 by quaternary chitosan salt (QCS) was used as a model to demonstrate the removal of reactive dyes fromextile effluents. The polymer was characterized by infrared (IR), energy dispersive X-ray spectrometry (EDXS) analyses and amount of quaternarymmonium groups. The adsorption experiments were conducted at different pH values and initial dye concentrations. Adsorption was shown to bendependent of solution pH. Three kinetic adsorption models were tested: pseudo-first-order, pseudo-second-order and intraparticle diffusion. Thexperimental data best fitted the pseudo-second-order model, which provided a constant velocity, k2, of 9.18 × 10⁻⁴ g mg−1 min−1 for a 500 mg L−1
olution and a value of k2, of 2.70 × 10⁻⁵ g mg−1 min−1 for a 1000 mg L−1 solution. The adsorption rate was dependent on dye concentration athe surface of the adsorbent for each time period and on the quantity of dye adsorbed. The Langmuir isotherm model provided the best fit to the
UN
CO
RR
EC
TED
Please cite this article in press as: S. Rosa, et al., Cross-linked quaternary chitosan as an adsorbent for the removal of the reactive dye fromaqueous solutions, J. Hazard. Mater. (2007), doi:10.1016/j.jhazmat.2007.11.059
quilibrium data in the concentration range investigated and from the isotherm linear equation, the maximum absorption capacity determined was060 mg of reactive dye per gram of adsorbent, corresponding to 75% occupation of the adsorption sites. The results obtained demonstrate that thedsorbent material could be utilized to remove dyes from textile effluents independent of the pH of the aqueous medium.
2007 Published by Elsevier B.V.
eywords: Chitosan; Reactive dye; Quaternary chitosan; Adsorption; Cross-linked
. Introduction
The textile industry consumes a significant volume of water inhe process of dyeing fibers and fabrics. This water is highly col-red due to the presence of dyes and can affect the photosynthesisrocess due to the occurrence of reduced water transparency,hich makes the penetration of sun rays more difficult [1].lthough many organic molecules are degradable, many oth-
rs are stable and, due to their complex chemical structures andynthetic organic origin, are not totally degradable [2]. Due toheir xenobiotic nature, azo reactive dyes can cause toxicity toquatic organisms [3].
The classes of dyes mostly used by the textile industry are azoyes containing reactive groups. Reactive dyes are compoundshat contain one or more reactive groups, which form covalentinks with oxygen, nitrogen or sulfur atoms from cellulose fibers
∗ Corresponding author. Tel.: +55 483 319 230; fax: +55 483 319 711.E-mail address: [email protected] (V.T. Favere).
(hydroxyl group), protein fibers (amino, hydroxyl and mercap- 36
tan groups) and polyamides (amino group), providing greater 37
stability to the fabric color [4]. 38
The conventional treatment process of textile effluents 39
involves numerous stages due to the characteristics of the pro- 40
duction process. The effluents can exit the processes at high 41
temperature, between 60 and 90 ◦C, or at ambient tempera- 42
ture. The effluents are collected and receive an injection of 43
carbon dioxide gas to neutralize the pH. In the neutralization 44
tank, new pH measurements are necessary, since the stations are 45
projected to treat effluents with pH varying between 8 and 10 46
[5]. 47
Conventional treatment involves a process of coagula- 48
tion/flocculation. This is a versatile process, which can be used 49
alone or combined with biological treatments, as a way of remov- 50
ing suspended solids and organic material, as well as promoting 51
the extensive removal of dyes from textile industry effluents 52
[6,7]. However, this approach presents the disadvantage of gen- 53
erating a large volume of sludge. This sludge is rich in dyes, 54
as well as other substances used in the textile process. This is 55
304-3894/$ – see front matter © 2007 Published by Elsevier B.V.oi:10.1016/j.jhazmat.2007.11.059
UN
CO
RR
EC
TED
Please cite this article in press as: S. Rosa, et al., Cross-linked quaternaraqueous solutions, J. Hazard. Mater. (2007), doi:10.1016/j.jhazmat.2007.1
ARTICLE IN PRESS+ModelHAZMAT 7567 1–8
2 S. Rosa et al. / Journal of Hazardous Materials xxx (2007) xxx–xxx
a problem, as the waste must be discarded properly to avoid56
environmental contamination [5].57
Other techniques that have been employed for toxic substance58
content reduction in industrial wastewater include advanced59
oxidation; membrane filtration; and reverse osmosis [6–10].60
However, these methods are limited due to their high operational61
costs [2,7].62
The adsorption method has been used for dye removal from63
the aquatic environment [8,11–15]. The major advantage of64
this technique over others is its low generation of residues and65
the possibility of adsorbent recycling and reuse [16]. Several66
literature reports concern the development of more effective,67
selective and cheaper adsorbent materials [2,8,9,11–13,17,18].68
It is important to mention that an increase in adsorption capacity69
may help compensate for the cost of additional processing.70
Biopolymers constitute a promising class of biosorbents used71
for the removal of pollutant from aquatic environments and72
among these, chitosan should be highlighted. This polymer is73
derived from chitin, which is one of the most abundant biopoly-74
mer in nature, obtained from crustacean shells of shrimps, crabs75
and lobsters, which are themselves waste products of the seafood76
processing industry [19,20].77
Chitosan has excellent properties for the adsorption of anionic78
dyes, principally due to the presence of protonated amino groups79
(–NH3+) in the polymer matrix, which interact with dyes in80
solution by ion exchange, at an appropriate pH [21–23]. The81
high content of amino groups also facilitates various chemical82
modifications in the polymer, for the purpose of improving its83
adsorbent properties and adsorption capacity.84
The purpose of this work was to study the kinetics and adsorp-85
tion equilibrium of reactive dye orange 16, which is used in the86
dyeing process in the textile industry, in aqueous solution with87
modified chitosan biopolymer.88
2. Experimental89
2.1. Materials90
Chitosan, used for the preparation of the adsorbent, was91
obtained from Purifarma (Brazil) and reported to have 90.0%92
degree of deacetylation, 8.0% water content, 1.0% maximum93
ash content and pH between 7.0 and 9.0. Glycidyl trimethyl94
ammonium chloride was purchased from Fluka Biochemica95
(Switzerland). The dye, reactive orange 16 (RO16, 50%) in96
sodium form, was acquired from Aldrich (USA). A stock solu-97
tion of 2000 mg L−1 of the reactive dye was prepared by massing98
an appropriate amount of the dye and diluting to find volume99
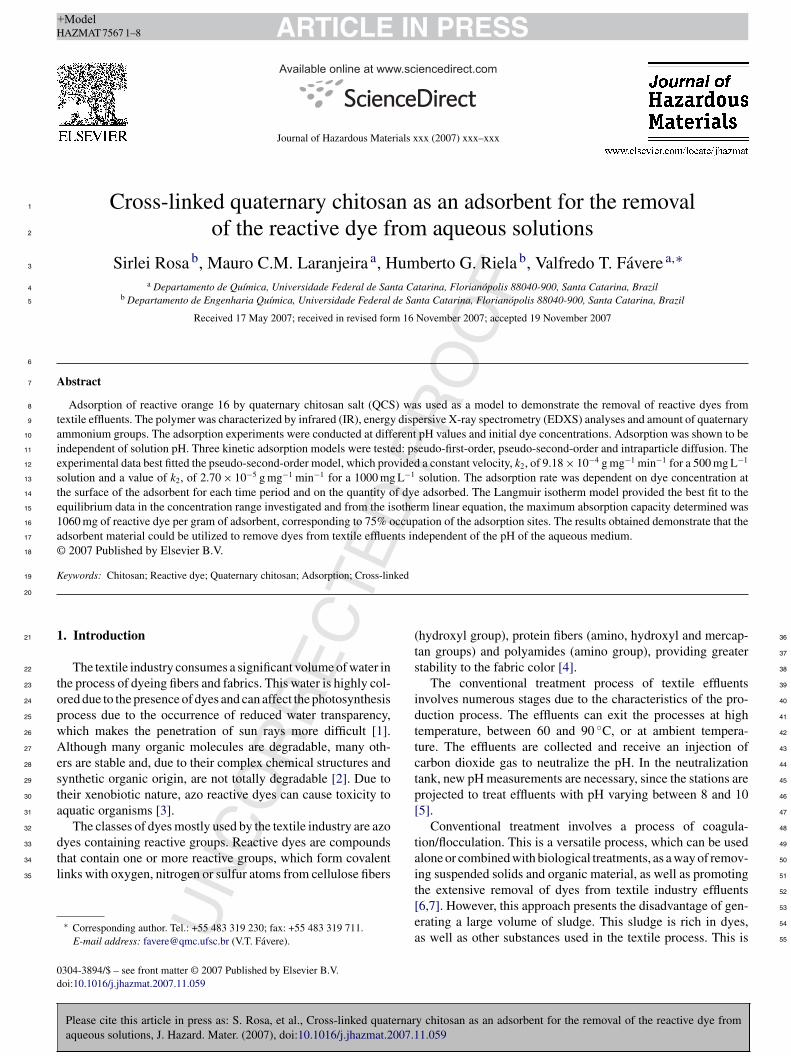
with distilled water. Fig. 1 shows the structure of RO16.100
2.2. Instrumentation101
Infrared spectra were obtained using a PerkinElmer PC FTIR102
16 spectrophotometer. The initial microprobe analysis using103
energy dispersive X-ray spectrometry (EDXS) of the new adsor-104
bent was realized using Philips equipment, model XL 30, by105
placing a sample in stabes and covering it in gold. The number106
of quaternary functional groups was determined by conducto-107
m 108
M 109
t 110
M 111
t 112
2 113
t 114
115
m 116
n 117
s 118
s 119
t 120
s 121
c 122
2 123
124
a 125
o 126
t 127
a 128
w 129
130
r 131
fl 132
b 133
s 134
w 135
c 136
137
o 138
2 139
N 140
1 141
142
c 143
1 144
sm1l
PR
OO
F
Fig. 1. Structure of RO16.
etric titration using a Mettler MC 226 conductivimeter fromicronal, model B 330, and a Schott Gerate automatic titra-
or, model T 80/20. UV–vis absorption measurements using aicronal B572 spectrophotometer were employed to determine
he reactive dye concentration in solution.
.3. Preparation of quaternary chitosan with glycidylrimethyl ammonium chloride
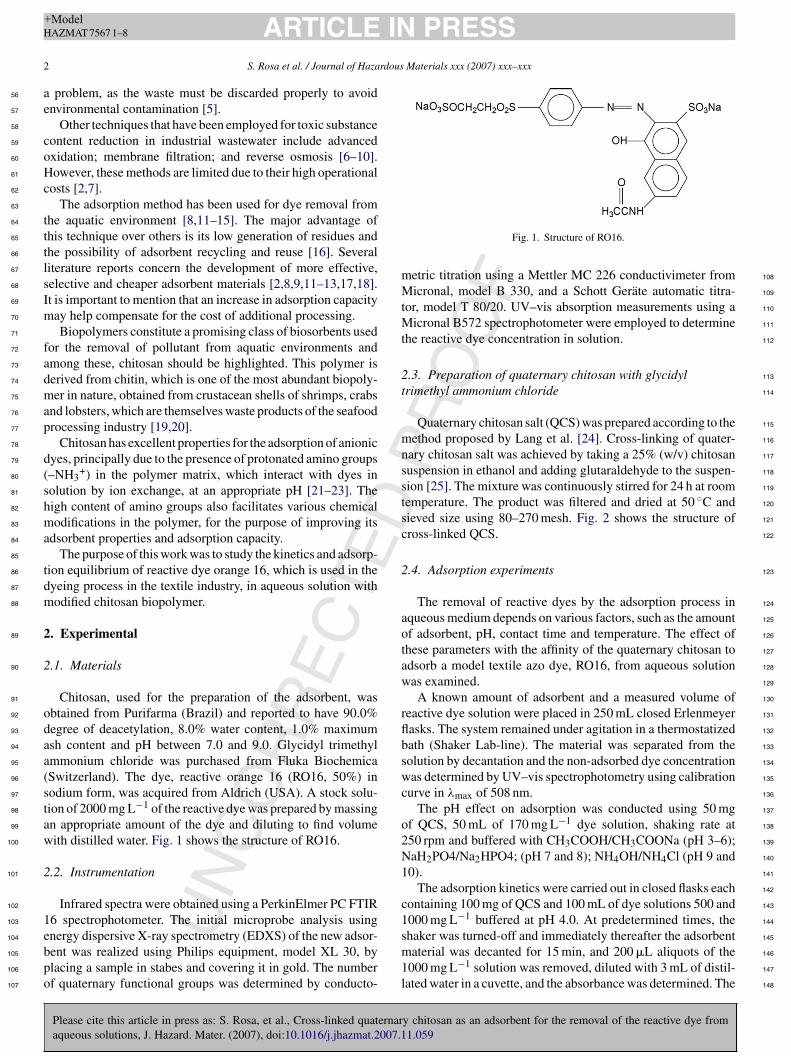
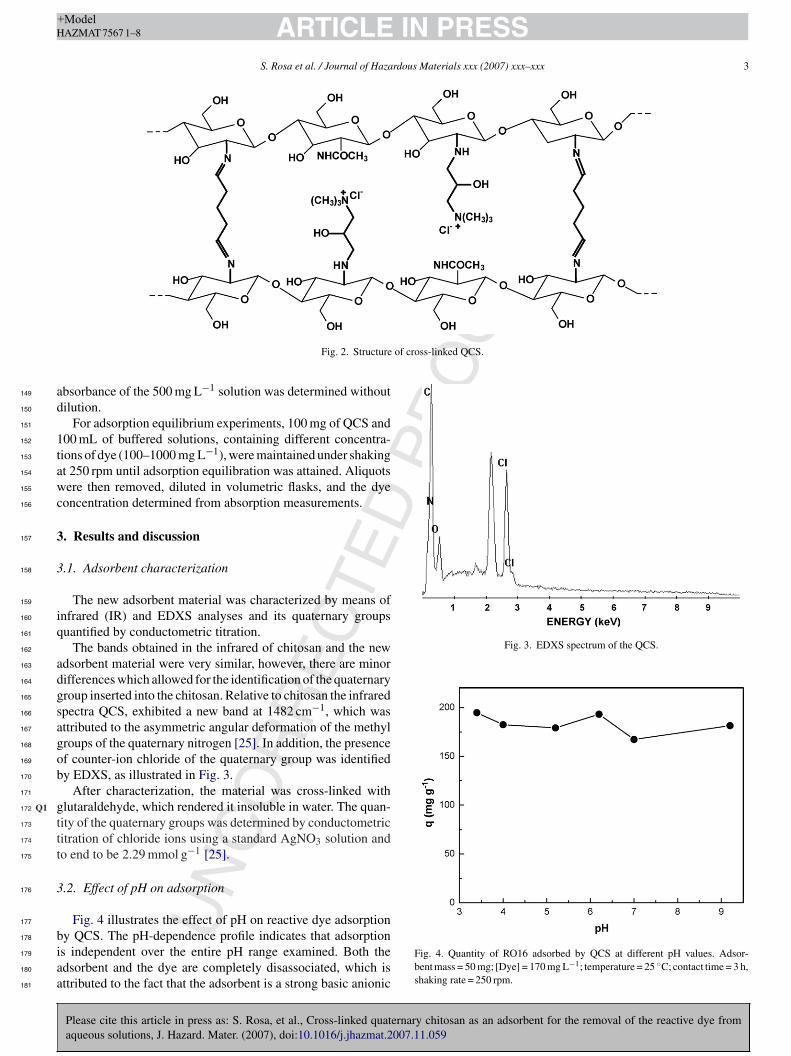
Quaternary chitosan salt (QCS) was prepared according to theethod proposed by Lang et al. [24]. Cross-linking of quater-
ary chitosan salt was achieved by taking a 25% (w/v) chitosanuspension in ethanol and adding glutaraldehyde to the suspen-ion [25]. The mixture was continuously stirred for 24 h at roomemperature. The product was filtered and dried at 50 ◦C andieved size using 80–270 mesh. Fig. 2 shows the structure ofross-linked QCS.
.4. Adsorption experiments
The removal of reactive dyes by the adsorption process inqueous medium depends on various factors, such as the amountf adsorbent, pH, contact time and temperature. The effect ofhese parameters with the affinity of the quaternary chitosan todsorb a model textile azo dye, RO16, from aqueous solutionas examined.A known amount of adsorbent and a measured volume of
eactive dye solution were placed in 250 mL closed Erlenmeyerasks. The system remained under agitation in a thermostatizedath (Shaker Lab-line). The material was separated from theolution by decantation and the non-adsorbed dye concentrationas determined by UV–vis spectrophotometry using calibration
urve in λmax of 508 nm.The pH effect on adsorption was conducted using 50 mg
f QCS, 50 mL of 170 mg L−1 dye solution, shaking rate at50 rpm and buffered with CH3COOH/CH3COONa (pH 3–6);aH2PO4/Na2HPO4; (pH 7 and 8); NH4OH/NH4Cl (pH 9 and0).
The adsorption kinetics were carried out in closed flasks eachontaining 100 mg of QCS and 100 mL of dye solutions 500 and000 mg L−1 buffered at pH 4.0. At predetermined times, the
y chitosan as an adsorbent for the removal of the reactive dye from1.059
haker was turned-off and immediately thereafter the adsorbent 145
aterial was decanted for 15 min, and 200 �L aliquots of the 146
000 mg L−1 solution was removed, diluted with 3 mL of distil- 147
ated water in a cuvette, and the absorbance was determined. The 148
UN
CO
RR
EC
TED
PR
OO
F
Please cite this article in press as: S. Rosa, et al., Cross-linked quaternary chitosan as an adsorbent for the removal of the reactive dye fromaqueous solutions, J. Hazard. Mater. (2007), doi:10.1016/j.jhazmat.2007.11.059
ARTICLE IN PRESS+ModelHAZMAT 7567 1–8
S. Rosa et al. / Journal of Hazardous Materials xxx (2007) xxx–xxx 3
Fig. 2. Structure of cross-linked QCS.
absorbance of the 500 mg L−1 solution was determined without149
dilution.150
For adsorption equilibrium experiments, 100 mg of QCS and151
100 mL of buffered solutions, containing different concentra-152
tions of dye (100–1000 mg L−1), were maintained under shaking153
at 250 rpm until adsorption equilibration was attained. Aliquots154
were then removed, diluted in volumetric flasks, and the dye155
concentration determined from absorption measurements.156
3. Results and discussion157
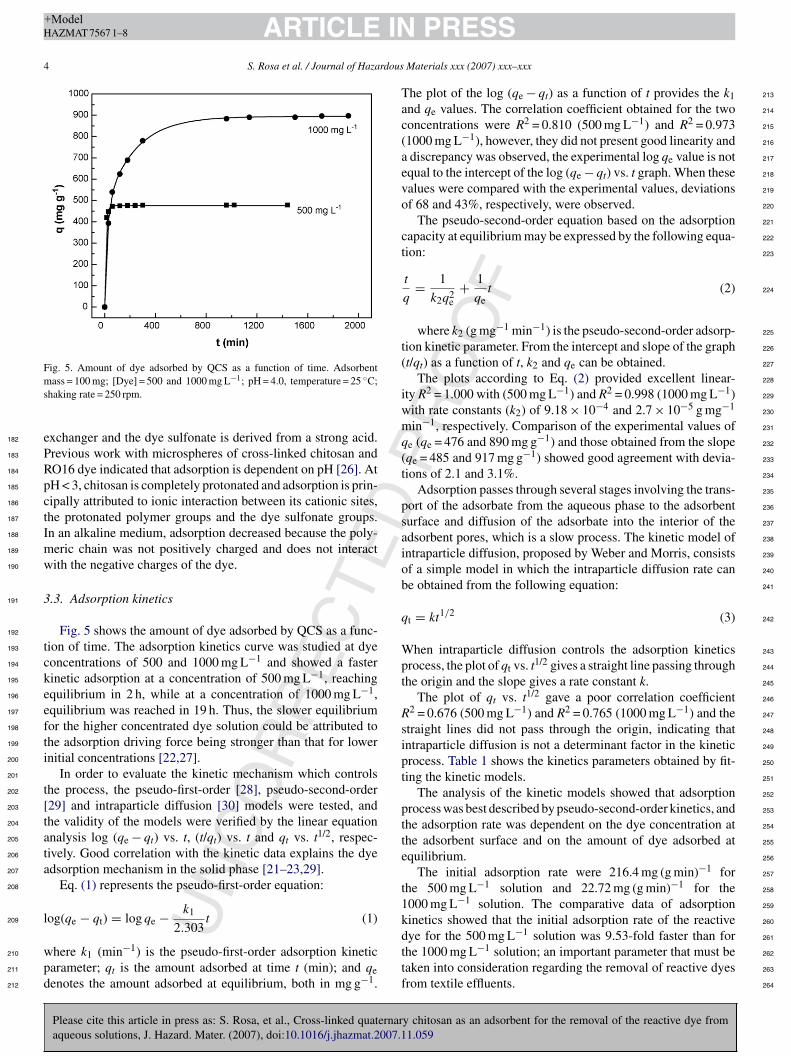
3.1. Adsorbent characterization158
The new adsorbent material was characterized by means of159
infrared (IR) and EDXS analyses and its quaternary groups160
quantified by conductometric titration.161
The bands obtained in the infrared of chitosan and the new162
adsorbent material were very similar, however, there are minor163
differences which allowed for the identification of the quaternary164
group inserted into the chitosan. Relative to chitosan the infrared165
spectra QCS, exhibited a new band at 1482 cm−1, which was166
attributed to the asymmetric angular deformation of the methyl167
groups of the quaternary nitrogen [25]. In addition, the presence168
of counter-ion chloride of the quaternary group was identified169
by EDXS, as illustrated in Fig. 3.170
After characterization, the material was cross-linked with171
glutaraldehyde, which rendered it insoluble in water. The quan-Q1172
tity of the quaternary groups was determined by conductometric173
titration of chloride ions using a standard AgNO3 solution and174
to end to be 2.29 mmol g−1 [25].175
3.2. Effect of pH on adsorption176
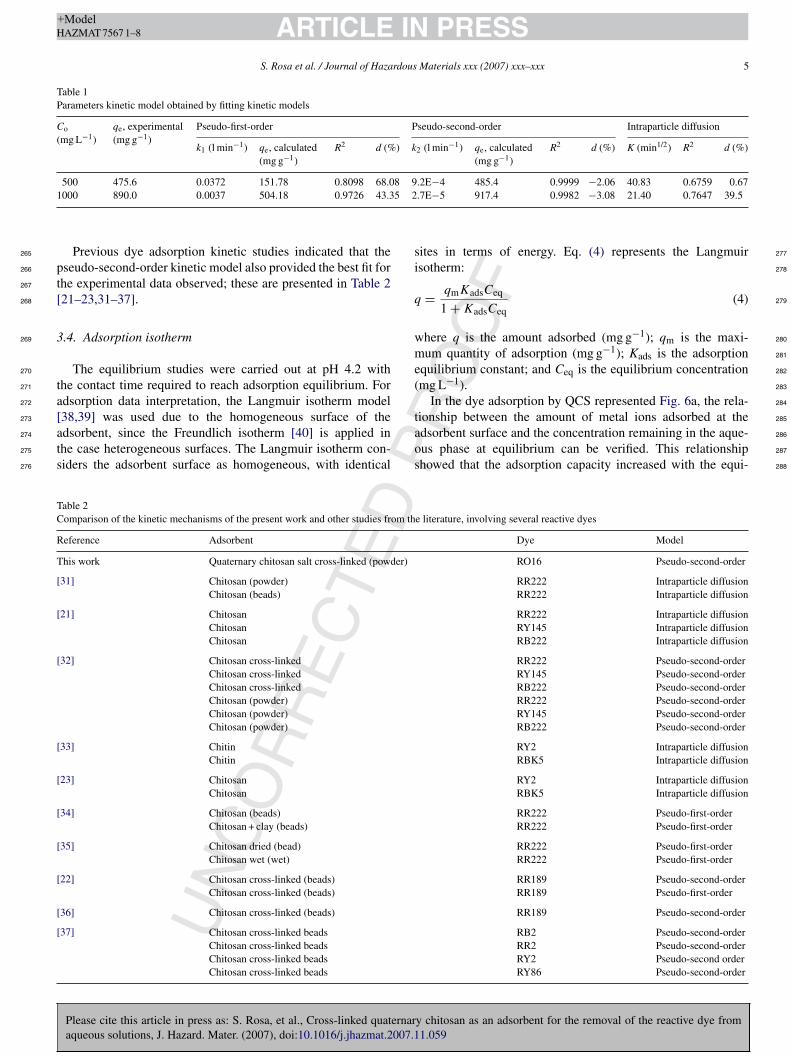
Fig. 4 illustrates the effect of pH on reactive dye adsorption177
by QCS. The pH-dependence profile indicates that adsorption178
is independent over the entire pH range examined. Both the179
adsorbent and the dye are completely disassociated, which is180
attributed to the fact that the adsorbent is a strong basic anionic181
Fig. 3. EDXS spectrum of the QCS.
Fig. 4. Quantity of RO16 adsorbed by QCS at different pH values. Adsor-bent mass = 50 mg; [Dye] = 170 mg L−1; temperature = 25 ◦C; contact time = 3 h,shaking rate = 250 rpm.
ED
PR
OO
F
ARTICLE IN PRESS+ModelHAZMAT 7567 1–8
4 S. Rosa et al. / Journal of Hazardous Materials xxx (2007) xxx–xxx
Fig. 5. Amount of dye adsorbed by QCS as a function of time. Adsorbentms
e182
P183
R184
p185
c186
t187
I188
m189
w190
3191
192
t193
c194
k195
e196
e197
f198
t199
i200
201
t202
[203
t204
a205
t206
a207
208
l209
w210
p211
d212
The plot of the log (qe − qt) as a function of t provides the k1 213
and qe values. The correlation coefficient obtained for the two 214
concentrations were R2 = 0.810 (500 mg L−1) and R2 = 0.973 215
(1000 mg L−1), however, they did not present good linearity and 216
a discrepancy was observed, the experimental log qe value is not 217
equal to the intercept of the log (qe − qt) vs. t graph. When these 218
values were compared with the experimental values, deviations 219
of 68 and 43%, respectively, were observed. 220
The pseudo-second-order equation based on the adsorption 221
capacity at equilibrium may be expressed by the following equa- 222
tion: 223
t
q= 1
k2q2e
+ 1
qet (2) 224
where k2 (g mg−1 min−1) is the pseudo-second-order adsorp- 225
tion kinetic parameter. From the intercept and slope of the graph 226
(t/qt) as a function of t, k2 and qe can be obtained. 227
The plots according to Eq. (2) provided excellent linear- 228
ity R2 = 1.000 with (500 mg L−1) and R2 = 0.998 (1000 mg L−1) 229
with rate constants (k2) of 9.18 × 10⁻⁴ and 2.7 × 10⁻⁵ g mg−1230
min−1, respectively. Comparison of the experimental values of 231
qe (qe = 476 and 890 mg g−1) and those obtained from the slope 232
(qe = 485 and 917 mg g−1) showed good agreement with devia- 233
tions of 2.1 and 3.1%. 234
Adsorption passes through several stages involving the trans- 235
port of the adsorbate from the aqueous phase to the adsorbent 236
surface and diffusion of the adsorbate into the interior of the 237
adsorbent pores, which is a slow process. The kinetic model of 238
intraparticle diffusion, proposed by Weber and Morris, consists 239
of a simple model in which the intraparticle diffusion rate can 240
be obtained from the following equation: 241
qt = kt1/2 (3) 242
When intraparticle diffusion controls the adsorption kinetics 243
process, the plot of qt vs. t1/2 gives a straight line passing through 244
the origin and the slope gives a rate constant k. 245
The plot of qt vs. t1/2 gave a poor correlation coefficient 246
R2 = 0.676 (500 mg L−1) and R2 = 0.765 (1000 mg L−1) and the 247
straight lines did not pass through the origin, indicating that 248
intraparticle diffusion is not a determinant factor in the kinetic 249
process. Table 1 shows the kinetics parameters obtained by fit- 250
ting the kinetic models. 251
The analysis of the kinetic models showed that adsorption 252
process was best described by pseudo-second-order kinetics, and 253
the adsorption rate was dependent on the dye concentration at 254
the adsorbent surface and on the amount of dye adsorbed at 255
equilibrium. 256
The initial adsorption rate were 216.4 mg (g min)−1 for 257
the 500 mg L−1 solution and 22.72 mg (g min)−1 for the 258
1000 mg L−1 solution. The comparative data of adsorption 259
kinetics showed that the initial adsorption rate of the reactive 260
NC
OR
RE
CT
ass = 100 mg; [Dye] = 500 and 1000 mg L−1; pH = 4.0, temperature = 25 ◦C;haking rate = 250 rpm.
xchanger and the dye sulfonate is derived from a strong acid.revious work with microspheres of cross-linked chitosan andO16 dye indicated that adsorption is dependent on pH [26]. AtH < 3, chitosan is completely protonated and adsorption is prin-ipally attributed to ionic interaction between its cationic sites,he protonated polymer groups and the dye sulfonate groups.n an alkaline medium, adsorption decreased because the poly-eric chain was not positively charged and does not interactith the negative charges of the dye.
.3. Adsorption kinetics
Fig. 5 shows the amount of dye adsorbed by QCS as a func-ion of time. The adsorption kinetics curve was studied at dyeoncentrations of 500 and 1000 mg L−1 and showed a fasterinetic adsorption at a concentration of 500 mg L−1, reachingquilibrium in 2 h, while at a concentration of 1000 mg L−1,quilibrium was reached in 19 h. Thus, the slower equilibriumor the higher concentrated dye solution could be attributed tohe adsorption driving force being stronger than that for lowernitial concentrations [22,27].
In order to evaluate the kinetic mechanism which controlshe process, the pseudo-first-order [28], pseudo-second-order29] and intraparticle diffusion [30] models were tested, andhe validity of the models were verified by the linear equationnalysis log (qe − qt) vs. t, (t/qt) vs. t and qt vs. t1/2, respec-ively. Good correlation with the kinetic data explains the dyedsorption mechanism in the solid phase [21–23,29].
Eq. (1) represents the pseudo-first-order equation:
og(qe − qt) = log qe − k1t (1)
UPlease cite this article in press as: S. Rosa, et al., Cross-linked quaternary chitosan as an adsorbent for the removal of the reactive dye fromaqueous solutions, J. Hazard. Mater. (2007), doi:10.1016/j.jhazmat.2007.11.059
2.303
here k1 (min−1) is the pseudo-first-order adsorption kineticarameter; qt is the amount adsorbed at time t (min); and qeenotes the amount adsorbed at equilibrium, both in mg g−1.
dye for the 500 mg L−1 solution was 9.53-fold faster than for 261
the 1000 mg L−1 solution; an important parameter that must be 262
taken into consideration regarding the removal of reactive dyes 263
from textile effluents. 264
UN
CO
RR
EC
TED
PR
OO
F
Please cite this article in press as: S. Rosa, et al., Cross-linked quaternary chitosan as an adsorbent for the removal of the reactive dye fromaqueous solutions, J. Hazard. Mater. (2007), doi:10.1016/j.jhazmat.2007.11.059
ARTICLE IN PRESS+ModelHAZMAT 7567 1–8
S. Rosa et al. / Journal of Hazardous Materials xxx (2007) xxx–xxx 5
Table 1Parameters kinetic model obtained by fitting kinetic models
Co
(mg L−1)qe, experimental(mg g−1)
Pseudo-first-order Pseudo-second-order Intraparticle diffusion
k1 (l min−1) qe, calculated(mg g−1)
R2 d (%) k2 (l min−1) qe, calculated(mg g−1)
R2 d (%) K (min1/2) R2 d (%)
500 475.6 0.0372 151.78 0.8098 68.08 9.2E−4 485.4 0.9999 −2.06 40.83 0.6759 0.671000 890.0 0.0037 504.18 0.9726 43.35 2.7E−5 917.4 0.9982 −3.08 21.40 0.7647 39.5
Previous dye adsorption kinetic studies indicated that the265
pseudo-second-order kinetic model also provided the best fit for266
the experimental data observed; these are presented in Table 2267
[21–23,31–37].268
3.4. Adsorption isotherm269
The equilibrium studies were carried out at pH 4.2 with270
the contact time required to reach adsorption equilibrium. For271
adsorption data interpretation, the Langmuir isotherm model272
[38,39] was used due to the homogeneous surface of the273
adsorbent, since the Freundlich isotherm [40] is applied in274
the case heterogeneous surfaces. The Langmuir isotherm con-275
siders the adsorbent surface as homogeneous, with identical276
sites in terms of energy. Eq. (4) represents the Langmuir 277
isotherm: 278
q = qmKadsCeq
1 + KadsCeq(4) 279
where q is the amount adsorbed (mg g−1); qm is the maxi- 280
mum quantity of adsorption (mg g−1); Kads is the adsorption 281
equilibrium constant; and Ceq is the equilibrium concentration 282
(mg L−1). 283
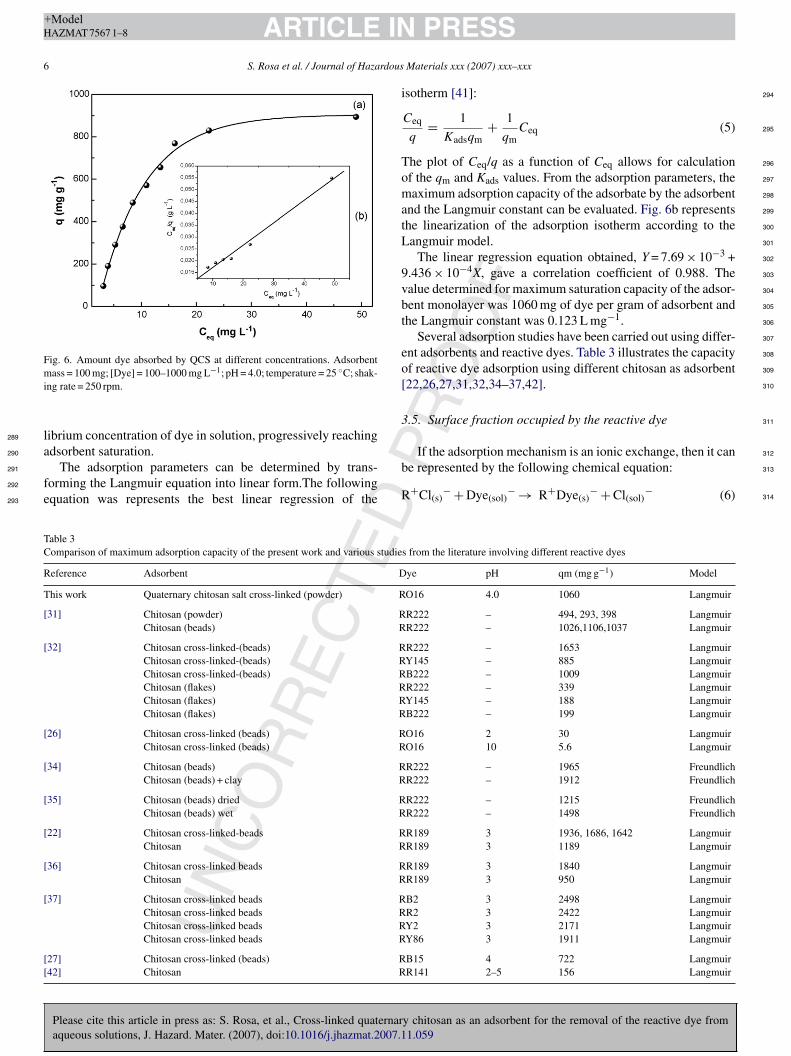
In the dye adsorption by QCS represented Fig. 6a, the rela- 284
tionship between the amount of metal ions adsorbed at the 285
adsorbent surface and the concentration remaining in the aque- 286
ous phase at equilibrium can be verified. This relationship 287
showed that the adsorption capacity increased with the equi- 288
Table 2Comparison of the kinetic mechanisms of the present work and other studies from the literature, involving several reactive dyes
Reference Adsorbent Dye Model
This work Quaternary chitosan salt cross-linked (powder) RO16 Pseudo-second-order
[31] Chitosan (powder) RR222 Intraparticle diffusionChitosan (beads) RR222 Intraparticle diffusion
[21] Chitosan RR222 Intraparticle diffusionChitosan RY145 Intraparticle diffusionChitosan RB222 Intraparticle diffusion
[32] Chitosan cross-linked RR222 Pseudo-second-orderChitosan cross-linked RY145 Pseudo-second-orderChitosan cross-linked RB222 Pseudo-second-orderChitosan (powder) RR222 Pseudo-second-orderChitosan (powder) RY145 Pseudo-second-orderChitosan (powder) RB222 Pseudo-second-order
[33] Chitin RY2 Intraparticle diffusionChitin RBK5 Intraparticle diffusion
[23] Chitosan RY2 Intraparticle diffusionChitosan RBK5 Intraparticle diffusion
[34] Chitosan (beads) RR222 Pseudo-first-orderChitosan + clay (beads) RR222 Pseudo-first-order
[35] Chitosan dried (bead) RR222 Pseudo-first-orderChitosan wet (wet) RR222 Pseudo-first-order
[22] Chitosan cross-linked (beads) RR189 Pseudo-second-orderChitosan cross-linked (beads) RR189 Pseudo-first-order
[36] Chitosan cross-linked (beads) RR189 Pseudo-second-order
[37] Chitosan cross-linked beads RB2 Pseudo-second-orderChitosan cross-linked beads RR2 Pseudo-second-orderChitosan cross-linked beads RY2 Pseudo-second orderChitosan cross-linked beads RY86 Pseudo-second-order
RO
OF
ARTICLE IN PRESS+ModelHAZMAT 7567 1–8
6 S. Rosa et al. / Journal of Hazardous Materials xxx (2007) xxx–xxx
Fig. 6. Amount dye absorbed by QCS at different concentrations. Adsorbentmi
l289
a290
291
f292
e293
isotherm [41]: 294
Ceq
q= 1
Kadsqm+ 1
qmCeq (5) 295
The plot of Ceq/q as a function of Ceq allows for calculation 296
of the qm and Kads values. From the adsorption parameters, the 297
maximum adsorption capacity of the adsorbate by the adsorbent 298
and the Langmuir constant can be evaluated. Fig. 6b represents 299
the linearization of the adsorption isotherm according to the 300
Langmuir model. 301
The linear regression equation obtained, Y = 7.69 × 10⁻³ + 302
9.436 × 10⁻⁴X, gave a correlation coefficient of 0.988. The 303
value determined for maximum saturation capacity of the adsor- 304
bent monolayer was 1060 mg of dye per gram of adsorbent and 305
the Langmuir constant was 0.123 L mg−1. 306
Several adsorption studies have been carried out using differ- 307
ent adsorbents and reactive dyes. Table 3 illustrates the capacity 308
of reactive dye adsorption using different chitosan as adsorbent 309
[22,26,27,31,32,34–37,42]. 310
3.5. Surface fraction occupied by the reactive dye 311
If the adsorption mechanism is an ionic exchange, then it can 312
TC
R
T
[
[
[
[
[
[
[
[
[[
ass = 100 mg; [Dye] = 100–1000 mg L−1; pH = 4.0; temperature = 25 ◦C; shak-ng rate = 250 rpm.
ibrium concentration of dye in solution, progressively reachingdsorbent saturation.
UN
CO
RR
EC
TED
P
Please cite this article in press as: S. Rosa, et al., Cross-linked quaternary chitosan as an adsorbent for the removal of the reactive dye fromaqueous solutions, J. Hazard. Mater. (2007), doi:10.1016/j.jhazmat.2007.11.059
The adsorption parameters can be determined by trans-orming the Langmuir equation into linear form.The followingquation was represents the best linear regression of the
be represented by the following chemical equation: 313
R+Cl(s)− + Dye(sol)
− → R+Dye(s)− + Cl(sol)
− (6) 314
able 3omparison of maximum adsorption capacity of the present work and various studies from the literature involving different reactive dyes
eference Adsorbent Dye pH qm (mg g−1) Model
his work Quaternary chitosan salt cross-linked (powder) RO16 4.0 1060 Langmuir
31] Chitosan (powder) RR222 – 494, 293, 398 LangmuirChitosan (beads) RR222 – 1026,1106,1037 Langmuir
32] Chitosan cross-linked-(beads) RR222 – 1653 LangmuirChitosan cross-linked-(beads) RY145 – 885 LangmuirChitosan cross-linked-(beads) RB222 – 1009 LangmuirChitosan (flakes) RR222 – 339 LangmuirChitosan (flakes) RY145 – 188 LangmuirChitosan (flakes) RB222 – 199 Langmuir
26] Chitosan cross-linked (beads) RO16 2 30 LangmuirChitosan cross-linked (beads) RO16 10 5.6 Langmuir
34] Chitosan (beads) RR222 – 1965 FreundlichChitosan (beads) + clay RR222 – 1912 Freundlich
35] Chitosan (beads) dried RR222 – 1215 FreundlichChitosan (beads) wet RR222 – 1498 Freundlich
22] Chitosan cross-linked-beads RR189 3 1936, 1686, 1642 LangmuirChitosan RR189 3 1189 Langmuir
36] Chitosan cross-linked beads RR189 3 1840 LangmuirChitosan RR189 3 950 Langmuir
37] Chitosan cross-linked beads RB2 3 2498 LangmuirChitosan cross-linked beads RR2 3 2422 LangmuirChitosan cross-linked beads RY2 3 2171 LangmuirChitosan cross-linked beads RY86 3 1911 Langmuir
27] Chitosan cross-linked (beads) RB15 4 722 Langmuir42] Chitosan RR141 2–5 156 Langmuir
UN
CO
RR
EC
TED
PR
OO
F
Please cite this article in press as: S. Rosa, et al., Cross-linked quaternary chitosan as an adsorbent for the removal of the reactive dye fromaqueous solutions, J. Hazard. Mater. (2007), doi:10.1016/j.jhazmat.2007.11.059
ARTICLE IN PRESS+ModelHAZMAT 7567 1–8
S. Rosa et al. / Journal of Hazardous Materials xxx (2007) xxx–xxx 7
where, “s” represents the solid phase and “sol” represents the315
solution.316
The surface fraction occupied by the Dye− ion upon dis-317
location from the chloride ion to the solution is given by the318
following equation:319
θDye- = N
N0(7)320
where θDye− represents the surface fraction occupied by dye in321
the solid phase, N0 is the amount of exchangeable Cl− ion per322
gram of adsorbent (2.29 mmol/g) determined by conductometric323
titration and N is the amount of dye adsorbed; calculated from324
the maximum adsorption capacity of the reactive dye by the325
adsorbent (1.72 mmol/g). The value calculated, 0.75 or 75%,326
represents the occupation of the adsorption sites on the adsorbent327
by the reactive dye.328
4. Conclusions329
The IR and EDXS techniques used for characterization330
proved that the quaternary ammonium group was immobilized331
on the chitosan surface, thus forming a new adsorbent. The332
results indicated that the adsorption process is not dependent on333
solution pH, since the most probable mechanism for adsorption334
is the interaction of the polymer quaternary ammonium groups335
with the dye sulfonate groups. Adsorption kinetics followed the336
pseudo-second-order mechanism, which was the model that pro-337
vided the best correlation with the experimental data. In the338
adsorption equilibrium studies, the Langmuir equation was used339
to fit the experimental data obtained, providing a maximum340
adsorption capacity of 1060 mg g−1 corresponding to 75% occu-341
pation of the adsorption sites. The results obtained showed that342
the new adsorbent material could be tested on textile effluents343
independent of the pH of the aqueous medium.344
Acknowledgement345
I gratefully acknowledge Prof. W.L. Hinze (Wake Forest Uni-346
versity, USA) for the critical reading and the comments.347
References348
[1] C.M. Kao, M.S. Chou, W.L. Fang, B.W. Liu, B.R. Huang, Regulating color349
textile wastewater by 3/31 wavelength admi methods in Taiwan, Chemo-350
sphere 44 (2001) 1055–1063.351
[2] G. Crini, Non-conventional low-cost adsorbents for dye removal: a review,352
Bioresour. Technol. 97 (2005) 1061–1085.353
[3] M.N.V.R. Kumar, T.R. Sridhari, K.D. Bhavani, P.K. Dutta, Trends in color354
removal from textile mill effluents, Colorage 40 (1998) 25–34.355
[4] E.R. Trotman, Dyeing and Chemical Technology of Textile Fibres, 6th ed.,356
Charles Griffin and Company Ltd., London, 1984.357
[5] P.C. Vandevivere, R. Bianchi, W. Verstrate, Treatment and reuse of358
waste-water from the textile wetprocessing industry, J. Chem. Technol.359
Biotechnol. 72 (1998) 289–302.360
[6] O. Tunay, Color removal from textile wastewaters, Water Sci. Technol. 34361
(1996) 9–16.362
[7] Y. Anjaneyulu, N.S. Chary, D.S.S.D. Raj, Decolourization of industrial363
effluents available methods and emerging technologies––a review, Environ.364
Sci. Biotechnol. 4 (2005) 245–273.365
[8] E. Forgacs, C. Tibor, O. Gyula, Removal of synthetic dyes from wastewa- 366
ters: a review, Environ. Int. 30 (2004) 953–971. 367
[9] T. Robinson, G. McMullan, R. Marchant, P. Nigam, Remediation of dyes 368
in textile effluent: a critical review on current treatment technologies with 369
a proposed alternative, Bioresour. Technol. 77 (2001) 247–255, Review. 370
[10] E. Kusvuran, O. Gulnaz, S. Irmak, M.O. Atanur, I.H. Yavuz, O. Erbatur, 371
Comparision of several advanced oxidation process for the decolorization 372
of reactive red 120 azo dye in aqueous solution, J. Hazard. Mater. 109 373
(2004) 85–93. 374
[11] L.C. Morais, O.M. Freitas, E.P. Goncalves, L.T. Vasconcelos, C.G. Gon- 375
zalez Beca, Reactive dyes removal from wastewaters by adsorption on 376
eucalyptus bark: variables that define the process, Water Res. 33 (1999) 377
979–988. 378
[12] K.K.H. Choy, G. McKay, J.F. Porter, Sorption of acid dyes from effluents 379
using activated carbon, Resour. Conserv. Recyl. 27 (1999) 57–71. 380
[13] Y.E. Benkli, M.F. Can, M. Turan, M.S. Celik, Modification of organo- 381
zeolite surface for removal of reactive azo dyes in fixed-bed reactors, Water 382
Res. 39 (2005) 487–493. 383
[14] A.R. Dincer, Y. Gunes, N. Karakaya, E. Gunes, C.C. Compar, J.J.M. Orfao, 384
M.F.R. Pereira, Adsorption of anionic and cationic dyes on activated anion 385
of activated carbon and bottom ash for removal of reactive dye from aqueous 386
solution, Bioresour. Technol. 98 (8) (2007) 34–839. Q2 387
[15] P. Faria, carbons with different surface chemistries, Water Res. 38 (2004) 388
2043–2052. 389
[16] G. Annadurai, M. Chellapandian, M.R.V. Krishnan, Adsorption of reactive 390
chitin, Environ. Monit. Assess. 59 (1999) 111–119. 391
[17] G. Crini, Recent development in polysaccharide-based materials used as 392
adsorbents in wastewater treatment, Prog. Polym. Sci. 30 (2005) 38–70. 393
[18] M. Nassar, Y.H. Magdy, Removal of different basic dyes from aqueous 394
solutions by adsorption on palm-fruit bunch particles, Chem. Eng. J. 66 395
(1997) 223–226. 396
[19] E. Longhinotti, F. Pozza, L. Furlan, M.N.M. Sanches, M. Klug, M.C.M. 397
Laranjeira, V.T. Favere, Adsorption of anionic dyes on the biopolymer 398
chitin, J. Braz. Chem. Soc. 9 (1998) 435–440. 399
[20] M.N.V.R. Kumar, A review of chitin and chitosan applications, React. 400
Funct. Polym. 46 (2000) 1–27. 401
[21] F. Wu, R. Tseng, R. Juang, Kinetic Modeling of liquid-phase adsorption of 402
reactive dyes and metal ions on chitosan, Water Res. 35 (2001) 613–618. 403
[22] M.S. Chiou, H.Y. Li, Equilibrium and kinetic modeling of adsorption of 404
reactive dye on cross-linked chitosan beads, J. Hazard. Mater. B93 (2002) 405
233–248. 406
[23] I. Uzun, Kinetics of the adsorption of reactive dyes by chitosan, Dyes 407
Pigments 70 (2006) 76–83. 408
[24] G.R. Lang, H. Wenbel, E. Konrad, Quaternization of chitosan with glycidyl 409
trimethyl ammonium chloride, US Patent 4 (1990) 921–949. Q3 410
[25] V.A. Spinelli, M.C.M. Laranjeira, V.T. Favere, Preparation and characteri- 411
zation of quaternary chitosan salt: adsorption equilibrium of chromium(VI) 412
ion, React. Funct. Polym. 61 (2004) 347–352. 413
[26] I.Y. Kimura, M.C.M. Laranjeira, V.T. Favere, L. Furlan, The interaction 414
between reactive dye containing vinylsulfone group and chitosan micro- 415
spheres, Int. J. Polym. Mater. 51 (2002) 759–768. 416
[27] M.S. Chiou, G.S. Chuang, Competitive adsorption of dye metanil yellow 417
and RB15 in acid solutions on chemically cross-linked chitosan beads, 418
Chemosphere 62 (2006) 731–740. 419
[28] S. Lagergren, Zur theorie der sogenannten adsorption gel ster stoffe, Kung- 420
liga Svenska Vetenskapsakademiens Handlingar. 24 (1898) 1–39. 421
[29] Y.S. Ho, G. Mckay, Pseudo-second order model for sorption process, Pro- 422
cess Biochem. 34 (1999) 451–465. 423
[30] W.J. Weber Jr., J.C. Morris, Kinetics of adsorption on carbon from solution, 424
J. St.Eng. Div. ASCE 89 (1963) 31–59. 425
[31] F. Wu, R. Tseng, R. Juang, Comparative adsorption of metal and dye on 426
flake and bead-types of chitosans prepared from fishery wastes, J. Hazard. 427
Mater. B73 (2000) 63–75. 428
[32] F. Wu, R. Tseng, R. Juang, Enhanced abilities of highly swollen chitosan 429
beads for color removal and tyrosinase immobilization, J. Hazard. Mater. 430
B 81 (2001) 167–177. 431
[33] G. Akkaya, I. Uzun, F. Guzel, Kinetics of adsorption of reactive dyes by 432
chitin, Dyes Pigments 73 (2007) 168–177. 433
UN
CO
RR
EC
TED
PR
OO
F
Please cite this article in press as: S. Rosa, et al., Cross-linked quaternary chitosan as an adsorbent for the removal of the reactive dye fromaqueous solutions, J. Hazard. Mater. (2007), doi:10.1016/j.jhazmat.2007.11.059
ARTICLE IN PRESS+ModelHAZMAT 7567 1–8
8 S. Rosa et al. / Journal of Hazardous Materials xxx (2007) xxx–xxx
[34] M.Y. Chang, R.S. Juang, Adsorption of tannic acid, humic acid, and dyes434
from water using the composite of chitosan and active clay, J. Colloid Interf.435
Sci. 278 (2004) 18–25.436
[35] M.Y. Chang, R.S. Juang, Equilibrium and kinetic studies on the adsorption437
of surfactant, organic acids and dyes from water onto natural biopolymers,438
Colloids Surf A: Physicochem. Eng. Aspects 269 (2005) 35–46.439
[36] M.S. Chiou, H.Y. Li, Adsorption behavior of reactive dye in aqueous solu-440
tion on chemical cross-linked chitosan beads, Chemosphere 50 (2003)441
1095–1105.442
[37] M.S. Chiou, H.Y. Li, Adsorption of anionic dyes in acid solutions using443
chemically cross-linked chitosan beads, Dyes Pigments 60 (2004) 69–84.444
[38] I. Langmuir, The constitution and fundamental properties of solids and 445
liquids, J. Am. Chem. Soc. 38 (1916) 2221–2295. 446
[39] I. Langmuir, The adsorption of gases on plane surfaces of glass, mica and 447
platinum, J. Am. Chem. Soc. 40 (1918) 1361–1403. 448
[40] H.M.F. Freundlich, Uber die adsorption in Losungen, Zeitschrift fr 449
Physikalische Chemie. (1906) 385–471. 450
[41] D.S. Kinniburgh, General Purpose adsorption isotherms, Environ. Sci. 451
Technol. 20 (1986) 895–904. 452
[42] N. Sakkayawong, P. Thiravetyan, W. Nakbapote, Adsorption mechanism 453
on synthetic reactive dye wastewater by chitosan, J. Colloid Interf. Sci. 286 454
(2005) 36–42. 455
Related Documents