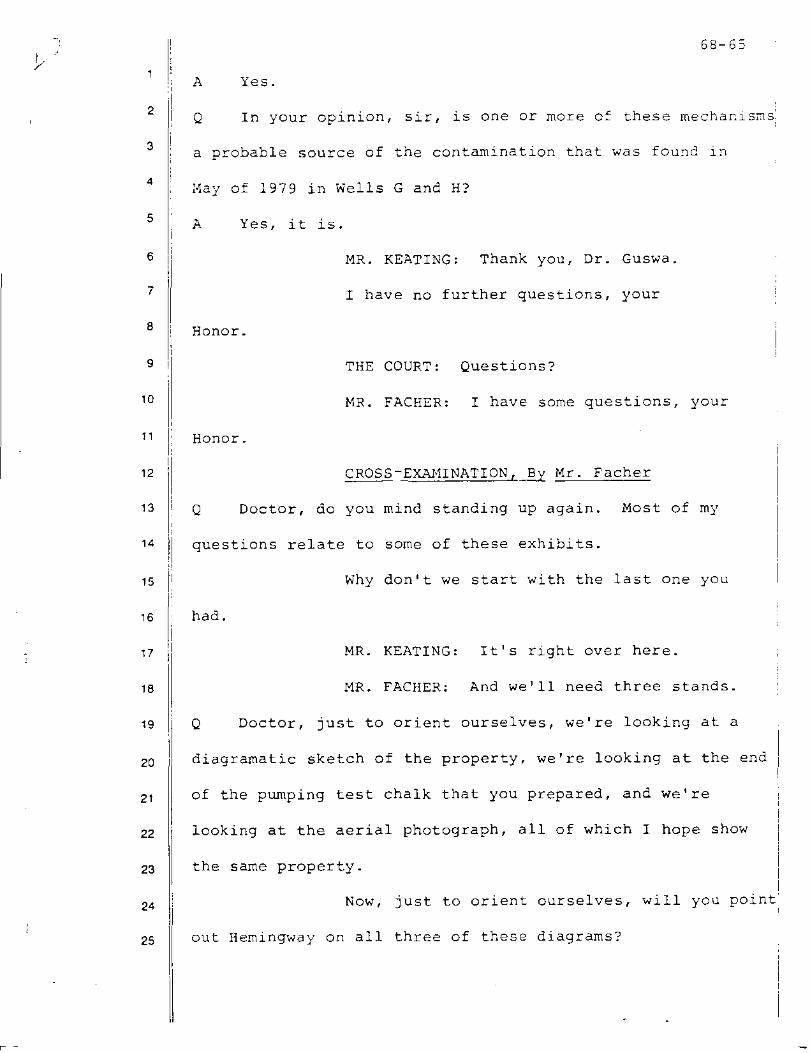
CROSS-EXAMINATION, By Mr. Facher Q Doctor, do you mind standing up again. Most of my questions relate to some of these exhibits. Why don't we start with the last one you had. MR. KEATING: It's right over here. MR. FACHER: And we'll need three stands. Q Doctor, just to orient ourselves, we're looking at a diagramatic sketch of the property, we're looking at the end of the pumping test chalk that you prepared, and we're looking at the aerial photograph, all of which I hope show the same property. Now, just to orient ourselves, will you point out Hemingway on all three of these diagrams?

Welcome message from author
This document is posted to help you gain knowledge. Please leave a comment to let me know what you think about it! Share it to your friends and learn new things together.
Transcript
CROSS-EXAMINATION, By Mr. Facher
Q Doctor, do you mind standing up again. Most of my
questions relate to some of these exhibits.
Why don't we start with the last one you
had.
MR. KEATING: It's right over here.
MR. FACHER: And we'll need three stands.
Q Doctor, just to orient ourselves, we're looking at a
diagramatic sketch of the property, we're looking at the end
of the pumping test chalk that you prepared, and we're
looking at the aerial photograph, all of which I hope show
the same property.
Now, just to orient ourselves, will you point
out Hemingway on all three of these diagrams?

68-66
A Yes. The main Hemingway building is here (indicating),
the parking lot area covers about here (indicating), and
then a piece of property that ends down this direotion -- here
(indicating), it is approximately like this. On here it is
approximately this (indicating). And over here it goes down,
approximately in this area here (indicating).
Q So that the main building on the photograph is that
square building with these objects around it. There it is on
the diagram (indicating), and there it is on the chalk by
the pumping test?
A Yes.
Q And this middle diagram does not -- that is the PAL --
does not complete the river as it actually is. Is that
correct?
A That's correct.
MR. FACHER: Would you---
A Meaning it doesn't go north.
MR. FACHER: Would you object, Mr. Schlichtmann,
if the witness put the rest of the river on this diagram?
MR. SCHLICHTMANN: Yes.
MR. FACHER: You would object?
MR. SCHLICHTMANN: Yes. Do you want to
put an overlay on it?
MR. FACHER: I don't have an overlay.
Q We will trace for the jury then, since Mr. Schlichtmann
68-67
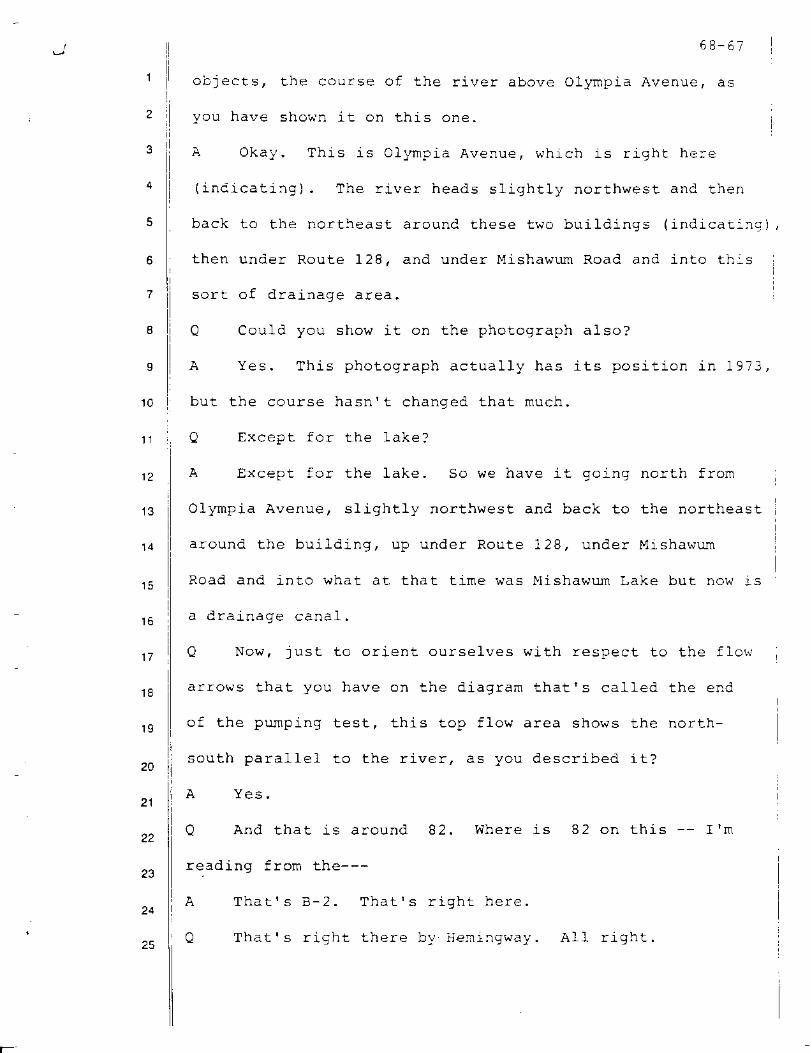
objects, the course of the river above Olympia Avenue, as
you have shown it on this one.
A Okay. This is Olympia Avenue, which is right here
(indicating). The river heads slightly northwest and then
back to the northeast around these two buildings (indicating),
then under Route 128, and under Mishawum Road and into this
sort of drainage area.
Q Could you show it on the photograph also?
A Yes. This photograph actually has its position in 1973,
but the course hasn't changed that much.
Q Except for the lake?
A Except for the lake. So we have it going north from
Olympia Avenue, slightly northwest and back to the northeast
around the building, up under Route 128, under Mishawum
Road and into what at that time was Mishawum Lake but now is
a drainage canal.
Q Now, just to orient ourselves with respect to the flow
arrows that you have on the diagram that's called the end
of the pumping test, this top flow area shows the north-
south parallel to the river, as you described it?
A Yes.
Q And that is around 82. Where is 82 on this -- I'm
reading from the---
A That's B-2. That's right here.
Q That's right there by Hemingway. All right.

68-68
Now this arrow here going across the 45-foot
line is just below S-76. Will you point out where that is?
A Yes. S-76 is here (indicating).
Q And where would that be on the photograph?
A It would be approximately---
Q I think you're blocking some of the jurors.
A I'm sorry. S-76 is approximately here.
Q And this arrow on the bottom that is pointing in the
direction of the Riley pumping wells, that's approximately
where on the diagram?
A This is Well BW-4, whioh is shown here (indicating),
so the arrow is basically this direction. It's actually
going to Well S-46, which is the pumping well.
Q And there are two pumping wells in that area?
A That's correct.
Q Now, I'm sure everyone, including Mr. Schlichtmann,
would like to know why there are no arrows pointing direotly
at the heart of the Beatrice site.
I'll do some of your work for you.
Can you explain that, sir?
A Yes. The fundamental reason for that is that the data
are not sufficient to draw conclusively what the
groundwater flow direction is in this location. I had talked
earlier about a groundwater divide on the Cryovac plant.
That is a natural divide that courses with the topographic

68-69
high. We look at Wells G and H themselves. We see a large
cone of depression, this large oval (indicating), which
encompasses both Wells G and H. In the middle of that large
oval, we see a small oval, two small ovals, one around G
and one around H. And in between there, we have a slight
mound. That is also a groundwater divide, meaning that
water located in this position -- an imaginary line, if you
will, where water to the north of that line flows toward
Well H, and to the south of the line flows toward Well G, and
the direction of flow is dependent on where that line is.
That represents sort of a local mound in the water table.
And I believe in some of the other transcripts I've read
that there was reference to a drum or a rubber elastic.
If you pull it down in two locations, that represented the
cone of depression.
You can also -- And maybe that was mentioned.
If not, I'll explain it. There was also a rise in between
those two places that you're pulling down. That is a high
on the water table, and it affects the groundwater flow
direction. That groundwater divide, however, is not the
same as this groundwater divide because it exists only
because the two wells are pumping, because each of the wells
is pulling the water level down in close proximity to itself.
And for instance if Well H were to stop
pumping, there would be no cone of depression around here,
68-70
and then all flow would be -- from the vicinity of H would
be south toward Well G.
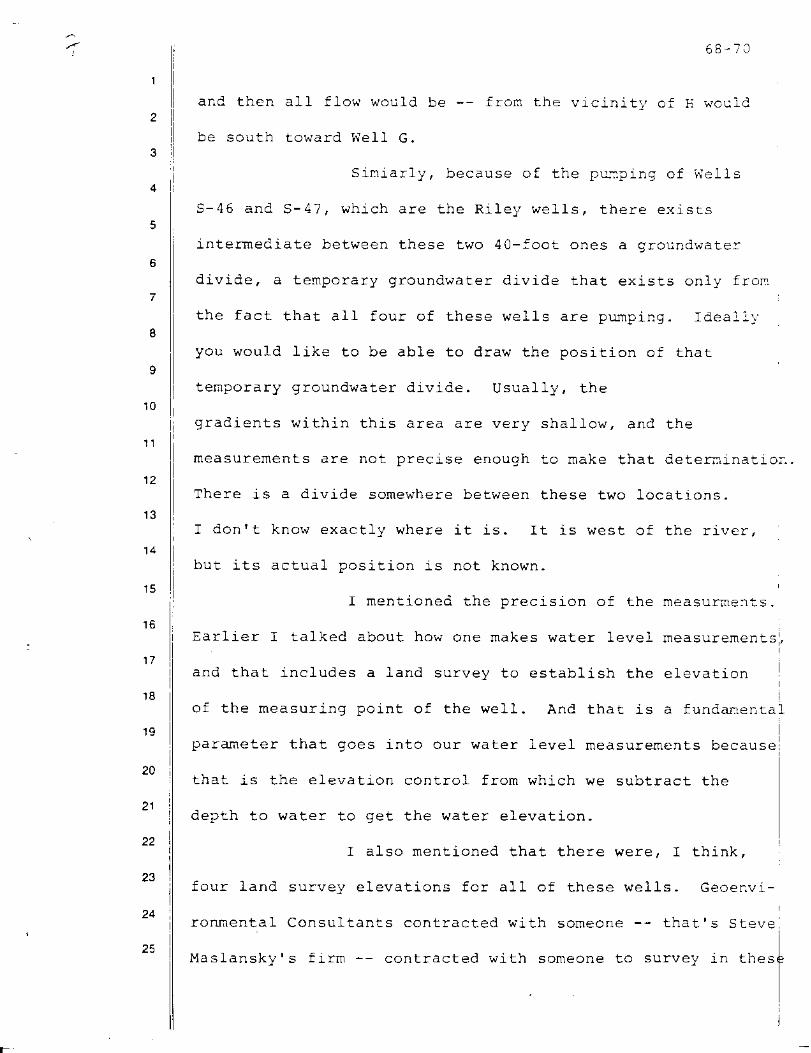
Similarly, beoause of the pumping of Wells
S-46 and S-47, which are the Riley wells, there exists
intermediate between these two 40-foot ones a groundwater
divide, a temporary groundwater divide that exists only from
the fact that all four of these wells are pumping. Ideally
you would like to be able to draw the position of that
temporary groundwater divide. Usually, the
gradients within this area are very shallow, and the
measurements are not precise enough to make that determination.
There is a divide somewhere between these two locations.
I don't know exactly where it is. It is west of the river,
but its actual position is not known.
I mentioned the precision of the measurments.
Earlier I talked about how one makes water level measurements,
and that includes a land survey to establish the elevation
of the measuring point of the well. And that is afundamental
parameter that goes into our water level measurements because
that is the elevation control from which we subtract the
depth to water to get the water elevation.
I also mentioned that there were, I think,
four land survey elevations for all of these wells. Geoenvi-
ronmental Consultants contracted with someone -- that's Steve
Maslansky's firm -- contracted with someone to survey in these

68-71
wells. The EPA had their contractor who did most of these
wells. And both Woodward-Clyde and Weston Geophysical had
land surveyors survey in the elevations of the wells on the
Beatrice property.

68-72
And we have that information and there are
discrepancies in the elevation of the measuring point. For
several of the wells, those discrepancies are as much as two
tenths of a foot. One land surveyor will say the elevation
of the measuring point is 40 feet, and the other says it is
40.2 feet. So we know there is a difference between those
two elevations. We don't know which one is correct.
We've used the measurements provided by Weston
Geophysical simply because we received them first.
In addition to the imprecision resulting from
the discrepancy in the land survey elevation, it appears, as
we look at the water level measurements that were made, that
they were made with an electric tape. Because as we see the
water level measurements made at the end of the test, there
are fluctuations in the measured water level that indioate a
plus or minus depth of a foot rise in the water level. That
reflects the precision of the measurement technique.
We now have three tenths of a variation or
uncertainty in any one of these measurements. It is for that
fundamental reason that it is not possible to draw the
direction of the arrow because if I look at any one particular
well, for instance, let's look at Well S-78, I see a gradient
toward Well W-14, but I also see a gradient toward W-14.
I know somewhere between these two 40 foot contours there is
a groundwater divide which would really determine which way

68-73
groundwater is moving. It is for that reason that I can't
draw an arrow through that portion of the map.
Q What is the gradient? Why are precision measurements
essential when you have a gradient or a flat surface as you
have at the Riley property?
A Well, it's for exactly that reason, a two tenths of a
foot or three tenths of a foot measurement descrepancy for
evaluating the Cryovac to Well G and H direction where the
total variation is 45 feet. There is not a major discrepancy.
In areas of very shallow gradients, such as
were shown on the other map, such as non-pumping conditions
where we may have several hundreds of feet with only a one
foot water level gradient, an error of three tenths of a foot
or discrepancy of three tenths of a foot is a very significant
part of that water level measurement.
Q Now, you referred to in one of the chalks to a mound.
It may have been in the pre-pumping one.
A That would be in the pre-pumping one, yes.
MR. FACHER: May I have that?
Q Incidentally, while we're getting that, the red line in
the photograph is the sewer oonnections?
Did I do that?
A No.
Yes, it is the sewer. There are actuall y two
sewers that run through here. They don't follow exactly the
63-74
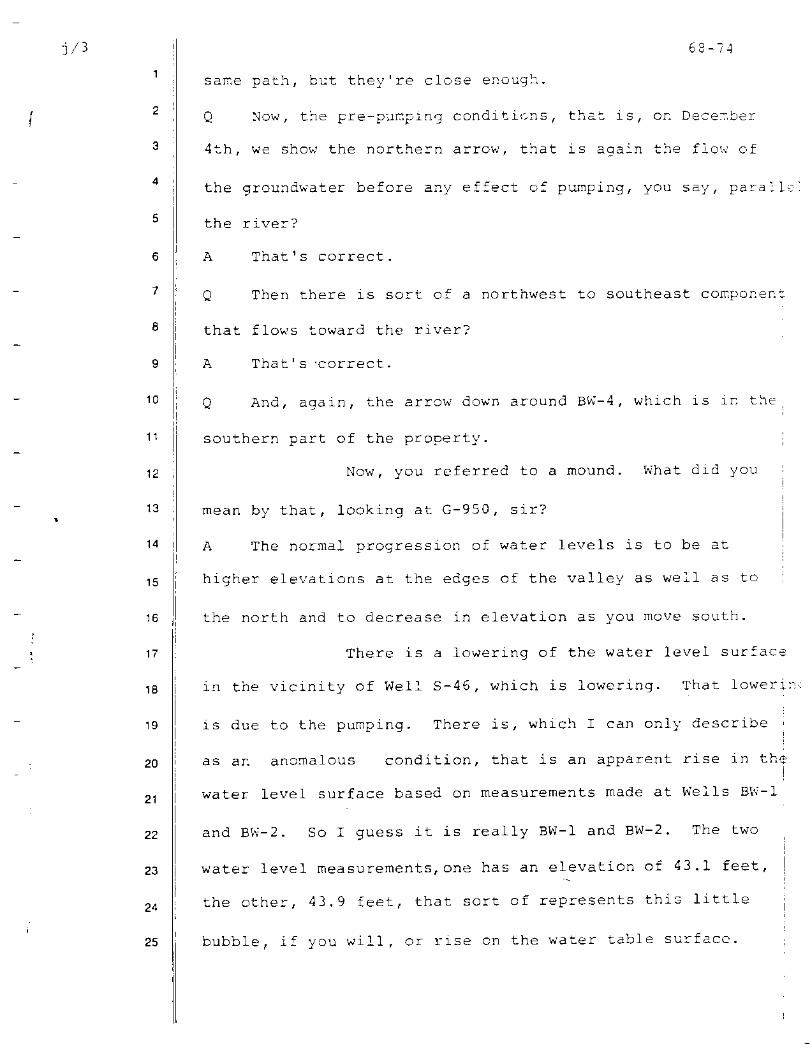
same path, but they're close enough.
Q Now, the pre-pumping conditions, that is, on December
4th, we show the northern arrow, that is again the flow of
the groundwater before any effect of pumping, you say, parallel
the river?
A That's correct.
Q Then there is sort of a northwest to southeast component
that flows toward the river?
A That's correct.
Q And, again, the arrow down around BW-4, which is in the
southern part of the property.
Now, you referred to a mound. What did you
mean by that, looking at G-950, sir?
A The normal progression of water levels is to be at
higher elevations at the edges of the valley as well as to
the north and to decrease in elevation as you move south.
There is a lowering of the water level surface
in the vicinity of Well S-46, which is lowering. That lowering
is due to the pumping. There is, which I can only describe
as an anomalous condition, that is an apparent rise in the
water level surface based on measurements made at Wells BW-1
and BW-2. So I guess it is really BW-1 and BW-2. The two
water level measurements, one has an elevation of 43.1 feet,
the other, 43.9 feet, that sort of represents this little
bubble, if you will, or rise on the water table surface.
68-75
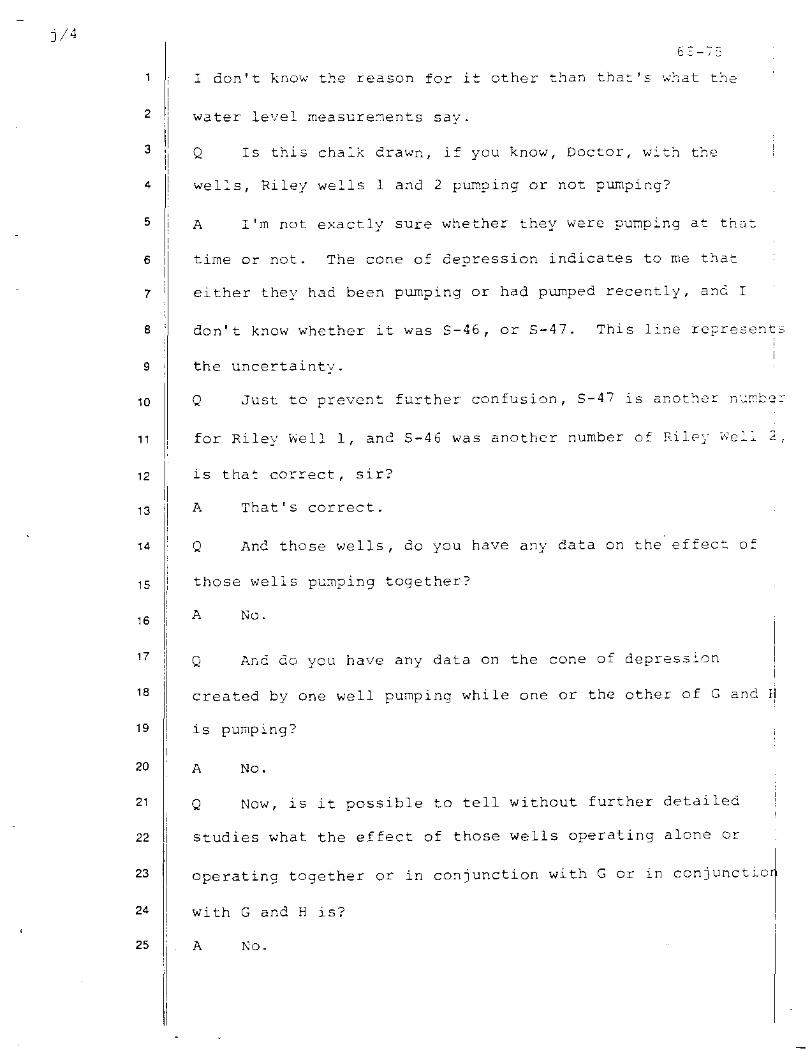
I don't know the reason for it other than that's what the
water level measurements say.
Q Is this chalk drawn, if you know, Doctor, with the
wells, Riley wells 1 and 2 pumping or not pumping?
A I'm not exactly sure whether they were pumping at that
time or not. The cone of depression indicates to me that
either they had been pumping or had pumped recently, and I
don't know whether it was S-46, or S-47. This line represents
the uncertainty.
Q Just to prevent further confusion, 5-47 is another number
for Riley Well 1, and 5-46 was another number of Riley
is that correct, sir?
A That's correct.
Q And those wells, do you have any data on the effeot of
those wells pumping together?
A No
Q And do you have any data on the cone of depression
created by one well pumping while one or the other of G and H
is pumping?
A No.
Q Now, is it possible to tell without further detailed
studies what the effect of those wells operating alone or
operating together or in conjunction with G or in conjunction
with G and H is?
A No.
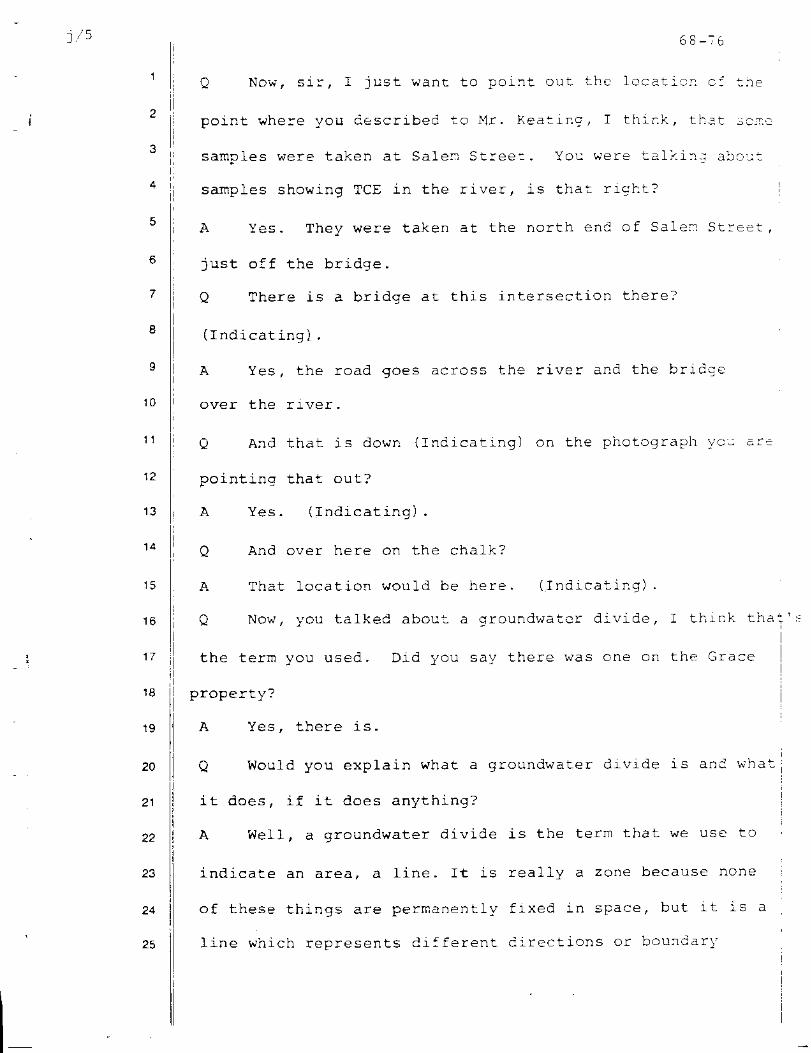
68-76
QNow , sir, I just want to point out the location of the
point where you described to Mr. Keating, I think, that some
samples were taken at Salem Street. You were talking about
samples showing TCE in the river, is that right?
A Yes. They were taken at the north end of Salem Street,
just off the bridge.
Q There is a bridge at this intersection there?
(Indicating).
A Yes, the road goes across the river and the bridge
over the river.
Q And that is down (Indicating) on the photograph you are
pointing that out?
A Yes. (Indicating).
Q And over here on the chalk?
A That location would be here. (Indicating).
Q Now, you talked about a groundwater divide, I think that's
the term you used. Did you say there was one on the Grace
property?
A Yes, there is.
Q Would you explain what a groundwater divide is and what
it does, if it does anything?
A Well, a groundwater divide is the term that we use to
indicate an area, a line. It is really a zone because none
of these things are permanently fixed in space, but it is a
line whioh represents different directions or boundary

68-77
between different directions of groundwater flow. We have a
high on the water level, the water level surface of the
water table here on the Cryoyac plant. To the east of this
line water flows to the east, as we move from higher water
levels 95.4 to lower water levels, 91.3.
That divide is a reflection of the topography
on the fact that we are up on the edges of the valley,
the water would be flowing down this way, and if we had another
valley there would be water flowing into that valley and a
divide on this station and another zone like this, we would
have all our river valleys sort of flowing together.
Q The question was, what does the divide divide?
A In this case the divide identifies two different direc-
tions of groundwater flow.
Q Is that a phenomenon that hydrologists come in contact
with, groundwater divide?
A Yes.
Q So that water is flowing in different directions on each
side of the divide, would that be a way of putting it?
A That's correct.
Q Now, you had a chalk on drops, the contours showing the
II
drops.
A Yes.
Q I don't know if I desoribed it correctly.
A I think it was called "Water Level Change Map."
68-78
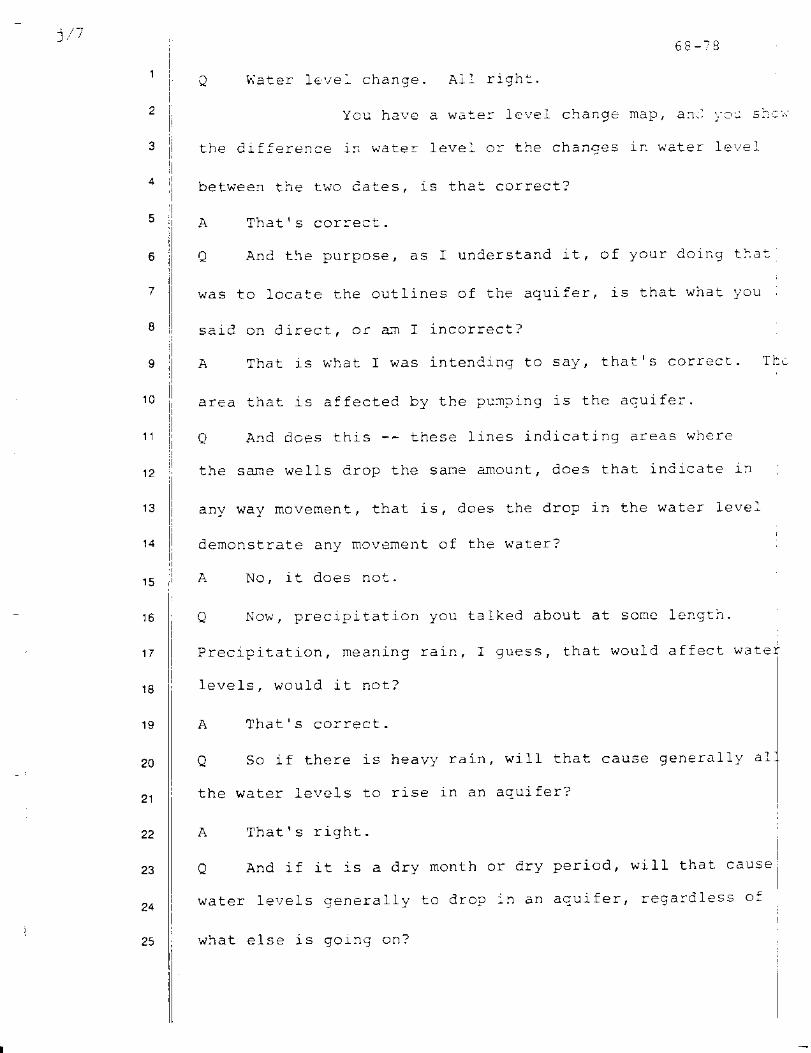
Q Water level change. All right.
You have a water leyel change map, and you show
the difference in water level or the changes in water level
between the two dates, is that correct?
A That's correct.
Q And the purpose, as I understand it, of your doing that
was to locate the outlines of the aquifer, is that what you
said on direct, or am I incorrect?
A That is what I was intending to say, that's correct. The
area that is affected by the pumping is the aquifer.
Q And does this -- these lines indicating areas where
the same wells drop the same amount, does that indicate in
any way movement, that is, does the drop in the water level
demonstrate any movement of the water?
A No, it does not.
Q Now, precipitation you talked about at some length.
Precipitation, meaning rain, I guess, that would affect water
levels, would it not?
A That's correct.
Q So if there is heavy rain, will that cause generally all
the water levels to rise in an aquifer?
A That's right.
Q And if it is a dry month or dry period, will that cause
water levels generally to drop in an aquifer, regardless of
what else is going on?
68-79
A That's correct.
Q And you had a rain chart, at least I called it a ran
chart, Is that correct, on the rainfall?
A On precipitation on Well S-94D, I believe. It is about
this wide. (Indicating).
MR. KEATING: I think this is the one
you are talking about.
Q This is the rain chart, again, on S-94D, and it shows
the relation between what happens when it rains and what
happens to the water level on that particular day, right?
A That's correct.
Q And it works the other way around, too, if you keep getting
no rain, the water level goes down?
A Water levels would decline if there is no rain, that is
right.
Q Do you have a memory, sir, or a data on whether
December was an unusually dry, if I can use that word, for
December, dry month in 1983?
A I have my meteorological data here if I can go find it.
Q Maybe we'll just use the numbers.
What do you have, if you have it, sir?
A I'm sorry. These are data sheets from the National
Oceanographic & Atmospheric Administration that summarize
the daily precipitation for the months of November, December
1985.
68-80
Q What do you have for December?
A Okay. I have a monthly summary for December also,
as well as a daily summary. For the month of December, 1.21
precipitation and a departure of minus 3.27 on the drop.
Q In other words, there were three and a quarter inches
less rainfall than was usual?
A That's correct.
Q And there had also been a heavy rainfall at the end of
November?
A That's correct.
Q Now, you talked about the stream or the river being
both recharged by the groundwater and under certain conditions
discharging water into the groundwater?
A That's correct.
Q And I want to show you a diagram just to see if this
helps illustrate the testimony. This is supposedly showing
water table contours and groundwater flow directions in
relation to stream stages for a losing stream, which I
gather means water coming out of the stream. Is that some-
thing that you can recognize as a correct diagramatic
representation?
A I would say that is a standard textbook representation
of that process.
Q I got it from a textbook, that's right.
And would you -- sorry I didn't make a giant

68-81
one -- can you point out on this diagram where the water
table is and write in the words "water table" and also where
the ground is. On the losing stream is what I'm interested
in.
A (Witness complies.)
Q And the bottom picture diagram is as if we were in an
airplane looking down with X-ray vision seeing through the
river?
A That's correct.
Q This little triangle that you put on the river surface,
you put that on some of your other diagrams, I believe.
That indicates the top of the water table?
A In this case it indicates the top of the stream. We
also use that symbol to indioate the top of the water table.
Q And the arrows indicate water flow direction?
A That is what they are intended to indicate, yes.
MR. FACHER: I'd like to offer this as B-901,
your Honor.
MR. SCHLICHTMANN: No objection, your
Honor.
THE COURT: Want to show it to Mr. Keating.
MR. FACHER: Oh, I'm sorry.
MR. KEATING: I have no objection, your
Honor.
THE COURT: And the number of that again?

68-82
MR. FACHER: B-901, water table contours,
groundwater flow directions, losing stream.
THE COURT: That is admitted.
(Diagram entitled, "WaterTable Contours, GroundwaterFlow Directions, Losing Stream"Exhibit B-901, was receivedinto evidence.)
Q One question that I forgot to ask about these contour
lines on the drop. Are you able to distinguish, sir, in
making this contour map showing drops at different wells
the effect of G and H pumping, Riley 1 and 2 pumping, laok of
precipitation or some combination or permutation of those.
Can you distinguish between them in trying to figure out
what caused the water drop?
A No. As I said, what that map represents is an arithmetic
difference between the two water level measurements.
Q It is just what you found according to the numbers?
A Right.
MR. FACHER: Now, could I have one more, the
nice sunshine one, the bright colors, orange and yellow,
the three-dimensional---
THE COURT: Well, there were a couple of
those. What layer do you want?
MR. FACHER: Not the long one. We might go
to the well once too often, if you pardon the bad pun.
Q This is only going to be up there a little bit. Just
68-83
so I understand it, you sort of have to look at this in
three D. We're standing at Salem Street or we're standing
right in front of -- And we're looking at the river and
it's coming toward us. So these arrows are actually
coming right at us, except this one is going, the one on the
top is going up a little bit?
A Right. It is coming at us but going up into the river.
Q Now, I just want to ask a question, see if I understand
what you testified to talking about pumping conditions.
I think you testified that these numbers really represent
energy or a loss thereof, but for convenience we talk about
them as water levels. Did I understand that correctly?
A Yes.
Q And on this S-92 -- which really is in the river, is
it not?
A Yes.
Q For all practical purposes?
A On the banks of the channel it shows on the map, but
it is in the river.
Q And based on your conception of this whole area, it
would be a river well, I guess?
A Yes.
Q That has a 42.82 reading at that point. Ther's that
little triangle. Is that right?
A This 42.82 is the actual elevation of the Aberjona River
68-84
surface water body itself. And they set up the measuring
station to measure the relation of the river.
Q And am I correct that this is the first well, this
42.48, -- I don't mean first, but this is the first
reading on the shallow well.
Would it be correct, using your information
about which you told us that there would be an arrow, a
small arrow going toward -- from 42.82, toward 42.48, would
a purist put an arrow in there?
A Yes. On the basis of this information, there is a
component or a decrease in the water level from the river
to that shallow well.
Q So that would be an arrow going westerly, at least in
some direction?
A That's right.
Q One last question, Doctor. To your knowledge, is there
any well testing data, chemical analysis from a well, showing
any of the complaint chemicals prior to May, 1979?
A You mean of Wells G and H?
Q Of any well that you're aware of, have there been any
chemical analyses-or tests of a production well or a monitoring
well prior to May of '79 that you're aware of?
A No, there are not.
MR. FACHER: Nothing further.
63-85
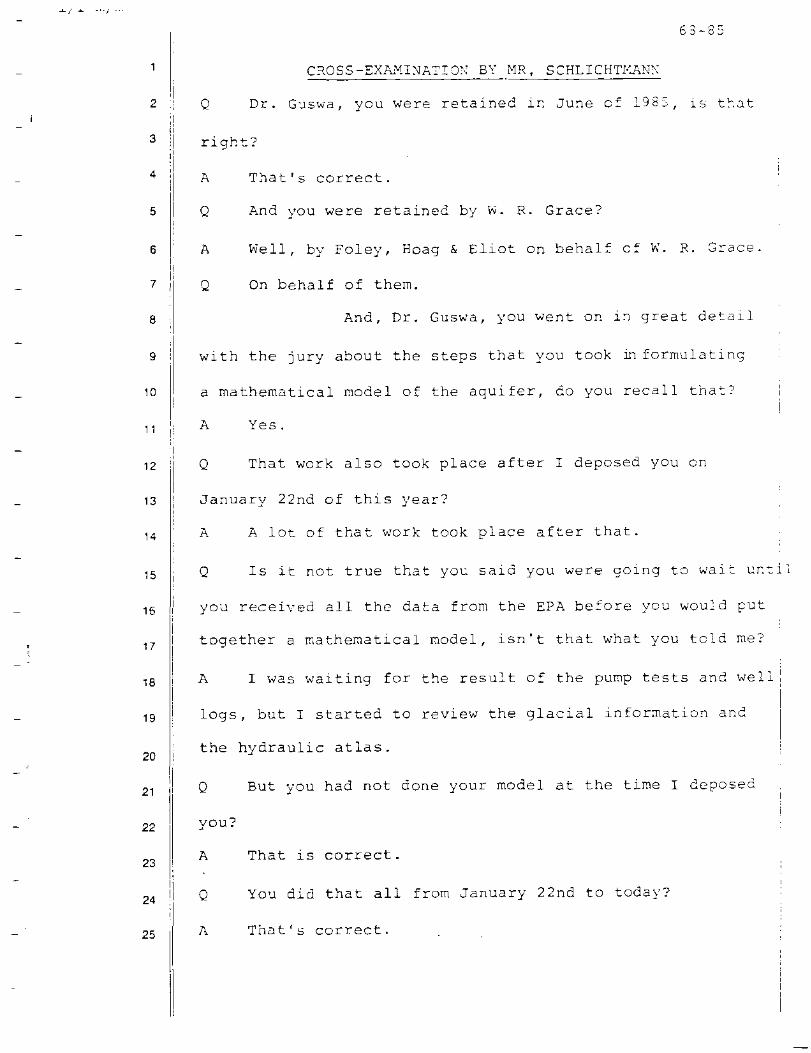
CROSS-EXAMINATION BY MR, SCHLICHTMANN
Q Dr. Guswa, you were retained in June of 1985 is that
right?
A That's correct.
Q And you were retained by W. R. Grace?
A Well, by Foley, Hoag & Eliot on behalf of W. R. Graoe.
Q On behalf of them.
And, Dr. Guswa, you went on in great detail
with the jury about the steps that you took in formulating
a mathematical model of the aquifer, do you recall that?
A Yes.
Q That work also took plaoe after I deposed you on
January 22nd of this year?
A A lot of that work took place after that.
Q Is it not true that you said you were going to wait until
you receiyed all the data from the EPA before you would put
together a mathematical model, isn't that what you told me?
A I was waiting for the result of the pump tests and well
logs, but I started to review the glacial information and
the hydraulic atlas.
Q But you had not done your model at the time I deposed
you?
A That is correct.
Q You did that all from January 22nd to today?
A That's correct.
68-86
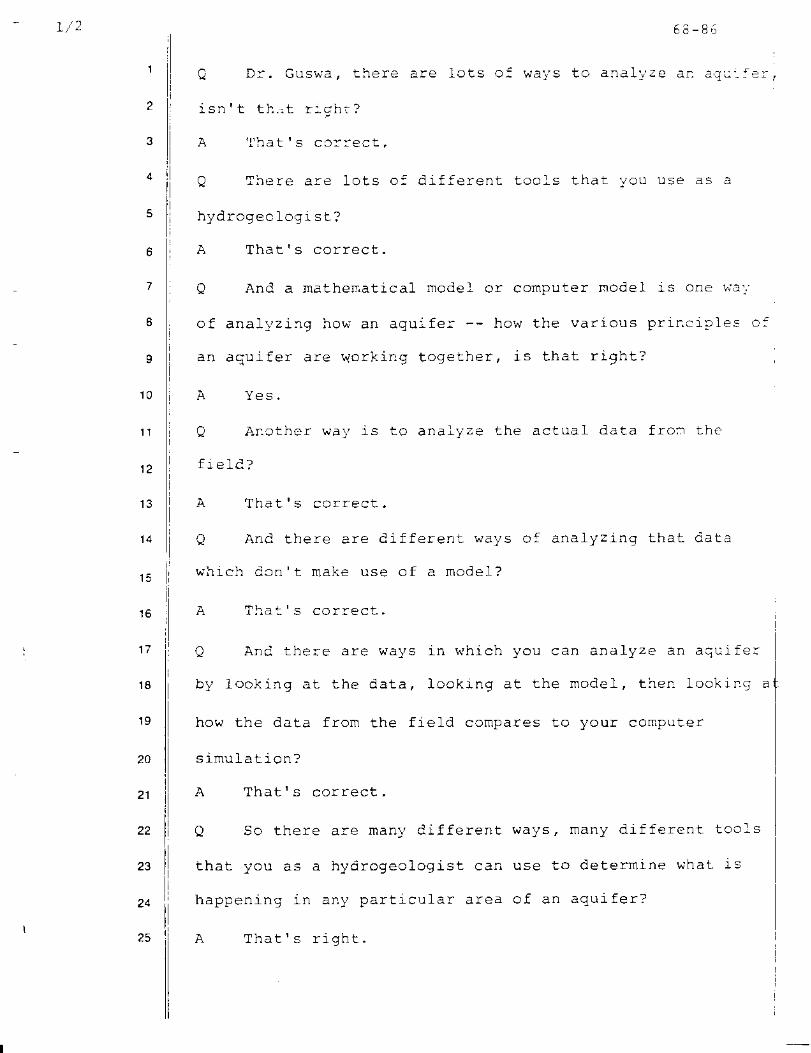
Q Dr. Guswa, there are lots of ways to anal y ze an aquifer,
isn't that right?
A That's correct,
Q There are lots of different tools that you use as a
hydrogeologist?
A That's correct.
Q And a mathematioal model or computer model is one way
of analyzing how an aquifer -- how the various principles of
an aquifer are working together, is that right?
A Yes.
Q Another way is to analyze the actual data from the
field?
A That's correct.
Q And there are different ways of analyzing that data
which don't make use of a model?
A That's correct.
Q And there are ways in which you can analyze an aquifer
by looking at the data, looking at the model, then looking at
how the data from the field compares to your computer
simulation?
A That's correct.
Q So there are many different ways, many different tools
that you as a hydrogeologist can use to determine what is
happening in any particular area of an aquifer?
A That's right.
68-87
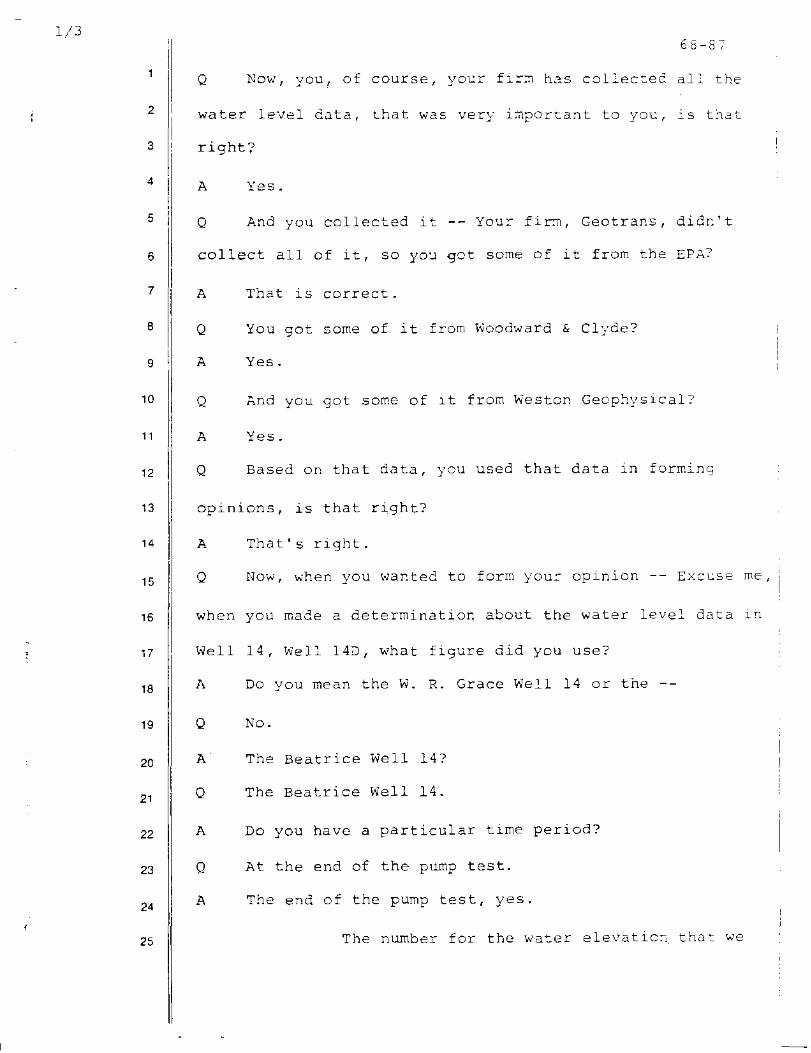
Q Now , you, of course, your firm has collected all the
water level data, that was very important to you, is that
right?
A Yes.
Q And you collected it -- Your firm, Geotrans, didn't
collect all of it, so you got some of it from the EPA?
A That is correct.
Q You got some of it from Woodward & Clyde?
A Yes.
Q And you got some of it from Weston Geophysical?
A Yes.
Q Based on that data, you used that data in forming
opinions, is that right?
A That's right.
Q Now, when you wanted to form your opinion -- Excuse me,
when you made a determination about the water level data in
Well 14, Well 14D, what figure did you use?
A Do you mean the W. R. Grace Well 14 or the --
Q No.
A The Beatrice Well 14?
Q The Beatrice Well 14.
A Do you have a particular time period?
Q At the end of the pump test.
A The end of the pump test, yes.
The number for the water elevation that we

68-88
used was 41.24 feet, and that -- 41.24 feet.
Q Yes.
And what value did you use for CW-14?
A CW-14 is 41.21 feet.
Q And SW-14?
A 41.19.
Q And OW-14?
A 41.36.
Q Now, to calculate those numbers, you made use of the
water level monitoring data, is that right?
A That's correct.
Q Now, I'm going to show you an exhibit. If you would come
up here to the jury.
A Should I bring my water level?
Q Please.
A (Witness complies.)
Q Let me show you a diagram, and do you have the end of the
pump test diagram?
MR. KEATING: Yes.
Q Now, in formulating your end of the pump test results,
you used values for different water levels at different
wells, is that right?
A That's correct.
Q And you used them to show the effect on the aquifer
at the end of the pump test, the 38 pump test?

68-89
A That's correct.
Q 41.21 forW-14?
A That's correct.
Q That was taken from the deepest well from that Well 14
cluster?
A I believe so. I'll let you know. It was taken from the
CW-14.
Q CW-14?
A Yes.
Q Now, in figuring that out, you got to the -- you take the
monitoring data, the well monitoring data for that well and
you look at the level recorded on that morning just prior
the pumps being turned off, is that right?
A That's correct.
Q That would be a document like this?
A That's right.
Q In fact, that is the one for CW-14, is it not?
A Just wait one minute and I'll let you know.
Q All right.
A I have a series of sheets that represent measurements in
CW-14.
Q This is CW-14 in January at the end of the pump test.
There it is right there. Do we agree?
A Yes.
Q The same one.
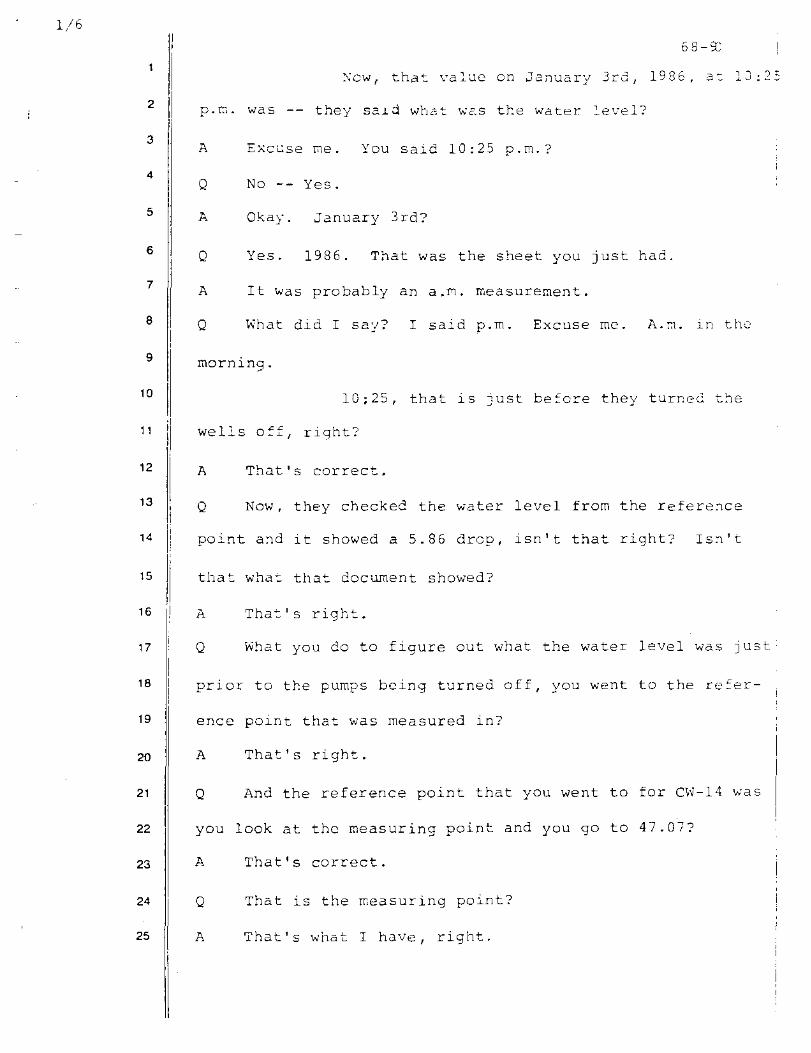
Now, that value on January 3rd, 1986, at 10:25
p.m. was -- they said what was the water level?
A Excuse me. You said 10:25 p.m.?
Q No -- Yes.
A Okay. January 3rd?
Q Yes. 1986. That was the sheet you just had.
A It was probably an a.m. measurement.
Q What did I say? I said p.m. Excuse me. A.m. in the
morning.
10:25, that is just before they turned the
wells off, right?
A That's correct,
Q Now, they checked the water level from the reference
point and it showed a 5.86 drop, isn't that right? Isn't
that what that document showed?
A That's right.
Q What you do to figure out what the water level was just
prior to the pumps being turned off, you went to the refer-
ence point that was measured in?
A That's right.
Q And the reference point that you went to for CW-14 was
you look at the measuring point and you go to 47.07?
A That's correct.
Q That is the measuring point?
A That's what I have, right.
68-91
Q When you take 47.07, which is the measuring point on
the well, and subtraot 5.86, you come to a value, is that
right?
A That's correct.
Q The value you come to is 41.21?
A That's correct.
Q Now, would you please write on this diagram here at Well
Cluster 14 where it says CW-14, would you put down the water
level for that point?
A You want it right on the side, or over the well, it
doesn't make any difference?
Q Right to the side.
A (Witness complies.)
Q DO you agree with that water level, you used that in
forming your opinions?
A That's correct.
Q Now, when you go to the next well above it, that
would be SW-14?
A Yes.
Q And you go to another sheet taken on that day, January
3rd, in the morning, approximately the same time, 10:24-
10:30?
A Yes.
Q And the value that you get when you do the subtraction
and everything is 41.19, is that correct?
68-92
A That's correct.
Q You write that down, 41.19?
A (Witness complies.)
QYou agree with that figure, you used that in forming
your opinion?
A Yes.
Q And the measuring point you used for the 41.19, for SW-14,
was 47.30?
A That's correot.
Q You used that in forming your opinion?
A Yes.
Q And then you go to OW-14?
A Yes.
Q And do you have the sheet of paper on that?
A Yes.
Q For January 3rd at 10:30?
A Yes.
Q And that value is 6.19, is that right?
A I have 6.18.
Q Well, doesn't this document say January 3rd, 10:30,
6.19?
A We may have used the 9:57. I don't know why we would
have. A hundredth of a foot.
Q 10:30 would be more accurate, wouldn't it?
A Yes, it would be the same time as the other ones.
68-93
Q You agree we should use that one to be the most accurate?
A You could use that one, yes.
THE COURT: We're talking about one hundredth
of a foot here?
MR. SCHLICHTMANN: Oh, yes.
THE COURT: Press on.
MR. SCHLICHTMANN: It won't make much difference,
but we will use 6.19.
Q The measuring point you used for that is 47.52?
A I have 47.54.
Q Well, isn't the surve y or who gave you the results
for the other ones, didn't he say 47.52?
A I'll let you know. He may have said 52 and I may have
put in 54.
Q It's understandable.
A Well, I can't find the elevation.
Q Isn't this the one right here? Do you recognize that?
A Yes.
Q Is that 47.52?
A That's correct.
Q The correct measuring point would be 47.52?
A Okay.
Q If we do 47.52 and subtract 6.19, we come to what value?
A 41.33.
Q Exactly. Why don't we put down 41.33 right there.

68-94
A (Witness complied.)
Q Now, those are values which you used and relied upon
forming your opinions?
A Yes.
Q Now , let's go to 13 and why don't you put down the values
that you used for Well 13, You have those right with you,
don't you?
A Yes.
68-95
Q For OW-13 you got 41.40?
A That's correct.
Q All right. Put that down.
And for SW-12, you got 41.20?
A That's correct.
Q And for CW-13, the deepest one, you got 41.24, am I
correct?
A That's correct.
Q Now, we go over to S-92, those are values that you used
in forming you opinions, you relied upon?
A Yes.
Q We go over to S-92. You used for the shallow well, top
well, is 42.48, am I right?
A That's correct.
Q Put that down.
And for the medium well you used 90.98. Is
that right?
A Yes.
Q And for the intermediate you used 41.01?
A Yes.
And the 92 deep, the measuring point that you used was
45.69,
A Sixty eight.
Q Well, doesn't the EPA for that well say that it was
45.69?

68-96
A I'll take your word for it right now.
Q Well, let me show it to you. S-92 deep, 45.69.
A That sheet says 45.69. We may have made a mistake
here, but I know we've gone through several revisions,
so -- I'm not yielding on it yet, but it is a hundred to
a foot---
Q You recognize that as an EPA sheet?
A Yes, I do.
Q And 45.69?
A Yes.
Q All right, you have 45.69. Now you want to subtract
from that the water level just before they turn the pumps
off. And what was the value used there?
A 40.90.
Q Yes. I'm sorry. The actual water level measurement.
A 4.78. Is that right. That is 92-D.
Q Really shouldn't it be 4.77. Isn't that what that --
rounding it off from---
MR. FACHER: I object, your Honor. "Really
shouldn't it be."
Q Well, I'm asking do you recognize this as the -- Do you
have the original shett there?
A I have our water level sheets.
(Pause.)
Q It is a little blurred here so it might be a differenoe
68-97
of opinion, but I think the last number before that was
4.769, if I'm not mistaken.
MR. KEATING: I can't hear you.
Q I think it says -- that is the computer printout --
it says 4.769. So I think they would probably round it off
to 4.77.
A This is S-92?
Q 5-92, the last day of the pump test, right before they
turned the pumps off.
A Which, the deep well?
Q That's right. Ninety-two deep.
A The last day of the test, we're talking about depth
of water, is that right?
Q Yes.
A I have 4.79 is what we used.
Q Well, we'll use your figure then. I think we have a
difference of opinion. Do you have the actual computer sheet?
A I have our summary of that.
Q You don't have the original one? It was a transduoer.
A Right. That is why I might not have it here.
Q All right.
A Wait a minute.
Q I don't think it is going to amount to any difference,
so why don't we use your figure.
A All right.

68-98
Q 40.90. Put that down.
Now, the values for S-93, the water level
values, are less than they are at 92, is that right?
A That's correct.
Q Do you have those with you. Can you just plug those
right in there, S-92.
THE COURT: This is again for the same time?
MR. SCHLICHTMANN: Yes. January 3rd in the
morning at 10:30.
Q Is that 40?
A 40.1, yes.
Q So the top well for 93, the shallow one is 40.1?
A That's correct.
Q And for the medium, it is 39.88. And for the deep one
it is 39.48?
A Yes.
Q And for G, what was that on the morning just before
they turned the pump off?
A 21.47.
Q Now, you did a cross section. That is shown in this
exhibit. And what you did is that you did a cross seotion
from Well G to 93 over to S-92?
A That's correct.
Q Now, in this, your exhibit here goes right to here; is
that right?
68-99
A That's correct.
Q Your exhibit stops here?
A That's correct.
Q Your exhibit didn't go to the next two wells, 14 and
13; is that right?
A It doesn't have 14 and 13 on it, yes.
Q It stops right here at 92?
A That's correct.
Q So this is a cross section done which includes also
not only the wells on this side of 92 but also on this side
of 92?
A This section here, yes.
Q This one right here?
A And Well 14, that is on the Beatrice property, yes.
Could I just look at a map, though, just to make sure we're
looking at the same line of section. I just want to make
sure where 13 and 14 are.
Q All right. Let me get you this one over here. It
seems to be gotten a lot of use out of in the trial.
Now, there's G-93, 92, 14, 13?
A Yes.
Q Is that right. That's along the cross section?
A That's on this section, yes.
Q And 14 is on the Beatrice property?
A Yes.
68-100
Q And 13 is on the Beatrice Property?
A Yes.
Q There's no question in your mind about that?
A No.
Q Now, Dr. Guswa, in drawing your arrows here, you applied
basic hydrologic principles known to your science?
A That's correct.
Q And the basio hydrological principle known to your
science is a really fundamental one in hydrology, which says
that if you have a plaoe of high hydrostatic head and you've
got a plaoe of low hydrostatic head, that the groundwater
is going to move from the high hydrostatic head to the low
hydrostatic head. Is that a fundamental principle in your
science?
A Yes.
Q And you applied it doing this diagram. Right. You
looked up here and you saw high hydrostratic head. Right.
It applies both horizontally and vertically?
A My point means hydrostatic means no flow at all.
Q Fine. We'll use high head. So if you go -- Here's
high head?
A Yes.
Q And here it is a little lower. So you know vertically
now it is going to go from high head to low head, vertically?
A That's correct.

68-101
Q And when you want to find out how it is going to go
horizontally you look over here and you see what it is here
and then you look over here and you see what it is here, and I
you note that here it is high and here it is low?
A Yes.
Q So you know it is going to go -- It is going to tend to
go from here over to here?
A Yes.
Q And when you look down all of the wells you notice that
all of them are higher than the other ones here. So you know
you're going to have flow from here over to here?
A We have a gradient, a flow component in that direction.
Q The gradient is moving from here to here. And of course
this is higher than it is here?
A That's correct.
Q And now that basic prinoiple of hydrology applies on
this side of Well 92 and it also applies on this side of
92 as well, doesn't it?
A That's correot.
Q And it applies to the Beatrice property no less than it
applies to anywhere else in the aquifer; is that right?
A That's correct.
Q Beatrice has no dispensation from the rules of
hydrologic practice?
A Not that I know of

68-102
Q Let's go over to the Beatrice side of the property and
let's look at Cluster 14. Now, when I look at the hydrostatic
head and in the medium I compare it to the medium well at
92. And I see that the head is higher than it is for 92-M;
am I right?
A That's correct.
Q And when I look at deep, I see that the head is higher
than it is down here?
A That's correct.
Q And you'll agree with me that that's an indication that
in the medium to deep layers of the aquifer, that the water
is going to tend to move from high head to low?
A That's correct.
Q Now, when I go over to Cluster 13 and I make a comparison,
I notice that the head at 13 is also higher than the head
at 14. Am I correct?
A Yes.
Q And so I know, applying the basic principle of my science,
that it is going to tend to move from 13 to 14. Am I right?
A Well, it will move -- It won't move directly to there
but actually move in that direction.
Q In that direction, around the area of 14.
Now, another principle known to your science
is that when you draw contours -- You draw contours to
determine flow, is that right?
68-103
A That's right.
Q And when you draw contours, another principle to your
science is that when you draw a flow line, an arrow to
determine flow, it is always at right angles to the contour
line. Am I right about that?
A Yes.
Q It is a basic principle?
A That's right.
Q Now, we have some contours on here. We have heads,
the head values. But between here, which is a 41 line --
Do you see that, the 41 line that goes down here? That 41
line is perpendicular to S-82. We don't have any contour
lines between here and over here. Do you see that?
A That's correct.
Q Now, if I wanted to put in a contour line between 41
and 41.5, if I wanted to run a line like this between
these two values, seeing the values that I have over here, am
I not correot -- please correot me if I'm wrong -- that if
you drew the contour line between these two points I'd have
to terminate somewhere around here?
A Which contour Line. 41---

68-104
Q Between 41 -- call it 41.1.
A 41.1?
Q Yes.
A Yes.
Q Would you draw that for the jury?
A (Witness complied.)
Q Now, Dr. Guswa, if I gave you the task of plotting the
flow lines on this diagram, knowing what you know about the
water level measurements and having the contours in front of
you, and with the basic prinoiple that an arrow flow should
be right angles to the contour, would you be able to put
those arrows on this diagram?
A I think so.
Q You could. All right. Could you draw the arrow between
the top of the surface and this contour line?
Now, let me give you another pen. We have a
red one. There you go.
A From the land surface to here? (Indicating).
Q Yes.
A (Witness complied.)
Q And if you want to draw an arrow of the flow between
here and here, (Indicating), how would you draw it?
A (Witness drawing.)
Q And if you wanted to draw it from here to here,
(Indicating), how would you draw it?
6E-105
A This one -- Well, these numbers are very small
differences --
Q Yes.
A -- but using these two numbers --
Q Yes.
A -- you have one going that way. (Witness drawing).
Q And how would you draw it here? (Indicating).
A (Witness drawing).
Q And how would you draw it over here? (Indicating).
A (Witness drawing).
Q And how would you draw it here? (Indicating).
A (Witness drawing).
And how would you draw it over here? (Indicating).
A (Witness drawing).
Q Now, Professor, I want to show you another diagram and
ask that you examine it. Haye you ever seen that before?
A This diagram?
Q Yeah, that one.
A No, I have never seen it.
Q Have you seen anything like it, bigger, more colorful?
A You mean a cross section?
Q Yes, something similar.
A The one behind it.
Q Did Mr. Facher or anybody from Beatrice Foods show you
a diagram that any of their experts did?

68-10E
A No, never did.
Q Never did. Let me ask you to help me, please. Could
you hold that for me, please?
A (Witness complied).
Q Could you unclip that?
A (Witness complied).
Q Just line up the dots.
A Put the clip on, too?
Q Yes.
Now, Dr. Guswa, do you agree with me, if you
could step to the side just so the jury could take a look,
would you agree with me if I told you that, in fact, the
diagram below was done by Mr. Koch for Beatrice Foods?
A Okay.
Q And this overlay right here was done by yourself?
MR. KEATING: I just didn't hear what you said
This overlay was done by whom?
MR. SCHLICHTMANN: Him.
MR. KEATING: Okay.
Q You and Mr. Koch seem to have a difference of opinion as
to how the well flows from 13 to 14 from Well 92 to G, am I
correct?
A Yes.
Q Take your time.
A Well, there are different direotions on the arrows.
6S-107
Q Yes, quite different, aren't they? Aren't they about
as different as you can get? I mean, there is no mistake
about it, your arrows are going strai ght over to G, and
Mr. Koch's arrows are going straight away, am I right?
A That's right.
Q Well, who do you think is right, you or Mr. Koch?
MR. KEATING: I object to that, your Honor.
THE COURT: Overruled.
A Well, I contoured these water level data. I don't know
what water level data Mr. Koch contoured.
MR. SCHLICHTMANN: Neither do I.
MR. FACHER: May that go out, your Honor?
THE COURT: Yes, that will go out. Just ques-
tions, Mr. Schlichtmann.
Q Mr. Guswa, just one thing. We have an overlay here
--Bill, could I have an overlay here?
Now, Dr. Guswa, if we go back to your diagram
at the end of the pump test, we have just gone through this
exercise with these flows from 13 over to 92. When you go
to your diagram back here, based on the work we just accom-
plished over there, tell the jury how the groundwater flows
from the Beatrice site at the end of the pump test based on
the work that we did just a few minutes ago; would you be
able to do that on this diagram?
A I would be able to show what this section shows, but
of wells, either
68-108
this section doesn't tell us what the groundwater flow is
doing on the Beatrice site at that time. This is a cross
section based on these six wells which happens to run this way.
Q Exactly.
A It doesn't oonsider any downgradient
I will draw it if you like.
Q Yes. Show us where 13 and 14 are, for the jury.
A Do you want me to mark them?
Q Yes.
A This is 13 and this is 14. (Indicating).
Q Based on the work that we did on the cross section,
would you show the jury the direction of flow, based on the
water level data? Indicate it with an arrow based on
the work you did with these wells.
A If you are asking me to do groundwater flow direction
from 13 --
MR. FACHER: Objection, your Honor.
A -- I cannot say that it goes to 14. If you are asking
me to translate this information to this sheet, with that
restriction, I'll draw it.
Q Yes, thank you.
A That is what you are asking me to do?
Q That is exactly what I'm asking you to do.
MR. FACHER: I object. That is not what he
asked.

68-109
THE COURT: Sustained.
Q Dr. Guswa, when we were over here, I asked you to make
a determination of how the groundwater flowed based on this
data from 13 over to 92, do you remember that?
A I did that.
Q That is what the data shows, is that right?
A That's correct.
Q Do you have any reason to doubt that these water levels
are inoorrect?
A No.
Q You used them in forming your opinions, didn't you?
A No reason to doubt that they are incorrect other than
dealing with the relative uncertainty I talked about earlier.
Q Yes, but you used those values, didn't you, informing
your opinions?
A That's oorreot.
Q You didn't come into the courtroom when you did this
and say, "Don't pay any attention to some of these yalues,
these are the ones I used in forming my opinion"?
THE COURT: Enough. Enough. Just questions
and no argument. Come on.
MR, SCHLICHTMANN: I won't argue.
Q Now, Dr. Guswa, you have the groundwater flow direction
arrow here, is that right?
A That's correct.

68-110
Q And you have a groundwater flow direction here, is that
right?
A That's right.
Q Now, based on cur work over here, and based on the fine
work you did on the aquifer here, do you think it is probable
that if we had to draw an arrow about where the groundwater
flowed in this area, right here in the middle, don't you
think that the probabilities are -- Let me ask you this.
If you had a choice between drawing a groundwater flow arrow
to the east --
A Yes.
Q -- and drawing a groundwater flow arrow to the west -- -
A Yes.
Q -- would you be able to make a choice between those two?
A Between those two, yes.
Q Would you draw the arrow to the east rather than to the
west?
A That's correct.
Q That would be based on the work you did over here as well
as your understanding of the aquifer?
A That's correct.
Q Would you please draw an arrow which is the probable
direction of the groundwater flow in this area in your
opinion?
MR. FACHER: Objection.
68-111
THE COURT: Wait a minute. No, I'll let him
answer, if he can.
A If you ask me to draw probable groundwater flow --
Q Yes,
A -- I would connect W-13 with W-10. I would not connect
W-13 with W-14. There is only three hundredths of a foot
difference which is over a hundred feet apart, and two tenths
of a differenoe between these two wells, which are the same
distance apart. So there is a lateral component of flow to the
east toward the river, but there is an even stronger --
these are minor gradients, but there is a stronger gradient
to the south. So if I were to draw -- -
Q
Yes, please.
A -- a groundwater flow direction here, I would draw an
arrow that locks like that. (Witness drawing).
You would not go to the west?
A I would not go to the west.
Q If you were up at W-11, what is the value at W-11?
A 41.43.
Q 41.43?
A Yes.
Q That is what you have down there, 41.93?
A Yes.
Q How would you draw the arrow from W-11; how would the
groundwater flow from W-11?
68-112
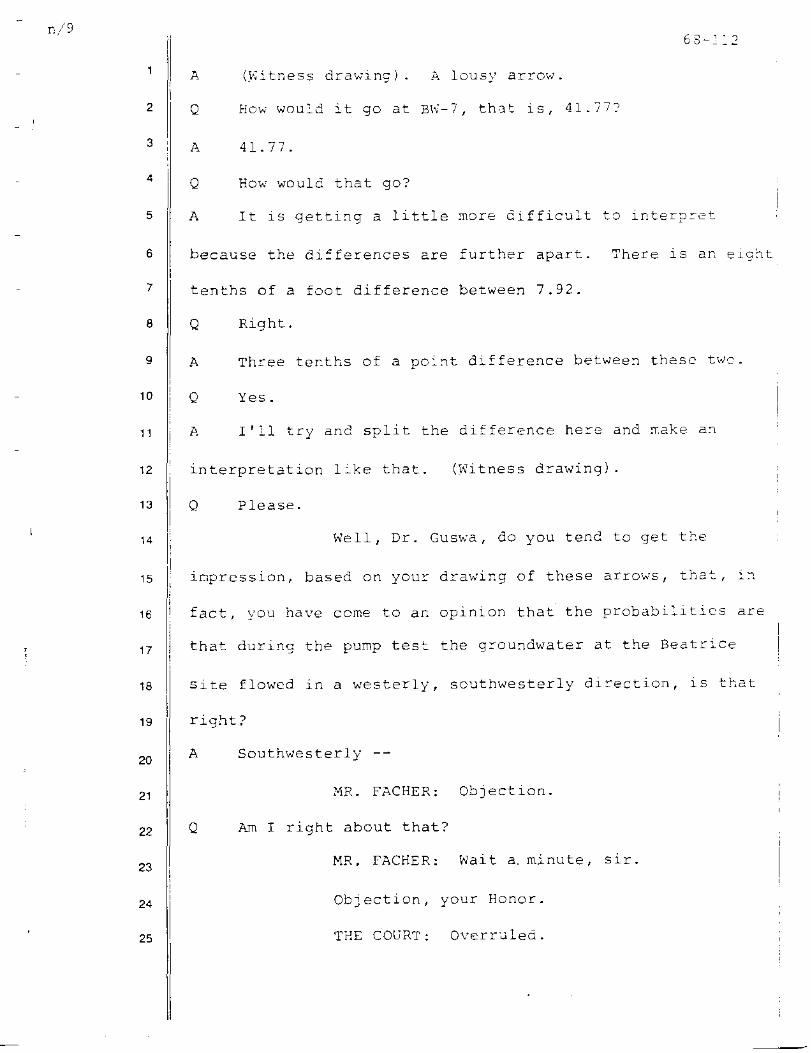
A (Witness drawing). A lousy arrow.
Q How would it go at BW-7, that is, 41.77?
A 41.77.
Q How would that go?
A It is getting a little more difficult to interpret
because the differences are further apart. There is an eight
tenths of a foot difference between 7.92.
Q Right.
A Three tenths of a point difference between these two.
Q Yes.
A I'll try and split the difference here and rake an
interpretation like that. (Witness drawing).
Q Please.
Well, Dr. Guswa, do you tend to get the
impression, based on your drawing of these arrows, that, in
fact, you have come to an opinion that the probabilities are
that during the pump test the groundwater at the Beatrice
site flowed in a westerly, southwesterly direction, is that
right?
A Southwesterly --
MR. FACHER: Objection.
Q Am I right about that?
MR. FACHER: Wait a minute, sir.
Objection, your Honor.
THE COURT: Overruled.

68-113
Q Am I right?
A From these three points, that's correct.
Q Well, you did that?
A That's right.
Q You have no reason to doubt what you did --
THE COURT: Are those three points adequate for
you to form an opinion, Doctor?
THE WITNESS: No, they are not.
Q You want more points?
A It is not a question of points.
Q How about 79?
A Here is the dilemma. S-80 is two tenths of a point
higher than S-79. S-79 is 400ths of a foot higher than BW-7.
If I were to interpolate those, I would have to draw, just
using those three, I would have to draw a flow to the north.
This is the problem I was talking about earlier`
There are uncertainties in these measurements that mask the
natural gradient.
Q How about S-76, 42.52?
A (Witness drawing).
Q And how about S-88, 41.37?
A (Witness drawing).
Q Let's see if we have any more wells left.

68-114
Q Now, how about if you had to make a choice here? If
you did a triangle between S-92, W-14 and S-95, how would
you draw the direction of the arrow?
A This one is highest, this one is lowest, this one is
higher, this one is higher, this one the lowest. 40.9
would fall --
Q It would go from the apex?
A I'm trying to scale off -- If I took a linear scaling,
the difference between these -- this is sort of how this
triangle stuff works. Take a 41.2 and 41.5 and 40.9 is approximate
here. We draw a line that conneots these points and draw an
arrow right next to that.
Q And did we do S-79? If you did S-79 and S-78 and S-92,
how would you draw the arrow?
A 79, 78, S-92?
Q Right.
(Pause.)
Q Can you draw a little bigger than that?
(Pause.)
Q Well, now, have we drawn enough arrows for you to form
and opinion yet?
A No.
Q Not enough arrows?
A No.
THE COURT; Well, that's about enough arrows
68-115
for today. It's five minutes past one. We'll start tomorrow
morning.
9:00 o'clock tomorrow morning, ladies and
gentlemen.
(Whereupon the jury left the courtroom.)
MR. KEATING: Your Honor, may we have a moment
before you leave just to raise one question concerning
scheduling matters?
MR. SCHLICHTMANN: Your Honor, can we have
these marked for the reoord? The first overlay is P-901,
and the second overlay is P-902. And P-901 goes on -- well,
it's all part of the same exhibit. P-902 is on Exhibit G-952.
THE COURT; Straighten that out any way you
want.
CONFERENCE AT THE SIDE BAR AS FOLLOWS:
MR. KEATING: Your Honor, just two matters,
one scheduling and one related.
I think we're still shooting to wind up cur
case before the break, before the 4th. I think that's quite
likely.
Now the reason I wanted to bring that to your
attention was that I have listed on my witness list, and I
think I listed it for at least a month now, an additional
witness that I retained as a result of the epiphany of Dr.
Pinder, one of his epiphanies. I think it might have been

68-116
second shower epiphany, where he finally began to discuss the
rolc of the river and the role of the aquifer and all of a
sudden it's first the molecules get the signals one way
and then it's the peat. Whatever it is. And you recall that
when I moved to strike his testimony, you had denied my
motion, and I had said to you at the time that since this was:
not an opinion that he had given at the time of the deposition
and therefore was not something that I was on notice of, that
I wanted to have the opportunity to introduce -- look over
witness list and if necessary introduce an expert to testify
on that particular issue.
THE COURT: Yes.
MR. KEATING: I have retained an expert.
It is David Todd, the man who does all these charts. He's
available to testify. I don't know if I'm going to use
him. I may or I may not use him. I don't think I would use
him until next week. But I have listed him on my witness
list. No one said anything about it. I recognize that if he
going to estify, Mr. Schlichtmann and/or Mr. Facher would
like an opportunity to have him deposed ahead of time. I
have no problem with that.
But before -- I just thought -- I didn't want
to all of a sudden waltz him into the courtroom, even though
I had listed him, and run the risk that it be objected to.
THE COURT: Do you want to depose him?

68-117
MR. SCHLICHTMANN: I objeot to having him
brought in as a witness. Two grounds. One, Mr. Keating
makes the statement that they didn't know Dr. Pinder's
attitude about the river when in fact he was asked specifically
at the deposition and he gave the opinion at the deposition
about his opinion as to how long it takes for the river water
to get to the wells. It was explored and dropped by counsel
at the deposition. They could have explored it in greater
detail. They chose not to.
There was no surprise about his feelings about,
the river. That's one.
And I can show the page reference in the
deposition.
Two, Dr. Guswa, a very fine hydrogeologist,
who has completel y examined this whole area, has given an
extensive opinion about his feelings about the river. He
was identified to me. I deposed him. Everybody was on fair
notioe about the fact that Dr. Guswa was going to give opinions
as well as Mr. Maslansky.
This is another witness. It is cumulative.
It's another hydrogeologist. There's nothing to be gained
except bringing in another hydrogeologist to outnumber the
hydrogeologists that came in for the plaintiff.
THE COURT: I thought he was a fellow who
made diagrams.
63-118
MR. KEATING: He does everything. Mr.
Schlichtmann is correct. He's a hydrogeologist. He writes
textbooks. He's a Professor at the University --
THE COURT: I don't suppose that they're limited
to numbers.
MR. SCHLICHTMANN: Well, only in the sense,
your Honor, that both sides were fully aware that they were
to obtain their experts, have them prepared and provide them
for both sides so they could be deposed.
Now, I think what is happening here is that a
very bad precedent is being established where plaintiffs
are stuck with all of their experts, as they should be, and
who are adequately and completely deposed about all their
opinions, and the defendants keep changing the players.
Their experts came in with no opinions when I deposed them.
But that's not good enough. They don't like the few things
they did give at the deposition so now they change it with a
new witness and ask me now to stop and to do --
THE COURT: Yes. Yours did that, too.
MR. SCHLICHTMANN: No, they did not, your
Honor. Not during the trial. That's just not true.
THE COURT: We had several depositions during
the trial.
MR. SCHLICHTMANN: They were because you were
trying to do some fundamental fairness to the plaintiffs.

68-119
And the plaintiffs were only asking -- he just wants to bring
in another hydrogeologist. Dr. Guswa has shown no incapability
of showing how the river works. What's to be gained?
THE COURT: Well, it seems to me there was
some notion of Dr. Pinder that he had a new thought.
MR. KEATING: His epiphany, he called it.
MR. SCHLICHTMANN: Mr. Handon was a geologist..
He was on the list. I deposed him.
THE COURT: That is totally irrelevant.
MR. SCHLICHTMANN: You're giving them a blank
check to bring in new experts, and you're asking me in the
midst of trial to depose them.
THE COURT: You had an expert who had new
thoughts.
MR. SCHLICHTMANN: That is not true.
THE COURT: I remember that.
MR. SCHLICHTMANN: Every expert that has appeared
for the defense has changed their opinion from the little
that they gave me from the depositions. Dr. Pinder and
Mr. Drobinski testified in this courtroom exactly as they
testified. The opinions they gave were the same opinions that
they gave in the deposition. They were fully aware of it.
Now this game that they're playing about new opinions is just
not true.
THE COURT: There was enough cross-examination

68-120
to set aside that notion.
MR. SCHLICHTMANN: Well, that is just not true,
your Honor.
THE COURT: There was plenty of contradictory
statements. He claimed they weren't contraditory because he
was trying to answer in the spirit of something or other.
MR. SCHLICHTMANN: Every witness has that
opportunity. Dr. Guswa is going to wiffle and waffle as all
experts do.
THE COURT: He hasn't yet.
MR. SCHLICHTMANN: He's just started. Maybe
he won't. The point is why should the defendants have a
blank check to bring in any expert they want, to haye me at
a disadvantage and hope in the turmoil of the trial I won't
have the chance to do the preparation?
THE COURT: What is Mr. Todd going to testify
to?
MR. KEATING: The impact of the river, the
impact of the river on the aquifer, to the role of the
souroes of water within the watershed of the area as to --
THE COURT: Anything different than what Guswa
said?
MR. KEATING: I think he would deal
particularly with the issue of dilution, your Honor, which I
don't think Dr. Guswa dealt with in any particular detail.
68-121
THE COURT: Yes, he did. He talked about it.
MR. KEATING: Two points. First of all, it
isn't a question of my holdin g baok. I speoifically mentioned
this when you denied the motion with regard to Pinder. That's
number one.
THE COURT: I remember that.
MR. KEATING: And I put it in the record.
Secondly, I have put his name down on witness
lists that I furnished to Mr. Schlichtmann as late as a
month ago and I continued to list him, and nobody has ever
said anything about it. So I thought I better bring that to
his attention explicitly or to all of our attention.
Thirdly, I'm not absolutely sure I'm going to
use him. I have him, I've retained him, he's prepared to I
testify on the subjects I've used. And I just want to make
sure they have an opportunity to examine him.
MR. SCHLICHTMANN: Dr. Todd, by the way, was
in the courtroom during Dr. Pinder's testimony.
MS. LYNCH: He was not.
MR. KEATING: That's false. He's never been
in this building. He's never been in the courthouse here at
all.
MR. SCHLICHTMANN: I'm sorry. I take it back.
MR. KEATING: No, I would never run the risk
of bringing him in if I was going to use him as a witness.
68-122
MR. SCHLICHTMANN: Talk about dilution, the
more hydrogeologists, you are going to dilute it. Their
opinions are going to be diluted.
MR. KEATING: That is my risk.
THE COURT: I can't say just because you decide
on one hydrologist, they are limited to one. I don't suppose
I need to rule on whether they can bring him in until they
decide to bring him in. The question is, do you want to
depose him?
MR. SCHLICHTMANN: If he is to testify, yes, I
want to depose him.
MR. KEATING: I'll work out a schedule with
Mr. Schlichtmann on that.
MR. SCHLICHTMANN: It is prejudicial for me to
depose their other expert.
THE COURT: That is what they said about your
expert.
MR. SCHLICHTMANN: They never had to depose
any of my experts because they gave an opinion which they
were not fully apprised of or not fully able to explore
during the trial; that is absolutely true for every single
expert.
THE COURT: Fine. I'm going to go to lunch.
See you later.
(Whereupon the 68th day of trial was concluded.)
68-6568-85
IN EVID.
68-51
68-123
INDEX
WITNESSES: DIRECT CROSS REDIRECT RECROSS
John Guswaby Mr. Beating 68-2
by Mr. Facherby Mr. Schlichtmann
NUMBER:
G-979
B-901
EXX H I B I T S
DESCRIPTION
Photograph
Diagram entitled "Water Table
Contours, Groundwater FlowDirections, Losing Stream"
68-82
Related Documents