Copyright 2000, Society of Petroleum Engineers Inc. This paper was prepared for presentation at the 2000 SPE Annual Technical Conference and Exhibition held in Dallas, Texas, 1–4 October 2000. This paper was selected for presentation by an SPE Program Committee following review of information contained in an abstract submitted by the author(s). Contents of the paper, as presented, have not been reviewed by the Society of Petroleum Engineers and are subject to correction by the author(s). The material, as presented, does not necessarily reflect any position of the Society of Petroleum Engineers, its officers, or members. Papers presented at SPE meetings are subject to publication review by Editorial Committees of the Society of Petroleum Engineers. Electronic reproduction, distribution, or storage of any part of this paper for commercial purposes without the written consent of the Society of Petroleum Engineers is prohibited. Permission to reproduce in print is restricted to an abstract of not more than 300 words; illustrations may not be copied. The abstract must contain conspicuous acknowledgment of where and by whom the paper was presented. Write Librarian, SPE, P.O. Box 833836, Richardson, TX 75083-3836, U.S.A., fax 01-972-952-9435. Abstract A new technique is developed for modeling 3D permeability distributions. The technique integrates all available data into a fluid flow simulation model. The integrated modeling process honors the essential aspects of the established reservoir descriptions as well as the geological facies model and engineering data. The added value of data integration of the fluid flow simulation is illustrated by the improved accuracy of the resulting well performance predictions and the decrease in time requirements for reservoir modeling history matching. The technique utilizes diverse data at different scales to condition reservoir models of facies, porosity, and permeability. Such data includes 3D seismic, well logs, core measurements, geologic facies distribution, flow meter logs, and pressure buildup tests. The model building process explicitly accounts for the difference in scale of the various measurements. The model calculates the porosity, facies, and permeability in the inter well volume using geostatistical techniques that are constrained by seismic impedance derived from the 3D seismic data. The use of engineering data in the permeability modeling constrains the results and decreases the history matching time requirements. A case study demonstrates the modeling technique. A reservoir model is developed for the Unayzah Formation in the Hawtah Field of Saudi Arabia. The Unayzah is a highly stratified clastic reservoir in a mixed fluvial and eolian depositional environment. Data integration provided more realistic reservoir model for this complex geologic setting than the conventional approach. Specifically, the integrated approach provide a reservoir model that captured the complex and highly stratified nature of the lithological units. Fluid flow simulation was carried out for both the new integrated reservoir model and the conventional reservoir model. Results show tremendous savings in history matching time and more accurate results for use in reservoir management production strategies when applying the new technique. Introduction At the present time there is an increasing demand for detailed geological numerical models which incorporate all available data into reservoir characterization studies for the purpose of fluid flow simulation. Conventional modeling techniques, which lack the ability to quantitatively integrate data, tend to produce homogenous results of reservoir properties in the inter-well regions. These models, when fed into reservoir simulations for performance predictions, may generate biased and unreliable results. This necessitates the development of an method that integrates all available data, despite differences in scale, improving the predictive power of the models and making it possible to obtain quicker production history matching from the reservoir simulation. One of the primary reasons for using geostatistics in the reservoir modeling process is data integration. That is, it allows the incorporation of diverse data of varying scale. This can include very descriptive data, such as conceptual geologic interpretations, or measurements such as 3D seismic time traces, their derivatives, and the resulting interpretations. Geostatistical tools can use data such as 3D seismic to directly or indirectly contribute to the modeling of the inter-well regions. This may provide significant risk reduction in reservoir development and management. This paper presents a geostatistical methodology that has been adopted for integrating geophysical, geological, and engineering data in reservoir modeling. The Hawtah Field, located in the central part of Saudi Arabia (Fig. 1), has been chosen to demonstrate the approach. Hawtah is a recently developed field with a wealth of modern geological, petrophysical, geophysical, and production data. Incorporating all of this information into the reservoir model exceeded the capability of conventional numerical models. Depositional facies maps representing geologic environments were generated using core-calibrated SPE 62902 Cross-Discipline Integration in Reservoir Modeling: The Impact on Fluid Flow Simulation and Reservoir Management Hisham M. Al Qassab, SPE, John Fitzmaurice, Zaki A. Al-Ali, SPE, Mohammed A. Al-Khalifa, G. A. Aktas, Saudi Aramco, and Paul W. Glover, U. of Aberdeen

Welcome message from author
This document is posted to help you gain knowledge. Please leave a comment to let me know what you think about it! Share it to your friends and learn new things together.
Transcript

Copyright 2000, Society of Petroleum Engineers Inc.
This paper was prepared for presentation at the 2000 SPE Annual Technical Conference andExhibition held in Dallas, Texas, 1–4 October 2000.
This paper was selected for presentation by an SPE Program Committee following review ofinformation contained in an abstract submitted by the author(s). Contents of the paper, aspresented, have not been reviewed by the Society of Petroleum Engineers and are subject tocorrection by the author(s). The material, as presented, does not necessarily reflect anyposition of the Society of Petroleum Engineers, its officers, or members. Papers presented atSPE meetings are subject to publication review by Editorial Committees of the Society ofPetroleum Engineers. Electronic reproduction, distribution, or storage of any part of this paperfor commercial purposes without the written consent of the Society of Petroleum Engineers isprohibited. Permission to reproduce in print is restricted to an abstract of not more than 300words; illustrations may not be copied. The abstract must contain conspicuousacknowledgment of where and by whom the paper was presented. Write Librarian, SPE, P.O.Box 833836, Richardson, TX 75083-3836, U.S.A., fax 01-972-952-9435.
AbstractA new technique is developed for modeling 3D permeabilitydistributions. The technique integrates all available data into afluid flow simulation model. The integrated modeling processhonors the essential aspects of the established reservoirdescriptions as well as the geological facies model andengineering data. The added value of data integration of thefluid flow simulation is illustrated by the improved accuracyof the resulting well performance predictions and the decreasein time requirements for reservoir modeling history matching.
The technique utilizes diverse data at different scales tocondition reservoir models of facies, porosity, andpermeability. Such data includes 3D seismic, well logs, coremeasurements, geologic facies distribution, flow meter logs,and pressure buildup tests. The model building processexplicitly accounts for the difference in scale of the variousmeasurements. The model calculates the porosity, facies, andpermeability in the inter well volume using geostatisticaltechniques that are constrained by seismic impedance derivedfrom the 3D seismic data. The use of engineering data in thepermeability modeling constrains the results and decreases thehistory matching time requirements.
A case study demonstrates the modeling technique. Areservoir model is developed for the Unayzah Formation in theHawtah Field of Saudi Arabia. The Unayzah is a highlystratified clastic reservoir in a mixed fluvial and eoliandepositional environment. Data integration provided morerealistic reservoir model for this complex geologic setting thanthe conventional approach. Specifically, the integratedapproach provide a reservoir model that captured the complex
and highly stratified nature of the lithological units. Fluid flowsimulation was carried out for both the new integratedreservoir model and the conventional reservoir model. Resultsshow tremendous savings in history matching time and moreaccurate results for use in reservoir management productionstrategies when applying the new technique.
IntroductionAt the present time there is an increasing demand for
detailed geological numerical models which incorporate allavailable data into reservoir characterization studies for thepurpose of fluid flow simulation. Conventional modelingtechniques, which lack the ability to quantitatively integratedata, tend to produce homogenous results of reservoirproperties in the inter-well regions. These models, when fedinto reservoir simulations for performance predictions, maygenerate biased and unreliable results. This necessitates thedevelopment of an method that integrates all available data,despite differences in scale, improving the predictive power ofthe models and making it possible to obtain quickerproduction history matching from the reservoir simulation.
One of the primary reasons for using geostatistics in thereservoir modeling process is data integration. That is, itallows the incorporation of diverse data of varying scale. Thiscan include very descriptive data, such as conceptual geologicinterpretations, or measurements such as 3D seismic timetraces, their derivatives, and the resulting interpretations.Geostatistical tools can use data such as 3D seismic to directlyor indirectly contribute to the modeling of the inter-wellregions. This may provide significant risk reduction inreservoir development and management.
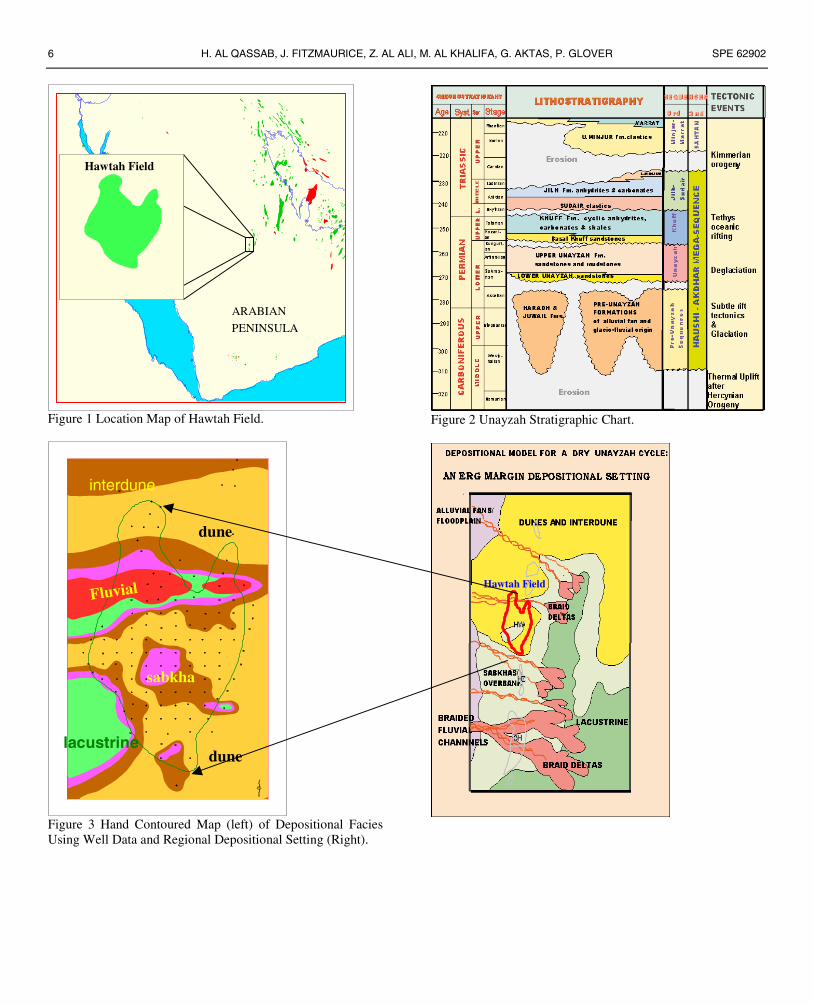
This paper presents a geostatistical methodology that hasbeen adopted for integrating geophysical, geological, andengineering data in reservoir modeling. The Hawtah Field,located in the central part of Saudi Arabia (Fig. 1), has beenchosen to demonstrate the approach. Hawtah is a recentlydeveloped field with a wealth of modern geological,petrophysical, geophysical, and production data. Incorporatingall of this information into the reservoir model exceeded thecapability of conventional numerical models.
Depositional facies maps representing geologicenvironments were generated using core-calibrated
SPE 62902
Cross-Discipline Integration in Reservoir Modeling: The Impact on Fluid FlowSimulation and Reservoir ManagementHisham M. Al Qassab, SPE, John Fitzmaurice, Zaki A. Al-Ali, SPE, Mohammed A. Al-Khalifa, G. A. Aktas, Saudi Aramco,and Paul W. Glover, U. of Aberdeen
2 H. AL QASSAB, J. FITZMAURICE, Z. AL ALI, M. AL KHALIFA, G. AKTAS, P. GLOVER SPE 62902
electrofacies from well logs. The facies model was generatedby geostatistical interpolation of the electrofacies logs usingSequential Indicator Simulation (SIS).
A stochastic seismic post-stack amplitude inversion wascarried out to produce a high-resolution (well log scale)acoustic impedance model. A porosity model was thengenerated using both the SIS facies model and the acousticimpedance model as soft data. Finally, a permeability modelwas constructed, which is conditioned to Kh from pressurebuildups allocated by flow meter profiles, core data, and theresulting porosity model.
Reservoir properties of this integrated model were theninput to the reservoir simulation and the history-match resultscompared with those of the conventional models. Histogramsof pressure match, CPU versus time steps, and error analysisplots are displayed for comparative analysis for flowpredictions using both models.
Stratigraphic and Reservoir Architecture of UnayzahReservoirs In Hawtah FieldThe Unayzah Reservoirs in the Hawtah Field are composedlargely of rocks of continental origin, organized in a highlycomplex fashion. Untangling the complex facies architectureof these reservoirs has required passing through severalevolutionary stages. Earlier conceptions advocated a complexpicture with a relatively random distribution of reservoir andnon-reservoir facies distributions. However, more recentdetailed stratigraphic and sedimentological studies suggestthat the rock architecture of the Unayzah reservoirs is in factmuch better organized than originally believed. Furthermore, asequence stratigraphic scheme can be applied in order toallow a better understanding of reservoir prediction andconnectivity for the most part of the reservoirs.
The Unayzah Reservoirs in the Hawtah Field can bedivided into three major units; the basal Lower Unayzah (B),the middle Upper Unayzah (A), and locally well-developedbasal Khuff clastics on top (Fig. 2).
The Lower Unayzah (B) and underlying pre-UnayzahSequences represent sedimentary successions filling astructural irregular topography (post orogenic early rift)following the Hercynian Orogeny. These sediments arecomposed of dry and wet alluvial fan and also associatedglacio-fluvial deposits.
The sediments of Unayzah-A signal a major shift indepositional and tectonic styles from the underlying Unayzah-B sandstones. The principal reservoir unit of the Unayzah Acan be divided into 5 major aggradational cycles which arelaterally correlatable and can be further subdivided into 13sequences. Individual cycles show upward-cleaningcharacteristics, most commonly starting with trangressivelacustrine and associated sabkha and interdune facies in thelower parts, followed by aeolian, and locally by ephemeralfluvial channel deposits in variable proportions. These cyclesrepresent overall upward-drying sequences developed inresponse to fluctuating climatic conditions probably causedby large scale cyclic orbital variations. Lake transgressions areattributed to the periods of deglaciation of gradually-
diminishing icecaps. Thickening of cycles along the flanks offield is attributed to ongoing subtle differential tectonicsubsidence.
The youngest reservoir unit, the Basal Khuff unit ischaracterized in the study area by localized lowstand incisedvalley fill sandstones which form locally prominent highquality reservoir bodies.
This brings the total number of stratigraphicsequences/zones to 15 zones which will be used for thepurpose of reservoir modeling.
Unayzah Depositional Facies Maps and ModelThe goal of building facies model in any reservoircharacterization study is to identify the spatial distribution ofrock types that control fluid flow behavior. However, onedifficulty in any study including this one is the availability andquality of core data that define rock or facies types. Therefore,we adopted a two-fold method. First, we identify facies typesand associations in terms of depositional environment fromcored wells so that geological characteristics can be explainedin details that are geologically sound. Once the facies wereidentified at cored wells, they were extended to non-coredwells which have well logs available. The output from thismethod was a foot-by-foot determination of depositionalenvironment facies types in each well in the Hawtah Field.Table 1 shows a description of each of the depositionalenvironment facies associations.
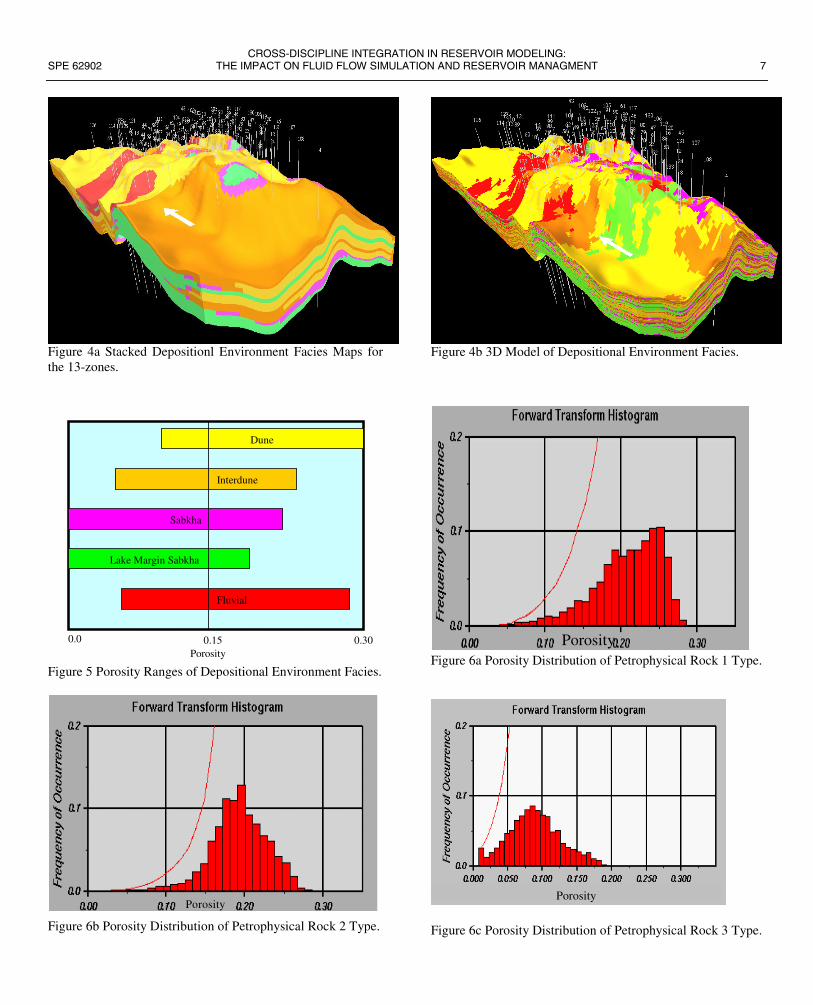
Facies maps were hand-drawn by the geologist for each ofthe 13 zones within Unayzah-A Reservoir. This wasaccomplished by simply assigning a facies type for each wellfor a given zone. This facies type represents the facies with thehighest proportion for a given zone. A facies value was thenplotted for every well location and directional data from borehole image logs in the form of a trend was placed next to thefacies type. This map was then hand contoured honoring thefacies type, directional indication from well image logs, andthe regional depositional characteristics of Unayzah Formation(Fig. 3).
These hand-drawn maps were then used to build a 3Denvironment of depositional facies model for the entirereservoir. This was done by treating each facies type from thehand-drawn facies maps as a region and then separatelydistributing facies available at wells within that region using acategorical geostatistical algorithm for facies namelySequential Indicator Simulation (SIS). Fig. 4 showscomparison between facies maps for a selected zone and theresulting 3D model.
Unayzah Petrophysical Rock ModelExamination of reservoir properties such as porosity andpermeability for the different depositional environment faciesindicated substantial overlap between them, as clearly seen inFig. 5. Therefore, it was concluded that depositionalenvironment facies can not be used alone to determinereservoir flow units for the purpose of this study. As a result,an in-house cluster analysis was used to establish

CROSS-DISCIPLINE INTEGRATION IN RESERVOIR MODELING:SPE 62902 THE IMPACT ON FLUID FLOW SIMULATION AND RESERVOIR MANAGMENT 3
petrophysical rock types for all the wells utilizing eightelectric log curves. These petrophysical rock types were thencross-referenced with the core data. The result showed threemain petrophysical rock types with a distinct reservoir qualityfor each one, namely; reservoir-rock (Rock 1), an intermediaterock type (Rock 2), and non-reservoir rock (Rock 3). Table 2shows detailed descriptions of each rock type. Furthermore,univariate statistics of porosity for each rock type show clearseparation between each class of porosity as indicated in thehistograms shown in Fig. 6.
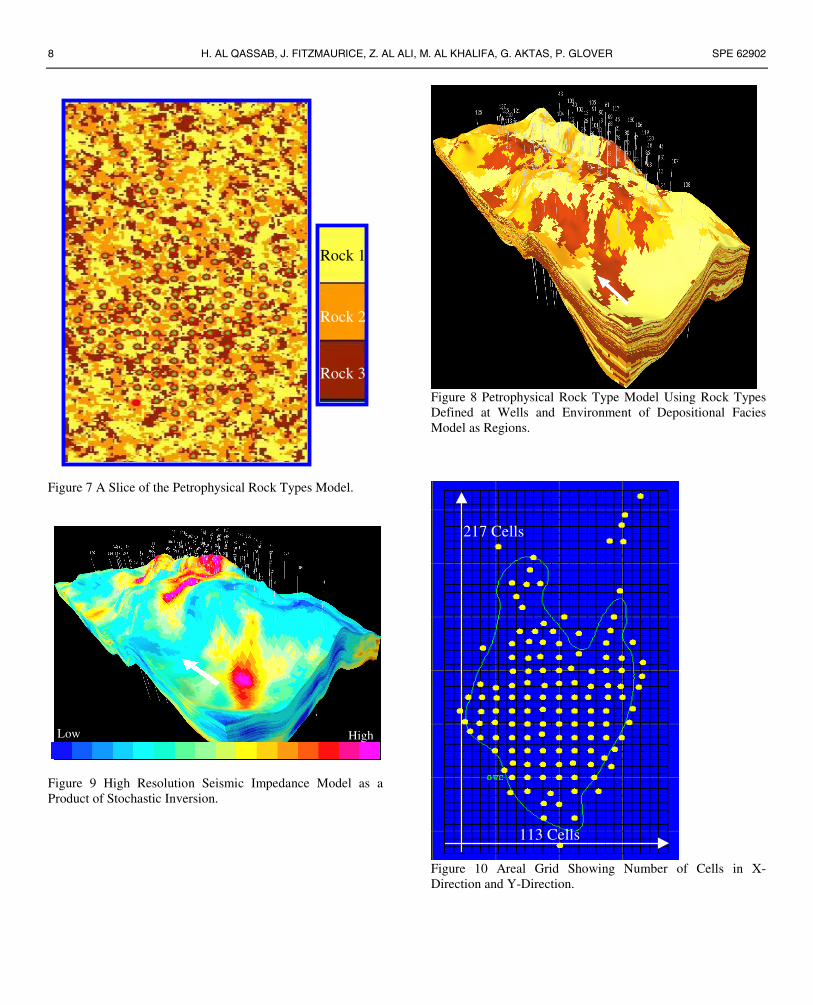
An attempt was made to build a 3D petrophysical rockmodel as defined at the wells but the resulting model (Fig. 7)has no geological character or meaning. Therefore it wasdecided to combine both the environment / depositional faciesmodel built earlier, that is fully supported by the geologistwith the petrophysical rock type model supported by thereservoir engineer, into a single integrated facies model. Thiswas accomplished by distributing the petrophysical rock typesdefined at the wells within each environment of depositionalfacies separately. Fig 8 shows the resulting 3D model ofpetrophysical rock type distributions utilizing depositionalenvironment facies model as regions.
Stochastic Seismic InversionA poststack amplitude inversion was performed on the 3DHawtah seismic volume for the purpose of incorporatingseismic impedance data into the 3D Hawtah model. That is,the available seismic data was transformed from wiggle traceinformation to acoustic impedance so as to be useful forinfluencing 3D reservoir descriptions. This transformation andintegration explicitly considered that seismic-basedinformation is an imperfect predictor of well impedance logs,and subsequently, an even less perfect predictor of facies.
Stochastic inversion has been employed in this study inplace of the conventional deterministic approach which givesabsolute impedance results with resolution dependent on theinherent seismic bandwidth. The stochastic inversion approachcapitalizes on stochastic simulations such as SequentialGaussian Simulation (sGs) including collocated cokriging togenerate multiple, equi probable realizations of impedancepseudo-logs at each seismic trace location, and then to selectthe closest one to the actual seismic trace. Moreover, thestochastic inversion approach honors the constraining wellimpedance logs along with their vertical resolution as well asthe specified univariate and bivariate statistics of impedanceby area and/or zone.
Elements of the inversion processing of the UnayzahReservoir included a simultaneous wavelet estimation andtime-depth analysis, zero-phase broadband reflectivityprocessing, 3D forward modeling of low-frequencyreflectivity balancing and impedance fields, deterministicinversion, and a high-frequency log-scale stochasticsimulation of impedance constrained by the deterministicinversion. The result is an impedance model at the same scaleof resolution as the well logs as shown on Fig 9.
A seismic horizon picked at top reservoir combined withtime to depth relationships determined from log to seismic tieswas used to convert the geologic model layering scheme toseismic micro-horizons within the reservoir, and to estimatethe seismic wavelet.
Time to Depth Conversion of AI (AcousticImpedance)Reservoir modeling is carried out in the depth domain, whichrequires the conversion of seismic acoustic impedance (AI)from the time to the depth domain. The conversion can bedone by simply snapping the impedance values between twomarkers, which are equivalent to the same depth markers, intoa pre-defined 3D grid. In the case of the Unayzah model, thegeological 3D reservoir grid model was defined in depthutilizing all the thirteen zones and an areal grid which coversthe field outline. The total number of vertical cells (layers) is133 with an areal grid of 162 in the x direction and 217 in they direction (Fig. 10), making the model size more than 3million cells in total. AI data between each of the 15 zones(which are available in time domain) were snapped to thecorresponding 15 zones in depth. This conversion from onedomain to another is considered as an implicit one, unlike theconventional velocity-based conversion. Fig. 11 shows aschematic diagram of how this was done.
Acoustic Impedance (AI) Porosity RelationshipWell data were thoroughly examined by means of univariateand bivariate analysis such as histograms and scattergramsrespectively to look for systematic relationship between wellAI and porosity. Fig 12 shows a cross plot of porosity and AIwhich indicated a large cloud of data with no strongrelationship between these two variables. However, there wasevidence of a strong AI and porosity relationship once the datawas segregated by petrophysical rock type as shown in Fig.13. This figure shows that the better the reservoir quality rock(Rock 1) the higher the correlation coefficient betweenporosity and AI. However, in the non-reservoir rock type(Rock 3), the relationship between the two variables is lost. Asa result, facies modeling plays a major role in determininghow much weight the seismic should have to influence theestimation of porosity in the inter well regions.
Porosity and Permeability ModelingA 3D Porosity model was built using the high resolutionimpedance model and utilizing the proper correlationcoefficient for each rock type as defined in the 3Dpetrophysical rock model built earlier. This was accomplishedthrough the use of sequential Gaussian simulation (sGs) ofporosity with collocated cokriging using acoustic impedance(AI) as soft data. Fig. 14 shows the resulting 3D model offacies specific porosity. The sequential Gaussian simulationwas chosen for its ability to generate models of porosity whichcapture the heterogeneity of the reservoir as well as its powerto generate multiple realizations of modeled porosity modelswhich can be ranked for use with fluid flow simulation tools,
4 H. AL QASSAB, J. FITZMAURICE, Z. AL ALI, M. AL KHALIFA, G. AKTAS, P. GLOVER SPE 62902
such as streamline simulation. In the case of the UnayzahReservoir, only one realization of porosity was selected forfluid flow simulation for practical reasons.
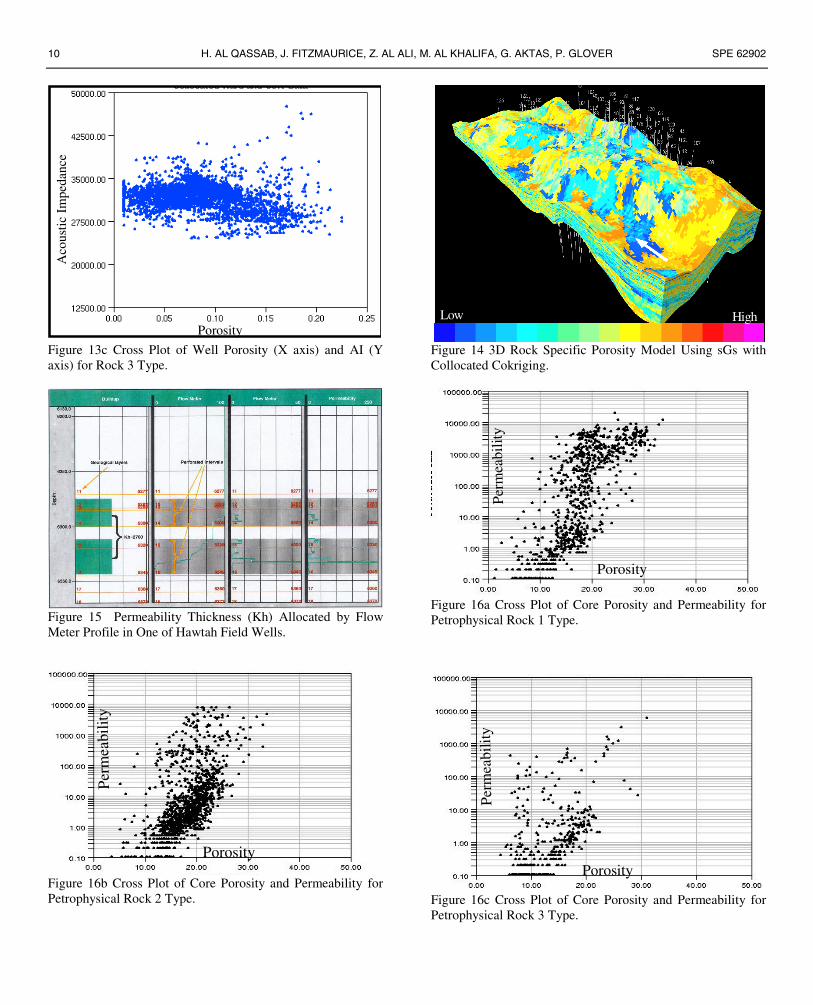
Permeability curves were constructed for each well in theHawtah Field honoring both the permeability thickness (Kh)from pressure buildups, flow meter profiles, and corepermeability data. The flow profile is used to allocate the totalor gross measurement of pressure buildup to a higherresolution permeability log. Fig 15 illustrates how flow meterdata is used in allocating permeability logs which has the samescale and resolution as the flow meter profile. The newlyproduced permeability log is then integrated with coreporosity and permeability data (Fig 16) for each facies toovercome the problem of missing data at non-perforatedintervals of the well. The integration is accomplished byassigning permeability values from cloud transforms of coreporosity and permeability as shown in Fig. 17. In non-perforated intervals, however, facies based cloud transformsare used to randomly sample possible permeability valuesfrom the core data for a given porosity class. A 3D correlatedprobability field was generated from the existing conditionedpermeability logs at each well location. The correlatedprobability field is then used to sample the cloud transformsfor each facies. For a given porosity value corresponding tothe existing facies-based porosity model it then assigns apermeability value. The result is a permeability model thatboth honors the engineering data at the well location(permeability from pressure buildup and flow meter) andretains core porosity and permeability character for eachfacies. Stratification of the Unayzah Reservoir is capturedbetter than using conventional techniques, as illustrated in Fig.18, where thin layers of high permeability are retained in themodel that would have otherwise been lost.
Conventional Porosity and Permeability ModelsTwo sets of porosity and permeability models wereconstructed using the interpolation methods of least squaresand inverse distance and a linear transformation of porosity topermeability. Porosity was distributed between the wellsusing inverse distance for the same 3D gridded integratedframework. Fig 19 shows the inverse distance porosity model.This figure shows a very homogeneous porosity distribution,achieved by the inverse distance interpolation using only thewell porosity data.
The permeability model was built by directly transformingthis porosity model. A regression line was fitted through thecloud of core porosity and permeability values by averagingthe distribution of permeability for a given porosity value.This linear relationship was then used to transform theporosity model. The resulting permeability model isunconstrained, with permeability model no actualpermeability’s at the well locations. Fig. 20 shows theresulting homogenous permeability distribution derived usingthis technique.
Fluid Flow PerformanceIn order to determine the level of accuracy between the twoapproaches and the advantage of data integration, fluid flowsimulations were run. Several criteria were set to determinethe level of accuracy, which included water breakthroughtime, CPU time required to history match, and fluid flowmovement pattern.
The simulation model was constructed using permeability,porosity, depth, cell thickness, and petrophysical rock types inthe case of integrated model. No upscaling was done on eitherset of models to eliminate any inherent errors associated withupscaling. Relative permeability curves as well as capillarypressure curves were built as rock type specific to produceidentified regions. Furthermore, the global porosity of the rocktypes were split into five bins for simulation modeling asshown on Fig. 21. Water injectors were placed at the down-dipends of the structure while oil producers were placed at thestructural high.
Water floods were modeled using a streamline simulatorand the porosity and permeability distributions obtained fromboth the conventional approach and the integrated approachdiscussed in this paper. Quick-look water flood simulationsprovided water breakthrough times, fluid front behavior, andwater cut comparisons. A detailed fluid flow simulation wasalso carried out using a finite difference simulation techniquefor both approaches to assess the required CPU time forhistory matching, and pressure and error analysis comparisons.
Results and DiscussionEach set of models when fed into fluid flow simulationproduced very different flow results in terms of breakthroughtimes and fluid movement patterns. In the case of theintegrated models, water had a preferred direction through thinzones of high permeability (Fig. 22) as captured by thestratification of the reservoir model which mimics the fielddata. By contrast, for the conventional approach the fluid frontmovement has no preferred direction throughout the model asshown on Fig. 23 because the conventional reservoir model ismore homogenous compared to the integrated model. Thecomputed water arrival time of the integrated model is a muchcloser match to the field data than that of conventional modelas shown in Fig. 24.
The fluid flow simulation results seem to indicate asignificant impact on level of accuracy in both historymatching time and well performance. Fig. 25 shows the erroranalysis for each time step for both the conventional and theintegrated model. The error at each time step for the integratedmodels are smaller and more stable than the errors from theconventional non-integrated model. Another advantage of theintegrated approach is clearly seen in the improvement ofsimulation speed for every time step as shown in Fig. 26, withas much as 17% saving of computational time withoutchanging the properties of the model. Other evidence ofimprovement when using the integrated approach is shown inFig. 27, which compares calculated pressure values versusobserved pressure. As shown in this figure, the calculatedpressures from the integrated model simulation match the
CROSS-DISCIPLINE INTEGRATION IN RESERVOIR MODELING:SPE 62902 THE IMPACT ON FLUID FLOW SIMULATION AND RESERVOIR MANAGMENT 5
observed pressure data well. Whereas the calculated pressuresfrom the conventional model simulation overestimates theobserved pressures by up to 25%.
ConclusionA new technique or scheme for integrating data of diversesource and different scales has been presented. The addedvalue of data integration has been demonstrated by thesignificant effect of the characteristics of the reservoir modelsgenerated. The integration of geological depositional faciesdata produced profound effects on the spatial distribution ofpetrophysical rock types between wells. Moreover, theincorporation of seismic acoustic impedance data providedadditional information allowing the heterogeneity and small-scale variations in the inter-well regions to be captured in themodel. The integrated method provided more realistic andmeaningful models for the complex heterogeneity of theUnayzah Reservoir as compared to the homogenous resultsproduced by the non-integrated conventional approach.Moreover, the effect of predictions of fluid-flow behavior wassignificant when using the integrated approach. Fluid flowmovement patterns, breakthrough time, major reduction ofCPU time and the pressure match with observed data are onlyfew examples of the many advantages of the integratedapproach described in this paper.
AcknowledgmentsAuthors would like to extend their thanks to Ministry ofPetroleum and Minerals and Saudi Aramco for the permissionto publish this paper. We also would like to thank themanagement of Saudi Aramco and University of Aberdeen fortheir support. We wish to thank the following colleagues atSaudi Aramco: Hassan AlKhaf, Maher Al-Marhoon, andKhalid Mashoug for their valuable contributions.
Reference1. AlAli,Z, and Alqassab,H., 2000, Optimizing Simulation Models
by Upscaling from Integrated Reservoir Models; A CaseHistory. SPE 59448.
2. Alqassab, H., 1999, Constraining Permeability Field toEngineering Data: An Innovative Approach in ReservoirCharacterization. Saudi Aramco Journal of Technology.
3. Alqassab, H., Heine,C., 1998, A Geostatistical Approach toAttribute Interpolation Using Facies Templates, An AdvancedTechnique in Reservoir Characterization. SPE 49449.
4. Araktingi, U., Bashore, W., 1992, Effects of Properties in SeismicData on Reservoir Characterization and Consequent Fluid Flow-Predictions When Integrated With Well Logs. SPE 24753.
5. Araktingi, U., Bashore, W., Hewett, T., and Tran, T., 1990,Integration of Seismic and Well Log Data in ReservoirModeling,. Presented at the Third Annual NIPER Conference onReservoir Characterization, Tulsa, Oct. 5-7,1990.
6. Jones, D., AlAli,Z., AlKhalifa,M., Aktas, G., 1999, Developmentof a Conceptual Model for The Study Field, Saudi Arabia. AnInternal Report.
Tables
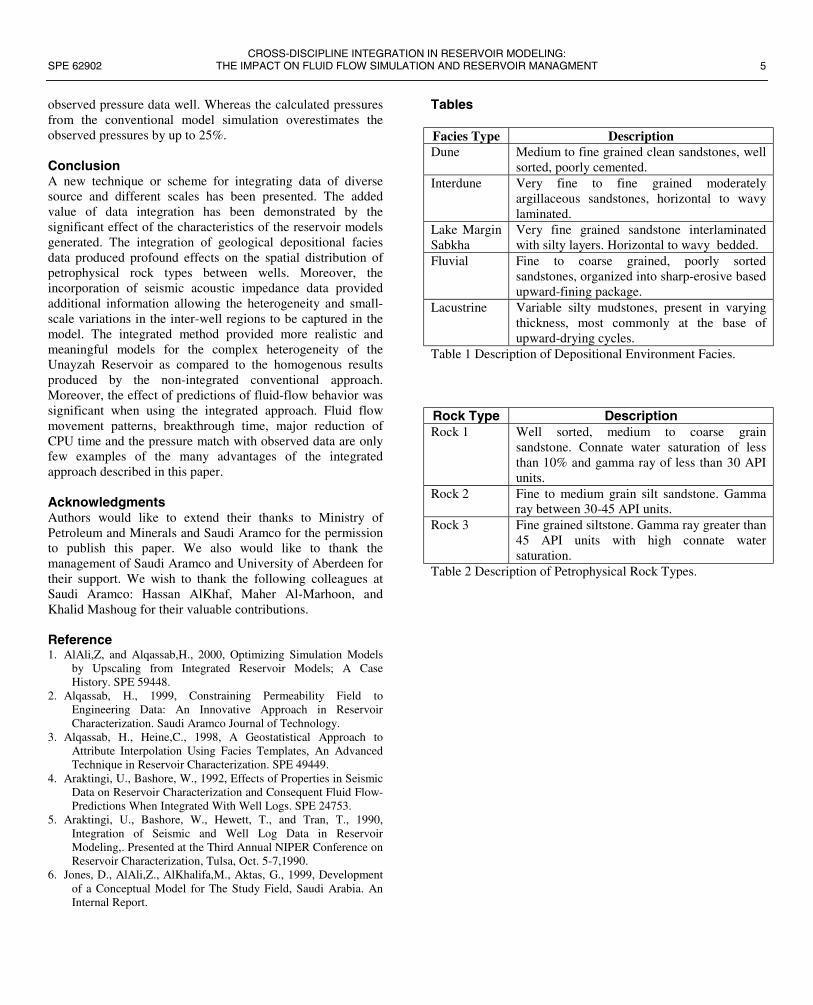
Facies Type DescriptionDune Medium to fine grained clean sandstones, well
sorted, poorly cemented.Interdune Very fine to fine grained moderately
argillaceous sandstones, horizontal to wavylaminated.
Lake MarginSabkha
Very fine grained sandstone interlaminatedwith silty layers. Horizontal to wavy bedded.
Fluvial Fine to coarse grained, poorly sortedsandstones, organized into sharp-erosive basedupward-fining package.
Lacustrine Variable silty mudstones, present in varyingthickness, most commonly at the base ofupward-drying cycles.
Table 1 Description of Depositional Environment Facies.
Rock Type DescriptionRock 1 Well sorted, medium to coarse grain
sandstone. Connate water saturation of lessthan 10% and gamma ray of less than 30 APIunits.
Rock 2 Fine to medium grain silt sandstone. Gammaray between 30-45 API units.
Rock 3 Fine grained siltstone. Gamma ray greater than45 API units with high connate watersaturation.
Table 2 Description of Petrophysical Rock Types.
6 H. AL QASSAB, J. FITZMAURICE, Z. AL ALI, M. AL KHALIFA, G. AKTAS, P. GLOVER SPE 62902
ARABIAN
PENINSULA
Hawtah Field
Figure 1 Location Map of Hawtah Field.
dune
dune
interdune
lacustrine
sabkha
Fluvial
Figure 3 Hand Contoured Map (left) of Depositional FaciesUsing Well Data and Regional Depositional Setting (Right).
Figure 2 Unayzah Stratigraphic Chart.
Hawtah Field
CROSS-DISCIPLINE INTEGRATION IN RESERVOIR MODELING:SPE 62902 THE IMPACT ON FLUID FLOW SIMULATION AND RESERVOIR MANAGMENT 7
Figure 4a Stacked Depositionl Environment Facies Maps forthe 13-zones.
0.0 0.15 0.30
Dune
Interdune
Sabkha
Lake Margin Sabkha
Fluvial
Porosity
Figure 5 Porosity Ranges of Depositional Environment Facies.
Porosity
Figure 6b Porosity Distribution of Petrophysical Rock 2 Type.
Figure 4b 3D Model of Depositional Environment Facies.
PorosityFigure 6a Porosity Distribution of Petrophysical Rock 1 Type.
Porosity
Figure 6c Porosity Distribution of Petrophysical Rock 3 Type.
8 H. AL QASSAB, J. FITZMAURICE, Z. AL ALI, M. AL KHALIFA, G. AKTAS, P. GLOVER SPE 62902
Rock 1
Rock 2
Rock 3
Figure 7 A Slice of the Petrophysical Rock Types Model.
Low High
Figure 9 High Resolution Seismic Impedance Model as aProduct of Stochastic Inversion.
Figure 8 Petrophysical Rock Type Model Using Rock TypesDefined at Wells and Environment of Depositional FaciesModel as Regions.
113 Cells
217 Cells
Figure 10 Areal Grid Showing Number of Cells in X-Direction and Y-Direction.

CROSS-DISCIPLINE INTEGRATION IN RESERVOIR MODELING:SPE 62902 THE IMPACT ON FLUID FLOW SIMULATION AND RESERVOIR MANAGMENT 9
25 Cells
25 Cells
Time Domain
Depth Domain
Figure 11 Schematic Diagram Showing Time (Top) to Depth(Bottom) Conversion. The 25 Cells are Snapped Between TwoEquivalent Markers.
Porosity
Aco
usti
c Im
peda
nce
Figure 13a Cross Plot of Well Porosity (X axis) and AI (Yaxis) for Rock 1 Type.
Porosity
Aco
ustic
Im
peda
nce
Figure 12 Cross Plot of Well Porosity (X axis) and AI (Y axis)for the Entire Reservoir.
Porosity
Aco
usti
c Im
peda
nce
Figure 13b Cross Plot of Well Porosity (X axis) and AI (Yaxis) for Rock 2 Type.
10 H. AL QASSAB, J. FITZMAURICE, Z. AL ALI, M. AL KHALIFA, G. AKTAS, P. GLOVER SPE 62902
Porosity
Aco
usti
c Im
peda
nce
Figure 13c Cross Plot of Well Porosity (X axis) and AI (Yaxis) for Rock 3 Type.
Figure 15 Permeability Thickness (Kh) Allocated by FlowMeter Profile in One of Hawtah Field Wells.
Porosity
Perm
eabi
lity
Figure 16b Cross Plot of Core Porosity and Permeability forPetrophysical Rock 2 Type.
Low High
Figure 14 3D Rock Specific Porosity Model Using sGs withCollocated Cokriging.
Porosity
Perm
eabi
lity
Figure 16a Cross Plot of Core Porosity and Permeability forPetrophysical Rock 1 Type.
Porosity
Perm
eabi
lity
Figure 16c Cross Plot of Core Porosity and Permeability forPetrophysical Rock 3 Type.

CROSS-DISCIPLINE INTEGRATION IN RESERVOIR MODELING:SPE 62902 THE IMPACT ON FLUID FLOW SIMULATION AND RESERVOIR MANAGMENT 11
Figure 17 Integrating Buildup Permeability As SelectingCriteria in Sampling a Range of Permeability Values fromCore Data.
Low High
Figure 19 Porosity Model Using Inverse Distance Approach.
Figure 21An Example of Relative Permeability Curves forRock 1 Type with Five Porosity Bins.
Low High
Cross-Section
Figure 18: 3D Permeability Model Using Core, Engineering,and Seismically Constrained Rock Specific Porosity Model.
Low
High
Figure 20 Permeability Model Using Linear Transformation ofPorosity to Permeability.
Water Breakthrough TimeMin Max
Figure 22 A Cross–Section of Integrated Model ShowingWater Breakthrough Time. Note the Stratification (Right) ofthe Reservoir.

12 H. AL QASSAB, J. FITZMAURICE, Z. AL ALI, M. AL KHALIFA, G. AKTAS, P. GLOVER SPE 62902
Water Breakthrough TimeHigh
Min Max
Water Breakthrough Time
Figure 23 A Cross–Section of Conventional Model ShowingWater Breakthrough Time. Note the Uniform Fluid Front(Right) of the Reservoir.
Calculated
Field
Well X Production Profile
Figure 24b Water Cut of Conventional Model. Note the WaterArrival Time as Compared to Field Date.
0
1 00 0
2 00 0
3 00 0
4 00 0
5 00 0
6 00 0
7 00 0
8 00 0
9 00 0
1 4 7
10
13
16
19
22
25
28
TIM E STEP
CP
U S
EC
ON
DS
INT EG R AT ED
CO NVENT IO NAL
Figure 26 Comparison of the Two Approaches in Terms ofCPU Time.
Calculated
Field
Well X Production Profile
Figure 24a Water Cut of Integrated Model. Note the Waterarrival Time as Compared to Field Date.
- 1 . 0 0 E - 0 7
- 5 . 0 0 E - 0 8
0 . 0 0 E + 0 0
5 . 0 0 E - 0 8
1 . 0 0 E - 0 7
1 . 5 0 E - 0 7
2 . 0 0 E - 0 7
2 . 5 0 E - 0 7
1 4 7
10
13
16
19
22
25
T I M E S T E P
ER
RO
IN T E G R A T E D
C O N V E N T IO N A L
Figure 25 Error Plot Analysis for Each Time Step for BothApproaches.
1500
1700
1900
2100
2300
2500
2700
2900
1994 1995 1996 1997 1998 1999Time
Pre
ssu
re
CONVENTIONAL
INTEGRATED
ACTUAL
Figure 27 Pressure Match Comparison Between Both Typesof Approaches.
Related Documents

![mmc2.geofisica.unam.mxmmc2.geofisica.unam.mx/cursos///geoest/Articulos... · "! #$ % & $ #$ ' (#)+*-, .0/ 132547698:;*=. @ ACB DFEHGJI0KLMDHNOGPB QSRUT=VOWXT>Y[Z\VOT=VOWXZ\VOW^]](https://static.cupdf.com/doc/110x72/5ec47295ab215e6b212578b4/mmc2-0-132547698-acb-dfehgji0klmdhnogpb.jpg)