1 CROSS-DISCIPLINE DATA INTEGRATION IN RESERVOIR MODELLING: OPTIMIZING FLUID FLOW SIMULATION AND RESERVOIR MANAGEMENT Hesham Al Qassab, J.C. Fitzmaurice, Z. Al Ali, M. Al Khalifa & P.W.J. Glover University of Aberdeen & Saudi Aramco

Welcome message from author
This document is posted to help you gain knowledge. Please leave a comment to let me know what you think about it! Share it to your friends and learn new things together.
Transcript
1
CROSS-DISCIPLINE DATA INTEGRATION IN RESERVOIR MODELLING:
OPTIMIZING FLUID FLOW SIMULATION AND RESERVOIR MANAGEMENT
Hesham Al Qassab, J.C. Fitzmaurice, Z. Al Ali, M. Al Khalifa & P.W.J. Glover
University of Aberdeen & Saudi Aramco
2
Structure
Minimising Impact of Hydrocarbon ExtractionData Integration TechniquesImproved Reservoir ModellingApplication the Unayzah FormationSummary
3
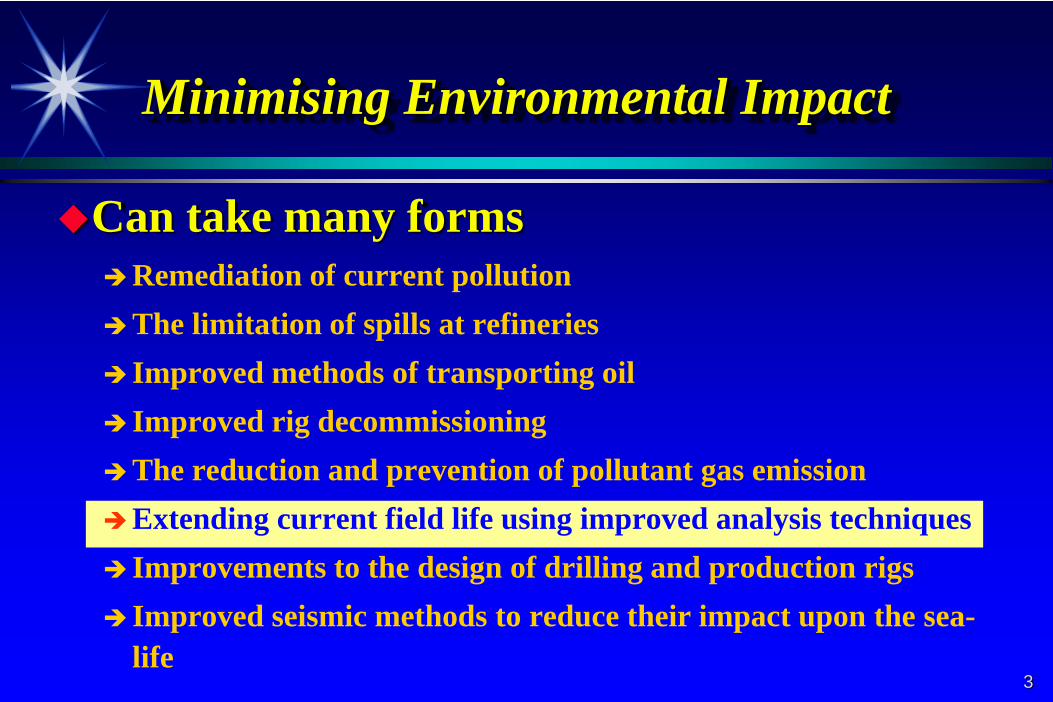
Minimising Environmental Impact
Can take many formsRemediation of current pollutionThe limitation of spills at refineriesImproved methods of transporting oilImproved rig decommissioningThe reduction and prevention of pollutant gas emissionExtending current field life using improved analysis techniquesImprovements to the design of drilling and production rigsImproved seismic methods to reduce their impact upon the sea-life

4Onshore Oil Reservoir in Saudi Arabia
Start: The Test Field
5
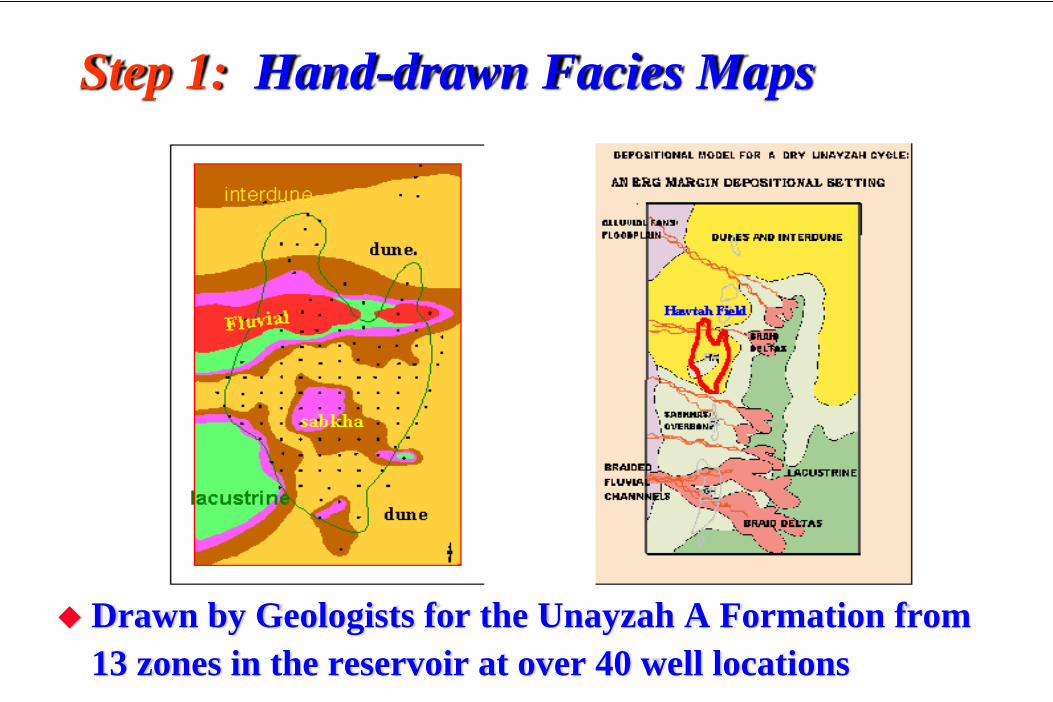
Drawn by Geologists for the Unayzah A Formation from 13 zones in the reservoir at over 40 well locations
Step 1: Hand-drawn Facies Maps
6
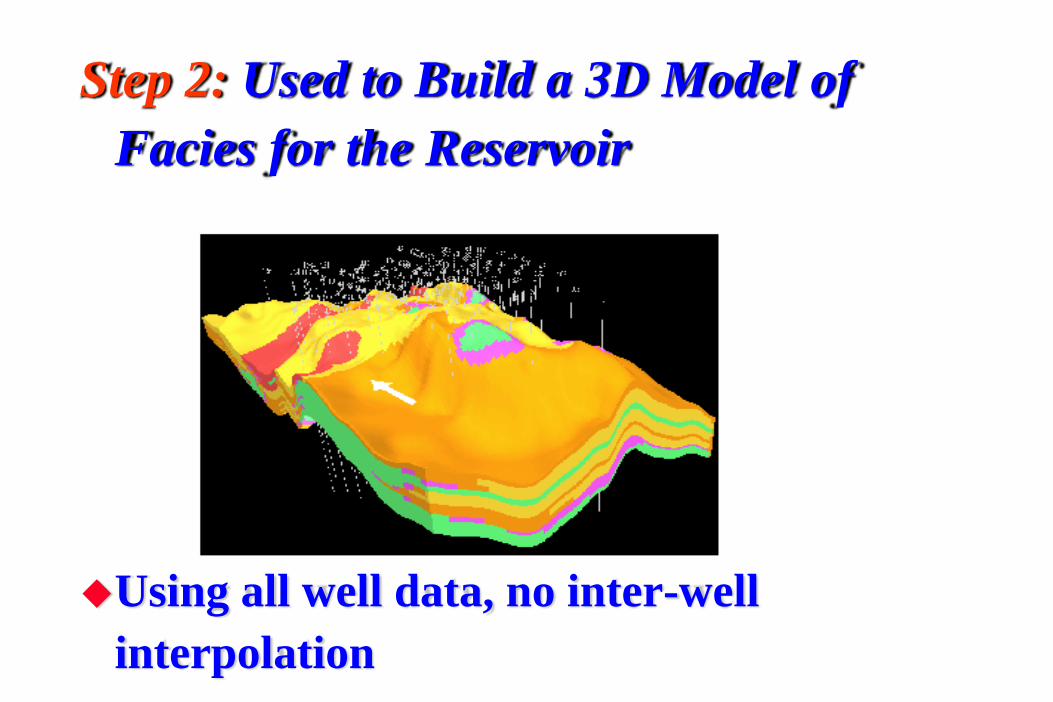
Using all well data, no inter-well interpolation
Step 2: Used to Build a 3D Model of Facies for the Reservoir
7
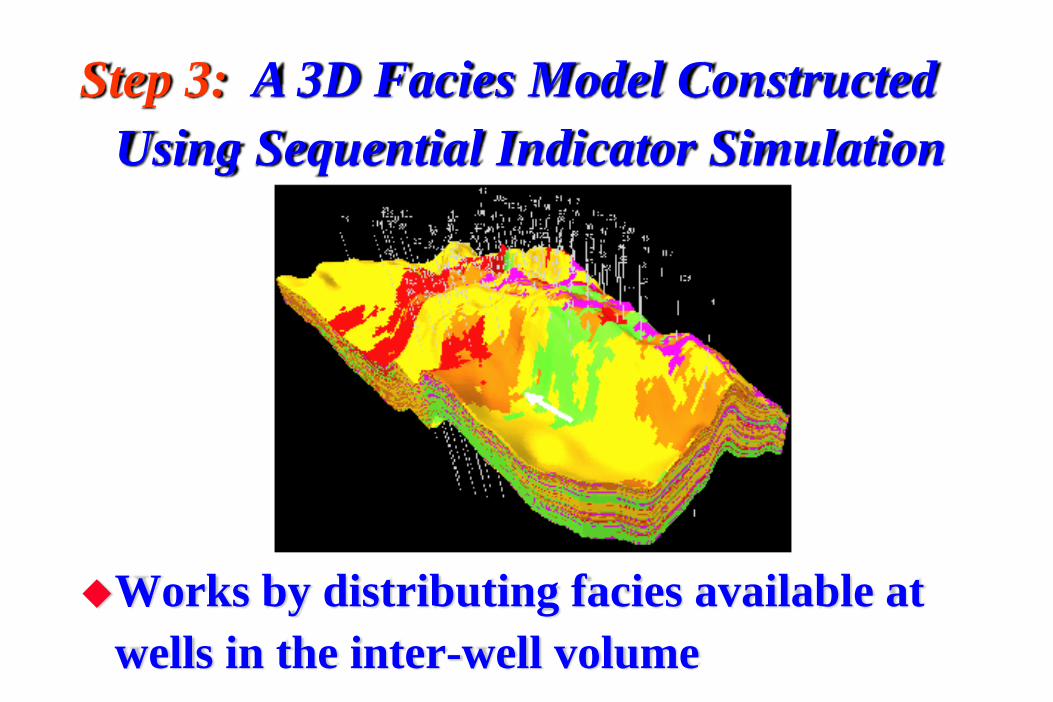
Works by distributing facies available at wells in the inter-well volume
Step 3: A 3D Facies Model Constructed Using Sequential Indicator Simulation
8
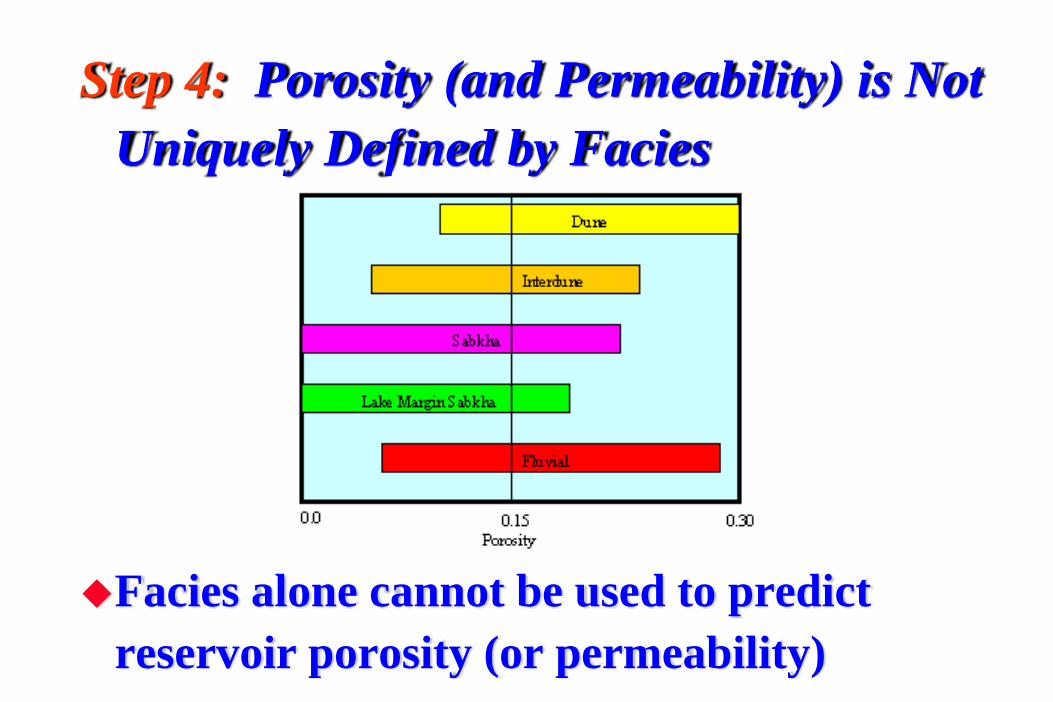
Facies alone cannot be used to predict reservoir porosity (or permeability)
Step 4: Porosity (and Permeability) is Not Uniquely Defined by Facies
9
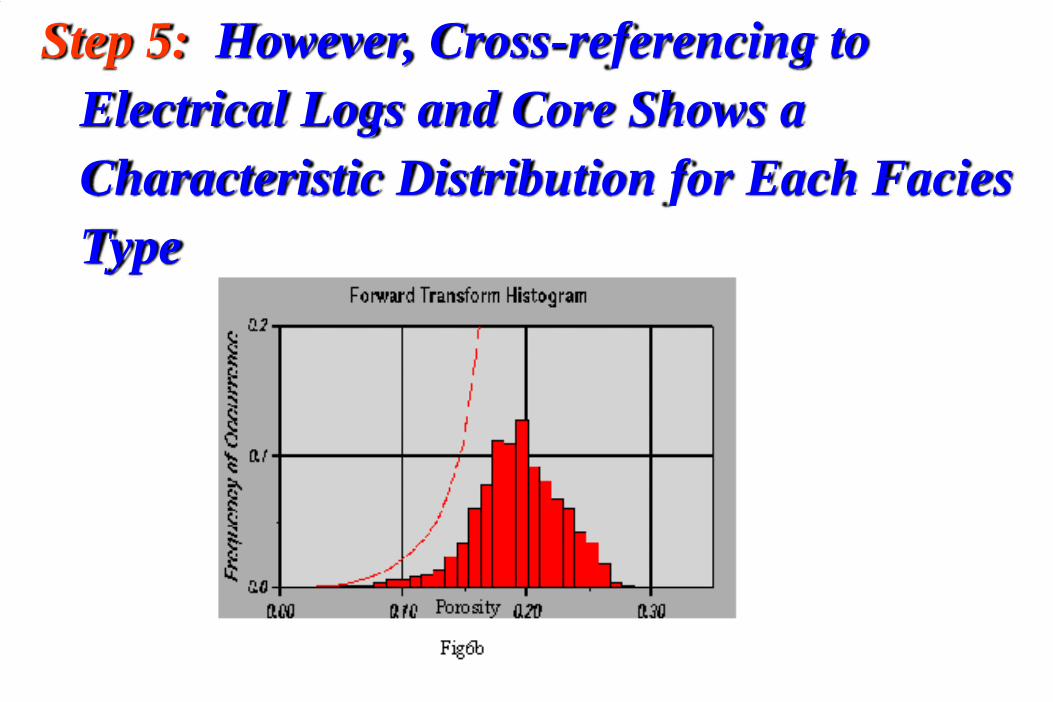
Step 5: However, Cross-referencing to Electrical Logs and Core Shows a Characteristic Distribution for Each Facies Type
10
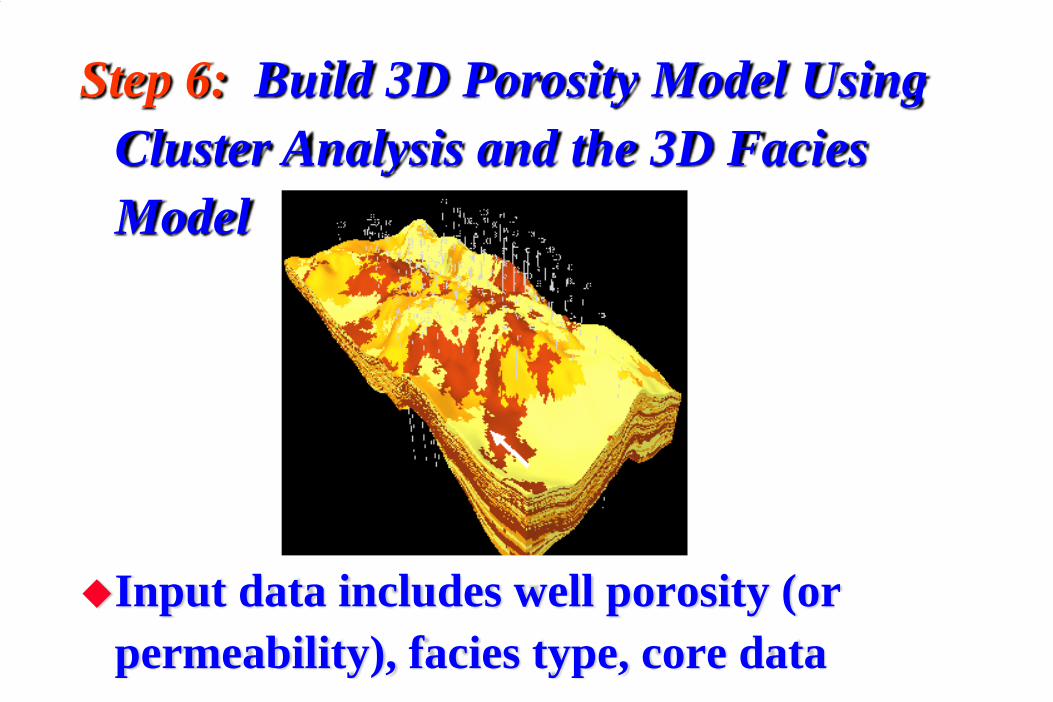
Input data includes well porosity (or permeability), facies type, core data
Step 6: Build 3D Porosity Model Using Cluster Analysis and the 3D Facies Model
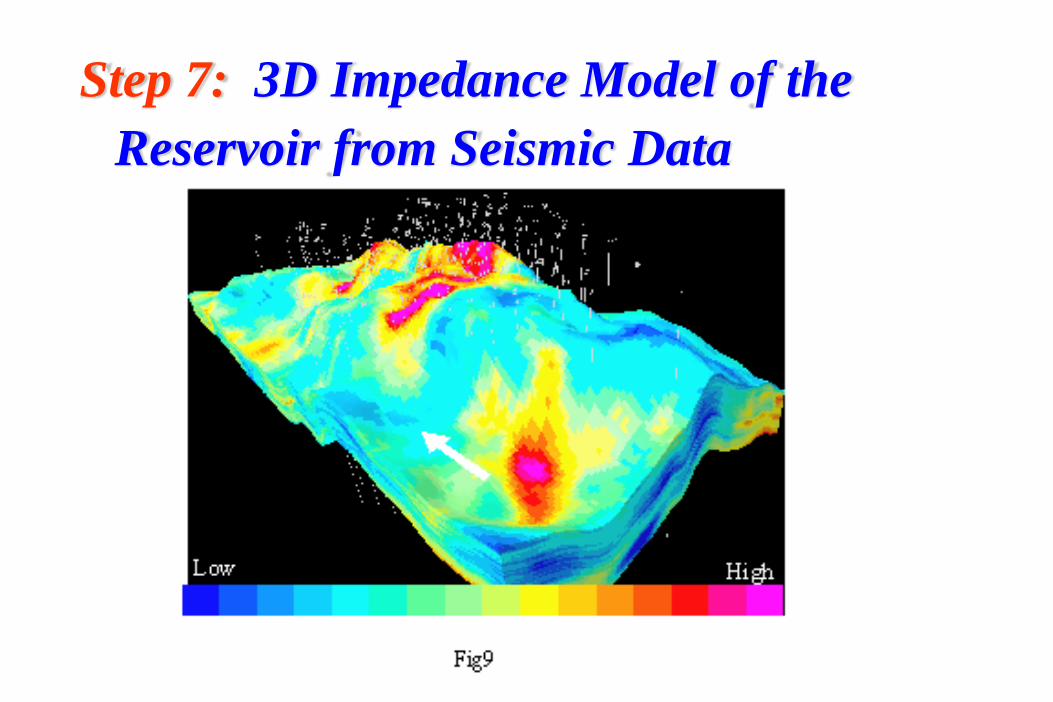
Step 7: 3D Impedance Model of the Reservoir from Seismic Data
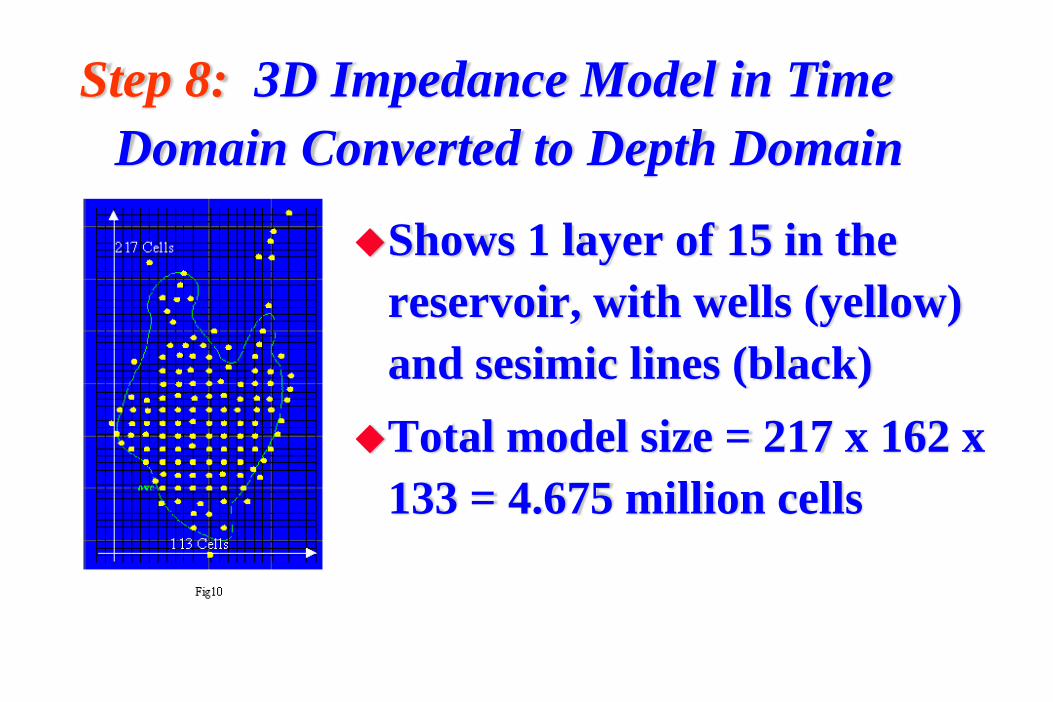
Shows 1 layer of 15 in the reservoir, with wells (yellow) and sesimic lines (black)Total model size = 217 x 162 x 133 = 4.675 million cells
Step 8: 3D Impedance Model in Time Domain Converted to Depth Domain
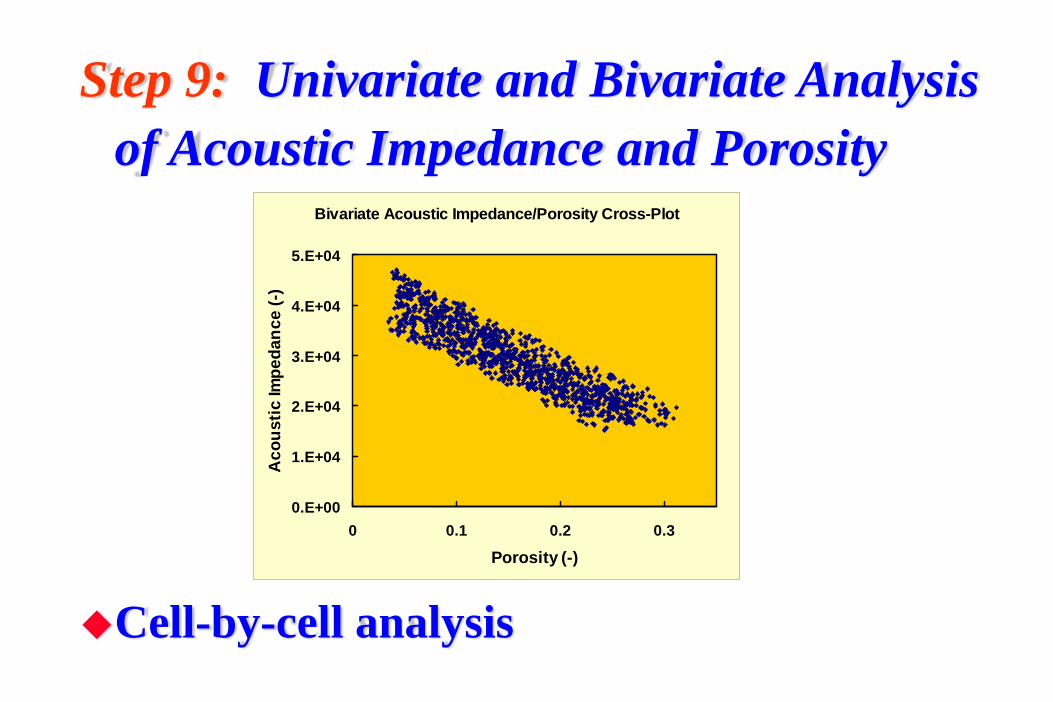
Cell-by-cell analysis
Step 9: Univariate and Bivariate Analysis of Acoustic Impedance and Porosity
Bivariate Acoustic Impedance/Porosity Cross-Plot
0.E+00
1.E+04
2.E+04
3.E+04
4.E+04
5.E+04
0 0.1 0.2 0.3
Porosity (-)
Aco
ustic
Impe
danc
e (-)
14
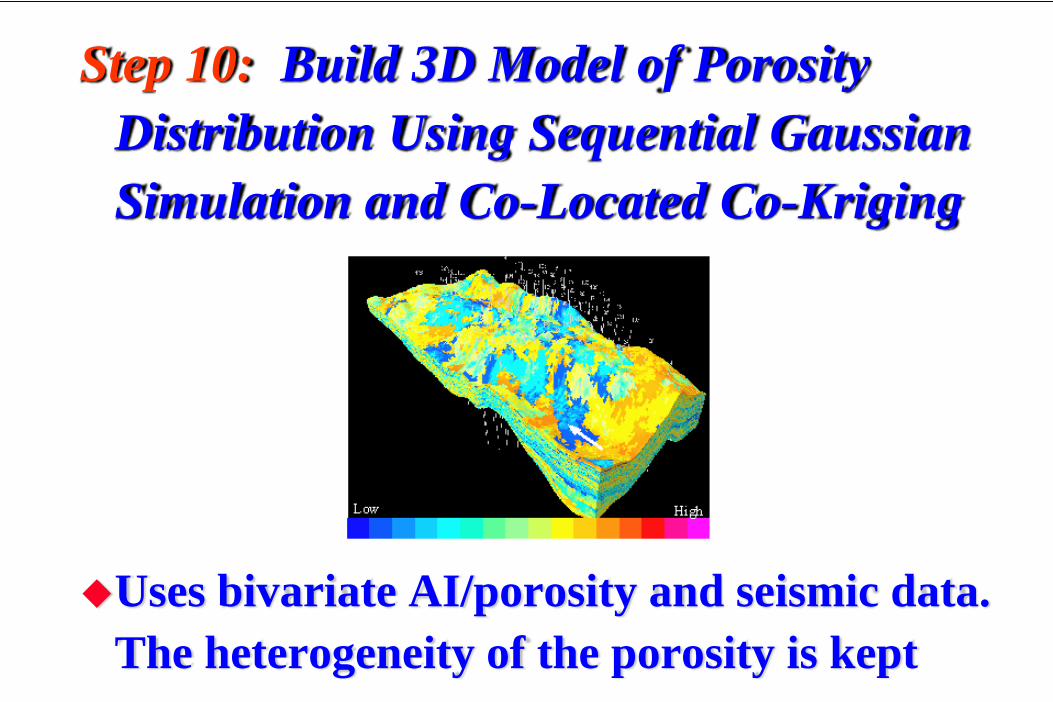
Uses bivariate AI/porosity and seismic data. The heterogeneity of the porosity is kept
Step 10: Build 3D Model of Porosity Distribution Using Sequential Gaussian Simulation and Co-Located Co-Kriging
15
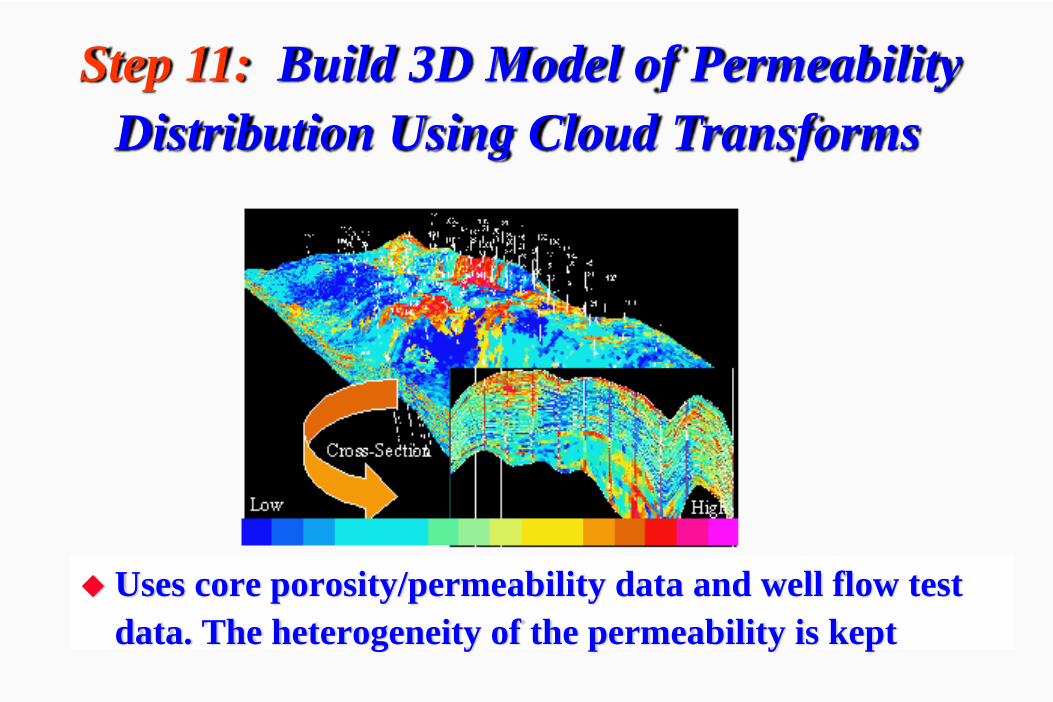
Uses core porosity/permeability data and well flow test data. The heterogeneity of the permeability is kept
Step 11: Build 3D Model of Permeability Distribution Using Cloud Transforms
16
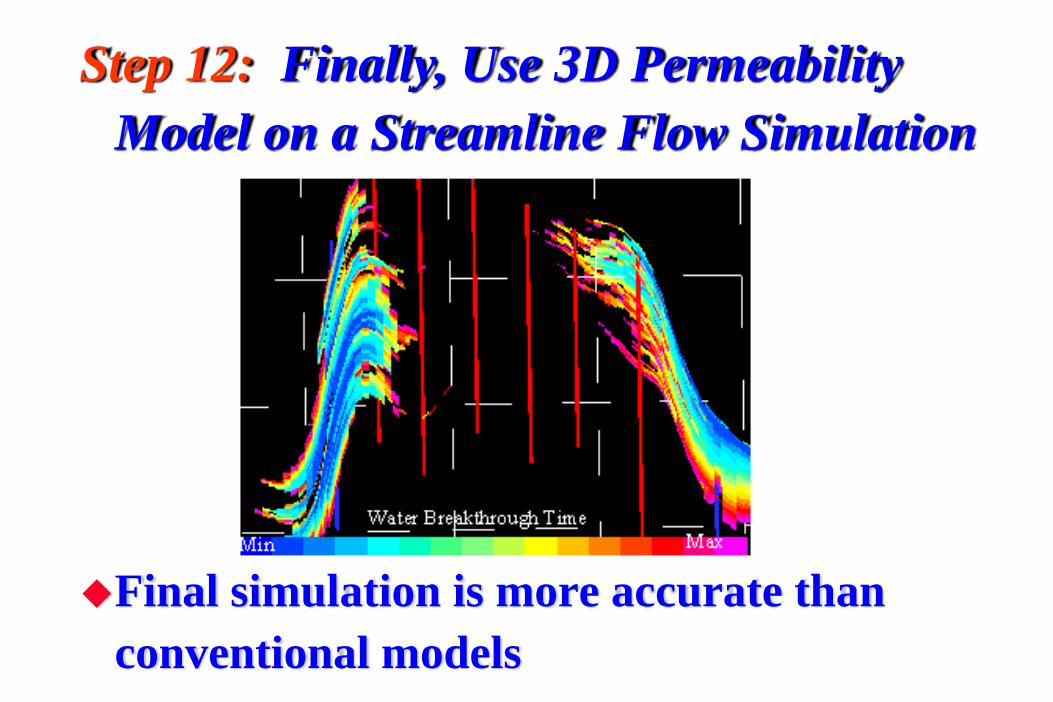
Final simulation is more accurate than conventional models
Step 12: Finally, Use 3D Permeability Model on a Streamline Flow Simulation
17
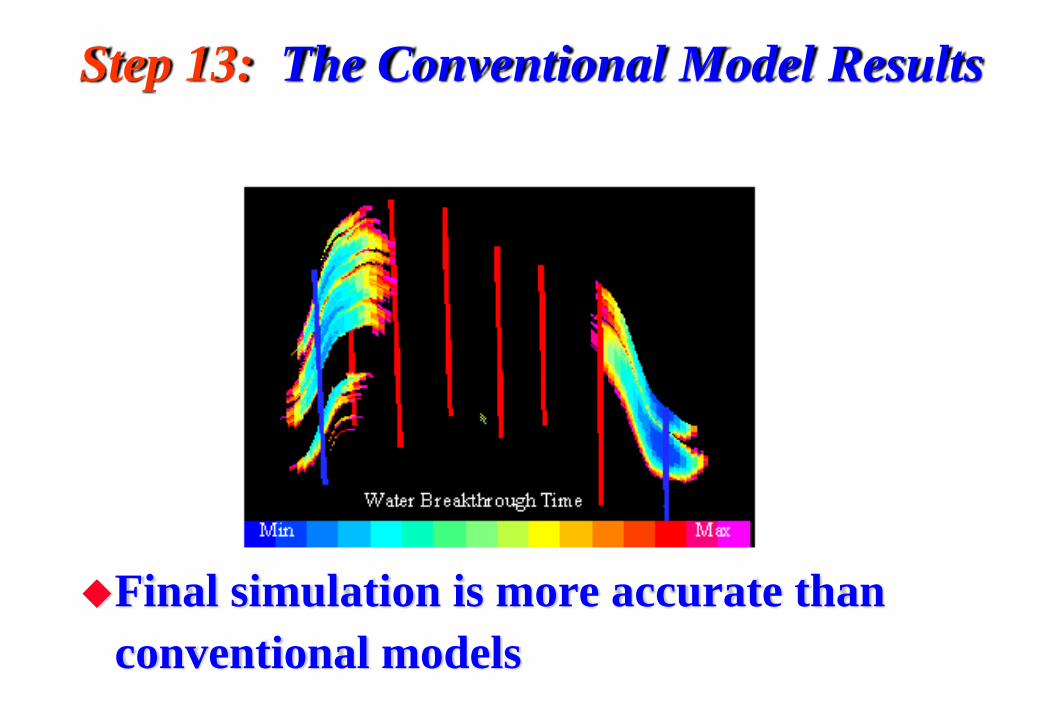
Final simulation is more accurate than conventional models
Step 13: The Conventional Model Results
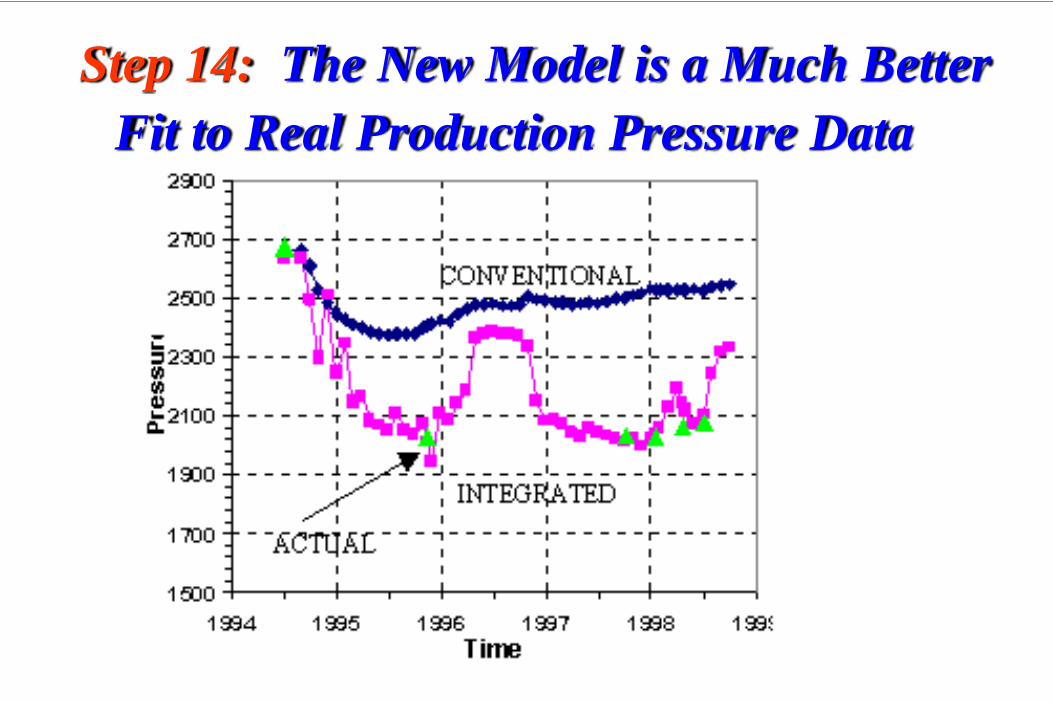
18
Step 14: The New Model is a Much Better Fit to Real Production Pressure Data
19
Results
Integrating existing data with new geostatistical techniques is successfulPorosity, Permeability, AI, and Facies models are all more realistic - retaining their natural heterogeneityFluid flow simulation with the new methods is faster (CPU time) and more accurate
20
Summary
Existing data can be used to improve reservoir analysisImproved reservoir analysis allows the field to produce more oil for longerEnvironmental damage is reduced by obviating the need for new reservoirsDespite this, oil production volume is maintained and improved
Related Documents