Running head: CULTURAL DIFFERENCES IN DECISIONS FROM EXPERIENCE 1 Cross Cultural Differences in Decisions from Experience: Evidence from Denmark, Israel, and Taiwan Sibilla Di Guida a , Ido Erev b , Davide Marchiori c a Corresponding author, Department of Business and Economics, COHERE, University of Southern Denmark, Campusvej 55, 5230 Odense M, Denmark;. Tel: +45 6550 7295, Email: [email protected] b Faculty of Industrial Engineering and Management, Technion, Technion City, Haifa 32000, Israel, [email protected] c Strategic Organization Design Unit, Department of Marketing and Management, University of Southern Denmark, Campusvej 55, 5230 Odense M, Denmark, [email protected]

Welcome message from author
This document is posted to help you gain knowledge. Please leave a comment to let me know what you think about it! Share it to your friends and learn new things together.
Transcript
Running head: CULTURAL DIFFERENCES IN DECISIONS FROM EXPERIENCE 1
Cross Cultural Differences in Decisions from Experience:
Evidence from Denmark, Israel, and Taiwan
Sibilla Di Guidaa, Ido Erevb, Davide Marchioric
a Corresponding author, Department of Business and Economics, COHERE, University of
Southern Denmark, Campusvej 55, 5230 Odense M, Denmark;. Tel: +45 6550 7295, Email:
b Faculty of Industrial Engineering and Management, Technion, Technion City, Haifa 32000,
Israel, [email protected]
c Strategic Organization Design Unit, Department of Marketing and Management,
University of Southern Denmark, Campusvej 55, 5230 Odense M, Denmark,
CULTURAL DIFFERENCES IN DECISIONS FROM EXPERIENCE 2
Cross Cultural Differences in Decisions from Experience:
Evidence from Denmark, Israel, and Taiwan
Abstract
Three studies are presented that compare decisions from experience in Denmark, Israel, and
Taiwan. They focus on two change-related cultural differences suggested by previous
research on dialectical vs. analytic approach to thinking. The first implies that East Asians
are more likely to change their behavior over time (i.e., are less consistent), the second that
they expect more changes in the environment. The results show that the “less consistency in
the East” hypothesis has a high predictive value. This hypothesis accurately predicts a
behavioral pattern that was documented in all three studies, as well as a non-trivial effect of
limited feedback in Study 3: When feedback was limited to the obtained payoff, the
participants from Taiwan exhibited less risk aversion than the Israeli. Analysis of the
“expecting more changes in the East” hypothesis reveals mixed results. This hypothesis was
supported in Study 2, which examined relatively complex multi-alternative multi-outcome
tasks, but not in Studies 1 and 3, which examined simple two-alternative two-outcome choice
tasks. A possible explanation for the different predictive value of the two examined
hypotheses is discussed.
Key words: The hot stove effect; underweighting of rare events; decisions from
experience; clicking paradigm; recency effect; dialectical thinking.
JEL classification: C91; D81; D83.
PsycINFO classification: 2343; 2930.
Word count: 9,799
CULTURAL DIFFERENCES IN DECISIONS FROM EXPERIENCE 3
1. Introduction
Previous studies of judgment and decision making in different cultures reveal two interesting
change-related differences between individuals from East Asian and Western cultures. The
first is that Easterners tend to change their opinions over time more often than Westerners.
For example, Yates et al. (1998) and Wallsten and Gu (2003) show that this tendency can
explain why Chinese people appear to be more overconfident than North Americans (see
Yates et al., 1989). The second is that Easterners expect more changes in the environment
than individuals from Western cultures (Ji et al., 2001, and 2008; Spencer-Rodgers et al.,
2010). For example, when presented with a graph summarizing the trend of the economic
growth rate or of the worldwide death rate for cancer, participants from the Peoples’ Republic
of China (PRC) were about twice as likely as Americans to predict a reversal of the trend in
the next period (Ji et al.’s Study 2, 2001).
Both change-related cultural differences can be explained by the higher propensity of
East Asians to tolerate contradictions (Peng & Nisbett, 1999). This tendency is commonly
referred to as dialecticism (see discussions in Wallsten & Gu, 2003, and in Ji et al., 2001).
On the one hand, dialecticism reduces the effort to be consistent,1 thus resulting in a higher
rate of changes in opinion; on the other, it induces a vision of an environment in constant
mutation, thus leading Easterners to expect more changes in the environment.
Previous attempts to examine the effect of cultural differences on decision making
have mainly focused on risk preferences and risk perception in decisions from description (à
la Kahneman & Tversy, 1979), i.e., in situations in which decision makers are provided with
1 Typically, when facing seeming contradictions, people of Chinese culture “retain basic elements of opposing
perspectives by seeking a ‘middle way,’” adopting a compromise approach (Peng & Nisbett, 1999:741). In
contrast, Westerners are more likely to emphasize contradictions in the attempt to logically evaluate alternative
perspectives, as heritage of the Aristotelian logic and, in particular, of its principle of tertium non datur.
CULTURAL DIFFERENCES IN DECISIONS FROM EXPERIENCE 4
full and accurate description of the incentive structure. These studies have shown, for
example, that the Chinese from the PRC are remarkably more risk seeking than North
Americans in decisions from description with hypothetical stakes, although this difference is
significant only in the financial/economic domain (Weber & Hsee, 1998; Hsee & Weber,
1999).2
The current paper explores the implications of the two mentioned change-related
cultural differences in the context of repeated decisions with feedback. Specifically, we
focus on pure decisions from experience, i.e., situations in which decision makers are not
provided with prior information about the incentive structure, but can only rely on the
outcomes of their past decisions. Our interest in exploring cultural differences in the context
of decisions from experience has two main motivations. First, recent research has shown that
choice behavior can greatly differ depending on whether decision makers can rely on the full
description of the problem at hand, or only on the observed outcomes from each of the
possible alternatives (cf. Section 1.2; Barron & Erev, 2003; Erev & Haruvy, 2014). This
result is commonly referred to as the experience-description gap (Hertwig & Erev, 2009).
Second, most of the previous studies on experiential decision-making were run with
“WEIRD” participants (i.e., from Western, Educated, Industrialized, Rich, and Democratic
Countries; see Henrich et al., 2010).
Therefore, the present investigation has two main goals. The first is to understand the
effects of the highlighted change-related cultural differences on choice behavior in decisions
2 Weber et al. (1998) hypothesize that the higher rate of risk seeking in the PRC can be explained by the
collectivist nature of that society: Compared to an individualistic society such as that of the USA, people in
mainland China are more likely to receive financial help if they are in need, and, consequently, are less risk
averse. Weber et al. call this the cushion hypothesis.
CULTURAL DIFFERENCES IN DECISIONS FROM EXPERIENCE 5
from experience, the second to evaluate the generality across cultures of the main behavioral
regularities observed in decisions from experience.
1.1 Baseline Experimental Design and Hypotheses
To pursue our two goals, we designed and ran three experimental studies, which are variants
to the basic “clicking paradigm” described in Figure 1. In this basic design, participants are
just told that the experiment will include many trials, and that their task at each trial is to
select (click on) one of the two unmarked keys that are presented on the screen. Each
selection is followed by the presentation of the outcomes from both keys. Importantly,
participants are not given any information about the payoff rule that generates the (stochastic)
outcomes from each option (key). Therefore, participants can assess the value of each option
only based on the observation of past outcomes. Although extremely simple, this paradigm
reliably replicates the main properties of operant conditioning and experiential learning (Erev
& Haruvy, 2014, provide a comprehensive review of the empirical studies adopting this
methodology).
The two change-related cultural differences mentioned in the introduction lead to two
hypotheses about behavior in the decisions from experience setting.
The first hypothesis is that of “less consistency in the East.” This hypothesis predicts
more changes in the preferred option (key) by Easterners, as a consequence of the more
frequent changes in opinion typical of people from dialectical cultures. Therefore, under this
hypothesis, the probability of repeating the previous choice (tendency referred to as inertia) is
predicted to be lower for East Asians.
The second hypothesis is that of “expecting more changes in the East.” As another
possible effect of dialecticism, Easterners are predicted to be less likely to choose the option
(key) that has yielded the best payoff in the previous trial. This is because East Asians expect
CULTURAL DIFFERENCES IN DECISIONS FROM EXPERIENCE 6
more changes in the environment, and, for this reason, are less likely to believe that the
option that has yielded the best outcome in the previous trial will do so also in the future.
---
Figure 1
---
1.2 Behavioral Regularities in Decisions from Experience
The current analysis examines the impact of cultural differences on five of the most important
regularities documented in previous studies of decisions from experience. In order to clarify
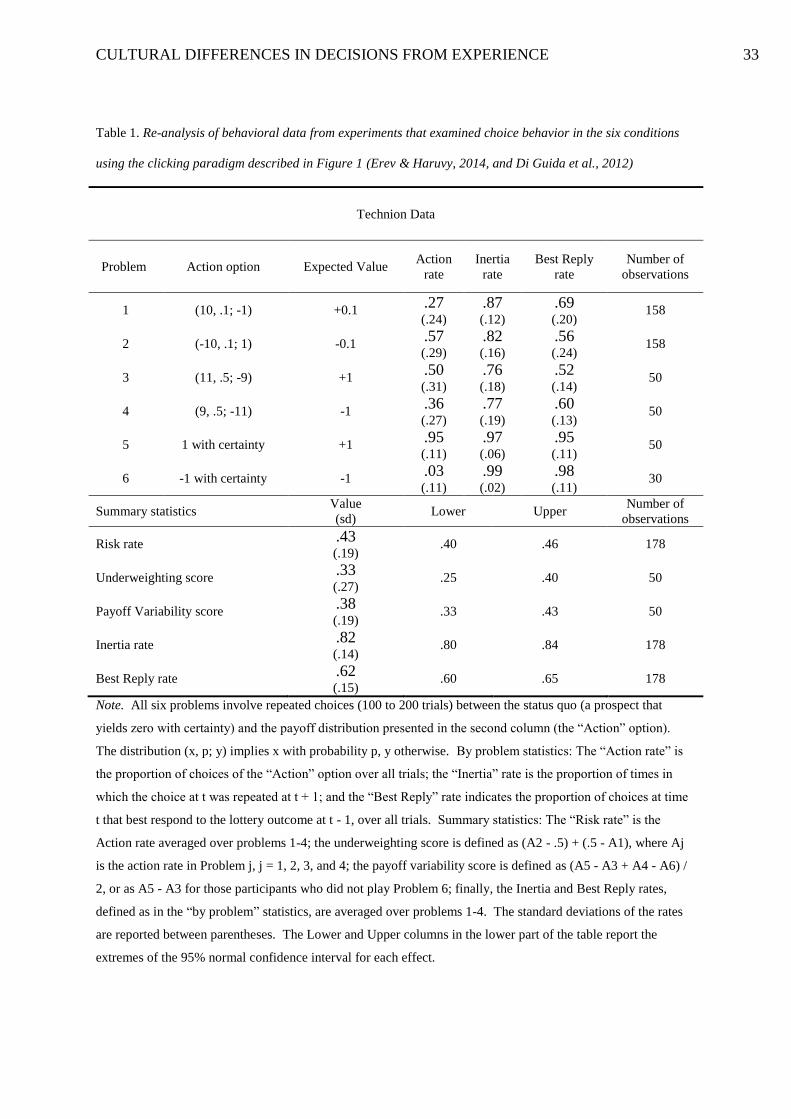
these regularities and their measurement, we focused on the six problems described in Table
1. The right hand columns and the lower rows of Table 1 summarize the results of two
experimental studies of these problems (Di Guida et al., 2012, and Erev & Haruvy, 2013) that
were conducted at the Technion (Haifa, Israel) using the clicking paradigm.
Notice that all six problems involve choice between the Status Quo (i.e., an option
that yields a payoff of zero with certainty), and an action that changes the status quo (which
we refer to as “Action option”). The participants faced each problem for at least 100 trials,
were not given prior information about the payoff rule behind each alternative, received
feedback about the payoff from each alternative after each choice, and were paid a show up
fee of 25 Israeli Shekels (1 Shekel ≈ $0.25) plus the payoff (in Shekels) from one randomly
selected trial.
1.2.1 Underweighting of rare events
The best known property of decisions from experience is the tendency to underweight rare
events (Barron & Erev, 2003; Hertwig et al., 2004; Rakow & Newell, 2010; Barron &
Ursino, 2013). Repeated experience with the choice task increases the tendency to select the
option that has yielded the best payoff most of the time, even when this choice behavior
CULTURAL DIFFERENCES IN DECISIONS FROM EXPERIENCE 7
impairs expected return. This tendency was documented in distinct experimental paradigms
(see Shafir et al., 2008; Ungemach et al., 2009; Danziger et al., 2014) and can be explained as
a product of reliance on small samples3.
The current analysis of this tendency focuses on the comparison of behavior in
Problems 1 and 2 (Table 1). Notice that in both problems, the action option alternative to the
status quo involves an extreme and rare (10%) outcome. The experimental results reveal
deviation from maximization in both problems: In Problem 1, most participants preferred the
Status Quo over an Action option with positive expected value (i.e., the prospect “+10 with p
= 0.1; -1 otherwise”): Only 27% (SD = 0.24) preferred the Action option; on the contrary, in
Problem 2, most participants (57%, SD = 0.29) preferred the Action, with negative expected
value (the prospect “-10 with p = 0.1; -1 otherwise”), over the status quo. Both deviations
can be explained by the hypothesis that subjects favor the option that lead to the best payoff
in 90% of the trials, and do not pay enough attention to the rare (10%), but extreme,
outcomes. That is, individuals behave as if they underweight rare events.
The underweighting score in the lower section of Table 1 presents the common
quantification of this effect. More in detail, this score is derived considering behavior in
Problems 1 and 2: Preferring the “Status Quo” option in Problem 1 and the “Action” option
in Problem 2 is an indication of insufficient sensitivity to the (rare) event occurring 10% of
the time. Therefore, the average of the difference between 0.5 (rate that indicates
indifference between the two options) and the rate of Action choices in Problem 1, and of the
difference between the rate of Action choices and 0.5 in Problem 2 can be used to assess this
3 Reliance on small sample implies a tendency to underweight rare events because rare events are likely to be
underrepresented in small samples. For example, the probability that a 10% event will be represented in sample
of 10 is only 0.38. The tendency to rely on small samples, in turn, can be the product of cognitive limitations
and/or a sophisticated attempt to response to patterns (Hertwig & Erev, 2009).
CULTURAL DIFFERENCES IN DECISIONS FROM EXPERIENCE 8
tendency. In particular, a significantly positive score can be interpreted as an overall
indication of underweighting of rare events in the two problems.
1.2.2 The payoff variability effect
Another robust behavioral regularity emerging in decisions from experience is the payoff
variability effect (Myers & Sadler, 1960; Busemeyer & Townsend, 1993): An increase in the
variability of payoffs moves decisions toward random choice, even when this bias impairs
expected returns and increases the probability of losses.
Problems 3, 4, 5, and 6 (Table 1) were designed to test for this effect. More in detail,
Problems 5 and 6 involve a choice between the Status Quo and an Action option that yields a
certain payoff of, respectively, 1 and -1. The results show that adding variability to the
payoff from the Action option, without changing its expected value (as in Problem 3 and 4),
reduces the tendency to choose it (see results reported in Table 1). Therefore, comparison of
the Action choice rate in Problems 5 and 3 and in Problems 6 and 4 suggests that the addition
of variability moves choice behavior toward random choice. Notice that these results cannot
be accounted for by any pattern of choice behavior that assumes stable aversion to risk and/or
losses.
The payoff variability score reported in the lower section of Table 1 presents the
common quantification of this effect. Specifically, this score is obtained by averaging the
difference between the maximization rates in Problem 5 and 3 (i.e., the difference between
the Action choice rates in the two problems), and the difference between the maximization
rates in Problem 6 and 4 (i.e., the difference between the Status Quo choice rates in the two
problems). A significantly positive score can be interpreted as a decrease in the
maximization rate in correspondence to an increase in the variability of payoffs, thus
providing indication of the payoff variability effect.
CULTURAL DIFFERENCES IN DECISIONS FROM EXPERIENCE 9
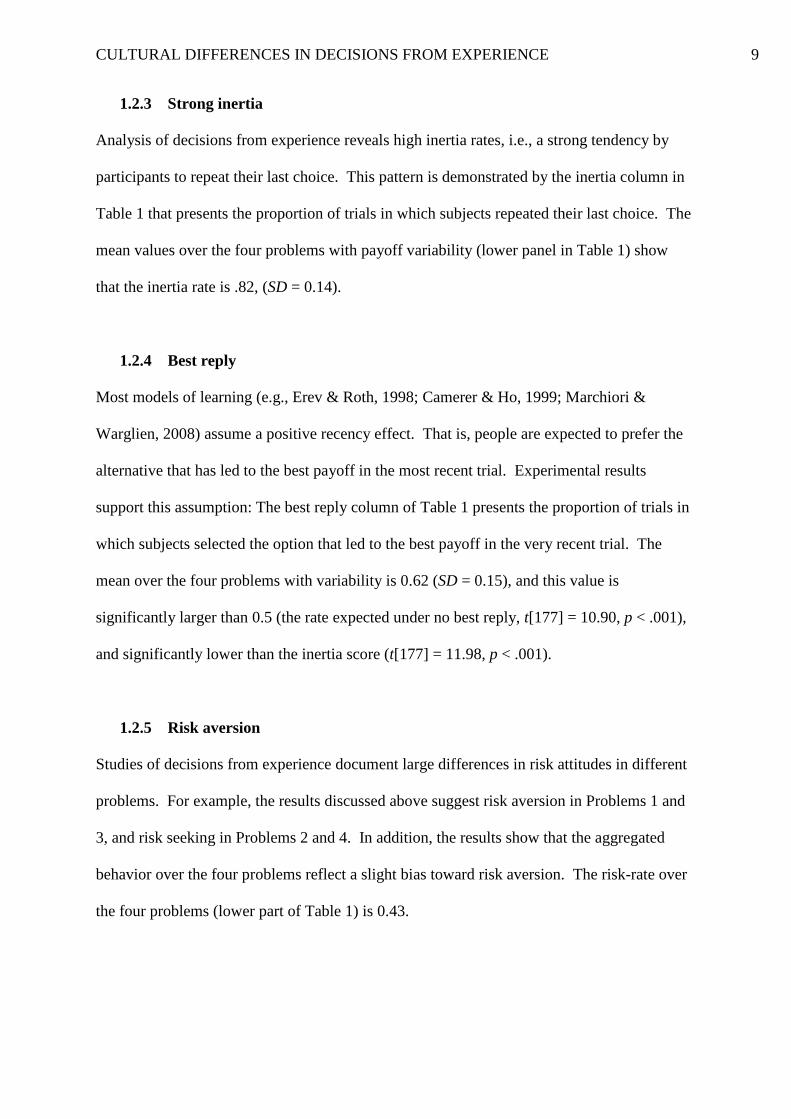
1.2.3 Strong inertia
Analysis of decisions from experience reveals high inertia rates, i.e., a strong tendency by
participants to repeat their last choice. This pattern is demonstrated by the inertia column in
Table 1 that presents the proportion of trials in which subjects repeated their last choice. The
mean values over the four problems with payoff variability (lower panel in Table 1) show
that the inertia rate is .82, (SD = 0.14).
1.2.4 Best reply
Most models of learning (e.g., Erev & Roth, 1998; Camerer & Ho, 1999; Marchiori &
Warglien, 2008) assume a positive recency effect. That is, people are expected to prefer the
alternative that has led to the best payoff in the most recent trial. Experimental results
support this assumption: The best reply column of Table 1 presents the proportion of trials in
which subjects selected the option that led to the best payoff in the very recent trial. The
mean over the four problems with variability is 0.62 (SD = 0.15), and this value is
significantly larger than 0.5 (the rate expected under no best reply, t[177] = 10.90, p < .001),
and significantly lower than the inertia score (t[177] = 11.98, p < .001).
1.2.5 Risk aversion
Studies of decisions from experience document large differences in risk attitudes in different
problems. For example, the results discussed above suggest risk aversion in Problems 1 and
3, and risk seeking in Problems 2 and 4. In addition, the results show that the aggregated
behavior over the four problems reflect a slight bias toward risk aversion. The risk-rate over
the four problems (lower part of Table 1) is 0.43.
CULTURAL DIFFERENCES IN DECISIONS FROM EXPERIENCE 10
---
Table 1
---
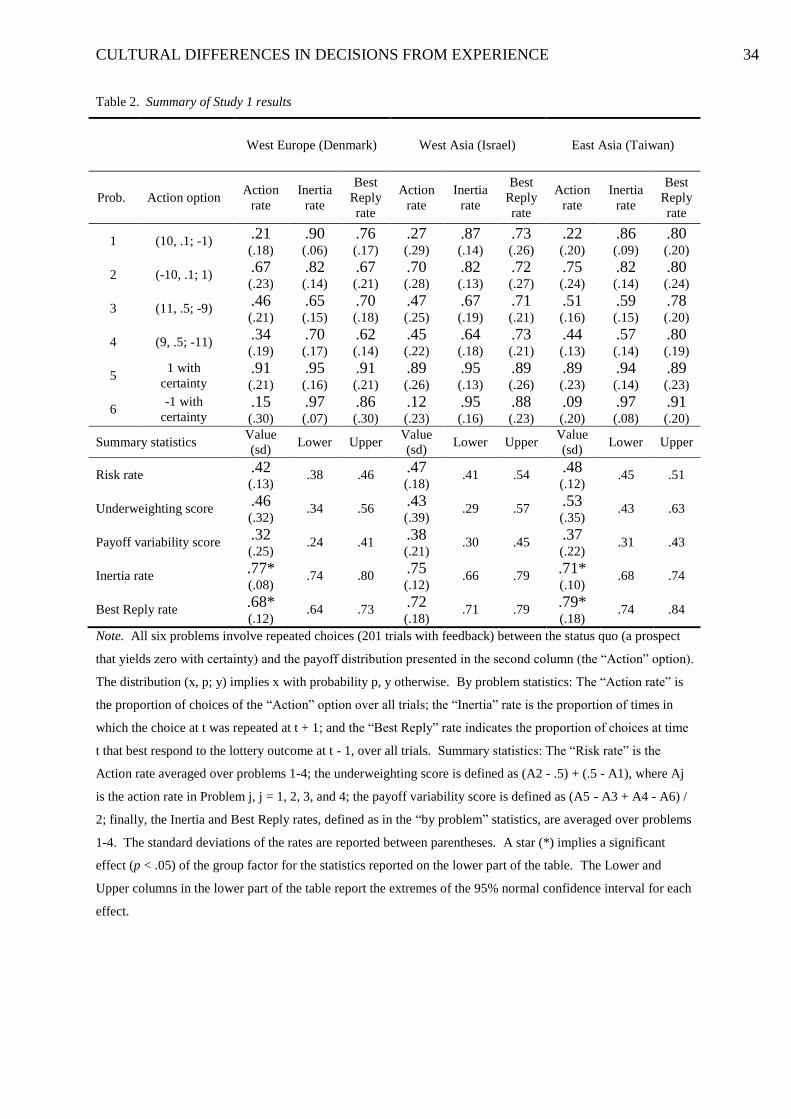
2. Study 1
Study 1 replicated the experiments summarized in Table 1, and was run in three different
locations: At the Lab@SDU (University of Southern Denmark, Odense, Denmark), at the
Interdisciplinary Center (IDC) Herzliya (Israel), and at the AI-Econ Lab of the National
Chengchi University (Taipei, Taiwan). In these three locations we could recruit participants
with different cultural backgrounds, in particular for what concerns the propensity to
dialectical thinking. Therefore, the replication of this experimental study in the three
mentioned locations allowed us to check for the robustness to cultural background of the five
properties of decisions from experience summarized in Table 1, and to test our hypotheses
about the two change-related cultural differences described earlier.
2.1 Design
Participants played for 201 times (200 decisions with feedback) each of the six binary
problems presented in Table 1. The order of the problems was independently randomized for
each participant.4 Participants were told that the experiment would include many trials and
that their task would be to choose between two unmarked keys that appear on the screen.
Participants were given no information about the problems’ incentive structure. After each
selection, the payoffs from the selected and the non-selected keys were presented on the
4 In spite of the apparently huge number of choice problems (clicking tasks) faced by each participant (i.e.,
1,206), the duration of the whole experiment was about 35 minutes. In addition, within each cultural group, we
did not observe any significant difference in choice behavior in the same problem when it was encountered at
the beginning (first 201 trials), or at the end of the experiment (trials 1,006 to 1,206).
CULTURAL DIFFERENCES IN DECISIONS FROM EXPERIENCE 11
screen (complete feedback). The Status Quo and Action options were randomly assigned to
keys, independently for each participant, and each option was maintained in the same
position in all trials of the same problem. Participants were told when each problem had
terminated.
2.2 Instructions and payment
In Denmark and in Israel, instructions were given in English, whereas in Taiwan both the
English and the Chinese versions were provided (the two-language method mimics the
original Technion study with instructions both in English and Hebrew). The translation to
Chinese Mandarin was made by a native speaker fluent in English. It is worth noting that in
the clicking paradigm, due to the simplicity of the task, instructions are minimal (see Figure
1), and their impact on participants’ performance is limited. The two buttons on the screen
were simply referred to as the “right” and “left” alternative. Instructions appeared on the
screen at the beginning of the experiment.
Participants were paid according to the amount of experimental points they earned
with their decisions during the experiment. Specifically, participants received an initial
endowment of 150 experimental points, plus the positive or negative outcome (in
experimental points) from six of their choices (one for each problem), randomly selected at
the end of the experiment.
The conversion rate between experimental points and the local currency was clearly
stated in the instructions. In order to make payments’ purchasing power comparable across
the three Countries, we rescaled payoffs according to the “The Economist’s Big Mac Index.”
Thus, one experimental point was worth 0.4 Danish Kroner, 0.2 Israeli Shekels, and 1
Taiwanese Dollar, so that the initial endowment of 150 points was equivalent to the price of
two Big Mac sandwiches.
CULTURAL DIFFERENCES IN DECISIONS FROM EXPERIENCE 12
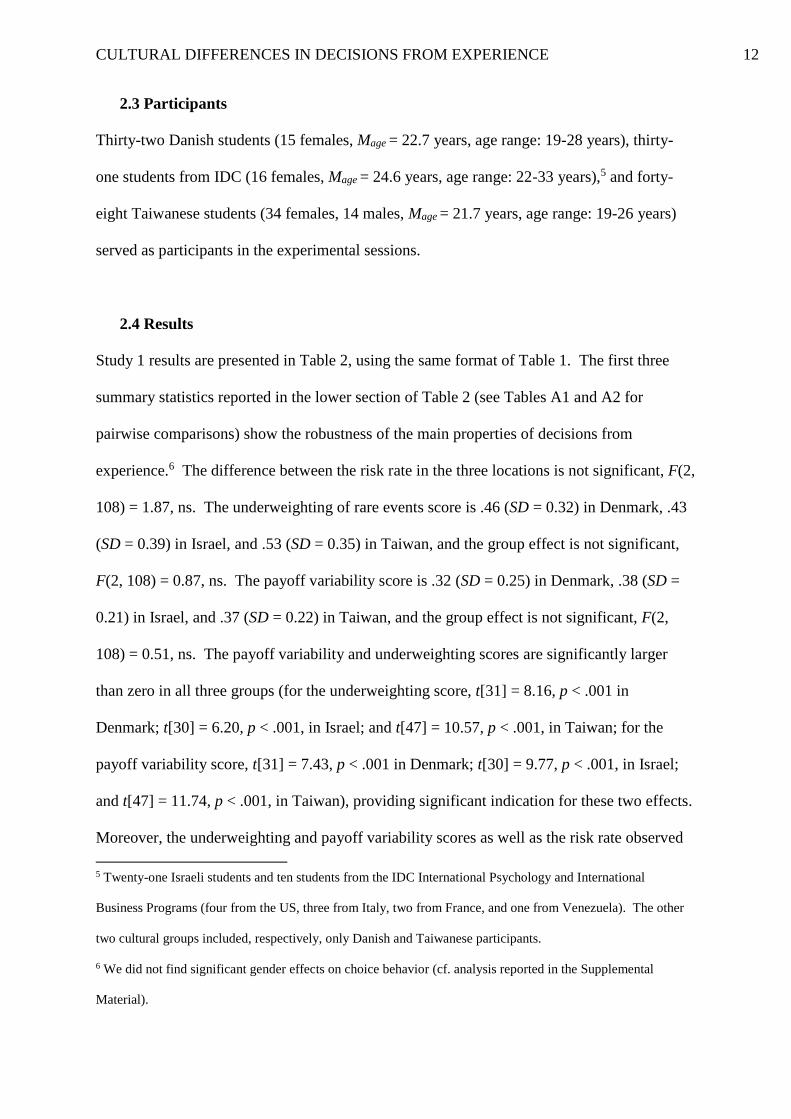
2.3 Participants
Thirty-two Danish students (15 females, Mage = 22.7 years, age range: 19-28 years), thirty-
one students from IDC (16 females, Mage = 24.6 years, age range: 22-33 years),5 and forty-
eight Taiwanese students (34 females, 14 males, Mage = 21.7 years, age range: 19-26 years)
served as participants in the experimental sessions.
2.4 Results
Study 1 results are presented in Table 2, using the same format of Table 1. The first three
summary statistics reported in the lower section of Table 2 (see Tables A1 and A2 for
pairwise comparisons) show the robustness of the main properties of decisions from
experience.6 The difference between the risk rate in the three locations is not significant, F(2,
108) = 1.87, ns. The underweighting of rare events score is .46 (SD = 0.32) in Denmark, .43
(SD = 0.39) in Israel, and .53 (SD = 0.35) in Taiwan, and the group effect is not significant,
F(2, 108) = 0.87, ns. The payoff variability score is .32 (SD = 0.25) in Denmark, .38 (SD =
0.21) in Israel, and .37 (SD = 0.22) in Taiwan, and the group effect is not significant, F(2,
108) = 0.51, ns. The payoff variability and underweighting scores are significantly larger
than zero in all three groups (for the underweighting score, t[31] = 8.16, p < .001 in
Denmark; t[30] = 6.20, p < .001, in Israel; and t[47] = 10.57, p < .001, in Taiwan; for the
payoff variability score, t[31] = 7.43, p < .001 in Denmark; t[30] = 9.77, p < .001, in Israel;
and t[47] = 11.74, p < .001, in Taiwan), providing significant indication for these two effects.
Moreover, the underweighting and payoff variability scores as well as the risk rate observed
5 Twenty-one Israeli students and ten students from the IDC International Psychology and International
Business Programs (four from the US, three from Italy, two from France, and one from Venezuela). The other
two cultural groups included, respectively, only Danish and Taiwanese participants.
6 We did not find significant gender effects on choice behavior (cf. analysis reported in the Supplemental
Material).
CULTURAL DIFFERENCES IN DECISIONS FROM EXPERIENCE 13
in the two Western locations are not significantly different from those observed in the
previous Technion studies summarized in Table 1 (see the Supplemental Material for
pairwise comparisons).
Analysis of the inertia rates confirms the prediction of the “less consistency in the
East” hypothesis. It reveals a smaller inertia rate in Taiwan (M = .71, SD = 0.10) than in
Denmark (M = .77, SD = 0.08) and Israel (M = .75, SD = 0.12), F(2, 108) = 3.77, p = 0.03, η2
= .07. In particular, the Taiwanese are observed to be significantly less likely than the Danes
to repeat their previous choice (see Table A2 for detailed pairwise comparisons).
In contrast, our generalization of the “expecting more changes in the East” result was
not supported. Analysis of the best reply scores reveals higher best reply rates in Taiwan (M
= .79, SD = 0.18) than in Denmark (M = .68, SD = 0.12) and Israel (M = .72, SD = 0.18). The
group effect is significant (F[2, 108] = 4.26, p = .02, η2 = .07), although the only significant
pairwise difference is between Denmark and Taiwan (see Table A1). Therefore, contrary to
what hypothesized, the Taiwanese behaved as if they expected fewer changes, as they were
more likely to select the option that had yielded the highest payoff in the previous trial.
Comparison of the present best reply and inertia rates to those from the reviewed Technion
studies (Table 1) reveal similar patterns in the three groups with Western participants.
---
Table 2
---
Under one explanation for the inaccuracy of our “expecting more changes in the East”
hypothesis, the results suggest a qualitative difference between decisions from experience and
prediction tasks. That is, it is possible that Easterners expect more changes when are asked to
predict the future (as in Ji et al., 2001), but not when they decide based on past experience. A
second explanation assumes that the critical difference between Study 1 and Ji et al.’s results
CULTURAL DIFFERENCES IN DECISIONS FROM EXPERIENCE 14
involves the number of possible outcomes. It is possible that Easterners expect more changes
when the number of possible outcomes is large (as in Ji et al. tasks predicting continuous
rates tasks), but the opposite hold in Study 1’s two-outcome tasks. One justification to this
“number of outcomes” explanation rests on the following two assumptions: First, some
people may believe that, in the current state of nature, the payoff from the action option tends
to alternate between positive and negative outcomes (see Rapoport & Budescu, 1997). Given
this belief, expecting a continuation of the current state implies a low best reply rate (e.g.,
selecting the Status Quo option after a positive outcome from the action option), whereas
expecting a change (namely, a termination of the alternating pattern) implies a high best reply
rate. Second, people are more likely to expect more alternations in two-outcome choice tasks
(like those of Study 1) than in multi-outcome tasks (like in Ji et al.’s prediction tasks). Notice
that this latter explanation suggests that it is not easy to derive the predictions about behavior
of the “expecting more changes in the East” hypothesis: Such an exercise would require
additional assumptions concerning the participants’ belief about of current state of nature,
and these beliefs can be creative. Yet, the current explanation suggests that our original
prediction (i.e., lower best reply rate in the East, cf. Section 1.1) is more likely to hold when
the number of possible payoffs is large.
Study 2 was designed to compare these explanations by examining decision problems
with multiple outcomes for each alternative, as well as problems with more than two possible
alternatives.7
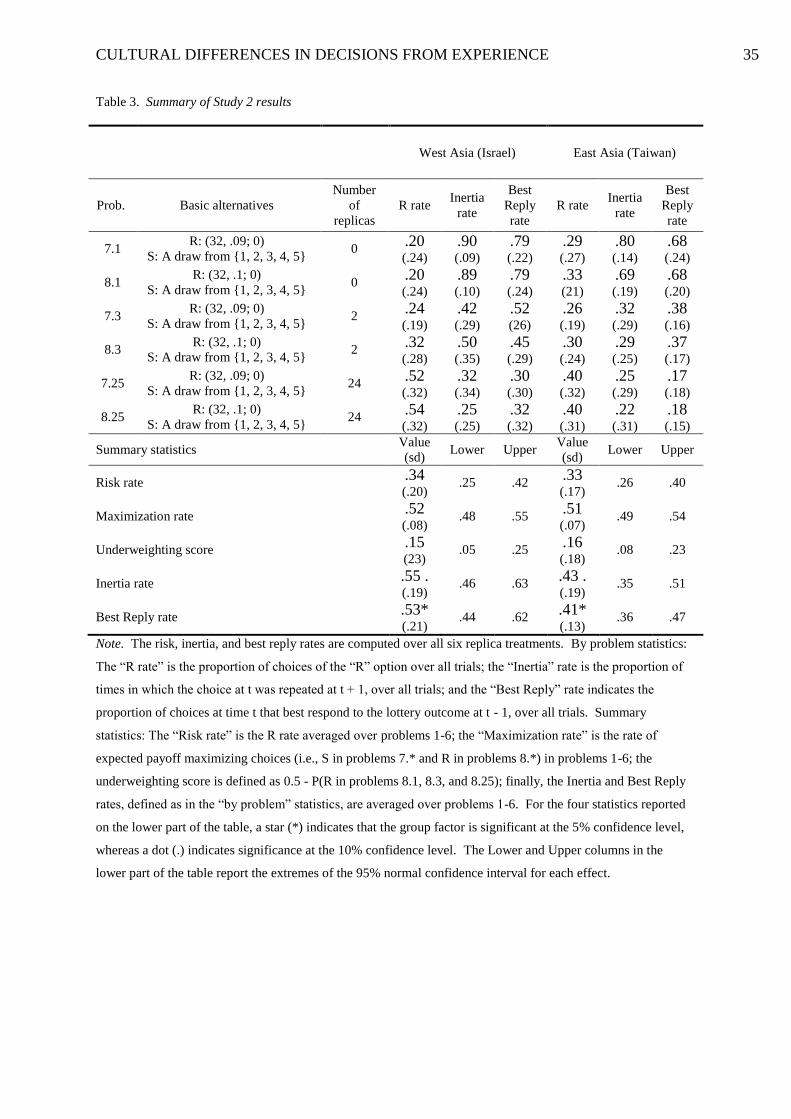
3. Study 2
Study 2 replicated the second study in Ert and Erev (2007), and was run in Taiwan (National
Chengchi University, Taipei) and in Israel (Technion, Haifa). It used the clicking paradigm,
7 We decided to leave the study of cultural differences in pattern detection to future research.
CULTURAL DIFFERENCES IN DECISIONS FROM EXPERIENCE 15
described earlier, and focused on the six problems presented in Table 3. The six problems
included two baseline problems (7.1 and 8.1), and two variants to each of these problems.
The baseline problems 7.1 and 8.1 imply choice between a two-outcome risky alternative
(labeled with R), and a safer prospect S with five possible outcomes.
Compared to the six problems considered in Study 1, in problems 7.1 and 8.1 task
complexity is increased by adding some noise to the outcome from the safe prospect.
Problems 7.3, 8.3, 7.25, and 8.25 further increase task complexity by increasing the number
of available alternatives at each trial.
Problems 7.3 and 8.3 used the same payoff distributions as in the baseline problems
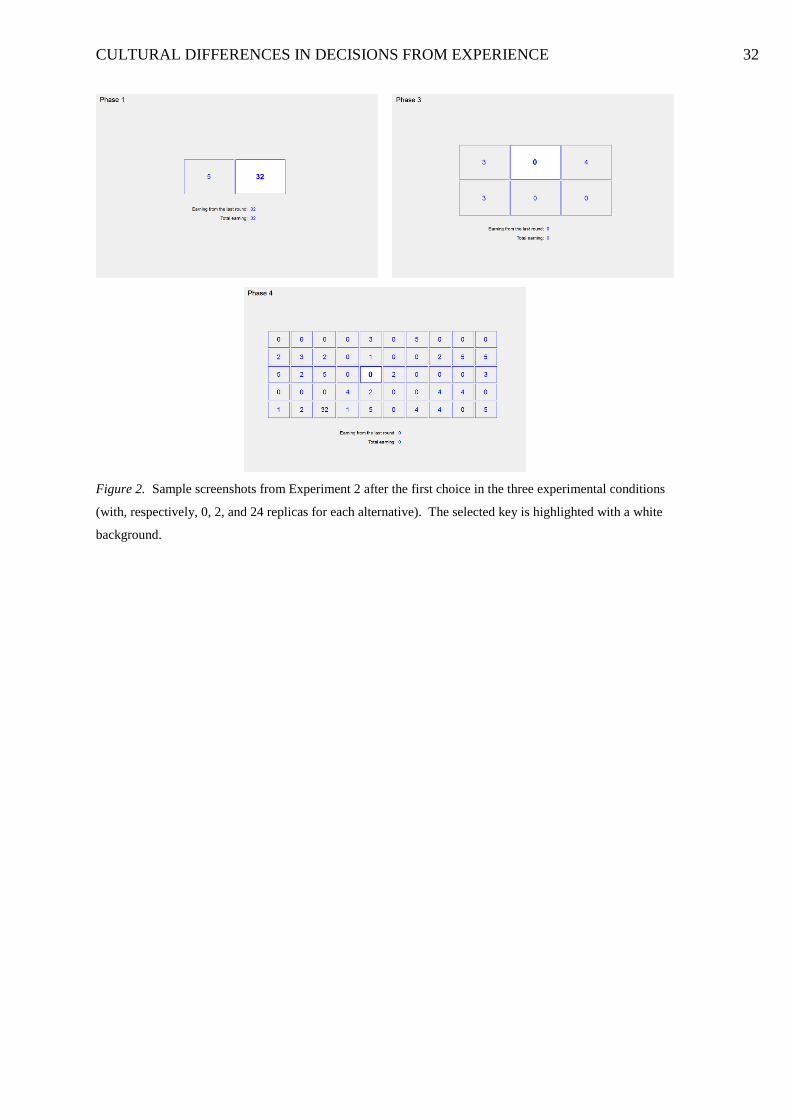
7.1 and 8.1, with the exception that two “replicas” were added to each alternative (cf. Figure
2). That is, at each trial, subjects saw a total of six keys on the screen: The outcomes from
three keys were independent draws from payoff distribution R, and the other three were
independent draws from payoff distribution S.
Problems 7.25 and 8.25 included 24 replicas of each alternative (thus, participants
could choose among a total of 50 keys at each trial). At each trial, the different replicas
yielded an independent draw from the reference distribution R or S. Figure 2 presents the
typical experimental screens under the three “replicas” conditions.
---
Figure 2
---
Notice that in the baseline problems, perfect best reply to recent payoffs implies a
frequency of R choices (henceforth, R-rate) of 10%: That is, extreme underweighting of the
rare event in Problem 8.1 (when the R option maximizes expected return), and strong risk
aversion. In contrast, in Problems 7.25 and 8.25 the probability that at least one of the 25
risky prospects will lead to a large gain is very high (.91 in 7.25, and .93 in 8.25). Thus,
CULTURAL DIFFERENCES IN DECISIONS FROM EXPERIENCE 16
perfect best reply implies overweighting of rare event in Problem 7.25 (when choosing R
impairs expected return), and high risk seeking rates.
3.1 Design
As in Study 1, at each trial, subjects had to select (click on) one of the unmarked keys
presented on the screen, and were given feedback about the outcomes from both the selected
and unselected keys (complete feedback).
Each subject faced each of the six problems for 50 trials. The order of the problems
was independently randomized for each subject, as well as the order of the keys presented on
the screen. Participants were not given any information about the exact length of the
experiment, but were just told that it would include six distinct phases. In addition,
participants were informed when each problem (phase) had terminated.
3.2 Instructions and payment
Instructions were translated in the local language by native speakers, and appeared on the
screen at the beginning of the experiment both in the local language and in English. The
conversion rate between experimental points and the local currency was communicated at the
beginning of the experiment, and was the same as in Study 1 (one experimental point was
worth 1 TWD, or 0.2 ILS).
Participants were paid according to the amount of experimental points gained during
the experiment. Specifically, participants received a show up fee of 24 Shekels or 120 TWD,
plus a bonus corresponding to the experimental points cumulated in one of the phases
(randomly selected at the end of the experiment).
CULTURAL DIFFERENCES IN DECISIONS FROM EXPERIENCE 17
3.3 Participants
One experimental session was run at the Technion (Haifa, Israel), whereas the other at the
AI-Econ Lab of the National Chengchi University (Taipei, Taiwan). Twenty Israeli students
(9 females, Mage = 24.2 years, age range: 20-28 years) and twenty-two Taiwanese students
(15 females, Mage = 22.5 years, age range: 20-26 years), who did not participate in Study 1,
served as participants in this study.
3.4 Results
Study 2 experimental results are presented in Table 3. Analysis of aggregate choice rates
shows no significant cultural differences. The data from Israel and Taiwan show very similar
risk rates (respectively, M = .34, SD = 0.20, and M = .33, SD = 0.17; F[1, 40] = 0.01, ns),
maximization rates (respectively, M = .52, SD = 0.08, and M = .51, SD = 0.07; F[1, 40] =
0.04 , ns), and underweighting of rare events scores (respectively, M = .15, SD = 0.23, and M
= .16, SD = 0.18; F[1, 40] = 0.02, ns).8 As already observed in Ert and Erev (2007) (see also
Grosskopf et al., 2006), the joint effect of an increase in the number of available alternatives
and of the tendency to select the alternative with the highest recent outcome dramatically
lowers the tendency to underweight rare positive outcomes. However, in both cultures, the
underweighting rates are significantly larger than zero (t[19] = 2.90, p = .01, in Israel; and
t[21] = 4.02, p = .001, in Taiwan).
Analysis of the inertia rates shows the robustness of the pattern documented in Study
1 and predicted by the “less consistency in the East” hypothesis. The inertia rate in Taiwan
8 We found no significant gender effects on risk rates (cf. analysis reported in the Supplemental Material).
CULTURAL DIFFERENCES IN DECISIONS FROM EXPERIENCE 18
(M = .43, SD = 0.19) is smaller than that in Israel (M = .55, SD = 0.19). In the current study,
this effect is significant at the 5% level in a one-tail test, t(40) = 2.01, p = .03.9
Analysis of the best reply rates reveals a reversal of the pattern documented in Study
1. The best reply rate averaged over all problems is .41 (SD = 0.13) in Taiwan, and .53 (SD =
0.21) in Israel. This difference is significant, F(1, 40) = 4.80, p = .03, η2 = .11, and robust:
The best reply rates in Taiwan are smaller than the rates in Israel in all six problems. Thus, in
the current context, our generalization of Ji et al. (2001) finding is accurate: The results
suggest that the subjects from Taiwan behaved as if they expected more changes in the
environment. The difference between the two locations is particularly clear in the multi-
alternative problems (7.24, and 8.24). The best reply rate in these problems is .31 (SD =
0.28) in Israel, and .17 (SD = 0.16) in Taiwan. This result suggests that the inconsistency
between Study 1 results and the “expecting more changes in the East” pattern documented in
Study 2 (as well as in Ji et al., 2001) is not a reflection of a qualitative difference between
prediction tasks and decisions from experience. Rather, the relationship between the
expectation of changes and the tendency to best reply to the most recent outcome is likely to
depend on subjects’ beliefs about the nature of the current state of nature, and these belief can
be creative. Thus, it is not easy to predict the impact of this hypothetical cultural difference
in the context of decisions from experience.
---
Table 3
---
9 The marginal significance of this result in a two-tail t test might be due to the limited number of subjects
involved in this study. However, we refer to this effect as “robust” in the sense that we observed consistently
lower inertia rates for the Taiwanese participants across all three studies.
CULTURAL DIFFERENCES IN DECISIONS FROM EXPERIENCE 19
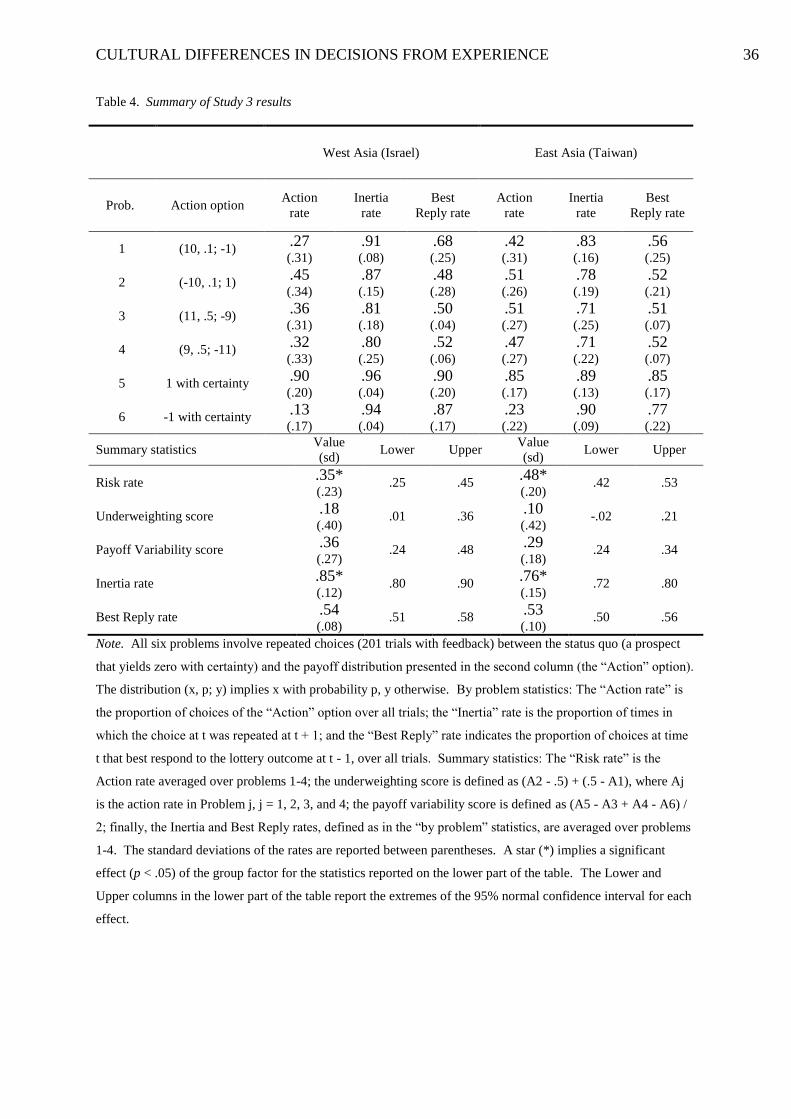
4. Study 3
Study 3 was designed to test a non-obvious implication of the “less consistency in the East”
hypothesis on risk behavior when feedback information is limited to the obtained outcome.
Specifically, this third experimental study was identical to Study 1, but for the fact that, at
each trial, participants were given feedback only about the outcome from the selected key (as
in a 2-armed bandit problem).
Previous research has shown that when the feedback is limited to the obtained
outcome, learning increases risk aversion (Denrell & March, 2001; Denrell, 2007; Erev and
Haruvy, 2014). This phenomenon, known as the hot stove effect, is a consequence of the fact
that bad payoffs from a particular option reduce the probability of choosing this option in the
future and of collecting more information about its value. In contrast, good payoffs increase
the probability of collecting more information. The slower adaptation after bad payoffs
implies that the impact of bad payoffs is expected to last longer than the impact of good
outcomes. For example, a sequence of -9 outcomes from the action option in Problem 3 can
lead subjects to stop choosing this attractive action and believe that its expected value is
negative. When feedback is limited to the obtained payoff, this belief will not be revised
unless the subjects choose to explore this apparently unattractive option again.
Notice that this logic implies that frequent changes in choice behavior are expected to
reduce the hot stove effect, as they would facilitate the collection of additional information
about the risky alternative. Therefore, when feedback is limited to the obtained payoff, the
frequent changes in the preferred alternative implied by the hypothesis of “less consistency in
the East” is expected to lead to a comparatively lower level of risk aversion in the East.
Study 3 tests this prediction.
CULTURAL DIFFERENCES IN DECISIONS FROM EXPERIENCE 20
4.1 Design, instructions, and payment
The design was identical to that of Study 1, with the only exception that feedback was limited
to the payoff from the selected key (partial feedback).
4.2 Participants
One experimental session was run at the Technion (Haifa, Israel), whereas the other at the
AI-Econ Lab of the National Chengchi University (Taipei, Taiwan). Twenty Israeli students
(5 females, Mage = 23.8 years, age range: 19-32 years) and forty-eight Taiwanese students (34
females, Mage = 21.9 years, age range: 19-32 years), who did not participate in either of the
previous experiments, served as participants in this study.
4.3 Results
The experimental data reported in Table 4 confirm the implication of the “less consistency in
the East” hypothesis mentioned earlier. That is, in comparison to the full feedback design
adopted in Study 1, limiting feedback information to the outcome from the selected key
reveals cultural differences in risk attitudes: In Study 3, we observe a significantly higher
propensity to take risk in Taiwan (M = .48, SD = 0.20) than in Israel (M = .35, SD = 0.23),
F(1, 66) = 5.01, p = .03, η2 = .07.10 In addition, comparison with the results from Study 1
suggests a stronger hot stove effect in Israel than in Taiwan, i.e., a stronger tendency by
Israeli participants to avoid the Action choice after a negative outcome. This effect can be
quantified, within each cultural group, by the difference between the risk rate under the
complete and partial feedback conditions. The hot stove score is 0.12 (SD = 0.20) in Israel,
and 0.002 in Taiwan (SD = 0.16). Although the observed differences in the risk rates support
10 We found no indication for gender effects on choice behavior (cf. analysis reported in the Supplemental
Material).
CULTURAL DIFFERENCES IN DECISIONS FROM EXPERIENCE 21
our conjecture, a two-way analysis of variance only indicates a marginal interaction effect of
the feedback and group factors, F(1, 143) = 3.64, p = 0.06, and the main effects of group and
feedback are not significant.
Confirming the pattern observed in the previous two studies, the inertia rate for the
Taiwanese participants (M = .76, SD = 0.15) is significantly lower than that observed for the
Israeli (M = .85, SD = 0.12), F(1, 66) = 5.39, p = .02, η2 = .08. The lower inertia rate
confirms that the higher risk rate observed for the Taiwanese participants can be explained by
a stronger propensity to explore more the two alternatives. This comparatively higher
propensity to exploration is compatible with the stronger propensity to dialectical thinking
documented in East Asian cultures.
Comparison of the best reply rates shows similar values in the two cultures. This rate
is .54 (SD = 0.08) in Israel, and .53 (SD = 0.10) in Taiwan. The difference across the two
groups is not significant, F(1, 66) = 0.41, ns. This similarity is consistent with the hypothesis
that, in simple two-outcome two-alternative choice tasks, Easterners do not expect more
changes in the trends than do Westerners.
In addition, limiting feedback information similarly increases the weighting of the rare
events in the two groups. A two-way analysis of variance of the underweighting scores in
Studies 1 and 3 shows a significant main effect of the feedback factor, F(1, 143) = 33.19, p <
.001, whereas the main effect of the group factor and the interaction effect of the group and
feedback factors are not significant.
---
Table 4
---
CULTURAL DIFFERENCES IN DECISIONS FROM EXPERIENCE 22
5. General Discussion
The current paper investigates the effect of two change-related cultural differences that were
documented in previous studies comparing judgments by individuals from East Asian and
Western cultures. The first implies that East Asians are more likely to change their behavior
over time, whereas the second implies that they expect more changes in the environment.
The two cultural differences are similar in the sense that they can be described as reflections
of the higher degree of tolerance to contradictory pieces of information, or dialectical
thinking, featuring East Asian cultures (see Peng & Nisbett, 1999, Wallsten & Gu, 2003, and
Ji et al., 2001). Yet, in the context of decisions from experience, they lead to different
predictions.
The present investigation shows that the “less consistency in the East” hypothesis has
a high predictive value. The pattern predicted by this hypothesis was documented in all three
studies, and in Study 3 it correctly predicts the non-trivial effect of limited feedback: When
the feedback is limited to the obtained payoff, the participants from Taiwan exhibit less risk
aversion than the Israeli.
Our analysis of the hypothesis “expecting more changes in the East” reveals mixed
results. The results of Study 1 reveal higher best reply rates in Taiwan than in Israel. Thus,
they seem to indicate expectation of fewer changes by Easterners. In contrast, Study 2 results
show lower best reply rates in Taiwan, whereas Study 3 results document similar best reply
rates in the two locations. These results suggest that it is not easy to derive the prediction of
the hypothesis of “expecting more changes in the East” in the context of decisions from
experience. The implications of “expecting more changes” depend on subjects’ beliefs
concerning the current state of nature, and it seems that these beliefs are creative and highly
sensitive to the small differences between our experiments.
CULTURAL DIFFERENCES IN DECISIONS FROM EXPERIENCE 23
We also find that the basic properties of decisions from experience (i.e., the
documented tendency to underweight rare events, the payoff variability effect, and the larger
tendency to inertia than to best reply in choice behavior) appear to be robust to the cultural
background. These properties of experiential decision-making, in particular the tendency to
underweight small probability events, have been shown to have important practical
implications for policy making and mechanism design in Western culture contexts (e.g., see
studies on enforcement of safety rules at the work-place or of safe medical procedures, as
pointed out in Erev & Roth, 2014).
The high predictive value of the “less consistency in the East” hypothesis prompts the
question of what are the psychological processes that underlie it. In particular, in what terms
is dialecticism likely to affect choice behavior in our experimental settings? Our favorite
answer rests on two observations. First, previous research show that the main properties of
decisions from experience can be captured with the assumption that people try to select the
option that led to the best payoff in similar situations in the past (see Gonzalez et al., 2003;
Erev & Haruvy, 2015). Second, studies of dialecticism suggest that this is a rather broad
concept that refers to a whole set of lay beliefs by people from Asian cultures, including not
only tolerance for contradiction and the expectation of change, but also holistic thinking and
cognition (Spencer-Rodgers et al., 2009 and 2010). Indeed, previous cross cultural studies
(e.g., Nisbett & Norenzayan, 2002, and Dong & Lee, 2008) have shown that dialecticism also
affects the way people collect and process visual information: Whereas East Asians tend to
pay more attention to the entire context/field and to its causal relations (holistic style of
cognition), Westerners tend to detach objects from their field and pay less attention to the
entire field (analytic style of cognition). Thus, it is possible that dialectical thinking reduces
consistency in decisions from experience, as it increases the variety of the criteria subjects
can use to judge similarity between present and past experiences.
CULTURAL DIFFERENCES IN DECISIONS FROM EXPERIENCE 24
Hsee and Weber (1999) explained the stronger risk seeking tendency in the PRC with
the cushion hypothesis. According to this hypothesis, compared to an individualistic society,
people in mainland China are more likely to receive financial help if they are in need, and, for
this reason, are less risk averse. Our results from Study 3 complement this observation by
highlighting another possible contributor, i.e., explorative behavior, for the lower risk
aversion observed in East Asia.
One attractive feature of the current results is that they clarify the relationship
between cultural differences in judgment confidence and in risk attitudes. Previous studies of
these issues reveal three phenomena that appear to be inconsistent. First, as noted above,
Yates et al (1989) found that Chinese subjects exhibit more overconfidence in probability
judgments. For example, when their Chinese subjects estimated that the probability that they
have provided the correct answer by 90%, they were only correct in 60% of the cases; the
American exhibited weaker overconfidence: Their 90% estimates were accurate in 75% of
the cases. Second, Hsee and Weber (1999) found higher tendency to take risk in China than
in the USA (although this cultural difference appears to hold only in the financial domain; see
Weber et al., 1998). Finally, Yates et al. (1997) found that the fact that Chinese state they are
highly confident in the correctness of their answers does not imply that they are willing to
pay more (than Americans) for gambles that yield a gain if they are in fact correct. Thus,
relative to their overconfidence, Chinese take less risk than Americans. The current analysis
highlights the same sufficient condition to all three phenomena. The hypothesis that
individuals from East Asian cultures are more likely to change their opinion is a sufficient
condition for overconfidence (see Wallsten and Gu, 2003), masks different risk preferences
across cultures (as shown in Study 3), and also implies less confidence in the accuracy of
previously expressed opinions.
CULTURAL DIFFERENCES IN DECISIONS FROM EXPERIENCE 25
In summary, the current analysis shows that the hypothesis that individuals from East
Asian cultures are likely to change their behavior over time has high predictive value.
Previous research shows that this hypothesis can explain, for example, why Chinese subjects
appear to be more overconfident than North Americans. The present results show the
robustness of the stronger tendency to change in the East in three decisions from experience
studies, and that this tendency correctly predicts less risk aversion by Asian participants when
feedback is limited to obtained payoffs.
CULTURAL DIFFERENCES IN DECISIONS FROM EXPERIENCE 26
Acknowledgements
This research was supported by the Max Wertheimer Minerva Center, a grant from the Israel
Science Foundation, a grant from the “Fonds de la Recherche Fondamentale Collective”
(grant no. 2.4614.12), and a grant from the National Science Council of Taiwan (grant no.
101-2410-H-004-002). The valuable assistance of Heng-Hui Lin in the collection of data is
gratefully acknowledged.
CULTURAL DIFFERENCES IN DECISIONS FROM EXPERIENCE 27
References
Barron, G., & Erev, I. (2003). Small feedback-based decisions and their limited
correspondence to description-based decisions. Journal of Behavioral Decision
Making, 16, 215-233
Barron, G., & Ursino, G. (2013). Underweighting rare events in experience based decisions:
Beyond sample error. Journal of Economic Psychology, 39, 278-286
Busemeyer, J. R., & Townsend, J. T. (1993). Decision field theory: A dynamic-cognitive
approach to decision making in an uncertain environment. Psychological Review, 100,
432-459
Camerer, C., & Hua Ho, T. (1999). Experience‐weighted Attraction Learning in Normal
Form Games. Econometrica, 67, 827-874
Danziger, S., Hadar, L., & Morwitz, V. G. (2014). Retailer pricing strategy and consumer
choice under price uncertainty. Journal of Consumer Research, 41, 761-774
Denrell, J. (2007). Adaptive Learning and Risk Taking. Psychological Review, 114, 177-187
Denrell, J., & March, J. G. (2001). Adaptation as information restriction: The hot stove effect.
Organization Science, 12, 523-538
Di Guida, S., Marchiori, D., & Erev, I. (2012). Decisions among defaults and the effect of the
option to do nothing. Economics Letters, 117, 790-793
Dong, Y., & Lee, K. P. (2008). A cross-cultural comparative study of users’ perceptions of a
webpage: With a focus on the cognitive styles of Chinese, Koreans and Americans.
International Journal of Design, 2, 19-30.
Erev, I., Ert, E., Roth, A. E., Haruvy, H., Herzog, S. M., Hau, R. , Hertwig, R., Stewart, T.,
West, R., & Lebiere, C. (2010). A choice Prediction Competition: Choices from
Experience and from Description. Journal of Behavioral Decision Making, 23, 15-47
CULTURAL DIFFERENCES IN DECISIONS FROM EXPERIENCE 28
Erev, I., Haruvy, E. (2014). Learning and the economics of small decisions. Invited chapter
submitted to Kagel, J.H. and Roth, A.E. (Eds.), The Handbook of Experimental
Economics. Princeton University Press.
http://www.utdallas.edu/~eeh017200/papers/LearningChapter.pdf
Erev, I., & Roth, A. E. (1998). Predicting how people play games: Reinforcement learning in
experimental games with unique, mixed strategy equilibria. American Economic
Review, 88, 848-881
Erev, I., & Roth, A. E. (2014). Maximization, Learning and Economic Behavior. PNAS, 111,
10818–10825.
Ert, E., & Erev, I. (2007). Replicated alternatives and the role of confusion, chasing, and
regret in decisions from experience. Journal of Behavioral Decision Making, 20, 305-
322
Grosskopf, B., Erev, I., & Yechiam, E. (2006). Foregone with the wind: Indirect payoff
information and its implications for choice. International Journal of Game Theory,
34, 285-302
Gonzalez, C., Lerch, J. F., & Lebiere, C. (2003). Instance-based learning in dynamic decision
making. Cognitive Science, 27, 591-635
Henrich, J., Heine, S. J., & Norenzayan, A. (2010). The weirdest people in the world?
Behavioral and Brain Sciences, 33, 61-83
Hertwig, R., Barron, G., Weber, E. U., & Erev, I. (2004). Decisions from experience and the
effect of rare events in risky choice. Psychological Science, 15, 534-539
Hertwig, R., & Erev, I. (2009). The description-experience gap in risky choice. Trends in
Cognitive Sciences, 13, 517-523
Hsee, C. K., & Weber, E. U. (1999). Cross-national differences in risk preferences and lay
predictions. Journal of Behavioral Decision Making, 12, 165-179
CULTURAL DIFFERENCES IN DECISIONS FROM EXPERIENCE 29
Ji, L.-J., Guo, T., Zhang, Z., & Messervey, D. (2009). Looking into the past: Cultural
differences in perception and representation of past information. Journal of
Personality and Social Psychology, 96, 761-769
Ji, L.-J., Nisbett, R E., & Su, Y. (2001). Culture, Change, and Prediction. Psychological
Science, 12, 450-456
Ji, L.-J., Zhang, Z., & Guo, T. (2008). To buy or to sell: Cultural differences in stock market
decisions based on price trends. Journal of Behavioral Decision Making, 21, 399-413
Marchiori, D., & Warglien, M. (2008). Predicting human interactive learning by regret-driven
neural networks. Science, 319, 1111-1113
Myers, J. L., & Sadler, E. (1960). Effects of range of payoffs as a variable in risk taking.
Journal of Experimental Psychology, 60, 306-309
Nisbett, R. E., & Norenzayan, A. (2002). Culture and cognition. In H. Pashler & D. L. Medin
(Eds.), Stevens Handbook of Experimental Psychology : Cognition (3d Ed., Vol. 2)
(pp. 561-597). New York: John Wiley & Sons.
Peng, K., & Nisbett, R. E. (1999). Culture, Dialectics, and Reasoning about Contradiction.
American Psychologist, 54, 741-754
Rakow, T., & Newell, B. R. (2010). Degrees of uncertainty: An overview and framework for
future research on experience‐based choice. Journal of Behavioral Decision Making,
23, 1-14
Rapoport, A., & Budescu, D. (1997). Randomization in individual choice behavior.
Psychological Review, 104, 603-617
Shafir, S., Reich, T., Tsur, E., Erev, I., & Lotem, A. (2008). Perceptual accuracy and
conflicting effects of certainty on risk-taking behaviour. Nature, 453, 917-920
CULTURAL DIFFERENCES IN DECISIONS FROM EXPERIENCE 30
Spencer-Rodgers, J., Boucher, H. C., Mori, S. C., Wang, L., & Peng, K. (2009). The
dialectical self-concept: Contradiction, change, and holism in East Asian cultures.
Personality and Social Psychology Bulletin, 35, 29-44
Spencer-Rodgers, J., Williams, M. J., & Peng, K. (2010). Cultural Differences in
Expectations of Change and Tolerance for Contradiction: A Decade of Empirical
Research. Personality and Social Psychology Review, 14, 296-312
Ungemach, C., Chater, N., & Stewart, N. (2009). Are probabilities overweighted or
underweighted when rare outcomes are experienced (rarely)? Psychological Science,
20, 473-479
Wallsten, T. S., & Gu, H. (2003). Distinguishing choice and subjective probability estimation
processes: Implications for theories of judgment and for cross-cultural comparisons.
Organizational Behavior and Human Decision Processes, 90, 111-123
Weber, E. U., Hsee, C. K., & Sokolowska, J. (1998). What Folklore Tells Us about Risk and
Risk Taking: Cross-Cultural Comparisons of American, German, and Chinese
Proverbs. Organizational Behavior and Human Decision Processes, 75, 170-186
Yates, J. F., Lee, J.-W., & Bush, J. G. (1997). General knowledge overconfidence: Cross-
national variations, response style, and “reality”. Organizational Behavior and
Human Decision Processes, 70, 87-94
Yates, J. F., Lee, J.-W., Shinotsuka, H., Patalano, A. L., & Sieck, W. R. (1998). Cross-
Cultural Variations in Probability Judgment Accuracy: Beyond General Knowledge
Overconfidence? Organizational Behavior and Human Decision Processes, 74, 89-
117
Yates, J. F., Zhu, Y., Ronis, D. L., Wang, D. F., Shinotsuka, H., & Toda, M. (1989).
Probability judgment accuracy: China, Japan, and the United States. Organizational
Behavior and Human Decision Processes, 43, 145-171
CULTURAL DIFFERENCES IN DECISIONS FROM EXPERIENCE 31
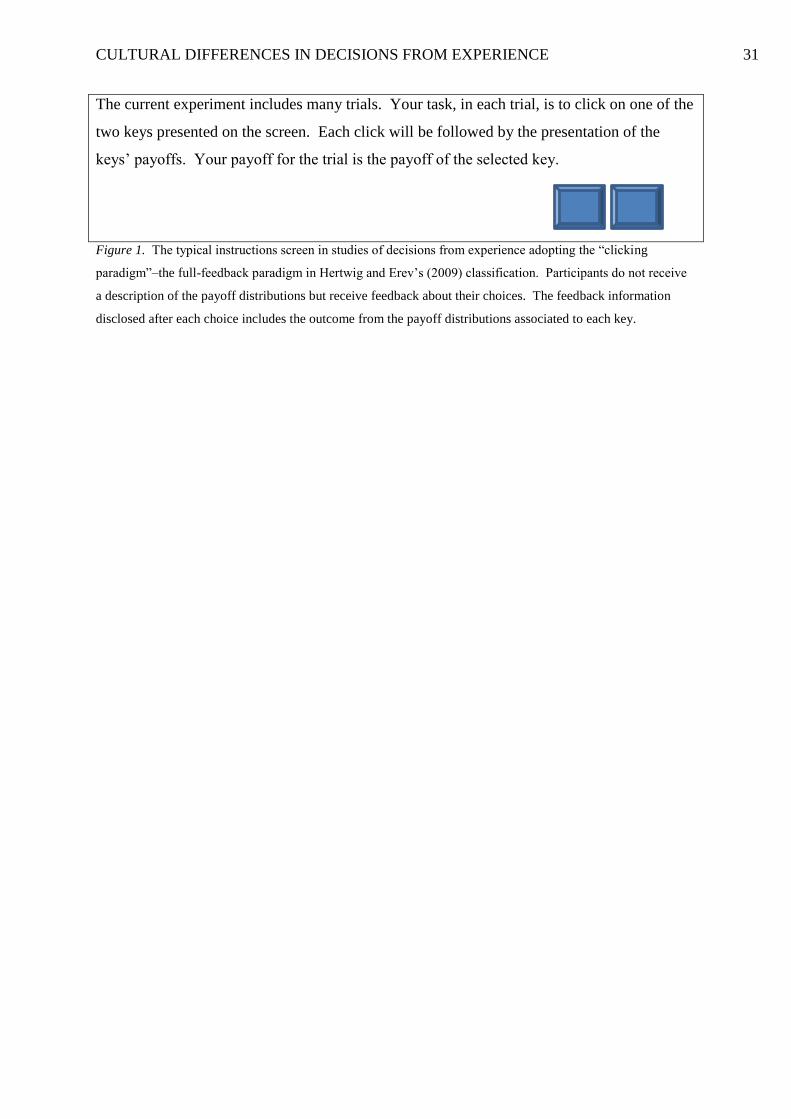
The current experiment includes many trials. Your task, in each trial, is to click on one of the
two keys presented on the screen. Each click will be followed by the presentation of the
keys’ payoffs. Your payoff for the trial is the payoff of the selected key.
Figure 1. The typical instructions screen in studies of decisions from experience adopting the “clicking
paradigm”–the full-feedback paradigm in Hertwig and Erev’s (2009) classification. Participants do not receive
a description of the payoff distributions but receive feedback about their choices. The feedback information
disclosed after each choice includes the outcome from the payoff distributions associated to each key.
CULTURAL DIFFERENCES IN DECISIONS FROM EXPERIENCE 32
Figure 2. Sample screenshots from Experiment 2 after the first choice in the three experimental conditions
(with, respectively, 0, 2, and 24 replicas for each alternative). The selected key is highlighted with a white
background.
CULTURAL DIFFERENCES IN DECISIONS FROM EXPERIENCE 33
Table 1. Re-analysis of behavioral data from experiments that examined choice behavior in the six conditions
using the clicking paradigm described in Figure 1 (Erev & Haruvy, 2014, and Di Guida et al., 2012)
Technion Data
Problem Action option Expected Value Action
rate
Inertia
rate
Best Reply
rate
Number of
observations
1 (10, .1; -1) +0.1 .27 (.24)
.87 (.12)
.69 (.20)
158
2 (-10, .1; 1) -0.1 .57 (.29)
.82 (.16)
.56 (.24)
158
3 (11, .5; -9) +1 .50 (.31)
.76 (.18)
.52 (.14)
50
4 (9, .5; -11) -1 .36 (.27)
.77 (.19)
.60 (.13)
50
5 1 with certainty +1 .95 (.11)
.97 (.06)
.95 (.11)
50
6 -1 with certainty -1 .03 (.11)
.99 (.02)
.98 (.11)
30
Summary statistics Value
(sd) Lower Upper
Number of
observations
Risk rate .43 (.19)
.40 .46 178
Underweighting score .33 (.27)
.25 .40 50
Payoff Variability score .38 (.19)
.33 .43 50
Inertia rate .82 (.14)
.80 .84 178
Best Reply rate .62 (.15)
.60 .65 178
Note. All six problems involve repeated choices (100 to 200 trials) between the status quo (a prospect that
yields zero with certainty) and the payoff distribution presented in the second column (the “Action” option).
The distribution (x, p; y) implies x with probability p, y otherwise. By problem statistics: The “Action rate” is
the proportion of choices of the “Action” option over all trials; the “Inertia” rate is the proportion of times in
which the choice at t was repeated at t + 1; and the “Best Reply” rate indicates the proportion of choices at time
t that best respond to the lottery outcome at t - 1, over all trials. Summary statistics: The “Risk rate” is the
Action rate averaged over problems 1-4; the underweighting score is defined as (A2 - .5) + (.5 - A1), where Aj
is the action rate in Problem j, j = 1, 2, 3, and 4; the payoff variability score is defined as (A5 - A3 + A4 - A6) /
2, or as A5 - A3 for those participants who did not play Problem 6; finally, the Inertia and Best Reply rates,
defined as in the “by problem” statistics, are averaged over problems 1-4. The standard deviations of the rates
are reported between parentheses. The Lower and Upper columns in the lower part of the table report the
extremes of the 95% normal confidence interval for each effect.
CULTURAL DIFFERENCES IN DECISIONS FROM EXPERIENCE 34
Table 2. Summary of Study 1 results
West Europe (Denmark) West Asia (Israel) East Asia (Taiwan)
Prob. Action option Action
rate
Inertia
rate
Best
Reply
rate
Action
rate
Inertia
rate
Best
Reply
rate
Action
rate
Inertia
rate
Best
Reply
rate
1 (10, .1; -1) .21
(.18)
.90
(.06)
.76
(.17)
.27 (.29)
.87 (.14)
.73 (.26)
.22
(.20)
.86
(.09)
.80
(.20)
2 (-10, .1; 1) .67 (.23)
.82 (.14)
.67 (.21)
.70 (.28)
.82 (.13)
.72 (.27)
.75 (.24)
.82 (.14)
.80 (.24)
3 (11, .5; -9) .46 (.21)
.65 (.15)
.70 (.18)
.47 (.25)
.67 (.19)
.71 (.21)
.51 (.16)
.59 (.15)
.78 (.20)
4 (9, .5; -11) .34 (.19)
.70 (.17)
.62 (.14)
.45 (.22)
.64 (.18)
.73 (.21)
.44 (.13)
.57 (.14)
.80 (.19)
5 1 with
certainty .91 (.21)
.95 (.16)
.91 (.21)
.89 (.26)
.95 (.13)
.89 (.26)
.89 (.23)
.94 (.14)
.89 (.23)
6 -1 with
certainty .15 (.30)
.97 (.07)
.86 (.30)
.12 (.23)
.95 (.16)
.88 (.23)
.09 (.20)
.97 (.08)
.91 (.20)
Summary statistics Value
(sd) Lower Upper
Value
(sd) Lower Upper
Value
(sd) Lower Upper
Risk rate .42 (.13)
.38 .46 .47 (.18)
.41 .54 .48 (.12)
.45 .51
Underweighting score .46 (.32)
.34 .56 .43 (.39)
.29 .57 .53 (.35)
.43 .63
Payoff variability score .32 (.25)
.24 .41 .38 (.21)
.30 .45 .37 (.22)
.31 .43
Inertia rate .77* (.08)
.74 .80 .75 (.12)
.66 .79 .71* (.10)
.68 .74
Best Reply rate .68* (.12)
.64 .73 .72 (.18)
.71 .79 .79* (.18)
.74 .84
Note. All six problems involve repeated choices (201 trials with feedback) between the status quo (a prospect
that yields zero with certainty) and the payoff distribution presented in the second column (the “Action” option).
The distribution (x, p; y) implies x with probability p, y otherwise. By problem statistics: The “Action rate” is
the proportion of choices of the “Action” option over all trials; the “Inertia” rate is the proportion of times in
which the choice at t was repeated at t + 1; and the “Best Reply” rate indicates the proportion of choices at time
t that best respond to the lottery outcome at t - 1, over all trials. Summary statistics: The “Risk rate” is the
Action rate averaged over problems 1-4; the underweighting score is defined as (A2 - .5) + (.5 - A1), where Aj
is the action rate in Problem j, j = 1, 2, 3, and 4; the payoff variability score is defined as (A5 - A3 + A4 - A6) /
2; finally, the Inertia and Best Reply rates, defined as in the “by problem” statistics, are averaged over problems
1-4. The standard deviations of the rates are reported between parentheses. A star (*) implies a significant
effect (p < .05) of the group factor for the statistics reported on the lower part of the table. The Lower and
Upper columns in the lower part of the table report the extremes of the 95% normal confidence interval for each
effect.
CULTURAL DIFFERENCES IN DECISIONS FROM EXPERIENCE 35
Table 3. Summary of Study 2 results
West Asia (Israel) East Asia (Taiwan)
Prob. Basic alternatives
Number
of
replicas
R rate Inertia
rate
Best
Reply
rate
R rate Inertia
rate
Best
Reply
rate
7.1 R: (32, .09; 0)
S: A draw from {1, 2, 3, 4, 5} 0
.20 (.24)
.90 (.09)
.79 (.22)
.29 (.27)
.80 (.14)
.68 (.24)
8.1 R: (32, .1; 0)
S: A draw from {1, 2, 3, 4, 5} 0
.20 (.24)
.89 (.10)
.79 (.24)
.33 (21)
.69 (.19)
.68 (.20)
7.3 R: (32, .09; 0)
S: A draw from {1, 2, 3, 4, 5} 2
.24 (.19)
.42 (.29)
.52 (26)
.26 (.19)
.32 (.29)
.38 (.16)
8.3 R: (32, .1; 0)
S: A draw from {1, 2, 3, 4, 5} 2
.32 (.28)
.50 (.35)
.45 (.29)
.30 (.24)
.29 (.25)
.37 (.17)
7.25 R: (32, .09; 0)
S: A draw from {1, 2, 3, 4, 5} 24
.52 (.32)
.32 (.34)
.30 (.30)
.40 (.32)
.25 (.29)
.17 (.18)
8.25 R: (32, .1; 0)
S: A draw from {1, 2, 3, 4, 5} 24
.54 (.32)
.25 (.25)
.32 (.32)
.40 (.31)
.22 (.31)
.18 (.15)
Summary statistics Value
(sd) Lower Upper
Value
(sd) Lower Upper
Risk rate .34 (.20)
.25 .42 .33 (.17)
.26 .40
Maximization rate .52 (.08)
.48 .55 .51 (.07)
.49 .54
Underweighting score .15 (23)
.05 .25 .16 (.18)
.08 .23
Inertia rate .55 . (.19)
.46 .63 .43 . (.19)
.35 .51
Best Reply rate .53* (.21)
.44 .62 .41* (.13)
.36 .47
Note. The risk, inertia, and best reply rates are computed over all six replica treatments. By problem statistics:
The “R rate” is the proportion of choices of the “R” option over all trials; the “Inertia” rate is the proportion of
times in which the choice at t was repeated at t + 1, over all trials; and the “Best Reply” rate indicates the
proportion of choices at time t that best respond to the lottery outcome at t - 1, over all trials. Summary
statistics: The “Risk rate” is the R rate averaged over problems 1-6; the “Maximization rate” is the rate of
expected payoff maximizing choices (i.e., S in problems 7.* and R in problems 8.*) in problems 1-6; the
underweighting score is defined as 0.5 - P(R in problems 8.1, 8.3, and 8.25); finally, the Inertia and Best Reply
rates, defined as in the “by problem” statistics, are averaged over problems 1-6. For the four statistics reported
on the lower part of the table, a star (*) indicates that the group factor is significant at the 5% confidence level,
whereas a dot (.) indicates significance at the 10% confidence level. The Lower and Upper columns in the
lower part of the table report the extremes of the 95% normal confidence interval for each effect.
CULTURAL DIFFERENCES IN DECISIONS FROM EXPERIENCE 36
Table 4. Summary of Study 3 results
West Asia (Israel) East Asia (Taiwan)
Prob. Action option Action
rate
Inertia
rate
Best
Reply rate
Action
rate
Inertia
rate
Best
Reply rate
1 (10, .1; -1) .27 (.31)
.91 (.08)
.68 (.25)
.42
(.31)
.83
(.16)
.56
(.25)
2 (-10, .1; 1) .45 (.34)
.87 (.15)
.48 (.28)
.51 (.26)
.78 (.19)
.52 (.21)
3 (11, .5; -9) .36 (.31)
.81 (.18)
.50 (.04)
.51 (.27)
.71 (.25)
.51 (.07)
4 (9, .5; -11) .32 (.33)
.80 (.25)
.52 (.06)
.47 (.27)
.71 (.22)
.52 (.07)
5 1 with certainty .90 (.20)
.96 (.04)
.90 (.20)
.85 (.17)
.89 (.13)
.85 (.17)
6 -1 with certainty .13 (.17)
.94 (.04)
.87 (.17)
.23 (.22)
.90 (.09)
.77 (.22)
Summary statistics Value
(sd) Lower Upper
Value
(sd) Lower Upper
Risk rate .35* (.23)
.25 .45 .48* (.20)
.42 .53
Underweighting score .18 (.40)
.01 .36 .10 (.42)
-.02 .21
Payoff Variability score .36 (.27)
.24 .48 .29 (.18)
.24 .34
Inertia rate .85* (.12)
.80 .90 .76* (.15)
.72 .80
Best Reply rate .54 (.08)
.51 .58 .53 (.10)
.50 .56
Note. All six problems involve repeated choices (201 trials with feedback) between the status quo (a prospect
that yields zero with certainty) and the payoff distribution presented in the second column (the “Action” option).
The distribution (x, p; y) implies x with probability p, y otherwise. By problem statistics: The “Action rate” is
the proportion of choices of the “Action” option over all trials; the “Inertia” rate is the proportion of times in
which the choice at t was repeated at t + 1; and the “Best Reply” rate indicates the proportion of choices at time
t that best respond to the lottery outcome at t - 1, over all trials. Summary statistics: The “Risk rate” is the
Action rate averaged over problems 1-4; the underweighting score is defined as (A2 - .5) + (.5 - A1), where Aj
is the action rate in Problem j, j = 1, 2, 3, and 4; the payoff variability score is defined as (A5 - A3 + A4 - A6) /
2; finally, the Inertia and Best Reply rates, defined as in the “by problem” statistics, are averaged over problems
1-4. The standard deviations of the rates are reported between parentheses. A star (*) implies a significant
effect (p < .05) of the group factor for the statistics reported on the lower part of the table. The Lower and
Upper columns in the lower part of the table report the extremes of the 95% normal confidence interval for each
effect.
CULTURAL DIFFERENCES IN DECISIONS FROM EXPERIENCE 37
APPENDIX
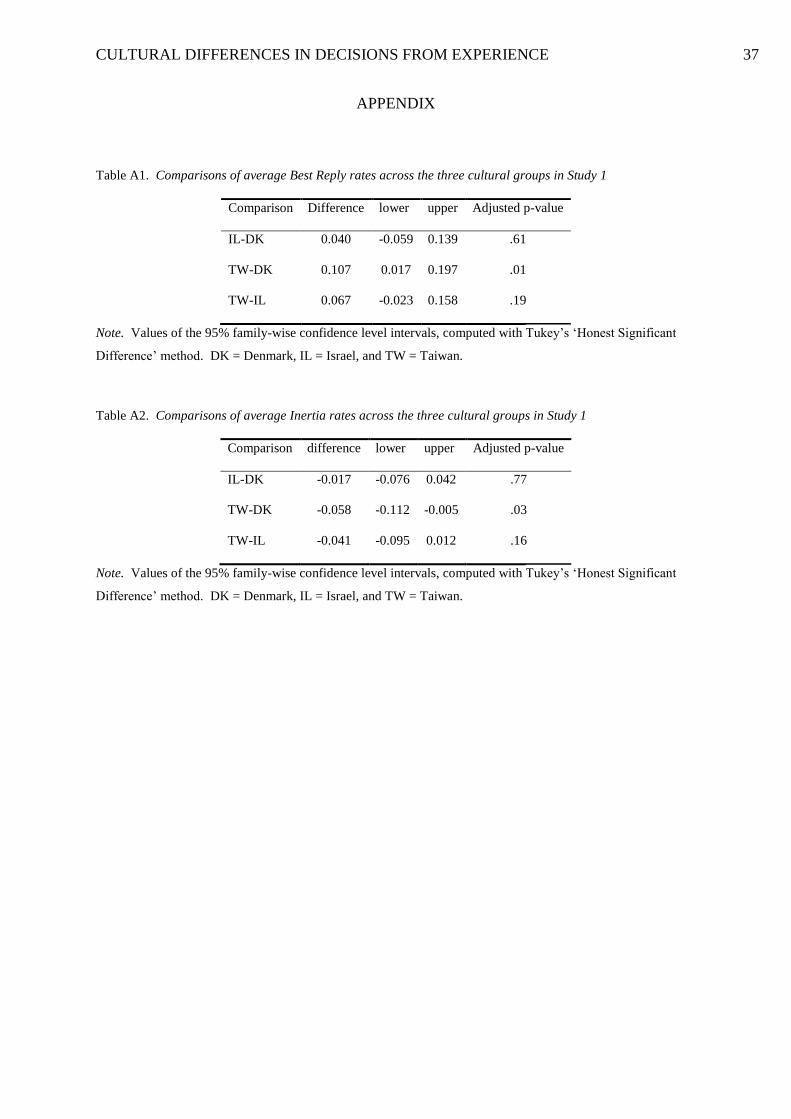
Table A1. Comparisons of average Best Reply rates across the three cultural groups in Study 1
Comparison Difference lower upper Adjusted p-value
IL-DK 0.040 -0.059 0.139 .61
TW-DK 0.107 0.017 0.197 .01
TW-IL 0.067 -0.023 0.158 .19
Note. Values of the 95% family-wise confidence level intervals, computed with Tukey’s ‘Honest Significant
Difference’ method. DK = Denmark, IL = Israel, and TW = Taiwan.
Table A2. Comparisons of average Inertia rates across the three cultural groups in Study 1
Comparison difference lower upper Adjusted p-value
IL-DK -0.017 -0.076 0.042 .77
TW-DK -0.058 -0.112 -0.005 .03
TW-IL -0.041 -0.095 0.012 .16
Note. Values of the 95% family-wise confidence level intervals, computed with Tukey’s ‘Honest Significant
Difference’ method. DK = Denmark, IL = Israel, and TW = Taiwan.
Related Documents