Andrew Noble Deputy Director General-Research NENA REGIONAL STAKEHOLDERS WORKSHOP 27-29 Oct 2015, Cairo, Egypt

Welcome message from author
This document is posted to help you gain knowledge. Please leave a comment to let me know what you think about it! Share it to your friends and learn new things together.
Transcript

Andrew Noble Deputy Director General-Research
NENA REGIONAL STAKEHOLDERS WORKSHOP
27-29 Oct 2015, Cairo, Egypt

Remote Sensing: A transformative technology: • Multi-sensor and multi-scale observations
of carbon (biomass, yield); • Water productivity (WUE, WPM), water
accounting • Surface energy fluxes (G×E, stress)
Scale pixel to landscape Productivity of Croplands, Grasslands; Livestock and Trees Based
Systems; Quantification of Traits/Integrated Breeding; Land Degradation and Desertification; Extreme Events, Climate Change and
Resilience
Integrated Earth Observation System

Water Productivity
Net/Gross Return WP = Unit of water consumed
Biomass, grain, meat/milk (kg) Income ($) Environmental benefits (C) Social benefits (employment) Energy (Cal) Nutrition (protein, carbs, fat)
Evaporation Transpiration Quality
/pixel)mor /m(m ETor useWater
($) valueeconomicor kg/pixel)or (kg/m Yield )(kg/m WP
323
actual
23
Concept and Methods
Return: Yield, Biomass, GPP: RS and Insitu Observation using Biophysical/Biospectral, and VPM models

Scale Matters
Assuming 25 units of surface + subsurface losses
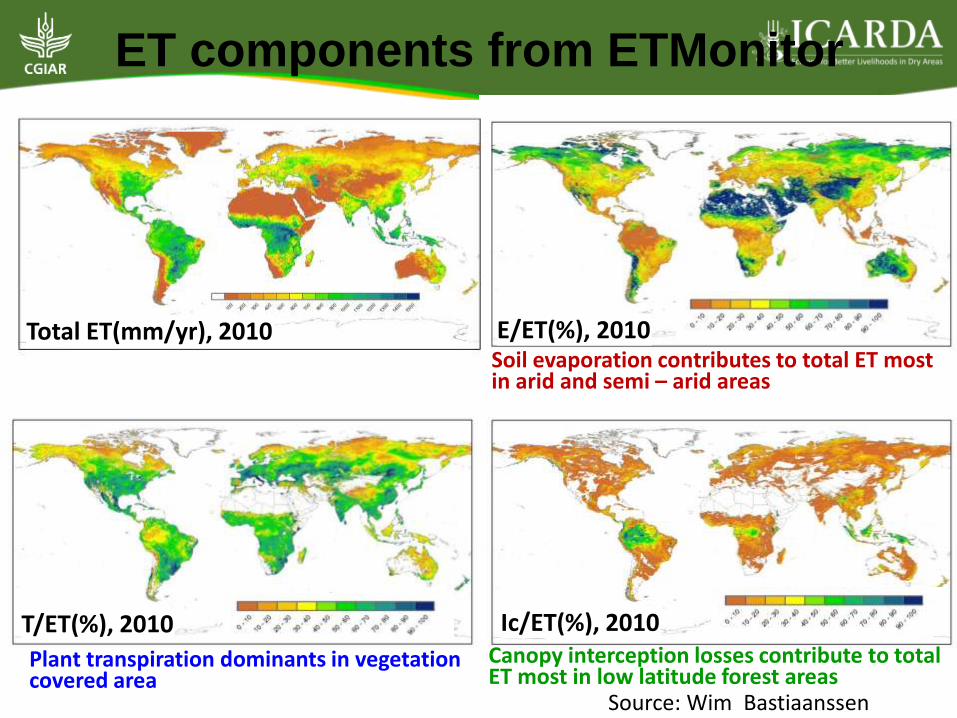
ET components from ETMonitor
E/ET(%), 2010
Ic/ET(%), 2010 T/ET(%), 2010
Total ET(mm/yr), 2010
Plant transpiration dominants in vegetation covered area
Soil evaporation contributes to total ET most in arid and semi – arid areas
Canopy interception losses contribute to total ET most in low latitude forest areas
Source: Wim Bastiaanssen

Water Productivity Score – Continental Wheat
Source: Wim Bastiaanssen

WP of Cotton 0.42 kg/m3 0.50 USD/m3
WP of Wheat 0.60 kg/m3 0.33 USD/m3
WP of Rice paddy 0.50 kg/m3 0.10 USD/m3
Water productivity (WP) is defined as the kg of yield produced/m3 of water used or, alternatively, as value in $ of yield produced/m3 of water used.
Good Farm boundaries for better interventions Land and Water Productivity Pixels to Fields
(Biradar et al., 2009)

Looking
East
Looking
South
Looking
West
Looking
North
Field West
North
East
Down
South
Ground Truth Data and Validation: Open Data Kits, Citizen Science/Community RS

Irrigation Development & ET
• 18-year ET estimates from AVHRR indicate persistent increase in ET.
• Increasing trend on average is 4.9 mm/year
y = 4.9x + 581
400
450
500
550
600
650
700
750
800
19
83
-84
19
84
-85
19
85
-86
19
86
-87
19
87
-88
19
88
-89
19
89
-90
19
90
-91
19
91
-92
19
92
-93
19
93
-94
19
94
-95
19
95
-96
19
96
-97
19
97
-98
19
98
-99
19
99
-00
20
00
-01
ET (
mm
/yea
r)
Year
Krishna River Basin-Annual ET
Annual ET Linear (Annual ET)
Source: Teluguntla et al. 2013 ACIAR Krishna Basin Project

Irrigation Development & ET
• The increasing trend is driven by the increase in ET during the dry (Rabi) season.
• This trend is because of irrigation development.
0
10
20
30
40
50
60
70
80
90
Jul-
83
Feb
-84
Sep
-84
Ap
r-8
5
No
v-8
5
Jun
-86
Jan
-87
Au
g-8
7
Mar
-88
Oct
-88
May
-89
De
c-8
9
Jul-
90
Feb
-91
Sep
-91
Ap
r-9
2
No
v-9
2
Jun
-93
Jan
-94
Au
g-9
4
Mar
-95
Oct
-95
May
-96
De
c-9
6
Jul-
97
Feb
-98
Sep
-98
Ap
r-9
9
No
v-9
9
Jun
-00
Jan
-01
Au
g-0
1
ET (
mm
/ m
on
th)
Months
AVHRR-8km ET
AVHRR-8km ET
Source: Teluguntla et al. 2013 ACIAR Krishna Basin Project

Productivity Land degradation Landuse dynamics Yield gaps Droughts/Floods CC and Impact
Mapping and Monitoring Major ALS
Scaling Similarity Prioritization Contexts Ex-ante
Farmscape to Landscapes

#/km2
(Biradar & Xiao, 2010, 2013)
Changing Cropping Systems • Cropping Intensity & Pattern • Land use/land cover change • Dynamics of Crop Fallows • Conservation Agriculture • Climate Change Impact • Input Use Efficiency
Agricultural Intensification
Cropping Intensity
Increase in Arable Land
72%
21% 7%

Land Use Map 2004/05
Irrigation Induced Salinity Control and Reclamation Project
Impact assessment and Ex-ante Analysis Change in Space and Time
Conclusions
• Water Productivity (WP) is an integrating element that goes beyond a simple ratio.
• Scale matters
• Transpiration is fixed – unless we change the physiological attributes of crops.
• E in ET is where gains can be made through management.
Related Documents