FINAL DEGREE PROJECT, IN PROJECT MANAGEMENT AND OPERATIONAL DEVELOPMENT CRITICAL SUCCESS FACTORS FOR EFFECTIVE IMPLEMENTATION OF LEAN ASSESSMENT TOOLS/ FRAMEWORK IN MANUFACTURING INDUSTRIES AUTHOR: PRADNYA BAVISKAR KTH SUPERVISOR: ANNA HORNSTRÖM 17 th August 2015 KTH ROYAL INSTITUTE OF TECHNOLOGY INDUSTRIAL ENGINEERING AND MANAGEMENT, 2015 STOCKHOLM, SWEDEN

Welcome message from author
This document is posted to help you gain knowledge. Please leave a comment to let me know what you think about it! Share it to your friends and learn new things together.
Transcript
FINAL DEGREE PROJECT, IN PROJECT MANAGEMENT AND OPERATIONAL DEVELOPMENT
CRITICAL SUCCESS FACTORS FOR EFFECTIVE IMPLEMENTATION
OF LEAN ASSESSMENT TOOLS/ FRAMEWORK IN
MANUFACTURING INDUSTRIES
AUTHOR: PRADNYA BAVISKAR
KTH SUPERVISOR: ANNA HORNSTRÖM
17th August 2015
KTH ROYAL INSTITUTE OF TECHNOLOGY
INDUSTRIAL ENGINEERING AND MANAGEMENT, 2015
STOCKHOLM, SWEDEN

FINAL DEGREE REPORT - PRADNYA BAVISKAR 1
FINAL DEGREE REPORT - PRADNYA BAVISKAR 2
EXECUTIVE SUMMARY
Research Title: Critical success factors for effective implementation of
lean assessment tools/framework in manufacturing
industries.
Author: Pradnya Baviskar
Program: Project Management & Operational Development
Faculty: Industrial Engineering and Management
Thesis Supervisor: Anna Hornström
Institute: Royal Institute of Technology, KTH, Stockholm, Sweden.
The base of this research is the concept of Lean Manufacturing which has been used over the
years for increasing productivity by minimizing waste from the organization. Many companies
have understood the importance of Lean and to make certain of the successful result from
the lean system, they have supported the fact that it is necessary to assess the Lean progress
continuously. This study examines the different Lean assessment frameworks and gives the
critical success factors for effective implementation of these assessment frameworks in
manufacturing industries. Research conducted for finding out the important success factors
is by extensive use of literature review. However the hypothesis for proposed success factors
finalized after literature review and these hypothesis have been proven by conducting survey
among the lean experts in manufacturing industries. This study provides the basic
understanding of lean concept which further helps in recognizing importance of lean
assessment in the growth of organization. The objective of this study can be seen in two ways
first is to ensure the successful implementation of lean assessment framework and second is
the result from the first objective which ensures the successful use of lean system in the
industry while giving boost to the economy, efficiency and productivity of the company.
Keywords: Lean manufacturing, Lean assessment, Lean assessment framework, Critical
success factors, effective implementation.
FINAL DEGREE REPORT - PRADNYA BAVISKAR 3
ACKNOWLEDGEMENTS
The completion of my master’s thesis would not have been possible without the help and
support of some essential people involved in this process. Firstly I would like to express
sincere gratitude to my best supervisor Anna Hornström for her wholehearted support,
guidance, and immense knowledge in the subject. I am thankful to her for showing extreme
patience for answering to my never ending questions and providing timely suggestions and
recommendations to improve my work. Next I would like to thank Phd researcher Mr. Omo
Oleghe for his consistent guidance on thesis topic and providing direction on conducting
effective research survey. I appreciate his efforts for providing valuable time to explain
important concepts and in addition suggesting important research papers on the thesis
subject.
Furthermore the thesis research cannot be concluded without enthusiastic participation of
lean experts from the Indian, Swedish and American manufacturing companies. Thus I am
grateful to these people for their active participation in the research survey and sharing their
knowledge and tips to improve quality in survey report. Of course there is a huge help and
timely assistance from my program colleagues and all the course teachers whenever I needed
they were there to help, for that I wanted to thank them. Its more than enough appreciation
to my friends who has given there valuable inputs by proof reading my final report. All my
friends and family members have played a crucial role in completing this part I really
appreciate their efforts wholeheartedly.
I take this opportunity to express my ultimate gratitude towards my parents Mr. & Mrs
Gorakh Baviskar for their constant encouragement to achieve my dreams and making me
believe in myself through all odds. Also I am thankful to my parent in laws Mr. & Mrs Badge
for their consistent support and blessings throughout my learning process which meant a lot.
And last but not the least I would like to share my enormous gratitude towards my beloved
husband Mr. Amol who has inspired me to pursue this program. He has always encouraged
me to overcome the difficulties I faced in this journey and still encourages me every coming
day. Without his love and belief I could have not been able to progress an inch towards my
goal.
FINAL DEGREE REPORT - PRADNYA BAVISKAR 4
Contents EXECUTIVE SUMMARY ............................................................................................................................ 2
ACKNOWLEDGEMENTS ........................................................................................................................... 3
List of Tables & Figures ........................................................................................................................... 6
1 Introduction .................................................................................................................................... 7
1.1 Background ............................................................................................................................. 7
1.2 Research Question .................................................................................................................. 8
1.3 Unit of analysis ........................................................................................................................ 8
1.4 Research Scope ....................................................................................................................... 8
1.4.1 In Scope ........................................................................................................................... 8
1.4.2 Out of Scope .................................................................................................................... 8
1.5 Research Purpose.................................................................................................................... 8
1.6 Thesis Structure ...................................................................................................................... 9
2 Research Methodology ................................................................................................................. 10
2.1 Research Philosophy ............................................................................................................. 10
2.2 Research Approach ............................................................................................................... 10
2.3 Research Strategy ................................................................................................................. 11
2.4 Data collection Method ........................................................................................................ 12
2.4.1 Self-completion questionnaire ...................................................................................... 12
2.4.2 Secondary data ............................................................................................................. 13
2.5 Data Analysis ......................................................................................................................... 13
2.6 Reliability ............................................................................................................................... 13
2.7 Validity .................................................................................................................................. 14
2.8 Ethical Consideration ............................................................................................................ 14
3 Literature Review .......................................................................................................................... 15
3.1 Lean assessment: Why it is necessary?................................................................................. 15
3.2 Lean performance measures for assessment ....................................................................... 15
3.3 Lean Assessment tools/ Frameworks ................................................................................... 16
3.3.1 EFQM Assessment (European Foundation for Quality Management) ......................... 16
3.3.2 LESAT (Lean Enterprise Self-Assessment Tool) ............................................................. 16
3.3.3 VSM (Value Stream Mapping) and opportunity assessment ........................................ 17
3.3.4 Balanced Scorecard (BSC) ............................................................................................. 17
3.3.5 The Lean Index .............................................................................................................. 18
3.3.6 Key performance indicator Benchmarking ................................................................... 18
3.3.7 Strategos Lean Assessment tool (SLAT) ........................................................................ 19
3.4 Critical success factors overview (CSF) ................................................................................. 20
FINAL DEGREE REPORT - PRADNYA BAVISKAR 5
3.5 Critical Success Factor Definition .......................................................................................... 22
3.5.1 CSF 1: Commitment and support from top management ............................................ 22
3.5.2 CSF 2: Organizational structure..................................................................................... 23
3.5.3 CSF 3: Human resource empowerment and training ................................................... 23
3.5.4 CSF 4: Effective Communication ................................................................................... 23
3.5.5 CSF 5: Technology ......................................................................................................... 23
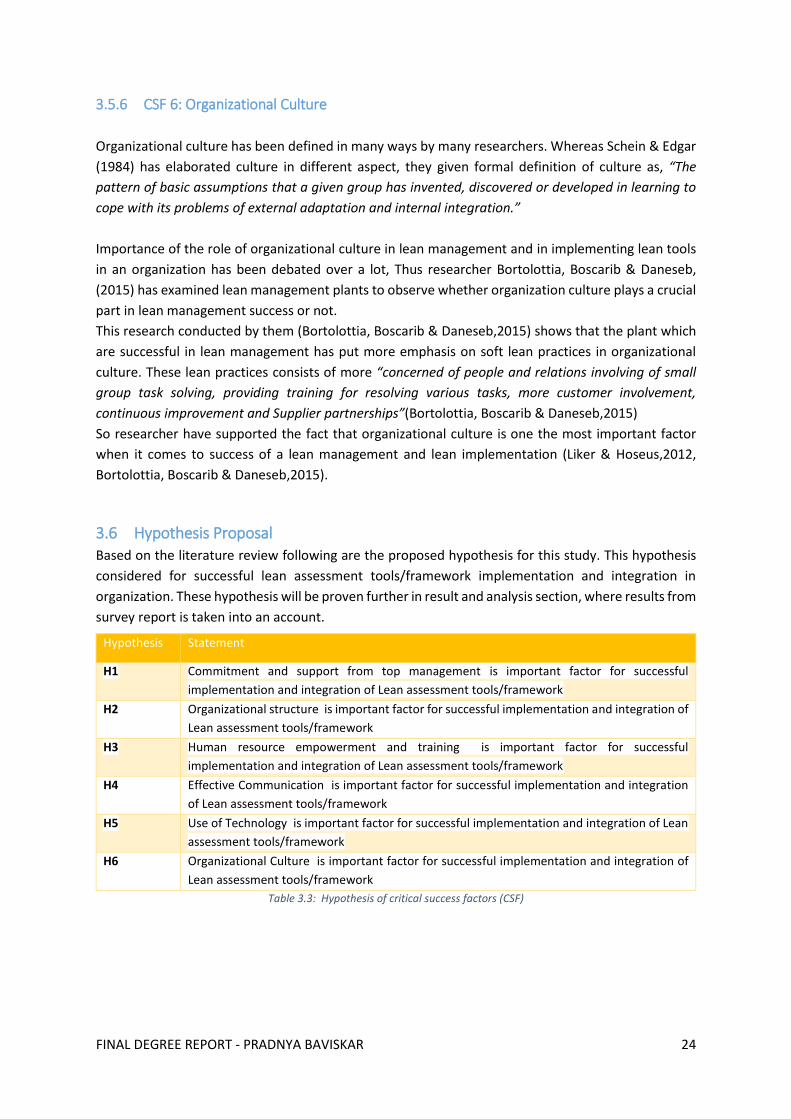
3.5.6 CSF 6: Organizational Culture ....................................................................................... 24
3.6 Hypothesis Proposal.............................................................................................................. 24
4 Result & Analysis ........................................................................................................................... 25
4.1 Response rate ....................................................................................................................... 25
4.2 General Background .............................................................................................................. 25
4.2.1 Survey Respondent Background ................................................................................... 25
4.2.2 Lean Benefits observed ................................................................................................. 26
4.2.3 Lean Assessment tools/ framework .............................................................................. 27
4.3 Critical Success factors for effective implementation of Lean assessment framework ....... 28
4.3.1 Commitment and support from top management ....................................................... 28
4.3.2 Organization structure .................................................................................................. 30
4.3.3 Human resource empowerment and training .............................................................. 31
4.3.4 Effective Communication .............................................................................................. 32
4.3.5 Technology .................................................................................................................... 34
4.3.6 Organization Culture ..................................................................................................... 34
4.4 Rating of critical Success factors ........................................................................................... 36
5 Discussion ...................................................................................................................................... 38
5.1 Commitment and support from top management ............................................................... 38
5.2 Organizational culture........................................................................................................... 38
5.3 Effective Communication ...................................................................................................... 38
5.4 Organizational Structure ....................................................................................................... 39
5.5 Technology ............................................................................................................................ 39
5.6 Human resource empowerment and training ...................................................................... 39
6 Conclusion ..................................................................................................................................... 40
6.1 Contribution of the research ................................................................................................ 41
6.2 Limitation of the research ..................................................................................................... 41
6.3 Recommendation for further research ................................................................................. 41
Reference .............................................................................................................................................. 42
APPENDIX A ........................................................................................................................................... 46
FINAL DEGREE REPORT - PRADNYA BAVISKAR 6
List of Tables & Figures
Figure 1.1 Deductive Research approach ............................................................................................. 11
Figure 3.1 European Foundation for Quality Management (EFQM) Model ......................................... 16
Figure 3.2 Balanced Scorecard four perspectives ................................................................................. 18
Figure 3.3 Improvement process .......................................................................................................... 19
Figure 3.4: Radar Chart: Strategos Lean Assessment Tool ................................................................... 20
Figure 3.5: 18 Critical success factors of lean tools ............................................................................ 21
Figure 4.1: Manufacturing sector of Respondent’s companies ............................................................ 26
Figure 4.2: Background of the Respondent (working areas and working experience) ......................... 26
Figure 4.3: Lean Benefits observed. ...................................................................................................... 27
Figure 4.4: Lean Assessment tools/ frameworks .................................................................................. 28
Figure 4.5: Authority and responsibility to establish and maintain Lean assessment framework ....... 29
Figure 4.6:Assuring successful integration of LA framework ................................................................ 30
Figure 4.7:Policy to support maintenance of LA framework ................................................................ 30
Figure 4.8: Organization Structure linkage ........................................................................................... 31
Figure 4.9: Lean Assessment framework updates and documentation ............................................... 31
Figure 4.10: Human resource empowerment and training .................................................................. 32
Figure 4.11: Communication system and Lean assessment awareness in organization ...................... 32
Figure 4.12: Effective implementation of lean assessment using communication. ............................. 33
Figure 4.13: Use of Technology in lean assessment ............................................................................. 34
Figure 4.14: Use of Technology in lean assessment ............................................................................. 35
Figure 4.15: Rating of the Critical success factors according to the importance ................................. 36
Figure 4.16: Rating of the Critical success factors according to the importance ................................. 36
Table 3.1: Comparison of proposed CSF's with literature ................................................................... 22
Table 3.2: Proposed final List of critical success factors (CSF) ............................................................. 22
Table 3.3: Hypothesis of critical success factors (CSF) ......................................................................... 24
Table 4.1: Survey Response rate .......................................................................................................... 25
Table 4.2: Result of Hypothesis Test .................................................................................................... 37
Table 6.1: Ranking of final critical success factors ............................................................................... 40
FINAL DEGREE REPORT - PRADNYA BAVISKAR 7
1 Introduction
1.1 Background
Womack et al. (1990) mentioned that Eiji Toyoda and Taiichi Ohno of Toyota, (Japan) developed the
approach for lean manufacturing. If we traced the root to 1950s and 1960s they have developed a
concept of quality enhancing system with continuous improvement, termed as a Toyota Production
System(TPS) which is also known as a Lean production or Lean Manufacturing. This system has helped
businesses to achieve higher quality, safety and increased morale of employees.
As reviewed by Randy Urbance The Machine that Changed the World (Womack, Jones & Roos, 1990)
has mentioned that, earlier in 1950 during development of Toyota Production System “Taiichi realised
that total system view of manufacturing process is key to maintaining efficiency, quality and flow
through the system” thus the focus was on removing waste which is in terms of cost, time and effort
and increased value.
Lean manufacturing is an organized way of eliminating waste, mainly focusing on cutting extra work
from the production activities. It has been used and implemented successfully to production,
administration and engineering functions. Therefore Lean implementation has a structured way of
working based on five principles of specifying value, value stream mapping, value stream flow, pull
and perfection. This can be explained as follows: (Shah & Ward, 2002)
Specify value: Value is defined in terms of customer needs at specific prize and time.
Map: Preparing a map of actions in current state of the system. Identify waste in current
system and eliminate it.
Flow: Develop value stream flow by eliminating any barriers.
Pull: Customer can pull the products according to their need, while eliminating sale forecast.
Perfection: Make continue effort of developing the process by always going to the 1st step and
begin next lean transformation.
This five lean principle are commonly used while implementing Lean.
However in today’s competitive era many companies are struggling for survival. Wherein Lean
manufacturing method assures them to provide system which helps to reduce cost, eliminate waste,
elevate efficiency, escalate productivity with high level of quality and maintain a profitability
(Womack, Jones & Roos, 1990). Implementation of lean manufacturing with its tools and principal is
proven beneficial methodology for any organization. This system can be use not only in production
areas but also in retail, healthcare and administrative areas (Womack, Jones & Roos, 1990).
The continue intensification of market competition and demand pressurizes the businesses to adopt
innovative tools and techniques. Introducing new tool and technique will help businesses to increase
its value adding activities. As described Lean manufacturing in businesses is one of the way for
reducing waste and concentrating more on value adding activities, thus it is also necessary to
constantly assess the present state of “leanness” of an organization and its willingness to change
(Alaskari et al, 2012). For this purpose different lean assessment frameworks are available, like EFQM
(European Foundation for Quality Management), LESAT (Lean Enterprise Self-Assessment Tool), VSM
(Value Stream Mapping), BSC (Balanced Scorecard), and Lean Index Tool. Lean assessment framework
mainly assesses the integration of strategies, leadership and commitment and lean transformation
FINAL DEGREE REPORT - PRADNYA BAVISKAR 8
planning, execution and monitoring. Lean assessment tools are also useful in assessing change
management and performance management within the organization (Nightingale, 2005).
However Identification of real critical success factors for implementing lean assessment framework
can be a major step towards improving chances of effective Lean system.
1.2 Research Question
The study seeks to address the following question:
“What are the critical success factors for implementation of lean assessment tools/framework in
manufacturing industries?”
Sub RQ: What are the different lean assessment framework generally used by manufacturing
industries?
1.3 Unit of analysis
Consideration of unit of analysis in a research project is one of the important parameter. It is a major
entity being analysed in the research. Unit of analysis in study can be 1) Individual 2) Groups 3)
Organization 4) Geographical units 5) Societies (Bryman & Bell, 2003). In this research, data is collected
from the people having background of lean manufacturing from level of supervisor to top
management in manufacturing industries. Hence main unit of analysis here considered is an Individual.
1.4 Research Scope
The scope of this study is limited by the following parameters.
1.4.1 In Scope
This study mainly includes literature review of Lean manufacturing, Lean assessment tools and
frameworks and critical success factors for effective implementation of Lean assessment tools.
Through literature review number of hypothesis being established for critical success factors. This is
quantitative research, where data required for fulfilment of the thesis will be collected using survey.
Data will be thoroughly measured by statistical analysis. The hypothesis will be validated by analysing
the results.
1.4.2 Out of Scope
This study will focus specifically on manufacturing industries and will not consider Information
technology, financial consultancies, and telecommunication industries etc. Survey will be restricted to
respondent with the expert knowledge of lean manufacturing.
1.5 Research Purpose
The aim of the research is to get better understanding of lean manufacturing and its assessment in
manufacturing industries and examine the critical success factors for effective implementation of lean
assessment tools.
This research will investigate critical success factors (CSFs) necessary for successful implementation of
lean assessment tools or framework in manufacturing industries which help to understand how CSFs
in industries have changed over time with the coming new technologies and globalization and what
CSFs have already been considered for previous researches. To fulfil this aim and identify direction for
FINAL DEGREE REPORT - PRADNYA BAVISKAR 9
selecting main critical success factors for this research, comprehensive review of published literature
have conducted.
The findings of CSFs from literature review are considered as Hypothesis. The CSF’s hypothesis
validation (accepted or rejected) for research is supported by analysis of detail survey from the lean
experts of the manufacturing industries.
Proven critical success factors in this research can be used to achieve success in business. The targeted
audiences will get benefit from this study are:
Researcher: Result of Analysis of this study can be shared for future work for academic purpose with
the researcher.
Company or Organization: They can consider development in area which will give boost to this critical
success factors so as to get success in business.
General Audience: Awareness regarding the importance of critical success factors in lean assessment.
1.6 Thesis Structure
This section explains the overall structure of the research.
Chapter 1 is an Introduction of the research study and explains further about the background of this
research giving understanding of the concept of Lean manufacturing and lean assessment which is
basis of this study. It also covers the main research question and sub research question, which decides
the outcome of the study also the topic in scope and out scope are discussed. Further the aim of the
study i. e. research purpose is explained in brief.
Chapter 2 is a Methodology consisting of the methods used for data collection necessary for carrying
out this research. It explains the basis of this research involving research philosophy, approach and
strategy. Data analysis is elaborated so that reader could understand how the analysis s carried out
for the data received. Also here reliability and validity of the research is described in detailed.
Chapter 3 is a literature review, this gives a scientific base for this research and describes all the
concepts required to understand the research area. Various scientific papers, journals, scientific data
bases, literature books, websites are considered for reviewing all the concepts. Here also hypothesis
is proposed for critical success factors upon thorough literature search.
Chapter 4 is a result and analysis, this research collects data from the responses received from the
survey. This section presents the result using pie charts and bar charts and by combining all the survey
data and predict the meaning of each result produced for each critical success factor. Thorough
analysis is conducted on the result which provides easy understanding to reader. Further the result
and analysis use for hypothesis testing.
Chapter 5 is a Discussion, which discusses the proven critical success factors (CSFs) for implementation
of lean assessment framework. The discussion is based on general concept of CSFs and what study has
revealed about these CSFs during result and analysis.
Chapter 6 is a Conclusion, which concludes this study and gives answer to the research questions
followed by contribution of the research and limitation of the research. Last but not least it provides
recommendation for future research in this area of study.
FINAL DEGREE REPORT - PRADNYA BAVISKAR 10
2 Research Methodology This chapter describes the research methodology used in this study. Here firstly the basis of the
research i.e. Research philosophy is discussed. Then research approach and strategy will be explained
in brief. It also gives a detail description of main data collection method and finally describes the
details of validity and reliability of this study.
2.1 Research Philosophy
According to Saunders (2009) research philosophy is “The basic belief system or world view that
guides the investigation, not only in choices of method but in ontologically and epistemologically
fundamental ways”
Here ontology concerns with the researcher’s views about how things work out in surroundings and
his commitment toward his opinion. In Ontology, objectivism and subjectivism these two aspects are
considered. Where objectivism is mostly concerned with the position which suggests “how social
entities exist independent of social actors.” Saunders (2009) on other hand Subjectivism is more
concerned with “Understanding the meanings that individuals attach to social phenomena” Saunders
(2009).
This research selects philosophy of Subjectivism. Subjectivism considers the fact that social
phenomena is created due to the opinion and perception of a people. This is also further explained by
Remenyi (1998) “the details of the situation to understand the reality or perhaps a reality working
behind them” can also be known as Social constructionism.
However philosophy of Epistemology relates with the acceptable knowledge in a particular field of
study. Saunders (2009). This research reflects one of the category of epistemology that is Positivism.
Positivism focuses on recognizable social reality. The study follows the “Positivism” where social
reality comes from the perception of group of people on the given study topic.
2.2 Research Approach
There are two types of research approaches so far, Deductive approach and Inductive approach.
In Deductive approach, researcher first develops a theory and finalises the hypothesis. To verify this
hypothesis, research strategy will be developed. Deductive approach is a top-down approach where
theory and hypothesis is developed using thorough literature review. Hypothesis is accepted or
rejected using data analysis where data collected through research strategy (Saunder, 2009 PP 155).
In Inductive approach researcher collects a data and create a theory as outcome of a data analysis.
(Saunder,2009 PP 155). Inductive approach is bottom-up approach where research strategy is decided
as either a group interview or survey or other methods of collecting data and theory is developed
upon data analysis.
In this research deductive approach is followed. Six critical success factors are finalized after literature
review which are taken as a hypothesis for this study. Survey has been conducted to get the data for
verification of hypothesis.
FINAL DEGREE REPORT - PRADNYA BAVISKAR 11
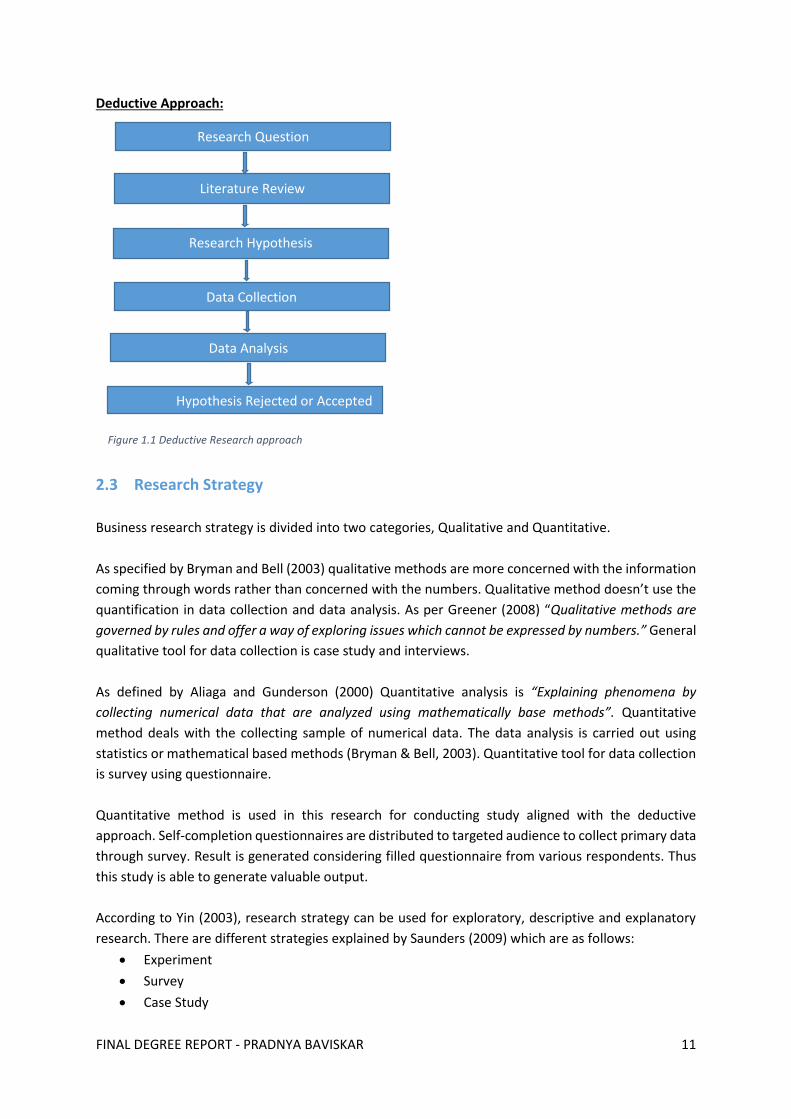
Deductive Approach:
2.3 Research Strategy
Business research strategy is divided into two categories, Qualitative and Quantitative.
As specified by Bryman and Bell (2003) qualitative methods are more concerned with the information
coming through words rather than concerned with the numbers. Qualitative method doesn’t use the
quantification in data collection and data analysis. As per Greener (2008) “Qualitative methods are
governed by rules and offer a way of exploring issues which cannot be expressed by numbers.” General
qualitative tool for data collection is case study and interviews.
As defined by Aliaga and Gunderson (2000) Quantitative analysis is “Explaining phenomena by
collecting numerical data that are analyzed using mathematically base methods”. Quantitative
method deals with the collecting sample of numerical data. The data analysis is carried out using
statistics or mathematical based methods (Bryman & Bell, 2003). Quantitative tool for data collection
is survey using questionnaire.
Quantitative method is used in this research for conducting study aligned with the deductive
approach. Self-completion questionnaires are distributed to targeted audience to collect primary data
through survey. Result is generated considering filled questionnaire from various respondents. Thus
this study is able to generate valuable output.
According to Yin (2003), research strategy can be used for exploratory, descriptive and explanatory
research. There are different strategies explained by Saunders (2009) which are as follows:
Experiment
Survey
Case Study
Research Question
Literature Review
Research Hypothesis
Data Collection
Data Analysis
Hypothesis Rejected or Accepted
Figure 1.1 Deductive Research approach
FINAL DEGREE REPORT - PRADNYA BAVISKAR 12
Action Research
Grounded Theory
Ethnography
Archival research
For this study, Survey is used as a research strategy. According to Saunders (2009) for deductive
approach, generally survey strategy is used. Survey is mostly used in business and management
research which gives answers to the questions like how much, how many, who, what and where etc.
Survey allows to get valuable data from a large group of people in a highly economical way. (Saunders,
2009). The data collected is usually by using questionnaire, this data can be effortlessly analyse by
descriptive and inferential statistical methods which allows to produce valid results. As suggested by
Saunders, “The survey strategy is perceived as authoritative by people in general and is both
comparatively easy to explain and to understand”
2.4 Data collection Method
2.4.1 Self-completion questionnaire
This is primary data collection method. Self-completion questionnaires are also known as self-
administered questions, where there is no need of presence of interviewer. This questions can be
filled on forms, websites by targeted audience and can be distributed by using emails or social
websites. Here self-completion questionnaires are formulated to get required data from the
respondents. This questions are carefully designed to draw appropriate results from the various
responses. This method proven to be very cost effective way of collecting data. For this study
questionnaire plays a major role for evaluation of each critical success factor.
2.4.1.1 Respondents
Respondents are selected from lean network such as lean forums, lean manufacturing groups and
social websites Linkedin, and personal connections. Responses are mainly accounted from the
candidate who has experience in lean manufacturing and has previously worked or currently working
in Lean company.
2.4.1.2 Questionnaire Design
There are total 25 no. of questions and divided into following sections:
1. General Background
2. Critical Success factors for effective implementation of Lean assessment framework
Commitment and support from top management
Organizational structure
Human resource empowerment and training
Communication
Technology
Culture
3. Rating of Critical Success Factors
The first section consists of general background of a respondent giving information about area of
business, respondent’s total year of experience and his/her knowledge about Lean concept. Second
FINAL DEGREE REPORT - PRADNYA BAVISKAR 13
section is important for this study which shows the necessity of critical success factors in
implementation of lean tools or frameworks. Third and fourth section will help to analyze the most
important critical success factors amongst the chosen ones according to view of respondents.
2.4.2 Secondary data
For this study secondary data is collected through research papers, scientific journals, articles and
conference papers from various data bases including:
Science Direct
Emerald Insight
Google Scholar
Elsevier
Springer Link
KTH university DIVA
Libris
Further keywords for searching appropriate results are “Lean Manufacturing”, “Lean Assessment”,
“Critical success factors ”,“ The Toyota way ”,“Total Plant solution”, and “CSF for lean implementation”
in addition to this knowledge has increased by reading a book of “Operations Management” by Lewis
& slack (2003) and for following appropriate research methodology and understanding how to select
references for the research work, the book of “Research Methods for business students” by Saunders
et al (2009) was very useful. This book also provided a guidance on using authentic references for
reliable and valid research writing (Saunders et al, 2009).
2.5 Data Analysis
As specified by Dr. Sue Greener (2008) there are two types of data analysis, univariate analysis and
bivariate analysis. Univariate analysis deals with the one variable at a time whereas bivariate analysis
focuses on relation between two variables. In Univariate analysis bar charts, Pie charts and histograms
are used to present data (Greener, 2008). For this research study, Univariate data analysis is
considered which will focus on individual variable at a time.
Survey questionnaires have been created using Google forms, which is easier and more reliable way
of formulating any types of survey questions. The responses collected through the survey is recorded
and collected in an excel sheet. This excel sheet can generate a small report for the data analysis. But
For this study elaborative analysis was required so report generated from the Google forms has not
been used. For Statistical analysis of Survey data a software DataCracker is used. Statistical analysis
has been conducted, by calculating, Average, mean and standard deviation for the questions which
can be answered by giving statistical points from 0 to 5 according to instruction. This result of the
survey presented in a bar charts. Other questions give a answers in a percentile format presented in
pie chart as a result.
2.6 Reliability
“Reliability is to design a research which is auditable” (Greener, 2008) which means research should
be consistent and clear and if the research is given to any person for reading he or she must able to
produce same results by following same methods in the research study or at least he or she should
have a complete understanding of the research and built a trust and belief in the results which have
been produced (Greener, 2008). In this study data collection method is explained thoroughly. Also For
FINAL DEGREE REPORT - PRADNYA BAVISKAR 14
this study respondents have been selected according to their work background, work experience and
their industry. The participants who are particularly chosen mostly have over 5 to 10 years of
experience in lean management and have thorough knowledge of lean assessment usage in
manufacturing industries. Freedom of choice is given to respondents for answering the given
questions and aim of the study is explained in advance as a purpose for “master’s thesis” so the reply
received from them is honest and clear. Thus this study is producing reliable data and if reader try to
produce same data by using a same method, it is able to regenerate the same result.
2.7 Validity
Dr. Sue Greener (2008) has explained face validity as, “if any non-researcher can relate the method to
its researching question and agrees that it is a suitable method for the given study then research has
a face validity" The test of validity is conducted by distributing initial set of survey questions to few
people to check whether they could understand the meaning of questions and whether they can
answer appropriately. During distribution basic aim of the study and subject of the research has been
explained to participants. It seems that they can relate the survey questions to the research aim and
can answer appropriately to the survey, which showed that they could understand the reason behind
choosing this method for this study. Survey questions also checked and rechecked by giving it to proof
reading.
Survey questions are statistically analyzed by the computer software program DataCracker, which is
widely used software for quantitative analysis and provides an accurate prediction of the quantitative
data. Results are presented in the form of bar charts and pie charts which able to read the data
precisely. Thus this research study shows the validity.
2.8 Ethical Consideration
According to Alcser et al (2011), ethical guidelines for survey has to be think through which are as
follows:
Providing enough necessary information about the background of the study and encourage
participation in the survey but always try not to harass candidates by continue push for
participation, attempt of several contacts and frequent visits to the respondent.
There is emphasize on using present available survey data received from participant rather
than pursuing participants for gathering extra data.
Show respect and give an honest opinion about the time required to fill the survey, no of
questions in the survey, actual duration for interview and benefits offered for participation.
In this study ethical attributes are followed while conducting survey. While distributing Survey
questions, there is an attachment of self-introduction, educational background, purpose of the study,
short introduction of research area and thank you note for participation also provided. At the
beginning of the questions, consent note providing information that “The results from this survey will
be used only for the study purpose and identity of the participants will not be disclosed in any case”
is written. If participated in the survey respondents had an option of selecting whether they want
summary of the results from this study, if yes they need to fill their email address. Thus the short
summary of the results of the survey will be sent to interested individual participants after the
publication of the thesis report. Once they have filled the survey and submitted it, an email with the
thank you not has been sent to the survey participants.
FINAL DEGREE REPORT - PRADNYA BAVISKAR 15
3 Literature Review Research papers, scientific articles and practitioner work on lean assessment and on critical success
factors are considered to sum up this section.
3.1 Lean assessment: Why it is necessary?
Nowadays more companies are facing difficulties in implementing lean manufacturing systems,
however few cases are observed where denoting success have been achieved in this area. The reason
behind lean system failure is debatably lack of understanding of lean performance and its
measurement, where in other words it is very necessary to assess performances to manage lean
(Behrouzi & wong, 2011).
Lean assessment gives complete analysis of current level of leanness of the organization with process
accuracy, stability and improvement and the degree of employee commitment towards these
activities. Lean manufacturing has importantly 14 key areas namely scheduling, material handling,
equipment, work process, quality, employees, layout, suppliers, customers, safety and ergonomics,
product design, management and culture (Yu Cheng Wong et al, 2009).
Thus lean manufacturing assessment considers this 14 areas and analyses in following parts: 1.
Cultural Awareness 2. Structured Flow Manufacturing 3. Small lot production 4. Setup Reduction 5.
Fitness for use 6. Employee Involvement 7. Control through Visibility 8. Housekeeping/workplace
organization 9. Total Quality focus 10.Level Load and balanced flow 11. Preventive Maintenance 12.
Supplier Partnerships 13. Pull Systems 14. Education and Training (Buker Inc.2010). As per the Michel
Tincher (Buker inc. 2010) Lean Assessment can be used by companies who are advanced in their “Lean
journey” and also by companies who want to start their efforts of becoming Lean.
3.2 Lean performance measures for assessment
Performing lean practices and establishing lean assessment framework is the part of organizations
manufacturing strategy. While developing lean assessment framework for analysing level of lean
implementation, well planned and strategic approach should be considered. (Doolen & Hacker,2005).
Understanding performance measures in organization is as important as developing a model to assess
these performance measures. As suggested by Srinivasaraghavan & Allada (2005) lean assessment
metrics should have some important properties such as:
Realistic & updated
Measurable
Able to monitor, control and evaluate performance
Helpful in understanding current situation and level
Easily enable to identify improvement opportunities
Aligned to strategic objective of the company and customer values
To measure the Lean system of an organization there are nine variables suggested by Karlsson &
Åhlström (1996) which are Elimination of waste, Continuous Improvement, Zero defects, Just-In-Time
Deliveries, Pull of materials, Multifunctional teams, Decentralization, integration of functions, and
vertical information system. (Behrouzi & wong, 2011). Accordingly this nine variables can quantified
and compare with benchmarks from historical data and can identify the current leanness of the
company.
FINAL DEGREE REPORT - PRADNYA BAVISKAR 16
3.3 Lean Assessment tools/ Frameworks
As defined by Womack, Roos & Jones (1990) “A lean enterprise is an organization which uses lean
concepts and practices not just in the manufacturing but in everything it does” so here are the lean
assessment tools described considering area of Quality, Culture, Process Improvement and stability,
employee satisfaction. Research papers, upcoming lean developments posted through authentic
websites, recent studies are considered as a reference here. Lean assessment tools or frameworks are
as follows:
EFQM assessment (European Foundation for Quality Management)
LESAT (Lean Enterprise Self-Assessment Tool)
VSM (Value Stream Mapping) and opportunity assessment
BSC (Balanced Scorecard)
Lean Index Tool
key performance indicator Benchmarking tool
Lean culture assessment model (LCAM)
Shingo Model
Strategos Lean Assessment tool
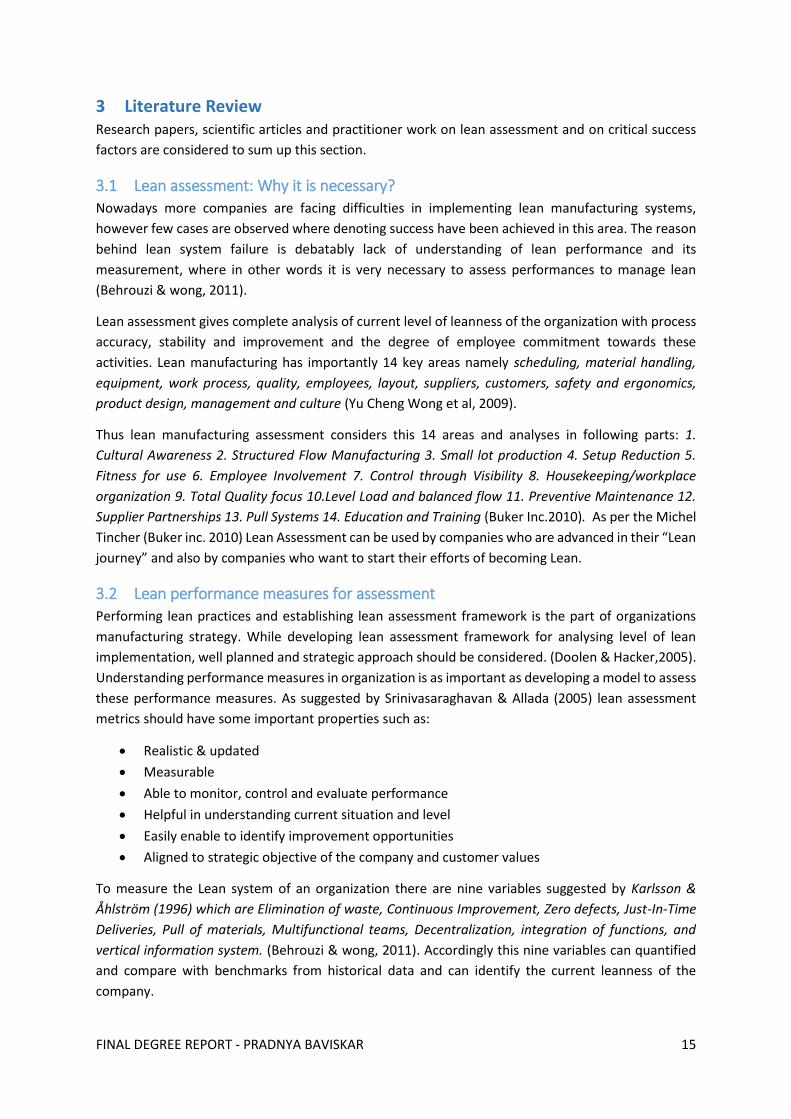
3.3.1 EFQM Assessment (European Foundation for Quality Management)
EFQM model or framework is a basis for Quality management which is standardised by European
foundation. As per European foundation for Quality management, the criteria of assessment divided
into two section of Enablers and Results. Where “Enabler” criteria gives overview of organization and
“Results” shows the achievement of organization. It mainly focuses on “maintaining leadership,
developing policy and strategy for achieving ultimate quality goal which further gives the result of
customer satisfaction, economic benefits and positive social impact”(Camison,1996).
Figure 3.1 European Foundation for Quality Management (EFQM) Model
3.3.2 LESAT (Lean Enterprise Self-Assessment Tool)
According to LESAT Facilitator’s Guide by Massachusetts Institute of Technology, 2012 Lean Enterprise
Self-Assessment Tool helps to assess and guide leadership during organizational transformation for
achieving enterprise excellence. It also states that LESAT was developed with aerospace industries in
US and UK and has significant impact and applicability for large kind of manufacturing industries.
FINAL DEGREE REPORT - PRADNYA BAVISKAR 17
As defined by Deborah Nightingale (2005) “LESAT is tool for executive self-assessment of the present
state of “leanness” of an enterprise and its readiness to change”. This assessment is advisable to take
during the planning phase of the organization transformation. It has been stated by LESAT Facilitator’s
Guide (MIT, 2012) and Nightingle (2005) that LESAT can identify gaps in current performance and
required improvement areas by assessing current and future state of the organization. LESAT also
gives important information or required inputs while developing transformation plan and helps in
monitoring improvements during implementation phase.
In assessment 54 lean enterprise practices have been considered and divided into three main sections
where section 1 deals with Leadership and Transformation including 28 practices, Section 2 deals with
Lifecycle processes in organization including 18 practices and Section 3 deals with Enabling
Infrastructure including 8 lean practices. Each lean practice is assessed on 1 to 5 capability maturity
scale (Nightingle, 2005).
3.3.3 VSM (Value Stream Mapping) and opportunity assessment
A value stream is combination of all value added and non-value added actions which is required to
produce a final group of products from same resources. This main flow generally start with the raw
materials followed by final product and end with the customer delivery (Abdulmalek & Rajgopal,
2007). The actions in this consists of processes, information and material handling. Value stream
mapping is mainly helps in identifying wastes from value stream and eliminate those extra steps which
are not needed (Rother & Shook, 1999). Value stream mapping considers the overall value processes
and not focusing on any one single process thus providing more sorted way for identifying non-value
added systems in value map.
The starting point of value stream mapping is by selecting any one of the target product or group of
product which needs to improve (Rother & Shook, 1999). By observing processes required for
delivering the final product, current state map of the all the actual processes is being drawn. The
Current state map will help to clearly analyse and asses the system flow and identifying any flaws in
current system. For suggesting further improvement, future state map is drawn by answering few
questions regarding efficiency, lean tools implementation and technical expertise. Future state map
is used as basis for making any changes in the system (Abdulmalek & Rajgopal, 2007).
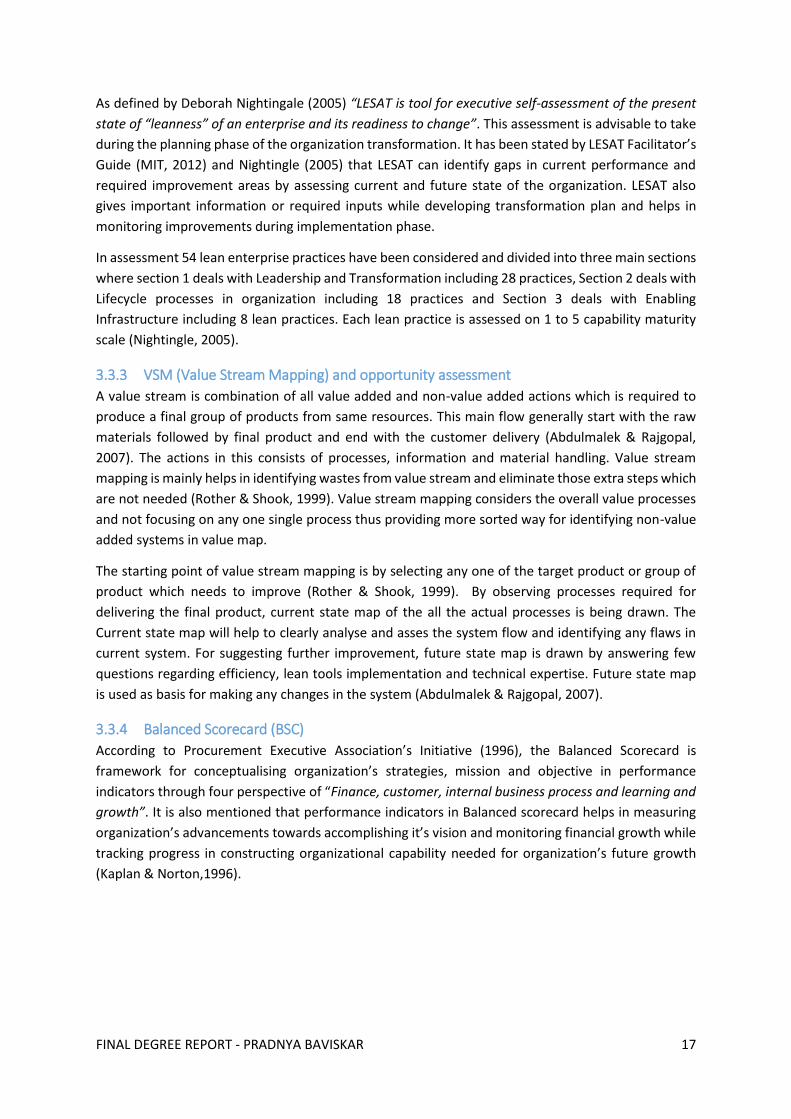
3.3.4 Balanced Scorecard (BSC)
According to Procurement Executive Association’s Initiative (1996), the Balanced Scorecard is
framework for conceptualising organization’s strategies, mission and objective in performance
indicators through four perspective of “Finance, customer, internal business process and learning and
growth”. It is also mentioned that performance indicators in Balanced scorecard helps in measuring
organization’s advancements towards accomplishing it’s vision and monitoring financial growth while
tracking progress in constructing organizational capability needed for organization’s future growth
(Kaplan & Norton,1996).
FINAL DEGREE REPORT - PRADNYA BAVISKAR 18
Figure 1.2 Balanced Scorecard four perspectives (Source: Guide to a Balanced Scorecard Performance Management
Methodology, Procurement Executive’s Association, 1996)
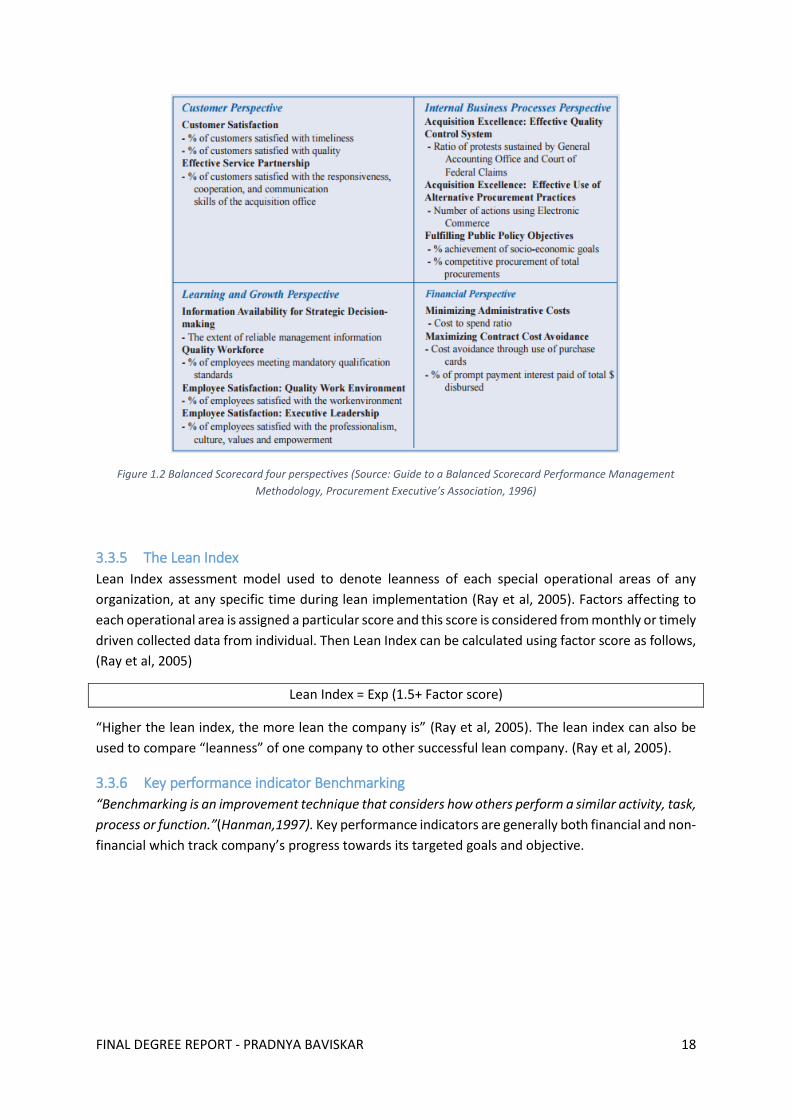
3.3.5 The Lean Index
Lean Index assessment model used to denote leanness of each special operational areas of any
organization, at any specific time during lean implementation (Ray et al, 2005). Factors affecting to
each operational area is assigned a particular score and this score is considered from monthly or timely
driven collected data from individual. Then Lean Index can be calculated using factor score as follows,
(Ray et al, 2005)
Lean Index = Exp (1.5+ Factor score)
“Higher the lean index, the more lean the company is” (Ray et al, 2005). The lean index can also be
used to compare “leanness” of one company to other successful lean company. (Ray et al, 2005).
3.3.6 Key performance indicator Benchmarking
“Benchmarking is an improvement technique that considers how others perform a similar activity, task,
process or function.”(Hanman,1997). Key performance indicators are generally both financial and non-
financial which track company’s progress towards its targeted goals and objective.
FINAL DEGREE REPORT - PRADNYA BAVISKAR 19
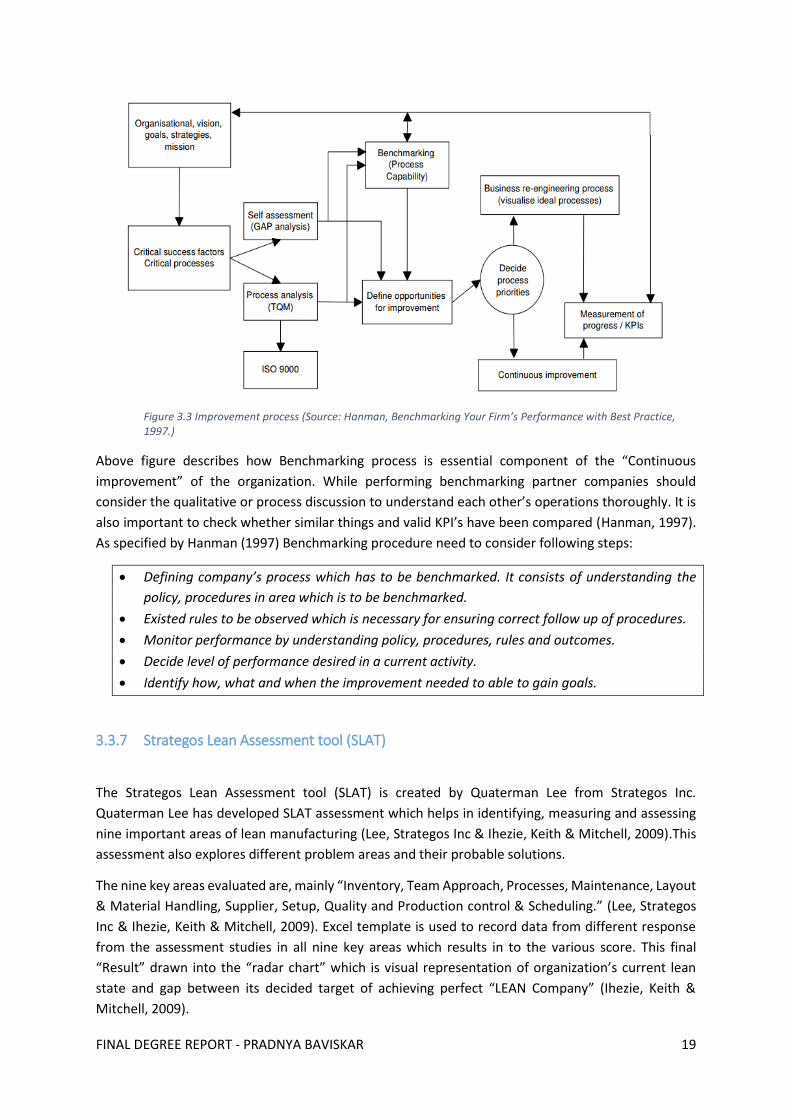
Figure 3.3 Improvement process (Source: Hanman, Benchmarking Your Firm’s Performance with Best Practice, 1997.)
Above figure describes how Benchmarking process is essential component of the “Continuous
improvement” of the organization. While performing benchmarking partner companies should
consider the qualitative or process discussion to understand each other’s operations thoroughly. It is
also important to check whether similar things and valid KPI’s have been compared (Hanman, 1997).
As specified by Hanman (1997) Benchmarking procedure need to consider following steps:
Defining company’s process which has to be benchmarked. It consists of understanding the
policy, procedures in area which is to be benchmarked.
Existed rules to be observed which is necessary for ensuring correct follow up of procedures.
Monitor performance by understanding policy, procedures, rules and outcomes.
Decide level of performance desired in a current activity.
Identify how, what and when the improvement needed to able to gain goals.
3.3.7 Strategos Lean Assessment tool (SLAT)
The Strategos Lean Assessment tool (SLAT) is created by Quaterman Lee from Strategos Inc.
Quaterman Lee has developed SLAT assessment which helps in identifying, measuring and assessing
nine important areas of lean manufacturing (Lee, Strategos Inc & Ihezie, Keith & Mitchell, 2009).This
assessment also explores different problem areas and their probable solutions.
The nine key areas evaluated are, mainly “Inventory, Team Approach, Processes, Maintenance, Layout
& Material Handling, Supplier, Setup, Quality and Production control & Scheduling.” (Lee, Strategos
Inc & Ihezie, Keith & Mitchell, 2009). Excel template is used to record data from different response
from the assessment studies in all nine key areas which results in to the various score. This final
“Result” drawn into the “radar chart” which is visual representation of organization’s current lean
state and gap between its decided target of achieving perfect “LEAN Company” (Ihezie, Keith &
Mitchell, 2009).
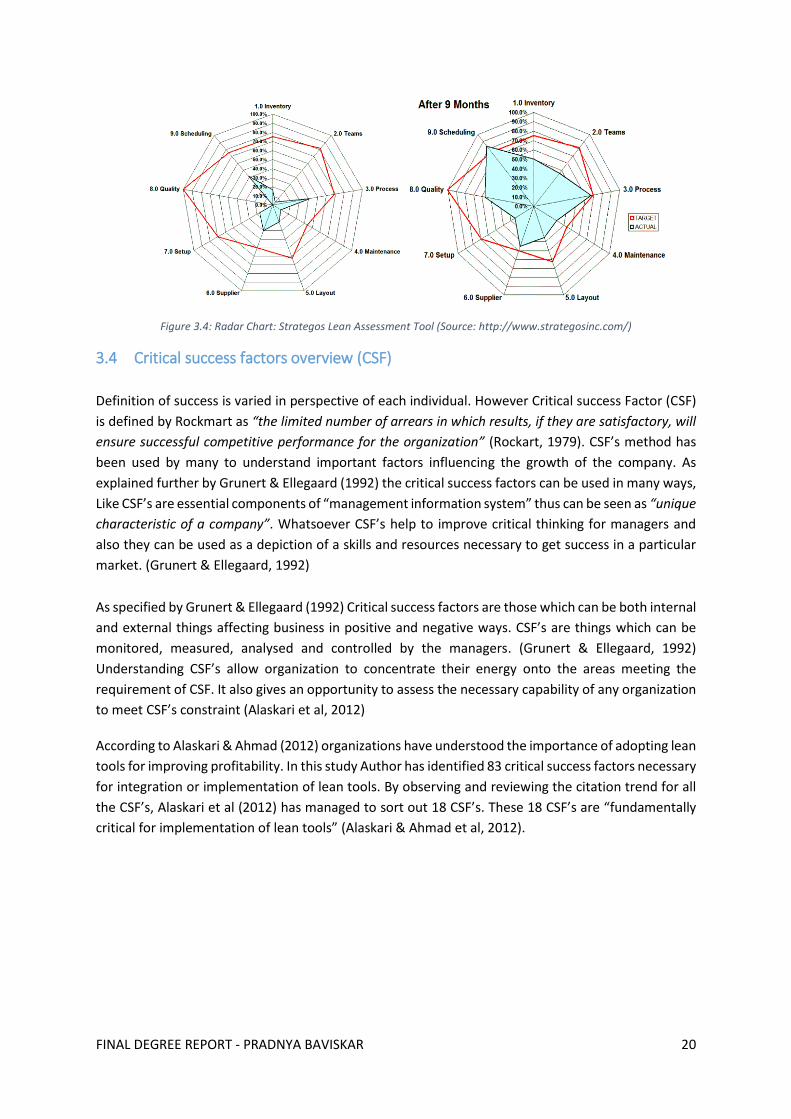
FINAL DEGREE REPORT - PRADNYA BAVISKAR 20
Figure 3.4: Radar Chart: Strategos Lean Assessment Tool (Source: http://www.strategosinc.com/)
3.4 Critical success factors overview (CSF)
Definition of success is varied in perspective of each individual. However Critical success Factor (CSF)
is defined by Rockmart as “the limited number of arrears in which results, if they are satisfactory, will
ensure successful competitive performance for the organization” (Rockart, 1979). CSF’s method has
been used by many to understand important factors influencing the growth of the company. As
explained further by Grunert & Ellegaard (1992) the critical success factors can be used in many ways,
Like CSF’s are essential components of “management information system” thus can be seen as “unique
characteristic of a company”. Whatsoever CSF’s help to improve critical thinking for managers and
also they can be used as a depiction of a skills and resources necessary to get success in a particular
market. (Grunert & Ellegaard, 1992)
As specified by Grunert & Ellegaard (1992) Critical success factors are those which can be both internal
and external things affecting business in positive and negative ways. CSF’s are things which can be
monitored, measured, analysed and controlled by the managers. (Grunert & Ellegaard, 1992)
Understanding CSF’s allow organization to concentrate their energy onto the areas meeting the
requirement of CSF. It also gives an opportunity to assess the necessary capability of any organization
to meet CSF’s constraint (Alaskari et al, 2012)
According to Alaskari & Ahmad (2012) organizations have understood the importance of adopting lean
tools for improving profitability. In this study Author has identified 83 critical success factors necessary
for integration or implementation of lean tools. By observing and reviewing the citation trend for all
the CSF’s, Alaskari et al (2012) has managed to sort out 18 CSF’s. These 18 CSF’s are “fundamentally
critical for implementation of lean tools” (Alaskari & Ahmad et al, 2012).
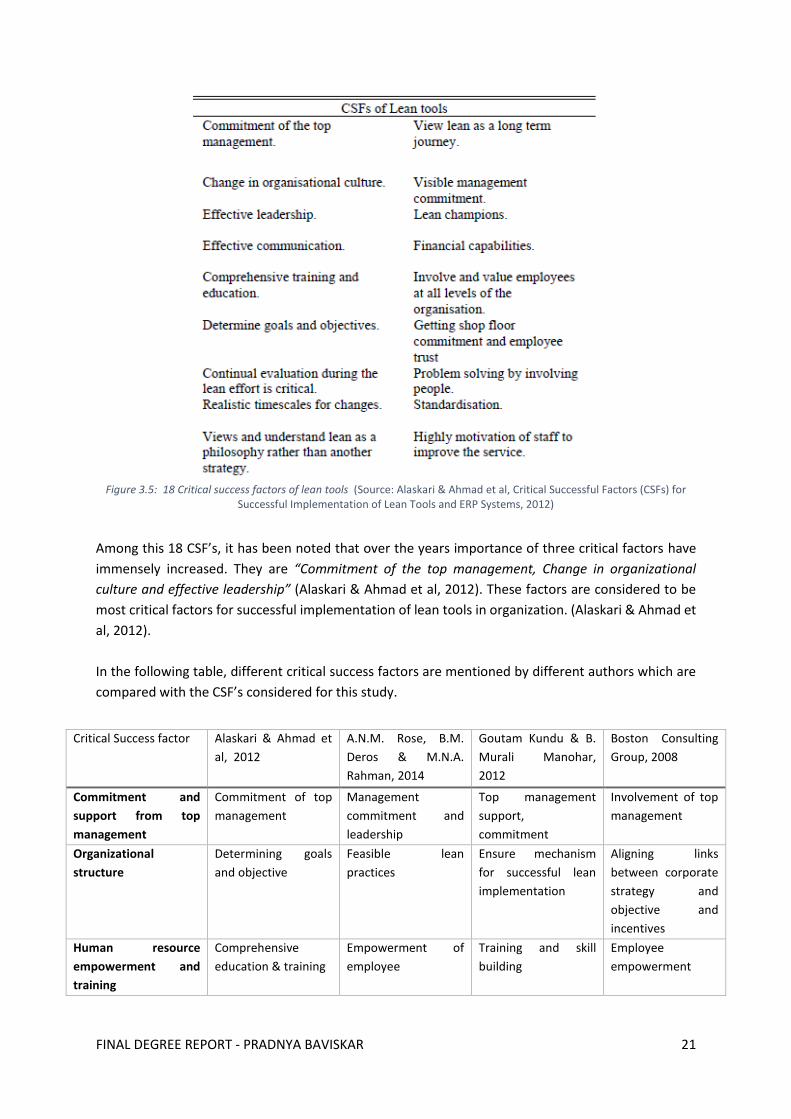
FINAL DEGREE REPORT - PRADNYA BAVISKAR 21
Figure 3.5: 18 Critical success factors of lean tools (Source: Alaskari & Ahmad et al, Critical Successful Factors (CSFs) for
Successful Implementation of Lean Tools and ERP Systems, 2012)
Among this 18 CSF’s, it has been noted that over the years importance of three critical factors have
immensely increased. They are “Commitment of the top management, Change in organizational
culture and effective leadership” (Alaskari & Ahmad et al, 2012). These factors are considered to be
most critical factors for successful implementation of lean tools in organization. (Alaskari & Ahmad et
al, 2012).
In the following table, different critical success factors are mentioned by different authors which are
compared with the CSF’s considered for this study.
Critical Success factor Alaskari & Ahmad et
al, 2012
A.N.M. Rose, B.M.
Deros & M.N.A.
Rahman, 2014
Goutam Kundu & B.
Murali Manohar,
2012
Boston Consulting
Group, 2008
Commitment and
support from top
management
Commitment of top
management
Management
commitment and
leadership
Top management
support,
commitment
Involvement of top
management
Organizational
structure
Determining goals
and objective
Feasible lean
practices
Ensure mechanism
for successful lean
implementation
Aligning links
between corporate
strategy and
objective and
incentives
Human resource
empowerment and
training
Comprehensive
education & training
Empowerment of
employee
Training and skill
building
Employee
empowerment
FINAL DEGREE REPORT - PRADNYA BAVISKAR 22
Table 3.1: Comparison of proposed CSF's with literature
The table has shown that the proposed CSF’s structure is well suited and this set of CSF’s are used for
the further analysis in this study. The author has proposed six distinct critical success factors for
integrating and implementing lean assessment tools/framework in manufacturing industries. Final
CSF’s proposed are as follows:
Table 3.2: Proposed final List of critical success factors (CSF)
The definition of six proposed critical success factors for lean assessment implementation are
explained in next section.
3.5 Critical Success Factor Definition
3.5.1 CSF 1: Commitment and support from top management
Commitment and support from top management can be defined as “Dedicating time to the program
according to its value in terms of cost and potential, reviewing plans, following up on results and
facilitating management problems” (Younga & Jordanb,2008). Where top management consists of
Director, Chief executive officer of the organization. Many studies have promoted the fact that
support and involvement of top management is essential factor in lean implementation.
According to Anchanga et al (2006) an outstanding leadership and top management involvement is
crucial factor which pushes ahead the implementation of lean practices. Moreover lean
implementation success depended on the “evidence of management commitment” to Lean program
(Scherrer Rathie et al, 2009, Kundu & Manohar, 2012).
Effective
Communication
Problem solving by
involving people and
communicating
Effective
communication
communication Strong and ongoing
communication
Technology Quality management Measurement
framework
IT infrastructure
Organizational Culture Involve and value
employees at all level
of organization
Continuous
improvement
Organizational
culture
Strong
organizational
culture while
tailoring
implementation
approach according
to culture
Critical Success factor
Commitment and support from top management
Organizational structure
Human resource empowerment and training
Effective Communication
Technology
Organizational Culture
FINAL DEGREE REPORT - PRADNYA BAVISKAR 23
3.5.2 CSF 2: Organizational structure
The organizational structure plays important part in Lean implementation (Faron,2012) and thus in
lean assessment implementation. As stated by Pugh, Hickson, Hinings and Turner (1968) and
mentioned by Siemerink (2014) organization structure consists of four basic dimension ie. “Structuring
activities, concentration of authority, line control of workflow and size of supportive component”.
According to Faron (2012) “the companies who transformed successfully, have observation that
organization structure is one of the success factors of lean transformation”. Also many research papers
on lean management have confirmed that flexible organization structure and lean is a successful
combination (Faron, 2012).
3.5.3 CSF 3: Human resource empowerment and training
“Human resource is an important asset of any organization” (Mohammad, Rashidi & Karimdoust,
2014) by training and empowering this resource, organization can explore its ability to succeed in lean
implementation. Thus it is important to use human resource and trained them skilfully. (Mohammad,
Rashidi & Karimdoust, 2014).
Training of skilled mind-sets in the organization consists of the both workers and managers.
Empowering the key resources and changing attitude is crucial step in achieving success in
implementation process (Jurado, Fuentes & Gomez,2013).
According to Jurado, Fuentes & Gomez (2013) considering employees opinions, actively listening to
their proposal and implementing those proposal will motivate them in a longer run, which eventually
help in executing changes.
3.5.4 CSF 4: Effective Communication
Many publishers have considered effective communication as essential factor in success of lean
manufacturing and executing lean tools. (Womack & Jones et al, 1990, Jurado, Fuentes & Gomez
,2013). Communication is necessary for flow of information from top- down management and
understanding the need for change for executing any new tools like lean assessment. Continuous
exchange of information regarding benefits of lean helps in reducing the resistance from the people
in the organization ( Jurado, Fuentes & Gomez 2013).
Communication is one of the success factor, because many authors suggested that failing to
understand and communicate urgency of lean transformation may lead to failure of implementation
and change process (Womack & Jones et al, 1990, Jurado, Fuentes & Gomez, 2013).
3.5.5 CSF 5: Technology
As defined by Lewis & Slack (2003) in operations management, Information technology is the
“capability offered by computers, software applications and telecommunications” IT is been
continuously used in manufacturing industries for process modelling, information management
system and product scheduling and controlling (Lewis & Slack 2003).Thus in Lean assessment,
assessment data has stored and managed by company’s information management system. So IT has
important role in implementation and integration of lean assessment tools. As stated by Lewis & Slack
(2003) “IT is a more than useful tool in Business processes redesign”.
Technology comes handy for analyzing data received from lean assessment tools. This data can be
easily interpreted and used in predicting current state of leanness of the company. It also helps in
identifying gaps in current and required performance of the organization (Nightingle, 2005).
FINAL DEGREE REPORT - PRADNYA BAVISKAR 24
3.5.6 CSF 6: Organizational Culture
Organizational culture has been defined in many ways by many researchers. Whereas Schein & Edgar
(1984) has elaborated culture in different aspect, they given formal definition of culture as, “The
pattern of basic assumptions that a given group has invented, discovered or developed in learning to
cope with its problems of external adaptation and internal integration.”
Importance of the role of organizational culture in lean management and in implementing lean tools
in an organization has been debated over a lot, Thus researcher Bortolottia, Boscarib & Daneseb,
(2015) has examined lean management plants to observe whether organization culture plays a crucial
part in lean management success or not.
This research conducted by them (Bortolottia, Boscarib & Daneseb,2015) shows that the plant which
are successful in lean management has put more emphasis on soft lean practices in organizational
culture. These lean practices consists of more “concerned of people and relations involving of small
group task solving, providing training for resolving various tasks, more customer involvement,
continuous improvement and Supplier partnerships”(Bortolottia, Boscarib & Daneseb,2015)
So researcher have supported the fact that organizational culture is one the most important factor
when it comes to success of a lean management and lean implementation (Liker & Hoseus,2012,
Bortolottia, Boscarib & Daneseb,2015).
3.6 Hypothesis Proposal
Based on the literature review following are the proposed hypothesis for this study. This hypothesis
considered for successful lean assessment tools/framework implementation and integration in
organization. These hypothesis will be proven further in result and analysis section, where results from
survey report is taken into an account.
Table 3.3: Hypothesis of critical success factors (CSF)
Hypothesis Statement
H1 Commitment and support from top management is important factor for successful
implementation and integration of Lean assessment tools/framework
H2 Organizational structure is important factor for successful implementation and integration of
Lean assessment tools/framework
H3 Human resource empowerment and training is important factor for successful
implementation and integration of Lean assessment tools/framework
H4 Effective Communication is important factor for successful implementation and integration
of Lean assessment tools/framework
H5 Use of Technology is important factor for successful implementation and integration of Lean
assessment tools/framework
H6 Organizational Culture is important factor for successful implementation and integration of
Lean assessment tools/framework
FINAL DEGREE REPORT - PRADNYA BAVISKAR 25
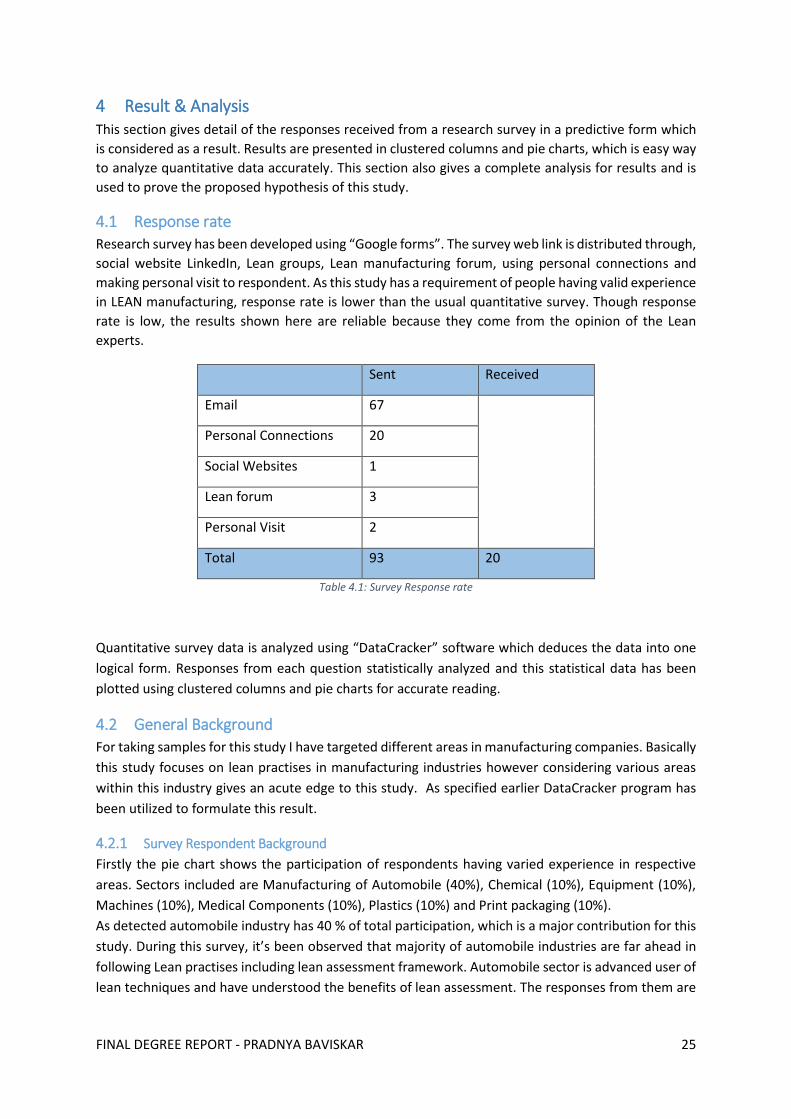
4 Result & Analysis This section gives detail of the responses received from a research survey in a predictive form which
is considered as a result. Results are presented in clustered columns and pie charts, which is easy way
to analyze quantitative data accurately. This section also gives a complete analysis for results and is
used to prove the proposed hypothesis of this study.
4.1 Response rate
Research survey has been developed using “Google forms”. The survey web link is distributed through,
social website LinkedIn, Lean groups, Lean manufacturing forum, using personal connections and
making personal visit to respondent. As this study has a requirement of people having valid experience
in LEAN manufacturing, response rate is lower than the usual quantitative survey. Though response
rate is low, the results shown here are reliable because they come from the opinion of the Lean
experts.
Table 4.1: Survey Response rate
Quantitative survey data is analyzed using “DataCracker” software which deduces the data into one
logical form. Responses from each question statistically analyzed and this statistical data has been
plotted using clustered columns and pie charts for accurate reading.
4.2 General Background
For taking samples for this study I have targeted different areas in manufacturing companies. Basically
this study focuses on lean practises in manufacturing industries however considering various areas
within this industry gives an acute edge to this study. As specified earlier DataCracker program has
been utilized to formulate this result.
4.2.1 Survey Respondent Background
Firstly the pie chart shows the participation of respondents having varied experience in respective
areas. Sectors included are Manufacturing of Automobile (40%), Chemical (10%), Equipment (10%),
Machines (10%), Medical Components (10%), Plastics (10%) and Print packaging (10%).
As detected automobile industry has 40 % of total participation, which is a major contribution for this
study. During this survey, it’s been observed that majority of automobile industries are far ahead in
following Lean practises including lean assessment framework. Automobile sector is advanced user of
lean techniques and have understood the benefits of lean assessment. The responses from them are
Sent Received
Email 67
Personal Connections 20
Social Websites 1
Lean forum 3
Personal Visit 2
Total 93 20
FINAL DEGREE REPORT - PRADNYA BAVISKAR 26
valid as they have an understanding of important factors necessary for implementation of lean
assessment framework.
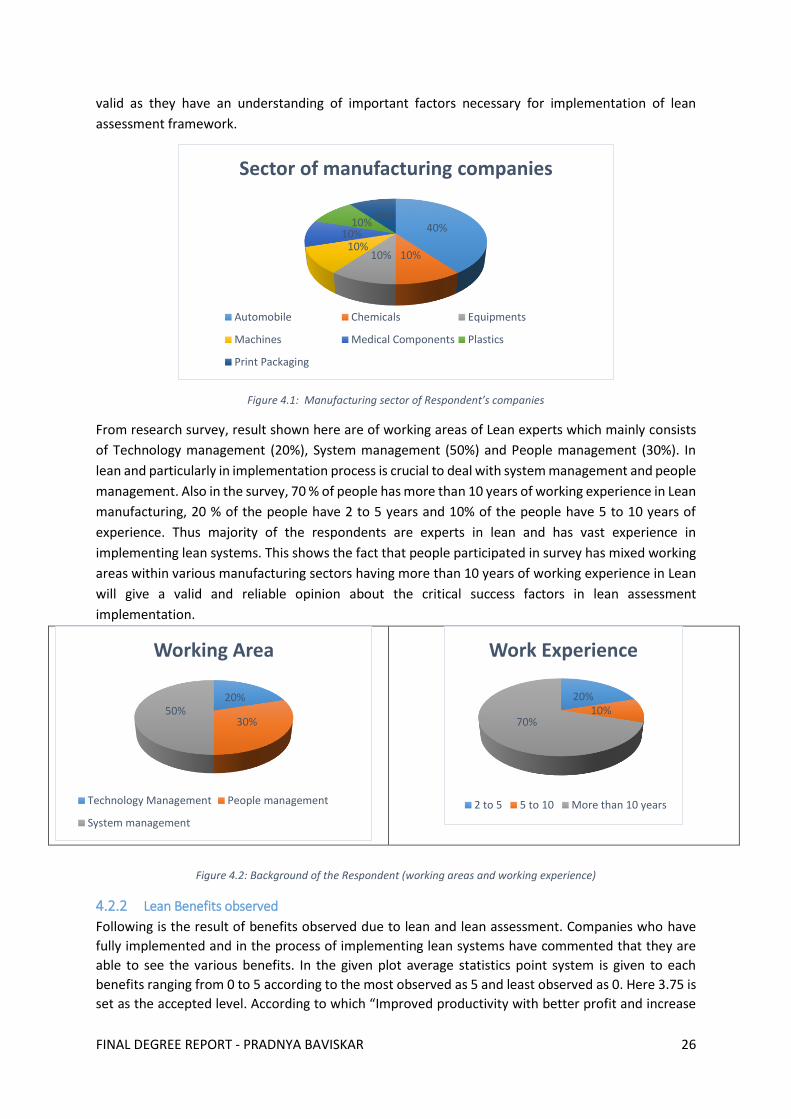
Figure 4.1: Manufacturing sector of Respondent’s companies
From research survey, result shown here are of working areas of Lean experts which mainly consists
of Technology management (20%), System management (50%) and People management (30%). In
lean and particularly in implementation process is crucial to deal with system management and people
management. Also in the survey, 70 % of people has more than 10 years of working experience in Lean
manufacturing, 20 % of the people have 2 to 5 years and 10% of the people have 5 to 10 years of
experience. Thus majority of the respondents are experts in lean and has vast experience in
implementing lean systems. This shows the fact that people participated in survey has mixed working
areas within various manufacturing sectors having more than 10 years of working experience in Lean
will give a valid and reliable opinion about the critical success factors in lean assessment
implementation.
Figure 4.2: Background of the Respondent (working areas and working experience)
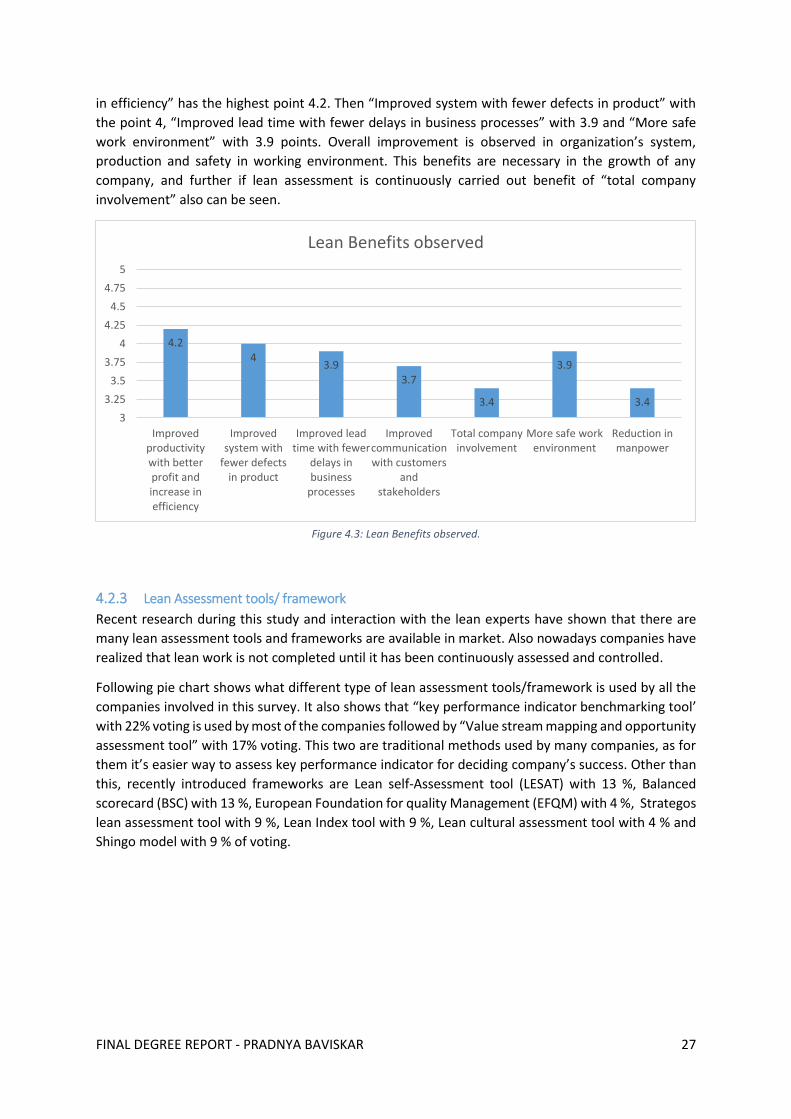
4.2.2 Lean Benefits observed
Following is the result of benefits observed due to lean and lean assessment. Companies who have
fully implemented and in the process of implementing lean systems have commented that they are
able to see the various benefits. In the given plot average statistics point system is given to each
benefits ranging from 0 to 5 according to the most observed as 5 and least observed as 0. Here 3.75 is
set as the accepted level. According to which “Improved productivity with better profit and increase
20%
30%50%
Working Area
Technology Management People management
System management
20%10%
70%
Work Experience
2 to 5 5 to 10 More than 10 years
40%
10%10%10%
10%10%
10%
Sector of manufacturing companies
Automobile Chemicals Equipments
Machines Medical Components Plastics
Print Packaging
FINAL DEGREE REPORT - PRADNYA BAVISKAR 27
in efficiency” has the highest point 4.2. Then “Improved system with fewer defects in product” with
the point 4, “Improved lead time with fewer delays in business processes” with 3.9 and “More safe
work environment” with 3.9 points. Overall improvement is observed in organization’s system,
production and safety in working environment. This benefits are necessary in the growth of any
company, and further if lean assessment is continuously carried out benefit of “total company
involvement” also can be seen.
Figure 4.3: Lean Benefits observed.
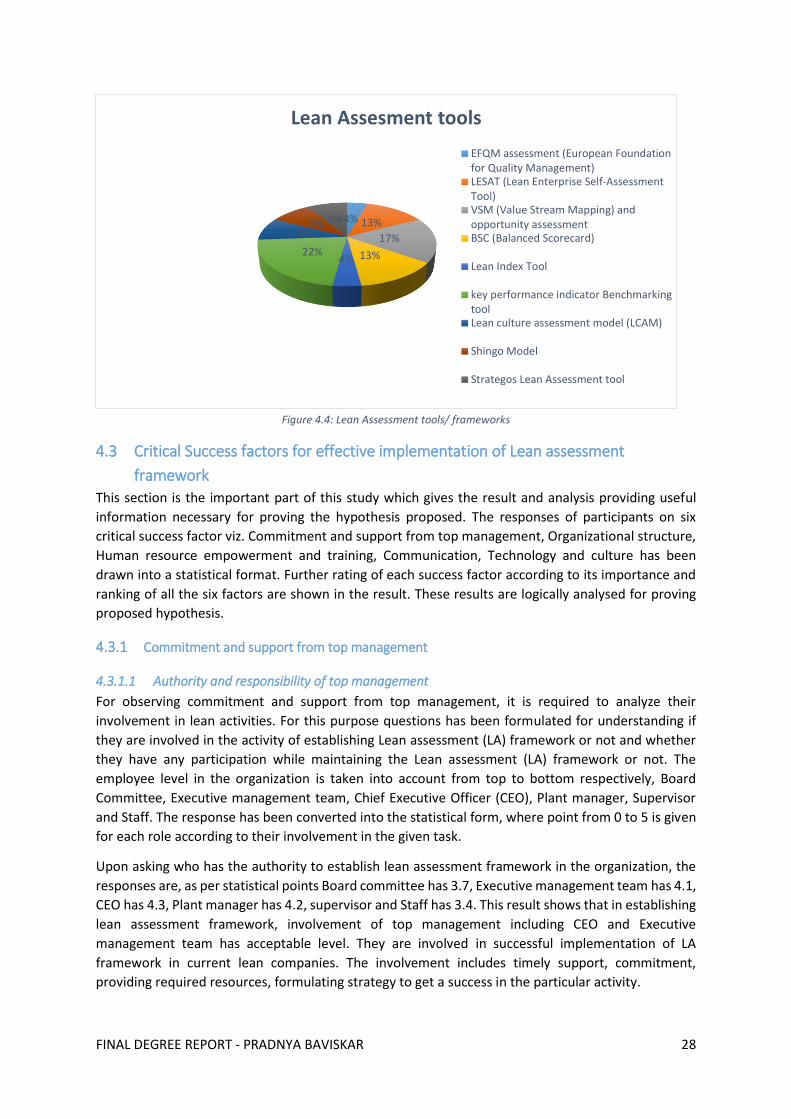
4.2.3 Lean Assessment tools/ framework
Recent research during this study and interaction with the lean experts have shown that there are
many lean assessment tools and frameworks are available in market. Also nowadays companies have
realized that lean work is not completed until it has been continuously assessed and controlled.
Following pie chart shows what different type of lean assessment tools/framework is used by all the
companies involved in this survey. It also shows that “key performance indicator benchmarking tool’
with 22% voting is used by most of the companies followed by “Value stream mapping and opportunity
assessment tool” with 17% voting. This two are traditional methods used by many companies, as for
them it’s easier way to assess key performance indicator for deciding company’s success. Other than
this, recently introduced frameworks are Lean self-Assessment tool (LESAT) with 13 %, Balanced
scorecard (BSC) with 13 %, European Foundation for quality Management (EFQM) with 4 %, Strategos
lean assessment tool with 9 %, Lean Index tool with 9 %, Lean cultural assessment tool with 4 % and
Shingo model with 9 % of voting.
4.24
3.93.7
3.4
3.9
3.4
3
3.25
3.5
3.75
4
4.25
4.5
4.75
5
Improvedproductivitywith betterprofit andincrease inefficiency
Improvedsystem with
fewer defectsin product
Improved leadtime with fewer
delays inbusiness
processes
Improvedcommunicationwith customers
andstakeholders
Total companyinvolvement
More safe workenvironment
Reduction inmanpower
Lean Benefits observed
FINAL DEGREE REPORT - PRADNYA BAVISKAR 28
Figure 4.4: Lean Assessment tools/ frameworks
4.3 Critical Success factors for effective implementation of Lean assessment
framework
This section is the important part of this study which gives the result and analysis providing useful
information necessary for proving the hypothesis proposed. The responses of participants on six
critical success factor viz. Commitment and support from top management, Organizational structure,
Human resource empowerment and training, Communication, Technology and culture has been
drawn into a statistical format. Further rating of each success factor according to its importance and
ranking of all the six factors are shown in the result. These results are logically analysed for proving
proposed hypothesis.
4.3.1 Commitment and support from top management
4.3.1.1 Authority and responsibility of top management
For observing commitment and support from top management, it is required to analyze their
involvement in lean activities. For this purpose questions has been formulated for understanding if
they are involved in the activity of establishing Lean assessment (LA) framework or not and whether
they have any participation while maintaining the Lean assessment (LA) framework or not. The
employee level in the organization is taken into account from top to bottom respectively, Board
Committee, Executive management team, Chief Executive Officer (CEO), Plant manager, Supervisor
and Staff. The response has been converted into the statistical form, where point from 0 to 5 is given
for each role according to their involvement in the given task.
Upon asking who has the authority to establish lean assessment framework in the organization, the
responses are, as per statistical points Board committee has 3.7, Executive management team has 4.1,
CEO has 4.3, Plant manager has 4.2, supervisor and Staff has 3.4. This result shows that in establishing
lean assessment framework, involvement of top management including CEO and Executive
management team has acceptable level. They are involved in successful implementation of LA
framework in current lean companies. The involvement includes timely support, commitment,
providing required resources, formulating strategy to get a success in the particular activity.
4% 13%
17%
13%4%22%
9%9% 9%
Lean Assesment tools
EFQM assessment (European Foundationfor Quality Management)LESAT (Lean Enterprise Self-AssessmentTool)VSM (Value Stream Mapping) andopportunity assessmentBSC (Balanced Scorecard)
Lean Index Tool
key performance indicator BenchmarkingtoolLean culture assessment model (LCAM)
Shingo Model
Strategos Lean Assessment tool
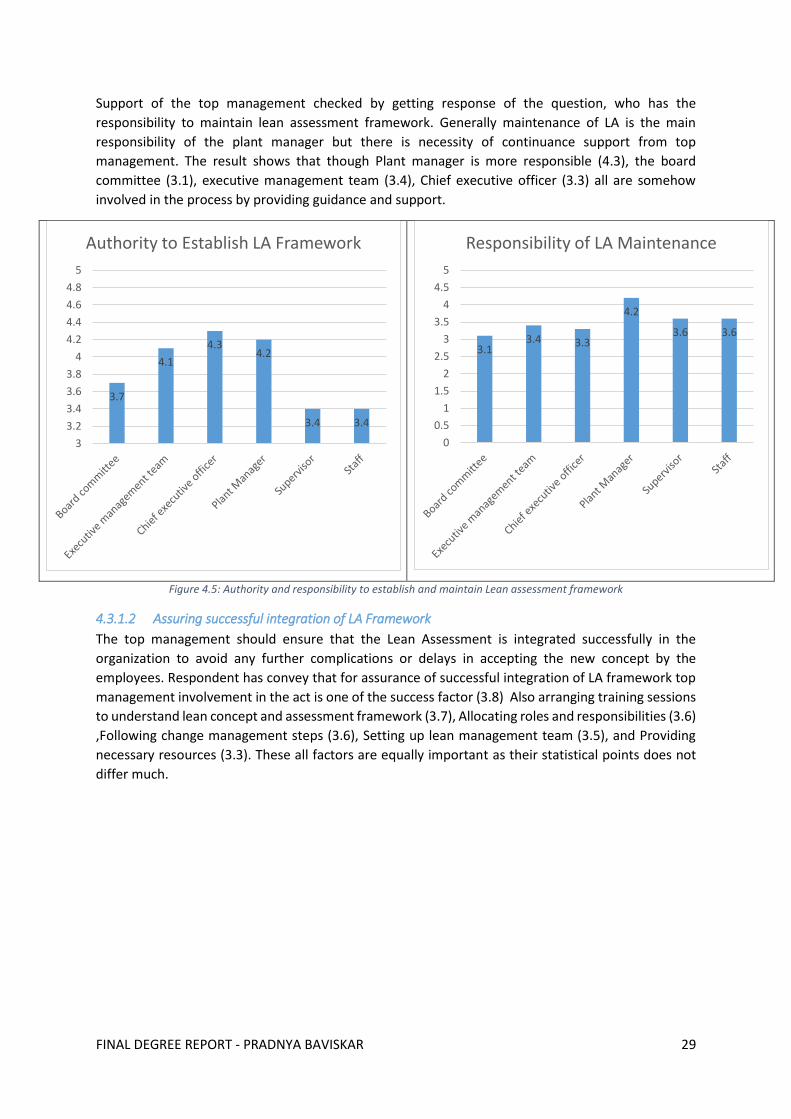
FINAL DEGREE REPORT - PRADNYA BAVISKAR 29
Support of the top management checked by getting response of the question, who has the
responsibility to maintain lean assessment framework. Generally maintenance of LA is the main
responsibility of the plant manager but there is necessity of continuance support from top
management. The result shows that though Plant manager is more responsible (4.3), the board
committee (3.1), executive management team (3.4), Chief executive officer (3.3) all are somehow
involved in the process by providing guidance and support.
Figure 4.5: Authority and responsibility to establish and maintain Lean assessment framework
4.3.1.2 Assuring successful integration of LA Framework
The top management should ensure that the Lean Assessment is integrated successfully in the
organization to avoid any further complications or delays in accepting the new concept by the
employees. Respondent has convey that for assurance of successful integration of LA framework top
management involvement in the act is one of the success factor (3.8) Also arranging training sessions
to understand lean concept and assessment framework (3.7), Allocating roles and responsibilities (3.6)
,Following change management steps (3.6), Setting up lean management team (3.5), and Providing
necessary resources (3.3). These all factors are equally important as their statistical points does not
differ much.
3.7
4.1
4.34.2
3.4 3.4
3
3.2
3.4
3.6
3.8
4
4.2
4.4
4.6
4.8
5
Authority to Establish LA Framework
3.13.4 3.3
4.2
3.6 3.6
0
0.5
1
1.5
2
2.5
3
3.5
4
4.5
5
Responsibility of LA Maintenance
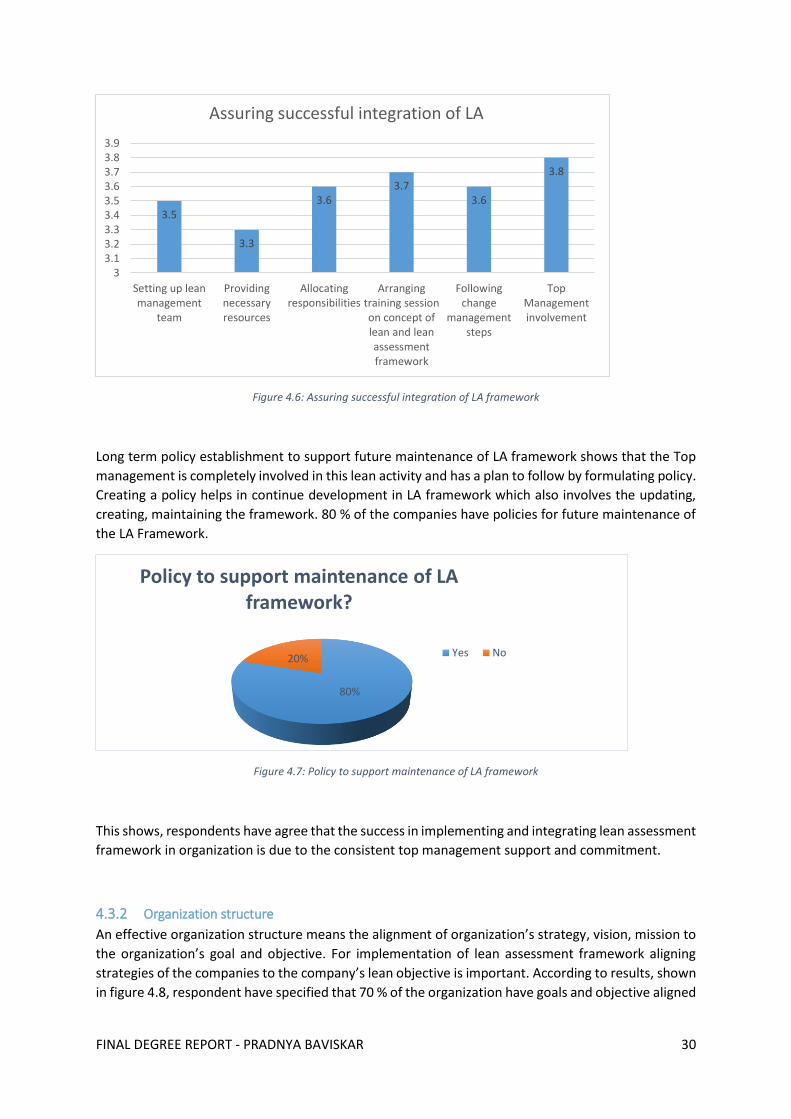
FINAL DEGREE REPORT - PRADNYA BAVISKAR 30
Figure 4.6: Assuring successful integration of LA framework
Long term policy establishment to support future maintenance of LA framework shows that the Top
management is completely involved in this lean activity and has a plan to follow by formulating policy.
Creating a policy helps in continue development in LA framework which also involves the updating,
creating, maintaining the framework. 80 % of the companies have policies for future maintenance of
the LA Framework.
Figure 4.7: Policy to support maintenance of LA framework
This shows, respondents have agree that the success in implementing and integrating lean assessment
framework in organization is due to the consistent top management support and commitment.
4.3.2 Organization structure
An effective organization structure means the alignment of organization’s strategy, vision, mission to
the organization’s goal and objective. For implementation of lean assessment framework aligning
strategies of the companies to the company’s lean objective is important. According to results, shown
in figure 4.8, respondent have specified that 70 % of the organization have goals and objective aligned
3.5
3.3
3.63.7
3.6
3.8
33.13.23.33.43.53.63.73.83.9
Setting up leanmanagement
team
Providingnecessaryresources
Allocatingresponsibilities
Arrangingtraining sessionon concept oflean and leanassessmentframework
Followingchange
managementsteps
TopManagementinvolvement
Assuring successful integration of LA
80%
20%
Policy to support maintenance of LA framework?
Yes No
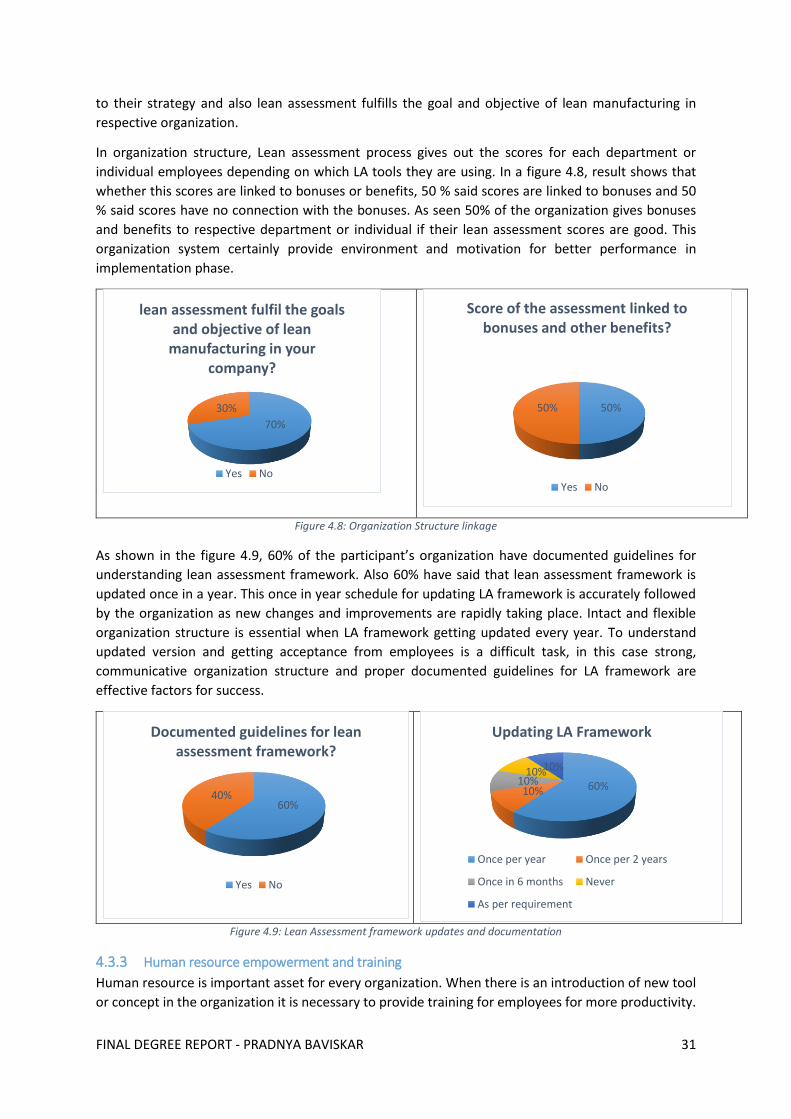
FINAL DEGREE REPORT - PRADNYA BAVISKAR 31
to their strategy and also lean assessment fulfills the goal and objective of lean manufacturing in
respective organization.
In organization structure, Lean assessment process gives out the scores for each department or
individual employees depending on which LA tools they are using. In a figure 4.8, result shows that
whether this scores are linked to bonuses or benefits, 50 % said scores are linked to bonuses and 50
% said scores have no connection with the bonuses. As seen 50% of the organization gives bonuses
and benefits to respective department or individual if their lean assessment scores are good. This
organization system certainly provide environment and motivation for better performance in
implementation phase.
Figure 4.8: Organization Structure linkage
As shown in the figure 4.9, 60% of the participant’s organization have documented guidelines for
understanding lean assessment framework. Also 60% have said that lean assessment framework is
updated once in a year. This once in year schedule for updating LA framework is accurately followed
by the organization as new changes and improvements are rapidly taking place. Intact and flexible
organization structure is essential when LA framework getting updated every year. To understand
updated version and getting acceptance from employees is a difficult task, in this case strong,
communicative organization structure and proper documented guidelines for LA framework are
effective factors for success.
Figure 4.9: Lean Assessment framework updates and documentation
4.3.3 Human resource empowerment and training
Human resource is important asset for every organization. When there is an introduction of new tool
or concept in the organization it is necessary to provide training for employees for more productivity.
70%
30%
lean assessment fulfil the goals and objective of lean
manufacturing in your company?
Yes No
50%50%
Score of the assessment linked to bonuses and other benefits?
Yes No
60%40%
Documented guidelines for lean assessment framework?
Yes No
60%10%10%
10%10%
Updating LA Framework
Once per year Once per 2 years
Once in 6 months Never
As per requirement
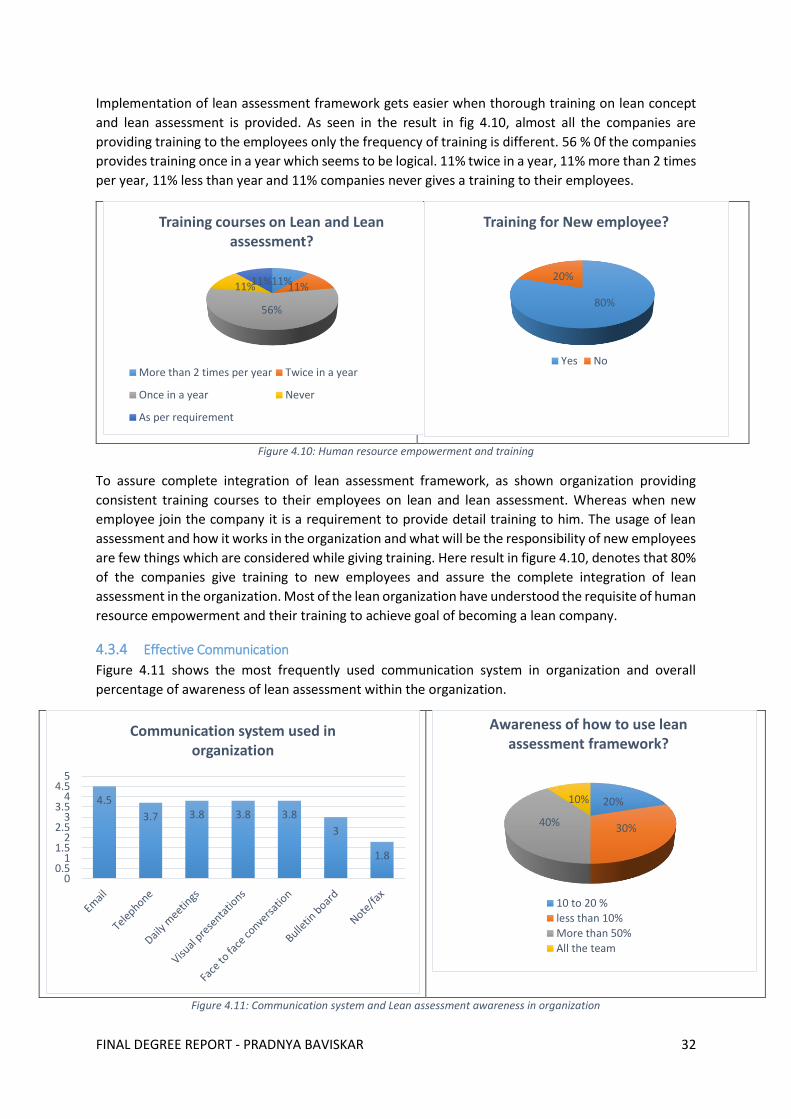
FINAL DEGREE REPORT - PRADNYA BAVISKAR 32
Implementation of lean assessment framework gets easier when thorough training on lean concept
and lean assessment is provided. As seen in the result in fig 4.10, almost all the companies are
providing training to the employees only the frequency of training is different. 56 % 0f the companies
provides training once in a year which seems to be logical. 11% twice in a year, 11% more than 2 times
per year, 11% less than year and 11% companies never gives a training to their employees.
Figure 4.10: Human resource empowerment and training
To assure complete integration of lean assessment framework, as shown organization providing
consistent training courses to their employees on lean and lean assessment. Whereas when new
employee join the company it is a requirement to provide detail training to him. The usage of lean
assessment and how it works in the organization and what will be the responsibility of new employees
are few things which are considered while giving training. Here result in figure 4.10, denotes that 80%
of the companies give training to new employees and assure the complete integration of lean
assessment in the organization. Most of the lean organization have understood the requisite of human
resource empowerment and their training to achieve goal of becoming a lean company.
4.3.4 Effective Communication
Figure 4.11 shows the most frequently used communication system in organization and overall
percentage of awareness of lean assessment within the organization.
Figure 4.11: Communication system and Lean assessment awareness in organization
11%11%
56%
11%11%
Training courses on Lean and Lean assessment?
More than 2 times per year Twice in a year
Once in a year Never
As per requirement
80%
20%
Training for New employee?
Yes No
4.5
3.7 3.8 3.8 3.8
3
1.8
00.5
11.5
22.5
33.5
44.5
5
Communication system used in organization
20%
30%40%
10%
Awareness of how to use lean assessment framework?
10 to 20 %
less than 10%
More than 50%
All the team
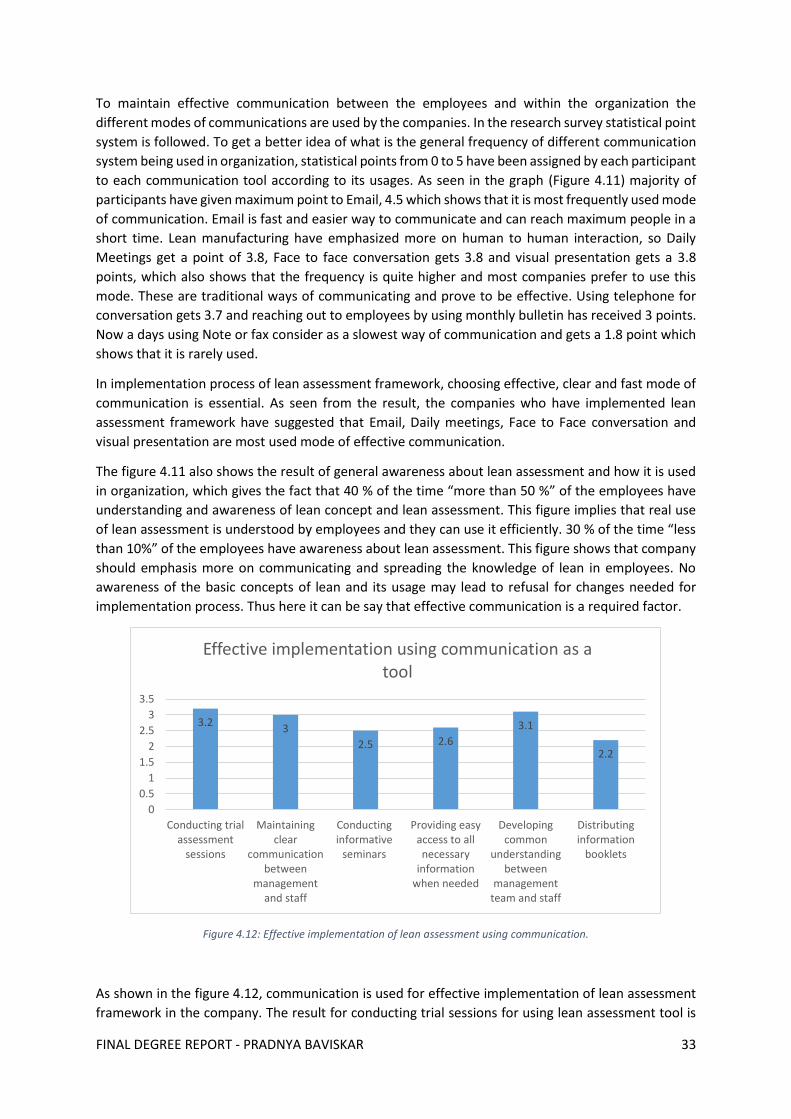
FINAL DEGREE REPORT - PRADNYA BAVISKAR 33
To maintain effective communication between the employees and within the organization the
different modes of communications are used by the companies. In the research survey statistical point
system is followed. To get a better idea of what is the general frequency of different communication
system being used in organization, statistical points from 0 to 5 have been assigned by each participant
to each communication tool according to its usages. As seen in the graph (Figure 4.11) majority of
participants have given maximum point to Email, 4.5 which shows that it is most frequently used mode
of communication. Email is fast and easier way to communicate and can reach maximum people in a
short time. Lean manufacturing have emphasized more on human to human interaction, so Daily
Meetings get a point of 3.8, Face to face conversation gets 3.8 and visual presentation gets a 3.8
points, which also shows that the frequency is quite higher and most companies prefer to use this
mode. These are traditional ways of communicating and prove to be effective. Using telephone for
conversation gets 3.7 and reaching out to employees by using monthly bulletin has received 3 points.
Now a days using Note or fax consider as a slowest way of communication and gets a 1.8 point which
shows that it is rarely used.
In implementation process of lean assessment framework, choosing effective, clear and fast mode of
communication is essential. As seen from the result, the companies who have implemented lean
assessment framework have suggested that Email, Daily meetings, Face to Face conversation and
visual presentation are most used mode of effective communication.
The figure 4.11 also shows the result of general awareness about lean assessment and how it is used
in organization, which gives the fact that 40 % of the time “more than 50 %” of the employees have
understanding and awareness of lean concept and lean assessment. This figure implies that real use
of lean assessment is understood by employees and they can use it efficiently. 30 % of the time “less
than 10%” of the employees have awareness about lean assessment. This figure shows that company
should emphasis more on communicating and spreading the knowledge of lean in employees. No
awareness of the basic concepts of lean and its usage may lead to refusal for changes needed for
implementation process. Thus here it can be say that effective communication is a required factor.
Figure 4.12: Effective implementation of lean assessment using communication.
As shown in the figure 4.12, communication is used for effective implementation of lean assessment
framework in the company. The result for conducting trial sessions for using lean assessment tool is
3.23
2.5 2.6
3.1
2.2
0
0.5
1
1.5
2
2.5
3
3.5
Conducting trialassessment
sessions
Maintainingclear
communicationbetween
managementand staff
Conductinginformative
seminars
Providing easyaccess to allnecessary
informationwhen needed
Developingcommon
understandingbetween
managementteam and staff
Distributinginformation
booklets
Effective implementation using communication as a tool
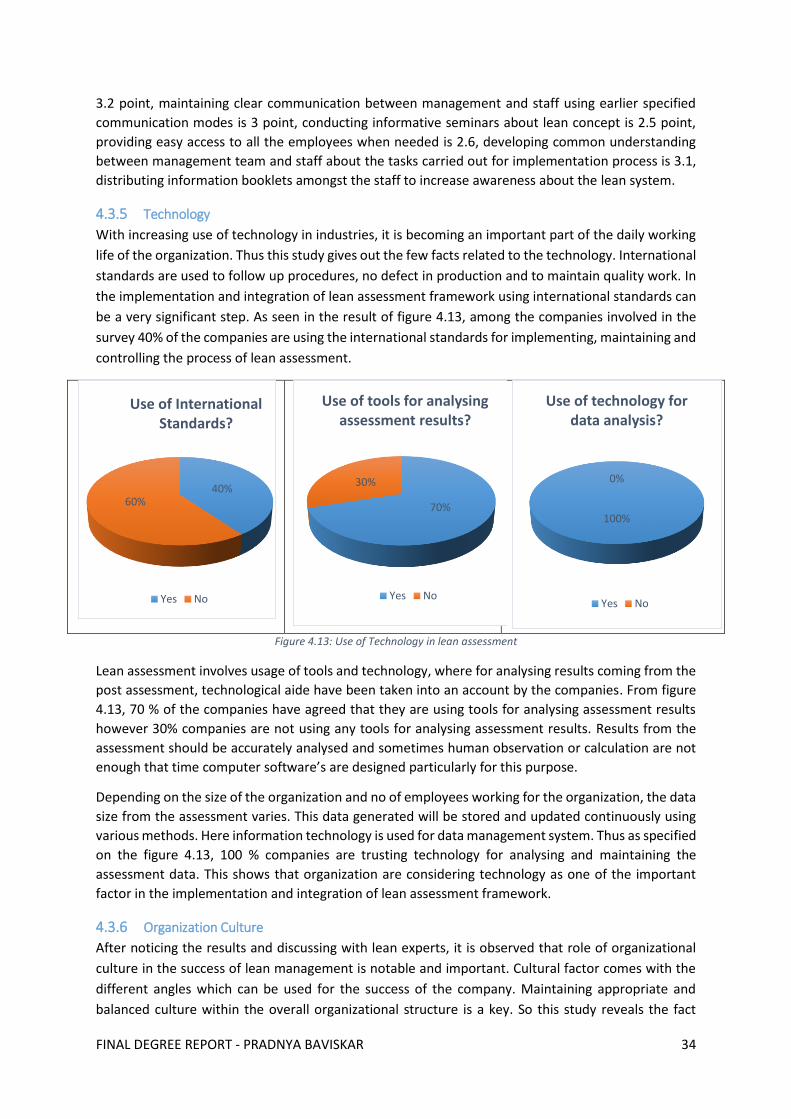
FINAL DEGREE REPORT - PRADNYA BAVISKAR 34
3.2 point, maintaining clear communication between management and staff using earlier specified
communication modes is 3 point, conducting informative seminars about lean concept is 2.5 point,
providing easy access to all the employees when needed is 2.6, developing common understanding
between management team and staff about the tasks carried out for implementation process is 3.1,
distributing information booklets amongst the staff to increase awareness about the lean system.
4.3.5 Technology
With increasing use of technology in industries, it is becoming an important part of the daily working
life of the organization. Thus this study gives out the few facts related to the technology. International
standards are used to follow up procedures, no defect in production and to maintain quality work. In
the implementation and integration of lean assessment framework using international standards can
be a very significant step. As seen in the result of figure 4.13, among the companies involved in the
survey 40% of the companies are using the international standards for implementing, maintaining and
controlling the process of lean assessment.
Figure 4.13: Use of Technology in lean assessment
Lean assessment involves usage of tools and technology, where for analysing results coming from the
post assessment, technological aide have been taken into an account by the companies. From figure
4.13, 70 % of the companies have agreed that they are using tools for analysing assessment results
however 30% companies are not using any tools for analysing assessment results. Results from the
assessment should be accurately analysed and sometimes human observation or calculation are not
enough that time computer software’s are designed particularly for this purpose.
Depending on the size of the organization and no of employees working for the organization, the data
size from the assessment varies. This data generated will be stored and updated continuously using
various methods. Here information technology is used for data management system. Thus as specified
on the figure 4.13, 100 % companies are trusting technology for analysing and maintaining the
assessment data. This shows that organization are considering technology as one of the important
factor in the implementation and integration of lean assessment framework.
4.3.6 Organization Culture
After noticing the results and discussing with lean experts, it is observed that role of organizational
culture in the success of lean management is notable and important. Cultural factor comes with the
different angles which can be used for the success of the company. Maintaining appropriate and
balanced culture within the overall organizational structure is a key. So this study reveals the fact
40%60%
Use of International Standards?
Yes No
70%
30%
Use of tools for analysing assessment results?
Yes No
100%
0%
Use of technology for data analysis?
Yes No
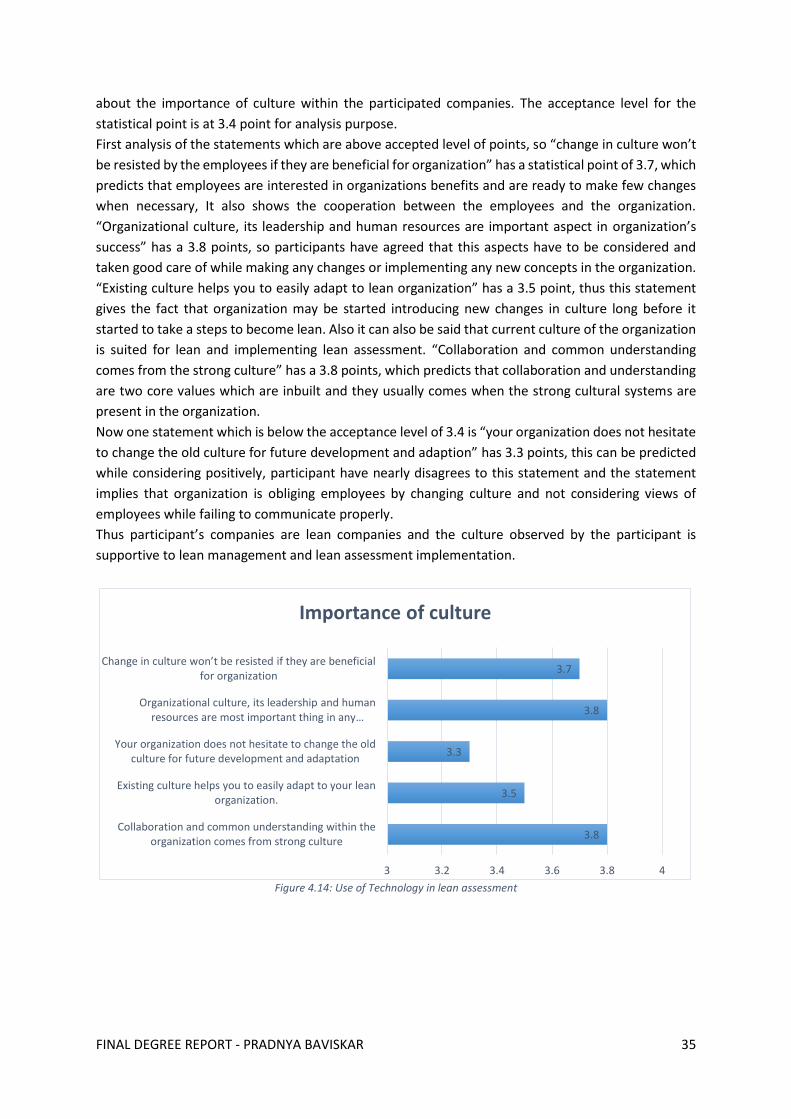
FINAL DEGREE REPORT - PRADNYA BAVISKAR 35
about the importance of culture within the participated companies. The acceptance level for the
statistical point is at 3.4 point for analysis purpose.
First analysis of the statements which are above accepted level of points, so “change in culture won’t
be resisted by the employees if they are beneficial for organization” has a statistical point of 3.7, which
predicts that employees are interested in organizations benefits and are ready to make few changes
when necessary, It also shows the cooperation between the employees and the organization.
“Organizational culture, its leadership and human resources are important aspect in organization’s
success” has a 3.8 points, so participants have agreed that this aspects have to be considered and
taken good care of while making any changes or implementing any new concepts in the organization.
“Existing culture helps you to easily adapt to lean organization” has a 3.5 point, thus this statement
gives the fact that organization may be started introducing new changes in culture long before it
started to take a steps to become lean. Also it can also be said that current culture of the organization
is suited for lean and implementing lean assessment. “Collaboration and common understanding
comes from the strong culture” has a 3.8 points, which predicts that collaboration and understanding
are two core values which are inbuilt and they usually comes when the strong cultural systems are
present in the organization.
Now one statement which is below the acceptance level of 3.4 is “your organization does not hesitate
to change the old culture for future development and adaption” has 3.3 points, this can be predicted
while considering positively, participant have nearly disagrees to this statement and the statement
implies that organization is obliging employees by changing culture and not considering views of
employees while failing to communicate properly.
Thus participant’s companies are lean companies and the culture observed by the participant is
supportive to lean management and lean assessment implementation.
Figure 4.14: Use of Technology in lean assessment
3.8
3.5
3.3
3.8
3.7
3 3.2 3.4 3.6 3.8 4
Collaboration and common understanding within theorganization comes from strong culture
Existing culture helps you to easily adapt to your leanorganization.
Your organization does not hesitate to change the oldculture for future development and adaptation
Organizational culture, its leadership and human resources are most important thing in any …
Change in culture won’t be resisted if they are beneficial for organization
Importance of culture
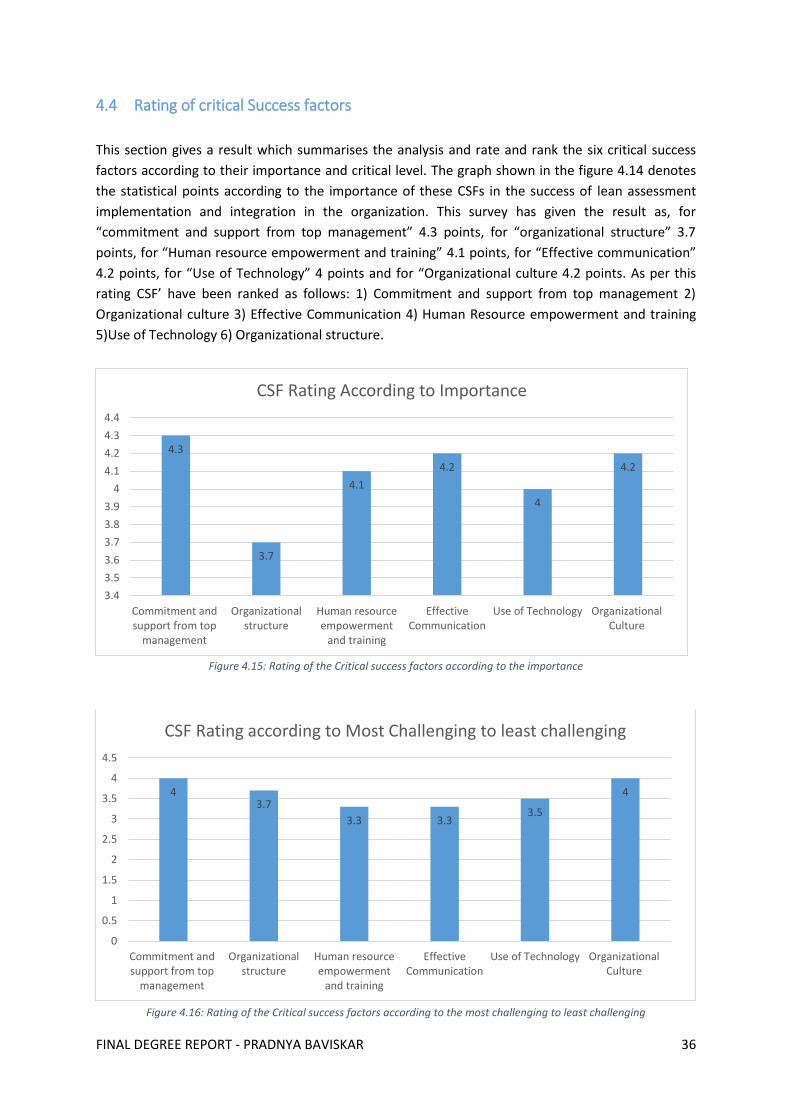
FINAL DEGREE REPORT - PRADNYA BAVISKAR 36
4.4 Rating of critical Success factors
This section gives a result which summarises the analysis and rate and rank the six critical success
factors according to their importance and critical level. The graph shown in the figure 4.14 denotes
the statistical points according to the importance of these CSFs in the success of lean assessment
implementation and integration in the organization. This survey has given the result as, for
“commitment and support from top management” 4.3 points, for “organizational structure” 3.7
points, for “Human resource empowerment and training” 4.1 points, for “Effective communication”
4.2 points, for “Use of Technology” 4 points and for “Organizational culture 4.2 points. As per this
rating CSF’ have been ranked as follows: 1) Commitment and support from top management 2)
Organizational culture 3) Effective Communication 4) Human Resource empowerment and training
5)Use of Technology 6) Organizational structure.
Figure 4.15: Rating of the Critical success factors according to the importance
Figure 4.16: Rating of the Critical success factors according to the most challenging to least challenging
4.3
3.7
4.1
4.2
4
4.2
3.4
3.5
3.6
3.7
3.8
3.9
4
4.1
4.2
4.3
4.4
Commitment andsupport from top
management
Organizationalstructure
Human resourceempowerment
and training
EffectiveCommunication
Use of Technology OrganizationalCulture
CSF Rating According to Importance
43.7
3.3 3.33.5
4
0
0.5
1
1.5
2
2.5
3
3.5
4
4.5
Commitment andsupport from top
management
Organizationalstructure
Human resourceempowerment
and training
EffectiveCommunication
Use of Technology OrganizationalCulture
CSF Rating according to Most Challenging to least challenging
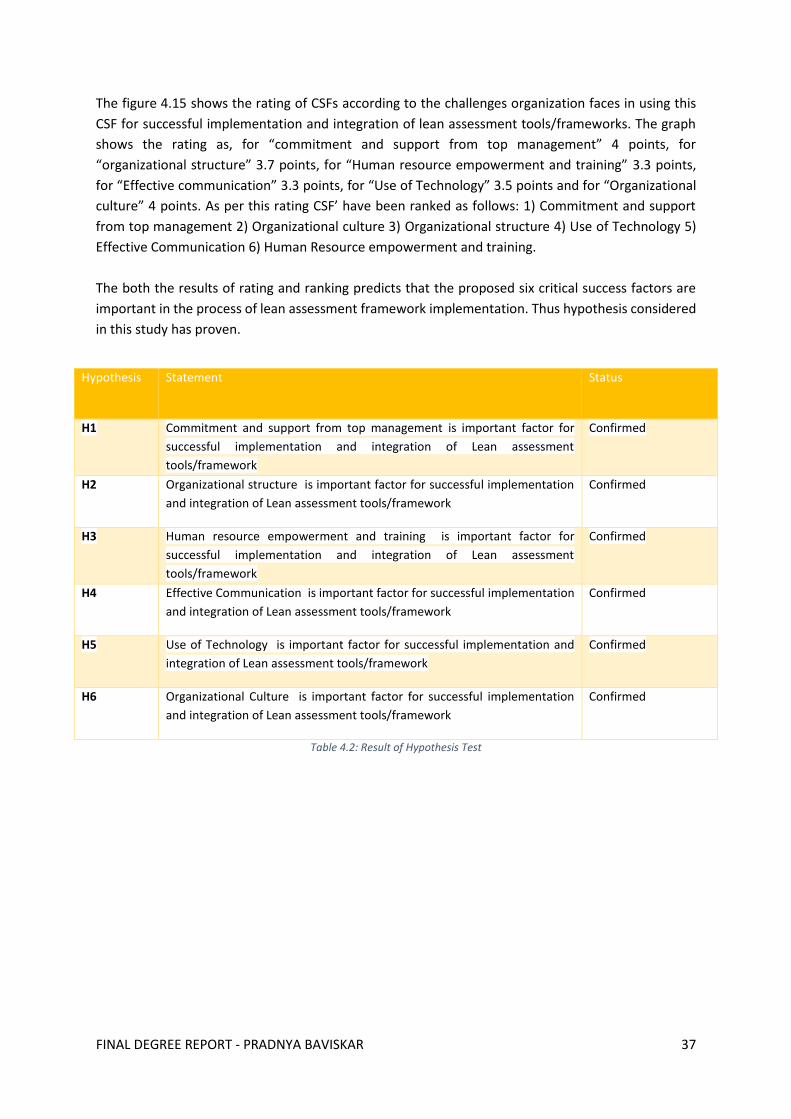
FINAL DEGREE REPORT - PRADNYA BAVISKAR 37
The figure 4.15 shows the rating of CSFs according to the challenges organization faces in using this
CSF for successful implementation and integration of lean assessment tools/frameworks. The graph
shows the rating as, for “commitment and support from top management” 4 points, for
“organizational structure” 3.7 points, for “Human resource empowerment and training” 3.3 points,
for “Effective communication” 3.3 points, for “Use of Technology” 3.5 points and for “Organizational
culture” 4 points. As per this rating CSF’ have been ranked as follows: 1) Commitment and support
from top management 2) Organizational culture 3) Organizational structure 4) Use of Technology 5)
Effective Communication 6) Human Resource empowerment and training.
The both the results of rating and ranking predicts that the proposed six critical success factors are
important in the process of lean assessment framework implementation. Thus hypothesis considered
in this study has proven.
Table 4.2: Result of Hypothesis Test
Hypothesis Statement Status
H1 Commitment and support from top management is important factor for
successful implementation and integration of Lean assessment
tools/framework
Confirmed
H2 Organizational structure is important factor for successful implementation
and integration of Lean assessment tools/framework
Confirmed
H3 Human resource empowerment and training is important factor for
successful implementation and integration of Lean assessment
tools/framework
Confirmed
H4 Effective Communication is important factor for successful implementation
and integration of Lean assessment tools/framework
Confirmed
H5 Use of Technology is important factor for successful implementation and
integration of Lean assessment tools/framework
Confirmed
H6 Organizational Culture is important factor for successful implementation
and integration of Lean assessment tools/framework
Confirmed
FINAL DEGREE REPORT - PRADNYA BAVISKAR 38
5 Discussion
The identified critical success factors are genuine in nature and can successfully use by any sector of
the manufacturing companies. As shown in the results participants have selected from different sector
within the manufacturing industry and they supported the selection of set of CSFs necessary for
implementation of lean assessment framework. The participants are skilled officials working in lean
companies and some companies involved in survey are top establishment of Lean manufacturing and
they have been using lean assessment from a long time.
5.1 Commitment and support from top management
Many researchers have mentioned in their studies that Commitment and support from top
management and active leadership is considered as a major success factor for the implementation
process (Alaskari & Ahmad et al 2012, Rose, Deros & Rahman 2014, Kundu & Manohar, 2012). Continue
involvement of top management in the process of implementation of lean assessment motivates the
employees and increases the overall performance of the process. During the research respondents
have accepted that in a change management due to implementation process, top management
supports the employees by providing necessary resources. This involvement of top management leads
to a higher performance and success, whereas in the given research, Top management commitment
and support is the top ranked and most choice critical success factor selected by the survey
respondent.
5.2 Organizational culture
The one response for the question “what assessment tools are used by the company”, was from the
lean organization as “lean assessment is only a starting point and real goal is to establish lean culture
within an organization”. This statement clearly shows the importance of a Lean culture in well-
established lean companies and further it also suggests the fact that the process of becoming lean has
to start with building a strong lean culture amongst the employees. Hence the results from this study
states the same that organization culture is major part of a successful lean organization and it helps
to effectively manage implementation process of lean assessment.
5.3 Effective Communication
Aforementioned communication is basic tool for connecting people working together, hence effective
communication is most necessary and important factor of the lean system (Achanga et al,2006,
Punnakitikashem, Buavaraporn & Chen, 2013) Effective communication is one of the success factor
for the implementation of lean tools including lean assessment framework (Alaskari & Ahmad et al
2012, Rose, Deros & Rahman 2014). This study has given the results showing effective communication
as critical success factor for implementation of lean assessment tools/ framework. Participants have
suggested that the organization maintaining the communication with the employees about the new
updates in lean assessment framework. Also they are understanding the progress of the processes by
performing daily meetings and having face to face conversation which is necessary to know the
requirements of the employees.
FINAL DEGREE REPORT - PRADNYA BAVISKAR 39
5.4 Organizational Structure
Organizational structure assure the alignment of organizations objective to its strategy. It also make
sure the role and responsibility of different levels in the organization is properly maintained and
understood by everyone, which is mostly required when the process of lean assessment
implementation starts. Hence the research also proves that the organization structure is a critical
success factor in the implementation of lean assessment framework.
5.5 Technology
Also technology considered as one of the critical success factor of lean assessment implementation as
lean assessment itself involves technological aid. Lean assessment involves, collecting data from
different resources, analyzing the large no of data, analyzing it and making prediction out of this
received data during each process various software, process technologies are used. Also for suggesting
improvement after analyzing data one needs to be trained in handling this software. This large no. of
data has to be stored for future references, then also technology comes handy like using data
management system for storage and updates of the assessment data. This research also supported
technology as a critical success factor.
5.6 Human resource empowerment and training
The factor human resource empowerment and training, suggested in researches has important
contribution in the success of lean assessment implementation (Mohammad, Rashidi & Karimdoust,
2014, Jurado, Fuentes & Gomez, 2014, Alaskari & Ahmad et al 2012). Understanding human values
and empowering them is a one way of assuring better performance, however this study reveals that
the companies are spending lot of time and money on training the present and new employees,
because they have understood the benefits achieved by trained employees. Different courses on lean
concept and lean assessment has been provided in companies for easing the process of
implementation. Thus survey shows that human empowerment and training is critical success factor
for implementation of lean assessment framework in the manufacturing industries.
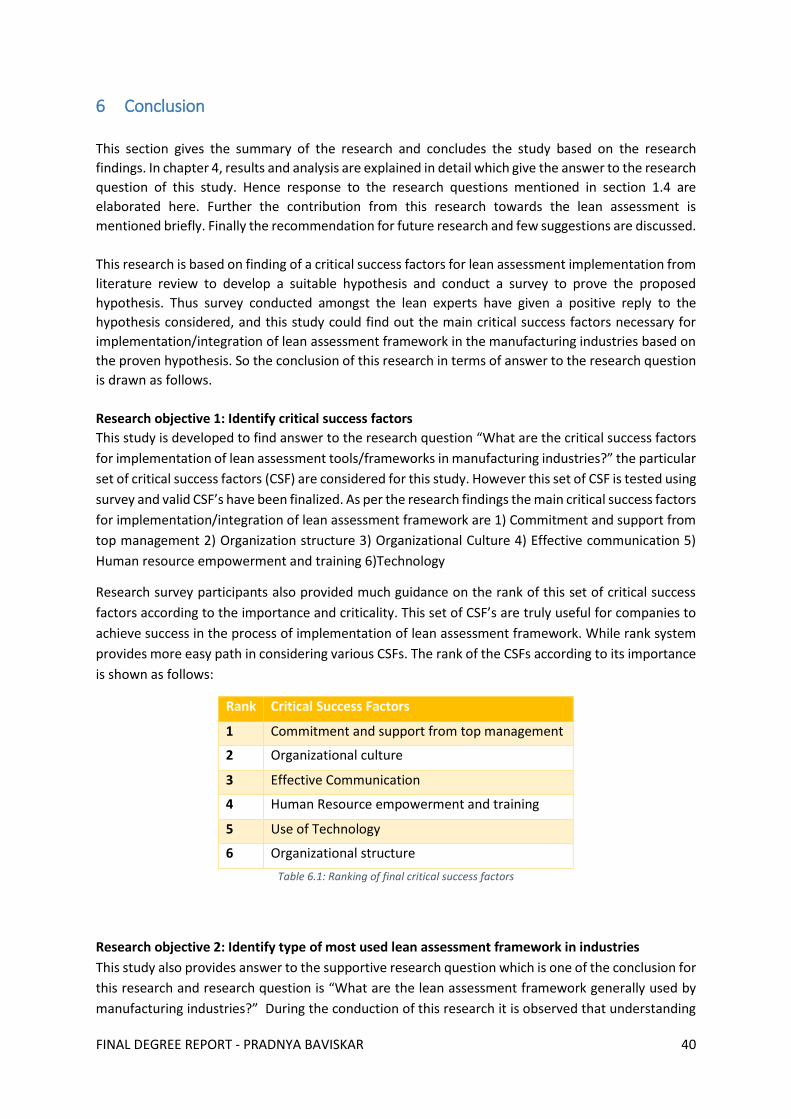
FINAL DEGREE REPORT - PRADNYA BAVISKAR 40
6 Conclusion
This section gives the summary of the research and concludes the study based on the research
findings. In chapter 4, results and analysis are explained in detail which give the answer to the research
question of this study. Hence response to the research questions mentioned in section 1.4 are
elaborated here. Further the contribution from this research towards the lean assessment is
mentioned briefly. Finally the recommendation for future research and few suggestions are discussed.
This research is based on finding of a critical success factors for lean assessment implementation from
literature review to develop a suitable hypothesis and conduct a survey to prove the proposed
hypothesis. Thus survey conducted amongst the lean experts have given a positive reply to the
hypothesis considered, and this study could find out the main critical success factors necessary for
implementation/integration of lean assessment framework in the manufacturing industries based on
the proven hypothesis. So the conclusion of this research in terms of answer to the research question
is drawn as follows.
Research objective 1: Identify critical success factors
This study is developed to find answer to the research question “What are the critical success factors
for implementation of lean assessment tools/frameworks in manufacturing industries?” the particular
set of critical success factors (CSF) are considered for this study. However this set of CSF is tested using
survey and valid CSF’s have been finalized. As per the research findings the main critical success factors
for implementation/integration of lean assessment framework are 1) Commitment and support from
top management 2) Organization structure 3) Organizational Culture 4) Effective communication 5)
Human resource empowerment and training 6)Technology
Research survey participants also provided much guidance on the rank of this set of critical success
factors according to the importance and criticality. This set of CSF’s are truly useful for companies to
achieve success in the process of implementation of lean assessment framework. While rank system
provides more easy path in considering various CSFs. The rank of the CSFs according to its importance
is shown as follows:
Rank Critical Success Factors
1 Commitment and support from top management
2 Organizational culture
3 Effective Communication
4 Human Resource empowerment and training
5 Use of Technology
6 Organizational structure
Table 6.1: Ranking of final critical success factors
Research objective 2: Identify type of most used lean assessment framework in industries
This study also provides answer to the supportive research question which is one of the conclusion for
this research and research question is “What are the lean assessment framework generally used by
manufacturing industries?” During the conduction of this research it is observed that understanding
FINAL DEGREE REPORT - PRADNYA BAVISKAR 41
different types of framework in a manufacturing industry is a necessity. Nowadays there are different
types of frameworks are available in the market and companies are using them according to their
purposes which are useful for organization’s cultural assessment, lean assessment, quality
management and process mapping. So the companies are using them according to their requirements.
As we have seen that there are six critical factors for lean assessment framework, we also get the
response from the participants about what different types of lean assessment frameworks are being
used in manufacturing industries. The survey responses showed that most used lean assessment
frameworks in the manufacturing industries are Key Performance Indicator (KPI) benchmarking, value
stream mapping and opportunity assessment, Lean Enterprise Self-assessment tool (LESAT), balanced
scorecard (BSC), Lean Cultural Assessment Model (LCAM) among the many other frameworks
available in the market.
6.1 Contribution of the research Most of the studies have focused on Lean management and finding critical success factors for lean
implementation (Achanga et al 2006 , Rathje, Boyle & Deflorin 2009, Bortolottia, Boscarib &
Daneseb,2015) Many researcher have discussed about the Lean manufacturing over the years. Few
researches conducted studies of finding critical success factors for implementation of lean tools.
However this study mainly comprises of the topic which particularly focuses on Lean assessment.
Lean assessment plays a major role in analyzing state of leanness of the organization, so identifying
critical success factors for effective implementation of lean assessment in manufacturing industries
provides a key to the success for companies. Identification of set of critical success factor is the major
contribution of this research. Also it gives understanding of various lean assessment frameworks used
in the industry which can be used for identifying particular applications in respective industries.
6.2 Limitation of the research
This research has few limitations, as mentioned the subject of this research is “Critical success factors
for implementation/integration of lean assessment tools/frameworks” shows that this study
concentrated on only lean assessment tools and does not consider overall “lean tools”.
It does not give complete elaboration of Lean concept or lean manufacturing in the study. The
research considered a thesis topic as a constraint to discuss more on “Lean concept”.
This study focuses on singular application while restricting to one area of industry that is
manufacturing.
Survey responses and quantitative data are limited due to the time constraint for the master
thesis.
6.3 Recommendation for further research
In this research lean assessment considered in manufacturing industries, further research can be
conducted with following same method in a different industries like Construction, IT, Finance,
Hospitality etc.
General background of respondents in this study is restricted to the lean expert, different survey can
be carried out using participants from varied background by adjusting survey questions according to
general understanding of the topic.
Here critical success factors are researched for Lean assessment tool/framework, same research can
be done for various important tools in Lean manufacturing.
FINAL DEGREE REPORT - PRADNYA BAVISKAR 42
Reference Achanga, P., Shehab, E., Roy, R. and Nelder, G. (2006), “Critical Success Factors for Lean
Implementation within SMEs”, Journal of Manufacturing Technology Management.
Agnieszka Faron (2012), “RELATIONS BETWEEN LEAN MANAGEMENT AND ORGANIZATIONAL
STRUCTURES”, Poznan University of Technology, Vol. 2, No. 1, pp. 103-114, ISSN 2083-4950
(Online) , 10 January.
Alaskari. O, Ahmad M.M, N. Dhafr, Pinedo-Cuenca. (2012), “Critical Successful Factors (CSFs)
for Successful Implementation of Lean Tools and ERP Systems”, Proceedings of the World
Congress on Engineering 2012 Vol III, WCE 2012, July 4 - 6, London, U.K.
Aliaga M. and Gunderson B. (2002) “Interactive Statistics” Second edition, Prentice Hall
Amelia Natasya, Abdul Wahaba, Muriati Mukhtara & Riza Sulaimanb (2013), “A Conceptual
Model of Lean Manufacturing Dimensions”, The 4th International Conference on Electrical
Engineering and Informatics (ICEEI 2013).
A.N.M. Rose, B.M. Deros and M.N.A. Rahman (2014), “Critical Success Factors for
Implementing Lean Manufacturing in Malaysian Automotive Industry” , Research Journal of
Applied Sciences, Engineering and Technology 8(10): 1191-1200, 2014 ISSN: 2040-7459; e-
ISSN: 2040-7467, September.
Brymman, A. and Bell, E. (2007) Business research strategies, Business research methods,
Second edition: 3-37. United States: Oxford University Press,
Cesar Camison (1996), “Total quality management in hospitality: an application of the EFQM
model”, Jaume l University, Department of Business Management and Marketing, Campus Riu
Sec, Spain, Elsevier Science Ltd.
Charles D. Ray, Xiaoqiu Zuo, Judd H. Michael, Janice K. Wiedenbeck (2005), “THE LEAN INDEX:
OPERATIONAL “LEAN” METRICS FOR THE WOOD PRODUCTS INDUSTRY”, March.
Christer Karlsson, Pär Åhlström (1996), “Assessing changes towards lean production”,
International Journal of Operations & Production Management, Vol. 16.
Cohen, L., Manion, L., Morrison, K. (2007), “Quantitative data analysis, Research methods in
education (ed.)”: 501-508. New York: Routledge,
Cohen, L., Manion, L. & Morison, K. (2000), “Research Methods in Education”, Fifth edition.
Deborah Nightingale (2005), “LESAT: The Lean Enterprise Self Assessment Tool”,
Massachusetts Institute of Technology ESD.61J / 16.852J: Integrating the Lean Enterprise.
Deborah Ihezie, S. Keith and Clarence Mitchell (2009), “Applying Lean Assessment Tools at a
Maryland Manufacturing Company”, Hargrove Department of Industrial, Manufacturing &
Information Engineering, Jr. School of Engineering Morgan State University, Spring.
Doustar S. Mohammad, Astaneh Matin Rashidi & Balalami Mitra Karimdoust (2014), “Human
Resource Empowerment in Lean Manufacturing”, IJIRES, Vol.1, Issue 1, May.
D.S. Pugh, D.J. Hickson, C.R. Hinings, K.M. MacDonald, C. Turner and T. Lupton (1963), “A
Conceptual Scheme for Organizational Analysis”, Administrative Science Quarterly, Vol. 8, pp.
289-315.
D. S. Pugh, D. J. Hickson, & C. R. Hinings, C. Turner (1968), “Dimensions of Organization”,
Administrative Science Quarterly, pp. 65 -105.
Farzad Behrouzi & Kuan Yew Wong (2011), “Lean performance evaluation of manufacturing
systems : A dynamic and innovative performance approach”.
FINAL DEGREE REPORT - PRADNYA BAVISKAR 43
Fawaz A. Abdulmalek & Jayant Rajgopal (2007), “Analyzing the benefits of lean manufacturing
and value stream mapping via simulation: A process sector case study”.
F.A. Abdulmalek, J. Rajgopal (2007), Int. J. Production Economics 107 223–236.
Gary Convis, President, “Role of Management in a Lean Manufacturing Environment”, Toyota
Motor Manufacturing Kentucky.
Goutam Kundu & B. Murali Manohar (2012), “CRITICAL SUCCESS FACTORS FOR
IMPLEMENTING LEAN PRACTICES IN IT SUPPORT SERVICES”, International Journal for Quality
research, UDK - 658.562, Vol.6, No. 4.
Jayanth Srinivasaraghavan & Venkat Allada (2005), “Application of mahalanobis distance as a
lean assessment metric”, Springer-Verlog London limited.
John F Rockart (1982), “The Changing Role of the Information Systems Executive: A Critical
Success Factors Perspective”, Sloan Management Review 24, 1; ABI/INFORM Global pg. 3,
(pre-1986), Fall.
J.K. Liker, M. Hoseus (2008), “Toyota Culture—The Heart and Soul of the Toyota Way”,
McGraw-Hill, New York, NY.
Kirsten Alcser, Christopher Antoun, Ashley Bowers, Judi Clemens, and Christina Lien (2011),
“Ethical Considerations in Surveys III”, Cross-Cultural Survey Guidelines.
Klaus G. Grunert & Charlotte Ellegaard (1992), “The Concept of Key Success Factors: Theory
and Method”, MAPP working paper no 4 SSN 0907 2101, October.
Lee, Quaterman, “Lean manufacturing strategy”, Strategos, available at:
www.strategosinc.com/ Accessed on 22-06-15 at 23:22
Linda Parker Gates (2010), “Strategic Planning with Critical Success Factors and Future
Scenarios: An Integrated Strategic Planning Framework”, CMU/SEI-2010-TR-037 ESC-TR-2010-
102, November.
“LAI ENTERPRISE SELF-ASSESSMENT TOOL (LESAT)” (2012) Facilitator’s Guide Version 2.0,
Massachusetts Institute of Technology
Maarten Siemerink (2014), “The effects of lean management on organizational structure and
the type of innovations influenced by this structure”, University of Twente, Faculty of
Management and Governance.
Mike Rother & John Shook (1999), “Learning to See: Value Stream Mapping to Add Value and
Eliminate Muda”, The Lean Enterprise Institute, Inc., Brookline, MA.
Neuman, W.L. (1997), “Social Research Methods: Qualitative and Quantitative Approaches”,
Allyn Bacon, Boston, MA.
Pascal Cotte, Adam Farber, Amyn Merchant & Petros Paranickas, Harold L. Sirkin (2008), “The
pursuit of lean advantage: Getting more from Lean seven success factors”, The Boston
Consulting Group.
Pedro Jose Martinez-Jurado, Jose Moyano-Fuentes, Pilar Jerez-Gomez (2013), “Human
resource management in Lean Production adoption and implementation processes: Success
factors in the aeronautics industry”, Business Research Quarterly (2014) 17, pp. 47-68,
September.
Peter Hines (2010), “Principles of Lean System”.
Prapawadee Na Ranong & Wariya Phuenngam (2009), “Critical Success Factors for effective
risk management procedures in financial industries: A study from the perspectives of the
financial institutions in Thailand”, Master Thesis Umea University, spring semester.
FINAL DEGREE REPORT - PRADNYA BAVISKAR 44
Prattana Punnakitikashem,Nattapan Buavaraporn & Lin Chen (2013), “An Investigation of
Factors Affecting Lean Implementation Success of Thai Logistics Companies”.
Randy Urbance ESD.83 Book Review “The Machine that Changed the World by James
Womack, Daniel Jones, and Daniel Roos”.
Raymond Younga & Ernest Jordanb (2008), “Top management support: Mantra or necessity?”,
International Journal of Project Management, Volume 26, Issue 7, Pages 713–725, October.
Remenyi, D., Williams, B., Money, A. and Swartz, E. (1998), “Doing Research in Business and
Management: An Introduction to Process and Method”, London: Sage
Robert S. Kaplan and David P. Norton (1996), “The Balanced Scorecard: Translating Strategy
into Action”, Harvard Business School Press.
Rockart, J.F. (1979), “Chief executives define their own data needs”, Harvard Business Review,
March-April.
Sara Bragança, Anabela Alves, Eric Costa, Rui Sousa (2013), “THE USE OF LEAN TOOLS TO
IMPROVE THE PERFORMANCE OF AN ELEVATORS COMPANY”
Schein, Edgar H. (1984), “Coming to a New Awareness of Organizational Culture”, Sloan
Management Review, 25:2 p.3, Winter.
Scherrer-Rathje, M., Boyle, T. A., & Deflorin (2009), “Reflections from the second attempt at
the Lean implementation”, Business Horizons, 52(1), 79-88. Accessed from
www.sciencedirect.com
Stephen Hanman (1997), “Benchmarking Your Firm’s Performance with Best Practice”,
International Journal of Logistics Management Volume 8, Number 2.
Taiichi Ohno (1978), “Toyota Production System: Beyond Large-Scale Production”.
Thomas R. Pomorski (2004), “Total Productive Maintenance (TPM) Concepts and Literature
Review”, Principal Consulting Engineer Brooks Automation, Inc.
Thomas Bortolottia, Stefania Boscarib, Pamela Daneseb (2015), “Successful lean
implementation: Organizational culture and soft lean practices”, International Journal of
Production Economics, Volume 160, Pages 182–201, February.
Thorsten Ahrens (2006), “Lean production: Successful implementation of organizational
change in operations instead of short term cost reduction efforts”.
Toni L. Doolen and Maria E. Hacker (2005), “A Review of Lean Assessment in Organizations:
An Exploratory Study of Lean Practices by Electronics Manufacturers”, Industrial and
Manufacturing Engineering, Oregon State University, Corvallis, Oregon, USA.
Womack J, Jones D, Roos D. (1990) “The machine that changed the world: the story of Lean
Production”, Rawson Associates.
Yu Cheng Wong, Kuan Yew Wong & Anwar Ali (2009), “A Study on Lean Manufacturing
Implementation in the Malaysian Electrical and Electronics Industry”, European Journal of
Scientific Research ISSN 1450-216X Vol.38 No.4 (2009), pp 521-535 © Euro Journals Publishing
Inc.
Research Books:
Alan Bryman and Emma Bell (2003), “Business Research Model”, first edition, Oxford
University Press, USA
Dr. Sue Greener (2008) “Business Research Methods”, Bookboon
FINAL DEGREE REPORT - PRADNYA BAVISKAR 45
Michael Lewis, Nigel Slack (2003), “Operations Strategy”, Volume 3, Third edition, Prentice
Hall Financial Times.
Michael Lewis, Nigel Slack (2003), “Operations Management”, Volume 3, Third edition,
Prentice Hall Financial Times.
M.Saunders, P. Lewis, A.Thornhill, (2009) “Research Methods for Business students”, Fifth
edition, Prentice Hall Financial Times.
Richard H. Hopf ,Lloyd W. Pratsch, Pauk A. Denett, David J. Litman, Ida M. Ustad, Terrence J.
Tychan (1996), “Guide to a Balanced Scorecard Performance Management Methodology”,
Procurement Executive’s Association
Websites:
http://www.kpmg.com/global/en/issuesandinsights/articlespublications/breaking-through-
the-wall/pages/making-lean-sustainable.aspx (Accessed on 24-02-15 at 13:54)
http://www.lean-manufacturing-junction.com/benefits-of-lean.html (Accessed on 24-02-15
at 14:30)
http://www.leansimulations.org/2011/11/lean-assessment-excel-tool-and-over-70.html
(Accessed on 24-02-15 at 15:58)
http://www.engr.psu.edu/cim/ie450/ie450ho1.pdf (Accessed on 26-02-15 at 12:00)
http://ocw.mit.edu/courses/aeronautics-and-astronautics/16-852j-integrating-the-lean-
enterprise-fall-2005/lecture-notes/13_lesat.pdf (Accessed on 26-03-15 at 06:00)
https://www.industryforum.co.uk/audit-assessment/lean-assessment/ (Accessed on 01-06-
15 at 12:44)
http://www.buker.com/buker-inc-releases-the-lean-manufacturing-assessment.php
(Accessed on 02-06-15 at 00:05 )
http://ocw.mit.edu/courses/aeronautics-and-astronautics/16-852j-integrating-the-lean-
enterprise-fall-2005/lecture-notes/13_lesat.pdf (Accessed on 06-06-15 at 00:15 18:25)
http://www.efqm.org/efqm-model/model-criteria (Accessed on 06-06-15 at 00:15)
http://energy.gov/sites/prod/files/maprod/documents/BalancedScorecardPerfAndMeth.pdf
(Accessed on 07-06-2015 at 01:11)
http://www.pwc.com/gx/en/audit-services/corporate-
reporting/assets/pdfs/UK_KPI_guide.pdf (Accessed on 22-06-15 at 21:42)
http://www.sae.org/manufacturing/lean/column/leanjul01.htm (Accessed on 25-06-15 at
16:00)
http://www.ijires.org/index.php/issues?view=publication&task=show&id=4 (Accessed on 29-
06-2015 at 14:46)
http://www.reliableplant.com/Read/26766/developing-lean-culture-elements (Accessed on
30-06-2015 at 12:50)
https://www.datacracker.com/ (Accessed on 04-07-15 at 00:09)
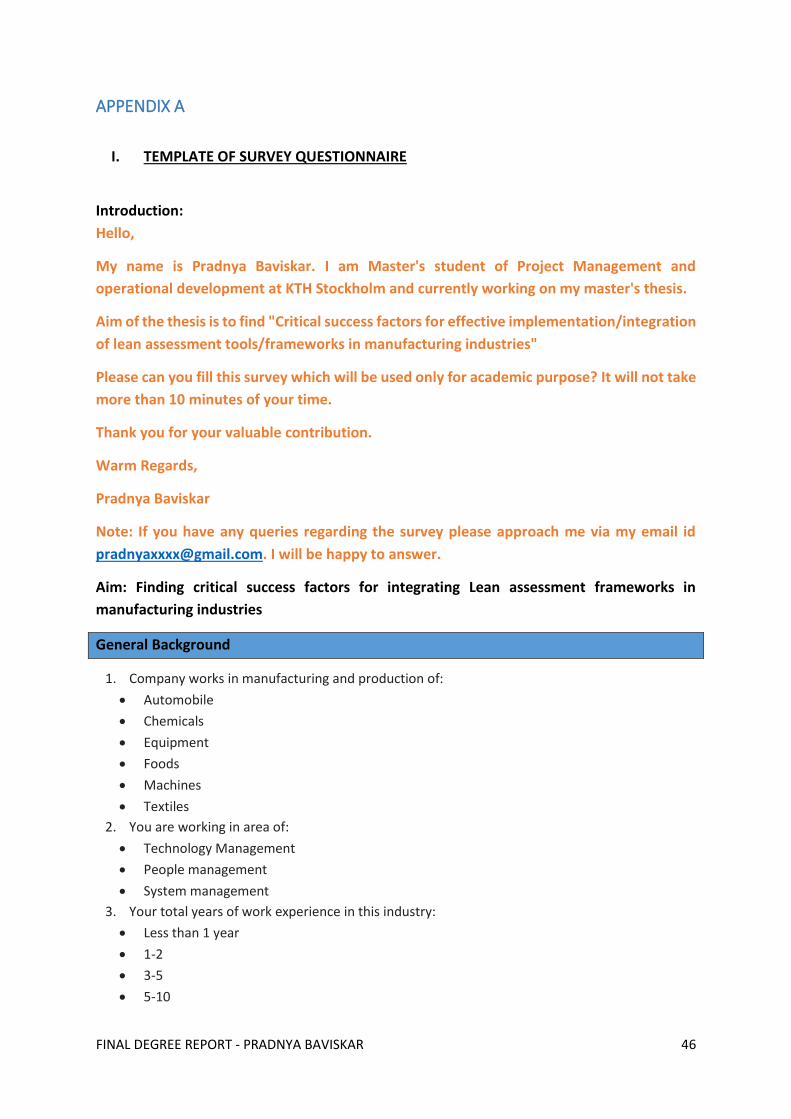
FINAL DEGREE REPORT - PRADNYA BAVISKAR 46
APPENDIX A
I. TEMPLATE OF SURVEY QUESTIONNAIRE
Introduction:
Hello,
My name is Pradnya Baviskar. I am Master's student of Project Management and
operational development at KTH Stockholm and currently working on my master's thesis.
Aim of the thesis is to find "Critical success factors for effective implementation/integration
of lean assessment tools/frameworks in manufacturing industries"
Please can you fill this survey which will be used only for academic purpose? It will not take
more than 10 minutes of your time.
Thank you for your valuable contribution.
Warm Regards,
Pradnya Baviskar
Note: If you have any queries regarding the survey please approach me via my email id
[email protected]. I will be happy to answer.
Aim: Finding critical success factors for integrating Lean assessment frameworks in
manufacturing industries
General Background
1. Company works in manufacturing and production of:
Automobile
Chemicals
Equipment
Foods
Machines
Textiles
2. You are working in area of:
Technology Management
People management
System management
3. Your total years of work experience in this industry:
Less than 1 year
1-2
3-5
5-10
FINAL DEGREE REPORT - PRADNYA BAVISKAR 47
More than 10 years
4. Your total years of work experience in Lean:
Less than 1 year
1-2
3-5
5-10
More than 10 years
5. What benefit/s do you observe the most in your company due to lean manufacturing? (you may
choose more than one)
Improved productivity with better profit and increase in efficiency
Improved system with fewer defects in product
Improved lead time with fewer delays in business processes
Improved communication with customers and stakeholders
Total company involvement
More safe work environment
Reduction in manpower
6. For assessing leanness of the company, what lean assessment framework/s your organization
uses?
EFQM assessment (European Foundation for Quality Management)
LESAT (Lean Enterprise Self-Assessment Tool)
VSM (Value Stream Mapping) and opportunity assessment
BSC (Balanced Scorecard)
Lean Index Tool
key performance indicator Benchmarking tool
Lean culture assessment model (LCAM)
Other (Please specify)
Critical Success factors for effective implementation of Lean assessment framework
Top Management support
7. Who has the authority to establish lean assessment framework in your company?
Board committee
Executive management team
Chief executive officer
Line Manager and supervisor
Staff
8. Who has the authority to maintain lean assessment framework in your company?
Board committee
Executive management team
Chief executive officer
Plant manager
Supervisor
Staff
9. How does your organization assure successful integration of lean assessment framework?
FINAL DEGREE REPORT - PRADNYA BAVISKAR 48
Setting up lean management team
Providing necessary resources
Allocating responsibilities
Arranging training session on concept of lean and lean assessment framework
Following change management steps
Other (please specify)
10. Does your organization have a policy to support future maintenance of lean assessment
framework?
Yes
No
Organization structure:
11. Do you think that lean assessment framework fulfil the goals and objective of lean manufacturing
in your company?
Yes
No
12. Does score of the assessment linked to bonuses and other benefits?
Yes
No
13. Do you observe result of assessment have helped in improving operational performance?
Yes
No
14. Does your organization have documented guidelines for lean assessment framework?
Yes
No
15. How often lean assessment framework getting updated or improvised?
Once per year
Once per 2 years
Once in more than 2 years
Never
Other (please specify)
Communication
16. What type of communication system used in your organization?
(According to frequency)
Telephone
Daily meetings
Visual presentations
Face to face conversation
Bulletin board
Note/fax
FINAL DEGREE REPORT - PRADNYA BAVISKAR 49
17. Is everyone in your team aware of how to use lean assessment framework?
Yes
No
18. How does your organization assure the effective implementation and use of lean assessment
framework within the company using communication as a tool?
Conducting trial assessment sessions
Maintaining clear communication between management and staff
Conducting informative seminars
Providing easy access to all necessary information when needed
Developing common understanding between management team and staff
Other (Please specify)
19. Does your organization timely inform all employees about the updates and changes in system or
framework?
Yes
No
Technology
20. Does your organization use any international standards or methods to protect assessment data?
Yes
No
21. Does your organization use any tools and techniques for analysing assessment result?
Yes
No
22. Does your organization use the tools, methods and technology for improving performance after
the assessment result?
Yes
No
Empowerment and training of human resources
23. Does your organization provide training courses on lean and lean assessment?
More than 2 times per year
Twice in a year
Once in a year
Less than once in a year
Never
24. Does your organization provide training for new employees?
Yes
No
Organizational Culture
Give points from 1 to 5 for each statement.
Strongly disagree = 1 to strongly agree= 5
FINAL DEGREE REPORT - PRADNYA BAVISKAR 50
Collaboration and common understanding within the organization comes from strong culture
Existing culture helps you to easily adapt to your lean organization.
Your organization does not hesitate to change the old culture for future development and
adaptation
Organizational culture, its leadership and human resources are most important thing in any
organization’s success.
Change in culture won’t be resisted if they are beneficial for organization
Rating of Critical Success Factor
Please give points accordingly from 1 to 6 score.
According to Importance
Commitment and support from top management
Organizational structure
Human resource empowerment and training
Communication
Technology
Culture
According to most challenging to least challenging
Commitment and support from top management
Organizational structure
Human resource empowerment and training
Communication
Technology
Culture
Thank you for your participation! The survey result can be shared if interested. Please leave
your email ids and mail will be sent to you with short summary and result of this research
study.
Email id:
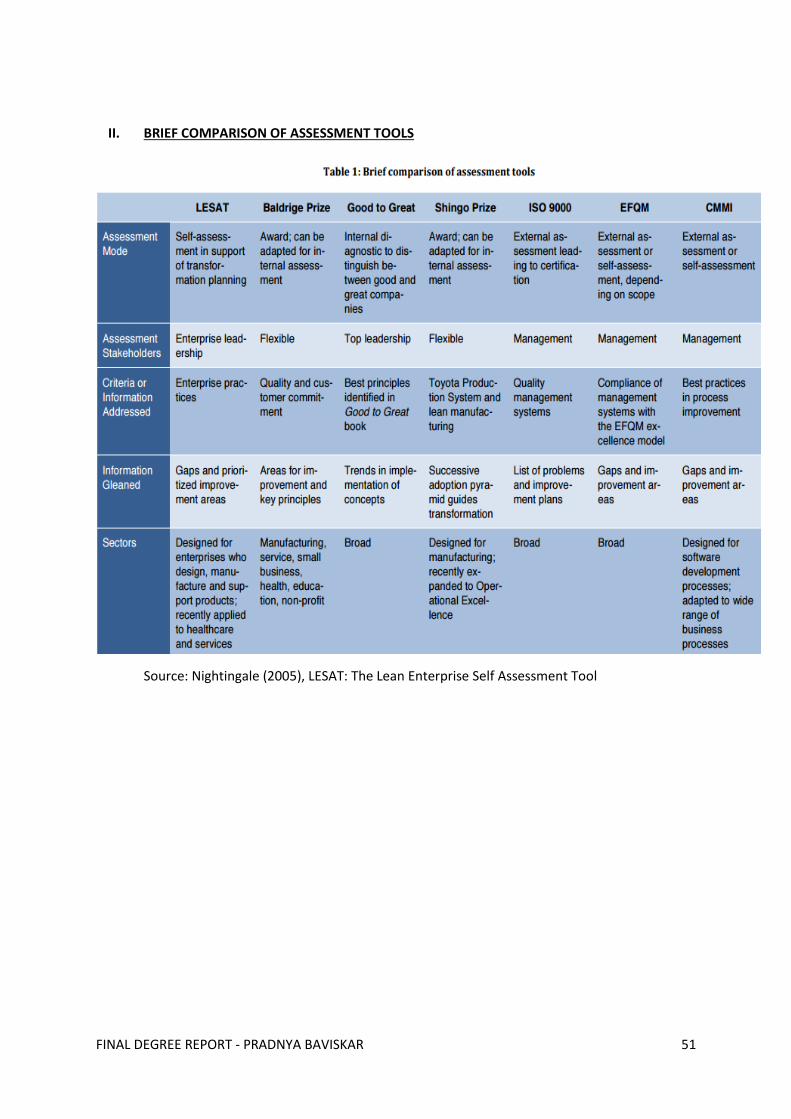
FINAL DEGREE REPORT - PRADNYA BAVISKAR 51
II. BRIEF COMPARISON OF ASSESSMENT TOOLS
Source: Nightingale (2005), LESAT: The Lean Enterprise Self Assessment Tool

FINAL DEGREE REPORT - PRADNYA BAVISKAR 52
www.kth.se
www.kth.se
Related Documents