Accelerated Stress Testing and Reliability Conference Critical Review of US Military Environmental Stress Screening (ESS) Handbook Nga Man Li and Dr. Diganta Das Center for Advanced Life Cycle Engineering(CALCE), University of Maryland [email protected] , [email protected] September 28- 30 2016, Pensacola Beach, Florida

Welcome message from author
This document is posted to help you gain knowledge. Please leave a comment to let me know what you think about it! Share it to your friends and learn new things together.
Transcript

Accelerated Stress Testing and Reliability Conference
Critical Review of US Military Environmental Stress Screening (ESS) Handbook
Nga Man Li and Dr. Diganta Das
Center for Advanced Life Cycle Engineering(CALCE), University of Maryland
[email protected], [email protected]
September 28- 30 2016, Pensacola Beach, Florida

Accelerated Stress Testing and Reliability Conference
September 28- 30 2016, Pensacola Beach, Florida
Environmental Stress Screening in a Product Development Process
ESS
Assess intrinsic
capability of
candidate
technologies
and incoming
sub-assemblies
Design
Product
Establish
Manufacturing
Process
Manufacture Ship to
Customer
Qualification
Test for
Engineering
Verification
Qualification
Test for
Design
Verification
Qualification
Test for
Process
Verification
Quality
Assurance
Tests
Field
Failures
and PHM
ESS is a process to eliminate defects due to manufacturing variations in electronics devices by a 100% screening.

Accelerated Stress Testing and Reliability Conference
Motivation for MIL-HDBK 344A Evaluation
• MIL-HDBK 344A- Environmental Stress Screening (ESS) of Electronic Equipment describes a quantitative approach for planning, monitoring and controlling ESS process.
• It was last updated in 1993, but it is still widely adopted within and beyond military and aerospace industries today.
• 344A is still widely used for ESS effectiveness studies and even for reliability assessment.
• Significant similarities with 344A are found in the approach discussed in a Chinese ESS Standard- GJB/Z34.
September 28- 30 2016, Pensacola Beach, Florida

Accelerated Stress Testing and Reliability Conference
Steps in ESS Implementation as per MIL-HDBK 344A
• Six essential steps involved in quantitative approach in MIL-HDBK344A • Purpose: Monitor and control ESS process statistically.
1. Establish Objectives/
Goals
2. Estimate Initial Defect
Density
3. Estimate Screening Strength
4. Refine Estimates
5. Monitor and Control
6. Implement Product
Reliability Verification Test (PRVT)
September 28- 30 2016, Pensacola Beach, Florida

Accelerated Stress Testing and Reliability Conference
Sources for Values/ Equations/ Methods Used in the Handbook
Defect Density Goal
Establishment
Initial Defect Density
Estimation
Screening Strength Estimation
ADR14-04-73.2
Failure Rates of Parts at
Different Environment
Hughes Aircraft Company,
Environmental Stress
Screening Guidelines
Field Failure Rates of Parts
of Various Quality Grades
AFWAL TR-80-3086
Failure Rates of 6 Avionics Systems
under Various Stresses
MIL-HDBK 217D
Failure Rates of Parts at
Different Environment
RADC-TR-86-149
Part Fraction Defectives of Parts at Different
Environment
RADC-TR-82-87
Screening Strength Equations for Various
Stresses
MIL-STD 2000
Method for System
Complexity Estimation
(cancelled in 1995)
1989
1986
1983
1982
1973
MIL-HDBK 344A 1993
1983
NAVMAT P-9492
Curves of “Failures vs number of
temperature cycle” 1979
1980
RADC-TR-86-149
Revised Screening Strength
Equations
1996 MIL-HDBK
2164A September 28- 30 2016, Pensacola Beach, Florida

Accelerated Stress Testing and Reliability Conference
Sources for Values/ Equations/ Methods Used in the Handbook
Defect Density Goal
Establishment
Initial Defect Density
Estimation
Screening Strength Estimation
ADR14-04-73.2
Failure Rate of Parts at
Different Environment
Hughes Aircraft Company,
Environmental Stress
Screening Guidelines
Field Failure Rate of Parts
of Various Quality Grades
AFWAL TR-80-3086
Failure Rate of 6 Avionics Systems
under Various Stresses
MIL-STD 217D
Failure Rate of Parts at
Different Environment
RADC-TR-86-149
Part Fraction Defectives of Parts at Different
Environment
RADC-TR-82-87
Screening Strength Equations for Various
Stresses
MIL-STD 2000
Method for System
Complexity Estimation
(cancelled in 1995)
1989
1986
1983
1982
1973
MIL-HDBK 344A 1993
1983
NAVMAT P-9492
Curve of “Failures vs number of
temperature cycle” 1979
1980
RADC-TR-86-149
Revised Screening Strength
Equations
1996 MIL-HDBK
2164A
MIL-STD 2000
Method for System
Complexity
Estimation (1989)
(cancelled in 1995)
MIL-STD 217D
Failure Rates of
Parts at Different
Environment
(1983)
Hughes Aircraft
Company,
Environmental Stress
Screening Guidelines
Field Failure Rates of
Parts of Various Quality
Grades (1983)
RADC-TR-86-149
Defect Density of Parts at
Different Environments (1986)
September 28- 30 2016, Pensacola Beach, Florida

Accelerated Stress Testing and Reliability Conference
Sources for Values/ Equations/ Methods Used in the Handbook
Defect Density Goal
Establishment
Initial Defect Density
Estimation
Screening Strength Estimation
ADR14-04-73.2
Failure Rate of Parts at
Different Environment
Hughes Aircraft Company,
Environmental Stress
Screening Guidelines
Field Failure Rate of Parts
of Various Quality Grades
AFWAL TR-80-3086
Failure Rate of 6 Avionics Systems
under Various Stresses
MIL-STD 217D
Failure Rate of Parts at
Different Environment
RADC-TR-86-149
Part Fraction Defectives of Parts at Different
Environment
RADC-TR-82-87
Screening Strength Equations for Various
Stresses
MIL-STD 2000
Method for System
Complexity Estimation
(cancelled in 1995)
1989
1986
1983
1982
1973
MIL-HDBK 344A 1993
1983
NAVMAT P-9492
Curve of “Failures vs number of
temperature cycle” 1979
1980
RADC-TR-86-149
Revised Screening Strength
Equations
1996 MIL-HDBK
2164A
AFWAL TR-80-3086
Failure Rates of 6
Avionics Systems
under Various
Stresses (1980)
NAVMAT P-9492
Curves of “Failures
vs number of
temperature cycle”
(1979)
ADR14-04-73.2
Failure Rates of
Parts at Different
Environment
(1973)
RADC-TR-82-87
Screening Strength
Equations for Various
Stresses (1983)
RADC-TR-86-149
Revised Screening Strength
Equations (1986)
September 28- 30 2016, Pensacola Beach, Florida

Accelerated Stress Testing and Reliability Conference
Defect Density Estimation in MIL-HDBK 344A
Vectors}Density {Defect Matrix} Complexity {System=Density Defect Initial
• Initial Defect Density (DIN) of a system is estimated using the
following relationship in MIL-HDBK 344A
• Defect Density Vectors: Estimated initial defect density values
at anticipated stress level of parts and interconnections used in a
system.
• Defect Density Values of different parts for various
environments from field data are included in this handbook.
September 28- 30 2016, Pensacola Beach, Florida

Accelerated Stress Testing and Reliability Conference
Defect Densities of Microelectronic Devices in Various Environments in MIL-HDBK 344A
12 tables similar to the one below for different devices (e.g.,
microelectronic devices, capacitors, resistors) are included in the
handbook for defect density estimation
September 28- 30 2016, Pensacola Beach, Florida

Accelerated Stress Testing and Reliability Conference
Evolution of Microelectronics in 30 years
1980s Today
Smallest Microelectronic Feature Size 1 μm 22-35nm
Maximum Microprocessor Clock Speed 25 MHz >4.2 GHz
Maximum Size of Available Commercial Memory 1MB 256GB
128MB 128GB [1] Keast, C. Fermilab Colloqium Presentation on 3D Integration for Integrated Circuits and Advanced Focal Planes, 2007
September 28- 30 2016, Pensacola Beach, Florida

Accelerated Stress Testing and Reliability Conference
Main Problems of Defect Density Estimation in MIL-HDBK 344A
• The method of counting number of parts/ leads/ interconnections over the system for complexity is not a valid method.
• Limited data on factory defect rates and field failure rates for parts of various quality grades [2] was used by Hughes Aircraft Company [3] to derive the defect density values for several part types.
• The defect densities given for different quality of parts/ interconnects were developed over 20 years ago with, which are likely invalid today with the changes in quality of parts and assembly technologies.
• Defect density values for COTS parts are not available in handbooks or from manufacturers
[2] Hughes Aircraft Company, “Environmental Stress Screening Guidelines”, 1983.
[3] U.S. Air Force, Environmental Stress Screening, RADC-TR-86-149, 1986
September 28- 30 2016, Pensacola Beach, Florida

Accelerated Stress Testing and Reliability Conference
Screening Strength Estimation in MIL-HDBK 344A
• Screening Strength (SS) is the ratio of number of fallouts
during the screen to number of initial latent defects.
• With the estimation of DIN and DREMAINING from previous steps,
required SS can be calculated from this equation to achieve the
desired DREMAINING goal.
SS =DIN -DREMAINING
DIN• Screening Strength (SS) can be seen as the probability that a
specific screen will precipitate a latent defect to a patent defect
(Precipitation Efficiency, PE) and detect the patent defect by
test (Detection Efficiency, DE).
SS = PE*DESeptember 28- 30 2016, Pensacola Beach, Florida
Accelerated Stress Testing and Reliability Conference
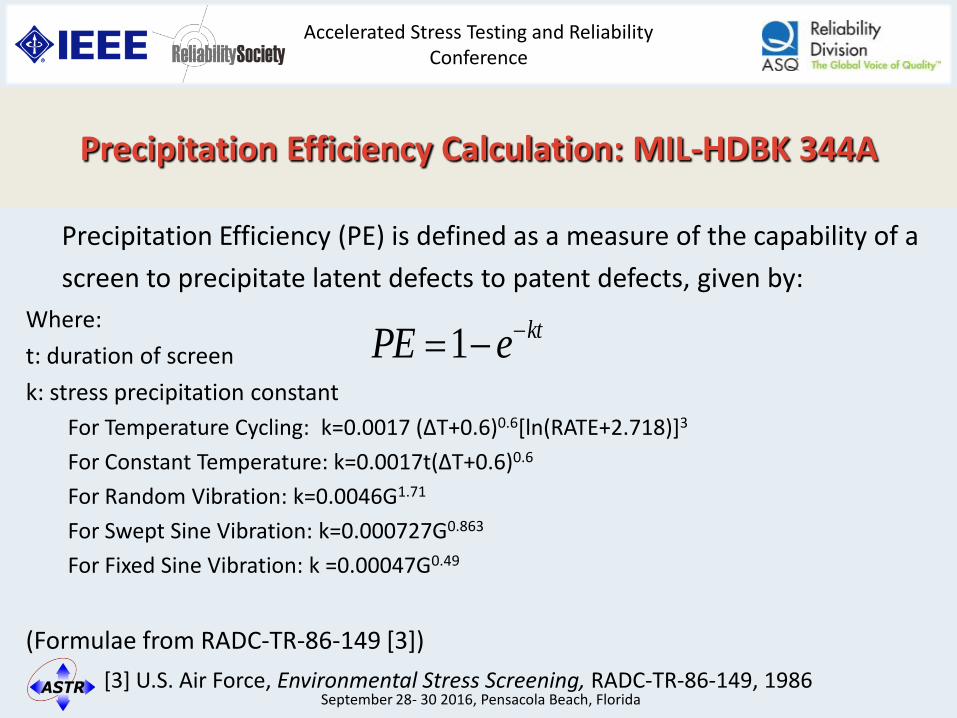
Precipitation Efficiency Calculation: MIL-HDBK 344A
Precipitation Efficiency (PE) is defined as a measure of the capability of a
screen to precipitate latent defects to patent defects, given by:
Where:
t: duration of screen
k: stress precipitation constant
For Temperature Cycling: k=0.0017 (∆T+0.6)0.6[ln(RATE+2.718)]3
For Constant Temperature: k=0.0017t(∆T+0.6)0.6
For Random Vibration: k=0.0046G1.71
For Swept Sine Vibration: k=0.000727G0.863
For Fixed Sine Vibration: k =0.00047G0.49
(Formulae from RADC-TR-86-149 [3])
ktePE 1
[3] U.S. Air Force, Environmental Stress Screening, RADC-TR-86-149, 1986 September 28- 30 2016, Pensacola Beach, Florida

Accelerated Stress Testing and Reliability Conference
Main Problem of Screening Strength Estimation in MIL-HDBK 344A
• Mathematical expressions for Precipitation Efficiency were derived by Hughes Aircraft Company in 1982 [4] by data collected by McDonnel Aircraft Company in 1980 [5] and by Grumman Aerospace Corporation in 1973 [6] respectively. – Not universally applicable since the coefficients in these models are from
regression analysis of specific screening results of selected products
– With several decades of changes in technology in the electronics industry, these models and model coefficients are completely out of date.
September 28- 30 2016, Pensacola Beach, Florida
[4] Saari, A.E., Schafer. R. E., and VanDenBerg, S.J., “Stress Screening of Electronic Hardware”, Hughes Aircraft
Company, Ground Systems Group, Fullerton, CA., RADC-TR-82-87, May 1982.
[5] Anderson, J.R., “Environmental Burn-in Effectiveness”, McDonnell Aircraft Company, St. Louis, NO., Report
No. AFWAL TR-80-3086, August 1980.
[6] Kube, F., Hlrschberger, G., “An Investigation to Determine Effective Equipment Environmental Acceptance
Test Methods”, Grumman Aerospace Corporation, Report No., ADR14-04-73.2, April 1973.

Accelerated Stress Testing and Reliability Conference
Case Study of Defect Density Estimation Based on a Current Design
• Users of MIL-HDBK 344A from the industry can be using different possible methods to estimate initial defect density of their systems today.
• A modern electronic system designed in 2015, to be used an industrial building, is used for this case study to compare defect density values result for the system with different methods.
September 28- 30 2016, Pensacola Beach, Florida

Accelerated Stress Testing and Reliability Conference
• Most defect density values in MIL-HDBK 344A were derived by extrapolating values from a few parts of certain quality grades.
• The defect density values for those parts were calculated from the equation below:
• Summation of defects detected in the factory and defects
detected in the field and divided by the total quantity, with the assumption of all failures detected are due to defects.
Calculation of Defect Density from Field/ Factory Data from the Original Data Source
September 28- 30 2016, Pensacola Beach, Florida
Accelerated Stress Testing and Reliability Conference
Common Defect/ Failure Related Terminologies
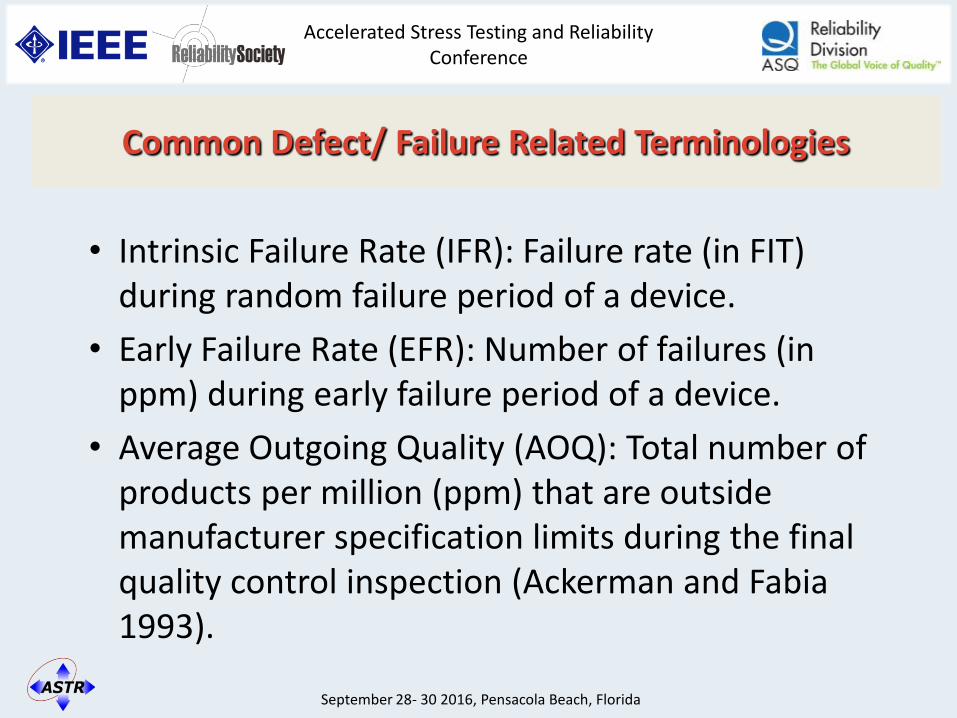
• Intrinsic Failure Rate (IFR): Failure rate (in FIT) during random failure period of a device.
• Early Failure Rate (EFR): Number of failures (in ppm) during early failure period of a device.
• Average Outgoing Quality (AOQ): Total number of products per million (ppm) that are outside manufacturer specification limits during the final quality control inspection (Ackerman and Fabia 1993).
September 28- 30 2016, Pensacola Beach, Florida

Accelerated Stress Testing and Reliability Conference
Possible Defect Density Values Today for ESS by MIL-HDBK 344A approach
• Ideal case: - Defect density can be the summation of defects detected in factory by
all means provided by the manufacturer and defects detected in the field of the parts obtained by the user divided by the total number of parts tested.
• More practical case: - Defect density can be the summation of defects from the data available
provided by the manufacturer adjusted by an acceleration factor for field environment when applicable. (For example, AOQ, EFR, IFR):
• Other cases: - Use of defect density values from tables in MIL-HDBK 344A
- Use of one of the available data provided by the manufacturer
September 28- 30 2016, Pensacola Beach, Florida

Accelerated Stress Testing and Reliability Conference
Possible Defect Density Calculation Method
• AOQ values have not been found for any parts. • Parts with enough data for defect density calculation are
included below: • Defect Density Calculation Method from available data:
• Original Defect Density Calculation Method:
September 28- 30 2016, Pensacola Beach, Florida

Accelerated Stress Testing and Reliability Conference
Defect Density Values Using Different Methods From
available data
(ppm)
From values of two consecutive grades
under same environment from handbook
(ppm)
# of
devices
Zener Diode 126.74 86 (JAN) 17.12 (JANTX) 1
Dual Diode 295.24 86 (JAN) 17.12 (JANTX) 1
Rectifier Diode 21.872 86 (JAN) 17.12 (JANTX) 1
Bipolar Junction
Transistor
161.76 346 (JAN) 69.2 (JANTX) 4
Ceramic Capacitor 3.31 61.5 (M) 18.4 (P) 2
Metal Strip
Capacitor
10.97 61.5 (M) 18.4 (P) 1
Thick film chip
Resistor 1
0.00003 20.3 (M) 6.1 (P) 6
Thick film chip
Resistor 2
0.00012 20.3 (M) 6.1 (P) 4
Total 1108.48 2029.5 444.36 20
September 28- 30 2016, Pensacola Beach, Florida
Accelerated Stress Testing and Reliability Conference
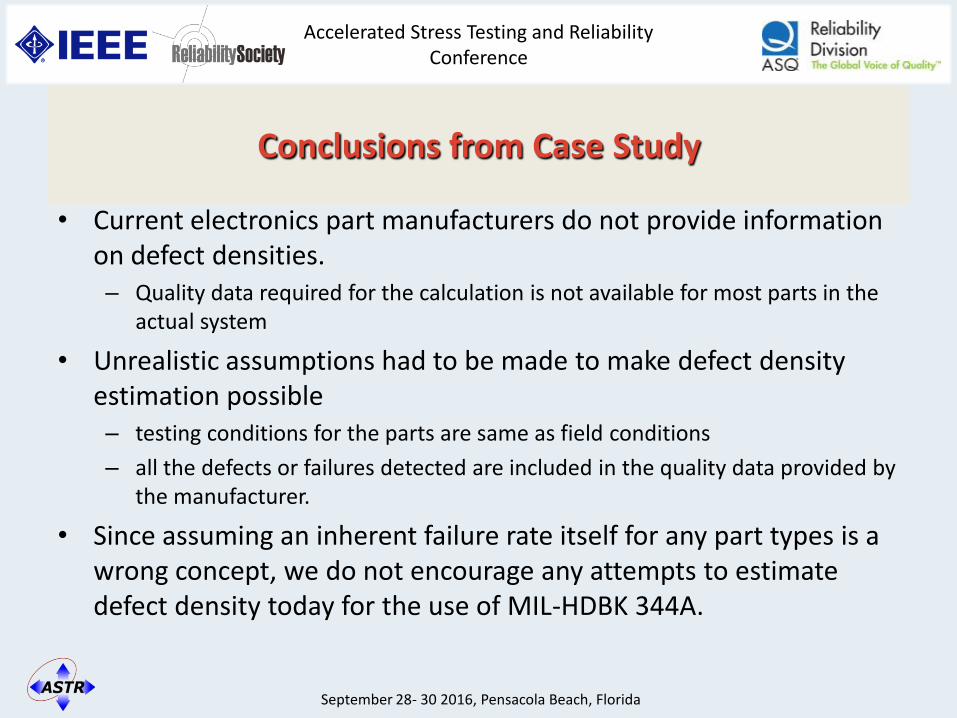
Conclusions from Case Study
• Current electronics part manufacturers do not provide information on defect densities. – Quality data required for the calculation is not available for most parts in the
actual system
• Unrealistic assumptions had to be made to make defect density estimation possible – testing conditions for the parts are same as field conditions
– all the defects or failures detected are included in the quality data provided by the manufacturer.
• Since assuming an inherent failure rate itself for any part types is a wrong concept, we do not encourage any attempts to estimate defect density today for the use of MIL-HDBK 344A.
September 28- 30 2016, Pensacola Beach, Florida

Accelerated Stress Testing and Reliability Conference
Problems with the Existing Methods for Initial ESS Profile Set Up
• Stress Types – Random vibration and thermal cycling/ shock are the only stresses being
recommended to eliminate defects in electronic systems for screening (ESS) purposes by all common standards and handbooks including MIL-HDBK 344A
• For stress profile determination - Apart from 344A, most handbooks in effect describe a standardized stress profile
based on stress limits, or assembly levels of electronic systems without identifying the critical defects and their effects in the field, and understanding defect-stress relationships
- ESS profiles determined by these methods can be redundant or ineffective
Therefore, the choice of stress types and stress profile determination should be defect and use-condition specific.
September 28- 30 2016, Pensacola Beach, Florida

Accelerated Stress Testing and Reliability Conference
PoF Centered Defect-based Approach for Stress Screening
• Physics of Failure (PoF) is widely used for reliability assessment and prognostics and health management (PHM) for electronics systems.
• Yet, the application of PoF concept for screening seems to lag behind.
• A defect-based approach based on PoF is proposed for initial ESS profile set up.
September 28- 30 2016, Pensacola Beach, Florida
Unit Definition
Existing Defects
Loading Conditions
Failure Mechanisms
Screen Selection to Precipitate Defects
Accelerated Stress Testing and Reliability Conference
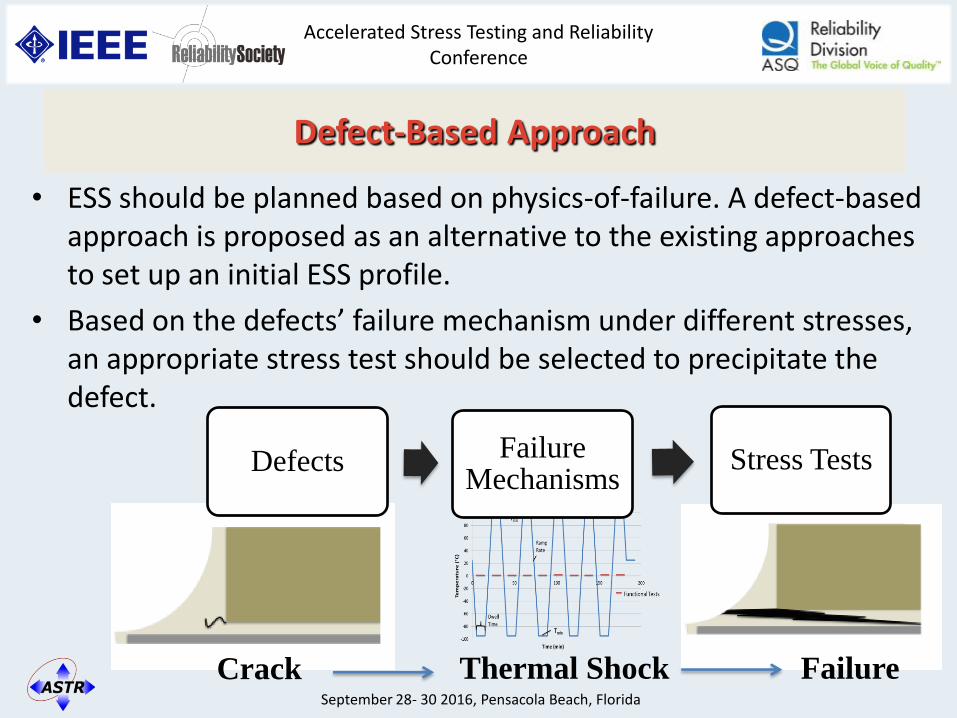
Defect-Based Approach
• ESS should be planned based on physics-of-failure. A defect-based approach is proposed as an alternative to the existing approaches to set up an initial ESS profile.
• Based on the defects’ failure mechanism under different stresses, an appropriate stress test should be selected to precipitate the defect.
Defects Failure Mechanisms
Stress Tests
Crack Thermal Shock Failure September 28- 30 2016, Pensacola Beach, Florida

Accelerated Stress Testing and Reliability Conference
Defect vs Stress Table for Board Layer Defects
September 28- 30 2016, Pensacola Beach, Florida

Accelerated Stress Testing and Reliability Conference
Example of Defect Page- Hollow Fiber
• Defect Description Long, hollow capillaries in glass filaments that provide pathway for conductive filament formation.
• Defect Formation Process(s) Air bubbles in molten glass are drawn into long capillaries in glass filaments during the processing of E-glass (most common fiberglass used in the electronics industry).
September 28- 30 2016, Pensacola Beach, Florida
Accelerated Stress Testing and Reliability Conference
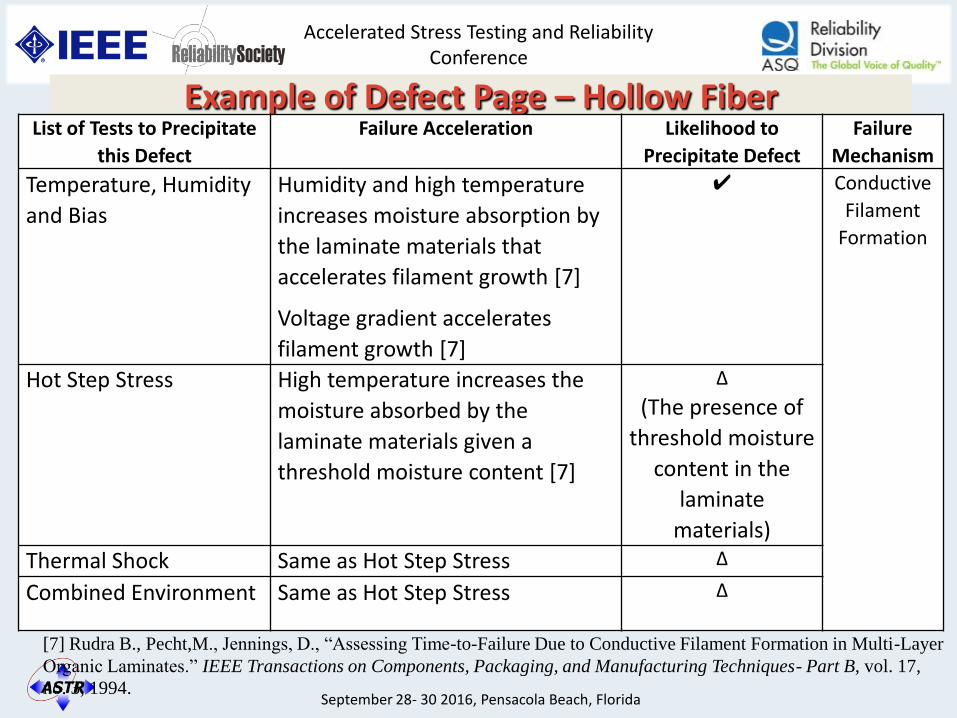
Example of Defect Page – Hollow Fiber
[7] Rudra B., Pecht,M., Jennings, D., “Assessing Time-to-Failure Due to Conductive Filament Formation in Multi-Layer
Organic Laminates.” IEEE Transactions on Components, Packaging, and Manufacturing Techniques- Part B, vol. 17,
no. 3, 1994.
List of Tests to Precipitate
this Defect
Failure Acceleration Likelihood to
Precipitate Defect
Failure
Mechanism
Temperature, Humidity
and Bias
Humidity and high temperature
increases moisture absorption by
the laminate materials that
accelerates filament growth [7]
Voltage gradient accelerates
filament growth [7]
✔ Conductive
Filament
Formation
Hot Step Stress High temperature increases the
moisture absorbed by the
laminate materials given a
threshold moisture content [7]
Δ
(The presence of
threshold moisture
content in the
laminate
materials)
Thermal Shock Same as Hot Step Stress Δ
Combined Environment Same as Hot Step Stress Δ
September 28- 30 2016, Pensacola Beach, Florida

Accelerated Stress Testing and Reliability Conference
Other Recommendations
• We urge the Department of Defense to discard MIL-HDBK 344A, so as to prevent more investments and efforts from wasted into performing ESS as required by MIL-HDBK 344A.
• Before the proposed defect-based approach matures, we encourage the industry to create a methodology in parallel that reflects today’s needs.
• For example, the up-to-date methodology should include the methods to acquire and estimate values instead of providing generalized values and models.
September 28- 30 2016, Pensacola Beach, Florida
Related Documents