Svensk Kärnbränslehantering AB Swedish Nuclear Fuel and Waste Management Co Box 250, SE-101 24 Stockholm Phone +46 8 459 84 00 Technical Report TR-10-69 Critical review of the literature on the corrosion of copper by water Fraser King Integrity Corrosion Consulting Limited December 2010

Welcome message from author
This document is posted to help you gain knowledge. Please leave a comment to let me know what you think about it! Share it to your friends and learn new things together.
Transcript

Svensk Kärnbränslehantering ABSwedish Nuclear Fueland Waste Management Co
Box 250, SE-101 24 Stockholm Phone +46 8 459 84 00
Technical Report
TR-10-69
Critical review of the literature on the corrosion of copper by water
Fraser King Integrity Corrosion Consulting Limited
December 2010
CM
Gru
ppen
AB
, Bro
mm
a, 2
011
Tänd ett lager: P, R eller TR.
Critical review of the literature on the corrosion of copper by water
Fraser King Integrity Corrosion Consulting Limited
December 2010
ISSN 1404-0344
SKB TR-10-69
Keywords: Copper, Water, Hydrogen Evolution, Canisters, Lifetime Prediction.
This report concerns a study which was conducted for SKB. The conclusions and viewpoints presented in the report are those of the author. SKB may draw modified conclusions, based on additional literature sources and/or expert opinions.
A pdf version of this document can be downloaded from www.skb.se.

2 TR-10-69
The following figures are reproduced with permission of the copyright holder:
Figures 1-1, 2-7 and 2-8 with permission of NACE International, Houston, TX, USA.Figures 1-2 and 3-5 with permission of the Nuclear Waste Management Organisation, Toronto, Canada.Figures 2-2, 3-1, 3-2, 3-3, 3-4 and 3-6 with permission of Elsevier B.V., Amsterdam, The Netherlands.Figure 2-3 with permission of Trans Tech Publications, Zurich, Switzerland.Figures 2-4, 2-5 and 2-6 with permission of The Electrochemical Society, Pennington, NJ, USA.Figures 2-9 and 2-10 with permission of Springer, Dordrecht, The Netherlands.

TR-10-69 3
Abstract
The conventional belief that copper is thermodynamically stable in oxygen-free water has been questioned by a research group from the Royal Institute of Technology, Stockholm lead by Dr. Gunnar Hultquist.
A critical review of the literature both in support of the proposed mechanism and that which argues against it has been conducted. The critical review has been supported by supplementary analyses, with particular focus on the scientific validity of the reported observations and their significance for the corrosion of a copper canister.
It is found that:
• thescientificevidenceinsupportofthesuggestionthatwateroxidisescopperisnotconclusiveand there are many aspects which are unclear and contradictory,
• despiteanumberofattempts,nootherresearchershavebeenabletoreproducetheobservationsof Hultquist and co-workers,
• evenifcorrect,themechanismisnotimportantforcoppercanistersinarepository,bothbecauseof differences in the environmental conditions and because, even if corrosion did occur by this mechanism, it would quickly stop, and
• thereisnoadverseimpactonthelifetimeofcoppercanistersduetothisproposed,butunproven,mechanism.

TR-10-69 5
Contents
1 Introduction 7
2 Critical review of the literature 112.1 Critical review 11
2.1.1 The original article of Hultquist, Corrosion Science 1986 112.1.2 Simpson and Schenk, Corrosion Science 1987 142.1.3 Seo et al. Proc. 10th ICC, 1987 142.1.4 Eriksen et al. SKB TR-88-17 and Corrosion Science 1989 162.1.5 Hultquist et al. Corrosion Science 1989 162.1.6 Möller, SKI Report 95:72 192.1.7 Gråsjö et al. Mater. Sci. Forum 1995 202.1.8 Szakálos et al. Electrochem. Solid-State Letters 2007 202.1.9 Johansson, Electrochem. Solid-State Letters 2008 232.1.10 Hultquist et al. 17th Int. Corrosion Congress 2008 232.1.11 Report from the SSM BRITE group 2009 252.1.12 Hultquist et al. Catal. Lett. 2009 272.1.13 Korzhavyi and Johansson, SKB TR-10-30, 2010 302.1.14 Bojinov et al. Corros. Sci. 2010 30
2.2 Summary of key points from the critical review of the literature 31
3 Supplementary analyses 333.1 Formation and properties of adsorbed Cu-OH species 333.2 Corrosion of copper in anoxic concentrated chloride solutions 383.3 Corrosion of copper in compacted bentonite 383.4 Role of dissolved oxygen 393.5 Corrosion potential considerations 413.6 Implications for corrosion of a copper canister in a deep geologic repository 42
4 Implications for canister lifetimes 43
5 Summary and conclusions 47
References 49

TR-10-69 7
1 Introduction
The integrity of the copper-cast iron canister is an important aspect of the KBS-3 repository design. For the expected repository conditions, analyses based on nearly three decades of research indicate that a 5-cm-thick copper shell will not fail within 100,000 years (SKB 2006a, b). Corrosion will be minimal because of the limited amount of oxidant within the repository and because of mass-transport limitations imposed by the use of highly compacted bentonite around the canisters. Once the initially trapped O2 in the bentonite (and any Cu(II) produced by the homogeneous oxidation of Cu(I) to Cu(II)) has been consumed, corrosion of the canister will cease unless sulphide reaches the canister surface (King et al. 2001, SKB 2006a, b). Based on the amount of sulphide present in the deposition holes and the amount that can diffuse to the canister surface from the groundwater, the estimated depth of corrosion after 100,000 yrs is <5 mm (SKB 2006a, b).
Long-term containment of the spent fuel is achieved through a series of engineered barriers, of which the copper canister is an integral component. These barriers, including the canister and clay-based buffer and backfill sealing materials, are designed to perform as an integrated system, one function of which is to ensure long canister lifetimes. A number of factors contribute to the long canister lifetimes, including:
• thelimitedrateofmasstransportofreactantsto,andofcorrosionproductsawayfrom,thecanister surface in highly compacted bentonite (HCB),
• thesuppressionofmicrobialactivitybyHCB,
• thelimitedavailabilityofoxidantwithintherepositoryenvironment,
• theinsignificantradiationfieldandyieldofradiolysisproductsresultingfromtheuseofathick-walled canister,
• thethermodynamicstabilityofcopperinO2-free aqueous solutions (in the absence of sulphide),
• thelimitedavailabilityofsulphideintheHCBandgroundwater,
• theabsenceofrapidformsoflocalisedcorrosionandenvironmentallyassistedcrackingintheexpected repository environment, and
• thestructuralstabilityofthecanisterresultingfromtheuseofathick-walledcastironinsert.
Thus, the thermodynamic stability of copper in O2-free aqueous environments is only one of a number of factors that lead to the long predicted canister lifetimes. Even then, the possibility that H2O (or H+) will act as an oxidant in the presence of sulphide is accounted for in the lifetime predic-tions. In fact, corrosion due to sulphide (accompanied by the evolution of H2) is predicted to account for >95% of the total wall loss within the 100,000-yr design life.
In corrosion science, the thermodynamic stability of a material in a given environment is typically represented in the form of a potential-pH (E-pH) figure, commonly referred to as a Pourbaix diagram (Pourbaix 1974). Pourbaix diagrams graphically illustrate the regions of thermodynamic stability of solid and dissolved species as a function of the pH and redox potential (EH). The boundaries between different solids represent the equilibrium conditions for conversion of one phase to another or, in the case of boundaries between a solid and a dissolved species, the equilibrium for a given activity of the dissolved component. Of course, the location of the various zones of stability depend not only on the values of the thermodynamic parameters, but more importantly on the identity of the species and the reactions between them. The selection of which species and reactions to include is based on experience of the corrosion characteristics of the given material or alloy in the given environment. Figure 1-1 shows the E-pH diagram for the Cu-H2O system for cases in which the assumed stable Cu(II) solid corrosion product is either CuO or Cu(OH)2. In both cases, the stability of Cu in pure water is indicated by the fact that the stability field for Cu2O lies above the H2O/H2 equilibrium (denoted as line (a) in the figures).

8 TR-10-69
Figure 1-1. Pourbaix diagrams for the copper-water system at 25°C considering different forms of copper(II) solid (Pourbaix 1974).

TR-10-69 9
The thermodynamic stability of copper and of the oxides diminishes in the presence of chloride ions (Figure 1-2). For example, in 1 mol/kg Cl–, both CuCl and CuCl2·3Cu(OH)2 are stable at certain pH and EH. Furthermore, Cu becomes thermodynamically unstable in water at low pH, as indicated by the fact that the Cu/CuCl2
– equilibrium line for a dissolved copper activity of 10–6 mol/kg crosses the H2O/H2 equilibrium line at pH 2-3 (Figure 1-2).
Copper is also unstable in water in the presence of sulphide ions (Figure 1-3). The stability field for copper sulphide (primarily Cu2S, with possible non-stoichiometric Cu2–xS species) straddles the H2O/H2 equilibrium line at all pH values.
Of course, copper could be thermodynamically unstable in other aqueous systems if there is a stable corrosion product that suppresses the E-pH range of stability for copper metal. In the case of the pure water system, however, this would require that this alternative corrosion product would need to exhibit a stability greater than that of Cu2O. Although this is possible it would seem unlikely, since such a species has not been identified on the basis of the 3,000-plus years of experience of mankind with copper and copper alloys and the even longer geological timeframes associated with native copper deposits.
Starting in 1986, Hultquist and co-workers have published a number of articles questioning the conventional position that copper is thermodynamically stable in O2-free pure water (Hultquist 1986, Hultquist et al. 1989, 2008, 2009, Szakálos et al. 2007, 2008). Other researchers have published evidence that either contradicts or calls into question the claims of Hultquist et al. (Eriksen et al. 1988, 1989, Johansson 2008, Möller 1995, Simpson and Schenk 1987, Apted et al. 2009). This report comprises a critical review of the literature on the corrosion of copper by water and a series of supplemental analyses aimed at providing insight into the issues raised in the published literature. The critical review in Section 2 includes articles by both Hultquist and co-workers and by those that dispute their claims. The supplementary analyses in Section 3 include discussion of the formation and properties of adsorbed Cu-OH species, the evidence for the corrosion of copper in anoxic Cl– solutions, the role of dissolved O2 in the corrosion of copper, corrosion potential considerations, and the implications of the proposed instability of copper in water on the long-term performance of copper canisters in a KBS-3 repository. Finally, in Section 4, a decision-tree approach is used to assess whether there is evidence for the oxidation of copper by water and, if so, what the impact would be on copper canisters.
10 TR-10-69
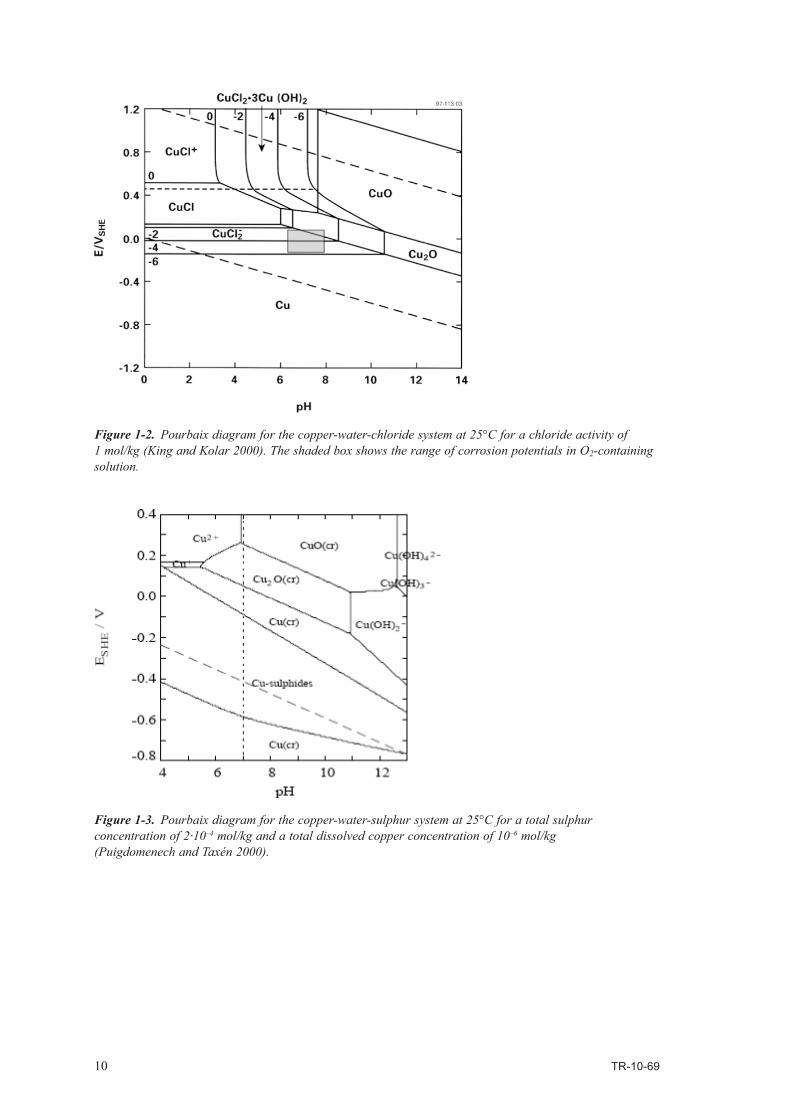
Figure 1-2. Pourbaix diagram for the copper-water-chloride system at 25°C for a chloride activity of 1 mol/kg (King and Kolar 2000). The shaded box shows the range of corrosion potentials in O2-containing solution.
Figure 1-3. Pourbaix diagram for the copper-water-sulphur system at 25°C for a total sulphur concentration of 2·10–4 mol/kg and a total dissolved copper concentration of 10–6 mol/kg (Puigdomenech and Taxén 2000).
TR-10-69 11
2 Critical review of the literature
In this section, the various key studies on both sides of the debate are critically reviewed. Only documents that are available to the author and in the public domain have been reviewed. The available information includes not only articles and papers in the peer-reviewed literature, but also discussion between various parties and information posted to various websites, all of which are publically accessible.
Figure 2-1 shows a timeline of the articles that have appeared in the scientific literature (with the exception of the June 1984 article in the Dagens Industri weekly technical journal) and which represent the key articles reviewed here. Following the publication of some of these articles, there has been an exchange of comments between the authors of the articles and critics of the work. These comments and the subsequent rebuttals are also captured here (both those that have been published in the scientific literature and those that have been posted to various websites), since they represent a key component of the current debate and of the scientific method of review and critique.
2.1 Critical review2.1.1 The original article of Hultquist, Corrosion Science 1986Following an initial newspaper report in 1984, Hultquist published the results of a study of the corrosion of copper in pure water as a Short Communication in Corrosion Science in 1986. The paper describes the results of a 1,200-hour experiment in which a number of polished copper strips (>99.7 wt.%, total surface area 1,460 cm3) were exposed to initially aerated deionised, double distilled water in a conical flask. The flask was apparently sealed using a weight impressing upon an O-ring gasket. The glass vessel was stored “under dark conditions” in order to exclude photoelectro-chemical effects. The temperature of the test was 24±2°C.
A solid-electrolyte hydrogen probe was inserted in the headspace above the solution in order to detect any H2 evolved from the solution. Prior to the experiment, the probe was calibrated with a range of H2/N2 gas mixtures and produced the theoretical 60 mV/dec response.
No attempt was made to initially deaerate either the water or the headspace, the volumes of which were 1.2 dm3 and 0.02 dm3, respectively. The concentration of dissolved O2 in water in contact with air at 24°C is 2.72·10–4 mol·dm–3 (Battino et al. 1983). The total amount of O2 in the vessel at the beginning of the experiment was, therefore, 3.26·10–4 mol dissolved in the water plus 1.72·10–4 mol in the headspace, for a total amount of 5.0·10–4 mol O2. The effectiveness of the weighted O-ring seal is unknown and it is possible that additional atmospheric O2 entered the vessel during the course of the experiment.
At the end of the experiment, a mass gain of 21.2 mg was observed. On the assumption that the mass change was due to the reaction
2Cu + H2O→Cu2O + H2 (2-1)
then the mass change corresponds to the loss of 2.65·10–3 mol (168 mg) Cu. In addition, it was estimated that 0.6 mg of dissolved Cu remained in solution, for a total loss of Cu of 169 mg (2.66·10–3 mol). Averaged over the entire duration of the experiment, the mean corrosion rate based on the mass loss is 0.096 µg·cm–2·h–1 (0.94 µm/yr). (Note: there are minor differences between the masses and rates given here and those reported by Hultquist (1986), presumably as a result of rounding errors.)

12 TR-10-69
Figure 2-1. Timeline of key articles and papers on the subject of the corrosion of copper by water.
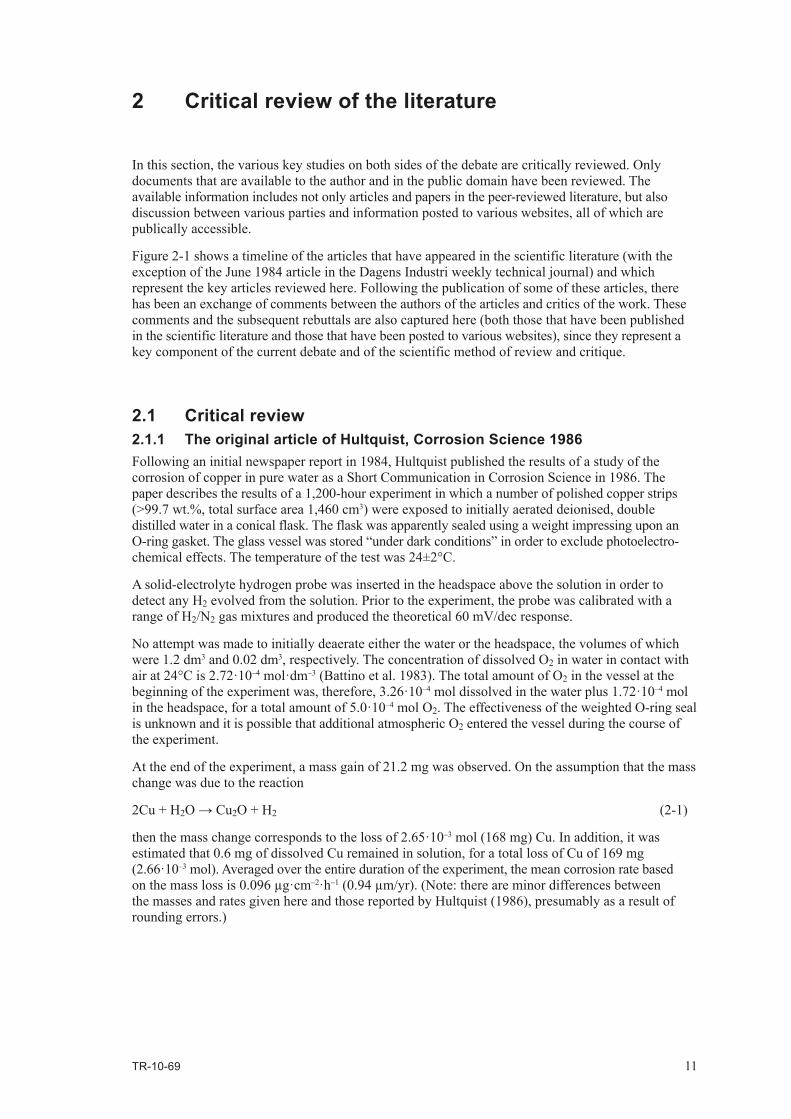
Hultquist (1986) reported the presence of H2 in the headspace above the water (Figure 2-2). Accumulation of H2 was observed after a period of 650 hr. Between that time and the end of the experiment, approximately 0.8 mg of hydrogen accumulated at a rate (based on the slope of the line in Figure 2-2) of 2.2·10–6 g/hr which, based on Reaction (2-1), is equivalent to a corrosion rate of 0.096 µg·cm–2·h–1 (0.94 µm/yr), exactly the same as estimated from the mass loss.
It is interesting to note that the rate of hydrogen production appears to be leveling off towards the end of the experiment (Figure 2-2), an observation that could have been confirmed if the experiment had been allowed to continue.
1984
1985
1986
1987
1988
1989
1990
1991
1992
1993
1994
1995
1996
1997
1998
1999
2000
2001
2002
2003
2004
2005
2006
2007
2008
2009
2010
HultquistCorros. Sci. 26, 1986,
173-177
Hultquist et al.Corros. Sci. 29, 1989,
1371-1377
Hultquist et al.Catal. Lett., published online 28 July 2009
Hultquist et al.Proc. 17th ICC,
2008, paper no. 3884
Szakálos et al.ESL 11, 2008, S2-S2
Szakálos et al.ESL 10, 2007, C63-
C67
BRITE groupSSM Report 2009:30
Simpson and SchenkCorros. Sci. 27, 1987,
1365-1370
Eriksen et al.Corros. Sci. 29, 1989,
1241-1250
JohanssonESL 11, 2008, S1-S1
MöllerSKI Report 95:72
Eriksen et al.SKB Technical Report
88-17
HultquistDagens Industri,
June 1984
Gråsjö et al.Mats Sci Forum 185-188, 1995, 703-712
Seo et al.Proc. 10th ICC 1987
Paper 2.31
Bojinov et al.Corros. Sci. 52, 2010,
2917-2927
Korzhavyi and Johansson
SKB TR-10-30
TR-10-69 13
Based on the similarity between the corrosion rates estimated based on the observed rate of H2 accumulation and the time-averaged mass loss, Hultquist (1986) proposed that the H2 observed was a result of the cathodic reduction of H+ (or H3O+) in support of the oxidation of Cu to Cu(I). Furthermore, it was stated that H+ (or H3O+) was the only oxidant and that the O2 initially present in the flask was consumed by an interfacial process involving hydrogen atoms produced by the reduc-tion of H+ (or H3O+), in a reaction of the type
4H + O2→2H2O (2-2)
This is a very important point in Hultquist’s claims which has gone overlooked. Not only does Hultquist claim that H2O is an oxidant for Cu, but he also proposes that H2O is reduced prefer-entially and to the exclusion of O2 as an oxidant. Notwithstanding the kinetic limitations of both the reduction of O2 and of H2O on Cu, the thermodynamic driving force for the reduction of O2 is 1.23 V more positive than that for H2O reduction. Not only is the reduction of O2 thermodynamically favoured over the reduction of H+ (or H3O+), but the initial concentration of dissolved O2 is over three orders of magnitude greater than that of H+ (or H3O+).
Apart from the observation that H2 was reported in the flask, it is not clear why Hultquist (1986) would exclude O2 as the most likely oxidant for the mass gain observed. It is interesting to note that the estimated amount (by the current author) of O2 in the flask initially (5.0·10–4 mol O2) would result in the corrosion of 127 mg Cu via the reaction:
4Cu + O2→2Cu2O (2-3)
This amount is less than the 169 mg mass loss reported by Hultquist (1986), but the difference could be due to air leaking into the flask through the O-ring gasket during the test.
Finally, in recognition of the fact that the amount of H2 reportedly observed is contrary to thermo-dynamic prediction, Hultquist suggested that the cathodic reaction is irreversible, implying that conventional thermodynamics cannot then be used to predict an upper H2 pressure. The logic of the argument in this final paragraph of the paper is somewhat unclear.
Figure 2-2. Time-dependent amount of hydrogen in the headspace above the water as reported by Hultquist (1986).

14 TR-10-69
The conclusions from the paper were that (Hultqist 1986):
“(1) Hydrogen is evolved during corrosion of copper , i.e. copper is oxidised by water.
(2) The escape rate of hydrogen from the corroding system is of decisive importance for the corrosion kinetics of copper in water.”
This second conclusion is interesting for a number of reasons. First, there was no discussion of this issue at all in the body of the text and there was no suggestion that H2 could escape from the flask. Therefore, the basis for the conclusion is obscure. Second, regardless of the basis for the conclusion, it is inconsistent with the suggestion that the H2 evolution reaction is irreversible. If this reaction is irreversible, then the partial pressure of H2 is irrelevant. Finally, if we assume that the conclusion is correct, then it has implications for the relevance of this proposed mechanism for the corrosion of copper canisters in the repository (see Section 3.6).
2.1.2 Simpson and Schenk, Corrosion Science 1987In response to the article by Hultquist (1986), Simpson and Schenk (1987) published a Short Communication in Corrosion Science describing their own attempts at measuring H2 due to corro-sion of copper in aqueous solution. This work was funded by Nagra and was an extension of their work using the measurement of the rate of H2 evolution to determine the anaerobic corrosion rate of C-steel for the Swiss programme. There were a number of differences, and a number of similarities, between the experimental methods used in both studies. The differences, and their significance, were discussed by Hultquist et al. (1989) and are summarised in Section 2.1.5. The major experimental differences between the two studies were that Simpson and Schenk (1987) used a simulated Swiss ground water and a NaCl solution instead of pure water and the solutions were deaerated prior to the tests. The significance of the Cl– ion is discussed in more detail in Section 3.2.
Simpson and Schenk (1987) used gas chromatography to measure the concentration of H2 in a N2 stream passed over the surface of the solutions containing the copper strips. The sensitivity of the technique to detect H2 evolved by corrosion is dependent on the N2 flow rate. With the normal flow rate of 0.1 dm3·hr–1, the detection limit was equivalent to a Cu corrosion rate of 3 nm/yr (assuming corrosion occurs via Reaction (2-1)). In some tests, the gas flow rate was stopped at the end of the experiment and any H2 allowed to accumulate under non-flowing conditions for a period of 50 hrs. The headspace gas was later collected in a known volume of N2 and again analysed for H2 by gas chromatography. The corresponding “detection limit” of this batch technique was one order of magnitude lower, i.e. a corrosion rate of 0.3 nm/yr.
No H2 was detected from either the ground water or NaCl solutions at temperatures of 50°C or 80°C using either continuously flowing N2 or the batch technique.
Small mass gains (0.56–1.0 mg) or mass losses (0.4 mg) were observed in the simulated ground water and NaCl solution, respectively. (The surface area of Cu was 2,400 cm2 in tests at 50°C and 1,200 cm2 at 80°C.) These mass changes were attributed to corrosion caused by trace levels of residual O2 left in the apparatus after inserting the specimens into the pre-deaerated solutions. The mass gain in the simulated ground water solution could be the result of Cu2O formation or the precipitation of a mineralised film. In the NaCl solution, Cu would dissolve anodically as CuCl2– (King et al. 2001) with minimal precipitation of a solid corrosion product. The gas chromatography technique was sufficiently sensitive that, had these small mass gains or losses been supported by the reduction of H+ (or H3O+), the resultant H2 would have been detected.
Simpson and Schenk (1987) were unable to explain the reason for the differences between their observations and those of Hultquist (1986).
2.1.3 Seo et al. Proc. 10th ICC, 1987Seo et al. (1987) published the results of various experiments in which Cu, Zn, and Fe samples were exposed to initially aerated water. The apparent production of H2 was monitored based on (i) the increase in total pressure (Zn only), (ii) the response of a solid state probe (Zn and Cu), or (iii) the potential of a Pd electrode immersed in the water (Cu or Fe). Additional experiments were performed in which a Pt wire immersed in the water was used to monitor the rate of O2 consumption.

TR-10-69 15
The experiment in which the solid-state electrode was used to monitor the rate of H2 generation from copper is the same as that described by Hultquist (1986). Eriksen et al. (1988, 1989) have criticised the use of this electrode and suggested that the measured voltages were in error. Szakálos et al. (2007) subsequently recognised the possible error in these measurements, and no further discussion of these results is given here.
In a second type of experiment, a copper wire was sealed in a glass tube along with water and a thin Pd sheet. A saturated calomel reference electrode (SCE) was also inserted into the cell in order to make potential measurements of the Cu wire and Pd sheet, the latter being used as a measure of the amount of H2 generated. A similar test was also performed using an Fe wire.
Figure 2-3 shows the time dependence of the potentials of the Pd and Cu electrodes (and the corresponding data for the experiment with an Fe wire) (Seo et al. 1987). The decrease in potential for the Cu and Fe wires was taken as a measure of the consumption of O2, whilst the potential of the Pd was taken as a measure of the amount of H2 absorbed by the sheet. These latter measurements are questionable, however, because, using the calibration table provided by the authors, there would appear to be an order of magnitude more H absorbed in the Pd sheet in the Cu experiment than in the equivalent test with Fe wire, despite a more vigorous evolution of H2 in the latter.
Figure 2-3. Time dependence of the potentials of a Pd sheet (cross-in-circle) and Cu wire(open circle) exposed to initially aerated water sealed in a glass tube (see illustration in the figure) (Figure 4 of Seo et al. 1987). Corresponding data for an experiment with an Fe wire are shown in the square symbols. The crosses are the potential of the Pd sheet in a blank experiment with neither Cu nor Fe.

16 TR-10-69
Of more interest is the potential of the Cu wire. The pH of the water measured at the end of the test was pH 7, whereas in a separate test with Fe an increase in pH to pH 9.3 was measured. The corresponding equilibrium potentials for the H2/H2O couple at 1 bar pressure are –0.655 VSCE at pH 7 and –0.791 VSCE at pH 9.3. Whilst the steady-state potential of the Fe wire (approximately –0.84 VSCE) is significantly below the equilibrium potential, that for the Cu (approximately –0.50 VSCE) is ~160 mV more positive. Since, if H2O is the oxidant in this system, the potential of the Cu must be more negative than the equilibrium potential for the H2/H2O reaction, the partial pressure of H2 would have to be <10–5 bar. Such a potential value is inconsistent with oxidation of Cu supported by the reduction of H2O.
Seo et al. (1987) then proposed a mechanism in which the O2 in the system, instead of being cathodi-cally reduced on the copper surface, is consumed by reaction with H atoms produced by the reduc-tion of water. The reduction of H2O is supposed to occur in both aerobic and anoxic conditions. The onset of H2 evolution corresponds to the point at which all of the initial O2 has been consumed by H. The only evidence provided for this proposed mechanism were results from gas-phase studies with sub-monolayer coverage by H2O and/or O2. Hultquist and co-workers also propose this mechanism in subsequent papers and it is discussed in more detail below.
2.1.4 Eriksen et al. SKB TR-88-17 and Corrosion Science 1989Eriksen and co-workers also studied the production of H2 from the corrosion of copper using gas chromatography in an SKB-funded study that was published both as an SKB report (Eriksen et al. 1988) and as a Short Communication in Corrosion Science (Eriksen et al. 1989). The experimental arrangement shared similarities with both the original work of Hultquist (1986) and the subsequent work of Simpson and Schenk (1987). In common with Hultquist’s experiment, Eriksen et al. (1988, 1989) used deionised, double-distilled water with approximately the same volume of water and surface area of copper of similar quality. (Eriksen et al. also used a higher purity 99.9995 wt.% Cu in a second test.) In common with Simpson and Schenk’s experimental technique, Eriksen et al. pre-deaerated both the water and vessels (although incompletely) and used gas chromatography to detect any H2 evolved (although with a lower sensitivity to that of Simpson and Schenk). In order to identify the corrosion products formed on the copper, Eriksen et al. used X-ray photoelectron spectroscopy (XPS, also known as ESCA) and cathodic stripping voltammetry, the latter technique also providing a measure of the quantity of reducible corrosion product on the surface.
Eriksen et al. (1988, 1989) did not observe any H2 produced from the exposure of copper to deionised, doubly distilled water during the exposure period of 61 days.
Both XPS and cathodic stripping voltammetry identified the corrosion product, which was present as visible patches on the Cu strip, as Cu2O. The time-averaged corrosion rate determined from the mass loss varied from 0.0082–0.014 µg·cm–2·h–1 (0.08–0.14 µm/yr) for the 99.7 wt.% purity Cu to 0.021 µg·cm–2·h–1 (0.21 µm/yr) for the 99.9995 wt.% Cu. This corrosion was attributed to residual O2 in the test vessel following incomplete initial deaeration, a claim which is consistent with the fact that the highest corrosion rate was observed for the higher-purity Cu, the surface area of which was only 40% of that of the 99.7 wt.%-purity Cu sample.
Eriksen et al. (1988, 1989) suggested that the reported observation of H2 by Hultquist (1986) was an error caused by long-term drift in the output of the solid electrolyte H2 probe. Szakálos et al. (2007) have subsequently acknowledged that the probe measurements could be in error.
2.1.5 Hultquist et al. Corrosion Science 1989The Hultquist et al. (1989) publication in Corrosion Science addressed three areas, namely:1. a critique of the paper by Simpson and Schenk (1987) based on a discussion of the supposed
significance of some of the differences in experimental technique,2. a presentation of a simple qualitative experimental illustration of the corrosion of copper by
water, and3. a description of possible corrosion products of the corrosion of copper in water and the associated
thermodynamic properties.
Hultquist et al. (1989) sought to explain the contradiction in the results from the Hultquist (1986) and Simpson and Schenk (1987) studies by focusing on the differences in four aspects of the respec-tive experimental methodologies. These differences and their suggested significance are:

TR-10-69 17
Surface finish of copper. Simpson and Schenk (1987) did not refer to any mechanical polishing of the copper sheet used in their tests, whereas Hultquist (1986) polished the surfaces to an 800-grit finish. Hultquist et al. (1989) speculated that the copper used by Simpson and Schenk may have been bright annealed in a H2 atmosphere, resulting in absorption of hydrogen into a near-surface layer which, it was then claimed, would suppress corrosion by the proposed mechanism. There is no evidence to support the claim by Hultquist et al. (1989) that the copper used by Simpson and Schenk did indeed contain such an altered surface layer. Furthermore, Hultquist et al. (1989) do not provide any explanation for how such a surface layer, if it indeed existed, would suppress the corrosion process. Hultquist et al. (1989) also claimed that by mechanically polishing the copper, Hultquist (1986) would have produced an oxide-free surface. Mechanical polishing with wet or dry SiC paper does not produce an oxide-free surface, which is the reason it is necessary to cathodically clean metal electrode surfaces in situ following polishing and prior to making electrochemical measurements.
Composition of solution. Hultquist et al. (1989) suggest that the increased concentration of dissolved Cu that would have been present in the Cl– solutions used by Simpson and Schenk could have lead to an increase in pH and the formation of a more-protective surface film, thus explaining the lower observed corrosion rate. Whilst it is true that the solubility of Cu(I) is increased by the presence of Cl– (due to the formation of Cu(I)-chloro complexes such as CuCl2
–), hydrolysis of these species would, if anything, have lead to a decrease in pH due to reactions such as
2CuCl2– + H2O→Cu2O + 4Cl– + 2H+ (2-4)
Technique for hydrogen detection and presence of oxygen. Hultquist et al. (1989) defended the use of the solid electrolyte H probe by claiming that, in a study of H2 evolution from the corrosion of Zn, the response of the same probe had been validated against manometric measurements of the rate of pressure increase. Simpson and Schenk (1987) used gas chromatography to detect any evolved H2 and had not criticised the use of the solid electrolyte H probe used by Hultquist (1986). However, at the end of a detailed and rather unclear discussion of the functioning of this probe, Hultquist et al. (1989) questioned Simpson and Schenk’s (1987) conclusion that the presence of 2 ppm O2 in the flowing N2 stream in the latter’s experiment would not have suppressed copper corrosion by water if that reaction were possible. Hultquist et al. (1986) stated that “We do not claim that this [the suppression of H+/H3O+ reduction by 2 ppm O2] is the case in Ref. 1 [(Simpson and Schenk 1987)] but it cannot be ruled out completely.” This seems to be a contradictory argument for Hultquist et al. (1989) to make because Hultquist (1986) contended that the reduction of H+/H3O+ proceeded even in aerated solution and that, indeed, it was the reaction between H atoms produced by this reduction reaction and O2 that was the cause of the consumption of O2.
The copper content in solution at the end of the experiment. Hultquist et al. (1989) seem to suggest that Simpson and Schenk erred in not measuring the dissolved Cu concentration at the end of their tests. It is not clear how this would have changed the conclusions of Simpson and Schenk (1987).
The simplified experimental technique discussed by Hultquist et al. (1989) comprised polished copper strips placed in glass tubes initially filled with aerated distilled water and sealed with either a Pd or a Pt membrane. The concept was that Pd would allow any H2 produced by corrosion of the copper to escape and for corrosion to therefore continue. In contrast, H2 would not permeate through the Pt membrane and, once an equilibrium pressure of H2 had built up within the glass tube, corro-sion would stop. Differences in the extent of corrosion in the two vessels were to be determined by visual inspection of the degree of corrosion product formation.
Hultquist et al. (1989) carried out tests for a period of 3,000 hr at a temperature of 50°C. Up to 200-hr exposure the copper strips in both tubes changed appearance to a similar degree. During this period, the authors suggested that the initially trapped O2 was consumed, although they did not state via which process (i.e. cathodic reduction or heterogeneous reaction with H atoms produced by the reduction of H+/H3O+). For the period 200–3,000 hrs, only the copper in the Pd-sealed glass tube continued to change colour. At the end of the test XPS (ESCA) was used to identify the nature (mainly Cu2O) and, user ion sputtering, the thickness of corrosion product, which was reported to be 5–6 times greater on the samples from the Pd-sealed tube. The authors claimed that this was evidence for the corrosion of copper in anoxic water and that the “kinetics of this corrosion can be ruled by diffusion of hydrogen through the enclosure of the system.”
SIMS was used to characterise the corrosion products on the samples, as well as on copper samples exposed to continuously aerated water. The higher relative abundances of ions containing H from the samples in the sealed glass tubes was taken as evidence that H+/H3O+ had been reduced during the tests.

18 TR-10-69
It is difficult to comment on the significance of these results without having been present during the experiments themselves. Although the explanation inferred by Hultquist et al. (1989) is plausible, more corrosion could have occurred in the Pd-sealed glass tube simply because this seal failed during the test, whereas the Pt seal did not (or did not to the same degree). Neither is the SIMS evidence convincing. Many different types of secondary ions are produced during the Ar+-ion bombardment of the surface. The differing amounts of H in the products could simply represent different degrees of hydration of the corrosion products formed. We note that the sealed glass tube experiments and the experiment in continuously aerated water were performed at different tempera-tures; at temperatures of 50°C and room temperature, respectively. Figueroa et al. (1986) studied the temperature dependence of the film breakdown (pitting) potential (EB) of copper in Cl– solutions at pH 9 and observed a minimum value at a temperature of 15°C, with the value of EB shifting to more-positive values with increasing temperature up to the maximum temperature of 55°C used in their studies. Figueroa et al. (1986) attributed this increasing protectiveness of the film to differing degrees of hydration over the temperature range studied.
Hultquist et al. (1989) briefly describe a second series of experiments in which the upper surface of the Pd seal was contacted by a column of water into which a saturated calomel reference electrode was inserted. Electrical contact with the upper surface of the Pd membrane was made with a Pt wire. This arrangement was designed to act as a crude hydrogen electrode, with the measured potential serving as a qualitative measure of the amount of hydrogen permeating through the Pd membrane. Experiments were set up with Zn, Fe, and Cu samples and a blank test without any metal. The most-negative potential was observed in the test with the Zn samples, followed by the Fe samples, with the least-negative potential recorded with Cu.
As with the glass tube experiments described above, it is difficult to criticise the reported observa-tions without a more-detailed knowledge of exactly how the experiments were conducted.
Hultquist et al. (1989) conclude the article with a discussion of possible alternative corrosion products. The underlying thesis of this discussion was that the corrosion products of the corrosion of copper in pure water are more complex than those shown in Reaction (2-1) and that thermodynamic predictions based on that stoichiometry are not valid. The authors present the results of SIMS analy-sis of Zr, Zn, Fe, and Cu surfaces exposed to H2, O2, or H2O at a partial pressure of ~10–5 Pa, report-ing species such as CuH+, CuO+, and CuOH+. Based on the relative amounts of these species for the different exposure conditions (and of the equivalent species for Zn and Fe), it was concluded that CuH+ is formed to a greater degree in the presence of H2O than when O2 is present. Presumably the inference was meant to be that H2O is reduced on copper, especially in the absence of O2. However, the exposure of Cu to these conditions has no relevance for the behaviour of copper in anoxic H2O. Aqueous corrosion is an electrochemical process that requires a minimum of several monolayers of water to occur. The formation of a sufficiently thick water layer is associated with the well-known critical relative humidity for atmospheric corrosion of 60–80% relative humidity. At a temperature of 25°C, this critical %RH corresponds to a water vapour pressure of ~2 kPa, approximately 8 orders of magnitude greater than the pressure in the tests from which these corrosion products were identified.
Based on this and additional evidence from UHV studies (Spitzer and Lüth 1985) and from studies in solution (Seo et al. 1987), Hultquist et al. (1989) list a series of mass- and charge-balanced reactions that they propose account for the corrosion of copper in H2O (with or without O2). These reactions involve the formation of a CuOH or Cu2OH intermediate species and the cathodic reduction of H+ to form atomic H:
Cu + H2O→Cu(H2O)ads→CuOH+H (2-5a)
followed by
2CuOH→Cu2O + H2O (2-5b)
or
CuOH→CuO+H (2-5c)
in the case of the CuOH intermediate, and
2Cu + H2O→2Cu(H2O)ads→Cu2OH + H (2-6a)
followed by
Cu2OH→Cu2O + H (2-6b)
in the case of the Cu2OH intermediate.
TR-10-69 19
It should be emphasised here that much of the evidence for these intermediate species comes from studies in UHV conditions with very low H2O vapour pressure.
There is no role in these reactions for the dissolved O2 present in solution initially in the glass tubes. Hultquist et al. (1989) claim that, instead of being cathodically reduced on the Cu surface, the O2 is consumed by reaction with the H formed in Reactions (2-5a), (2-5c), (2-6a), or (2-6b), via
H + ½O2→OH (2-7a)
or
2H + ½O2→H2O (2-7b)
In addition to the consumption of O2, atomic H can also (i) combine and evolve as H2, (ii) enter the copper, or (iii) escape from the system via some ill-defined pathway involving “surface diffusion and/or desorption.”
This suggestion that O2 does not directly participate in the corrosion of Cu in aerated solutions is unconventional but is consistently stated in Hultquist’s publications (Hultquist 1986, Gråsjö et al. 1995, Seo et al. 1987, Szakálos et al. 2007). This issue is analysed in more detail in Section 3.4.
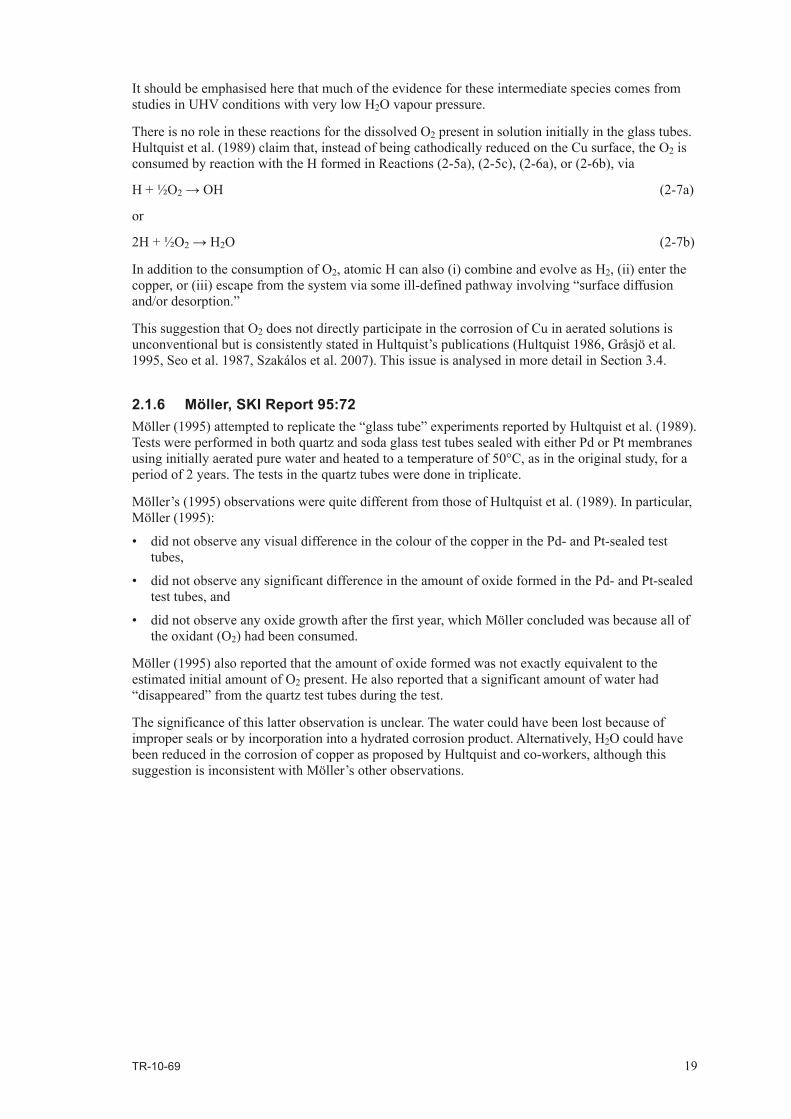
2.1.6 Möller, SKI Report 95:72Möller (1995) attempted to replicate the “glass tube” experiments reported by Hultquist et al. (1989). Tests were performed in both quartz and soda glass test tubes sealed with either Pd or Pt membranes using initially aerated pure water and heated to a temperature of 50°C, as in the original study, for a period of 2 years. The tests in the quartz tubes were done in triplicate.
Möller’s (1995) observations were quite different from those of Hultquist et al. (1989). In particular, Möller (1995):
• didnotobserveanyvisualdifferenceinthecolourofthecopperinthePd-andPt-sealedtesttubes,
• didnotobserveanysignificantdifferenceintheamountofoxideformedinthePd-andPt-sealedtest tubes, and
• didnotobserveanyoxidegrowthafterthefirstyear,whichMöllerconcludedwasbecauseallofthe oxidant (O2) had been consumed.
Möller (1995) also reported that the amount of oxide formed was not exactly equivalent to the estimated initial amount of O2 present. He also reported that a significant amount of water had “disappeared” from the quartz test tubes during the test.
The significance of this latter observation is unclear. The water could have been lost because of improper seals or by incorporation into a hydrated corrosion product. Alternatively, H2O could have been reduced in the corrosion of copper as proposed by Hultquist and co-workers, although this suggestion is inconsistent with Möller’s other observations.
20 TR-10-69
2.1.7 Gråsjö et al. Mater. Sci. Forum 1995Gråsjö et al. (1995) studied the consumption of O2 and the production of H2 during the corrosion of Al, Zn, Fe, Cu, and Grade 316 stainless steel exposed to pure water. The exact experimental procedure is not clear from the description provided, but it appears that the water was initially aerated but that the air above the water was removed in some tests, but not in others. Regardless, the time dependence of the amount of O2 and H2 in the headspace above the water was determined by bleeding off a small volume and analysing it in a separate chamber using mass spectrometry.
Oxygen was consumed during the tests for all the metals except the stainless steel, for which the corrosion rate was considered too small to significantly consume O2, although the sensitivity of the technique was reported to be equivalent to a corrosion rate of 0.01 µm/yr. Hydrogen was detected in the case of Al, Zn, and Fe but, interestingly, not for Cu. In the Cu test, approximately 99% of the original O2 had been consumed by the end of the 200-hr test but there appears to have been no attempt to extend the duration of the test to determine if H2 would have been produced once the water had become anoxic (as there was in the case of Fe, the test for which was allowed to continue for 2,000 hrs). Based on the time-dependence of the O2 concentration, the rate of O2 consumption in the Cu test was found to be first order with respect to [O2].
Gråsjö et al. (1995) concluded that the first-order kinetics for O2 consumption was evidence that O2 was consumed by reaction with H on the metal surface, presumably formed by the reduction of H2O. The authors appear to have discounted the more-conventional explanation that O2 was consumed by cathodic reduction on the copper, a reaction that is known to be first order with respect to [O2] (King et al. 1995a, b, Vazquez et al. 1994a, b). The only evidence that Gråsjö et al. (1995) provide in sup-port of their proposed mechanism are results from gas phase studies at temperatures of 160–400°C in which no liquid water was present (RH <0.02%) (Hultquist et al. 1993, 1994).
2.1.8 Szakálos et al. Electrochem. Solid-State Letters 2007The article by Szakálos et al. (2007) has resulted in much discussion about the claims of Hultquist and co-workers that H2O is an oxidant for copper in anoxic water. The paper is an attempt to produce a more-rigorous study of the proposed phenomenon to address concerns expressed by Eriksen et al. (1989), and admitted by Szakálos et al. (2007), regarding the validity of Hultquist’s (1986) H2 measurements using the solid electrolyte probe. In this latest work, the flux of H2 passing from the corrosion cell through a Pd membrane was measured using an ion pump or, alternatively, the accumulation of H2 was measured as a pressure increase in a fixed volume on the outlet side of the membrane.
Experiments were performed using polished oxygen-free high-conductivity (OFHC) Cu in deionised water for periods of up to 2,300 hrs and at temperatures that were varied between 8°C and 85°C. Attempts were made to deaerate the water but inevitably trace amounts of O2 remained in the system. Further details of the experimental procedure are given by Szakálos et al. (2007).
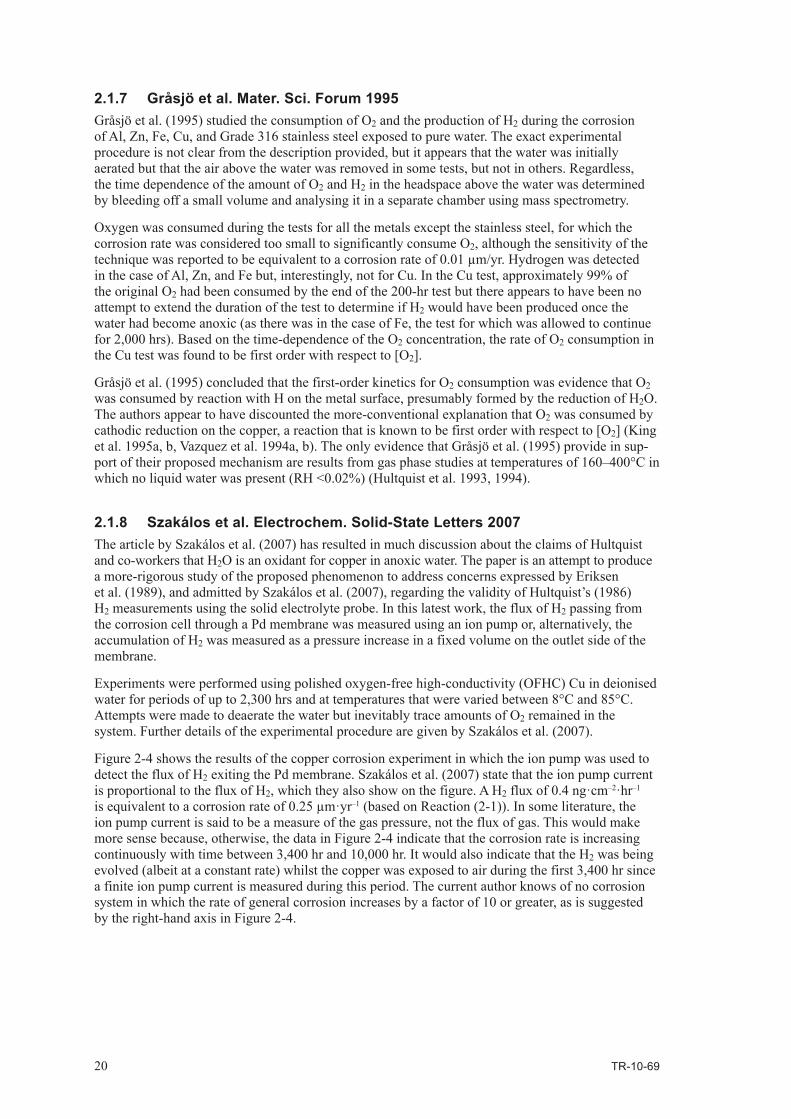
Figure 2-4 shows the results of the copper corrosion experiment in which the ion pump was used to detect the flux of H2 exiting the Pd membrane. Szakálos et al. (2007) state that the ion pump current is proportional to the flux of H2, which they also show on the figure. A H2 flux of 0.4 ng·cm–2·hr–1 is equivalent to a corrosion rate of 0.25 µm·yr–1 (based on Reaction (2-1)). In some literature, the ion pump current is said to be a measure of the gas pressure, not the flux of gas. This would make more sense because, otherwise, the data in Figure 2-4 indicate that the corrosion rate is increasing continuously with time between 3,400 hr and 10,000 hr. It would also indicate that the H2 was being evolved (albeit at a constant rate) whilst the copper was exposed to air during the first 3,400 hr since a finite ion pump current is measured during this period. The current author knows of no corrosion system in which the rate of general corrosion increases by a factor of 10 or greater, as is suggested by the right-hand axis in Figure 2-4.

TR-10-69 21
Figure 2-4. The reported flux of H2 produced by the corrosion of copper by water exiting a Pd membrane as measured using an ion pump (Figure 2 from Szakálos et al. 2007).
Figure 2-5 shows the results of the experiment in which the pressure of H2 accumulating above the Pd membrane was measured as a function of time, during which the temperature was increased on several occasions. Since this is a direct measure of the pressure, the rate of corrosion is given by the slope of the curve. Hydrogen was not specifically identified in this test and it was simply assumed that a decreasing pressure represented the consumption of O2 (open symbols) and an increasing pressure represented the production of H2 (full symbols). Following a period of 1,280 hrs, the pressure was observed to increase. The slope of this curve is relatively constant between changes in temperature, suggesting a constant corrosion rate at a given temperature. This is in contrast to the apparent acceleration in the corrosion rate represented by the data in Figure 2-4 and calls into question the interpretation of the results of these two experiments.
Figure 2-5. The reported change in pressure due to H2 produced by the corrosion of copper in water accumulating above the Pd membrane (Figure 3 from Szakálos et al. 2007).

22 TR-10-69
Another point of interest in Figure 2-5 is the apparent arrest in the increase in pressure at a temperature of 73°C after ~2,250 hrs (highlighted as an insert in the figure). Szakálos et al. (2007) interpreted this arrest as indicating that the system was reaching an equilibrium pressure, which they estimated to be about 1 mbar (101 Pa) at 73°C.
Following the experiment, the corrosion products were examined using powder XRD and SIMS. The SIMS analysis showed a range of ionic products with varying O and H contents. A similar trend to that reported by Hultquist et al. (1989) was observed, in which the H content was higher in tests performed in the absence of O2. The powder XRD suggested the presence of CuO and Cu2O. Nevertheless, the authors suggested that the major corrosion product was HxCuOy, an unspecified hydrogen- and oxygen-containing Cu species of undefined stoichiometry. Alternatively, the ionic products observed by SIMS could have resulted from a hydrated Cu2O film.
Szakálos et al. (2007) presented a modified Pourbaix (E-pH) diagram for the Cu–H2O system that includes the proposed stability field for the presumed corrosion product HxCuOy (Figure 2-6). Comparison with Figure 1-1 shows that the authors have assumed an equilibrium between HxCuOy and Cu2O, with the stability field of the new compound extending to a potential given by the water reduction line for a H2 pressure of ~1 mbar (101 Pa) corresponding to the proposed equilibrium H2 pressure estimated from Figure 2-5.
Based on the proposed mechanism and the estimated field of stability of the proposed new species HxCuOy, Szakálos et al. (2007) conclude that copper will corrode in anoxic water due to the reduc-tion of H2O if the H2 pressure is less than approximately 1 mbar (at 73°C). Hydrogen evolution is only detectable once O2 has been removed from the system and, although it is not specifically stated in this paper, it is implied that any O2 present is consumed by reaction with atomic H rather than by direct reduction on the copper surface.
There was some discussion of the results presented by Szakálos et al. (2007) between the authors and Drs. Hannu Hänninen and Willis Forsling of the Swedish National Council for Nuclear Waste (Hänninen and Forsling 2007, Szakálos and Hultquist 2008). Among other comments, Hänninen and Forsling (2007) proposed a number of alternative causes for the H2 observed by Szakálos et al. (2007), including: other cell components (such as the stainless steel components, glass, or sealing materials), desorption of hydrogen absorbed in the material during processing, or the oxidation of a pre-existing Cu2O film or of a Cu2O film formed by reaction with residual O2 to CuO.
The reply by Szakálos and Hultquist (2008) addressed these and other comments that had passed between the two groups. In response to the latter suggestion regarding the oxidation of a pre-formed Cu2O film, Szakálos and Hultquist (2008) claimed that there was insufficient residual O2 in the vessel to produce sufficient Cu2O to account for the amount of H2 observed. However, this response ignores the air-formed oxide that would have been present on the surface following polishing and which was not subsequently removed prior to the experiment.
Figure 2-6. Modified Pourbaix (E-pH) diagram including the proposed stability field for the new species HxCuOy (Figure 4 from Szakálos et al. 2007).
TR-10-69 23
2.1.9 Johansson, Electrochem. Solid-State Letters 2008Johansson (2008) published a comment on the Szakálos et al. (2007) article in which he provided an alternative explanation for the experimental observations. His major criticisms were that:
1. There is no evidence, in the form of a copper-based mineral for example, for the existence of a stable HxCuOy species, unlike the widespread evidence for Cu2O and CuO.
2. The H2 observed is consistent with the corrosion of the stainless steel reaction chamber and the thickening of the pre-existing passive oxide film.
3. The mass gain exhibited by the Cu can be explained solely in terms of the O2 initially in the test, contrary to the claim by Szakálos et al. (2007) that at least 50% of the mass change was the result of oxygen incorporated into the film due to the reduction of H2O.
Szakálos et al. (2008) responded to Johansson’s criticisms and maintained their original position, stating that:
1. Hydrogen was also observed in the “ion-pump” experiment, in which there was no exposed stain-less steel surfaces present. Furthermore, even in the “pressure-gauge” experiment where stainless steel surfaces were exposed to the water, they doubted whether the corrosion rate would have been sufficient at the temperature of the experiments to account for the amount of H2 reported.
2. Based on their calculations, there was insufficient initial O2 to account for the mass gain observed on the copper.
3. If the conventional E-pH diagram is correct, then Cu2O should have been reduced in the presence of H2 which did not occur so, by inference, there must be an alternative corrosion product present that is stable in the presence of H2.
The question of the amount of O2 initially present is a key issue and is, unfortunately, difficult to resolve. If, indeed, there was more oxygen in the corrosion product than was present initially as O2 then some or all of the oxygen is most likely to have resulted from the reduction of H2O. However, O2 is notoriously difficult to remove from aqueous solutions (Butler et al. 1994), as well as being difficult to prevent from re-entering the experimental apparatus.
In their response, Szakálos et al. (2008) present additional information regarding the hydrogen content of the copper foil. They suggest that, during the course of the experiment, the H content of the copper foil increased from 1 wppm to “about one order of magnitude more hydrogen in the copper metal than in the gas phase”, although Szakálos et al. (2008) do not actually state how much H was in the metal.
The solubility of hydrogen in copper is very small (San Marchi 2006). Measurement of low concen-trations of H in metals is complicated by artifacts due to hydrated corrosion products and adsorbed water. Based on extrapolation of the solubility data compiled by San Marchi (2006), the lattice H concentration in copper at 73°C is of the order of 10–5 wppm for a H2 pressure of 1 mbar (101 Pa). Although some H could also be trapped in the metal due to dislocations and other types of trap, such a large discrepancy with the reported value of 1 wppm is difficult to explain. Copper hydride is known, but is unstable at temperatures >0°C (Fitzsimons et al. 1995).
2.1.10 Hultquist et al. 17th Int. Corrosion Congress 2008Further evidence for the corrosion of copper in anoxic water was presented in a wide-ranging paper by Hultquist et al. (2008). The major focus of the paper was the results from two studies in which, again, differences were observed in the corrosion behaviour of copper in water in glass vessels sealed using either Pd or Pt membranes.
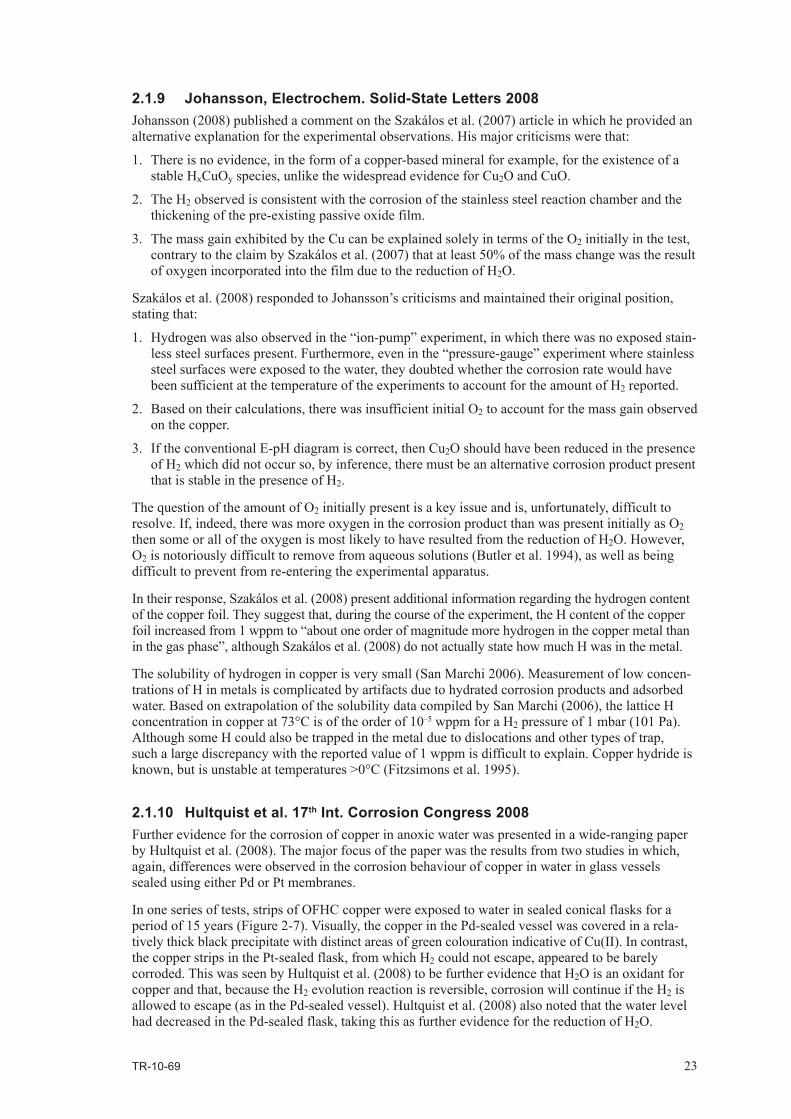
In one series of tests, strips of OFHC copper were exposed to water in sealed conical flasks for a period of 15 years (Figure 2-7). Visually, the copper in the Pd-sealed vessel was covered in a rela-tively thick black precipitate with distinct areas of green colouration indicative of Cu(II). In contrast, the copper strips in the Pt-sealed flask, from which H2 could not escape, appeared to be barely corroded. This was seen by Hultquist et al. (2008) to be further evidence that H2O is an oxidant for copper and that, because the H2 evolution reaction is reversible, corrosion will continue if the H2 is allowed to escape (as in the Pd-sealed vessel). Hultquist et al. (2008) also noted that the water level had decreased in the Pd-sealed flask, taking this as further evidence for the reduction of H2O.
24 TR-10-69
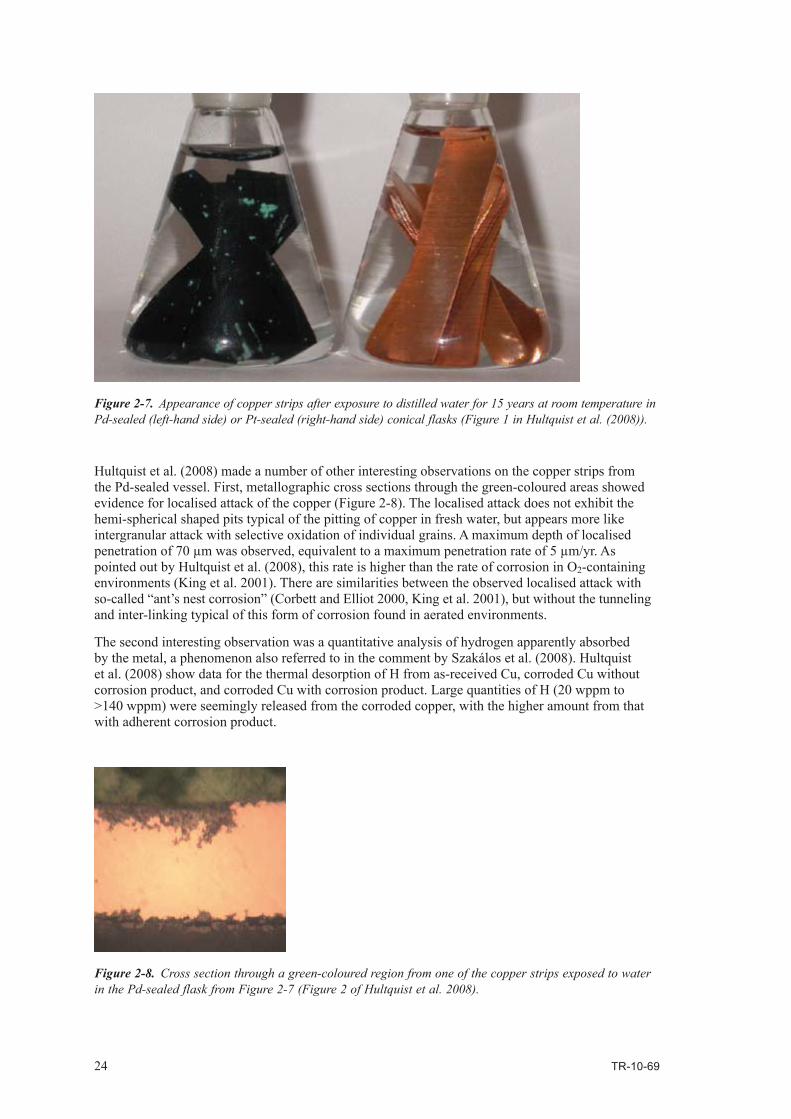
Hultquist et al. (2008) made a number of other interesting observations on the copper strips from the Pd-sealed vessel. First, metallographic cross sections through the green-coloured areas showed evidence for localised attack of the copper (Figure 2-8). The localised attack does not exhibit the hemi-spherical shaped pits typical of the pitting of copper in fresh water, but appears more like intergranular attack with selective oxidation of individual grains. A maximum depth of localised penetration of 70 µm was observed, equivalent to a maximum penetration rate of 5 µm/yr. As pointed out by Hultquist et al. (2008), this rate is higher than the rate of corrosion in O2-containing environments (King et al. 2001). There are similarities between the observed localised attack with so-called “ant’s nest corrosion” (Corbett and Elliot 2000, King et al. 2001), but without the tunneling and inter-linking typical of this form of corrosion found in aerated environments.
The second interesting observation was a quantitative analysis of hydrogen apparently absorbed by the metal, a phenomenon also referred to in the comment by Szakálos et al. (2008). Hultquist et al. (2008) show data for the thermal desorption of H from as-received Cu, corroded Cu without corrosion product, and corroded Cu with corrosion product. Large quantities of H (20 wppm to >140 wppm) were seemingly released from the corroded copper, with the higher amount from that with adherent corrosion product.
Figure 2-7. Appearance of copper strips after exposure to distilled water for 15 years at room temperature in Pd-sealed (left-hand side) or Pt-sealed (right-hand side) conical flasks (Figure 1 in Hultquist et al. (2008)).
Figure 2-8. Cross section through a green-coloured region from one of the copper strips exposed to water in the Pd-sealed flask from Figure 2-7 (Figure 2 of Hultquist et al. 2008).

TR-10-69 25
The third interesting observation, and one which Hultquist et al. (2008) associated with the presence of absorbed H, was that it was claimed that the mechanical properties of the material had been degraded by exposure to water. This claim was based on the observation that a crack initiated when a corroded strip was bent by 180° and a report in the literature that cathodic charging of copper reduces the tensile strength and strain-to-failure (Panagopoulos and Zacharopoulos 1994). However these latter tests were conducted under such severe charging conditions (current densities of 10–150 mA·cm–2 in 2.6 wt.% H2SO4 containing 10 mg/L As2O3) that the relevance to the conditions here is questionable (even if we assume that H2O is reduced on the copper surface). For OFHC Cu in contact with 69 MPa gaseous H2, there are conflicting reports of the effect of hydrogen on the mechanical properties of copper, with some studies showing no effect and others indicating a loss in tensile strength (San Marchi 2006).
Finally, Hultquist et al. (2008) reported the results of SIMS analyses of corrosion products on copper rods that had also been exposed to water in Pd- or Pt-sealed glass vessels. As previously reported (Hultquist et al. 1989, Szakálos et al. 2007), higher proportions of H-containing secondary ions were found for corroded Cu exposed to water in the Pd-sealed vessel. Hultquist and co-workers use these observations of H-containing corrosion products as evidence that H2O is acting as an oxidant, partly because Pourbaix diagrams conventionally show H-free Cu2O and CuO as the stable corrosion prod-ucts of Cu in H2O (even though Pourbaix (1974) also shows an E-pH diagram with Cu(OH)2 as the stable Cu(II) corrosion product). However, it has been known for some time that an adsorbed Cu(I) hydroxide species (CuOHADS) is a precursor of Cu2O formed during electrochemical experiments (King 2002, King et al. 2001). The formation and properties of these species are reviewed in more detail in Section 3.1. Furthermore, all passive films are hydrated to some degree and those formed on noble metals, including Cu, are often described as being hydrous in nature (Burke and Murphy 2001, Burke et al. 1990). Therefore, the presence of H in corrosion product films on copper is not necessarily an indication of the reduction of H2O.
2.1.11 Report from the SSM BRITE group 2009The Barrier Review, Integration, Tracking, and Evaluation (BRITE) group of the Swedish Radiation Safety Authority (SSM) published a critical review of the Szakálos et al. (2007) article in 2009 (Apted et al. 2009). The review was critical both in the sense that it presented an in-depth analysis of the original work, supplemented by additional analyses of their own and in the sense that the BRITE group were skeptical of the relevance to the KBS-3 concept of the reported observations, even if these findings could be shown to be valid. Although the review was officially published in 2009, a draft version had been available for review and comment, including by Hultquist and co-workers, prior to this date.
As noted above, the BRITE group cast doubt on the relevance of the findings of Hultquist and co-workers, concluding that:
“Based solely on our analyses of the information published up to and including Szakálos et al. (2007), and from the perspective of the performance of the KBS-3 concept, it could be reasonably argued that no further work was warranted on the postulated copper corrosion process. …”
The BRITE group performed supplemental analyses of the data presented by Szakálos et al. (2007), focusing on four possible alternative hypotheses for the generation of H2 in both the “ion-pump” and “pressure-gauge experiments” (Apted et al. 2009). It is important to note that the BRITE group did not dispute the fact that H2 was generated in these tests. The four alternative hypotheses were:
1. The mechanism proposed by Szakálos et al. (2007) in which H2O acts as an oxidant for Cu, with some of the resultant hydrogen evolving as H2 gas.
2. Oxidation of a Cu2O film (either pre-formed in air or formed due to corrosion by residual O2) to either CuO or Cu(OH)2 coupled to the reduction of H2O, with some of the resultant hydrogen evolving as H2 gas.
3. A surface catalysed process resulting in the reduction of H+ (or H2O) to H2 and the oxidation of dissolved Cu(I) (formed by the oxidation of Cu by residual O2) to dissolved Cu(II).
4. The H2 gas could have formed from H absorbed into the copper during the original manufacturing process.

26 TR-10-69
A fifth alternative hypothesis, that the H2 resulted from corrosion of the stainless steel surfaces exposed in the experiments (as proposed by Johansson (2008)), was considered to have been adequately addressed by Szakálos et al. (2008) and was not considered further by the BRITE group.
Supplementary analyses were performed in an attempt to identify which one of these alternative hypotheses, if any, could best account for the experimental observations. First, an analysis based on a conventional thermodynamic approach was carried out, which reaffirmed that H2O could not oxidise copper with the formation of Cu(OH)2 (the formation of Cu2O was not considered because of the assertion by Szakálos et al. (2007) that the corrosion product contains H and is of the form HxCuOy). Cupric hydroxide corresponds to the solid species proposed by Szakálos et al. (2007) for the case x = y = 2. A similar analysis was also performed for the reaction
2Cu + 2H2O→2CuOH+H2 (2-8)
with CuOH corresponding to the case of x = y = 1. This analysis also indicated that CuOH was thermodynamically unstable with respect to Cu metal for the conditions of the tests. Finally, the direct oxidation of Cu to Cu2+ by H+
Cu + 2H+→Cu2+ + H2 (2-9)
is only thermodynamically favourable (at pH 6.5 and 73°C) for [Cu2+] < 10–19 mol·dm–3, a condition that was deemed to be highly unlikely in water in contact with copper. It was concluded, therefore, that the available thermodynamic evidence did not support the contention of Szakálos et al. (2007) (Hypothesis 1), but the BRITE group did not entirely rule out the possibility that the proposed HxCuOy might exist.
The BRITE group also analysed the apparent time dependence of the corrosion rate from the ion-pump and pressure gauge experiments. As noted above, the H2 production (corrosion) rate in the ion-pump experiment increased with time. Acceleration of the rate of reaction is characteristic of an autocatalytic process (but is not characteristic of a catalytic process as suggested by the BRITE group) in which one of the products is the catalytic species. None of the proposed hypotheses above involve an autocatalytic process. Apparently Szakálos and Hultquist have suggested that the increasing reaction rate is a consequence of a deteriorating surface film, but the cited Szakálos and Hultquist (2008) is not listed in the references in the BRITE report.
Next, the BRITE group compared the H2 generation rates from the two experiments (the ion-pump and pressure-gauge tests) (Apted et al. 2009). For the ion-pump experiment, a mean corrosion rate of 0.08 µm/yr was derived, which is a factor of three less than the peak rate of 0.23 µm/yr based on the maximum reported H2 generation rate of 0.37 ng·cm–2·h–1 (Figure 2-4). Based on the integrated cor-rosion rate, a pre-existing Cu2O-layer thickness of 0.21 µm would be required if H2 was generated via (Hypothesis 2)
Cu2O + 3H2O→2Cu(OH)2 + H2 (2-10)
This oxide film thickness was deemed to be possible since O2 was initially present in the test vessel. Interestingly, the corrosion rate estimated by the BRITE group for the pressure-gauge experiment was approximately 40 times lower than that in the ion-pump experiment, even though the test was done at a higher temperature. This difference cannot be explained by the attainment of equilibrium in the pressure-gauge experiment since this condition was only established towards the end of the test. The BRITE group also estimated activation energies for the two tests and found that they differed. However, it is difficult to draw firm conclusions from the limited data available.
It was not possible to determine the validity of Hypothesis 3 (the surface-catalysed reduction of H+) based on the available data. Hypothesis 4 (the release of H in the as-received Cu strips) was consid-ered unlikely because the amounts of H2 generated exceeded the amount likely present in the metal by two orders of magnitude (in the case of the ion-pump experiment).
The BRITE group were critical of the solid-phase analyses that had been performed (Apted et al. 2009). They did not consider the SIMS data reliable for a number of reasons, and suggested that the inclusion of measurements on standard compounds would improve confidence in these measurements. They were similarly skeptical of the ability of powder X-ray diffraction to adequately
TR-10-69 27
characterise the corrosion products and suggested alternative X-ray techniques that should be used. Finally, they criticised the “vague and imprecise terms” in which Szakálos et al. (2007) described the properties of the proposed HxCuOy solid phase.
Having examined the basis for the claims of Szakálos et al. (2007) based on the scientific evidence provided, the BRITE group then considered the relevance and implications for the repository system. Much of this discussion was based on evidence from natural analogues. It was argued that, although there are a significant number of native (i.e. metallic) copper deposits known, there is no evidence for Cu ores bodies containing this previously unknown HxCuOy species as would be expected if this phase were thermodynamically stable. For example, there is no evidence for alteration rinds on the surface of copper deposits as would be expected if Cu was slowly altered to HxCuOy. Neither can it be argued that HxCuOy is metastable with respect to Cu (i.e. HxCuOy was formed initially but it has since been reduced to Cu metal), since mineralogical and crystallographic evidence indicates that these deposits were formed as Cu metal. There is no evidence from the geological record, therefore, for either the formation or the persistence of the proposed HxCuOy phase.
Finally, the BRITE group considered the implications of Szakálos et al.’s (2007) claims for the lifetime of the copper canisters and the overall safety of the KBS-3 system. They estimated a canister lifetime of 625,000 yrs based on their estimated corrosion rate of 0.08 µm/yr, although it could be argued that the lifetime would only be 217,000 based on the peak H2 generation rate presented in Szakálos et al. (2007). The BRITE group argued that even if the canister lifetime was of the order of 625,000 yrs it would have little impact on safety (as measured by the release of dose-contributing radionuclides) because the half-lives of the highly soluble radionuclides (e.g. Cl-36, I-129, Cs-135) are so long that the suggested reduction in the period of containment has little effect on dose.
The overall conclusions from the BRITE group report were that:
• TheinformationpresentedinSzakálosetal.(2007)isincompleteanddoesnotsubstantiatetheclaim that water oxidises copper.
• However,thepossibilitythatthisreactionispossiblecannotbeexcludedbecausenootherviablemechanism has been demonstrated.
• TheevidenceprovidedbySzakálosetal.(2007)insupportoftheformationofHxCuOy is insufficient.
• TherearealternativemechanismstoexplaintheobservationofH2 formation, but there is insufficient information to adequately test these hypotheses.
• ThereisnoevidencefromnaturalanaloguesfortheformationorpersistenceofHxCuOy.
• EveniftheclaimsofSzakálosetal.(2007)arecorrect,thereislittleornoimpactonthesafetyof the KBS-3 disposal system.
• Whilsttheywereinclinedtosuggestthatnofurtherinvestigationofthisissueiswarranted,theBRITE group recommended than an independent study into the claims be performed under well-controlled conditions.
2.1.12 Hultquist et al. Catal. Lett. 2009The latest paper in the series from Hultquist and co-workers (Hultquist et al. 2009) is the first in which the authors attempt to make predictions of the lifetime of copper canisters in a repository. The paper is a collection of various topics, including (i) the results of molecular dynamics simulations of proposed surface species, (ii) further measurements of H2 evolved from copper corrosion experi-ments in water, and (iii) predictions of the extent of copper corrosion on copper canisters in the repository.
A theme that carries through many of the publications reviewed here, and which continues in Hultquist et al. (2009), is the reliance by Hultquist and co-workers on information derived from studies of copper surfaces exposed to gaseous water vapour and/or O2 at low pressures. These gas-phase studies have been used to justify the proposed consumption of O2 by H atoms formed from the reduction of H2O in aqueous solution and the formation and existence of H-containing corrosion products. The fundamental conditions and the processes that operate in the gas phase are totally

28 TR-10-69
different from those that occur in solution. In solution, ionic species are hydrated and the interface comprises a double-layer structure that affects, among other processes, the adsorption of species on the surface and the nature of charge transfer reactions. Electrochemical charge-transfer processes are responsible for oxidation and reduction processes at the surface. The use of information gathered from gas phase studies, in which neither a double layer exists nor electrochemical reactions occur, must be considered tenuous at best.
The molecular dynamics simulations were an attempt to obtain a value for the free energy of forma-tion of the proposed HxCuOy species, the lack of which had been criticised in reviews of earlier papers from this group. Hultquist et al. (2009) chose to perform simulations for the copper atom-hydroxylradicalsystem,forwhichtheyestimatedaΔGf value of –548 kJ/mol. This value should be compared with values of –200 kJ/mol (Wagman et al. 1982, cited by Apted at al. 2009) and the value of –228 kJ/mol for CuOHADS (Protopopoff and Marcus 2005). Using the value estimated using molecular dynamic simulations gives an overall free energy change for the reaction
Cu + H2O→CuOH+½H2 (2-11)
of–311kJ/mol,comparedwithvaluesof+37kJ/moland+9kJ/molbasedontheΔGf values for CuOH of Wagman et al. (1982) and Protopopoff and Marcus (2005), respectively. Based on the value estimated for CuOH by Hultquist et al. (2009), the equilibrium H2 pressure for Reaction (2-11) is >10100 bar at 25°C.
The experimental measurements were similar to those reported by Szakálos et al. (2007) and carried out in a similar apparatus, except with the addition of a pressure gauge and a facility to sample the gas phase for analysis using a mass spectrometer. Few details were given of the results of this test, although later in the text the authors refer to an equilibrium H2 pressure of 0.5 mbar at 45°C. This value is clearly inconsistent with that calculated from the free energy change for Reaction (2-11).
Hultquist et al. (2009) predict the extent of corrosion of a copper canister based on a linear extrapo-lation of a log-log plot of the time dependence of the depth of corrosion based on measurements for four different exposure times. The basis for each of these four points is unclear, but from what is stated in the text and from estimates taken directly from Figure 2-9, it appears that:• ThedatumfortheshortestexposureperiodisbasedonthedealloyingofaCu-Aualloyinwater
for a period of 20 hrs. Based on a measurement directly from Figure 2-9, the depth of de-alloying appears to have been ~0.3 nm, giving a mean "corrosion" rate of 0.1 µm/yr. Quite what relevance the de-alloying of a Cu-Au alloy has for the corrosion of a copper canister is unclear.
• Thesourceofthedatumatatimeof~0.1yrisunknown.Hultquistetal.(2009)refertoa"Ref. [24]" but this relates to an investigation of the condition of the 17th century Swedish war-ship Vasa and a careful reading of that article makes no mention of copper artifacts. Regardless, the depth of corrosion from the figure is ~0.02 µm in a period of 7 weeks giving a mean corro-sion rate of 0.15 µm/yr.
• Thedatumatatimeof15yrscomesfromthestudyofHultquistetal.(2008).Thetextreferstoa maximum depth of 35 µm, although direct measurement from the figure suggests a value of 14 µm. Regardless, the mean corrosion rate is of the order of 1–2 µm/yr.
• Thefinaldatapointsatatimeof333yrsareestimatedfromobservationsofcoppercoinsfromthe warship Vasa. Measurements from the figure suggest a corrosion depth of 1.1 mm, giving a mean corrosion rate of 3.3 µm/yr. A more-detailed discussion of the relevance of these artifacts is given below.
Based on these four data points, Hultquist et al. (2009) then linearly extrapolated the log-log plot and estimated that a copper canister would corrode more than 1 m in 100,000 yrs. (In fact, extrapolation of the data suggests a depth of ~3 m, equivalent to a mean corrosion rate of 30 µm/yr). A feature of this extrapolation of a log-log plot, which Hultquist and co-workers acknowledged, is that the corrosion rate is predicted to increase with time. Hultquist et al. (2009) claimed that this was due to the uptake of H by the copper, and cited evidence for a similar effect on steels and copper. The refer-ence cited for the effect of H on steels (Yang et al. 1998, the reference is mis-cited as Qiao and Luo 1998 by Hultquist et al. 2009) actually refers to the effects of H on the localised corrosion properties of passive films on Type 310 stainless steel. Whilst evidence for an increase in the rate of general corrosion of C-steel due to absorbed H has also been reported in the literature (Gu et al. 1999), the

TR-10-69 29
effect seems to require severe charging conditions (24 h cathodic charging at a current density of 3 mA·cm–2 in a 1 mol·dm–3 H2SO4 solution containing 250 µg·g–1 As2O3). The reference cited for the effect of hydrogen on copper corrosion refers to a Sandia National Labs news bulletin that describes experiments with implanted D in thin vapour deposited Cu layers on Si wafers (Sandia 2000).
The most important set of data in Figure 2-9 are those from the Vasa since they represent the longest exposure time of any of the points on the plot. Hultquist et al. (2009) claimed that, as with the other data on the figure, the artifacts from the Vasa had been exposed to anoxic water. This was based on the report by Sandström et al. (2002) on the degradation of the wooden structure of the ship after exposure to air. Figure 2-10 shows an image of two of the coins on which Hultquist et al. (2009) based their estimate of the corrosion rate. One coin is clearly more-severely corroded than the other, which Hultquist et al. (2009) claimed was due to limited access of water to the less-severely corroded coin. It is highly unlikely that the rate of water access would vary for different coins in saturated media. A far more likely explanation is that the corrosion rate was limited by the supply of sulphide. Sandström et al. (2002) refer to an earlier measurement of a sulphide concentration of 7 mg/L in the region of the Vasa. Sulphide is present because the anoxic conditions were created by microbial activity in the vicinity of the wreck. It is the oxidation of that sulphide and elemental sulphur that is now causing deterioration of the wooden components of the ship in the Vasa museum.
In summary, the scientific basis for the data in Figure 2-9 and the conclusions drawn from extrapolation of the corrosion damage must be considered of dubious validity.
Figure 2-9. Log-log plot of corrosion depth against time for copper-containing alloys in assumed anoxic conditions used by Hultquist et al. (2009) to predict the depth of corrosion on a copper canister (Figure 4 from Hultquist et al. 2009).
Figure 2-10. Image of copper coins taken from the wreck of the Vasa (Figure 3 from Hultquist et al. 2009).
30 TR-10-69
2.1.13 Korzhavyi and Johansson, SKB TR-10-30, 2010Korzhavyi and Johansson (2010) used quantum mechanical techniques to investigate the structural and energetic stability of various compounds of Cu+, Cu2+, O2–, H– and H+. The aim of the studies was to determine, using density functional theory and linear response theory, whether the HxCuOy species proposed by Szakálos et al. (2007) was stable.
The authors first validated their approach by calculating enthalpies and free energies of formation of compounds that have been well studied and for which experimentally measured values are available. The compounds considered (and their structures) were Cu2O (cuprite structure), CuO (tenorite), and CuH (wurtzite and sphalerite structures). All species were found to be structurally stable and the calculated enthalpies and free energies of formation close to the measured values.
Having thus validated their computational approach, Korzhavyi and Johansson (2010) then went on to assess the stability of other Cu, O, and H-containing compounds that corresponded to the pro-posed HxCuOy species. Various structural forms of Cu4H2O and CuH2 were found to be dynamically unstable. Different structural forms of CuOH were also investigated and a free energy of formation of –158 kJ/mol to –161 kJ/mol estimated. These values contrast with the value of –584 kJ/mol pro-posed by Hultquist et al. (2009) based on molecular dynamics simulations of copper atoms and the hydroxyl radical, but are of the same order as the values of –200 kJ/mol and –228 kJ/mol reported by Wagman et al. (1982) and Protopopoff and Marcus (2005).
TakingaΔGf value of –159 kJ/mol for CuOH produces a free energy change for reaction (2-11) of +78 kJ/mol. Furthermore, CuOH is metastable with respect to Cu2O since the free energy change for the reaction
2CuOH = Cu2O + H2O (2-12)
is –66 kJ/mol.
Thus, the quantum mechanical simulations of Korzhavyi and Johansson (2010) demonstrate that CuOH could not be the stable solid phase responsible for the corrosion of copper by water.
2.1.14 Bojinov et al. Corros. Sci. 2010Bojinov et al. (2010) carried out a series of careful electrochemical measurements on copper in deaerated deionised water in an attempt to identify possible reactions that could account for the generation of H2 from this system. Very low concentrations of dissolved Cu2+ were observed in solu-tion (of the order of 20 nmol/L), thought to be generated by the dissolution of the air-formed oxide produced during preparation of the electrode or by dissolution of oxide formed by the consumption of trace levels of residual O2 in solution. The similarity of the open-circuit potential of a copper electrode and that of a Cu2+ ion-selective electrode suggested that the potential was determined by a redox reaction involving the dissolved Cu2+. The presence of a Cu2O film was confirmed during the early stages of the exposure (after 2-3 hours) by cathodic stripping voltammetry. However, no such film was present after a total exposure period of 330 hrs, suggesting that further corrosion of the electrode had not occurred following the consumption of the residual O2. There was also evidence for adsorbed surface species from electrochemical impedance spectroscopy measurements.
TR-10-69 31
The observations were interpreted in terms of an adsorbed CuOHads species responsible for the reduction of water by a reaction such as
Cu*(O)Hads + H2O + e– = Cu*(O)ads + H2 + OH– (2-13)
where Cu* indicates a surface copper atom.
Two possible routes for the formation of CuOHads (or Cu*(O)Hads) were considered, one involving the oxidation of Cu
H2Oads = OHads + H+ + e– (2-14a)
OHads + Cu = CuOHads (2-14b)
and the other involving the reduction of dissolved Cu2+
Cu2+ + OH– + e– = CuOHads (2-15)
Reaction (2-14) can be written more simply as
Cu + H2Oads = CuOHads + H+ + e– (2-16)
where the fact that this reaction involves oxidation of the copper is clear.
Fitting of this model to their electrochemical measurements allowed the rate constants for the vari-ous reactions to be determined, from which it was apparent that the predominant source of CuOHads was the reduction of dissolved Cu2+ (reaction (2-15)). It was concluded, therefore, that H2 could be produced by reaction (2-13) without the requirement to oxidise copper.
2.2 Summary of key points from the critical review of the literature
There are a number of key points arising from the various studies reviewed above. These key issues are summarised here in bullet form, with a more-detailed discussion provided in the foregoing sections:
• Hultquistandco-workershaveprovidedevidencefortheevolutionofH2 during the corrosion of copper in pure water based on: (i) the difference in corrosion rate and visual appearance of samples in Pd- and Pt-sealed vessels, (ii) ion-pump measurements of the flux of H2 through a Pd membrane, (iii) pressure changes due to the consumption of O2 and the production of H2.
• Gråsjöetal.(1995)didnotobserveH2 production from the corrosion of copper in water, although the experiment may not have been allowed to run long enough for anoxic conditions to be established.
• NeitherSimpsonandSchenk(1987)norEriksenetal.(1988,1989)observedH2 production from the corrosion of copper in aqueous chloride solutions or pure water, respectively, using gas chromatography.
• Möller(1995)didnotseeanyvisualdifferenceintheappearanceofCustripsinPd-andPt-sealed glass vessels and corrosion appears to have ceased half-way through the 2-year experiment.
• ThepotentialofCuwireduringsupposedH2 generation is 150 mV more positive than the equilibrium potential for the H2O/H2 rection for a H2 pressure of 1 atm (Seo et al. 1987).
• TheproductionofH2 has been associated with the formation of a previously unknown phase HxCuOy (Hultquist et al. 2008, 2009, Szakálos et al. 2007).
• TheequilibriumH2 pressure for the Cu/ HxCuOy system is believed to be ~1 mbar (101 Pa) at 73°C (Szakálos et al. 2007).

32 TR-10-69
• Iftheion-pumpcurrentdescribedintheworkofSzakálosetal.(2007)isameasureofthefluxofH2 as the authors claim, then their results indicate that the rate of corrosion increases monotoni-cally upon exposure to O2-free water.
• Hultquistandco-workerspointtothepresenceofHincorrosionproductsoncopperasevidencefor the reduction of H2O, but passive films, including those on copper, are hydrated to some degree.
• ThecorrosionofcopperinwaterwillcontinueprovidedH2 is removed from the interface and the pressure remains below the equilibrium pressure (Hultquist 1986, Hultquist et al. 1989, Szakálos et al. 2007).
• Oxygendoesnotsupportthecorrosionofcopperinwaterbutis,instead,consumedbyreactionwith H atoms produced by the reduction of H2O (Gråsjö et al. 1995, Hultquist 1986, Hultquist et al. 2008, Seo et al. 1987, Szakálos et al. 2007).
• ThereductionofH2O is capable of supporting the oxidation of copper to the Cu(I) and Cu(II) oxidation states (Hultquist et al. 1989).
• BasedontheanalysisbytheSSMBRITEgroupofthepaperbySzakálosetal.(2007),thecorrosion rate of copper in the "pressure-gauge" experiment is approximately 40 times lower than that in the ion-pump experiment despite being done at a higher temperature.
• Quantummechanicalcalculationsindicatethattherearenostable(withrespecttoCu2O) compounds that would correspond to the proposed HxCuOy species proposed by Hultquist and co-workers (Korzhavyi and Johansson 2010).
• Bojinovetal.(2010)suggestthatH2 could be formed without the oxidation of copper due to reactions between an adsorbed CuOHads species and H2O. The CuOHads species is formed from the reduction of dissolved Cu2+ that results from the dissolution of a pre-formed Cu2O layer or from the consumption of residual O2.
• Hultquistandco-workershavereportedH2 generation from initially aerated experiments (e.g. Hultquist (1986)) and from experiments in which the water used had been extensively deaerated (e.g. Hultquist et al. (2009)). Thus, pre-oxidation of the surface does not seem to affect H2 generation from copper.
• NeitherHultquistandco-workersnorotherresearchershavereportedthegenerationofH2 when copper is exposed to solutions other than pure water, e.g. saline solutions representative of bentonite pore water or deep ground waters.

TR-10-69 33
3 Supplementary analyses
In this Section, we expand on some of the issues raised from the critical review of the literature in Section 2 and provide further analyses and discussion in an attempt to resolve these issues.
3.1 Formation and properties of adsorbed Cu-OH speciesHultquist and co-workers have proposed the formation of an unidentified stable solid phase to account for the evolution of H2 from the corrosion of Cu in pure water. Based on SIMS analysis of corrosion products from aqueous- and gas-phase experiments, this solid has been identified by the generic composition HxCuOy. The thermodynamic properties of this species have been inferred from an apparent equilibrium partial pressure of H2 observed by Szakálos et al. (2007). Although, presum-ably, x and y could be non-integral, the corresponding compounds for x = y = 1 and x = y =2 are CuOH and Cu(OH)2. The latter, of course, exists as a Cu(II) solid and its thermodynamic properties are known (Pourbaix 1974), but it is only stable at potentials approximately 700 mV more positive than the H2O/H2 equilibrium (Figure 1-1(b)). The species CuOH is unknown as a stable solid (although Wagman et al. (1982) do provide a single value for the free energy of formation), but is thought to exist as a surface intermediate species formed during the oxidation of copper in electrochemical experiments (King and Kolar 2000).
Figure 3-1 shows the results of cyclic voltammetric experiments in deaerated 0.1 mol·dm–3 NaClO4 solution at pH 7 and pH 10 (King et al. 1995a). The anodic peaks A1 and A2 on the forward potential scan are believed to be due to the formation of sub-monolayer quantities of Cu(OH)ADS or Cu2O, formed by the reactions (Burstein and Newman 1981, Elsner et al. 1988, King and Kolar 2000):
Cu + H2O→Cu(OH)ADS + H+ + e– (3-1a)
or
2Cu + H2O→Cu2O + 2H+ + 2e– (3-1b)
Formation of Cu2O by the loss of water from Cu(OH)ADS
2Cu(OH)ADS→Cu2O + H2O (3-2)
is also possible but, being a chemical reaction, would not account for the peaks seen in Figure 3-1. Peak A1 is more prominent at the higher pH (Figure 3-1(a)), suggesting that this species could be due to the formation of Cu(OH)ADS. Peak C1 is due to the reduction of Cu2O (i.e. the reverse of Reaction 3-1(b)), as identified from the peak potential. Peaks A1 and A2 account for less than one monolayer of adsorbed species, based on the monolayer charge densities given in the literature (see King and Kolar 2000). A monolayer or more of Cu2O is only formed if the potential is scanned into region A3.
An important feature of peak A1 is that it is formed at a potential more negative than the equilibrium potential for Reaction (3-1(b)). At pH 10, the equilibrium potential for the formation of Cu2O is –0.36 VSCE (Pourbaix 1974), compared with a peak potential for A1 of –0.65 VSCE.
In chloride solutions, there appears to be competition between OH– and Cl– for surface sites (King and Kolar 2000). Chloride ions are known to form adsorbed CuClADS species at potentials up to 700 mV more-negative than the equilibrium potential (Elsner et al. 1988). Figure 3-2 shows the voltammetric behaviour of Cu in deaerated 1 mol·dm–3 NaCl solution at pH 10 (King et al. 1995b). In this case, peak A2 is believed to be the formation of sub-monolayer CuClADS at a potential 700 mV below the equilibrium potential (–0.105 VSCE, Moreau 1981). Peak C1 is again due to the reduction of Cu2O and is observed if the potential is scanned anodically into region A3. (In this case, peak A1 is believed to be due to the oxidation of adsorbed or absorbed H formed during the cathodic pre-cleaning at –1.3 VSCE (Elsner et al. 1988, King and Kolar 2000)). In 1 mol·dm–3 Cl– solution, therefore, Cl– wins the competition for surface sites even in pH 10 solution.

34 TR-10-69
Figure 3-1. Cyclic voltammetric studies of the formation of surface films on copper in deaerated 0.1 mol·dm–3 NaClO4 solution at room temperature (King et al. 1995a).

TR-10-69 35
These sub-monolayer adsorbed species are believed to catalyse certain reactions on the copper surface (King et al. 1995a, b). Figure 3-3 shows a series of potential scans in oxygenated unbuffered 0.1 mol·dm–3 NaClO4 solution. Scans were started with a pre-cleaned surface at a potential of –1.2 VSCE and scanned to more-positive potentials in each successive scan. Up to an upper potential limit of –0.55 VSCE (curve (c)), the rate of O2 reduction was the same on both the forward and backward scans. With increasing potential limit, however, a peak appeared on the forward scan (see curve (g)), with a higher rate of O2 reduction on the forward (anodic-going) scan. This enhanced current is lost, however, on the reverse (cathodic-going) scan.
The potential-dependence of the catalysis of the O2 reduction reaction in Figure 3-3 has been associ-ated with the formation of surface films shown in Figure 3-1. Based on measurements of the interfa-cial pH during O2 reduction (King et al. 1995a), it was shown that the pH at the electrode surface is ~pH 10 in the limiting current region during the reduction of O2 in oxygenated solution. Therefore, it is assumed that the surface films observed in Figure 3-1(a) are those present during O2 reduction on Cu in unbuffered solution. That being so, it can be seen that catalysis of the O2 reduction reaction is associated with the presence of sub-monolayer Cu(OH)ADS or sub-monolayer Cu2O. Formation of a complete monolayer of Cu2O, as happens for an upper potential limit of –0.1 VSCE results in a loss of catalytic activity (curve (g), Figure 3-3).
The question is whether these same catalytic sub-monolayer surface films also catalyse H2 evolution. Inspection of Figures 3-1 and 3-2 suggests that this is not the case. In each figure, the current in the region of H2O reduction (i.e. at potentials more negative than approximately –1.0 VSCE) is lower on the reverse scan (when catalytic sub-monolayer surface films are present) than on the forward scan on clean Cu surfaces. Therefore, even if Cu(OH)ADS is present on the surface, it would not support enhanced H2 evolution.
Figure 3-2. Cyclic voltammograms on copper in deaerated 1 mol·dm–3 NaCl solution at pH 10 at room temperature (King et al. 1995b).
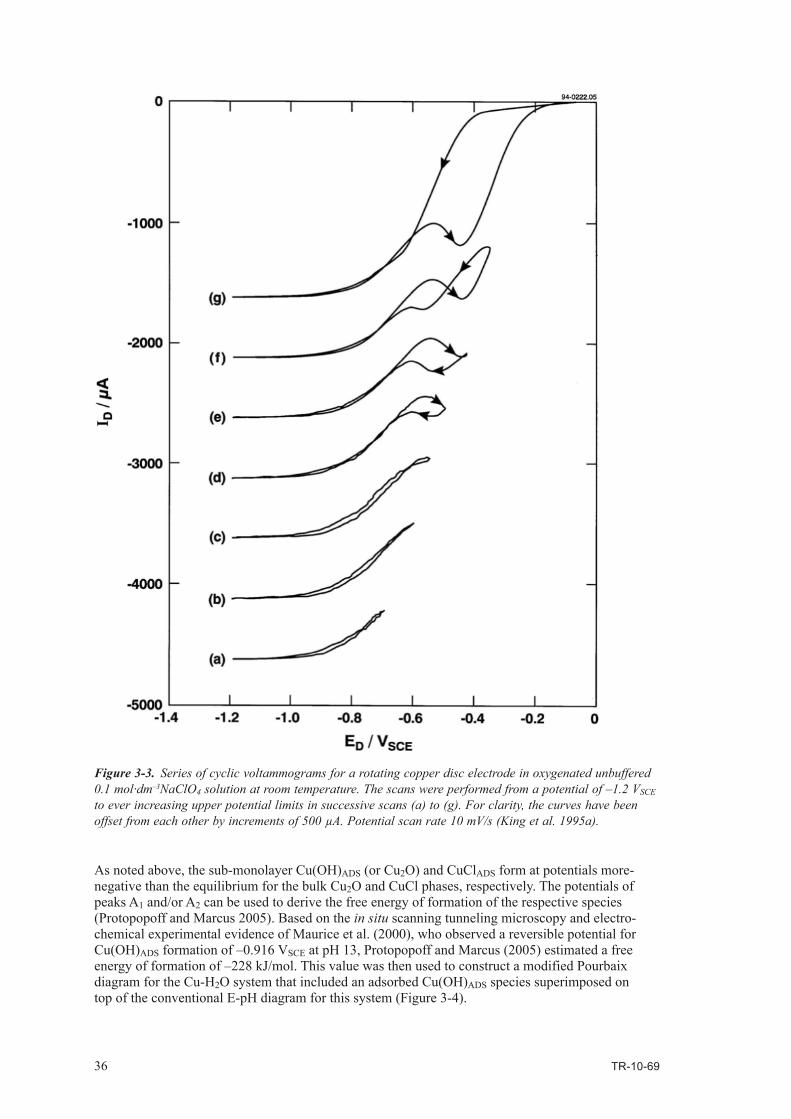
36 TR-10-69
Figure 3-3. Series of cyclic voltammograms for a rotating copper disc electrode in oxygenated unbuffered 0.1 mol·dm–3NaClO4 solution at room temperature. The scans were performed from a potential of –1.2 VSCE to ever increasing upper potential limits in successive scans (a) to (g). For clarity, the curves have been offset from each other by increments of 500 µA. Potential scan rate 10 mV/s (King et al. 1995a).
As noted above, the sub-monolayer Cu(OH)ADS (or Cu2O) and CuClADS form at potentials more-negative than the equilibrium for the bulk Cu2O and CuCl phases, respectively. The potentials of peaks A1 and/or A2 can be used to derive the free energy of formation of the respective species (Protopopoff and Marcus 2005). Based on the in situ scanning tunneling microscopy and electro-chemical experimental evidence of Maurice et al. (2000), who observed a reversible potential for Cu(OH)ADS formation of –0.916 VSCE at pH 13, Protopopoff and Marcus (2005) estimated a free energy of formation of –228 kJ/mol. This value was then used to construct a modified Pourbaix diagram for the Cu-H2O system that included an adsorbed Cu(OH)ADS species superimposed on top of the conventional E-pH diagram for this system (Figure 3-4).
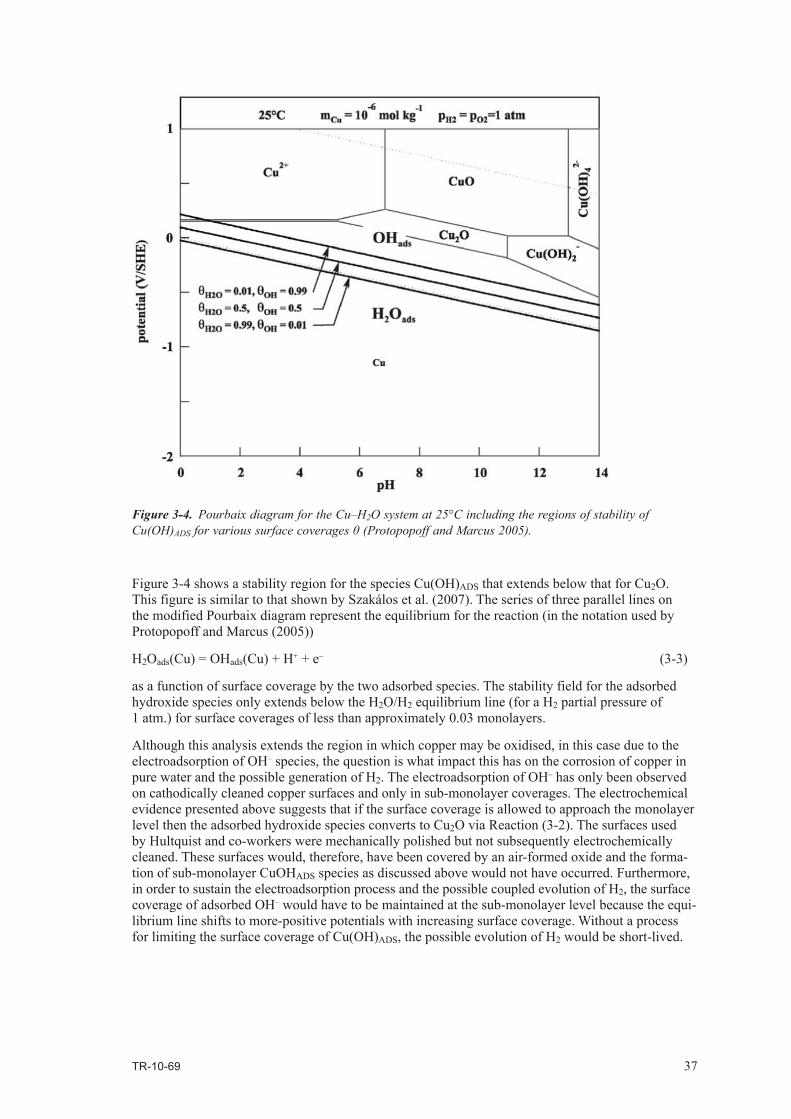
TR-10-69 37
Figure 3-4 shows a stability region for the species Cu(OH)ADS that extends below that for Cu2O. This figure is similar to that shown by Szakálos et al. (2007). The series of three parallel lines on the modified Pourbaix diagram represent the equilibrium for the reaction (in the notation used by Protopopoff and Marcus (2005))
H2Oads(Cu) = OHads(Cu) + H+ + e– (3-3)
as a function of surface coverage by the two adsorbed species. The stability field for the adsorbed hydroxide species only extends below the H2O/H2 equilibrium line (for a H2 partial pressure of 1 atm.) for surface coverages of less than approximately 0.03 monolayers.
Although this analysis extends the region in which copper may be oxidised, in this case due to the electroadsorption of OH– species, the question is what impact this has on the corrosion of copper in pure water and the possible generation of H2. The electroadsorption of OH– has only been observed on cathodically cleaned copper surfaces and only in sub-monolayer coverages. The electrochemical evidence presented above suggests that if the surface coverage is allowed to approach the monolayer level then the adsorbed hydroxide species converts to Cu2O via Reaction (3-2). The surfaces used by Hultquist and co-workers were mechanically polished but not subsequently electrochemically cleaned. These surfaces would, therefore, have been covered by an air-formed oxide and the forma-tion of sub-monolayer CuOHADS species as discussed above would not have occurred. Furthermore, in order to sustain the electroadsorption process and the possible coupled evolution of H2, the surface coverage of adsorbed OH– would have to be maintained at the sub-monolayer level because the equi-librium line shifts to more-positive potentials with increasing surface coverage. Without a process for limiting the surface coverage of Cu(OH)ADS, the possible evolution of H2 would be short-lived.
Figure 3-4. Pourbaix diagram for the Cu–H2O system at 25°C including the regions of stability of Cu(OH)ADS for various surface coverages θ (Protopopoff and Marcus 2005).

38 TR-10-69
3.2 Corrosion of copper in anoxic concentrated chloride solutions
Copper is thermodynamically unstable in water at low pH in the presence of high concentrations of chloride ions (Figure 1-2). Although high Cl– concentrations (greater than, say, 1 mol·dm–3) are possible in deep groundwaters, especially in Finland (King et al. 2001), it is unlikely that acidic conditions will develop. Not only will the near-field pH be buffered by the presence of bentonite and calcite, but the locally acidic conditions in occluded regions are not expected to occur for copper. Local acidification is unlikely because Cl– strongly stabilises dissolved Cu(I), which does not hydrolyse strongly in any case, and because Cu(II), which does strongly hydrolyse, will not be formed either by direct dissolution at the corrosion potentials expected in the repository or in occluded regions because of the absence of O2 to oxidise Cu(I).
Although Cu is predicted to be thermodynamically stable in O2-free Cl– solutions at neutral pH, Posiva have conducted a limited experimental programme to establish if corrosion is possible under these conditions (Bojinov and Mäkelä 2003, Bojinov et al. 2004). Copper in the form of mass-loss coupons and as an electrical resistance probe was exposed to 1 mol·dm–3 NaCl solution at room temperature or 80°C for periods up to 30 days. The solution was deaerated after placing the coupons in the test vessel, but prior to the start of the experiment, by bubbling O2-free N2 through the solution for 4–6 hrs. This technique typically leaves a few ppb residual O2 (Butler et al. 1994, King et al. 2001), although Bojinov and Mäkelä (2003) presented evidence suggesting a dissolved [O2] of 0.001–0.01 ppb. The corrosion rate was measured in situ using the electrical resistance probe, with a time-averaged value also obtained from the mass-loss and solution analyses. The redox potential of the solution was also measured using a Pt electrode.
The corrosion rate was observed to decrease with time and then stop after 60–80 hrs exposure (Bojinov and Mäkelä 2003, Bojinov et al. 2004). The authors attributed this behaviour to the consumption of residual O2 followed by the cessation of corrosion once anoxic conditions had been established. The solution pH was found to increase from an initial value of pH 6.4 to a final value of pH 9.5–9.9, the increase being attributed to the OH– ions produced by the reduction of the residual O2. No H2 was detected in the headspace of the autoclave following a 6-day exposure, consistent with the absence of H2O reduction. No further H2 measurements were made because of failure of the gas sampling system.
The corrosion potential (ECORR) was also measured during the tests. An apparent steady-state ECORR was attained after ~15 days exposure, with a value of –0.33 VSCE at room temperature and –0.43 VSCE at 80°C. The value at room temperature is more-positive than that reported by King et al. (1995c) for a copper rotating-disc electrode in nominally deaerated 1 mol·dm–3 NaCl, but this is consistent with the negative shift in ECORR with increasing rate of mass transport as a consequence of the mass-transport limitation of the anodic reaction (King et al. 1995c).
More interestingly, however, the establishment of a steady-state ECORR was found to correspond to the time at which corrosion stopped. Furthermore, the value of the steady-state ECORR was at the boundary of the region of immunity on the Pourbaix diagram, as defined by the Cu/CuCl2– equilib-rium line for a dissolved copper concentration of 10–5–10–6 mol·dm–3 (Figure 1-2).
In conclusion, therefore, there is no evidence for the corrosion of copper in O2-free 1 mol·dm–3 NaCl solution at room temperature or 80°C. Corrosion, directly measured in situ using an electrical resist-ance technique, ceased once the residual O2 had been consumed. This observation is supported by the absence of H2 in the one gas sample analysed. Furthermore, the cessation of corrosion occurred at a potential at which the conventional Cu-H2O-Cl– E-pH diagram predicts the immunity of copper.
3.3 Corrosion of copper in compacted bentoniteKing et al. (1997) studied the corrosion of copper in compacted bentonite under simulated repository conditions. The aim of the study was to determine the environmental conditions under which Cu(I) or, alternatively Cu(II), was the major corrosion product. To this end, the bentonite clay was compacted with, and immersed in, synthetic ground waters with Cl– concentrations of between 0.17 mol/L and 2.5 mol/L, with Cu(I) expected to be progressively stabilised with increasing [Cl–]. The redox conditions in the sealed glass vials in which the tests were conducted were also varied, with initial
TR-10-69 39
atmospheres of either 0.23 vol.% O2 or air (20.9 vol.% O2). In some cases, Fe filings were included to the dry clay before compaction in order to scavenge O2 during the test and produce anoxic conditions. Clearly, the formation of Cu(II) was expected to be favoured by increased [O2] and the absence of Fe filings. All tests were conducted at a temperature of 95°C for periods of between 10 and 184 days with an initial gas pressure of 1 atm. Based on previous work, the predominant copper oxidation state was indicated by the shape of the copper diffusion profile in the clay and the nature of the precipitated corrosion product. Of more interest for the current discussion, however, is the fact that the atmosphere inside the sealed glass vial was sampled at the end of the test and the gas composition determined, including the presence of H2.
Detailed results from the various tests, as well as from an aerated blank test that contained all of the test components with the exception of the copper coupon, are reported by King et al. (1997). The observations relevant to the current subject include:• Intheoneblanktestperformed,theinitialairatmospherewasfoundtohavechangedtoacomposi-
tion of 0.043 vol.% H2, 3.51 vol.% O2, 1.17 vol.% Ar, 5.29 vol.% CO2, balance N2 at the end of the test. The Ar content is similar to that in air, suggesting a final pressure of close to 1 atm. and that the results are reliable. The decrease in O2 and increase in CO2 were attributed to microbial activity. Of interest is the generation of H2 in the complete absence of corrodible metals, including copper.
• Ofthe27experimentsforwhichgasanalyseswereperformed,H2 was observed at concentrations above the detection limit (0.001 vol.%) in 25 of the tests.
• Ofthe25experimentsinwhichmeasureableH2 was detected, 11 tests gave H2 concentrations below that found in the blank test. In these cases, the unknown reaction(s) responsible for H2 generation in the blank test is(are) considered responsible for the observed H2.
• Ofthe14remainingtests,eight(withobservedH2 concentrations of 0.28–3.3 vol.%) contained Fe filings, with the source of H2 considered to be the corrosion of Fe.
• Allofthe6remainingexperimentsinwhichH2 was observed at concentrations higher than in the blank test were performed under initially aerated conditions with between 5.4 vol.% and 17.5 vol.% O2 remaining at the end of the test. The concentration of H2 observed varied between 0.057 vol.% and 0.43 vol.%. The observed H2 concentrations may be within the (unknown) scatter of the blank experiment.
The source of the H2 in tests without Fe filings is unknown. What is clear, however, is that H2 in excess of that observed in the blank test (without a copper coupon) was only found under aerobic conditions, quite unlike those that Hultquist and co-workers suggest are required for the oxidation of copper by water.
3.4 Role of dissolved oxygenIn a number of their publications, Hultquist and co-workers claim that residual O2 in the test cell is consumed by reaction with atomic H produced by the reduction of H2O (Gråsjö et al. 1995, Hultquist 1986, Hultquist et al. 1989, 2008, Seo et al. 1987, Szakálos et al. 2007). This claim is based primarily on analogy with the behaviour in gas-phase systems that have been studied by Hultquist and some of his colleagues. If correct, this claim would not only mean that H2O is an oxidant for copper but also that H2O is preferentially reduced compared with O2. Furthermore, it would seem to indicate that O2 itself is not directly an oxidant for copper.
This somewhat unconventional claim warrants further discussion, not least because it directly affects the common understanding of the corrosion behaviour of metals in aqueous systems.
Many researchers have investigated the corrosion behaviour of copper and copper alloys in O2-containing environments. For the conditions expected in a deep geological repository, King and co-workers have studied the corrosion of copper in O2-containing chloride solutions over a broad range of conditions, including the effects of temperature, Cl– concentration, O2 partial pressure, pH, the rate of mass transport, and the presence of various ions and complexants, including SO4
2– and NH4
+ (King et al. 2001). Based on the results of electrochemical studies and of experiments in com-pacted bentonite, King and Kolar (2000) developed a reaction scheme that described the corrosion behaviour of copper canisters in the repository environment (Figure 3-5). There are two roles for
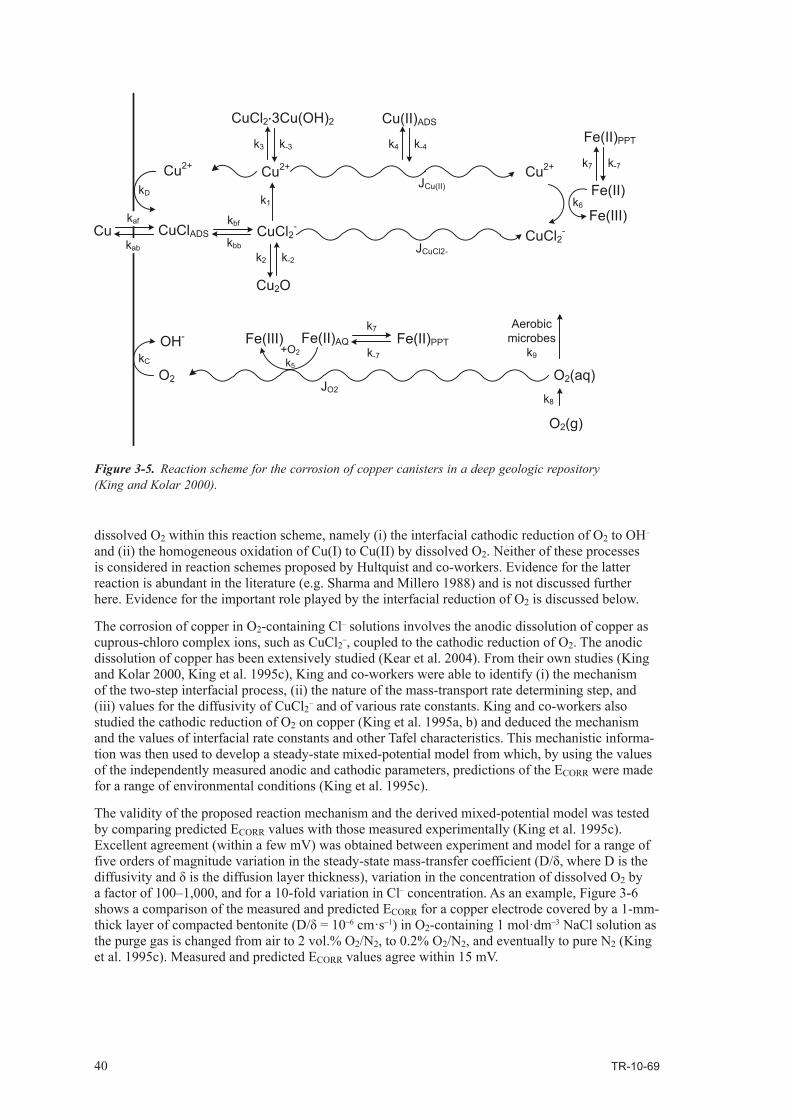
40 TR-10-69
Figure 3-5. Reaction scheme for the corrosion of copper canisters in a deep geologic repository (King and Kolar 2000).
dissolved O2 within this reaction scheme, namely (i) the interfacial cathodic reduction of O2 to OH– and (ii) the homogeneous oxidation of Cu(I) to Cu(II) by dissolved O2. Neither of these processes is considered in reaction schemes proposed by Hultquist and co-workers. Evidence for the latter reaction is abundant in the literature (e.g. Sharma and Millero 1988) and is not discussed further here. Evidence for the important role played by the interfacial reduction of O2 is discussed below.
The corrosion of copper in O2-containing Cl– solutions involves the anodic dissolution of copper as cuprous-chloro complex ions, such as CuCl2
–, coupled to the cathodic reduction of O2. The anodic dissolution of copper has been extensively studied (Kear et al. 2004). From their own studies (King and Kolar 2000, King et al. 1995c), King and co-workers were able to identify (i) the mechanism of the two-step interfacial process, (ii) the nature of the mass-transport rate determining step, and (iii) values for the diffusivity of CuCl2
– and of various rate constants. King and co-workers also studied the cathodic reduction of O2 on copper (King et al. 1995a, b) and deduced the mechanism and the values of interfacial rate constants and other Tafel characteristics. This mechanistic informa-tion was then used to develop a steady-state mixed-potential model from which, by using the values of the independently measured anodic and cathodic parameters, predictions of the ECORR were made for a range of environmental conditions (King et al. 1995c).
The validity of the proposed reaction mechanism and the derived mixed-potential model was tested by comparing predicted ECORR values with those measured experimentally (King et al. 1995c). Excellent agreement (within a few mV) was obtained between experiment and model for a range of fiveordersofmagnitudevariationinthesteady-statemass-transfercoefficient(D/δ,whereDisthediffusivityandδisthediffusionlayerthickness),variationintheconcentrationofdissolvedO2 by a factor of 100–1,000, and for a 10-fold variation in Cl– concentration. As an example, Figure 3-6 shows a comparison of the measured and predicted ECORR for a copper electrode covered by a 1-mm-thicklayerofcompactedbentonite(D/δ=10–6 cm·s–1) in O2-containing 1 mol·dm–3 NaCl solution as the purge gas is changed from air to 2 vol.% O2/N2, to 0.2% O2/N2, and eventually to pure N2 (King et al. 1995c). Measured and predicted ECORR values agree within 15 mV.
2
-
JO22
+O2k5
k7
k-7
PPT
kC
2+
2
2-
ADSkbf
kbb
k-2k2
2+
kaf
kab
kD
k3 k-3
2+
2-
k1
2 2
k6
JCuCl2-
JCu(II)
k-4k4
ADS
AQ
Aerobicmicrobes
k9
2
k8
k-7k7
PPT

TR-10-69 41
Figure 3-6. Comparison of measured time-dependent (sold curve) and predicted steady-state (horizontal dashed lines) corrosion potentials for copper in contact with a 1-mm-thick layer of compacted bentonite immersed in O2-containing 1 mol·dm–3 NaCl solution at room temperature (King et al. 1995c). The solution was initially aerated and then the purge gas was changed to the indicated composition at the times indicated by the respective arrows.
This independent validation of measured and predicted ECORR values is strong evidence in support of the role of O2 as the oxidant for the corrosion of copper in O2-containing solutions. Furthermore, this evidence calls into question the claim by Hultquist and co-workers that O2 is consumed by the products of H2O reduction.
3.5 Corrosion potential considerationsThe discussion in the previous section centred on the measurement and prediction of ECORR. The value of ECORR can be used to provide valuable insight into the corrosion mechanism and can be used to predict what reactions are occurring or might occur, as discussed in the examples below.
By definition, ECORR must lie between the equilibrium potentials for the anodic and cathodic reac-tions. If we assume that the proposed mechanism is correct, then the maximum value of ECORR will be determined by the equilibrium potential for the reaction
H2O + e–→½H2 + OH– (3-4)
where the arrow should strictly be reversible if the process is at equilibrium. Based on the reported equilibrium pressure of 1 mbar at 73°C (Szakálos et al. 2007), the BRITE group estimated a redox potential of –0.343 VSHE (or –0.58VSCE assuming the same conversion factor as at 25°C) (Apted at al. 2009). This maximum value of ECORR is 80 mV more negative than the room-temperature value reported by Seo et al. (1987) and several hundred mV more negative than the experimental values of King et al. (1995c) at room temperature and 150 mV more negative than the value of Bojinov et al. (2004) at 80°C.

42 TR-10-69
Hultquist et al. (1989) even suggested that H2O could oxidise copper to the Cu(II) state. The authors proposed the following reaction sequence:
Cu + H2O→CuOH+H (3-5a)
followed by
2CuOH→Cu2O + H2O (3-5b)
or
CuOH→CuO+H (3-5c)
Reaction 3-5(c) represents the oxidation of Cu(I) to Cu(II) with the formation of H atoms. If correct, based on the Pourbaix diagram in Figure 1-1(a), this would suggest that hydrogen is being evolved at a potential of +0.014 VSCE.
Based on the limited available information on the ECORR of copper in deaerated systems, therefore, it seems unlikely that the potential is sufficiently negative to allow for the reduction of H2O.
3.6 Implications for corrosion of a copper canister in a deep geologic repository
In attempting to make predictions of the extent of canister corrosion, Hultquist et al. (2009) fail to properly take into account the repository system and the repository environment. Apart from the questionable basis for the corrosion rates that they use in their extrapolation, Hultquist et al. (2009) ignore one of their own basic findings from their studies. If we accept, for the sake of argument, that their proposed mechanism is correct then, by their own evidence, the extent of canister corrosion due to the reduction of water would be minimal.
A basic tenet of the proposed mechanism is that there exists an equilibrium partial pressure of H2 below which copper will corrode with H2O as an oxidant. Equally, as they repeatedly emphasise (Hultquist 1986, Hultquist et al. 1989, 2009, Szakálos et al. 2007), corrosion will cease once that H2 partial pressure is reached. The proposed equilibrium pressure is ~1 mbar at 73°C (Szakálos et al. 2007) and 0.5–1 mbar at 45°C (Hultquist et al. 2009). This value is less than the partial pressure of H2 present naturally in deep ground waters. In both Swedish and Finnish deep ground waters, the concentration of dissolved H2 is of the order of 10–6–10–5 mol·dm–3 (Auqué et al. 2006, King et al. 2001), equivalent to a partial pressure of 1.3–13 mbar. Under these conditions, corrosion of copper by water is not thermodynamically favourable according to the data of Hultquist and co-workers.
Even if the ground water H2 content is below the equilibrium partial pressure of H2, a significant pressure of H2 would quickly develop in the repository if the corrosion mechanism and corrosion rate proposed by Hultquist et al. are correct. The repository is an almost completely closed system. That, after all, is what it is designed for; to limit the escape of radionuclides from the repository to the surface. To achieve this aim, highly compacted bentonite with a low hydraulic permeability (<10–13 m/s once fully saturated, SKB (2006c)) is used to seal the canisters in the boreholes or deposi-tion tunnels. Dissolved and gaseous H2 can pass through the bentonite by a number of mechanisms. However, the rate of diffusion of dissolved H2 is so low that, by analogy with the similarly imperme-able Opalinus clay, the maximum rate of diffusive transport is equivalent to the rate at which H2 would be produced by the corrosion in water at a rate of a few nm/yr (Nagra 2004). If H2 is produced any faster than this rate then a separate H2 gas phase would form at the canister surface. Gaseous H2 could be transported by two-phase flow and, at higher pressure, by dilatancy of the pores in the bentonite, but these processes operate at H2 pressures of several MPa (i.e. 10’s of bar). Therefore, if the rate of oxidation of copper by water exceeds a few nm/yr, a H2 gas phase with a pressure of several MPa would develop at the canister surface. This would clearly suppress corrosion if the H2 equilibrium partial is of the order of 100’s of Pa (mbar). At this point, corrosion would only continue if H2 could escape the interfacial region, but evidence from the Opalinus clay studies indicates that this would only occur by aqueous diffusion at the low gas pressures in question, with the flux of H2 equivalent to a corrosion rate of a few nm/yr.

TR-10-69 43
4 Implications for canister lifetimes
It is clear from the discussion above that there are questions concerning both the scientific validity of the observations reported by Hultquist and co-workers and, more importantly, their relevance to the behaviour of copper canisters in a deep geological repository. In this section, these questions are structured in the form of a decision tree (Figure 4-1). For the oxidation of copper by water to impact the lifetimes of copper canisters, each of the questions must be answered “Yes.” A single “No” answer means that the question of whether water can oxidise copper is not relevant to the use of copper as a canister material in the KBS-3 design.
Based on the information presented by Hultquist and co-workers and by other researchers, as well as the insights provided by the supplemental analyses, the answers for each of the four questions posed in the decision tree are as follows:
Is there credible scientific evidence for the oxidation of copper by water?
The answer to this question is uncertain. There are certain observations and analyses that would support the proposed mechanism, including:• theobservationofH2 using a solid electrolyte probe (Hultquist 1986), ion pump technique and/or
pressure increases (Hultquist et al. 2009, Szakálos et al. 2007),• differencesinbehaviourofcopperexposedtowateringlassvesselssealedbyPdandbyPt
(Hultquist et al. 1989, 2008),• thepossiblethermodynamicstabilityofsub-monolayerCuOHADS species at potentials lower than
the Cu2O/H2O equilibrium line (Section 3.1).
However, there are also a number of observations and analyses that do not support the proposed mechanism, including:• thepoorcharacterisationofthestablesolidphase(HxCuOy) supposedly formed during the
corrosion of copper in water,• thefactthatthecorrosionofcopperinwaterbecomesthermodynamicallyunfavourableinthe
presence of a monolayer of CuOHADS (Section 3.1),• thesuggestionthatonlyH2O, and not O2, is cathodically reduced in O2-containing water
(Gråsjö et al. 1995, Hultquist 1986, Hultquist et al. 2008, Seo et al. 1987, Szakálos et al. 2007),• theuseofevidencefromgasphasestudiestoinferthebehaviourofO2 and the composition of
corrosion products in aqueous solution,• thesuggestionthatthereductionofH2O can cause the oxidation of Cu(I) to Cu(II)
(Hultquist et al. 1989), and• theobservationthatthemeasuredcorrosionpotentialofcopperis150mVmorepositivethan
the equilibrium potential for the H2 evolution reaction at 1 atm pressure (Seo et al. 1987).
If there is credible evidence for the oxidation of copper by water, has the effect been repro-duced by other researchers?
The answer to this question is “No.” Despite three published attempts at reproducing various aspects of the experiments by Hultquist and co-workers, no other researcher has managed to find any evidence that water can oxidise copper. These other studies include:
• anattemptbySimpsonandSchenk(1987)tomeasureH2 due to the corrosion of copper in O2-free Cl– solutions (Section 2.1.2),
• anattemptbyEriksenetal.(1988,1989)tomeasureH2 due to the corrosion of copper in O2-free water (Section 2.1.4), and
• anattemptbyMöller(1995)toreproducethedifferencesobservedbyHultquistetal.(1989)between the appearance of copper exposed to water in Pd-sealed and Pt-sealed glass vessels (Section 2.1.6).

44 TR-10-69
Figure 4-1. Decision tree approach to the question of whether the oxidation of copper by water is an important process for the KBS-3 repository design.
Is there credible scientific evidence
for the oxidation of copper by water?
No
The oxidation of copper by water is not an im
portant process for the KB
S-3 repository design
If there is scientific evidence for
the oxidation of copper by water, has the effect been
reproduced by other researchers?
If water is an oxidant for copper, is the
mechanism relevant for repository conditions?
Yes
Yes
If oxidation of copper by water is possible
in the repository, will canister lifetimes be adversely
affected?
No
Yes
Evidence for H2 formation and differences between Pd-sealed and Pt-sealed tests
support proposed mechanism, BUT poorly characterised corrosion
product HxCuOy, proposed preferential reduction of H2O
over O2, ECORRmeasurements, and other
factors count against it
No
No
Three separate groups have failed to reproduce H2production or
differences between Pd-sealed and Pt-
sealed tests
Unproven mechanism in water even more unlikely in Cl- pore
water solution. Background pH2 or
development of H2 gas phase will suppress copper oxidation.
Effect of H2O reduction due to sulphide already
taken into account. Maximum rate due to
oxidation by water determined by slow
diffusion of dissolved H2 (~nm/yr).
Yes

TR-10-69 45
Furthermore, Bojinov and Mäkelä (2003) and Bojinov et al. (2004) could not detect H2 in their single attempt from copper corrosion experiments in anoxic concentrated Cl– solution. Furthermore, in situ measurement of the corrosion rate and corrosion potential suggested that corrosion ceased once the potential reached the thermodynamically predicted immunity zone (Section 3.2).
This inability of other researchers to reproduce the results of Hultquist and co-workers is the most troubling aspect of this issue. One of the fundamental principles of experimental scientific work is that the observations should be repeatable and reproducible. Hultquist and co-workers have not provided an adequate explanation for this failure on the part of others to reproduce their results. This failure is particularly concerning in the case of Simpson and Schenk who had developed prior expertise in the use of H2 evolution measurements to study the corrosion of C-steel.
If water is an oxidant for copper, is the proposed mechanism relevant to conditions in a deep geological repository?
The answer to this question is “No.” Notwithstanding the absence of a proven mechanism by which water oxidises copper in the laboratory, it is clear that the proposed mechanism is not relevant to the conditions in the repository. Even under laboratory conditions, H2 production has only been claimed in bulk water. The canister in the repository is surrounded by highly compacted bentonite with saline pore fluids and saline ground water. The Cl– ions in the pore solution and ground water determine the anodic dissolution behaviour of copper and determine the nature of the corrosion products formed (Sections 3.1–3.4). No evidence for H2 evolution has been observed in two studies of the corrosion of copper in anoxic Cl– solutions (Bojinov and Mäkelä 2003, Bojinov et al. 2004, Simpson and Schenk 1987).
Perhaps the most important reason that the proposed mechanism is not important under repository conditions is because the partial pressure of H2 in deep Swedish and Finnish ground waters is higher than the proposed equilibrium H2 partial pressure at 73°C. Furthermore, because of the low hydraulic conductivity of highly compacted bentonite, a H2 gas phase would quickly develop around the container if corrosion in water did occur, which would suppress any further corrosion to a rate of a few nm/yr, equivalent to the diffusive flux of dissolved H2 away from the canister surface.
If the oxidation of copper by water in the repository is possible, will it adversely affect the canister lifetime?
The answer to this question is “No.” It should be remembered that corrosion of the canister sup-ported by the reduction of water is already included in the safety analysis for the KBS-3 concept (SKB 2006a, b). Sulphide present in the deposition hole or that diffusing through the bentonite from the ground water is assumed to reach the canister surface causing corrosion and, because of the stability of the Cu2S that is formed, the evolution of H2 from the reduction of water. Because of the limited amount of sulphide available in the repository and because of the limited rate of supply to the canister surface because of the highly compacted bentonite, this process is predicted to result in <5 mm of corrosion in a period of 100,000 years (SKB 2006a, b).
Any additional corrosion that would occur if the proposed oxidation of copper water were to take place would be minor in comparison. If the H2 partial pressure in the ground water at repository depth exceeds the equilibrium partial pressure for the oxidation of copper, then no corrosion via this process will occur. If the ground water H2 partial pressure is insufficient to suppress corrosion by this mechanism, then corrosion would proceed for a short period until such time that a H2 gas phase developed at the canister surface. Based on analyses of the H2 transport capacity of Opalinus clay (which has a similar hydraulic conductivity to highly compacted bentonite, Nagra (2004)), such a gas phase would be expected to develop if the corrosion rate exceeds a few nm/yr. At this corrosion rate, the rate of H2 generation exceeds the rate at which dissolved H2 could be removed from the canister surface by diffusion through the bentonite. In this almost-completely sealed system, corro-sion would continue at the rate at which H2 could be transported away from the interface, i.e. a rate of a few nm/yr corresponding to the rate of diffusion of dissolved H2.

TR-10-69 47
5 Summary and conclusions
A critical review of the literature in support of and against the suggestion that water oxidises copper has been carried out. The important findings and conclusions from the review include:
• Hultquistandco-workershaveprovidedevidencefortheevolutionofH2 during the corrosion of copper in pure water based on: (i) the difference in corrosion rate and visual appearance of samples in Pd- and Pt-sealed vessels, (ii) ion-pump measurements of the flux of H2 through a Pd membrane, (iii) pressure changes due to the consumption of O2 and the production of H2.
• Gråsjöetal.(1995)didnotobserveH2 production from the corrosion of copper in water, although the experiment may not have been allowed to run long enough for anoxic conditions to be established.
• NeitherSimpsonandSchenk(1987)norEriksenetal.(1988,1989)observedH2 production from the corrosion of copper in aqueous chloride solutions or pure water, respectively, using gas chromatography.
• Möller(1995)didnotseeanyvisualdifferenceintheappearanceofCustripsinPd-andPt-sealed glass vessels and corrosion appears to have ceased half-way through the 2-year experiment.
• ThepotentialofCuwireduringsupposedH2 generation is 150 mV more positive than the equilibrium potential for the H2O/H2 rection for a H2 pressure of 1 atm (Seo et al. 1987).
• TheproductionofH2 has been associated with the formation of a previously unknown phase HxCuOy (Hultquist et al. 2008, 2009, Szakálos et al. 2007).
• TheequilibriumH2 pressure for the Cu/ HxCuOy system is believed to be ~1 mbar (101 Pa) at 73°C (Szakálos et al. 2007).
• Iftheion-pumpcurrentdescribedintheworkofSzakálosetal.(2007)isameasureofthefluxofH2 as the authors claim, then their results indicate that the rate of corrosion increases monotoni-cally upon exposure to O2-free water.
• Hultquistandco-workerspointtothepresenceofHincorrosionproductsoncopperasevidencefor the reduction of H2O, but passive films, including those on copper, are typically hydrated to some degree.
• ThecorrosionofcopperinwaterwillcontinueprovidedH2 is removed from the interface and the pressure remains below the equilibrium pressure (Hultquist 1986, Hultquist et al. 1989, Szakálos et al. 2007).
• Oxygendoesnotsupportthecorrosionofcopperinwaterbutis,instead,consumedbyreactionwith H atoms produced by the reduction of H2O (Gråsjö et al. 1995, Hultquist 1986, Hultquist et al. 2008, Seo et al. 1987, Szakálos et al. 2007).
• ThereductionofH2O is capable of supporting the oxidation of copper to the Cu(I) and Cu(II) oxidation states (Hultquist et al. 1989).
• BasedontheanalysisbytheSSMBRITEgroupofthepaperbySzakálosetal.(2007),thecorro-sion rate of copper in the "pressure-gauge" experiment is approximately 40 times lower than that in the ion-pump experiment despite being done at a higher temperature.
• Quantummechanicalcalculationsindicatethattherearenostable(withrespecttoCu2O) compounds that would correspond to the proposed HxCuOy species proposed by Hultquist and co-workers (Korzhavyi and Johansson 2010).
• Bojinovetal.(2010)suggestthatH2 could be formed without the oxidation of copper due to reactions between an adsorbed CuOHads species and H2O. The CuOHads species is formed from the reduction of dissolved Cu2+ that results from the dissolution of a pre-formed Cu2O layer or from the consumption of residual O2.

48 TR-10-69
• Hultquistandco-workershavereportedH2 generation from initially aerated experiments (e.g. Hultquist (1986)) and from experiments in which the water used had been extensively deaerated (e.g. Hultquist et al. (2009)). Thus, pre-oxidation of the surface does not seem to affect H2 generation from copper.
• NeitherHultquistandco-workersnorotherresearchershavereportedthegenerationofH2 when copper is exposed to solutions other than pure water, e.g. saline solutions representative of bentonite pore water or deep ground waters.
A decision-tree approach has been used to summarise the findings of the critical review and to address the relevance of these findings for the corrosion behaviour of the canister. It is found that:
• thescientificevidenceinsupportofthesuggestionthatwateroxidisescopperisnotconclusiveand there are many aspects which are unclear and contradictory,
• despiteanumberofattempts,nootherresearchershavebeenabletoreproducetheobservationsof Hultquist and co-workers,
• evenifcorrect,themechanismisnotimportantforcoppercanistersinarepository,bothbecauseof differences in the environmental conditions and because, even if corrosion did occur by this mechanism, it would quickly stop, and
• thereisnoadverseimpactonthelifetimeofcoppercanistersduetothisproposed,butunproven,mechanism.

TR-10-69 49
References
SKB’s (Svensk Kärnbränslehantering AB) publications can be found at www.skb.se/publications.
Apted M J, Bennett D G, Saario T, 2009. A review of evidence for corrosion of copper by water. SSM Report 2009:30, Strålsäkerhetsmyndigheten (Swedish Radiation Safety Authority).
Auqué L F, Gimeno M J, Gómez J B, Puigdomenech I, Smellie J, Tullborg E-L, 2006. Groundwater chemistry around a repository for spent nuclear fuel over a glacial cycle. Evaluation for SR-Can. SKB TR-06-31, Svensk Kärnbränslehantering AB.
Battino R, Rettich T R, Tominaga T, 1983. The solubility of oxygen and ozone in liquids. Journal of Physical and Chemical Reference Data, 12, pp 163–178.
Bojinov M, Mäkelä K, 2003. Corrosion of copper in anoxic 1M NaCl solution. Posiva Working Report 2003-45, Posiva Oy, Finland.
Bojinov M, Laitinen T, Mäkelä K, Snellman M, Werme L, 2004. Corrosion of copper in 1 M NaCl under strictly anoxic conditions. In: Oversby V M, Werme L O (eds). Scientific basis for nuclear waste management XXVII: symposium held in Kalmar, Sweden, 15–19 June 2003. Warrendale, PA: Materials Research Society. (Materials Research Society Symposium Proceedings 807).
Bojinov M, Betova I, Lilja C, 2010. A mechanism of interaction of copper with a deoxygenated neutral aqueous solution. Corrosion Science, 52, pp 2917–2927.
Burke L D, Murphy M A, 2001. Multilayer hydrous oxide growth on copper in base and its correlation with previously reported electrocatalytic data for this electrode system. Journal of Solid State Electrochemistry, 5, pp 43–49.
Burke L D, Ahern M J G, Ryan T G, 1990. An investigation of the anodic behavior of copper and its anodically produced oxides in aqueous solutions of high pH. Journal of the Electrochemical Society, 137, pp 553–561.
Burstein G T, Newman R C, 1981. Reactions of scratched copper electrodes in aqueous solutions. Journal of the Electrochemical Society, 128, pp 2270–2276.
Butler I R, Schoonen M A A, Rickard D T, 1994. Removal of dissolved oxygen from water: a comparison of four common techniques. Talanta 41, pp 211–215.
Corbett R A, Elliot P, 2000. Ant-nest corrosion – digging the tunnels. In: Corrosion/2000, NACE International, Houston, Texas, Paper 646.
Elsner C I, Salvarezza R C, Arvia A J, 1988. The influence of halide ions at submonolayer levels on the formation of oxide layer and electrodissolution of copper in neutral solutions. Electrochimica Acta, 33, pp 1735–1741.
Eriksen T E, Ndalamba P, Grenthe I, 1988. On the corrosion of copper in pure water. SKB TR 88-17, Svensk Kärnbränslehantering AB.
Eriksen T E, Ndalamba P, Grenthe I, 1989. On the corrosion of copper in pure water. Corrosion Science, 29, pp 1241–1250.
Figueroa M G, Salvarezza R C, Arvia A J, 1986. The influence of temperature on the pitting corrosion of copper. Electrochimica Acta, 31, pp 665–669.
Fitzsimons N P, Jones W, Herley P J, 1995. Studies of copper hydride. Part 1 – synthesis and solid state stability. Journal of the Chemical Society, Faraday Transactions, 91, pp 713–718.
Gråsjö L, Hultquist G, Lu Q, Seo M, 1995. In situ measurements of oxygen consumption and hydrogen evolution in corrosion of some materials in liquid water. Materials Science Forum, 185–188, pp 703–712.
Gu B, Luo J and Mao X, 1999. Hydrogen-facilitated anodic dissolution-type stress corrosion cracking of pipeline steels in near-neutral pH solution. Corrosion, 55, pp 96–106.
Hänninen H, Forsling W, 2007. A few comments on the published study “Corrosion of Copper by Water” by P. Szakálos, G. Hultquist, and G. Wikmark. [Online]. Available at: http://www.mkg.se/pdf/Karnavfallsradet_PM_Hanninen_Forsling_Kommentarer_om_kopparkorrosion.pdf.

50 TR-10-69
Hultquist G, 1986. Hydrogen evolution in corrosion of copper in pure water. Corrosion Science, 26, pp 173–177.
Hultquist G, Chuah G K, Tan K L, 1989. Comments on hydrogen evolution from the corrosion of pure copper. Corrosion Science, 29, pp 1371–1377.
Hultquist G, Gråsjö L, Lu Q, 1993. Consumption and release of gas components during the reaction of iron at 300°C in a H2
16O/H218O/O2 gas mixture. Corrosion Science, 34, pp 1035–1038.
Hultquist G, Gråsjö L, Lu Q, Åkermark T, 1994. The analysis of gas consumption in the reaction of Fe and Cu in H2
16O/H218O/O2 gas mixtures. Corrosion Science, 36, pp 1459–1471.
Hultquist G, Szakálos P, Graham M J, Sproule G I, Wikmark G, 2008. Detection of hydrogen in corrosion of copper in pure water. In: Proceedings of the 17th International Corrosion Congress, Las Vegas, Nevada, September 2008. Houston, TX: NACE International, Paper 3884.
Hultquist G, Szakálos P, Graham M J, Belonoshko A B, Sproule G I, Gråsjö L, Dorogokupets P, Danilov B, AAstrup T, Wikmark G, Chuah G-K, Eriksson J-C, Rosengren A, 2009. Water corrodes copper. Catal. Lett. 132, 311–316.
Johansson L-G, 2008. Comment on “corrosion of copper by water” [Electrochem. Solid-State Lett., 10, C63, (2007)]. Electrochemical Solid-State Letters, 11, pp S1–S1.
Kear G, Barker B D, Walsh F C, 2004. Electrochemical corrosion of unalloyed copper in chloride media – a critical review. Corrosion Science, 46, pp 109–135.
King F, 2002. Corrosion of copper in alkaline chloride environments. SKB TR-02-25, Svensk Kärnbränslehantering AB.
King F, Kolár M, 2000. The copper container corrosion model used in AECL’s second case study. Report 06819-REP-01200-10041-R00, Ontario Power Generation, Nuclear Waste Management Division, Canada.
King F, Quinn M J, Litke C D, 1995a. Oxygen reduction on copper in neutral NaCl solution. Journal of Electroanalytical Chemistry, 385, pp 45–55.
King F, Litke C D, Tang Y, 1995b. Effect of interfacial pH on the reduction of oxygen on copper in neutral NaClO4 solution. Journal of Electroanalytical Chemistry, 384, pp 105–113.
King F, Litke C D, Quinn M J, LeNeveu D M, 1995c. The measurement and prediction of the corrosion potential of copper in chloride solutions as a function of oxygen concentration and mass-transfer coefficient. Corrosion Science, 37, pp 833–851.
King F, Ryan S R, Litke C D, 1997. The corrosion of copper in compacted clay. AECL-11831, COG-97-319-I, Atomic Energy of Canada Limited.
King F, Ahonen L, Taxén C, Vuorinen U, Werme L, 2001. Copper corrosion under expected conditions in a deep geologic repository. SKB TR-01-23, Svensk Kärnbränslehantering AB.
Korzhavyi P A, Johansson B, 2010. Thermodynamic properties of copper compounds with oxygen and hydrogen from first principles. SKB TR-10-30, Svensk Kärnbränslehantering AB.
Maurice V, Strehblow H-H, Marcus P, 2000. In situ STM study of the initial stages of oxidation of Cu(III) in aqueous solution. Surface Science, 458, pp 185–194.
Möller K, 1995. Kopparkorrosion i rent syrefritt vatten. SKI Rapport 95:72, Statens kärnkraftinspektion (Swedish Nuclear Power Inspectorate). (In Swedish.)
Moreau A, 1981. Etude du mecanisme d’oxydo-reduction du cuivre dans les solutions chlorurees acides-I. Systeme Cu-. Electrochimica Acta, 26, pp 497–504.
Nagra, 2004. Effects of post-disposal gas generation in a repository for spent fuel, high-level waste and long-lived intermediate level waste sited in Opalinus Clay. Nagra Technical Report NTB 04-06, National Cooperative for the Disposal of Radioactive Waste, Switzerland.
Panagopoulos C N, Zacharopoulos N, 1994. Cathodic hydrogen charging and mechanical properties of copper. Journal of Material Science, 29, pp 3843–3846.
TR-10-69 51
Pourbaix M, 1974. Atlas of electrochemical equilibria in aqueous solutions. 2nd ed. Houston, TX: NACE.
Protopopoff E, Marcus P, 2005. Potential-pH diagrams for hydroxyl and hydrogen adsorbed on a copper surface. Electrochimica Acta, 51, pp 408–417.
Puigdomenech I, Taxén C, 2000. Thermodynamic data for copper. Implications for the corrosion of copper under repository conditions. SKB TR-00-13, Svensk Kärnbränslehantering AB.
San Marchi C, 2006. Technical reference on hydrogen compatibility of materials. Copper alloys: pure copper (code 4001). [Online]. Available at: http://www.sandia.gov/matlsTechRef/chapters/4001TechRef_Cu.pdf.
Sandia, 2000. Sandia researchers perform first-ever multiple copper corrosion experiments on single. Sandia National Laboratories, Science Daily, [Online] 7 August. Available at: http://www.sciencedaily.com/releases/2000/08/000807070959.htm.
Sandström M, Jalilehvand F, Persson I, Gelius U, Frank P, Hall-Roth I, 2002. Deterioration of the seventeenth-century warship Vasa by internal formation of sulphuric acid. Nature, 415, pp 893–897.
Seo M, Hultquist G, Gråsjö L, Sato N, 1987. Hydrogen evolution kinetics in corrosion of copper, iron and zinc in water. In: Proceedings of the 10th International Congress on Metallic Corrosion, Madras, India, November 1987. Trans Tech Publications, Switzerland, paper 2.31, pp 481–488.
Sharma V K, Millero F J, 1988. The oxidation of Cu(I) in electrolyte solutions. Journal of Solution Chemistry, 17, pp 581–599.
Simpson J P, Schenk R, 1987. Hydrogen evolution from corrosion of pure copper. Corrosion Science, 27, pp 1365–1370.
SKB, 2006a. Long-term safety for KBS-3 repositories at Forsmark and Laxemar – a first evaluation. Main report of the SR-Can project. SKB TR-06-09, Svensk Kärnbränslehantering AB.
SKB, 2006b. Fuel and canister process report for the safety assessment SR-Can. SKB TR-06-22, Svensk Kärnbränslehantering AB.
SKB, 2006c. Buffer and backfill process report for the safety assessment SR-Can. SKB TR-06-18, Svensk Kärnbränslehantering AB.
Spitzer A, Lüth H, 1985. An XPS study of the water adsorption on Cu(110). Surface Science, 160, pp 353–361.
Szakálos P, Hultquist G, 2008. Correspondence with Drs. H. Hänninen and W. Forsling, Swedish National Council for Nuclear Waste. [Online]. Available at: http://www.mkg.se/pdf/Szakalos_m_fl_svar_till_Karnavfallsradet_080229.pdf.
Szakálos P, Hultquist G, Wikmark G, 2007. Corrosion of copper by water. Electrochemical Solid-State Letters, 10, pp C63–C67.
Szakálos P, Hultquist G, Wikmark G, 2008. Response to the comment on “corrosion of copper by water” [Electrochem. Solid-State Lett., 10, C63, (2007)]. Electrochemical Solid-State Letters, 11, pp S2–S2.
Vazquez M V, de Sanchez S R, Calvo E J, Schiffrin D J, 1994a. The electrochemical reduction of oxygen on polycrystalline copper in borax buffer. Journal of Electroanalytical Chemistry, 374, pp 189–197.
Vazquez M V, de Sanchez S R, Calvo E J, Schiffrin D J, 1994b. The electrochemical reduction of hydrogen peroxide on polycrystalline copper in borax buffer. Journal of Electroanalytical Chemistry, 374, pp 179–187.
Wagman D D, Evans W H, Parker V B, Schumm R H, Halow I, Bailey S M, Churney K L, Nuttall R L, 1982. The NBS tables of chemical thermodynamic properties. Selected values for inorganic and C1 and C2 organic substances in SI units. Journal of Physical and Chemical Reference Data, 11, Supplement 2.
Yang Q, Qiao L J, Chiovelli S, Luo J L, 1998. Effects of hydrogen on pitting susceptibility of Type 310 stainless steel. Corrosion, 54, pp 628–633.
Related Documents