Evaluating Critical Issues For Nigeria’s Strategic Roadmap Input Nigeria Downstream Oil & Gas Sector Strategic Outlook Nigeria Subsidy Cost Comparative Analysis A Proactive Approach to Subsidy Implementation in Nigeria Nigeria Existing Refineries Performance Review The Need to Increase Nigeria’s Local Refining Capacity Refined Products Imports Opportunity Cost to Nigeria Demystifying Reasons for Low Investments in Local Refining Capacity in Nigeria Nigeria Existing Refineries Revamp Strategy Existing Refineries Revamp Proposed Ownership Structure New Refining Capacity Investment Outlook Nigeria Refining Capacity Investments GVA Potential Market Prospects for Nigeria as a Regional Refining Center Nigeria Refining Center Benefits to Targeted Markets in West Africa Volume 3-14| Mar 2015 Usman Suleman MBA (Oil & Gas ); B.Eng (Civil) Hosea 4:6 My people are destroyed for lack of knowledge

Critical issues that should form the basic road map of the next government in nigeria vol 3-14 19.03.2015_
Aug 07, 2015
Welcome message from author
This document is posted to help you gain knowledge. Please leave a comment to let me know what you think about it! Share it to your friends and learn new things together.
Transcript

Evaluating Critical Issues
For
Nigeria’s Strategic Roadmap Input
Nigeria Downstream Oil & Gas Sector Strategic Outlook
Nigeria Subsidy Cost Comparative Analysis
A Proactive Approach to Subsidy Implementation in Nigeria
Nigeria Existing Refineries Performance Review
The Need to Increase Nigeria’s Local Refining Capacity
Refined Products Imports Opportunity Cost to Nigeria
Demystifying Reasons for Low Investments in Local Refining Capacity in Nigeria
Nigeria Existing Refineries Revamp Strategy
Existing Refineries Revamp Proposed Ownership Structure
New Refining Capacity Investment Outlook
Nigeria Refining Capacity Investments GVA Potential
Market Prospects for Nigeria as a Regional Refining Center
Nigeria Refining Center Benefits to Targeted Markets in West Africa
Volume 3-14| Mar 2015
Usman Suleman MBA (Oil & Gas ); B.Eng (Civil)
Hosea 4:6 My people are destroyed for lack of knowledge
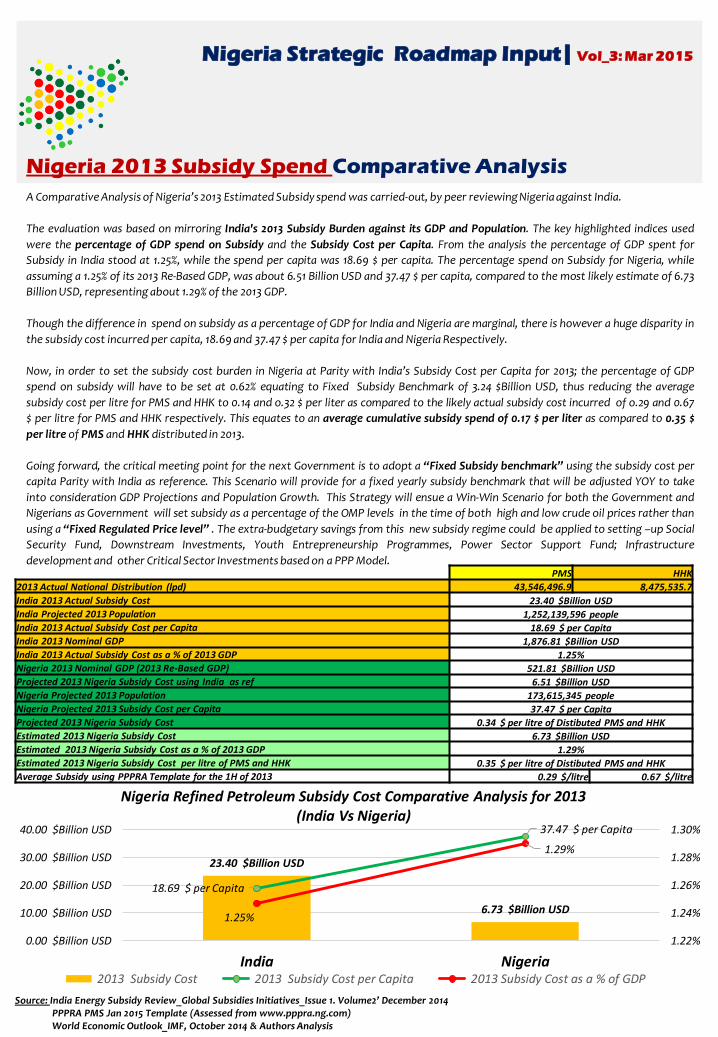
A Comparative Analysis of Nigeria’s 2013 Estimated Subsidy spend was carried-out, by peer reviewing Nigeria against India.
The evaluation was based on mirroring India's 2013 Subsidy Burden against its GDP and Population. The key highlighted indices used
were the percentage of GDP spend on Subsidy and the Subsidy Cost per Capita. From the analysis the percentage of GDP spent for
Subsidy in India stood at 1.25%, while the spend per capita was 18.69 $ per capita. The percentage spend on Subsidy for Nigeria, while
assuming a 1.25% of its 2013 Re-Based GDP, was about 6.51 Billion USD and 37.47 $ per capita, compared to the most likely estimate of 6.73
Billion USD, representing about 1.29% of the 2013 GDP.
Though the difference in spend on subsidy as a percentage of GDP for India and Nigeria are marginal, there is however a huge disparity in
the subsidy cost incurred per capita, 18.69 and 37.47 $ per capita for India and Nigeria Respectively.
Now, in order to set the subsidy cost burden in Nigeria at Parity with India’s Subsidy Cost per Capita for 2013; the percentage of GDP
spend on subsidy will have to be set at 0.62% equating to Fixed Subsidy Benchmark of 3.24 $Billion USD, thus reducing the average
subsidy cost per litre for PMS and HHK to 0.14 and o.32 $ per liter as compared to the likely actual subsidy cost incurred of o.29 and 0.67
$ per litre for PMS and HHK respectively. This equates to an average cumulative subsidy spend of 0.17 $ per liter as compared to 0.35 $
per litre of PMS and HHK distributed in 2013.
Going forward, the critical meeting point for the next Government is to adopt a “Fixed Subsidy benchmark” using the subsidy cost per
capita Parity with India as reference. This Scenario will provide for a fixed yearly subsidy benchmark that will be adjusted YOY to take
into consideration GDP Projections and Population Growth. This Strategy will ensue a Win-Win Scenario for both the Government and
Nigerians as Government will set subsidy as a percentage of the OMP levels in the time of both high and low crude oil prices rather than
using a “Fixed Regulated Price level” . The extra-budgetary savings from this new subsidy regime could be applied to setting –up Social
Security Fund, Downstream Investments, Youth Entrepreneurship Programmes, Power Sector Support Fund; Infrastructure
development and other Critical Sector Investments based on a PPP Model.
Nigeria Strategic Roadmap Input| Vol_3: Mar 2015
Nigeria 2013 Subsidy Spend Comparative Analysis
Source: India Energy Subsidy Review_Global Subsidies Initiatives_Issue 1. Volume2’ December 2014PPPRA PMS Jan 2015 Template (Assessed from www.pppra.ng.com)World Economic Outlook_IMF, October 2014 & Authors Analysis
23.40 $Billion USD
6.73 $Billion USD
18.69 $ per Capita
37.47 $ per Capita
1.25%
1.29%
1.22%
1.24%
1.26%
1.28%
1.30%
0.00 $Billion USD
10.00 $Billion USD
20.00 $Billion USD
30.00 $Billion USD
40.00 $Billion USD
India Nigeria
Nigeria Refined Petroleum Subsidy Cost Comparative Analysis for 2013(India Vs Nigeria)
2013 Subsidy Cost 2013 Subsidy Cost per Capita 2013 Subsidy Cost as a % of GDP
PMS HHK
2013 Actual National Distribution (lpd) 43,546,496.9 8,475,535.7
India 2013 Actual Subsidy Cost 23.40 $Billion USD
India Projected 2013 Population 1,252,139,596 people
India 2013 Actual Subsidy Cost per Capita 18.69 $ per Capita
India 2013 Nominal GDP 1,876.81 $Billion USD
India 2013 Actual Subsidy Cost as a % of 2013 GDP 1.25%
Nigeria 2013 Nominal GDP (2013 Re-Based GDP) 521.81 $Billion USD
Projected 2013 Nigeria Subsidy Cost using India as ref 6.51 $Billion USD
Nigeria Projected 2013 Population 173,615,345 people
Nigeria Projected 2013 Subsidy Cost per Capita 37.47 $ per Capita
Projected 2013 Nigeria Subsidy Cost 0.34 $ per litre of Distibuted PMS and HHK
Estimated 2013 Nigeria Subsidy Cost 6.73 $Billion USD
Estimated 2013 Nigeria Subsidy Cost as a % of 2013 GDP 1.29%
Estimated 2013 Nigeria Subsidy Cost per litre of PMS and HHK 0.35 $ per litre of Distibuted PMS and HHK
Average Subsidy using PPPRA Template for the 1H of 2013 0.29 $/litre 0.67 $/litre

47%
Share
100% 2013 subsidy regime for HHK =0.67 $ per litre
The current Nigeria Subsidy application for PMS and HHK may require an overhaul of the current strategies. These new strategic
approach will take into consideration the re-assessment of the current subsidy for HHK and PMS by using the energy efficiency factor to
develop an energy content efficiency parity pricing for HHK, PMS and LPG.
This new strategy will seek to bring LPG into the fold of the regulated market, by splitting the current subsidy for HHK between HHK and
LPG using a suitable sharing ratio and setting a new benchmark Regulated Price for HHK and LPG (i.e. HHKRegulated Price=LPGRegulated Price).
To illustrate this strategy, the estimated average subsidy for HHK in 2013 was used as a basis to evaluate the New Approach. Applying an
assumed sharing ratio split of 53%:47% for LPG and HHK respectively using the estimated 2013 average subsidy spend per litre for HHK;
would have reduced the subsidy provision for HHK from 0.67 to o.32 $ per litre and thus increase the Regulated Price for HHK from 0.31
to 0.67 $ per litre.
The new benchmark regulated price of 0.67 $ per litre will be used to fix the LPG regulated market price from the estimated OMP of
0.74$ per litre . Setting LPG Regulated Price at parity with HHK, will require subsidizing LPG by only 19% of its share of HHK Subsidy; while
the balance 81% will be invested in expanding the existing LPG Infrastructure to meet a yearly market demand of circa. 1.2 million MT
per annum for the next 3-4-years after the Roll-Out of an HHK:LPG Swap Program to boost LPG Domestic Consumption.
Note: The strategy will be premised on an LPG:HHK Swap Program; with the aim of swapping 40% of the reported 2013 consumption of
HHK over a 3-4 years period with Government providing a 50% Start-Up Grant to the LPG Industry to Invest in expanding the existing
infrastructures within a 2-3 years window starting from 2015, prior to the HHK:LPG Swap Roll-Out Program. The savings from the Re-
distributed portion of the HHK Subsidy share of 53% for LPG after removing actual subsidy for LPG will go to pay Governments Start-up
Grant and to further expand the domestic LPG infrastructure over an additional period of 3-years after the actual Roll-out date, and
thereafter the excess fund will be re-applied to other Key Sectors (Health, Education, Youth Employment Programs etc.).
This proposed Swap Program will be a major contributory factor to determine the existing Refineries Revamp Strategy; that will
consider a “PMS & LPG Optimization Strategy” and also match HHK and ATK production outlook to post-Swap demand.
The PMS_HHK_LPG Energy Parity pricing could then be applied to ensure that LPG could be introduced as an Auto-gas for the
transportation sector as a complementary fuel option to PMS.
Nigeria Strategic Roadmap Input| Vol_4: Mar 2015
Proposed New Subsidy Implementation Strategy in Nigeria
New Approach to HHK Subsidy Implementation
(Using 2013 subsidy regime)
LPG Regulated Parity Price to HHK
0.67 $ per litre
$ per Energy Content = =$ per Energy Content $ per Energy Content
53%
Share
19% for Subsidizing LPG0.07 $ per litre
0.36$ per litre
Adjusted HHK Regulated Price 0.67 $ per litre
81% for Expanding
LPG Infrastructure0.32 $ per litre
0.31$ per litre
100% for Subsidizing HHK
0.31 $ per litre
Source: NNPC 2013 Statistical BulletinPPPRA HHK Template _Jan-July 2013 (Assessed from www.pppra.ng.com)Authors Analysis
Autogas Cooking gas

Nigeria average domestic refinery utilization capacity for the periods, 2001- 2013 was under 30%; which is far below
the normal international benchmarking standards of 80-90% capacity utilization and 90% on-stream time efficiency
for continuous operation as indicated hereunder.
This low refining capacity utilization had lead to massive importation of lighter petroleum products to close the
supply gap from the existing refineries to meet National Demand.
This assessment clearly reveals Nigeria’s continued yearly importation of refined petroleum products in the face of
the “low throughput utilization” of the existing refineries.
This evaluation underlines the need to increase “Local Refining Capacity” and or “Gasoline Optimization
Investments” of the existing refineries in Nigeria to meet increasing local energy demand in Nigeria, with particular
reference to PMS Demand.
Nigeria Strategic Roadmap Input| Vol_5: Mar 2015
Nigeria Existing Refineries Performance Review
Source: NNPC Annual Statistical Bulletin( 1999-2013)PPPRA PMS Jan 2015 Template (Assessed from www.pppra.ng.com)BP Annual Statistical ReportAuthors Analysis
47%
31%
39%
20%
47% 48%
24%22%
43%
21%
8%
25%
11%
24% 25%
20%
25%
0%
10%
20%
30%
40%
50%
60%
70%
80%
90%
100%
199
7
199
8
199
9
200
0
200
1
200
2
200
3
200
4
200
5
200
6
200
7
200
8
200
9
201
0
201
1
201
2
201
3
Combined Domestic Refinery Production Slate Volume Vs
Average Combined Domestic Refinery Throughput
Average Combined Refinery Capacity Utilization (%)

The performance of the refineries to meet national demand, using the actual 2013 refined petroleum product distribution
to the various States as reported by NNPC, shows that the refineries produced only 10%, 30% and 42% of demand for PMS,
DPK and AGO respectively, with a supply deficit of 39.oomillion litres per day of PMS ; 5.89million litres per day of DPK
and 4.497million litres per day for AGO.
From our analysis, upgrading the existing refineries to operate at optimal level of 90% throughput to meet 2013 demand,
indicates that, the existing refineries would have had a deficit production balance of approximately 22.02million litres per
day for PMS and with a production surplus of 0.321 and 8.512 million litres per day of DPK and AGO respectively .
In order to assess the projected demand for refined petroleum products in Nigeria vis-à-vis the refining capacity deficit
to meet the demand for PMS by 2016; an evaluation of the future demand were also analyzed. From the analysis, Nigeria
will require a new refining capacity of 553,945 bpsd by 2016; while assuming that the projected demand for PMS will
maintain an annual increase of 6.5% per annum as depicted below.
This is a clear indication that there should be an urgent need to set in-place pro-active modalities to increase domestic
refining capacity to at least meet 2018/2020 demand projections.
This evaluation underlines the need to Optimize the ‘Deep Conversion” Capabilities of the existing and proposed Refineries
to meet increasing local energy demand for PMS and thus reduce the “Greenfield Refinery Capacity” required in the Mid-
term; while also diversifying the “Energy Mix” by encouraging the use of LPG for domestic cooking and as transportation
fuel.
Source: NNPC Annual Statistical Reports (1999-2013); Authors Analysis
Nigeria Strategic Roadmap Input| Vol_6: Mar 2015
The Need to Increase Nigeria’s Local Refining Capacity
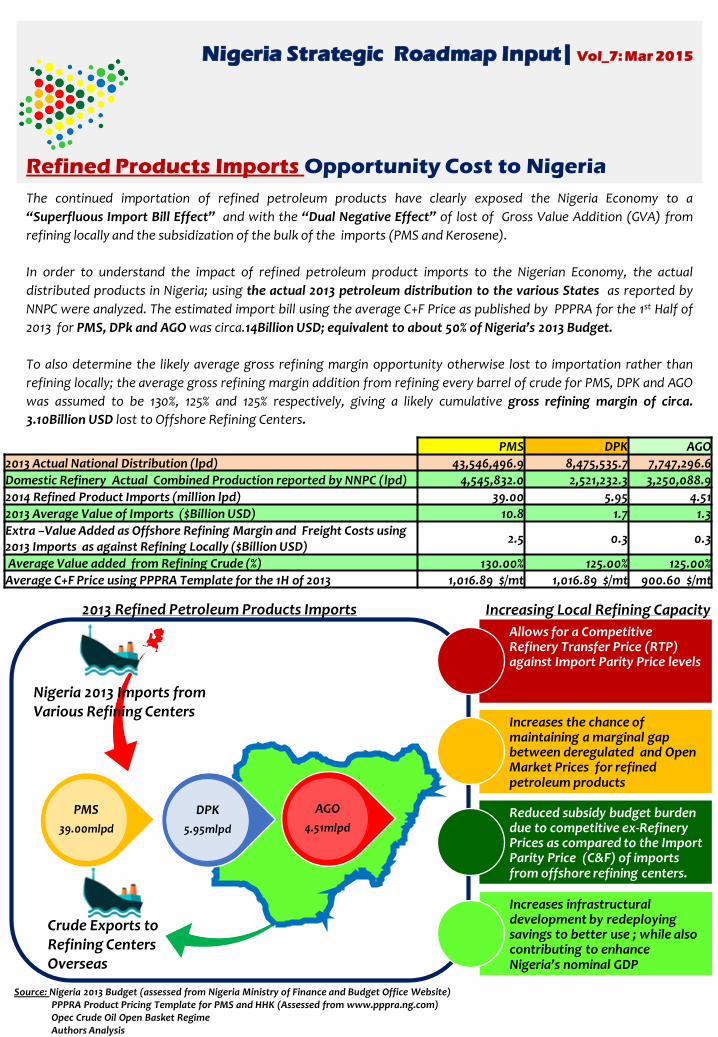
The continued importation of refined petroleum products have clearly exposed the Nigeria Economy to a
“Superfluous Import Bill Effect” and with the “Dual Negative Effect” of lost of Gross Value Addition (GVA) from
refining locally and the subsidization of the bulk of the imports (PMS and Kerosene).
In order to understand the impact of refined petroleum product imports to the Nigerian Economy, the actual
distributed products in Nigeria; using the actual 2013 petroleum distribution to the various States as reported by
NNPC were analyzed. The estimated import bill using the average C+F Price as published by PPPRA for the 1st Half of
2013 for PMS, DPk and AGO was circa.14Billion USD; equivalent to about 50% of Nigeria’s 2013 Budget.
To also determine the likely average gross refining margin opportunity otherwise lost to importation rather than
refining locally; the average gross refining margin addition from refining every barrel of crude for PMS, DPK and AGO
was assumed to be 130%, 125% and 125% respectively, giving a likely cumulative gross refining margin of circa.
3.10Billion USD lost to Offshore Refining Centers.
Nigeria Strategic Roadmap Input| Vol_7: Mar 2015
Refined Products Imports Opportunity Cost to Nigeria
PMS DPK AGO
2013 Actual National Distribution (lpd) 43,546,496.9 8,475,535.7 7,747,296.6
Domestic Refinery Actual Combined Production reported by NNPC (lpd) 4,545,832.0 2,521,232.3 3,250,088.9
2014 Refined Product Imports (million lpd) 39.00 5.95 4.51
2013 Average Value of Imports ($Billion USD) 10.8 1.7 1.3
Extra –Value Added as Offshore Refining Margin and Freight Costs using 2013 Imports as against Refining Locally ($Billion USD)
2.5 0.3 0.3
Average Value added from Refining Crude (%) 130.00% 125.00% 125.00%
Average C+F Price using PPPRA Template for the 1H of 2013 1,016.89 $/mt 1,016.89 $/mt 900.60 $/mt
Nigeria 2013 Imports from Various Refining Centers
Crude Exports to Refining Centers Overseas
DPK
5.95mlpd
AGO
4.51mlpd
PMS
39.00mlpd
Source: Nigeria 2013 Budget (assessed from Nigeria Ministry of Finance and Budget Office Website)PPPRA Product Pricing Template for PMS and HHK (Assessed from www.pppra.ng.com)Opec Crude Oil Open Basket RegimeAuthors Analysis
Allows for a Competitive Refinery Transfer Price (RTP) against Import Parity Price levels
Increases the chance of maintaining a marginal gap between deregulated and Open Market Prices for refined petroleum products
Reduced subsidy budget burden due to competitive ex-Refinery Prices as compared to the Import Parity Price (C&F) of imports from offshore refining centers.
Increases infrastructural development by redeploying savings to better use ; while also contributing to enhance Nigeria’s nominal GDP
Increasing Local Refining Capacity2013 Refined Petroleum Products Imports
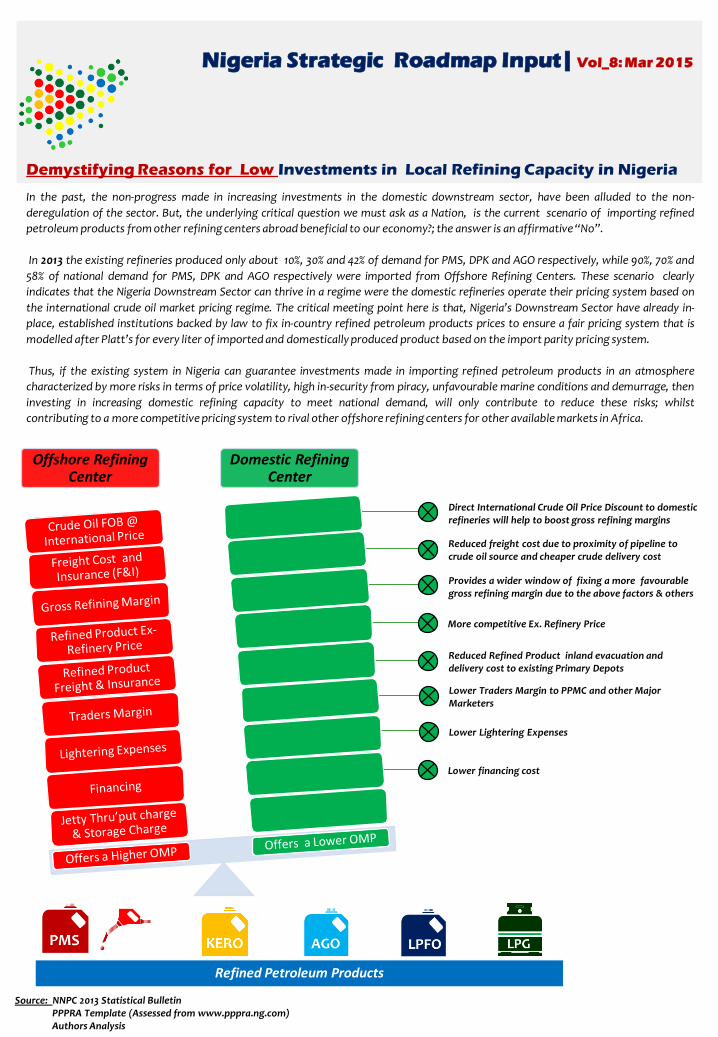
In the past, the non-progress made in increasing investments in the domestic downstream sector, have been alluded to the non-
deregulation of the sector. But, the underlying critical question we must ask as a Nation, is the current scenario of importing refined
petroleum products from other refining centers abroad beneficial to our economy?; the answer is an affirmative“No”.
In 2013 the existing refineries produced only about 10%, 30% and 42% of demand for PMS, DPK and AGO respectively, while 90%, 70% and
58% of national demand for PMS, DPK and AGO respectively were imported from Offshore Refining Centers. These scenario clearly
indicates that the Nigeria Downstream Sector can thrive in a regime were the domestic refineries operate their pricing system based on
the international crude oil market pricing regime. The critical meeting point here is that, Nigeria’s Downstream Sector have already in-
place, established institutions backed by law to fix in-country refined petroleum products prices to ensure a fair pricing system that is
modelled after Platt’s for every liter of imported and domestically produced product based on the import parity pricing system.
Thus, if the existing system in Nigeria can guarantee investments made in importing refined petroleum products in an atmosphere
characterized by more risks in terms of price volatility, high in-security from piracy, unfavourable marine conditions and demurrage, then
investing in increasing domestic refining capacity to meet national demand, will only contribute to reduce these risks; whilst
contributing to a more competitive pricing system to rival other offshore refining centers for other available markets in Africa.
Nigeria Strategic Roadmap Input| Vol_8: Mar 2015
Demystifying Reasons for Low Investments in Local Refining Capacity in Nigeria
Direct International Crude Oil Price Discount to domestic refineries will help to boost gross refining margins
Source: NNPC 2013 Statistical BulletinPPPRA Template (Assessed from www.pppra.ng.com)Authors Analysis
Refined Petroleum Products
Offshore Refining Center
Domestic Refining Center
Reduced freight cost due to proximity of pipeline to crude oil source and cheaper crude delivery cost
Provides a wider window of fixing a more favourablegross refining margin due to the above factors & others
More competitive Ex. Refinery Price
Reduced Refined Product inland evacuation and delivery cost to existing Primary Depots
Lower Traders Margin to PPMC and other Major Marketers
Lower Lightering Expenses
Lower financing cost

The existing refineries upgrade strategies, will be premised on providing a deeper conversion capabilities to
meet the deficit production capacity of the existing refineries to meet national demand for PMS.
The underlying objective of the “Deep Conversion Upgrade” is to produce more gasoline and less fuel oil, This
will also help to reduce in the near-term the in-country refining capacity investments required by 2018 to a more
likely capacity of 400,000 bpsd; thereby reducing the near-term investments required for “Greenfield
Refineries”.
The most likely scope of investments for the proposed PMS Optimization Programme for the existing Refineries
are highlighted below, with the estimated revamp cost.
New Isomerization Units
New Continuous Catalytic Reforming (CCR) Units
New Alkylation Units
New and Upgraded Fluidized Catalytic Cracking Units (FCCU)
Existing Refineries Revamp Cost Estimate
(to operate @ 90% Nameplate Capacity)
Nigeria Strategic Roadmap Input| Vol_9: Mar 2015
Nigeria Existing Refineries Revamp Strategy
PHRC Projected Total Revamp Investment Estimate: $1.692 Billion USD
WRPC Projected Total Revamp Investment Estimate: $1.249 Billion USD
KRPC Projected Total Revamp Investment Estimate: $1.148 Billion USD
ISBL Facilities Upgrade
ISBL-Isom Complex
ISBL-CCR Platformer
Alky/Acid
FCCU Upgrade
OSBL Facilities OSBL facilities new and upgrade
Project management
Others(Lic/Catalysts/et.c)
Contigencies
Source: Petrofin Presentation_Trinidad and Tobago Energy Conference ,2013Authors Analysis

Existing Refineries Revamp Investments
(to operate @ 90% Nameplate Capacity)
Nigeria Strategic Roadmap Input| Vol_10: Mar 2015
Existing Refineries Revamp Proposed Ownership Structure
PHRC
WRPC
KRPC
ISBL Facilities Upgrade
ISBL-Isom Complex
ISBL-CCR Platformer
Alky/Acid
FCCU Upgrade
OSBL Facilities OSBL facilities new and upgrade
Project management
Others(Lic/Catalysts/et.c)
Contigencies
Source: Petrofin Presentation_Trinidad and Tobago Energy Conference ,2013Authors Analysis
Existing NNPC Refineries SPV
Indigenous Partners
NNPC (50%)IPMAN &
NUPENG (15%)
FGN/Host States (10%)
18 Licensees' for Private
Refineries (10%)
Foreign Technical Partner
(15%)

NNPC’s Strategic Plan to introduce greenfield refineries in Lagos, Bayelsa and Kogi States of a combined refining
capacity of 400,000-550,000 bpsd may have been overtaken by Dangote’s proposed 400,000bpsd refinery to be
located in Lagos. Therefore, a more reactive strategic approach will have to be taken in the view of the
aforementioned in determining the most likely investment outlook from the NNPC.
However, taken into consideration the projected deficit refining capacity of 705,114 by 2018; Nigeria will still
require an additional refining capacity of about 305,114bpsd; assuming that the existing refineries conversion
process of crude oil remains the same.
This indicates that the planned investments in Kogi and Bayesla States can still be pursued by the NNPC. The
proposed Kogi 100,000bpsd refinery will seek to reduce the radial distribution coverage of KRPC; while the
proposed Bayelsa 100,000bpsd could be set-up to target the available offshore market in West Africa Coastal
countries. While any surplus production from Kaduna Refinery will target the landlocked countries of West
Africa; otherwise the proposed Kogi Refinery will have to be resized to ensure that KRPC production matches
both its domestic market catchment area and the Land-locked countries Import demand in West Africa.
Nigeria Strategic Roadmap Input| Vol_11: Mar 2015
New Refining Capacity Investment Outlook
New Investment Cost Estimate
(to operate @ 90% Nameplate Capacity)
Dangote 400,000bpsd Refinery Investment Estimate: $xx Billion USD
NNPC Kogi 100.000bpsd Refinery Investment Estimate: $1.2 Billion USD
NNPC Bayelsa 100,000bpsd Refinery Investment Estimate: $1.2 Billion USD
Nigeria Refining Capacity Target from Revamp of existing Refineries and New Investments
=1.045 mmbpsd
Source: National Refineries Special Taskforce Report August, 2012Proceedings of the Nigerian Refining Capacity Summit (Uyo 2012)NNPC Greenfield Refinery Initiative (Assessed from http://www.nnpcgroup.com/nnpcbusiness/midstreamventures/greenfieldrefineryinitiative.aspx) Authors Analysis

Investments in New refining Capacity, together with the revamping of the existing refineries inNigeria; will have a strong impact our national economy and job market.
These attended economic impact will culminate into providing a Gross Value Addition (GVA) asdepicted in the figure below.
Nigeria Strategic Roadmap Input| Vol_12: Mar 2015
Nigeria Refining Capacity Investments GVA Potential
Source: Wood Mackenzie_African Refining Value Chain Study, March 2014Authors Analysis
Refinery Average Utilization Rate of
90%
Nigeria Refining Capacity1.045million BPSD
Indirect & Complimentary jobs
51,500
Direct Refinery Employees
5,700
Refinery Salaries per year
$263mm USD
Refineries Net Cash per year
$6,413mm USD
Net Cash Margin per year ($million USD)
Refinery Salaries per year ($million USD)
# of Direct Refinery Employees
# of Indirect Refinery EmploymentGenerated
Refinery Design Capacity ("000BPSD)
Refinery Average Utilization Rate (%)
Gro
ss V
alu
e A
dd
ed(G
VA
) to
th
e N
iger
ian
Eco
no
my
Gross Value Addition(GVA) Potentials
PHRC (Revamped) WRPC (Revamped) KRPC (Revamped)
Kogi Refinery (New) Bayelsa Refinery (New) Dangote Refinery (New)

The projected demand for refined petroleum products was also assessed for West Africa and some selected Central
African Countries. The average actual import volumes for 2002,2004 and 2005 were projected assuming annual
growth rates of 7.00%, 6.25% and 5.50% for PMS, DPK and AGO respectively from the 3-year average imports. The
projected 2018 import demand (with Nigeria Import demand inclusive) is about 89.38 million litres per day while
the import demand excluding Nigeria’s projected import demand is about 31.74 million litres per day. This
projections vis-à-vis the actual import demand are depicted in the chart below:
The current strategic opportunities are premised on revamping the existing refineries to operate at an average
optimum level of 90% of their installed capacity together with projected new installed capacity of 800,000bpsd.
The projected combined Installed refining capacity of 1.045million bpsd by 2018, will be able to meet both domestic
and West Africa demand and with a production balance surplus of 20.05 million litres per day; that is expected to
meet demand deficits in other African Countries.
Note: Putting in-place the right “Existing Refineries Gasoline Optimization Strategy” might reduce the need for the
projected new refining capacity required by 100,000-200,000 bpsd capacity.
Nigeria Strategic Roadmap Input| Vol_13: Mar 2015
Market Prospects for Nigeria as a Regional Refining Center
31.74 million
litres per day
20.05 million litres
per day
Source: NNPC Statistical Report (1997-2013)EIA Report (2002-2014)Authors Analysis
PHRC 210,000bpsd Operating @ 90% of Installed Capacity
WRPC 125,000bpsd Operating @ 90% of Installed Capacity
KRPC 110,000bpsd Operating @ 90% of Installed Capacity
Dangote 400,000bpsd Operating @ 90% of Installed Capacity
NNPC Kogi 100,000bpsd Operating @ 90% of Installed Capacity
NNPC Bayelsa 100,000bpsd Operating @ 90% of Installed Capacity

Nigeria as a Regional Refining Center for West and Central Africa, will shorten the freight distance of shipping vessels
supplying the refined products to West African Countries, which fall within the same Atlantic coastline as against
importing same from NWE Refineries and other offshore refining centers.
The savings accrued to this countries will come from the marked difference in freight distance coupled with the
competitive FOB price offering from Nigeria as an oil producing state. The average freight distance savings are
depicted below.
Allow for a sound and market friendly ex-refinery spot price for refined petroleum products
Increases the chances to abolish subsidy and allow for a more deregulated market for refined petroleum products
Reduced subsidy budget burden due to reduced freight cost on both crude oil and refined product imports from Europe
Reduced freight cost on refined product imports from Europe
Source: Authors Analysis
Imports from Rotterdam
31.74 million
litres per day
31.74 + 20.05 million litres
per day
Nigeria Strategic Roadmap Input| Vol_14: Mar 2015
Nigeria Refining Center Benefits to Targeted Markets in West Africa
Related Documents