CRITICAL DURATION, CONTRAST SENSITIVITY, AND SPECIFIC READING DISABILITY 0- M.H. BLACKWOOD B.A. (BONS). Being a dissertation submitted as a partial requirement for the degree of Master of Psychology within the University of Tasmania. Department of Psychology. DECEMBER, 1979 1.

Welcome message from author
This document is posted to help you gain knowledge. Please leave a comment to let me know what you think about it! Share it to your friends and learn new things together.
Transcript
CRITICAL DURATION, CONTRAST SENSITIVITY,
AND SPECIFIC READING DISABILITY
0- M.H. BLACKWOOD B.A. (BONS).
Being a dissertation submitted as a
partial requirement for the degree
of Master of Psychology within the
University of Tasmania. Department
of Psychology.
DECEMBER, 1979
1.
ABS TRACT
•Critical durations and contrast sensitivities for sine-wave
gratings of four different spatial frequencies - were measured in
normal and disabled readers. Two groups, each of ten subjects, with
an average age of 14 years, and matched as to seZ age; IQ, and
socio—eaonomic status, were used. The results showed that while
•critical duration for controls increases significantly with spatial
frequency, this is not so for disabled readers, suggesting that the
two groups may differ in terms of the temporal properties of their
spatial frequency channels. It Was also found, for stimulus dur-
ations approximately equal to fixation durations, that disabled
readers were relatively less sensitive than were controls at low to
medium spatial frequencies. At all duration's there was a marked
contrast sensitivity loss at 4 c/deg. Controls, in respect of both
critical duration and contrast sensitivity function, produced results
similar to those found in other studies on normal adillt subjects.
The suggestion of spatial frequency-selective differences
in'Oritical duration and the clear finding of such differences in
contrast sensitivity may indicate a fundamental abnormality in the
visual-temporal integration of spatial Stimuli. The existence of
such qualitative differences in children at this comparatively
mature age renders a developmental explanation unlikely. An explan-
ation discounting visual perceptual differences seems even more
untenable.
The present study does not preclude a multi-factorial etio-
logy for SRD; it does; however, indicate that abnormality . in spatial
- frequency-specific channels of visual information processing is one
factor which can now confidently be included.

SOURCES STATEMENT
The present thesis describes original
research undertaken in the Department
of Psychology, University of Tasmania.
To the best of my knowledge and belief,
any theories. and techniques not my own
have been acknowledged in the text.
ACKNOWLEDGEMENTS
Acknowledgements are due to a number of people, without
whose support and encouragement this thesis could have been
neither attempted nor completed.
I am indebted to my supervisor, Dr. W.J. Lovegrove, who
suggested the topic, and took great care in reading, and advis-
ing on, the manuscript. His support was invaluable.
Research Assistant Alison Bowling was unfailingly helpful
in the analysis of the data, and took a lively interest through-
out. Her expertise was essential to the preparation of this
thesis.
My fellow students from the Honours year in the Psychology
Department provided constant encouragement, and my involVement
in their weekly seminar introduced me to visual perception.
The considerable task of acquiring familiarity with the area
was greatly facilitated by their theoretical interest, and per-
sonal friendship.
Thanks are also due to the staff of the High School, and,
of course, to the children themselves, whose co-operation was a
key factor to the success of the testing.
I would like to thank Mrs. S. McCabe, who typed the manu-
script.
iv.
CONTENTS
CHAPTER 1 Specific Reading Disability: Theoretical background
Page
•• 1
CHAPTER 2
Visual Information Processing, Specific Reading Disability, and the present study
20
CHAPTER 3 Method and Results .. •
•
36
CHAPTER 4 Discussion • •
•
67
REFERENCES
APPENDICES .. •
•
90
V.

CHAPTER 1.
SPECIFIC READING DISABILITY : THEORETICAL
BACKGROUND
Page
1.1 Extent and nature of SRD •• •• • • • • 2
1.2 General theories of SRD:— • • 4
1.2.1 School centred 00 00 •• 4
1.2.2 Child centred 00 041 40 •• 5 1.2.3 Family centred .• .• •• 6
1.2.4 Organ centred O0 00 00 •• 7
1.3 Specific deficit theories •• •• • • •• 8
1.3.1 Developmental deficit • • •• 9 1.3.2 Visual—verbal deficit •• •• •• 10
1.3.3 Theories of Integration deficit •• 14
1.3.4 Memory deficit •• •• 16

2.
1.1 Extent and nature of Specific Reading Disability (SRD)
The complex task of reading and the associated problem of
reading difficulty have attracted close attention for many years;
indeed, since the introduction of more generally available education
* there has been at least some awareness that this ability is not auto-
matic, and that some individuals fail to master reading, in spite of
apparently normal general ability. In 1896 "A case of congenital
word blindness" was reported in The British Medical Journal (Morgan, in
Hepworth, 1971, p.2). Interpretations of the phenomenon vary; there
is still controversy over whether it exists at all (Rutter and Yule,
1975) except as an effect of the lower end of the normal curve, but
where it is accepted as a discrete entity, reasons for its existence
have been postulated'by psychologists, neurologists and education-
alists; some of these theories will be briefly examined after a con-
sideration of the magnitude and nature of the problem.
Changes in nomenclature have been legion. Word blindness,
dyslexia, strephosymbolia, learning difficulty and specific reading
disability (SRD) are amongst the labels which have been attached to
the phenomenon, and the meaning varies slightly. The present study,
using the latter term, defines children with SRD as those who, des-
pite at least average intellectual ability, fail to acquire normal
reading skills in the absence of gross neurological, educational, or
behavioural impairment. In this partial paraphrase of the World
Federation of Neurology definition (Critchley 1970), the emphasis
shifts to the specificity of the disability: reading rather than
"learning", and excludes those children with apparent accompaniments
to reading problems such as brain damage, - primary emotional distur-
bance, or educational neglect, which may denote more general diff-
iculties. For the purposes of the present study children whose

3
reading ability, as measured on a standard test, falls two years
or more below chronological age, given normal intelligence, will
be classified as SRD's.
Estimates of the incidence of the problem vary; for example,
Bachmann in 1927 claims 1%, Traxler in 1949 25% (Malmquist, 1958),
and this variability undoubtedly reflects the different parameters
which have defined the group, themselves reflecting the contemporary
prevailing view of the importance of the problem.
Current estimates of the incidence in the school population
vary considerably; Rutter and Yule (1975) find a geographical vari-
ation from 3.53/3 in ten year olds on the Isle of Wight,to 6% in London
for the same age group. It would seem that figures vary with chron-
ological age as well; 4.5% of fourteen year olds on the Isle of Wight
showed specific reading retardation. Bearing the variability of these
estimates in mind,.Gardner's (1973) summarizing comment may serve as
well as any: "a significant number of people seem to have serious
difficulties learning to read" (p. 63).
It seems likely (Rutter &.Yule, 1975) that this "significant
number" includes not only the lower end of a normal distribution in
reading ability, but also those individuals with whom this study is
concerned: those with specific reading disability.
The distinctions between general reading backwardness and
specific reading retardation have been clearly articulated by Rutter
and Yule (1975). SRD's show a different sex distribution, with a
high proportion of male children; have significantly fewer neuro-
logical abnormalities, and higher IQ's when compared with children
who are generally backward in reading.
4.
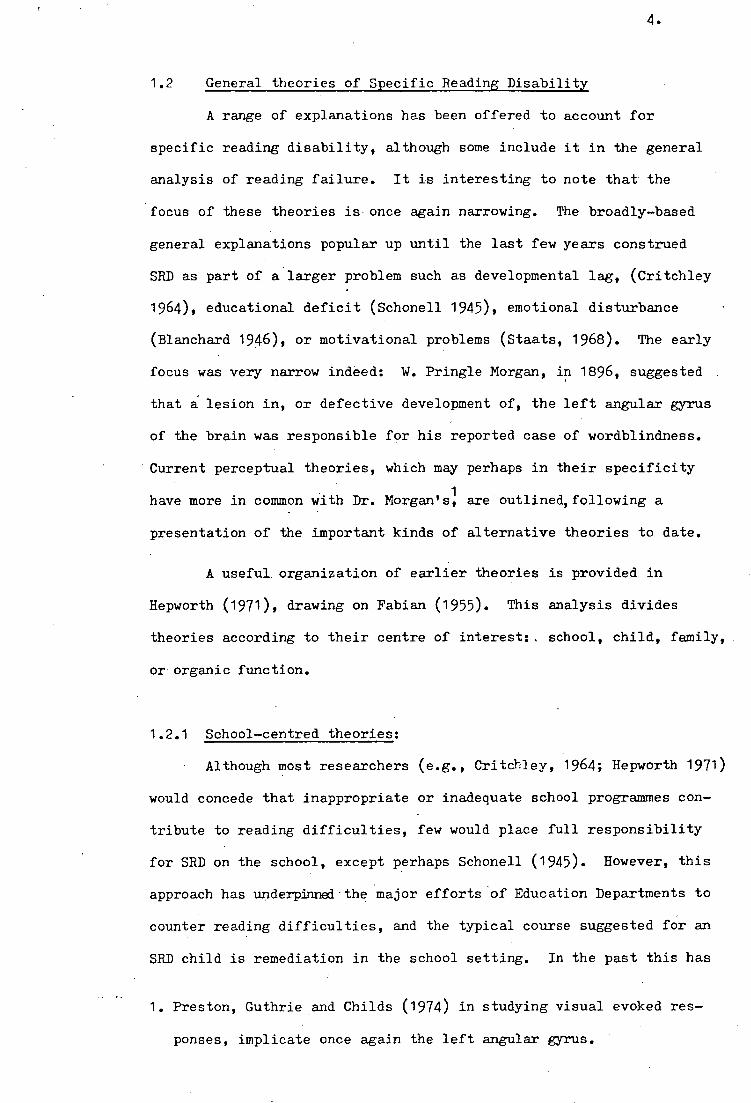
1.2 General theories of Specific Reading Disability
A range of explanations has been offered to account for
specific reading disability, although some include it in the general
analysis of reading failure. It is interesting to note that the
focus of these theories is once again narrowing. The broadly—based
general explanations popular up until the last few years construed
SRD as part of a larger problem such as developmental lag, (Critchley
1964), educational deficit (Schonell 1945), emotional disturbance
(Blanchard 1946), or motivational problems (Staats, 1968). The early
focus was very narrow indeed: W. Pringle Morgan, in 1896, suggested
that a lesion in, or defective development of, the left angular gyrus
of the brain was responsible for his reported case of wordblindness.
Current perceptual theories, which may perhaps in their specificity
• 1 have more in common with Dr. Morgan's, are outlined, following a
presentation of the important kinds of alternative theories to date.
A useful organization of earlier theories is provided in
Hepworth (1971), drawing on Fabian (1955). This analysis divides
theories according to their centre of interest:. school, child, family,
or organicfunction.
1.2.1 School—centred theories:
Although most researchers (e.g., Critchley, 1964; Hepworth 1971)
would concede that inappropriate or inadequate school programmes con-
tribute to reading difficulties, few would place full responsibility
for SRD on the school, except perhaps Schonell (1945). However, this
approach has underplumd - the major efforts of Education Departments to
counter reading difficulties, and the typical course suggested for an
SRD child is remediation in the school setting. In the past this has
1. Preston, Guthrie and Childs (1974) in studying visual evoked res-
ponses, implicate once again the left angular gyrus.
5.
meant intensive teaching, usually still employing the method curr-
ently in vogue at that school. Critchley (1964) remarks that patient
teaching in an old fashioned way is still the method of choice in
reading remediation. This approach is being modified, and new methods
• include the use of entirely different teaching procedures, although
these are outside the scope of the present discussion, which intends
merely to point out that the school centred approach, theoretically
espoused by so few, has in fact dominated remedial action for SRI),
seen in the attitude that although orthodox schooling has failed, more
intensive and individualized orthodox schooling nonetheless holds the
answer.
1.2.2 Child-centred theories:
The broad thrust of these theories is that some personality
variable or emotional state is centrally implicated in SRI). The psy-
choanalytic position, of historical interest only, describes reading
in this way: "The book symbolizes the mother, the author, the father ...
now comes the reader, the son, hungry, voracious and defiling in his
turn, eager to force his way into his mother ..." (Strachey, 1930, On p.1E
. Hepworth, 1971). Under this orientation an understandable repression
and guilt causes SRI), and psychoanalytically generated insight will
release the energy necessary to read. This curious assertion has little
basis in evidence.
A further example of this group of theories, although it could
hardly be less similar in orientation, is the behavioural approach,
regarded as promising by Rachman (1962) and developed largely by
Staats (1968). Briefly, this view holds that speech, itself a dis-
criminative stimulus, becomes associated with written words which then
become discriminative Stimuli, eliciting the reading response.. If

6.
inadequate or inappropriate reinforcement systems are operating in
the individual child or the environment, the response will not be
acquired. Reading is construed as an operant behaviour, and the
application of reinforcement principles is regarded as fundamental
'to the remedial process. While Staats and his colleagues (1964,
1965 f 1970), report considerable success with this method, it is
difficult to see motivational problems as the Whole answer, in the
face of the data on visual perception, visual and verbal processes,
and memory, to be presented later. It is notable that subsequent work
in this area (e.g. Umansky & Umansky, 1976) has concentrated on
"culturally deprived" children, where lack of motivation can reason-
ably be posited as a factor contributing to reading backwardness,
- though not necessarily to reading retardation, using Rutter and Yule's
(1975) distinction. Most writers accept lack of motivation as one of
the contributing factors in any reading difficulty (Esson, 1967, p.219,
refers whimsically to "infirmity of purpose"), but it is impossible
to disentangle cause and effect in this area, and the pragmatically
appealing stance is that long experience of failure is likely to
reduce motivation, and that Staats' results represent the effect of
. maximising motivation (a perfectly reasonable activity) while not
necessarily adding to our understanding of the acquisition of reading.
1.2.3 Family-Centred theories:
While there is evidence that reading disability runs in fam-
ilies (Hepworth 1971, Critchley 1964; Malmquist 1958), the importance
of the genetic component in SRD has, according to Rutter and Yule,
(1975) been very much overstressed. They argue that there is "a genetic
component in reading generally" but that the specific genetic arguments
for the inheritance ora specific condition of developmental dyslexia
"must be rejected" in favour of a multi-factorial view which is far
more strongly supported (p. 193).
7.
SRD as an index to family psychopathology would be accepted
by few researchers these days, but early psychoanalysts such as
Fabian and Blanchard (1946, in Hepworth, 1971) proposed psychoanalytic
family therapy as the most suitable method of remediation. The
inequalities of society, with the family as the focus, have been
implicated in the deprivation syndrome (Richardson, in Sapir & Nitzburg,
1973). In a typical setting of poor nourishment, lack of early stim-
ulation and limited educational opportunity, the deprivation syndrome
will frequently produce reading backwardness as part of a psychosocially
determined outcome. While this kind of "reading disability" is not the
present concern of this study, it is mentioned as the contemporary
representative of the "family-centred" approach.
1.2.4 Organ-centred theories:
With the longest and most respectable history, these theories
began with the late nineteenth century proposition already mentioned,
that lesions or defects in development at specific sites in the brain
produced reading disability. The concept of minimal brain dysfunction,
associated with slight but diagnostically important neurological impair-
ment, evidenced by clumsiness, mixed laterality, and the like, was
influential in the view of reading disability by the 1960's. McDonald
Critchley (1964, 1970) and Delacato (in Dechant, 1970) for example,
though differing in some premises, have authoritatively claimed that
specific reading disability is the overt aspect of neurological imm-
aturity or disorganization, and that a clear syndrome of "developmental
dyslexia" can be discerned. These views have now been impressively
challenged by Rutter and Yule, 1975, who found the accompanying neuro-
logical symptoms predominated in those children classified as "backward
readers", children whose reading fell below chronological age but
not mental age; these children may well represent the lower end of the
8.
normal curve. Rutter and Yule found a specific group showing reading
"retardation",. i.e., reading achievement below mental age. This group
showed associated abnormalities only in speech and language; the
suggestion is that in the view of developmental dyslexia held by
Critchley, these diagnostically separate groups have been confused, for
speech and language deficits have been placed, with poor co-ordination
and so on, in the constellation of "neurological" symptoms. Rutter and
Yule argue instead for a separate specific disability in reading, multi- •
factorially determined, with organic impairment no more than a possible
contributing factor.
These general theories no longer command wide acceptance, but
they frame the historical context for this thesis.
1.3 Specific deficit.theories
The tendency of modern researchers to focus on more limited
aspects of processing and their contribution to specific reading dis-
ability, arises from the striking and common finding of apparent pro-
cessing differences in SRD children when compared with normals.. While
these measured differences have inspired a range of theoretical explan-
ations, to be discussed in the sections immediately following, their
practical implication has been the generation of numerous diagnostic
tests based on "perceptual ability" (e.g., the Marianne Frostig
Developmental Test of Visual Perception, 1961; the Illinois Test of
Psycholinguistic Abilities CITPAI, Kirk & McCarthy 1968) as an under-
lying mechanism to reading ability, and the implementation of programmes
which include visual-motor exercises and laterality exercises, such as
Delacato's, in a general context of-reading remediation.
The area yields a vast amount of data, often inconsistent, which
is far from being integrated satisfactorily. A useful categorization

9.
of approaches derives from considering the theories in terms of the
specific deficits they propose, and the following section presents
them in that framework.
1.3.1 Developmental Deficit Theories:
In keeping with Critchley's notion of cerebral immaturity,
these theories espouse the idea of perceptual immaturity. An impor-
tant early study was carried out by Silver and Hagin (in Young &
Lindsley, 1970). In assessing the visual discrimination of children
with SR]), a defective ability to orient a figure in space correctly,
defects in visual motor function and visual memory deficits are
regarded as essentially symptomatic of a lower level of maturation
• of brain function. Because the problem is presented as largely a
matter of neurophysiologic maturation, then specific training to
remediate reading difficulties will include improving the accuracy
of perceptual input to enhance this maturation. The idea of lack of
maturation had been proposed earlier by Vernon (1957), whose view of
SRD would include perceptual immaturity within a general picture of
developmental lag. This view has a good deal in common with Critchleyts.
A more cautious conclusion is offered by Lyle and Goyen
(1975; p.676), who state that "it is not unlikely ... that a matur-
ational factor is involved in the perceptual deficit manifested by
retarded readers in tachistoscopic tasks". In examining the visual-
perceptual deficit in retarded readers, Lyle and Goyen found that
speed of exposure of response cards and not level of complexity, was
the crucial variable, with faster exposures (10 msec, 1 sec) producing
a significantly poorer performance in SRD's. Because they used only
young children (6.5 yr. to 7.5 yr) and because their earlier studies

10.
(1968 and 1971) indicated that visual-perceptual deficits are found only
in SRD's aged under 8.5 years, Lyle and Goyen (1975) propose a matur-
ational component in the deficit studied.
The perceptual developmental delay hypothesis is supported too by
Satz, Rardin and Ross (1971) who found, like Lyle and Goyen, that skills
of visual motor integration were poorly developed in young SRD's, but
that these skills were finally acquired, the older SRD's showing a normal
performance. Lovegrove and Brown (1978)found significantly longer visual
processing times in SRD's than in normal matched controls,which diff-
erences decreased with age. This is consistent with developmental deficit
theories, though it should be noted that the finding was restricted to one
of two experiments; the second will be discussed later.
These theories, showing early visual perceptual differences between
SRD's and normal readers, differences which disappear with age, require
some further causative explanation for the apparent continuation of SRD
into adolescence and even adulthood. Indeed, there may be a slight incr-
ease in the prevalence of SRD with Age (Rutter & Yule 1975). Lack of mot-
ivation due to repeated experience of failure is the clear candidate for
this position, but cannot be totally satisfactory, since strenuous rem-
edial efforts along conventional lines, combined with appropriate rein-
forcements, while frequently successful (Staats & Butterfield, 1965),
still leave a proportion of mature SRD's. Developmental deficit hypo-
theses may account for the early failure to acquire reading, but not for
the continuation of that failure.
1.3.2 Visual-verbal deficit theories:
The probability that observed perceptual deficits in SRD children
are in fact a product of verbal deficits, that is, are cognitive in
origin, has been strongly argued by several researchers. This alter-
native conceptualization is put consistently, for example, by Vellutino.
11.
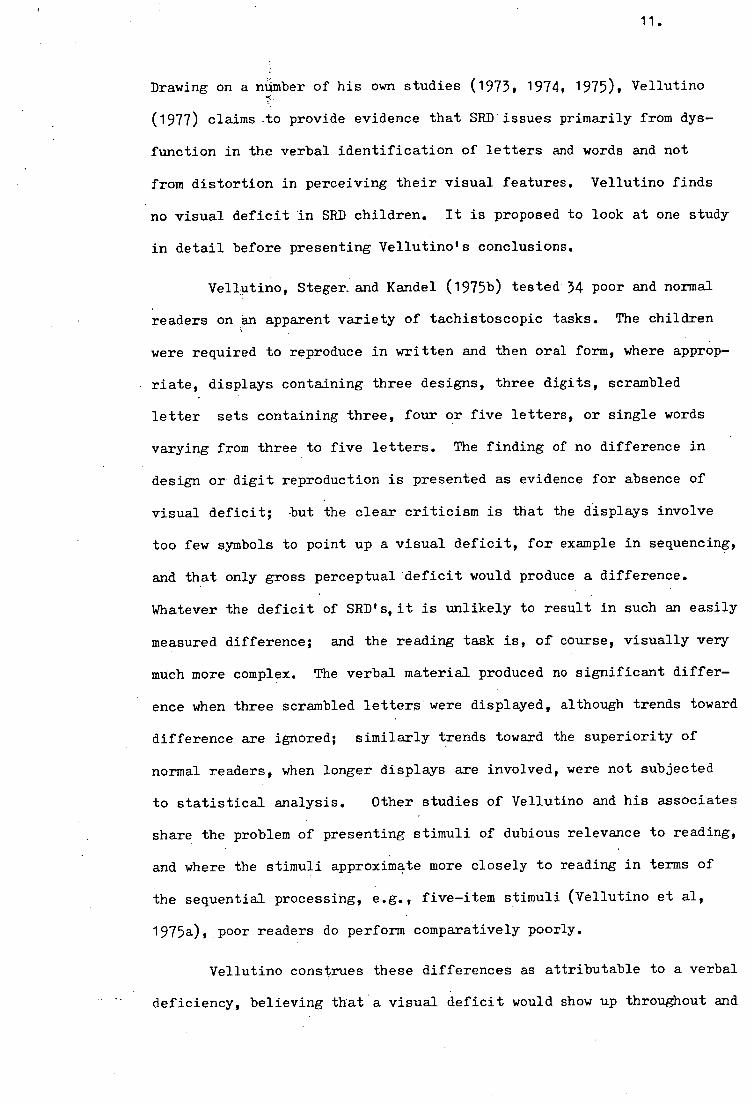
Drawing on a number of his own studies (1973, 1974, 1 975), Vellutino -
(1977) claims to provide evidence that SRD issues primarily from dys-
function in the verbal identification of letters and words and not
from distortion in perceiving their visual features. Vellutino finds
no visual deficit in SRD children. It is proposed to look at one study
in detail before presenting Vellutino's conclusions.
Vellutino, Steger. and Kandel (1975b) tested 34 poor and normal
readers on an apparent variety of tachistoscopic tasks. The children
were required to reproduce in written and then oral form, where approp-
riate, displays containing three designs, three digits, scrambled
letter sets containing three, four or five letters, or single words
varying from three to five letters. The finding of no difference in
design or digit reproduction is presented as evidence for absence of
visual deficit; •but the clear criticism is that the displays involve
too few symbols to point up a visual deficit, for example in sequencing,
and that only gross perceptual 'deficit would produce a difference.
Whatever the deficit of SRD's,it is unlikely to result in such an easily
measured difference; and the reading task is, of course, visually very
much more complex. The verbal material produced no significant differ-
ence when three scrambled letters" were displayed, although trends toward
difference are ignored; similarly trends toward the superiority of
normal readers, when longer displays are involved, were not subjected
to statistical analysis. Other studies of Vellutino and his associates
share the problem of presenting stimuli of dubious relevance to reading,
and where the stimuli approximate more closely to reading in terms of
the sequential processing, e.g., five-item stimuli (Vellutino et al,
1 975a), poor readers do perform comparatively poorly.
Vellutino construes these differences as attributable to a verbal
deficiency, believing that a visual deficit would show up throughout and

12.
not merely on longer displays, and that the difficulty experienced by
poor readers in pronouncing and spelling the stimuli compared with
their (apparent) visual competence suggests a verbal and not a visual
deficit. The problem, however, lies in the nature of the visual task
he is assessing, and in his view of reading which ignores the temporal
integration necessary. In a review article, Vellutino (1977b) claims
that due to the limited number of letters in the alphabet and the number
of recurring combinations such as ling' 9 the visual demands in reading
are ultimately. minimal. It could be said that, given the number of •
different combinations which can occur over sequences of letters and
words, the visual-temporal demands are ultimately infinite. More
detailed reference will be made to the spatial-temporal interaction
later; the argument for a frank verbal labelling deficit, however, sel-
ectively ignores evidehce for subtle visual deficit, at least as a con-
tributor; ignores the possibility of visual-temporal deficit, and ignores
too the observation of adequate verbal labelling in other areas (such as
the ability to recognize and name objects rather than words). Vellutino's
work does not exclude by any means. the possibility of visual sequencing
deficit or temporal integration problems, despite his interpretation that
it does.
The conclusions offered by Vellutino and his colleagues have been
criticized by Fletcher and Satz (1979) on more specific grounds: the
face validity of the tasks which incorporate both recognition and memory
components; the use of a visual-verbal copying task to draw inferences
about visual perceptual processes involved in reading where the similarity
is questionable, and the assumption that word pronunciation represents
verbal mediation alone. Fletcher and Satz argue that word pronunciation
could involve 'several different phonological and semantic strategies,
and poor performance on such a task with its close correspondence to
13.
the reading task may merely be replicating reading, where poor per-
formance is axiomatic for SRD's. Fletcher and Satz highlight, too,
the criticism mentioned earlier: the selective ignoring of discrep-
ant results. Their conclusion is that a unitary deficit hypothesis is
not only premature as a simplistic interpretation of a highly complex
phenomenon, but fails to incorporate even its own discrepancies, as
well as the evidence from other researchers. Vellutino's response (1979)
clarifies some of these issues, for instance that in his view a verbal
deficit is not tantamount to a unitary and simplistic deficit, but
represents a linguistic deficiency of variable complexity. He concedes,
too, that 'the serial deficit notion has not been adequately conceptual-
ized and evaluated. However, the fundamental thrust of the criticism
of his work on methodological grounds is not altered by the theoretical
acrobatics displayed subsequently.
Clifton-Everest (1974) compared recognition performance on a
tachistoscopically presented task between backward and normal readers.
Line patterns were used, and the recognition task involved identifying
as the same or different, two stimuli separated by various durations
above three seconds with an interpolated task involving auditory digit
recognition. No significant difference between the groups emerged;
indeed, recognition performance was overall so low as to support the
idea that visual memory of meaningless stimuli not amenable to verbal-
ization cannot play an.important role in reading.
Clifton-Everest (1976) subsequently reports an experiment show-
ing deficient analysis of written words in SRD's; there were striking
differences from normal readers in the ease of identifying letter seq-
uences within long words, that is, on performance where verbalization
is involved. Clifton-Everest, very much more cautiously than Vellutino,
proposes a linguistic deficit that precludes suitable verbal codes being
selected to supplement information that is held visually. Again, the

14.
problem of suitably complex visual material arises. The finding of a
similar performance between groups in the 1974 study may derive not from
the fact that the material is free of a verbal component, but from the
fact that it is simple, non-sequential processing that is required.
Witelson's research (1977), for example, indicates adequate spatial per-
formance in SRD children, with comparatively poor linguistic performanCe.
And Clifton-Everest's 1976 research is also open to the interpretation
that the apparently cognitive analysis may depend in the first instance,
on visual sequencing analysis. Clifton-Everest sees this probability,
and concedes that there is some relation between failure to acquire skills
of visual analysis, and severe reading disability, but he sees these
skills as primarily cognitively based, and as specific to the reading
task where verbalization is required.
1.3.3 Theories of integration deficit:
In 1882, Abbott (reported by Birth & Lefford, in Sapir & Nitzburg,
1973) demonstrated that the frog is unable to modify its response of
striking at a fly, except by gustatory feedback. A tactual pain stimu-
lus (sharp spikes around an impaled fly) failed to alter the visually
determined response of striking. The importance of intersensory inte-
gration in the development of reading skills has frequently been empha-
sised. Butters and Brody (1968) regard visual-auditory inter-sensory
associations as fundamental to reading because the written word must arous
its appropriate auditory associate if it is to be successfully read.
It is known that intersensory - integration supersedes unimodal sen-
sory responses as one ascends the vertebrate series from fish to man. But
with gross integration intact, the more subtle areas of integration which
could have implications for reading, may be impaired in SRD children.
Findings of this kind are reported for "brain-damaged" children, by Birch
and Lefford, in Sapir and Nitzburg, (1973). They found that although these
15.
children1 differed little from normals in their performance on the easy
task of visual discrimination and the comparatively unsophisticated
integration of visual and haptic modalities, marked differences were
found when the level of integration and analysis required was increased
(e.g., to visual-kinaesthetic). In a rather more directly relevant
study, Birch and Belmont (1964) investigated auditory-visual integration
in retarded readers. The task involved the selection of a spatial patt-
ern of dots Which corresponded to an auditory stimulus; the performance
of retarded readers was significantly poorer than that of normal readers.
Their interpretation of the results implies an integration deficit, but.
an important omission, the failure to screen for subtle visual dysfunction,
allows the interpretation they concede: "the obtained differences in
intersensory performance could occur if deficiencies existed in the fun-
ctioning of either of the sensory modalities". The only children exclu-
ded were those with "significant uncorrected visual disturbance" (p.859). I
would seem, then, that the evidence for a defect in integration is far
from unequivocal, and that the possibility of deficit in one modality
alone is not eliminated; indeed, may provide the most parsimonious
explanation.
In a similarly relevant study which also investigated integrative
functioning, Blank and Bridger (in Sapir & Nitzburg, 1973) examined the
conversion of visual-temporal information (in this case, a series of
flashed lights) to visual-spatial patterns (selecting a pattern corres-
ponding to what had been seen). SRD's, although equally able in a task
requiring visual-spatial recall. were significantly poorer at the task
involving integration. Blank and Bridger interpret their findings as
a difficulty in applying verbal labels, leading to poor intramodal tran-
sfer. This implies an even more sophisticated area of inefficiency, the
1. including a group of children with "delayed speech development"
who, if Rutter and Yule (1975) are correct, are at risk for SRD.

16.
cognitive component. The research on integration then, while gener-
ally refining the focus of attention to perceptual processes, remains
inconclusive, since the processes examined are by definition multi-
determined, allowing the possibility of subtle visual dysfunction,
cognitive inefficiency, integration deficits, or a combination. This
range of interpretations reflects the complexity of the problem of SRI.
A re-interpretatiqn of the intermodal approach to information
processing is offered by Bryden (1972) who argues that the more important
shift occurs in the transfer of information from spatial to temporal modes
rather than from one modality to another. It is possible to construe
much of the research purporting to assess intermodal integration in these
terms: Birch and Belmont (1964) provide as strong evidence for temporal-
spatial problems as they provide for auditory-visual, since they pre-
sented a sequence .of stimuli (temporal) and required a selection of
corresponding spatial stimuli. The utilization of different modalities
may be irrelevant compared with the temporal-spatial transfer. This
possibility has direct bearing on the present research, to be discussed
in the next chapter.
1.3.4 Memory deficit theories:
The finding that SRI) children show significant differences from
normals in early stages of visual processing has been reported by Stanley
and Hall (1973a), while a difference in recall of letter arrays after
brief presentation, specifically leading to a deduction of visual memory
deficit, has been found by the same authors (1973b).
Stanley (in Deutsch & Deutsch, 1975), summarizes the view that
SRD may be connected with abnormalities at the very early stages in vis-
ual processing.
1
Outlining the relevance, already pointed out by Young and
Lindsley (1970), of visual information processing to the study of read- ,
ing disability, Stanley refers to the importance of iconic storage, or
visual information store (VIS).
This rapidly decaying representation is transferred into short-
term memory (STM) and subsequently in more manageable proportions to
long-term memory (LTM). All these processes are clearly involved in the
acquisition of reading skills, and abnormalities here represent a basic
deficit, which could account for reading disability.
Using the method of temporal separation threshold, where VIS is
measured as the interstimulus interval (ISI) at which two stimuli are
reported, Stanley found SRD children to have significantly longer VIS
than normal readers. He also measured transfer from VIS to STN using
backward masking tasks, and found significantly longer processing times,
while STM differences, measured by sequential memory tasks from the ITPA,
indicated a lower level of S. Spatial transform ability was found to
be similar. The overall picture from Stanley's results, is of the scan
and retrieval processes (ills, and VIS to STM) in SRI children being
markedly slower than in normals; and Stanley argues that this slowness
of processing probably accounts . for the difficulty that SRD children
experience with sequential memory tasks. The integration of the results
on STM itself is less clear. Stanley concludes that there are specific
deficits at the early stages in visual information processing, and that
these deficits can be construed as memory deficits; but he advises
further research to clarify the .precise nature of the inter-relationship
of such deficits.
A more complex view of the role of memory is offered by Kolers
(1975), who regards pattern analysing disability as measured by recog-
nition of graphemic patterns, as characteristic of reading disability.

18.
He claims that reading disabled children differ in the ability to
.analyse and remember graphemic patterns, but not in the ordinary vis-
ual perceptual sense, the level of performance being cognitive. There
are serious methodological problems with this study in that no controls
for intelligence were applied and it is dubious whether 3RD children
were in fact tested. His study is mentioned only as an example of an
entirely different view of the level at which memory is implicated, con-
trasting with Stanley's highly specific findings on very early visual
memory processes.
Stanley's emphasis on these processes has a good deal in common
with the immediate background to the present study, to be presented in
the next section.
CHAPTER 2.
VISUAL INFORMATION PROCESSING, SPECIFIC
READING DISABILITY, AND THE PRESENT
STUDY.
1 9.

CHAPTER 2.
VISUAL INFORMATION PROCESSING, SPECIFIC
READING DISABILITY, AND THE PRESENT
STUDY
Page
2.1 Contrast and related concepts : definitions 21
2.2 Psychophysical evidence for spatial frequency channels 22
2.3 Temporal properties of spatial frequency channels • • 24
2.3.1 Visual persistence and reaction time • • 24
2.3.2 Bloch's Law 25
2.4 Transient and sustained mechanisms in visual information processing: Relevance to Bloch's Law • • 28
2.5 Reading disability and spatio-temporal prop- erties 30
2.6 The present study 33
20.

21.
2.1 Contrast and related concepts: definitions
An important characteristic of visual stimuli is spatial frequency,
defined as the number of cycles of a sine—wave grating per degree of
visual angle. A stimulus of repeated cycles of spatial frequency is
called a grating, and the number of cycles (one dark and one light bar)
subtended in one degree of visual angle at the eye is the spatial fre-
quency of that grating. In everyday visual terms, spatial frequency
corresponds to the information received as to such features of stimuli
as size, and generality or detail.
• A sine—wave grating in which luminance varies is a mathematically
simple stimulus which can be changed in the laboratory, with reference to
such features as spatial frequency and contrast. The contrast of a sine—
wave grating is defined as Lmax—Lmin, where L is the luminance of a point Lmax+Lmin
on the screen (Kulikowski & Tolhurst, 1973).
Amongst the measures which can be derived from response to a grat-
ing is threshold contrast, which is the level of contrast required in
order to just detect a grating. Human threshold contrast across spatial
frequencies is often expressed as the contrast sensitivity function (CSF),
where sensitivity is the reciprocal of threshold contrast. This function
is regarded as an important visual perceptual measurement; Sekuler (1974),
in his analysis of spatial vision, calls the contrast sensitivity function
"a quick and useful summary of the overall response of the visual system"
(p.207); moreover, he points to research (Campbell & Green, 1965) which
uses the contrast sensitivity function to summarize not only the whole
eye—brain system response, but selected portions of it.
The human contrast sensitivity function defines sensitivity to
various spatial frequencies, and normally takes the form represented in
the following diagram:
1 000
SIGNAL DURATION
lonsic)
MOO 560 300 160
100
56
10 J5 45 1.5 45 15
SPATIAL FREOUENCT (cad)
300
5 oi;
In 100
o- w < 0- Z 0
30
1 I 1 1 1 1 1
22. .
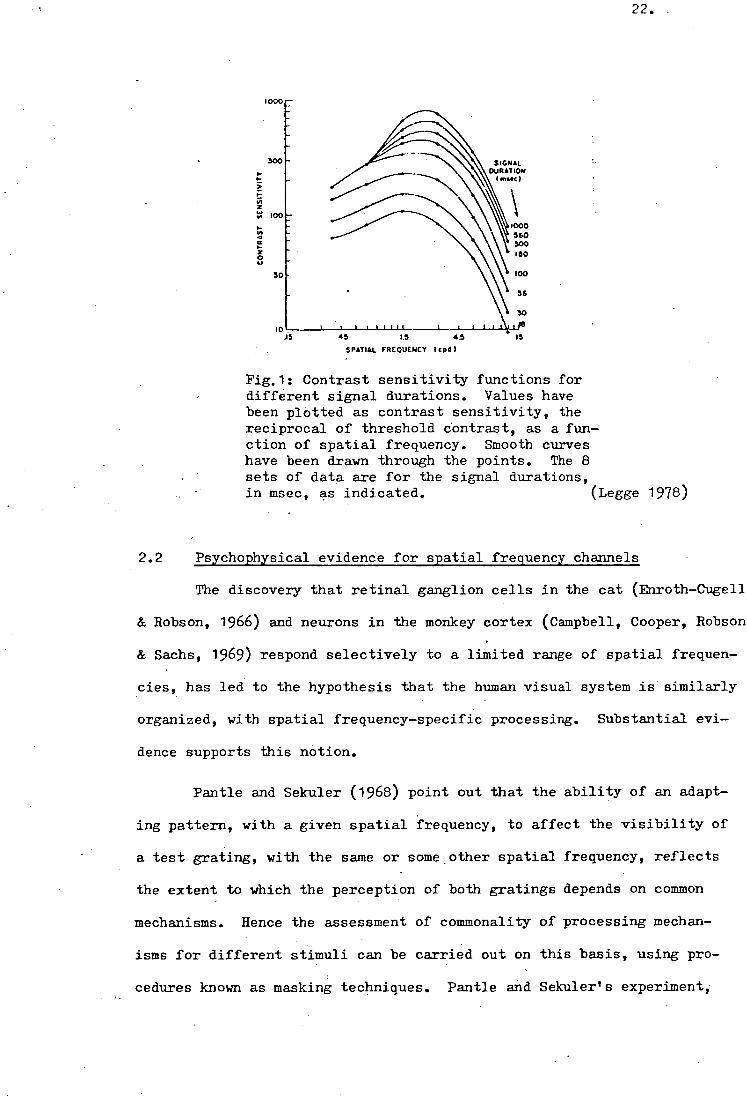
Fig.1: Contrast sensitivity functions for different signal durations. Values have been plotted as contrast sensitivity, the reciprocal of threshold contrast, as a fun-ction of spatial frequency. Smooth curves have been drawn through the points. The 8 sets of data are for the signal durations, in msec, as indicated. (Legge 1978)
2.2 Psychophysical evidence for spatial frequency channels
The discovery that retinal ganglion cells in the cat (Enroth-Cugell
& Robson, 1966) and neurons in the monkey cortex (Campbell, Cooper, Robson
& Sachs, 1969) respond selectively to a limited range of spatial frequen-
cies, has led to the hypothesis that the human visual system is similarly
organized, with spatial frequency-specific processing. Substantial evi-
dence supports this notion.
Pantle and Sekuler (1968) point out that the ability of an adapt-
ing pattern, with a given spatial frequency, to affect the visibility of
a test grating, with the same or some other spatial frequency, reflects
the extent to which the perception of both gratings depends on common
mechanisms. Hence the assessment of commonality of processing mechan-
isms for different stimuli can be carried out on this basis, using pro-
cedures known as masking techniques. Pantle and Sekuler's experiment,
2 3.
using 33 combinations of adaptation and test patterns, found significant
differences in luminance threshold as a function of spatial frequency,
and maximum masking effects, represented by peaks of luminance threshold,
where spatial frequencies of adaptation and test gratings were approx-
iMately similar. The latter effect demonstrated some commonality; an
adaptation grating of 1.05 c/deg, for example, affected test gratings
of both .35 and 1.05 c/deg, maximally, suggesting that the mechanisms
mediating the detection of these gratings was similar. It also demon-
strated differences, in that higher frequency adaptation gratings pro-
duced maximum masking for comparable test gratings. This provides evi-
dence f6r differentially tuned spatial frequency mechanisms which are,
however, limited in number.
Blakemore and Campbell (1969) showed an adaptation effect on con-
trast sensitivity function, using sinusoidal gratings of varying spatial
frequency with respect to the test stimulus. Their findings imply
"channels tuned to spatial frequencies ranging from 3 c/deg up to the
upper limit of resolution at about 48 c/deg" (Campbell, 1974,p.97).
Campbell and - Kulikowski (1966), in a simultaneous masking study, found
that masking effects on threshold contrast were very much reduced when
test and masking gratings differed in spatial frequency; Campbell and
Maffei (1970), measuring evoked potential from the visual area of the
scalp, determined that thresholds, represented by electrical signals,
were selectively sensitive to spatial frequency and to orientation. Even
the well-known McCollough after-effect1 has been shown (Stromeyer, 1972)
to be spatial frequency-specific.
On the basis of the above evidence, Campbell argues that the vis-
ual system may perform a spatial frequency analysis on the Fourier or
1. Following viewing of vertical black gratings on one colour, a com-
plementary coloured after-effect is perceived on a vertical test grating
of black and white.

24.
sine-wave components of the input stimuli. While the argument pre-
sented in this thesis does not rely on the visual system performing
such an analysis, it does depend on the notion of separate spatial fre-
quency channels. On these, the evidence seems clear that, in the words
of Sachs, Nachmias and Robson (1971,p.1183) that "the human visual sys-
tem contains several sensory channel's, each selectively sensitive to a
different, moderately narrow range of spatial frequencies".
2.3 Temporal properties of spatial frequency channels
2.3.1 Visual persistence and reaction time:
Considerable research supports the view that the spatial frequency-
specific channels differ in their temporal properties.
Visual information store (VIS) or visual persistance (VP) has been
mentioned in an earlier section in relation to Stanley's work. This mea-
sure refers to the temporal properties of very early visual processing,
corresponding to the time for which an image persists after stimulus off-
set. Meyer and Maguire (1977) measured the persistence produced by grat-
ings of various spatial frequency, and showed that persistence increased
with spatial frequency in an approximately linear fashion. This finding
has been replicated consistently. (Lovegrove ., Heddle & Slaghuis, in
press; Bowling, Lovegrove & Mapperson, 1979).
An easily accessible measure of general visual temporal function-
ing is offered by reaction time, where the subject is required to press
a switch as soon as a grating is seen. Reaction time has also been
shown to vary with spatial frequency, so that longer reaction times are
found with higher spatial frequency (Breitmeyer, 1975; Vassilev &
Mitov 1976; and Lupp, Hauske & Wolf 1976).

25.
2.3.2 Bloch's Law:
The fact that the visual system deals with stimuli in discrete
time periods (Haber & Hershenson, 1973) makes temporal processing an
important feature of vision research. The reciprocity of time and
intensity was first investigated by Bloch (1885), and is represented by
the equation Ixt.k where I is the intensity, t the duration of the
stimulus, and k a constant. This basic law, Bloch's Law, underlies a
wide variety of perceptual phenomena, and, with visual persistence and
reaction time, is a fundamental visual perceptual measure.
According to Bloch's Law, this reciprocity breaks down if the
duration of the pulse is too long; the upper limit of the reciprocity
is called the "critical duration", explained by Haber and Hershenson
(1973) as "the duration beyond which adding more time ceases to have
any effect".(p.121).
This reciprocity means that the intensity level required in order
to detect a stimulus (the threshold) will decrease as the duration of
stimulus exposure increases, up to the critical duration, which as a gen-
eral rule, is about 100 msec, but which varies according to stimulus
conditions which will be considered in detail later.
1. t
1
• 100
Time in milliseconds
Fig. 2: . Two ways of illustrating Bloch's Law showing the range over which time and intensity are reciprocally related. (Haber & Hershenson
.1973)
100
26.
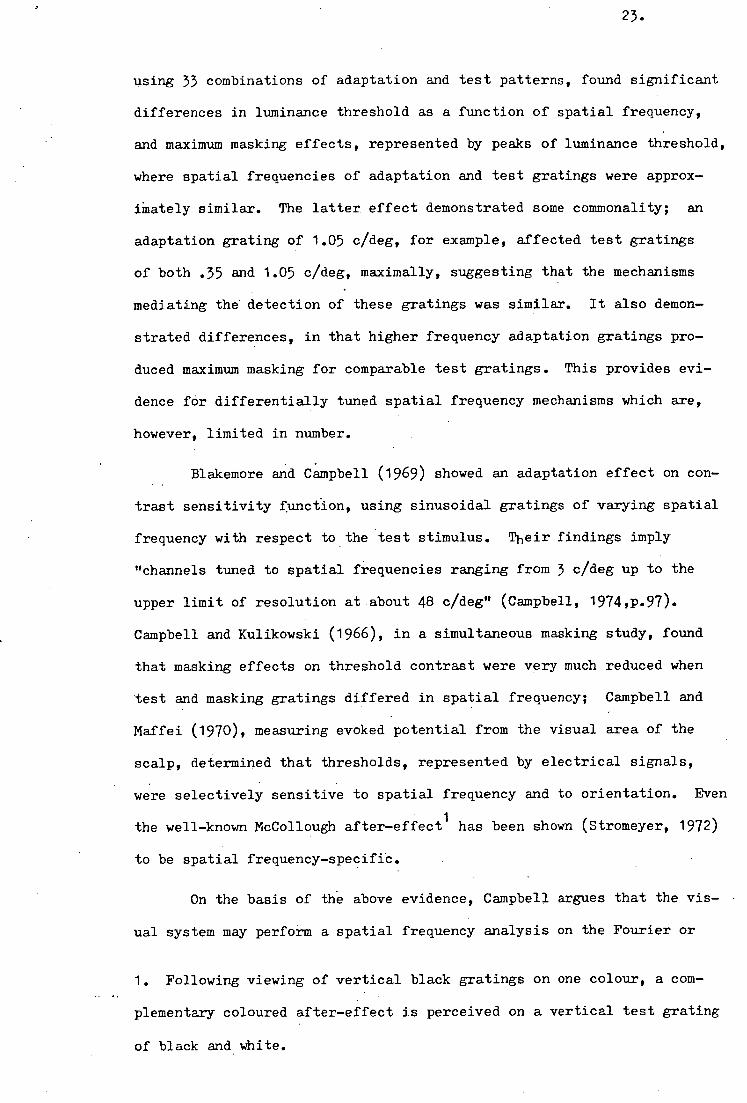
It has also been clearly established that the same phenomenon
exists when contrast level, rather than luminance of a pulse, is the
dependant variable (Breitmeyer & Ganz, 1977).
20 100 400 20 100
400 STIMUU.1S DURATION (MSC)
Fig. 3: Threshold contrast in per cent at spatial frequencies of 0.5, 2.8 and 16.0 c/ deg as a function of stimulus duration. Both threshold contrast and stimulus dura-tion are plotted along logarithmic co-or-dinates in order to obtain linear functions indicating the contrast-duration reciprocity at each spatial frequency. (Breitmeyer & Ganz, 1977:
The examination of Bloch's Law as a function of spatial frequency
supplies not only information about the temporal integration of the sys-
tem, but also provides a measure of contrast sensitivity at various dur- -
ations.
Like other temporal measures, those afforded by Bloch's Law also
demonstrate spatial frequency-specific effects. Contrast sensitivity
function varies with spatial frequency, though in a more complex way
than either reaction time or visual persistence. This has been mentioned
in an earlier section.
Critical duration, represented in the following diagram by
the intersection of the two lines corresponding to threshold contrast at
varibus durations, increases with spatial frequency.

27.
7 I 300
6- 100
4 M 1— 30
0
0 0
▪
10 2
1 on 12.0
Cc •—
•
SPATIAL ' R( OUCNC Y
0
ANSOLLITIE
.0051
.00,11
.00M
.00M
.002•
0' ZS 10 30 1QO 300 1000 3000
LOG SIGNAL DURATION (mssc)
Fig. 4: Threshold as a function of duration. Contrast thresholds are plotted as a function of signal duration for 6 spatial frequencies. To facilitate display, the sets of data points have been vertically displaced and sequenced in order of spatial frequency. The ordinate values give the relative contrasts for points within a'set. Absolute contrast of the asymp-totic level of each curve is given at its right. Data points are the geometric means of 6 threshold estimates (18-1000 msec) or 4 est- imates (1800 and 3000 msec) from 2 subjects. Threshold estimates were obtained from blocks of forced choice trials. Error bars represent +1s.e. Each set of data has been fitted piece-
• wise with straight line segments. (Legge, 1978)
Breitmeyer and Ganz (1977) found a similar increase in critical
duration with spatial frequency.
These findings have led to the increasingly consistent conclusion
that the human visual system is composed of channels, each channel res-
ponding to a narrow band of spatial frequencies and having characteristic
temporal properties (Breitmeyer & Ganz, 1977; Campbell & Robson, 1968;
• Legge, 1978; Lovegrove, Heddle & Slaghuis, 1978, in press). The exis-
tence of "transient" and "sustained" mechanisms has been briefly alluded
to, and the following section discusses these in more detail.

28.
2.4 Transient and sustained mechanisms in visual information processing: Relevance to Bloch's Law
Enroth-Cugell and Robson (1966), in an electro-physiological study
on the retinal ganglion cells of the cat, analysed spatial-summation pro-
perties in two distinct types of cells. Termed X and Y cells, they exhi-
bited respectively linear and non-linear spatial summation; when temporal
properties were considered (Cleland, Lubin & Levick, 1971), X and Y cells
could be regarded as "sustained" and "transient" respectively. The X cellE
responded continuously to a steady test spot, in a characteristic "sus-
tained" manner; the Y cells were observed to respond in a "transient"
Manner only to the onset or offset of a steady test spot; both cell types
showed spatial frequency selectivity, with optimal responses of sustained
cells occurring at a higher spatial frequency than for the transient cells.
The correlate of this finding in the human visual system has been suggested
by Breitmeyer and Ganz, (1976); Kulikowski and Tolhurst(1973),and Breitmeyer
(1975).
These spatial frequency selective mechanisms have been described by
Legge (1978) as two "distinct mechanisms" termed sustained and transient,
after possible neural processes. The transient mechanisms respond best
to rapid temporal changes, whereas the sustained mechanisms respond best
to slow or slowly varying stimuli. Breitmeyer (1974) and Breitmeyer and
Ganz (1977) summarize the relative properties of these two mechanisms:
Channels called "transient" operate at low to moderate spatial
frequencies and are characterized by a transient response to the on and
offset of a flashed stimulus of prolonged duration, and by a relatively
high temporal resolution, as revealed by their greater sensitivity to
flicker, rapid motion, and abrupt stimulus onset. Sustained channels,
operating at moderate to high spatial frequencies, are characterized by
a sustained response to a flashed stimulus of prolonged duration and by
relatively poor temporal resolution.

29.
In terms of threshold contrast, the implications of transient
and sustained mechanisms are outlined by Legge (1978). Threshold for
transient mechanisms should, beyond a relatively short critical dur-
ation, reach independence of signal duration, since they primarily
respond only to stimulus onset and offset. Sustained mechanisms, on
the other hand, would be expected to be characterized by an indefinite -
drop in threshold as a function of signal duration, because they con-
- tinue to respond throughout stimulus presentation. While the .use of
the,term "indefinite" is dubious, since the concept of critical dur-
ation, however long that duration is, must be accommodated, the out-
come of this prediction is that low spatial frequency stimuli, insofar
as they excite transient mechanisms, will produce shorter critical dur-
ations than will high "spatial frequency stimuli, as has indeed been
shown (Breitmeyer & Ganz, 1978). The lack of a clear dichotomy in
Breitmeyer and Ganz's work arises, according to Legge, because even at
the "low" spatial frequency (1.5 c/deg) used by Breitmeyer and Ganz,
transient mechanisms may not be sufficiently involved. In an attempt
to achieve less equivocal results, Legge examined contrast threshold
considered as a function of duration over a range of spatial frequen-
.cies from .375 c/deg to 12 c/deg. He found the distinct qualitative
differences represented by Fig.21.
This important verification of the anticipated properties of
sustained and transient mechanisms . places Bloch's Law and contrast
sensitivity function even more firmly in the range of temporal pro-
cesses mediated through transient and sustained mechanisms. Critical
duration acquires indeed a critical importance in the assessment of
visual temporal processing. The preceding sections support the funda-
mental premise underlying the present study; that is, that both spatial
3 .
and temporal processing are mediated by spatial frequency-specific
channels which may be considered in terms of "sustained" and "tran-
sient" properties. The relationship between these channels provides
a predictable response pattern in terms of spatial frequency.
The importance of such relative differences in ordinary visual
tasks may not be great, but their importance to a task as complex as
reading will be a matter for discussion in a later section. The stress
at present is on the existence, in normal human subjects, of spatial
frequency-specific channels with characteristic temporal properties
which are related in theoretically consistent ways. The next section
presents findings which imply differences in this pattern in SRD
children.
2.5 Reading disability and spatio-temporal properties
Amongst the range of visual perceptual approaches to reading
disability, of which several have been already mentioned, are the
studies which examine stages of visual information processing such as
visual persistence or VIS (Stanley & Hall, 1973b), transfer of infor-
mation from VIS to short-term memory or STM (Stanley & Hall, 1973b,
Lovegrove & Brown, 1978) and visual STM itself (Stanley & Hall, 1973a).
Morrison, Giordani and Nagy (1977) show similar VIS durations for SRD's
and controls, and Vellutino's findings, which have already been presen-
ted in an earlier section, imply no visual perceptual deficit in SRD's.
However, a substantial amount of research finds differences at this
basic level of early information processing, and Stanley's studies have
been outlined in this context. It should be noted that there are
31.
inconsistencies in the direction of difference found; Stanley and
Hall (1973b) show significantly longer VIS durations in SRD's when
compared with controls, while Fisher and Frankfurter (1977) find
shorter VIS durations in SRD's.
In view of the evidence on spatial frequency-specific temporal
properties in visual processing, the possibility of abnormal inter-
action, in SRD children, of spatial frequency channels, bears investi-
gation, particularly because the weight of evidence is for differences
in precisely those early visual information processes which have been
shown to be spatial frequency-specific.
The research providing evidence for an abnormal interaction is
the immediate background for the present study.
Lovegrove and Brown (1978) found that VIS in 8 year old - SRD's
was, as expected, from Stanley and Hall's (1973b) study, significantly .
longer than controls, but that this difference decreased with age. This
.suggests (on first analysis) quantitative rather than qualitative diff-
erences. The interesting finding from the point of view of an argument
for qualitative differences in temporal processing, however, derives
from Experiment II of that study. Here, rate of transfer of information
from VIS to short-term memory (STM) was investigated, and it was found
that while both 8 year olds and 11 year olds transferred information at
a significantly slower rate than controls, this difference, in fact,
increased with age. The interpretation of simple developmental lag in
temporal processing becomes highly questionable. These findings, however,

32.
were based on letter stimuli; the question remained as.to whether
such differences could be demonstrated using more general stimuli, the
response to which would have clearer implications for fundamental def-
icit or abnormality. Lovegrove, Billing and Slaghuis (1978) investi-
gated the effect of spatial properties of stimuli on visual processing,
and found that processing of visual contourinformation at the level of
the visual cortex, differed between SRD's and controls: SRD's showed
higher levels of both visual contour orientation masking and the tilt
aftereffect, as well as orientation differences in VIS duration. As was
discussed earlier, it maybe that in SRD children, the relative effic-
iencies of processing different kinds of spatial information is dis-
turbed. Since there are clear links between processing of visual con-
tour information, and spatialfrequency .processing (Campbell & Kulikowski,
1966), spatial frequency-specific effects on VIS were investigated.
Lovegrove, Heddle and Slaghuis (1979, in press), measured VIS
duration as a function of spatial frequency. VIS duration was determined
by the temporal separation between two successive stimuli at which sub-
jects could discern a blank, the stimuli being sine-wave gratings at
five spatial frequencies. The findings were that the disabled reading
group had significantly longer durations of visual persistence then con-
trols at 1 2 and 4 cycles per degree; were similar at 8 cycles per
degree, and at 12, had significantly shorter visual store durations.
The authors state: "Whether specifically disabled readers have longer,
shorter or the same durations of VIS as controls may depend on the dom-
inant spatial frequencies contained in the stimuli in each [of the pre-
vious, apparently disorapant] experiment". It would seem that spatial
frequency is having a differential effect on the temporal aspects (of
which VIS, of course,. if one) of visual processing, with SRD children.

33.
In summary, it seems that for SRI) children, there is the poss-
ibility of an abnormal interaction between spatial properties of stim-
uli and the temporal aspects of the processing of those stimuli, so that
the expected patterns do not apply.
The discovery of qualitative as well as quantitative differences
in the visual processing of children with reading disability can usefully
be related to the reading process itself.
If contour orientation information is processed abnormally,
(Lovegrove, Billing & Slaghuis, 1978), the orientation aspects of letter
recognition might be expected to suffer. It is well established (Critchley
1964; Hepworth 1967) that reversals and inversions, essentially problems
of orientation, are far more common in disabled readers than in their nor-
mally reading peers.
Rapid processing of peripheral information, conferred by a short
VIS in low frequency channels, may serve a role in the visual guidance of
central vision (Lovegrove, Heddle & Slaghuis, 1979, in press), with clear
application to the reading task, which requires integration of successive
fixations involving both central and peripheral vision. And it may also
be speculated that relatively short VIS duration at high spatial frequen-
cies would lead to relatively poor recognition of detail, although this
remains unproven. The reading task requires both accuracy of detail,
recognition and sophisticated integration of sequences of a broader kind,
and difficulties in precisely those components of reading will be con-
ferred by the kinds of distortions of visual processing suggested by this
group of studies.
2.6 The present study
Bloch's Law, as has been outlined, affords several important

34.
measures:
(a) the critical duration at different spatial frequencies.
(b) threshold contrast, and hence its reciprocal, contrast
sensitivity, at a range of spatial frequencies and dur-
ations of stimulus exposure.
(c) This can include a contrast sensitivity function corres-
ponding to effectively unlimited duration, beyond which
increased time has no effect. The latter would provide
an "absolute" contrast sensitivity function.
Reference to the value of these measurements has already been made
(Sekuler, 1974). They become even more relevant when it is recalled from
earlier discussion that, in all of them, spatial frequency-specific effect
have been established (Breitmeyer & Ganz, 1977; Legge, 1978).
The immediate background to the present study demonstrated spatial
frequency-specific differences between SRD's and controls in the very
early stages of visual processing. These differences, incidentally, may
vary with contrast, since it has been shown (Bowling, Lovegrove &
Mapperson, 1979) that the persistence of low contrast gratings is longer
than that for high contrast gratings, an effect which increased with
spatial frequency. It is also argued in that paper that integration time
may be a basic component of visual persistence. Data on critical duration
as a function of spatial frequency can be plotted to form a line of sim-
ilar slope to the data on visual persistence. In view of the persistence
differences found in SRD's, the contribution of critical duration to those
differences bears investigation. Further unpublished research by
Lovegrove (1978) implies spatial frequency-specific differences in
threshold durations at constant contrast, between SRD's and normals,which,
though reaching significance only at low spatial frequency, leads to the
- deduction that contrast exerts differential effects on SRD children. In
35.
conjunction with the data on persistence, the investigation of the
relationship in SRD's, between critical duration and spatial frequency,
as well as contrast sensitivity and spatial frequency, becomes therefore
an important dimension in the study of the effect of spatial properties
on temporal processes, since it is precisely that interaction which may
be disturbed in SRD's. A study of the operation of Bloch's Law provides,
of course, just such information. •
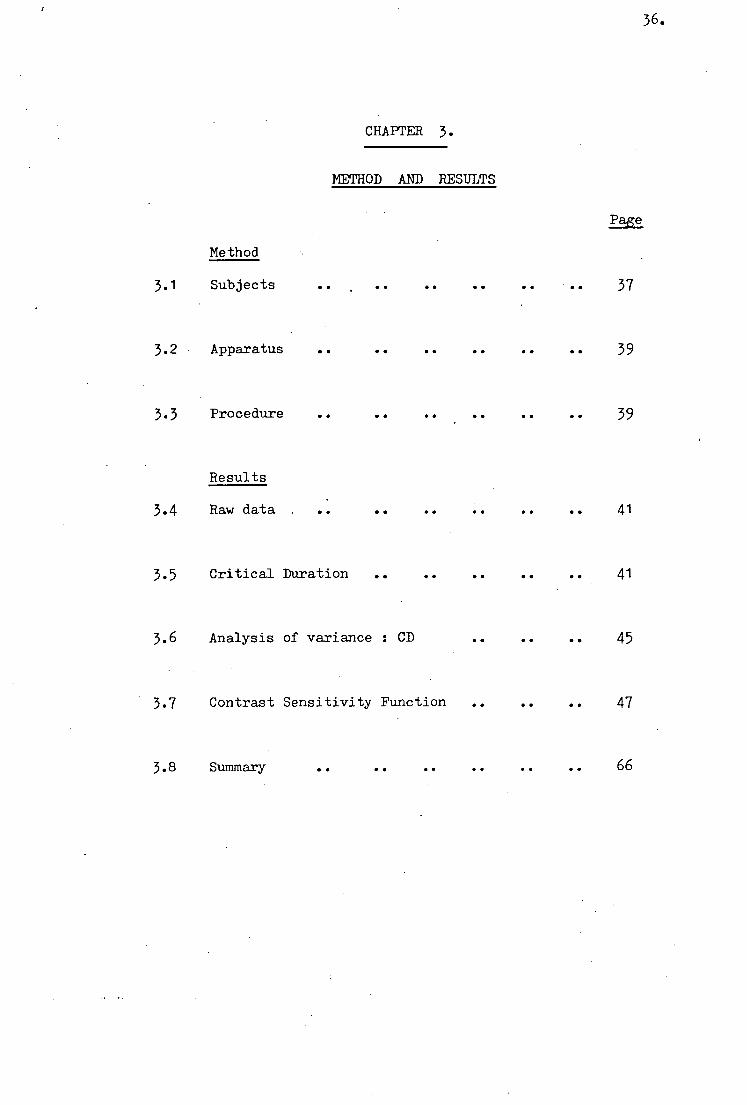
CHAPTER 3.
METHOD AND RESULTS
Method
Page
3.1 Subjects • • • • •• • • • • 37
3.2 Apparatus • • • • • • • • • • • • 39
3.3 Procedure • • • • • • • • • • • • 39
Results
3.4 Raw data . 41
3.5 Critical Duration 41
3.6 Analysis of variance : CD .. .. .. 45
3.7 Contrast Sensitivity Function .. .. .. 47
3.8 Summary .. .. .. .. .. .. 66
36.

37.
Method
3.1 Sub'ects:
Ten experimental subjects were selected from amongst children
known to have reading difficulties, who attended a special English
class at a local High School. Children were selected according to
the following criteria:
1. An intellectual ability within normal limits
(IQ 85 or higher), as measured on an appropriate
intelligence test. Most had been individually
tested on a WISC or Binet, and all had a Ravens
Progressive Matrices score..
2. Reading age, as measured on the accuracy scale of
the Neale analysis of Reading Ability (1966),
falling twoyears or more below chronological
age.
3. Absence of physical, emotional or social disa-
bility which could be regarded as primary, and abs-
ence of obvious educational deficit (e.g., frequent
school changes).
Children for the control group were selected from the school
files, on the basis of matched sex, age, IQ and socioeconomic status,
as measured by father's occupation.1 All were reading at a level
considered to be appropriate for their age.
1. Status taken from Congalton'S matrix of socioeconomic status in
Australia (1963). This ranks in two ways from Rank 1 (profess-
ional) to Rank 7 (unskilled); and from Rank 1 (upper class) to ,
Rank 7 (working class).
38.
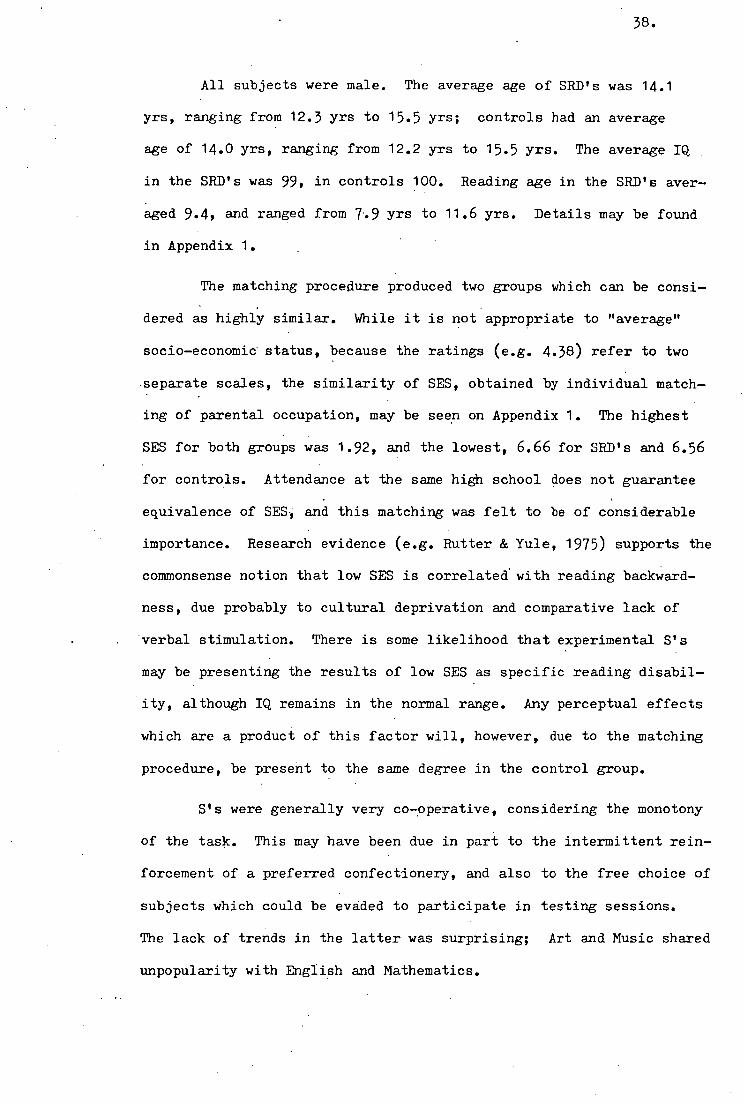
All subjects were male. The average age of SRD's was 14.1
yrs, ranging from 12.3 yrs to 15.5 yrs; controls had an average
age of 14.0 yrs, ranging from 12.2 yrs to 15.5 yrs. The average IQ
in the SRD's was 99, in controls 100. Reading Age in the SRD's aver-
Aged 9.4, and ranged from 7..9 yrs to 11.6 yrs. Details may be found
in Appendix 1.
The matching procedure produced two groups which can be consi-
dered as highly similar. While it is not appropriate to "average"
socio-economic status, because the ratings (e.g. 4.38) refer to two
.separate scales, the similarity of SES, obtained by individual match-
ing of parental occupation, may be seen on Appendix 1. The highest
SES for both groups was 1.92, and the lowest, 6.66 for SRD's and 6.56
for controls. Attendance at the same high school does not guarantee
equivalence of SESi and this matching was felt to be of considerable
importance. Research evidence (e.g. Rutter & Yule, 1975) supports the
commonsense notion that low SES is correlated with reading backward-
ness, due probably to cultural deprivation and comparative lack of
'verbal stimulation. There is some likelihood that experimental S's
may be presenting the results of low SES as specific reading disabil-
ity, although IQ remains in the normal range. Any perceptual effects
which are a product of this factor will however, due to the matching
procedure, be present to the same degree in the control group.
S's were generally very co-operative, considering the monotony
of the task. This may have been due in part to the intermittent rein-
forcement of a preferred confectionery, and also to the free choice of
subjects which could be evaded to participate in testing sessions.
The lack of trends in the latter was surprising; Art and Music shared
unpopularity with English and Mathematics.
39.
3.2 Apparatus:
The inspection field was presented on a B.W.D. Model 539D
oscilloscope (P31 Phosphor), viewed at a distance of 228 cm. At this
distance the masking of the oscilloscope with an 8 cm. occluder pro-
vided a circular field, subtending 2o of visual angle. The uniform-
field luminance of the display was 2.2 cd/m2
.
The stimuli consisted of vertical sinusoidal gratings at four
spatial frequencies generated in the manner described by Campbell and
Green (1965). The contrast was varied using a B & K Precision 2810
digital voltmeter, adjustable in steps of .001. An interval timer was
connected to control duration of stimulus.
Testing was carried out in a photographic dark room, at the
High School. Every effort was made by teachers to ensure undisturbed
conditions for the research programme, and a key was provided after
the lunch-time disappearance of a quantity of reinforcements. Inevit-
ably, however, there was a certain amount of noise in the passage out-
side, and the progress of testing was sometimes interrupted by curious
students, or those anxious to offer their perceptual abilities for
assessment. Conditions of luminance and apparatus setting were con-
stant throughout, and the testing situation was generally very good.
3.3 Procedure:
Each subject was tested individually, and required approximat-
ely two hours of testing, administered in at least two sessions, gen-
erally on different days. Control and experimental subjects were
alternated. All subjects had normal uncorrected vision, with better
than 6/6 Snellen acuity.

40.
Threshold contrast was determined for each of nine stimulus
durations (40, 60, 80, 100, 150, 200, 300, 500 and 1000 msec.) at
each of four spatial frequencies (2, 4, 12, and 16 c/deg.). The
order of presentation of spatial frequencies was counterbalanced
across subjects, and counterbalancing of order of duration presen-
tation (from 40 to 1000 or 1000 to 40) was also carried out so that
each subject was tested on two spatial frequencies at decreasing dur-
ations, and two at increasing durations. Details may be seen on
Appendix 2. All spatial frequencies were thus tested at all durations
in a cross-randomised manner.
The subject sat in a chair directly in front of the oscilloscope.
No supporting brace was used. Instructions were standard throughout
(Appendix 3) and were given during the dark adaptation period of five
minutes.
The subject's task was to determine whether or not a grating was
flashed on the screen, after the experimenter said "Now" and the subject
pressed a switch. The foreperiod was held constant at 10 msec. through-
out all trials and all subjects. The contrast threshold was deterinined
using a blockwise tracking procedure adapted from Houlihan and Sekuler
(1968), thus providing a measure of the miss and false alarm rates.
Each block consisted of twelve trials with the target stimulus appear-
ing, or a blank screen appearing, on six trials each, in random order.
Contrast was held constant for each block and varied from block to
block in steps of .005, except at contrast levels of .005 or beldw,
where steps of .002 were used. Threshold contrast was judged to have
been reached when the subject achieved 75% accuracy over a single block
or bracketed this value between successive blocks. In order to deter-
mine the contrast for the first block, approximate threshold was deter-
mined using serial incrementation in steps of .005 from a clearly
41.
subthreshold contrast, until the subject detected the grating.
Results
3.4 Raw Data:
Raw scores took the form of contrast thresholds at the four
spatial frequencies and nine durations specified, for the two groups,
each with 10 S's. Because scores were in voltage readings, all thresh--
olds were in terms of relative contrast. Appendix 4 shows the raw
scores.
The miss rate (number of misses divided by total number of tar-
get trials) and the false alarm rate (number of false alarms divided by
the total number of blank trials), were calculated for each S. The
averages for each group are shown in Appendix 5. These were analysed
by the Mann-Whitney U Test (Siegel, 1956), which revealed no signifi-
cant differences in miss and false alarm rates between the two groups,
indicating that the demonstrated differences to be reported, were not
due to criterion differences.
The data available have been analysed in two ways, and results
will be presented in two sections, dealing with critical duration (CD),
and the contrast sensitivity function (Cs).
3.5 Critical Duration:
Log threshold was plotted against log duration in the manner
used by Legge (1978), for each S at each spatial frequency. It was
usually found that contrast threshold decreased with duration increase,
in two stages, and that a straight line could be fitted to each compon-
ent. Generally there was a steeply descending portion, followed by a
less steeply descending portion. Lines were fitted to each component

42.
by linear regression, using the method of least squares, and the .
point of intersection was taken as an estimate Of CD.
In all cases where a point of intersection was obtainable,
the first slope was maximised,. and the pivotal point included in
both slopes. This strict criterion was applied to all S's in eadh
condition to avoid shifts in criterion.
Eighty sets of data (20 S's at each of four spatial frequencies)
were dealt with in this way. For 6 sets of data it was impossible to
fit two lines to the points available and here no CD was obtainable,
and the statistical analysis treated these cases as.thiSsing data points.
Because three of these were from each group, and they were spread across
spatial frequencies, it is unlikely that they would have influenced
the analysis.
CD's may be seen on Appendix 6, and. Fig. 5 shows these means.
It can be seen that the control group showed. a linear increase
in CD with spatial frequency, as found by Legge (1978) while for
SRD's this difference appears much less.
Regression lines can be plotted through the points on Fig. 5
to show the slope of each set of points. The equations for SRD's
and controls respectively were:
y = 124.1 + 4.6x
and y = 105.0 + 10.5
Fig. 6 presents those regression lines.
The regression coefficient for the control data at 10.5
agreed well with the regression coefficient of 11.1 obtained by
Bowling, Lovegrove and Mapperson (1979) in normal adults, using
data from Legge (1978) on critical,duration.

Reading Disabled Group c---0 Control Group
280-
260-
240
220
••• I
00.
00' 4••
•••
•••• 00 ,Thro
.•&"
... ...
..
100
1 16
• Si5qtial • Frequency (cycles per degree) 'Fig.5: Mean critical duration as a function of spatial frequency for the 'two groups.

Reading Disabled Group
c---0 Control Group
280
260
240
—th" 220
200
0 .— 0
.0
g 160
° 140
120
180
.••• ..••••
..•••
.0
100
.••• ...■••••••
L . 12 16_
Spatial Frequency. (cycles per degree) Fig.6: Regression lines for mean critical duration As a function of spatial frequency.
45.
Clearly the slope for SRD's was much flatter at 4.6 and the
difference in slope approaches significance (F(1 4) = 3.7, p = 0.12)
Mean, contrast thresholds for the two -groups at each duration
and each spatial frequency were also plotted, to produce graphs
which may be compared. with Legge's (1978) figure, on p.27 of the
present study. . These figures may be seen on Appendix 7.
For both groups relative slopes of the two components inter-
secting at CD were similar to Legge'S with respect to spatial fre-
quency. The typical picture was of a steep initial slope and
relatively flat second slope at low spatial frequency, and at higher
spatial frequency the two slopes, while remaining different, were
less strikingly so. For SRD's the compression of CD's is evident. ■
Analysis of variance: CD
Because of the correlation between means and variance in all
conditions, the data did not satisfy the'homogeneity of variance
assumption for analysis of variance. A log transformation was
therefore carried out on the individual CD's.' The summary of the
analysis of variance is shown in Table 1.
A two-way analysis of variance with repeated measures on
spatial frequency was carried out using Teddybear .(Wilson, 1978),
and the summary of the, analysis of variance is seen on Table 1 on
the following page.
There was a non-significant group effect (F(1,18) = 2.5, p=0.13),
showing that, over all frequencies, the difference between CD's
for SRD's and controls approaches but does not reach significance.

46.
TABLE 1
Summary of Analysis of variance critical duration)
Source of Variation . SS •MS
Groups 0.36 1 0.36 2.53 . 10.13 .
Frequency 4.92 3 1.64 6.97. 0.0004 ,
G x F 1.01 • 3 0 .34. 1 .43. 0.24'
Error 15.26 . 66 0.23.
TOTAL 21.54_ 73 0.30 .
The spatial frequency main effect was significant (F(3 54) =
6.97, P<0.05),:indicating that across both groups, Spatial frequency
significantly affeCted CD. This is in line with previous repOr•s,
where CD increases in a linear fashion With spatial frequency.
This effect of spatial frequency on CD is not SignifidantlY diff-
erent in the two gi-Ouips, though the gro4-frequenCy interaction
(F(3, 54) = 1.43, p 7.:_0.24) suggests a trend towards difference.,
which is supported by comparing the individual regression coeff-
icients for each subject. The F test comparing individual slopes
across groups (F(1, 18) = 3.4, p = 0.08), while regarded with
caution, is significant on a one-tailed test.
There is further tentative support from the Duncan's test,
showing, at the 0.01 level, that CD for controls increased signifi-
cantly with spatial frequency. In the SRD's there is no difference
at all (00.05).

47.
In summary, there is a trend towards a significant diff-
erence in CD's between groups as a function of spatial frequency,
as might be expected from Fig. 6.
3.7 Contrast sensitivity function (CSF)
Contrast sensitivity was calculated as the reciprocal of
contrast threshold, raw scores for which may be found in Appendix
4. Fig. 7 presents the mean CSF for SRD's and controls at all dur-
ations from 40 msec. to 1000 msec.
Analysis of variance on all CSF results is presented in
Table 2, following. There was no main effect of groups (F(1, 18) =
0.98, p>0.05), nor was there a significant group-frequency inter-
action (F(3, 54) = 0.171, p)0.05). There was, however, a main
effect of frequency, showing that spatial frequency significantly
affects contrast sensitivity (F(3, 54) = 252, p<0.001) Examination
of Fig. 7 shows that contrast sensitivity peaked at 4 c/deg., given
long durations, although controls and SRD's were different in this
respect, which will be discussed shortly. It will also be observed
that at shorter durations the function was clearly linear, contrast
sensitivity decreasing with spatial frequency increase, without
the peak at 4 c/deg mentioned earlier. These findings are consis-
tent with previous data (Legge, 1978).
There was also a significant duration effect (F(8, 144) = 63,
p<0.001). Longer durations increased sensitivity, in keeping with
expected results from Bloch's Law, which would predict decreasing
contrast threshold with increasing durations.
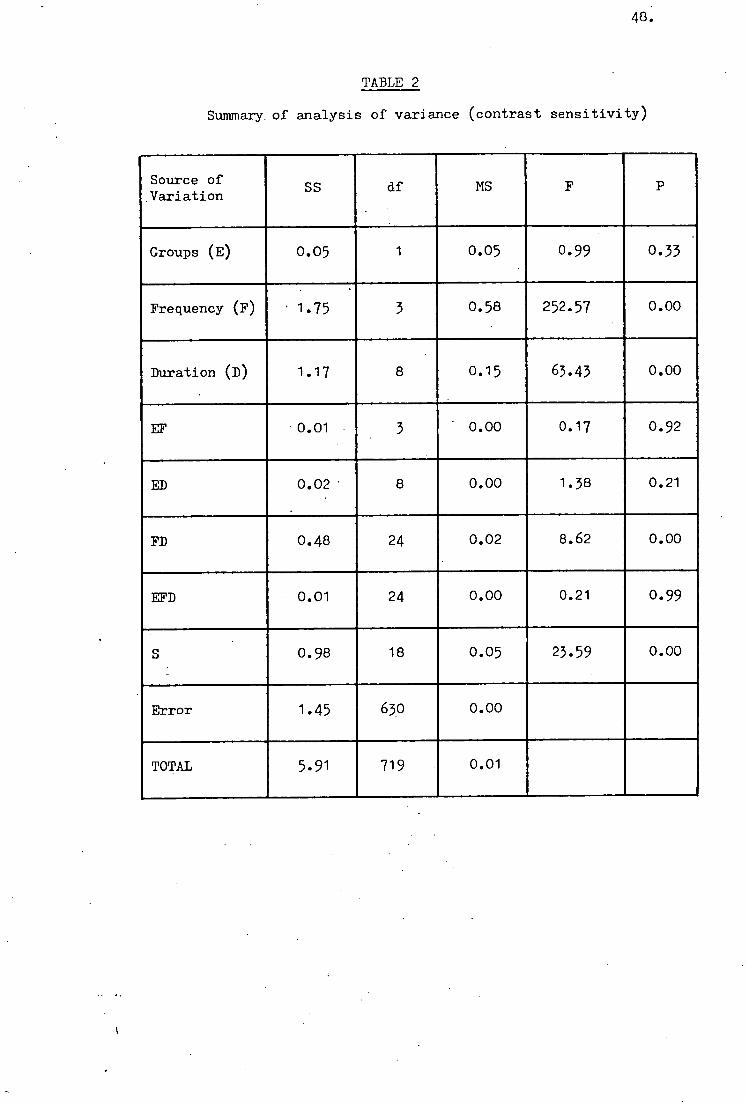
48.
TABLE 2
Summary of analysis of variance (contrast sensitivity)
Source of .Variation
SS df MS F P
Groups (E) 0.05 1 0.05 0.99 0.33
Frequency (F) • 1.75 3 0.58 252.57 0.00
Duration (D) 1.17 8 0.15 63.43 0.00
EF 0.01 3 ' 0.00 0.17 0.92
ED 0.02 ' 8 0.00 1.38 0.21
FD 0.48 24 0.02 8.62 0.00
EFD 0.01 24 0.00 0.21 0.99
S 0.98 18 0.05 23.59 0.00
Error 1.45 630 0.00
TOTAL 5.91 719 0.01

2 4 • 12 11 4 12 16 2 4 12 16
L0 - 40 msec
3 0 -
20 -
10
60 msec 80 msec
150 msec
500 msec
100 msec
300 msec
2 0 -
10-
4.0
3 0 -
2 0 -
1.0 - 0
0 .
Cr
0
cx
0
4.0 -
3 0 -
200 msec
49.
o---o Control group
A- -41 Reading disabled group
Log Spatial Frequency (cycles per degree)
Fig.7: Mean CSF for the two groups at the nine durations tested.
50.
There was a significant frequency-duration interaction effect
(F (24, 432) = 8.6, p<0.00 1 ), indicating that duration exerted diff-
erential effects on the sensitivity to each of the four spatial fre-
quencies used, and, in the manner described above, altered the
apparent CSF, which is clearly seen in the Fig.7. The addition of
time increased sensitivity most noticeably at 4 c/deg., to produce
peak sensitivity there by 1000 msec in both groups.
Even though there was no main effect of groups, nor an inter-
action between groups and frequency, the CSF at each duration bore
examination, especially in view of the apparent consistent differ-
ences between SRD's and controls at all durations (Fig.7).
The pattern of sensitivity for each group was of considerable
interest, hence analyses were carried out on the interaction of
orthogonal components, separated into linear, quadratic and cubic.
This is necessary because the analysis of variance shown in
Table 2 collapses means of contrast sensitivity across all the dura-
tions. It can be argued that such a procedure would be expected
only to reach significance when differences are both considerable,
and evenly distributed. Little meaning can be attached to the fail-
ure to find overall differences by this method.
More importantly, the clear pattern differences on the graphs
suggest a difference in shape of function at different durations
rather than consistent quantitative differences across all spatial
frequencies. An orthogonal analysis tests the significance of this
apparent effect.
Examination of the graphs reveals that control data were con-
sistent throughout with Legge's (1978) findings. CSF -changed from a
linear function decreasing with spatial, frequency at short durations,
to a quadratic function peaking at 4 c/deg. at longer durations.

51.
Sensitivity at all spatial frequencies increased with increased
duration.
The results of the analysis for each duration are presented
separately below.
i) 40 msec. duration
The summary of analysis of variance is presented in Table 3,
following. The analysis of variance showed a significant main effect .
of groups (F (1,18) = 4.49, p< 0.05), indicating that SRD's were less
sensitive than controls. At 4 c/deg. and 2 c/deg., the differences
were significant (T = 3.76, p<0.001 and T = 2.12, p( 0.05, respec-
tively).
The linear trend was significant (F (1,18) = 213.36, p(0.001),
with a non-significant'quadratic (F (1, 18) = 1.98, p)0.05)trend,
indicating that, overall, there was a significant linear decrease in
sensitivity with increasing spatial frequency. Although the cubic
trend reached significance (F (1, 18) = 4.75, p<0.05), this result
was unsupported by significance at any other shorter durations, while
the linear trend persisted at the 0.001 level, clearly representing
the dominant function at short durations. The two groups demonstrate
similar shapes of functions; there was no significant interaction
between groups and frequency (F (3, 54) = 1.82, 00.05), nor was
there significant interaction between orthogonal components. In par-
ticular, there was no significant difference in quadratic trend
(F (1, 54) = 1,56, p) 0.05), indicating no difference in shapes of
functions.
Duncan's Multiple Range Test showed spatial frequency-specific
differences either at or near significance, within both groups. This
latter effect occurred at each of the durations tested, and is refl-
ected in the analysis of variance for mean contrast sensitivities,
summarized in Table '2.

TABLE 3
Summary of analysis of variance at 40 msec.
Source of Variation
SS . df MS F P
Groups (E) 134.51 1 134.51 4.49 0.05
S within Groups 539.21 18 29.96 3.46 0.00
Frequency (F) 1901.30 3 633.77 73.36 0.00
L 1843.18 1 1843.18 213.36 ' 0.00
Q 17.10 1 17.10 1.98 0.17
C 41.03 1 41.03 4.75 0.03
Frequency x Groups (ExF) 47.18 3 15.73 1.82 0.15
L 20.91 1 20.91 2.42 0.13
Q 13.49 1 13.49 1.56 0.22
C 12.78 1 12.78 1.48 0.22
S between 466.49 54 8.64
Groups
TOTAL 3088.69 79 39.10
52.
53.
ii) 60 msec stimulus duration
The summary of analysis of variance at this duration is pre-
sented in Table 4. Both functions were significantly linear
(F (1, 18) . 145.42, P('0.001), and the analysis of orthogonal com-
ponents was similar to that at 40 msec. There was no main effect of
groups (F (1, 18) = 1.66, p)0.05). T-tests indicated a significant
difference at 4 c/deg (T = 2.79, p<0.01), and there was no signifi-
cant difference for other spatial frequencies. Significant differ-
ences at a single spatial frequency must be regarded with caution
when there is no main effect, nor an interaction effect, as is the
case here; the importance, however, of results at 4 c/deg in partic-
ular, will be referred to later. The frequency effect is significant
(F (3, 54) = 49.67, p(poi).
iii) 80 msec stimulus duration
The analysis of variance summary table is presented in Table 5.
Again, there was no main effect of groups (F (1, 18) = 0.59,
p) 0.05), nor an interaction effect, with either frequency or ortho-
gonal components. The functions remained linear, with no signifidant
.quadratic (F (1, 18) = 0.88, 00.05) or cubic (F (1, 18) = 1.23,
p>0.05) trends, and the shape of the functions for the two groups
was similar, as there were no interaction effects on orthogonal com-
ponents. The difference at 4 c/deg approached significance (T = 1.72,
p = 0.09), and the main frequency effect was, again, significant
(F (3, 54) . = 31.32, p<0.001).
iv) 100 msec stimulus duration
The summary of analysis of variance may be seen on Table 6.
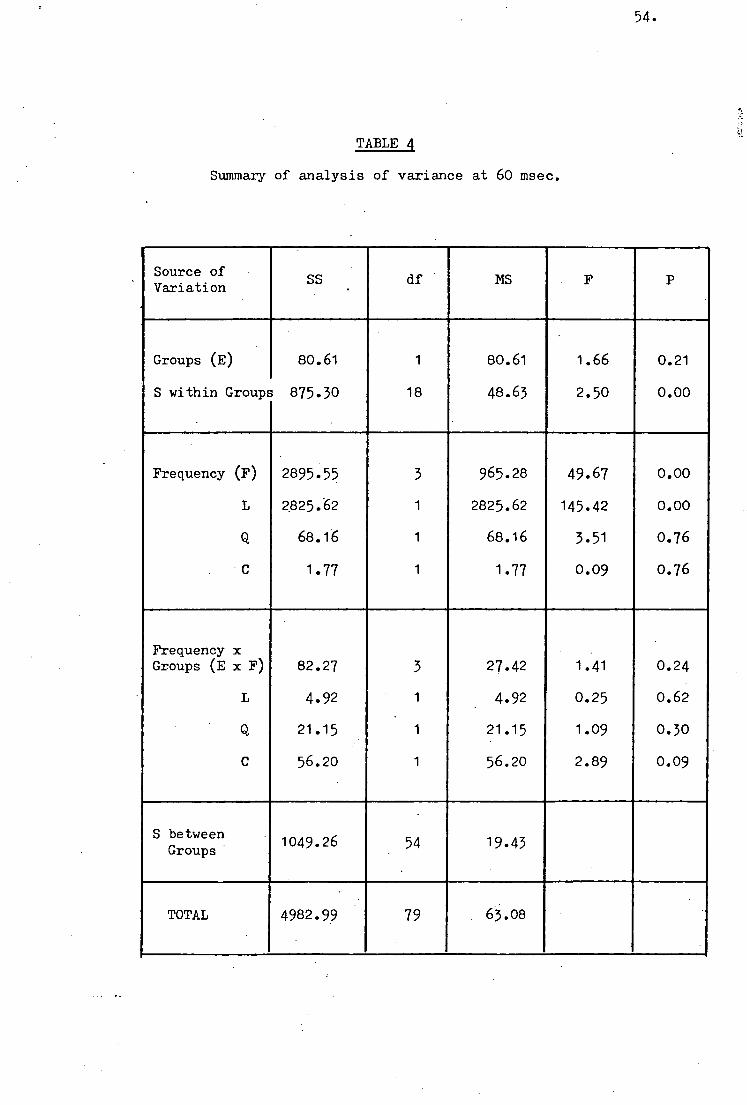
TABLE 4 •
Summary of analysis of variance at 60 msec.
i Source of Variation SS . df MS F P
Groups (E) 80.61 1 80.61 1.66 0.21
S within Groups 875.30 18 48.63 2.50 0.00
Frequency (F) 2895.55 3 965.28 49.67 0.00
L 2825:62 1 2825.62 145.42 0.00
Q 68.16 1 68.16 3.51 0.76
C 1.77 1 1.77 0.09 0.76
Frequency x Groups (E x F) 82.27 3 27.42 1.41 0.24
L 4.92 1 4.92 • 0.25 0.62
Q 21.15 1 21.15 1.09 0.30
C 56.20 1 56.20 2.89 0.09
S between •
Groups • 1049.26 54 19.43
•
TOTAL 4982.99 • 79 63.08 •
54.

TABLE 5
Summary of analysis of variance at 80 msec
Source of Variation
SS df MS F. P
Groups (E) 58.97 1 58.97 0.59 0.45
S within Groups 1788.29 18 . 99.35 2.10 0.00
Frequency (F) 3113.93 3 1037.98 31.32 0.00
L 3043.99 1 3043.99 91.85 0.00
Q 29.04 1 29.04 0.88 0.35
C 40.91 1 40.91 1.23 0.27
Frequency x Groups (E x F) 94.11 3 31.37 0.95 0.42
L 55.44 1 55.44 1.67 0.20
Q 0.20 1 0.20 0.01 0.94
C 38.47 1 38.47 1.16 0.29
S between 1789.57 54 33.14 Groups
TOTAL 6344.87 79 86.64
55.

56.
The analysis produced similar results to those at 80 msec,
with a significant frequency effect (F (3, 54) = 34.01, 1)1(0.001),
a significant overall linear trend (F (1, 18) = 101.18, p(0.001),
and similar shaped linear functions in both groups. The difference
between groups approached significance at 4 c/deg (T = 1.83, p = 0.07).
The group difference found at 40 msec, in view of the fact that
it did not occur again at the succeeding durations of 60, 80 and 100
msec, should'be viewed with caution. The similarity of the graphs
would lead one to expect consistency of this finding, and it is pro-
bable therefore, that a significant difference has occurred at 40
msec by chance, as a reflection of the large number of comparisons.
Up to this duration, the most consistent effect was the diff-
erence at 4 c/deg, where SRD's showed lower sensitivities at or near
significance at all durations, even though their overall sensitivity
was not less.
Linear functions have applied so far for both groups.
v) 150 msec stimulus duration
The analysis of variance summary is presented on Table 7. This
was the first duration at which a quadratic function for CSF could be
.observed, although it was slightly less than significant (F (1, 18) =
3.46, p = 0.06). However, the two groups differed significantly in
terms of the quadratic component of the function (F (1, 54) = 4.79, P(
0.05), and it is clear from the graphs that while there was a quadratic'
function in controls, there was a 'linear function in SRD's. This ten-
dency persists to 1000 msec. At 4 c/deg and 12 c/deg, sensitivity
differences between groups were significant (T = 3.78, p = 0.001; T =
2.12, p(0.05 respectively), and despite.the main effect Of groups,
these differences can be interpreted as contributing to the group in-
teraction on quadratic function. Again, there was a significant effect
of frequency (F (3, 54) = 25.66, p(0.001).

TABLE 6
Summary of analysis of variance at 100 msec
Source of Variation SS • df MS F P
Groups (E) 126.71 1 126.71 1.071 0.31
S within Groups 2130.40 18 118.36 3.26 0.00
Frequency (F) 3695.01 3 1231.67 34.01 0.00
L • 3669.35 1 3664.35 101.18 0.00
Q 4.17 1 4.17 0.11 0.73
C 26.49 1 36.49 0.73 0.40
Frequency x Groups (E x F) 51.93 3 17.31 0.48 0.69
L 18.62 1 18.62 0.51 0.47
Q 29.85 1 24.85 0.69 0.41
C 8.45 1 8.45 0.23 0.53
S between Groups 1955.59 54 36.21
TOTAL 7959.64 79 100.75
57.

TABLE
Summary of analysis of variance at 150 msec.
I Source of Variation SS . df MS F P
Groups (E) 483.58 1 483.58 3.02 0.10
S within Groups 2878.78 18 159.93 4.55 0.00
Frequency (F) 2704.18 3 901.39 25.66 0.00
L 2580.83 1 2580.83 73.46 0.00
Q 121.48 1 121.48 3.46 0.07
C 1.87 1 1.87 0.05 0.81
,
Frequency x Groups (E x F) 222.06 3 74.02 2.11 0.11
L 19.88 1 19.88 0.57 0.45
Q 168.38 1 168.38 4.79 0.03
C 33.80 1 33.80 0.96 0.33
S between Groups (error) 1897.09 54 35.13
TOTAL 8185.69 79 103.62
58.

59.
vi) 200 msec stimulus duration
Table 8 presents the summary of the analysis of var-
iance. Results were similar to those reported above for 150 msec,
tending, however, to be less significant. There was no significant
'overall quadratic function .(F (1, 18) = 0.95, p>0.05) and the
interaction of groups with quadratic component only approached sig-
nificance (F (3,. 54) = 2 .97, P = 0. 09).
A significant effect of spatial frequency was again found
(F (3, 54 . 18.71, 0(0.001). At this duration and the preceding
duration, because a quadratic function is emerging for controls, the
effect of spatial frequency has changed. Sensitivity for controls is
now tending to peak at 4 c/deg, while falling sharply at the higher
spatial frequencies. The change in quadratic component between the
two groups is reflected by the significant sensitivity difference at
4 c/deg (T = 2.74, P < 0 . 01 ) .
vii) 300 msec stimulus duration
The analysis of variance may be seen on Table 9, following.
The overall quadratic function was significant (F (1, 18) = 8.25,
p<.01), indicating that for both groups, CSF is approximating the
quadratic curve described by Legge (1978). There was, however, a
difference in the shape of the function in respect of the quadratic
component, which approached significance (F (1, 54) = 3.49, p = 0.07).
The significant difference at 4 c/deg (T = 2.6, p(0.05) underlies
the difference in shape of function, as will be seen by examination
of Fig.7 . Again, there was a Significant spatial frequency effect
(F (3, 54 ) = 22.08, p<0.001).

TABLE 8
Summary of analysis of variance at 200 msec
Source of Variation
SS . df MS F P
Groups (E) 346.37 1 346.37 1.55 0.22
S within Groups 4017.50 18 223.19 2.95 0.00
Frequency (F) 4246 .53 3 1415.51 18.71 0.00
L 4173:08 1 4173.08 55.17 0.00
Q 71.82 1 71.82 0.95 0.33
C 1.62 1 1.62 0.02 0.38
Frequency x Groups (E x F) 348.60 3 116.20 1.54 0.21
L 63.28 1 63.28 0.84 0.36
Q 224.81 1 224.81 2.97 0.09
C 60.51 1 60.51 0.80 0.37
S between Groups (error) 4084.49 54 75.64
TOTAL 15045.49 79 165.11
60.

TABLE 9
Summary of analysis of variance at 300 msec
Source of Variation
SS . df MS F P
Groups (E) 347.69 1 347.69 1.33 0.26
S within Groups 4723.27 18 262.40 3.71 0.00
Frequency (F) 4684.58 3 1561.53 22.08 0.00
L -3954.55 1 3954.55 55.92 0.00
Q 583.38 1 583.38 8.25 0.01
C 146.65 1 146.65 2.07 0.15
Frequency x Groups (E x F) 295.04 3 98.35 1.39 0.26
L 0.03 1 0.03 0.00 0.98
Q 247.26 1 247.26 3.49 0.07
C 47.75 1 47.75 0.68 0.41
S between Groups (error) 3818'85
54 70.72
TOTAL 13869.44 79 175.56
6 1.
62.
viii) 500 msec stimulus duration
Table 10 presents the summary of analysis of variance. There
is a significant overall quadratic function (F (1, 18) = 13.64, p<
0.001), and a significant difference in the quadratic component of
the two groups (F (1, 54) = 5, 16, p<0.05). SRD's showed a more
linear function, again with the significant difference at 4 c/deg
(T — 2.61, p<0.001) underlying this difference in - shape of function.
Controls are showing peak sensitivity at 4 c/deg, while SRD's are
continuing to showlinearly decreasing sensitivity with increasing
. spatial frequency. At this duration there was also a significant
interaction between groups and frequency (F (3, 54) = 3.88, p< 0 . 01 ),
indicating that spatial frequency overall was exerting significantly
different effects on the sensitivity of SRD's when compared with
controls.
ix) 1000 msec stimulus duration
The analysis of variance summary is presented in Table 11. A
significant overall quadratic function was found (F (1, 18) = 9.88,
p< 0.01), and this is the first duration at which the function for
SRD's on the graph can be observed to be quadratic, with a slight
tendency to peak at 4 . /deg. The peak, however, is not as marked as
for controls, and this is clear from the fact that a significant
difference persisted at 4 c/deg (T = 2.61, p<0.05). The tendency
for SRD's to approximate controls in terms of shape of function is
reflected.by the lack of a significant difference in the quadratic
component (F (1, = 1.79, p>0.05).
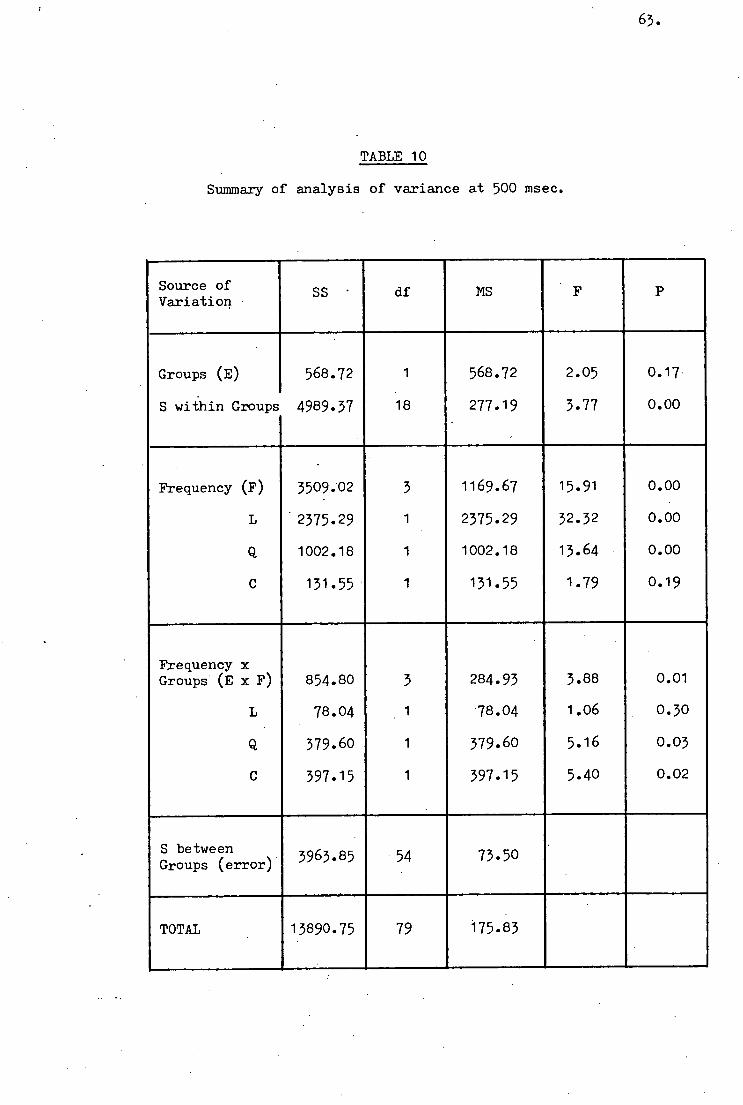
TABLE 10
Summary of analysis of variance at 500 msec.
Source of Variation
SS • df MS p
Groups (E) 568.72 1 568.72 2.05 0.17
S within Groups 4989.37 18 277.19 3.77 0.00
Frequency (F) 3509.02 3 1169.67 15.91 0.00
L . 2375.29 1 2375.29 32.32 0.00
Q 1002.18 1 1002.18 13.64 0.00
C 131.55 1 131.55 1.79 0.19
Frequency x Groups (E x F) 854.80 3 284.93 3.88 0.01
L 78.04 1 78.04 1.06 0.30
Q 379.60 1 379.60 5.16 0.03
C 397.15 1 397.15 5.40 0.02
S between Groups (error) 3963-85 54 73.50
TOTAL 13890.75 79 175.83
63.
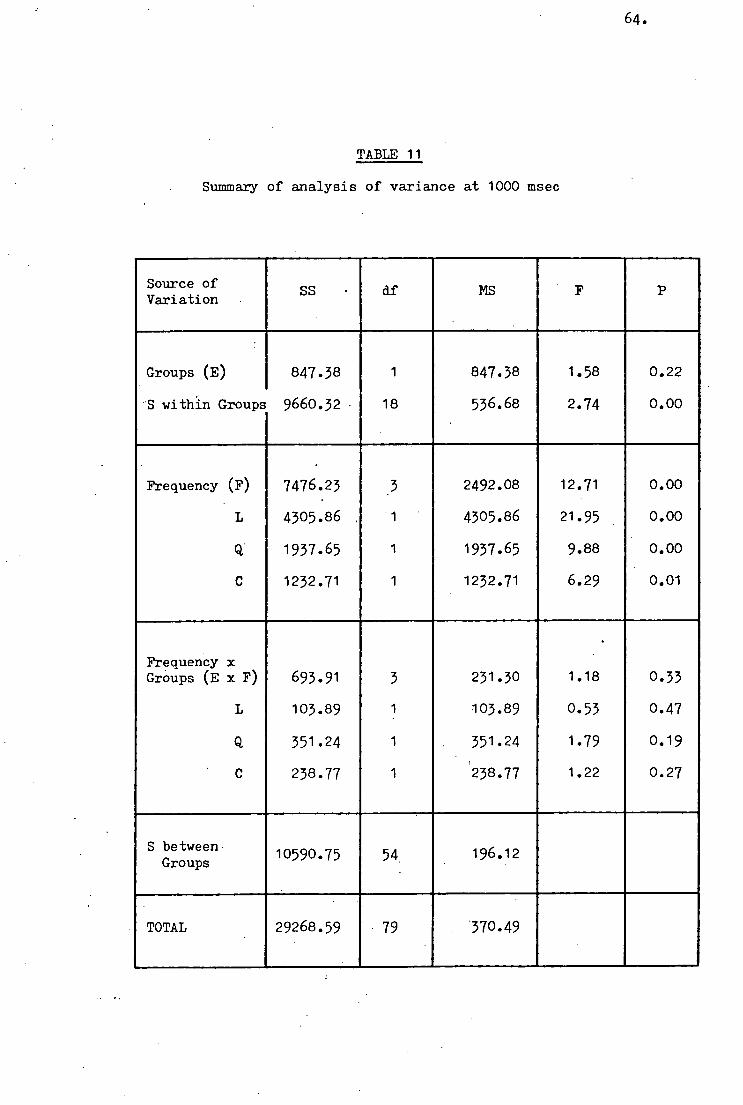
TABLE 11
Summary of analysis of variance at 1000 msec
Source of Variation
SS • df MS F P
Groups (E) 847.38 1 847.38 1.58 0.22
S within Groups 9660.32 18 536.68 2.74 0.00
Frequency (F) 7476.23 3 2492.08 12.71 0.00
L 4305.86 1 4305.86 21.95 0.00
Q 1937.65 1 1937.65 9.88 0.00
C 1232.71 1 1232.71 6.29 0.01
Frequency x Groups (E x P) 693.91 3 231.30 1.18 0.33
L 103.89 1 103.89 0.53 0.47
Q 351.24 1 351.24 1.79 0.19
C 238.77 1 238.77 1.22 0.27
S between Groups 10590.75 54 196.12
TOTAL 29268.59 79 370.49
64.
65.
In the individual analyses at the nine durations, while a main
effect of groups has not generally been found, examination of Fig.7
reveals consistent trends towards differences, which were frequently
significant.
Sensitivity was lower for SRD's at all spatial frequencies
except 16 c/deg, and at all stimulus durations. Only 2 of the 72
data points (16 c/deg at 200 msec & 500 msec respectively) showed
marginally greater sensitivity in SRD's when compared with controls.
The trend towards lower sensitivity was not, however, equally marked
in the remaining three spatial frequencies, and the differential
effects of spatial frequency on contrast sensitivity can be seen
in the different shapes of the functions provided by SRD and control
data in Fig.7.
It is clear. that there was a spatial frequency Selective diff-
erence. At 16 c/deg there was no difference at all. At 12 and 2
c/deg there were greater differences, and at each of these spatial.
frequencies, sensitivity was significantly lower at one of the nine
'stimulus durations. These results must be viewed with caution,
because in a large number of comparisons, chance effects can not be
ruled out.
However, at 4 c/deg the lower sensitivity of SRD's was clear
and consistent. reaching significance at seven of the nine stimulus
durations tested, and approaching significance at the remaining two.
The overall difference in sensitivity, as well as being spatial
frequency-specific, was more apparent at some durations. While fun-
ctions in both groups clearly changed from linear to quadratic with
increasing durations, this change occured at longer stimulus durations
for SRD's than for controls. The quadratic function, apparent in

66.
controls at 150 msec, was not clearly seen in SRD s till 1000 msec.
This is shown by the interaction of the quadratic component in the
orthogonal analysis, which, at durations from 150 ,500 mSec,'Is
either at or near significance. These results reflect the tendency
in controls towards a quadratiejunction with.peak Sensitivity at
4 c/deg, while'SRD's showed a persisting linear . fUnction. Linear
decrease of sensitivity with increasing spatial .frequency in SRD's
was evident at all durations except the longest.
3.8 Summary
The trend towards a significant interaction between CD as a
function of spatial frequency and, gOupS is supported by the signi-
ficance.reached by Duhcari's, showing that cp for controls but not
for SRD's increases with Spatial frequency. The analysis of indivi,:
dual regression . coefficients provides further support for the cOn-
tention that spatial frequency is exerting a differential effect on,:
controls and SRD's although the failure of group tests to shOw .
significance means that these results are to be viewed with caution.
Marked differences have been shown in the CSF of SRD's when
compared with controls. These take the form of differences in the
-shape of functions, especially at intermediate durations, the latter
corresponding closely to reported estimates of the duration of a
single fixation (Haber & Hershenson, 1973). Far SRD' s it is likely
that fixation duration is longer than for normal readers (Griffin,
Walton & Ives, 1974). The most consistent difference was at 4 c/deg;
hence there is A Clear conclusion of spatial frequency-selective
loss in sensitivity.
CHAPTER 4.
DISCUSSION •
Page
4.1 Control data and previous research • • • • 68
4.2 SRD — control differences 70
4.3 Implications, for reading • • • • • • • • 79
4.4 Possibilities for treatment 81
67.

6s.
This chapter begins with a discussion of the results in
terms of similarity to other research; an integration of the present
results, with the research on SRD and early visual information pro-
cessing, is then presented. The concluding interpretation is offered.
The implications for the reading process, and2for the amelioration of
SRD, are raised.
4.1 Control data and previous research
An important yardstick to the general validity of these results,
in terms of accurate calibration of equipment, relative constancy of
conditions, and consistency of testing, is the similarity of control
data to previously found data on normal S's.
While there is a certain amount of noise in the data from con-
trols, as has been mentioned, in general the findings agree well with
earlier published research, in the following areas:
a) Critical duration increases linearly with spatial fre-
quency. Legge's (1978) data on CD may be replotted in
the manner described by Bowling, Lovegrove and
Mapperson (1979). A linear function with a slope of
11.1 is obtained; in the present study, the straight
line fitted to control data on mean CD as a function
of spatial frequency has a similar slope at 10.3.
The data points themselves correspond reasonably well;
. the only identical spatial frequency Legge . has used is
12 c/deg., where a CD of 215 msec. is reported, and
the present study finds a CD of 221 msec. Breitmeyer
and Ganz. 's (1977) similar finding of an increase in
CD with spatial frequency is replicated, though their
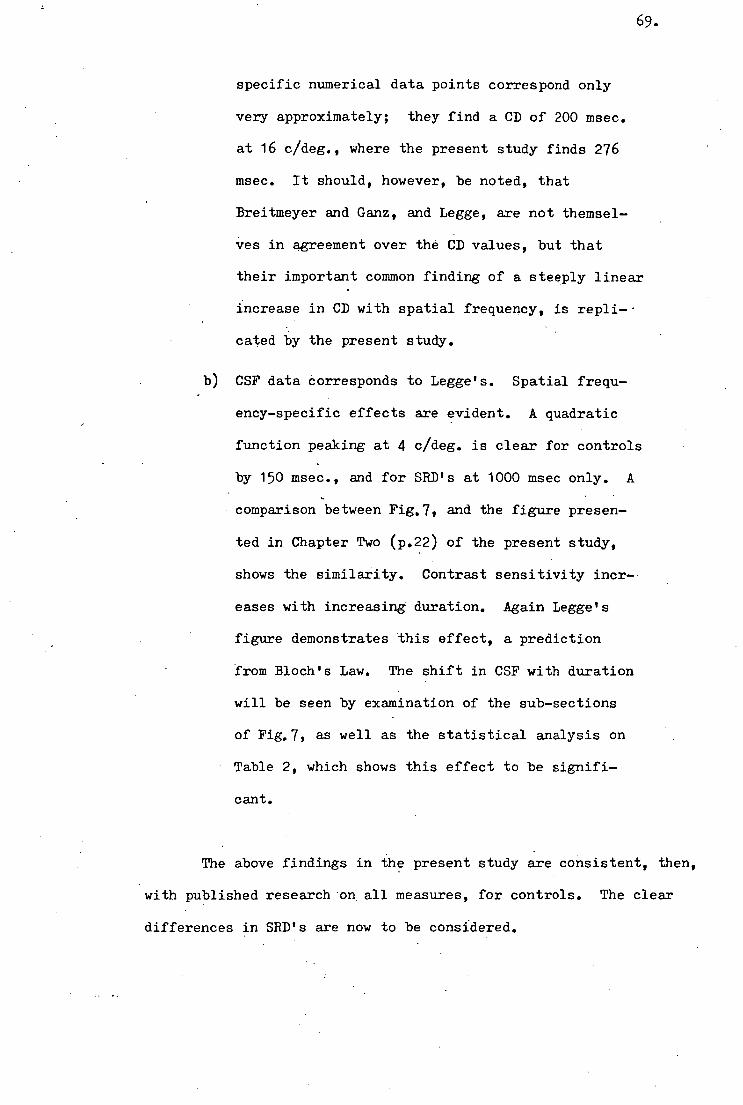
69.
specific numerical data points correspond only
very .approximately; they find a CD of 200 msec.
at 16 c/deg., where the present study finds 276
msec. It should, however, be noted, that
Breitmeyer and Ganz, and Legge, are not themsel-
ves in agreement over the CD values, but that
their important common finding of a steeply linear
increase in CD with spatial frequency, is repli-
cated by the present study.
b) CSF data corresponds to Legge's. Spatial frequ-
ency-specific effects are evident. A quadratic
function peaking at 4 c/deg. is clear for controls
by 150 msec., and for SRD's at 1000 msec only. A
• comparison between Fig.7, and the figure presen-
ted in Chapter Two (p.22) of the present study,
shows the similarity. Contrast sensitivity incr-
eases with increasing duration. Again Legge's
figure demonstrates this effect, a prediction
from Bloch's Law. The shift in CSF with duration
will be seen by examination of the sub-sections
of Fig.7, as well as the statistical analysis on
Table 2, which shows this effect to be signifi-
cant.
The above findings in the present study are consistent, then,
with published research . on all measures, for controls. The clear
differences in SRD's are now to be considered.
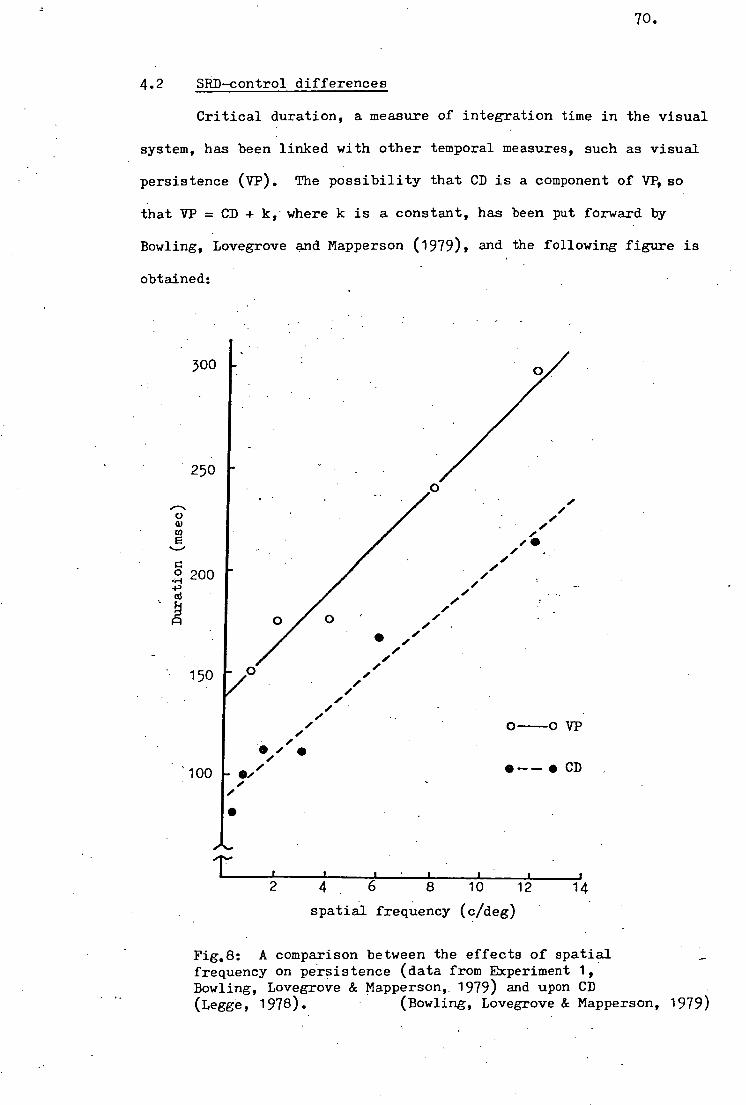
70.
4.2 SRD-control differences
Critical, duration, a measure of integration time in the visual
system, has been linked with other temporal measures, such as visual
persistence (VP). The possibility that CD is a component of VP, so
that VP = CD + k,• where k is a constant, has been put forward by
Bowling, Lovegrove and Mapperson (1979), and the following figure is
obtained:
2 4 6 8 10 12 14
spatial frequency (cideg)
Fig.8: A comparison between the effects of spatial frequency on persistence (data from Experiment 1, Bowling, Lovegrove & Mapperson,. 1979) and upon CD (Legge, 1978). (Bowling, Lovegrove & Mapperson, 1979)
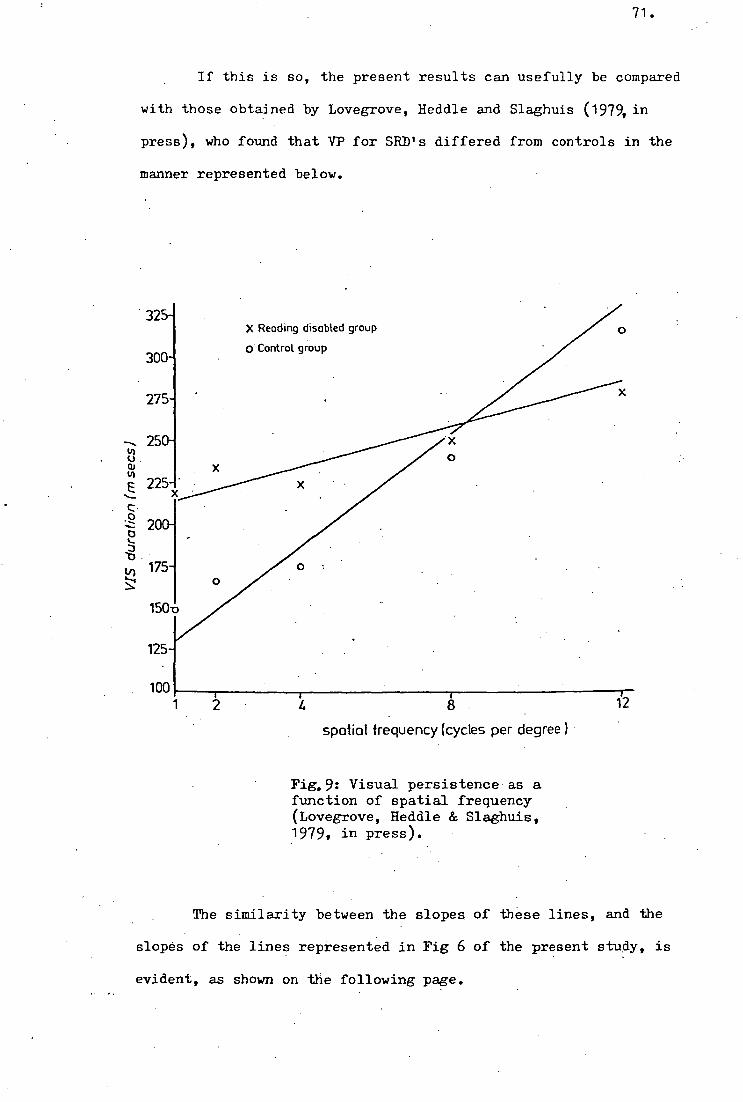
71.
If this is so, the present results can usefully be compared
with those obtained by Lovegrove, Heddle and Slaghuis (1979, in
press), who found that VP for SRD's differed from controls in the
manner represented below.
32
300
275
X Reading disabled group
0 Control group
25
E225 1 x x
200-
t,) 175-
150.o
125-
1 00
1'2
spatial frequency (cycles per degree )
Fig. 9: Visual persistence as a function of spatial frequency (Lovegrove, Heddle & Slaghuis, 1979, in press).
The similarity between the slopes of these lines, and the
slopes of the lines represented in Fig 6 of the present study, is
evident, as shown on the following page.
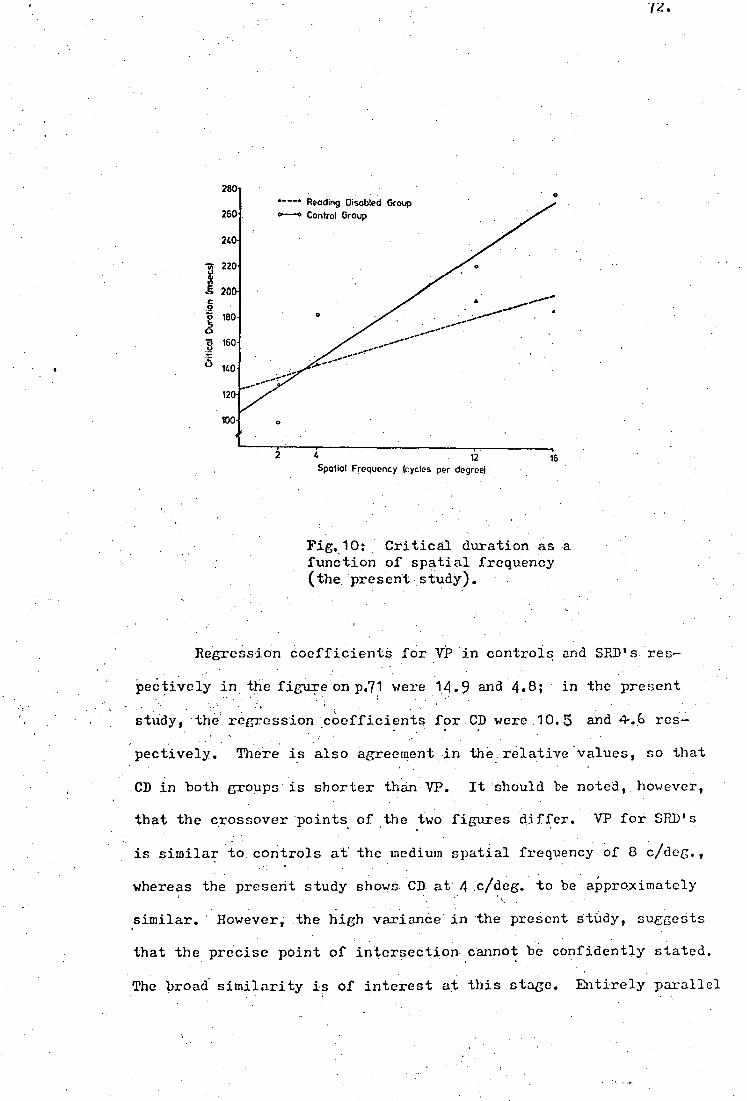
180
220
fit
T, 160
• 140
280
. . Reading Disabled Group
260 *---o Control Group
240
120
100
4 12 Spatial Frequency (cycles per degree)
16
••••■
••••,,,,,,•••••••••••••••
■•••■•■•■•
Fig. 10: Critical duration as a function of spatial frequency (the present study).
Regression Coefficients for VP in controls and SRD's.res-
pectively in the figure on p.71 were 14.9 and 4.6,. in the present
study, 'the regression coefficients'for CD were 10.5 and 4.6 res-
pectively. There is also agreement in the.relative values, so that
.CD in both groups is shorter than VP. - It should be noted however,
that the crossover 'points of the two figures differ. VP for SED's
is similar to. controls at the medium spatial frequency of 8 c/deg.,
whereas the present study shows. CD. at'4 .c/deg. to be ai)proximately
similar.' However Abe high variance in the present StUdy, suggests
that the precise point of intersection, cannot be confidently stated.
The broad similarity is of interest at this stage. Entirely parallel
le •

73.
results would be rather surprising, considering the differences
of age of S's in the earlier study, as well as such factors as
different equiPment and test conditions.
It has been argued (Lovegrove, Heddle & Slaghuis, 1978)
that the persistence data reflects abnormality in the visual infor-
mation processing channels with respect to spatial frequency. The
present results, in the'light of the possible dependence Of VP on
CD proposed by Bowling et al., suggests that these abnormalities
may be produced by CD differences, as a more basic index of visual'
temporal processing, and that VP differences represent almost
parallel findings to those of the present Study, the latter being
at a more fundamental level.
It would appear that SRD's integrate the lbw spatial frequency
of 2 c/deg. more slowly than do controls, with no difference at
slightly higher spatial frequency (4 c/deg.), and that integration
time at the high spatial frequencies (12 and 16 c/deg.) is shorter. The 1 .
absence of a signifiCant group-frequency interaction, however, shows
that these differences between SRD'S and controls can only be
regarded as trends.
If this similarity between the. CD data and the VP data can
be interpreted as showing some sort of Parallel functioning, then
the conclusion of the present study reiterates and strengthens the
Argument -put forward by Lovegrove, Heddle and Slaghuis (1979, in
press) that there are "differences between the two groups, but, More
importantly that these differences vary in a complex Way with
the spatial frequency of the stimuli involved". SRD's show differ-
ent temporal -patterns of. spatial frequency processing, so that the
expected inter-relationships do not apply. The effect such processing
74.
differences might have on reading will be considered in a later
section of this chapter.
The properties of transient and sustained channels have been
discussed in Chapter Two. The predictions arising from those prop-
erties, as outlined by Breitmeyer and Ganz (1977), and Legge (1978),
are that lower spatial freqUencies will produce shorter CD's, as a
reflection of greater transient activity, with higher spatial fie-
quencieS, involving mainly sustained activity v prodUcing longer CD's.
The control data from the present study are consistent with these
predictions. For SRD'S, however, the increase in CD'With spatial
frequency is not significant and this may reflect a different
relative proportion of sustained and transient cells with respect
to spatial frequency response. Overall although the CD's are
shorter, they are not significantly so and an inference of greater
transient activity throughout cannot be made; the pattern of CD
with spatial frequency shows this. It would seem from examination
of Fig, 6, that sustained and transient activity may be occurring
in approximately similar proportions at all spatial frequencies,
so that unusually high sustained or weak transient activity is raising
, the CD at low spatial frequencies, and the. converse, with high tran-
sient activity or weak sustained, continuing to operate at high .
spatial frequencies. This possibility is offered With caution, as
it is yet to be tested directly. The interpretation presented in
the preceding section, which implies a difference in spatial fre
. quency'channels,may be made with some confidence.
It is noticeable that the shape of the CSF curve in SRDIs
differs from controls in terms of the quadratic component at inter-
' mediate durations (150 to 1000 msec.) The analysis of variance
75.
shows that these differences are either at (p1(0.05) or near (p <0.10)
significance. These stimulus durations are similar to fixation dura-
tions, and the specific implications for reading will be discussed in
a later section of this chapter.
Findings on the CSF in patients with cerebral lesions in the
visual pathways have been reported by Bodis-Wollner (1972). The
following findings are of interest to the present results for SRD's,
seen in Fig 7. Bodis-Wollner reports :
i) A generally reduced CSF in those patients when
'compared to normals.
ii) Selective spatial frequency loss; some patients
showed greater mid-frequency loss, and others
more marked high-frequency loss.
iii) Failure to "peak" at 4 c/deg. This failure to
peak was more marked in the early stages of
.recovery, and gradually ameliorated, though
failing to reach normal contrast sensitivity
even after 6 weeks.
The figure may be seen on the following page. Patient 1
represents the preponderance of patients tested.
The similarity with the present findings may be noted in all
three of the above respects, at intermediate durations, which corr-
espond to fixation durations. In SRD's it is. likely that these are
longer than in normal readers, (Griffin, Walton & Ives, 1974). This
accommodates the present findings,which persist to 500 msec.
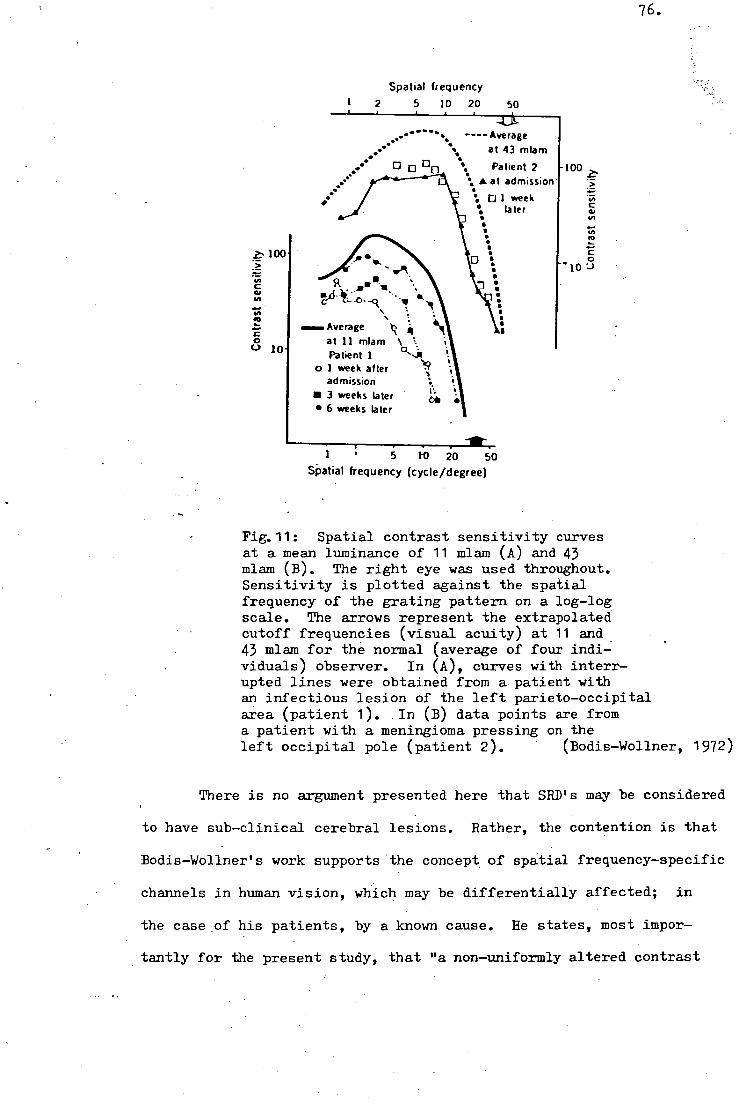
76.
Spatial frequency
1 2 5 10 20 50
••••
444 ----Average
at 43 mlam . • Patient 2 .. 100 ,,...
es A at admission r--- . .>
; rj llaweterek w
— in C
• in • ..... • in • to • ,_ a • E
0 a. o ft
R ir
Average at at 11 mlam \ Patient 1 ct-411'
o 1 week after admission
r. • 3 weeks later • 6 weeks later
S 1-0 20 50 Spatial frequency (cycle/degree)
Fig.11: Spatial contrast sensitivity curves at a mean luminance of 11 mlam (A) and 43 mlam (B). The right eye was used throughout. Sensitivity is plotted Against the spatial frequency of the grating pattern on a log-log scale. The arrows represent the extrapolated cutoff frequencies (visual acuity) at 11 and 43 mlam for the normal (average of four indi- viduals) observer. In (A), curves with interr-upted lines were obtained from a:patient with an infectious lesion of the left parieto-occipital area (patient 1). In (B) data points are from a patient with a meningioma pressing on the
left occipital pole (patient 2). (Bodis-Wollner, 1972)
There is no argument presented here that SRD's may be considered
to have sub-clinical cerebral lesions. Rather, the contention is that
Bodis-Wollner's work supports 'the concept, of spatial frequency-specific
channels in human vision, which may be differentially affected; in
the case of his patients, by a known cause. Be states, most impor-
tantly for the present study, that "a non-uniformly altered contrast

77.
sensitivity would pose a greater difficulty in pattern recog-
nitiOn than a simple drop in visual acuity" (p. 770), because, he
argues, in supra-threshold . conditions, an invariate neural repre-
sentation of the retinal image depends on the proper balance of
signals. It is apparent from, the CSF data in the present study
that SRD's have non-uniformly different CSF ,in similar directions
to those reported by Bodis=Wollner, and his prediction of difficulty
in pattern recognition may be regarded as symptomatic of this find-
ing. In SRD's, such difficulties, less gross than those of
Bodis-Wollner's patients, may be represented by reading disability..
as the most accessible measure. This will be considered in more
detail later.
The CSF data leads clearly to the conclusion that the spatial
frequency-specific channels in the visual pathways of SRD's, given
normal acuity, differ significantly from controls.
Theories accounting for perceptual •eficit in SRD's have been
considered in detail In Chapter One. It is proposed:now to examine
briefly the present results in the light of some of these theories.
The present study adds evidence to the proposition that visual
perceptual deficits are present, on Very basic measures, in SRD
children. As such, it is entirely, in disagreement with Vellutino
(1977), who claims that frank visual perceptual deficits do. not
exist, and that any defiait derives primarily from verbal deficit.
Of the Studies supporting a perceptual deficit, th'Ose support-
ing the notion of a developmental lag (Satz, Rardin & Ross, 1971;
Lyle & Goyen, 1975) have argued that visual perceptual deficit is'
present only in younger children, and that these deficits disappear
with age. The present results are not consistent with such an

78.
interpretation, for two main reasons:
The children tested had an average age of 14.1 years.
It seems unlikely that a developmental lag
hypothesis can accommodate such relatively
mature children although it remains possible
that the "lag" persists into adolescence. .
More importantly, the CSF results t and to a lesser
• . extent, the CD'results,suggest qualitative, rather
than quantitative , The CSF data
would SUggest that "maturing" would need to occur
differentially across spatial frequency channels,
so that the normal peak at 4 c/deg. Would be
acquired. Such a proposition seems implausible.
- In the present data on CD, a developmental lag
hypothesis would demand the prediction that matur-
ing would occur in two ways: a decrease in inte-
gration time, at low spatial frequencies, and an
increase in integration time, at high spatial fre-
quency. This would bring Mt and control data
into line. Again, this seems an unlikely eventu-
ality.
The work•of Stanley and Hall (1973a; 1973b), indicating a
memory deficit, has links with the Present study, in view of recently
published research (Tieger & Ganz, 1979) which suggests that visual
memory itself may also be spatial frequency-specific. It is not
inconceivable that parallel findings to the present results could
occur at the level of memory, and this would bear. investigation.
This remains speculative and the consistency of the present study.
79.
with the work of Stanley and Hall cannot really be assessed, because
that.research examined sequential processing, and the present
results rely on single stimulus presentation only. Although diff-
erent functions are clearly being measured, spatio-temporal abili-
ties underlie both areas of research, and differences are found
between SRD's and controls.
4.3 IMplieationt for. reading
There are a number of ways in which the present results may
contribute to reading disability, particularly when considered in
conjunction with VP data. A recent model suggests that low Spatial
frequency channels rapidly transmit general information to the visual
cortex. Detail is considered to be added later by the slower trans-
mitting high spatial frequency channels (Breitmeyer & Ganz, 1976).
In these terms the longer periods of temporal integration
with increasing spatial frequenCy permit processing to occur as a
series of successive approximations with detailed discriminations
(based on high frequency information) requiring more time than
general discriminations (based on low frequency information): Suoh
a view implies that perception proceeds in a global-t6-local manner. -
Recent evidence SuggestsAhat this, indeed, is the case (Navon, 1977).
The control data reported here indicate that integration of increas-
ing spatial fre4uencies does occur sequentially in normal readers.
The lack Of increase in critical duration with increasing spatial
'frequency in disabled readers would tend to decrease the extent to which
information is integrated sequentially, possibly creating difficulties
in word recognition..
A related way in which the differences in increase of integration
times between normals and SRD's may Contribute to reading disability

80.
concerns visual information processing in central and peripheral
vision. It is suggested that in normal readers the shorter inte-
gration times of the low frequency channels which predominate in
peripheral vision (Enroth-Cugell & Robson, 1966; Campbell, Cooper
& Enroth-Cugell, 1969) would facilitate rapid processing of peri-
pheral information and serve a role in visual guidance (Breitmeyer
& Ganz, 1976).
In disabled readers, however, this would not occur to . the same
extent, as their integration times for low spatial frequencies do not
differ significantly from their integration times for medium spatial
frequencies. Such a problem is suggested by studies where interfer-
ence with or removal of peripheral information disrupts the normal
reading process (McConkie, 1976).
Bodis-Wollner's (1972) findings lead to further confidence in
the claim that selective spatial frequency sensitivity loss can be
expected to produce pattern perception and reading difficulties. The
similarity with SRD's at intermediate durations has already been dis-
cussed.
The analysis presented here would indicate that disabled readers
should experience a general visual deficit on many tasks requiring
temporal integration. Reading should only be one manifestation of the
problem, albeit the most often measured one. Such a conclusion is
strongly supported by a recent study (Rosewarne, 1978, unpub.), requir-
ing subjects to identify pictorial and verbal material moved behind a
stationary slit in the manner initially used by Parks (1965). Disabled
readers had more difficulty than controls with all sorts of stimuli
indicating a:general deficit in spatio-temporal integration: It is
possible that the differences reported here underlie such difficulties.

81.
Finally the analysis presented here suggests that the diff-
erences between disabled readers and controls would produce relat-
ively few problems on tasks involving only central viewing and
single fixations, which have often been studied (Vellutino, 1977)
in reading disability. Problems would arise primarily with tasks
requiring integration of successive fixations, involving central and
peripheral visual information processing. Reading, of course, is such
a task.
4.4 Possibilities for treatment
The concept of spatial frequency-specific deficits has only
recently been established, and for that reason treatment possibilities
are in the very early stages. Bodis-Wollner's (1972) findings, for
example, act as evidence for spatial frequency-specific deficit, with-
out suggesting treatment implications; his patients improved through
medical intervention, such as drugs. However, the plasticity of the
mammalian visual cortex, and the reversible effects of selective
deprivation of various stimuli (Dews & Wiesel, 1970; Mitchell,
Millidot, & Heagstrom, 1973) would suggest that deficits in CSF may
be remediated. Such a finding is reported by Banks, Campbell, Hess
and Watson (1978), who treated amblyopia by using high contrast
square-wave rotating discs. The children treated over short periods
of time on a regular basis with this method, showed improved visual
acuity, and, more importantly for the present study, improved con-
trast sensitivity function. The present results indicate that at
4 c/deg. SRD children show the most striking deficit; it would seem
worth-while to investigate the effect of exposure to the method of
Banks et al, using high contrast gratings at that spatial frequency.
However, this possibility must be qualified by the fact that whereas

82.
the visual perceptual origins of amblyopia are known to be lack of
stimulation, the basis of spatial frequency—specific processing
differences in SRD is far less clearly understood. The earlier
suggestion in this chapter, that a deficit in the processing of
peripheral stimuli may be involved in SRD, leads also to treatment
possibilities; improved performance'as a result of practice and
feed—back with motion discrimination (Johnson & Leibowitz, 1974),
and acuity discrimination (Saugstad & Lie, 1964) in peripheral
'vision, have been reported.
Such methods have the advantage of being unconnected with the
reading task, and use general stimuli with no educational overtones.
The reading task itself represents a source of frustration, and of
experience of failure, for children with specific reading disability.

REFERENCES
83.
84.
Banks, R.V., Campbell, F.W., Hess, R., and Watson, P.G. ."A New Treatment for Amblyopia", British Orthoptical Journal, 1978, 35, 1.
Birch, Herbert and Belmont, Lillian, "Auditory-visual Integration in Norm-al and Retarded Readers", American Journal of Ortho-psychiatry, 1964, 34, 852-861.
Blank, M., and Bridger, W.H., "Deficiencies in Verbal Labelling in Retarded Readers", American Journal of Orthopsychiatry, 1966, 36, 840-847.
Bodis-Wollner, Ivan, "Visual Acuity and Contrast Sensitivity in Patients with Cerebral Lesions", Science, 17 Nov. 1972, 769-771.
Bowling, A. Lovegrove, W., and Mapperson, B., "The Effect of Spatial Frequency and Contrast on Visual Persistence", Perception, 1979, 8, 529-539.
.Breitmeyer, Bruno G., "Simple Reaction Time as a measure of the Temp-oral Response Properties of Transient and Sustained Channels", Vision Research, 1975, 15, 1411-1412.
Breitmeyer, Bruno G., and Ganz, Leo, "Implications of Sustained and Transient Channels for Theories of Visual Pattern Mask-ing, Saccadic Suppression, and Information Processing", Psychological Review, Jan. 1976, 83, 1, 1 -35.
Breitmeyer, Bruno G., and Ganz, Leo, "Temporal Studies with Masked Gratings: Inferences about Human Transient and Sus-tamed Channels", Vision Research, 1977, 17, 861-865.
Bryden, M.P., "Auditory-Visual and Sequential-Spatial Matching in Relation to Reading Ability", Child Development, 1972, 43, 824-832.
Butters, N., and Brody, B.A., "The Role of the Left Parietal Lobe in the Mediation of Intra and Cross-modal Associations", Cortex, 1968, 4, 328-343.
Campbell, Fergus, "The Transmission of Spatial Information Through the Visual System", in Schmitt, F.O., and Worden, F.G. (eds.) MIT, The Neurosciences, Cambridge, 1974.
Campbell, F.W., Cooper, G.F. and Enroth-Cugell, C., "The Spatial Selec-tivity of the Visual Cells of the Cat". Journal of Physiology, 1969, 203, 223-235.
Campbell, F.W., Cooper G.F., Robson, J.G. and Bachs, N.B., "The Spatial Selectivity of Visual Cells of the Cat and the Squirrel Monkey", Journal of Physiology (Lond.), 1969, 204, 120- 121.
Campbell, F.W., and Kulikowski, J.J., "Orientational Selectivity of the 'Human Visual System", Journal of Physiology (Lond.), 1966, 187, 437-445.
85.
Cleland, B.G., Dubin, M.W. and Levick, W.R., "Sustained and Transient Neurones in the Cat's Retina and LGN", Journal of Physiology, 1971, 217, 473-496.
Clifton-Everest, I.M., "The Immediate Recognition of Tachistoscopically Presented Visual Patterns by Backward Readers", Genetic Psychology Monographs, 1977, 89, 221 -239.
Clifton-Everest, I.M., "Dyslexia: Is there a Disorder of Visual Per-ception?" Neuropsychologia, 1976, 14, 491 -494.
Congal ton,
Cornsweet,
Critchley,
A.A., "Occupational Status in Australia", Studies in Socio-logy, 3, University of N.S.W., Kensington N.S.W., 1963.
Tom N., Visual Perception, Academic Press, N.Y., 1970.
McDonald, The Dyslexic Child, Thomas Springfield, Illinois, 1970.
Critchley, McDonald, Developmental Dyslexia, William Heinemann Medical Books Ltd., London 1964.
Dechant, Emerald, Detection and Correction of Reading Difficulties, Meredith, N.Y., 1971.
Deutsch, D., and Deutsch, J.A., Short Term Memory, Academic Press, 1975.
Dews, P.B. and Wie§el, T.N. "Consequences of Monocular Deprivation on Visual Behaviour in Kittens". Journal of Physiology, 1970, 206, 437-455.
Enroth-Cugell, C., and Robson, J.G., "The Contrast Sensitivity of Retinal Ganglion Cells of the Cat", Journal of Physiology (Lond.), 1966, 187, 517-552..
Esson, T.H., "The Reaction of Parents to Reading Failure", Proceedings, Dyslexia Symposium, Melbourne 1967.
Fletcher, J.M., and Satz, Paul, "Unitary Deficit Hypotheses of Reading Disability: has Vellutino led us astray?" Journal of Learning Disabilities, 1979, Vol. 12, 3.
Frostig, M., The Marianne Frostig Developmental Test of Visual Per-ception, Palo Alto, California, Psychological Press, 1961.
Gardner, Howard, '!Developmental Dyslexia: the Forgotten Lesson of Monsieur CP„ Psychology Today, Aug. 1973, 63 -67.
Griffin, D.C., Walton, H.N. and Ives, V., "Saccades as Related to Read-ing Disorders", Journal of Learning Disabilities, 1974 7, 5, 310-316.
Haber, R.N. and Hershenson, M., The Psychology of Visual Perception, . Holt, Rinehart and Winston, N.Y., 1973.
Hepworth, T.S., Dyslexia: The Problems of Reading Retardation, Angus and Robertson, Sydney, 1971.
86.
Houlihan, K., and Sekuler, R., "Contour Interactions in Visual Mask- ing, Journal of Experimental Psychology, 1968, 77, 281-285
Hurvish, Leo M., and Jameson, Dorothea, The Perception of Brightness and Darkness, Allyn and Bacon Inc., Boston, 1966.
Johnson, C.A. and Leibowitz, H.W. "Practice, refractive error, and feed-back as factors influencing peripheral motion thresholds." Perception and Psychophysics, 1974, 15, 276 -280.
Kirk, S.A. and McCarthy, J.J., The Illinois T est of PsyCholinguistic Abilities, Urbana, University of Illinois Press, 1968.
Kolers, Paul A., "Pattern . Analysing Disability in Poor Reader's", Devel- opmental Psychology, 1975, 11, 3, 282-290.
Kulikowski, J.J. and Tolhurst, D.J. "Psychophysical Evidence for Sus-tained and Transient Detectors in Human Vision", Journal of Physiology (Lond.), 1975, 232, 149-162.
Legge, Gordon E., "Sustained and Transient Mechanisms in Human Vision: Temporal and Spatial Properties", Vision Research, 1978, 18, 69-81,
Lovegrove,
Lovegrove,
W.J. "Spatial Frequency Sensitivity and Reading Disability", (unpub.) 1978, University of Tasmania.
W., Billing G. and Slaghuis, W., "Processing of Visual Con-tour Orientation Information in Normal and Disabled Reading Children", Cortex, xiv, 1978, 208-278.
Lovegrove, William and Brown, Christina, "Development of Information Processing in Normal and Disabled Readers", Perceptual and Motor Skills, 1978, 46, 1047 -1054.
Lovegrove, W., Heddle, M., and Slaghuis, W. "Reading Disability: Spatial Frequency Specific Deficits in Visual Infor-mation Store", Cortex, in press, 1979.
Lupp, U., Hauske, G. and Wolff,. W. "Perceptual Latencies to Sinusoidal Gratings", Vision Research, 1976, 16, 969 -972.
Lyle, J.G.
Malmquist
and Goyen, Judith, "Effect of Speed of Exposure and diff- iculty of Discrimination on Visual Recognition of
' Retarded Readers", Journal of Abnormal Psychology, 84_,. 6, 673-676.
E., Reading Disabilities, Amqvist and Wiksell, Stockho]. 1958.
McConkie, G.W. "The use of Eye Movement Data in Determining the Per-ceptual Span in Reading". In R.A. Monty and J.W. Senderr (Eds.), Eye Movements and Psychological Processes, 1976, Hillsdale, N.J., Erlbaum.
Meyer, Glenn and Maguire, William, "Spatial Frequency and the Mediation of short-term Visual Storage", Science, Nov. 1977, 198.

87.
Mitchell, D.E., Freeman, R. and Millidot, M. and Haegstrom G., "Meridional Amblyopia: Evidence fOr Modification of the Human Visual System by Early Visual Experience". Vision Research, 1973, 13, 535 -558.
Navon, David, "Forest Before Trees: The Precedence of Global Features in Visual Perception" Cognitive Psychology, 1977, 9, 353-383.
Neale, Marie, The Neale Analysis of Reading Ability, 1966, London, ' MacMillan.
Pantle, A. and Seknler, R. "Size Detecting Mechanisms in Human Vision", Science, 1968, 162, 1146-1148.
Parks, T.E. "Post-retinal Visual Storage", American Journal of Psych-ology, 1965, 78, 145-147.
Preston, Malcolm S., Guthrie, John T., and Childs, Barton. "Visual Evoked Responses (VER's) in Normal and Disabled Readers". Psychophysiology, 1974, 11, 4, 452-247.
Rachman, S., "Learning Theory and Child Psychology: Therapeutic Poss-ibilities", Journal of Child Psychology and Psychiatry, 1962, 3, 149-163.
Rosewarne, Pamela. "Spatio-Temporal Integration of Pictorial and Sym-bOlic Material in Average and Problem Readers". (Unpub-' lished thesis) 1978, Monash University, Melbourne.
Rutter, Michael and Yule, William. "The Concept of Specific Reading Retardation", Journal of Child Psychology and Psychia-la, 1975, 16, 181 -197.
Sachs, LB., Nachmias,. J., and Robson, J.G., "Spatial Frequency Channels. in Human Vision", Journal of the Optical Society of America, 1971, 61, 9.
•Sapir, S.G., and Nitzburg, A.C., Children with Learning Problems: Read-ings in a Development-Interaction Approach, 1973 Brunner-Mazel, N.Y.
Satz, Paul, Rardin, Donald and Ross, John. "An Evaluation of a Theory • of Specific Developmental Dyslexia", Child Development,
1971, 42, 2009-2021.
Saugstad, P., and Lie, I., "Training of Peripheral Visual Acuity", Scandinavian Journal of Psychology, 1964, 5, 218-224.
Schoneil, F.T., The Psychology and Teaching of Reading, Oliver and Boyd, London, 1945.
Sekuler, Robert, "Spatial Vision", Annual Review of Psychology, 1974, • 25, 195-232.
Siegel, Sidney, Non-parametric Statistics for the Behavioural Sciences, McGraw-Hill, Tokyo, 1956.
88.
Staats, A.W.,Learning, Language and Cognition, 1968, Holt, Rhinehart and Winston, N.Y.
Staats, A.W., Brewer, B.A., and Gross, N.C., "Learning and Cognitive Development: Representative Samples, Cumulative Hierarchical Learning, and Experimental Longitudinal Methods", Society for Research in Child Development Monograph, 1970, 35, 8.
Staats, A.W., and Butterfield, W.H., "Treatment of Non-reading in a Culturally Deprived Juvenile Delinquent: An Appli-cation of Reinforcement Principles", Child Development, 1965, 4, 925-942.
Staats, A.W., Minke, K., Finley, J.R., Wolf, M., and Brooks, L.O., "A Reinforcer System and Experimental Procedure for the Laboratory Study of Reading Acquisition", Child Develop-ment, 1964, 35, 209=231.
'Stanley, G.
Stanley, G.
and Hall, R. "Short Term Visual Information Processing in Dyslexics", Child Development, 1973 a, 44, 841 -844.
and Hall, R. "A Comparison of Dyslexics and Normals in Recalling Letter Arrays after Brief Presentation". British Journal of Educational Psychology, 1973 b, 43, 301 -304. •
Tieger, Todd and Ganz, Leo. "Recognition of Faces in the Presence of Two-Dimensional Sinusoidal Masks", Perception and Psycho-physics, 1979, 26, 2, 163-167.
Umansky, John A., and Umansky, Shashanna F., "Parents as Behaviour Therapy-technicians in Treating Reading Deficits", Australian Psychologist, 1976, 11, 3, 305-311.
Vassilev, A., and MitOv, D., "Perception Time and Spatial Frequency", Vision Research, 1976, 16, 89-92.
.Vellutino, P.R., "Has the Perceptual Deficit Hypothesis Led us Astray?" Journal of Learning Disabilities, 1977 a, 10, 6.
Vellutino, P.R., "Alternative Conceptualizations of Dyslexia: Evidence in Support of a Verbal-deficit Hypothesis", Harvard Educational Review, 1977 b, 47, 3.
Vellutino, P.R., "The Validity of Perceptual-deficit Explanations of Reading Disability: . A reply to Fletcher and Satz", Journal of Learning Disabilities, 1979, 12, 3.
Vellutino, P.R., Pruzek, RN., Steger, J.A. and Meshoulam, U., "Immed-iate Visual Recall in Poor and Normal R eaders as a Function of Orthographic-linguistic Familiarity", Cortex, - 1973, 9.
Vellutino, P.R., Smith, H., Steger, J.A. and Kaman, M., "Reading Dis-ability: Age differences and the Perceptual Deficit Hypothesis", Child Development, 1975, 46, 487-493.

89.
Vellutino, F.R., Steger, J.A. and Kandel, G. "Reading Disability: An Investigation of the Perceptual Deficit Hypothesis", Cortex, 1975 b, 8, 106-118.
Vernon, M.D., Backwardness in Reading: A Study of its Nature and Origin, Cambridge, Cambridge University Press, 1957.
Wilson, J.B. "Teddy Bear: Statistical Program", Technical Report T5, Edition 2, Botany Department, University of Otago, N.Z., May 1976.
Witelson, S.F., "Developmental Dyslexia: Two Right Hemispheres and None Left", Science, 1977, 195, 309-311.
Young, F.A ., and Lindsley, D.B. (eds.) Early Experience and Visual Infor-mation Processing in Perceptual and Reading Disorders. National Academy of Sciences, Washington, 1970.

.APPENDICES
90.

APPENDIX 1
Details of subjects: IQ, reading age, chronological age and socio-economic status (n = 20)
Group Experimental
Control
Subject No. d.o.b. IQ R.A. C.A. SES (Congalton) d.o.b. IQ C.A. SES (Congalton)
1 19/ 5/65 100 9.6 14.4 Design Engineer . 1.92 9/ 2/65 92-112 14.7 Design Engineer 1.92
2 19/12/64 115 11.6 14.9 Ganger 6.57 16/ 2/65 111 14.7 Warehouse man 6.57
15/ 6/67 113 8.7 12.3 s.e. bricklayer 4.91 5/ 7/67 111 12.2 Undertaker 5.53
4 4/11/65 88 . 9.0 13:10 Mail Officer 5.52 22/ 4/65 88 14.5 Police Officer 5.07
. 5 ' 8/10/64 72-88 9.4 14.11 Pensioner 14/ 8/64 83-95 15.1 Foreman
6 1/ 4/64 88 7.9 15.5 Motor Mechanic 5.97 17/ 4/64 80-86 15.5 Plasterer 6.22
7 23/ 4/65 114 11.2 14.5 Painter 6.21 3/ 6/65 106 14.3 Builder 4.83
8 22/ 2/67 100 8.9 12.7 Motor Mechanic 5.97 30/ 1/67 99 12.8 Logging Contractor 6.56
9 2/11/64 93 8.1 14.10 Plant Operator 6.66 15/ 9/64 108 15.0 Bricklayer 6.38
10 7/ 2/66 99 9.5 13.7 Toolroom Turner 29/ 8/66 100-107 13.1 Home duties
- x 99 9.4 14.1 100 14.0
Min 7.9 12.3 12.2
Max 11.6 15.5 15.5

APPENDIX 2
Cross randomising of presentation order of spatial frequency and duration
Ex erimental
Control
2 4 12 16 2 4 12 16 Sf
S 1 id 3d 4i 2i •21 1i 3d 4d Order of pres
entat
ion (1
, 2, 3 or 4) and di
rec-ti
on of t
esting at
each sf
(i = i
ncrea
sing d
ur-at
ion ord
er; d . d
ecreasing)
_ 2 4i id 3d 2i 2i 3d 4d
3 2d 4d 2i 1i 3d 1i 2i 4d
4 2d 31 4d 11 2d 4d 1i 31
21 1i 4d 3d 41 id •2d 3d
6 31 2d 4d 1i 2d 3d 41 1i
7 2d 4i 1i 3d 4d 31 11 2d
8 id 21 31 4d 3d 2d 4i 1i
9 41 2d 1i 3d 3d 4i id 2i
10 1i 3i 2d 4d ii 2d 3d 4i
APPENDIX 3
INSTRUCTIONS
When you press this button, just about straight away what
we call a "grating"-will come on the screen. A grating has lines
and spaces, like this (demonstration). But it will.be sometimes
quite hard to see, like this (low contrast).
And sometimes it will not be there at all, even for some-
One with the best eyes in the world (blank). - Every time I want
you to press the button, I will fiddle. with a dial, then say "Now",
and I want you to press the button, and then to say "Yes" or "No"
if you can or cannot see the grating.
So each time you press the button, there might be a grat-
ing, or there might not. You are to say "Yes" if there is, and
"No" if there's not. Is that clear?
Sometimes it will be very hard to decide. I only want you
to say "Yes" if you can actually see lines, not if there is just
•a flicker or a change in the screen but you can't really see lines.
It does not matter at all if you are right or wrong, because
for every person there is a place where you just can't tell the
difference. I want to find exactly where that place is for you.
93.
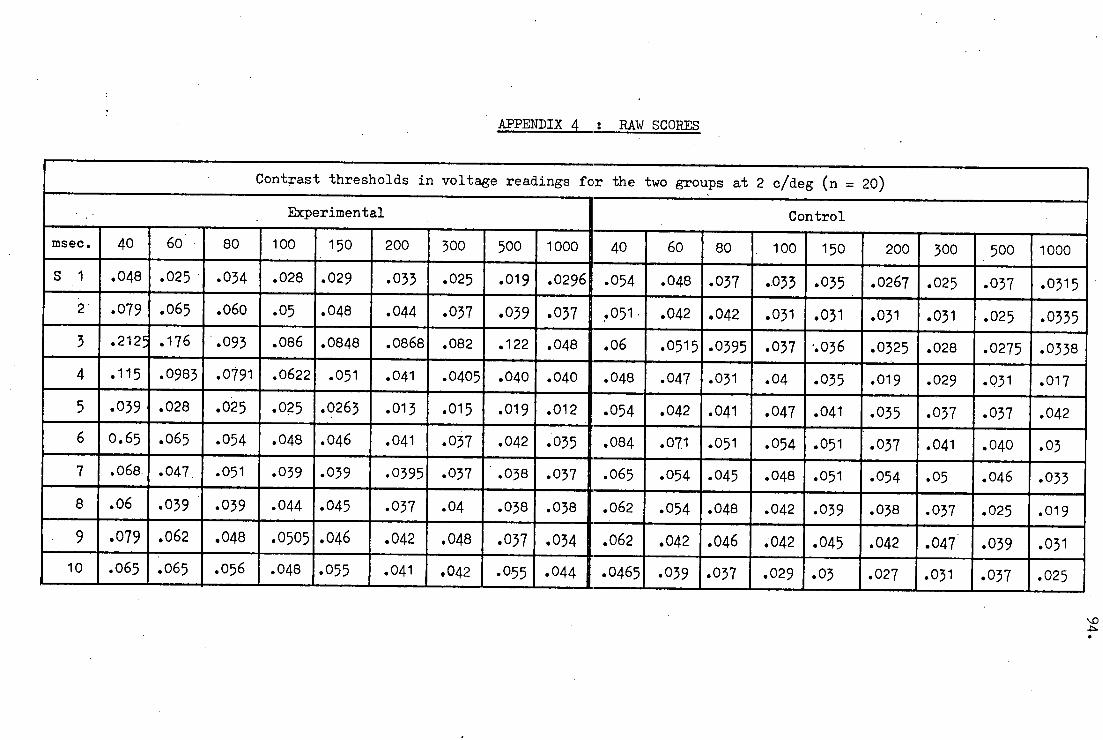
APPENDIX 4 : RAW SCORES
Contrast thresholds in voltage readings for the two groups at 2 c/deg (n . 20)
. Experimental Control
msec. 40 60 80 100 150 200 300 500 1000 40 60 80 100 150 200 300 500 1000
S 1 .048 .025 .034 .028 .029 .033 .025 .019 .0296 .054 .048 .037 .033 .035 .0267 .025 .037 .0315
2 .079 .065 .060 .05 .048 .044 .07 .09 .07 .051. .042 .042 .01 .031 .031 .031 .025 .035
3 .2125 .176 .093 .086 .0848 .0868 .082 .122 .048 .06 .0515 .095 .037 ..06 .0325 .028 .0275 .0338
4 .115 .0983 .0791 .0622 .051 .041 .0405 .040 .040 .048 .047 .031 .04 .035 .019 .029 .031 .017
5 .039 .028 .025 .025 .0263 .013 .015 .019 .012 .054 .042 .041 .047 .041 .035 .037 .037 .042
6 0.65 .065 .054 .048 .046 .041 .07 .042 .05 .084 .071 .051 .054 .051 .07 .041 .040 .03
7 .068 .047 .051 .039 .039 .0395 .037 .08 .07 .065 .054 .045 .048 .051 .054 .05 .046 .033
8 .06 .09 .039 .044 , .045 .037 .04 .038 .038 .062 .034 .048 .042 .039 .038 .037 .025 .019
9 .079 .062 .048 .0505 .046 .042 .048 .037 .034 .062 .042 .046 .042 .045 .042 .047 .039 .031
10 .065 .065 .056 .048 .055 .041 .042 .055 .044 .0465 .039 .037 .029 .0 .027 .01 .07 .025
■D
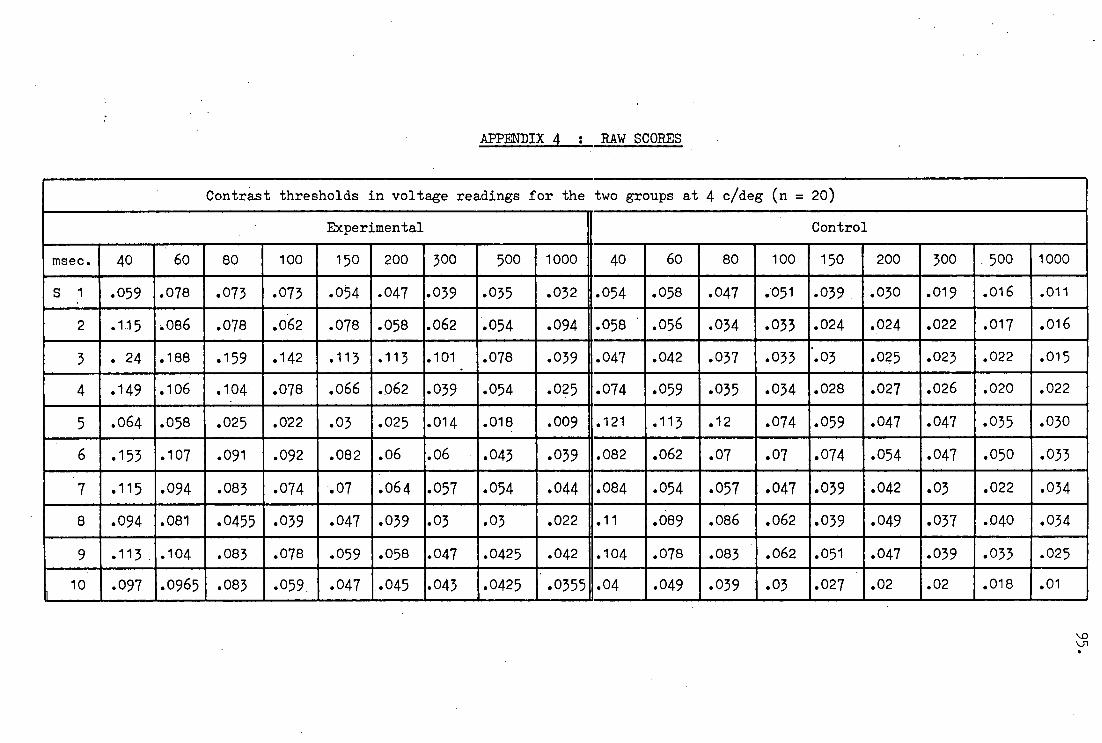
APPENDIX 4 : RAW SCORES
Contrast thresholds in voltage readings for the two groups at 4 c/deg (n . 20)
Experimental Control -
msec. 40 ,
60 80 100 150 200 300 500 1000 40 60 80 100 150 200 300 500 1000
S 1 .059 .078 .073 .073 .054 .047 .039 .035 .032 .054 .058 .047 .051 .039 .030 .019 .016 .011
2 .115 .086 .078 .062 .078 .058 .062 .054 .094 .058 ' .056 .034 .033 .024 .024 .022 .017 .016
3 . 24 .188 .159 .142 .113 .113 .101 . .078 .039 .047
1.074
.121
.042
.059
.113
.037
.035
.12
.033
.034
.074
..03
.028
.059
.025
.027
.047
.023
.026
.047
.022
.020
.035
.015
.022
.030
4 .149 .106 .104 .078 .066 .062 .039 .054 .025
5 .064 .058 .025 .022 .03 .025 .014 .018 .009
6 .153 .107 .091 .092 .082 .06 .06 .043 .039 .082 .062 .07 .07 .074 .054 .047 .050 .033
.115 .094 .083 .074 .07 .064 .057 .054 .044 .084 .054 .057 .047 .039 .042 .03 .022 .034
s .094 .081 .0455 .039 .047 .039 .03 .03 .022 .11 .089 .086 .062 .039 .049 .037 .040 .034 ,
9 .113 .104 .083 .078 .059 .058 .047 .0425 .042 .104 .078 .083 .062 .051 .047 .039 .033 .025
lo J
.097 .0965 .083 .059 .047 .045 .043 .0425 .0355 .04 .049 .039 .03 .027 .02 .02 .018 .01
kJ,
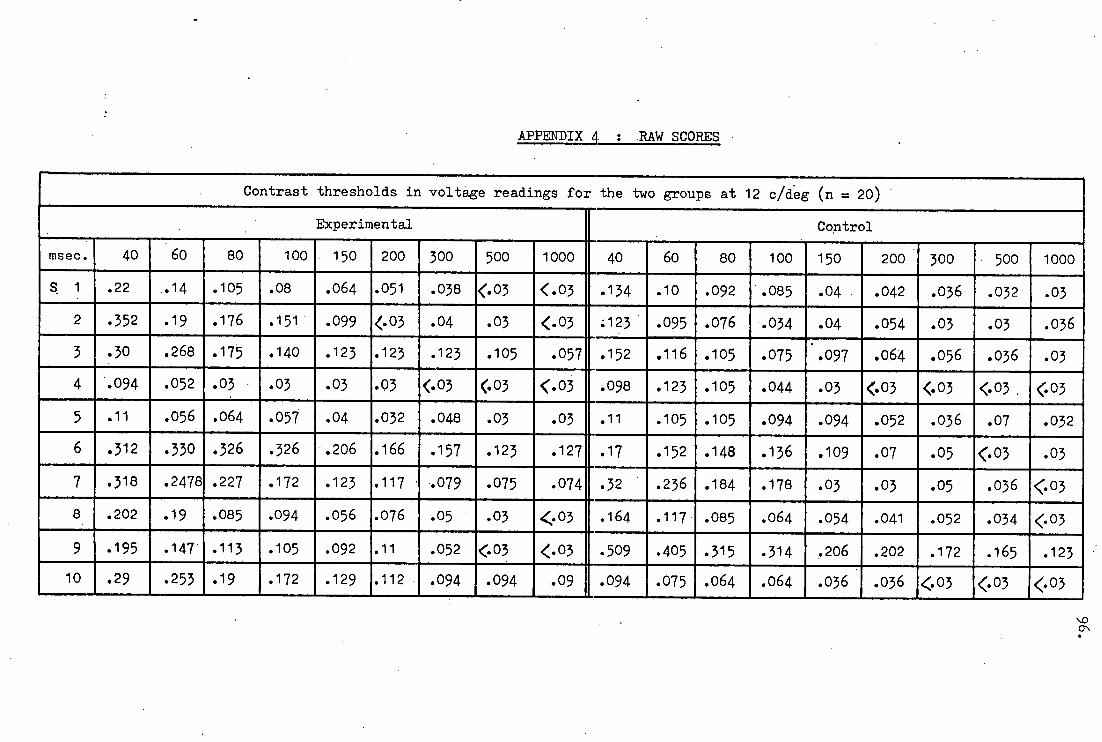
APPENDIX LI : RAW SCORES
Contrast thresholds in voltage readings for the two groups at 12 c/deg (n = 20)
Experimental Control
msec. 40 60 80 100 150 200 300 500 1000 40 60 80 100 150 200 300 500 1000
S. 1 .22 .14 .105 .08 .064 .051 .038 ‹.03 <.03 .134 .10 .092 .085 .04 .042 .036 .032 .03
2 .352 .19 .176 .151 .099 <.03 .04 .03 <.03 ;123 , .095 .076 .034 .04 .054 .03 .03 .036
3 .30 .268 .175 .140 .123 .123 .123 .105 .057 .152 .116 .105 .075 . .097 .064 .056 .036 .03
4 .094 .052 .03 .03 .03 .03 <.03 03 1;.03 .098 .123 .105 .044 .03 ‹.03 <.03 <:03 , <:03
5 .11 .056 .064 .057 .04 .032 .048 .03 .03 .11 .105 .105 .094 .094 .052 .036 .07 .032
6 .312 .330 .326 .326 .206 .166 .157 .123 .127 .17 .152 .148 .136 .109 .07 .05 ‹.03 .03
7 .318 .2478 .227 .172 .123 .117 .079 .075 .074 .32 .236 .184 .178 .03 .03 .05 .036 ‹.03
.202 .19 .085 .094 .056 .076 .05 .03 403 .164 .117 .085 .064 .054 .041 .052 .034 <:03
9 .195 .147 .113 .105 .092 .11 .052 <:03 <.03 .509 .405 .315 .314 .206 .202 .172 .165 .123
10 .29 .253 .19 .172 .129 .112 .094 .094 .09 .094 .075 .064 .064 .036 .036 403 ‹.03 ‹•03

APPENDIX 4 : RAW SCORES
Contrast thresholds in voltage readings for the two groups at 16 c/deg (n = 20)
Experimental Control
msec. 40 60 80 100 150 200 300 500 1000 40 60 80 100 150 200 300 500 1000
.348 .244 .038 .055 .098 .04 .064 .039 <.038 .203 .142 .148 .084 .104 .077 .081 .039 .039
.403 .34 .273 .22 .174 .189 .185 .153 .04 .203 , .192 .157 .19 .137 .088 .12 .12 .104
3 .385 .385 .385 .385 .371 .163 .12 .092 ■
.12 1.388 1 .344 .255 .203 '.28 .21 .112 .102 .092
.396 .325 .228 .22 .132 .142 .104 .12 .088 .133 1
.11 .077 .07 038 .082 038 038 (.038
5 .136 .106 .132 .1.3 .077 .104 .08 .055 .038 I 1.411 .324 .307 .282 .203 .185 .163 .134 .152
6 .369 .354 .391 .413 .34 .246 .163 .22 .211 1 1.23 1
.214 .163 .152 .159 .138 .145 .12 .048
7 .444 .347 , .22 .195 .142 .12 .12 .038 .056 ( .133 .12 .085 .10 038 038 038 038 <,038
8 .192 .216 .144 .12 4038 <.038 <.038 .038 <.038 .466 .311 .211 .211 .211 .081 .081 .055 038
.29 .216 .172 .144 .144 .10 .10 .056 .055 i ! .58 .549 .46 .394 .373 .28 .241 .246 .150
10 .275 .214 .22 .155 .12 .106 .11 .077 .077 .22 .142 .092 .142 .086 .142 .08 .038 <.038

APPENDIX 5
Average miss and False Alarm Rates for the control
group and the SRD's
* Miss Rate False Alarm Rate
Controls
SRD's - .
.176
.164
.079
.061
98.
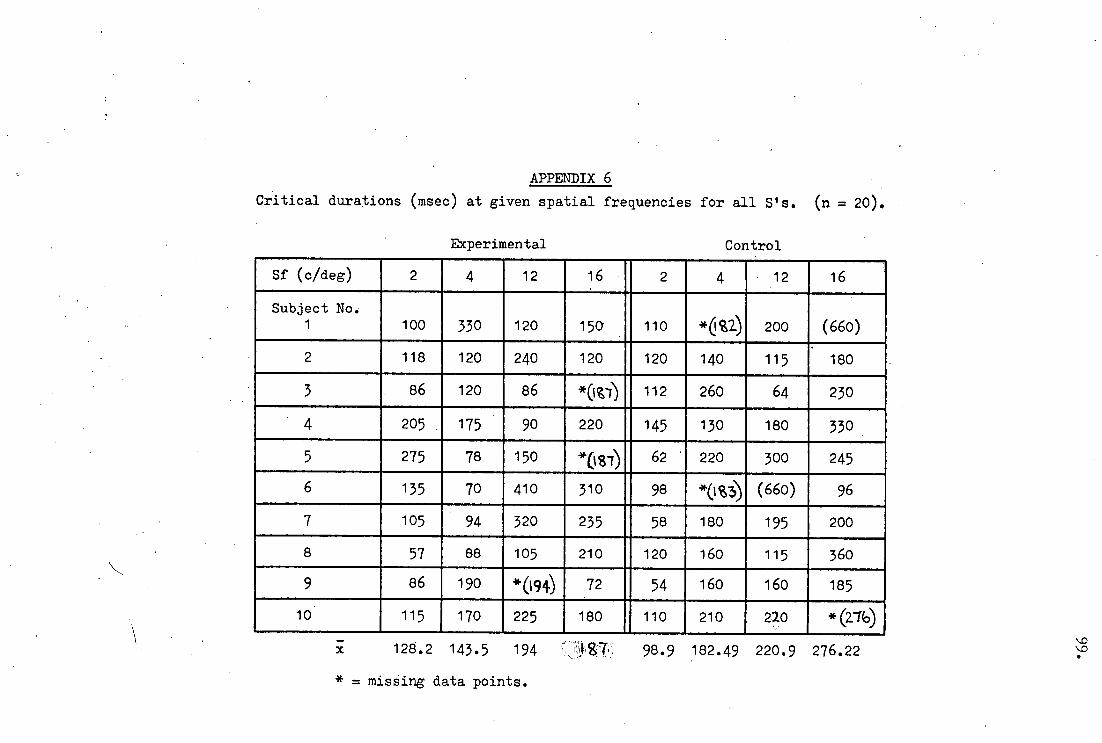
APPENDIX 6
Critical durations (msec) at given spatial frequencies for all S's. (n = 20).
Experimental
Control
Sf (c/deg) 2 4 12 16 2 4 12 16
Subject No. 1 100 330 120 150 110 *6 qa) 200 (660)
2 118 120 240 120 120 140 115 180
3 86 120 86 *06) 112 260 64 230
• 4 205 175 90 220 145 130 180 330
5 275 78 150 *ogi) 62 ' 220 300 245
6 135 70 410 310 98 *00 (660) 96
7 105 94 320 235 58 180 195 200
8 57 88 105 210 120 160 115 360
9 86 190 *094) 72 54 160 160 185
10 115 170 225 180 110 210 220 *(a1) -
x 128.2 143.5 194 98.9 182.49 220.9 276.22
* = missing data points.

APPENDIX 7
Mean log contrast thresholds as a function of log duration at the faur spatial frequencies, for con-trols (n = 10).
100. 100.
.3 0
•as
-o5
.04
-ol
•o15
-.- ■ •-••
c Icle3
I / 1 I 1 li I . I I Ii I 1
40 60 ?0 100 1 50 Zoo 2oo 500 loOo
03 dUra410n(vlASeC)

APPENDIX 7
Mean log contrast thresholds as a function of log duration at the fair spatial frequencies, for SRD' s (n 10).
•
Related Documents