Journal of Crystal Growth 242 (2002) 517–532 Critical behaviour of the curved region near 111-facet edge of equilibrium shape cuprous selenide large single crystals Jadranko Gladi ! c*, Zlatko Vu $ ci ! c, Davorin Lovri ! c Institute of Physics, Bijeni $ cka cesta 46, P.O. Box 304, HR-10000 Zagreb, Croatia Accepted 11 March 2002 Communicated by G. Muller Abstract Several millimetres large spherical cuprous selenide single crystals with well developed (1 1 1) facets grown at about 30 K below the roughening temperature (T R E830 K) and rapidly cooled to room temperature were used to test the universality and value of critical exponent describing the surface profile behaviour near the facet edge. Enlarged photographs (52.5 times) of part of the crystal profile were digitised with resulting spatial resolution of 0.190470.0001 mm. After FFT low pass filtering, the position of crystal silhouette edge was determined as the loci of the extremes in the first derivative of each image row intensity profile. For assumed critical dependence z ¼ Aðx x 0 Þ y ; the inverse logarithmic derivative applied to crystal profile data points disclosed the extent of intervals of different behaviour, giving independently the respective indicative values of fitting parameters y and x 0 : In three distinct regions non-linear Levenberg–Marquardt fitting was applied to original data sets. In the region farthest away from the facet, the behaviour is well described by yE2:5 or by Andreev formula z ¼ Aðx 0 xÞ 2 þ Bðx 0 xÞ 4 . In the stepped region, for j=13.98–17.121 (tilt angle relative to facet plane), the critical exponent y ¼ 1:49970:003 is found, in agreement with Pokrovsky–Talapov universality class predicted value of y ¼ 3 2 : The step interaction energy, step free energy and facet free energy ratios obtained from data fitting parameters only, are compared to published values for 4 He, Si and Pb single crystals. The behaviour in the immediate vicinity of the facet edge is discussed in the light of dynamics features recently observed on different single crystals during growth (cuprous selenide, 4 He) and equilibration (Pb). r 2002 Elsevier Science B.V. All rights reserved. PACS: 68.35.Mo; 81.10.Aj Keywords: A1. Critical exponent; A1. Equilibrium crystal shape; A1. Pokrovsky–Talapov universality class; A2. Single crystal growth; B2. Superionic conductors 1. Introduction There has been considerable interest in experi- mental investigation of the shape of equilibrium single crystals of various materials, in the tem- perature range where equilibrium crystal shape *Corresponding author. Tel.: +385-1-469-8888; fax: +385- 1-469-8889. E-mail addresses: [email protected] (J. Gladi ! c), [email protected] (Z. Vu$ ci ! c), [email protected] (D. Lovri ! c). 0022-0248/02/$ - see front matter r 2002 Elsevier Science B.V. All rights reserved. PII:S0022-0248(02)01452-5

Welcome message from author
This document is posted to help you gain knowledge. Please leave a comment to let me know what you think about it! Share it to your friends and learn new things together.
Transcript
Journal of Crystal Growth 242 (2002) 517–532
Critical behaviour of the curved region near 111-facet edge ofequilibrium shape cuprous selenide large single crystals
Jadranko Gladi!c*, Zlatko Vu$ci!c, Davorin Lovri!c
Institute of Physics, Bijeni$cka cesta 46, P.O. Box 304, HR-10000 Zagreb, Croatia
Accepted 11 March 2002
Communicated by G. Muller
Abstract
Several millimetres large spherical cuprous selenide single crystals with well developed (1 1 1) facets grown at about
30K below the roughening temperature (TRE830K) and rapidly cooled to room temperature were used to test the
universality and value of critical exponent describing the surface profile behaviour near the facet edge. Enlarged
photographs (52.5 times) of part of the crystal profile were digitised with resulting spatial resolution of
0.190470.0001mm. After FFT low pass filtering, the position of crystal silhouette edge was determined as the loci
of the extremes in the first derivative of each image row intensity profile. For assumed critical dependence z ¼Aðx� x0Þ
y; the inverse logarithmic derivative applied to crystal profile data points disclosed the extent of intervals of
different behaviour, giving independently the respective indicative values of fitting parameters y and x0: In three distinct
regions non-linear Levenberg–Marquardt fitting was applied to original data sets.
In the region farthest away from the facet, the behaviour is well described by yE2:5 or by Andreev formula
z ¼ Aðx0 � xÞ2 þ Bðx0 � xÞ4. In the stepped region, for j=13.98–17.121 (tilt angle relative to facet plane), the critical
exponent y ¼ 1:49970:003 is found, in agreement with Pokrovsky–Talapov universality class predicted value of y ¼ 32:
The step interaction energy, step free energy and facet free energy ratios obtained from data fitting parameters only, are
compared to published values for 4He, Si and Pb single crystals.
The behaviour in the immediate vicinity of the facet edge is discussed in the light of dynamics features recently
observed on different single crystals during growth (cuprous selenide, 4He) and equilibration (Pb). r 2002 Elsevier
Science B.V. All rights reserved.
PACS: 68.35.Mo; 81.10.Aj
Keywords: A1. Critical exponent; A1. Equilibrium crystal shape; A1. Pokrovsky–Talapov universality class; A2. Single crystal growth;
B2. Superionic conductors
1. Introduction
There has been considerable interest in experi-mental investigation of the shape of equilibriumsingle crystals of various materials, in the tem-perature range where equilibrium crystal shape
*Corresponding author. Tel.: +385-1-469-8888; fax: +385-
1-469-8889.
E-mail addresses: [email protected] (J. Gladi!c), [email protected]
(Z. Vu$ci!c), [email protected] (D. Lovri!c).
0022-0248/02/$ - see front matter r 2002 Elsevier Science B.V. All rights reserved.
PII: S 0 0 2 2 - 0 2 4 8 ( 0 2 ) 0 1 4 5 2 - 5
(ECS) comprises both planar facets and curvedinterfacial regions. Facets and curved regions joinat edges, which can be either sharp or smooth.Within an xz-plane section of the crystal (perpen-dicular to the facet which is coplanar with the xy
facet plane), the shape of curved interface in thevicinity of a smooth edge positioned at (x0; 0) isdescribed as [1,2]
z ¼ Aðx� x0Þy þ higher order terms: ð1Þ
The main objective of the experimental endea-vour has been to test the universality and value ofthe critical exponent y; theoretically predicted tobe equal to 3
2:
The ECS materials investigated thus far havebeen mostly metals, with single crystals up to10 mm in diameter, on graphite substrate (Pb[1,3–5], Au [3,6,7], In [8–10].) The shape of 9 mmPb crystal [1] is described with y=1.6070.15within a curved surface region not extending allthe way to the edge (latest STM measurement on afew mm large Pb crystals [5] at 380K givey=1.4970.06 independent of azimuth); the shapeof 4 mm In crystals with yE2 close to the edge andyE1:6070:10 further away, while for describing afew mm large Au crystals having sharp edges [9] aterm linear in ðx� x0Þ was used [3]. Profiles of0.36–7.2 mm Si crystallites [11] (equilibrated apexesof small silicon columns on silicon substrate) aredescribed with y ¼ 1:5 (with a 6% uncertainty) formisorientation of profile from the facet between 31and 171.
The theory describes the shape of idealized largecrystals in the thermodynamic limit (V-N; atfixed T ; where the atomic scale details of crystaloutline effectively disappear), with the mathema-tically sharp features such as strict planarity offacets, the sharpness of edges and corners, etc. Thediscrepancy between these and the experimentallyobserved features are expected to be morepronounced for smaller crystals (their size beinglimited by the equilibration time).
The investigated 4He single crystals [12–14] werea few millimetres large and their shape wasdescribed [12] with y ¼ 1:5570:06; starting at thefacet edge. On millimetre size growing singlecrystals of ordinary H2O ice [15], the value of y ¼
1:74 was obtained, again fitted over the entirerounded profile, from the very facet edge.
The aim of this article is to investigate the shapeof the curved region near the (1 1 1) facet edge ofan equilibrium shape large spherical single crystalof cuprous selenide. Cuprous selenide Cu2�xSeis a representative of a group of chemicallyand structurally simplest superionic conductors,namely metal chalcogenides (M27xCh, M=Ag,Cu; Ch=S, Se, Te). These materials exhibit largeionic and electronic conductivity, thus enablingfast bulk metal atom transport, while still in solidphase. They have only recently been introduced asconvenient materials for studying ECS properties[16–20], since they are, besides the solid 4He singlecrystals, the only materials having large (sub-centimetre) size crystals of apparently ECS formthat can be grown on a practical time scale (ofseveral days).
1.1. Theoretical background
Let us briefly review the underlying theory andbasic definitions of the ECS along the lines setforth by Landau [21] and Jayaprakash et al. [2].
As crystals are anisotropic, the equilibriumshape of a crystal is the direct consequence of thesurface free energy per unit area f ð~hhÞ dependenceon the crystal surface (described by zðx; yÞ; ~hh ¼~rrzðx; yÞ; origin at the crystal centre) orientationrelative to crystallographic axes, at given tempera-ture. The shape is determined [2,21] by minimiza-tion of the surface free energy, subject to theconstant volume constraint, i.e. by minimizationofZ
dx dy½f ð~hhÞ � 2lzðx; yÞ�; ð2Þ
where l is the Lagrange multiplier. The solution tothis variational problem is not strictly valid [22]except in the thermodynamic limit V-N; sinceby writing the total free energy in the form ofEq. (2) the physical effects of atomic scale details(e.g. edge and corner energies, curvature correc-tions, and the like) responsible for finite sizecorrections are omitted.
As pointed out by Rottman et al. [1], theprediction of critical exponent y ¼ 3
2is based on
J. Gladi!c et al. / Journal of Crystal Growth 242 (2002) 517–532518
two propositions: (i) that interface can be mod-elled as a two-dimensional (2D) surface (for smallbulk correlation length), and (ii) that the dominantexcitations of such surface are ‘‘steps’’ or ‘‘ledges’’(TSK—terrace–step–kink model).
Microscopically, the transition region with sur-face orientations arbitrarily close to a high-symmetry direction (flat facet—smooth phase),the so-called vicinal surfaces, can be viewed as asequence of atomically smooth terraces separatedby steps of height a (lattice plane spacing) andspacing l: The angle j between the vicinal surfaceand the facet is proportional to the linear densityof steps 1=l (jBtan jBa=l ¼ j~hhj). It should bestressed that such a picture is valid only if the tiltangle j is small enough [23,24]. On such steppedsurface, the distance between steps is large and thesteps are well defined. If the angle j gets too large,the terrace width becomes comparable to stepwidth—thus the regular staircase disappears andthe surface becomes rough.
Generally, the surface free energy per unit areafor the stepped surface can be written as anexpansion [3] in terms of moduli of ~hh:
f ð~hhÞ ¼ b0 þ b1j~hhj þ b2h2 þ b3j~hhj
3 þy ð3Þ
with generally temperature dependent coefficientsbn: The term b0 is the surface free energy per unitarea of the facet (~hh ¼ 0), b1j~hhj corresponds to thestep free energy that vanishes at the rougheningtransition. The higher order terms representinteractions between steps.
A ‘‘very particular choice’’ [3] of coefficients inEq. (3) (in the framework of the mean-field theory)gives the Andreev [25] crystal shape (in xz-plane,as in Eq. (1)) of the form
lzðxÞ ¼ z0 þ aðlxÞ2 þ bðlxÞ4: ð4Þ
Models [2] taking into account thermal fluctua-tions in step positions, which exclude voids andoverhangs (solid-on-solid condition), with onlyrepulsive interactions between steps, give the freeenergy dependence on slope ~hh of the steppedsurface
f ðj~hhjÞ ¼ b0 þ b1j~hhj þ b3j~hhj3: ð5Þ
The resulting crystal shape in the vicinity offacet edge is described by the power law depen-
dence [2] (again in xz-plane):
lzðxÞ ¼
b0 for jlxjob1;
b0 �2
33=2b1=23
ðjlxj � b1Þ3=2 for jlxjXb1:
8><>: ð6Þ
The exponent y ¼ 32(critical exponent) describing
the shape of the curved surface, characterises sucha transition (second-order phase transition) asbelonging to the Pokrovsky–Talapov [26] (orGruber–Mullins [27]) universality class. Suchuniversal exponent should be independent of theobserved material, orientation of facet or azi-muthal angle of the xz-plane crystal section.
The paper is organised as follows.In Section 2 we review the preparation of large
spherical cuprous selenide single crystals with welldeveloped (1 1 1) facets. The methods of noiseremoval and determination of crystal silhouetteedge position on digitised enlarged photographs ofpart of crystal profile (the facet and adjacentcurved region) are discussed.
In Section 3 the detailed analysis of functionaldependence of thus obtained crystal profile datapoints is given. For assumed critical dependencez ¼ Aðx� x0Þ
y; the inverse logarithmic derivativeapproach is used to disclose the intervals ofdifferent behaviour and to obtain indicative valuesof fitting parameters y and x0 independently.
The results are discussed in Section 4. The valueof scaling parameter l is estimated in order tocalculate the b0; b1 and b3 coefficients, while theratios of these coefficients are obtained fromthe fitting parameters (of the critical behaviour inthe stepped region) only. These are compared withvalues obtained by other authors on 4He, Si andPb single crystals. The extent of the stepped regionand the possible origin of the behaviour of crystalprofile adjacent to the facet edge is discussed.
2. Experimental procedure
The method of growth [19,20] of superionicconductor cuprous selenide Cu2�xSe single crystalsin a solid/vapour system is based upon the fastbulk Cu atoms transport at temperatures from
J. Gladi!c et al. / Journal of Crystal Growth 242 (2002) 517–532 519
300K up to the melting temperature Tm ¼ 1450K.The crystals are grown using modified Ohachi’smethod [17,18], around the tip of a quartzcapillary (the tip being o10% of the crystalsphere volume, see Fig. 4 in Ref. [19]). The tipnarrowing is used for single crystal seed selection,and for keeping the current density of Cu atomssmaller [20] (103–105 times) than the one ofselenium molecules. Thus high quality sphericalsingle crystals are grown in the solid-state crystal-lisation mode [28,29], with constant volumegrowth rate (0.1–0.9mm3 h�1) [19,20].
The partly faceted (circular (1 1 1) facets) andpartly rounded crystals were grown at about 30Kbelow the roughening temperature, TRE830K,for several days, until reaching several millimetresin diameter. The growth was observed in situ,measuring simultaneously facet and sphere radii.Their ratio, characterising the crystal shape, showsthe exponential-like relaxation (with relaxationtime constant tB1200min, see Fig. 6. in Ref. [20])towards the equilibrium value with time, as radialgrowth rate decreases (from 350 to 1.5 nm s�1), allthe time obeying volume vs. time linearity. Thenthey were quickly cooled (from 800 to 600K in lessthan a minute) to room temperature (hopefullywithout changing their shape and quality). Thesingle crystals with well-developed eight (1 1 1)facets (with relative orientations perfectlyreflecting the point group symmetry of FCCcrystal), thus grown and quenched, were used toobtain the enlarged photographs of the crystaledge projection. Their growth shape is believed tobe as near to equilibrium shape as practicallyattainable (the exponential approach to equili-brium becoming prohibitively slow after growthtime > 5t).
A halogen point-like white light source and aconvergent lens provided a parallel light beam forbacklighting the crystal. The part of crystal with afacet was brought into the centre of the light beam,with the facet surface parallel to paraxial rays.Another lens was used to obtain a magnifiedpicture of the facet and its neighbourhood silhou-ette projected directly on photographic paper(ILFORD black and white Ilfobrom FB IB3.1P).A continuous coloured glass filter was used toprovide monochrome illumination, thus reducing
chromatic aberrations. The exposure time wasabout 20min.
By projecting standard calibration grid severaltimes larger than the single crystal samples (DRCMetrigraphics, 10� 3mm, 40 mm bars) a smallerarea (approx. 30� 30 cm) with no pincushiondistortions was determined in the image centre.Subsequently, the observed single crystal wasplaced so as to get the image of facet and itsneighbourhood well within this area. Testing onstandard steel balls (comparable in size with oursingle crystals) using a CALCOMP digitisingboard to obtain coordinates of their silhouetteedge from photographs, proved that within thechosen central area there were no detectable imagedistortions (the fit standard deviations were at theworst 10 times smaller than the declared deviationof standard balls’ radii, at a given magnification ofabout 53 times).
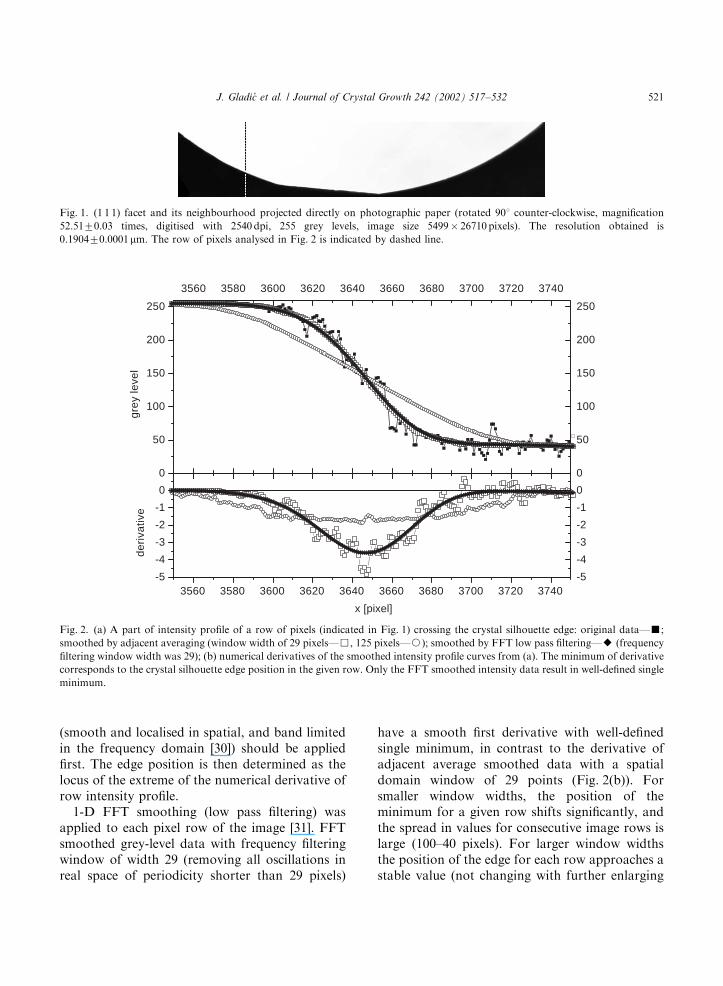
The photographs of single crystal facet edgearea were digitised using a professional drumscanner (Linotype-Hell Cromagraph S3700, sam-pling aperture 12 mm, resolution 100 dotsmm�1),thus avoiding the subjective choice of crystalprojection edge points sampled when using adigitising board. A typical scan of a crystalphotograph (crystal with 2R ¼ 7:8070:05mm,measured with vernier calliper) resulted in non-compressed RAW file of 26710 rows with 5499pixels each (Fig. 1).
Due to the initial orientation of the photographwith edge extending roughly along the y-direction,i.e. perpendicular to the pixel rows, a basicallyone-dimensional (1D) approach to the edge detec-tion problem at hand proved to be quite appro-priate.
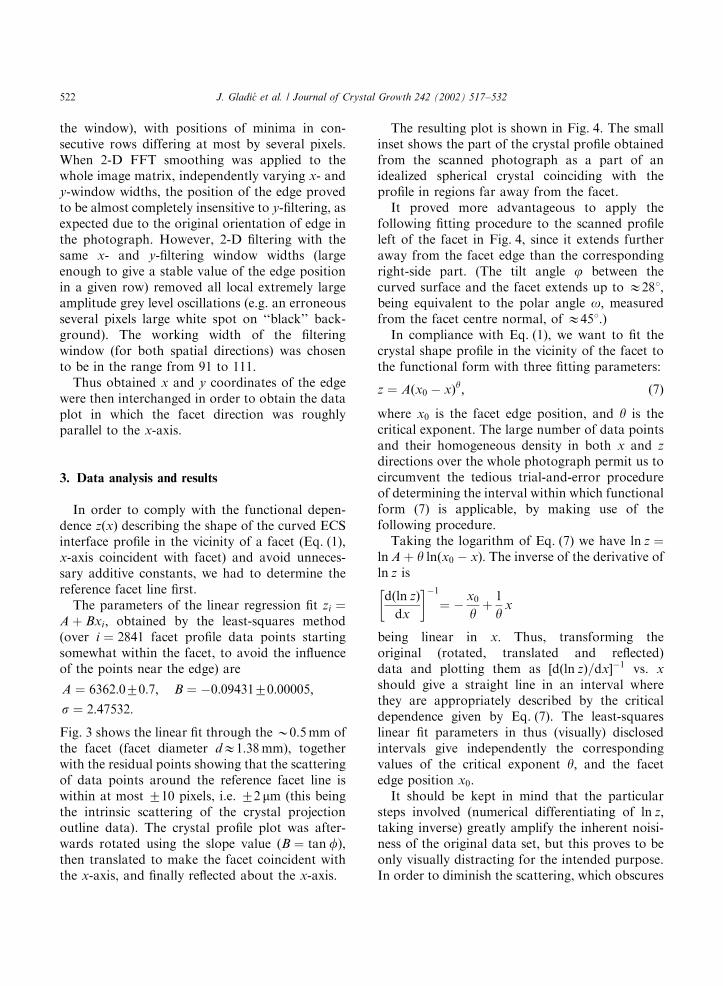
Fig. 2 shows part of a typical row taken fromthe middle part of the image, crossing the crystaledge near the facet end. The white part (crystal)has a uniform grey level value of 255, while the‘‘black’’ background has a grey value of 40720,with superimposed noise. The transition areadefining the crystal silhouette outline shows agradual change from white to ‘‘black’’ overtypically 120720 pixels, with the similar high-frequency noise. In order to get an objective edgeposition within a row, a smoothing filter matchingthe known requirements of biological vision
J. Gladi!c et al. / Journal of Crystal Growth 242 (2002) 517–532520
(smooth and localised in spatial, and band limitedin the frequency domain [30]) should be appliedfirst. The edge position is then determined as thelocus of the extreme of the numerical derivative ofrow intensity profile.
1-D FFT smoothing (low pass filtering) wasapplied to each pixel row of the image [31]. FFTsmoothed grey-level data with frequency filteringwindow of width 29 (removing all oscillations inreal space of periodicity shorter than 29 pixels)
have a smooth first derivative with well-definedsingle minimum, in contrast to the derivative ofadjacent average smoothed data with a spatialdomain window of 29 points (Fig. 2(b)). Forsmaller window widths, the position of theminimum for a given row shifts significantly, andthe spread in values for consecutive image rows islarge (100–40 pixels). For larger window widthsthe position of the edge for each row approaches astable value (not changing with further enlarging
0
50
100
150
200
250
3560 3580 3600 3620 3640 3660 3680 3700 3720 3740
0
50
100
150
200
250
grey
leve
l
3560 3580 3600 3620 3640 3660 3680 3700 3720 3740-5
-4
-3
-2
-1
0
-5
-4
-3
-2
-1
0
x [pixel]
deri
vativ
e
Fig. 2. (a) A part of intensity profile of a row of pixels (indicated in Fig. 1) crossing the crystal silhouette edge: original data—’;
smoothed by adjacent averaging (window width of 29 pixels—&, 125 pixels—J); smoothed by FFT low pass filtering—E (frequency
filtering window width was 29); (b) numerical derivatives of the smoothed intensity profile curves from (a). The minimum of derivative
corresponds to the crystal silhouette edge position in the given row. Only the FFT smoothed intensity data result in well-defined single
minimum.
Fig. 1. (1 1 1) facet and its neighbourhood projected directly on photographic paper (rotated 901 counter-clockwise, magnification
52.5170.03 times, digitised with 2540 dpi, 255 grey levels, image size 5499� 26710 pixels). The resolution obtained is
0.190470.0001mm. The row of pixels analysed in Fig. 2 is indicated by dashed line.
J. Gladi!c et al. / Journal of Crystal Growth 242 (2002) 517–532 521
the window), with positions of minima in con-secutive rows differing at most by several pixels.When 2-D FFT smoothing was applied to thewhole image matrix, independently varying x- andy-window widths, the position of the edge provedto be almost completely insensitive to y-filtering, asexpected due to the original orientation of edge inthe photograph. However, 2-D filtering with thesame x- and y-filtering window widths (largeenough to give a stable value of the edge positionin a given row) removed all local extremely largeamplitude grey level oscillations (e.g. an erroneousseveral pixels large white spot on ‘‘black’’ back-ground). The working width of the filteringwindow (for both spatial directions) was chosento be in the range from 91 to 111.
Thus obtained x and y coordinates of the edgewere then interchanged in order to obtain the dataplot in which the facet direction was roughlyparallel to the x-axis.
3. Data analysis and results
In order to comply with the functional depen-dence zðxÞ describing the shape of the curved ECSinterface profile in the vicinity of a facet (Eq. (1),x-axis coincident with facet) and avoid unneces-sary additive constants, we had to determine thereference facet line first.
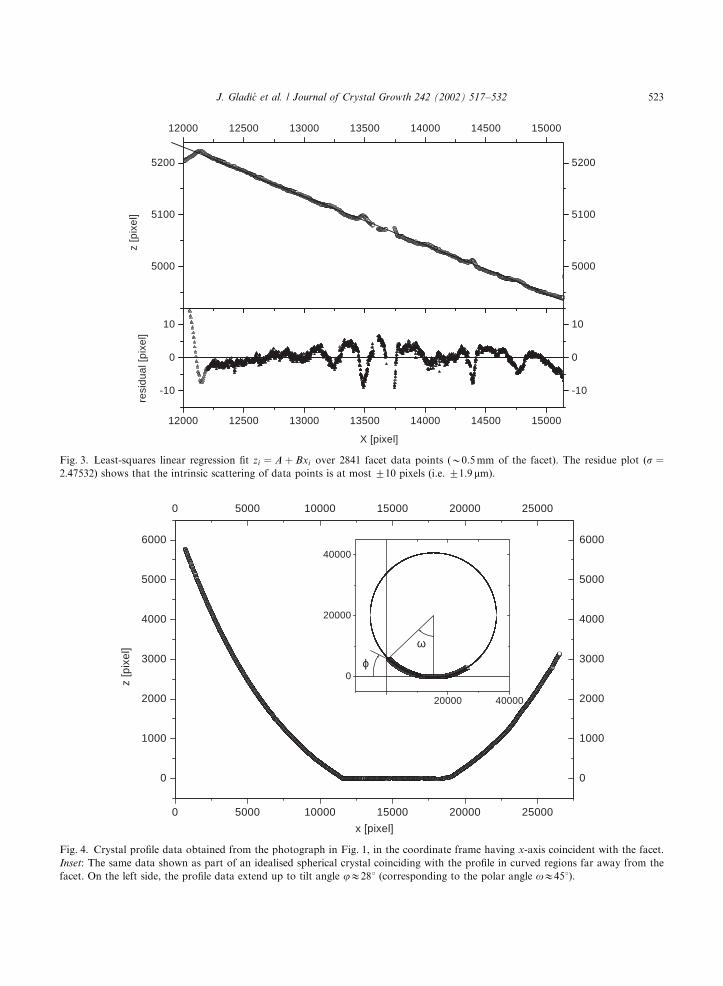
The parameters of the linear regression fit zi ¼Aþ Bxi; obtained by the least-squares method(over i ¼ 2841 facet profile data points startingsomewhat within the facet, to avoid the influenceof the points near the edge) are
A ¼ 6362:070:7; B ¼ �0:0943170:00005;
s ¼ 2:47532:
Fig. 3 shows the linear fit through the B0.5mm ofthe facet (facet diameter dE1:38mm), togetherwith the residual points showing that the scatteringof data points around the reference facet line iswithin at most 710 pixels, i.e. 72 mm (this beingthe intrinsic scattering of the crystal projectionoutline data). The crystal profile plot was after-wards rotated using the slope value (B ¼ tan f),then translated to make the facet coincident withthe x-axis, and finally reflected about the x-axis.
The resulting plot is shown in Fig. 4. The smallinset shows the part of the crystal profile obtainedfrom the scanned photograph as a part of anidealized spherical crystal coinciding with theprofile in regions far away from the facet.
It proved more advantageous to apply thefollowing fitting procedure to the scanned profileleft of the facet in Fig. 4, since it extends furtheraway from the facet edge than the correspondingright-side part. (The tilt angle j between thecurved surface and the facet extends up to E281,being equivalent to the polar angle o; measuredfrom the facet centre normal, of E451.)
In compliance with Eq. (1), we want to fit thecrystal shape profile in the vicinity of the facet tothe functional form with three fitting parameters:
z ¼ Aðx0 � xÞy; ð7Þ
where x0 is the facet edge position, and y is thecritical exponent. The large number of data pointsand their homogeneous density in both x and z
directions over the whole photograph permit us tocircumvent the tedious trial-and-error procedureof determining the interval within which functionalform (7) is applicable, by making use of thefollowing procedure.
Taking the logarithm of Eq. (7) we have ln z ¼lnAþ y lnðx0 � xÞ: The inverse of the derivative ofln z is
dðln zÞdx
� ��1
¼ �x0
yþ
1
yx
being linear in x: Thus, transforming theoriginal (rotated, translated and reflected)data and plotting them as ½dðln zÞ=dx��1 vs. x
should give a straight line in an interval wherethey are appropriately described by the criticaldependence given by Eq. (7). The least-squareslinear fit parameters in thus (visually) disclosedintervals give independently the correspondingvalues of the critical exponent y; and the facetedge position x0:
It should be kept in mind that the particularsteps involved (numerical differentiating of ln z;taking inverse) greatly amplify the inherent noisi-ness of the original data set, but this proves to beonly visually distracting for the intended purpose.In order to diminish the scattering, which obscures
J. Gladi!c et al. / Journal of Crystal Growth 242 (2002) 517–532522
5000
5100
5200
12000 12500 13000 13500 14000 14500 15000
5000
5100
5200
z [p
ixel
]
12000 12500 13000 13500 14000 14500 15000
-10
0
10
-10
0
10
X [pixel]
resi
dual
[pix
el]
Fig. 3. Least-squares linear regression fit zi ¼ Aþ Bxi over 2841 facet data points (B0.5mm of the facet). The residue plot ðs ¼2:47532Þ shows that the intrinsic scattering of data points is at most 710 pixels (i.e. 71.9 mm).
0 5000 10000 15000 20000 25000
0
1000
2000
3000
4000
5000
6000
0 5000 10000 15000 20000 25000
0
1000
2000
3000
4000
5000
6000
z [p
ixel
]
x [pixel]
20000 40000
0
20000
40000
ϕ
ω
Fig. 4. Crystal profile data obtained from the photograph in Fig. 1, in the coordinate frame having x-axis coincident with the facet.
Inset: The same data shown as part of an idealised spherical crystal coinciding with the profile in curved regions far away from the
facet. On the left side, the profile data extend up to tilt angle jE281 (corresponding to the polar angle oE451).
J. Gladi!c et al. / Journal of Crystal Growth 242 (2002) 517–532 523
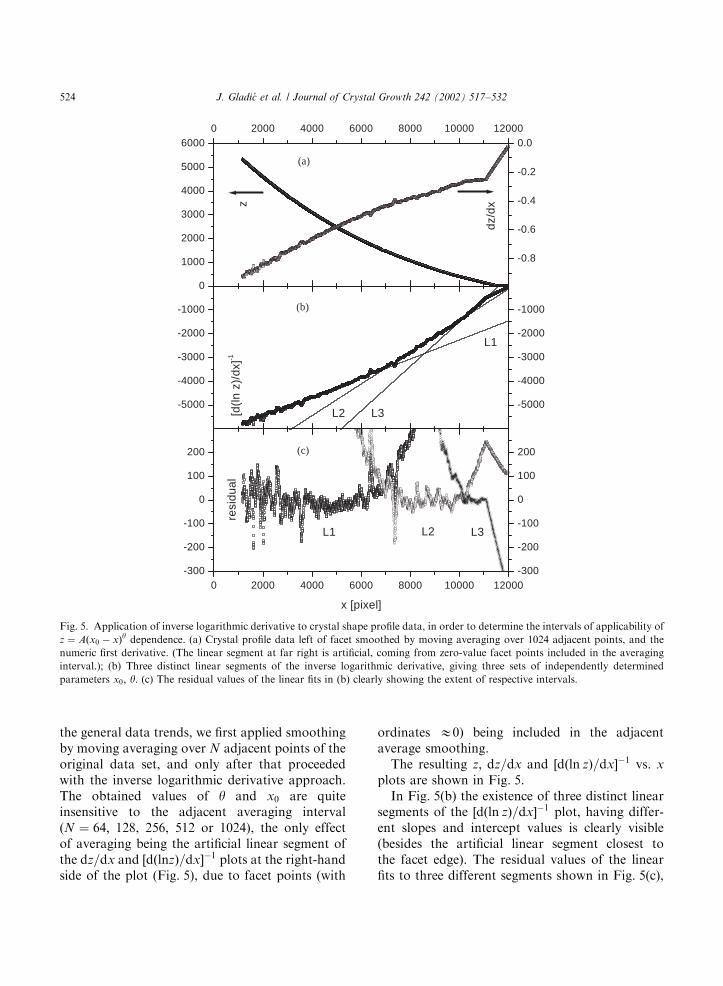
the general data trends, we first applied smoothingby moving averaging over N adjacent points of theoriginal data set, and only after that proceededwith the inverse logarithmic derivative approach.The obtained values of y and x0 are quiteinsensitive to the adjacent averaging interval(N ¼ 64; 128, 256, 512 or 1024), the only effectof averaging being the artificial linear segment ofthe dz=dx and ½dðlnzÞ=dx��1 plots at the right-handside of the plot (Fig. 5), due to facet points (with
ordinates E0) being included in the adjacentaverage smoothing.
The resulting z; dz=dx and ½dðln zÞ=dx��1 vs. xplots are shown in Fig. 5.
In Fig. 5(b) the existence of three distinct linearsegments of the ½dðln zÞ=dx��1 plot, having differ-ent slopes and intercept values is clearly visible(besides the artificial linear segment closest tothe facet edge). The residual values of the linearfits to three different segments shown in Fig. 5(c),
0
1000
2000
3000
4000
5000
6000
[d(l
n z)
/dx]
-1
0 2000 4000 6000 8000 10000 12000
-0.8
-0.6
-0.4
-0.2
0.0
(a)
dz/
dx
z
-5000
-4000
-3000
-2000
-1000
-5000
-4000
-3000
-2000
-1000(b)
L3L2
L1
0 2000 4000 6000 8000 10000 12000-300
-200
-100
0
100
200
-300
-200
-100
0
100
200(c)
L3L2L1
resi
dual
x [pixel]
Fig. 5. Application of inverse logarithmic derivative to crystal shape profile data, in order to determine the intervals of applicability of
z ¼ Aðx0 � xÞy dependence. (a) Crystal profile data left of facet smoothed by moving averaging over 1024 adjacent points, and the
numeric first derivative. (The linear segment at far right is artificial, coming from zero-value facet points included in the averaging
interval.); (b) Three distinct linear segments of the inverse logarithmic derivative, giving three sets of independently determined
parameters x0; y: (c) The residual values of the linear fits in (b) clearly showing the extent of respective intervals.
J. Gladi!c et al. / Journal of Crystal Growth 242 (2002) 517–532524
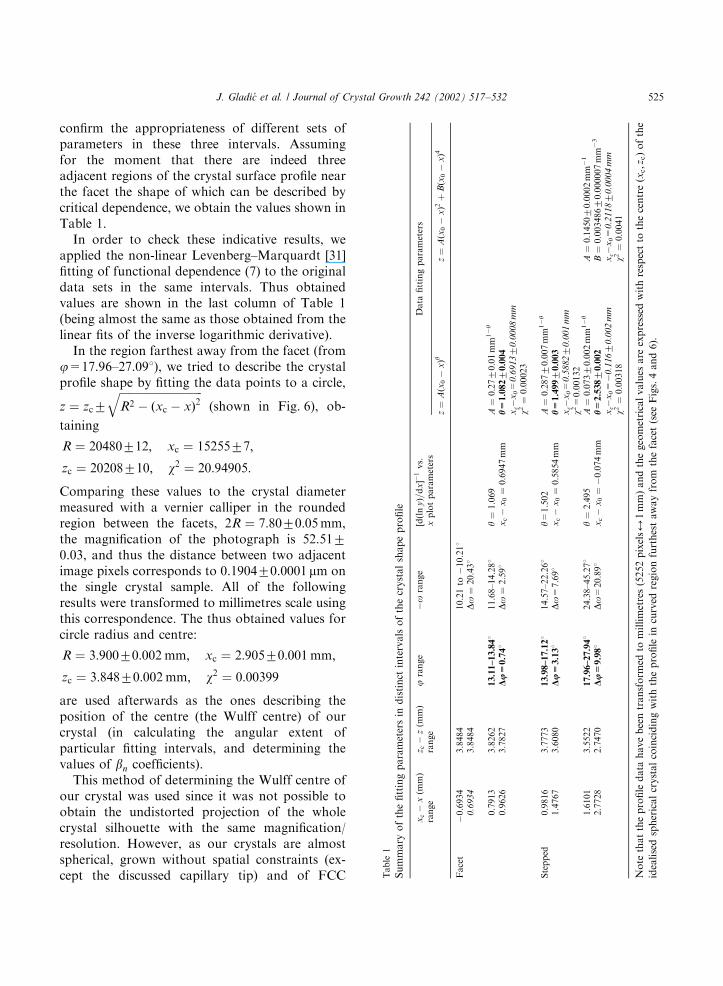
confirm the appropriateness of different sets ofparameters in these three intervals. Assumingfor the moment that there are indeed threeadjacent regions of the crystal surface profile nearthe facet the shape of which can be described bycritical dependence, we obtain the values shown inTable 1.
In order to check these indicative results, weapplied the non-linear Levenberg–Marquardt [31]fitting of functional dependence (7) to the originaldata sets in the same intervals. Thus obtainedvalues are shown in the last column of Table 1(being almost the same as those obtained from thelinear fits of the inverse logarithmic derivative).
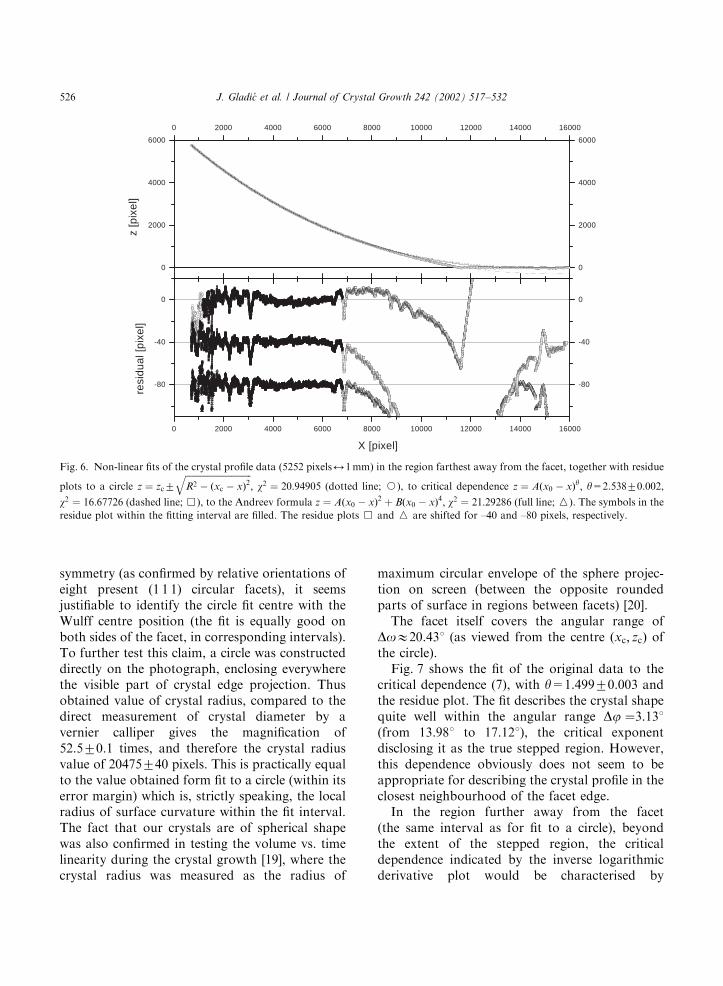
In the region farthest away from the facet (fromj=17.96–27.091), we tried to describe the crystalprofile shape by fitting the data points to a circle,
z ¼ zc7ffiffiffiffiffiffiffiffiffiffiffiffiffiffiffiffiffiffiffiffiffiffiffiffiffiffiffiffiffiffiR2 � ðxc � xÞ2
q(shown in Fig. 6), ob-
taining
R ¼ 20480712; xc ¼ 1525577;
zc ¼ 20208710; w2 ¼ 20:94905:
Comparing these values to the crystal diametermeasured with a vernier calliper in the roundedregion between the facets, 2R ¼ 7:8070:05mm,the magnification of the photograph is 52.5170.03, and thus the distance between two adjacentimage pixels corresponds to 0.190470.0001 mm onthe single crystal sample. All of the followingresults were transformed to millimetres scale usingthis correspondence. The thus obtained values forcircle radius and centre:
R ¼ 3:90070:002 mm; xc ¼ 2:90570:001 mm;
zc ¼ 3:84870:002 mm; w2 ¼ 0:00399
are used afterwards as the ones describing theposition of the centre (the Wulff centre) of ourcrystal (in calculating the angular extent ofparticular fitting intervals, and determining thevalues of bn coefficients).
This method of determining the Wulff centre ofour crystal was used since it was not possible toobtain the undistorted projection of the wholecrystal silhouette with the same magnification/resolution. However, as our crystals are almostspherical, grown without spatial constraints (ex-cept the discussed capillary tip) and of FCC T
able
1
Summary
ofthefittingparametersin
distinct
intervalsofthecrystalshapeprofile
xc�
x(m
m)
range
z c�z(m
m)
range
jrange
�o
range
½dðlnyÞ=dx��
1vs.
xplotparameters
Data
fittingparameters
z¼
Aðx
0�xÞy
z¼
Aðx
0�xÞ2þBðx
0�xÞ4
Facet
�0.6934
3.8484
10.21to
�10.211
0.6934
3.8484
Do¼
20:431
0.7913
3.8262
13.11–13.841
11.68–14.281
y¼
1:069
A¼
0:2770:01mm
1�y
0.9626
3.7827
Du=0.741
Do¼
2:591
xc�
x0¼
0:6947mm
h=
1.08270.004
xc�x0=0.691370.0008mm
w2¼
0:00023
Stepped
0.9816
3.7773
13.98–17.121
14.57–22.261
y=1.502
A¼
0:28770:007mm
1�y
1.4767
3.6080
Du=3.131
Do=7.691
xc�
x0¼
0:5854mm
h=
1.49970.003
xc�x0=0.588270.001mm
w2=
0.00132
1.6101
3.5522
17.96–27.941
24.38–45.271
y¼
2:495
A¼
0:07370:002mm
1�y
A¼
0:145070:0002mm
�1
2.7728
2.7470
Du=9.981
Do=20.891
xc�
x0¼
�0:074mm
h=
2.53870.002
B¼
0:00348670:000007mm
�3
xc�x0=�0.11670.002mm
xc�x0=0.211870.0004mm
w2¼
0:00318
w2¼
0:0041
Note
thattheprofile
data
havebeentransform
edto
millimetres(5252pixels2
1mm)andthegeometricalvalues
are
expressed
withrespectto
thecentreðx
c;z
cÞofthe
idealisedsphericalcrystalcoincidingwiththeprofile
incurved
regionfurthestawayfrom
thefacet(see
Figs.4and6).
J. Gladi!c et al. / Journal of Crystal Growth 242 (2002) 517–532 525
symmetry (as confirmed by relative orientations ofeight present (1 1 1) circular facets), it seemsjustifiable to identify the circle fit centre with theWulff centre position (the fit is equally good onboth sides of the facet, in corresponding intervals).To further test this claim, a circle was constructeddirectly on the photograph, enclosing everywherethe visible part of crystal edge projection. Thusobtained value of crystal radius, compared to thedirect measurement of crystal diameter by avernier calliper gives the magnification of52.570.1 times, and therefore the crystal radiusvalue of 20475740 pixels. This is practically equalto the value obtained form fit to a circle (within itserror margin) which is, strictly speaking, the localradius of surface curvature within the fit interval.The fact that our crystals are of spherical shapewas also confirmed in testing the volume vs. timelinearity during the crystal growth [19], where thecrystal radius was measured as the radius of
maximum circular envelope of the sphere projec-tion on screen (between the opposite roundedparts of surface in regions between facets) [20].
The facet itself covers the angular range ofDoE20.431 (as viewed from the centre ðxc; zcÞ ofthe circle).
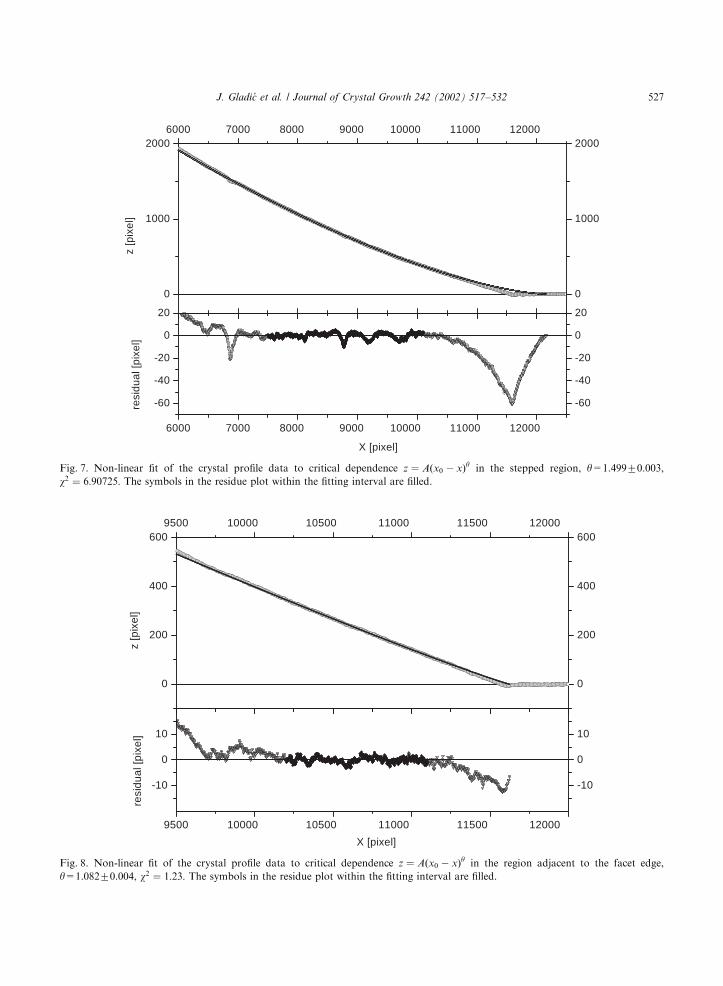
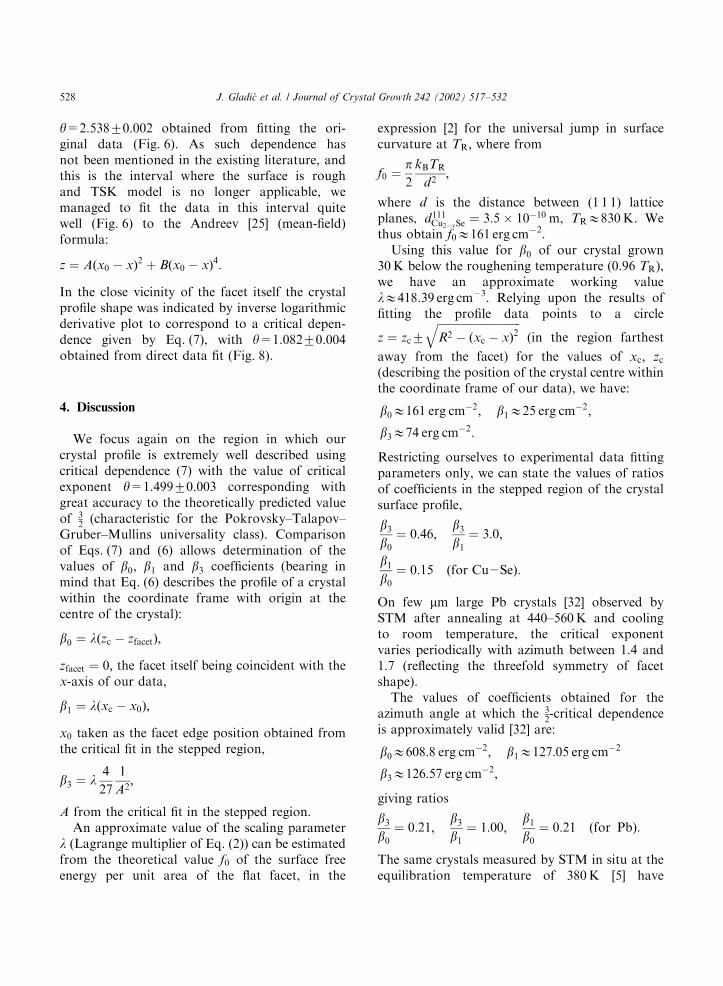
Fig. 7 shows the fit of the original data to thecritical dependence (7), with y=1.49970.003 andthe residue plot. The fit describes the crystal shapequite well within the angular range Dj ¼3.131(from 13.981 to 17.121), the critical exponentdisclosing it as the true stepped region. However,this dependence obviously does not seem to beappropriate for describing the crystal profile in theclosest neighbourhood of the facet edge.
In the region further away from the facet(the same interval as for fit to a circle), beyondthe extent of the stepped region, the criticaldependence indicated by the inverse logarithmicderivative plot would be characterised by
0
2000
4000
6000
0 2000 4000 6000 8000 10000 12000 14000 16000
0
2000
4000
6000z
[pix
el]
0 2000 4000 6000 8000 10000 12000 14000 16000
-80
-40
0
-80
-40
0
X [pixel]
resi
dual
[pix
el]
Fig. 6. Non-linear fits of the crystal profile data (5252 pixels21mm) in the region farthest away from the facet, together with residue
plots to a circle z ¼ zc7ffiffiffiffiffiffiffiffiffiffiffiffiffiffiffiffiffiffiffiffiffiffiffiffiffiffiffiffiffiffiR2 � ðxc � xÞ2
q; w2 ¼ 20:94905 (dotted line; J), to critical dependence z ¼ Aðx0 � xÞy; y=2.53870.002,
w2 ¼ 16:67726 (dashed line; &), to the Andreev formula z ¼ Aðx0 � xÞ2 þ Bðx0 � xÞ4; w2 ¼ 21:29286 (full line; W). The symbols in the
residue plot within the fitting interval are filled. The residue plots & and W are shifted for –40 and –80 pixels, respectively.
J. Gladi!c et al. / Journal of Crystal Growth 242 (2002) 517–532526
0
1000
20006000 7000 8000 9000 10000 11000 12000
0
1000
2000
z [p
ixel
]
6000 7000 8000 9000 10000 11000 12000
-60
-40
-20
0
20
-60
-40
-20
0
20
X [pixel]
resi
dual
[pix
el]
Fig. 7. Non-linear fit of the crystal profile data to critical dependence z ¼ Aðx0 � xÞy in the stepped region, y=1.49970.003,
w2 ¼ 6:90725: The symbols in the residue plot within the fitting interval are filled.
0
200
400
6009500 10000 10500 11000 11500 12000
0
200
400
600
z [p
ixel
]
9500 10000 10500 11000 11500 12000
-10
0
10
-10
0
10
X [pixel]
resi
dual
[pix
el]
Fig. 8. Non-linear fit of the crystal profile data to critical dependence z ¼ Aðx0 � xÞy in the region adjacent to the facet edge,
y=1.08270.004, w2 ¼ 1:23: The symbols in the residue plot within the fitting interval are filled.
J. Gladi!c et al. / Journal of Crystal Growth 242 (2002) 517–532 527
y=2.53870.002 obtained from fitting the ori-ginal data (Fig. 6). As such dependence hasnot been mentioned in the existing literature, andthis is the interval where the surface is roughand TSK model is no longer applicable, wemanaged to fit the data in this interval quitewell (Fig. 6) to the Andreev [25] (mean-field)formula:
z ¼ Aðx0 � xÞ2 þ Bðx0 � xÞ4:
In the close vicinity of the facet itself the crystalprofile shape was indicated by inverse logarithmicderivative plot to correspond to a critical depen-dence given by Eq. (7), with y=1.08270.004obtained from direct data fit (Fig. 8).
4. Discussion
We focus again on the region in which ourcrystal profile is extremely well described usingcritical dependence (7) with the value of criticalexponent y=1.49970.003 corresponding withgreat accuracy to the theoretically predicted valueof 3
2 (characteristic for the Pokrovsky–Talapov–Gruber–Mullins universality class). Comparisonof Eqs. (7) and (6) allows determination of thevalues of b0; b1 and b3 coefficients (bearing inmind that Eq. (6) describes the profile of a crystalwithin the coordinate frame with origin at thecentre of the crystal):
b0 ¼ lðzc � zfacetÞ;
zfacet ¼ 0; the facet itself being coincident with thex-axis of our data,
b1 ¼ lðxc � x0Þ;
x0 taken as the facet edge position obtained fromthe critical fit in the stepped region,
b3 ¼ l4
27
1
A2;
A from the critical fit in the stepped region.An approximate value of the scaling parameter
l (Lagrange multiplier of Eq. (2)) can be estimatedfrom the theoretical value f0 of the surface freeenergy per unit area of the flat facet, in the
expression [2] for the universal jump in surfacecurvature at TR; where from
f0 ¼p2
kBTR
d2;
where d is the distance between (1 1 1) latticeplanes, d111
Cu2�xSe¼ 3:5� 10�10 m, TRE830K. We
thus obtain f0E161 erg cm�2.Using this value for b0 of our crystal grown
30K below the roughening temperature (0.96 TR),we have an approximate working valuelE418.39 erg cm�3. Relying upon the results offitting the profile data points to a circle
z ¼ zc7ffiffiffiffiffiffiffiffiffiffiffiffiffiffiffiffiffiffiffiffiffiffiffiffiffiffiffiffiffiffiR2 � ðxc � xÞ2
q(in the region farthest
away from the facet) for the values of xc; zc(describing the position of the crystal centre withinthe coordinate frame of our data), we have:
b0E161 erg cm�2; b1E25 erg cm�2;
b3E74 erg cm�2:
Restricting ourselves to experimental data fittingparameters only, we can state the values of ratiosof coefficients in the stepped region of the crystalsurface profile,
b3b0
¼ 0:46;b3b1
¼ 3:0;
b1b0
¼ 0:15 ðfor Cu2SeÞ:
On few mm large Pb crystals [32] observed bySTM after annealing at 440–560K and coolingto room temperature, the critical exponentvaries periodically with azimuth between 1.4 and1.7 (reflecting the threefold symmetry of facetshape).
The values of coefficients obtained for theazimuth angle at which the 3
2-critical dependence
is approximately valid [32] are:
b0E608:8 erg cm�2; b1E127:05 erg cm�2
b3E126:57 erg cm�2;
giving ratios
b3b0
¼ 0:21;b3b1
¼ 1:00;b1b0
¼ 0:21 ðfor PbÞ:
The same crystals measured by STM in situ at theequilibration temperature of 380K [5] have
J. Gladi!c et al. / Journal of Crystal Growth 242 (2002) 517–532528
circular facets, the critical exponent is no longerazimuth dependent and has an average value of1.4970.06. Such contrast to the previous report ofnon-universal behaviour is explained as resultingfrom the crystal shape changes that apparentlyoccur during cooling of the samples.
For small Si 3-D crystals [11] observed bySEM ex situ after equilibrating at 9001C the meanvalue of the ratio b3=b0=0.3670.09 was found,while for 2-D samples observed by TEM andREM in situ at 9001C the value of b3=b0=0.426was obtained. In both cases the profile iscompatible with 3
2power law within the tilt angle
range 3–171, while at small angles (0–1.51) ‘‘nophysically reasonable law can be assigned to theprofile’’.
Helium crystals have been the most extensivelyinvestigated ECS material thus far, both theoreti-cally and experimentally. For HCP 4He(0 0 0 1)facet, with TR ¼ 1:28K and d0001
He ¼2.99� 10�10m,using the relation [2] for universal jump in surfacecurvature (or Fisher and Weeks [33] relationconnecting the roughening temperature and prin-cipal surface stiffnesses at TR), the value of b0should be 0.31 erg cm�2. As discussed in Ref. [34],the precise measurements by Babkin et al. [35]showed that close to c-direction it raises up toabout 0.31 erg cm�2, the exact theoretical value(confirming that it is indeed justified to use thetheoretical value at the roughening temperature inour estimate for l). The step energy found byRolley et al. [24] is 0.01470.0005 erg cm�2 (fallingoff exponentially when approaching TR; with atypical value of 0.0002 erg cm�2 in the temperaturerange between 1.13 and 1.232K [34,36]). From theindependent measurements of g8 component ofsurface stiffness (in the stepped surface region, fortilt angle o1.31, where it is proportional to stepinteractions and vanishes linearly with tilt angle),the value of step interaction energy at 0.1K isdeduced (see Figs. 3 and 4 in Ref. [37]) to beE0.15 erg cm�2. Keeping in mind that the valuescorrespond to different temperatures below TR wehave
b0 ¼ 0:31 erg cm�2; b1 ¼ 0:014 erg cm�2;
b3E0:15 erg cm�2;
which would give (indicative only) values of theratios
b3b0E0:48;
b3b1E10:7;
b1b0E0:045 ðfor 4HeÞ:
As has already been pointed out the criticalbehaviour description of equilibrium crystal shapeis appropriate in the stepped region only. Thecrossover angle between the stepped and the roughsurface regions was predicted to be rather small inthe case of helium where the crystal surfaces areweakly coupled to the underlying lattice. (Thelattice potential is small and the solid–liquidinterface thickness is much larger than the atomicspacing; thus the step height changes from 0 to a
over a distance—step width—of several atomicspacings [24].) The opposite is expected in the caseof metal–vacuum interface (surface) of metalcrystals—the coupling should be strong, resultingin narrow, sharp steps, and thus enabling thestepped surface to extend to larger values of tiltangle j:
The values of step interaction energy, stepenergy and facet surface free energy ratiosobtained for cuprous selenide seem to fit prettywell within the overall framework—falling inbetween the values for metal (Pb) crystals andhelium crystals at the opposite end—indicating arather strong coupling. In agreement with that,our y ¼ 3
2fit extends up to jE171, comparable to
131 in Pb [1], 151 in In [9] and 171 in Si [11]. On theother hand, in 4He, the critical dependencedescribes the data up to 0.1 rad (E5.731) [12], theother measurements showing that the crossoverangle is even smaller [24,37]. Since both b1 and b3are temperature dependent, further experimentaldata at different temperatures are necessary for amore detailed analysis.
The problem of the extent (angular range) of they ¼ 3
2fit near the facet edge is far from being
cleared in various materials. This has proved to bean experimentally difficult problem itself, forobvious reasons such as small sample sizes (of afew mm in most cases), scarcity of available datapoints in the region of interest and limited reso-lution. Besides, there seems to be an intrinsically
J. Gladi!c et al. / Journal of Crystal Growth 242 (2002) 517–532 529
different behaviour that has often been noticedthere, either directly or indirectly (through changein value of critical exponent of the stepped regionwhen taking into account more and more pointsapproaching the facet edge).
Rottman et al. [1] showed on a 9 mm equilibriumPb crystal, by choosing a number of differentwindows (B0.8 mm wide) and determining withineach of them the value of the critical exponent,that the effective value of y indeed had a minimum(y=1.53) within the ‘‘true critical region’’ between41 and 131 from the edge. Extending the fitted datawindow to either side caused rising of the y valuesdetermined from the fit.
On small Pb single crystals with threefold facetshape symmetry [32] observed at room tempera-ture, there was also pronounced dependence [38]on the fitting range Dr=rf ¼ 0:2020:55 (rf is facetradius, Dr is fitting interval). The fit interval beginsat the edge position, and the critical exponentvalue diminishes in general when taking intoconsideration more points away from the facet.
M!etois and Heyraud [9] analysed equilibriumshape profiles of two In single crystals (B4 mm indiameter), in the vicinity of a {1 1 1} facet. Theirresults show that the data in the region from 01 toB51 (with respect to facet orientation) are bestdescribed with the exponent yE2; and from 51 to151 with the exponent yE1:6070:10:
Elbaum [15] studied curvature jump of singlecrystals of ordinary H2O ice grown from vapourby interference microscope. During in situ mea-surements, the sample was growing at a rate ofB50 (As�1, which had strong effect on the profileat temperatures farther below TR: Just below TR
(B271.81K in cooling), the surface profile showncontains the facet (2rB0:3mm) and a small rangeof surface orientations from 01 to B1.31 withrespect to the facet. About 20 data points from thisrange gave exponent y=1.74, fitted over the entirerange. The authors conclude that the shape of thecritical region is suggestive of Pokrovsky–Talapovtransition, though an experiment in which theequilibrium would be reached, farther below theroughening temperature, is called for.
Carmi et al. [12] investigated the profile of HCP4He crystals next to c facets (0 0 0 1). The crystalsof lateral dimensions as large as a few millimetres
were observed in situ at temperature stabilizedbelow TR (1.28K) to an accuracy of 0.002K. Theauthors claim that although their crystals werepossibly not in global equilibrium, after equilibra-tion times of the order of 10min, the vicinalsurfaces of interest should be in local equilibrium(since they should equilibrate as a rough surface,i.e., with time constants shorter than 20 s). Incontrast to results on 9 mm Pb crystals [1], theextent of fit interval on large 4He crystals was notlimited to a ‘‘window’’. The fitting functiondescribes the data beginning from the chosen facetend position up to 0.1 rad (E5.731) with respect tothe facet orientation. The obtained values of yfrom 13 photographs at various temperaturesrange from 1.49 to 1.65, giving the overall resulty=1.5570.06.
All these observations seem to indicate that insitu measurements of non-growing, equilibratedcrystals show better agreement with predictedvalue y ¼ 3
2; all the way to the facet edge (fit
interval not being limited to a ‘‘window’’).In the case of cuprous selenide, application of
inverse logarithmic derivative enabled us to clearlysee the distinction between the stepped regionbehaviour (with y=1.499) and the differentdependence near the facet edge, where an intri-guing value of y=1.082 emerges. As the shape ofour crystals was analysed on single crystalsobtained by interrupting the crystal growth andcooling them rapidly to room temperature, one istempted to say that such critical exponent valuecould rather be the result of (local) shape changethat occurred during the cooling, than some newintrinsic behaviour.
However, during the growth [19,20,39] of ourspherical Cu2�xSe single crystals under conditionsof constant volume growth rate, the exponential-like shape relaxation (the ratio of facet radius tosphere radius) towards the equilibrium form isobserved. The other effect superimposed to therelaxation behaviour is the facet size oscillations(of order of 20%) during growth [20]. Theseoscillations seem to be correlated with step-likebehaviour of facet height ðzfacetÞ value in time, theperiod of increase in facet diameter correspondingto the constant value of zfacet and the period ofdecrease in facet diameter corresponding to the
J. Gladi!c et al. / Journal of Crystal Growth 242 (2002) 517–532530
increase of zfacet value. The process bears resem-blance to ‘‘burst-like’’ growth mode reported [40]for 4He solid/liquid interface at 2mK. Thesegrowth dynamics features surely do affect thecrystal shape during gradual approach to idealequilibrium form, especially in the immediatevicinity of facets. They seem to be present duringcrystal growth in such diverse systems as solid 4Heand Cu2�xSe, and could be recognised in theequilibration–relaxation process of small Pb crys-tallites after an abrupt change in temperature [41].
Thus, if we accept that the y=1.082 behaviourof our crystal profile in the immediate vicinity ofthe facet edge is of the dynamic origin, one wouldexpect that in the case of non-growing, ideallyequilibrated crystal, the same y ¼ 3
2critical beha-
viour would prevail in this region. In that case they ¼ 3
2fit would be extending from the facet edge all
the way up to jE171, in accordance withpredictions. (Note that the observed facet radiusxc � x0 ¼ 0:6934mm of the crystal analysed hereis E18% larger than the facet radiusxc � x0 ¼ 0:5882mm that comes out as the fittingparameter from the y=1.499 critical behaviour inthe stepped region. Seemingly, the sample was‘‘quenched’’ in the growing part of the facet sizeoscillation cycle.)
Using the hereby established reliable, high-resolution method of crystal shape analysis (givingintervals of different behaviour and values of yand x0 independently), one should try observingthe crystal shape in situ during growth andcorrelating it with simultaneous observations ofgrowth dynamics features as the equilibrium formis approached.
References
[1] C. Rottman, M. Wortis, J.C. Heyraud, J.J. M!etois, Phys.
Rev. Lett. 52 (12) (1984) 1009.
[2] C. Jayaprakash, W.F. Saam, S. Teitel, Phys. Rev. Lett. 50
(25) (1983) 2017.
[3] J. S!aenz, N. Garc!ıa, Surf. Sci. 155 (1985) 24 and references
therein.
[4] J.J. M!etois, J.C. Heyraud, Ultramicroscopy 31 (1989) 73.
[5] H.P. Bonzel, Progr. Surf. Sci. 67 (2001) 45.
[6] J.C. Heyraud, J.J. M!etois, J. Crystal Growth 50 (1980)
571.
[7] J.C. Heyraud, J.J. M!etois, Acta Metall. 28 (1980) 1789.
[8] J.C. Heyraud, J.J. M!etois, Surf. Sci. 177 (1986) 213.
[9] J.J. M!etois, J.C. Heyraud, Surf. Sci. 180 (1987) 647.
[10] J.J. M!etois, J.C. Heyraud, Ultramicroscopy 31 (1989) 73.
[11] J.M. Bermond, J.J. M!etois, J.C. Heyraud, F. Floret, Surf.
Sci. 416 (1988) 430.
[12] Y. Carmi, S.G. Lipson, E. Polturak, Phys. Rev. B 36
(1987) 1894.
[13] A.V. Babkin, H. Alles, P.J. Hakonen, A.Ya. Parshin, J.P.
Ruutu, J.P. Saram.aki, Phys. Rev. Lett. 75 (18) (1995) 3324.
[14] A.V. Babkin, H. Alles, P.J. Hakonen, J.P. Ruutu, J.P.
Saram.aki, A.Ya. Parshin, J. Low Temp. Phys. 101 (1995)
525.
[15] M. Elbaum, Phys. Rev. Lett. 67 (21) (1991) 2982.
[16] T. Ohachi, S. Imai, T. Tanaka, H. Yamai, I. Taniguchi,
Solid State Ion. 28–30 (1988) 1160.
[17] T. Ohachi, I. Taniguchi, J. Crystal Growth 65 (1983) 84.
[18] T. Ohachi, I. Taniguchi, in: P. Vashishta, J.N. Mundy,
G.K. Shenoy (Eds.), Fast Ion Transport in Solids, Elsevier
North-Holland, Amsterdam, 1979, p. 597.
[19] Z. Vu$ci!c, J. Gladi!c, J. Crystal Growth 205 (1999) 136.
[20] Z. Vu$ci!c, J. Gladi!c, Fizika A (Zagreb) 9(1) (2000) 9 (http://
fizika.phy.hr/fizika a/av00/a9p009.htm).
[21] E.M. Lifshitz, L.P. Pitaevskii, Landau and Lifshitz Course
of Theoretical Physics, Vol. 5, Statistical Physics, 3rd
Edition, Part 1, Pergamon Press, Oxford, 1980.
[22] M. Wortis, Equilibrium crystal shapes and interfacial
phase transitions, in: R. Vanselow, R. Howe (Eds.),
Chemistry and Physics of Solid Surfaces, Vol. 7, Springer,
Berlin, 1980.
[23] S. Balibar, C. Guthmann, E. Rolley, J. Phys. I France 3
(1993) 1475.
[24] E. Rolley, C. Guthmann, E. Chevalier, S. Balibar, J. Low
Temp. Phys. 99 (5/6) (1995) 851.
[25] A.F. Andreev, Zh. Eksp. Teor. Fiz. 80 (1981) 2042.
[26] V.L. Pokrovsky, A.L. Talapov, Phys. Rev. Lett. 42 (1979)
65.
[27] E.E. Gruber, W.W. Mullins, J. Phys. Chem. Solids 28
(1961) 875.
[28] T. Ohachi, I. Taniguchi, J. Crystal Growth 40 (1977) 109.
[29] T. Ohachi, B.R. Pamplin, J. Crystal Growth 42 (1977) 592.
[30] J.R. Parker, Algorithms for Image Processing and
Computer Vision, Wiley Computer Publishing, Wiley,
New York, Chichester, Brisbane, Toronto, Singapore,
Weinheim, 1997.
[31] W.H. Press, B.P. Flannery, S.A. Teukolsky, W.T. Vetter-
ling, Numerical Recipes, The Art of Scientific Computing
(FORTRAN), Cambridge University Press, Cambridge,
New York, New Rochelle, Melbourne, Sidney, 1987,
p. 523.
[32] K. Arenhold, S. Surnev, H.P. Bonzel, P. Wynblatt, Surf.
Sci. 424 (1999) 271.
[33] D.S. Fisher, J.D. Weeks, Phys. Rev. Lett. 50 (1983) 1077.
[34] F. Gallet, S. Balibar, E. Rolley, J. Physique 48 (1987) 369.
[35] A.V. Babkin, D.B. Kopeliovich, A.Ya. Parshin, Zh. Eksp.
Teor. Fiz. 89 (1985) 2288.
J. Gladi!c et al. / Journal of Crystal Growth 242 (2002) 517–532 531

[36] P.E. Wolf, F. Gallet, S. Balibar, E. Rolley, P. Nozi"eres,
J. Phys. 46 (1985) 1987.
[37] E. Rolley, E. Chevalier, C. Guthmann, S. Balibar, Phys.
Rev. Lett. 72 (6) (1994) 872.
[38] K. Arenhold, S. Surnev, H.P. Bonzel, P. Wynblatt, Surf.
Sci. 417 (1998) L1160.
[39] Z. Vu$ci!c, D. Lovri!c, J. Gladi!c, in preparation.
[40] J.P. Ruutu, P.J. Hakonen, A.V. Babkin, A.Ya. Parshin,
J.S. Penttil.a, J.P. Saram.aki, G. Tvalashvili, Phys. Rev.
Lett. 76 (1996) 4187.
[41] K. Th .urmer, J.E. Reutt-Robey, E.D. Williams, M. Uwaha,
A. Emundts, H.P. Bonzel, Phys. Rev. Lett. 87 (2001)
186102.
J. Gladi!c et al. / Journal of Crystal Growth 242 (2002) 517–532532
Related Documents