I " I r I i ! , I v DOT! FAA! PM·86!39,11 Program Engineering and Maintenance Service Washington, D.C. 20591 Criteria for Asphalt-Rubber Concrete in Civil Airport Pavements Vol. II-Evaluation of Asphalt-Rubber Concrete Denise M. Hoyt Robert L. Lytton Freddy L. Roberts Texas Transportation Institute Texas A&M University College Station, Texas March 1987 Final Report This document is available to the public through the National Technical Information Service, Springfield, Virginia 22161 US Department of Transportation Federal Aviation Administration

Welcome message from author
This document is posted to help you gain knowledge. Please leave a comment to let me know what you think about it! Share it to your friends and learn new things together.
Transcript

I " I r I i .~
! , I v
DOT! FAA! PM·86!39,11 Program Engineering and Maintenance Service Washington, D.C. 20591
Criteria for Asphalt-Rubber Concrete in Civil Airport Pavements Vol. II-Evaluation of Asphalt-Rubber Concrete
Denise M. Hoyt Robert L. Lytton Freddy L. Roberts
Texas Transportation Institute Texas A&M University College Station, Texas
March 1987
Final Report
This document is available to the public through the National Technical Information Service, Springfield, Virginia 22161
US Department of Transportation
Federal Aviation Administration
N~I~
This document is disseminated under the sponsorship of the Department of Transportation in the interest of information exchange. The United States Government assumes no liability for its contents or use thereof.
r
T ...,hnl .. 1 It.,.n Doc ..... '.I1 ... Page
t. ,,_H •. 2. 0. .......... Acre ••• '''' He. lI. III~'''''. \; ...... He.
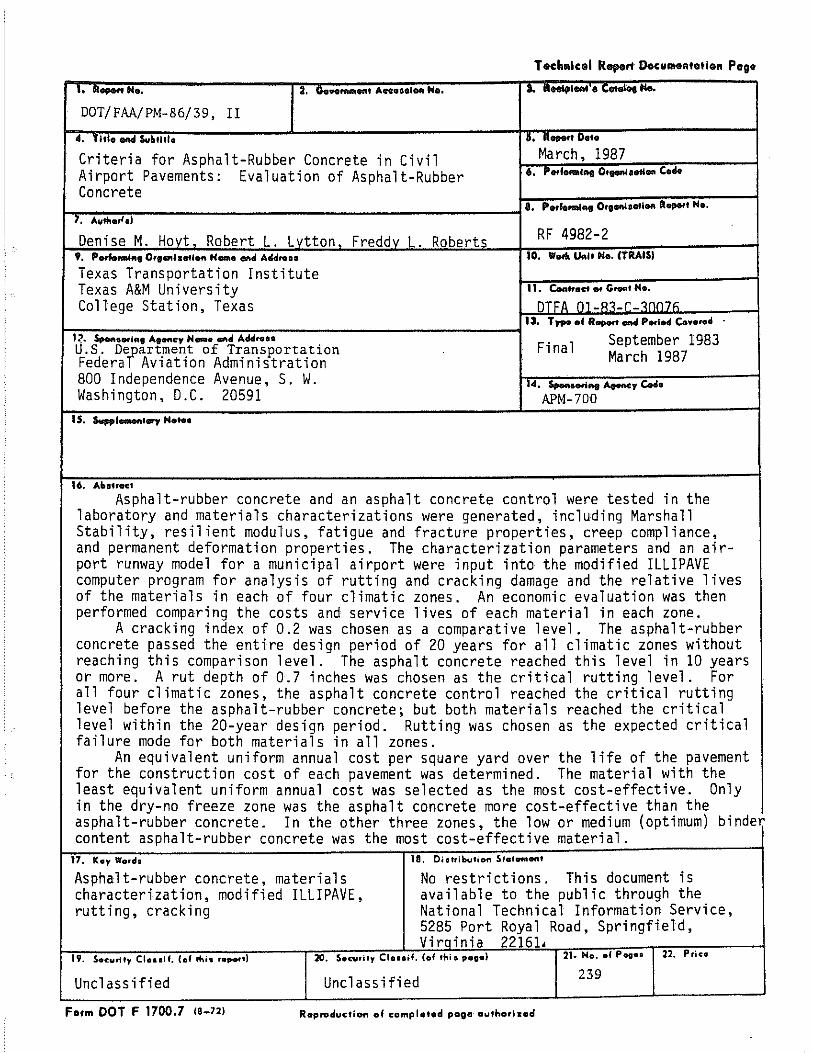
DOT/FAA/PM-86/39, II
4. Til' ..... "~III'. I"' ''_D ••• Criteria for Asphalt-Rubber Concrete in Civil March, 1987 Airport Pavements: Evaluation of Asphalt-Rubber 6. P ... , .... "I 0'..,.1 ...... CaH
Concrete .0 Perfa .. ", O'gllfti •• Ueft • .,.... H •. I. "",,,.r,) Denise M. Hovt Robert L. Lytton Freddy L. Roberts RF 4982-2
•. '., ........ 0, ... ' ... 1." Hama eftd Add,. .. 10. "' ... IMII N •• ITR"'S)
Texas Transportation Institute Texas A&M University 11. C&n"act Of Gren' He.
College Station, Texas DTFA 01-fl3-C-u. T"....f Rapet'f eM P.,I" c. .......
1~. .... • .,h •• A .... e" H .... Gft" ",.u,. .. Fi na 1 September 1983 u.s. Defartment of Transportation March 1987 Federa Aviation Administration
800 Independence Avenue, S. W. 14 ................... ,c:.d. Washington, D.C. 20591 APM-700
15. ~I"",'''''' Hahn
16. AlutfClC'
Asphalt-rubber concrete and an asphalt concrete control were tested in the laboratory and materials characterizations were generated, including Marshall Stabil ity, resilient modulus, fatigue and fracture properties, creep compliance, and permanent deformation properties. The characterization parameters and an air-port runway model for a municipal airport were input into the modified ILLIPAVE computer program for analysis of rutting and cracking damage and the relative lives of the materials in each of four climatic zones. An economic evaluation was then performed comparing the costs and service lives of each material in each zone.
A cracking index of 0.2 was chosen as a comparative level. The asphalt-rubber concrete passed the entire design period of 20 years for all climatic zones without reaching this comparison level. The asphalt concrete reached this level in 10 years or more. A rut depth of 0.7 inches was chosen as the critical rutting level. For all four climatic zones, the asphalt concrete control reached the critical rutti ng 1 eve 1 before the asphalt-rubber concrete; but both materials reached the critical level within the 20-year design period. Rutting was chosen as the expected critical failure mode for both materials in all zones.
An equivalent uniform annual cost per square yard over the life of the pavement for the construction cost of each pavement was determined. The material with the least equivalent uniform annual cost was selected as the most cost-effective. Only in the dry-no freeze zone was the asphalt concrete more cost-effective than the asphalt-rubber concrete. In the other three zones, the low or medium (optimum) binder content asphalt-rubber concrete was the most cost-effective material.
17. Kay W.,d. 18, Diotrib."tion Slah,men'
Asphalt-rubber concrete, materials No restrictions. This document is characterization, modified ILLIPAVE, available to the public through the rutting, cracking National Technical Information Service,
5285 Port Royal Road, Springfield, Virainia 22161.
19. Socurity CI.nil. (of rhi. , • .,.,.1 20. S.a.lrity Ctuoif, (of .hi. ,8G8) 21. Ho .• f POtJo, 22. P rica
Unclassified Unclassified 239
Form DOT F 1700.7 (8_72) Reproduction of compl ••• d pogo authorl •• d

~,
~,
~,
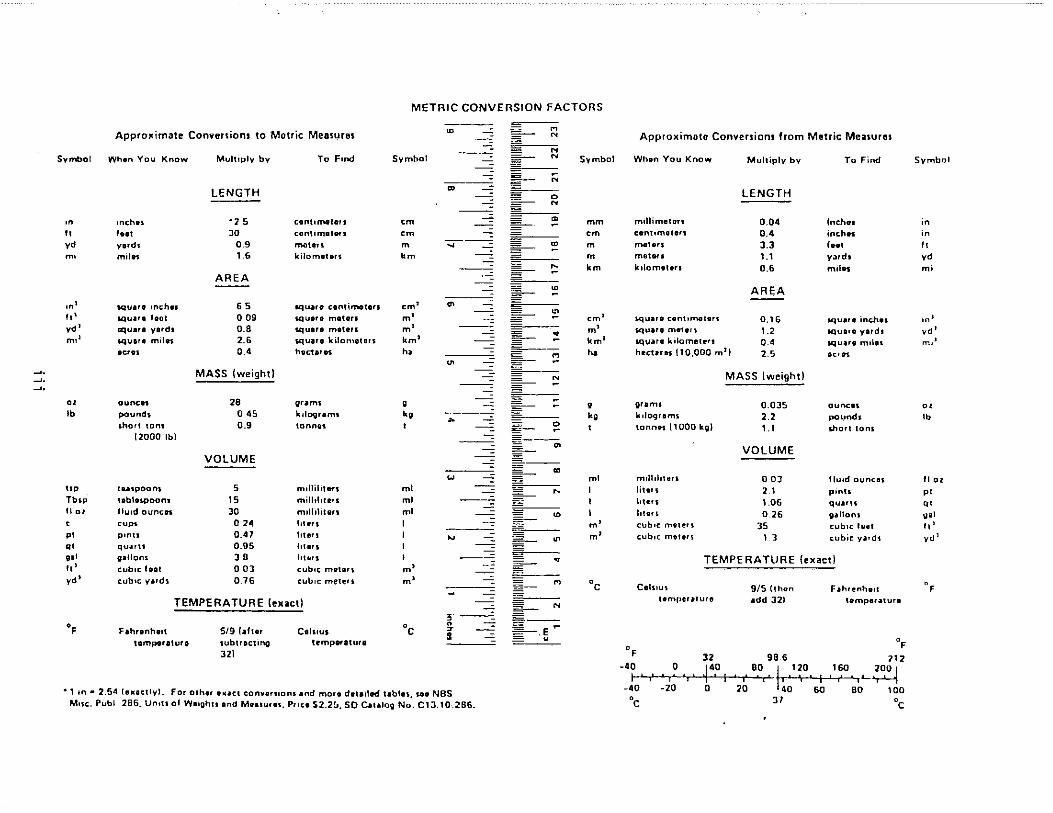
METRIC CONVERSION FACTORS
Svmbo l
,n
" yd m,
,n' ", yd'
m"
a, Ib
". Tblp
II 01
.' .' g" II'
yd'
OF
Approximate Conversions to Motric Measures
Whon You Know
Incho,
foot vord, milO1
squlro Incho. IqUIfO foot ~uorl Vlrdl IqUlr. mihn .UOI
DUne" pound, 'hor! ton.
[2000 Ibl
I""poon, llblo",oon.
flUid DUnC"
CUI>'
plnn qU,HtI
gallom
cubiC hit cubIC Vllds
Multiply bv
LENGTH
'75 30
0.' ,. AREA
.5 00. 0.8 2 .•
0.'
MASS Iweigh,l
28 0'5 0.'
VOLUME
5 IS 30 0" 0.41 0.95 38 003 0.76
To Fmd
tOntlmotlf' contimalOfI mal.n kilo mat on
Iqwra tlmimotars loQuor. motors loQu.ra mIte" Iqu.,a kilonl8tor, hoct.un
graml k,lD'ijr.ml ton no,
mll1illlotl
milltll'er, millIlIter, hICn, Ittllr, itler, IlIlIr,
cubiC metor,
CUl1lC mll!lIHI
TEMPERATURE 1 ••• c,1
Fah,onh.lt tlmper.tur,
5/9 (Iftor IUbHICtino
321
Col'lus lemp.,.luto
Svmbol
<m em m km
em' m' m' km' h_
g
kg
ml ml ml I
m' m'
°c
m
m
...
'"
'"
..
w
....
, n ~
S
., In .. 2.54 (itlillctly" For othor ouct connr110m .nd moro dotiliod ,obi." soo NBS MISC. Publ 286. Un.n of Wllghll and MOOIUfOl, P'ICO S2.2tt. SO Catllog No. C1J. to;286.
~
=-
~
N
N N
;;
o N
'" '" ~
m
" .= '"
= M
N
~- ~ ~- en
;;;;;: III
~
'" ~
'" ~
~
= N
= -:;~
Symbol
mm em m
m km
om' m' km' ha
g kg
ml I I I m' m'
°c
Approximote Conversiom from Metric Me;u.urel
Whon You Know
millimlltuTi (entlmo'o',
mate" me'efl kllomolol1
MultiplV by
LENGTH
0.04 0.' 3.3 1.1 0 .•
AREA
"<lUUO confuTlcne'l 0.16 Iquorl m01"l 1.2 ~u .. re kilomfl!Il!" 0.4 hll!ctoros (10.000 mIl 2.5
gram' k,loqloms
tonn ... t' 000 kg)
m,II,I,'or, lit., ,
lite" h,." cub.c m.t~f\
cubiC mol,,,
MASS Iweightl
0.035 2.2 1.t
VOLUME
O.OJ 2. I 1.06 02.
35 I 3
To Find
Inch •• inchot fool yards mlll.'I
loqu.ro inchos
IQUO'O vordl IqUiIlro milo,
OC'"
ourw::o, pound, ihor' ton,
flUid ounce,
plnll
qUlin
gll10nl cubiC IU8t
cubit ylrd,
TEMPERATURE lexactl
ells,u\ tomperllurfl
9/5 {than odd 321
Flh'll!nhol! lampo,alur.
0, (IF 32 98.6 112
-4fl I!?' I .1 4,0
1 IBO,~20. I 1'~' ~.~~Oi
! 1 I It. I -40 -20 0 20 40 60 60 lOa
(Ie 31 0e
Symbol
in in
" yd mi
on' vd ' m,'
a. Ib
flo1 .' Q'
u- ' ", yd'
0,


ACKNOWLEDGEMENTS
The authors extend appreciation to Dr. Aston McLaughlin of the FAA who served as the contract technical representative and who met with
project personnel on several occasions to discuss project progress. His
comments were always helpful and incisive and his assistance with decisions involving certain elements of the research helped immeasurably.
Mr. Robert A. Benko of the Great Lakes Region of the FAA is to be thanked for sharing his experience and valuable data on the construction
of Wexford County Airport, Cadillac, Michigan. This project included a rubberized bituminous surface course constructed with unvulcanized synthetic rubber in liquid latex form. While the rubberized bituminous material is quite different from the asphalt-rubber material produced
from scrap rubber, the construction experience was useful for the
recommendations made in this report on construction guidelines. We want to extend our thanks to two consultants who provided valuable
literature and special help in preparing the specifications for field
preparation of asphalt-rubber materials: Dr. Rudy Jimenez and Ray Pavlovich. Thanks also is due to Dr. Scott Shuler and Cindy Adams who
coordinated their work with ours so that the most effective use of
available research funds could be realized.
v
PREFACF
This report is the result of a project ~I)onsorpd by the Federal
Aviation Administration, U.S. Department of Transportation, and conducted
by the Texas Transportation Institute (TTl) of Texas A&M UniverSity.
This is the second of two reports on contract number DTFA OI-83-C-30076 "Criteria for Asphalt-Rubber Concrete in Civil Airport
Pavements" and it includes the testing and material characterization of
an asphalt-rubber concrete and an asphalt concrete control, a performance
evaluation, and an economic evaluation of the cost-effectiveness of the
two materials.
vi
TABLE OF CONTENTS
DISCLAIMER • • .
ACKNO~LEDGEMENTS
PREFACE. • . . • LIST OF TABLES.
LIST OF FIGURES.
CHAPTER
I. INTRODUCTION.
A. Objectives B. Scope of Volume I.
C. Scope of This Volume
II. LABORATORY EVALUATION OF ASPHALT-RUBBER CONCRETE.
A. Overall Testing Objectives •.•• B. Selection of Materials for Testing
a. Aggregate •••.•.•.•. b. Asphalt Concrete Control Mix
c. Asphalt-Rubber Concrete Mi x. C. Design of Experiments •••••.
D. Testing Program and Characterization of Materials.
a. Marshall Stability •.••••• b. Resilient Modulus •••••••• c. Fatigue Testing and Fatigue Parameters d. Overlay Testing and Fracture Properties.
e. Creep Testing and Creep Compliances •.• f. Repeated Load Testing and Permanent Deformation
Parameters ............... .
III. PERFORMANCE PREDICTION OF ASPHALT-RUBBER CONCRETE AND ASPHALT CONCRETE.
A. Design Data ••• a. Airport Type and Traffic
vii
iv
v
vi
x
xii
1
1
2
2
3
3
4
4
5
12
17
IB 19
19
24
3B
47
59
71
71
71
Section Page
IV.
b. Pavement Structure •.
c. Environmental Effects and Seasonal Temperatures
B. Evaluation of Airport Pavement Performance.
a. The Modified ILLIPAVE Program
1. Permanent Deformation •• b. Maximum Stresses and Strains. c. Cracking Analysis: Comparison by Aircraft.
d. Permanent Deformation Analysis: by Aircraft •..••.•••.
Comparison
e. Mixed Traffic Damage Evaluation: Comparison of Mixes •••••
. . .
f. Relative Lives of Airport Pavements in Different
78
78
81
81
82
84
85
90
91
Climatic Zones. . • . • . . . • . . • • • . . 98
COST-EFFECTIVENESS COMPARISON BETWEEN ASPHALT-RUBBER CONCRETE AND ASPHALT CONCRETE. • • • • • . .•.
A. Cost Data for Asphalt-Rubber Concrete and Asphalt Concrete .••.••....
B. Cost-Effectiveness Analysis Based on Projected Lives
99
99
of Pavements. . • • • • • • • • • • • 102
a. Construction Cost Per Square Yard. . • • • 102 b. Equivalent Uniform Annual Costs per Square
Yard of Materials in Place. • • • . 103
V. SUMMARY, CONCLUSIONS, AND RECOMMENDATIONS. 107
A. Modifications to the Marshall Method of for Asphalt-Rubber Concrete · · · · . . a. Aggregate Gradation · · · · . . b. Mixing and Compaction Temperatures.
c. Mixing. . . . . . • · d. Compactive Effort. • • e. Extrusion of Specimens from Molds f. Air Void Content. . · . · · · ·
B. Differences in Material Properties.
a. Compaction and Air Voids.
b. Stability ••••••••
viii
Mix Design 107
107
108
108
108
108
109
109
109
110
Sect ion Paqe
c. Resilient Modulus. • . • • • • . . . • • • • • 110
d. Creep Compliance and Temperature Susceptibility 110
e. Beam Fatigue Tests. • • . • • • • • • 111
f. Crack Propagation and Fracture Tests. 111
g. Permanent Deformation. 112
c. Predicted Field Performance
D. Life-Cycle Cost Analysis •.
E. Recommended Future Research
F. Recommended Future Practice
112
113
113
114
REFERENCES 115
APPENDIXES
A. Suggested Guide Specification For Production Of Asphalt-Rubber Binder And Its Use In Construction. •• 118
B. Changes To Asphalt Concrete Mix Design Procedures And Construction Guidelines For Use Of Asphalt-Rubber Concrete As A Pavement Material. • • • • • • • • . . 127
C. Permanent Deformation Analysis: Strain Versus Cycles To Failure Plots. • . • • • • • • • • • • • • • • I?:
D. Permanent Deformation Parameters For All Material, Aircraft, And Temperature Combinations; And Sample Plots, Permanent Deformation Parameters Versus Temperature .•.•..••.••••.•.••..
E. Summary Of Aircraft Data; And Calculated Estimates
156
For Tire Contact Pressure Distributions. • • • • • 181
F. Beam Fatigue Laboratory Data For Asphalt Concrete And Asphalt-Rubber Concrete. • • • • • . • • 187
G. ILLIPAVE Damage Results, With Description Of Calculations For Combined Traffic Damage. • 194
ix

LIST OF TABLES
Table Page
2
3
4
5
6
7
8
9
10
11
12
13
14
15
1977 FAA Aggregate Grading Band for Bituminous Surface Course with 1/2" (12.5mm) Maximum Particle Size*. • 6
Weight Percentages Used From Each Type of Aggregate Obtained From the Producer •••••••••
Calculation of Modified Aggregate Gradation for Rubber Particles in Asphalt-Rubber Concrete Mix ••.•••.•
Material Parameters Calculated from Laboratory Fatigue Tests Performed in This Study •••••••••.•.•
Comparison of the Fatigue Parameter K2 from Laboratory Tests Conducted in This Study to the Parameter K2 Calculated From the Regression Equation Developed in Reference 17 •••••••••••••••••••
Regression Equations Generated From Laboratory Data and Used to Predict Fatigue Parameters for Any Temperature (OF) ..••••••.....••...
Fatigue Parameter Values Calculated for Selected Temperatures from Regression Equations Developed for the Materials in this Study
Results of Fracture Tests.
Slopes of the 10910 A Versus n Graph.
Creep Compliance of Asphalt-Rubber and Asphaltic Concrete Materials ••.•••••••••••
Creep Compliance Properties of Asphalt-Rubber Concrete and Asphaltic Concrete Materials
Time-Temperature Shift Constants.
Calculated Fracture Exponents ••
Permanent Deformation Parameters From Lab Tests
Stresses in Top Pavement Layer Used to Calculate Permanent Deformation Parameters for the Field Conditions (Aircraft Loads) •••••••••••
x
. . . . .
8
14
30
33
36
37
43
46
49
51
55
58
64
66
Table
16
17
18
19
20
21
22
23
24
25
26
Summary of Aircraft Traffic Data From the Aviation Department, City of Austin, Texas •.••.
SUlTll1ar'y of Ai rcraft Traffic Wander Factors for Each Aircraft Considered in the Pavpment Evaluation.
SUlTll1ary of Aircraft Passes Per Da'y = [Total Yearl'y Traffic x Wander Factor/365 Da'ys Per Year] ••••
Average Seasonal Temperature for Each of Four Seasons for Each Climatic Zone. • • •• • •••••••
Stresses Calculated Under the Main Gear Assemblies of the DC-10 and B-727 at Various Depths ••••
Rankings of Each of the Five Aircraft Relatin9 Several Aircraft Characteristics to the Pavement Damage Indicators • • ••••••••
Field Cracking Indices for Combined Traffic at 20 Years. • • • • • . •.•••.
. . . . .
Times to Rut Depths of 0.7" or More for Combined Traffic and for Various Materials and Climatic Zones
Representative Prices (1984) for Asphalt-Rubber Binders per Ton, as Used in Chip Seal and Interlayers* •••.••.••••.•••.•
Unit Cost Per Ton of Material in Place for Asphalt Concrete and Asphalt-Rubber Concrete
In-Place Costs Per Square Yard for Asphalt Concrete and Asphalt-Rubber Concrete ••••••••••••
27 Equivalent Uniform Annual Construction Costs Per Square Yard of Asphalt Concrete and Asphalt-Rubber Concrete •••••••••• . . . . . . . . . . . . . . .
xi
Page
73
74
76
80
86
89
93
96
100
101
104
106

Fi gu re
2
3
4
5
6
7
fl
LI ST OF F I {;IJlH \
1977 FAA Specification Aggregate (;radinq Rand for 1/2-inch Maximum Particle Size; Mid-Rand Gradation is Shown ..••....•.....•.....•• . . . Aggregate Rlends Resulting from Two Sieve Methods and FAA Specification Aggregate Gradation (Mid-Band).
Test Property Curves for the Marshall Method Mix Design for the AC-10 Asphalt Concrete Control Material ••••
Gradation of the Rubber in the Victoria Asphalt-Rubber Binder .•.••.••.•••...••......
Property Curves for the Marshall Method Mix Design for the Victoria Asphalt-Rubber Concrete Material •
Comparison of Marshall Stabilities of Mixes Used in the Testing Program •••••••••••••••
Plots of Resilient Modulus Versus Temperature for Each of the Four Materials in This Study •••
Combined Plot Showinq Resilient Modulus Versus Temperature for the Four Materials in This Study.
. .
9 Repeated Flexural Apparatus Used for Beam Fatigue
10
11
12
13
14
15
Tests . . • . . . . . . . . . . . . . . . . . . . . . . . Computer Printout of Fatigue Data Analysis and Calculated Fatigue Parameters.. • •••••
Computer Plot of Laboratory Fatigue Test Results.
Combined Plot of Fatigue Parameters Calculated from Laboratory Data • • • • • • • • • • • • • • • • •
Plots of Ilog Kli Versus Log T Showing Laboratory Data Points and Linear Regressions ••••••••
Plots of K2 Versus Log Kl Showing Laboratory Data Points and Linear Regressions ••••••••••
. . . .
Schematic Diagram of the Texas Transportation Institute Overlay Tester ••••••••••• . . . . . . .
xii
Page
7
9
11
13
16
20
22
23
26
28
29
31
34
35
39

Fi gu re
16
1 7
18
19
20
21
22
23
24
25
26
27
28
Computed Relation Between Change of Strpss Intensity Factor and Crack Length ••••••••.••••••
Typical Graph of Crack Speed Versus Chanqe of Stress Intensity Factor ••••
Graph of Lo91O A Versus n
Creep Test Sample with LVDT Measuring Collar and Test Equi pment • • • • • • • .
Typical Plot of Creep Compliance Versus Time.
Time-Temperature Shift Function aT as a Function of Temperature ••••••••••••••••••
Typical Plot of Strain Versus Number of Loading Cycles.
Typical Repeated Load Test Results Showing Total and Accumulated Strains •••••••••••••••••
Calculated Contact Pressures (psi) for Two Different Ti re Loads •••••••.•••••••••
Schematic of the Pavement Structure Used in the ILLIPAVE Analysis. • • • • •••
Plot of Relative Cracking Index Cracking Comparison of the Five Traffic Pattern. • •••
Versus Year Showinq Aircraft in the Mixed
Plots of Cracking Index (Adjusted to Field Fatigue Condition) for Combined Traffic Versus Year, Showing Four Materials in Each Climatic Zone •••••••••
Plots of Rut Depth Versus Year for Combined Traffic, Showing Four Materials in Each Climatic Zone •••••
xiii
Page
41
42
45
48
50
53
60
61
77
79
88
94
97

CHAPTER I. INTROOUCTION
The introductory chapter in the first volume of this report gives
some historical background on the development and use of asphalt-rubher
in highway pavements.
That introduction highlighted the interest that has been shown by thR
engineering community in the use of asphalt-rubber since it was developed
by Charles H. McOonald, Consulting Engineer, Phoenix, Arizona beginning
in the 1960's. It also suggested some of the areas in which there are
additional needs for information concerning field performance,
relationships between laboratory-developed properties and performance,
design techniques, specifications and tests for compliance and
construction practices.
Airport pavements are special cases that have not heen treated widely
in the literature and they pose special problems for the asphalt-rubber
mixes hecause of the high tire pressures and multiple loads that are
applied.
OBJECTIVES
The primary ohjectives of the research in this project are to:
1. Develop processes for preparing asphalt-rubber binders in the
laboratory that have properties similar to those produced in the
field.
2. Modify the FAA laboratory asphalt concrete mixture design
procedure for use with these asphalt-rubber binders.
3. Determine the engineering properties of typical asphalt-rubber
concrete materials.
4. Perform a cost-effectiveness analysis to determine if these
materials should be considered as alternatives in future
designs.
5. Develop model specifications and construction procedures for the
use of these materials in the field.
1

SCOPE OF VOLUME 1
The first volume of this report DOT/FAA/PM-86/39, entitled "Criteria
for Asphalt-Rubber Concrete in Civil Airport Pavements: Mixture Desiqn",
addressed Objectives One and Two and the model sppcifications in
Objective Five. Specifically, that volume includerl the development of
the laboratory procedure for preparing asphalt-ruhher for use in mixture
design, the development of the mixture design procedure, and the guide
specifications for field production of the asphalt-rubber binders.
SCOPE OF THIS VOLUME
This volume is concerned with the remaining Objectives, numbers Three
and Four, and the construction procedures in Objective Five.
Specifically, this volume includes the laboratory tests for materials
characterization of asphalt rubber in stability, modulus, fatigue,
fracture, creep, and permanent deformation; the prediction of the
performance of airport pavements under a variety of climatic conditions;
the comparison of costs of asphalt concrete and asphalt-rubber concrete
over their predicted performance lives; and the production and
construction procedures which should be used with asphalt-rubber CQncrec=
to achieve a uniformly high quality pavement which performs well U"~~'
aircraft traffic. The production and construction procedures are
included as Appendix A and the remaining appendixes record the data on
material properties, aircraft, and tire contact pressures that were used
in this report.
2

CHAPTER I I. LABORATORY EVALIIAT ION or I\SI'HI\U -RIJR8ER CIINCRETE
This chapter presents the results of a testinq proqram to determine
the materials characteristics of asphalt-rubher concrete with low,
medium, and high binder contents and a commonly used asphalt concrete
with an AC-10 asphalt cement binder. These properties are used in
predicting the relative performance of airport pavements constructed with
these materials, which are, in turn, used in a cost-effectiveness
analysis of these materials.
The materials properties and the tests that are used to determine
them are presented in this chapter. The materials properties include:
1. Stability (Marshall Stability)
2. Modulus (Indirect Tension Loading)
3. Fatigue (Beam Fatigue Loading)
4. Fracture ("Overlay" Test)
5. Creep Compliance (Creep Test)
6. Permanent Deformation (Repeated Load Test)
Each of the tests will be described followed by typical results of
the testing of each of the four mixes that are considered.
OVERALL TESTING OBJECTIVES
The tests on each of the four mixes were made to determine the
properties of asphalt-rubber concrete and asphalt concrete at a variety
of temperatures and typical loading rates so as to allow the prediction
of the performance of a typical airport pavement in four different
climatic zones: (1) wet-freeze, (2) wet-no freeze, (3) dry-freeze, and
(4) dry-no freeze. More will be explained about these climatic zones in
the chapter on performance prediction. The computer program used in the
analysis is capable of taking into account th~ seasonal changes of
temperature and material properties that occur during the life of the
pavement. Also, by determining the stiffness of each of the four mixes
at different temperatures, it is possible to determine the temperature
susceptibility of each mix; i.e., those mixes which change modul~s the
3

most will hI' thp. most advl'rsf'ly iltfE'ctf'd by temrprature chanqes in the
field.
All samples of asphalt-rubher concrete that were used for testing
were prepared in accordance with the modifications to the Asphalt
Institute's MS-2 manual procedures that were recommended in Volume I,
except that a compaction temperature of 3750 F (191 0 C) was found to be too
high to compact the beam specimens used for fatigue and overlay testing.
The asphalt-rubber concrete material at 3750 F (191 0C) moved too much
under the compactor to be well-compacted. Therefore, a lower compaction
temperature (325 0 F, or 1630 C) was used for all specimens prepared in the
mix design and materials characterization in this portion of the study.
The asphalt concrete samples were prepared in accordance with the MS-2
manual procedures as they are.
The sample preparation and testing were done with one primary
objective in view: to permit a realistic comparison of asphalt-rubber
concrete with ordinary asphalt concrete performance and
cost-effectiveness when they are used in airport pavements.
SELECTION OF MATERIALS FOR TESTING
Aggregate
A mixture of crushed limestone and field sand was chosen for the
aggregate, as these materials generally produce a high quality mix which
performs well in both test and field conditions. A maximum particle size
of 1/2" (100 percent passing the 1/2 in. sieve; some retained on the 3/8
in. sieve) was chosen. ASTM C125 defines the maximum size of coarse
aggregate as the smallest sieve opening through which the entire sample
passes (Ref 1). The aggregates were blended to meet the 1977 FAA
aggregate grading specification for pavements with a bituminous surface
course and designed to accommodate aircraft with gross weights of 60,000
pounds (27,000 kg) or more, or with tire pressures of 100 psi (690 kPa) or
more (Ref 2). This grading band is similar to the 1983 ASTM
specification grading band for bituminous paving mixtures and 3/8"
4
nominal maximum siz~ of aggreqate (InO pf'rcf'n~. passing t.hE' 1/2 in. sieve;
some retained on the 3/8 in. sieve) which is r:onnnnnly usen for hiqhway
pavements carrying heavy truck traffic (Ref I). ASrM grading
requirements are hased upon nominal maximum size which allows for a sinal I
percentage (usually about 5%) of the sample weight to he retained on that
sieve (Ref 1). The percents of material passing through standard sieve
sizes for the FAA and the ASTM specifications are shown in Table 1.
The middle of the FAA grading band was chosen as the target for the
combined aggregate grading. The band and the mid-band gradation are
shown in Figure 1.
The limestone and the field sand were obtained from White's Mines in
Brownwood, Texas. The limestone was obtained from the producer in four
different sizes and the material was weighed from each batch of material
as shown in Table 2. The limestone dust had to be sieved before use
because it contained too high a percentage of fines (material passing the
#200 sieve) to meet the grading specifications. The field sand was
sieved through the #B sieve before use to remove sticks and organic
debris and to break up large clods.
Two sieving methods were used to produce a final aqgreqate hlend.
For the initial testinq which was descrihed in Volump 1 of this renort.
small hand shakprs were IIs~d and only t.hp 1 imestone dust. was sieved, as
described above. However, this was found to be a very time-consuminq
process and was not satisfactory for the production of the samples needed
for the material characterization and testing described in this volume.
A sieve method in which all of the limestone and field sand materials
were sieved through large sieves on a Gillson mechanical shaker was
therefore adopted. The combined aggregate was then produced by weight
from the resulting sized material. Both sieving and weighing methods met
the mid-band of the FAA grading specification, and are shown in Figure 2.
Asphalt Concrete Control Mix
The material chosen for the control was an AC-10 Lab Standard
(American Petrofina was used). A Marshall mix design was performed and
5

TABLE 1. 1977 FAA Aggregate Grading Band for P,itJminous Surface Course with 112" (12.5 mm) Maximum Particle Size.*
Sieve Size
1/2 ; n. (12.5mm)
3/8 in. (9.5mm)
#4 (4.75mm)
#8 (2.36mm)
#16 (1. l8mm)
#30 (600)Jm)
#50 (300)Jm)
#100 (150)Jm)
#200 (7 5)Jm)
% passing (by weight)
FAA Specification ASTM Specification
100
79-93
59-73
46-60
34-48
24-38
15-27
8-18
3-6
100
90-100
55-85
32-67
7-23
2-10
*For aircraft weighing 60,000 pounds or more or with tire pressures of 100 psi or more; compared with the 1983 ASTM aggregate grading band for bituminous paving mixtures with 3/8" (9.5 mm) nominal maximum size of aggregate.
6

Cl Z Ul Ul « 11.
I-Z w ..... u cr W 11.
-' ... ... 0 I-
200 100 50 30 16 6 4 3/6' 1/2' 3/4' 100
90
80
E-
~ .I
=-- /I 70
60
/ V// = // V =--
50
40
30
20
10
0
~ ~ // =-- ~ V/ /
/ ~ V
I: /" b /' c
=-- ~ :? "/
~ ,
-
200 100 50 30 16 8 4 3/8' 1/2' 3/4'
AGGREGATE GRADATION
Figure 1. 1977 FAA Specification ft.ggregate Grading ~and for liZ-Inch f.1aximum Particle ~ize; Mid-Band Gradation is Shown.
1-1' 100
90
80
70
60
50
40
30
20
10
0 1- l'

TABLE 2. Weight Percentages tJsed From E~ch Typp of Agqregate Obtained From the Producer.
Material/Size
-1/2", +3/8" only, limestone
3/8" grade limestone, as supplied by producer
1/4" grade limestone, as supplied by producer
Brownwood field sand
Limestone dust (crusher supply), as supplied by producer then broken down by the following sieves:
Sieve Size
#8
#16
#30
#50
#100
#200
passing #200
8
"/, Used
13.5
12.9
17.2
17.2
1.8
12.5
9.8
8.1
0.0
5.2
1.8

<!l z iii rn « Il.
.... Z UJ ()
\D II: UJ Il.
..J « .... 0 ....
200 100 50 30 16 8 4 3/8" 1/2" 3/4" 100
90
80
70
60
50
40
30
20
10
0- ~ l :----
0 o Target Gradation-FAA h~ I:: Specification, mid -band
,/ E r- 1:>-. ~ First (Earlier) Sieve Method
~ 0- - -0 Second (Later) Sieve Method
~ r r-
I: // § /. /" to V E-
L1
=- V . ~
~ =-- ..-0-/ . /
~ 7 ~ l: /t /
E ~-E 0 ...
200 100 50 30 16 8 4 3/8" 112" 3/4"
AGGREGATE GRADATION
Figure 2. Aggregate Blends Resulting ft'OIll rlVll Sil've t-lethods and FAA Specification Aggregate Gradation (Mid-Band),
1-1" 100
90
80
70
60
50
40
30
20
10
o 1-1"
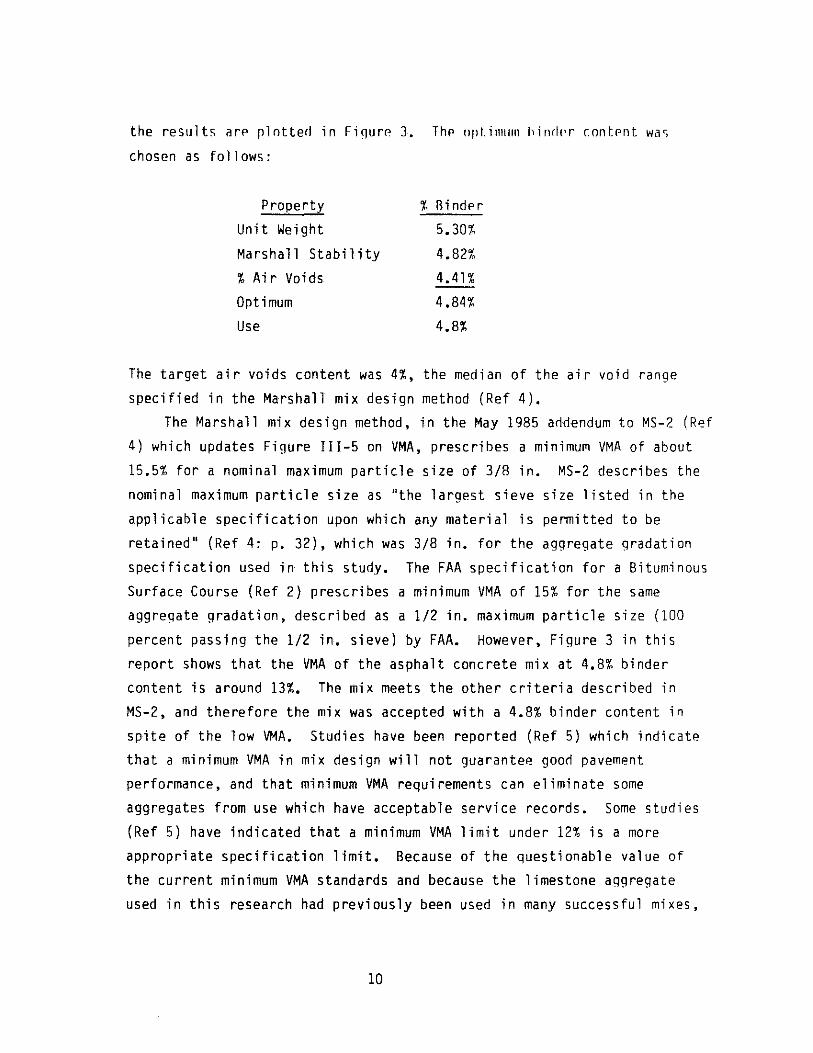
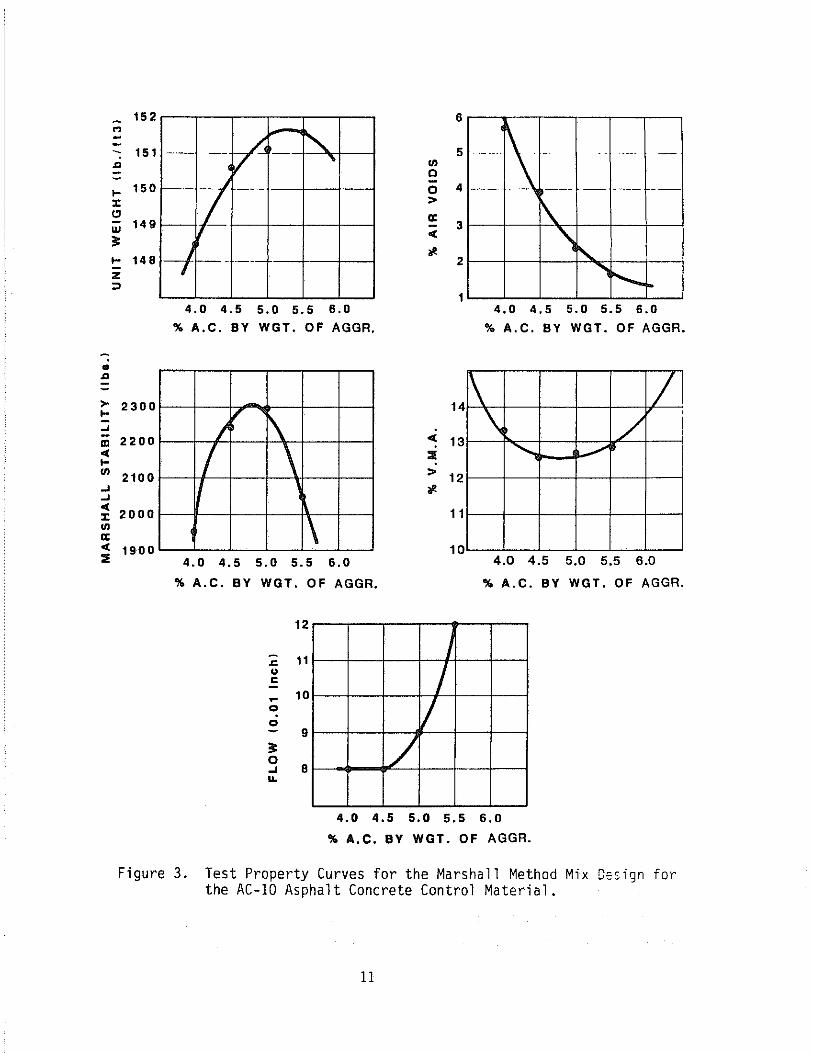
the results arf' plotted in Fi~ur(' 3. Thf' npt.illllJlII bindl'r contpnt was
chosen as follows:
Property
Unit Wei ght
Marshall Stability
% Air Voids
Optimum
Use
% Rindf'r
5.30%
4.82%
4.41%
4.84%
4.8%
The target air voids content was 4%, the median of the air void range
specified in the Marshall mix design method (Ref 4).
The Marshall mix design method, in the May 1985 addendum to MS-2 (Ref
4) which updates Figure JJJ-5 on VMA, prescribes a minimum VMA of about
15.5% for a nominal maximum particle size of 3/8 in. MS-2 describes the
nominal maximum particle size as "the largest sieve size listed in the
applicable specification upon which any material is permitted to be
retained" (Ref 4: p. 32), which was 3/8 in. for the aggregate gradation
specification used in this study.
Surface Course (Ref 2) prescribes
The FAA specification for a Bituminous
a minimum VMA of 15% for the same
aggregate gradation, described as a 1/2 in. maximum particle size (100
percent passing the 1/2 in. sieve) by FAA. However, Figure 3 in this
report shows that the VMA of the asphalt concrete mix at 4.8% binder
content is around 13%. The mix meets the other criteria described in
MS-2, and therefore the mix was accepted with a 4.8% binder content in
spite of the low VMA. Studies have been reported (Ref 5) which indicate
that a minimum VMA in mix design will not guarantee good pavement
performance, and that minimum VMA requirements can eliminate some
aggregates from use which have acceptable service records. Some studies
(Ref 5) have indicated that a minimum VMA limit under 12% is a more
appropriate specification limit. Because of the questionable value of
the current minimum VMA standards and because the limestone aggregate
used in this research had previously been used in many successful mixes,
10
.. J:l
>-I-.... III 0( I-m .... .... 0( :c III a: 0(
:Ii
152 .., -- 151 J:l --I- 150 :c CJ w 149 ~
I- 148 z ::>
2300
2200
2100
2000
1900
--- ~ ~ .. ~.-
~ --
-
J - ---I
4.0 4.5 5.0 5.5 6.0
% A.C. BY WGT. OF AGGR.
I ~ 1\
/ \
\ 4.0 4.5 5.0 5.5 6.0
% A.C. BY WGT. OF AGGR.
12
.c 11
" c ~
10 0
0 9
~ 0 .... 8
/ ...
III o o > a: 0(
i'-
6
5
4
3
2
1
14
0( 13 :Ii
> 12 i'-
11
10
I
/ /
---_ .. ~ - "--- -
I--- - -- --
\. ~ " ,...., """'-- r-
4.0 4.5 5.0 5.5 6.0
% A.C. BY WGT. OF AGGR •
\ / \ /
, I
........... ........ ~ I
4.0 4.5 5.0 5.5 6.0
% A.C. BY WGT. OF AGGR.
4.0 4.5 5.0 5.5 6.0
% A.C. BY WGT. OF AGGR.
Figure 3. Test Property Curves for the Marshall Method Mix D~sign for the AC-IO Asphalt Concrete Control Material.
11
the VMA of 13~ for the asphalt concrete mix with 4.8~ binder content was
accepted.
Asphalt-Rubber Concrete Mix
The asphalt-rubber binder was obtained from a Texas State Department
of Highways and Public Transportation project in Victoria, Texas and
shall hereafter be referred to as Victoria asphalt-rubber. The job was
being performed by the Arizona Refining Company, who produced the
asphalt-rubber material. Victoria asphalt-rubber was a mix of 77% AC-10
asphalt cement with 3% extender oil and 20% rubber which was digested for
about two hours. The rubber was a blend of the following types of
ambient grind, vulcanized whole tire rubber: Baker CR40 (40~) and C107
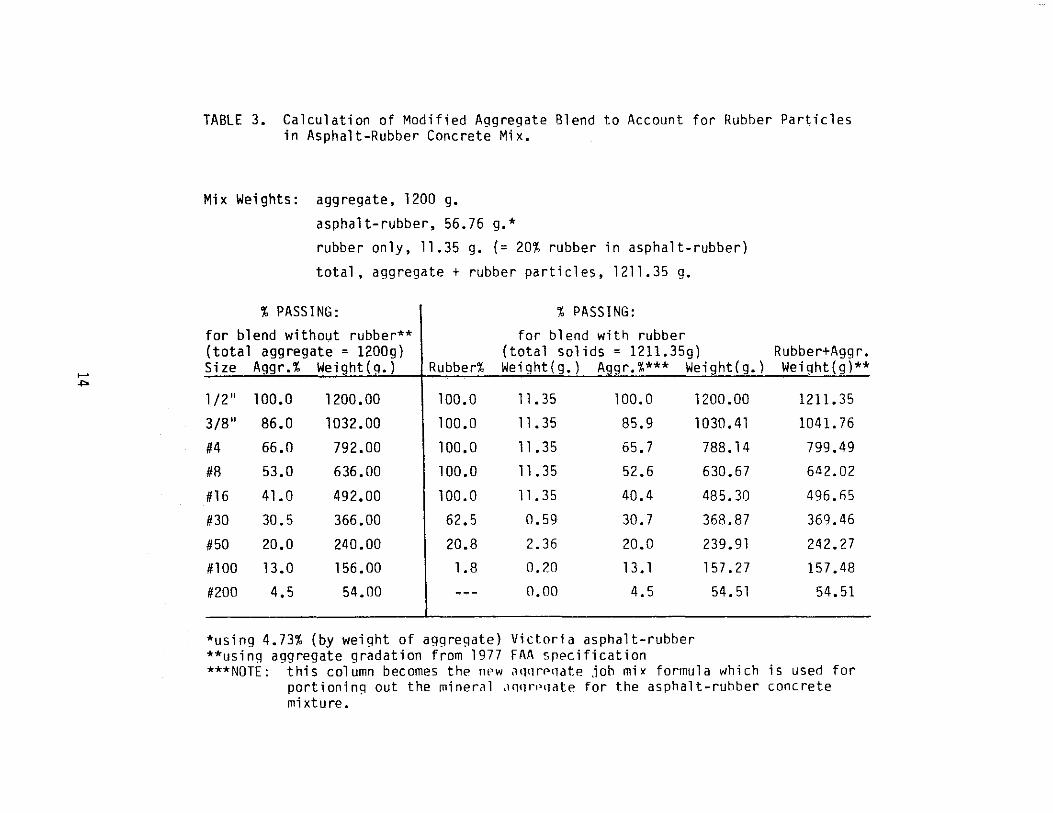
(20%), and Genstar C106 (30%) and Cl12 (10%). The combined rubber
gradation is shown in Figure 4. As discussed in Volume 1 of this report,
an adjusted aggregate blend must be calculated which accounts for :"e
rubber particles in the mix. The calculated, adjusted aggreaate ::e"~
for the Victoria asphalt-rubber concrete is shown in Table 3 and i,
compared with the unadjusted aggregate blend which meets the FAA
specification at mid-band. It can be seen from this table that the
adjusted blend of the mineral aggregate (aggregate weight, for blend with
rubber) was almost the same as the unadjusted aggregate mixture
(aggregate weight, for blend without rubber) which did not account for
rubber particles acting as aggregate in the mix. The difference between
the two aggregate blends was too small to be accurately measured when
preparing the aggregate mixture for use in making test specimens. Also,
the difference in the two blends was probably smaller than random
differences in the aggregates would be. Therefore, it was decided that
in this case the same aggregate weights could be used for both the
asphalt concrete control and the asphalt-rubber concrete test samples.
It must be emphasized here that the aggregate mixture modification which
accounts for the rubber particles in the mix must always be checked
before this decision can be made.
A modified Marshall mix design was performeQ USing the Victoria
asphalt-rubber and the FAA specification mid-band aggreqate gradation.
12

100
90
80
en c: 70 '" '" '" 0-
200 100 16 50 30 8 3/8" 1/2" 3/4" 4 1-1 "
~ I c / ~ E E I I--E E f ~
100
90
80
70
...., 60 c: OJ u "-OJ 50 0-
..... w~
'" ...., 0 40 I-
30
~ I r-Io / r l- I E-E
C I E-
60
50
~o
30
20
10
0
=-- / :: / ~
21)
10
o AA AA CA ,n " n . -. ,,..,,, , • ..,. II -. I A 01 'I 'I"
Aggregate Gradation
Figure 4. Gradation of the Rubber in the Victoria Asphalt-Rubber Binder.
..... "'"
TABLE 3. Calculation of Modified Aggregate Blend to Account for Rubber Particles in Asphalt-Rubber Concrete Mix.
Mix Weights: aggregate, 1200 g.
asphalt-rubber, 56.76 g.*
rubber only, 11.35 g. (= 20% rubber in asphalt-rubber)
total, aggregate + rubber particles, 1211.35 g.
% PASSING: % PASSING:
for blend without rubber** for blend with rubber (total aggregate = 1200g) (total solids = 1211.35g) Size Aggr. % Weight(g.) Rubber% Weight(g.) Aggr.%*** Weight(g. )
1/2" 100.0 1200.00 100.0 11. 35 100.0
3/B" 86.0 1032.00 100.0 11. 35 85.9
#4 66.0 792.00 100.0 11 .35 65.7
#8 53.0 636.00 100.0 11 • 35 52.6
#16 41.0 492.00 100.0 11 • 35 40.4
#30 30.5 366.00 62.5 0.59 30.7
#50 20.0 240.00 20.8 2.36 20.0
#100 13.0 156.00 1.8 0.20 13.1
#200 4.5 54.00 0.00 4.5
*using 4.73% (by weight of aggregate) Victoria asphalt-rubber **using aggregate gradation from 1977 FAA srecification
1200.00
1030.41
788.14
630.67
485.30
368.87
239.91
157.27
54.51
Rubber+Aggr. Weight(g)**
1211.35
1041.76
799.49
6<12.02
496.65
369.46
242.27
157.48
54.51
***NOTE: this column becomes the n~w .lqqrpqate job mix formula which is used for portioning out the miner~l ,1Qqro'qate for the asphalt-rubber concrete mixture.

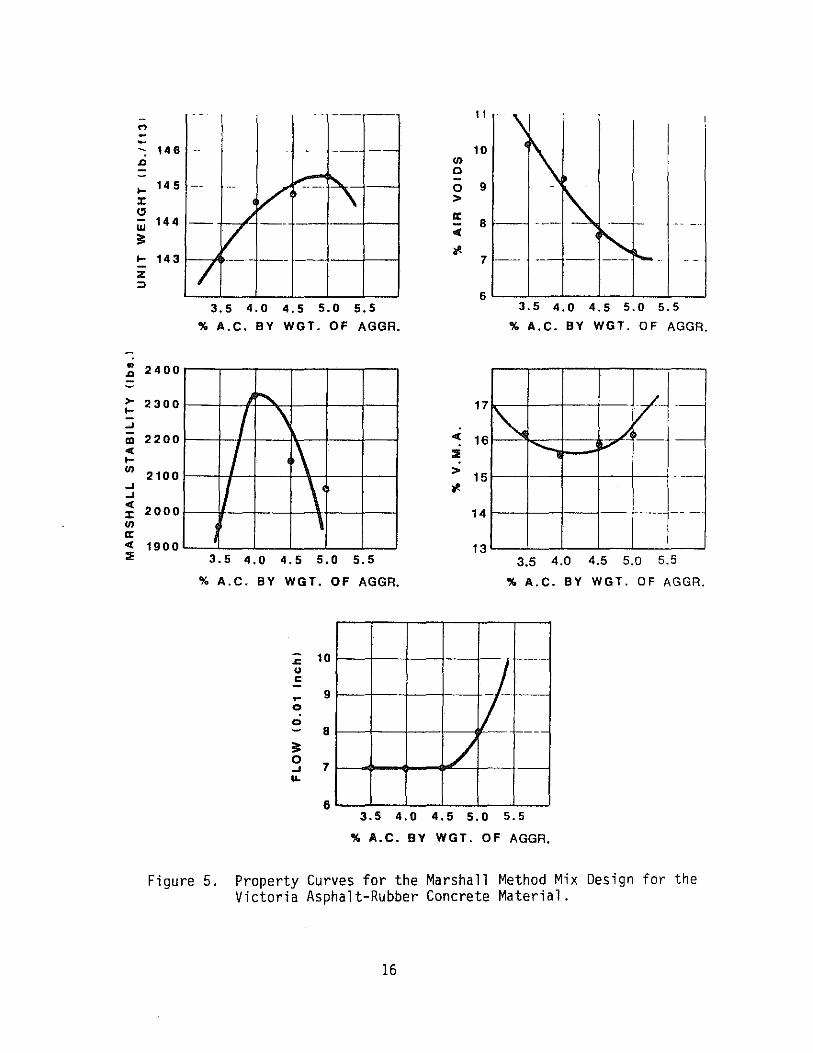
However, it was quickly realized that the air void contents in these
Marshall samples were higher than the air void contents in the asphalt
concrete control samples, and that the standard requirement in the
Marshall mix design method for three to five percent air voids could not
be met. The difficulties experienced by earlier researchers in
compacting asphalt-rubber materials in the laboratory was discussed in
Volume 1 of this report. Higher air void contents and swelling of
samples after extrusion from molds have been experienced previously.
This was due possibly to a rebound action of the rubber particles away
from the walls of the mold. Because of this, an air void content of 7%
was chosen as the optimum for the asphalt-rubber concrete in this mix
design, with the realization that the asphalt-rubber concrete might still
perform well in the testing phase of the study and that it might compact
better in the field. An air void content of 7% was considered to be low
enough to avoid the problem of the air voids becoming interconnected
within the mix, causing moisture susceptibility. Plots of the mix design
results for the Victoria asphalt-rubber concrete are shown in Figure 5.
The optimum binder content was chosen as follows:
Property % Binder
Unit Weight 4.875%
Marshall Stability 4.050% % Air Voids 5.265% Optimum 4.730%
Use 4.73%
The mix design data summarized above resulted in optimum binder
contents for the two materials (asphalt concrete control and Victoria
asphalt-rubber concrete) which were close enough to each other to be
considered the same. This was not expected.
Construction guidelines generally specify a + 0.5% tolerance on
binder content. Therefore, the asphalt-rubber concrete was tested at the
optimum binder content and at optimum~ 0.5%. In the testing program in
this study, four mixes were tested as shown below.
15
-.. Sl
> .... ..J
CD -C .... III
..J
..J -C l: III IX: -C ::IE
... ---: 146 Sl --.... 145 l: Cl
UJ 144
iI: .... 143 z ::l
2400
2300
2200
2100
2000
1900
- - --- --
-- - ---- --
-- --- V -- --- I\" /
V ---
/ ---"- --- ---
3.5 4.0 4.5 5.0 5.5
% A.C. BY WGT. OF AGGR.
J~
I \
/ ~\ I \
\
3.5 4.0 4.5 5.0 5.5
% A.C. BY WGL OF AGGR.
.c 10 u c
~ 9
0
0 8
iI: 0
7 ..J IL
6
III C -o > IX:
-C
a'-
11
10
9
8
7
17
-c 16 ::IE
> 15 a'-
14
13
3.5 4.0 4.5 5.0 5.5
% A.C. BY WGL OF AGGR.
vjj ~ / ""-. V
---
----- -- -
3.5 4.0 4.5 5.0 5_5
% A.C. BY WGT. OF AGGR.
7---
-
,---
/ 3.5 4.0 4.5 5.0 5.5
% A.C. BY WGT. OF AGGR.
Figure 5. Property Curves for the Marshall Method Mix Design for the Victoria Asphalt-Rubber Concrete Material.
16

't, Asphalt Cement and
Materi 01 Ri nder Content extender Oi 1 't, Rubber % Bind e r
Control AC-1O Optimum 100 0 4.80 Asphalt-Rubber Low (-0.5't,) 80 20 4.23
Conc rete
Asphalt-Rubber Medium (Optimum) 80 20 4.73 Concrete
Asphalt-Rubber High (+0.5%) 80 20 5.23 Conc rete
DESIGN OF EXPERIMENTS
In order to make a comparison of the performance and life cycle cost
of asphalt concrete with asphalt-rubber concrete, a number of laboratory
tests were performed to characterize the important properties of each
mix. These tests included: Marshall Stability, Resilient Modulus Tests,
Beam Fatigue Tests, Crack Propagation Tests with the TTl ·Overlay"
Tester, Creep Tests, and Repeated Load Tests. The properties determined
by these tes'ts are subsequently used in predicting the performance of an
airport pavement under a variety of commercial aircraft. The results of
these predictions are discussed in Chapter III of this volume. Each of
these tests is described in more detail in the following sections.
It is important to determine the material properties over a practical
range of stress and temperature conditions and to test a sufficient
number of replicates to permit a reliable representation of these
properties.
In the resilient modulus tests, three temperatures were used, 33°F
(DoC), nOF (25°C), and 104°F (40°C), for all four materials: the AC-10
control mix, and the low, medium, and high binder content asphalt-rubber
concrete. Three replicates were used for each combination of temperaturp
and mi x.
Beam fatigue tests were made at three temperatures: 34 0 F (loC), 68 0 F
(20°C), and 104°F (40°C) in order to obtain the temperature riependeoce of
the fatigue properties of each mix. Three replicates were used at Adch
17

of t.hree initiol ';trf'SS levels, makinq a t.DLll III nine i>pam tpsts that
were marlp for pach comhination of temperat.lJrp dnd mix.
The Crack Propagation Tests were made with the Texas Transportation
Institute overlay tester which will be described more in detail in a
subsequent section. The device is designed to repeatedly open and close
a crack of constant width along the bottom edge of a beam sample and is
used to measure the fracture properties of the beam material. This test
has been found to be more reliable and repeatable than the beam fatigue
tests in providing material properties. Tests were made at two
temperatures, 340 F (loC) and 77 0 F (2S oC). Two replications were made on
each combination of temperature and mix.
Repeated load tests were also made on cylindrical samples of the same
size as the creep tests, i.e., 4 inches (10 cm) in diameter and S inches
(20 cm) high. The purpose of the test is to determine how permanent, or
plastic, deformation is accumulated in a material that is subjected to
repeated stresses similar to those which are applied by passing aircraft
traffic. The testing procedure is as recommended by the Federal Highway
Administration to provide input data for the VESYS programs (Ref 6). The
test procedure is described in more detail in a subsequent section.
Tests were made at three temperatures, 40°F (4.4oC), 70°F (21.1 oC) and
100°F (37.SoC). O~e sample was tested for each combination of material
and temperature.
TESTING PROGRAM AND CHARACTERIZATION OF MATERIALS
Laboratory test results were used for most of the material
characterization of the asphalt material comprising the top layer. The
material parameters and the tests used to define them are described
below.
For the underlying layers, typical materials were selected and the
material characterization for these layers was estimated and then held
constant for all combinations of surface material, environmental zone,
and aircraft traffic. (See the section on Desiqn Data in Chapter III in
this report.) This was done to ensure that differences in the result3nt
IS

pavement damaq~ cauld be attributed to differences in the material
"~;DQn5~ 0f the t.op (bituminous) layer, which was varied from asphalt
:on(r~te through t.hree hinder contents of asphalt-rubber concrete.
Marshall Stability
The Marshall stability results from the mix designs were used to
obtain a preliminary evaluation of the comparative resistance to
deformation of the materials. Marshall stabilities were performed as
described in the Marshall mix design method as outl ined in MS-2 of the
Asphalt Institute (Ref 4).
The maximum stabilities for the two mixes (AC-10 asphalt concrete
control and Victoria asphalt-rubber concrete) were approximately equal, but the maximum stability for the AC control material occurred at a
higher binder content (4.8%) than that of the asphalt rubber concrete
material (4.1%). The shapes of the stability versus binder content
curves were similar (as shown in Figure 6), indicating that the
stabilities of the two materials were about equally sensitive to changes
in the binder content. For the asphalt concrete, a 2 0.5% range in
binder content above and below the point of maximum stability resul~e~ '.
a stability range of about 2,160 to 2,320 pounds; the same range in
binder content about the maximum stability point of asphalt rubber
concrete resulted in a stability range of about 2,035 to 2,330 pounds.
The stabilities were well above the minimum stability required for
heavy traffic in the Marshall mix design (1,500 pounds), and therefore no
difficulty was expected in achieving the minimum stability at the design
binder contents.
Resilient Modulus
In this study, resilient moduli were used as input data to the
modified ILLIPAVE analysis program (Ref 7, 8,9). The resilient modulus,
defined as the ratio of repeated axial deviator stress to the recoverable
axial strain, was measured by a Mark IV device as developed by Schmidt
(Ref 10). This device applies a 0.1 second load pulse every teree
19

..... • III :9 .... >-.... ;;;! III « .... en ..J ..J « J: en ex: « ::
2400
2300
2200
2100
2000
1900
3.5
o Victoria Asphalt-Rubber Concrete
A AC-10 Asphalt Concrete Control
4.0 4.5 5.0 5.5
% BINDER BY WEIGHT OF AGGREGATE
Figure 6. Comparison of Marshall Stabilities of Mixes Used in the Testing Program.
20

seconds across the vertical diameter of a cylindrical, Marshilll type
specimen. The resultant deformation (a dynal"ic tpst response) across the
horizontal diameter is measured by Goulci Stilthalll Iiniversal Transducing
Cells (UC3's) (Ref 11). Resilient modulus is calculated according to the
following formula:
M = P(~ + 0.2734) R lit
where P = load (lbs)
~ = Poisson's Ratio for asphalt ~ 0.35
II = change in diameter, or deformation (in.xlO-6)
t = sample height (in.)
( 1 )
Curves of resilient modulus (psi) versus temperature (oF) were
plotted for each material and are shown in Figure 7. A combined plot of
resilient modulus versus temperature, shown in Figure 8, indicated that
the asphalt concrete control material had a modulus which was more
temperature susceptible than the moduli of the asphalt-rubber materials.
The diametral resilient modulus described above "is often subjected
to criticism because of the light load used, the conditions of biaxial
stressing and the rigid assumptions which should be closely adhered to,
but are not, in order for the cylindrical, diametrically loaded specimen
to respond elastically" (Ref 12, p. 182). However, for this study, the
resilient modulus was chosen because it is easily obtained at different
temperatures; and for purposes of comparison of materials it was felt
that the resilient modulus was a sufficient estimate of modulus to be
used in the analysis program. In reality, however, for viscoelastic
materials like asphalt and rubberized asphalt, the modulus is variable
and depends upon load duration and temperature. Creep compliance, which
is the inverse of the time-dependent modulus, is commonly used by
researchers to describe the variation of modulus with load duration of
viscoelastic materials (Ref 13). In this study, creep compliances were
calculated and compared for the asphalt materlals. (See the sectioo on
Creep Testing and Creep Compliances in this reDort.)
21

1.20 AC-10 Coniroi 1.20 ARC low
1.00 1.00
0 .80 0 .80
0. 0.
'" '" ~ ~ - - .60 a: .60 a: ~ ~
.40 .40
.20 .20
0 0 20 40 60 80 100 20 40 60 80 100
TEMPERATURE I"F) TEMPERATURE I"F)
1.20 ARC Medium 1.20 ARC H)gh
1.00 1.00
• .80 • .80 0. 0.
00 '" 0 0
.60 .60 a: a: ~ ~
.40 .40
.20 .20
0 0 20 40 80 80 100 20 40 60 80 100
TEMPERATURE ("F) TEMPERATURE ("F)
Figure 7. Plots of Resilient Modulus Versus Temperature for Each of the Four Materials in This Study.
22

1.2r------------------------------------------,
1.0
0.8
Ul Q.
'" 0.6 o ... -a:
:::E
0.4
0.2
RESILIENT MODULI
o ARC High
6 ARC Medium
o o ARC Low
.. AC Control
, o
o.o~-__:~-~~-__:~-__:~-~~-~~-~ o 20 40 eo 80 100 120 140
TEMPERATURE, of
Figure 8. Combined Plot Showing Resilient Modulus Versus Temperature for the Four Materials in This Study.
23
It is a better approximation of field conditions to use a modulus for
the underlying layers which is stress-sensitivE and is calculated by the
program for each stress condition. The ILLIPAVE program as modified at
Texas A~M University and used in this study has this capability (Ref 8).
However, primarily to ensure a consistent response of the underlying
layers, the moduli were input as constants for those layers. The
assumption was made that temperature effects were only felt in the
bituminous layer, which was 15.5 inches thick.
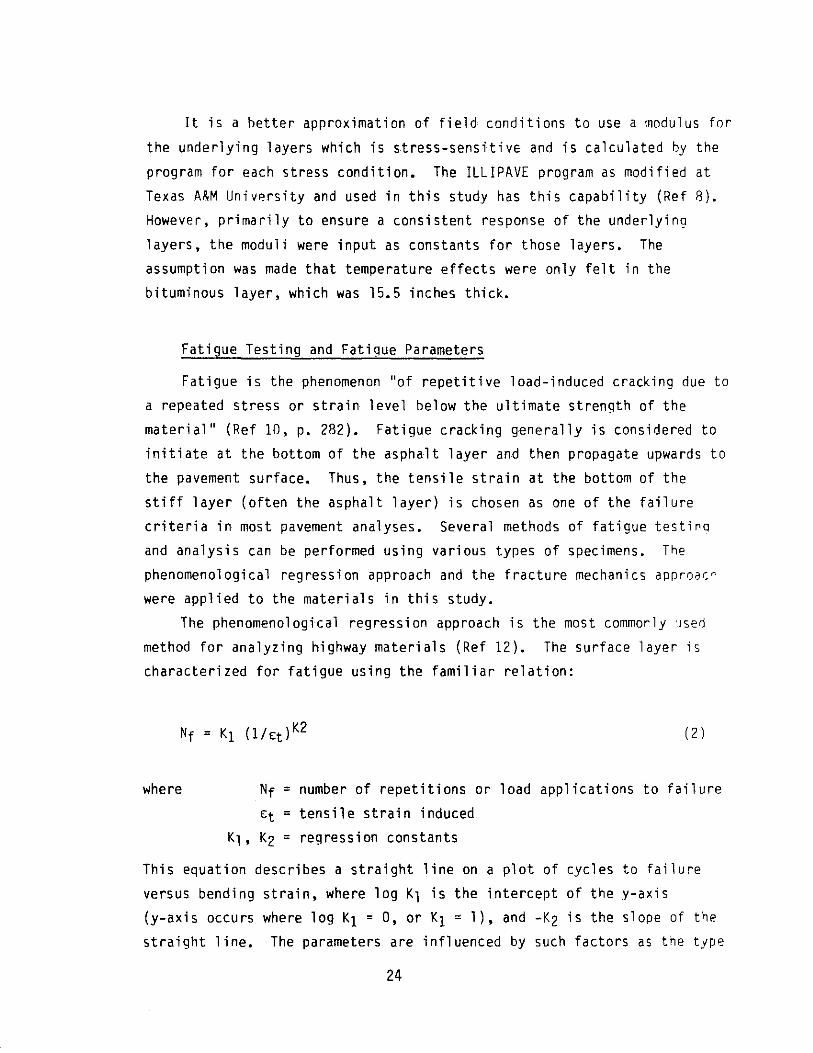
Fatigue Testing and Fatigue Parameters
Fatigue is the phenomenon "of repetitive load-induced cracking due to
a repeated stress or strain level below the ultimate strength of the
material" (Ref 10, p. 282). Fatigue cracking generally is considered to
initiate at the bottom of the asphalt layer and then propagate upwards to
the pavement surface. Thus, the tensile strain at the bottom of the
stiff layer (often the asphalt layer) is chosen as one of the failure
criteria in most pavement analyses. Several methods of fatigue testing
and analysis can be performed using various types of specimens. The
phenomenological regression approach and the fracture mechanics approac r .
were applied to the materials in this study.
The phenomenological regression approach is the most commor1y :Jsed
method for analyzing highway materials (Ref 12). The surface layer is
characterized for fatigue using the familiar relation:
where
(2 )
Nf = number of repetitions or load applications to failure
Et = tensile strain induced
Kl, K2 = regression constants
This equation describes a straight line on a plot of cycles to failure
versus bending strain, where log Kl is the intercept of the y-axis
(y-axis occurs where log Kl = 0, or Kl = 1), and -K2 is the slope of the straight line. The parameters are influenced by such factors as the type
24

of load, dimensions of the test specimen, loading rate, test type,
temperature, and properties of the mix, including air voids, aggregate
gradation and type, asphalt content and viscosity, etc. Thus, Kl and K2
are not material properties (Ref 12). This study used beam fatigue tests. These can be performed in
either a controlled stress or a controlled strain mode. The type of
pavement being simulated in the testing determines which mode of testing
is proper (Ref 12). Previous researchers have stated that controlled
stress loading is typically experienced by stiff, thick pavements (six
inches thick or more). Controlled strain loading is encountered in thin
pavements of two inches thick or less (Ref 14; this reference quotes Ref
15). Because airfield pavements are designed for heavy aircraft loads,
they would be thick and therefore subject to controlled stress loading.
This was the type of loading applied in the beam fatigue tests.
This study followed the procedures for fatigue testing which are
described in the VESYS 11M User's Manual (Ref 6). VESYS uses a repeated
load flexure device with beam specimens. The third-point loading
configuration theoretically applies a constant hending moment over the
center 4 inches of a 15 inch long specimen (Ref 6). The deflection up
and down is measured at the center of the beam with a Linear Variable
Differential Transformer, LVOT, which in these tests was bonded to the
specimen with a stiff clay. This study used a device which applied a
repeated tension-compression load in the form of a haversine wave for 0.1
second duration with 0.4 second rest periods. A schematic of the device
is shown in Figure 9.
Temperature (which affects binder stiffness) and stress level both
have a pronounced effect upon fatigue life. Therefore, the temperature
around the fatigue devices was controlled and fatigue tests were
performed at a variety of temperatures and stress levels. Tests were
performed in temperature chambers at 340 F (loC), 680 F (200C), and 104 0 F
(400C). Applied loads were chosen so that some specimens failed at cycle
numbers in the thousands, some at cycle numbers in the tens of thousands,
and some at cycle numbers in the hundreds of thousands. This was dooe by
a trial-and-error method; but the aim of obtaining a range of data points
25

1. Reaclton clamp 2. load clamp 3. Restrainer 4. Specimen 5. loading rod 6. Stop nuts
Key.
7 load bar 8. Piston rod 9. Thomps.on ball bushing
10. lVDT hulder 11.LVDT
Figure 9. Repeated Flexural Apparatus Used for Beam Fatigue Tests. (Reference 10)
26

was achieved fai rly easily. A strip chart wa" w,(>rt to record chart load
and chart deformation. This information, "lon'l with initial bendinq
strain and the number of cycles to failure, w~s put into a computer
program which calculated the followinq: load in pounds, deflection in
inches, elastic modulus, bending strain, and the parameters Kl and KZ
with an R-value to estimate the goodness of fit (Figure 10). Initial
bending strain was the strain measured in the beam at the beginning of
the test, usually at or around ZOO cycles. At ZOO cycles, it was assumed
that the test machine was set up and functioning smoothly and that at
this time the initial bending strain could be read without fluctuation
introduced by adjusting the equipment setup or by transient responses in
the test specimen. The program also plotted initial bending strain, Ei,
versus number of cycles to failure, Nf (Figure 11). On this plot there
is one data point for each specimen tested; the data points should plot
approximately as a straight line. However, in this research and in all
other published fatigue test results there is quite a hit of scatter in
the data points. Therefore, a best-fit line is regressed through the
data points. The parameters and the R-values which describe the
goodness-of-fit of the regression equations calculated from the
laboratory tests are summarized in Table 4.
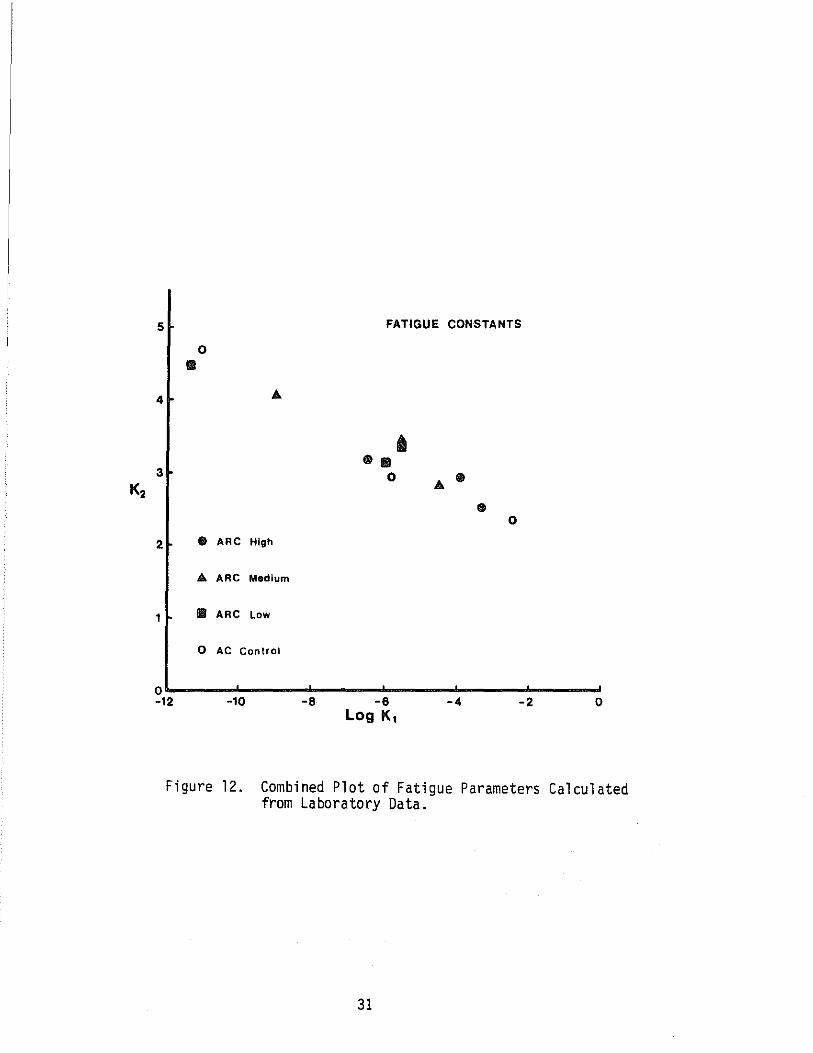
Several researchers have postulated that "a 1 inear relationship
exists between K2 and log Kl, irrespective of mixture properties and test
procedures" (Ref 16, p. 40; contains references to Ref 17 and Ref 18).
The results from the laboratory tests in this study were therefore
plotted to see if this held true for the tests in this study (Figure 12).
As can be seen in the plot, a roughly linear relation was confirmed.
Kennedy (Ref 16, 17) developed the following linear regression
relationship from combining several sets of data:
KZ = 1.350 - 0.252 log K1 (R = 0.95; se = 0.29) ( 3 )
27
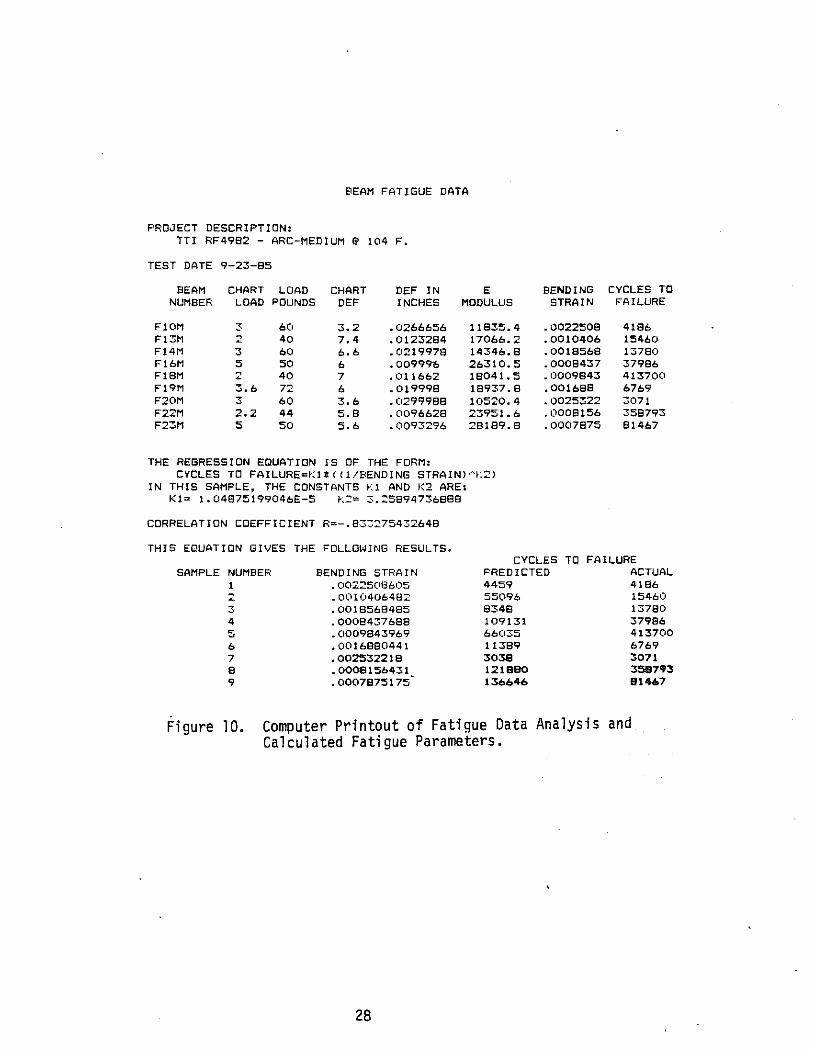
BEAM FAT! GUE DATA
PROJECT DESCRIPTION: TTI RF4982 - ARC-MEDIUM E> 104 F.
TEST DATE 9-23-85
BEAM CHART LOAD CHART DEF IN E NUMBER LOAD POUNDS DEF INCHES MODULUS
FIOM 3 60 3.2 .0266656 11835.4 F13M 2 40 7.4 .0123284 17066.2 FI4M 3 60 6.6 .0219978 143410.8 FI6M ::; 50 6 .0099% 26310.5 FI8M 2 40 7 .011662 18041.5 FI9M 3.6 72 6 .019998 18937.8 F20M 3 60 3.6 .0299988 1(1520.4 F22M 2.2 44 5.8 .0096628 23951.6 F23M 5 SO 5.6 .0093296 28189.8
THE REGRESSION EQUATION IS OF THE FORM: CYCLES TO FAILURE='('* «I/BENDING STRAIN)~"2)
IN THIS SAMPLE, THE CONSTANTS KI AND 1(2 ARE: K 1 = 1. 048751 99046E -5 ~,~= 3. :5894736888
CORRELATION COEFFICIENT R=-.e3~~75432648
THIS EQUATION GIVES THE FOLLOWING RESULTS.
BENDING CYCLES TO STRAIN FAILURE
.0022508 4186
.0010406 15460
.0018568 13780
.0008437 37986
.0009843 413700
.001688 6769
.0025322 3071
.0008156 358793
.0007875 81467
CYCLES TO FAILURE SAMPLE NUMBER BENDING STRAIN PREDICTED ACTUAL
I :;: 3 4 5 6 7 8 9
Figure 10.
.00225(18605 4459 4186
.0010406482 5'5096 15460
.0018568485 8348 13780
.0008437688 109131 37986
.0009843969 66035 413700
.0016880441 11389 6769
.002532218 3039 3071
.0008156431 121980 3587'93 -.0007875175 136646 91467
Computer Printout of Fatigue Data Analysis and Calculated Fatigue Parameters.
28

-1
I I
~
-2 J ~ ~ w 0 - ~ x ~
~ • z I ~
< ~ -3 ~ • ~ • u z ~
Q Z W W ~ < ~
~ ~ -4 z ~
I -W
-5 ~--~-r-r~~nll----r-Ti-r""",r,njl--~r-r,-r,,',','T'nil----r-T'-r' ,',','T,nii---'--J-rllnn 2 3 4 5 6
NF-NUMBER OF CYCLES TO FAILURE (IXl0'EJ
TTl RF49B2 - ARC-MEDIUM 0 104 F.
Figure 11. Computer Plot of Laboratory Fatigue Test Results.
29
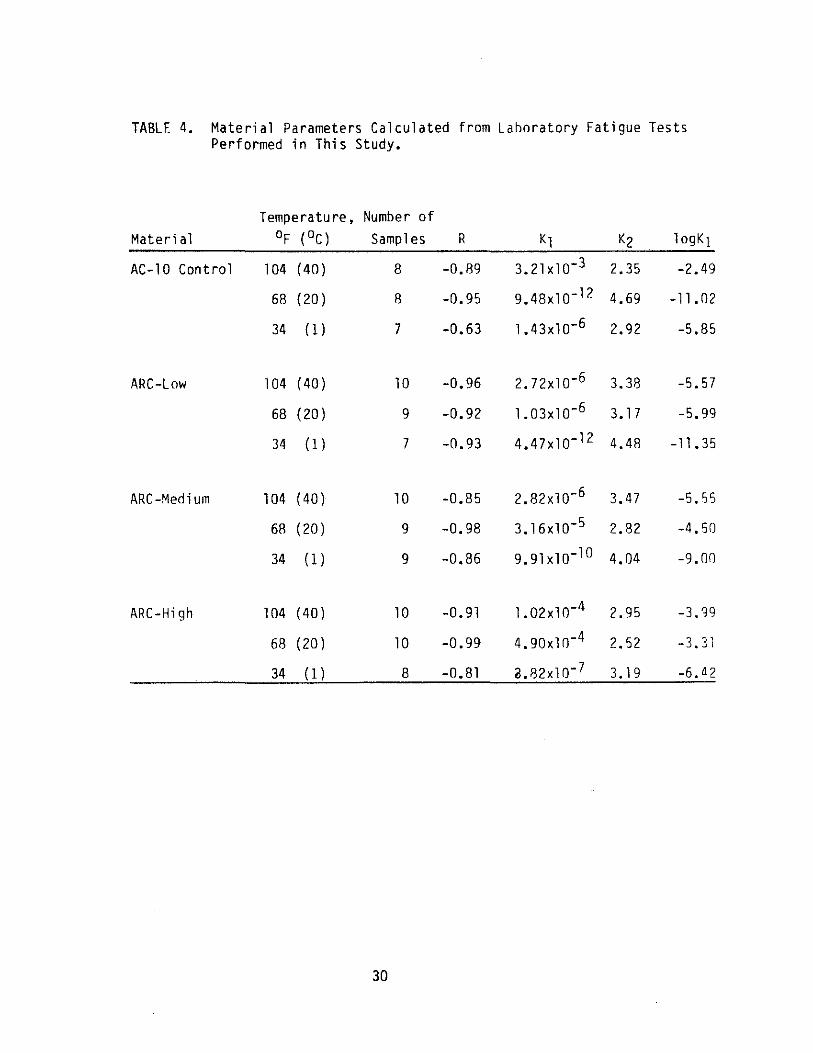
TABLE 4. Material Parameters Calculated from Lahoratory Fatigue Tests Performed in This Study.
Temperature. Number of Materi al of (oC) Samples R Kl K2 10gK)
AC-10 Control 104 (40 ) 8 -0.89 3.21xlO-3 2.35 -2.49
68 (20) B -0.95 9.48xlO- 12 4.69 -11. 02
34 (1) 7 -0.63 1.43xlO-6 2.92 -5.85
ARC-Low 104 (40 ) 10 -0.96 2.72xlO-6 3.38 -5.57
68 (20) 9 -0.92 1.03xlO-6 3.17 -5.99
34 (1) 7 -0.93 4.47xlO- 12 4.48 -11. 35
ARC-Medium 104 (40) 10 -0.85 2.82xlO-6 3.47 -5.SS
6R (20) 9 -0.98 3.16xlO-5 2.82 -4.S0
34 (1) 9 -0.86 9.91xlO-10 4.04 -9.00
ARC-High 104 (40) 10 -0.91 1.02xlO-4 2.95 -3.g9
68 (20 ) 10 -0.99 4.90xlO-4 2.52 1 l' -J • ...) 1
34 (1) 8 -0.81 (l.82xlO- 7 3. 1 9 -6.az
30
K2
5 FATIGUE CONSTANTS
0 l1li
4
~ 8l1li
3 0 A 8
., 0
2 ., ARC High
A ARC Medium
1 l1li ARC Low
o AC Control
0 -12 -10 -8 -8 -4 -2 0
Log K1
Figure 12. Combined Plot of Fatigue Parameters Calculated from Laboratory Data.
31
The Kl values computed from the lab data in this study were used in
Kennedy's regression equation to see how well the KZ values calculated
from Kennedy's equation compared with the KZ values calculated from the
lab data. The results and comparisons are tabulated in Table 5.
In order to use the laboratory results in a comparative analysis
which was sensitive to the differences due to both material and
temperature, a double regression procedure was applied to the lab data,
as follows. First, Ilog Kli versus log T (where T indicates temperature
in Fahrenheit degrees) was plotted and a linear regression was performed
for each of the four materials (asphalt concrete control and three binder
contents of asphalt-rubber concrete; see Fiqure 13). This yielded a set
of equations (one for each material) where temperature was the
independent variable and Kl was the dependent variable. Then K2 versus
log Kl was plotted and a linear regression was performed for each
material (see Figure 14). This yielded a set of equations with log Kl as
the independent variable and KZ as the dependent variable. Using th~se
sets of equations, any temperature could he chosen and the fatigue
rarameters could be calculated for each material at that temperatur~.
The equations thus derived are shown in Table 6. The fatigue paramet~rs
calculated for some of the temperatures used to characterize seasons
within the environmental zones are shown in Table 7.
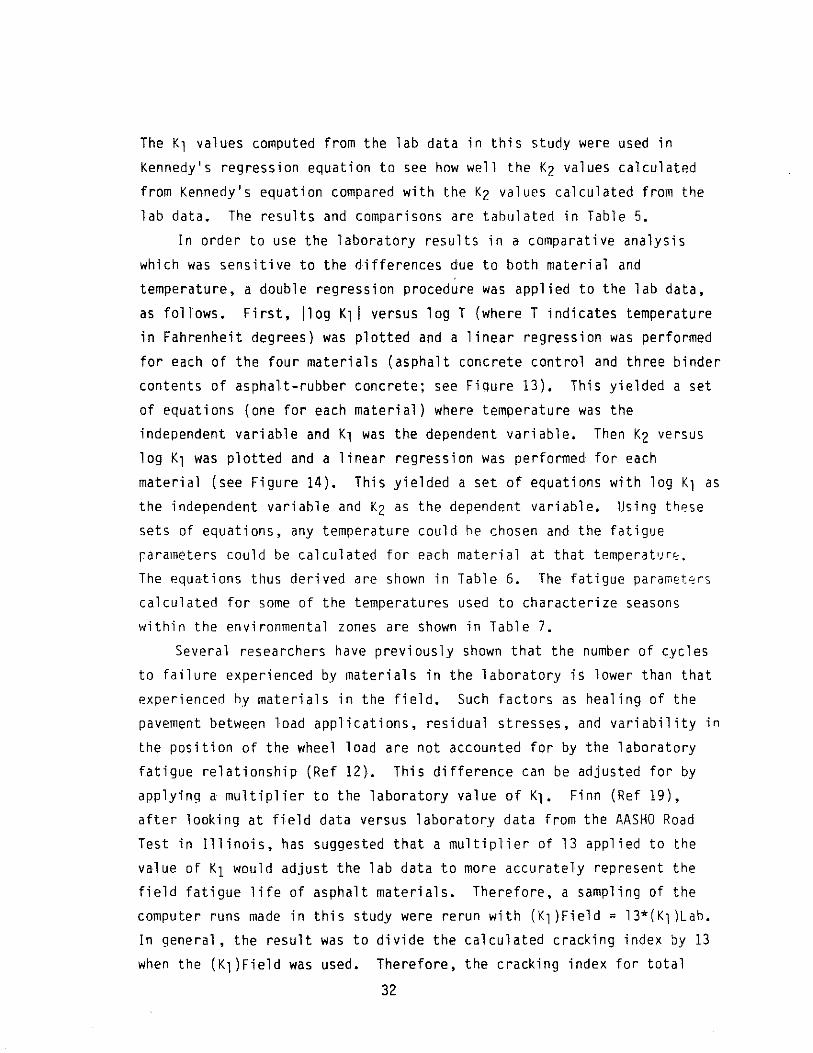
Several researchers have previously shown that the number of cycles
to failure experienced by materials in the laboratory is lower than that
experienced hy materials in the field. Such factors as healing of the
pavement between load applications, residual stresses, and variability in
the position of the wheel load are not accounted for by the laboratory
fatigue relationship (Ref 12). This difference can be adjusted for by
applying a multiplier to the laboratory value of Kl. Finn (Ref 19),
after looking at field data versus laboratory data from the AASHO Road
Test in Illinois, has suggested that a multiplier of 13 applied to the
value of K1 would adjust the lab data to more accurately represent the
field fatigue life of asphalt materials. Therefore, a sampling of the
computer runs made in this study were rerun with (Kl )Field = 13*(Kl )Lab.
In general, the result was to divide the calculated cracking index by 13
when the (Kl)Field was used. Therefore, the cracking index for total
32
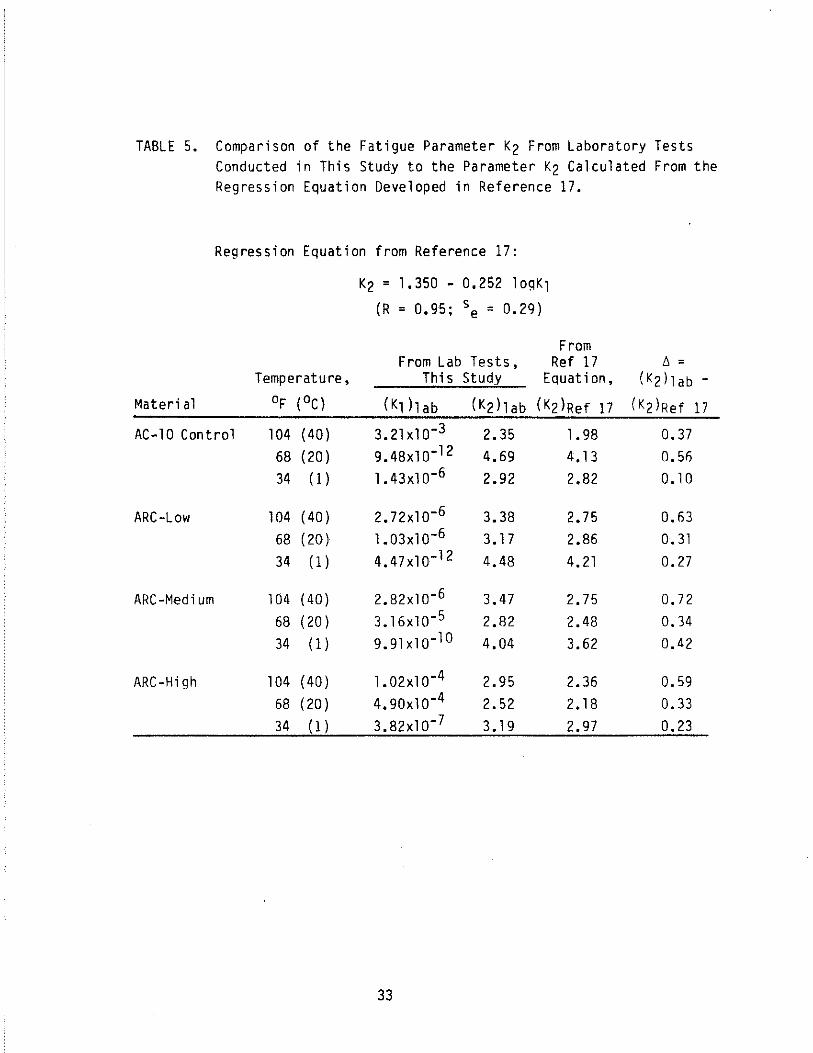
TABLE 5. Comparison of the Fatigue Parameter K2 From Laboratory Tests Conducted in This Study to the Parameter K2 Calculated From the Regression Equation Developed in Reference 17.
Reg res s i on Equation from Reference 17:
K2 = 1.350 - 0.252 lo~K1
(R = 0.95; se = 0.29)
From From Lab Tests, Ref 17 /', =
Temperature, This Study Equat ion, (K2)lab -
Materi a1 of (OC) (K1 h ab (K2)lab (K2)Ref 17 (K2)Ref 17
AC-10 Control 104 (40) 3.21x10⁻³ 2.35 1. 98 0.37 68 (20) 9.48x10⁻¹² 4.69 4.13 0.50 34 (1) 1. 43x1 0-6 2.92 2.82 0.10
ARC-Low 104 (40) 2.72x10⁻⁶ 3.38 2.75 0.63 68 (20) 1. 03x1 0-6 3.17 2.86 0.31 34 ( 1 ) 4.47x10⁻¹² 4.48 4.21 0.27
ARC-Medium 104 (40) 2.82x10⁻⁶ 3.47 2.75 0.72 68 (20 ) 3.16x10⁻⁵ 2.82 2.48 0.34 34 (1) 9.91x10⁻¹O 4.04 3.62 0.42
ARC-High 104 (40) 1. 02x1 0-4 2.95 2.36 0.59 68 (20) 4.90x10⁻⁴ 2.52 2.18 0.33 34 (1) 3.82x10⁻⁷ 3.19 2.97 0.23
33

12 AC-10 Control ARC Low ... Lab leat reDu!ts .• Lab teal rnults
11
10 12
9 11
8 10 I'og K11
7 9
6 I'og K11
8
5 7
4 8
3 5
2 4 1 2 3 2
log T I"F) log T I"F)
9 ARC Medium ARC High ·"lab lest reBults ·"Lab lest results
7
8
6
l'Og K,I 7
I'og K,ls
6
4
5
3 2 3 2
log T (·F) log T (-F!
Figure 13. Plots of I log Kl I Versus Log T Showing Laboratory Data Points and Linear Regressions.
34
3
3

K2
5
4
3
AC-l0 Control --Lab t •• t r.sulla
2~--~--~----~--~--~~ -,2 -,0 -8 -6 -4 -2
log K,
5 ARC Medium ·"Lab laat results
•
3
2 ~ __ -J ____ ~ ____ ~ ____ ~ ____ ~ __
-12 -10 -8 -6 -. -2
log K 1
K2
5 ARC Low
--Lab t8.1 rDsults
4
3
2L-__ ~ __ ~ ____ ~ __ ~ ____ ~
-,2 -'0 -8 -6 -4 -2 log K,
5 ARC High --Lab test results
4
3
2L---__ --' ____ -'-____ -'--____ --'-____ ..L-_
-12 -10 -8 -6 -. -2
log K 1
Figure 14. Plots of K2 Versus Log K1 Showing Laboratory Data Points and Linear Regressions.
35
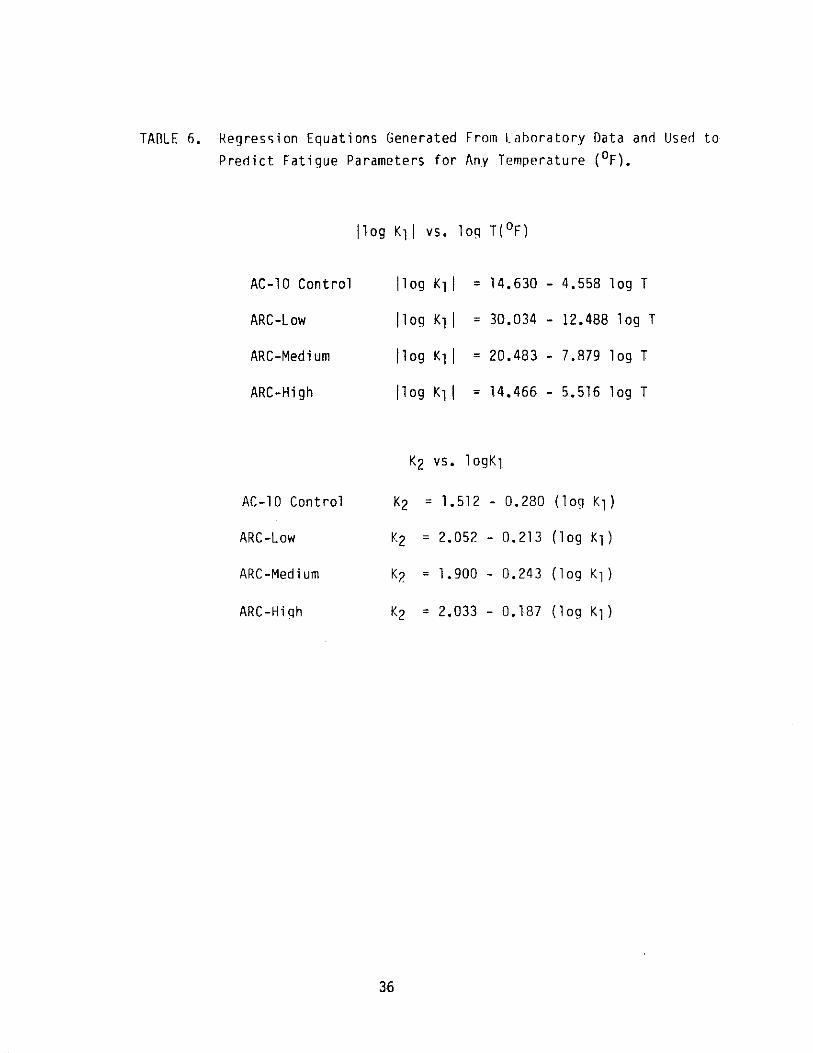
TAOLE 6. Regression Equations Generated From laboratory Data and Used to Predict Fatigue Parameters for Any Temperature (oF).
110g Kll vs. log T(oF)
AC-l0 Control 110g Kll = 14.630 4.558 log T
ARC-Low 110g Kll = 30.034 12.488 log T
ARC-Medium 110g K 1 1 = 20.483 7.879 log T
ARC-High 110g Kll = 14.466 5.516 log T
K2 vs. 109Kl
AC-l0 Control K2 = l. 512 - 0.280 (log Kl)
ARC-Low K2 = 2.052 0.213 (log Kl)
ARC-Medium K2 = 1.900 0.243 (log K 1 )
ARC-High K2 = 2.033 0.187 (log Kl)
36

TABLE 7. Fatigue Parameter Values Calculated for Selected Temperatures from Regression Equations Developed for the Materials in This Study.
Kl Temperature (not adjusted to Nf, when
Materi al of (OC) field conditions) K2 e: = 1O-3in/;n
AC-10 Control 35 ( 1 .7 ) 2.56xlO-8 3.64 2,130 50 (10.0) 1.30xlO-7 3.43 2,530 60 (15.6) 2.99xlO-7 3.34 3,130 75 (23.9) 8.26xl0-7 3.21 3,520 90 (32.2) 1.90xl0-6
3. " 4,060 105 (40.6) 3.83xl0-6 3.03 4,710
ARC-Low 35 (1.7) 1. 77xl 0-" 4.34 190 50 (10.0) l.52xl0-9 3.93 940 60 (15.6) 1.4Bxl0-B 3.72 2,140 75 (23.9) 2.41xl0-7 3.46 5,780 90 (32.2) 2.35xlO-6 3.25 13,200
105 (40.6) 1.61xl0-5 3.07 26,100
ARC-Medium 35 (1 .7) 4.Blxl0-9 3.92 2,770 50 (10.0) 7.99xlO-B 3.62 5,790 60 (15.6) 3.36xl0- 7 3.47 B,640 75 (23.9) l.95xl0-6 3.29 14,500 90 (32.2) B.20xl0-6 3.13 20,100
105 (40.6) 2.76xl0- 5 3.01 29,600
ARC-High 35 (1. 7) 1.l2xl0-6 3.14 2,950 50 (10.0) B.03xl0-6 2.98 1 ,990 60 (15.6) 2.20xl0-5 2.90 11 ,000 75 (23.9) 7.52xl0- 5 2.BO lB,900 90 (32.2) 2.06xl0-4 2.72 29,BOO
105 (40.6) 4.81xl0-4 2.65 42,900
37
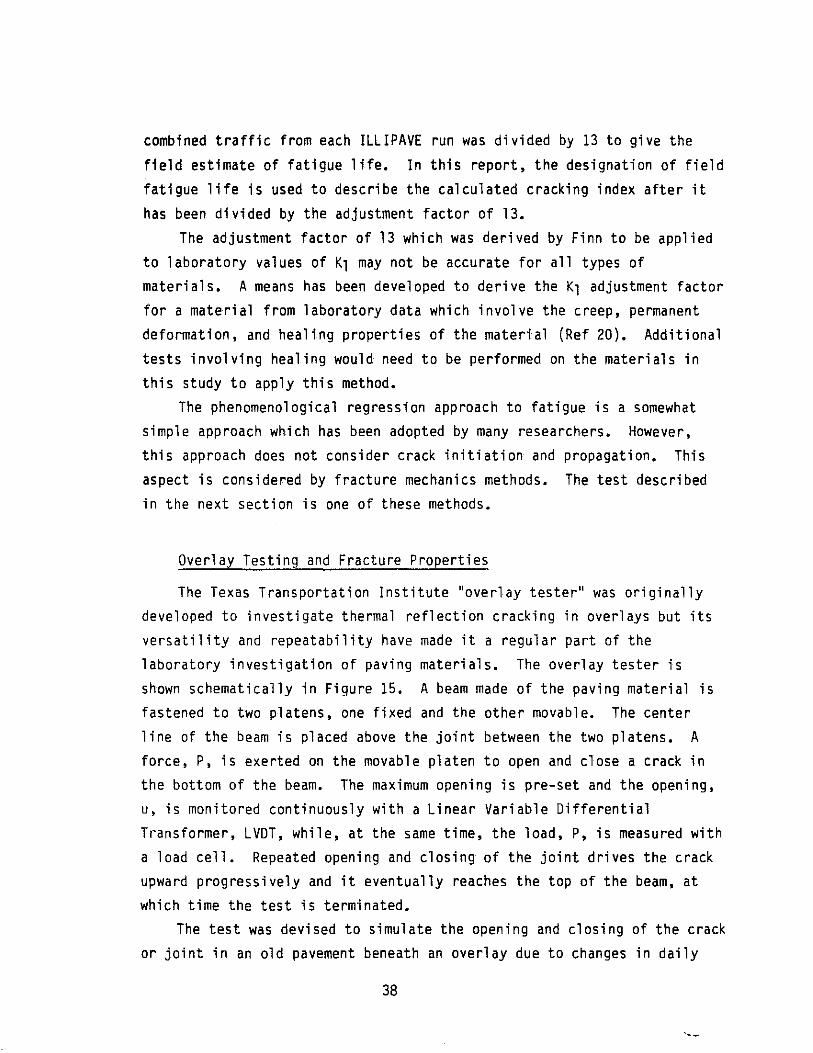
combined traffic from each ILLIPAVE run was divided by 13 to give the
field estimate of fatigue life. In this report, the designation of field
fatigue life is used to describe the calculated cracking index after it has been divided by the adjustment factor of 13.
The adjustment factor of 13 which was derived by Finn to be applied
to laboratory values of Kl may not be accurate for all types of materials. A means has been developed to derive the Kl adjustment factor
for a material from laboratory data which involve the creep, permanent deformation, and healing properties of the material (Ref 20). Additional
tests involving healing would need to be performed on the materials in this study to apply this method.
The phenomenological regreSSion approach to fatigue is a somewhat
simple approach which has been adopted by many researchers. However, this approach does not consider crack initiation and propagation. This
aspect is considered by fracture mechanics methods. The test described
in the next section is one of these methods.
Overlay Testing and Fracture Properties
The Texas Transportation Institute "overlay tester" was originally developed to investigate thermal reflection cracking in overlays but its versatility and repeatability have made it a regular part of the
laboratory investigation of paving materials. The overlay tester is shown schematically in Figure 15. A beam made of the paving material is fastened to two platens, one fixed and the other movable. The center
line of the beam is placed above the joint between the two platens. A force, P, is exerted on the movable platen to open and close a crack in the bottom of the beam. The maximum opening is pre-set and the opening,
u, is monitored continuously with a Linear Variable Differential Transformer, LVDT, while, at the same time, the load, P, is measured with a load cell. Repeated opening and clOSing of the joint drives the crack upward progressively and it eventually reaches the top of the beam, at
which time the test is terminated. The test was devised to simulate the opening and closing of the crack
or joint in an old pavement beneath an overlay due to changes in daily
38

FORCE, P
TENSION
COMPRESSION
PRE-SET MAXIMUM OPENING
OPENING, U
TOP FIBER STRAIN
c CRACK LENGTH
d HEIGHT OF SAMPLE
M VABLE PLATEN P
FEEDBACK CONTROLLED FORCE FOR OPENING AND CLOSING THE CRACK
-II-U
CYCLIC OPENING AND CLOSING MAXIMUM OPENING CONTROLLED BY LVDT
Figure 15. Schematic Diagram of the Texas Transportation Institute Overlay Tester.
39

temperature. The crack length is observed and measllreri visually on each
side of the beam sample and the average crack lenqth is used to compute
the fracture properties of the beam material. The strain in the top
fiber is measured with another LVDT principally when a strain relieving
layer has been built into the beam so as to determine the extent to which
strain has been relieved.
The fracture properties that are measured are the constants A and n
that appear in Paris' Law (Ref 21), as follows:
(4)
where c = the crack length
N = the number of load cycles
dc/dN = the "crack speed", or the rate of growth of the crack.
6K = the change of "stress intensity factor" during the . application of the load
A = the fracture coefficient
n = the fracture exponent
The "stress intenSity factor" is calculated with an elastic finite
element computer program and is taken from a graph of Kd lEu versus cld,
as shown in Figure 16. Once the crack length ratio, cld, is known, the
value of the change of stress intensity factor, 6K, during the load cycle
can be calculated.
A graph of the "crack speed", dc/dN, versus the change of stress
intenSity factor, both on a logarithmic scale, shows a straight-line
portion with a slope, n, and an intercept, A, as shown in Figure 17.
The measured values of A and n are given in Table 8, along with some
of the other test data.
Although these constants are derived empirically from this test, it
has been shown theoretically (Ref 22) that the fracture coefficient, A,
depends upon the tensile strength and creep compliance of the beam
material in tension and that the fracture exponent, n, depends solely
upon the slope of the creep compliance curve. This relationship will be
shown in a subsequent section of this chapter. Because both A and n
40

a: 0 l-t.) « u. >-I-(/J
t.Kd 1/2 z w I- Eu z (/J (/J w a: I-(/J
u. 0 w CJ z « :r: t.)
o 1
c/d
RELATIVE CRACK LENGTH
Figure 16. Computed Relation Between Change of Stress Intensity Factor and Crack Length.
41

CRACK SPEED
log (~~)
6K= 1 log 6K
CHANGE OF STRESS INTEN SITY FACTOR
Figure 17. Typical Graph of Crack Speed Versus Change of Stress Intensity Factor.
42
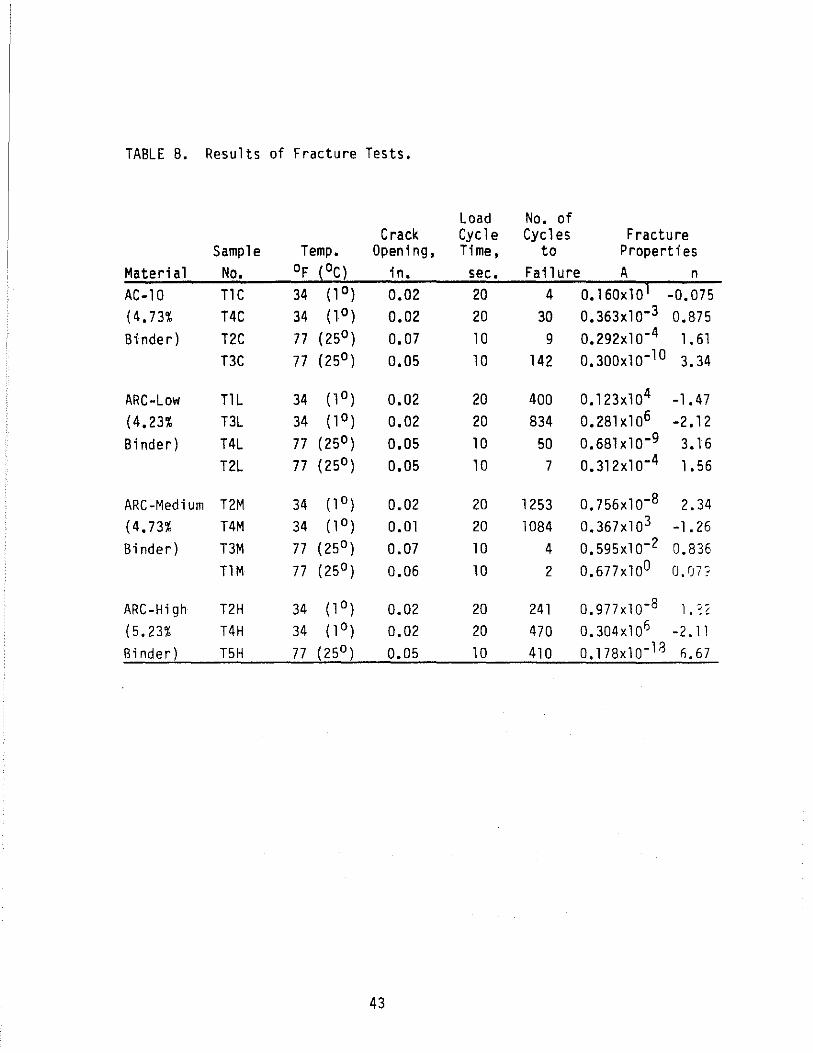
TABLE B. Results of Fracture Tests.
Load No. of Crack Cycle Cycles Fracture
Sample Temp. Opening, Time, to Properti es Material No. of (OC) in. sec. Fail ure A n AC-10 T1C 34 (10) 0.02 20 4 0.160xl01 -0.075 (4.73% T4C 34 (1 0) 0.02 20 30 0.363xlO-3 0.B75 Binder) T2C 77 (25°) 0.07 10 9 0.292xlO-4 1. 61
BC 77 (25°) 0.05 10 142 0.300x10⁻¹⁰ 3.34
ARC-Low T1L 34 (1 0) 0.02 20 400 0.123x10⁴ -1.47 (4.23% BL 34 (1 0) 0.02 20 B34 0.2Blxl06 -2.12 Binder) T4L 77 (25° ) 0.05 10 50 0.6B1xlO-9 3.16
T2L 77 (25°) 0.05 10 7 0.312xlO-4 1.56
ARC-Medium T2M 34 (1 0) 0.02 20 1253 0.756xlO-B 2.34 (4.73% T4M 34 (1 0) 0.01 20 10B4 0.367xl03 -1.26 Binder) BM 77 (25°) 0.07 10 4 0.595xlO-2 0.836
T1M 77 (25°) 0.06 10 2 0.677xlOO O,rJ7 0
ARC-High T2H 34 (l 0) 0.02 20 241 0.977xlO-8 1. ~ 2
(5.23% T4H 34 ( 1 0) 0.02 20 470 0.304xl06 -2.11 Binder) T5H 77 (25° ) 0.05 10 410 0.178xlO- 18 6.67
43
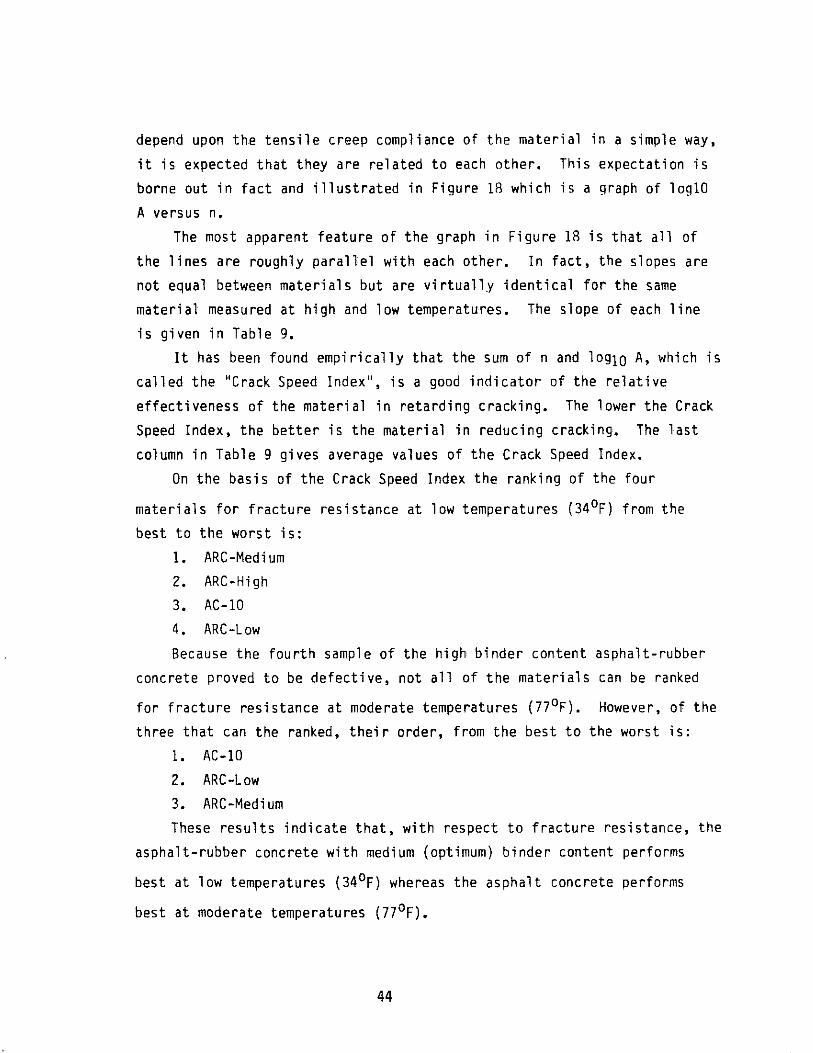
depend upon the tensile creep compliance of the material in a simple way,
it is expected that they are related to each other. This expectation is borne out in fact and illustrated in Figure 18 which is a graph of 10g10
A versus n. The most apparent feature of the graph in Figure 18 is that all of
the lines are roughly parallel with each other. In fact, the slopes are
not equal between materials but are virtually identical for the same material measured at high and low temperatures. The slope of each line
is given in Table 9. It has been found empirically that the sum of nand 10910 A, which is
called the "Crack Speed Index", is a good indicator of the relative
effectiveness of the material in retarding cracking. The lower the Crack Speed Index, the better is the material in reducing cracking. The last
column in Table 9 gives average values of the Crack Speed Index.
On the basis of the Crack Speed Index the ranking of the four
materials for fracture resistance at low temperatures (340F) from the
best to the worst is:
1. ARC-Medium 2. ARC-High
3. AC-l0 4. ARC-Low Because the fourth sample of the high binder content asphalt-rubber
concrete proved to be defective, not all of the materials can be ranked
for fracture resistance at moderate temperatures (77 oF). However, of the three that can the ranked, their order, from the best to the worst is:
1. AC-l0 2. ARC-Low 3. ARC-Medium These results indicate that, with respect to fracture resistance, the
asphalt-rubber concrete with medium (optimum) binder content performs
best at low temperatures (34oF) whereas the asphalt concrete performs
best at moderate temperatures (77 0F).
44
.... (J1
-1 B. 7 5 -0 ARC-High
.. . .
-14 -13 -12 -11
. .
0---- ARC High Blndar Content
" -.- ARC Med. Binder Content a ••••••• ARC Low Binder Content
0--- AC-10 Control
"'-'- -. 0__ .~ e ........... --- ._---", --- . ----------..:
-10 -9 -B -7 -6 -5 -4 -3 -2
log 10 A
n
7
6
5
4
3
2
3 .... ---.: I -. :--.! 2 -1 _ .-........;:.-.......
-1 -.....,-,,_.
-2
Figure 18. Graph of Log iO A Versus n.
4 5 6
~ --...... -..xJ

TABLE 9. Slopes of the 10910 A versus n Graph.
Temperature C rack Speed Material of (OC) Slo~e Index AC-10 34 (l0) 0.261 -1. 223
77 (25°) 0.289 -5.054
ARC-Low 34 (1°) 0.276 2.474 77 (25°) 0.283 -4.476
ARC-Medium 34 (1°) 0.337 -2.288 77 (25°) 0.368 -0.740
ARC-High 34 (l0) 0.291 -1. 408 77 (25°)
46

Creep Testing and Creep Compliances
The creep of asphaltic concrete and asphalt-rubber concrete is not
only an important material property in itself, it is also related to and
is an indicator of several important properties of these materials
including their permanent deformation, temperature susceptibility, and
fracture properties. Because a creep test is simple and quick to run at a variety of temperatures, it is useful to run a series of these tests to
assist in interpreting the expected performance of pavements built with these materials.
The creep test is made in a temperature chamber on a cylindrical
sample that is 4 inches (10.8 cm) in diameter and 8 inches (21.6 cm) high. Collars are clipped around the sample to support two LVOT's which
measure the displacement of the middle half of the sample. A schematic and a photograph of a creep sample mounted in the testing equipment are
shown in Figure 19.
A stress that is less than half of the expected failure stress of the sample is applied to the top surface of the sample and is held constant
for 1000 seconds while the two LVOT's measure the displacement on
opposite sides of the sample. The displacement is divided by the distance between the two LVOT collars to give a at several times during the length of the test.
strain which is recorded The strain, e:(t), is
divided by the constant applied stress, DO, to give the creep compliance, O(t). The results of the creep tests which were made on the four materials are given in Table 10. A plot of some of the typical results
is shown on a semi-logarithmic graph in Figure 20. Averages of the compliances measured at each temperature were fit
with a curve of the form
(5)
with the resulting constants as shown in Table 11. It is apparent f"rom this table that as the temperature increases, the values of 01 increase
and the values of m decrease.
47

STRESS
K
t: LVDT
~g
- ........ ..,.
1 1 f r f
Figure 19. Creep Test Sample with LVOT Measuring Collar and Test Equipment.
48
~ LVDT ,

TABLE 10. Creep Compliance of Asphalt-Rubber and Asphaltic Concrete Materials.
Time After Loading (sec) Mat'l Sample Temp. (OF) 1.00E-01 1. OOE+OO 1.00E+01 1.00E+02 1.00E+03
AC10Cont AC10-3 40 6.88E-07 1.47E-07* 3.44E-06 7.47E-06 1.59E-05 AC10-5 40 7.50E-07 1.84E-06 3.47E-06 8.59E-06 1. 89E-05 AC10-1O 40 5.47E-07 9.84E-07 1.95E-06 4.84E-06
AC10-7 70 3.67E-06 1.02E-05 1.89E-05 2.69E-05 4.04E-05 AC10-2 70 1.09E-06* 1.13E-05 2.23E-05 2.92E-05 3.90E-05 AC10-8 70 2.89E-06 8.28E-06 1.53E-05 2.23E-05 3.38E-05 AC1 0-1 100 1.46E-05 2.90E-05 3.44E-05 3.96E-05 4.62E-05 AC10-4 100 1.04E-05 2.27E-05 2.55E-05 2.84E-05 3.44E-05 AC10-6 100 8.13E-06 1.88E-05 2.56E-05 2.88E-05 3.98E-05
AR-Low AR1L 40 1. 44E-06 2.66E-06 6.50E-06 1.16E-05 1.87E-05 AR3L 40 8.44E-07 1.78E-06 3.66E-06 6.88E-06 1.33E-05 AR7L 40 1.88E-07 2.81E-07 6.88E-07 1.45E-06 2.23E-06
AR2L 70 3.13E-06 8.36E-06 1.56E-05 2.23E-05 2.81E-05 AR4L 70 3.13E-06 7.81E-06 1.41E-05 2.13E-05 3.01E-05 AR8L 70 3.13E-06 8.59E-06 1.62E-05 2.58E-05 3.92E-05 AR5L 100 8.54E-06 1.70E-05 2.38E-05 2.75E-05 3.09E-"): AR6L 100 7.92E-06 1. 49E-05 2.lOE-05 2.71E-05 3.3E-~5 AR9L 100 3.44E-06 1.58E-05 2.38E-05 3.15E-05 4.22E_cJ5
AR-Med. AR2M 40 5.31E-07 1.31E-06 2.98E-06 5.56E-06 8.93E-:)6 AR4M 40 9.06E-07 2.06E-06 4.50E-06 7.75E-06 AR6M 40 1.00E-06 2.06E-06 4.00E-06 7.72E-06 1.34E-05
AR5M 70 5.86E-06 1. 65E-05 2.68E-05 3.56E-05 5.08E-05 AR9M 70 3.13E-06 8.59E-06 1.51E-05 2.25E-05 3.45E-05 AR1M 70 4.58E-06 1. 04E-05 1.47E-05 1.77E-05 2.25E-05 AR3M 100 1.04E-05 2.07E-05 2.88E-05 3.65E-05 4.81E-05 AR10M 100 4.69E-06 1. 04E-05 1.47E-05 1.78E-05 2.26E-05 AR8M 100 1. 03E-05 2.22E-05 3.27E-05 4.24E-05 5.64E-05
AR-High AR1H 40 7. 19E -07 1.53E-06 3.42E-06 6.92E-06 1.43E-05 AR5H 40 6.41E-07 1.44E-06 3.16E-06 6.03E-06 9.84E-06 AR8H 40 4.38E-07 1.20E-06 2.89E-06 6.17E-06 1.22E-05 AR3H 70 3.20E-06 8.75E-06 1. 69E-05 2.51E-05 3.89E-05 AR6H 70 4.30E-06 1.05E-05 1.93E-05 3.lOE-05 5.00E-05 AR7H 70 3.05E-06 7.97E-06 1.34E-05 1.76E-05 2.34E-05
AR2H 100 4.17E-06 9.38E-06 1.31E-05 1.46E-05 2.29E-05 AR4H 100 9.06E-06 1.77E-05 2.48E-05 3.08E-05 4.00E-05 AR9H 100 6.15E-06 1. lOE-05 1.50E-05 1.69E-05 1.94E-05
*Questionab1e measurement
49

co I
UI IS ...
)(
,.... ..0 -...... C\I , C -'-'
"" a tl Z < ..... ...J 0... %
8 0... UI UI a: u
flfB
~
5lIlE-
.~ 31111-
2111
1111
1/1
UliE-2
TEMP. = 71<l F
SYMBOL BINDER 0 AC-ll<l )( AR-Low .. AR-M .. d
+ AR-Hi
UliE-l
S6Mf1.END. 2
4L 9M 6H
/'/
UliEIII UliE1 UliE2
TI ME (S .. oond .. )
Figure 20. Typical Pl"t of Creep Compliance Versus Time.
/' .-x
UliE3 UliE4

TABLE 11. Creep Compliance Properties of Asphalt-Rubber Concrete and Asphalt Concrete Materials.
Material Temperature of (OC) Dl m
AC10 Control 40 (4.4) 1.38xlO-6 0.354
70 (21.1) 7.9lxlO-6 0.254
100 (37.8) 1.83xlO-5 0.128
AR-Low 40 (4.4) 1.19xlO-6 0.290
70 (21.1) 7.01xlO-6 0.247
100 (37.8) 1.24xlO-5 0.177
AR-Medium 40 (4.4) 1. 70xl 0-6 0.289
70 (21.1) 9.20xlO-6 0.211
100 (37.8) 1. 42xl 0-5 0.164
.~R-Hi gh 40 (4.4) 1.35xlO-6 0.328
70 (21.1) 7.65xlO-6 0.245
100 (37.8) 1.04xlO-5 0.146
51
The degree to which these values shift with temperature is an
indicator of the temperature susceptibility of each material. In order
to compare these properties numerically, a time-temperature shift property of each materi al was determi ned. The average creep compl i ance curves for each temperature were shifted horizontally parallel to the
time-axis until each lined up with the curve for 700 F (21.1 0C), which was
designated as the "master" creep curve. The amount of the shift in time with changing temperature is expressed as a ratio, aT, which is itself, a
function of temperature. The ratio, aT, is
aT = t (6)
where:
tTo
tTo = the time at which a given compliance is reached when the
material is at the "master" temperature, To. In this
case the master temperature is 70°F (21.1 oC). t = the time at which the same compliance is reached when the
material is at some other temperature.
It is more desirable for the value of aT to change by a small amount over any temperature range. Values of the aT function for each of the materials are shown in Figure 21, and this indicates that there is some
variation of aT between the four materials. Two commonly-used functions were fit to the curves in Figure 21 to
produce numerical comparisons of the temperature susceptibility of the four materials. The fi rst of these is commonly used in the
VESYS-analysis method developed by the Federal Highway Administration (Ref 6). The function is
log aT = - 6(T-To)
where 6 = the temperature susceptibility constant
To = the master curve temperature T = any other temperature
52
(7)

3.0
2.0
1.0
log aT
o
-1.0
40 -30
50 -20
60 -10
- - - - ARC High Blndar Content
70 o
ARC Med. Binder Content
ARC Low Binder Content
AC-l0 Control
.~
~ ........ .. ~ . . . ....... '. '-.... . ........ ..... .. . "'-
". ........... ......... . . . . . . ............
80 10
90 20
100
30
Figure 21. Time-Temperature Shift Function aT as a Function of Temperature.
53
The second function is one that is commonly used to describe the
time-temperature shift of viscosity in polymers. It is known as the
"WLF" equat ions a fter its ori gi nators, Will i ams, Lande 1. and Ferry (Ref
23). The equation is
log aT = -C1(T-To)
(C/I-Io) (8 )
in which Cl, C2 = the material constants. Of the two, the constant Cl serves as a temperature susceptibility constant.
The values of the temperature shift constants, S, Cl, and C2 are
given in Table 12.
On the basis of the WLF Equation, the materials in this study are
ranked in order of ascending temperature susceptibility:
1. Asphalt-rubber concrete, high binder content
2. Asphalt-rubber concrete, medium binder content
3. Asphalt-rubber concrete, low binder content
4. Asphaltic concrete, control
It appears that the addition of rubber helps the material to maintain a
more stable compliance (or modulus) during temperature changes. This
result agrees reasonably well with the results from the resilient
modulus testing described earlier.
Although permanent deformation is not measured directly by the creep
test, it is commonly considered that at least a part of the permanent
deformation in pavements is due to non-recoverable, time-dependent creep.
The other part of permanent deformation is due to plastic deformation
when the material follows a different stress-strain curve on loading and
unloading.
It is common to estimate the non-recoverable time-dependent creep by
subtracting the ordinates of the creep recovery curve after the load has
been removed from the ordinates of the creep curve under load. Although
the creep reovery curve was not observed in these tests, it usually has
the same general shape as the creep curve, and thus the difference
between the two has roughly the same shape.
54
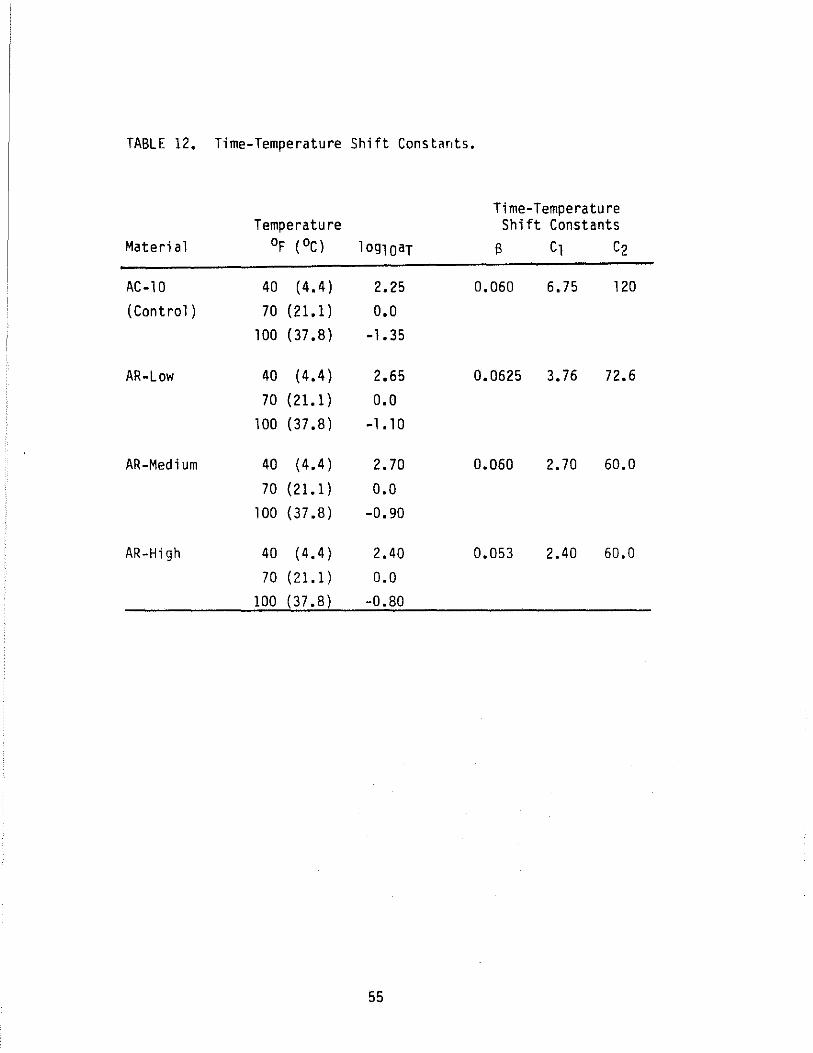
TABLE 12. Time-Temperature Shift Cons t~nts.
Time-Temperature Temperature Shift Constants
Materi al of (OC) 1 091 OaT fl Cl C2
AC-10 40 (4.4) 2.25 0.060 6.75 120
(Control) 70 (21.1) 0.0 100 (37.8) -1.35
AR-Low 40 (4.4) 2.65 0.0625 3.76 72.6
70 (21.1 ) 0.0
100 (37.8) -1.10
AR-Medium 40 (4.4) 2.70 0.060 2.70 60.0
70 (21.1) 0.0 100 (37.8) -0.90
AR-High 40 (4.4) 2.40 0.053 2.40 60.0
70 (21.1) 0.0
100 (37.8) -0.80
55

If the non-recoverable strain were equal to the creep curve alone,
which it is not, it would be possible to account for that part of the
permanent deformation that is due to non-recoverable, time dependent
creep by using the creep curve alone. Then, the equation for the
time-dependent portion of permanent strain after N repetitions of load
pulses would be:
(9 )
The percentage of the resilient strain, Er , which is accumulated with
each stress pulse is F(N) as given by:
where: 0 0 = the stress applied to the sample
D1 = the compliance coefficient
m = the compliance exponent
Er = the resilient strain
lit = the time duration of the stress pulse N = the total number of load pulses
F(N) = the percentage of the resilient strain that remains as permanent accumulated strain.
(10)
The cl uster of terms, 00 D1 m (ll t )m/Er' corresponds to the permanent
strain coefficient, GNU, which is explained in the next section of this
chapter, and the term (l-m) corresponds to ALPHA, the permanent strain
exponent. This exponent has the property that the closer it is to 1.0,
the more the material behaves elastically and the closer it is to 0.0,
the more the material behaves plastically. On this basis, at 700 F
(21.1 0C), the four materials are ranked in order of increasing plastic
behavior, as judged from the m-exponent:
56

1. Asphalt-rubber concrete, medium binder content
2. Asphalt-rubber concrete, high binder content
3. Asphalt-rubber concrete, low binder content
4. Asphalt concrete, control This result indicates that the asphalt concrete control material would
experience the most time-dependent permanent deformation of the four
materials. The fracture of asphaltic concrete obeys a law of fracture mechanics
known as Paris' Law (Ref 21). Although it was originally considered an
empirical relation, it has subsequently been derived from first
principles of mechanics by Schapery (Ref 22). Paris' Law is stated as
fo1lows:
dc = A(lIK)n (11) dn
where dc/dn = the rate of growth of a crack with each load cycle, N
lIK = the change of stress intensity factor, a calculated quantity, with each stress pulse
A,n = the fracture coefficient and exponent which are determined by experiment.
Schapery's derivations showed that the two material properties A and
n are, in fact, determined by simpler material properties including the creep compliance and tensile strength (Ref 22). He found that the
fracture exponent, n, can be determined simply as
where mt = the slope of the tensile log-log plot of creep compliance versus time.
(12 )
The creep compliance tests that are reported here were compressive,
not tenSile, but their relative size will indicate the way that the fracture exponent varies with binder and with temperature. Table 13
57
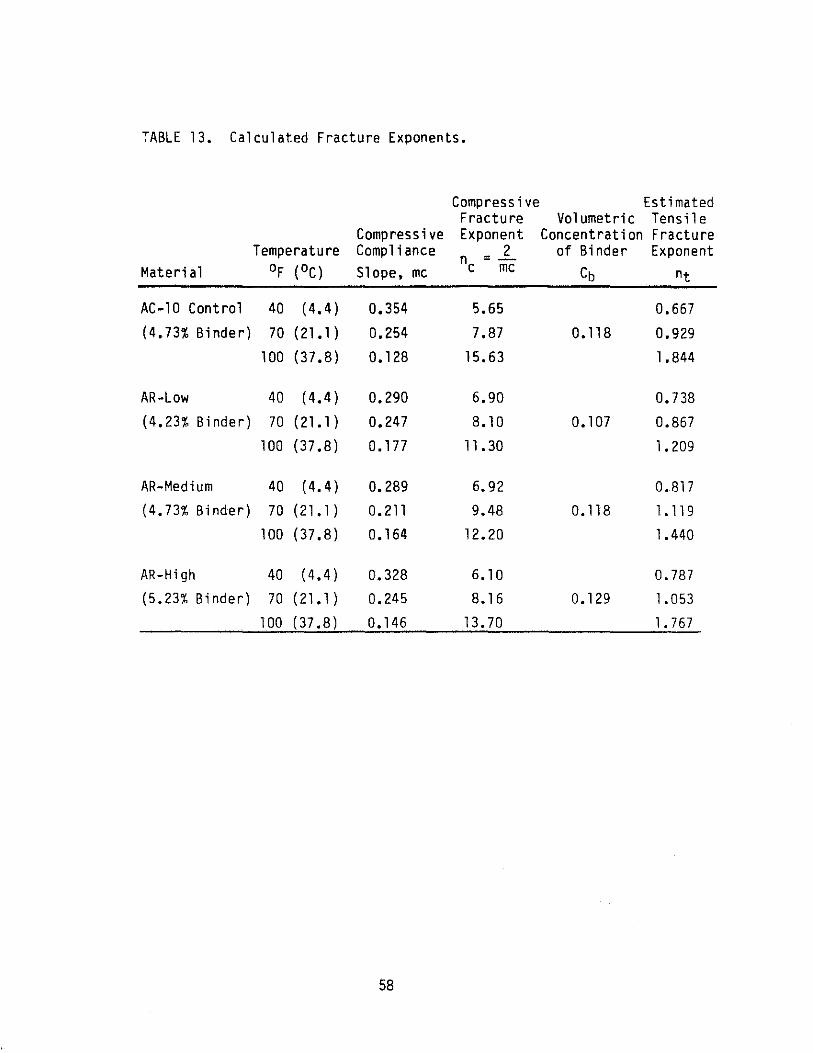
TABLE 13. Calculated Fracture Exponents.
Compressive Estimated Fracture Vol umetri c Tens il e
Compressive Exponent Concentration Fracture Temperature Compliance n - 2 of Bi nder Exponent
Materi a 1 of (OC) Slope. mc c mc Cb nt
AC-10 Control 40 (4.4) 0.354 5.65 0.667 (4.73% Binder) 70 (21.1) 0.254 7.87 0.118 0.929
100 (37.8) 0.128 15.63 1.844
AR-Low 40 (4.4) 0.290 6.90 0.738 (4.23% Binder) 70 (21.1) 0.247 8.10 0.lD7 0.867
100 (37.8) 0.177 11.30 1.209
AR-Medium 40 (4.4) 0.289 6.92 0.817 (4.73% Binder) 70 (21.1) 0.211 9.48 0.118 1. 119
100 (37.8) 0.164 12.20 1.440
AR-High 40 (4.4) 0.328 6.10 0.787 (5.23% Binder) 70 (21.1 ) 0.245 8.16 0.129 1.053
100 (37.8) 0.146 13.70 1.767
58

shows the slope of the compressive creep compliance curve and the
fracture exponent derived from it. The fracture exponents are larger
than those that were measured at 340 F (l.lOC) and 77 0 F (250C) with the
overlay tester indicating, correctly, that the compliance of the
asphalt-rubber concrete and asphaltic concrete in tension is greater than
it is in compression. Typically, the value of tensile mt is between 0.5 and 1.0, which gives tensile fracture exponents between 1.0 and 2.0.
If the compressive fracture exponent is multiplied by the volumetric concentration of binder, as is suggested by the rule of mixtures, the
resulting tensile fracture exponents are shown in the last column of Table 13. These estimated tensile fracture exponents are in the expected
range. The compressive creep test is a simple, quick and valuable test to
give not only the creep compliance of a material but also indications of
its temperature susceptibility, permanent deformation properties, and
fracture exponent.
Repeated Load Testing and Permanent Deformation Parameters
Permanent deformation parameters were used to characterize the materials for rutting susceptibility. Typically, the results of creep or
permanent deformation testing are used to plot strain versus number of
loading cycles, as shown in Figure 22, and the resulting curve can then be used to predict the rutting life of a pavement. In this study, repeated load tests were performed and an equation with three material
parameters was used to describe the accumulated strain versus loading cycles curve. This permanent deformation characterization method was one
of the reasons for choosing the modified ILLIPAVE program for analysis instead of the VESYS program initially chosen for use. Typical repeated
load test results are plotted in Figure 23, which shows total and accumulated strain.
The VESYS pavement structural analysis program (Ref 6) uses two terms, ALPHA and GNU, to characterize permanent deformation. ALPHA and GNU are calculated from the intercept and the slope of the straight line
relationship between the logarithm of the permanent strain and the
59
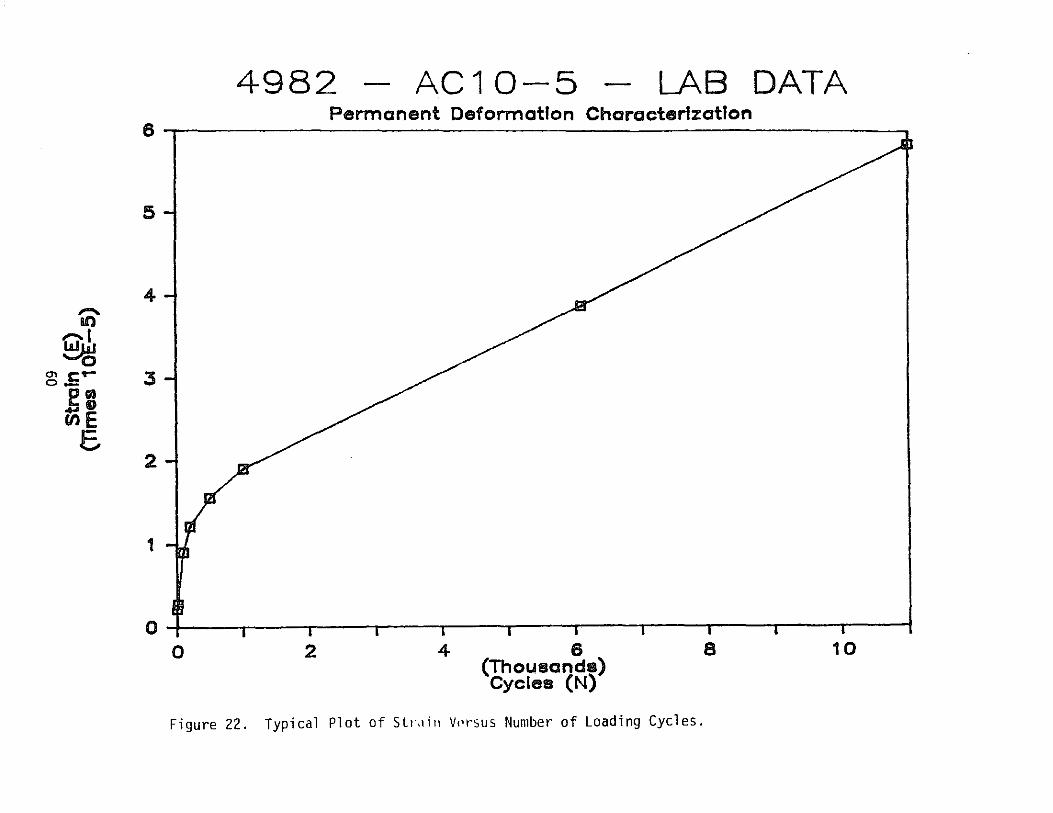
-If') QI ~
'" c .... 0_
Ell (l)E E.
4982 AC10-5 LAB DATA Permanent DeformatIon CharacterizatIon
6 ~---------------------------------------------------------,
5
4
3
2
1
04---~----.---~----.----.----.----.----.----.----~---;
o 2 4 6 (Thousands) Cycles (N)
Figure 22. Typical Plot of Stl'.lill V"rsus Number of Loading Cycles.
a 10
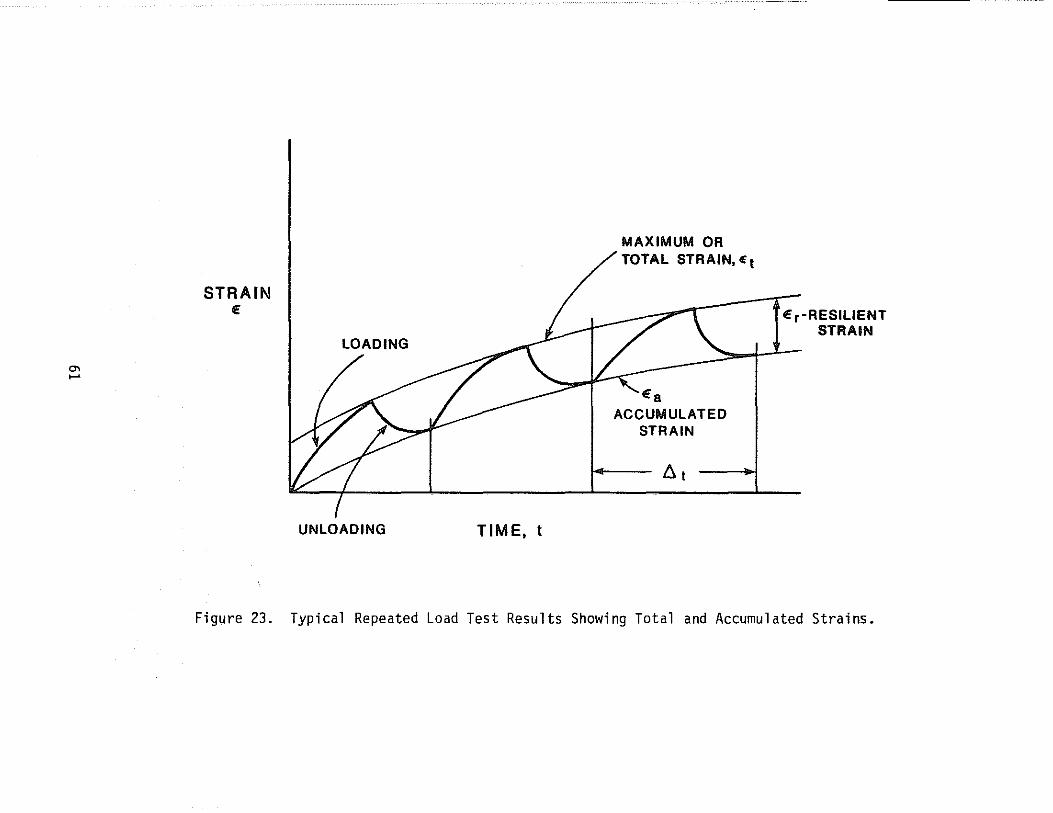
a......
STRAIN €
LOADING
UNLOADING TIME. t
MAXIMUM OR TOTAL STRAIN. E t
~ ( t€r-RESILIENT
€B ACCUMULATED
STRAIN
lit
STRAIN
Figure 23. Typical Repeated Load Test Results Showing Total and Accumulated Strains.

logarithm of the number of load applications (Ref 14). They are defined
as follows:
GNU = I*S/e:r (13 )
and
ALPHA = 1-5 (14 )
where I = the arithmetic value of the intercept (not a logarithm)
S = the slope of the linear portion of the logarithmic relationship
e:r = resilient strain.
However, it has been shown (Ref 8,9,24) that a three-parameter, nonlinear equation more accurately describes the material behavior of asphalt
composites due to permanent deformation. The three parameters are developed from the following equation, which is used to describe the same
permanent strain versus loading cycles curve:
where e:a = permanent (accumulated) strain N = loading cycle
EQ, p, and S are calculated parameters
(15 )
This equation describes an S-shaped curve with the strain at a high number of cycles approaching some horizontal asymptote. The change in
di rection of the S-shape occurs at N = p, or where e:a = e:O*e-l = .368e:0. Using this equation, the relationship between strain and cycles never becomes linear and therefore more accurately represents the material
behavior. The procedures for calculating the three parameters, as well as the
method of using these parameters for calculating rut depths in the modified ILLIPAVE computer program, are described elsewhere (Ref 8).
In this study, repeated load compression tests were performed to 10,000 or more cycles on cylinders following the VESYS procedures for
62
. --....

direct compression testing (Ref 6). One test was performed for each
material at every test temperature (40oF, 700 F and 100oF; or 4.4oC,
2l.l oC, 37.SoC). A plot of permanent strain versus cycles was made for
each sample tested to determine the shape of the curve and whether the
three parameter equation could be used to describe the material behavior (see Appendix C).
Resilient strain was read from the dynamic test output at 200 cycles
and the three permanent deformation parameters were calculated. Two
methods were used to calculate the three parameters: a linear regression program written at Texas A&M University, and a nonlinear regression program which is part of the S.A.S. statistical analysiS package. The
linear regression program is based on a method which takes the logarithm
of both sides of the S-shaped curve equation and then reduces the result to the linear form y = mx + b, where m is the slope of the line and b is the y-intercept. A least squares regression is then applied to the test
data and a linear best fit is calculated. Alternatively, the S.A.S. nonlinear regression program uses an iterative process in which an
initial guess of each parameter must be input. At least one of these methods produced a good fit for every test, but rarely did both methods produce a good fit for the same test results. Table 14 gives a summary
of the calculated permanent deformation parameters and the method of calculation used for each test sample.
The permanent deformation parameters were sensitive to several factors, including stress level and temperature. The laboratory testing
had to be performed with an applied load which was much lower than that which would be expected in the field conditions. This was because an axial load was applied to a cyclindrical specimen with a small diameter (4 inches) which had no confining pressure applied, and the specimen
failed at much lower stresses than in the field where every element of material is supported by the lateral pressure of surrounding elements. Therefore some adjustment had to be made to the permanent deformation
parameters to account for the differences in applied versus field
stresses. First, typical field stresses were calculated for each horizontal element (seven elements were defined in the top pavement layer
63

TABLE 14. Permanent Deformation Parameters from Lab Tests.
Reg ress ion Mater; al T(OF) Sample e:0 RHO BETA e:O/e:r Method
AC-10 40 AC10-5 0.0187E+0 1.1539E16 0.0637 1,662 Nonlinear
70 AC10-7 0.8232E-3 0.9817E04 0.2070 27.44 Linear
100 AC10-1 0.9355E+0 6.3750E16 0.0591 31,509 Nonlinear
ARC-Low 40 AR-3L 0.0326E+0 3.4221E16 0.0651 2,219 Nonlinear
70 AR-4L 0.4379E+0 2.5438E16 0.0670 13,738 Nonlinear
100 AR-5L 1. 1542E-2 0.1917E05 0.1292 94.89 Linear
ARC-Med. 40 AR-4M 0.0181E+0 3.4514E16 0.0645 1,445 Nonlinear
70 AR-9M 0.0238E+0 2.8904E16 0.0524 544 Nonlinear
100 AR-8M 0.0588E+0 2.5023E16 0.0560 1,680 Nonlinear
ARC-High 40 AR-5H 0.0357E+0 1. 2988E15 0.0709 4,967 Nonlinear
70 AR-6H 0.7124E-2 0.4716E11 0.0738 165 Linear
100 AR-9H 0.4829E-3 0.5229E03 0.1528 14.72 Linear
64
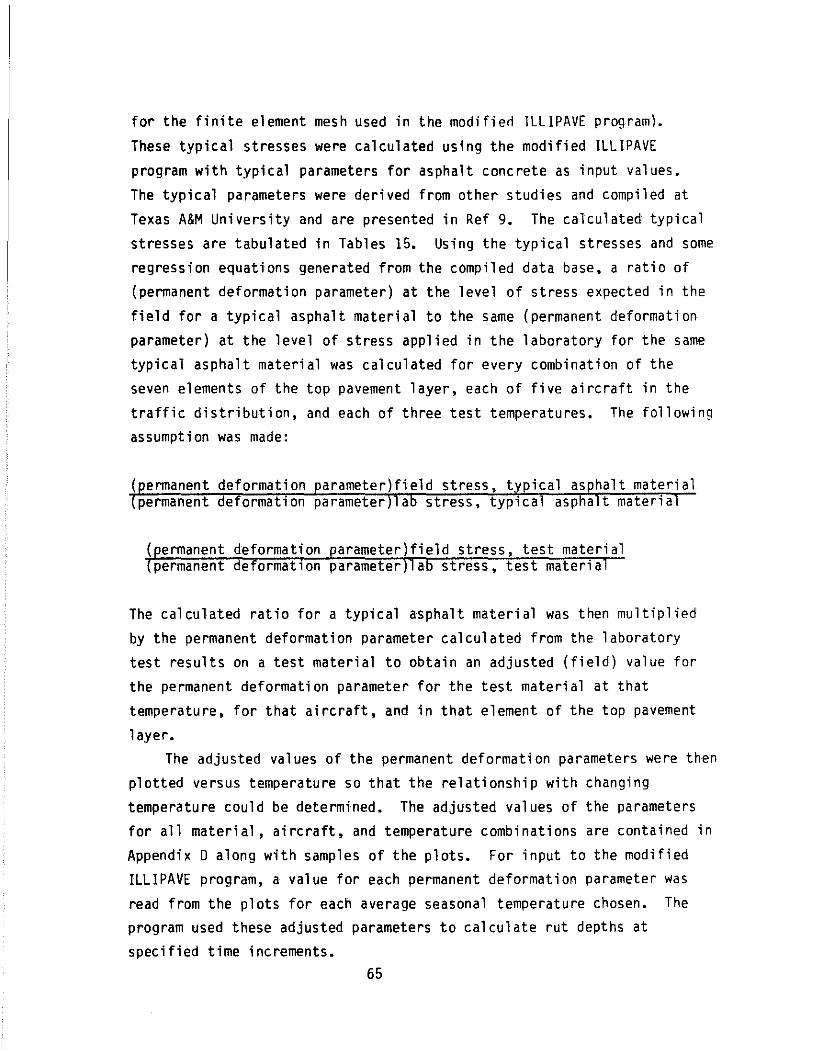
for the finite element mesh used in the modifierl ILLIPAVE program).
These typical stresses were calculated using the modified ILLIPAVE
program with typical parameters for asphalt concrete as input values. The typical parameters were derived from other studies and compiled at
Texas A&M University and are presented in Ref 9. The calculated typical
stresses are tabulated in Tables 15. Using the typical stresses and some regression equations generated from the compiled data base, a ratio of (permanent deformation parameter) at the level of stress expected in the
field for a typical asphalt material to the same (permanent deformation parameter) at the level of stress applied in the laboratory for the same typical asphalt material was calculated for every combination of the seven elements of the top pavement layer, each of five aircraft in the
traffic distribution, and each of three test temperatures. The following assumption was made:
( ermanent deformation arameter)field stress, typical asphalt material permanent eformatlon parameter a stress, tYPlca asp a t materia
( ermanent deformation arameter)field stress, test material permanent e ormatlon parameter a stress, test materla
The calculated ratio for a typical asphalt material was then multiplied
by the permanent deformation parameter calculated from the laboratory test results on a test material to obtain an adjusted (field) value for
the permanent deformation parameter for the test material at that temperature, for that aircraft, and in that element of the top pavement
layer. The adjusted values of the permanent deformation parameters were then
plotted versus temperature so that the relationship with changing temperature could be determined. The adjusted values of the parameters
for all material, aircraft, and temperature combinations are contained in Appendix D along with samples of the plots. For input to the modified ILLIPAVE program, a value for each permanent deformation parameter was
read from the plots for each average seasonal temperature chosen. The program used these adjusted parameters to calculate rut depths at specified time increments.
65

TABLE 15. Stresses in Top Pavement La'yer Used to Calculate Permanent Deformation Parameters for the Field Conditions (Aircraft Loads).
Aircraft Temperature Element Stress{Field) Stress (Lab)
DC-09 40 2 70.90 20
3 86.90 20
4 80.8 20
5 78.18 20
6 85.00 20
7 104.89 20
70 1 10.8 20
2 69.60 20
3 84.79 20
4 76.90 20
5 69.55 20
6 69.80 20
7 79.06 10
100 1 69.30 10
2 117.67 10
3 113.47 10
4 89.70 10
5 70.99 10
6 59.21 10
7 51.58 10
66

TABLE 15. (Continued)
Ai reraft Temperature Element Stress(Field) Stress (Lab)
DC-10 40 2 47.00 20
3 94.25 20 4 110.31 20
5 121.86 20 6 141.64 20
7 179.49 20
70 2 54.60 20 3 93.63 20 4 102.40 20 5 104.67 20 6 112.70 20 7 132.04 20
100 1 67.10 10
2 124.75 10 3 138.54 10 4 123.45 10 5 105.60 10 6 92.30 10 7 83.20 . 10
67
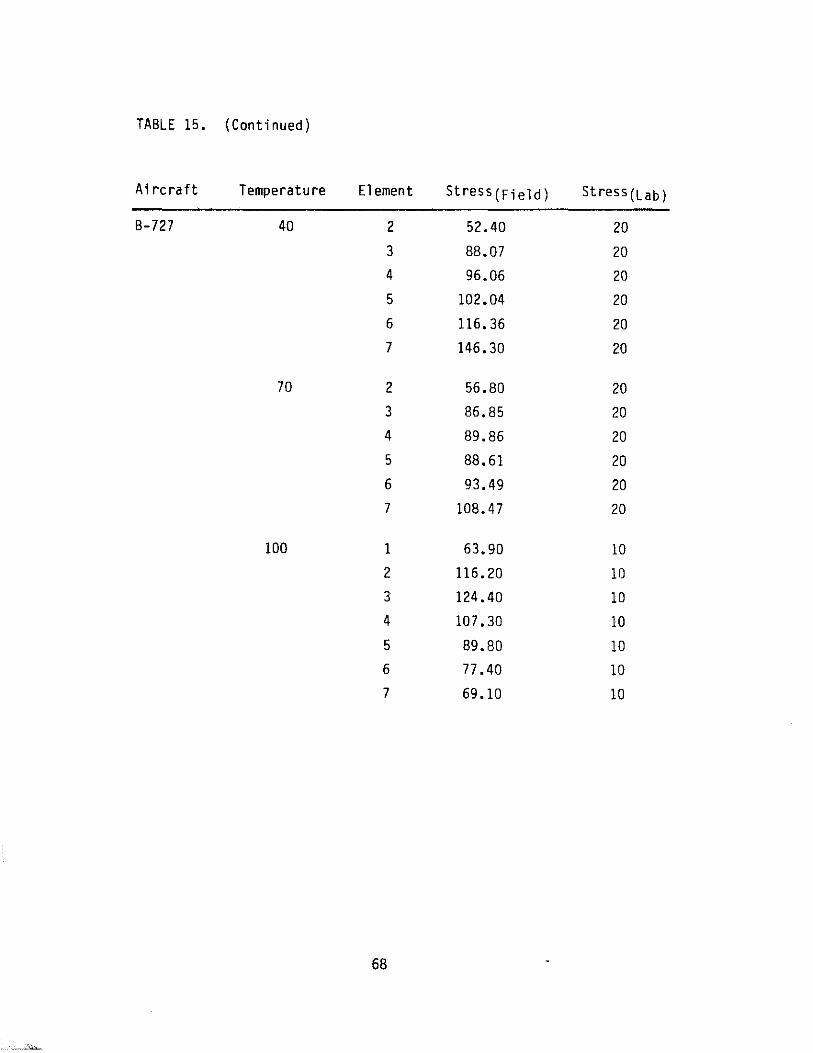
TABLE 15. (Continued)
Ai reraft Temperature Element StreSS(Field) Stress(Lab)
B-727 40 2 52.40 20
3 B8.07 20 4 96.06 20
5 102.04 20
6 116.36 20 7 146.30 20
70 2 56.80 20 3 86.85 20 4 89.86 20 5 88.61 20
6 93.49 20 7 108.47 20
100 1 63.90 10
2 116.20 10
3 124.40 10
4 107.30 10
5 89.80 10 6 77 .40 10
7 69.10 10
68

TABLE 15. (Continued)
Aircraft Temperature Element StreSS(Field) Stress(Lab)
B-737 40 1 8.20 20
2 61.80 20 3 74.20 20 4 70.80 20 5 69.70 20 6 76.40 20 7 94.60 20
70 1 17.80 20 2 61. 70 20
3 72.60 20 4 67.20 20 5 61.70 20 6 62.50 20 7 71.10 20
100 1 71.34 10 2 103.60 10 3 98.10 10 4 78.80 10 5 62.90 10 6 52.80 10 7 46.20 10
69

TABLE 15. (Continued)
Ai reraft Temperature Element StreSS(Field) StreSS(Lab)
8-757 40 1 0.40 20
2 76.70 20
3 93.40 20
4 86.40 20
5 83.40 20
6 90.60 20
7 111. 70 20
70 1 12.30 20
2 75.20 20
3 91.10 20
4 82.30 20
5 74.20 20
6 74.40 20
7 84.22 20
100 1 74.70 10
2 126.70 10
3 121.60 10
4 96.00 10
5 75.80 10
6 63.20 10
7 55.00 10
70

CHAPTER III. PERFORMANCE PREOICTION OF ASPHALT-RUBBER
CONCRETE AND ASPHALT CONCRETE
In this chapter, the design data and the results of calculations with the modified ILLlPAVE program are presented. In the final section of
this chapter a comparison is made of the predicted lives of a typical airport pavement using each of the four mixes under conditions of mixed traffi c.
DESIGN DATA
The comparative analysis of this project was accomplished by selecting an airport type, pavement structure, and traffic pattern, and
holding these constant. Four environmental zones were simulated by
choosing four typical seasonal temperatures for each zone, and the (~nvironmental zones and the material in the surface layer were varied in mUltiple computer runs of the modified ILLIPAVE program.
Airport Type and Traffic
Asphaltic materials are most typically used as surface layer
materials at a medium to small civil airport. Asphaltic materials creep under heavy loads of more than a very short duration, and thus are subject to moderate to severe rutting. Therefore, they are generally not
considered as suitable materials for larger airports with heavier wheel
loads, higher traffic counts and more likelihood of planes standing in line. The Robert Mueller Municipal Airport in Austin, Texas, was selected as an appropriate airport model for this study. This airport uses runways and taxiways made of asphalt concrete. Austin has
experienced a tremendous growth in recent years and its airport has
experienced the damage problems associated with rapid population and, therefore, traffic growth. The major runway was used as the structural model for the analyses in this study. Some significant distresses were
71

expected in the damage analyses, thus providing an actual scenario in
which to compare the performance of the materials considered.
Total numbers and types of aircraft using the Austin Airport between
1969 and 1981 were known, and projections were available for the years
1985 and 1990 (Ref 25). Only the air carrier aircraft were considered,
because the smaller aircraft (general aviation and air taxi/commuter aircraft) have widely varied taxi patterns. Also, the smaller aircraft
individually cause little to no significant pavement damage compared with the larger and heavier air carrier traffic (Ref 25). Five air carriers
were included in the traffic: OC-9, DC-10, B-727, B-737, B-757. Since the major runway of the Austin municipal airport was used as
the structural model, it was assumed that all of the traffic logged by
the airport used the runway being considered. Therefore, no runway routing percentage factors were applied to the traffic counts. Table 16 gives a summary of the aircraft traffic data. However, not all aircraft
follow exactly the same wheel paths. Much more lateral wander from the
centerline of the path of travel is exhibited by aircraft over the width of a runway than is exhibited by trucks over the width of a highway. Thus, anyone point in the airfield pavement does not experience the same stresses from every aircraft because the airplane gears pass by that point at different distances from the point. Because of this, "wander
factors" must be applied to the numbers of aircraft to obtain an estimate of the number of coverages which pass over the area experiencing the maximum or critical strain. It was assumed that the lateral movement of each aircraft type over the width of the runway is normally distributed.
Using this assumption and the basic aircraft characteristics, wander factors were computed by Rauhut, et al. (Ref 25), generally following the procedure outlined by Ho Sang (Ref 26). This procedure "was modified somewhat to account for the transverse profile of the critical pavement
response parameters of asphalt concrete tensile strain and subgrade
vertical compressive strain" (Ref 25, p.IV.5). The wander factors derived by Rauhut, et a1. were used in this study and are listed in Table 17. The total traffic counts for each year and each aircraft were multiplied by the wander factors and then divided by 365 to obtain an
72
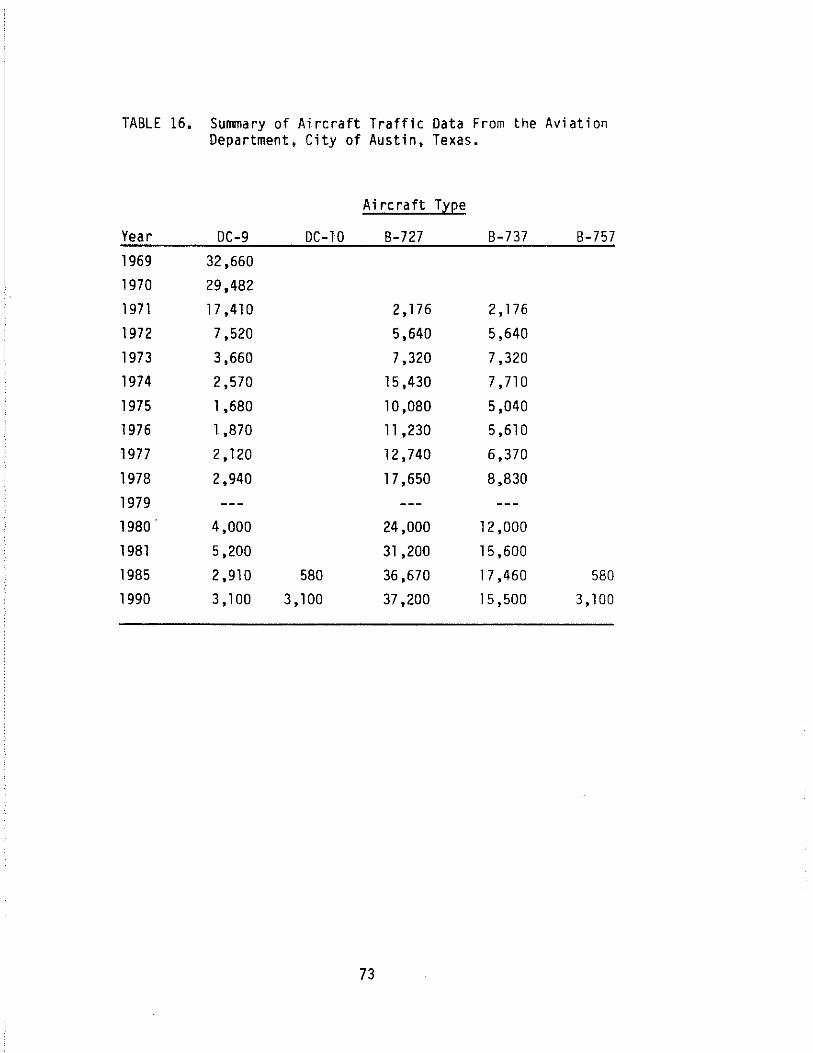
TABLE 16. Summary of Aircraft Traffic Data From the Aviation Department, City of Austin, Texas.
Ai rc ra ft T~l2e
Year DC-9 DC-l0 B-727 8-737 8-757
1969 32,660
1970 29,482
1971 17,410 2,176 2,176
1972 7,520 5,640 5,640
1973 3,660 7,320 7,320
1974 2,570 15,430 7,710
1975 1,680 10,080 5,040
1976 1 ,870 11 ,230 5,610
1977 2,120 12,740 6,370
1978 2,940 17,650 8,830
1979
1980 4,000 24,000 12,000
1981 5,200 31 ,200 15,600
1985 2,910 580 36,670 17,460 580
1990 3,100 3,100 37,200 15,500 3,100
73

TABLE 17. Summary of Aircraft Traffic Wander Factors for Each Aircraft Considered in the Pavement Evaluation.
Aircraft Wander Factor*
B-727 0.77
B-737 0.57
8-757 0.61
DC-9 0.68
DC-10 0.72
*Wander Factor is simply the inverse of the Pass-to-Coverage Ratio
74

estimate of the maximum or critical number of passes per day for each
aircraft. See Table 18 for a summary of the numbers of critical passes
per day.
The stress analyses were performed considering only the main landing
gear assembly. The nose gear was not considered in the analysis because
it is lighter and smaller than the main landing gear, and it does not traverse the same section of pavement as does the heavier main gear assembly. Therefore, the main landing gear assembly was considered as
the critical loading condition. The five carrier aircraft used in the analysis involved a variety of
main landing gear configurations, wheel loads and sizes, and tire pressures. The aircraft data used in this study are summarized in Appendi x E.
Previous research has confirmed that the tire contact pressures that are experienced by a pavement can in reality be much higher than the
"known" tire inflation pressure (Ref 8). This can have significant
consequences for the amount of pavement damage caused by heavy vehicles and thus for the design life of a pavement. However, not much previous
work has been done in quantifying the tire contact pressures resulting from different load, radius, and inflation pressure combinations. Also,
the work which has been done to this point has looked at stationary vehicles (static loads) and not at moving vehicles (dynamic loads with
both horizontal and vertical components). There are a great many difficulties in measuring loads due to moving vehicles. However, considering the importance of tire contact pressures versus tire
inflation pressures, some estimate was needed for this study of the tire contact pressures of aircraft. Therefore, a known but static contact pressure distribution and the known tire inflation pressures and wheel
loads of the five aircraft in this study were used to create an estimate of the tire contact pressure distribution for each of the five aircraft considered. The "known" pressure distribution was a previously calculated pressure distribution for a 32x8.8 Type VII aircraft tire.
This was a nose gear tire used in WWII on the Boeing B-52 Stratofortress (Ref 27; see Figure 24). As a starting point, the tire inflation
75
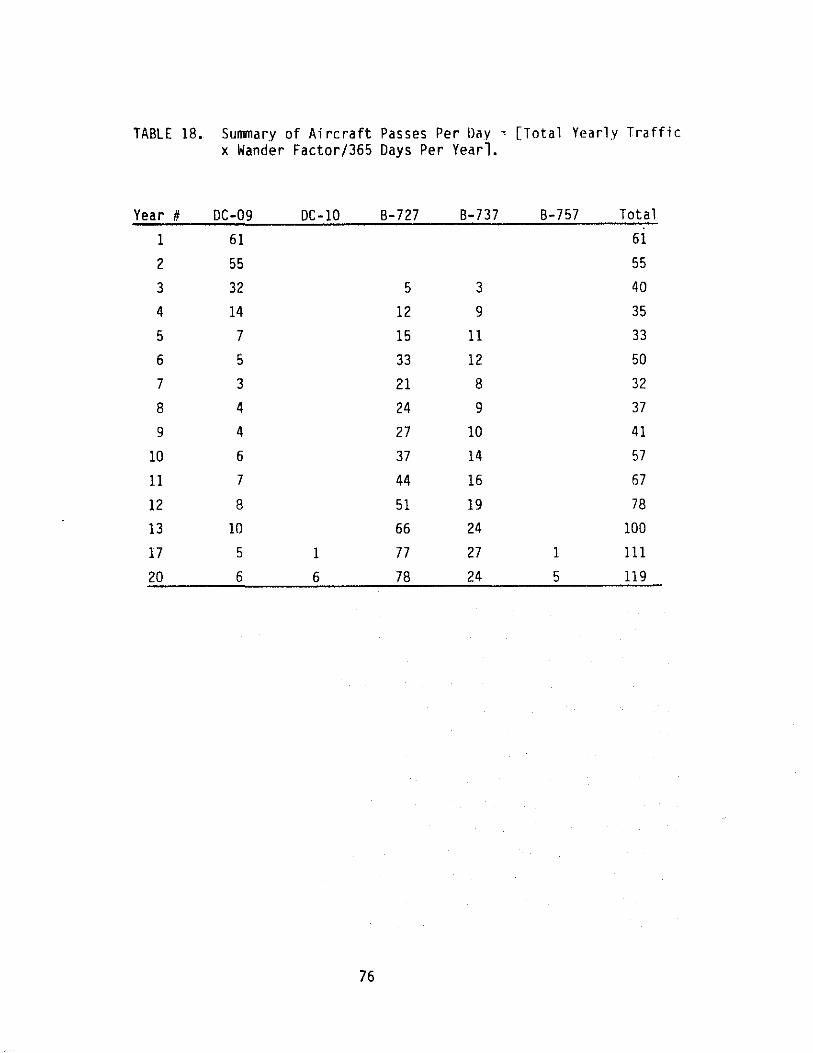
TABLE 18. Sunvnary of Aircraft Passes Per lJay " [Total Yearly Traffic x Wander Factor/365 Days Per Yearl.
Year # DC-09 DC-10 B-727 B-737 B-757 Total
1 61 61
2 55 55
3 32 5 3 40
4 14 12 9 35
5 7 15 11 33
6 5 33 12 50
7 3 21 8 32
8 4 24 9 37
9 4 27 10 41
10 6 37 14 57
11 7 44 16 57
12 8 51 19 78
13 10 66 24 100
17 5 1 77 27 1 111
20 6 6 78 24 5 119
76

AIRCRAFT TIRE CONTACT PRESSURE DISTRIBUTIONS
---- ---------- ---... 48.7 -.... .... "-,- "-,. 90.5
, I ,
I 21.3 105.6 21. 3 \ I \ I 34.4 10S.6 34.4 \ I 2S.3 \ 90.7 psi 2S.3
I I , 34.4 10S.6 34.4 I , I
\ 21.3 105.6 21.3 I \ I , 90.5 /
" / ..... 4S.7 "., -- -- -------------- --(a) 6' 0.75 in., Fz • 2200 lb
------------------------ -, "., " ,./ 12.9 130.4 12.9 "
/ " 45.1 IS7.9 45.1 / \ I 57.3 135.9 57.3 \ I \ , 42.9 132.6 42.9 I
I 3S.2 108.9 psi 3S.2 I 1 I I 42.9 132.6 42.9 I
\ 57.3 135.9 57.3 I \ I \ 45.1 187.9 45.1 / , /
" 12.9 130.4 12.9 / " ".,
'~---------------------~~ (b) 6 • 1.00 In., Fz • 3700 lb
Note: Inflation Pressure: 95 psi (655 kPa). Tire Type: 32xB.B TYPE VII Aircraft Tire. This tire type was used as the nose gear on the Boeing B52 (Stratofortress) in Worl d ~Iar I I. A hi gh-pressure version is used on the nose gear of the U.S. space shuttle.
Figure 24. Calculated Contact Pressures (psi) for Two Different Tire Loads (Ref 27) .
77

pressure of the aircraft being considered was set at the center of the
tire. Then a pressure distribution was created having the same ratios
between adjacent points on the tire as were calculated fer the "known"
model. Then a cylindrical volume of revolution was calculated and the
result was compared with the known wheel load for that tire. The newly
calculated pressure distribution was then adjusted up or down at the center, and the procedure was repeated, until the cyl indrical volume of revolution was approximately equal to the wheel load. The resulting tire
pressure distribution was used as input to the ILLIPAVE program. The calculated estimates of tire contact pressures for each of the five aircraft are shown in Appendix E.
Pavement Structure
The thicknesses and materials of the structural layers at the Austin municipal airport vary slightly over the length of the main runway. A
typical pavement section was chosen and then was held constant for this analysis. Material properties were then estimated for the underlying structural layers, and laboratory characterizations were used for the top
layer, which was variable depending upon the material being analyzed. Figure 25 shows the typical cross section of the runway pavement
structure used in this analyis.
Environmental Effects and Seasonal Temperatures
Because asphaltic materials are temperature sensitive, the analysis was performed at different temperatures to determine temperature effects. Four environmental zones which represent typical areas of the U.S. were
chosen: wet-freeze, wet-no freeze, dry-freeze, and dry-no freeze. Seasonal average temperatures were used whenever temperatures were needed as input values for the analysis. Table 19 gives a summary of the climatic zones and the seasonal temperatures that were used to represent
them.
78

/ /
15.5·
/
5.0· V /
8.0·
/ /
A.C. or A.R.C.
Crushed Limestone
Lime-Stab. Clay
Brown Clay with Gravel Over
E:- 40,000 y-130 pct
E;:;- 70,000
y=140 pcl
fL=0.45
Tan Silty Clay, Some Gravel
E;;;" 20.000
y= 110 pct
fL= 0.45
E=modulus
y =density
fL=Poisson's ratio
Figure 25. Schematic of the Pavement Structure Used in the ILLIPAVE Analysis.
79

TABLE 19. Average Seasonal Temperature for Each of Four Seasons for Each Climatic Zone.
Zone Season Tem~erature,oF (DC)
Wet-Freeze Winter 35 (1.7) Spri ng 65 (18.3) Summer 95 (35.0) Fall 60 (15.6)
Wet-No Freeze Winter 75 (23.9) Spri ng 95 (35.0) Summer 105 (40.6) Fall 95 (35.0)
Dry-Freeze Winter 35 (1. 7) Spri ng 60 (15.6) Summer 90 (32.2) Fall 50 (10.0)
Dry-No Freeze Winter 55 (12.8) Spring 75 (23.9) Summer 95 (35.0) Fall 75 (23.9)
80

EVALUATION OF AIRPORT PAVEMENT PERFORMANCE
In this section of Chapter III, the computer program that was used in
the analysis is described and the results of the analysis for individual
aircraft are presented.
The Modified ILLIPAVE Program
The modified ILLIPAVE program used in this analysis is the third in a series of finite element computer programs that were developed to analyze
the stresses, strains, and displacements in a pavement. The first program in this series was developed by Duncan, et a1. (Ref 28), in
cylindrical coordinates and provided for one circular load with non-uniform vertical and horizontal contact pressure distributions, multiple layers, and non-linear stress-strain curves for the materials ic each layer. The second program was a revision of the first. It pro.ided
for one circular load with a uniform vertical pressure distribution and included a variety of methods of estimating the stress-dependent
resilient modulus of each element depending upon whether the layer was composed of granular or fine-grained soil. Because this revision was
made at the University of Illinois (Ref 7), the program was re-named ILLIPAVE. This second program was obtained by Texas A&M University at
which further modifications were made. This third version of the program, referred to as the "modified ILLIPAVE" program, provides for multiple tires on one or two axles, non-uniform vertical and horizontal contact pressure distributions on circular loaded areas, and all of the
non-linear stress-strain curve capabilities that were available in the two previous programs. In addition, the program predicts rut depth, variance of rut depth, slope variance, present serviceability index (for
highway applications) and fatigue cracking with increasing numbers of
load applications. It also has the capability, not present in the previous programs, of using interface elements which permit one layer to slip with respect to another either with or without resistance that is
proportional to the slip (Ref 8).
81
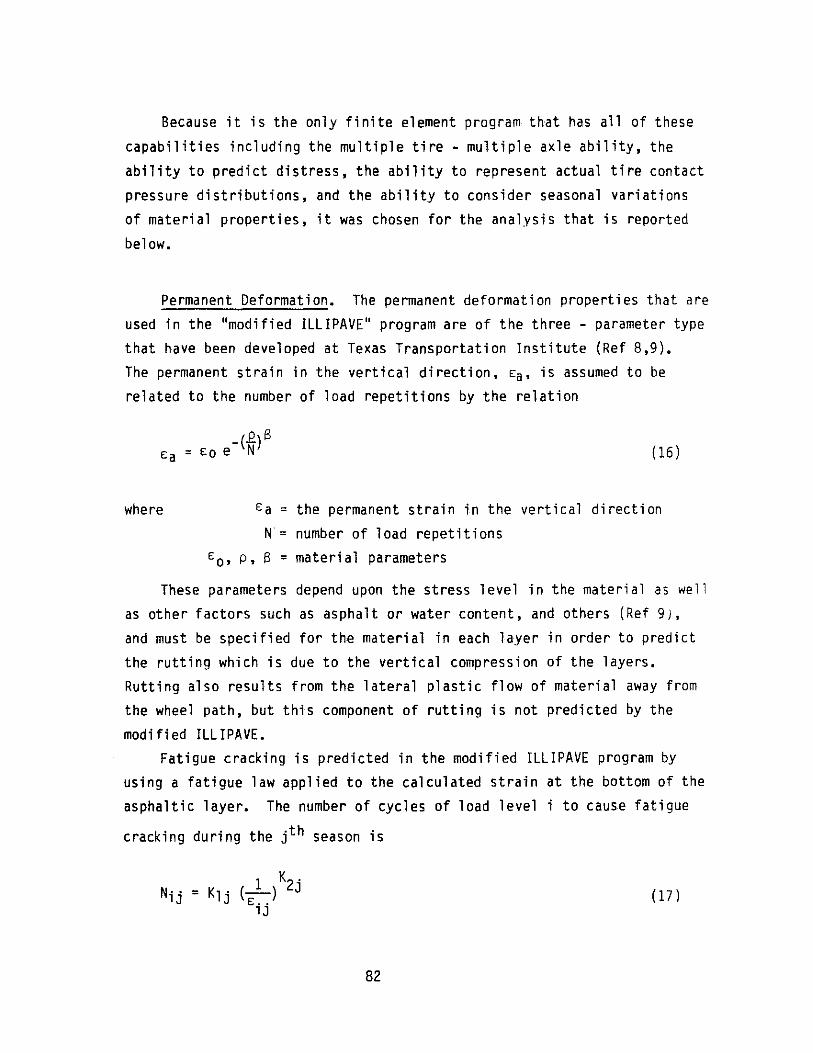
Because it is the only finite element program that has all of these
capabilities including the multiple tire - multiple axle ability, the ability to predict distress, the ability to represent actual tire contact
pressure distributions, and the ability to consider seasonal variations of material properties, it was chosen for the analysis that is reported
below.
Permanent Deformation. The permanent deformation properties that are used in the "modified ILLIPAVE" program are of the three - parameter type that have been developed at Texas Transportation Institute (Ref 8,9).
The permanent strain in the vertical direction, Ea, is assumed to be related to the number of load repetitions by the relation
_(2.)13 Ea = EO e N (16)
where Ea = the permanent strain in the vertical direction
N= number of load repetitions EO' p, 13 = material parameters
These parameters depend upon the stress level in the material as well as other factors such as asphalt or water content, and others (Ref 9),
and must be specified for the material in each layer in order to predict the rutting which is due to the vertical compression of the layers. Rutting also results from the lateral plastic flow of material away from the wheel path, but this component of rutting is not predicted by the
modified ILLIPAVE. Fatigue cracking is predicted in the modified ILLIPAVE program by
using a fatigue law applied to the calculated strain at the bottom of the
asphaltic layer. The number of cycles of load level i to cause fatigue
cracking during the jth season is
(17)
82
where Ei j = the strain at the bottom of the asphalt layer due to
the ith load level in the jth season
Kl j , K2j = fatigue "constants" for the jth season
Nij = the number of load cycles to cause fatigue cracking
due to the ith load level in the jth season.
A "cracking index" is derived from these calculated fatigue lives and
the actual number of repetitions of the ith load level and the jth
season, as follows
n .. -2J.
- N .. lJ
where ck = the cracking index after k seasons
(18 )
nij = the actual number of repetitions of load level i and season j Nij = the number of repetitions to cause fatigue cracking of load
level i in the jth season
It is assumed that ck has a normal probability distribution which
allows the calculation of an expected area of cracking E[CkJ and a pr.obability that the actual cracking index is greater than 1.0. The percentage of the total area of the pavement that has cracked is assumed
to be proportional to the probability that the cracking index is greater
than 1.0. A detailed development of the cracking index equations is
found in Reference (13). In this report, the modified ILLIPAVE program was used to calculate
the distress that occurs in a standard airport pavement placed in four different climatic zones and carrying the landing gear of five different aircraft. The capability of the program to represent multiple tires on
each of two axles, non-uniform vertical and horizontal tire contact pressures, and seasonal material variations made it particularly useful
for these analyses. The data used as input to the program is discussed in the preceding sections of this report, and the results of the analyses
are in the following sections.
83

Maximum Stresses and Strains
The structural deterioration of flexible pavements is usually related
to two failure criteria, the load-induced cracking of the bituminous surface course and the development of ruts in the wheel paths. Fatigue cracking of an asphaltic material, which generally manifests itself as
alligator cracking, is considered to be the result of repeated flexural stresses causing large tensile strains at the bottom of the surface
course. Rutting occurs in all layers and results both from permanent vertical strain and lateral plastic flow in each layer. The compressive
stresses at the top of the subgrade are a good indication of whether the layers placed above it are sufficiently thick so that only minimal
rutting occurs in the subgrade. In order to locate the point under each aircraft gear assembly where
the largest of each of these types of stress or strain is reached, multiple runs of the BISAR pavement structural analysis program were run.
BISAR (~itumen 2tructures .Analysis in B.0ads) is "a general-purpose program for computing stresses, strains and displacements in an elastic multilayered system subjected to one or more uniform loads, acting
uniformly over circular surface areas" (Ref 29). This program was written by Shell Research Laboratory in Amsterdam. The program was run using a pavement structure similar to the one finally used in the materials analysis and comparison in this report, and it was run for a
range of surface layer stiffnesses. Stresses and strains were calculated at points under and between the wheels of the main gear assemblies.
In all cases, the largest tensile stresses or strains at the bottom
of the asphaltic surface material were found to occur directly under one of the wheels. These stresses or strains increased with increasing wheel load and with increasing surface layer stiffness.
The maximum vertical compressive stresses or strains in the entire pavement structure occurred directly under the wheels and at the pavement
surface. The vertical compressive stresses or strains diminished with depth, so that at the top of the subgrade (at a depth of 28.5") they were much less than at the surface of the pavement. At the top of the subgrade, the maximums occurred either directly under the wheel (e.g.,
84

for the DC-IO, at all stiffnesses; and for the 8-727, at lower
stiffnesses) or at the center point of the gear assembly (e.g •• for the
B-727 at higher stiffnesses). However, at this depth (28.5"), the
differences between vertical compressive stresses or strains from point to pOint under the gear assembly were small. Thus, the vertical
compressive stresses or strains at the top of the subgrade may be
considered to be the same at every point under the gear assembly.
Summaries of the results for the DC-IO (four wheels in the main gear assembly) and the B-727 (two wheels in the main gear assembly) are shown in Table 20.
Cracking Analysis: Comparison by Aircraft
Because the modified ILLIPAVE computer program can handle only one
type of load at a time, the computer runs in this study were made initially with the entire traffic count being made up of one aircraft
type for each computer run. Therefore, a direct comparison may be made of the relative cracking damage done by each aircraft. For all
environmental zones and for all materials, the DC-IO aircraft produced the most cracking damage, followed by the B-727, the B-757, the DC-9, and then the B-737. Figure 26 shows an example plot of the cracking index
versus year for the wet-no freeze environment and indicates the relative
cracking damage due to each aircraft. It must be emphasized that these cracking indices were obtained using each aircraft as the entire traffic count and so they are only useful here for comparison of damage due to
different aircraft. Also, the single-aircraft cracking indices have not been adjusted from laboratory to field fatigue conditions. Cracking indices due to mixed traffic will be discussed in a later section.
The cracking damage ranking of the five aircraft can easily be
understood by comparing some of the aircraft characteristics for each of the planes. In Table 21, the aircraft are ranked for each of several variables. It can be seen that the cracking damage rank is directly
correlated with the wheel load and with the tire inflation pressure. The sizes and spacing of the tires also affected the damage ranking.
85
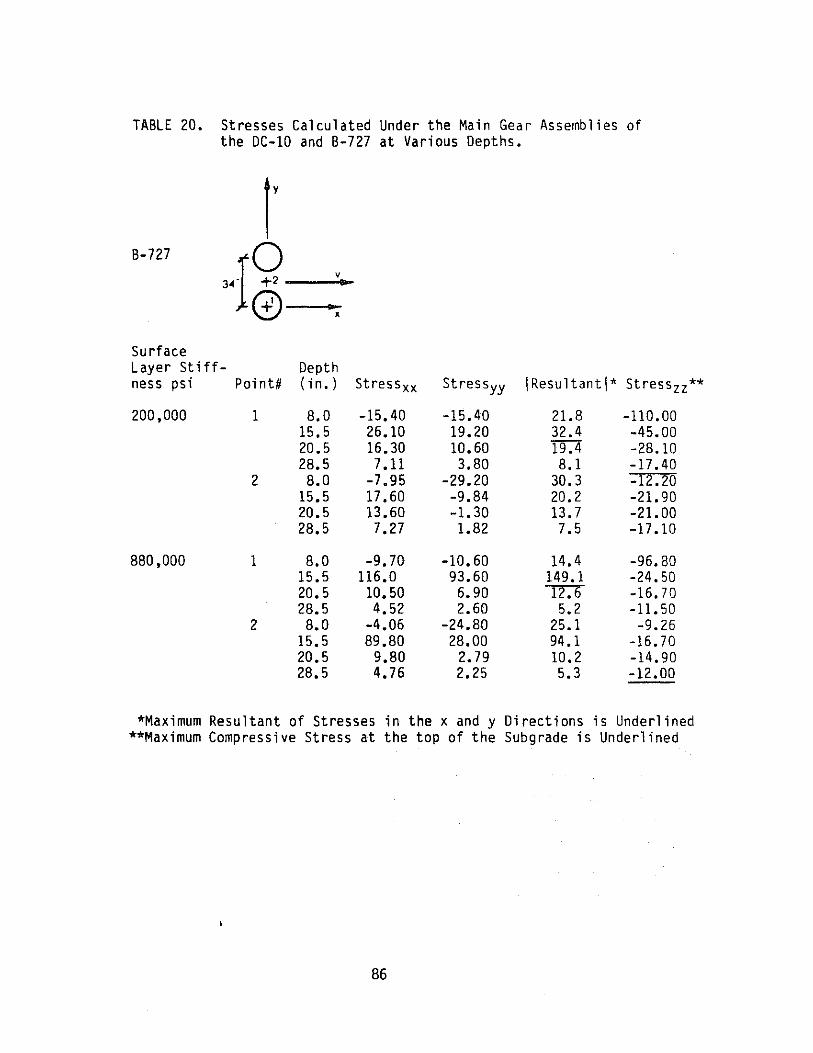
TABLE 20. Stresses Calculated Under the Main Gear Assemblies of the DC-10 and 8-727 at Various Depths.
l' 8-727 ,.19 v ..
0 • x
Surface Layer St iff- Depth ness psi Point# ( in. ) Stress xx Stressyy IResultantl* Stresszz **
200,000 1 8.0 -15.40 -15.40 21.8 -110.00 15.5 26.10 19.20 32.4 -45.00 20.5 16.30 10.60 19.4 -28.10 28.5 7.11 3.80 8.1 -17.40
2 8.0 -7.95 -29.20 30.3 -12.20 15.5 17.60 -9.84 20.2 -21. 90 20.5 13.60 -1.30 13.7 -21. 00 28.5 7.27 1.82 7.5 -17.10
880,000 1 8.0 -9.70 -10.60 14.4 -96.30 15.5 116.0 93.60 149.1 -24.50 20.5 10.50 6.90 "12.6 -16.70 28.5 4.52 2.60 5.2 -11.50
2 8.0 -4.06 -24.80 25.1 -9.26 15.5 89.80 28.00 94.1 -16.70 20.5 9.80 2.79 10.2 -14.90 28.5 4.76 2.25 5.3 -12.00
*Maximum Resultant of Stresses in the x and y Directions is Underlined **Maximum Compressive Stress at the top of the Subgrade is Underlined
86

TABLE 20. (Cent i nued)
t DC-10 ,.rQ +,0 v
II>
(£).¢O • x
• • .. • 64
Surface Layer Stiff- Depth ness psi Peint# ( in. ) St ressxx Stressyy IResultantl* Stress zz**
200,000 1 B.O -lB.60 -lB.60 26.3 -126.0 15.5 26.60 25.50 36.B -53.00 20.5 15.30 14.40 21.0 -32.7 2B.5 5.52 5.05 7.5 -19.80
2 B.O -6.92 -13.00 14.7 -3.22 15.5 4.92 -17.30 1B.0 -9.57 20.5 4.41 -10.50 11.4 -12.00 2B.5 3.17 -3.20 4.5 -13.00
3 B.O -5.92 -6.55 B.B -1. 90 15.5 -10.60 -6.66 12.5 -5.51 20.5 -B.26 -4.65 9.5 -7.61 2B.5 -3.62 -1.22 3.8 -9.79
4 B.O -B.07 -6.12 10.1 -2.21 15.5 -15.BO 1.30 15.8 -6.52 20.5 -11.30 1. 61 11.4 -8.65 28.5 -4.66 1.89 5.0 -10.30
B80,000 1 8.0 -13.10 -13.40 18.7 -110.0 15.5 117.0 114.0 163.4 -2B.50 20.5 8.70 B.29 "1"2.0 -19.40 2B.5 3.07 2.94 4.3 -13.60
2 8.0 -7.2B -14.80 16.5 -5.26 15.5 43.30 -10.30 44.5 -11. 80 20.5 3.92 -2.95 4.9 -12.20 2B.5 2.21 -0.21 2.2 -11. 90
3 8.0 -11.60 -7.65 13.9 -4.48 15.5 -19.10 2B.80 34.6 -9.55 20.5 -4.61 2.32 5.2 -10.30 2B.5 -1.43 1.69 2.2 -10.50
4 B.O -9.99 -9.91 14.1 -4.43 15.5 -B.78 6.58 11. 0 -9.38 20.5 -3.47 -0.B3 3.6 -10.40 28.5 -1.06 0.51 1.2 -11. 00
87

Vi' a; Qj E III ~
III c.. .. :J .,. ;: 0 ... ..a 0
....I ~
x .. " 00 .5 00 CD c :;;: 0 III
U
.~ iii W a:
Figure 26.
WET/NO FREEZE AC-10 CONTROL - EACH PLANE - TOT. TRAF.
24
22 0 DC-9
20 + DC-10
18 0 B-727
6 B-737 16
)( B-757
14
12
10
IS
1:1
4
2
0 1 :5 5 7 9 11 13 15 17 19
V .. ar
Plot of Relative Cracking Index versus Year, Showing Cracking Damage Comparison of the Five Aircraft in the Mixed Traffic Pattern. (Note: For this Plot, Each Aircraft is Separately Considered as Making Up the Total Traffic).

00 \D
TABLE 21. Rankings of Each of the Five Aircraft Relating Several Aircraft Characteristics to the Pavement Damage Indicators.
DC-9 DC-l0 B-727 B-737 B-757 Variable Rank Val ue Rank Val ue Rank Value Rank Value Rank Va 1 ue
Wheel Load (lbs) 4 26,900 50,300 2 39,900 5 25,800 3 28,600
Tire Radius (in) 2 7.25 5 9.30 4 8.69 3 7.45 1 7.21
Tire Inflation Pressure (psi) 4 163 1 185 3 168 5 148 2 175
Diagonal Ti re Spacing (in) 1 24 5 83.7 3 34 2 30.5 4 56.4
20-Year Cracking Index*, all 4 Zones, All 4 Materials: 4 var var 2 var 5 var 3 var
*Rankings of Cracking Index are in order of decreasing damage.
Permanent Deformation Analysis: Comparison by Aircraft
8ecause the modified ILLIPAVE computer runs in this study were made
initially with the entire traffic count being made up of the same aircraft for each computer run, a direct comparison could be made of the
relative rutting damage done by each aircraft. However, the comparison
results were not as simple as they were in the case of the relative cracking damages. In general, the most rutting was produced by the DC-la, followed by the 8-727, then the 8-757, DC-9, and the 8-737. In
some cases the B-757 moved either up or down by one place in the ranking of aircraft by the rutting damage produced. As was seen in Table 21, the
8-757 has a relatively high tire inflation pressure (ranked second highest of the five aircraft being considered), and higher tire pressures are expected to cause more damage. The B-757 also has the second largest
tire spacing of the five aircraft considered, which affects the superposition of the loads caused by the two tires at any point. The
interplay between the aircraft characteristics of the 8-757 and the permanent deformation calculated in the finite element mesh (as affected by the permanent deformation parameters, which were both temperature and
stress dependent) may be the cause of the variable rutting ranking of that aircraft.
The wet-no freeze environmental zone with seasonal average
temperatures of 75°F, 95°F, 105°F, and 95°F (23.9 0C, 35.0oC, 40.6oe,
35.0oC) experienced the highest rut depths during the twenty-year
pavement life considered for all aircraft. For the asphalt concrete
control material, the dry/no freeze zone with temperatures of 55°F, 75°F,
95°F, and 75°F (12.SoC, 23.9 0C, 35.0oC, 23.9 0C) exhibited the lowest rut depths; but for the asphalt-rubber concretes, the dry-freeze zone with
temperatures of 35°F, 60°F, 90°F and 50°F (l.7 oC, l5.6oC, 32.2oC, lOoe) had the lowest rut depths in the twenty-year life. Thus, the
asphalt-rubber concrete appears to be a better material for resisting deformation in cold temperatures than the asphalt concrete.
9D
The analyses were made using one aircraft at a time which permitted
an evaluation of the relative amount of damage done by each aircraft.
This evaluation, while important, does not reflect the effect of actual mixes of these aircraft on the damage of an airport pavement. In the
following section, the effect of mixed traffic will be considered.
Mixed Traffic Damage Evaluation: Comparison of Mixes
Appendix G contains an explanation of how the damage due to mixed traffic was calculated, as well as year by year results for both single
and combined aircraft traffic. The mixed traffic damage calculations
contain the adjustment from laboratory fatigue to field fatigue which was
described in Chapter II of this report under Fatigue Testing. Rutting was chosen as the critical mode, because the cracking indices
for the mixed traffic in the field fatigue condition never got very large. A rut depth of 0.7 inches was considered as the critical level. A rut of this depth on a cross-slope of 2 percent would have a surface
depression of approximately 6 feet (1.8 m) wide, which is fairly typical
and which would be expected to start collecting water. A cracking index of 0.2 (adjusted to the field fatigue condition) was
used as a basis for comparison, and not as a failure criterion. A pavement with a cracking index of 0.2 would contain low severity level fatigue cracking. Some fine, longitudinal hairline cracks would be
detected running parallel to each other in the wheel paths, with very few
of the cracks being interconnected and none of the cracks being spa11ed. Approximately two-tenths of the length of the wheel paths would contain these low severity cracks.
In all cases, the asphalt-rubber concrete performed better (i.e.,
experienced less damage) than the asphalt concrete control. This was true for all four environmental zones, and for mixed as well as single
vehicle traffic. For all four environmental zones, the field damage index (i.e.,
laboratory damage index 13, as previously discussed in the section of this report on fatigue testing) was highest for the asphalt concrete control material and lowest for the asphalt-rubber concrete with medium
91

binder content. This predicted that the asphalt concrete control
pavement will fatigue much earlier than will the asphalt-rubber concrete
pavement. However, the wet-no freeze environment, with seasonal
temperatures of 750F, 950F, 1050F and 950F (23.90e, 35.00e, 40.60e,
35.00e), displayed the widest difference between the cracking
performances of the control and the rubberized materials. Also, the damage indices were the highest for all materials in this zone, which has
three seasons with high ~900F) temperatures. This result shows that the cracking behavior of all four materials is most susceptible to high
temperatures, with the asphalt concrete control being the worst case.
Thus, in an area with high temperatures for much of the year, the asphalt-rubber concrete appears to be a better paving material choice for
cracking resistance than the asphalt concrete.
The wet-freeze environment, with seasonal temperatures of 350F, 65 0F,
95 0F, and 600F (1.70e, lB.30e, 35.00e, l5.60e), and the dry-freeze
environment, with seasonal temperatures of 350F, 600F, 900F and 50 of
(1.7 0e, l5.60e, 32.2 0e, lOoe), had the least difference between the cracking performances of the control and the rubberized materials. However, the difference between the two types of materials was still
significant. Also, both the asphalt concrete control and the asphalt-rubber concrete performed better in these two zones than they did in the two "no-freeze" environments. It must be emphasized, however, that this analysis did not include consideration of moisture freeze/thaw
effects. Only temperature effects on the material properties were accounted for. The two "freeze" environments each had one cold season, two moderate seasons, and one hot season. The cold/moderate seasonal temperature combination seemed to create the better environment for the
cracking performances of both materials. Table 22 shows the 20-year field damage indices which illustrate these observations. Figure 27 shows
plots of field damage index versus time for all four materials in each environmental zone; these plots provide a graphic comparison of the material performances with respect to cracking.
92

TABLE 22. Field Cracking Indices for Combined Traffic at 20 Years.
Zone Cracking Index (Temeeratures,OF) Materi al (Field, 20 Years)
Wet-Freeze AC-10 Cant ro 1 0.21
(35-65-95-60) Asphalt-Rubber, Low 0.07
Asphalt-Rubber, Medi um 0.04
Asphalt-Rubber, High 0.05
Dry-Freeze AC-10 Control 0.16
(35-60-90-50) Asphalt-Rubber, Low 0.06
Asphalt-Rubber, Medi um 0.03
Asphalt-Rubber, High 0.04
Wet-No Freeze AC-10 Control 0.83
(75-95-105-95) Asphal t-Rubber, Low 0.15
Asphalt-Rubber, Medi um 0.10
Asphalt-Rubber, High 0.11
Dry-No Freeze AC-10 Control 0.35
(55-75-95-75) Asphalt-Rubber, Low 0.13 Asphalt-Rubber, Medium 0.06
Asehalt-Rubber, High 0.07
93

,NET FREEZE DRY FREEZE CQUB1NED TRAFflC COJ,lBIHEO TRArrlC
0.21 0.16 0.2 ~ n~[';'u"!'rl 'illUl aN'·","l O.l~
0.19 WIM." " ~IM •• ,; 0.18 '""~ " 0.1. I.,,"') ,0
0.17 ,-, " '-' , "II M 0.13 I,ll " D.HI
" 0.12 0.15 0 AC 0 AC 0 .- 0.14 • AR-C .- 0.11 AR-C
S 0.13 AR-W S 0.' • AR-W
· 0.12 • AR-H 0.09 • AR-H · 0.1 t ;
• • E 0.' E O.OB
~ 0.0<1 0 ~ 0.07 0 < j ~ 0.08
0 o.oe e 0.07 • 0 e u 0.06
0 u 0.05 0
0.05 0 0.04 0
0 0 0.04-
0 0 0.0.3 0 •
0.03 0 • 0 0
0 • • 0.02 • • 0.02 0 • • 0 • •
0 , t • 0 • • 0.01 0 , t I , • 0.01 0
0 I • • • ! • • • , 0 0 , • 7 • " "
,. " ,. , • 7 • " "
,. "
,. ,- Yoar
'" ... WET/NO FREEZE DRY, NO FREEZE
CONBiNED 'T'RAFAC COUBIH£D TRAFAC 0.' 0'>'
It~:..,;, ;rll'(RAIUlIqoq y~ w.tU1'llU,"fj
0.6 -I ~1n\.' " WlnUr " !iQr''''l " 0.' ~rl .... " ,-, '"' -, " 0.7
fa'! " Fall "
0 AC 0 AC 0 0.25 · 0 .• • AR-C 0
.- • AR-C
~ ;;
• AR-W S AR-W
· 0.' • AR-H ; 0.2 • AR-H
• • £ £ ~ 0.' ~ 0.15 < ~
0 :;; 0 • e • 0.' 0
0
u u 0.' 0 0
0 02 0
0 0
0 0
0 0.05 0 0 • 0.' -I 0 .
0 0 • 0
0 • 0 0 • , ; I 0 0 , • • • • • • • • • • • 0 0
0 2 • • B 10 12 1A 1. 1. '0 , • 7 • " " " "
,. Yoar Voar
Figure 27. Plots of Cracking Index (Adjusted to Field Fatigue Condition) for Combined Traffic versus Year, Showing Four Materials in Each Climatic Zone.

All of the materials considered reached a rut depth of 0.7 inches or
more during the 20-year consideration period. The times to this failure
level for all materials in each climatic zone are shown in Table 23.
For all four environmental zones, the asphalt concrete control material experienced the largest rut depths; and the asphalt-rubber
concrete, medium binder content, experienced the smallest rut depths. For all zones except the dry-no freeze zone, with seasonal temperatures
of 5SoF, 75°F, 95°F and 7SoF (12.80C, 23.90C, 35.00C, 23.90C) the rut
depths of the asphalt concrete control were much higher than those of the
asphalt-rubber materials. For the dry-no freeze climate, the rut depths
of all four materials were similar. Therefore, it was evident that, at moderate temperatures and with respect to resistance to permanent deformation, either the asphalt concrete or the asphalt-rubber concrete
could be used equally well as a pavement surface material. But at either
hot or cold temperatures, the asphalt-rubber concrete appeared to be
considerably more resistant to permanent deformation than the asphalt concrete control material. The wet-no freeze environment, with seasonal
temperatures of 7SoF, 95°F, 105°F, and 95°F (23.90C, 3S.00C, 40.60C,
35.00C), was the harshest zone for the asphalt concrete; this mix was computed to fail in less than a year in the hot temperatures.
The cr~parisons of rutting behavior discussed above can be visualized
by looking at plots of rut depth versus year for each climatic zone, as shown in Figure 28.
In general, the addition of rubber to an asphalt paving mixture seemed to impart increased resistance to both cracking and rutting at
high temperatures (2900F). At cold/moderate temperature combinations, the addition of rubber imparted some cracking resistance, but the
performance difference was not as marked as at high temperatures. At ~oderate temperatures, the asphalt concrete control material performed
almost as well as the asphalt-rubber concrete with respect to rutting
(permanent deformation).
95

TABLE 23. Times to Rut Depths of 0.7" or More for Combined Traffic and for Various Materials and Climatic Zones.
ZONE RUT DEPTH (Seasonal (First Rut DAMAGE INDEX
Temperatures, Depth Over (Field Fatigue oF) MATER I AL YEAR 0.70 in.) Parameters)
Wet/Freeze AC-I0 Control 04 0.71 0.020 (35-65-95-60) Asphalt-Rubber, Low 17 0.73 0.050
Asphalt-Rubber, Med. 17 0.70 0.027
Aspha It-Rubber, High 17 0.76 0.038
Dry /Freeze AC-I0 Control 05 0.73 0.017
(35-60-90-50) Asphalt-Rubber, Low 18 0.72 0.054 Asphalt-Rubber, Med. 18 0.72 0.025
Asphalt-Rubber, High 17 0.72 0.033
Wet/No Freeze AC-I0 Control 1 1.61 0.019 (75-95-105-95) Asphalt-Rubber, Low 13 0.70 0.062
Asphalt-Rubber, Med. 15 0.72 0.060
Asphalt-Ruhher, Hi gh 13 0.75 0.045
Dry/No Freeze AC-I0 Control 15 0.75 0.201 (55-75-95-75) Asphalt-Rubber, Low 16 0.73 0.083
Asphalt-Rubber, Med. 16 0.71 0.038
Asphalt-Rubber, Hi2h 15 0.73 0.038
96

WET FREEZe: WET, NO FREEZE COI.IBINE;O TfU,.F"FIC COWSINED TRAFFlC ... '0 ...... TDl'tUT\lltt !"q
L_ .'ft\er " - ID!UAT\IItt 'on
U S, .. I .. "
IU~r " ~ " 0 "0 """ .. 0 r.lI ~ -. ...
" fill "
L' 0 AC 0 AC
0 00 0 R, c • "' 0
R" 0 0
~ 0 i "" 0 0." • RH
0 0 ~ 40 RH 0
< 0 5 0 .. 0" 0 0
~ 0 ~ 0
0' 0 , & 30 0
'; 0 '; 0 c 0 0." • 0
• 0.' • • 0
• • 20 • • 0._ • • •
I • 0.3 • •
I • '0 I 0.2 • I 0.' 0
3 0 , " " " '. " ." l 0 , • " " .. " " Vaar 'raar
<.0
" DRY FREEZE DRY, NO FREEZE
COUBINED ~FIC COI.ISINED TRAFFlC LO
L_ ""'" TDf'{U11JII{ !"'! ""'" TEII'ERATUJt[ (OP
111ft"' .. " U ....... ~ 0.' 1I1.l.oIr " -, " 0 """ " " rill ~ - .. 0
0." hll " • " 0 AC .
0 0 AC 0
R, 0
R" 0 07 R!.
!. 0 0 .• 0 c R" 2 • RH 0 ~
'J. 0." 0 0
'J. 0.' • RH 2 ,
& 0.7 0 0 • 2
0 0 o. 2 '; 0' 0
I ; R
, • I " R
0.' I 0_ 9 I R
, 0._ • •
j • • I I • 0.3 • 0.3 0 ,
• • ~ • 0.2 • ::1 • ~ o. 0 ...... - .'--'----'-
3 • • " " .- " " 3 • , • " " " " •• Vaor 'rao ..
Figure 28, Plots -of' Rut Depth for Combined Tra ffi c versus Year, Showing Four Materials in Each Climatic Zone.

Relative Lives of Airport Pavements in Uifferent Climatic Zones
A cracking index of 0.2 was chosen as a comparison level for this
study. The following are the cracking lives in years to a cracking index of 0.2 for combined traffic acting on the asphalt concrete control and
the asphalt-rubber concrete, medium binder content, in each environmental zone:
Envi ronment AC-I0 Control ARC-Medium Wet-Freeze 20 >20 Wet-No Freeze 10 >20
Dry-Freeze >20 >20 Dry-No Freeze 15 >20
The asphalt-rubber concrete passed the entire design period for all
environmental zones without reaching the comparison level of 0.2 for cracking index. The asphalt concrete control had a varying cracking life, with the shortest life occurring in the wet-no freeze environment.
A rut depth of 0.7 inches was chosen as the critical level for this study. The fo110winq are the rutting lives in years for combined traffic for the two materials in each environmental zone:
Envi ronlnen t AC-I0 Control ARC-Medium Wet-Freeze 4 17 Wet-No Freeze 1 15 Dry-Freeze 5 18
Dry-No Freeze 15 16
Comparing the times for cracking to the critical times for rutting shows
that rutting is the expected critical failure mode for both materials in •. 11 four environmental zones. Because of this, the rutting failure times
will be used for the economic evaluation performed in the following section.
98

CHAPTER IV. COST-EFFECTIVENESS COMPARISON BETWEEN
ASPHALT-RUBBER CONCRETE AND ASPHALT CONCRETE
In this chapter, approximate costs of asphalt-rubber concrete and asphalt concrete will be estimated for these materials compacted in
place. A cost-effectiveness analysis of each of the four materials that
have been analyzed in the previous chapters will be performed. Because the only difference between the pavements analyzed is the materials used in the surface layer, it is the cost-effectiveness of that layer which is
analyzed.
COST DATA FOR ASPHALT-RUBBER CONCRETE AND ASPHALT CONCRETE
Estimates for asphalt-rubber concrete are based on (1) the cost of
producing the asphalt-rubber binder and (2) substituting the cost of the asphalt-rubber binder for the cost of asphalt cement in asphalt concrete
unit prices. Since the asphalt-rubber binder produced for use in seal coat
construction is the same as that to be used in asphalt-rubber :01creco. the component prices presented by Shuler, et al. (Ref 30) were updated for current prices and are shown in Table 24.
Representative prices for asphalt-rubber binders, as used in chip seals and interlayers, are given in Table 24. These prices are based on industry-supplied data for asphalt-rubber binder containing 70 percent
asphalt, 25 percent rubber and 5 percent petroleum additives. The price
per ton was developed from an application rate of 0.60 gal/yd2• The cost information indicates that the cost of materials represents about one-half of the in-place cost. Blending and reacting the asphalt and
rubber and distribution of the asphalt-rubber binder represents about 20
percent of the total in-place cost of the binder. Approximate in-place component costs for hot mixes made with asphalt
cement and asphalt-rubber binders are given in Table 25. Using an asphalt-rubber binder increases the cost of the concrete by about 40
99
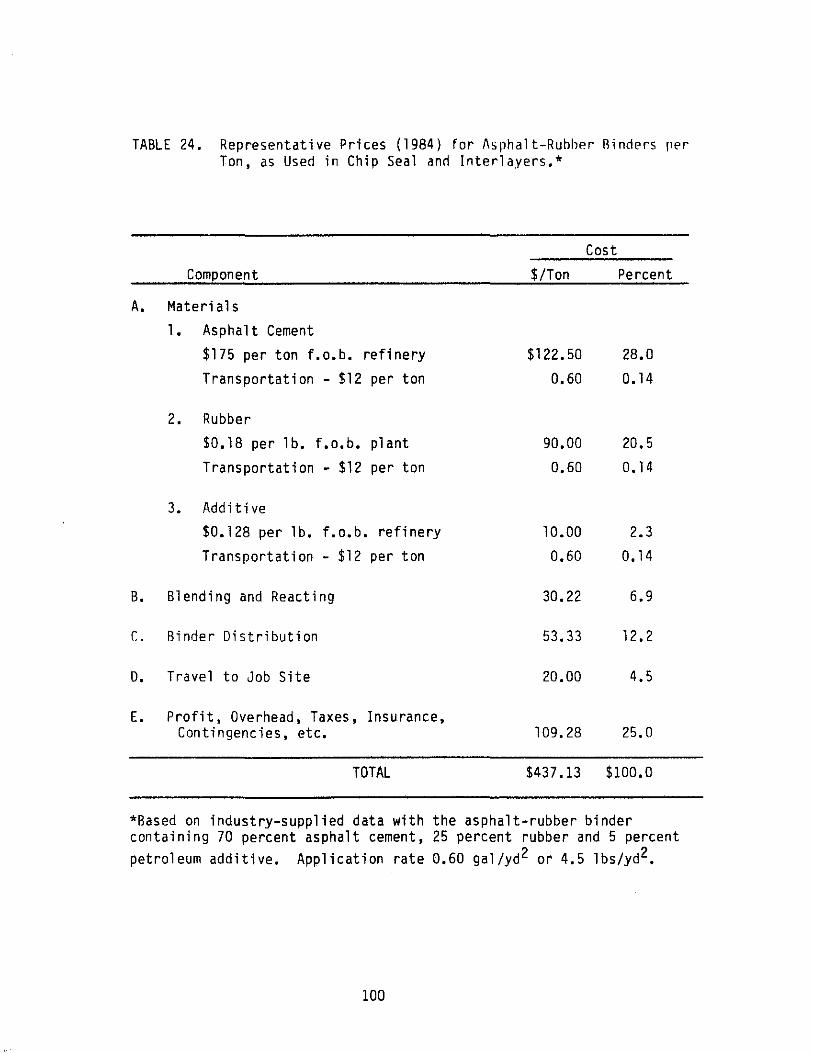
TABLE 24. Representative Prices (1984) for Asphalt-Ruhber Hinders per Ton, as Used in Chip Seal and Interlayers.*
Cost Component $/Ton Percent
A. Materi al s 1 • Asphalt Cement
$175 per ton f.o.b. refi nery $122.50 28.0 Transportation - $12 per ton 0.60 0.14
2. Rubber
$0.18 per lb. f.o.b. plant 90.00 20.5
Transportat ion - $12 per ton 0.60 0.14
3. Additive $0.128 per lb. f.o.b. refi nery 10.00 2.3
Transportation - $12 per ton 0.60 0.14
B. Blending and Reacting 30.22 6.9
C. Binder Distribution 53.33 12.2
D. Travel to Job Site 20.00 4.5
E. Profit, Overhead, Taxes, Insurance, Contingencies, etc. 109.28 25.0
TOTAL $437.13 $100.0
*Based on industry-supplied data with the asphalt-rubber binder containing 70 percent asphalt cement, 25 percent rubber and 5 percent petroleum additive. Application rate 0.60 gal/yd 2 or 4.5 Ibs/yd2•
100

TABLE 25. Unit Cost Per Ton of Material in Place for Asphalt Concrete and Asphalt-Rubber Concrete.
Asphalt-Rubber Cement Binder
Asphalt Cement Binder Low Binder Content Medium Binder Content High Binder Content
Com~onent $/Ton Percent $/Ton Percent $/Ton Percent $/Ton Percent
Binder* 8.40 25.0 18.61 40.7 20.81 43.1 23.01 45.2 Aggregate 8.85 26.4 8.85 19.4 8.85 18.3 8.85 17.4 Energy Costs 1.20 3.6 1.28 2.8 1. 28 2.7 1.28 2.5
Mixing 3.51 10.5 3.51 7.7 3.51 7.3 3.51 6.9 ..... Haul. Laydown • C) ..... and Compaction 5.92 17.6 5.92 13.0 5.92 12.3 5.92 11.6
Miscellaneous 0.66 2.0 0.66 1.4 0.66 1.4 0.66 1.3
Mark-Up (15%) 5.04 15.0 6.85 15.0 7.24 15.0 7.63 15.0
33.58 100.0 45.68 100.0 48.27 100.0 50.86 100.0
* 4.8% - Asphalt Cement Binder; 4.23% - Low Asphalt-Rubber Cement Binder; 4.73% - Medium Asphalt-Rubber Cement Binder; 5.23% - High Asphalt-Rubber Cement Binder. Asphalt Cement at $175 per ton and Asphalt-Rubber Cement at $440 per ton at the plant.

percent. Most of this cost difference 1s directly related to producing
the asphalt-rubber binder itself.
COST-EFFECTIVENESS ANALYSIS BASED ON PROJECTED LIVES OF PAVEMENTS
The type of distress which controls the useful life of all pavement
surface layers is rutting. In accordance with common practice, a
limiting rut depth of 0.50 inches (1.27 cm) was set and annual costs were calculated for each pavement in each climatic zone. However, it was
found that the asphaltic concrete control pavement was predicted to reach this level of rut depth within one year. Seeking a more realistic cost comparison between the four materials, a limiting rut depth of 0.70
inches {l.B cm} was set and new pavement lives were determined. The cost figures for both limiting rut depths are presented below.
The steps in this cost comparison are as follows: 1. Determine the construction cost of each paving material in place
per square yard. 2. Determine the equivalent uniform annual cost per square yard of
each pavement over its predicted life. 3. Select the most cost-effective material in each climatic zone as
the one which provides the least equivalent uniform annual cost
per square yard for the life of the pavement. The equivalent uniform annual cost per square yard is the annual C0st
per square yard which, if paid annually over the life of the pavement, has a present value equal to the in-place cost per square yard of
construction of the asphaltic surface layer. The interest rate that is used in calculating the equivalent uniform annual cost is 4.0 percent and is considered to be a reasonable estimate of the difference between
actual interest and actual inflation rates as applied to construction.
Construction Cost Per Square Yard
The determination of the in-place construction cost per square yard for the lS-inch {38 cm} thick asphalt surface layer uses the following
steps:
102
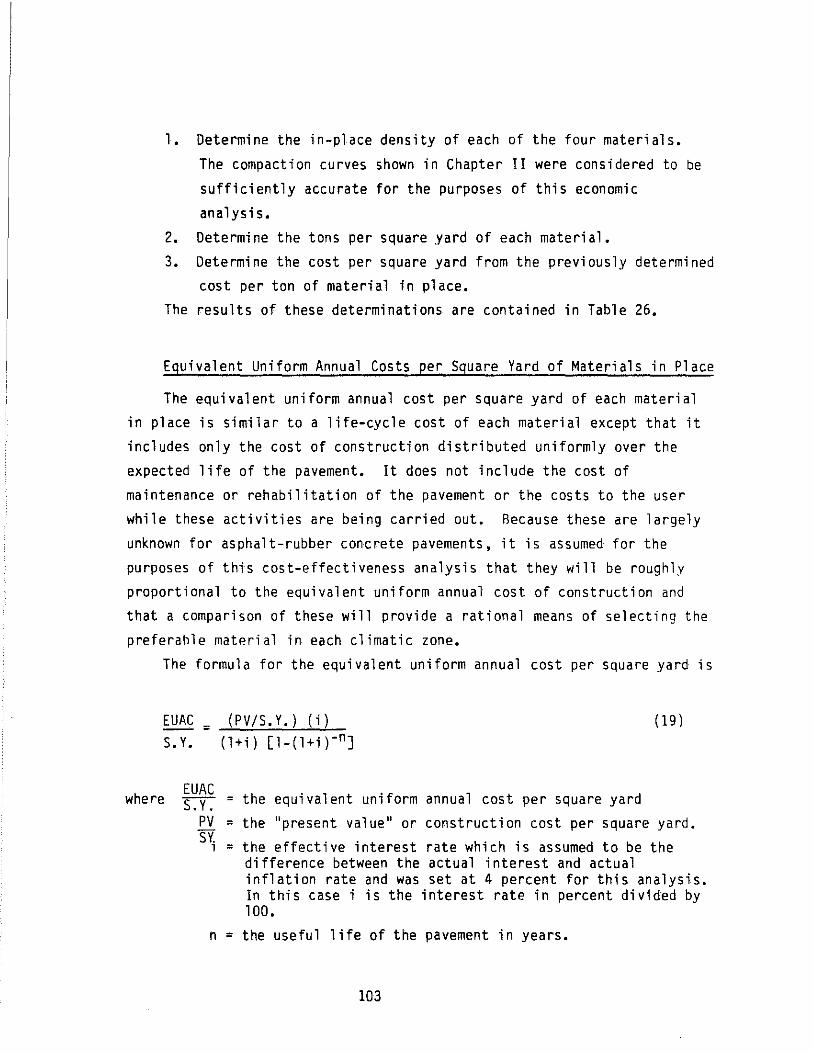
1. Determine the in-place density of each of the four materials.
The compaction curves shown in Chapter II were considered to be
sufficiently accurate for the purposes of this economic
analysi s.
2. Determine the tons per square yard of each material. 3. Determine the cost per square yard from the previously determined
cost per ton of material in place.
The results of these determinations are contained in Table 26.
Equivalent Uniform Annual Costs per Square Yard of Materials in Place
The equivalent uniform annual cost per square yard of each material in place is similar to a life-cycle cost of each material except that it includes only the cost of construction distributed uniformly over the
expected life of the pavement. It does not include the cost of
maintenance or rehabilitation of the pavement or the costs to the user while these activities are being carried out. Because these are largely
unknown for asphalt-rubber concrete pavements, it is assumed for the purposes of this cost-effectiveness analysis that they will be roughly proportional to the equivalent uniform annual cost of construction and
that a comparison of these will provide a rational means of selecting the preferable material in each climatic zone.
The formula for the equivalent uniform annual cost per square yard is
EUAC = (PV/S.Y.) (i) (19 )
S. Y. (l+i) [l-(l+i )-nJ
where EUAC S. Y. = the equi val ent uniform annual cost per square yard
PV = the "present value" or construction cost per square yard. S~ = the effective interest rate which is assumed to be the
difference between the actual interest and actual inflation rate and was set at 4 percent for this analysis. In this case i is the interest rate in percent divided by 100.
n = the useful life of the pavement in years.
103

TARLE 26. In-Place Costs Per Square Yard for Asphalt Concrete and Aspha1tRubber Concrete.
In-Place In-Place Percent Costs per Tons per Costs per Binder Ton Density, Square Yard Square Yard
Material % $/Ton 1 b/ft3 T/S.Y. $/S.Y.
Asphalt Concrete 4.BO $33.5B 151. 2 0.B51 $2B.56
Asphalt-Rubber Concrete
Low Bi nder 4.23 45.6B 144.8 0.B15 37.21
Medium Binder 4.73 4B.27 145.3 0.B17 39.45
High Binder 5.23 50.B6 144.9 0.B15 41.46
104

Two comparisons are made in Table 27, one for a critical rut depth of
0.5 inches (1.27 cm) and the other for a critical rut depth of 0.7 inches
(1.8 cm). The most cost-effective material to use depends, not surprisingly,
upon the climatic zone and the level of the critical rut depth. Only in
the dry-no freeze zone is the asphaltic concrete more cost effective than the asphalt-rubber concrete. Elsewhere, the most cost-effective
materials are either the low or medium (optimum) binder content asphalt-rubber concretes. In the wet-freeze zone, the best material
changes from the medium to the low binder content material as the
critical rut depth is deepened. On the basis of this study, it appears to be desirable to perform
full scale experiments with asphalt-rubber concrete to determine whether
these findings, which are based upon laboratory tests and computer
analysis, are borne out in practice.
105
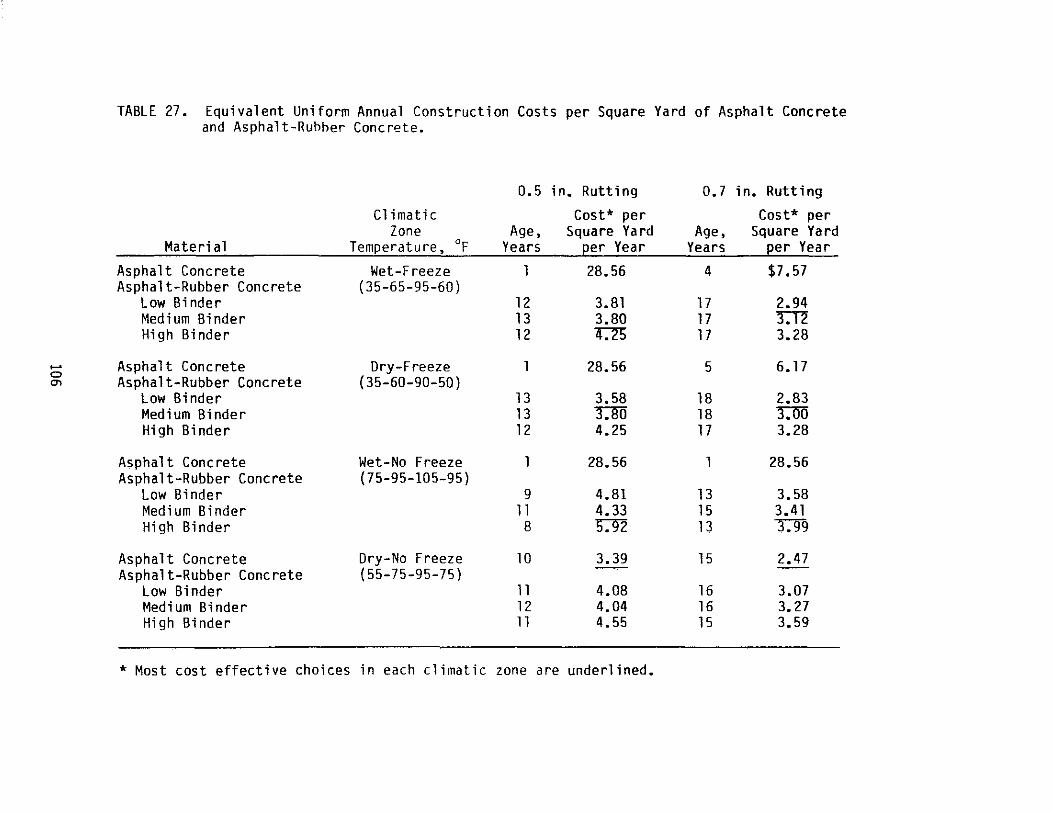
..... 0 0'1
TABLE 27. Equivalent Uniform Annual Construction Costs per Square Yard of Asphalt Concrete and Asphalt-Rubber Concrete.
0.5 in. Rutting 0.7 in. Rutting
Climatic Cost* per Cost* per Zone Age, Square Yard Age, Square Yard
Material Temperature, of Years eer Year Years eer Year
Asphalt Concrete Wet-F reeze 1 28.56 4 $7.57 Asphalt-Rubber Concrete {35-65-95-60}
Low Bi nder 12 3.81 17 2.94 Medium Binder 13 3.80 17 ~ High Binder 12 4.2"5 17 3.28
Asphalt Concrete Dry-Freeze 28.56 5 6.17 Asphalt-Rubber Concrete {35-60-90-50}
Low Bi nder 13 3.58 18 2.83 Medi um Bi nder 13 "Dffi 18 DiD High Binder 12 4.25 17 3.28
Asphalt Concrete Wet-No Freeze 28.56 1 28.56 Asphalt-Rubber Concrete {75-95-105-95}
Low Binder 9 4.81 13 3.58 Medium Binder 11 4.33 15 3.41 High Binder 8 5.92 13 3.99
Asphalt Concrete Dry-No Freeze 10 3.39 15 2.47 Asphalt-Rubber Concrete {55-75-95-75}
Low Binder 11 4.08 16 3.07 Medium Binder 12 4.04 16 3.27 High Binder 11 4.55 15 3.59
* Most cost effective choices in each climatic zone are underlined.

CHAPTER V. SUMMARY, CONCLUSIONS, AND RECOMMENDATIONS
This concluding chapter summarizes the changes in the Marshall
method of mix design which were necessary to produce a satisfactory mix
design for asphalt-rubber concrete. It also presents a brief summary of the results of the laboratory testing, computer analysis, and prediction
of field performance, and the study of the cost effectiveness of asphalt
concrete as contrasted with asphalt-rubber concrete that have been
presented in the three previous chapters.
MODIFICATIONS TO THE MARSHALL METHOD OF MIX DESIGN FOR ASPHALT-RUBBER CONCRETE
The Marshall method of mix design for asphalt concrete (Ref 4) can be
used to produce an adequate mix for asphalt-rubber concrete, but several modifications must be made to the design procedure. These modifications
were presented in the two volumes of this report, and are summarized
below.
Aggregate
An aggregate gradation should be chosen based on the project specifi
cations, and the final aggregate blend combination (mineral aggregate plus rubber particles) must meet the gradation requirements. Before
producing the aggregate blend for production, a calculation must be
performed which adjusts the aggregate quantities and which treats the rubber as an additional aggregate. The rubber particles may contribute
significantly to the total amount of solid particles in the mix, thereby
necessitating a reduction in some components of the mineral aggregate
blend. If this is the case, then the mineral aggregate blend used in the
mix design must be modified to permit space for the rubber particles.
107

Mixing and Compaction Temperatures
The Marshall method of mix design calls for determination of mixing and compaction temperatures by viscosities. However, the absolute
viscosity of asphalt-rubber produced from ground reclaimed rubber and measured with capillary tube viscometers is highly variable. (See Volume
I of this report, page 7). Therefore, viscosity as measured by capillary tube viscometer could not be used in the Marshall mix design of
asphalt-rubber concrete. Mixing and compaction temperatures for producing asphalt-rubber
concrete for mix design must be higher than those used for asphalt concrete. In this study, temperature and compactive effort experiments
showed that mixing and compaction at 37SoF (191 0C) produced asphalt-rubber concrete with higher stabilities and lower air voids than
were attained at lower temperatures. In the materials characterization
portion of this study, a mixing temperature of 37SoF (191oC) was used. But the beam specimens used in several of the test procedures could not
be compacted at this high of a temperature; therefore, a compaction
temperature of 32SoF (1630 C) was adopted for the mix design and specimen
production.
Mixing
Mixing must be performed using a high energy mechanical mixer.
Compactive Effort
Compactive effort of 7S blows per face of the specimen has been recommended in this study, regardless of gear load, to obtain desired air
voids contents.
Extrusion of Specimens from Molds
Asphalt-rubber concrete specimens must be allowed to cool to room , temperature (about 24 hours) before being extruded from the molds. This
108
prevents the swelling of the specimens which had previously been ohserved
by other researchers, as mentioned in Volume 1 of this report.
Air Void Content
Percent air voids requirements must be raised from those specified in
the Marshall method when designing an asphalt-rubber concrete mixture. Difficulty was experienced with the mixes tested in this study in attain
ing air void contents below about 7% in the laboratory. Therefore, it is recommended that the band on air voids requirement should be between 3% and 8% for the Marshall mix design. However, it may be possible to
better compact the asphalt-rubber concrete in the field.
DIFFERENCES IN MATERIAL PROPERTIES
Laboratory testing of asphalt concrete and asphalt-rubber concrete included tests of compaction and air voids, Marshall stability, resilient
modulus, creep compliance and temperature susceptibility, beam fatigue, crack propagation and fracture in the Texas Transportation Institute
"overlay" test, and permanent deformation. There were four materials tested: an asphalt concrete at the optimum binder content of an AC-10
hinder (AC): an asphalt-rubber concrete at the optimum binder content (ARC-Medium Binder Content); and two other asphalt-rubber concretes at hinder contents above and below optimum by 0.50 percent by weight
(ARC-Low and High Binder Content). The results of the comparisons of
these four materials are summarized below.
Compaction and Air Voids
The asphalt-rubber concrete (ARC) had lower density and higher air voids than the asphalt concrete (AC) at the same level of laboratory
compaction. The maximum density of the AC was about 6 lb/ft 3 greater
than the ARC and the air voids about 4.5 percent less at the optimum binder content which was, in the materials tested, about the same in the AC and the ARC.
109
Stabil ity
The maximum Marshall stabilities of the AC and the ARC mixes were
nearly identical at the same level of compaction, but the maxima occurred
at different binder contents: 4.1% for the ARC and 4.8% for the AC. For the binder contents used in the testing program, the Marshall stabilities
were approximately 2100 for ARC and 2300 for the AC, both of which are
above the minimum required in the Marshall mix design method for heavy
traffic.
Resilient Modulus
The resilient moduli of the materials at the same compaction level
varied from one temperature to the next. In general, at low
temperatures, the resilient modulus of the AC was greater than that of
any of the ARC mixes tested, and at high temperatures was lower than that
of the ARC mixes. The change of modulus with temperature, which is a
measure of temperature susceptibility, was greater in the AC followed by
the ARC-High, ARC-Low, and ARC-Medium, in that order.
Creep Compliance and Temperature Susceptibility
Creep tests were made on the four mixes at three different tempera
Lures and the time-temperature shift functions for each were determined.
At the 700 F (21.1 0C) master temperature and at 10 seconds after loading, the average creep compliances arranged in order of increasing magnitude
were as folloNs: ARC-Low, ARC-High, AC, and ARC-Medium. At the 700 F
(21.1 0C) master temperature and at 1,000 seconds after loading, the
average creep compliances arranged in order of increasing magnitude were
as follows: ARC-Low, ARC-Medium, ARC-High, and AC. The temperature susceptibility, as indicated by the time-temperature
shift functions, in decreasing order were: AC, ARC-Low, ARC-Medium, and
ARC-High. The addition of the rubber to the binder helps the material to
maintain a more stable compliance as temperature changes.
110

Beam Fatigue Tests
Beam fatigue tests were made at three temperatures to determine how
the fatigue properties changed with temperature. Linear relations were
found between 10910 Kl and K2 for each mix and the dependence of 10910 Kl on temperature was also found for each mix. The fatigue resistance of these materials in the field depends upon these properties as well as the level of strain imposed on the material in the pavement structure.
Therefore, it is not strictly correct to compare the fatigue resistance
of these materials on the basis of laboratory tests alone. At a tempera-
ture of 750 F (24°C) the values of Kl are arranged in decreasing order as
follows: ARC-High, ARC-Medium, AC, and ARC-Low. At a temperature of
3SoF (2°C), the values of Kl in decreasing order are: ARC-High, AC, ARC-Medium, and ARC-Low.
Crack Propagation and Fracture Tests
The Texas Transportation Institute overlay tester was used to deter
mine the fracture properties of each mix at a low temperature, 34°F
(l.loC) and a moderate temperature, 77 0 F (2SoC). By using a "Crack Speed
Index", which can be determined from the test results, the materials can be compared in their ability to resist cracking. At the low temperature,
the mixes are arranged in the following order of decreasing crack resistance: ARC-Medium, ARC-High, AC, and ARC-Low. At the moderate temperature, the materials were arranged in a different order, again
decreasing in crack resistance: AC, ARC-Low, and ARC-Medium. According to Schapery's theory of crack growth (Ref 22), crack
resistance is approximately a function of the square of the ratio of the tellsile strength to the modulus. The reversal of the order of crack
resistance of the asphalt concrete as compared to the asphalt-rubber concrete, medium binder content, as the temperature decreases from
moderate to low temperature is primarily due to the fact that the modulus of the asphalt-rubber concrete decreases relative to that of the control
material. See Figure 8 in this report.
III

Permanent Deformation
Repeated load tests were run on each mix at three different tempera
tures and material properties were characterized by three parameters which were used to calculate rut depth in the modified ILLIPAVE analyses.
At 700 F (2l 0Cl, the values of the scale parameter, p, which is an indicator of resistance to rutting, are ranked in decreasing order as
follows: ARC-Medium, ARC-Low, ARC-High, and AC.
PREDICTED FIELD PERFORMANCE
A typical pavement which was built at Robert Mueller Airport in Austin, Texas was used for all the predictions of field performance.
Four climatic zones, five aircraft, and four materials were analyzed
in separate runs using the modified ILLIPAVE computer program for a total of 80 runs. The results were analyzed separately to evaluate the rela
ti ve effect of di fferent ai rcraft, different materi al s. and different climatic zones on the cracking and rutting performance of the typical
pavement. Subsequently. the effect of mixed traffic. using a typical mix of the five aircraft. was evaluated to determine the expected useful life
of the pavement in each climate using each of the four materials. The aircraft were the DC-g. DC-10. 8-727. 8-737 and 8-757. The most damaging aircraft in both cracking and rutting was the DC-10.
In all cl imates. the rutting criterion was more critical than the cracking criterion. The materials that lasted longest in each climate
were as follows: wet-freeze. ARC-Medium; dry-freeze. ARC-Medium and Low; wet-no freeze, ARC-Low; dry-no freeze. ARC-Medium. The materials that were more resistant to cracking in each climate were as follows:
wet-freeze. ARC-Medium; dry-freeze. ARC-Medium; wet-no freeze.
ARC-Medium; dry-no freeze. ARC-Medium. The wet-no freeze climate was the most severe in all cases.
112

LIFE CYCLE COST ANALYSIS
The costs of each of the materials compacted in place were estimated and were used to compute the cost per square yard of pavement surface for
the typical pavement that was used in the analyses. The use of the
rubber in the asphalt-rubber concrete increases the cost per ton by $12 to $17, increasing with the percent binder that is used. The percentage increase is 36 to 51 percent. The useful life of the pavement, as
dictated by the critical rutting criterion, was used to calculate an
equivalent uniform annual cost of each material in each climate. An interest rate of four percent, representing the difference between actual
interest and actual inflation rates, was used to calculate these annual
costs. A comparison of these equivalent uniform annual costs per square yard revealed the most cost effective materials. In each climate, these
were as follows: wet-freeze, ARC-Low and Medium; dry-freeze, ARC-Medium; wet-no freeze, ARC-Medium; and dry-no freeze, AC. Thus, according to these analyses, in all climates but the dry-no freeze zone, the
additional cost of adding rubber to the binder is justified by the increased life and rlecreased life cycle costs of the ARC material. There are still questions that remain and these are discussed in the following two sections of this chapter.
RECOMMENDED rUTURE RESEARCH
In view of the promiSing results of this study of asphalt-rubber concrete, further research is warranted both in the laboratory and in the
field. Laboratory research should investigate the healing, low temperature
(11eking and mOisture susceptibility of asphalt-rubber concrete and a mc,'e extensive study of the fracture and permanent deformation properties
of ARC should be made with different types of rubber and aggregate. The
healing property is particularly important in calculating the 1ab-tofield fatigue shift factor which was assumed to be 13 in this study. The low temperature cracking should include determination of the thermal coefficient of expansion, glass-transition temperature, and further
113

studies of the fracture properties of ARC. The possible effect of the
increased air void content on an increase in the rate of oxidation and aging is another important study that needs to be conducted. An assess
ment of the effect of each of these on the predicted useful life and cost
effectiveness of the ARC material, as was done in this report, is an essenti al part of the research eval uation.
Field research with demonstration projects are warranted on the basis of these results. Particularly important is to experiment with laydown
and compaction methods to achieve the desired level of compaction, to run tests on cores taken from the completed project, and to make periodic
assessments of the condition of the pavement. Because both traffic and
climate make a difference in the performance of pavement made with an ARC surface course, it is worthwhile to find sites for demonstration projects in all climatic zones where ARC appears to be cost effective.
RECOMME NDED FUTURE .PRACTICE
The use of asphalt-rubber concrete for airport pavement appears to be justified on the basis of its expected cost effectiveness. Production and construction practices must be altered somewhat to account for the
rlifferent properties and the increased temperatures and increased cor.Jpactivp. effort that will be required to mix and place ARC properly. ?roduction and construction practices should be in accordance with the
procedures which are outlined in Appendixes A and B. On the basis of this study, asphalt-rubber cement used as a binder,
t~9~ther with a densely graded aggregate, when properly constructed, should provide a superior cost-effective asphalt-rubber concrete for use on cirport pavements in three of the four unique climatic zones in the
United States, excluding only the dry-no freeze zone.
114

REFERENCES
1. Mindess, S. and Young, J. F., Concrete, Prentice-Hall, Inc., Englewood Cliffs, N.J., 1981.
2. "Bituminous Surface Course," STANDARDS FOR SPECIFYING CONSTRUCTION OF AIRPORTS - New Standard for Plant Mix Bituminous Materials, Advisory Circular No. 150/5370-10, Item P-401, Federal Aviation Administration, May, 1977.
3. "Standard Specification for Hot-Mix, Hot-Laid Bituminous Paving Mixtures," 1983 ANNUAL BOOK OF ASTM STANDARDS, Designation D 3515-83, Volume 04.03, Philadelphia, PA., 1983.
4. "Mix Design Methods for Asphalt Concrete and Other Hot-Mix Types," Manual Series No.2 (MS-2), The Asphalt Institute, College Park, Maryland, May, 1984.
5. Foster, C. R., "The Effect of Voids in Mineral Aggregate on Pavement Performance," Information Series 96/86, National Asphalt Pavement Association, Riverdale, Maryland, 1986.
6. Kenis, W. J., "Predictive Design Procedures, VESYS User's Manual - An Interim Design Method for Flexible Pavement Using the VESYS Structural Subsystem," Final Report No. FHWA-RD-77-154, Federal Highway Administration, January, 1978.
7. "ILLIPAVE User's Manual," Transportation Facilities Group, Department of Civil Engineering, University of Illinois at Urbana-Champaign, May, 1982.
8. Roberts, F. L., Tielking, J. T., Middleton, D., Lytton, R. L. and Tseng, K., "Effects of Tire Pressures on Flexible Pavements," TTl Research Report No. 372-1F, Texas Transportation Institute, Texas A&M University, College Station, Texas, December, 1985.
9. Tseno, K. and Lytton, R. L., "Prediction of Permanent Deformation on Flexible Pavement Materials," Paper prepared for publication at the ASTM Symposium on Implication of Aggregates in the Design, Construction, and Performance of Flexible Pavements, New Orleans, LA., December, 1986.
10. Yoder, [. J. and Witczak, M. W., Principles of Pavement Design, 2nd edition, John Wiley & Sons, Inc., New York, 1975.
11. Schmidt, R. J., "A Practical Method for Measuring the Resilient Modulus of Asphalt-Treated Mixes," HIGHWAY RESEARCH RECORD NO. 404, Highway Research Board, 1972, pp. 22-32.
115

12. Little, D. N., Al-Balbissi, A. H., Gregory, C. and Richey, B., "Design and Characterization of Paving Mixtures Based on Plasticized Sulfur Binders - Engineering Characterization," TTl Draft Final Report RF 4247, Texas Transportation Institute, Texas A&M University, College Station, Texas, July, 1984.
13. Rauhut, J. B., D'Quin, J. C. and Hudson, W. R., "Sensitivity Analysis of FHWA Structural Model VESYS II," Volume 1 and 2, Federal Highway Administration, Report No. FHWA-RD-76-23, Washington, D.C., March, 1976.
14. Little, D. N., Haxo, H. E. and Saylak, D., "Development of Second Generation Sulphlex Binders for Paving Mixtures," Texas Transportation Institute, Final Report for Federal Highway Administration, May, 1985.
15. Epps, J. A. and Monismith, C. L., "Fatigue of Asphalt Concrete Mixtures - Summary of Existing Information: Fatigue of Compacted Bituminous Aggregate Mixtures," American Society for Testing and Materials, Special Technical Publication No. 508, 1972.
16. Austin Research Engineers, Inc., "Material Properties to Minimize Distress in Zero-Maintenance Pavements," Research Report No. FHWA-RD-80, April, 1980.
17. Adedimila, A. S. and Kennedy, T. W., "Fatigue and Resilient Characteristics of Asphalt Mixtures by Repeated-Load Indirect Tensile Test," Research Report No. 183-5, Center for Highway Research, The University of Texas at Austin, August, 1975.
18. Pell, P. S. and Cooper, K. E., "The Effect of Testing and Mix Variables ~n the Fatigue Performance of Bituminous Materials," Proceedings, Association of Asphalt Paving Technologists, Volume 44, 1975, pp.
19. Finn, F., Saraf, C., Kulkarni, R., Nair, K., Smith, W. and Abdullah, A., "The Use of Distress Prediction Subsystems for the Design of Pavement Structures," Proceedings, Fourth International Conference -Structural Design of Asphalt Pavements, Volume I, The University of Michigan, Ann Arbor, Michigan, January, 1977, pp. 3-38.
"n Al-Balhissi, A. H., "A Comparative Analysis of the Fracture and Fatigue Properties of Asphalt Concrete and Sulphlex," Ph.D. Dissertation, Texas A&M University, August, 1983.
21. Pari s. P .C. and Erdogan, F., "A Critical Analysis of Crack Propagation Laws," Transactions of the ASME, Journal of Basic Engineering, Series D, Volume 85, No.3, 1963.
22. Schapery, R. A., "A Theory of Crack Growth in Viscoelastic Media," Technical Report No. MM 2764-73-1, Mechanics and Materials Research Center, Texas A&M University, College Station, Texas, March, 1973.
116

23. Williams, M. L., Landel, R. F. and Ferry, J. D., "Visco-Elastic Properties of Polymers," Journal of American Chemical Society, Vol. 77, p. 3701, 1955.
24. Lytton, R. L., personal communication, Texas Transportation Institute, Texas A&M University, College Station, Texas, 1986.
25. Brent Rauhut Engineering, Inc., "Runway and Taxiway Pavement Evaluations: Robert Mueller Municipal Airport, Austin, Texas," Report Prepared for the City of Austin Aviation Department, January, 1982.
26. Ho Sang, V., "Field Survey and Analysis of Aircraft Distibution on Airport Pavements," Final Report, Federal Aviation Administration, February, 1975.
27. Tielking, J. T., "A Tire Contact Solution Technique," Tire Modeling, NASA Conference Publication 2264, Proceedings of a Workshop held at Langley Research Center, Hampton, Virginia, September, 1982, pp. 95-121.
28. Duncan, J. M., Monismith, C. L. and Wilson, E. L., "Finite Element Analysis of Pavements," Highway Research Record 228, Highway Research Board, 1968, pp. 18-33.
29. "BISAR (Bitumen Structures Analysis in Roads) User's Manual," Abbreviated Version, Koninklijke/Shell-Laboratorium, Shell Research N.V., Amsterdam, July, 1972.
30. Shuler, T. S., Pavlovich, R. D., Epps, J. A. and Adams, C. K., "Investigation of Materials and Structural Properties of Asphalt-Rubber Paving Mixtures," TTl Final Report RF 48711-1F, Texas Transportation Institute, College Station, Texas, September, 1985.
117

APPENDIX A
Suggested Guide Specification For Production
Of Asphalt-Rubber Binder And Its Use In Construction
lIB

APPENDIX A. SUGGESTED GUIDE SPECIFICATION FOR PRODUCTION OF
ASPHALT-RUBBER BINDER AND ITS USE IN CONSTRUCTION
1. DESCRIPTION
This guide* involves production of asphalt-rubber binders for use in hot asphalt-rubber concrete for pavement surfaces in accordance with the plant and other specifications. The main differences between the use of
asphalt-rubber cement and the use of asphalt cement occur in the production of the asphalt-rubber binder. Construction experience has
indicated that the same guidelines as those used for other hot-mix types (in particular, for asphalt concrete) will produce an acceptable
asphalt-rubber concrete pavement surface. Therefore, construction operations which are not described herein (e.g., mixing, placement, and
compaction) should follow the regular FAA Specifications. This specification describes two known proprietary processes for production of
the binder hereinafter known as Method A and Method B. Method A uses
ground reclaimed "devulcanized" rubber and an extender oil whereas Method B uses ground reclaimed vulcanized rubber and a kerosene diluent. Either method is acceptable based on proper compliance with the specifications
and certification of materials.
2. MATERIALS
Asphalt-rubber, as currently used, shall include between 15 and 28 percent by total weight of dry rubber in an asphalt cement matrix. (See Volume I of this report, page 18.)
* The bulk of this guide was prepared by Ray Pavlovich.
119

2.01 ASPHALT CEMENT
Asphalt cement shall meet the requirements of AASHTO M 20-70 (Table
1), M226-80 (Table 1), or M226-80 (Table 3). Acceptable grades for the respective materials will depend on location and circumstances and will require approval of the Supplier of the asphalt rubber. In addition, it
shall be fully compatible with the ground rubber proposed for the work as determined by the Supplier.
2.02 RUBBER EXTENDER OIL (METHOD A)
Extender oil shall be a resinous, high flash point aromatic
hydrocarbon meeting the following test requirements.
Viscosity, SSU, at 1000 F (ASTM D 88)
Flash Point, CDC, degrees F (ASTM D 92)
Molecular Analysis (ASTM D 2007): Aspha1tenes, Wt.%
Aroma tic s, wt. %
2.03 KEROSENE TYPE DILUENT (METHOD B)
2500 min.
390 min.
0.1 max. 55.0 min.
The kerosene type diluent used shall be compatible with all
materials used and shall have a flash point (ASTM D 92) of not less than
800 F. The Initial Boiling Point shall not be less than 3000 F with total
distillation (dry point) before 4500 F (ASTM D 850). The Contractor is
cautioned that a normal kerosene or range oil cut may not be suitable.
2.04 GROUND RUBBER COMPONENTS
A. For Method A. The rubber shall meet the following physical and
chemical requirements:
1. Composition. The rubber shall be a dry, free flowing blend of 40 Wt.% powdered devu1canized rubber and 60 Wt.% ground vulcanized rubber scrap specially selected to have a natural
120

rubber content of at least 40 Wt.1" of the rubber. It shall be
free from fabric, wire, or other contaminating materials exceDt
that up to 4 Wt.% of a mineral powder (such as calcium
carbonate) may be included to prevent sticking and caking of
the particles.
2. Sieve Analysis (ASTM C 136):
Si eve Number % Passing
8 100
30 60-80
50 15-40
100 0-15
3. Chemical Analysis (ASTM D 297):
Natural Rubber Content, Wt.% 30 min.
4. Mill Test:
When 40-50 grams of rubber retained on the Number 30 sieve are
added to the tight 152.4 mm rubber mill, the material will J3":
on the mill roll in one pass, and will usually be retaine~ JO
the mill roll. This will indicate the presence of a sufficient
quantity of reclaimed devulcanized rubber.
B. For Method 8. The rubber shall be a ground tire rubber, 100%
vulcanized, recommended by the Contractor for this use and with the
approval of the Engineer and meeting the following requirements:
1. Composition. The rubber shall be ground ti re rubber, dry
and free flowing. The specific gravity of the rubber shall be
1.15 ~ 0.05 and shall be free from fabric, wire, or other
contaminating materials except that up to 4 Wt.% of a mineral
powder (such as calcium carbonate) may be included to prevent
sticking together of the particles.
121
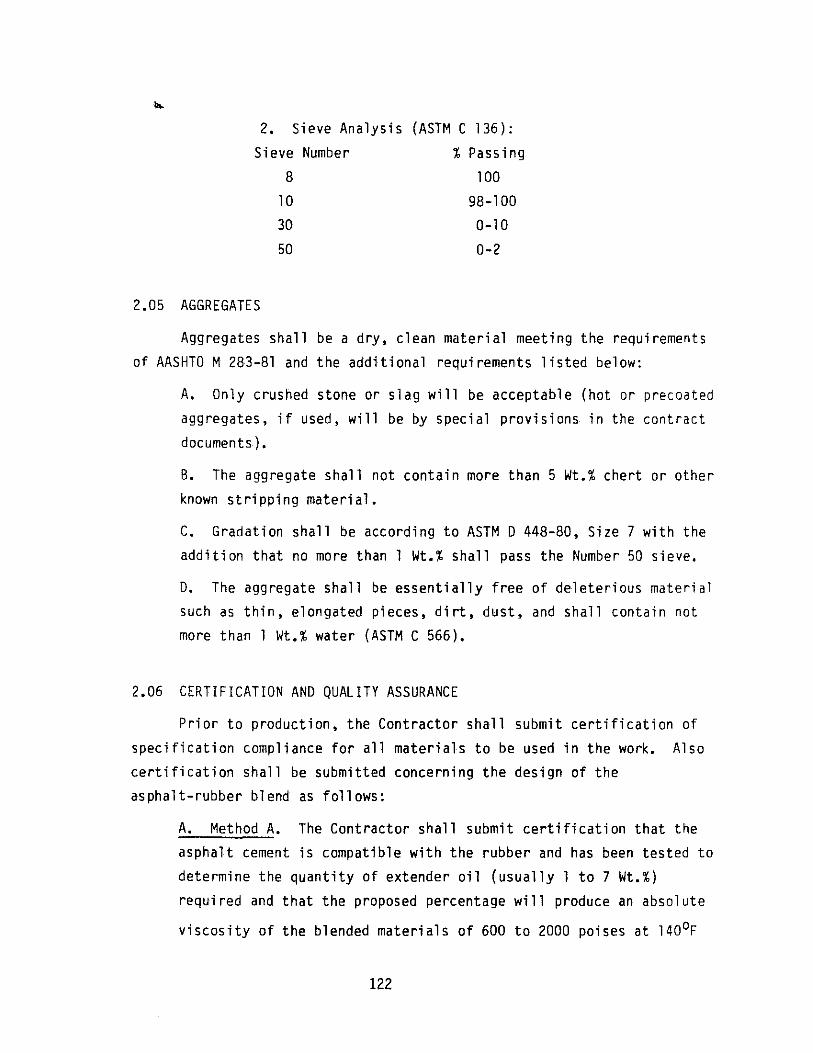
... 2. Sieve Analysis (ASTM C 136):
Sieve Number
8
10 30
50
% Passing 100
98-100
0-10
0-2
2.05 AGGREGATES
Aggregates shall be a dry, clean material meeting the requirements
of AASHTO M 283-81 and the additional requirements listed below:
A. Only crushed stone or slag will be acceptable (hot or precoated aggregates, if used, will be by special provisions in the contract
documents).
B. The aggregate shall not contain more than 5 Wt.% chert or other known stripping material.
C. Gradation shall be according to ASTM D 448-80, Size 7 with the
addition that no more than 1 Wt.% shall pass the Number 50 sieve.
D. The aggregate shall be essentially free of deleterious material such as thin, elongated pieces, dirt, dust, and shall contain not more than 1 Wt.% water (ASTM C 566).
2.06 CERTIFICATION AND QUALITY ASSURANCE
Prior to production, the Contractor shall submit certification of
specification compliance for all materials to be used in the work. Also certification shall be submitted concerning the design of the asphalt-rubber blend as follows:
A. Method A. The Contractor shall submit certification that the asphalt cement is compatible with the rubber and has been tested to determine the quantity of extender oil (usually 1 to 7 Wt.%)
required and that the proposed percentage will produce an absolute
viscosity of the blended materials of 600 to 2000 poises at 1400 F
122

when tested in accordance with the requirements of AASHTO T 202-80.
New certifications \;i1l be required if the asphalt cement lot or
source is changed.
B. Method B. The Contractor shall submit certifi cati ons that the
asphalt cement is compatible with the rubber. New certifications
will be required if the asphalt cement lot is changed.
3. EQUIPMENT
3.01 PRE-BLENDING
Rubber and a portion of the asphalt for the asphalt-rubber blend
shall be preblended in a master batch prior to introduction of the master
batch to the distributor. The master batch can be diluted with
additional asphalt and additives in the distributor to the formulation
recommended by the Supplier.
4. PRODUCTION DETAILS
4.01 PREPARATION OF BINDER: METHOD A.
A. Preparation of Asphalt-Extender Oil Mix Blenrl
Blend the preheated asphalt cement (250 to 4000 F), and
sufficient rubber extender oil (1 to 7 Wt.%) to reduce the
viscosity of the asphalt cement-extender oil blend to within the
specified viscosity range. Mixing shall be thorough by
recirculation, mechanical stirring, air agitation, or other
appropriate means. A minimum of 400 gallons of the asphalt
cement-extender oil blend shall be prepared before introduction of
the rubber.
B. Preparation of Asphalt-Rubber Binder
The as pha It-extender oil blend shall be heated to wi thi n the
range of 350 to 425 0 F. The asphalt-rubber blend for the master
batch shall be preblended in appropriate preblending equipment as
specified by the supplier prior to introduction of the master batch
123
into the distributor. Addition of asphalt cement into the
distributor to provide the specified formula shall be as directed
by the supplier. The percentage of rubber shall be 20 to 24 Wt.%
of the total blend as specified by the supplier. Recirculation
shall continue for a minimum of 30 minutes after all the rubber is
incorporated to insure proper mixing and dispersion. Sufficient
heat should be applied to maintain the temperature of the blend
between 375 and 4250 F while mixing. Viscosity of the asphalt-rubber
shall be less than 4000 centipoises at the time of application
(ASTM D 2994 with the use of a Haake type viscometer in lieu of a
Brookfield Model LVF or LVT if desired).
4.02 PREPARATION OF BINDER: METHOD B.
A. Preparation of the Asphalt-Rubber Blend - Mixin9
The asphalt cement shall be preheated to within the range of
350 to 4500 F. The asphalt-rubber blend for the master batch shall
be preblended in appropriate preblending equipment as specified by
the supplier prior to introduction of the master batch into the
distributor. Addition of asphalt cement and diluent into the
distributor to provide the specified formula shall be as directed
by the supplier. The percentage of rubber shall be 20 to 24 Wt.%
of the total asphalt-rubber mixture (including diluent). Mixing
and recirculation shall continue until the consistency of the
mixture approaches that of a semi-fluid material (i.e., reaction is
complete). At the lower temperature, it will require approximately
30 minutes for the reaction to take place after the start of the
addition of rubber. At the higher temperature, the reaction will
take place within approximately five minutes; therefore, the
temperature used will depend on the type of application and the
methods used by the Contractor. Viscosity of the asphalt-rubber
shall be less than 4000 centipoises at the time of application
(ASTM 0 2994 with the use of a Haake type viscometer in lieu of a
124

Brookfield Model LVF or LVT if desired). After reaching the proper
consistency, application shall proceed immediately.
B. Adjustment to Mixing Viscosity with Diluent
After the full reaction described in MIXING (4.02) above has
occurred, the mix can be diluted with a kerosene type diluent. The amount of diluent used shall be less than 7.5 percent by volume of
the hot asphalt rubber composition as required for adjusting viscosity for better wetting of the aggregate. Temperature of the
hot composition shall not exceed the kerosene initial boiling point at the time of adding the diluent.
4.03 JOB DELAYS
Prior to preparation or use of asphalt-rubber (prepared by either
Method A or B) maximum holdover times due to job delays (time of application after completion of reaction) to be allowed will be agreed upon between the Contractor, Supplier, and Engineer. However, holdover
times in excess of 16 hours will not be allowed at temperatures above
2900 F. Retempering including reheating and the addition of asphalt, rubber or diluent (kerosene/extender oil) will be allowed with the
approval of the Engineer.
4.04 APPLICATION OF BINDER
The binder material shall be applied at a temperature of 375 to
4250 F for Method A and 290 to 3500 F for Method B at a rate specified by
the Engineer.
5. METHOD OF MEASUREMENT
The asphalt-rubber binder will be measured by the number of tons of
materi al actually used.
125
6. BASIS OF PAYMENT
The unit price bid per ton shall include the cost of furnishing all
material, all labor and equipment necessary to complete the work.
126

APPENDIX B
Changes To Asphalt Concrete Mix Design Procedures And Construction Guideline For
Use Of Asphalt-Rubber Concrete As A Pavement Material
127

APPENDIX B. CHANGES TO ASPHALT CONCRETE MIX DESIGN PROCEDURES
AND CONSTRUCTION GUIDELINES FOR USE OF ASPHALT-RUBBER CONCRETE
AS A PAVEMENT MATERIAL
1. DESCRIPTION
This guide involves the mix design for asphalt-rubber concrete and the use of asphalt-rubber concrete as a pavement material. Mix design
and construction experience have indicated that the same procedures as those used for other hot-mix types (in particular, for asphalt concrete) will produce an acceptable asphalt-rubber concrete pavement surface.
Therefore, mix design procedures not discussed herein should follow the Marshall method of mix design as described in the Asphalt Institute's Manual MS-2 (Ref 4). Construction operations not described herein (for
example, methods of mixing, placement, and compaction) should follow the regular FAA specifications for construction with asphalt concrete.
2. MODIFICATIONS TO MARSHALL MIX DESIGN METHOD FOR ASPHALT-RUBBER CONCRETE
To produce an adequate mix for asphalt-rubber concrete, the followinq
modifications must be made to the Marshall mix design method for asphalt concrete (Ref 4):
2.01 AGGREGATE
A calculation must be performed which adjusts the aggregate blend to treat the rubber particles in the binder as an additional aggregate. If this adjusted aggregate blend is significantly different from the original aggregate blend, then the adjusted blend shall be used to combine the aggregate to produce a final blend.
128
2.02 MIXING AND COMPACTION TEMPERATURES
The Marshall method of mix design calls for determination of mixing
and compaction temperatures to be dependent upon viscosity of the
material. However, capillary tube viscometers shall not be used to
measure viscosity of asphalt-rubber concrete made with ground reclaimed rubber. If viscosity is used to determine mixing and compaction temperatures, then the Schweyer rheometer, the Haake rotational
viscometer, or the Brookfield viscometer may be used*.
If specific temperatures are recommended, then the mixing and
compaction temperatures for mix design of asphalt-rubber concrete shall be higher than temperatures for asphalt concrete. A mixing temperature
of 375°F is suggested by this study; a compaction temperature of above
325 0 F(1630C) is suggested.
2.03 MIXING
Mixing shall be performed using a high energy mechanical mixer.
2.04 COMPACTIVE EFFORT
A compactive effort of 75 blows per face of the specimen shall be
applied, regardless of the gear level.
2.05 EXTRUSION OF SPECIMENS FROM MOLDS
Asphalt-rubber concrete specimens shall be allowed to cool to room
temperature before being extruded from the molds. (The project engineer should specify a minimum cooling time; 24 hours is recommended by this
study.)
*Personal communication with T. S. Shuler, New Mexico Engineering Research Institute, and B. M. Gallaway, Texas A&M University, March, 1987.
129

2.06 AIR VOID CONTENT
The upper 1 imit on ai r void content shall be 8%. The lower 1 imit specified by MS-2 (Ref 4) can remain at 3%.
3. MODIFICATIONS TO CONSTRUCTION PROCEDURES WHEN USING ASPHALT-RUBBER CONCRETE
The primary modification to construction procedures involves the
temperatures at which the material is mixed, transported, placed, and compacted. Other construction procedures used for asphalt concrete have
been successfully used in construction with asphalt-rubber concrete.
3.01 TEMPERATURES
It is recommended that the mixing temperature be in the range of
325-350oF(163-177 oC). It is recommended that compaction be allowed to control the
temperatures of the materials during the placement process. The contractor shall construct a test strip which shall be tested for air
void content after placement. The suggested temperature range for
placement shall be "greater than 300oF(l490 C)" and it is recommended that
the initial test strip be placed at a temperature of 32SoF(1630C) or
above, if possible. If the material cannot be sufficiently compacted at a temperature
below 350 0 F(177 0C), then it is recommended that the compactive effort be
increased rather than increasing the temperature of the materials above
350oF(177 oC). This is due to the high cost of heating the materials. It is possible that 3 to 5 percent air void contents may be attained
in the field, but field verification will be necessary.
3.02 SMOKE CONTROL
At the higher temperatures required for placement of asphalt-rubber concrete, the material may emit smoke. Applicable pollution control measures may need to be taken.
130
APPENDIX C
Permanent Deformation Analysis:
Strain Versus Cycles To Failure Plots
131
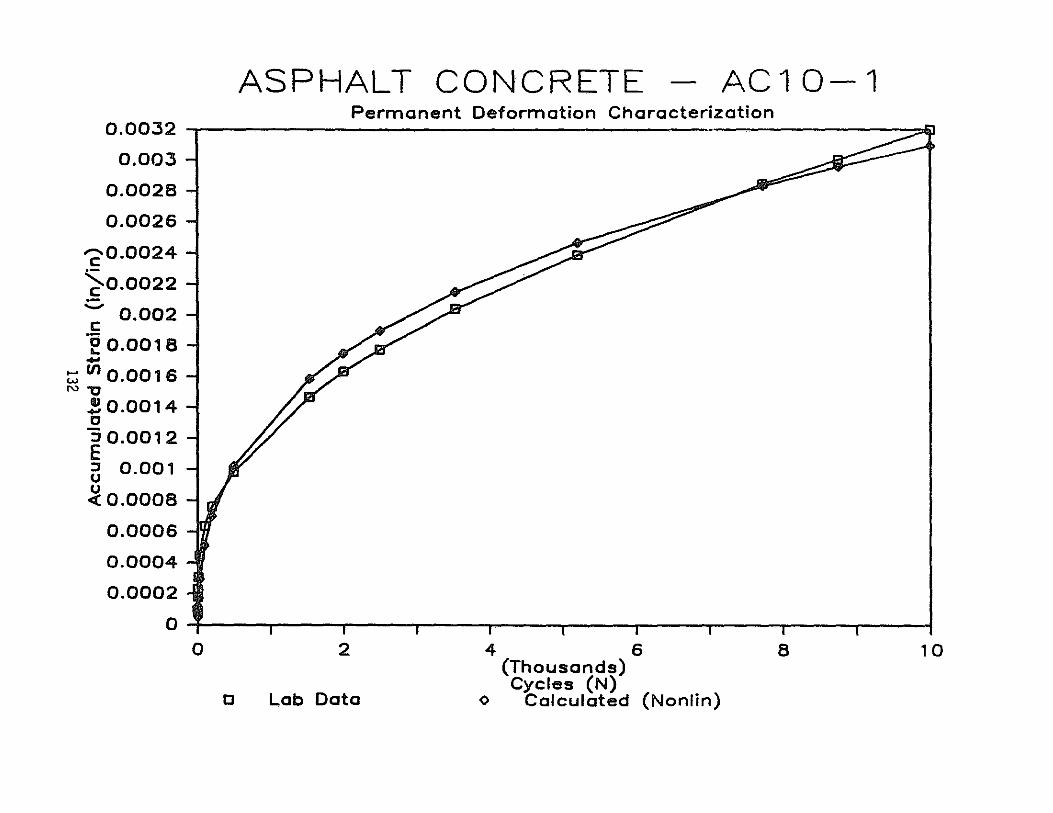
ASPHALT CONCRETE AC10-1 Permanent Deformation Characterization
0.0032 AI
0.003
0.0028
0.0026
'20.0024
~0.0022 .-- 0.002 c: 'e 0.0018 ....
t;; III 0.0016 "'"0
20.0014 o :; 0.0012 E ~ 0.001
~ 0.0008
0.0006
0.0004
0.0002
o ~T~--~----~----~----~-----r-----r-----r----~----~----~ o 2
o Lab Data
4 6 (Thousands) Cycles (N)
<> Calculated (Nonlin)
8 10

-2.4 -2.5 -2.6 -2.7 -2.8
,-.,. -2.9 .E -3 0 L. -3.1 ....
fI)
"0 -3.2 IU -3.3 .... 0
..... :::J -3.4 t:: E -3.5
:::J u -3.6 u 5 -3.7 01 -3.8 0 -l -3.9
-4 -4.1 -4.2 -4.3 -4.4
0
0
ASPHALT CONCRETE AC10-1 Permanent Deformation Characterization
2
Lab Data
4 6 (Thousands) Cycles (N)
o Calculated (Nonlin)
8 10

4982 AC10-7 Permanent Deformation Characterization
0.00035 ;oIjJ
0.0003
0.00025 .E ~ ....
CIl 0.0002 "0 4D ..........
w o .j:>-
~.00015 :J u u «
0.0001
0.00005
o ~.~-~----~----~----~----~-----r-----r----~----~---~ o 2
o Lab Data
4 6 (Thousands) Cycles (N)
+ Calculated (Linear)
8 10

-3.4
-3.6 -
-3.8 -
-4 -
- -4.2 -c: .-0
-4.4 -... o+J VI
"0 -4.6 -u
o+J -4.8 -0 .... :J ~ E -5 -
:J u -5.2 -u ~ -5.4 -01 0 -5.6 -..J
-5.8 -
-6 -
-6.2 ;
-6.4 0
ASPHALT CONCRETE AC 1 0-7 Permanent Deformation Characterization
2
C Lob Data
1 r--I
4 6 (Thousands) Cycles (N)
+ Calculated (Linear)
r 8 10
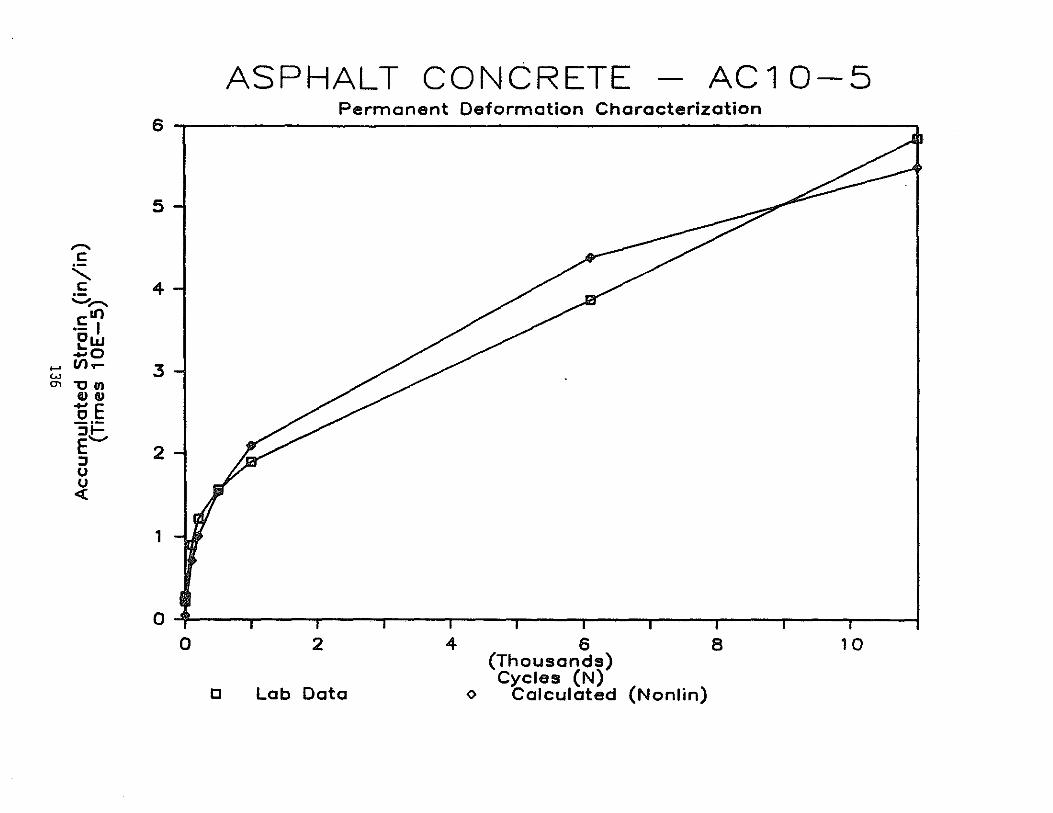
,...., e .-
........... e
-,...., elf) .- I Ow .be
...... Vl.-~ 1:1 1/1
411411 ..... E .2i= ::1_ E ::I U U «
ASPHALT CONCRETE AC10-5 Permanent Deformation Characterization
6
5
4
:3
2
1
O~'~--~---r----r----r---.----~---r----r----r---.--~
o 2
C Lob Data
468 (Thousands) Cycles (N)
<> Calculated (Nonlin)
10

ASPHALT CONCRETE AC10-5 Permanent Deformation Characterization
-4.2 -4.3 -4.4 -4.5 -4.S -4.7
......... -4.8 c: -0 -4.9 ... .... -5 III
"0 -5.1 QJ
-5.2 .... 0 1-':; -5.3
~ E -5.4 :::J u -5.5 u < -5.S ....... 01 -5.7 0 -5.8 ...J
-5.9 -S
-S.1 -S.2 -S.3 -S.4
0 2 4 S 8 10
0 Lab Data
(Thousands) Cycles (N)
<> Calculated (Non lin)

ASPH,L\LT RUBBER CONCRETE -- AR4L Permanent Deformation Characterization
0.0006 .-------------------------------------------------------~
0.0005
.E 0.0004 D L. ....
III
"D III
..... 00.0003 w -0:> :::J
E :::J U
~ 0.0002
0.0001
o4.~---,----~----~----~----_r----_r----~----~----~----4 o 2
[] Lab Data
4 6 (Thousands) Cycles (N)
o Calculated (Nonlin)
8 10

-3.2
-3.4 -
-3.6 -
-3.B ....... c: -4 0 L. .... -4.2 Ul
"0 -4.4 Q.I .... 0
..... ::l -4.6 -~ E
::l -4.B -0 0 « -5 ..: "-'
01 -5.2 -a
..J
-5.4 -
-5.6 -
-5.B .,
-6 0
[J
ASPHALT RUBBER AR4L Permanent Deformation Characterization
r I
2
Lab Data
I I I I
4 6 (Thousands) Cycles (N)
o Calculated (Non lin)
I
B I
10

ASPHALT RUBBER CONCRETE AR5L Permanent Deformation Characterization
0.0006 ,-------------------------------------------------------~
0.0005
........ c , .!: 0.0004 '-'"
c o L +'
...... If) 0.0003 ~'O
@I .... o :J
~ 0.0002 u u <{
0.0001
o ~-----r----_r-----r----~----~----~----_,----_.r_--r_~--~ o 2
o Lab Data
4 6 (Thousands) Cycles (N)
+ Calculated (Linear)
8 10

........ c 0 L .... Ul
"t7 @) .... 0
.... :J ..,. E .... :J u u « ...., 0\ 0 -l
ASPHALT RUBBER CONCRETE -3.2
-3.3 -
-3.4 -
-3.5 -
-3.6 -
-3.7 -
-3.8 -
-3.9 -
-4 -
-41 -. I
-4.2 -
-4.3 -
-4.4 0
0
Permanent Deformation Characterization
2
Lab Data
4 6 (Thousands) Cycles (N)
+ Calculated (Linear)
.,. 8
AR5L
T
10

----c: .-, c:
.::::,. ............ c:U") .- I Ow .bo Vl.-
~-oUl N .., 1\1
"OE -1= ::l ........ E ::l U U «
ASPHALT RUBBER CONCRETE AR3L Permanent Deformation Charocterization
6
5
4
3
2
1
o ~'~--~----~----~----~----~-----r-----r----~----~----~ o 2
IJ Lab Data
4 6 (Thousands) Cycles (N)
o Colculoted (Nonlin)
8 10

-c 0 L ..... III
"0 @.I ..... 0
.... :J t; E
:J u u « ....., 01 0 .J
ASPHALT RUBBER CONCRETE -4.2
-4.4 -
-4.6 -
-4.B -
-5 -~
-5.2 .,
-5.4 -
-5.6 ...:
-5.B -
-6 -
-6.2 -
-6.4 -
-6.6 -•
-6.B 0
Permanent Deformation Characterization
~
,-2
[] Lab Data
I
-
4 6 (Thousands) Cycles (N)
o Calculated (Nonlin)
T
B
AR3L
......l
I
10
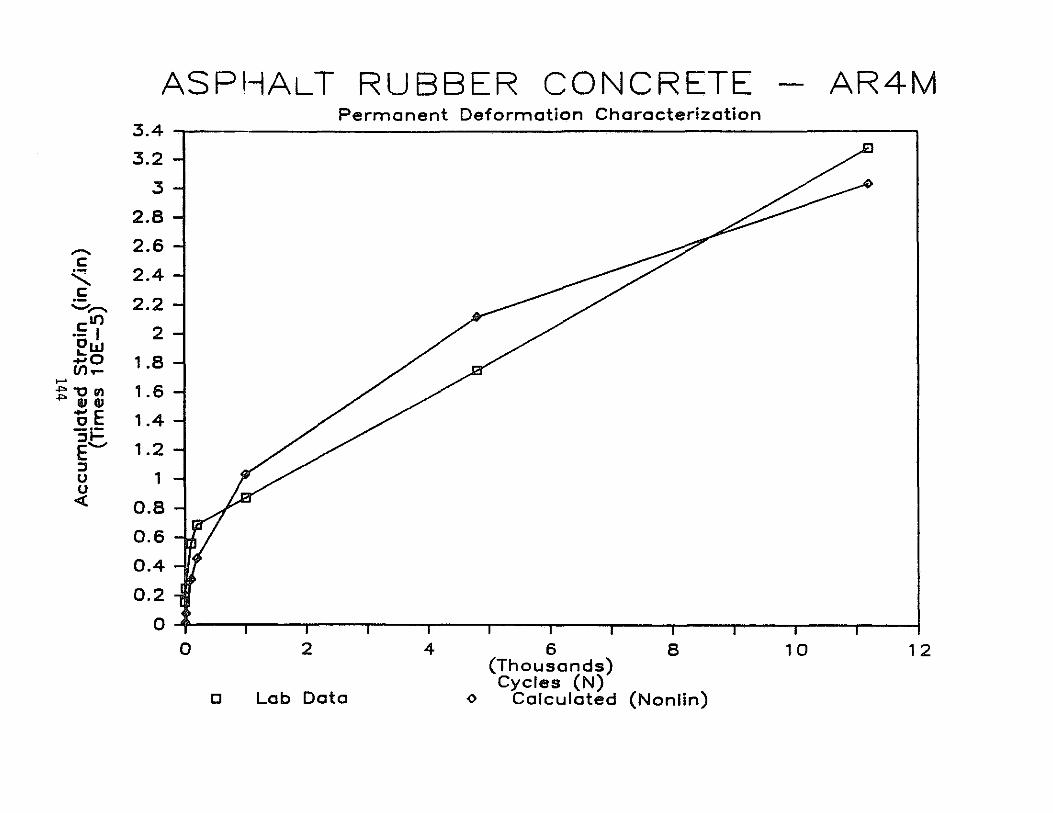
........ I:
'-I: '-" ........ 1:10 .- I Ow !:oo Ul .... ....
""""'Om """ iii QI
t5E 3t, E :::J U u «
ASPHALT RUBBER CONCRETE 3.4
3.2
3
2.8
2.6
2.4
2.2
2
1.8
1.6
1.4
1.2
1
0.8
0.6
0.4
0.2
0 0
[]
Permanent Deformation Characterization
2
Lab Data
468 (Thousands) Cycles (N)
<> Calculated (Non lin)
AR4M
10 12

.....,. c c L. ....
11'1
1J u .... c
...... ::J ;';; E
::J 0 0 < ....., 01 0 ..J
ASPHALT RUBBER CONCRETE - AR4M -4.4
-4.6
-4.8
-5
-5.2
-5.4
-5.6
-5.8
-6
-6.2
-6.4
-6.6
-6.8
-7 0
IJ
Permanent Deformation Characterization
2
Lab Data
468 (Thousands) Cycles (N)
o Calculated (Non lin)
10 12

ASPHALT RUBBER CONCRETE AR8M Permanent Deformation Characterization
0.00045 ,---------------------~----------------------------------_,
0.0004
0.00035 ,.... c
"-£ 0.0003 ....... c '2>.00025 ....
...... If) ..,. '" " !! 0.0002
0 :J
~.00015 0 0 «
0.0001
0.00005
o o 2
C Lab Data
4 6 (Thousands) Cycles (N)
o Calculated (Non lin)
8 10

....... .E
" ... -oJ III
" u -oJ
" ,.... :l
:!:i E :l u u c( '-"
0> 0 -I
ASPHALT RUBBER CONCRETE -3.3
-3.4
-3.5 . -3.6
-3.7
-3.B
-3.9
-4
-4.1
-4.2
-4.3
-4.4
-4.5
-4.6
-4.7
-4.B
-4.9 0
0
Permanent Deformation Characterization
2
Lab Data
4 6 (Thousands) Cycles (N)
o Calculated (Nonlin)
AR8M
B 10

ASPHALT RUBBER CONCRETE 0.00028
0.00026
0.00024
0.00022 .--.. c: '-0.0002 c:
q;J.00018 c: ·~)'0001 6 ... +'
..... 110.00014 ;!ij"t:l
*.00012 :::J E 0.0001 :::J ~.00008 « 0.00006
0.00004
0.00002
Permanent Deformation Characterization
AR9M
o+T--~--~--~--~~--~--~--~--~~ o 2
D Lab + Calc (Lin)
4 6 (Thousands) Cycles (N)
~
8 10
Calc (Nonlin)

'"' c: D ... .... til
"D ., .... D
.... ~
~ E ~ U U
~ D\ 0
..J
ASPHALT RUBBER CONCRETE -3.5
-3.6 -
-3.7 -
-3.8 -
-3.9 -
-4 -
-4.1 -I~
-4.2 -
-4.3...!
-4.4 -
-4.5 -
-4.6 -
-4.7 ..;
-4.8 -:
-4.9
0
IJ Lob
2
+
Permanent Deformation Characterization
--T
Cole (Un)
4 6 (Thousands) Cycles (N)
o
8
Calc (Non lin)
AR9M
I
10

ASPHALT RUBBER CONCRETE - AR9H 0.00028
0.00026
0.00024
0.00022
c: 0.0002 a .w.00018 II)
1'.00016 -~ J.00014 E ~.00012 u « 0.0001
0.00008
0.00006
0.00004
0.00002
0
Permanent Deformation Characterization
2
IJ Lab Data
4 6 (Thousands) Cycles (N)
+ Calculated (Linear)
8 10

""' c: ·0 L.. ....
Ul
"0 G1 .... D
~ :::J ~ E
:::J U U « '-'
DI 0 -'
ASPHALT RUBBER CONCRETE Permanent Deformation Characterization
-3.5
-3.6 -
-3.7
-3.8
-3.9 -
-4 -
-4.1 ~
-4.2 -
-4.3 -
-4.4 -
-4.5 -I
-4.6 T---- 1 ---I I I ---,--- ------.-
0 2 4 6
o Lob Data
(Thousands) Cycles (N)
+ Calc'ulated (Linear)
.. 8
AR9H
-
.., 10
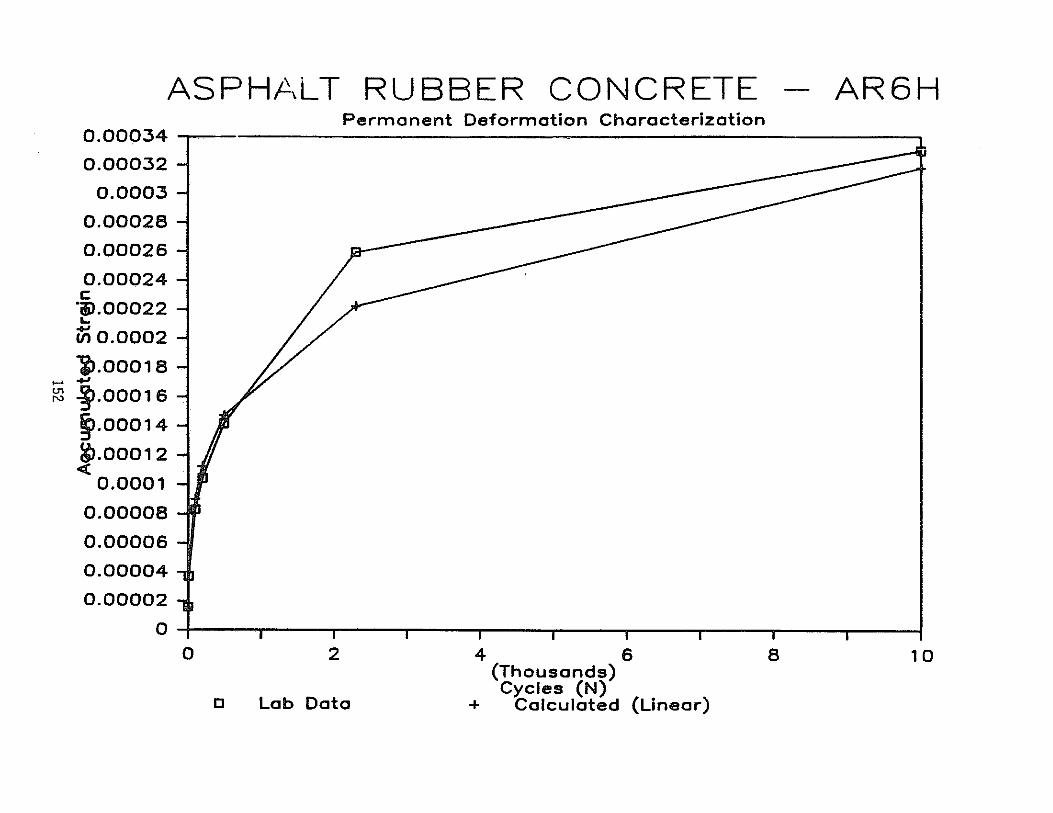
ASPHp\LT RUBBER CONCRETE - AR6H 0.00034
0.00032
0.0003
0.00028
0.00026
0.00024 c ·i1.00022 L
<OJ Ul 0.0002
j).00018 ..... <OJ
R.i ~.00016
~1.00014 g,.00012 c(
0.0001
0.00008
0.00006
0.00004
0.00002
0
0
Perrnanent Deformation Characterization
2
[] Lab Data
4 6 (Thousands) Cycles (N)
+ Calculated (Linear)
8 10

,..... c; 0 L..
-+J III
"0 u
<OJ 0
t;; :J w E
:J u u 5 0> 0 ..J
ASPHALT RUBBER CONCRETE -3.4
-3.5
-3.6
-3.7
-3.8
-3.9
-4
-4.1
-4.2
-4.3
-4.4
-4.5
-4.6
-4.7
-4.8
-4.9
0
[]
Permanent Deformation Characterization
2
Lab Data
4 6 (Thousands) Cycles (N)
+ Calculated (Linear)
AR6H
8 10

ASPHALT RUBBER CONCRETE AR5H Permanent Deformation Characterization
7
6
5 c a_ LII}
iii I 4 1LI "00 IU~ ....
...... a UI ~:;IU
3 EE :::Ji= UV u «
2
1
O~+~----'------'-----'------.-----.------.-----'r---~ o 2 4 6 8
[J Lab Data
(Thousands) Cycles (N)
<> Calculated (Nonlin)
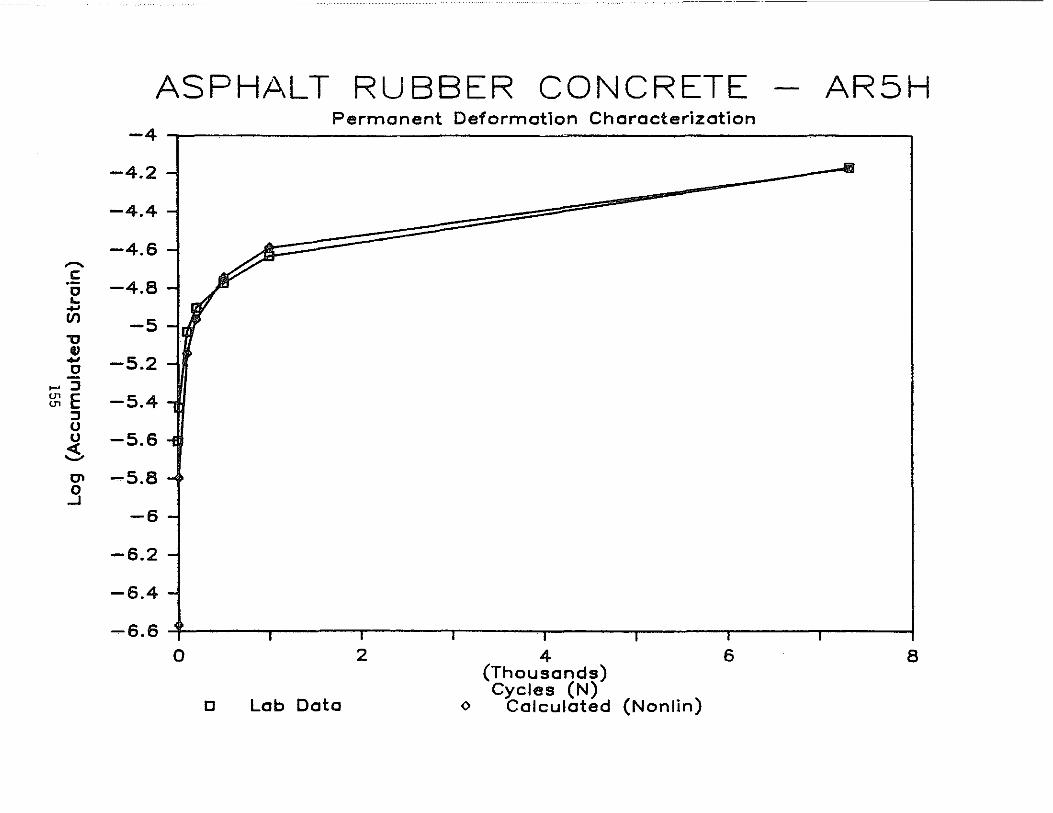
----- ---
ASPHALT RUBBER CONCRETE AR5H Permanent Deformation Characterization
-4
-4.2 - ..IiI
-4.4 -
-4.6 -,..... c: .- -4.8 -" ... .... Vl -5 -"0
" .... -5.2 -" _:::J
~E -5.4 ., :::J U u -5.6 -1 < '-'
0'1 -5.8 -0
...J -6 -
-6.2 -
-6.4 -
-6.6 +- 1 1-- - .--- I
0 2 4 6 8
c Lab Data
(Thousands) Cycles (N)
o Calculated (Nonlin)
APPENDIX D
Permanent Deformation Parameters For All Material,
Aircraft, And Temperature Combinations; And Sample
Plots, Permanent Deformation Parameters Versus Temperature
156

APPENDIX D. PERMANENT DEFORMATION PARAMETERS FOR ALL MIIT[lUAI,
AIRCRAFT, ANlJ TEMPERATURE COMBINATIONS; AND SIIMPLE PLIlTS, PI:RMANENT
DEFORMATION PARAMETERS VERSliS TEMPFRATliRE
This appendix contains the permanent deformation parameters for each
material and each aircraft after the parameters have been adjusted to the
field stress level. Also in this appendix are samples of the plots of
the adjusted permanent deformation parameters versus temperature. The
plots for the DC-IO aircraft are included here.
In this appendix, the element numbers are the horizontal finite
element mesh rows, with element number 1 being at the top of the asphalt
layer and element number 7 being at the bottom. When no data are shown
for element number 1, the typical stress calculated for that aircraft
load in the top of the asphalt layer was negative. In that case, no
ratio (of permanent deformation parameter at field stress to D~rmaneot
deformation parameter at laboratory stress for the typical aspha;:
concrete material) could be calculated. This ratio was necessary far
calculating the parameter at field stress for the test material. Thus,
when no ratio could be calculated, the parameter from element number 2 was input in the computer program for element number 1 as well.
Note that the parameter does not change with element number, or
with increasing depth. This is because the parameter is not sensitive
to stress. It is, however, sensitive to temperature and to material.
157

PERMANENT DEFORMATION PARAMETER: p
AIRCRAFT: All
Temperature, of
Material Element 40 (4.4) 70 (21.1) AC-10 Control all 1.15xlO16 9.82xl03
ARC-Low all 3.42xlO16 2.54xlO16
ARC-Medium all 3.45xlO16 2.89xlO16
ARC-High all 1.30xlO15 4.72xl0 10
158
(oC)
100 (.37.7) 6.38xlO 16
1.92xlO4
2.50xlO16
5.23xl02

PERMANENT UEFORMATION PARAMETER: E o/Er
AIRCRAFT: DC-9
Temperatu re, of (oC)
Mater; a1 Element 40 (4.4) 70 (21.1) 100 (37.7)
AC-10 Control 2.46x101 6.43x10 4
2 3.07x10³ 4.99x101 1.15x10⁵
3 3.72x10³ 5.99x10 1 1.0gx105
4 3.46x10³ 5.44x101 8.22x10⁴
5 3.35x10³ 4.98x10 1 6.57x10 4
6 3.63x10³ 5.00x101 5.70x10⁴
7 4.62x10 3 5.59x101 5.20x10⁴
ARC-Low 1.23x10⁴ 1.94x10 2
2 4.10x10³ 2.50x10⁴ 3.47x10²
3 4.96x10³ 3.00x10⁴ 3.30x10²
4 4.61x10³ 2.73x10 4 2.48x10 2
5 4.47x10³ 2.49x10⁴ 1.98x10²
6 4.85x10³ 2.50x10⁴ 1.72x10²
7 6.17x10³ 2.80x10⁴ 1. 57x1,J 2
ARC-Medi um 4.87x10 2 3.43/ 1.'.'
2 2.67x10³ 9.88x10² 6.14y1~;
3 3.23x10³ 1.19x10³ 0
5.84x10'
4 3.00x10³ 1.08x10³ 4.3gx103
5 2.91x10³ 9.88x10² 3.50x10³
6 3.16x10³ 9.91x10² 3.04x10³
7 4.01x10³ 1.11x10³ 2.77x10³
ARC-High 1.48x10² 3.01x101
2 9.17x10³ 3.00x10² 5.38x101
3 1.11x10⁴ 3.60x10² 5.12x101
4 1.03x10⁴ 3.27x10² 1.84x101
5 1.00x10⁴ 3.00x10² 3.07x101
6 1.09x10⁴ 3.00x10² 2.66x101
7 1.38x10⁴ 3.36x10 2 2.43x10 1
159
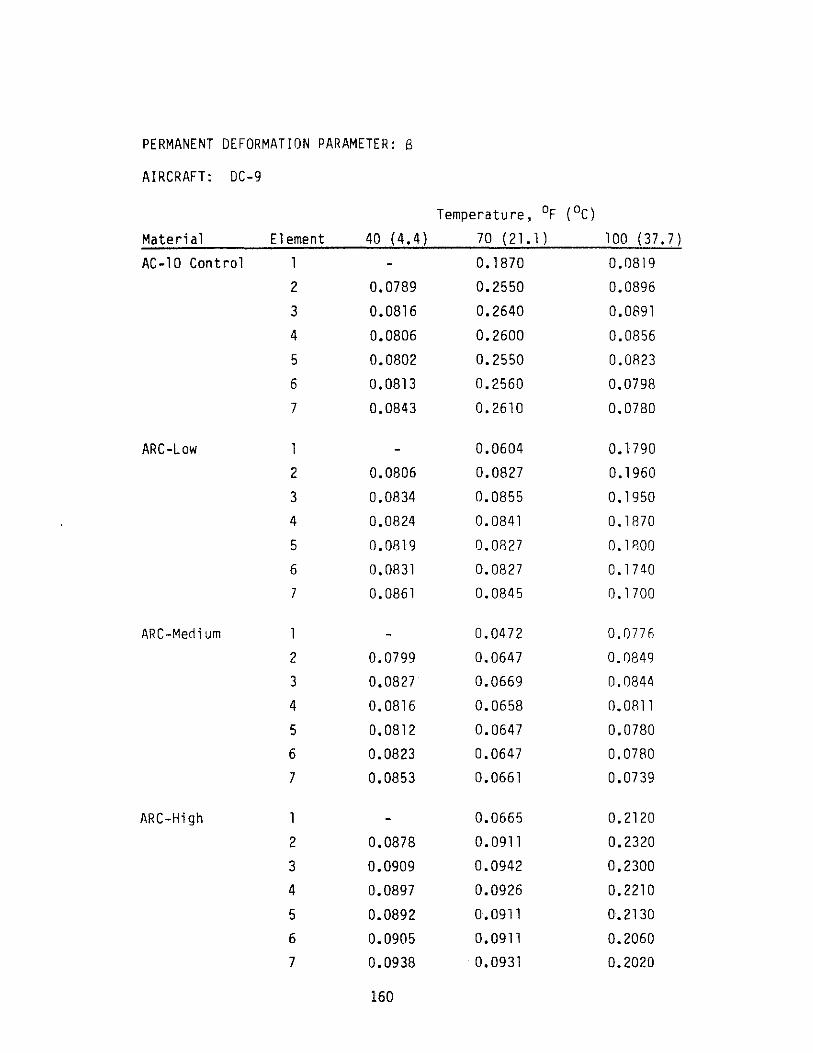
PERMANENT DEFORMATION PARAMETER: B
AIRCRAFT: DC-9
Temperature, of (DC)
Material Element 40 (4.4) 70 (21.1) 100 (37.7)
AC-l0 Control 0.1870 0.0819
2 0.0789 0.2550 0.0896
3 0.0816 0.2640 0.0891
4 0.0806 0.2600 0.0856
5 0.0802 0.2550 0.0823
6 0.0813 0.2560 0.0798
7 0.0843 0.2610 0.0780
ARC-Low 0.0604 0.1790
2 0.0806 0.0827 0.1960
3 0.0834 0.0855 0.1950
4 0.0824 0.0841 0.1870
5 0.0819 0.0827 O.lflOO
6 0.0831 0.0827 0.1740
7 0.0861 0.0845 0.1700
ARC-Mectium 0.0472 0.0776
2 0.0799 0.0647 0.0849
3 0.0827 0.0669 0.0844
4 0.0816 0.0658 0.0811
5 0.0812 0.0647 0.0780
6 0.0823 0.0647 0.0780
7 0.0853 0.0661 0.0739
ARC-High 0.0665 0.2120
2 0.0878 0.0911 0.2320
3 0.0909 0.0942 0.2300
4 0.0897 0.0926 0.2210
5 0.0892 0.0911 0.2130
6 0.0905 0.0911 0.2060
7 0.0938 0.0931 0.2020
160
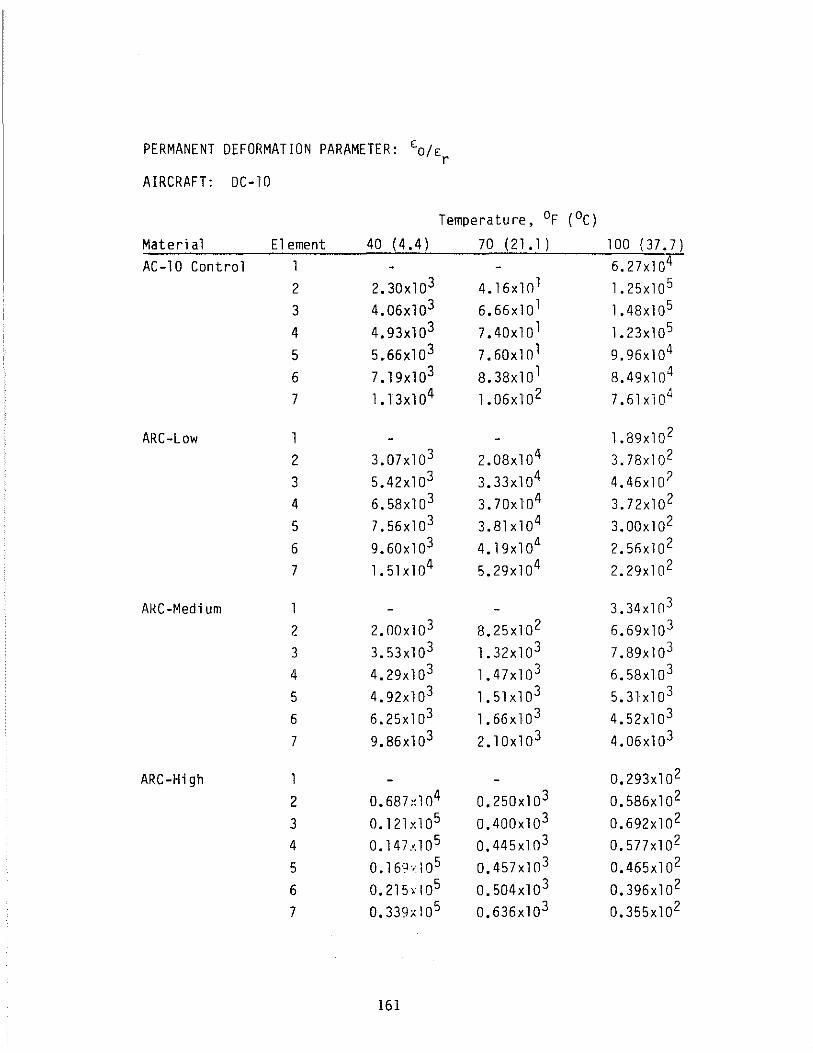
PERMANENT DEFORMATION PARAMETER: '-O/Er
AIRCRAFT: DC-l0
Temperature, of (OC)
Materi al Element 40 (4.4) 70 (21.1) 100 (37.7) AC-10 Control 6.27xlO4
2 2.30x10³ 4.l6xlO l 1.25xl0 5
3 4.06x10³ 6.66xlO l 1.48xl05
4 4.93x10³ 7.40xlO l 1.23xl05
5 5.66x10³ 7.60xl01 9.96xl04
6 7.19x10³ 8.38x101 8.49xl04
7 1.13xl04 1.06xl02 7.6lxl04
ARC-Low 1.89xl0 2
2 3.07x10³ 2.08x10 4 3.78xlO2
3 5.42xl03 3.33xl04 4.46xlO( 4 6.58xl03 3.70xlO4 3.72x10 2
5 7.56xl03 3.8lxl04 3.00xl02
6 9.60xl03 4.19x10⁴ 2.5fixl0 2
7 1.5lxlO4 5.29xlO4 2.29xlO2
ARC-Medium 3.34x10³
2 2.00xl0 3 8.25xl02 6.69x10³
3 3.53xl03 1.32x10³ 7.S9xl03
4 4.29xl03 1.47xl03 6.58xl03
5 4.92xl03 1.5lx103 5.31xl0 3
6 6.25xl03 1.66xl03 4.52x10³
7 9.86xl03 2.l0xl03 4.06xl03
ARC-High 1 0.293xlO 2
2 0.687~1()4 0.250xl03 0.586xl02
3 O.12lxl05 0.400xl03 0.692xl0 2
4 0.147.<.105 0.445xlO3 O. 577xl 02
5 0.16 Q ·.105 0.457xlO3 0.465xl02
6 0.215,105 0.504xl0 3 0.396xl02
7 0.339xl05 0.636xl03 0.355xl02
161
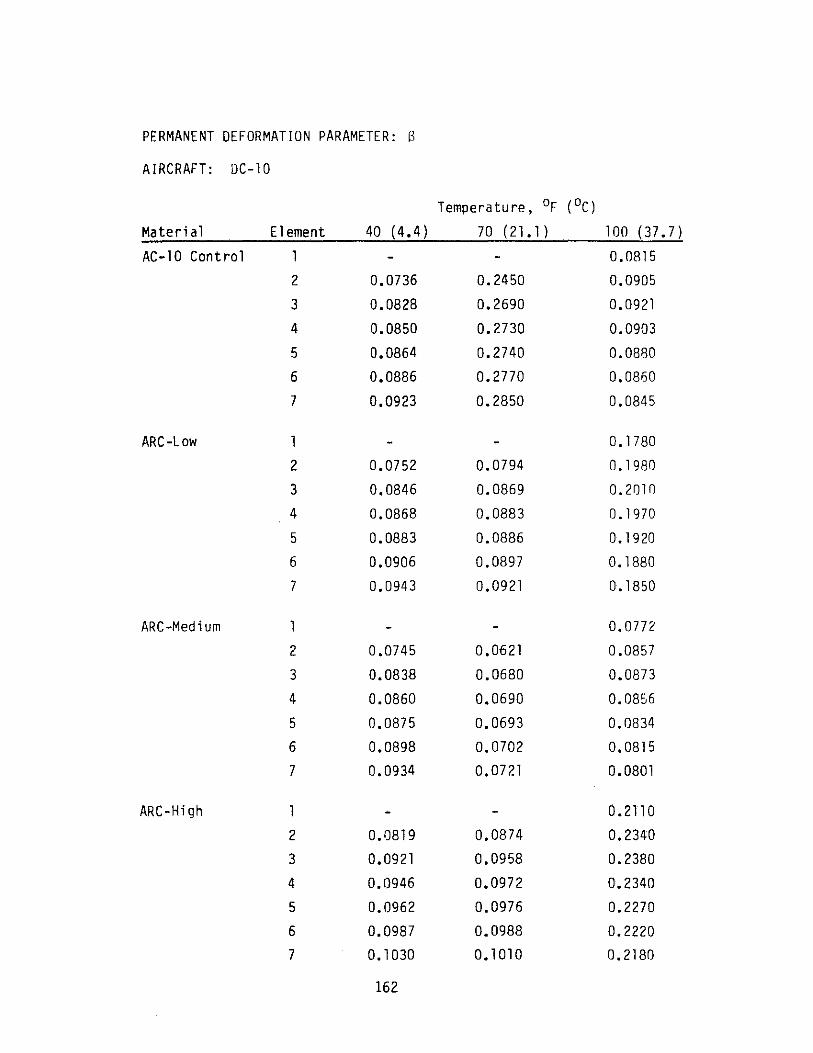
PERMANENT DEFORMATION PARAMETER: (1
AIRCRAFT: DC-l0
Temperature, of (DC)
Material Element 40 (4.4) 70 (21.1) 100 (37.7)
AC-l0 Control 1 0.0815
2 0.0736 0.2450 0.0905
3 0.0828 0.2690 0.0921
4 0.0850 0.2730 0.0903
5 0.0864 0.2740 0.0880
6 0.0886 0.2770 0.0860
7 0.0923 0.2850 0.0845
ARC-Low 0.1780
2 0.0752 0.0794 0.1980
3 0.0846 0.0869 0.2010
4 0.0868 0.0883 0.1970
5 0.0883 0.0886 0.1920
6 0.0906 0.0897 0.1880
7 0.0943 0.0921 0.1850
ARC-Medium 1 0.0772
2 0.0745 0.0621 0.0857
3 0.0838 0.0680 0.0873
4 0.0860 0.0690 0.0856
5 0.0875 0.0693 0.0834
6 0.0898 0.0702 0.0815
7 0.0934 0.0721 0.0801
ARC-High 0.2110
2 0.0819 0.0874 0.2340
3 0.0921 0.0958 0.2380
4 0.0946 0.0972 0.2340
5 0.0962 0.0976 0.2270
6 0.0987 0.0988 0.2220
7 0.1030 0.1010 0.2180
162
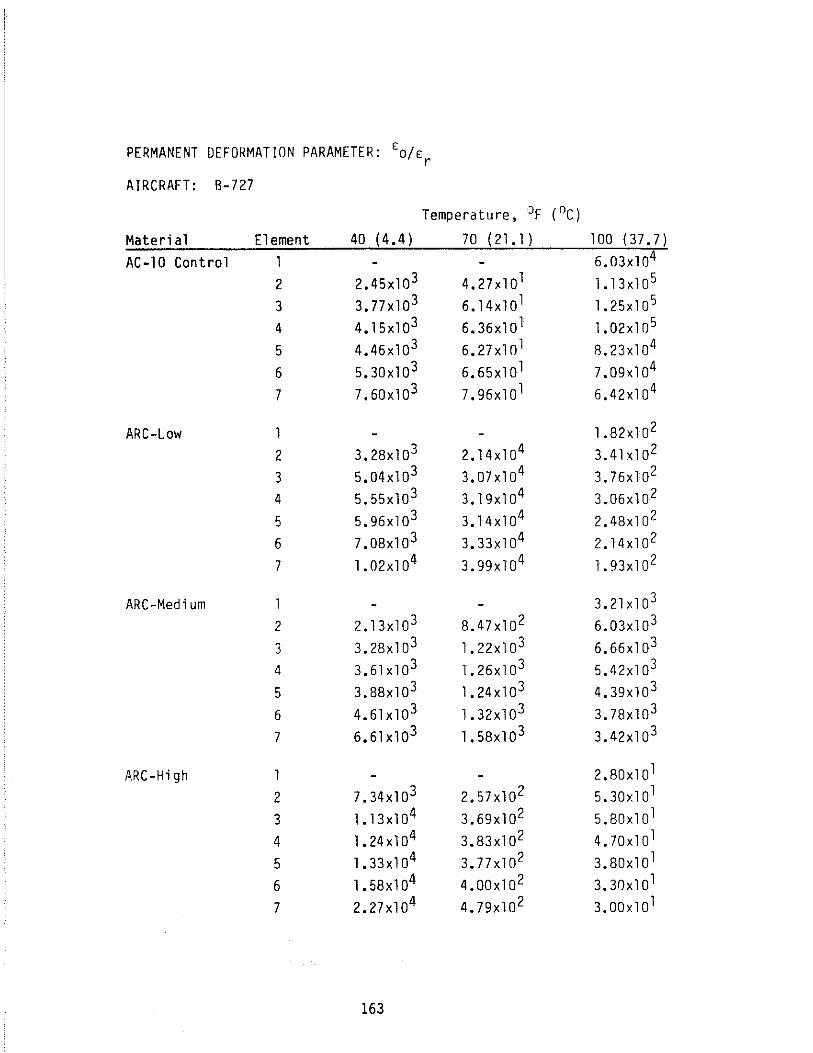
PERMANENT DEFORMATION PARAMETER: EO/Er
AIRCRAFT: 8-727
Temperature, DF (oC)
Material Element 40 (4.4) 70(21.1) 100 (37.7)
AC-10 Control 6.03xlO4
2 2.45x10³ 4.27xlO l 1.13xlO5
3 3. 77xl 03 6.14xlO l 1.25xlO5
4 4.15xl03 6.36xlO l 1.02xlO5
5 4.46xlO3 6.27xlO l 8.23xl04
6 5. 30xl 03 6.65xlOl 7.09xlO4
7 7.60xlO3 7.96xlO l 6.42xlO4
ARC-Low 1.82xlO2
2 3.28xlO3 2.14xlO4 3.41xlO 2
3 5.04xlO3 3.07xl04 3.76xlO2
4 5.55xlO3 3.19xlO4 3.06xlO 2
5 5.96xlO3 3.14xlO4 2.48xlO 2
6 7.08xlO3 3.33xlO4 2.14xl02
7 1.02xl04 3.99xlO4 1.93xl02
ARC-Medium 3.21xlO3
2 2.13xlO 3 8.47xl02 6.03xl03
3 3.28xlO3 1.22xl03 6.66xlO3
4 3.61xl03 1.26xl03 5.42xl03
5 3.88xl03 1.24xlO3 4.39xlO 3
6 4.61xlO3 1.32xl03 3.78xl03
7 6.61xlO3 1.58xl03 3.42xl03
ARC-High 2.80xlO l
2 7.34xl03 2.57xlO2 5.30xlO 1
3 1.13xlO4 3.69xlO2 5.80xl01
4 1.24xl04 3.83xl02 4.70xl01
5 1.33xlO4 3.77xlO2 3.80xl01
6 1.58xlO4 4.00xlO2 3.30xlO1
7 2.27xlO4 4.79xlO2 3.00xlO1
163

PERMANENT DEFORMATION PARAMETER: B
AIRCRAFT: B-727
Temperature, of (oC)
Mater; a1 Element 40 (4.4) 70 (21. 1 ) 100 (37.7)
AC-10 Control 1 0.0808
2 0.0749 0.2470 0.0894
3 0.818 0.2650 0.0904
4 0.0830 0.2670 0.0882
5 0.0839 0.2660 0.0856
6 0.0857 0.2690 0.0835
7 0.0891 0.2750 0.0819
ARC-Low 1 0.1767
2 0.0766 0.0799 0.1955
3 0.0836 0.0858 0.1977
4 0.0848 0.0864 0.1929
5 0.0857 0.0862 0.1871
6 0.0876 0.0869 0.1821::
7 0.911 0.0891 0.17~1
ARC-Med i urn 0.0766
2 0.0759 0.0625 0.0847
3 0.0828 0.0671 0.0857
4 0.0841 0.0675 0.0836
5 0.0849 0.0674 0.0811
6 0.0868 0.0680 0.0791
7 0.0902 0.0697 0.0776
ARC-High 0.2090
2 0.0834 0.0880 0.2312
3 0.0910 0.0945 0.2338
4 0.0924 0.0951 0.2281
5 0.0934 0.0949 0.2213
6 0.0954 0.0957 0.2159
7 0.0992 0.0982 0.2118
164
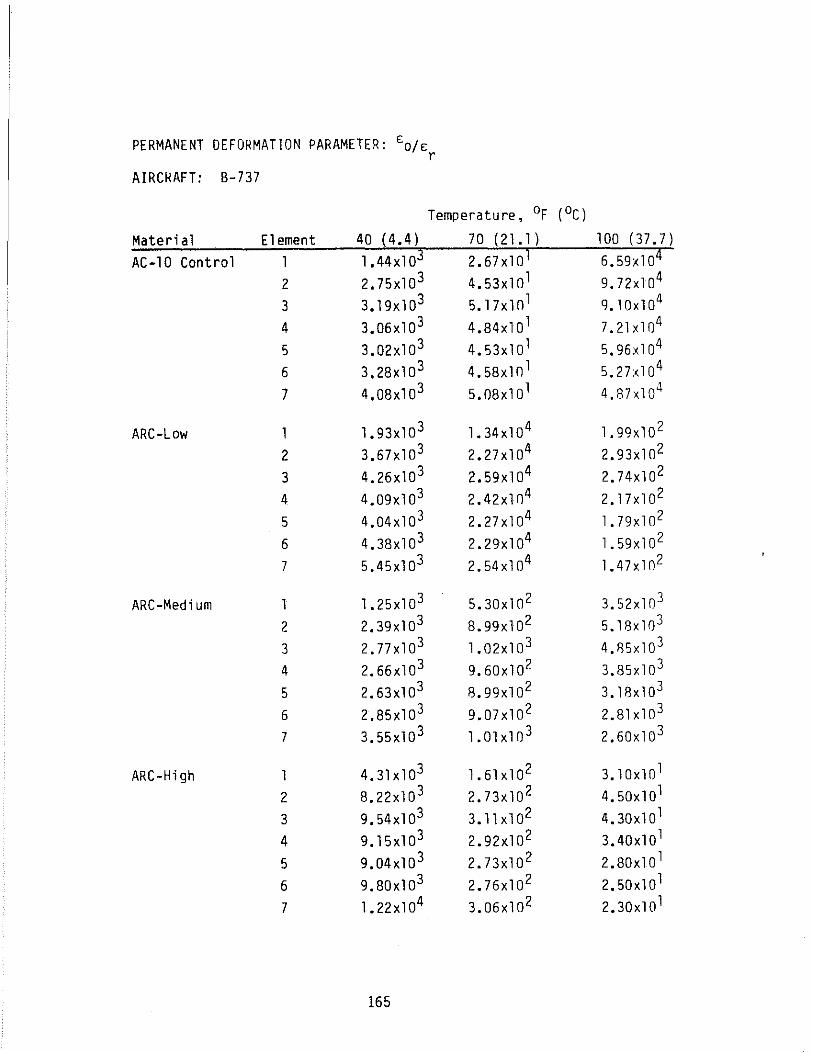
PERMANENT DEFORMATION PARAMETER: Eolr; r
AIRCRAFT: B-737
Temperature, of (oC)
Materi al Element 40 (4.4) 70 (21.1) 100 (37.7)
AC-10 Control 1 1.44xlO3 2.67xl01 6.59xl04
2 2.75xlO3 4.53xlO l 9.72xl04
3 3.19xlO3 5.17xlOl 9.10xl04
4 3.06xl03 4.B4xlO l 7.21xlO4
5 3.02xl03 4.53xlO l 5.96xlO 4
6 3.28xl03 4.58xlO l 5.2hl04
7 4.08xl03 5.08xlOl 4.87xl04
ARC-Low 1.93xl03 1. 34xl 04 1.99xl0 2
2 3.67xl03 2.27xl04 2.93xlO2
3 4.26xl03 2.59xl04 2.74xl0 2
4 4.09xl03 2.42xlO4 2.17xl0 2
5 4.04xl03 2.27xl04 1.79xlO2
6 4.38xl03 2.29xl04 1.59xl02
7 5.45xl03 2.54xlO4 1.47xlO2
ARC-Medium 1.25xl03 5.30xlO 2 3.52xlO 3
2 2.39xl03 8.99xl02 5.18xlf)3
3 2.77xl03 1.02xl0 3 4.fl5xl0 3
4 2.66xl03 9.60xl0 2 3.85xlO 3
5 2.63xl03 8.99xl02 3.18xl03
6 2.85xl03 9.07xl0 2 2.81xl0 3
7 3.55xl0 3 1.01xlO 3 2.60xlO 3
ARC-High 4.31xlO3 1.61xl02 3.10xlO1
2 8.22xlO 3 2.73xl0 2 4.50xl01
3 9.54xl03 3.11xlO2 4.30xlO1
4 9.15xlO3 2.92xl0 2 3.40xl01
5 9.04xl0 3 2.73xl0 2 2.80xlO 1
6 9.80xl03 2.76xl0 2 2.50xl01
7 1.22xlO4 3.06xl02 2.30xlO1
165
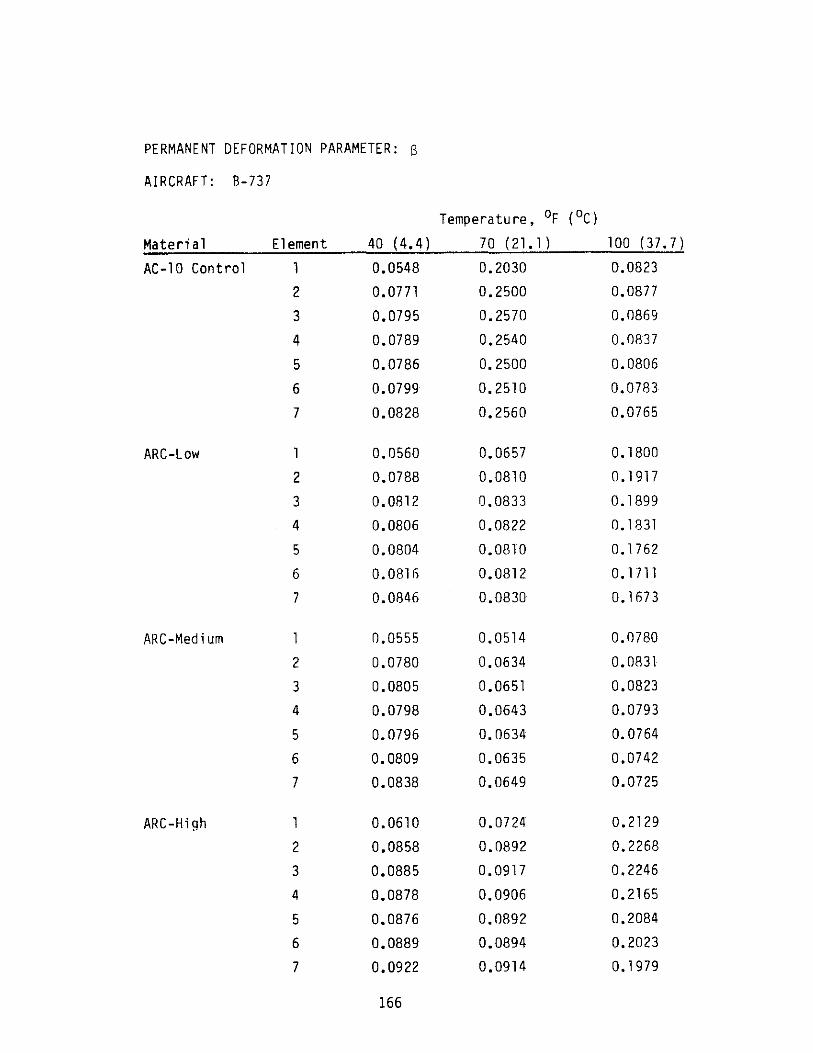
PERMANENT DEFORMATION PARAMETER: S
AIRCRAFT: B-737
Temperature. of (oC)
Material Element 40 (4.4) 70(21.1) 100 (37.7)
AC-l0 Control 1 0.0548 0.2030 0.0823
2 0.0771 0.2500 0.0877
3 0.0795 0.2570 0.0869
4 0.0789 0.2540 0.n837
5 0.0786 0.2500 0.0806
6 0.0799 0.2510 0.0783
7 0.0828 0.2560 0.0765
ARC-Low 0.0560 0.0657 0.1800
2 0.0788 0.0810 0.1917
3 0.0812 0.0833 0.1899
4 0.0806 0.0822 0.1831
5 0.0804 0.0810 0.1762
6 0.0816 0.0812 0.1711
7 0.0846 0.0830 0.1673
ARC-Medium 0.0555 0.0514 0.n780
2 0.0780 0.0634 0.0831
3 0.0805 0.0651 0.0823
4 0.0798 0.0643 0.0793
5 0.0796 0.0634 0.0764
6 0.0809 0.0635 0.0742
7 0.0838 0.0649 0.0725
ARC-High 1 0.0610 0.0724 0.2129
2 0.0858 0.0892 0.2268
3 0.0885 0.0917 0.2246
4 0.0878 0.0906 0.2165
5 0.0876 0.0892 0.2084
6 0.0889 0.0894 0.2023
7 0.0922 0.0914 0.1979
166

PERMANENT DEFORMATION PARAMETER: EO/E:r
AIRCRAFT: 8-757
Temperature, of (DC)
Material Element 40 (4.4) 70(21.1) 100 (37.7)
AC-10 Control 1.31xl03 2.50xl01 6.87xlO 4
2 3.29xl03 5.33xlO l 1.2Bxl05
3 4.02xl03 6.46xlOl 1.2lxl05
4 3.70xl03 5.BlxlOl 8.87xl04
5 3.57xl03 5.27xlOl 6.96xl04
6 3.89xl03 5.28xlO l 5.9Bxl04
7 5.01xl03 5.94xlO l 5.42xl04
ARC-Low 1.75xl03 1.25xl04 2.07xl02
2 4.39xl03 2.67xl0 4 3.B7xl02
3 5.37xl03 3.23xl04 3.64xl02
4 4.94xl03 2.91xl04 2.67xl02
5 4.76xl03 2.64xl0 4 2.10xl02
6 5.19xl03 2.64xl04 1.80x10²
7 6.69xl03 2.98xl04 1.ii3xlO2
ARC-Medi um 1 1.14xl03 4.96xl0 2 3.66xl0 3
2 2.86xl03 1.06xl03 6.85x10³
3 3.50xl03 1.2Bxl03 6.44xlO 3
4 1.21xl03 1.15xl03 4.73xl0 3
5 3.10xl03 1.04xl03 3.71xlO3
6 3.38xl03 1.05xl03 3.19xlO3
7 4.36xl03 1.lBxl03 2.B9xl03
ARC-High 3.92xl03 1.50xl02 3.20xlO l
2 9.B3xl03 3.21xl02 6.00xlO l
3 1.20xl04 3.89xl02 5.60xlOl
4 1.10xl04 3.50xl0 2 4.10xlOl
5 1.07xl04 3.17xl02 3.30xlO l
6 1.16xl04 3.18xl02 2.80xlO 1
7 1.50xl04 3.5Bxl02 2.50xlO l
167

PERMANENT DEFORMATION PARAMETER: 8
AIRCRAFT: B-757
Temperature, of (oC)
Materi a 1 Element 40 (4.4) 70 (21. 1 ) 100 (37.7)
AC-10 Control 1 0.0329 0.1910 0.0830
2 0.0799 0.2590 0.0907
3 0.0826 0.2670 0.0901
4 0.0815 0.2630 0.0866
5 0.0811 0.2580 0.0832
6 0.0822 0.2580 0.0807
7 0.0852 0.2640 0.0788
ARC-Low 0.0337 0.0617 0.1814
2 0.0817 0.0838 0.1983
3 0.0844 0.0866 0.1970
4 0.0833 0.0851 0.1893
5 0.0829 0.0836 0.1819
6 0.0840 0.0836 0.1764
7 0.0870 0.0854 0.1722
ARC-Medium 0.0333 0.0483 0.0786
2 0.0809 0.0655 0.0860
3 0.0837 0.0677 0.0854
4 0.0826 0.0665 0.0820
5 0.0821 0.0654 0.0788
6 0.0832 0.0654 0.0764
7 0.0862 0.0668 0.0747
ARC-High 1 0.0367 0.0680 0.2145
2 0.0890 0.0923 0.2345
3 0.0920 0.0953 0.2330
4 0.0908 0.0937 0.2239
5 0.0903 0.0921 0.2151
6 0.0915 0.0921 0.2086
7 0.0948 0.0941 0.2037
168

Aircraft: DC-10
Material: AC-10 Control
20
18
16
14
12
0 .... · 0 · III 10 •
"0 -aJ All Elements ;;: .... Q. 8 ..... CJ 0 ..J
6
4
2
30 40 50 60 70 80 90 100
TEMPERATURE (OF.)
169
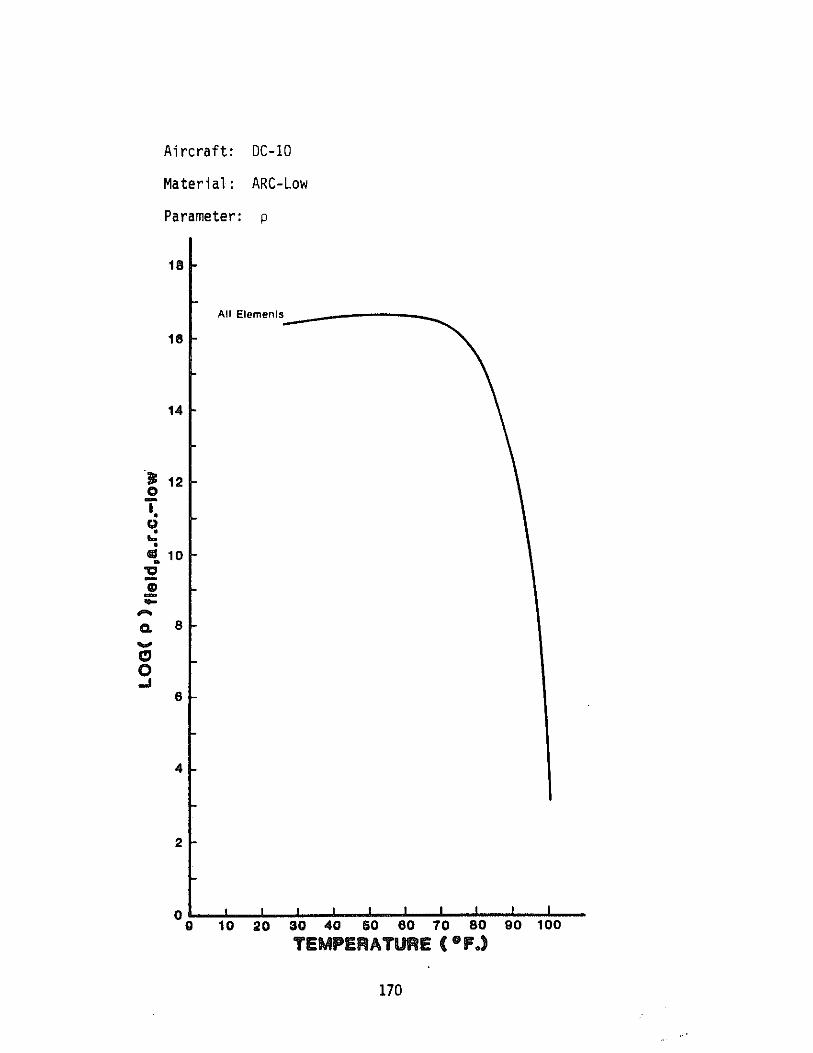
Aircraft: OC-10
Material: ARC-Low
Parameter: p
18
All Elemenls'_------_
18
14
jI: 12 o ~ ~ .. • 411 10 • :5! III -.... ....
a. 8 ..... ~ o .....
8
4
2
Og~~10~-2~0~~3~O~~4~O--~5~O--8~0~~7~O~~8~O--~80~~1~0~O-TEMPERATURE «ClFJ
170

Aircraft: DC-IO
Material: ARC-Medium
Parameter: p
17
All Elements
16
E ::I -1:1 4D E I • U • .. • 15 III •
1:1 -.! -..... Q. .... C-' 0 ..J
14
40 50 60 70 60 90 100
TEMPERA TURE (0 F.)
171

Aircraft: DC-10
Material: ARC-High
Parameter: p
18
18
14
s::. Cl12 -s::. I. U • .. • l1li 10 •
:5! CD --,..,
Q. 8 .... Cl o ..I
8
4
2
All Elements
OL-~ __ ~ __ ~~ __ ~ __ ~~~~ __ ~~~~ o 10 20 30 40 50 80 70 80 90 100
TEMPERATURE (OF.)
172
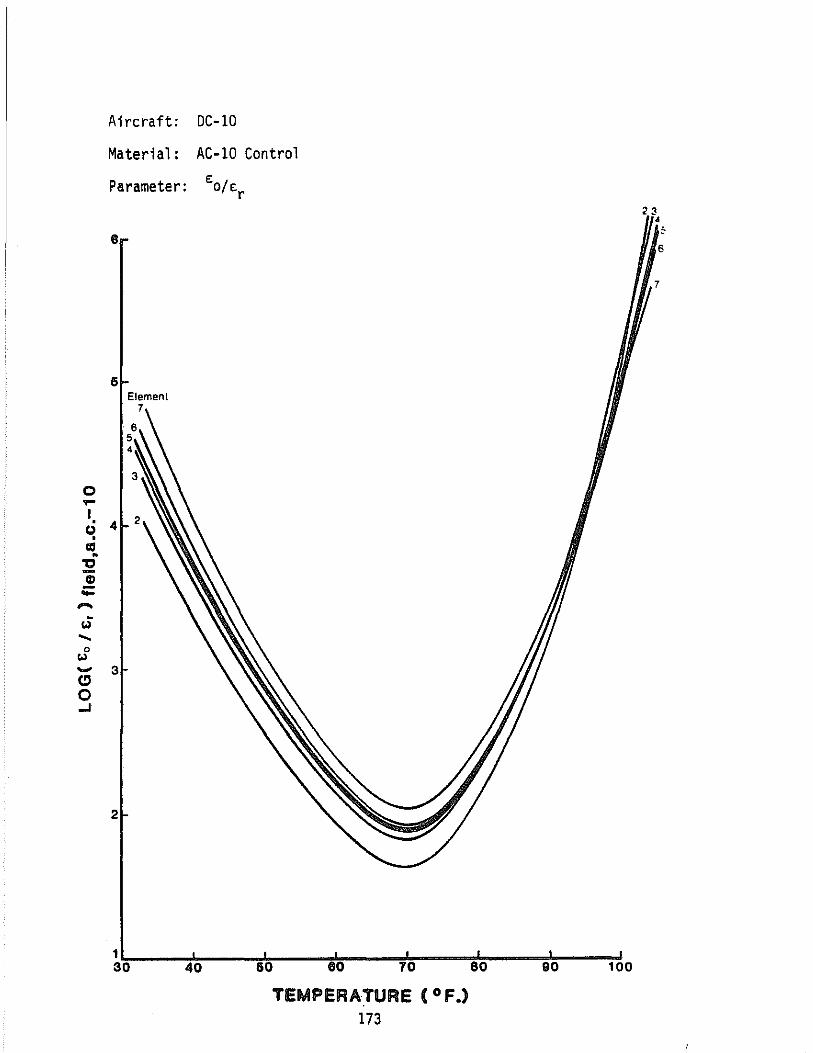
0 .... I · (,) •
III •
!! CD ;: .... ~
\oj .... 0
Co> ..... (!)
0 ...J
Aircraft: DC-lO
Material: AC-lO Control
Parameter: EOIEr
tI
6 Element
7
4
3
2
~~O------4~O~----~6~O----~G*O~----~70~----~8~O~----~90~----~100
TEMPERATURE (0 f.) 173
23 • 6
7

Aircraft: DC-10
Material: ARC-Low
Parameter: Eo/Er 5
~ 0 -I • u • .. •
&II •
:E .!! -,.. ~
I.l .....
0 I.l ..... ~
2
0 ...I
1
OL-~4~O----~50~----~e~O----~7~O~----~8~O~----~90~----~10~O~
TEMPERATURE (OF.) 174
3
2
5
6
7
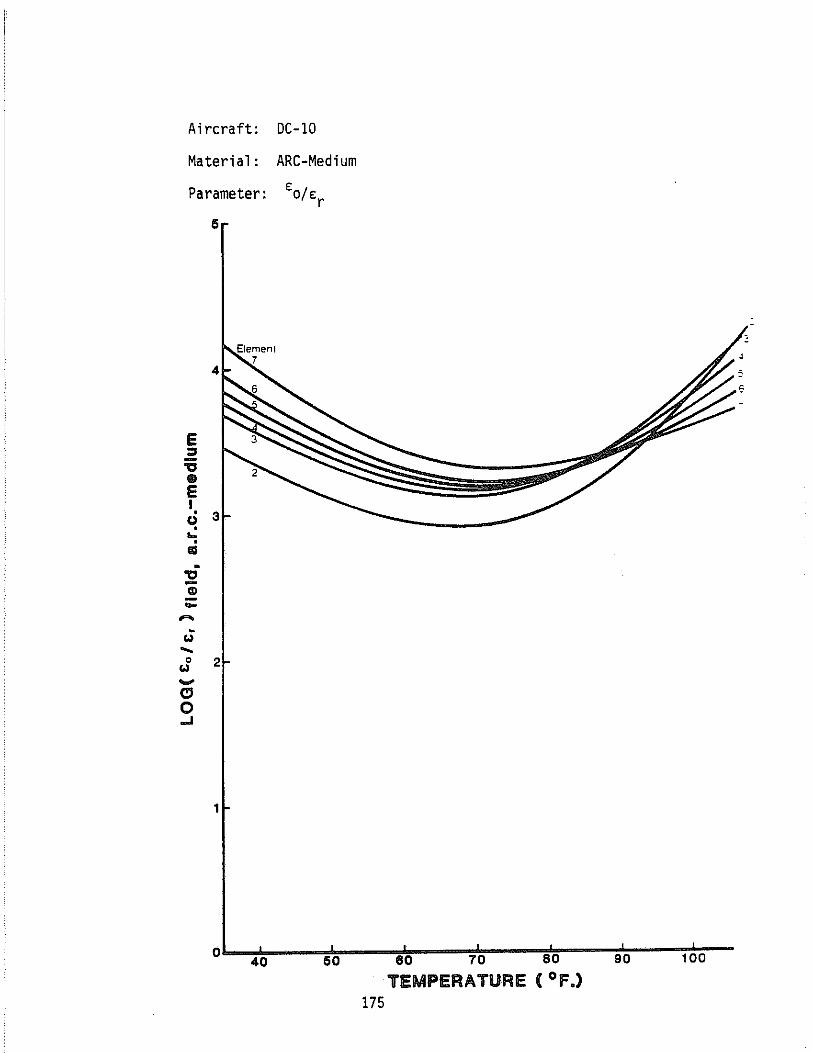
Aircraft:
Material:
Parameter:
e :::I -'tI CD e I • U • .. •
III •
'tI -CD -..... -Co) .... 0 2 Co)
..... ~ 0 ...I
1
DC-IO
ARC-Medium
£0/ £r
Ob--4~O~----~5~O~----~80~----~7~O~----~8~O~----9~O~----1~O~O~
TEMPERATURE (OF.) 175

Aircraft: DC-10
Material:
Parameter:
4
&;
~ 3 &; I • U • ... •
III •
'C
.!! -,... ~
2 w .... Ii ... 0 0 ...I
1
o 10 20 30 40 150 80 70 80 90 100
TEMPERATURE (OF.) 176
2 4
7

0 ... I • 0 •
til •
"0 Q)
:;::: ,... CQ ....
Aircraft: DC-l0
Material; AC-l0 Control
Parameter: i3
0.32
0.26
o.
0.16
0.12
177
TEMPERATURE (OF.)
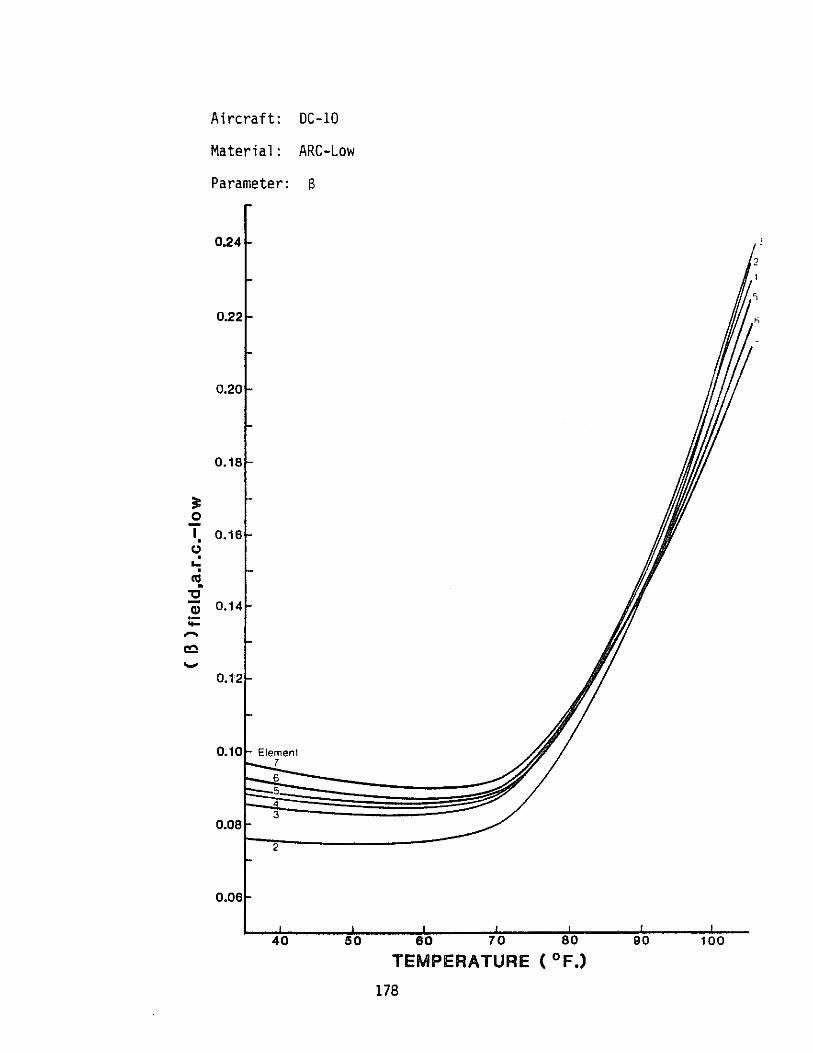
:t o I • (} · .. • 11!.
3:! Q)
;
....
Aircraft: DC-10
Material: ARC-Low
Parameter: S
0.24
TEMPERATURE (0 F.)
178
90 100
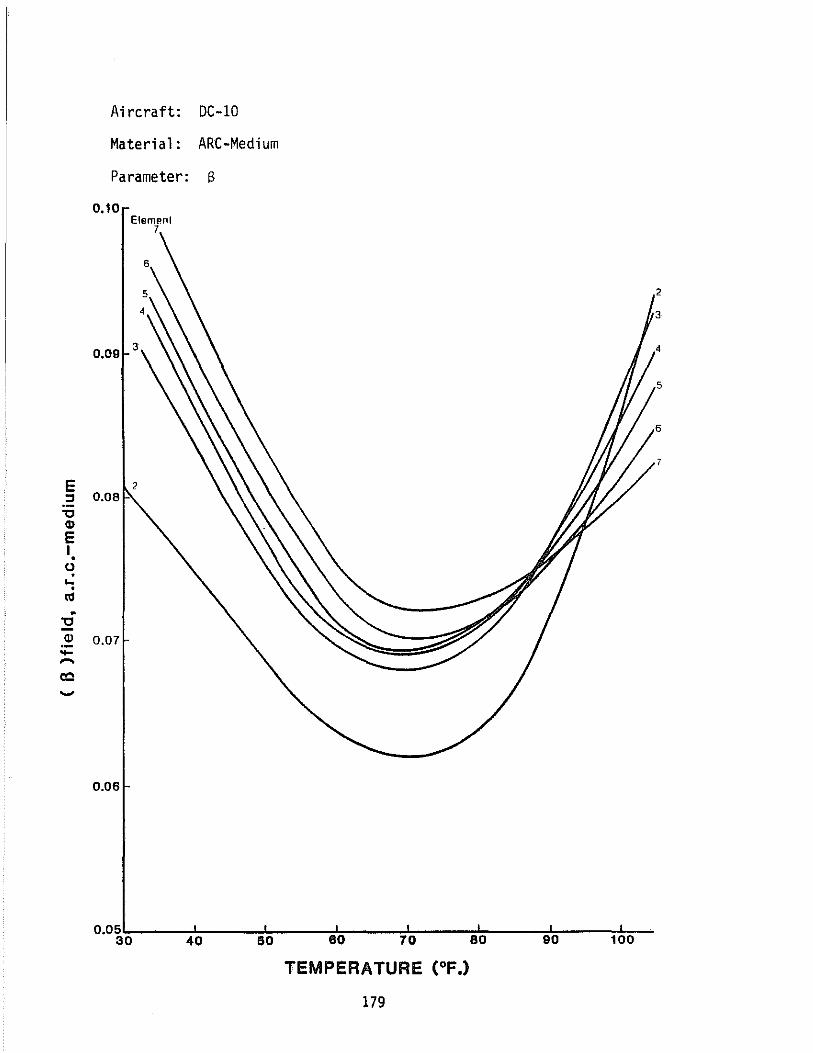
E :::J -0 Q)
E I • 0 • ... •
111
· -0 CIl .--......
CQ
.....
Aircraft: DC-I0
Material: ARC-Medium
Pa rameter: I'
0.10 Elemenl
7
3 0.09
~
0.08
0.07
0.08
0.05~ ____ ~ ____ ~~ ____ ~~ __ ~~ ____ ~~ __ ~~ ____ ~~_ 30 40 150 eo 70 80 90 100
TEMPERATURE (OF.)
179

.r.
.E'
.r. I q ~
.; :!i ., :;: .....
a::>
--
Aircraft: DC-10
Material: ARC-High
Parameter: i3
0.30
0.28
0.26
0.24
0.22
0.20
0.16
0.16
0.14
0.12
Element 7
0.081:0';------------
40 50 eo 70 80 90
TEMPERATURE (OF.)
180
100
APPENDIX E
Summary Of Aircraft Data; And Calculated
Estimates For Tire Contact Pressure Distributions
181
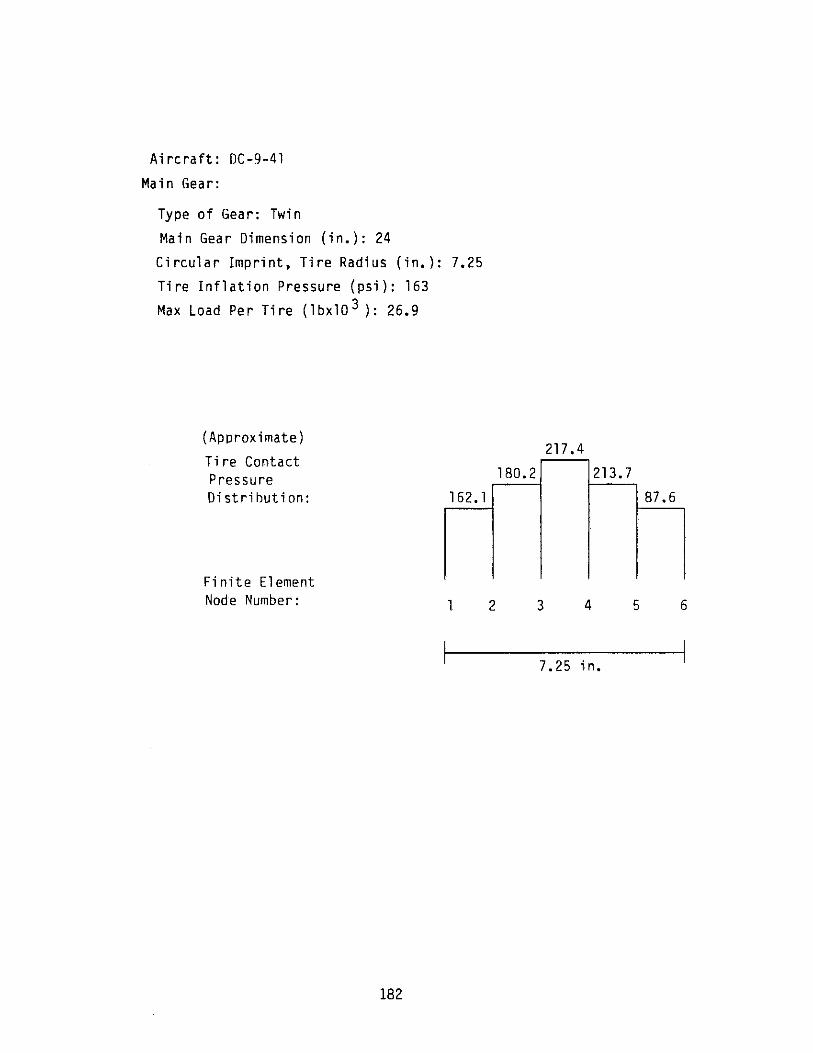
Aircraft: DC-9-41
Main Gear:
Type of Gear: Twin
Main Gear Dimension (in.): 24
Circular Imprint, Tire Radius (in.):
Tire Inflation Pressure (psi): 163
Max Load Per Tire (lbx10 3 ): 26.9
(Approximate)
Tire Contact Pressure Distribution:
Finite Element Node Number:
182
7.25
162.1
2
217.4
180.2 213.7
87.6
3 4 5 6
7.25 in.

Pircraft: DC-10-30 CF
Main Gear:
Type of Gear: Twin-Tandem
Main Gear Dimension (in.): 54x64
Circular Imprint, Ti re Radius (in.):
Tire Inflation Pressure (psi): 185
Max Load Per Tire (lbxl0 3 ): 50.3
(Approximate)
Ti re Contact Pressure Distribution:
Finite Element Node Number:
183
9.30
184.3
247.1
204.9 242.8
99.5
2 3 4 5 6
9.30 in.

Aircraft: B-727-200
Ma in (;ear:
Type of Gear: Twin
Main Gear Dimension (in.): 34
Circular Imprint, Tire Radius (in.): 9.69
Tire Inflation Pressure (psi): 169
Max Load Per Ti re (lbxl0 3 ): 39.9
(Approximate)
Tire Contact Pressure Distribution:
Finite Element Node Number:
184
167.3
1
224.4
196.0 220.5
90.4
2 3 4 5 6
R.69 in.

Aircraft: R-737-200C
Main Gear:
Type of Gear: Twin
Main Gear Dimension (in.): 30.5
Circular Imprint, Tire Radius (in.):
Tire Inflation Pressure (psi): 148
Max Load Per Tire (lbxl0 3 ): 25.8
(Approximate)
Ti re Contact Pressure Distribution:
Fi n ite E1 ement Node Number:
185
7.45
147.3
197.4
163.7 194.1
79.5
2 3 4 5 6
7.45 in.

Aircraft: R-757
Ma i n Gea r:
Type of Gear: Twin-Tandem Main Gear Dimension (in.): 34x45
Circular Imprint, Tire Radius (in.): 7.21 Tire Inflation Pressure (psi): 175 Max Load Per Ti re (lbx10 3 ): 28.6
(Approximate) Tire Contact Pressure Distribution:
Fi nite E1 ement Node Number:
186
174.3
2
233.7
193.8 229.7 94.1
3 4 5 6
7.21 in.

APPENDIX F
Beam Fatigue Laboratory Data For Asphalt
Concrete And· Asphalt-Rubber Concrete
187

APPENDIX F. BEAM FATIGUE DATA
Asphalt-Rubber Low at 340 F
Test Date: 11-B5 Actual Predi cted
Beam E Bending Cycles to Cycles to Number Modulus Strain Fail ure Fail ure
F19L 589400 .0001525 604510 542690
F23L 552600 .0001627 607140 406520
F24L 982300 .0001525 1003590 542690
F26L 468700 .0006394 4440 890
F27L 1171700 .0002557 15490 53670
F28L 901300 .0003325 12740 16590
F30L 937400 .0005115 700 2410
K1 = 4.466 E-12 K2 = 4.476
Correlation Coefficient R=- .93
Asphalt-Rubber Low at 680 F
Test Date: 7-85 Actua 1 Predi cted
Beam E Bending Cycles to Cycles to Number Modulus St ra in Fail ure Fail ure
F8L 124900 .0007196 9080 9100
F4L 153300 .0005864 19950 17400
F1L 146600 .000613 9410 15120
F3L 150100 .0003865 139250 65120
F9L 146500 .0004092 25730 54330
F2L 136800 .0004731 54270 34320
F6L 205000 .0002339 114670 319190
F7L 144200 .0003325 163660 104830
F5L 327400 .000183 1084220 693430
K1 = 1.026 E-6 K2 = 3.165
Correlation Coefficient R=- .91
188
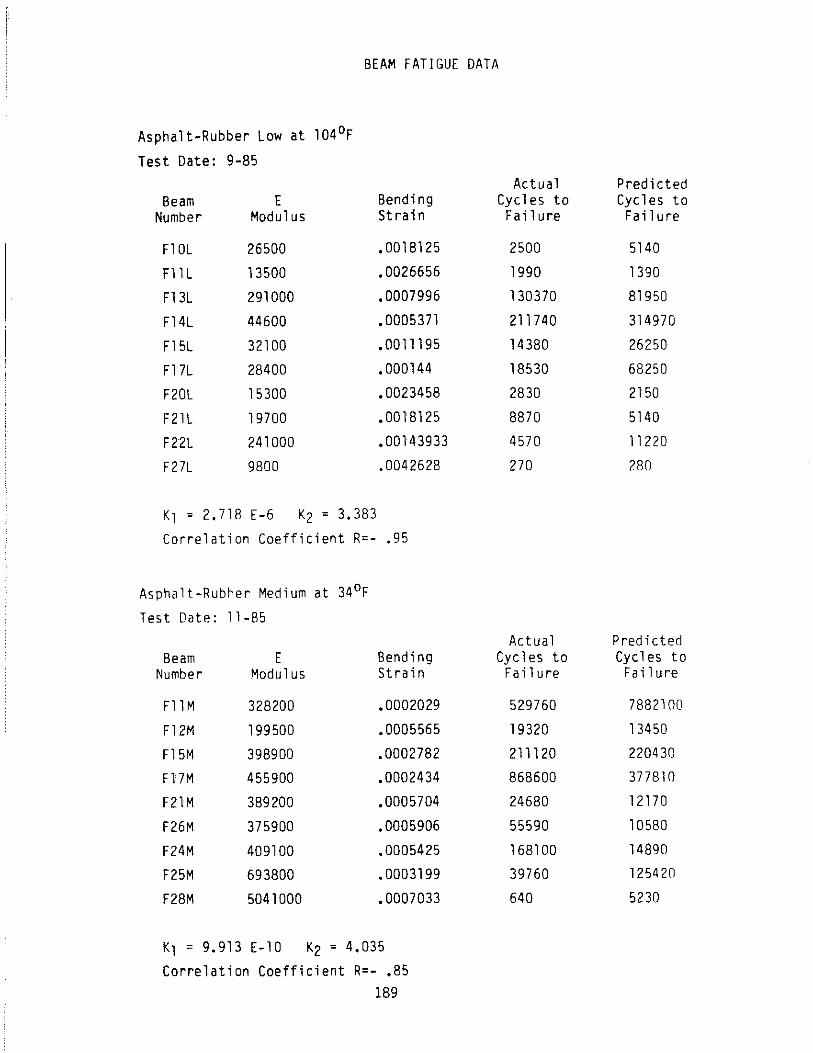
BEAM FATIGUE DATA
Asphalt-Rubber Low at 104°F
Test Date: 9-85
Beam Number
Fl0L
F11L
F13L
F14L
F15L
F17L
F20L
F21L
F22L
F27L
E Modulus
26500
13500
291000
44600
32100
28400
15300
19700
241000
9800
Bending St ra in
.0018125
.0026656
.0007996
.0005371
.0011195
.000144
.0023458
.0018125
.00143933
.0042628
Kl = 2.718 E-6 K2 = 3.383
Correlation Coefficient R=- .95
Asphalt-Rubber Medium at 34°F
Test Date: 11-85
8eam Numbe r
F11M
F12M
F15M
F17M
F21M
F26M
F24M
F25M
F28M
E Modulus
328200
199500
398900
455900
389200
375900
409100
693800
5041000
Bending Strain
.0002029
.0005565
.0002782
.0002434
.0005704
.0005906
.0005425
.0003199
.0007033
K1 = 9.913 E-l0 K2 = 4.035
Correlation Coefficient R=- .85 189
Actua 1 Cycles to
Fa i 1 u re
2500
1990
130370
211740
14380
18530
2830
8870
4570
270
Ac t u a 1 Cycl es to Fai 1 ure
529760
19320
211120
868600
24680
55590
168100
39760
640
Predi cted Cycles to Fail ure
5140
1390
81950
314970
26250
68250
2150
5140
11220
280
Predicted Cycles to
Fa i 1 u re
7882100
13450
220430
377810
12170
10580
14890
125420
5230

BEAM FATIGUE DATA
Asphalt-Rubber Medium at 68 0 F
Test Date: 6-85
Beam Number
F8M
F1M
F5M
F9M
F2M
F7M
F6M
F4M
F3M
E Modulus
221000
731000
39500
46000
75800
145700
87600
67200
85100
Bending St ra; n
.0030919
.0009002
.001688
.0010128
.0003515
.0001828
.0003547
.0003965
.000313
Kl = 3.156 E-5 K2 = 2.822
Correlation Coefficient R=- .98
Asphalt-Rubber Medium at 104 0F
Test Date: 9-85
Beam Number
Fl0M
F13M
F14M
F16M
F18M
F19M
F20M
F22M
F23M
F25M
E Modulus
35500
17100
14300
26300
18000
18900
10500
22500
28200
26300
Bending Strain
.00225081
.0010406
.0018568
.0008437
.0009843
.001688
.0025322
.0007875
.0007875
.0008437
K1 = 2.823 E-6 K2 = 3.469
Correlation Coefficient R=- .85 190
Actual Cycles to
Failure
680
7340
1780
8030
140350
1766120
92720
130000
449560
Actual Cycles to Failure
4190
15460
13780
37990
413700
6770
3070
358790
81470
327930
Predi cted Cycles to
Failure
380
12460
211 0
8940
177110
1121570
172630
126120
245780
Predicted Cycles to Failure
4340
63010
8450
130440
76410
11760
2880
165720
165720
130440
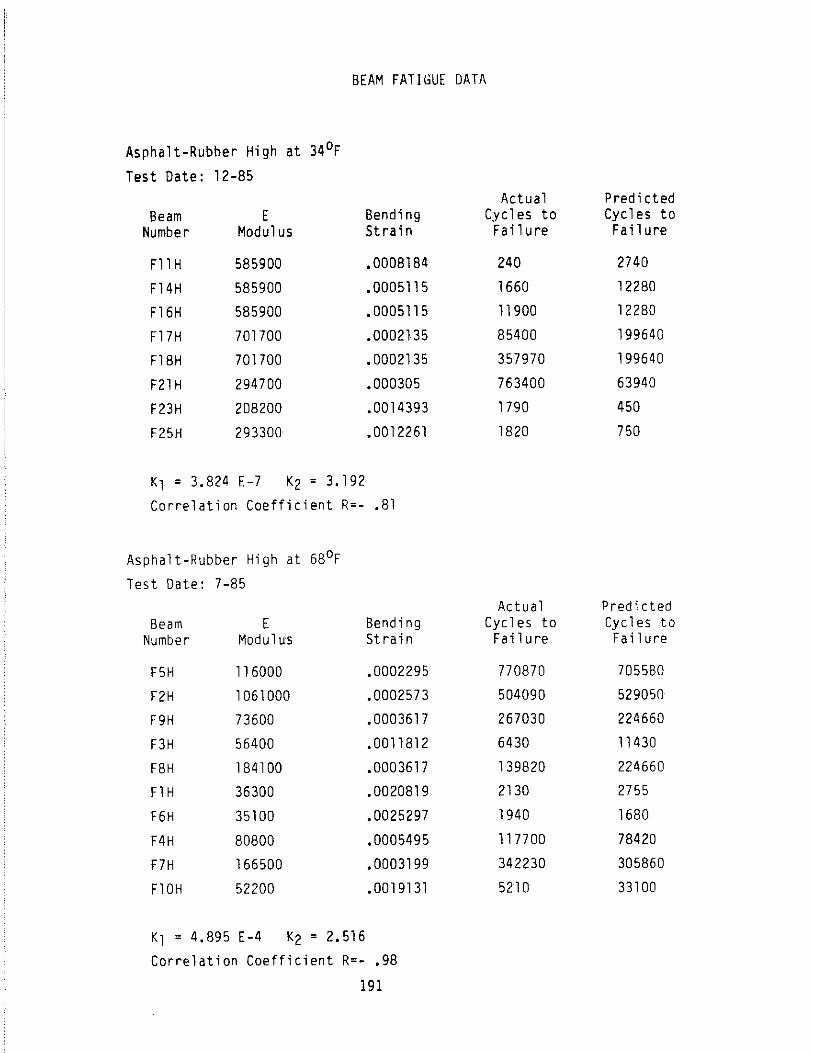
BEAM FATIGUE OATA
Asphalt-Rubber High at 34°F
Test Date: 12-85
Beam Number
F11 H
F14H
F16H
F17H
F18H
F21 H
F23H
F25H
E Modulus
585900
585900
585900
701700
701700
294700
208200
293300
Bending St ra in
.0008184
.0005115
.0005115
.0002135
.0002135
.000305
.0014393
.0012261
Kl = 3.824 E-7 K2 = 3.192
Correlation Coefficient R=- .81
Asphalt-Rubber High at 680 F
Test Date: 7-85
Beam Number
F5H
F2H
F9H
F3H
F8H
F1H
F6H
F4H
F7H
Fl0H
E Modulus
116000
1061000
73600
56400
184100
36300
35100
80800
166500
52200
Bending Strain
.0002295
.0002573
.0003617
.0011812
.0003617
.0020819
.0025297
.0005495
.0003199
.0019131
K1 = 4.895 E-4 K2 = 2.516
Correlation Coefficient R=- .98
191
Actual Cyc 1 es to
Failure
240
1660
11900
85400
357970
763400
1790
1820
Actual Cycles to
Fail ure
770870
504090
267030
6430
139820
2130
1940
117700
342230
5210
P red i cted Cycles to Fail ure
2740
12280
12280
199640
199640
63940
450
750
Predicted Cyc 1 es to Fai 1 ure
705580
529050
224660
11430
224660
2755
1680
78420
305860
33100

BEAM FATIGUE DATA
Asphalt-Rubber High at 104°F
Test Date: 10-85
Beam Number
F12H
F13H
F15H
F19H
F20H
F22H
F25H
F26H
F27H
F24H
E Modulus
21800
20400
16500
9400
24600
15200
41000
16500
15200
17300
Bending Strai n
.0016526
.0023456
.0021857
.005177
.0019458
.0015726
.005331
.0021857
.0010487
.001386
K1 = 1.020 E-4 K2 = 2.948
Correlation Coefficient R=- .90
Asphalt Concrete Control at 34°F
Test Date: 12-85
Beam Number
F20C
F21C
F22C
F23C
F25C
F26C
F27C
E Modulus
435500
638300
531900
569900
1314100
1489300
785600
Bending St rai n
.0008156
.0003478
.0004173
.0001947
.0002365
.0002086
.0004521
K1 = 1.428 E-6 K2 = 2.920 Correlation Coefficient R=- .62
192
Actua 1 Cycles to
Failure
22080
6760
5430
510
2450
11650
620
27220
111 050
21050
Actua 1 Cycles to
Fail ure
470
97130
127640
469280
6590
15510
3700
Predi cted Cycles to Fai 1 ure
16290
5800
7140
580
10060
18860
520
7140
62280
27360
Predicted Cycles to
Failure
1490
17990
10560
97770
55470
79940
8360

BEAM FATIGUE DATA
Asphalt Concrete Control at 68 0F
Test Date: 8-85
Beam Number
F6C
F9C
F4C
F5C
F8C
F2C
F7C
F3C
E Modulus
133900
170400
151200
187500
119700
104200
117200
171500
8ending St ra in
.0004476
.0002813
.0003964
.0003836
.000601
.0006906
.0005115
.0002796
Kl = 9.475 E-12 K2 = 4.687
Correlation Coefficient R=- .95
Asphalt Concrete Control at 104 0 F
Test Date: 10-85
Beam Number
FlOC
Fll C
F12C
F13C
F14C
F16C
F17C
F19C
E Modulus
4500
7000
8200
7700
10900
7200
6600
11700
Bending St ra in
.0079965
.0037946
.0032325
.0023069
.0016317
.0024757
.003373
.0007593
Kl = 3.209 E3 K2 = 2.348
Correlation Coefficient R=- .89
193
Actua 1 Cycles to
Fa i 1 u re
32530
710110
56200
181800
9120
11100
17950
301300
Actual Cycles to
Fa i 1 u re
1080
520
1050
6970
9940
3040
16100
148900
P red i cted Cycles to Fail ure
47350
417330
83630
97520
11890
6200
25320
429280
Predictej Cyel es to
Fa; 1 ure
270
1550
2260
49100
11270
4240
2050
67940

APPENDIX G
ILLIPAVE Damage Results, With Descriptions
Of Calculations For Combined Traffic Damage
•
194

APPENDIX G. ILLIPAVE DAMAGE RESULTS, WITH DESCRIPTION OF
CALCULATIONS FOR COMRINED TRAFFIC DAMAGE
The printouts in this Appendix summarize the damage results of the
ILLIPAVE analyses performed for this study. There are 16 printouts, one
for each combination of the four climatic zones and the four materials
tested. Each printout shows the resulting damage when each plane was
considered as making up the total traffic number, and the resulting
damage after the combined traffic pattern containing five aircraft was
accounted for.
Table 18 in the text summarizes the numbers of aircraft passes per
day at the critical point in the pavement for each ai rcraft type during
each year. In order to calculate the damage due to the combined traffic,
the numbers of each aircraft had to be made cumulative for each year.
Then, for each year, the percentage of the total cumulative traffic which
each aircraft represented was calculated. This percentage appears in the
printouts in Column A labeled "~ of Total Traffic". The traffic data in
this form are shown in the table preceding the damage printouts.
The ILLIPAVE program calculated the damaqe index based on laJora~0'v
fatigue conditions and the rut depth which could be expected ~veri j~!'
if all of the trilffic had been made up of the same aircraft, ~nes~ oro
shown in the printouts in Columns Band D, which are labeled "Damage
Index - Total" and "Rut Depth - Total ". Multiplying Column A times
Column B gives Column C, which indicates the amount of damage index,
which that aircraft contributed in that year to the combined traffic
damage index. Multiplying Column A times Column D gives Column E, which
indicates the amount of rut depth which that aircraft contributes in that
year to the combined traffic rut depth. Summing Column C for each
aircraft for any year and dividing by 13 gives the damage index due to
the combined traffic for that year and adjusted from laboratory to field
fatigue conditions.
gives the rut depth
Summing Column E for each aircraft for any year
due to the combined traffic for that year. These
sums are shown on the second page of each printout next to "All Traffic".
195

Cumulative Critical Passes Per Day of Combined Aircraft Traffic.
OC-9 OC-1O 8-727 B-737 B-757 Total
Year Number % Number % Number '!; Number '!; Number % Number "f.
1 61 100.0 61 100.0
2 116 100.0 116 100.0
3 148 94.9 5 3.2 3 1.9 156 100.0
4 162 84.8 17 8.9 12 6.3 191 100.0 ..... <0 5 109 75.4 32 14.3 23 10.3 224 100.0 '"
6 174 63.5 65 23.7 35 12.8 274 100.0
7 177 57.8 86 28.1 43 14.1 306 100.0
8 181 52.8 110 32.1 52 15.2 343 100.0
9 185 48.2 137 35.7 62 16.1 384 100.0
10 191 43.3 174 39.5 76 17.2 441 100.0
11 198 39.0 218 42.9 92 18.1 508 100.0
12 206 35.2 269 45.9 111 18.9 586 100.0
13 210 31.5 335 4fUl 135 19.7 686 100.0
17 251 22.9 1 0.1 1110 55.6 234 21.3 1 0.1 1097 1 00 . I)
20 267 18.6 9 n.1i R42 58.6 312 21.7 B 0.5 143B 100.n

lllNI, ; MA lE." 1 (\1. :
W..;.t. 1·:I ... ·~~ZI···
(:,[; :10 Cunt.1" Cl'1
I'LANI:. t)( .. ()~,\
I)r; :I 0
:I 4
10
n:A" .[
I '.'
•. .1
6 , .'
:I
4 , . •• J
A Z of'
TO I • rRAf " '1 ,,000 !.oot) 0.'11"1 0.<'1411
B UAMA(it: tot n I
"/ ~ ,S:·~L" -o:~~ J..4:;1,~()l
J " 'J~.'" -- ():I ) •. .5'':::_ '0 I
0 .. '/'~',4 :.?" ~J(JF:" 0 J O.f.,:\~; . .').4,,1: .,,)! I)" ~')J<I :;-'" fJ3L "P] 0.:)2/ 4.:!91:"()\ O.4U;' 4,,80E.01 O.4.n 5. ::; 11,>0 I () . J 'I () (). :,0 :·.:d,· (,\ 1 O.\:·,J 7.:\·)b>Ol 0" :.11::, H. :',/f" 0:1 O.V'I 1.410,100 0" 1 1:::6 :1" U()L. t·OO
1.. of I)r-\I'IAGE 1 In • Tr,:AF Lui.,,·1
0.0(1) O.O()O 0.000 0,,000 0.000 O.(lOO ().,ooo 0.000 0 .. 000 O~(iO(>
0.000 0.000 0.000
C D E 1 ND[ X h'I.1'I lH.Y I H
total J,,67l··07 ~.~9~O] ~.49l-01
I. '~':",I:-O.l. 6.~!~11:.-()1. 6. L'I:.·' 0.1 ) U~.-,F··01 (),,()~'.L-()·! t-,,,:.I,()~·-O·J
;:>"O.h '()1 6.'/~)1·:·()! :,.B'): 'I)J
;.' ) rl. .. ·0:1 /,;.')"-OJ :""l,4f 0] '.1.., 17!- ·01 /.5:JI" 01 :t,,:.;I.I· '(j!
;-'.;:>.11.. ·0:1 i.U()I·(" 4,,:JII. 0:1 ;·~,,:;)6r .. O! n.O:~b:·OI 4.:!,:1I··()J ;;',,:IH .... OJ H.:?lL. 0:1 :.,,~";:I 0:1 :~ •. .l'i"1:·()1 ),401,0] ? ~jnF .() I. :.',. /01:····0:1
,'"2 .. 'F"() I. J.4f,I. ... ·0:l JNDD "to;'.::!-I ~~~ 0.001: I'O() O.OOl.+(lO 0.001' ,Oil o . (AiL.: 00 () • ',)0 Ie -+- 01.) O.OOf+OO 0" 0':.'" :·00 o. 00L .~ O() (i,nnL:OO 0.001. +00 ()., O()I: iOn 0.001.100 0.OOIC.100
n.5HE'()IL7}1 OJ. H.Y::'L'Ol :1,41'.1:. OJ 'I.)HI:·OI ,LJ7r::· III 'i , 7 OF 0:1 :1" 0 (, t= .. I) 1 1. I.n +00 2.,: . ..71'{)) 1 ~'.~)I.:IOc' ~~, ;-'?I'··(lj
IWT DrYT" total "1.(.-1 .. ",1'''<1.
O. O()I, +00 0.001.-+00 0,001::'00 0" 001-,' 00 ()" 001: .. +()O 0.001.+00 O.OOl+OO 0. OOf. '1·00 (). OOt, 100 0" OOf. '00 o ~ 00:. (,00 (>.001 '00 0" OOi:. 1·00
O~OOl 4ft311:.-+()O i,,,~1jt "O~1 : .. 1,.:)01:+0(.1 :" .. :·_)DL'~O~!' (I. 006 ~. /,7L : on :1.40\:,,02 )" 4n.10() I." ',2jl: .. ()~!
%, uf l.!(,f1A(il: lNDI::A: I~tn IJI: "" H 1m. Tf~AI'. t,ot.."l totaln:: tDt.al tot",nX
0.000 O.OOF+OO O.OOl{OO 0.000 O.OOE'OO O.OO~+()O O.O:I,:) :L ~"/L··(il L:I 41.:--02 H • ."H, OJ ;.>. B~;r·,O;'! ()" 08'; 4 •. iJI::>·() I. ,5, 8?r:-o;·~ ? :131::.'() 1 H" :WI:. ,OJ (),,'14.,~ ~.I"ln"Ol I.:\~'I:·();-' 1,',6t:rO:l :i.,\BI.--OJ O.?3/ 6.271.-01 1.49[-0! 1.02L+()O ).41r .. ()j
U.:'Ul ',.'.00101 J ,,'n'l OJ :I ,,()41 ':(l(! ~).'/!,r·(lJ o.:ln 7.f:l4F: .. Ol 2,,~·;:·)I::"·()J L,)HI:IOO \'';'.;(: .. OJ On:~~'j) B,,/nr:···()1 ~~,,],~!I:'-'O] 1 ~11E':OO :_·'"Y~.Jr "(>:1
O • .j9~) .l..OJH·()() .L?lll:.·()J 1..151:(10 4":"LOI (],,4;'''/ :1 ,,:iM+(lO 4 ,,','CI:' 0:1 1.:I'il'+(,il ';,.111: ()'I
O.4~:jY 1 .. ~41'+()() ,~".I2,1. ,01 1.·?4F+()O :,.,,',''>' \"1 O.4UB l.:;,/L+()() 1'"(,6\ .. ·01 l.;'''/L·\OO f,,!,H 'Or ().~56 2.~8l.()0 1.44~+0() 1.4Y~+UO H.~Ol()J ().~j86 3.401.+()() j ,,'J'?LlOO 1.621:+00 Y.48l 01
197

A B C D E 7- of DAMAGE INDEX I~LJT DEPTH
PLANE YEAI~ TDT • TI,AF • total total*% tot.al tot-a 'U,:' 1~"-737 1 0.000 6.4'iE-02 O.OOE+OO 4.89[-01 O.OOE+OO
" 0.000 1 .. 2~~E' ~~O 1 O.O()E+OO 5 .. ~j2E-Ol 0.00[+00 <.
:5 O.()19 .I .• 66E'-O 1 3.15E-0:3 ;:;. 88E -()1 1. UE--02 -4 o. 06:~ ::> .. O::IF --0 1. 1. 2UE-O~' 6.16E·"Ol 3. BBE-'()2 ::; 0.10:, 2. :.lO1~ -.. 01. 2 .. 45[.·--02 ('.39E>01. 6. ~'j(lI::"02 6 0.1.28 2,,'11[ .... 01 ~l .. nr.:--02 6" ;H.-Ol 8,,:::i9["'O::~ J 0.141 ' r,L'f:' 0 1 4 • ~:'j'iE--02 (,. 'lOE--O :1. 9. nE -o:;! .' ,~ .. .:..d _ .... . .
f;j O. ] ;:;;~ :L 6~)r:: -()l 5 .. ~J4E'-()2 7.10E-01 1. .. OU[·-O j 9 O. I. (, .l 4. OHE"O I. b" ~-j7l'-02 ./. 3.lL--O 1 1. HlI:::-O 1
10 0 .. 1 ~i'~.~ I, "i,'iE: -0:1. 8" 07[--O:~ 7" !:j'7L -0 :1. 1. .311:"·OJ 1 J o. HII ::i. 401::: ··01. 'i" JtIl~"O;~ 7.89E·()1 1 ,,"::\f.::-·!) 1
12 0 .. 18'/ 6 .. 23L-Ol :1 .113E--Ol B.21.L-O:l. 1. ,,!'/;jf:: .-. 01 1,1, 0.1.9; ).2'1E"OI. J .• 441:: "().l U • ;iBI'::-() l 1 • (, '.)1:.: -- 0 .l
L' O.2:i3 'J. .. 20L+OO 2.~j6L--O:l. '7.9 /,E-OJ. 2" 12F:--O 1 20 0.21/ J.::iHE+O() 3.4,3E-01. J. .OOEH)O 2. :l!:d: --0 1
'" of l)M~AGE INDEX I·Wl Ur.YIH I.
YEAI~ TDr • n;:AI'" • totdl l~otaU:% ~Clta 1. t.ot d 1.:( l.
B···/5'l 1. O.O()O O.O()[+OO o . () () L';()O r,
0.000 O.OOE+OO 0" 001,+00 .:. ~~ O.OO() 0.00[+00 0.001".+00 4 0.000 O.OOE+OO O.OOE+OO ::) 0 .. 000 O.O()F+(l() (l.OOE+OO
6 0.000 O.O()[+OO O.OOf::+OO 'l 0 .. 000 O.O()[+OO O.()()E+OO U 0.000 O.OOE+OO O.OOf::+()O
'i 0.000 O"OOE+OO O.OOE+OO 10 0.000 O.OOE+OO O.OOE+OO 11 0.000 O.OOE+OO 0.00[+00 1 ''> ()"OOO 0.00[+00 O.OOE+OO
L.l O.O()() O.OOE+OO O.OOH·O() 11 0.001 1. (,71::+00 1. .b7E--·O.' L~6E+OO 1.2M:--O.5
20 o. ()O~j ;'.'. 20[ +00 1.lOE .... 02 1.36E+O() 6.80E-03 7- of f)MAGE INDEX fWT DEPTH
YEAR TOT, ·II\AF. tot. ,':%/13 tota'l.*% All. 'II' .. +'. .I. 1 .000 ::;.86E-03 5.49E-()l
., ,- 1.000 1.1~'[""()2 6.22E-01 .. .1 .• 000 J..54E-O~ 6.6'>'E-·01 .J
4 1.000 1 • 'J~'JE--O:'>' 'l.1.1E--O:1 I;: ,J .1..000 2. :.I!:lE .. O~ 7.4BE-01 6 J .000 3.10l--02 8.08E·-Ol ; 1.000 ;\ .. !:j7E"O:~ !:l.4H:--01
B 1.000 It .101:::--,02 8./61::--01
9 .1..000 4. /OE--'02 9.1:lE-01
10 1.000 5. !5:?L ·-02 9. ~j5E--O 1
11 1 .000 6. 4,9E -02 1.00E+()O 1 ~, 1 .. 000 7.62E·-02 L 05E+OO .-U .l.()OO 9.071:,,02 1.11E+OO
17 1.OO() 1.:)6E-01 1.301::+00
20 1.000 2.10E-01 1.43E+00
198

llJN~~ : Wet I-rl?~:'::.;o
MATERIAL:I~l.
I. of D(')MAGt J.lml::.X IILfl !.Il:YTII F'LANI,~ Y I,Af< rill .. 11@ totdl total'7. tot,ai. tot,~ 1 :.:;~ [)C-O~' J 1.000 ::.~ .. ()::~E ··-O:·! ? .. 02E·-02 1.ObE·01 1.06L·-0:1
') .. '" 1.000 ,5.841::,"-02 ,~. 84l-02 1 • 66b: -0 I. J. • f> 61: 01 ::l 0.94'1 ~j. ) 71:. ·-0;·) 4 .. '10l:·O~'. ~' .. O;:~r: -01 l .. ~·lL OJ 4 0.0411 6 • .5..5l ·02 5.37E-02 ~' •. SOl-O 1. 1 • Y~"L --0 I ~ o .l~,4 '1.4:·~E·O:·~ 5 .. bOI:--02 2. ~j4E:'()1 1.'12f..-OJ b o . b ~·S~:·; 9.08E-·02 5.76E-02 2.881::-01 J. • f-j,IL ·0 J
;' 0.5'78 1 .OH:--01. 5. 8bE -O~) 3. 08E -·():I 1.'78E-01 8 0.52/ 1.14E-01 5.99E-02 3 • .50E-01 I.. '74E -01 c,> 0.48~) 1. 27[·-01 6.13E-02 3.::i2E-01 1.'10[--01
10 0.43.5 1. 461:-01 6.33E·()2 ..5. 8~~t:-0 1 1.6~)I:·-Ol
11 0.390 1.68F-Ol 6. ~J6E--02 4 .1~jE--Ol 1 .. 62[:-01 1 ') "- O • . 3~j2 1.941::-.. 01 6.8.5[--02 4. ~:jOb:"O I. L~J8E-01
13 O.~H::; 2.27['01 'l.16E-02 4.91L·-01 1 • ~;:,[ ·-0 1 11 0.229 3.74E-·01 IL ~j'lE -·02 6.431:·()I. 1.4'7E-01 20 0.186 4 .. 93E-01 '1.161:--02 'l.42E-Ol J .. 38[.-01
7. of DANA[J[ INDEX l~lJ r DE:F'rH YEAR TOT. TI\(.lF. tot,)' t.ot a 1. ,:% 1.01.,,'1 t.eJl iJ 1 ,(7-
DClO .l 0.000 1.12[··01 O. OO[ H)() 2 • .I.J.E-·01. O.OOl+OO '" 0.000 ~'. .141:: .. ·01 0.00[+00 3.22E-01 0.00[+00 ,. 3 O.()OO 2.8'110-·01 O.OOF.::+OO 3.0/1'::"'01 O.OOE+OO 4 0.000 3.52E-0:1 O.OOE+OO 4.3'i'E-01 O. OOE·J 00 ~ 0.000 4. J.31:: ·01 O.OOL+OO 4.83E·-()1 O.OOL+OO 6 0.000 ~j. 05[--01. O.O()[+OO ~j.441:··01 O.O()~+OO
'7 0.000 :.:i.64t::--Ol 0.001:+00 :':;.80E·--01 0.00[+00 tl 0.000 6.3~'.E-O:l. 0.00[+00 (".201:-01 O.OOE+OO 9 0.000 'l.on·01. O. c)OE+OO 6.61E--OJ. O. OOl: +00
10 0.000 8.1 ~'.[·-Ol O.OOHOO 7.14[-01 O.OOE+OO 11 0.000 9.3::;I::--Ol 0.0010+00 '7. nt--01 O.OOHOO 1 ':, 0.000 1.08E+OO O.OOE+OO B.35[-Ol O.OOE+OO 13 0.000 1.26E+00 O.()OE+()O 9.09E·-()1 O.O()E+OO 17 O.OOJ 2.08E+OO 2.08E-03 1 .18E+00 L18E-03 20 0.006 2.74E+00 1. 64E-02 1..351::+00 8.0'/10-0.3
I. of' DAMAGE INDEX RUT DEPTH TOT.TRAF. t.ot.al totalr./. t.ot M 1 t.otal*X
B-n'l 1 0.000 4.9'7E-02 O.OOE+OO 1.39E-Ol 0.00[+00 2 0.000 9.451':-·02 O.OOE+OO 2.16['-01 O.OOl+OO 3 0.032 1 • ~~7E -·01 4.06E-03 2. 62E --01 8. 37E-0;~ 4 0.089 1.~;6E-Ol 1. ~mE·02 2.97[·--01 2 .. 6~jE-02
" ,J 0.143 1.82[-·01 2.61.E-02 3.28E-Ol 4.69[-02 6 0.237 2.2:S[-01 5.29E-02 3./11:::,01 8.'7YE02 '1 0.28:1. ~.'. 49E'Ol 'l.OOE-02 3.96E-01 1.111:'·-01 8 0 • ..521 2.79['01 8.97E-02 4.24[-01 1.:~6E--01
c,> 0.3~,'l 3.13E·-01 1.121:-01 4.53E-01 1.62[·-01. 10 O. 39~j 3.591::'-01 1.4~E-01 4.90E-Ol 1.'/4E-01 11 0.42</ 4.141::-'01 1. n[-01. ~.31[-O1 2.28E-Ol 12 0.45'7 4.1'/[-·01 ::'.191::-01 5.7::;E·01 ::'.641':--01 13 0.488 5.59E-Ol 2.'73E-01 6.2'lE-01 3. OM ·-01 1/ 0.556 9.20£-01 5.121:-01 8.18E--01 4.551::-01 20 0.586 1.21E+00 7.10E"·01 9.41E-01 5.51l·-01
199

i. of DAMAGE INDEX RUT DEPTH PLANE YEAR TOT.TRAF. tot.al total*% total tot.al*% 1!,-7,5 ! J 0.000 1.40E--02 O.OOi:+OO 9.22E-02 O.OOE+OO
" 0.000 2.67E·-02 O.OOE+OO 1.45E-01 O.OOE+OO <.
~~ 0.0J.9 3.5'/E-02 6. B:~F. --()4 1..771::·-01 s. ~~6E .. ·0.l , 0.063 4" 40E· .. O:·.' ~~ • '/7'1: "uO~'5 2.0IF·-OJ. j • ~)7E··(): •. ' 't
~~i 0 • .1.0,5 :..:i. I,sE .. 02 ~. ~H [·0.1 :'.23E·O.l. :~. :lOE·();c " O. j:·~U {;. :5:1I:>O~.' B.O'/[·-·O;1 ;;~,,53F-Ol ;'. .. :, 4 I",· () 2 0;;,\ .. ,
0.1.41 7.041::"02 9 .. <}JL -·0:5 ~'./li':"()l s. B~'I:·().2 /
0 O. J ~)2 /. H9E·-()2 :I. .. :·'OE,,·()::.' ::. 'JOE -()1 I; .. 41E"O:~ <} O. Ud 8.041':'02 .1..421:,:,02 ,j.1U:-·()J ::; .. OO[ -0;'>
1.0 (). j n :I..02F-()1 1 • 7~.iE·-·02 3.37F-01 ~i. !l()I:-'-02 11 O • .l.llJ. 1.1./r-:"·Ol 2 .. J. ~~I::-'02 ;l. MI:'''!).I. () . bJE ·-O;.·~ 1. :;.~ 0.189 :t.3!:iE-():1 2" ~:)!jL -.. 02 :5.'17E-01 -, .!)11-::·-02 , 13 O. 191 l ; 5t1i:: .. ·() 1 :5 ... l11:::-· O;~ 4.J5[ .. ·0.l iJ. ~61C:·-()2 1.'7 (I • ~~ 13 2.60[-01 ~.:j It ~j4E·-O::.~ ~L ?lE-OJ 1. .. ;,2E -():l 20 O.2J./ 3.42E-·01 / • 4JE -·02 6. ~YI::"'O 1 1 .. 4:1[-0.l
:1. of l)AMAG~: INDEX I(lJl DI'YTI·I YEAR TOT. TI(AF. t()ta1. totaH,% tOt-d I. total ;;:;;
e.-;~j'7 1. 0.000 3.1J.I::·-02 O.()OE+OO :I. 8:5E _.() 1 0.00[+00 " 0.000 5.92E-02 O.OOE+OO 2.59[-01. O.OOE+OO <.
:1 0.000 /.96[-,02 O.OO[+()O :~. 03E --01. O.OOE+()O 4 0.000 9.75E-02 O.OOE+OO 3 • .37E-01 O.OOI::+()O "' .J 0.000 1. • 14E"·Ol. O.OO[+()O ;5.67[·"()1 O.OOE+()O 6 O.O()O 1.40E·-·Ol O.OOE+OO 4.07E"·0l. O.OOE+OO -; 0.000 1 • ~j6E --0 1 O.()OE+OO 4.3l.E-O:l 0.00[+00 8 0.000 1.75E-·0.1 O.OOE+()() 4. 57E --0 l. O.()()E+()() 9 O.OO() 1.96E--Ol O.O()[+OO 4.B4E"-Ol O.OOE+O()
lO O.()OO 2 .~~5E-Ol 0.00[+00 5. l<}E ·-01 O.OOE+()O 11 0.000 2. 59E-"Ol. O.OOE+OO 5.57E·-OI O.OOE+OO 1. ~, O.()()O 2.99E-·Ol O.OOE+OO !':j.98E--Ol O.OOE+()O 13 0.000 :5 • ~j()E -·0:1. 0.00[+00 6.46E-()1 O.OOE+OO 1/ 0.001. 5.77E·-Ol ~;. '77E"04 8.21E·-01 a.21E-04 20 0.005 '7. 5'lE --0:[ .3. 79E --03 'l.33E--Ol 4.66E·-03
% of DAI'lAGE INDEX fWr DU:'TH YEAR TOT. TI(AF. tot.'.;Z!13 tot. a 1 *%
A I. l Tra f. 1 1.000 J. • 55E ·_·0;; L 061: -0 1 .. , <. 1.000 2. '76E'-0~1 j • <'>61-::,-0:[ ;5 l .000 4.141::,-,0;5 ~~. ()3E"0 l 4 j .000 5.40E·-03 2.34F·-OI ~-oJ 1.0(1) 6.72E-03 L. blE-Ol <'> I.OOO ? • 12E--O:1 3.03[-01 J J..OOO .I .• O7IC:--O:·~ J.2i'E-Ol 8 1..000 1. .241::'-02 3.54E·-Ol <} 1..000 L 441:-0;~ .3.8J.E--Ol
1.0 1.000 1 .• 71E-O~! 4.17E·-Ol 11. 1.000 2. 03E'-0~~ 4. ~j6E"-O 1 12 1..000 ~) 411:"-'0') ',.97E-01 ... • .. 6-
U 1.000 2.89E·-02 !':j. 4bE'-O 1 1"1 1.000 5.04E-02 7.261::-01 20 1.000 6.B9E-02 8.45E-()1
200

lDNI'::: Wet Fre~zl:?
MA1L.RIAL:RM
i( of DM~AGE INDEX IWl D~YIH
PL.ANI::: YEAI~ TO r • II~AF • total ·to La H,i( LO tal tot d 1 :0; lie'O'i 1. 1 .000 1 .181;"-02 1. .WE ·-O;! 1.03[-OJ j " 02.1: .. () 1
" J .()Ot) '2. • 241::~ 07 L. ~'41:::-0L J .• 60L-1) 1. I .• MiL: ·0.1 ,--, -, o ~ 94(/ ;"" 0:1 ~.-O:·.~ ;'. U(,~-02 1. 'I',l'-OJ J " H41;'-O:l 4 0.B48 :5.6')1::.····02 J. l3t::: ·O~! 2.:~lj:: OJ 1.8UL·01 ,.
0.754 4. 32E'0~) 3. :'{,j;:-·02 2.44[:··01 j " B4F--0:l '-' 6 ().6]~-j ~'j. 2YE· .. ·02 :5.. 3bL-·02 ~'./6E·OJ J • /~"L ·0 J 7 0.57B ~j. 91[,-02 :5" 4 :i.E ···()2 ~'. y!;;t; '-():I 1 ./lL--()j
8 O.~:jLJ 6.621:: -02 J.49E·-O:' .5.161:-01 1.661::-·0J 9 0.482 7. 4lE'O::~ 3" ~,7[-O::~ 3.38EOl 1. (,?,L-Ol
10 O.43:l 8.~lf>02 :3" 69E·-()2 :5.661:-,01 1" 50b>01 11 0.390 9.·81 E .. ();.:) 3.B2L-02 :5.96E·Ol 1.~j5[··0:1
1'" •. 0.352 1. UI'::-·Ol 3. <;BL·"02 4.29E-OJ. 1.51.1::·01 13 0.31. !) 1.32['01 4.17L·-02 4. 6BL --in l.41L·-OJ 1J 0.229 2.JHI::-Ol 4.99[-,02 6.1.017-01 1. 40E ·-01 ~~o O.lB6 2. BiE--OJ !;;. ;54L-0~' 7.01lC·01 1.:l0[·-OJ
i( of I)MAGF. INDEX Rur nf::!=' I'H YLAR T(n ,,'! HAl'. tot ;;'1 to'!,,,·!"-!. tot. i'I'1 t.ot.aU/.
DC lO 1 0.000 5. ::i31~~~"02 O. OOf:. +00 1.A~'E"()J 0.001::+00 " 0.000 1. O!',[ .. () J O.OOE+OO ?,,6BE-Ol 0 .. ()Ol: +O() A~·.
:5 o.O()O 1. 42E·_·O 1 O.OOE+OO .s.1. JF-OJ. 0" 001,: +00 ... 0.000 J. 'J3L"'OJ O.OOF+OO 3 .. ~~~JF -() 1 O.OOE+()O ~! 0.000 2.03COI 0" oo!::: +00 .5. 871:·\) 1. ()"OOI.::+OO 6 0.000 ::'..4'ii:-"OJ 0" OO[ H)() 4,,311'-01 (). 00['1 00 / 0.000 2. ltlt:.-O 1 0.001::+00 4. :5/1:>·01 O.OOE+OO 8 0.000 ~l • :t:1I::: - 0 1 0.00['100 4.8~jL-OJ O.OOL+O()
" 0.000 :.I. 4H1':'O 1. 0 .. 00[+00 :5.1.4[-Ol ()" OOt': ,·00 10 0.000 4.00f;-OJ O.OOE+OO ! .. " !:;11::-01 O"O()E+OO 11 0.000 4. 6U:'O 1- 0 .. OOHO{) :5. 'lJT ·01 O.OOl:+OO 1 ':, .~. 0.000 ~'j. 32["OJ O.O()[+OO 6.:54f>Ol (I.O()[+OO
13 0.000 6 • :·~~,t::: .. O 1. O. OOE 1·00 6.84[··O'l O.OOl,-j·OO 1/ 0.00] :1 • on:" 00 1. • 02E.· 03 8.63l-01 !3. <'dE ·-04 20 0.006 1.:.I!::Jt:+OO B.09t::-·O:l 9. 7~'jE -01. !::J. tl~"I,: "OJ
/. cd' DAI1AtiF INDEX !~lIT DEF'lH ruT. mAF. tot,,,; 1 t()tn1.~i( tot;! I. tot.al*i(
[?'-.. n7 1. 0.000 ::!.59E-"02 O.OOE+OO 1.4J[01 O.OOE+OO 2 0.000 4.91E-02 ().OOE+()O 2.17E-Ol. O.OO~+O() 3 O.O:I? 6.62E-02 2.1~'E-·03 2.62f:-·Ol 8.39E-03 4 o .Ot!',> 8.:10[-"02 7.21E-03 2. 97E -'(ll 2.65[-02 c' -, O.l4:l 9. ~jOE --02 1.36[-02 :3. 28l"Ol 4.60E-02 6 0.237 1.16E"01 2.75[-02 3.6<;E-01 8. 7!::J f-:. 02 )' 0.281 l.30E"·01 3.65E-02 3.94E"Ol 1.11F-01 8 0.321 1.461::-·0 J. 4.67['-02 4.21E-01 1. 35f,,'() 1 9 O. :l~7 1.631::-01 5.82E"-02 4.49E-Ol l .. 60E-Ol
10 0.:5<;5 1.87['01. J • 39t: ··02 4.861'::-01 :1 • <; ~!E-" () 1 11 0.429 2.1610'-01 9.24L--02 ~.26E--01 2,,2;:'[-01 1 " '" O. 4~j9 2. 4<;~>-O 1 1..14E·()1 5.68E-01 2,,6J.£ 01 13 0.488 2.91E·-01 1.42E-01 6.18E-01 3.02E-01 \.
17 0.556 4.79E--01. 2.61t::-()1 8.01£--01 4.461'::01 20 0.586 6.31E-01 3.70E.-01 9.19E-01 ::;.38E--01
201

I. of DAMAGE INDEX RUT DEPTH PL.ANE YE.AI~ TOT. TI~AF. tot.al total*% tot.al total"-/. /!'-73/ 1 0.000 8. 2'1E -O:j O.OOE+OO 9.17£-02 O.OOE+OO
2 0.000 1. .50E···02 O,OOE+OO 1.. 43E--01 0,,00[+00 ,5 0.019 2.l21:~"O·2 4.03E-·04 1.74E-01. :.1. ~~OE -·0.5 4 0.063 ~'" 60[ .. -02 1 • 64E-03 1. • 98E ... () 1. :1 .• 25E·-0;' ~;) 0.1.0;3 3.05E .. ()2 :3. 14E·-·03 2.10E··Ol 2" 25E~"02 6 O. 128 3" nE'-()~' 4. TlE-()3 2.47E'-·Ol 3 .. 16[·-02 I 0.14J. 4.16E·02 ;'j. B61::"O:3 2.641::-·0.1. .3. nE-'O~~ B 0" 1. ~)::,~ 4,,66E·()2 7" 09E'-O~~ 2.B3E-()1 4 .. 3()[-O2 '1 O.J.61 ~" 2:~E""O',? B. 40E"()~1 3 • O:~E"O 1 4. 87E-O;~
10 0.172 !:i. 9'lE -.. ():~ 1. O:~E-'O;~ :5. 2BE -O:l 5.63E"02 11 O. WJ. 6.'J.l.E-02 l.2;)I':'·()2 3. 55E -.()l (,,, 4:5[ -o:·~ :1.2 O.Hl'i' 7.'i'7E-02 1 ,Sl [·-02 ~L 8!5E--01 7.2'7E"02 .1.3 O.1.'l1 ? • 3)E -0) J. .. 84E .. ();.! 4. ~~OE'O I. n" :U[-O;' 1/ 0.213 1.!j4f::-01 3. 2;"ERMO~~ ~,,,4BF-O:l. 1.17£"01 :,~o O.~~J./ 2.02['-0.1. 4 .. :3'JE-()~ (;. :50t: .. ·01. 1. :371':-01
I. of l) Af'1 A G I:: INDEX FWT DEf"TI-I YEAII roT. I'I::AF , total tota 11'7. to t d I. t,()t"l :.;7-
B-7~)7 1. 0.000 :I..41E-02 O"OOE+OO L~2E-01 0.00[+00 ~~ 0.000 2.6UI:: .... 0? O.OO[+()() ;~ • 061::· 01. O .. ()O[+OO :3 0.000 3.611::--02 O. OO!::·j 00 2.37[-01 0.00[+00 4 O.()()O 4.421::-'02 0.00[:+00 2.61E·-{)l O. OOE H)C) L:- 0.000 ~'j .. :l(lE -02 O"OOE+OO 2.82E-OJ. O.OOE-+OO " (, 0.000 (,. J41': .... O::~ O"OOE+OO 3.1.0E"·01 O .. O()E+OO 7 0.000 /"OB/:-02 O .. OOE+OO :3.27E .. ·Ol 0.00[+00 8 0.000 7.94E-02 O.OOE+()() ;5. 45E·-01 O.OOE+OO 9 0.000 B. B'l[-"02 O"OOE+OO ;).63[--01. O.OOHOO
10 o • (){){) 1.02E-·01 O.OOE+OO :s .13"71':·-0 1 O.OOE+OO 11 0.000 1 .. 18E·-Ol O"OOHOO 4" :l3E--Ol O"OOE+OO J ",l .~ 0.000 1.3()E·-·Ol O.OOH·OO 4.41E-01 O.OOE+()O L~ O.OO() 1.. ~j<"E-"01 O"OOE+OO 4 .. ?3E·_·01 O.OO[+()O 11 0.001 2.6:2.17:"-01 2.62E-04 5.'lOE·"Ol ';:;. 90E --04 20 O. OO~j 3.44E-01 :I. .721::·-·03 6.63E>01. 3. 32[ --O~~
I. of OAMAGE INDEX RUT DEPTH YEAR TOT" TI~AF .. tot. ·:,1.11:1 totnP;%
A L I. TrM' • .l I.OOO 'r. O('E -.. 04 1. .031:::-,01 -, l.OOO J.72[--03 J.60/::,,·01 L
,) J..OO{) 2. :~'iF-()3 1. 'l6E·-·Ol i, I.OOO 3.0'iE-·03 2.26E--01 ,~. c, 1. 000 :5.I'rE-OJ 2.~4E"·01
6 1.000 ~,. 071::- .. 03 2. 'l~jE--01 / 1.000 ~j.B8r::-O:l :5. J.YE-OJ B 1.000 6.02E,,·03 3.4~jE--01
'i 1.000 J .. 811::-0:5 :1. nl:,"'o L 10 1.000 '1.31.E·-·03 ".OlE--OJ 11 1 • 000 :I. • 1 Of: -·02 4.44i:C-Ol 1':' 0 .. L 000 1.301:':"-02 4. 8~E·-01 1:5 1.000 1. ~)~E··"02 ::;.32E .. -{)1
17 1.000 2.70[-02 7.03E-01 20 1.000 3.67[-02 8.15E-·01
202

ZUNi: : W"t Ft~e~z.::
f1AHRIAL:RH
X of l)AMM'~. 11~[)EX Ii'ln liEf·'" II PI..ANI-. Yl::AI( TnT .11~AF" tota I tuLal*Y. toLdL t.()t~l n; DL'O'I J 1 .000 J ,,~;:5f.· O~) :L" 331::,-02 1.2'lr_-(lJ J • ~1/,f···Ol
"1 ,. .i..OOO ::~ • ~)~'H~ ···02 ~oo ~j,5L -·O:·! 1.8'lL .() :I. I "tj'iL-Ol '1 0.9.0\9 3.40[-0:) 3.nf.··02 ;:>. ::~n:-():I 2. :1 61:.·() J '-' 4 O.U48 4. I. /1::>-02 :.5 , ::iJ I:' 02 2.57E-Ol ~) " I. llI.. ·0 I " 0.?~4 4.8'11:-02 :',.68E02 ~~" !l:~b.: -O:J ~) • :I :.'1. . () :1 .J ,
().63~ :.i. ?UF::·O~l :5. !'iF .-()~) :,. U,I::-·Ol ~'" 0 U>O 1 i)
} 0.~j7!l 6oo(J7E-O~; ;5.06E·_·O:) ~~. 36/::-():1 :i.(>'4~·-()J
8 () • :j21 7.4HF·0?' 3.,9410-,02 3. :::iill: ·01. L 8'!L'() J ') o. 4B:~ B.:57E··02 4. 041:"-O~) 3.8H.-O:l l.D4~·():1
10 O.4:~,1 '1.62F·02 4.16l::-0~ 4.1U:·()J 1. ;m,OJ J 1 O.3'!O 1 • .1:1[-,,01 4.32F··()2 4. 4~',1;-()1 1. 73f: ·-0 J 1',' O.,\~j:2 1.;~BI::-Ol 4" ~jOE"02 4 • 7:3[-0 I. 1.6tll::.·OJ J:~ o . :!.:i. ~M.j 1 • :jOF·() 1 4. 7H ·02 3.:lBE"01 1.(,3['01 .l/ O. '2~.)'" 2. 46L·-0 1. 5.64E-02 6.6:::;1::·-01 1 • ~'; :!.I:-·() 1 20 0.106 ~~'" ?41:-'Ol 6. O:5E '-O~! 7.5'lE··O:L 1 .. 4:LE-()1
% of DMAUE INDEX IWT DEPT fI )TAR I [IT. TRAF. t.ota·1 total*/. tot-a'l totill ;.:%
1)(; -10 1 0.000 OooOOE+OO (). <)Ol,~ +00 " 0.000 0.00[+00 O.OOF+OO ., " 0.000 0.001::+00 0.001: +00 4 0.000 O"OOE+OO O. OOt_ +00 :i O.O()O 0.001::+00 (). 001:: 1-00 6 0.000 0.00[+00 O.OOL+OO 1 0.000 O.OOF+OO 0" OOb. +00 B 0,,000 O.OOHOO 0.001:+00 9 il.O!)!) o ,,()Ol,~ +00 O"OOHOO
10 0.000 0.00['100 0.001:-:'00 J .1 o . O~)O 0" OOHOO OooOOE+OO 1 ':' .. 0.000 O.OOt:+oo 0.001:. rOO 1 .,
,J 0.000 0" 001:.+00 O.OOL+OO 17 O.OOJ 'i'.:',lll:'-·O:i ~'. !:j8E - 04 :I. .. O::j~ +()O J • ()~Jf: '-03 20 0.00(, I .• ~'61' +00 J , !:'i71'::-0,5 I .• 1. if, +00 /.041':-·0:5
'I. of' DM'lp,GF. JIWD: RLI'I DFF'TH 1U'I. mAl' " tol·.·ilL t.()t~l(1. totAl LC1t ,', l".z
g-lD 1 0.000 O.OOHOO O.OOL+OO 2 0.000 O.OOt::+oo 0.00[-.+00 3 O.O~~:' 9. ~j7E'O::' 3.06F·03 2,.'161:-01 9 • .o\6L-0~~ 4 0.OU9 1.17E-01 1..04F.-02 o5.33J:::--OJ 2" \171:'··0:! " " 0.143 1 .3lf:.· 01 1" 'I6E-02 3.b6E-01 ~j" ~)~5t. ···02 6 () .237 1.6BE"·Ol 3.98L-02 4.101:"O.l 9./lL-·(L' 7 O.2Hl 1.8BE.··01 ~j. ~'7E,,·02 4.36["01 1 .23[-0 j 8 0.321 2.1.01::-01. 6.7!:'iE-02 4.641:: -·0 1 1.491::·01 9 0.357 ~l. :~6f:'-0 1 8.41[--02 4.94E-Ol 1.761:: -OJ
IO 0.059::; 2.701::-01 1.07E·-()1 ::;.32£-01 2.1.0EOl 11 0.429 :3.121::-·01 1.341:.-01 ~). 73[-·01 :.'" 46[ .. ·01 j ':) (). 4~j9 .5.5'11':: -0 1. 1. 65E·() 1 6. !BE-O 1 ).841::-,01
13 0.48B 4.21E·-01 2.05E-01 6.70E-Ol 3.2JE-Ol 17 0.:556 6.93E-01 3.85E·-01. 8. S8E-'() 1. 4.7/E·01 20 O.5fJ6 9.12F··01 5.:34[,-01 '1.78E-0J. ~j .13E -01
203

% ot' DAMAGE INDEX RUT DEPTH PLANE YEAR TOT. n~AF. t.ot. a 1 total*% tot.al tot.al?',% B-'73! 1 0.000 O.OOE+OO O.OOE+()O
2 0.000 0.001':+00 0.00[+00 3 0.019 2.9410-02 !:i.!WE-04 2.04E-Ol 3.B8E-OJ 4 0.063 ~,. 60t:: ,-,02 2.27E-03 2.30E·-Ol 1.45E-02 ~ 0.1.0J 4.23E-·02 4.J5E-03 2.53E-OJ. ~'. 60E-·Ij'.! 6 0.1 ~~B ~~,I .. l/E···(i2 (, .. 62E .. -03 2 .. !BE··Ol 3 .. 63[ ····O:c I 0.141 5.171::-"02 8.14[-0,3 " • O;·!I':"O 1 4 ,,2~)I: 'OJ 8 ().1~j2 6.47E··()2 S' .. B4E-'O;3 ;>,. 21,E'-():1 4. UBE'-O~' 9 0.16.1. 7. 2~i":-02 .I. .17[-,02 :5.421'::'-0.1 ~'j .. ::;01:: -O~.~
10 ON 172 B.32E:·()2 1 .. 43[-02 :r, • bBE -'(H 6 .. :;:~E"'()2 11 O.lH.I. 9. 5 'Jr:>" 0 2 1. /4E --02 .~. 9/1;: .. ·() I. 7. :I. HI:,--O',' 12 (). 1139 1. :I. H>--O 1 2 .. 09E'-O:~ 4.2E:E-O:t B.OUE·-02 .L:5 0.191 1. ~~()I;:'O 1 2. t:j5E·-()2 4.64\::,,01. () 1.41:::-·()~! . " 1. i' 0.213 2.1:31:::,,-01 4.~j4E-02 ~;:.I ~ <j~7;E - 0 J 1.270:-0:1. 20 0.211 :2. U n:·o 1 .S ,,0'7£'-02 "'.I'/E-·O'!' 1..4/1::01
'I •• of DAMAtiE INDEX I~UT DEPTH Y[Af~ rOT. rRAF • t. () I', c"- tot.al'';/. tot.! I. tot il Ui;
B-'l~;? 1 0.000 O.OOl+OO O.()OI::+()O :.! 0.000 O.OOE+OO O.OOE+OO 3 0.000 O.OOE+OO 0.00[+00 4 0.000 O.OOE+OO O.OO[+()() 5 0.000 O.OOE+OO O.OOE+OO 6 0.000 0.00[+00 0.001::+00 7 0.000 O.OOE+OO O.OOE+OO {:) 0.000 O.OOE+OO O.OOE+OO 9 0.000 O. OOI:~ +00 O.OOE+()O
10 0.000 O"OOE+OO O.OOE+OO 11 0.000 O.OOE+OO O.OOE+OO 1 ') .- 0.000 O.OOE+OO O.OOE+OO 13 0.000 0.00[+00 O.OOE+OO 1/ 0.001 3.44E·"01. 3.44E-04 9.471'::-01 'i.47E·-04 20 0.00:) 4. 5:~E -.. 0 1, 2.26E-03 l..03E+()O 5.14E-03
I. of OAMAGE INDEX I~UT OEPTII YEA/, TOT. Tr'AF. 1..01...:.;%113 totaV.;%
AI. I. TraY. 1 1. 000 1.02E·-·03 1. 24E-·Ol 2 1.000 1.9:)E.-03 1.B'?E"Ol :1 1.000 2.76[··03 ;:'. 29E -·0 1 4 1.000 3.69['-03 2.62E-OI ::oj 1.000 4.61310-03 ~~.<JIE"Ol
6 1.000 6.49[--03 3.34E·-·01 ! i.OOO / • b::;f:: -O;l :;.:59E-·01 8 1.000 a. <18E·-O:1 3.87E-01 9 1.000 1.0::;1::-02 4 • .I.~jE-·01
10 1.000 1. • 2!5E ·-02 4.~jlE·-01
1l 1.000 1.491::\·02 4.91E"01 12 1.000 1.7BE·-02 5.32E·-01 1.3 1.000 ~.14E··02 ::;.81E-·01 17 1.000 3.76E·-02 7.58E-·01 20 1.000 5.12[-02 8.74E-01
204

~m,lt' Dr'v Freeze M,~T[RIAL, AC--10 Contl"ol
A B C 0 E :1. of DAMAGE INDEX RUT DEF'TH
F'LA~IE YEAR TDT.TRAF. tot.al total*% total total*% DC-(>'l 1 1.000 5. 26E-(J2 5.26E-02 5.38E-01 5.38E-01
~ 1. 000 1.00E-01 1.00E-01 6.07E-01 6.07E-r)1 "' 3 0.949 1.35E-01 1.28E-01 6.46E-01 6. 13E-01 .q 0.848 1,,65E-01. 1.40E--01 6.76E-01 5.711E-Ol 5 (I. 754 1 .93[-0:1. 1. 46E-01- 7.02E-01 ~
..I. 30[-01 6 I), 635 2.36E:-01 1. 50E·-0 1 7.38E-01 4.69E-Ol 7 O~578 2. 64E-01 1 • 53E-"Ol 7.59[-01 4.39[-01 8 0"527 2" 9l:!I:::: -I) 1 1 . 56E'--0 1 7.81[-01 4. 12E--Ol 9 0" '1·82 ~'" 31[--01 1 .60E--Ol 8"05E-Ol 3. 8BE "'0.1
10 0" 4'n :). EIOE ",01 1. 65E' ···01 8. 3bE --I) 1 3.62E-01 1 1 f)·.3QO 4" 3@t'-Ol 1.71["01 8" 69£>'01 3 ,. 39E. --(I 'J
1 '7 r) • "';ooC::- ,., .', _I'::' 5.0~5E-(l1 1.78E-01 9 ()5E-Ol 3. 1 9E -_r) 1
13 O~~)l':.i 5,,9~E-Ol 1 ,,86E-01 9.47E-01 2. 98E--<)1 17 o. ~~29 9. 7::iE-(ll 2. 2~;E--O 1 1. 1 (lE+(lO 2. 52E--(l1 .'2 (1 0. 186 1 .. 2~3E+OO 2.38E-01 1.20E+OC) 2"23E-Ol
." r~jf DAMAGE INDEX f;:UT DEF'TH /"
Y~{4f=;: TOT. TRMc. t cot,,] tot".l * ./ '" total tot"l*i. DC:--l C' O,,{)OO O.OOE+OO O.OOE+(JO
':"' 0., 0(10 O.OOE+OO O .. OOE+OO . ....:. 0 .. 000 0.00[+00 0 . OOE+(JO 'I. O. 000 O.OOE+OO O.OOE+OO ~ .. } OL(Jr)(J O~OOE+OO O.OOE+C)O 6 0.000 O.OOE+OO O.OOE+OO 7 O. 000 O.OOE+OO O.OOE+OO 8 o. (100 O.OOE+OO O"OOE+(I0 9 0. 000 O.OOE+OO On OOE+c)I)
10 0.000 O.OOE+OO O.OOE+I)O 11 0.000 o. OOE+(lO O.OOE+OO 12 0.000 O.OOE+OO O. OOE+OO 1" '-' 0.000 O.OOE+(lO O.OOE+OO 17 0.001 3.42E+OO 3. 42E-03 2.31E+OO 2. :::lE-(13 20 0.006 4.51E+OO 2.70E-·02 2.46E+OO 1.48E-02
% of DAMAGE INDEX RUT DEF'TH TOT.TF:AF. total tot".l *% tot,;>l tot" 1 * ./ ,.
8-727 1 0.000 O.OOE+(lO O.OOE+(JO 2 0"000 O.OOE+OO O.OOE+OO 3 0.032 2.80E-01 8.96E-03 8.68E-01 2. 78E-(l2 4 0,,089 3.43E:-01 3.05E-02 9" 09E-·Ol 8. 09E-02 ~ _J O. 143 4.02E-01 5.75E-02 9.43E-01 1.:::5E-01 6 0.237 4.92E-Ol 1. 17E-Ol 9.90[-01 2. 35E -·-01 7 0.281 5.49E-01 1.54E-01 1~02E+O(J 2.86[-01 8 0.321. 6" 16E-01 1.98E-01 1.05E+(lO 3.36E--01 9 O. 357 6.89[-01 2.46E-01 1.08E+00 3.85E-01
10 1),,395 7.92E-01 .,. 13E":'01 1 • 12E+00 4.42E-Ol ._' . 11 0.429 9. 12E-01 3.91E-Ol 1- 16E+c)0 4. 99E-01 1.2 0.459 1.05E+OO 4.83E-Ol 1.21E+00 5.55E-Ol 13 0.488 1.23E+OO 6.01E-c)1 1.27E+00 6. 18E-01 17 0.556 2.03E+00 1. 13E+00 1 . 47E+OO 8. 16E-01 20 0.586 2. 67E+OO 1.56E+(l0 1.60E+00 9.35E-01
205
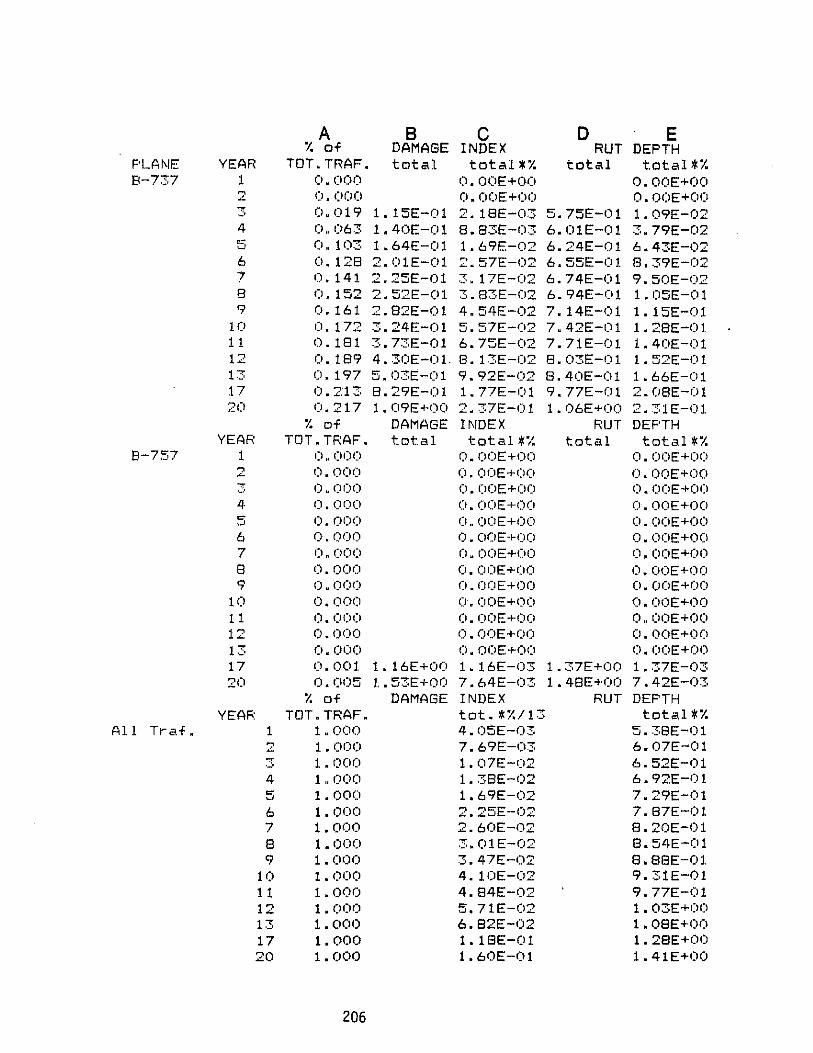
A B C 0 E !. of DAMAGE INDEX RUT DEPTH
PLANE YEAR TDT.TRAF. total total*1. total t.otal*1. 8-737 1 (ly(lOO O.OOE+()O O.OOE+OO
~
"" 0. O(l(j 0. O(lE +00 O.OOE+OO .." ._' 0.019 1.15E-Ol 2. 18E-03 5.75E-01 1. 09E-02 4 1),,1)63 1.40E-01 B.83E-03 6.01E-Ol 3. 79E-02 ",. ;oj O. 103 1.64E-Ol 1.69E-02 6.24E-Ol 6.43E-02 6 0.128 2.01E-Ol 2 .. 57E-02 6. 55E-Ol 8. 39E-02 7 <). 141 2.25E-Ol 3. 17E-02 6.74E-01 9.50E-02 8 0.152 2.52E-Ol :!'" 83E -(12 6.94E-01 1.05E-01 9 O. 161 2.82E-01 4. 54E-02 7. 14E-01 1.15E-01
10 O. 172 3.24E-01 5.57E-02 7.42E-01 1.28E-Ol 11 O. 181 3.73E-Ol 6. 75E-02 7.71E-01 1.40E-Ol 12 0.189 4.30E-01. B.13E-02 B.03E-Ol 1.52E-Ol 13 0.197 5.03E-Ol 9. 92E-02 B.40E-Ol 1.66E-Ol 17 0.213 B.29E-Ol 1.77E-01 9.77E-Ol 2.0BE-Ol 20 0.217 1.09E+00 2.37E-Ol 1.06E+00 2.31E-Ol
I. of DAMAGE INDEX RUT DEPTH YEAR TDT.TRAF. total total*i. total total*i.
8-757 1 (l~(lO(l O.OOE+(>O O.OOE+(JO " 0.000 O.OOE+OO O.OOE+OO .~
"":!; 0 .. 000 O.(I0E+(lO O.OOE+(JO 4 0.000 O.OOE+OO O.OOE+OO '" 0.000 (J,,(lOE+(lO O.OOE+C)O '" 6 0.(100 O.OOE+OO O.OOE+OO 7 0 .. 000 O .. OOE+(lO O.OOE+(H) 8 0.000 O.OOE+OO O.OOE+OO 9 0 .. 000 O.OOE+(lO O.OOE+OO
10 0.000 O.OOE+OO O.OOE+OO 11 0.000 O.OOE+(JO O.OOE+OO 12 0.000 O.OOE+OO O.OOE+OO 13 0 .. 000 O.OOE+OO O.OOE+(JO 17 0.001 1. 16E+OO 1.16E-03 1.37E+OO 1.37E-03 20 0.005 1..53E+OO 7.64E-03 1.48E+OO 7.42E-03
I. of DAMAGE INDEX RUT DEPTH YEAj;: TDT.TRAF" tot.*i.113 t.otal*1.
All Tr-af. 1 1.000 4.05E-03 5.38E-01 2 1.000 7. 69E-03 6.07E-01 3 1.000 1.07E-02 6.52E-Ol 4 1,,000 1.3BE-02 6. 92E-(l1 5 1.000 1.69E-02 7.29E-Ol 6 1.000 2.25E-02 7.B7E-Ol 7 1.000 2.60E-02 B.20E-01 8 1.000 ·3.01E-02 B.54E-Ol 9 1.000 3. 47E-02 8.BBE-Ol
10 1.000 4.10E-02 9.31E-Ol 11 1.000 4.84E-02 9.77E-Ol 12 1.000 5.71E-02 1.03E+f)O 1-'-.~ 1.000 6. 82E-02 1.0BE+OO 17 1.000 1.1BE-Ol 1.2SE+OO 20 1.000 1.60E-Ol 1.41E+OO
206

ZONE: : Dry Freeze t1ATEF:J!\L, PL_
I. of DAMAGE INDEX RUT DEF'TH PLANE YEAR TOT.TRAF. tot a 1 total *1. total total *1. D[-(-9 1 1.000 2. 22E-02 2.2'2E-02 1.05E-Ol 1.05E-Ol .., 1.000 4.22E-02 4.22E-02 1.62E-Ol 1.62E-01 ~
~ 0.949 5.67E-02 5.38E-·02 1.96E-Ol 1.86E-01 . ....:. 4 0.848 tl.95E-(l2 5" 89E-02 2.22E-Ol 1. 89E--0 1 5 0.754 8. 15E··-02 6. 14E-02 2.45E-Ol 1.85E-Ol 6 (1.635 9.96E---02 6,,33E-02 2.77E-Ol 1.76E-Ol 7 0.578 1.11E-Ol 6.43E-O~ 2.96E-Ol 1.71E-Ol 8 0,,527 1.25E-Ol 6 .. 57E-02 ~ 17E-Ol 1.67E-01 ''':'.
9 0.482 1.40E-01 6.73E-02 3.38E-01 1.63E-01 10 0 .. 433 1.60E-Ol 6. 95E-02 ,3. 66E-01 1 . 58E -'01 1 1 0.390 1.85E-01 7.20E-02 3.96E-Ol 1.55E-01 12 0.352
.., 13E--Ol 7 .. 50E -·1)2 4.29E-Ol 1.51E-01 ..::..
13 0.315 2.50E-Ol 7.86E-02 4.68E-Ol 1.47E-Ol 17 0.229 4. l1E-Ol 9.41E--02 6.09E--Ol 1. ::;,9E--Ol 20 o. 186 5.41E--Ol 1.01E-Ol 7.00E-Ol 1.30E-01
'l., of DAMAGE INDEX RUT DEF'TH YEAR TOT. TRAF-. total total *1. total total *1.
DC--ll) 1 0.000 O.OOE+OO O.OOE+OO " On (Jr)(l O.OOE+OO O.OOE+OO "' ~ 0.000 O.OOE+(l(J O.OOE+OO --'
4 0.000 O.OOE+OO O.OOE+OO 5 0.000 O.OOE+OO O.OOE+(lO 6 0.000 O.OOE+OO O.OOE+OO 7 0.000 O.OOE+(I(J 0 .. (JOE+(J(l
8 0.000 O.OOE+OO O.OOE+OO 9 0.0(10 O.OOE+OO O.OOE+OO
10 0.000 O.OOE+OO O.OOE+(l(J 1 1 0.000 O.OOE+OO O.OOE+(JO 12 0.000 O.OOE+OO O.OOE+(J(I 13 0.000 O.OOE+f)O O.OOE+O(l 17 0.001 1.92E+00 1.92E-03 8. 15E-Ol 8. 15E-04 20 0.006 2. 53E+OO 1.52E-02 9.23E-01 5. 54E-03
I. of DAMAGE INDEX RUT DEF'TH TOT.TRAF. total total*% total total*1.
B--727 1 0.000 O.OOE+OO O~OOE+O(l
2 0.000 O.OOE+(JO O.OOE+OO
"" 0.032 1.15E--Ol 3. 68E-03 2.50E-Ol 8.00E-03 --' 4 0" 08', 1.41E-Ol 1.25E-02 2. 84E-(>l 2.52E-02 5 O. 143 1.65E-Ol 2. 36E-02 "" "-' . 13E-Ol 4.47E-02 6 O.~37 2.02E-(Jl 4.79E-02 3 .. 53E--Ol. 8.37E-02 7 0.281 2.26E-01 6.34E-02 3.77E--01 1.06E-01 8 0.321 2. 53E--Ol 8. 12E-02 4.03E-01 1.29E-01 9 0.357 2.83E-01 1.01E-Ol 4.29E-01 1.53E--Ol
10 (I ~ ::.95 3~25E-Ol 1.29E~01 4.65E-01 1.84E-Ol 1 1 0.429 3.75E-01 1.61E-01 5.03E-01 2. 16E-01 12 0.459 4. 32E-01 1.98E-Ol 5.45E-Ol 2.50E·-Ol 13 0.488 5,,06E-01 2.47E-Ol 5. 93E-Ol 2.89E-01 17 0.556 8.34E-Ol 4.64E--Ol 7.70E-Ol 4.28E-01 20 0.586 1.10E+00 6.43E-Ol 8.84E-Ol 5. 18E-Ol
207

:t. of DAMAGE INDEX RUT DEPTH F'LA~IE YEAR TOT.TRAF. tat .. l tot .. l*:t. total total*:t. B·-737 1 OuOOO O.OOE+OO O.OOE+OO
2 0.000 O.OOE+OO O.OOE+(>O 3 0.019 3w95E-02 7.50E-04 1.74E-01 3.30E-03 4 0 .. 063 4. 84E-02 3.05E-03 1. 98E-01. 1.24E-02 ~
'"' o. 103 5. 67E-02 5. 84E-03 " ~. 18E-01 2.25E-02 6 o. 128 t..94E-02 8.88E-03 2.47E-01 3 .. 16E-02 7 O. 141 7.7SE-02 1.09E-02 2.64E-01 3.72E-02 8 o. 152 8. 68E-02 1.. 32E-02 2.82E-Ol 4.29E--02 q O. 161 9. 72E-02 1.57E-02 3.01E-Ol 4.85E-02
10 o. 172 1. 12E-Ol. 1.92E-02 3.26E-01 5.61E--02 11 o. 181 1.29E-Ol 2u33E-02 3.54E-01 6.40E-02 12 o. 189 1.48E-Ol 2 .. 80E-02 3.83E-Ol 7. 24E-02 13 o. 197 1.74E-01 3 .. 42E-02 4. 18E-01 8 .. 23E-02 1.7 0.213 :::::. 8bE-0 1 b.09E·-02 5 .. 45E-Ol 1. 16E-01 20 0.217 3. 76E-Ol 8. 17E-02 6.27E-01 1.36E-01
'1. of DAMAGE I~IDEX RUT DEF'TH YEAR TOT .. TRAF. tatal total. *1. total total *1.
B-757 1 0 .. 000 O.OOE+OO O.OOE+OO 2 0.000 O.OOE+OO O .. OOE+OO 3 0 .. 000 (I .. f)OE+OO O.OOE+(lO 4 0.000 O.OOE+OO O.OOE+(lO 5 0.000 O .. OOE+(JO O.OOE+OO {, 0.000 O.OOE+OO O.OOE+OO 7 0.000 O.OOE+(JO O.OOE+OO 8 0.000 O.OOE+OO O.OOE+OO 9 0.000 O .. OOE+OO O.OOE+OO
10 0 .. 000 O.OOE+OO O.OOE+OO 11 0 .. 000 O.OOE+OO O.OOE+(JO 12 0.000 O.OOE+OO O.OOE+OO 1~ . '-' 0 .. 000 O.OOE+OO O.OOE+OO 17 0.001 5.06E-Ol 5.06E-04 6.48E-01 6.48E-04 20 0.005 6.66E-Ol 3. 33E-03 7. 29E-Ol 3 .. 65E-03
I. of DAMAGE INDEX RUT DEPTH YEAr;: TOT.TRAF. tot.*1.113 total*:t.
All Tr ".f . 1- 1.000 1.71E·-03 1.05E-Ol .., 1.000 3.24E-03 1.62E-01 ~
3 1.000 4.4SE-03 1.97E-Ol 4 1.000 5. 73E-03 2.26E-Ol ~ 1.000 6. 99E-03 2.52E-Ol '"' 6 1 • (1)0 9.24E-0::;, 2.91E-Ol 7 1.000 1.07E-02 3. 14E-01 8 1.000 1.23E-02 3. 39E-(> 1 9 1.000 1.42E-02 3.65E-01
1.0 1.000 1.67E-02 3. 98E-01 11 1.000 1.97E-02 4.34E-01 12 1.000 2. 32E-02 4.73E-01 13 1.000 2. 77E-02 5. 19E-01 17 1.000 4.7BE-02 6.B5E-Ol 20 1.000 6.49E-02 7. 93E-01
208
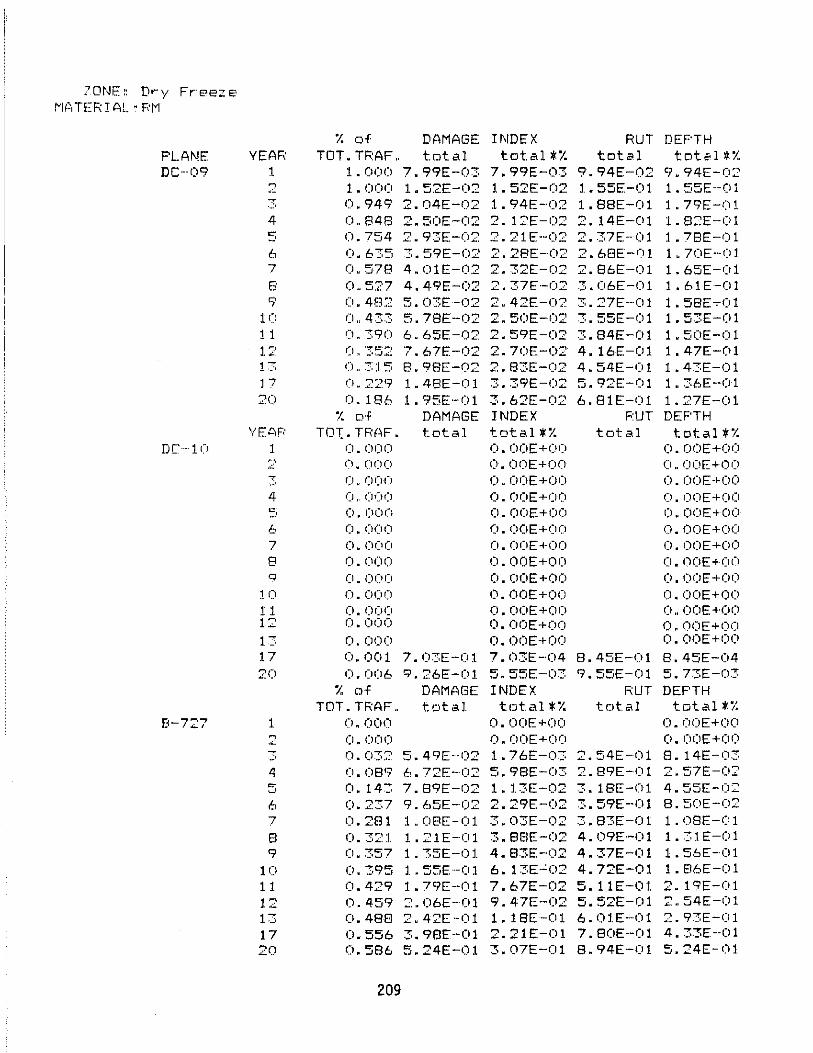
?ONE, Dry Fr·eeze ~lln[RI I'll. ·PM
I. of DAMAGE INDEX RUT DEF'TH PLANE YEAF, TClT.TRAF .. t.ot a 1 tot.al *1. tot" 1 tDt",l *% DC-09 1 1.000 7. 99E-03 7.99E-03 9.94E-02 9.94E-02
2 1.000 1.52E-02 1.52E-02 l.55E-Ol 1 • 55E --01 3 0.949 2.04E-02 1 .94E-·02 1.SSE-Ol 1 . 79E-('1 4 1) .. 848 2.50E-(l2 2. 1?E-02 2. 14E-('1 1.82E--Ol ~ 0.754 2. 93E-02 2.21E--02 2.37E-01 1 .78E-')1 ..J
6 o. 635 3.59E-02 2.28E-·02 2.68E-01 1.70E--Ol 7 (l~578 4.01E-02 2. 32E-(l2 2.86E-Ol 1.65E-Ol B (1,,527 4.49E-02 2.37E·-02 ·3.1)6E-Ol 1 b 1 E-O 1 9 o. 482 5.03E'-02 2.42E-02 3. 27E--0 1 1 .S8E.1)1
10 1) .. 433 5. 78E-02 2 .. 50E-02 3.55E-(Jl 1.53E-Ol 1 1 0" 390 6.65E-02 2.59E-02 3.84E-Ol 1 .50E-Ol 1 ,:.\ r). ":"~··-l .,; • .J":':' 7. 67E-r)2 2,,7(JE-02 4. 16E-01 1 47E-(>1 13 (I" ::::1.5 8.9SE-02 2. 83E-02 4.54E-Ol 1 .43E-01 I 7 0" 22(7 1. 48E-0 1 3. 39E-02 5.92E-f)1 1.36E-Ol 20 0 .. 186 1 . 95E-C)1 3. 62E-02 6.81E-01 1. 27E--C) 1
~1. Df DAMAGE INDEX PUT DEPTH VEAF' TO"(. TRI,F . total total*1. total total*'l.
DC··_·l(' 1 0.000 O.OOE+C)O O.OOE+(J(I ~ o. 000 O.OOE+OO (J,,(JOE+OO ~
-, 1).0(10 OuOr)E+OO O.OOE+OO .-4 t) , (I f) (J O.OOE+OO o. OOE+(lO c ._, o. 000 O.OOE+(J(l O.OOE+O(l 6 o. 000 O.OOE+OO O.OOE+OO 7 O~ (l(l(l O.OOE+OO o. OOE+OO 8 o. (II)(J O.OOE+OO O.OOE+C)C) q (I. (Jell) O.OOE+OO O.OOE+(l(l
10 o. 000 O.OOE+OO O. OOE+OO 1 1 o. OC)O O.OOE+(lO (I,,(lOE+OO 1:: 0.000 O.OOE+OO O~OOE+OO 13 O. 000 O.OOE+OO O.OOE+OO 17 0.001 7.03E-01 7.03E-·04 8.45E--0! 8.45E-04 20 O~O(l6 '1. 26E-Ol 5n 55E-·03 9.55E-(l1 5. 73E-03
% elf DAMAGE INDEX RUT DEPTH TClT.TRAF .. total t(Jtal*1. tr.>tal total *i:
[1-7'2.7 ! 0"000 O.OOE+OO O.OOE+OO 2 0"000 O. (JOE +(>(1 O. OOE+(i(l
c' 0.03:.? 5.49E-··02 1.76E-03 ::.54E-·01 8. 14E-03 4 0.089 6.72E--·02 5. 98E-03 2. 89E-·Ol 2,,57E-02 e o. 143 7.89E-02 1. 13E-·02 ~ 18E-Cll 4.55E-02 J . .; .. 6 0.237 9. ~)5E-02 2.29E-02 3. 59E--Ol 8.50E-02 7 0.281 1 .08E-0! 3.03E-02 3.83E-Ol 1 . (l8E-01 8 O.32l 1 .21E-01 3.88E-02 4.09E·-Ol 1.31E-Ol 9 o. 357 1 . 35E--Ol 4.83E-02 4.37E-Ol 1 .56E-·01
10 0.395 1 . 55E··-(l 1 6. 13E"':'02 4.72E-Ol 1.86E-Ol 11 0.429 1 .79E-Ol 7.67E-02 ~ l1E-C):I. ~ 19E-01 ..J. ..::.~
12 o. 459 2.06E--·Ol 9.47E-02 5. 52E-(l1 2 .. 54E-Ol 13 0.488 2. 42E ·-01 1. 18E-Ol 6.01E--,('1 2.93E-01 17 0.556 3. 98E --01 2.21E-Ol 7. SOE--01 4.33E--01 20 0.586 5.24E-Ol ~ -' . 07E-Ol 8.94E-Ol 5.24E-Ol
209

I. of DAMAGE INDEX RUT DEPTH F'LA~IE YEAR TOT. TRAF, toted total *1. tot. •• l t.otal*1. B-737 1 O~OOO O. OOE+OO O.OOE+OO
2 0.000 O.OOE+OO O.OOE+OO 3 0.019 1 . 98E-02 3. 77E-04 1 .68E-01 3. 19E-03 4 o. 063 2. 43E-02 1.53E-03 1- 91E-01 1 .. 20E-02 = o. 1,03 2. 85E-02 2. 93E-03 "' llE-01 "' 17E-02 ,J ~. ~.
6 o. 128 3.49E-"02 4. 46E-03 2.38E-01 3.05E-02 7 o. 141 3. 89E-02 5. 49E-03 2.55E-Ol 3 .. 59E-02 8 O. 152 4. ~.6E-02 6.63E-03 2.73E-01 4. 14E-02 9 o. 161 4.88E-02 7. 86E-03 2.91E-01 4.69E-02
10 o. 1.72 5.61E-02 9. 65E-03 "" h 16E-Ol 5 .. 43E-02 11 o. 181 6.46E-02 1. 17E-02 3.42E-Ol 6. 19E-02 12 O. 189 7,,45E-02 1 .41E-02 3.71E-01 7.00E-02 l' '-' o. 197 8. 73E-02 1.72E-02 4 .. 04E-01 7.96E-02 17 0" 21·3 1.44E-Ol 3~ 06E--02 5.27E-Ol 1 . 12E-"0 1 .'20 (1 .. 217 1.89E-01 4. 10E-'()2 6.07E-Ol 1.32E-Ol
!:, of DAMAGE INDEX RUT DEF'TH YEAR TOT.TRAF. tot.al total *1. total total*1.
8-757 1 o. 000 O.OOE+OO OuOOE+(JO 2 OuOOO O.OOE+OO O.OOE+OO 3 0.000 O.OOE+OO O.OOE+OO Lj. 0.000 0. OOE+OO O.OOE+OO 5 0.000 (J,,(JOE+(JO O.OOE+OO 6 0.000 O.OOE+OO O.OOE+OO 7 0.000 O .. OOE+OO O.OOE+(JO 8 0.000 O.OOE+(JO O.OOE+OO 9 0.000 O.(JOE+(I0 O.OOE+OO
10 O~(lOO O.OOE+OO O.OOE+OO 1 1 0 .. 000 O.OOE+OO O.OOE+OO 12 (1 .. 000 O.OOE+OO O.OOE+OO 13 0.000 O.OOE+OO O.OOE+OO 17 0.001 2.04E-01 2.04E-04 5.68E-Ol 5. 68E-04 20 0.0(15 2. 69E"-01. 1.34E-03 6. 39E-Ol ~ 19E-03 .";'.
:1. of DAMAGE INDEX RUT DEPTH YEAR TOT. TRAF. tot. *1./13 t.otal*1.
All Tl'"af. 1 1.000 6. 14E-04 9.94E-02 2 1.000 1. 17E-03 1.55E-Ol ~ 1.000 1, .66E-03 1.90E-01. .~.'
4 1 .000 2.21E-03 2. 19E-Ol = ,.J 1.000 2. 79E-03 2.46E-Ol 6 1.000 3. 85E-03 2.86E-01 7 1 .000 4.53E-03 3.09E-Ol 8 1. (lOO 5.31E-03 3. 34E-Ol 9 1.000 6. 18E-"03 3.60E-01
:to 1.000 7.38E-03 3.94E-Ol 1 1 1.000 8.80E-03 4.31E-Ol 12 1.000 1..04E-02 4.70E-01 13 1.000 1.26E-02 ~
-J. 16E-Ol 17 1.000 2.20E-02 6.83E-Ol 20 1 .000 3.01E-02 7.91E-Ol
210

:: o~\!c: DI-- '/ Ft-f.-?ez e MATEfn AL :: Fd·j
F'U\NF DC-(l9
DE-l0
8--727
YEAP 1 2
5 6 7
8 Ci
1 (I 1 .,
12 1"':
DAMAGE INDEX RUT DEPTH TOT, TRFlF, tot ,,11 total tote'] *%
1.(10(1 1.15E-02 1. 15E-02 1.12E-Ol 1.12E-Ol 1.000 2. 19E-02 2. 19E-02 1.72E-Ol 172E-Ol 0.949 2.95E-02 2.80E-02 2.08E-Ol 1 97E-Ol 0.848 3.61E-02 3.06E-02 2.35E-Ol 1.99E-Ol (1,,754 4,,24E-f)2 j.j9E--02 2.59E-t)1 1~95E-'IJl
0"635 5.j8E-(J2 3,,29E-02 2.92E-I-)1 1 SSE-Cl] 0.578 5.79E-02 3.34[-02 3.11E-Ol 180[-01 0.527 6.49E-r)2 3~4?E-r:17 3~3?E--()1 1 75E·-(11 (l" 482 7" 2t)[~··- (l~:;~ ? n 501:: -.. (l~,~ '"3" 54[ .-1) 1 1 70P- _./ J1 (),43~~; R,·34E:--r)~~ ·3"6:1E>···O:' 3.B2[~··-()1 j 65F:-.()1 (1" :·~,7'() 9" 61r-~·-(1~ 7..751::-··(1:·,:: 4.1.3E-·-("J! 1 61E·_·(q (J ':)5::~ :1 n 1. 1 E" -·-01 3" 90E --·02 4" 4hE·_·· r) j 1 57F':- n 1 0, -:::1.::.i 1 '"3(1F.::---CI1 4" (J9E>-O~·\ 4" 85[--(")1 1 53[-·rl1
17 (I, :.~;~q 2. j 4E .... r~J1 Ll., FJf';"E··-(\:? ti" ~~f-,E·-·(\1 1 Ll:,[···-I,·'J 7( I (I, 186 ":t B 1.1:· -r", 1 5 :,2::::;~.- , .. C<· .. 7 171;:-.;.:, 1 1 ~:.~,r:: - (,11
YEAF, 1
4
5
7 8 9
10 1 1 1:2
"I. nf OAMAGE I NDEX HIT DEF'TH TOT.TF'i~F, total totaU%
(I" r)1-}r"1 I). OOE·+c)(I 0. (l(Je)
(I" r)(l(l
I). (l()I')
(i" 0(,'0 0.000 r) ()()()
(\ 000 0 .. 000 0.000 0.000 0.000
f).OOE+(lO 0" OI)E +(l(l
0 .. (lOE+OO O.OOE+O(J O.OOE+OO O.OOE+OO O.OOE+OO O.OOE+(l(J O.OOE+f)O O.OOE+r)O O.OOE+OO
toLd tota.l *~( O.OOE+(lO O~OOE+OO
O.OOE+(lO O.OOE+OO O.OOE+(lt) O.OOE+OO O.OOE+OO O.OOE+OO O.OOE+(JO O.OOE+(lO O.OOE+OO O.OOE+OO
13 0.000 O.OOE+OO O.OOE+OO 17 0.001 9.97E-Ol 9.97E-04 9.72E-Ol 9.72E-04 20 0.006
f. of TOT.TRAF.
0.000
1.31E+OO 7.87E-03 1.09E+00 6.54E-03 DAMAGE INDEX RUT DEPTH totC'.l total*%
O.OOE+OO total total*%
O.OOE+OO 2 0.000 O.OOE+OO O.O(lE+OO 3 0.032 8.20E-02 2.62E-03 2.7BE-Ol B.89E-03 4 0.089 1.00E-Ol 8.93E-03 3. 14E-Ol 2.79E-02 5 0.143 1.ISE-01 1.68E-02 3.45E-Ol 4.93E-02 6 0.237 1.44E-Ol 3.41E-02 3.88E-Ol 9.19E-02 7 0.281 1.61E-Ol 4.S2E-02 4.13E-Ol 1.16E-Ol 8 0.321 1.80E-Ol 5.78E-02 4.40E-Ol 1.41E-Ol 9 0.357 2.02E-Ol 7.20~-02 4.69E-Ol 1.67E-Ol
10 0.395 2.32E-Ol 9. 15E-02 5.06E-(ll 2.0(IE-(l1 11 0.429 2.67E-OI 1.15E-Ol 5.46E-Ol 2.34E-Ol 12 0.459 3.08E-Ol 1.4IE-Ol 5.89E-Ol 2.70E-Ol 13 0.488 3.60E-Ol 1.76E-Ol 6.39E-Ol 3.12E-Ol 17 0.556 5.94E-Ol 3.30E-Ol 8.23E-Ol 4.57E-Ol 20 0.586 7.8IE-Ol 4.S8E-Ol 9.40E-Ol 5.51E-Ol
211

I. of DAMAGE INDEX RUT DEF'TH F'LANE YEAR TOT.TRAF. t.ot.al t.ot.al*1. t.otal t.otal*1. B-737 J O~OOO O.OOE+OO O.OOE+OO
2 0.000 O.OOE+OO O.OOE+OO 3 0.019 2. 94E-02 5. 59E-04 1.92E-Ol 3~65E-03 4 0.063 3.60E-02 2.27E-03 2. 17E-01 1.37E-02 ~ ,_, 0.103 4. 23E-02 4 .. 35E-O:::;, 2.38E-Ol 2.45E-02 6 o. 128 ~ ...!. 17E-(l2 6. 62E-03 2.67E-Ol 3. 42E-02 7 o. 141 5.77E-02 8. 14-E-03 2.84E-Ol 4.01E-02 8 0.152 6.47E-02 9. 84E-03 3.03E-Ol 4.60E-02 9 o. 161 7.24E-02 1. 17E-02 3.22E-01 ~
...!. 19E-02 10 0. 172 8.32E-02 1.43E-02 .3. 48E-Ol 5. 98E-Cl2 1 1 0.181 9.58E-02 1.73E-02 3. 75E-Ol 6. 79E-02 12 o. 189 1. liE-Oj 2'.09E-02 4.05E-Ol 7. 65E-02 13 O~ 197 1.29E-OJ 2. 55E-02 4.40E-01 8.66E-02 17 On213 2. 13E-··01 4.54E-02 5.67E-Ol 1.21E-Ol 20 0.217 2.81E-Ol 6.09E-02 6. 48E--Ol 1.41E-Ol
./ of DAMAGE INDEX RUT DEF'TH ,. YEAF, TOT. TRAF. total total *1. total total *1.
B-757 1 0.000 O.OOE+(lO O .. OOE+OO ~ 0.000 O.OOE+OO O.OOE+OO ..::. - (1.000 O.OOE+OO O.OOE+OC) . .:.
4 0.000 O .. OOE+OO O.OOE+OO ~ ,.J 0.000 (I"OOE+OO O.OOE+OO 6 0.000 O.OOE+OO O.OOE+OO 7 0.000 O.OOE+OO O .. OOE+OO 8 0.000 O.OOE+OO O.OOE+OO 9 0 .. 000 (l .. OOE+OO O.OOE+OO
10 0 .. 000 O.OOE+OO O.OOE+OO 11 0.000 O.OOE+OO O.OOE+OO 12 0.000 O~OOE+OO O.OOE+OO 13 OnO!)!) O.OOE+OO O.OOE+OO 17 0.001 2.91E-Ol 2.91E-04 9. llE-Ol 9. llE-e)4 20 0 .. 005 3. 82E-Ol 1.91E-03 9.89E-Ol 4.95E-03
I. of DAMAGE INDEX RUT DEPTH YEAR TOT.TRAF. tot. *1./13 total *1.
All TI-af. 1. 1.000 8. 87E-04 1.12E-Ol 2 1.000 1.69E-03 1.72E-Ol - 1.000 2.40E-03 2. 10E-Ol . ..,;. 4 1.000 3.22E-03 2.41E-Ol 5 1.000 4.09E-03 2.69E-Ol 6 1.000 5. 66E-03 3.11E-Ol ? 1.000 6. 67E-03 3.36E-Ol 8 1.000 7.84E--03 3. 62E-Ol 9 1.000 9. 13E-03 3.90E-Ol
10 1.000 1.09E-02 4.25E-Ol 11 1.000 1.30E-02 4.63E-(Jl 12 1..000 1.55E-02 5.04E-Ol 13 1.000 1.86E-02 5.51E-Ol 17 1.000 3.27E-02 7. 23E-Ol 20 1.000 4.47E-02 8. 36E-Ol
212

ZONE: Wet-No Freeze MATERIAL: ASPHALT CONCRETE CONTROL
A B C 0 E % of DAMAGE INDEX RUT DEPTH
PLANE YEAR TOT.TRAF. total tot,alll% total total$% DC-09 1 1.000 2.41E-Ol 2.41E-01 1.61E+01 1.61E+Ol
2 1.000 4.58E-01 4.58E-01 2.2SE+Ol 2.25E+Ol 7 ~, 0.949 6. 15E-Ol 5.84E-Ol 2.S8E+Ol 2.45E+Ol 4 0.848 7.53E-Ol 6. 39E-01 2. 82E+Ol 2.39E+Ol 5 0.754 8.84E-01 6.66E-Ol 3.01E+01 2.27E+Ol 6 0.635 1.08E+00 6.86E-01 3.26E+01 2.07E+Ol 7 0.578 1.21E+OO 6.98E-01 3.40E+Ol 1.97E+Ol 8 0.527 1. 35E+OO 7. 13E-01 3.55E+Ol 1.87E+Ol 9 0.482 1.52E+OO 7.30E-01 3.69E+01 1. 78E+C,'1
10 0.433 1.74E+OO 7.53E-01 3.88E+01 1.68E+Ol 11 0.390 2.00E+OO 7.82E-01 4.07E+01 1.59E+Ol 12 0.352 2.31E+OO 8. 13E-01 4.26E+01 1.50E+01 13 0.315 2.71E+OO 8.52E-01 4.48E+01 1.41E+Ol 17 0.229 4. 46E+00 1.02E+00 5.21E+01 1. 19E+Ol 20 0.186 5.87E+OO 1.09E+OO 5.63E+Ol 1.05E+01
% of DAMAGE INDEX RUT DEPTH YEAR TOT.TRAF. total total*/. total total*/.
DC-10 1 0.000 O.OOE+OO O.OOE+OO 2 0.000 O.OOE+OO O.OOE+OO 3 0.000 O.OOE+OO O.OOE+OO 4 0.000 O.OOE+OO O.OOE+OO 5 0.000 O.OOE+OO O.OOE+t)O 6 0.000 O.OOE+OO O.OOE+OO 7 0.000 O.OOE+OO O.OOE+OO 8 0.000 O.OOE+OO O.OOE+OO 9 0.000 O.OOE+OO O.OOE+OO
10 0.000 O.OOE+OO O.OOE+OO 1 1 0.000 O.OOE+OO O.OOE+OO 12 0.000 O.OOE+OO O.OOE+OO 13 0.000 O.OOE+OO O.OOE+OO 17 0.001 1.79E+01 1.79E-02 1.88E+02 1.88E-Ol 20 0.006 2.36E+Ol 1.41E-01 2.03E+02 1.22E+OO
% of DAMAGE INDEX RUT DEPTH TOT.TRAF. total total*% total total*/.
B-727 1 0.000 O.OOE+OO O.OOE+OO 2 0.000 O.OOE+OO O.OOE+OI) 3 0.032 1.50E+OO 4.81E-02 3.42E+01 1.09E+00 4 0.089 1.84E+OO 1.64E-01 3.73E+01 3. 32E+00 5 0.143 2. 16E+00 3.08E-Ol 3.98E+Ol 5. 69E+OO 6 0.237 2.64E+OO 6.25E-01 4.30E+01 1.02E+Ol 7 0.281 2. 95E+OO 8. 28E-01 4.49E+Ol 1.26E+01 8 0.321 3.30E+OO 1.06E+OO 4.68E+01 1.50E+Ol 9 0.357 3.70E+OO 1.32E+OO 4.87E+01 1.74E+Ol
10 0.395 4. 25E+OO 1. 68E+I~O 5.11E+Ol 2.02E+Ol 1 1 0.429 4. 89E+OO 2.10E+OO 5.36E+01 2.30E+Ol 12 0.459 5. 64E+OO 2. 59E+OO 5.61E+Ol 2.57E+Ol 13 0.488 6.60E+OO 3. 22E+OO 5.90E+01 2.88E+01 17 0.556 1.09E+01 6.05E+OO 6.87E+Ol 3.82E+Ol 20 0.586 1.43E+Ol 8. 39E+OO 7.38E+01 4.33E+Ol
213
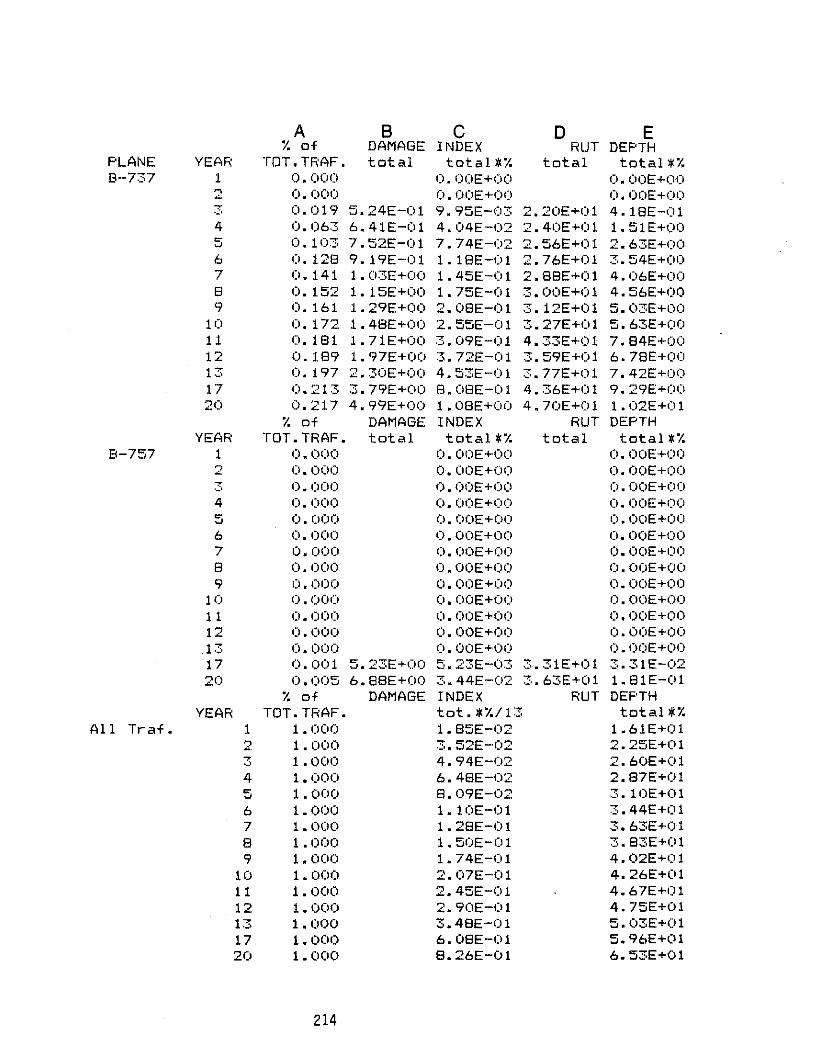
A B C 0 E % of DAMAGE INDEX RUT DEPTH
PLANE YEAR TOT.TRAF. total total*t. total total*t. B-737 1 0.000 O.OOE+OO O.OOE+OO ,..,
~ 0.000 O.OOE+OO O.OOE+Ot) 3 0.019 5.24E-Ol 9. 95E-03 2.20E+Ol 4.18E-Ol 4 0.063 6.41E-01 4.04E-02 2.4·0E+01 1.51E+OO 5 0.103 7.52E-Ol 7. 74E-02 2.56E+Ol 2. 63E+(lO 6 0.128 9. 19E-Ol 1.1SE-01 2.76E+01 3.54E+OO 7 O. 141 1.03E+00 1.45E-Ol 2.88E+01 4.06E+OO S 0.152 1. 15E+00 1.75E-Ol 3.00E+01 4.56E+OO 9 0.161 1.29E+OO 2.08E-01 3. 12E+Ol 5.03E+OO
10 0.172 1.4SE+OO 2. 55E-(Jl 3.27E+Ol 5. 63E+OO 11 O. 181 1.71E+OO 3.09E-Ol 4.33E+01 7. 84E+OO 12 0.189 1.97E+OO 3.72E-Ol 3.59E+Ol 6. 78E+OO 13 0.197 2.30E+OO 4.53E-Ol 3.77E+Ol 7. 42E+00 17 0.213 3. 79E+OO B.OBE-Ol 4.36E+01 9. 29E+OO 20 0.217 4. 99E+00 1.0BE+OO 4.70E+01 1.02E+(l1
% of DAMAGE INDEX RUT DEPTH YEAR TOT.TRAF. total total*t. total total*%
8-757 1 0.000 O.OOE+OO O.OOE+OO 2 0.000 O.OOE+(JO O.OOE+OO 3 0.000 O.OOE+OO O.OOE+(I0 4 0.000 O.OOE+(JO O.OOE+OO 5 0.000 O.OOE+I)O O.OOE+OO 6 0.000 O.OOE+OO O.OOE+OO 7 0.000 O.OOE+(lO O.OOE+OO 8 0.000 O.OOE+(}() O. (}()E +00 9 0.000 O.OOE+OO O.OOE+OO
10 0.000 O.OOE+OO O.OOE+OO 11 0.000 O.OOE+OO O.OOE+OO 12 0.000 O.OOE+OO O.OOE+OO 1"" '-' 0.000 O.OOE+OO O.OOE+OO 17 0.001 5. 23E+OO 5.23E-03 3.31E+Ol 3.31E-02 20 0.005 6.88E+OO 3. 44E-02 :::;,.63E+Ol 1.B1E-(l1
% of DAMAGE INDEX RUT DEPTH YEAR TOT.TRAF. tot. *%/13 total*%
All T .... af. 1 1.000 1.85E-02 1.61E+01 2 1.000 3. 52E-02 2 .. 25E+Ol 3 1.000 4.94E-02 2.60E+01 4 1.000 6. 48E-02 2.S7E+01 5 1.000 8.09E-02 3.10E+01 6 1.000 1. 10E-Ol 3.44E+01 7 1.000 1.2BE-01 3. 63E+Ol B 1 . 000 1.50E-01 3.83E+Ol 9 1.000 1.74E-Ol 4.02E+01
10 1.000 2.07E-Ol 4.26E+01 11 1.000 2.45E-Ol 4.67E+01 12 1.000 2.90E-01 4. 75E+01 13 1.000 3.48E-01 5.03E+Ol 17 1.000 6. OSE-I) 1 5. 96E+(ll 20 1. (100 8.26E-01 6. 53E+01
214

ZONE: Wet-No Freeze MATERIAL: ASF'HALT RUBBER LOW
% of DAMAGE INDEX RUT DEPTH PLANE YEAR TOT.TRAF. total total*% total total"'/. DC-09 1 1.000 4. 68E-02 4;68E-02 1.64E-Ol 1.64E-01
2 1.000 8.90E-02 8.90E-02 2.42E-01 2.42E-Ol
'" '-' 0.949 1.20E-01 1.14E-Ol 2.87E-01 2.72E-Ol 4 0.848 1.47E-Ol 1. 24E-01 3.22E-Ol 2.73E-Ol 5 0.754 1.'72E-Ol 1.30E-Ol 3.51E-Ol 2.65E-01 6 0.635 " L. 10E·-01 1.33E-Ol 3.92E-Ol 2.49E-01 '7 0.578 2.35E-Ol 1.36E-Ol 4.16E-Ol 2.41E-01 8 0.527 2. 63E-01 1.39E-Ol 4. 43E-Ol 2.33E-Ol 9 0.482 2.95E-Ol 1.42E-01 4.70E-01 2.26E-01
10 0.433 3.39E-·01 1.47E-01 5.05E-Ol 2.191::-01 11 0.390 3.90E-Ol 1.52E-01 5.44E-01 2.12E-Ol 12 0.352 4.49E-01 1.58E-01 5.85E-Ol 2.06E-01 1'" '-' 0.315 5.26E-Ol 1.66E-Ol 6.33E-01 2.00E-01 17 0.229 8.67E-01 1.98E-01 8.10E-01 1.85E-Ol 20 0.186 1. 14E+00 2. 12E-Ol 9.23E-Ol 1.72E-01
% of DAMAGE INDEX RUT DEPTH YEAR TOT.TRAF. total total*% total total*%
DC--I0 1 0.000 O.OOE+OO O.OOE+OO 2 0.000 O.OOE+OO O.OOE+OO 3 0.000 O .. OOE+OO O.OOE+OO 4 0.000 O.OOE+OO O.OOE+OO 5 0.000 O.OOE+OO O.OOE+OO 6 0.000 O.OOE+OO O.OOE+OO 7 0.000 O.OOE+t)O O.OOE+OO 8 0.000 O.OOE+OO O.OOE+OO 9 0.000 O.OOE+OU O.OOE+OO
10 0.000 O.OOE+OO O.OOE+OO 1 1 0.000 O.OOE+I)O O.OOE+OO 12 0.000 O.OOE+OO O.OOE+OO 13 0.000 O.OOE+OO O.OOE+OO 17 0.001 3. 83E+OO 3. 83E-03 1.28E+OO 1.28E-03 20 0.006 5.04E+OO 3.03E-02 1.43E+OO 8.60E-03
% of DAMAGE INDEX RUT DEF'TH TOT.TRAF. total total*% total total*%
8-727 1 0.000 O.OOE+(lO O.OOE+OO 2 0.000 O.OOE+OO O.OOE+OO 3 0.032 2.64E-Ol 8.46E--03 3.6::",E-01 1. 16E-02 4 0.089 3.24E-Ol 2. 88E-02 4.07E-t)1 3.62E-02 5 0.143 3.80E-01 5. 43E-02 4.45E-01 6. 36E-02 6 0.237 4.64E-Ol 1. 10E-01 4.97E-Ol 1.18E-Ol 7 0.281 5.19E-01 1.46E-01 5.27E-01 1.48E-Ol 8 0.321 5.81E-01 1.87E-Ol 5.60E-Ol 1.80E-01 9 0.357 6.51E-01 2.32E-Ol 5.95E-01 2. 12E-Ol
10 0.395 7.47E-01 2.955-01 6.39E-Ol 2.53E-Ol 11 0.429 8.61E-01 3.69E-01 6.88E-01 2.95E·-Ol 12 0.459 9.93E-01 4.56E-Ol 7.40E-Ol 3.40E-01 13 0.488 1.16E+OO 5.68E-Ol 8.01E-01 3.91E-01 17 0.556 1.92E+OO 1.06E+OO 1.02E+OO 5.69E-Ol 20 0.586 2. 52E+OO 1.48E+OO 1. 17E+OO 6.84E-01
215

'% of DAMAGE INDEX RUT DEPTH PLANE YEAR TOT.TRAF. total total *'% total total*,% B-737 1 0.000 O.OOE+OO O.OOE+OO
") ~ 0.000 O.OOE+OO O.OOE+OO 3 0.019 8.61E-02 1.63E-03 2. 45E-(l1 4. 66E-03 4 0.063 1.05E-Ol 6. 64E-03 2.76E-01 1.74E-02 5 0.103 1.24E-01 1.27E-02 3.03E-Ol 3.12E-02 6 0.128 1.51E-01 1.93E-02 3.39E-01 4.34E-02 7 O. 141 1.69E-01 2. 38E-02 3.61E-Ol 5.09E-02 8 0.152 1.B9E-·Ol 2.88E-02 3.B4E-Ol 5.84E-02 9 O. 161 2. 12E-Ol 3.41E-02 4.09E-Ol 6.58E-02
10 0.172 2. 43E-('1 4. lBE-02 4.40E-Ol 7. 57E-02 1 1 O. lBl 2. BOE-Ol 5.07E-02 4.75E-Ol 8.59E-02· 12 0.lB9 3.23E-Ol 6.11E-02 5.12E-Ol 9.67E-02 13 0.197 3.7BE-('1 7. 45E-02 5.55E-Ol 1.09E-Ol 17 0.213 6.23E-01 1. ::nE-Ol 7. 14E-01 1.52E-(H 20 0.217 B.20E-01 1.7BE-Ol B.16E-Ol 1.77E-01
'% of DAMAGE INDEX RUT DEPTH YEAR TOT.TRAF. total total*,% total total*,%
B-757 1 0.0(10 O.OOE+OO O.OOE+OO 2 0.000 O.OOE+OO O.OOE+OO 3 0.000 O.OOE+OO O.OOE+OO 4 0.000 O.OOE+OO O.OOE+OO 5 0.000 O.OOE+OO O.OOE+OO 6 0.000 O.OOE+OO O.OOE+OO 7 0.000 O.OOE+OO O.OOE+OO B 0.000 O.OOE+OO O.OOE+OO 9 0.000 O.OOE+t)(l O.OOE+OO
10 0.000 O.OOE+OO O.OOE+OO 11 0.000 O.OOE+OO O.OOE+OO 12 0.000 O.OOE+OO O.OOE+OO 13 0.000 O.OOE+OO O.OOE+OO 17 0.001 1.03E+OO 1.03E-03 1.05E+OO !.05E-03 20 0.005 1.35E+OO 6. 77E-03 1. 19E+OO 5. 96E-03
% of DAMAGE INDEX RUT DEPTH YEAR TOT.TRAF. tot.*%/13 total*%
All Traf. 1 1.000 3.60E-03 1.64E-Ol 2 1.000 6. B4E-O;o· 2.42E-Ol 3 1.000 9.51E-03 2.BBE-Ol 4 1.000 1.23E-02 3.26E-Ol 5 1.000 1.51E-02 3.60E-Ol 6 1.000 2.02E-02 4.10E-01 7 1.000 2. 35E-02 4.40E-Ol B 1.000 2. 72E-02 4.72E-01 9 1.000 3. 14E-02 5.05E-Ol
10 1.000 3. 72E-02 5.47E-01 11 1.000 4.40E-02 5.93E-Ol 12 1.000 ~
..J. 19E-02 6.42E-01 13 1.000 6.21E-02 7.00E-01 17 1.000 1.0BE-Ol 9.09E-Ol 20 1.000 1.46E-01 1.05E+OO
216

ZONE: Wcpt-No FrCPllllzlIII MATERIALIASPHALT RU88ER MEDIUM
% of DAMAGE INDEX RUT DEPTH PLANE YEAR TOT.TRAF. totill total *% total totill*% DC-09 1 1.000 2.9BE-02 2.9BE-02 1.38E-Ol 1.38E-Ol
2 1.000 5. 66E-02 5. 66E-02 2.07E-Ol 2.07E-Ol 3 0.949 7.61E-02 7.22E-02 2.48E-Ol 2. 35E-Ol 4 0.848 9. 32E-02 7.90E-02 2.80E-Ol 2.37E-Ol 5 0.754 1.09E-01 8. 24E-02 3.07E-01 2.31E-Ol 6 0.635 1.34E-Ol 8. 48E-02 3.45E-Ol 2.19E-Ol 7 0.578 1.49E-01 8.63E-02 3.67E-01 2.12E-Ol 8 0.527 1.67E-Ol 8. 82E-02 3.91E-01 2.06E-Ol 9 0.482 1.87E-Ol 9.03E-02 4.16E-01 2.01E-Ol
10 0.433 2. 15E-Ol 9.31E-02 4. 49E-Ol 1.95E-Ol 11 0.390 2.48E-Ol 9.66E-02 4.B5E-01 1.B9E-Ol 12 0.352 2. 86E-Ol. 1.01E-01 5. 23E-(l1 1. 84E-O 1 13 0.315 3.35E-Ol 1.05E-Ol 5.69E-Ol 1.79E-Ol 17 0.229 5.51E-Ol 1.26E-(>1 7.34E-Ol 1.6BE-Ol 20 0.186 7.25E-Ol 1.35E-Ol B.39E-Ol 1.56E-Ol
I. of DAMAGE INDEX RUT DEPTH YEAR TOT.TRAF. total total *1. total total *1.
DC-l0 1 0.000 O.OOE+OO O.OOE+OO 2 0.000 O.OOE+OO O.OOE+OO 3 0.000 O.OOE+OO O.OOE+OO 4 0.000 O.OOE+OO O.OOE+OO 5 0.000 O.OOE+OO O.OOE+OO 6 0.000 O.OOE+OO O.OOE+OO 7 0.1)1)0 O. (>OE+OO O. t)OE+OO 8 0.000 O.OOE+OO O.OOE+OO 9 0.000 O.OOE+OO O.OOE+OO
10 0.000 O.OOE+OO O.OOE+OO 1 1 0.000 O.OOE+OO O.OOE+OO 12 0.000 O.OOE+OO O.OOE+OO 13 0.000 O.OOE+OO O.OOE+OO 17 0.001 2. 33E+OO 2.33E-03 1.05E+00 1.05E-03 20 0.006 3.06E+OO 1.84E-02 1. 18E+00 7.08E-03
I. of DAMAGE INDEX RUT DEPTH TOT.TRAF. total total *1. total total *1'.
8-727 1 0.000 O.OOE+OO O.OOE+OO 2 0.000 O.OOE+OO O.OOE+OO 7
'-' 0.032 1.91E-Ol 6.10E-03 3. 15E-Ol 1.01E-02 4 0.089 2.33E-Ol 2.08E-02 3.55E-Ol 3.16E-02 5 0.143 2.74E-Ol 3.91E-02 3.89E-Ol 5.56E-02 6 0.237 3. 35E-Ol 7. 93E-02 4. 36E-(l1 1.03E-Ol 7 0.281 3.74E-Ol 1.05E-Ol 4. 64E-(l1 1.30E-Ol 8 0.321 4. 19E-Ol 1. :::;.4E-Ol 4.94E-Ol 1.59E-Ol 9 0.357 4.69E-Ol 1. 67~-01 5.26E-Ol 1.88E-Ol
10 0.395 5.39E-Ol 2. 13E-Ol 5. 66E-Ol 2.24E-Ol 11 0.429 6.20E-Ol 2.66E-Ol 6.11E-Ol 2.62E-01 12 0.459 7. 16E-01 3. 28E-Ol 6.58E-Ol 3.02E-Ol 13 0.488 8. 38E-Ol 4.09E-Ol 7. 14E-Ol 3. 49E-Ol 17 0.556 1. 38E+OO 7.67E-Ol 9.18E-Ol 5.10E-Ol 20 0.586 1. 82E+00 1.06E+OO 1.05E+OO 6. 14E-Ol
217
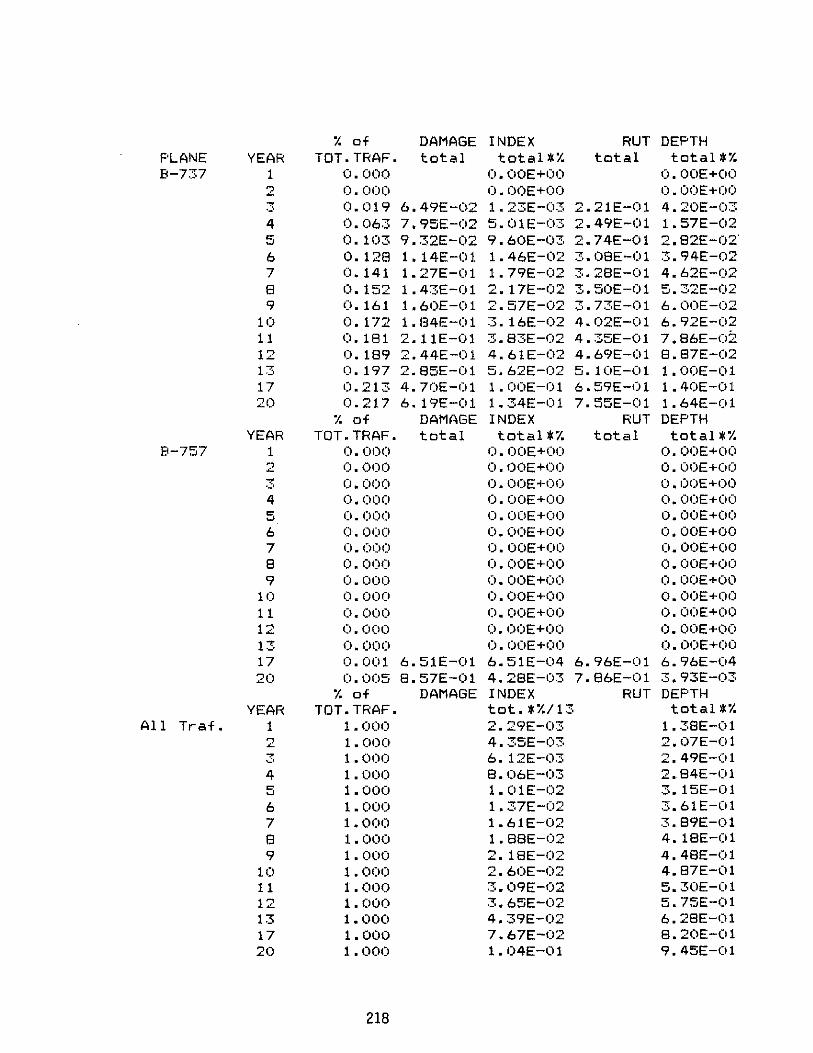
% of DAMAGE INDEX RUT DEPTH PLANE YEAR TOT.TRAF. total total*% total total*% 8-737 1 0.000 O.OOE+OO O.OOE+OO
2 0.000 O.OOE+OO O.OOE+OO ~
'-' 0.019 6.49E-02 1.23E-03 2.21E-Ol 4.20E-03 4 0.063 7.95E-02 5.01E-03 2.49E-Ol 1.57E-02 5 0.103 9.32E-02 9.60E-0::;. 2.74E-Ol 2.82E-02' 6 0.128 1.14E-Ol 1.46E-02 3.08E-01 3.94E-02 7 0.141 1.27E-Ol 1.79E-02 3.28E-Ol 4.62E-02 8 0.152 1.43E-Ol 2. 17E-02 3.50E-Ol 5. 32E-02 9 0.161 1.60E-Ol 2. 57E-02 3.73E-Ol 6.00E-02
10 0.172 1.84E-01 3. 16E-02 4.02E-01 6. 92E-02 11 O. 181 2.11E-Ol 3. 83E-02 4.35E-Ol 7.86E-02 12 0.189 2.44E-Ol 4.61E-02 4.69E-01 8.87E-02 13 0.197 2.85E-Ol 5.62E-02 5.10E-Ol 1.00E-01 17 0 .. 213 4.70E-01 1.00E-Ol 6.59E-01 1.40E-Ol 20 0.217 6. 19E-Ol 1.34E-Ol 7.55E-Ol 1.64E-01
% of DAMAGE INDEX RUT DEPTH YEAR TOT.TRAF. total total*% total total*%
8-757 1 0.000 O.OOE+OO O.OOE+OO 2 0.000 O.OOE+OO O.OOE+OO 3 0.000 O.OOE+OO O.OOE+OO 4 0.000 O.OOE+OO O.OOE+OO 5 0.000 O.OOE+OO O.OOE+OO 6 0.000 O.OOE+OO O.OOE+OO 7 0.000 O.OOE+OO O.OOE+OO 8 0.000 O.OOE+OO O.OOE+OO 9 0.000 O.OOE+OO O.OOE+OO
10 0.000 O.OOE+OO O.OOE+OO 1 1 0.000 O.OOE+OO O.OOE+OO 12 0.000 O.OOE+OO O.OOE+OO 13 0.000 O.OOE+OO O.OOE+OO 17 0.001 6.51E-Ol 6.51E-04 6. 96E-Ol 6. 96E-04 20 0.005 8.57E-Ol 4.2BE-t)3 7.86E-Ol 3. 93E-03
'l. of DAMAGE INDEX RUT DEPTH YEAR TOT.TRAF. tot. *%/13 total*%
All Tr-af. 1 1.000 2. 29E-03 1. 38E-Ol 2 1.000 4. 35E-03 2.07E-01 3 1.000 6. 12E-03 2. 49E-01 4 1.000 8.06E-03 2.84E-Oi 5 1.000 1.01E-In 3. 15E-Oi 6 1.000 1.37E-02 3.61E-Ol 7 1.000 1.61E-02 3. 89E-Ol 8 1.000 1.88E-02 4. 18E-Ol 9 1.000 2. 18E-02 4.4BE-Ol
10 1.000 2.60E-02 4.B7E-(>1 11 1.000 3.09E-02 5.30E-Ol 12 1.000 3. 65E-02 5.75E-Ol 13 1.000 4. 39E-02 6.2BE-Ol 17 1.000 7. 67E-02 8.20E-Ol 20 1.000 1.04E-Oi 9. 45E-Ol
218

ZONE: Wet-No Freeze MATERIAL: ASPHALT RUBBER HIGH
% of DAMAGE INDEX RUT DEPTH PLANE YEAR TOT.TRAF. totill totill*% total total *% DC-09 1 1.000 3.33E-02 3.33E-02 1.94E-Ol L94E-Ol
2 1.000 6. :~AE-02 6. 34E-02 2.76E-Ol 2.76E-Ol 3 0.949 8.52E-02 8.09E-02 3.22E-Ol 3.06E-Ol 4 0.848 1.C>4E-Ol 8. 84E-02 3.58E-Ol 3.03E-Ol 5 0.754 1.22E-Ol 9.22E-02 3.88E-Ol 2.92E-Ol 6 0.635 1.50E-(>1 9 .. 50E-02 4.29E-Ol 2.72E-Ol 7 0.578 1.67E-Ol 9. 66E-02 4.53E-Ol 2.62E-Ol 8 0.527 1.87E-Ol 9.87E-02 4.79E-Ol 2.52E-Ol 9 0.482 2.10E-Ol 1.01E-Ol 5.06E-Ol 2.44E-OI
10 0.433 2.41E-Ol 1.04E-Ol 5.41E-Ol 2.34E-Ol 1 I 0.390 2.78E-Ol 1.08E-01 5.79E-Ol 2.26E-(Jl 12 0.352 3.20E-01 1.13E-OI 6. 19E-Ol ..,
~. 18E-Ol 13 O.~515 3.75E-Ol 1.18E-Ol 6.66E-Ol 2.10E-Ol 17 0.229 6.17E-Ol 1.41E-Ol 8.36E-Ol 1.91E-Ol 20 0.186 8.12E-Ol 1.51E-Ol 9.43E-Ol 1.75E-OI
I. of DAMAGE INDEX RUT DEPTH YEAR TOT.TRAF. total total*% total total *1.
DC-H) 1 0.000 O.OOE+OO (l.OOE+OC) ~,
'" 0.000 O.OOE+OO O.OOE+OO 3 0.000 O.OOE+OO O.OOE+Ot) 4 0.000 O.OOE+OO O.OOE+(I0 5 0.000 O.OOE+OO O.OOE+(l(l
6 0.000 O.OOE+OO O.OOE+(I(l 7 0.000 O.OOE+OO O.OOE+(H)
8 (1.000 O.OOE+OO O.OOE+(>(l 9 0.000 O.OOE+OO O.OOE+OO
10 0.000 O.OOE+OO O.OOE+(lO 1 1 0.000 O.OOE+OO O.OOE+OO 12 0.000 O.OOE+OO O.OOE+OO 1"'" ~. 0.000 O.OOE+OO O.OOE+OO 17 0.001 2.17E+OO 2. 17E-03 1.41E+OO 1.41E-03 20 0.006 2. 85E+OO 1.71E-02 1.55E+OO 9.29E-03
% of DAMAGE INDEX RUT DEPTH TOT.TRAF. total total*i'. total total*%
B-727 1 0.000 O.OOE+OO O.OOE+OO 2 0.000 O.OOE+OI) O.OOE+OO ?
'-' 0.032 1.90E-01 6.07E-03 4.29E-Ol 1.37E-02 4 0.089 2.32E-Ol 2.07E-02 4.74E-Ol 4.22E-02 5 0.143 2.73E-Ol 3.90E-02 5. 12E-Ol 7.32E-02 6 0.237 3. ::!.3E-Ol 7.90E-02 5.64E-Ol 1. :".4E-Ol 7 0.281 3.72E-Ol 1.05E-Ol 5.95E-Ol 1.67E-Ol 8 0.321 4. 17E-01 1.34E-Ol 6.28E-Ol 2.01E-Ol 9 0.357 4.67E-Ol 1.67E-Ol 6. 62E-Ol 2.36E-Ol
1(> 0.395 5. 36E-Ol 2. 12E-'~1 7.06E-Ol 2.79E-Ol 1 1 0.429 6. 18E-Ol 2.65E-Ol 7.53E-Ol 3.23E-01 12 0.459 7. 13E-01 3.27E-Ol 8.04E-Ol 3.69E-Ol 13 0.488 8.34E-Ol 4.07E-Ol 8.63E-Ol 4.21E-(>1 17 0.556 1.38E+OO 7.67E-Ol 1.07E+00 5.97E-C>1 20 0.586 1. 81E+OO 1.06E+OO 1.21E+OO 7.08E-<)1
219

% of DAMAGE INDEX RUT DEPTH F'LANE YEAR TOT.TRAF. total total*% total total*% 8-737 1 0.000 O.OOE+OO O.OOE+OO
2 0.000 O.OOE+OO O.OOE+OO 3 0.019 7.41E-02 1.41E-03 2.80E-Ol 5.33E-03 4 0.06:3 9.07E-02 5.71E-03 3.12E-Ol 1.96E-02 5 0.103 1.06E-Ol 1.10E-02 3.39E-Ol 3. 49E-02 6 0.128 1.30E-Ol 1.67E-02 ::!,.75E-Ol 4.80E-02 7 0.141 1.45E-01 2.05E-02 3.96E-Ol 5. 59E-02 8 0.152 1.6::!,E-Ol 2. 48E-02 4.20E-(l1 6. 38E-02 9 o. 161 1.82E-Ol 2. 94E-02 4.44E-Ol 7. 14E-02
10 0.172 2.09E-01 3.60E-02 4.75E-01 8.16E-02 1 1 o. 181 2.41E-Ol 4. 37E-02 5.08E-Ol 9.20E-02" 12 0.189 2.78E-01 5.26E-02 5.44E-Ol 1.03E-Ol 13 0.197 3.26E-Ol 6. 42E-02 5.86E-Ol 1. 15E-0 1 17 0.213 5.37E-01 1.14E-01 7.38E-01 1. 57E -01 20 0.217 7.06E-Ol 1.53E-01 8.34E-01 1.81E-01
% of DAMAGE INDEX RUT DEPTH YEAR TOT.TRAF. total total *i'. total total *1.
B--757 1 0.000 O.OOE+OO O.OOE+OO 2 0.000 O.OOE+OO O.OOE+OO 3 0.000 O.OOE+OO O.OOE+OO 4 0.000 O.OOE+(lO O.OOE+OO 5 0.000 O.OOE+OO O.OOE+Ot) 6 0.000 O.OOE+OO O.OOE+OO 7 0.000 O.OOE+(lO O.OOE+OO 8 0.000 O.OOE+OO O.OOE+OO 9 0.000 O.OOE+OO O.OOE+OO
10 0.000 O.OOE+OO O.OOE+OO 1 1 0.000 O.OOE+OO O.OOE+OO 12 0.000 O.OOE+OO O.OOE+OO 13 0.000 O.OOE+OO O.OOE+OO 17 0.001 7. 14E-01 7. 14E-04 9.33E-01 9.33E-04 20 0.005 9.39E-01 4. 69E-03 1.03E+OO 5. 13E-03
I. of DAMAGE INDEX RUT DEPTH YEAR TOT.TRAF. tot. *%/13 tot al *i'.
All Traf. 1 1.000 2.56E-03 1.94E-01 2 1 . 000 4.87E-03 2.76E-01 ?
"-' 1 • 000 6.80E-03 3.25E-Ol 4 1.000 8.83E-03 3.65E-Ol 5 1.000 1.09E-02 4.00E-01 6 1.000 1. 47E-02 4.54E-01 7 1.000 1.71E-02 4.S5E-01 8 1.000 1.9SE-02 5.1SE-01 9 1.000 2.29E-02 5.52E-Ol
10 1.000 2.71E-02 5.95E-01 11 1.000 3.21E-02 6.41E-Ol 12 1.000 3. 79E-02 6.90E-Ol 13 1.000 4. 53E-02 7.46E-01 17 1.000 7.S9E-02 9.4SE-01 20 1.000 1.07E-01 1.0SE+OO
220

tUNt::: Dry-No Freeze MHleH1AL:AS~HALT CONCRETt:: LON1RuL
A B C 0 E "- of DAMAuE INDE.X t-/Ul I.IE.P1H
PLANE YE:.AR TOT. TRAF. tc.tai total"" total total"'" 1.1"';-0':1 1 1. lH.H) '=I. !:lUt:.-lll ':I.!:lOr:.-Ol 1. '<be-Ul 1.'<bt:.-Ul
2 1. uOU 1. 8bE-Ol 1.8bE-Ol c.1BE-Ol c:. 18E-Ul ~ u. ':;'<':! <:. ~lt:.-lll <:.~et:.-Ul O=.bOt::-Ul c.47t£-Ul
'+ u.1:I48 .5.0/£-u1 2.6oe.-Ol c.':I2E-Ul <:.4BE-1)1 ::. u. 1'54 :O.bOt:.-Ul d. ~/lt:.-I)l ".20e-lll i::.41t:::-Ul
b I). b35 4.41)£-(>1 2.7'::1£-01 3.5I:1E-01 2.2"1£-1)1 I U.tlltj '<.9lt:.-U1 2.tJ4t::.-Ol 2..!:lOI:.-Ul ,~ .... 19£-Ul
d U.521 5.51 E-CIl 2. ':WE-01 4.04£-01 <:. 13£-01 '=I I).,+e~ b. Ilt:.-Ul <:.91t:.-Ul '+.29t:.-01 <::.07,e-u1
11) U."f..:S.3 7.01:1£-01 3.0-1£-01 4.51E-01 0:::. 00t::-1) 1 11 u. ~':ju e. 1be-lll 3. let::-lll 4.'::15t:.-Ul 1. 94t:.-u1 1e:: 1) • .5='2 ':I.'+I£-U1 3.31£-01 t..3,+E-Ol 1.88£-01 I"> U.315 1. lUt:.+lJU :0. '+ 71:.-ul 5. hIe -Ul 1. 1;2t::-1) 1 11 u. ~2':3 1.8<:E+OO '+. 1bE-01 7 • .51:1£-01 1. 5'=lt::-1)1 CU U. Il:1b a::: . .;s':lt:.+lKl 4. 44t:.-Ol i:I.40t:.-Ul 1.t.bl:.-Ul
" of I.IAMAl::it:: IND£X Hur DE.PTH Yt:HH I U r. 1 HAt- • t I:.t a 1 total"" t Cot al tc.tal"l<-
DC-II) 1 u.uuO O.UUE.+OO I). uOE+()(>
C O.uuu u.UOI::.+UU O .. uul::+OO .3 U.Uur) u.OC)E+uO O.OOe+I)O '< U. l)UU ll" UU1:.+00 O.OUt::+Oll =-; U.UUU U.OO£+OO o.OOE+UO b (I.OUU ll. uut:.+(JU l). uOE.+uO 1 U. (JUU I).I)()£+OO O.UOE+OO e u.uuu U.UOt:.+Ou O.uut::+OO ':! u.UUO O.(lOE.+Ou u.UO£+OO
10 U.l>UU O.uOt:.+(I0 ll.OOt::+110 11 O.uuO ll. OOE. +lH) u.LlOE+OO le:: u.OOu L>.uOI::.+OO (I. llO£+OO 1':; U .. OI)O L>. ()lIE +00 O.L>O£+OO 1 I U.OOI 'I. tl'::lI:.+Oll I. i:l9£-ll3 1. 20t::.+ (l() 1.201=.-03
2u 0.006 1.0'+E+u1 b.2~£-02 1.3'+£+00 tl.Olt::-U3 l<- cl ," JJAMHL:;E:. 1 NDt:: X RUT 1.It::~TH
rur. TkA~. total total"" total total"" .tI-1i:::! 1 O.OUI) o.uOc.+ou O. UlIt::+lH')
c: l).uOO O.OU£+(I(1 u.uut::+I)()
3 u.lI2iC: b.3'::it:.-lll 2.o4t::.-u2 :0. 481:.-Ul 1. 111:.-l12 '+ (). lI8:! 7.8<:E-01 o. l~bE-U2 3.8~£-(I1 3.47£-02 5 lI. 143 9. 111:.-111 1.311::.-01 4. 25t:-Ul 6.08t:.-(12 6 l).i=:37 1. 12£+(10 2.6bE-(I1 4. 74£-01 1 • 12E-()1 'I 0.281 1. c:::'1::. +00 3.e>21::.-1I1 ::'.02t::-ul 1. 41E:.-1l1 8 (). 321 1.40E+00 4.51E-Ol 5.33£-01 1. 11E-Ol 9 O.3'b1 1. e>71:.+00 !:>.b1E:.-Ol 5.66£-01 2.02E-Ul
10 1I.395 1. 81E+OL> 7. 131::-01 6.07E-Ol 2.40E-Ol 1 1 ll. '<2',; 2. tJi:h£+(HJ 1;.92£-01 b.e>21:.-1I1 2.!:l01:.-01 12 u. ,+5';3 2.4uE+OO 1. 10E+00 7.0UE-Ol 3.21£-01 13 ~I. '<81:! 2. I;J E.+OO 1. 37t::+00 7. 56e-Ol 3. 69t:.-lI1 11 u.556 4. 63E+OO 2. 57E+00 '3.5I;E-Ol 5.33£-01 0=0 ll. !:I8b 6.091::.+00 3.571:.+00 1. 09t::+(IO 6. 37E:.-Ol
221
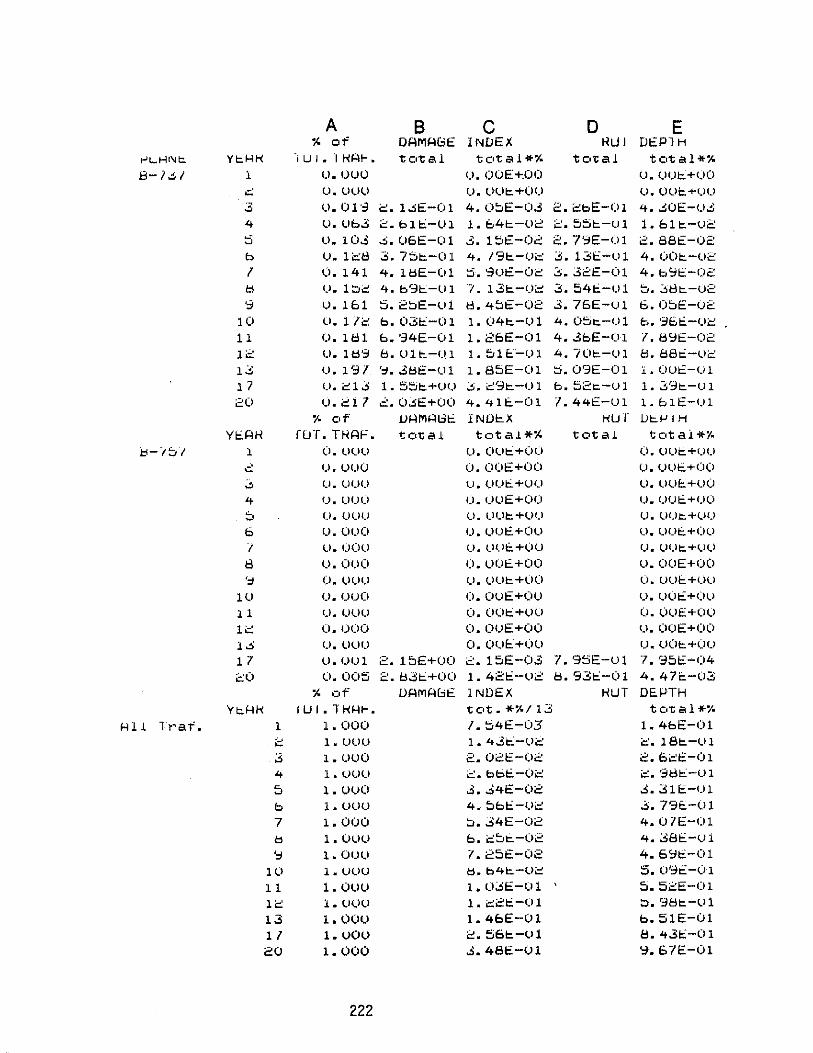
A B C 0 E " of DAMAGE INUEX HUI DEP1H
t""L.Ht\lt::. n:.HH j U' • IHAt-. t Cit a 1 tc,t a 1 *" t c,'c a 1 tc,tal*" B-i.,1 l U. IJUll I). OOE+,OO U. lllll::.+ll(l
0::: ll. llUll ll. 1I111::.+1I1-, l).OOt:.+UU .:, U.Ol':3 2 . I.,E-Ol 4. (I::'E-O.3 2.2bE-Ol 4.~OE-()':;
4 ll. llb3 2.blt::-Ol 1.b4t:.-lJ2 2.~::;t:.-Ul 1. bll::.-u2 ::5 1I. 10.3 .3.U6E-Ul .3. 15£-02 2.7'::IE-01 2.88£-02 b 1I. l<::tl 3.751::.-01 4. 19t:.-uc: 3. 13t::-Ul 4.00t:.-U2 I O. 141 4. lcsE-UI ::1. ':3uE:-02 2i.32E-Ol 4.b91:::-02 /:I u. 1:;:)i=! 4.b91::.-1I1 't. 13t:.-Ui::: 3. 54t::.-U1 ~ '"' . ~8t:.-u2 ':1 1I. Ibl :5.2::'E-1l1 tI.4::'E-02 3.75E-lll b.O::'E-02
10 1I. 1 l i:: b.031:::-01 1. (l41::.-U1 4.0::.it:.-Ul b. '36t::.-u<:: 11 u. Itl1 b. '34E-01 1. 25E-01 4 • .3bE-Ol 1.1::I9E-02 12 (.I. 1/:1':" 1::1. 1I11::.-I.!1 1. 511:::"-1) 1 4.7UI::.-Ul 1::1. 88t=.:-Ui::: 12; o. 191 '':I • .3 1::1 E-I) 1 1. 85E-Ol ::;.03E-Ol 1. out:::-() 1
17 U.i:::l.:l 1. 55l:.+uu ~.i:::9t::.-CJl b.52t:.-Ul 1. 39t::.-Ul
20 u.217 2.0..sE+(lO 4.4lt:.-Ol 7. 44E-Ul 1. blE-I.>1
" of uA MAt.:.l 10 I NOI::.X HU r iJl::.J.lIH Yt::.AH ruT. THAI". tCI'tal total*" total tCltal*/,.
}:i-/t,,'1 1 (I.uut> U.Ollt:::+Oc) O. Ul>t::'+UU
.:: u.uuU O.OOE+OO u.()ut::.+OO ~ u.uuu u.()()t:..+1I0 1l.1I11£::.+UO 4 ().UUi) u.()uE+OO IJ.UUI::.+C)() ~
-' O.lIUU u.tJut::.+uu U. lH).t:.+l)O
b u.uuO U. l>Ut::.+OU U.llUt:.+OU I u. ()OU o. lH .. lt::.+(JU U.OUt:.+llC)
tl C).ouO U.UUI:.+OO ll.OOE+OO '':I O. lHJU U.l>Ut:.+(JO (J.UUc+()U
III O.OUt) O.OllE+OU u. OU~+Oll 11 U. llC)(J O. (IUI:::+lIU O. llllt::+UU li:: 0.000 U.OIJE+OO u.OOE+(lO 1"; U.UUU O. (>I)£::.+UU u.UOt:::.+(lu 17 1I.I)1I1 2. l~E+U(l 2. 15E-03 7. 95E-U1 "1.951:::-(14 20 0.005 2.~3~+(JO 1. 42t:::-02 B.93t::-(Jl 4.47<:'-03
~ of DAMAGE INDEX HUT DEJ.JTH VI::.HH I U I • T HHI-. t Cit. *;;. / 13 t CIt; a 1 *i'.
Hll l,'ai. 1 1.000 1.::'4E-03 1.4bE-01 2: 1.1I1111 1. 43t::-0i=: '-' ~. 181::.-U1 3 1. I)1I0 2.02E-02 2.6~C:-Ol
4 1. lH.JU 2.bbt:.-Oi:::: c. '38~-U 1 5 1. vvO 3.':;4E-02 ~.31t::-Ul
b 1 • 1I11l1 4.~bt::-()i:: 3. 73£::.-U1 7 1.000 ~ • .34E-02 4.01E-Ol to I.UlIlI b.c~c.-02 4. 38t::-I,.Il ',; 1.0Ull 7. 25E-02 4.5":110-01
HI 1.1I11U tj.b4t:.-Ui:::: 5.(l~E-(l1
11 1. Ollll 1.U:.>t::-Ul 5. 52E-Ol Ii::: 1. lH.)U 1.~2~-Ol ;:).381::.-1I1 13 1.0011 1.4bE-Ol b.51E-01 11 1. VOll i:::.561::.-lI1 8.431:::-01 20 1.000 ~.48E-Ol '::l.67E-01
222
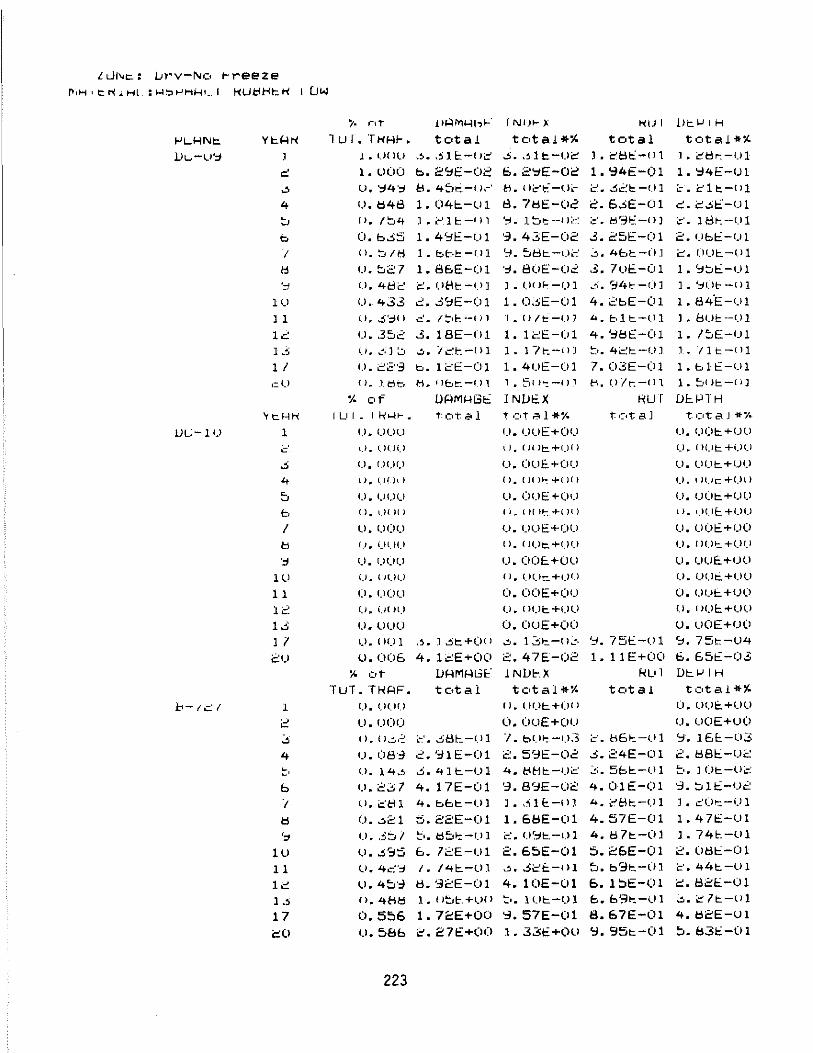
LLJ"c:.: ut"V-I\ICt t-reeze f"1-1 ' en..j. Hl : ~~~HHt_. I I'<Ut<Ht:;1'< 1 U"l
~. n~ HAM"-Ibl-" fNIP-X I'<IJI Vt:;\.JIH fo'LHNt:. YI:.H~ 1 u I • TI'<HI-. tc.t a 1 tc.tal*" total total"''' lJL";-u':; .1 • t.H IU ~~. ,0) 11::.-( h:' .5. ,,1 I:.-uc I • i:'!:1~ -Il 1 1. c~r-:-l)l
.:: 1. llOO b.2~E-02 b.2':1E.-02 1 • ':l4E -01 1. ':14E-I)1 ~ ll. ':14'~ ~. 4::-1/::.-( ),-' H. (Ic't:: -(h- i:"' • .:;";2t:-Ul i:. i::'l~-(Jl
4 I.>. tl48 1. (l4c-lll 8.7!:1E-U2 2.5';;E-01 c::.~~t::-()l
::, Il. /04- 1 .. i:-' 1 t: -I J 1 ':; ~ 1 !:.It; --I k·: i::' .. t\'3t=: -(») c'. I !:II-: ·-1.>1 b (l.b'::::; 1.4':;1:::-1.11 ':3. 43E-02 3.25E-Ol 2. I)bE-1) 1 I o.!J/H 1 • btc.do -Ill '~. ~t:H:: -Ui.-:' :::-. 4bl:. -().1 '~
~. {,JUt:. -() 1
tI U.~27 1. 8bE-01 '~. 8UE-(l2 .3 .. 71)E.-Ol 1. ':1=..t::-Ul ':'} U.4tjc C:: .. 1,1t1t:.-U] l.()()~-{)l .. ~ •• 941:--0] ] .. I::jUb --I) 1
ltl U."t33 ~.3~E-(l1 1.0,5E-U1 4.2bE-01 1 • 84·E. -I) 1 I 1 l.l. ,j ':::H I c'" I!:'r: --I i 1 l.O/t::-Ul 4. b11::-I.11 l. bl)t ._1) 1 1':: u.3~2
, ~. 18E-01 1. 1 ;'-:E.-(> 1 4. ':;BE-Ol 1. !!:JE-Ul
1 ~~ u • .:') ~I ~. /c:I::.-{) 1 1. 17t-.-o) ~'. 4cl::.-UJ , . lIe-tIl
1 I 1.1. 2c":3 b. 1 i::'E-O 1 1.4I)E-01 7.03E-01 1. b1t:-Ul ,=U II. l~b 11 .. iJbt'.-fll , • ~}I ''': -f 1 1 1-1. I) /t. ... -(J 1 1. =.rl H:.-( IJ
1- of ORM~GO: INDt:X RU r De.PTH 'Yt:.Hh: I U r .. I h'1-H- ~ T. CIT. 20 1 toti::ll*i'- t c.t a] t.otaJ*'l·
IJL-l1'> 1 I.I .. U()U U.lJuE+UU u.u(lt:..+()()
c U .. U(JI.l t J. ()( 11::.+(.)( 1 U .. (IUI::.+()U
.5 (l. fH)U U.OuE:.+(lU U.UUt:.+UU 4 II .. I,H). I O. ()f)!--:+i){1 I)" ,li.lc: +UI I
::. U.U()U u.OUE+(I1) U.O(lI::.+UI)
b (l.I.)(JI) Il.I)fH::+(J(1 I) .. '.)(.lE:. +t>U
I u.uUU (.l. UUE+f)f) U.UOi::+UO tl (I. I)!.)!) (l. (J()t:.+(}f) U .. {IUt. +()U
':1 IJ.UUU U.OOE:.+uu u.IJuE+UU
III (l.IIt)!) (I. UUt:.+IYI U.UUI::.+f.lU
11 O.UUU O.OOE+(lU O.(Jut:..+UO
Ie: U.i.j()() u .. IH.lI::.+!)U u. (IUE:.+UU
1.5 u.uuu O.OuE+(lCl 1l.uOE+u(l ] 1 I). (HJl " . l..:;t:.+(HJ ~. 131::. -(J.:, '::4 .. 75E-Ul "'. 75t::-U4
2u U.O(lE. 4. lcE+(JO 2.47£-02 1. 11 E+(>O b.b5t:-03 l< of'" liHM~G~' J NDI:-. X RUl D~\.JIH
TuT. TRRF. tot a 1 tc,tal*% tota.L total*~
b-/c.1 1 (). U(H.l 1 J. (1)1::. +I.)() U.U{)t:.+I.lU
2 o.uOI) O.OuE+(>1) IJ.I)OE+UO ;" () .. (),.::.,,':: i.-:' • ..:;t.1t::.. -PI "1. bl)": -1)3 c' • H5f::-U1 '::l. lE-e.-1.>3 4 I).08·:J 2.'!::IIE-Ol 2.5'='E-02 3.24E-Cll 2.~81::.-U2 ~ I). 14~ .3.41t::.-C)1 4. t::H-II::.-Ui::' 2;. 5bl:.-f) 1 ~ JOI::.-Ui::' " -'. b 1).22i7 4. 17E-Ol '~. 8':iE -1)2 4.01E-Ol -:J.::'lE-1)2 / f.l.i::'el 4. bbt:.-I) I ] .. ,1 f,.-Il J 4. ~-:'8t.-()1 I • d(lt-:-Ul
tI 0 • ..::..21 ti.22E-01 1.5!:1E-01 4.57E-U1 1. 47t:-1)1
'" I). 3tJ I ~I. ~!:tIo:.-l.Il i,:::. I.I~"~ -t) 1 4.!:l71:.-0] 1. 740.-01 III O.~9:5 b. l2E-l)l 2.5::'E-01 S.25E.-Ol 2. Ot:H:. -01
11 lI.4t:'";':j { . f41:.-111 ,!1 • .5i::'f:. -t' 1 t..b91:.-l>l i:::'.44!::.-Ul
Ie:: 1I. 4~'~ !:l. ':32E-(l1 4. 10E-Ul 5. I~E-Ol <::.l::I2e.-01 J., 1l.4t-1t1 1 • (lOt:". +I)() ,'. lUt:.-I)} b.b9"'-01 .!o.c7!::.-ul
17 0.5::'5 l.72E+OO -:J.57E-01 a.o7E-01 4.t:l2E-Ul
<::U u.58b ii:'.27E+OO 1.33E+Oll ':1.9510-01 ~.~31:::-01
223

" of DAMAGt:: INDEX RUr DEPTH j..JL. Hr\lt-. Yr:.HR I U I. IRH~. t Cit a 1 tCttal*y.. total tc,t a1 *7. I!-I..,I 1 I). (lOll O. UUE +lll) IJ.lIlIE+O(l
i::: u.uuu U.l>UI::.+UU U.Ul>I=.+UU
~ ll. U1 ':i 1. 10:::1::-(12 1 • .3:;;;'E-OJ c:.01E-(i1 ~.~~~-()~
4 C).OO.j 1:1. "li:::t:.-UC ~. 4':iH:.-u3 2.2l:H:.-Ul 1.441::.-1)2 ::-, u. l(l~ 1.0e:E-Ol 1.U~E-02 2.51t:::-Ul C.:5S1I::.-UC b I). lc~ 1.i:::!:JI::.-Ol 1.bUr:.-Od e. tj 4 1::.-1.1 1 2,. b31::.-ui:"~
1 o. 141 1. 4uE-(.11 1. '371::-02 3.0~E-Ol 4. C:7t::.-Uc~
1:1 u. 1~C: 1.:::.71:.-<.>1 c:.~8t:.-uc ~.i:::4t:.-(,)1 4. 92!:.-u2 ';j U. lbl 1. 7~E-Ul 2.I:Ie:E-02 ":::;."+~t:-Ul ~.obE-()i:::
1U u. 1 Ie: 2.U11=.-1)1 .,j.4bl:.-Ui::: " ~. 74tO-Ol b. 4~t::-llc: 11 u. 11:11 c:.2i2E-OC: 4.i:::uE-O.3 4.1)~C:-Ol 1 • ':';.:i~ -uc:: 1.::: u. 11:1':1 i::.b~I=.-Ul :J.Ubt:.-Oc: 4."'I:It:.-01 tl.i:::C:St':.-Ui::: 1.:; IJ. 1';) 1 , l..!iE-Ul b. 1-/E-U2 4. 7!:1E-01 'j.41E::.-u2 ~.
1 1 U.i.:.'l~ ~ .,. 1 t,::,t:,-{) 1 1 • 1 ()t:.-u 1 b. i::c~t:.-f.I1 1. :.!-..!.ot:.-Ul
2u O.C:17 b. 7';jE-01 1. 47E-01 I. 1 bE-I.I1 l.::.~t:.=.:-Ul
:;< of UHJYlHbt:. 1 NUl:. X kUI VI:. fJT H YI:oAR TO'!. Ir(H~. t c,t a 1 tcotal*" tCIt 131 tcotal*"
Ct-I="/ 1 C). LIDO (). OCJb~ +(H) 1I.UOt:.+l)u e: I). (1)0 u.OI)E+OI) 1I.UUI::.+UU ~ o.U()u u.out:.+uu 1I.uOt:.+(l(J 4 l..I.uOu U.OUE+(JU o.(JUE+OO ~ ..J u. tJUU (J.OOt::.+th) (I.LlUt:.+UU b lJ.uUu u.uuE+OO u.uuE.+uO 1 U" U!JU (J.t1Ul:.+i)U U. f)Ut:. +()u
1:1 u.UOu O.OuE+uu CJ.uUE.+(JU ';j u.ouu u.uot:.+()() u. Utlt:.+t>U
lU u.()Uu u.OuE+OO u. c)uE+uU 1 1 o. UU() (J. (,.HJt:::+()U u.uut:.+U() 1e: u.uuu U.OUE+(Jt) 0.(1(1£+00 13 U .. Ulll) u.U()~+U() C.J. U()t:,+(H)
11 U.OUl 1.4c:t:-Ol 1.4e:E-O,+ '9.6.1 E-Ol '~. 011:0-«4 i::.l) u.ut>':) ':J • '1bl:.-01 4.I:II:II:.-U~ 1 • ()~t:. +lH) 5. 2..'::j~-lI2i
" Clt- VAJYlHl;;1:. INDEX RU i' DEPIH Y:::'f-iR I U I • I H'I-U- • t CI't .. *"-/1"::; tot al *"-
H.l I ,'a T. 1 1. uuu c:.54E-U.3 1. 21:11:.-U 1 i::: 1. uou '+.1:I41:.-u3 1. ':1'+1:. -u 1 .., 1 • lIlllJ b.!:IbE-u';; i:::."::;4t=.-Ul 4 1 • lH)U ':I • 1/1:.-U';' 2.bbt:::-1I1
::J 1. uOU 1. 1bE-U2 1.:::. '::I5£-u 1
b 1. Ol)U 1.bll:.-U2 ';;.~1:lI:.-Ul
7 I.UOO 1. '9ul:o-u2 ~. 63E-(.11 t; 1. lH)U ~.C:~t:.-uc: 2i. 1::I1t:-Ol ';j I. U(JU 2. :5 1:"E-02 '+. 19E-U1
lU I.liOU .:i .. Illt:-02 4. ::'7t:.-l)1
1 1 1. UlIU ~. 41 E-(J2. 4.':i7t::-U1 Ie: 1. .. t.H)U 4.4Ut=.-U;:: ::S.40t:.-Ol
1.3 I • Uf)O ::' • .3uE-02 ::-'.':i11:o-f.l1 1 1 l.OllU 9.31E:::-t.')c 'I. 7l:1E:;-ul i:::U 1. OOU 1. 27E-(ll ':i.uuE-Ol
224
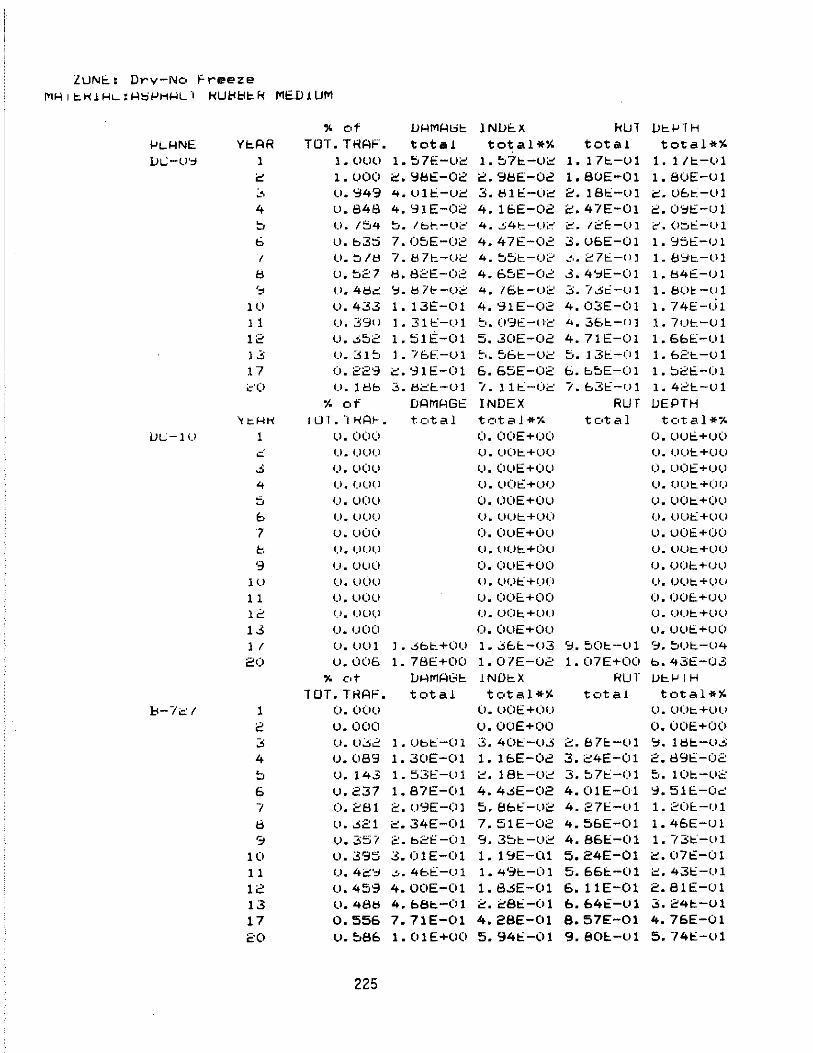
LUN~: Dry-No I'-reeze M" I ~"l "L-: "o",H"L"1 I-(U"I:H:. f( MED1UM
,. of V"MI-lt.;~ INVE:x f(UT Vt:.",TH ",L"NE Y~AR TOT. TriAF. total total*" total total*" VL.:-U':i 1 1. UUU 1.~7E-Ui::: 1.o7t:.-O~ 1- 17~-lll 1- 1/~-U1
~ 1. vOO ~. ';:H:It:: - 0 2 2.9I:!E-02 1.80E-01 1.BUE-vl ~, u.'ii49 4. Ult::"-ll~ 3.!:\II::-U~ 2. 181::-1'>1 ~. 06~:-U1
4 1l.848 4. '::l1 E-02 4. lbE-02 2. 47E-Ol 2. O':;t::-I) 1 ~ u. /::,£+ ~. Ibt-.-Ui:"' 4."::';41::-Ui::' "J c. 12f:-1) 1 C'.O::Jt::-Ul
b u.b3::5 7.0e,E-02 4. 47t::-02 3.ubE-01 1. "::I 5 t:::-u 1 1 U. !J/l:;j 7" tj 7~-()i=' 4,,~OI::.-1)2 '!'" 27t::.-lll 1. I:!':i~-Ul
/:l u.027 ~.82E-02 4. 65E-02 .3.4':iE-01 1. !:!4E -I) I ':, (I. 4tk:: '-.j.~71::--()2 4. 161::-02 3./.;jti-ol 1. 81.>", -pi
III U.433 1. 13E-OI 4.3IE-02 4.03E-Ol 1.74E-l.il 1 1 u.39U I • 31 t:: -1.>1 t:1" O':lt:::-Ui=' 4.36"'-"1 1. 7U~-1)1 12 1l • .:.i~2 1. ::;1E~:-OI 5.3C>E-02 4.7IE-Ol 1. Gbt:.-UI ] 2; u.31::' 1.lbE-UI tl. t,bc.-OC ~
..J. 13t:.-(l1 l.b2~-ul
17 o. 22'9 c. ':ll E-01 G.G5E-02 b.b~E-Ol 1.~2t:.-1)1
cO u. l!:lb 3.~i.:::E:.-Ul -I. lll::.-Uc l.b31::-01 1. 42t:..-t11
" of DAMI-lGt:: INDEX RUr VEPTH 'y~HH IUT."II-(Af-. total tCltaJ.*~ total tot. C\ 1 *i'o
LJL;-IU I u.OOu O.OOE+UC> U.UvE+I)O 0=: U.I)UU 1I.UOt:.+uo u.uu£:.+uu .3 ().uOu u.OUE+OU U. UOl:::+I)U
4 i).(lUU o.oOt:::+oCJ U. (.JUt::. +(If)
::5 U.U(lu O. UOE+Oll u.uOt:.+(Iu b I). litH) u.UUI=.+O<) u. UU~+lIU
7 o.uoo O.OllE+Oll 1l.1l0E+UU e !.I.U!)!) U. '- IUI:_ +ou U.UUt:.+UU '~ u.uuU O.OllE+OO O.U(ll::.+Ut.)
III u.uuu O.UUI:::+(JO U. (JUt:. + (..I U II U. lHJU 1l.00(:+00 O. OOE:. +Ut)
12 (). uuu U.(JOI:::.+(JU u.UUt:.+lIU 1.3 U.uOO O.OOE+Oll u.uut::.+uO 1 1 ll.lllli 1 • -Sbto +OU 1.~bt:.-u3 SJ.=-Ol::.-lll (~. tJOt:.-U4 20 1l.005 1.7BE+00 1. 0/E-U2 1.07E+00 b.43t::-U3
"- c,t VAMAGt:. lNDt:.X Rur IJt:.",IH 1 OT. TRAF. total total*" t Cit a 1 total*"
1:<- -I 0=: 1 1 O.OOu 1I. 1I0E+(H) U.U()t:.+ou
2 v.OOO 1l.00E+1)0 O.OOE+OO 2; (). l>2i2 1.l)bto-OI 3.40t::-o.3 2.87£:-(>1 '::I. l!:!t:.-O-S 4 u.089 1.30E-(l1 1. 1bE-02 3.c4E-01 2.B9E-02 ~ 0. 143 1. 53!:::-u1 'J
~. 18t:.-u~ 3.~7t::-Ol ~. 10t:.-u2 G v.237 1.87E-01 4.4.!SE-02 4.01E-01 ':1. 51E-0c: 7 0.281 2. 1)':lE -01 5.8bt:-:-1)2 4.271:::-01 1. 2CH:. -C) 1
!:l 0.'!s21 ~.34E-Ol 7.5IE-02 4.5GE-01 1.4GE-ul ':I 0.357 2.b2t:-Ol 9.3::'I::.-U2 4.8Gt:.-01 1. -/3t::-u 1
10 U.395 3.01E-01 1. 1'::iE-01 5. 24E-01 c.07t::-01 1 1 o. 4i::'~ o:..4bE-Ul 1. 49t:.-01 5.GGt:.-01 i:::.43~-()1
12 0.459 4.00E-01 1.8.3E-(l1 G. llE-Ol 2.81E-U1 13 1l.48t:! 4.b8t:.-Ol 2.2810-01 b.b4t::-01 2;. 24t:.-v1 17 0.55G 7.71E-01 4. 28E-01 8. 57E-01 4.7GE-Ol 20 v.586 1. (> 1 E+(IO 5.941::-01 9.80!:.-lI1 5.741::-01
225

'" crf l!I .. 1 M f-l G~. lNUEoX Ru·r DEoI-'TH I-'Lf-lNE YEoHR fLH. TRAF. total total*" total total*'" b-I~I u. UUU I) • UUE:.+UU I). lJut:.+UI)
i=: o. 000 I). UOE+Ol) I). U<'JE+()I.)
,e. I) • U:1 ':J ',' 411::.-()~::' b. 41::H::.-04 1. ~41-:.-Ul 3. btU': -( 12; ~.
4 u. 053 4. 1l::iE-U2 . .,;. ~. 6~E-O,3
..;. ~. ~()E-(ll 1- 2,8l::.-UC:
~, u. 102; 4. '::IUI:::-(h.-:' ~
~'. utrl-;-()..j . ... ~. 4d~,-U] ~-:: . 4':J'=,-Uc
b u. 128 b. uOE-U2 I. 5/E-U3 ' .. ' ~. 72,E.-01 ..
~. 4':Ji::.-UC:
I d. J41 b. II)I::.-(k' '''1 ~ 441:-:.-(),~ i=: • '~l ~.'''U 1 4. 111::.--1)2
tI u. 11... "-' ...I~ I. ::ilH:: -02 1. 14E-02 " ~. 11E-Ul Lf • 1,jI:::-UC:
',.. (I. Ibl b. 4Ur-~ -Ue: 1. .~;::-J!::.-()i:": ':'. ':;ct:-() 1 ~ 3::..t:.--ui::. ...I.
10 \). 172 ':J • b::)E-02 1- bbE-(l2 ':'. :)~E-tll b. 1l:lEo-OC' 1 1 (l. 1t11 1. 11i=.-U.1 .~
L • ( lli::.-{);::: d. tI':!o: -U 1 I. U4t:.-UC·
Ii::: u. lB':! 1. C'l:lE-01 2. 4;;::1::.-02 Lf. 21~-(l1 I. f::1~t:._C)c:
1~ (I. 1 ':I I J • ::rUe -(I 1 c:. '-:lbl::.-()C' 4. ::''='I::. -f) 1 '~. ()2t:.-u;;::
17 U.i=:l.3 c.4/E-01 ~. .J. 2"/t:-OC: ~.
...I. l~tJE -(11 1. ciJ::.-Ul
i::U l). cl I ~. c::rt:. -l).1 I • (lbt-:.-(}c' b. d~~:-UJ 1. 4l::H:".-(11
" c,r UHMHGE INUEX HU r DEPIH Y<=-H" 1 IJ I • IHHI-. tot a 1 t Cit a 1 *i<o t: ot a 1 tot a 1 *7/.
0-1':;/ 1 !l. UOO o. UUE+()u u. O(JI::+UO
'" (l. (JUt) u. UO!::+()(,1 o. UUI:::+UU
,:, ll. ()UO u. UUI::,.+(iU ll. OOI::+C)u .. P. (JUt) (). UUI::.+UU o. (JU!::+I)U
::. U. UOli u. UOE+(HJ U. UOI::.+UU b u. UUI) u. OUt::.+()U C). uot:.+I)U
1 u. UOO u. OUE+OU u. UOt::.+uO e u. U(H) 1.1. UUt::.+(lU o. (lC)I::.+UU
'":1 u. lIUll u. OOE+(>O ll. UUt:.+uO 111 u. U()U u. UU!::+()U u. U()t:.+tll.)
11 u. U(JU I). UOE+(lO I). Out:.+Ul>
Ie () . (Jt)CJ (). (H)b..'+()( ) I). ucH::.+U{)
13 !J. UliU o. U(.lE+()U u. UUE.+Oll
1 I u. U(l.l " ., . 4Cjl:"_-U J ~;. 4eH-.. -l.l4 b. i::'~I-:-nl b. c:tJl::-u4 ell u. uc)::l Lf. ::l8E-C)1 c. 2':JE-(l3 l.O~E-(ll " ::'2t::-U~ " .
'Y. ot UHMHG" JNUI=X HU-I lJEo.., I H VE:.f-lH r 0'1 . T Rl-lt' • tot • *"/13 total*r.
Hll I }""'8 t. 1 1. 1..)( H .. ) 1. i:::ll::.-()~'!i 1. 1 11::.-(11
c: 1. llllll .~
~. 2'=JE-(l3 1. tlUEo-Ul .:! 1. U()O ':'. c'4t:.-t)..:S ....
~. 1'30:-01 4 1. Utle) Lf. ,~uE-O~ .~
~. ~2t=.-1)1 ~ ..! 1 .. I..IUI.I ':;. 41 t-:.-U.1 '. ~. tlle-UJ b 1- uoo I. 441::-03 3. i.::t.c-Ul
I 1. I)(H) 1:1. 14t:-{)~ ..'!i .. ::rUC.-lll
1:1 1 • UC)U 1.CJ2E-02 ..>. Il:lEo-Ul ;=1 1. uut) 1. 1 ':::It:.-I)c Lf. Ubt:.-Ul
III 1. UOo 1. 421:::-02 Lf. 43f.-ul 11 J . UUO 1 .. b'::it:::. -C)i::: Lf. 1l31=-U1 12 1. 000 .~
~. OlE-02 h .J. 261::.-Ul
1.?i 1 • UUU .~
~. 41t::.-Oi::: ~ ...I. Ibl::-01
1 1 1.OOU 4. 23E-02 I. 57t::-C) 1 2u 1. UOu O. lbEo-u(:! l:l. 74E-U1
226

lUNc: lJt"y-N() ",,-,."eeze r1'~ t t'" H.l ~L. : 1-'-:; f-.l· ... H-lt. 1 e(Ut:<j,i~e( Hll,H
"- Crf 111-1 fY1 1-11; 10 JN1110X HUI lJIo" I H j.JLHNc Vt:.AR fUT. HlAF. total total"''' total total"''' UL.:-' '':1 1 ) .. lJ(JU 1 .. '.::f'::1t:.-Ui::: 1. '~(:3E -0.::' 1.'+O£-Ul 1.'+'-'",-1)1
2 1. UOO .3. 79E-02 .3. 7'::lE-02 2.10E-01 2. lUIo-I)) .:, I.l ~ ':JL+ '::J ::'" 1)'7~. -(k: '+. t:\~~-Oi::.' c' .. =..()~ -I) 1 i.-: .. ..:=-t1t: -u 1
4 u.t:l4B 6. 24E-(J2 5.2':;E-(J2 2.1:32£-01 i::: .. 3SH::: -() 1 ~ ,I o. 1':::J4 I .. ..!i~I:::. -(lj::' ~.~cl:::.-Uc s. ()'::I';:-I)1 c.33f-:-Ul
b 0.b35 8. ':3~E-02 5. 58E-02 .3.4bE-01 2. 1'::lt:.-U) ( 1).=.,/tS ':;;. '::f'.::ft:.-uC' ~
...I. II::!Io-U':: ~.b7t-Ol c' .. lc~t:.-I)l
I::! 0.527 1. 12E-Ol 5.90E-02 .3.91£-01 2. 06t:.-1) 1
'" U.4~2 ).C'~I::.-(>l b.04t:.-IJi::' '+. 1 bt:.-I) 1 i:::.oUI::.-'(ll
If) u.lf.33 1. 44E-I.I1 5.24E-02 4.47£-01 1. ':1'+1:=' -I)) 11 u. 3';J( I 1. bbl:='-I) 1 b.471::.-<.lC' 4+.t:\21::.-Ul 1 • I:ltH: -I) 1 12 u.352 1. 91E-Ol 5.7'+E-02 c
...I. 19E-Ol 1.1:33c-01 13 CJ .. ~l::' c. C4t:.-I)1 I .. Obt:. -Ui::: tc,. b21o-1) 1 1. 1710-1)1
1 7 0.229 3. 59E-01 t:l.45E-02 7. 19E-Ol 1.65E-U1 i::'O I). l~b '+.I:lblo-Ul Y.o3t:.-oi::' 1:<. 19t:.-Ol 1. 52t:-Ul
l<- of DAMAGE INDEX RUT DEPTH 't:.He( I U I • IHHf-. t.ot a 1 total*'" t.ot a 1 tot a 1 *~
liL.:-I0 1 O.OO(J O.OOE+OO u.1.I0E+Ou C l).dUU U.UUI:.+otJ l).lJUI:.+OU
.3 U.UlIU O.OOE+Ou u.OOE+O(l -4 II. UUU I). UlH:.+Ou U .. (JOt:. +tH I
:;, 1.1.000 O.OUE+OO O.OOE+I)L' b I) .. OI,H) U.OOc+Oo U .. 001::. +(H)
7 u.L100 O.OOE+OO o.UOEO+I)(I 1:1 U .. UUU u.uut=.+UI) (). uut:.+I)U
'3 u.OOu O.OOE+OO O.OI)E+I)(I lU I)"UUU (I. UlJf:::.+UU O.UIJI=.+t)u
11 U.OOU O.OOE+OO u.OUE+Oll
Ie u.uou 0 .. UUI:.+tl(J U. fJUt:.+lH)
13 u.(>Ou O.uOE+(>O o. OUEO +')l' 17 U.OOI 1.'+l1o+UU 1.-41t:.-U"> 1. 15t:.+ou 1 • Iblo-u3 21.1 O.u06 1.I:3~E+OU 1- 11E-02 1. 29E+OU 7. 72E-03
7- ot lJI-IMHb~ 1 NlJl::X HU1 DE"TH rUT. THRF. total total"''' total total*lC.
~-h:: I J lJ. ()UU u.UUt:.+Ou ll.OO£+Ou
2 0.000 O.OOE+OO O. O('E +<)0 ;., u .. o32 1. l':lt:.-Ul 3.l:Ilt:.-L'''> .:i • .:i2t:.-Ol 1 .. UbI::. -lli:::
4 'J. 08'3 1. 45E-Ol 1.30E-02 3.73£-02 3. 32E-03 ~
" o. 1'+3 1. 11 t:.-Ul i:::.44t::-u2 '+.U8EO-Ol ~). ~41::.-0c
6 0.2".37 2.09E-01 4. 95E-02 '+.S5E-01 1.08c-01 -I U.<::ti1 c.~~I::.-Ul b.551:.-02 '+.t:l4t:.-Ul 1 • ..>bt:.-I))
8 u.321 e.52E-01 8.40E-02 5. 1~E-01 1.b5E-U1 '::I (J .. .!J~I c.. ~3r.-Ul 1.1)tJt:.-OJ :;'.'+/I:.-L'l ] .. '~~t::.-(Jl ,
1(' u.395 ..>.3bE-01 1.33E-01 5. 88E-01 2.321:::-01
11 U.~~':1 .:i.t:S~I:.-Ul I • b5~-(ll b • ..>21:.-01 i::' .. 11 t:.-U 1 12 0.459 4. 47E-01 2.05E-01 6.7'::1E-01 .!;. 1eE-01 13 0.481:1 :;'.23t:.-01 2.:;'5t:.-U1 7.351::-('1 ">.:;'';;jt:;-01 1 7 0.556 8. 52E-01 4.7':1E-01 9. 35E-01 e..20E-01 ;.::0 0.586 1. 131::+0u b.b5E-Ol 1.0E>I::+UO b.221:='-(·1
227
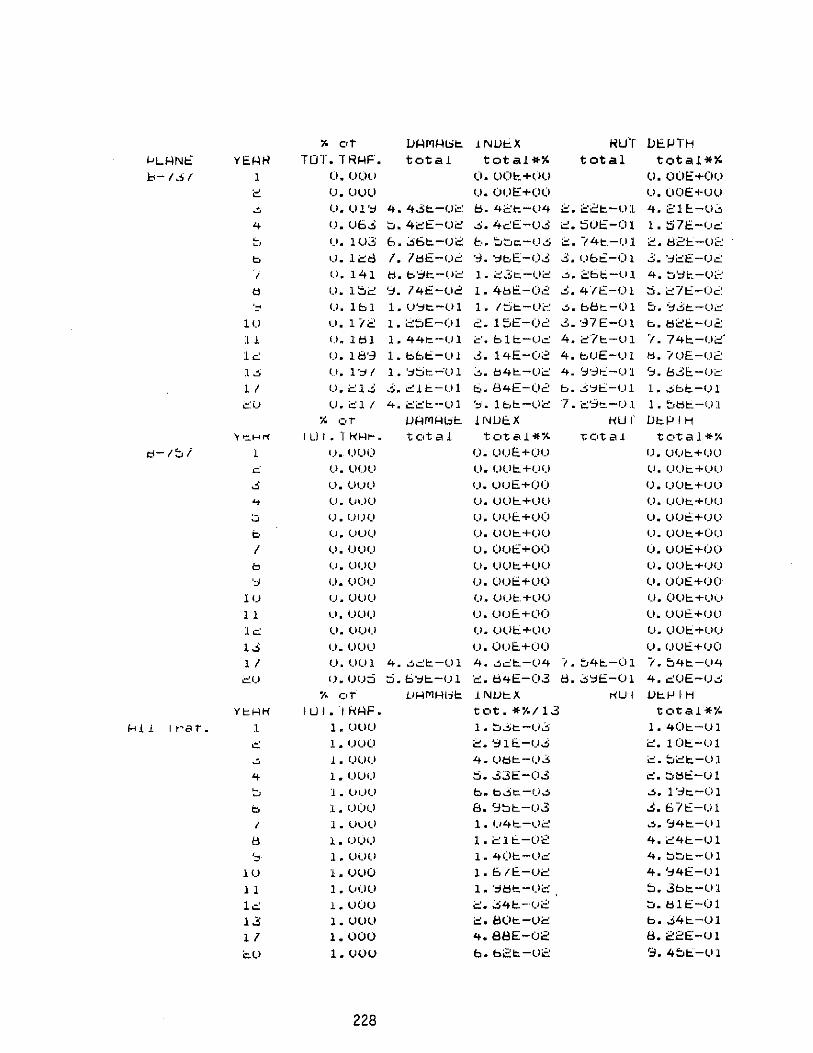
" c,t li F-l1'I ' .. H:;t" .I NUt::. X HU'r lit:.I-'TH i->L F-l Nt:: YEF-lH TOT. TRHF. tot ,,\.I total*" total total*" b-/~I 1 U.UUO O.OOI::+I,HJ U.OOE+Ou
~ U. Ul)U 1).OUE+(lO u. UOE+Ull .; U.Ul':I oCt .. 4.5t:.-Ui::: ~M 4C't::-()4 2. 22c.-Ul 4.21!::-ll2, 4 I).Ub" ::O.4~E-U2 .:i.4c:E-u" ~.5()E-Ol 1. 57E-,-'c: ~ u. lU3 b.':;6!=.-u2 b .. ':J'::Jc.-U6 e. -/4t:::.-Ul 2. l::S21::.-Uc~ "' b u. li:::d I. ltiE-u2 'oJ. ':lbE-I),'; .3.Ubt:-(il 3. ':li:::E-U2 I u. 141 d. b':1t:.-I)i=: 1.i:::3t:.-Ui::: ..:!I.2bl:.-Ul 4. ~':jt::-Ui..-:
tl I). l::'c ':I • 74E-u2 1.4tlE-02 ':;.4"1£-01 :j.i:::7t::-Od '::, u. 1bl 1. U':lt::.-Ul 1- !::)t:-UC: ~.bet=.-Ul ::s. '~~t:.-()c
lU u. 1/2 1. i::!5E-(l1 2. 15E-(l2 3. ':l7 E-(1 1 b.~2c:'-U2
11 U .. Itl1 l • .q..q.t:-Ul c'. bl!::.-U':: 4. i:::?"l:.-Ul -I. 74 1::-1.1 e:' Ie.: u. H:I':l l.bbt::.-Ul .3. 14E-(J2 4. buE-I)j 1;. IOE-U2 1..:. u. 1 ':U 1 .. '.::10t::. --U 1 ~.c;4t::-Ui::! 4. '~':3t:.'-() 1 ~.i:S3E:.-Uc:
1 I U .. i:::l~ .:fj.~l!::'-Ul b.84E-(I2 b.3':lt:::-1)1 l.,jbl::.-()l
..::u U. cl I 4.i:::a:::I::.-Ul '::} . Ibl=.-Ui::: "7 .. i:::':j,=, -1).1 1. ~l::H:.-UI
" or UHI'IHt.:;t::. 1 NU!::.X fiUI Dt::.PIH Y"::..HI"'( 1 U I. 'I fiHi-. t Cft a 1 total*'X. 't Cit a 1 tCltal*~
d-/'bl I t).UUtJ CJ.uuE+()u U.UUI::.+UU
c: ll. tH .. H) u.UUI::.+()U ll. UUt:,+UI)
" U.U(JU u.I')uE+OO (J" uUt:. +(JCJ
... (J" tH)() O.I)OI::.+I)U C).I)Ut:,+UU
:;;, O.Uf)ll U.U()E:.+()O u.uUE+<JU b U.l>UU O. lH)I::.+OU U. UlH::.+OU
I u.UUC) u.OuE+OO O.uUE+O(l b (I.OUU U.llUI::.+I)U U. UUI::.+(H)
'~ CI.UOU u.Oui::.+()O U.oUE+O(l IU U.llUU U. UUC.+UU u.Out:.+I)U
11 U.UlIU u.uOE+OO u.uuE+uu 1.::; 1l.UUU U.UUt::.+UU fJ.uut:::+uC) 1" u.uuu u. (Juc.+()(J U.<JUc.+uO
1 1 U.UUl 4. ~C:I:::.-l)} 4. ~Ct:.-U4 1.::"41:.-01 /,,::'4t::.-U4
':::1) !)" I)I)~ ::l.b':lt::.-Ul e:.b4E-03 /::l.~':IE-UI 4.cuE-1J6
" or VJ.4MHlji::. 1 NUt::. X "UI Ut::.fJIH YCHfi "I U I. 'I fi14F. tot.*"/13 total""
f.<ll I r"'e,'. 1. 1 • UO!) 1,. ::'31::. -I)~ 1. 40t::.-Ol e: 1" UU(I 2.':11t::.-U~ ~. 10t::.-1.I1 .:, 1" C)UO 4.Udt:.-U2i i:::.~i:::I::.-Ul
4 1. uuu ::I • .33E-(I.3 ~.::'l:i~-(jl
~ 1 " UUt) b.b.3t:.-()~ "'. 1 ':ito-U 1 b 1. U(JU 8. ':3::J/::.-u3 ".blE-Ul I 1. lhJU 1" 1./,,+1=. -l)'::: .:>.'::141::.-Ul
/::l 1" UUl) 1.i=:1t::-u2 4.i:::4t:.-Ul
';;! 1 " uut) 1.40/::.-UC: 4.0~t:-Ul
10 I.UOO 1.b/E-lIe: 4.':::;I41::-U1
11 1" (IOe) 1,. '::H:H:. - U i::: tJ.3bt:.-Ul
le.: 1. llOU i:::.2i4c.-·u2 ::o.tl1E-U1 1.3 1. llllll i:::.80t:.-Ui::: b .... 4t::.-lll 11 1. (IOU 4. 88E-02 8. 22E-Ul i::..U 1.UllU b.b21::.-02 9.4t..t:.-1I1
228
Related Documents