Crises, Liquidity Shocks, and Fire Sales at Hedge Funds Nicole Boyson, Jean Helwege, and Jan Jindra This document is a paper presented at the Annual Meeting of the Midwest Finance Association, March 15, 2013. It is also Northeastern University D’Amore-McKim School of Business Research Paper no. 2013-03.

Welcome message from author
This document is posted to help you gain knowledge. Please leave a comment to let me know what you think about it! Share it to your friends and learn new things together.
Transcript
Crises, Liquidity Shocks, andFire Sales at Hedge FundsNicole Boyson, Jean Helwege, and Jan Jindra
This document is a paper presented at the Annual Meeting of theMidwest Finance Association, March 15, 2013. It is also NortheasternUniversity D’Amore-McKim School of Business Research Paper no.2013-03.

Crises, Liquidity Shocks, and Fire Sales at Hedge Funds*
Nicole Boysona
Northeastern University
Jean Helwegeb University of South Carolina
and
Jan Jindrac
Ohio State University
November 29, 2012
ABSTRACT
We investigate hedge fund stock trading from 1998-2010 to test for fire sales. While funds with high capital outflows sell large amounts of stock during crises, these funds also buy stock, rather than using all the proceeds to fulfill redemptions. Further, funds with large outflows rarely sell the same stocks at the same time. For the relatively few stocks that are sold en masse, there is no evidence of price pressure, largely because hedge funds overwhelmingly choose to sell their most liquid, largest, and best-performing stocks. We provide new and compelling evidence that hedge funds neither engage in nor induce fire sales, since their well-diversified portfolios allow them to cherry-pick the most appropriate stocks to sell during crises. JEL Classification: G21, G24, G28, G32, G33, E44, E58, E61 Keywords: Liquidity shocks, fire sales, financial crisis, hedge funds, financial constraints
*We are grateful for helpful comments from Nikunj Kapadia, Rabih Moussawi, Rene Stulz, and seminar participants at Northeastern University. a Nicole Boyson, Northeastern University, Boston, MA 02186; email: [email protected]; phone: 617.373.4775. b Jean Helwege, University of South Carolina, Columbia, SC 29208; email: [email protected]; phone: 803.777.4926. Corresponding author.
c Jan Jindra, Ohio State University, Columbus, OH 43210; email: [email protected]; phone: 650.489.6807.

1
While the subprime crisis is widely viewed as the result of a severe housing shock, it is
less clear how problems in the housing sector were transmitted via financial intermediaries to the
rest of the economy. A number of academic studies focus on the connection between financial
crises, liquidity shocks, and asset fire sales to explain the large dislocations in financial markets.
Because of their capital structures, hedge funds likely suffer significantly from prolonged
pressure on their balance sheets when liquidity dries up; hence, their asset sales could be central
to the amplification of crises (e.g., Khandani and Lo (2007), Brunnermeier (2009), Brunnermeier
and Pedersen (2009), and Aragon and Strahan (2012)).
To date, however, no study has directly tested for the existence of fire sales by hedge
funds. If hedge funds are large sellers of stock during crises at fire sale prices, their sales can lead
to liquidity spirals that exacerbate the crisis, and they deserve some blame for its propagation. If,
however, hedge fund stock sales do not occur at fire sale prices, these sales will not exacerbate
the crisis and hedge funds are less culpable in its propagation. While prior studies document that
hedge funds do indeed sell more stock during crises (Ben-David, Franzoni, and Moussawi (2012)
and He, Khang, and Krishnamurthy (2010)), and thus are suggestive of fire sales, the literature
stops short of performing direct tests.
In this paper we analyze whether hedge fund stock sales in crises can be characterized as
fire sales. We use two fund-specific proxies for liquidity shocks: fund flows and fund-imposed
capital lockup and redemption periods. Controlling for a variety of fund characteristics, we find
that during crises funds with high outflows sell significantly more stock than funds with high
inflows, consistent with liquidity shocks imposing selling pressure. However, on average, funds
with outflows use nearly all their proceeds from stock sales to buy additional stock, inconsistent

2
with forced sales. We also note that the buying is not likely a result of covering existing short
positions, since it is doubtful that hedge funds would continue to hold these stocks at quarter-end.
Next, we investigate whether funds that sell stock engage in fire sales. A necessary
condition for fire sales is that hedge funds experiencing outflows sell stocks that are common
across their portfolios. We find that such sales of stocks are fairly uncommon, accounting on
average for only about 1% of the total stocks held by hedge funds each quarter. We then test for
fire sales using the approach of Coval and Stafford (2007), which examines the price impact of
en masse stock sales by funds with significant capital outflows (hereafter, forced sales) and en
masse stock purchases by funds with large inflows (forced buys). Our results show no evidence
of fire sales during crises. Although funds with large outflows sell a large quantity of stock in
crises, these transactions do not lead to the sort of price pressure that characterizes fire sales.
Finally, we examine characteristics of forced sale and purchase stocks to understand why
sales (purchases) have so little impact on prices. Although we identify few forced sales, these
sales are substantial in size, comprising about 1.5% of the stock’s total market capitalization and
3.1% of the stock’s quarterly volume, and are about twice this high in December 2008. Forced
purchases are larger, on average, comprising 2.5% of market capitalization and 5.9% of trading
volume, but do not change noticeably during the subprime crisis. Importantly, we find that these
large transactions do not involve price pressure because forced sale and purchase stocks are
significantly different from other stocks held by hedge funds. In all periods, and even more so
during crises, forced sale stocks have better prior year performance, larger size, higher average
trading volume, and better liquidity. Therefore, when forced to sell, hedge funds avoid fire sales
by cherry-picking stocks based on high liquidity, large size, and good past performance. Forced
purchase stocks do not involve price pressure for the same reason, as those stocks are similar in

3
characteristics to forced sale stocks. A key inference of this result is that most hedge funds are
quite well-diversified and refrain from selling less liquid, smaller, and poorly performing stocks,
thereby managing to avoid fire sales altogether.
The paper is organized as follows. The next section discusses the literature and develops
our hypotheses. Section II describes the data. Section III examines the factors that drive hedge
funds to sell stocks. Section IV performs the fire sale tests. Section V studies the characteristics
of stocks in hedge fund portfolios, and Section VI concludes.
I. Analytical Framework
The recent financial crisis has focused researchers’ attention on the need for liquidity
among financial institutions that may be forced to sell assets in a crisis if they run short of cash.
For example, in Brunnermeier and Pedersen (2009), hedge funds and other speculators finance
their trades through collateralized borrowing from banks, which could cause a liquidity squeeze
if hedge funds experience a decline in the value of their assets, an increase in margins, or large
investor withdrawals. They posit that a fund will react to such shocks by selling assets, which in
turn will cause downward price pressure on the assets it sells. Their theory is closely related to
the work of Shleifer and Vishny (1992, 2011), who show that fire sales occur when firms are
forced to sell assets to repay debt at a time when other firms in the industry (that could extract
full value from the assets) are unable to purchase them. Research using amplification models,
such as Krishnamurthy (2009), links such fire sales to loss spirals that erode capital and
ultimately cause a financial crisis.1
1See also Gromb and Vayanos (2002), Adrian and Shin (2008, 2010), Diamond and Rajan (2010), Geanakoplos (2010), Allen and Carletti (2006), and Uhlig (2010).Boyson, Helwege, and Jindra (2012a, 2012b) evaluate these theories for commercial banks and investment banks, respectively, and find little evidence of widespread fire sales during financial crises.

4
These theories start with the premise that a crisis arises because financial firms are forced
to sell assets as a result of funding pressures. Thus, we first consider the extent to which hedge
funds are forced to sell assets as a result of liquidity shocks. We investigate hedge fund trading
during crises and consider whether pressure to sell, if it exists, is greater among hedge funds that
are more likely under funding pressure, including funds with capital outflows, short lockup
periods, and/or short redemption periods. We also examine the characteristics of funds that
experience these pressures during crises and investigate whether there are systematic differences
in outflows across funds of different styles. Previous studies of the subprime crisis indicate that
hedge funds were forced into severe asset sales (Ben-David, Franzoni, and Moussawi (2012) and
He, Khang, and Krishnamurthy (2010)) and that these sales led to liquidity problems in the
stocks they held (Aragon and Strahan (2012)). Ben-David, Franzoni and Moussawi (2012)
conclude, however, that some hedge funds sold stock in order to invest in profitable
opportunities elsewhere. Further, Chen, Hanson, Hong and Stein (2008), Zhang (2009) and
Massa, Simonov, and Yan (2012) present evidence that hedge funds and mutual funds are often
the buyers who profit from fire sales by other institutions.
We first consider whether hedge funds are forced to sell stock as a result of a market-
wide breakdown in liquidity. We identify systematic shocks by separating the sample into crisis
and boom periods, and we investigate idiosyncratic shocks using data on fund flows, fund
performance, leverage usage, and lockup and redemption periods. If liquidity shocks force hedge
funds to sell in a crisis, stock sales should be higher during crises than during booms. Further,
sales should be concentrated in hedge funds facing capital outflows or having other financial
constraints. These patterns in gross sales should be matched in the data on net sales (i.e., sales of
existing stock less purchases of new stock). After all, if hedge funds are under pressure to sell

5
stocks due to redemption requests, they should use the proceeds to fund cash withdrawals and
not to buy new stock.
For hedge funds to be a source of stress in a crisis, not only must they sell large quantities
of assets to meet margin calls and redemptions, but also the asset sales must put downward
pressure on prices. Boyson, Stahel, and Stulz (2010) link contagion in hedge fund returns to
liquidity shocks, and Hameed, Kang and Viswanathan (2010) and Maier, Schaub, and Schmid
(2011) argue that funding problems lead to decreases in liquidity and stock prices. Sadka (2010)
and Billio, Getmansky, and Pelizzon (2010) tie aggregate liquidity risk to underperformance
during crises, although the latter also argue that hedge funds’ contributions to systemic risk were
not especially large.
By contrast, using a proprietary database of institutional trades, Anand, Irvine, Puckett,
and Venkataraman (2012) show that during the crisis, institutions tilted their selling activity
towards less liquidity-sensitive stocks suggesting that such stocks may serve as a liquidity hedge
for institutions in a downturn. Ambrose, Cai, and Helwege (2012) argue that selling assets in the
absence of information effects does not cause losses in efficient markets. Brown, Green, and
Hand (2010) note that few hedge funds failed during the crisis, and that hedge fund losses were
small compared those reported by other financial institutions. Further, recent work provides
evidence that hedge funds adjust their trading activities to better withstand crises. For example,
Ang, Gorovvy, and van Inwegan (2012) find that hedge funds decreased leverage before and
during the subprime crisis, and Liu and Mello (2011) show theoretically that hedge funds will
hold more cash during crises due to their fragile capital structures. Finally, Shadab (2009) argues
that hedge funds actually reduced the severity of the financial crisis by acting as net purchasers
of mortgage-backed securities and as lenders to distressed borrowers.

6
Thus, prior evidence is inconclusive regarding whether selling by hedge funds drives
down stock prices in a crisis. We fill this gap by examining the impact of sales during crises on
stock prices. We use a test of forced sales (Coval and Stafford (2007)), which disentangles price
pressure from information effects by analyzing sales that are motivated by necessity in periods of
distress. This approach allows us to consider a symmetric response to price pressure in booms
when hedge funds experience abnormally high inflows. We also examine the characteristics of
stocks sold in crises to determine the extent to which hedge funds can alleviate price pressure
through strategic selling of their stock holdings.
II. Data
Hedge fund data for the period 1998-2010 are obtained from two sources: mandatory 13F
filings for stock holdings for institutions with over $100 million under management (reported by
Thomson-Reuters) and the Lipper TASS hedge fund database. While data limitations require that
we focus only on long stock positions of hedge funds, common stock holdings comprise a
substantial 22% of hedge fund assets reported in Lipper TASS for fund families with over $100
million in assets under management. Further, using Lipper TASS data, Cao, Chen, Liang, and Lo
(2010) show that hedge funds have significant exposure to the stock market.
We begin with the dataset of Griffin and Xu (2009), which contains hedge funds with
13F filings during 1998-2004 and extend it for 2005-2010 by matching fund and manager names
in Lipper TASS with Thomson-Reuters.2 Since we require Lipper TASS data for all analyses, we
drop the Griffin and Xu (2009) funds that do not appear in Lipper TASS. Since we wish to
exclude companies with a substantial part of their business coming from non-hedge fund entities,
we check SEC-required ADV filings for all funds to ascertain that filers have at least 50% of
2 We thank John Griffin for providing this list. Lipper TASS reports data for individual hedge funds while 13F filings are at the fund family (management company) level. Note that this data does not suffer from the survivorship bias that is frequently encountered when using self-reported data.

7
their assets in hedge funds or at least 50% of their assets owned by high net worth individuals,
and that they also charge incentive fees.3 If ADV filings are not available, which happens for
twenty of the funds that appear in our final sample, we perform a web-based search to ensure that
a reliable source, such as the fund’s own website, a reputable news source such as Bloomberg, or
an interview with the hedge fund manager, identifies the entity as a hedge fund. As a final check
for these twenty funds, we search the CRSP mutual fund database to ensure these fund families
are not also managing mutual funds. This process yields 262 hedge fund families that appear in
both Lipper TASS and Thomson Reuters.4
Summary statistics for the hedge fund sample are in Table 1. Since the 13F data are
reported at the fund family level and the Lipper TASS data are at the fund level, we aggregate
the Lipper TASS data to the family level and take size-weighted averages of fund characteristics.
All variables in the paper are winsorized at the 5% and 95% tails. Panel A presents fund family
characteristics. The mean family size is about $743 million, minimum required investment is $2
million, mean family age is about 10 years, lockup period is 6 months, and redemption period is
156 days. The lockup period is the initial time after an investor purchases the fund during which
he is not permitted to withdraw his capital, and the redemption period is the sum of the
redemption notification period (number of days notice an investor most give before requesting to
withdraw his capital) and the redemption frequency period (how frequently an investor may
withdraw his capital during a year; for example, quarterly). Following Agarwal, Daniel, and
3For a brief period in 2006, all hedge funds were required to file ADV forms. In 2009, filing again became mandatory. Hence, in same cases, we are imputing the fund’s classification from an ADV form filed after the sample data. To test that this approach is appropriate, we compared the ADV filings for 2006 with those for 2009 or later for the same fund (when available) and found no differences in classification between the two filings. 4 Our sample is similar to that ofBen-David, Franzoni, and Moussawi (2012), who also investigate stock trading by hedge funds. They select their sample using a proprietary list from Thomson-Reuters of entities that file 13F forms, both in the aggregate and detailed by entity within the aggregate filings, and exclude all filings where more than half the included entities are not hedge funds. They then filter the remaining filings by examining ADV forms to ensure the majority of the filer’s business comes from hedge fund activity.

8
Naik (2009), we sum the redemption notification and frequency periods and report the total.
Turning to the indicator variables, we note that about 62% of funds report that they use leverage
and about 78% of funds have a high water mark. As for style characteristics, 52% of funds
follow a long-short equity style and 19% of funds follow an event-driven style. Less than 1% of
funds report following a dedicated short style, fixed income arbitrage, managed futures or equity
market neutral style.
Panel B reports the breakdown of the sample year by year, including the number of fund
families, the mean fund size as reported in the Lipper TASS database, the average equity
portfolio size reported in the 13F database, the number of stocks per manager, and the mean
change in hedge fund holdings per family. Means are first calculated by quarter and then
averaged across funds. The number of funds in the sample doubles from the beginning to the end,
and the mean fund size increases through 2007, drops in 2008-2009, and grows again in 2010.
The average equity portfolio size and number of stocks held remains steady throughout the
period. The change in hedge fund holdings, which is the value of stock purchases less sales
divided by the value of all stock holdings, measured by prior quarter market value, is highest
during boom periods and lowest in 2008, when the median change in holdings is -1%. Holdings
rebound during 2010. Comparing our results to Ben-David, Franzoni, and Moussawi (2012), the
summary data are quite similar to their sample for all periods of overlap (2004-2009).
Panel C presents information about hedge fund stock portfolios. The total mean (median)
market value of stocks in the portfolio is $726 billion ($329 million), and the mean (median)
number of stocks is 144 (64). The average (median) hedge fund holding as a percentage of the
stock’s market capitalization is about 1% (0.5%) and the average transaction size is about $5.6
million ($3.1 million). Finally, we report the average change in hedge fund holdings, calculated
9
as in Panel B, averaged across all quarters. The mean change is 9.3% with a median of 4.4%,
indicating that hedge funds have net quarterly purchases of about 9.3% of their prior period
assets. This value is in line with the 10.6% reported (for a slightly different time period) by Ben-
David, Franzoni, and Moussawi (2012).5 Finally, despite winsorization, the medians are much
smaller than the means, indicating the presence of some very large portfolios.
Last, Panel D reports characteristics at the stock level. The average (median) prior year
annual return is 8.2% (3.5%) with standard deviation of 13.0% (10.8%). These estimates use
monthly data from CRSP. The mean (median) total assets for each firm is $2 billion ($550
million), market capitalization is $2.4 billion ($745 million), and Tobin’s Q is 2.3 (1.7). Mean
(median) quarterly volume is 43 (15) million shares. This data is from Compustat. We also report
the Amihud (2002) illiquidity measure (multiplied by 108) and the bid-ask spread (multiplied by
102) using daily data, and the means (medians) are 0.972 (0.058) and 0.06 (0.03), respectively.
There is significant heterogeneity in stock returns given the 25th percentile value of -24% and the
75th percentile value of 31%, and evidence that some portfolios contain very large stocks. The
mean and 25th percentile values of the Amihud measure are quite high despite winsorization,
indicating that some hedge funds invest in very illiquid stocks. The Tobin’s Q, volume, and
liquidity measures are reasonable given the average size of the stocks held.
Following Boyson, Helwege, and Jindra (2012a, 2012b), we identify booms and crises
over the sample period of 1998-2010 by examining NBER cycles, bank failures, the TED spread,
Moody’s Aaa-Baa bond spreads, flight to quality (Collin-Dufresne, Goldstein, and Helwege
(2009)), the Long Term Capital Management (LTCM) episode, and credit crunches (Bordo and
Haubrich (2010)). Quartiles of the monthly distributions of bank failures, TED and credit spreads, 5Since this is a key variable in both our paper and in Ben-David, Franzoni, and Moussawi (2012), we compute its mean and median using their sample period (2004-2009), and obtain a mean of 0.084 (0.037). These values are close to their reported mean (median) values of 0.106 (0.033), confirming the general similarity of our samples.

10
stock market quarterly returns, NBER recessions, flight to quality, and LTCM episodes are used
to determine boom periods and crises. Table 2 presents the details on the three crisis periods and
two boom periods.6 For example, the crisis period from March 2007 through June 2009 is
characterized by an NBER contraction, a high number of bank failures, high TED and credit
spreads, high incidence of flight to quality, a credit crunch, and low stock market quarterly
returns. The boom period from January 2003 through February 2004 is characterized by an
NBER expansion, low credit spreads, and high stock market returns. For a particular observation
to be classified as occurring during a crisis (boom) period, the crisis must last for the full quarter.
III. Fund Flows and Stock Trading
A. Fund Flows
Our first set of tests considers whether hedge funds are forced to sell assets in a crisis. We
hypothesize that funds with large capital outflows should be under more pressure to sell, since
the only alternative for a fund facing outflows is to borrow the cash, which may be quite difficult
in a crisis. Likewise, we predict that hedge funds with large capital inflows are more likely to
buy stock. We calculate quarterly flows at the hedge fund family level (net flows/prior period
fund family assets), and divide this variable into quintiles each quarter.
Table 3 reports summary data on hedge fund flows. Panel A reports average fund flows
and provides evidence that fund outflows are larger during crises for all flow quintiles.
Differences between all crises/the subprime crisis and booms are significant for all quintiles,
with the most extreme outflows occurring in the subprime crisis among funds in (the worst)
quintile 1 (with a difference of -3.5% between the subprime crisis and boom periods). Notably,
regardless of time period, average flows are always negative for the worst two quintiles of flows
6 The remaining time periods are “neutral.” In unreported results we shorten the crisis periods by one quarter for both the beginning and the end and find that our conclusions are not sensitive to the change.

11
(quintiles 1 and 2), and average flows are negative for the first three quintiles of flows during all
crises and the subprime crisis.
Panel B provides evidence that outflows follow poor fund performance and inflows
follow good performance regardless of the time period, consistent with Baquero and Verbeek
(2009). Differences in performance between the worst and best flow quintiles average about -3%
for each of the time periods, which is statistically significant at the 1% level. During crises funds
exhibit the worst lagged performance, with negative performance for the first three flow quintiles
during crises. During booms, funds have positive performance even for the worst flow quintile,
and differences in performance between booms and the subprime crisis and for booms and all
crises range from -3.0% to -5.6% and are statistically significant for all quintiles studied.
Finally, Panel C presents the proportion of funds with outflows (negative flows).
Focusing on all funds during all periods, about 45% of funds have outflows; this value increases
to just over 50% for the subprime crisis. By contrast, the proportion is about 42% during booms.
Differences between booms and crisis periods, including the subprime crisis, are statistically
significant at the 1% level. Turning to the style results, there is notable variation in the
proportion of funds that experience outflows during crises. Strikingly, both the global macro and
convertible arbitrage styles have fewer funds with outflows during the subprime crisis than
booms, at 29% vs. 33% for global macro and 36% vs. 42% for convertible arbitrage in crises and
booms, respectively. These results are consistent with the stated strategies of these funds – since
convertible arbitrage funds generally hold short stock positions and global macro funds are
opportunistic in nature, these funds are probably the most likely to have good performance
during crises. However, due to small sample sizes, these results are statistically insignificant.
Both the stock-heavy long/short equity and event driven styles, which together represent over

12
two-thirds of the sample, have significantly more funds with outflows during the subprime crisis
than booms: 54% vs. 45% for long-short and 51% vs. 38% for event driven during the subprime
crisis and booms, respectively. Finally, both managed futures and fixed income arbitrage styles
have more funds with outflows during crises, although the small sample sizes here warrant
caution. Taken together, the results show that hedge funds experience worse outflows during
crises, that these outflows follow poor performance, and that the proportion of funds with
outflows increases in a crisis. In the next section, we analyze the selling (and purchasing) activity
of hedge funds.
B. Stock Sales and Purchases
Hedge funds frequently trade stocks, so any analysis of selling activity among these firms
in a crisis must consider the volume of transactions that ordinarily takes place in this asset class.
Moreover, while the volume of stock sales is best measured by the market value of the
transactions, changes in the market value of holdings are also caused by stock price changes. In
this paper, we use two separate approaches to estimate selling activity: (1) using the market value
of the shares sold, as in Ben-David, Franzoni and Moussawi (2012), and (2) using the number of
shares sold, as in Coval and Stafford (2007). The latter calculates percentage changes for each
stockholding in each portfolio each quarter based on the prior quarter’s holdings, categorizing
activity as shares eliminated, decreased, unchanged or increased, but does not include purchases
of new stocks. Table 4 Panel A reports these proportions for all funds all periods as 38%
eliminated, 22% decreased, 24% unchanged, and 16% increased, which sum to 100%. These
figures do not differ appreciably for the boom, crisis, or the subprime crisis.
In contrast to the Coval and Stafford approach, using the market value of the portfolio in
the previous quarter allows one to measure the amount of new shares purchased (although the

13
fractions no longer sum to 100%).7 Since these proportions are measured relative to prior period
assets, they represent changes in the equity holdings due to actual trades, not just due to changes
in price. We sum quarterly changes in holdings in prior quarter market value dollars for all
existing stocks eliminated, decreased, or increased, and all new purchases, and divide by the sum
of the market value of stockholdings for the fund in dollars in the prior quarter. Since this
calculation allows us to measure the dollar amount of new shares purchased and is relative to
prior period assets, we believe it is the most appropriate measure for our tests and focus on it for
the remainder of the discussion. For all funds in all periods, existing stock eliminations,
decreases, and increases make up 25%, 12%, and 13% of prior quarter holdings, respectively,
and new buys make up 33%, as reported in Table 4. Subtracting all sells from all buys results in
an average net increase (net buys) of about 9%. We also report these proportions separately for
booms, crises, and the subprime crisis. For booms and all crises, net buys are also around 11%
(8%) and drop to 7% during the subprime crisis. Still, buys outweigh sells in all time periods.
We also perform this analysis for various subsets of the data. Panel B presents results for
funds in the bottom quintile based on flows. For all periods, the difference between buys and
sells is about 5%, lower than for Panel A but still positive. During crises, we find more selling
activity, with net buys of about 2% for all crises and for the subprime crisis. In Panels C and D,
we perform this analysis for funds with the shortest lockup and redemption periods. In theory,
funds with shorter lockup and redemption periods are more likely to be forced into asset sales in
a crisis, while funds with longer lockup and redemption periods have more flexibility in their
7We follow Ben-David, Franzoni and Moussawi (2012), whose SAS program (“Institutional Trades, Flows, and Turnover Ratios using Thomson-Reuters 13F data”) is found at http:/wrds.wharton.upenn.edu/. We thank Rabih Moussawi for making this code available. In this method, shares held are adjusted for splits and distributions, and the quarterly holding snapshots are used to derive the trades. Holdings that originate from changes in the universe of 13F filers are filtered out. We require that hedge fund appear in two consecutive quarters, so if a hedge fund does not appear we eliminate the observation.

14
portfolio decisions.8 In Panel C we report data for the funds in the lowest lockup period quintile,
which have an average lockup period of about 2 days (for comparison, the average lockup period
for the highest quintile is about 22 months). Here, there is positive net buying during booms at
14%, but net buying during crises is still high at around 12%. Finally, in Panel D we report data
for funds in the lowest redemption period quintile, which averages about 51 days (for
comparison, the average redemption period for the highest quintile is about 9 months). For this
variable, there is much less net buying during crises, especially during the subprime crisis where
net buys are a negative -0.7% as compared to net buys during booms of about 9%.
Overall, based on univariate analyses of hedge fund portfolio changes, we conclude that
even the most constrained funds (those with low flows, short lockups, and/or short redemption
periods) are net buyers of stock, on average. However, during crises, we find that funds with
high outflows and short redemption periods feel pressure, as their net buying activity is
significantly lower than during all periods or during booms.
C. Buys and Sells at the Fund Level
We next consider measures of selling and buying pressure at the fund level, rather than
among all funds at a given point in time, using a multivariate analysis. Table 5 reports results
from regressions estimated separately for four samples: all periods, all crises, subprime crisis,
and all booms. We focus on funds with high and low flows and create indicator variables for the
lowest and highest flow quintiles (D1 and D5, respectively). The first three columns are for the
entire sample period while the other columns focus on crises (including the subprime crisis) and
booms. The regressions are pooled over time and across fund families, and standard errors are
clustered by time and hedge fund family. The dependent variable in the first column in each time
period is total sales. Sales are measured as the sum of existing stock eliminations and decreases 8See Aragon (2007).

15
as a proportion of prior period portfolio market value. In the second column of each time period,
the dependent variable is total purchases, which is the sum of purchases of existing and new
stocks as a proportion of prior period market value. The dependent variable in the third column is
the difference between the first two dependent variables (net sales). We include a number of fund
characteristics as controls: an indicator variable for leverage, the log of the size of the stock
portfolio, the fund’s quarterly return, the log of fund age, incentive fees measured as a percent of
profits, management fees measured as a percent of assets, the log of minimum required
investment, a high watermark dummy variable, a dummy variable for registered investment
adviser (RIA), and style dummies.
Focusing on the full sample period, we find that on a gross basis, funds both buy and sell
more stock in booms, but neither sell nor buy more stock in crises. However, a subset of funds –
those in the bottom quintile based on outflows – engage in more gross selling and more net
selling during the full sample period, which could be at the heart of fire sales, although the net
sales results are only significant at the 10% level. Further, funds with large inflows engage in
more buying and net buying than funds in the middle three flow quintiles. The inflow results are
larger and more significant than the outflow results. In addition, larger funds and funds with
better returns have lower net sales. Finally, there is weak evidence that funds with high minimum
investments sell more.9
While the regressions for all periods do not show increased net sales in a crisis, there is
evidence that funds with outflows sell more stock. If sales by these funds are high enough, this
selling activity could lead to declining stock prices and fire sales. We examine this hypothesis in
the set of regressions labeled “All Crises.” The results show that funds with the largest outflows
9 We also perform regressions where we interact the flow indicator variables with the crisis indicator variables and find insignificant coefficients on these interaction terms.

16
have significantly more stock sales than other funds during a crisis. And since they have fewer
buys, their net sales are significantly larger as well. Also, funds with large inflows continue to
buy significantly more stock. Older funds tend to sell more, both on a net and gross basis. To
examine economic significance, we set all continuous explanatory variables to their means for
the “all crises” periods, and set the dummy variables to 1 for high watermark, 1 for leverage, 0
for registered investment advisor, and 1 for long-short equity, since these values represent the
majority of the funds in the sample. We then compare the predicted net sales for high outflow
funds and high inflow funds. High outflow funds have predicted net sales of 3% of prior period
assets, while high inflow funds have predicted net purchases of 11% of prior period assets, so
this difference is economically as well as statistically significant (as noted in the last row of the
table, the differences in coefficients on high and low flow funds is statistically significant at the
0% level). We also note that the control variable coefficients and measures of statistical
significance are comparable to the values in the previous set of regressions for all periods.
For the recent subprime crisis of Q1 2007-Q2 2009, the results are similar to all crises in
that funds with large outflows sell more stock. The constant term in the net selling regression is
significantly positive during the most recent financial crisis and all crises, implying higher net
selling across the middle three flow quintiles as well. As with the previous regression, funds with
inflows purchase significantly more stock, and therefore have significantly lower net selling. We
perform the same test of economic significance as in the prior set of regressions, and find
predicted net sales of about 4% for high outflow funds compared to net purchases of about 10%
for high inflow funds, which again has strong economic significance.
The results thus far indicate that hedge funds with large outflows sell more stock during
the entire sample period, during all crises, and during the recent crisis period. The magnitude of

17
the coefficients on the large outflow indicator variable is higher for the subprime crisis (0.047)
than for all crises (0.045), and both these coefficients are higher than for all periods (0.033),
which suggests that sales may be more severe during crises. This finding is consistent with the
results of Table 4 that indicate that funds sell more stock during crises than during normal times.
However, the results of a chi-squared test indicate no significant differences among these three
coefficients, with p-values of 0.60 for the difference between all periods and all crises, 0.59 for
the difference between all crises and the subprime crisis, and 0.46 for the difference between all
periods and the subprime crisis. Further, we perform the same regression analysis for all periods
excluding crisis periods (not reported), and obtain a statistically significant coefficient of 0.029
on the large outflow indicator variable. The p-value from a chi-squared test that compares this
coefficient to all crises (the subprime crisis) is 0.59 (0.48).
Finally, the last set of regressions in Table 5 focuses on boom periods. Contrary to the
estimates for other time periods, net sales by funds in the bottom flow quintile are not larger in
booms. A chi-squared test comparing the coefficient on high outflow funds during booms to all
crises (the subprime crisis) results in an insignificant p-value of 0.49 (0.41). Funds in the high
flow quintile buy more stock, consistent with results for other periods. The size and performance
results that held for all periods and crisis periods are no longer significant, but fund age and
minimum investment are positively related to sales. We perform the same test for economic
significance as in the all crises and subprime crisis regressions, and find predicted net purchases
of 2% for low flow funds and 14% for high flow funds. Again, this difference is economically
significant, but in contrast to crisis periods, low flow funds are actually net buyers during booms.
As for all other regression specifications, the difference in coefficients on flow quintiles is large
and statistically significant for net sales.

18
Table 6 examines the effects of lock-up periods and redemption restrictions on gross
sales, gross purchases and net sales. The correlation between lockup and redemption periods is
positive, but not large at about 0.22. If we re-estimate the regressions separately including either
lockup period dummies or redemption restriction dummies, the results do not change from those
reported. Similar to the specifications in the prior table we report results for all periods, all crises,
subprime crisis, and all booms.10 As noted earlier, data for these variables are not available for
all funds so these regressions are estimated with a slightly reduced sample. As with the flow
variable, we create quintile indicators for redemption periods and lockups, and include the top
and bottom quintile indicators in the regressions. The net sales regression in the “All Periods”
column has coefficients on the crisis period and fund flow quintile variables that are very similar
to Table 5. That is, crises do not involve significantly more selling, ceteris paribus.
As in Table 5, funds with outflows sell more and funds with inflows buy more stock.
However, it does not appear that funds with outflows are forced into sales: the coefficients on the
indicator for short lockup periods implies that these funds actually sell less stock on a net basis,
although on a gross basis they both sell more and buy more stock. Further, while funds with
short redemption periods sell more stock on a net basis, consistent with the hypothesis of forced
sales, their gross sales are no different from other funds. The funds that should have the greatest
ability to avoid fire sales, those with long redemption periods, do have fewer forced sales, as
measured by the significant negative coefficient in the gross sales regression, but they also buy
significantly fewer stocks so that their net sales are comparable to those of other funds.11
10We also perform these analyses including the volatility of past fund flows as in Manconi, Massimo, and Yasuda (2012) and find that this measure does not predict sales, does not add to the explanatory power of the regression, and does not change the main results. For brevity and because its inclusion reduces our sample size, we omit it. 11We also perform regressions where we interact the lockup and redemption indicator variables with the crisis indicator variables and find insignificant coefficients on all these interaction terms.

19
The results in the crisis period regressions provide evidence that lockups and redemption
restrictions have little effect on forced stock sales. Funds that should suffer more in a crisis from
short lockup features tend to sell more stock, but they also buy more stock. Indeed, funds with
short lockups buy so much more stock in the two crisis periods that they have more net buying
than other funds. Nor is there evidence that the funds with short redemption periods are under
pressure to sell more assets than other funds. While they do sell more stock during the subprime
crisis on net, this result is driven by sharply lower buying, not higher selling. Moreover, these
funds also have greater net sales in booms, suggesting that the net selling is not prompted by
liquidity problems due to outflows. Likewise, the coefficients on the long lockup and redemption
period indicators are largely unrelated to gross or net selling during crises. For the control
variables, results are generally consistent with Table 5.12 Further, tests of economic significance
during all periods and all subperiods have very similar results to those performed in Table 5.
In summary, hedge funds with large outflows sell more stock than funds with large
inflows, regardless of the time period studied. While the regression results also suggest that
funds with large outflows sell more stock during crisis periods than boom periods or all periods,
the differences between time periods are not statistically significant. Evidence of differences in
selling behavior is weaker when considering other hedge fund constraints like leverage, lockups
and redemption periods. Leverage is never significantly related to buying or selling. The weak
results for lockup and redemption periods are perhaps not too surprising, as they are not direct
measures of fund liquidity. Also, lockup periods apply to new fund investors only, and
redemption periods can be altered when hedge funds erect gates. Funds with poor performance
12 We also perform a robustness test (not tabulated) using a logit regression in which the dependent variable is set to 1 if the firm has net sales during a quarter and zero otherwise. We find nearly identical results to the regressions presented in Tables 5 and 6.

20
also tend to sell more stock, consistent with the positive correlation between poor performance
and outflows reported in Table 3.
Our result that funds with outflows sell more stock is consistent with Ben-David,
Franzoni, and Moussawi (2012), who attribute greater selling pressure on hedge funds to larger
than normal outflows. However, our results do not necessarily imply that these funds are forced
to sell stocks. First, we show that funds with outflows use most of the proceeds of stock sales to
buy more stock. If they were under pressure to sell stocks that they would rather hold, they
would not likely voluntarily sell more than necessary. Furthermore, the coefficients on the
indicator variable for a crisis are not significant in our gross or net sales regressions, suggesting
that the sales in a crisis happen for the same reasons they occur in normal times.
IV. Tests of Fire Sales
Our results on flows and sales suggest that hedge fund sales may put downward pressure
on stock prices in a crisis. We examine price pressure around forced stock sales (and purchases)
on a stock-by-stock basis using the approach of Coval and Stafford (2007). They consider a sale
(purchase) to be forced if the stock is widely sold (bought) by a number of managers
experiencing severe outflows from (inflows to) their funds. We create their variable PRESSURE
by summing the difference between flow-induced purchases and sales each quarter and dividing
the difference by the average trading volume of the stocks from the prior two quarters. Then,
severe flows are those below/above the 10th/90th percentile of quarterly fund flow, where flow is
calculated as the dollar flow divided by prior period assets:
𝑃𝑅𝐸𝑆𝑆𝑈𝑅𝐸!,! =
(!"# !,∆!"#$%&'(!,!,! !"#$!,!!!"#$"%&'(" !"!! ! !"# !,∆!"#$%&'(!,!,! !"#$!,!!!"#$"%&'(" !"!!!!
!"#$%&'()!,!!!":!!! (1)

21
where i is the individual stock, j is the fund, and t is the quarter. We sort stocks based on the
PRESSURE variable, and define those falling in the 10th percentile as pressure sale stocks and
those in the 90th percentile as pressure purchase stocks. Since this definition of PRESSURE relies
on frequent trading of the same stock by different managers, we require a stock be owned by at
least 10 managers during the quarter to calculate the PRESSURE measure.13
While it is difficult to disentangle price pressure from information effects, this approach
focuses on forced selling of the same stock by many funds and should help differentiate the two
effects. If information effects cause widespread sales of stock, returns should drop during the
selling period and not rebound afterwards. By contrast, if price pressure is the cause of selling,
large capital outflows that induce several funds to sell the same stock at the same time should
result in an initial price drop followed by a subsequent increase to compensate the liquidity
providers. Thus, we construct monthly cumulative abnormal returns for stocks that are widely
sold by subtracting from their returns the equally-weighted return of all stocks held by all hedge
funds – except the stock of interest – in a given month. We control for cross-sectional
dependence in monthly returns with Fama and MacBeth (1973) portfolios (i.e., we calculate
average abnormal returns each month and use the time series of mean abnormal returns). Finally,
as in Coval and Stafford (2007), we require the existence of at least 25 hedge funds in each
quarter for a stock to be included (which does not exclude any quarters in our sample).
Using this approach, we find too few pressure sales and purchases for a meaningful
analysis for all periods prior to 2001. Therefore, the pressure sale analysis covers the time period
2001-2010. Figure 1 graphs the number of pressure sale and purchase stocks by quarter for this
period. Stocks that are neither sold nor purchased average 4,189 separate stocks, which is about
13 For the remainder of the paper, we interchangeably use the terms “pressure sale (purchase)” and “forced sale (purchase)”.

22
98% of all stocks held by hedge funds each quarter. By contrast, pressure sale and purchase
stocks average 40 and 41 stocks, respectively – or about 1% each – per quarter. Pressure sale
stocks as a proportion of all stocks is highest in June 2007, at 1.9%, but then drops significantly
afterward, and pressure purchases follow a similar pattern.
Cumulative abnormal returns for pressure sales and purchases are presented in Table 7
and graphed in Figure 2. Figure 2 shows monthly data while Table 7 aggregates the data into
various periods. In Figure 2, we present cumulative abnormal returns for the 12 months prior to
the 18 months following the quarter of sale. Since we have quarterly data on sales and monthly
data on returns, and do not know exactly when during the quarter that the sale occurs, we label
the three months during the quarter of sale as T1, T2, and T3 respectively. All other months are
labeled relative to this quarter. Examining Figure 2 and focusing on pressure sales, there is no
obvious pattern of fire sales in either the whole period or any subperiod, since returns do not
decrease during the period of selling and increase subsequently. In stark contrast to Coval and
Stafford’s (2007) findings for mutual funds, the returns on the stocks that are sold during all
periods and crises are large and significantly positive prior to the sale, but do not change much
after the sale takes place. Further, for all periods, returns never even reach negative territory
before, during, or after the selling activity, hardly an indication of fire sales. The similarity in
patterns of pressure sale and pressure purchase stocks for all periods and the crisis periods is
striking. Only during booms do the returns on pressure sale and pressure purchase stocks diverge,
with pressure sales drifting slightly upward after the sale (although the sale itself does not affect
the price) and pressure purchase stocks drifting downward.
The data behind these graphical results are reported in Table 7, where we aggregate the
returns over various subperiods and perform t-tests for statistical significance. There is no

23
evidence of fire sales during any period: while stock prices do drop during the selling period,
these changes are not statistically significant, and there is not a significant price rebound after the
sale period; in fact, for the crisis subperiods, the performance of pressure sale stocks continues to
drift downward. There is also no consistent evidence of temporary increases in stock prices due
to pressure purchases – while the general pattern of the data does show that prices rise when
stocks are bought and fall afterward, none of these changes is statistically significant.
We perform several additional (untabulated) robustness tests concerning price pressure.
First, we perform tests using Coval and Stafford’s (2007) alternate pressure measures with very
similar results. Next, we sort stocks into quintiles by proxies other than fund flows, and create
the pressure variable based on these proxies. These proxies include lockup and redemption
periods, fund performance, leverage, fund performance interacted with leverage, required
minimum investment, and fund size. In each case, the results are consistent with those in Table 7
in that they provide no evidence of fire sales as a result of hedge fund selling.
V. Characteristics of Stocks Sold (and Purchased) by Hedge Funds
While our results in section III indicate that hedge funds sell more stock in crises in
response to outflows, these sales do not appear to cause downward price pressure on the stocks
as shown in Section IV. This could arise from several factors, including the fact that hedge funds
do not herd to the same extent as mutual funds and thus do not engage in massive selling of the
same stocks. Hedge funds can erect gates when redemptions become overwhelming. Or, hedge
funds may avoid extreme sales of the same stocks by increasing their cash holdings as trouble
appears more likely, as suggested by Liu and Mello (2011). In fact, in September 2008,
Citigroup’s prime brokerage division published a report estimating hedge fund cash holdings at

24
20% prior to the crisis and 30% during the third quarter of 2008.14 And in November, 2008,
Barton Biggs, the manager of Traxis Partners, in an article in Fortune, noted two reasons why he
was not worried about hedge fund withdrawals igniting a market selloff: first, hedge funds have
losses to make up before they can begin to earn their performance fees, so that investors pulling
out during this period would be forgoing a free ride with no incentive fees, and second, he states
that: “It is a fact that hedge fund margin debt has been declining since July 2007, and prime
brokers report massive hedge fund cash holdings.”15 Hence, there appear to be many ways that
hedge funds can avoid fire sales – even during crises – and avoid selling en masse.
Further, it is possible that when hedge funds sell the same stocks they simply do not sell
enough stock to move prices. We examine this idea in Figure 3, which graphs, by quarter, the
percentage of stock market value (Panel A) and quarterly volume (Panel B) that the average
pressure sale, purchase, and other holding comprises. Untabulated results indicate that pressure
sales (purchases) comprise an average of 1.5% (2.5%) of market capitalization and 3.1% (5.9%)
of quarterly volume, which is fairly substantial. Further, pressure sales are even higher during the
crisis at 7.1% of volume in December 2008 and 5% in March 2009. This indicates that, although
there are few pressure sales and purchases, those that do occur represent a fairly substantial
proportion of these stocks’ volume and market capitalization, especially during the recent crisis.
However, despite this result, the results of the prior section provide strong evidence that
these stocks are not sold at fire sale prices. Perhaps these stocks have characteristics that make
them better suited to withstand such pressure. Boyson, Helwege, and Jindra (2012a) note in their
study of commercial banks that firms have several ways to avoid fire sales when faced with
selling pressure. In particular, they note that banks can avoid the sale of toxic assets and instead
14 See “Hedge Fund Cash Holdings at 30%,” FinAlternatives article: http://www.finalternatives.com/node/5510 . 15 See http://money.cnn.com/2008/11/10/news/economy/hedgefunds_Biggs.fortune/index.htm.

25
sell off assets that have retained value in the crisis (cherry picking). Likewise, when faced with
selling pressure, hedge funds can also cherry pick the stocks they do sell. We hypothesize that
hedge funds will sell past good performers and those with strong liquidity and/or large size. We
investigate this hypothesis in Tables 8 and 9.
Table 8 presents medians of stock and firm characteristics of pressure sale (purchase)
stocks during all periods, all crisis periods, the subprime crisis, and booms.16 Column 1 also
presents medians for the entire universe of CRSP stocks as a comparison. Focusing first on all
periods, pressure sale stocks have significantly higher prior period returns than other stocks held
by hedge funds, at 12.6% versus 3.3% respectively. The typical firm size is about five times
higher for pressure sale stocks based on either total assets or market capitalization. Tobin’s Q is
also significantly higher for pressure sales by 0.40. For liquidity, pressure sale stocks trade far
more often (trading volume is 69 million shares versus only 14 million for the comparison
group). Also, the Amihud liquidity measure and the bid-ask spreads are significantly lower for
pressure stocks than the comparison group.
Comparing pressure sales to pressure purchases, we find that while a few characteristics
of pressure sale stocks differ from pressure purchase stocks in the overall sample period, their
characteristics remain much closer to each other than to other stocks owned by hedge funds. For
example, pressure sale stocks have worse performance then pressure purchase stocks by 2% per
year, much smaller than the 9% difference between pressure sale stocks and all other stocks held
by hedge funds. Pressure sale stocks are about the same size as pressure purchase stocks and
have somewhat higher volume. They also have worse bid-ask spreads and Amihud liquidity
measures, but these differences are far from being economically significant.
16We present medians here since, as previously noted, means are often skewed due to outliers. Results using means are similar in direction and significance.

26
Turning to results for crisis periods, the differences in performance and other
characteristics between pressure sale stocks and the comparison group are even more compelling.
One notable difference in crises is the magnitude of the returns in the previous year. Not only do
hedge funds sell stocks with better past performance in a crisis, but the difference in the returns
is sharply higher, at 12.6% and 12.9% more than the other stocks’ prior year returns for all crises
and the subprime crisis, respectively. As with the overall period, the differences between
pressure sale and pressure purchase stocks are sometimes statistically significant but
economically small, and both pressure purchase and pressure sale stocks are larger and more
liquid than hedge funds’ other stockholdings. During boom periods, the differences between
pressure sale and all other stocks remain strong and large, while differences between pressure
purchase and pressure sale stocks are even less significant.
These univariate results suggest that the absence of fire sales for hedge funds in crises
owes to their selective sales of highly liquid assets. We examine this hypothesis in greater detail
with a logit regression in Table 9. The dependent variable is set to 1 if the stock in question is a
pressure purchase (sale) stock and zero for stocks that are neither pressure purchase nor pressure
sale stocks. Hence, pressure sale stocks are compared to stocks that are not pressure purchases
and the pressure purchase stocks are compared to the other stocks that are not pressure sales. The
logit regressions include time indicators, and standard errors are clustered at the time and stock
level. We exclude the log of the market value and Amihud measure from the regressions since
they are highly correlated with the log of assets and bid-ask spread, respectively.
For all periods and all subperiods, the logit results indicate that pressure sale stocks are
larger with better past performance, higher volume and better liquidity than other stocks. The
results are similar when comparing pressure purchase stocks to other stocks and are consistent

27
with the univariate results in Table 8. These results are highly economically significant as well as
significantly significant. For example, for all periods, the marginal probability of a stock being
pressure sold increases from 0.8% to 1% (a change of 25%) if the stock’s prior period annual
return moves from the 25th percentile to the 75th percentile. Similarly, the marginal probability
goes up by 33% (from 0.6% to 0.9%) as size moves from the 25th to the 75th percentile, up by
233% (from 0.3% to 1%) as volume moves from the 25th to the 75th percentile, and down by 30%
(from 1% to 0.7%) as the bid-ask spread goes from the 25th to the 75th percentile. Results are
even stronger for the recent crisis, with changes in marginal probabilities of 25%, 100%, 500%,
and -20% for moves from the 25th to 75th percentile for annual return, total assets, volume, and
bid-ask spreads, respectively. Panel B of Table 9 compares pressure buy stocks to pressure sell
stocks and omits the stocks that are not heavily traded. The only consistent statistically
significant result in these regressions is that pressure sale stocks have higher volume than
pressure purchase stocks. This result is also economically significant: for example, during the
recent crisis, the probability of a pressure sale goes from 44% to 58% (a 32% increase) for a
volume move from the 25th to the 75th percentile.
Taken together, the results in Tables 8 and 9 provide strong evidence that when hedge
funds are forced to sell or purchase stocks they largely avoid fire sales. The stocks they do sell
when under outflow pressure are similar to stock they buy when under inflow pressure, and both
types of trades reflect a propensity to cherry pick the stocks likely to have the smallest price
impact upon purchase or sale. These results are consistent with the earlier finding that
redemptions in crises do not force hedge funds into fire sales. Additionally, even funds with
significant selling pressure during the recent financial crisis had well-diversified stock portfolios
that allowed them to strategically sell off positions. While some hedge funds likely did not have

28
this ability to cherry pick assets, the variety of stocks sold in crises and their generally high
liquidity leads us to conclude that hedge fund pressures did not result in detectable fire sale
activity at any time in our sample period.
VI. Conclusion
A commonly held view of hedge funds in the subprime crisis describes them as victims
of severe outflows and margin calls that forced them to sell assets into a declining market.
Consistent with this portrait of a fragile industry, Ben-David, Franzoni and Moussawi (2012)
find that hedge funds had significant stock sales during the worst quarters of the recent crisis.
With such a shortage of buyers, their sales alone might explain the precipitous drop in the stock
market from 2008 to 2009. By contrast, Liu and Mello (2011) argue that hedge funds’ fragile
capital structures lead hedge funds to better plan for expected crises, by reducing leverage,
increasing cash positions, and holding more liquid assets.
While many of the stylized facts suggest that the financial crisis was exacerbated by
forced sales of stocks by hedge funds, our analysis suggests otherwise. While hedge funds
experiencing outflows sell more stock than funds experiencing inflows, and outflows are larger
during crises, we find no evidence that these stock sales occur at fire sale prices. Furthermore,
hedge funds with high flows, short lockup and short redemption periods, which should be the
most vulnerable funds, do sell stock in response to outflows, but they use most of the proceeds to
buy more stock. We also show that hedge funds hold well-diversified portfolios and rarely sell
the same stocks at the same time. This evidence calls into question the extent to which hedge
funds are forced to sell into a falling market.
We explicitly test for fire sales among hedge funds and find that stocks under the most
pressure from widespread hedge fund sales do not lose value in the quarter in which they are sold.

29
Nor are there price reversals one would expect when excess selling of stocks drives their prices
below their fundamental values. In sum, we find no evidence that hedge funds engage in fire
sales during the subprime crisis or any other time during our 1998-2010 sample period. Our
results also hold for pressure buys, which show no evidence of price increases when hedge funds
are forced to buy them.
We attribute the lack of price pressure from hedge fund trading to two factors. First,
hedge funds rarely sell the same stocks during the same quarters. Furthermore, when hedge funds
do sell large quantities of stock, they sell the best performing, largest, and most liquid stocks in
their portfolios. This cherry picking strategy minimizes the downward price pressure on stock
prices when they are forced to sell. We infer that these funds own sufficiently well-diversified
portfolios in that their trading activity does not lead to a significant impact on the stock price,
and therefore the pressure sales and purchases and not followed by price reversals when the
pressure ends.

30
References
Adrian, T. and H. S. Shin. 2008. Liquidity and Financial Cycles. Working paper.
Adrian, T. and H.S. Shin. 2010. Liquidity and Leverage. Journal of Financial Intermediation 19:418-437.
Agarwal, V., N.D. Daniel, and N.Y. Naik. 2009. Role of Managerial Incentives and Discretion in Hedge Fund Performance. Journal of Finance, 64:2221-2256.
Allen, F. and E. Carletti. 2006. Credit Risk Transfer and Contagion. Journal of Monetary Economics 53:89-111.
Ambrose, B. W., K. Cai, and J. Helwege. 2012. Fallen Angels and Price Pressure. Journal of Fixed Income 21:74-86.
Amihud, Y. 2002. Illiquidity and Stock Returns: Cross-Section and Time-Series Effects. Journal of Financial Markets 5:31-56.
Anand, A., P. J. Irvine, A. Puckett, and K. Venkataraman. 2012. Institutional Trading and Stock Resiliency: Evidence from the 2007-2009 Financial Crisis. forthcoming Journal of Financial Economics.
Ang, A., S. Gorovvy, and G. van Inwegan. 2011. Hedge Fund Leverage. Journal of Financial Economics 102:102-126.
Aragon, G. O. 2007. Share Restrictions and Asset Pricing: Evidence from the Hedge Fund Industry. Journal of Financial Economics 83:33-58.
Aragon, G. O. and P. E. Strahan. 2012. Hedge Funds as Liquidity Providers: Evidence from the Lehman Bankruptcy. Journal of Financial Economics 103:570-587.
Baquero, G. and M. Verbeek. 2009. A Portrait of Hedge Fund Investors: Flows, Performance, and Smart Money. Working paper, Erasmus University.
Ben-David, I., F. Franzoni, and R. Moussawi. 2012. Hedge Fund Stock Trading in the Financial Crisis of 2007-2009. Review of Financial Studies 25:1-54.
Billio, M., M. Getmansky, and L. Pelizzon. 2010. Crises and Hedge Fund Risk. Working paper.
Boyson, N. M., J. Helwege, and J. Jindra. 2012a. Liquidity Shocks, Crises and Fire Sales at Commercial Banks. Working paper.
Boyson, N. M., J. Helwege, and J. Jindra. 2012b. Liquidity Shocks, Crises and Fire Sales at Investment Banks. Working paper.
Boyson, N. M., C. W. Stahel, and R. M. Stulz. 2010. Hedge Fund Contagion and Liquidity Shocks. Journal of Finance 65:1789-1816.
Brown, G., J. Green, and J. Hand. 2010. Are Hedge Funds Systemically Important. Working Paper.

31
Brunnermeier, M. K. 2009. Deciphering the 2007-2008 Liquidity and Credit Crunch. Journal of Economic Perspectives 23:77-100.
Brunnermeier, M. K. and L. H. Pedersen. 2009. Market Liquidity and Funding Liquidity. Review of Financial Studies 22:2201-2238.
Cao, C., Y. Chen, B. Liang, and A. Lo. 2010. Can Hedge Funds Time Market Liquidity? Working paper.
Chen, J., S. Hanson, H. Hong, and J. Stein. 2008. Do Hedge Funds Profit from Mutual Fund Distress? Working paper.
Coval, J. and E. Stafford. 2007. Asset Fire Sales (and Purchases) in Equity Markets. Journal of Financial Economics 86:479-512.
Diamond, D. and R. Rajan. 2010. Fear of Fire Sales, Illiquidity and Credit Freezes. Quarterly Journal of Economics 126:557-591.
Ding, B., M. Getmansky, B. Liang, and R. Wermers. 2009. Share Restrictions and Investors Flows in the Hedge Fund Industry. Working paper.
Fama, E. and J. MacBeth. 1973. Risk, Return, and Equilibrium: Empirical Tests. Journal of Political Economy 81:607-636.
Geanakoplos, J. 2010. The Leverage Cycle. In D. Acemoglu, K. Rogoff, and M. Woodford, eds., NBER Macroeconomics Annual 2009, 24, 1-65.
Griffin, J. M. and J. Xu. 2009. How Smart are the Smart Guys? A Unique View from Hedge Fund Stock Holdings. Review of Financial Studies 22:2531–2570.
Gromb, D. and D. Vayanos. 2002. Equilibrium and Welfare in Markets with Financially Constrained Arbitrageurs. Journal of Financial Economics 66:361-407.
Hameed, A., W. Kang, and S. Viswanathan. 2010. Stock Market Declines and Liquidity. Journal of Finance 65:257-293..
He, Z., I. G. Khang, and A. Krishnamurthy. 2010. Balance Sheet Adjustments in the 2008 Crisis. IMF Review 58:118-156.
Khandani, A.E. and A.W. Lo. 2007. What Happened to the Quants in August 2007? Journal of Investment Management 5:5-54.
Krishnamurthy, A. 2009. Amplification Mechanisms in Liquidity Crises. American Economic Journal 2:1-33.
Liu, X. and A. Mello. 2011. The Fragile Capital Structure of Hedge Funds and the Limits to Arbitrage. Journal of Financial Economics 102(3): 491-506.
Maier, T., N. Schaub, and M. Schmid. 2011. Hedge Fund Liquidity and Performance: Evidence from Financial Crises. Working paper.

32
Manconi, A., M. Massimo, and A.Yasuda 2012. The Role of Institutional Investors in Propagating the Crisis of 2007-2008. forthcoming Journal of Financial Economics.
Massa, M., A. Simonov, and S. Yan. 2012. Contrarian Hedge Funds and Momentum Mutual Funds. Working paper.
Sadka, R. 2010. Liquidity Risk and the Cross-Section of Hedge-Fund Returns. Journal of Financial Economics 98:54-71.
Shadab, Houman D. 2009. Hedge Funds and the Financial Crisis. Mercatus on Policy, No. 24.
Shleifer, A. and R. W. Vishny. 1992. Liquidation Values and Debt Capacity: A Market Equilibrium Approach. Journal of Finance 47:1343-1366.
Shleifer, A. and R. W. Vishny. 2011. Fire Sales and Finance and Macroeconomics. Journal of Economic Perspectives 25:29-48.
Uhlig, H. 2010. A Model of a Systemic Bank Run. Journal of Monetary Economics 57:78-96.
Zhang, Hanjiang. 2009. Asset Fire Sales, Liquidity Provision, and Mutual Fund Performance. Working paper, University of Texas at Austin.

33
Table 1: Summary Statistics Panel A presents summary statistics at the hedge fund family level for funds that owned stocks during the period 1998 to 2010. Panel B presents additional portfolio, by year, at the hedge fund family level. Panel C presents stock portfolio statistics at the hedge fund family level. Panel D presents individual stock characteristics at the individual stock level for stocks traded by hedge funds.
Panel A: Quarterly Fund Family Characteristics at the Fund Family Level N Mean Median Q1 Q3 Continuous Variables Size ($ million) 4,973 743 270 91 748 Min. required investment ($ million) 4,953 2.0 1.0 0.55 1.50 Fund family age in years 4,973 10 9 7 12 Lockup period in months 4,973 6 4 0 12 Total redemption period in days 4,857 156 135 111 163 Quarterly flow as a % of AUM 4,973 0.009 0.008 -0.048 0.066 Quarterly flow volatility 4,507 0.108 0.050 0.030 0.088 Quarterly return 4,973 0.014 0.013 -0.015 0.045 Incentive fee (% of assets) 4,973 0.19 0.20 0.20 0.20 Management fee (% of profits) 4,973 0.014 0.013 0.010 0.015 Indicator Variables Manager is a registered inv. advisor? 4,973 0.14 Fund uses leverage? 4,973 0.62 Fund has high water mark? 4,973 0.78 Fund is convertible arbitrage style? 4,973 0.06 Fund is dedicated short bias style? 4,973 0.00 Fund is event driven style? 4,973 0.18 Fund is equity market neutral style? 4,973 0.00 Fund is long-short equity style? 4,973 0.52 Fund is global macro style? 4,973 0.02 Fund is managed futures style? 4,973 0.01 Fund is fixed income arbitrage style? 4,973 0.01
Panel B: Fund Family Level, by Year
Year
Average Number of
Funds
Mean Fund Size
Equity Portfolio
(13F) $ Million
Number of Stocks Per
Manager
Avg. Quarterly Change in HF Holdings, (% Share of Equity
Holdings) Number Mean Mean Mean Median Mean Median
1998 36 603 683 133 72 0.091 0.032 1999 46 461 757 118 63 0.118 0.055 2000 60 488 797 143 76 0.070 0.026 2001 80 500 672 137 68 0.133 0.076 2002 91 569 557 138 68 0.086 0.054 2003 105 588 655 143 73 0.127 0.067 2004 124 773 792 155 69 0.108 0.055 2005 140 810 771 150 65 0.094 0.046 2006 147 939 796 152 60 0.076 0.029 2007 141 967 905 157 60 0.096 0.048 2008 116 878 621 132 49 0.017 -0.010 2009 86 687 553 136 50 0.114 0.045 2010 72 752 726 134 63 0.104 0.053

34
Table 1: Summary Statistics, Continued
Panel C: Stock Portfolio Characteristics at the Fund Family Level
N Mean Median Q1 Q3 Market value of stock portfolio ($MM) 4,973 726 329 137 769 Number of stocks per filing 4,973 144 64 34 120 Hedge fund holding/Stock market cap 4,973 0.009 0.005 0.002 0.010 Transaction size ($ million) 4,964 5.62 3.11 1.34 6.40 Quarterly change in HF holdings 4,973 0.093 0.044 -0.085 0.225
Panel D: Stock Characteristics at the Stock Level
N Mean Median Q1 Q3 Prior year annual return 155,069 0.082 0.035 -0.238 0.318 Return standard deviation 155,069 0.130 0.108 0.070 0.168 Total assets ($ million) 155,069 3,433 633 125 2,683 Market Capitalization ($ billion) 155,069 1,980 551 185 1,790 Tobin’s Q 155,069 2.30 1.63 1.05 2,96 Quarterly volume (millions of shares) 155,069 43 15 4 46 Amihud Illiquidity Measure * 108 155,069 0.972 0.058 0.011 0.387 (Bid-Ask)/Bid (Daily) * 102 155,069 0.063 0.027 0.013 0.071

35
Table 2: Crisis and Boom Periods
This table reports the periods of Booms and Crisis as determined by in-sample distribution of the following indicators: NBER recessions and expansions; bank failures (normalized by the contemporaneous number of banks); TED spread; Moody's AAA-Baa credit spreads; flight to quality indicator (Collin-Dufresne, Goldstein, and Helwege (2009)); the Long Term Capital Management (“LTCM”) episode; stock market declines and increases; and credit crunch periods (Bordo and Haubrich (2009)).
Periods Dates Notes Crisis 8/1998 - 1/1999 - High TED spread
- Flight to quality - LTCM episode - Low stock market returns
3/2001 - 11/2001 - NBER contraction (3/2001 - 11/2001) - Flight to quality - Low stock market returns
3/2007 - 06/2009 - NBER contraction - High bank failures - High TED and credit spreads - Flight to quality - Credit crunch - Low stock market returns
Boom 6/1999 - 5/2000 - NBER expansion
- High stock market returns
1/2003 - 2/2004 - NBER expansion - Low credit spreads - High stock market returns

36
Table 3: Fund Flows
Funds are divided into quintiles each quarter, based on flows. Panel A reports average fund flows, and Panel B reports average lagged quarterly performance by flow quintile. Panel C reports the proportion of funds that have outflows (e.g. negative flows), both in the aggregate and by fund style. Both panels report flows for all periods, boom, crises, and the subprime crisis. t-tests for differences in means between the subprime crisis and booms and for all crises and booms are performed for all analyses, and Panels A and B include tests for differences between flow quintiles.
Panel A: Flows by Fund Flow Quintile
Quintile N Overall Boom Crisis Subprime
Crisis Diff: Sub Crisis - Boom
Diff: Crisis-Boom
1 (worst) 1,000 -0.149 -0.135 -0.158 -0.170 -0.035*** -0.012***
2 1,019 -0.038 -0.024 -0.054 -0.061 -0.037*** -0.007*** 3 994 0.008 0.013 0.000 -0.008 -0.021*** -0.008*** 4 1,006 0.056 0.058 0.048 0.039 -0.019*** -0.009***
5 (best) 954 0.177 0.184 0.156 0.148 -0.036*** -0.008*** Diff (1-5) NA -0.326*** -0.320*** 0.315*** -0.318*** NA NA
Panel B: Quarterly Lagged Fund Performance by Flow Quintile
Quintile N Overall Boom Crisis Subprime
Crisis Diff: Sub Crisis - Boom
Diff: Crisis-Boom
1 (worst) 958 -0.003 0.019 -0.018 -0.012 -0.031*** -0.037*** 2 981 0.012 0.042 -0.011 -0.014 -0.056*** -0.053*** 3 953 0.016 0.036 -0.007 -0.006 -0.042*** -0.043*** 4 958 0.020 0.040 -0.001 0.003 -0.037*** -0.041***
5 (best) 867 0.030 0.041 0.011 0.010 -0.031*** -0.030*** Diff (1-5) NA -0.033*** 0.022*** 0.030*** 0.023*** NA NA
Panel C: Proportion of Funds with Outflows
Quintile N Overall Boom Crisis Subprime
Crisis Diff: Sub Crisis - Boom
Diff: Crisis-Boom
All Funds 4,973 0.445 0.424 0.479 0.506 0.082*** 0.055*** By Style Global Macro 63 0.317 0.333 0.368 0.294 -0.039 0.035 Conv. Arbitrage 248 0.440 0.415 0.370 0.364 -0.051 -0.045 Emerging Markets 104 0.394 0.278 0.426 0.452 0.174* 0.148 Event Driven 849 0.393 0.378 0.444 0.505 0.127*** 0.066* Multi-Strategy 902 0.453 0.439 0.449 0.469 0.030 0.010 Fund of Funds 182 0.500 0.360 0.491 0.477 0.117 0.131 Long-Short 2,528 0.456 0.446 0.508 0.539 0.093*** 0.062** Managed Futures 62 0.597 0.364 0.727 0.696 0.332** 0.363** Fixed Inc. Arbitrage 43 0.512 0.500 0.857 1.000 0.500** 0.357*

37
Table 4: Portfolio Changes by Period and Measures of Pressure
This table reports mean portfolio changes as measured using the Coval and Stafford (2007) approach and the Ben-David et. al. (2012) approach as detailed in Section III. Panel A reports data for all funds, Panel B reports data for funds in the bottom quintile of flows, Panel C reports data for funds in the bottom tercile of lockup period, and Panel D reports data for funds in the bottom tercile of redemption period. All Panels report data for all periods, booms, all crises, and the subprime crisis separately.
Panel A: All Funds
All Periods
Booms
Crises
Subprime Crisis
Portfolio Changes (Coval and Stafford) Eliminate as % of prior period shares 0.378 0.371 0.392 0.390 Decrease as % of prior period shares 0.226 0.233 0.228 0.234 Increase as % of prior period shares 0.239 0.233 0.236 0.239 Maintain as % of prior period shares 0.157 0.163 0.144 0.137 Portfolio Changes (Ben-David et. al.) Eliminate as a % of prior period MV 0.249 0.257 0.243 0.242 Decrease as a % of prior period MV 0.117 0.126 0.117 0.120 Increase existing % of prior period MV 0.129 0.131 0.125 0.126 Buy new as % of prior period MV 0.330 0.365 0.310 0.304 Net Buys 0.093 0.113 0.075 0.068
Panel B – Only Funds in Bottom Flow Quintile
All Periods
Booms
Crises Subprime
Crisis Portfolio Changes (Coval and Stafford)
Eliminate as % of prior period shares 0.420 0.398 0.435 0.443 Decrease as % of prior period shares 0.236 0.261 0.238 0.240 Increase as % of prior period shares 0.211 0.208 0.210 0.208 Maintain as % of prior period shares 0.134 0.133 0.117 0.109 Portfolio Changes (Ben-David et. al.) Eliminate as a % of prior period MV 0.282 0.270 0.274 0.276 Decrease as a % of prior period MV 0.129 0.132 0.133 0.136 Increase existing % of prior period MV 0.116 0.115 0.118 0.118 Buy new as % of prior period MV 0.340 0.366 0.312 0.314 Net Buys 0.045 0.079 0.023 0.020

38
Table 4: Portfolio Changes by Period and Measures of Pressure, continued
Panel C – Only Funds in Bottom Lockup Period Quintile
All Periods
Booms
Crises
Subprime Crisis
Portfolio Changes (Coval and Stafford)
Eliminate as % of prior period shares 0.414 0.389 0.442 0.449 Decrease as % of prior period shares 0.215 0.231 0.208 0.211 Increase as % of prior period shares 0.226 0.227 0.222 0.223 Maintain as % of prior period shares 0.145 0.153 0.128 0.117 Portfolio Changes (Ben-David et. al.) Eliminate as a % of prior period MV 0.271 0.266 0.270 0.276 Decrease as a % of prior period MV 0.118 0.126 0.118 0.122 Increase existing % of prior period MV 0.136 0.140 0.134 0.134 Buy new as % of prior period MV 0.369 0.394 0.374 0.371 Net Buys 0.116 0.143 0.119 0.107
Panel D – Only Funds in Bottom Redemption Period Quintile
All Periods
Booms
Crises Subprime
Crisis Portfolio Changes (Coval and Stafford)
Eliminate as % of prior period shares 0.371 0.356 0.375 0.378 Decrease as % of prior period shares 0.235 0.211 0.241 0.244 Increase as % of prior period shares 0.257 0.251 0.263 0.266 Maintain as % of prior period shares 0.138 0.181 0.121 0.111 Portfolio Changes (Ben-David et. al.) Eliminate as a % of prior period MV 0.247 0.262 0.242 0.253 Decrease as a % of prior period MV 0.120 0.120 0.121 0.121 Increase existing % of prior period MV 0.128 0.128 0.125 0.124 Buy new as % of prior period MV 0.312 0.340 0.270 0.243 Net Buys 0.073 0.086 0.032 -0.007

39
Table 5 Buying and Selling Activity as a Function of Flows, Leverage and Performance
This table performs OLS regression analyses examining quarterly sells, buys, and net sells (sells-buys) of stock at the hedge fund family level. The independent variables are sales as a proportion of market value, buys as a proportion of market value, and net sells as a proportion of market value. Regressions are performed for the entire sample period (1998-2010), all crisis periods, the recent crisis period, and all boom periods. All regressions include style dummies. Independent variables are described in Section III. Standard errors are clustered at the family and time levels. Statistical significance is denoted with * ,** , and *** at the 1%, 5%, and 10% levels, respectively.
All Periods (1998-2010) All Crises Subprime Crisis (Q107-Q209) All Booms Sells Buys Net Sells Sells Buys Net Sells Sells Buys Net Sells Sells Buys Net Sells Constant 0.918*** 0.788*** 0.131 0.868*** 0.607*** 0.261* 0.904*** 0.587*** 0.317* 0.909*** 0.977*** -0.068 Boom Indicator 0.013* 0.030* -0.016 Crisis Indicator -0.001 -0.015 0.013 Flow Quintile Indicators Bottom Flow Quintile (D1) 0.036*** 0.002 0.033* 0.037*** -0.009 0.045*** 0.041*** -0.006 0.047*** 0.009 -0.001 0.010 Top Flow Quintile (D5) -0.004 0.082*** -0.086*** -0.011 0.084*** -0.095*** -0.006 0.085*** -0.091*** 0.005 0.115*** -0.110*** Control Variables Leverage Dummy -0.032 -0.024 -0.008 -0.031 -0.033 0.002 -0.025 -0.036 0.012 -0.027 -0.036 0.009 Log Stock Portfolio Size -0.037*** -0.017** -0.020*** -0.036*** -0.006 -0.030*** -0.038*** -0.009 -0.029*** -0.036*** -0.023 -0.013 Fund Quarterly Return 0.195*** 0.419*** -0.223** 0.207*** 0.534*** -0.327*** 0.161*** 0.529*** -0.367*** 0.200 0.241 -0.041 Log of Fund Age 0.036** 0.016 0.020 0.030** -0.005 0.035** 0.028* -0.008 0.036** 0.055*** 0.014 0.041*** Incentive Fee (% Profits) -0.036 0.248 -0.284 0.458 0.479 -0.021 0.803** 1.034*** -0.231 -0.496* -0.103 -0.393 Mgmt. Fee (% AUM) 7.248*** 6.473** 0.775 7.919*** 7.018*** 0.901 7.917*** 8.480*** -0.564 8.968** 13.315*** -4.347* Log of Min. Investment 0.007 -0.007 0.014** 0.003 -0.007 0.010 0.000 -0.007 0.008 0.006 -0.020 0.026** High Watermark Dummy -0.032 -0.036 0.004 -0.045 -0.069* 0.024 -0.063*** -0.112** 0.049 -0.014 -0.012 -0.002 RIA Dummy -0.026 -0.011 -0.015 -0.030 -0.028 -0.002 -0.034* -0.035 0.001 0.010 0.058* -0.048** p-value: D1=D5? 0.00*** 0.00*** 0.00*** 0.00*** 0.00*** 0.00*** 0.00*** 0.00*** 0.00*** 0.39 0.00*** 0.00*** Adjusted R2 0.149 0.098 0.080 0.167 0.111 0.091 0.182 0.140 0.095 0.137 0.112 0.111 Includes Style Dummies? Yes Yes Yes Yes Yes Yes Yes Yes Yes Yes Yes Yes N 4,953 4,953 4,953 1,506 1,506 1,506 1,197 1,197 1,197 899 899 899

40
Table 6 Buying and Selling Activity as a Function of Hedge Fund Constraints
This table performs OLS regression analyses examining quarterly sells, buys, and net sells (sells-buys) of stock at the hedge fund family level. The dependent variables are sales as a proportion of market value, buys as a proportion of market value, and net buys as a proportion of market value. Regressions are performed for the entire sample period (1998-2010), all crisis periods, the recent crisis period, and all boom periods. Independent variables are described in Section III. Standard errors are clustered at the family and time levels. Statistical significance is denoted with * ,** , and *** at the 1%, 5%, and 10% levels, respectively.
All Periods (1998-2010) All Crises Subprime Crisis (Q107-Q209) All Booms Sells Buys Net Sells Sells Buys Net Sells Sells Buys Net Sells Sells Buys Net Sells Constant 0.877*** 0.802*** 0.075 0.858*** 0.718*** 0.140 0.820*** 0.640*** 0.180 1.064*** 1.142*** -0.078 Boom Indicator 0.013 0.031** -0.018** Crisis Indicator -0.003 -0.013 0.010 Flow Quintile Indicators Bottom Flow Quintile (D1) 0.035*** 0.002 0.033* 0.032*** -0.022 0.054*** 0.032*** -0.020* 0.052*** 0.008 0.017 -0.008 Top Flow Quintile (D5) -0.003 0.088*** -0.091*** -0.020** 0.085*** -0.106*** -0.014* 0.089*** -0.103*** -0.008 0.138*** -0.146*** Lockup and Red. Period Short Lockup Pd. Quintile 0.027 0.056** -0.029** 0.048* 0.116*** -0.068*** 0.066*** 0.124*** -0.058** 0.013 0.039 -0.026 Long Lockup Pd. Quintile -0.010 -0.039 0.029 0.002 -0.039 0.041 0.001 -0.043 0.044 0.013 -0.055 0.068** Short Red. Pd. Quintile -0.014 -0.052 0.038* -0.031 -0.091* 0.059 -0.017 -0.134*** 0.117*** -0.020 -0.095*** 0.075*** Long Red. Pd. Quintile -0.038* -0.055** 0.018 -0.011 -0.011 0.000 -0.004 -0.022 0.018 -0.059*** -0.057 -0.002 Control Variables Leverage Dummy -0.031 -0.020 -0.011 -0.032 -0.026 -0.006 -0.023 -0.028 0.006 -0.035 -0.027 -0.008 Log Stock Portfolio Size -0.038*** -0.019*** -0.019*** -0.037*** -0.009 -0.028** -0.039*** -0.012 -0.027 -0.040*** -0.030* -0.011 Fund Quarterly Return 0.221*** 0.438*** -0.217*** 0.218*** 0.544*** -0.326*** 0.176*** 0.508*** -0.332*** 0.268** 0.238 0.030 Log of Fund Age 0.038** 0.022 0.017 0.028** -0.006 0.035** 0.027 0.000 0.027 0.057*** 0.029** 0.028** Incentive Fee (% Profits) -0.038 0.157 -0.195 0.422 0.212 0.210 0.797* 0.472 0.324 -0.524* -0.041 -0.483 Mgmt. Fee (% AUM) 7.678*** 7.705** -0.028 8.029*** 8.591** -0.562 8.839*** 12.198*** -3.359* 10.442*** 11.420*** -0.978 Log of Min. Investment 0.009 -0.009 0.018*** 0.004 -0.014 0.018** 0.004 -0.011 0.015 0.000 -0.024 0.024* High Watermark Dummy -0.022 -0.015 -0.007 -0.028 -0.020 -0.008 -0.034 -0.042 0.008 -0.010 -0.028 0.019 RIA Dummy -0.036 -0.024 -0.013 -0.031 -0.020 -0.011 -0.037 -0.022 -0.015 0.005 0.043 -0.038 p-value: D1-D5? 0.00*** 0.00*** 0.00*** 0.00*** 0.00*** 0.00*** 0.00*** 0.00*** 0.00*** 0.94 0.01*** 0.00*** Pseudo R2 0.167 0.119 0.086 0.183 0.153 0.112 0.202 0.190 0.119 0.165 0.137 0.131 Includes Style Dummies? Yes Yes Yes Yes Yes Yes Yes Yes Yes Yes Yes Yes N 4,546 4,546 4,546 1,380 1,380 1,380 1,095 1,095 1,095 791 791 791

41
Table 7: Monthly Cumulative Average Abnormal Return for Stocks Around Hedge Fund Sales This table reports cumulative abnormal returns in excess of the equally-weighted average of all stocks held by hedge funds at the beginning of the month. Results are reported for “pressure sale” stocks, which are stocks with PRESSURE below the 20th percentile. Results are also reported for “pressure buy” stocks, which are stocks with PRESSURE above the 20th percentile. PRESSURE is stock-level variable calculated as the quantity of shares bought by mutual funds with inflows above the 20th percentile less the quantity of shares sold by mutual funds with outflows below the 20th percentile scaled by the average monthly trading volume for the stock, requiring at least 10 owners for each stock and at least 25 hedge funds during the event quarter. Statistical significance is denoted with * ,** , and *** at the 1%, 5%, and 10% levels, respectively. These results are graphed in Figure 1.
Panel A: All Periods
Panel B: All Crises
Panel C: Subprime Crisis
Panel D: Booms
Pressure Sales Pressure Buys Time CAAR t-statistic CAAR t-statistic
Event Period [t-12, t-1] 0.121*** 2.81 0.127*** 3.26 Event Period [t1, t3] -0.017 -1.12 0.015 1.34
Event Period [t+1, t+6] -0.004 -0.12 -0.035* -1.88 Event Period [t+1, t+12] 0.018 0.50 -0.036 -1.53 Event Period [t+1, t+18] 0.005 0.12 -0.062 -1.63
Pressure Sales Pressure Buys Time CAAR t-statistic CAAR t-statistic
Event Period [t-12, t-1] 0.166** 2.06 0.241*** 2.79 Event Period [t1, t3] -0.034 -1.28 0.016 0.69
Event Period [t+1, t+6] -0.061 -1.34 -0.035 -1.09 Event Period [t+1, t+12] -0.053 -1.19 -0.045 -1.00 Event Period [t+1, t+18] -0.069* -1.73 -0.083 -1.40
Pressure Sales Pressure Buys Time CAAR t-statistic CAAR t-statistic
Event Period [t-12, t-1] 0.134** 1.95 0.185*** 2.48 Event Period [t1, t3] -0.017 -0.74 0.034 1.36
Event Period [t+1, t+6] -0.013 -0.36 -0.030 -0.85 Event Period [t+1, t+12] -0.001 -0.02 -0.052 -1.34 Event Period [t+1, t+18] -0.026 -0.84 -0.078 -1.43
Pressure Sales Pressure Buys Time CAAR t-statistic CAAR t-statistic
Event Period [t-12, t-1] 0.165 1.26 0.064 0.40 Event Period [t1, t3] -0.051 -1.50 0.011 0.22
Event Period [t+1, t+6] 0.047 0.59 -0.169 -1.52 Event Period [t+1, t+12] 0.151 0.82 -0.152 -1.15 Event Period [t+1, t+18] 0.096 0.59 -0.221 -0.98

42
Table 8 Characteristics of Pressure Buys and Pressure Sales at the Individual Stock Level
This table reports medians of stock-level characteristics of pressure stocks and all other holdings for the period 2001-2010. Pressure buys are stocks with heavy buying pressure and pressure sells are stocks with heavy selling pressure, as defined in Section IV.
Panel A: All Periods All CRSP
Stocks Pressure
Sales (PS) Pressure Buys
(PB) All Other HF
Holdings PS-All Other HF Holdings
PS-PB
Prior Year Annual Return 0.068 0.126 0.147 0.033 0.093*** -0.021**
Prior Year Standard Dev. 0.094 0.095 0.094 0.108 -0.013*** 0.001 Total Assets ($MM) 567 2,851 2,906 609 2,242*** -55 Tobin’s Q 1.54 2.03 1.93 1.63 0.40*** 0.10 Market Cap ($MM) 466 2,873 2,826 532 2,341*** 47 Avg. Qrtly. Vol. (MM) 10 69 59 14 55*** 10*** Amihud Illiquidity * 108 0.073 0.005 0.004 0.061 -0.056*** 0.001* B-A: (B-A)/B*102 0.029 0.011 0.011 0.028 -0.017*** 0.000**
Panel B: All Crises All CRSP
Stocks Pressure
Sales (PS) Pressure Buys
(PB) All Other HF
Holdings PS-All Other HF Holdings
PS-PB
Prior Year Annual Return -0.046 0.041 0.097 -0.085 0.126*** -0.056***
Prior Year Standard Dev. 0.102 0.090 0.091 0.116 -0.026*** -0.001 Total Assets ($MM) 595 4,574 3,832 623 3,951*** 742 Tobin’s Q 1.49 2.12 1.83 1.56 0.56*** 0.29 Market Cap ($MM) 490 3,912 3,565 523 3,389*** 347 Avg. Qrtly. Vol. (MM) 12 96 65 16 80*** 31*** Amihud Illiquidity * 108 0.066 0.003 0.003 0.062 -0.059*** 0 B-A: (B-A)/B*102 0.027 0.012 0.011 0.027 -0.015*** 0.001*
Panel C: Subprime Crisis
All CRSP Stocks
Pressure Sales (PS)
Pressure Buys (PB)
All Other HF Holdings
PS-All Other HF Holdings
PS-PB
Prior Year Annual Return -0.052 0.052 0.112 -0.077 0.129*** -0.060***
Prior Year Standard Dev. 0.093 0.085 0.088 0.104 -0.019*** -0.003 Total Assets ($MM) 647 4,491 3,716 635 3,856*** 775 Tobin’s Q 1.51 2.18 1.84 1.59 0.59*** 0.34 Market Cap ($MM) 557 3,953 3,556 556 3,397*** 397 Avg. Qrtly. Vol. (MM) 14 95 67 17 78*** 28*** Amihud Illiquidity * 108 0.045 0.003 0.003 0.047 -0.044*** 0.000 B-A: (B-A)/B*102 0.02 0.011 0.010 0.021 -0.010*** 0.001**
Panel D: All Booms All CRSP
Stocks Pressure
Sales (PS) Pressure
Buys (PB) All Other HF
Holdings PS-All Other HF Holdings
PS-PB
Prior Year Annual Return 0.045 0.058 -0.006 -0.013 0.071** 0.064
Prior Year Standard Dev. 0.099 0.147 0.127 0.121 0.026*** 0.020** Total Assets ($MM) 551 1,871 2,226 629 1,242*** -355** Tobin’s Q 1.46 1.99 1.81 1.56 0.43*** 0.18 Market Cap ($MM) 353 1,970 2,028 442 1,528*** -58 Avg. Qrtly. Vol. (MM) 6 84 70 10 74*** 14 Amihud Illiquidity * 108 0.154 0.010 0.009 0.107 -0.097*** 0.001 B-A: (B-A)/B*102 0.056 0.028 0.030 0.054 -0.026*** -0.002
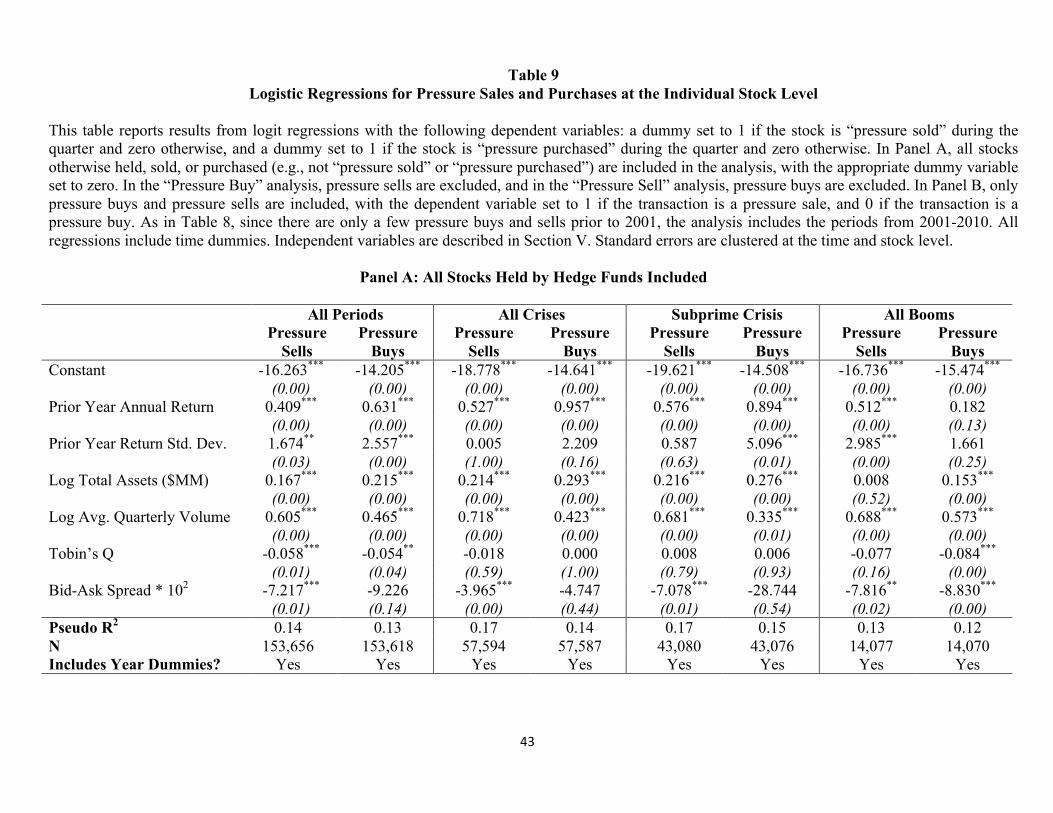
43
Table 9 Logistic Regressions for Pressure Sales and Purchases at the Individual Stock Level
This table reports results from logit regressions with the following dependent variables: a dummy set to 1 if the stock is “pressure sold” during the quarter and zero otherwise, and a dummy set to 1 if the stock is “pressure purchased” during the quarter and zero otherwise. In Panel A, all stocks otherwise held, sold, or purchased (e.g., not “pressure sold” or “pressure purchased”) are included in the analysis, with the appropriate dummy variable set to zero. In the “Pressure Buy” analysis, pressure sells are excluded, and in the “Pressure Sell” analysis, pressure buys are excluded. In Panel B, only pressure buys and pressure sells are included, with the dependent variable set to 1 if the transaction is a pressure sale, and 0 if the transaction is a pressure buy. As in Table 8, since there are only a few pressure buys and sells prior to 2001, the analysis includes the periods from 2001-2010. All regressions include time dummies. Independent variables are described in Section V. Standard errors are clustered at the time and stock level.
Panel A: All Stocks Held by Hedge Funds Included
All Periods All Crises Subprime Crisis All Booms Pressure
Sells Pressure
Buys Pressure
Sells Pressure
Buys Pressure
Sells Pressure
Buys Pressure
Sells Pressure
Buys Constant -16.263*** -14.205*** -18.778*** -14.641*** -19.621*** -14.508*** -16.736*** -15.474*** (0.00) (0.00) (0.00) (0.00) (0.00) (0.00) (0.00) (0.00) Prior Year Annual Return 0.409*** 0.631*** 0.527*** 0.957*** 0.576*** 0.894*** 0.512*** 0.182 (0.00) (0.00) (0.00) (0.00) (0.00) (0.00) (0.00) (0.13) Prior Year Return Std. Dev. 1.674** 2.557*** 0.005 2.209 0.587 5.096*** 2.985*** 1.661 (0.03) (0.00) (1.00) (0.16) (0.63) (0.01) (0.00) (0.25) Log Total Assets ($MM) 0.167*** 0.215*** 0.214*** 0.293*** 0.216*** 0.276*** 0.008 0.153*** (0.00) (0.00) (0.00) (0.00) (0.00) (0.00) (0.52) (0.00) Log Avg. Quarterly Volume 0.605*** 0.465*** 0.718*** 0.423*** 0.681*** 0.335*** 0.688*** 0.573*** (0.00) (0.00) (0.00) (0.00) (0.00) (0.01) (0.00) (0.00) Tobin’s Q -0.058*** -0.054** -0.018 0.000 0.008 0.006 -0.077 -0.084*** (0.01) (0.04) (0.59) (1.00) (0.79) (0.93) (0.16) (0.00) Bid-Ask Spread * 102 -7.217*** -9.226 -3.965*** -4.747 -7.078*** -28.744 -7.816** -8.830*** (0.01) (0.14) (0.00) (0.44) (0.01) (0.54) (0.02) (0.00) Pseudo R2 0.14 0.13 0.17 0.14 0.17 0.15 0.13 0.12 N 153,656 153,618 57,594 57,587 43,080 43,076 14,077 14,070 Includes Year Dummies? Yes Yes Yes Yes Yes Yes Yes Yes

44
Table 9, Logistic Regressions for Pressure Sales and Purchases, Continued
Panel B: Only Pressure Sales and Buys Included (Dependent Variable = 1 if Pressure Sale and 0 if Pressure Buy)
All Periods All Crises Subprime Crisis All Booms Constant -2.695* -5.773** -5.880* -2.011 (0.07) (0.02) (0.08) (0.70) Prior Year Annual Return -0.179 -0.346** -0.304 0.212 (0.14) (0.02) (0.11) (0.62) Prior Year Return Standard Dev. -1.039 -2.452 -4.030 0.964 (0.32) (0.37) (0.13) (0.52) Log Total Assets ($MM) -0.053 -0.055 -0.059 -0.422*** (0.17) (0.21) (0.30) (0.01) Average Quarterly Volume 0.183*** 0.378*** 0.385*** 0.281 (0.01) (0.00) (0.01) (0.20) Tobin’s Q -0.002 -0.008 -0.001 -0.068 (0.87) (0.70) (0.96) (0.36) Bid-Ask Spread * 102 0.581 -0.240 5.155 5.026 (0.78) (0.95) (0.53) (0.11) Pseudo R2 0.01 0.03 0.03 0.05 N 2,786 949 830 195 Includes Time Dummies? Yes Yes Yes Yes

45
0
500
1000
1500
2000
2500
3000
3500
4000
4500
5000Mar‐01
Jun‐01
Sep‐01
Dec‐01
Mar‐02
Jun‐02
Sep‐02
Dec‐02
Mar‐03
Jun‐03
Sep‐03
Dec‐03
Mar‐04
Jun‐04
Sep‐04
Dec‐04
Mar‐05
Jun‐05
Sep‐05
Dec‐05
Mar‐06
Jun‐06
Sep‐06
Dec‐06
Mar‐07
Jun‐07
Sep‐07
Dec‐07
Mar‐08
Jun‐08
Sep‐08
Dec‐08
Mar‐09
Jun‐09
Sep‐09
Dec‐09
Mar‐10
Jun‐10
Sep‐10
Figure1:QuarterlyCountsofStocks,byPressureCategory
Non‐PressureStocks PressureSaleStocks PressurePurchaseStocks

46
Figure 2: Performance of Pressure Sales and Pressure Buys
Panel A graphs cumulative monthly abnormal returns around the “pressure sales” and “pressure buys” of stocks for all periods, Panel B graphs crisis periods only, Panel C graphs the recent crisis only, and Panel D graphs all booms. Pressure sales and pressure purchases are defined in Section IV.
Panel A
Panel B
‐0.050
0.000
0.050
0.100
0.150
0.200
0.250
CumulativeAverageAbnormalReturn
TimeRelativetoEventDate
AllPeriods
PressureSales PressureBuys
‐0.050
0.000
0.050
0.100
0.150
0.200
0.250
CumulativeAverageAbnormalReturn
TimeRelativetoEventDate
AllCrises
PressureSales PressureBuys
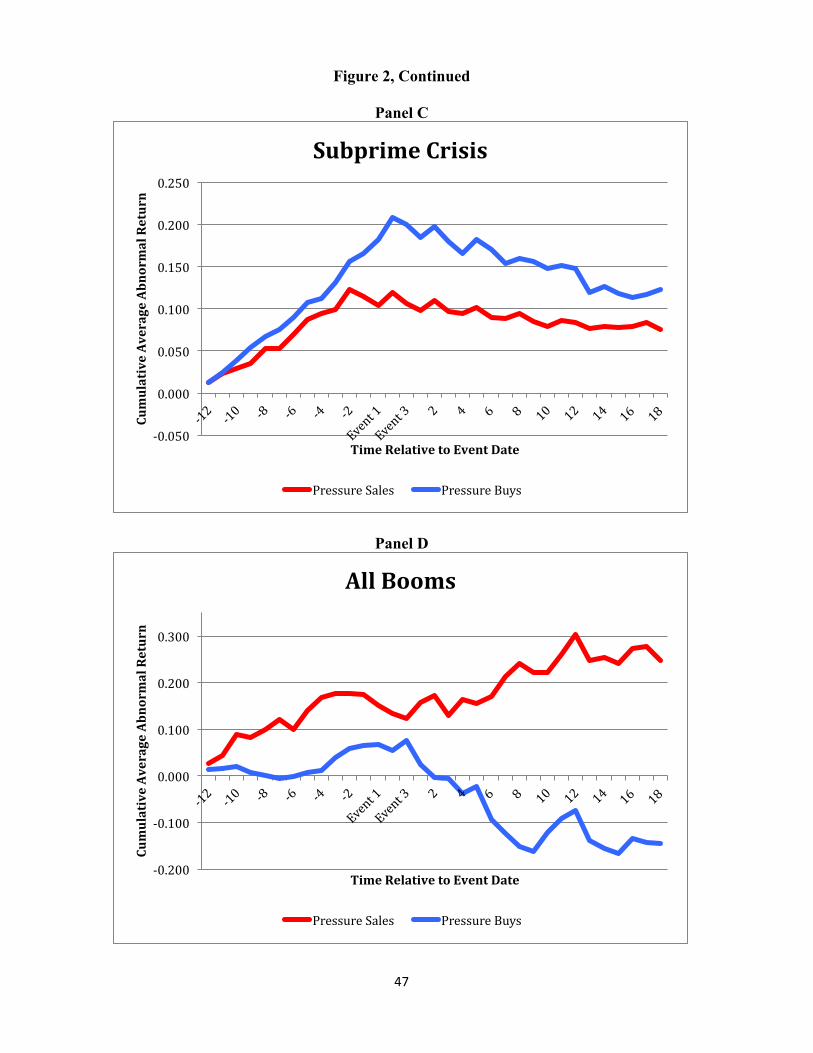
47
Figure 2, Continued
Panel C
Panel D
‐0.050
0.000
0.050
0.100
0.150
0.200
0.250
CumulativeAverageAbnormalReturn
TimeRelativetoEventDate
SubprimeCrisis
PressureSales PressureBuys
‐0.200
‐0.100
0.000
0.100
0.200
0.300
CumulativeAverageAbnormalReturn
TimeRelativetoEventDate
AllBooms
PressureSales PressureBuys

48
Figure 3: Pressure Sales, Purchases, and All Other Stocks Relative to Market Capitalization and Volume
0.0%
0.5%
1.0%
1.5%
2.0%
2.5%
3.0%
3.5%
4.0%
4.5%
5.0%M
ar-0
1 Ju
n-01
Se
p-01
D
ec-0
1 M
ar-0
2 Ju
n-02
Se
p-02
D
ec-0
2 M
ar-0
3 Ju
n-03
Se
p-03
D
ec-0
3 M
ar-0
4 Ju
n-04
Se
p-04
D
ec-0
4 M
ar-0
5 Ju
n-05
Se
p-05
D
ec-0
5 M
ar-0
6 Ju
n-06
Se
p-06
D
ec-0
6 M
ar-0
7 Ju
n-07
Se
p-07
D
ec-0
7 M
ar-0
8 Ju
n-08
Se
p-08
D
ec-0
8 M
ar-0
9 Ju
n-09
Se
p-09
D
ec-0
9 M
ar-1
0 Ju
n-10
Se
p-10
Prop
ortio
n of
Sto
ck's
Mar
ket C
ap
Panel A: Average Trade Dollar Value/Stock Market Capitalization
All Other Stocks Pressure Sales Pressure Buys
0.0%
2.0%
4.0%
6.0%
8.0%
10.0%
12.0%
14.0%
16.0%
Mar
-01
Jun-
01
Sep-
01
Dec
-01
Mar
-02
Jun-
02
Sep-
02
Dec
-02
Mar
-03
Jun-
03
Sep-
03
Dec
-03
Mar
-04
Jun-
04
Sep-
04
Dec
-04
Mar
-05
Jun-
05
Sep-
05
Dec
-05
Mar
-06
Jun-
06
Sep-
06
Dec
-06
Mar
-07
Jun-
07
Sep-
07
Dec
-07
Mar
-08
Jun-
08
Sep-
08
Dec
-08
Mar
-09
Jun-
09
Sep-
09
Dec
-09
Mar
-10
Jun-
10
Sep-
10
Prop
ortio
n of
Sto
ck's
Qua
rter
ly V
olum
e
Panel B: Number of Shares Traded/Quarterly Volume
All Other Stocks Pressure Sales Pressure Buys
Related Documents