u.s. Department of Justice Office of Justice Programs Bureau of Justice Assistance .\1 ) £ L p' Bureau of Justice Assistance The Social of the National Citizens' Crime Prevention Campaign FOCUS ON WHAT WORKS , If you have issues viewing or accessing this file contact us at NCJRS.gov.

Welcome message from author
This document is posted to help you gain knowledge. Please leave a comment to let me know what you think about it! Share it to your friends and learn new things together.
Transcript
u.s. Department of Justice
Office of Justice Programs
Bureau of Justice Assistance
~.~ .\1 ,~
)
£ L p'
Bureau of Justice Assistance
The Social Imp~act of the National Citizens' Crime Prevention Campaign
FOCUS ON WHAT WORKS
,
If you have issues viewing or accessing this file contact us at NCJRS.gov.
Bureau of Justice Assistance
The Social Impact of the Nationtal Citizens' Crime Preverltion Campaign
u.s. Department of Justice National Institute of Justice
144533
This document has bean reproduced exactly as received from the person or organization originating it. Points of view or opir.ions stated in this document are those of the authors and do not necessarily represent the official position or policies of the National Institute of Justice.
Permission to reproduce this ~ ...... material has been
ml~c DaIlain/aJP /BJA u . S. Department of Justice
to the National Criminal Justice Reference Service (NCJRS).
Further reproduction outside of the NCJRS system requirel> permission of the~owner.
FOCUS ON WHAT WORKS November 1993 I\ICJ 144533
---~-~-----------------------------
This document was prepared by the National Crime Prevention Council, supported by grant number 91-DD-CX-0034, awarded by the Bureau of Justice Assistance, U.S. Department of Justice. The opinions, findings, and conclusions or recommendations
expressed in this document are those of the authors and do not necessarily represent the official position or policies of the
U.S. Department of Justice.
Bureau of justice Assistance 633 Indiana Avenue NW., W~shington, DC 20531
(202) 514-6278
The Bureau of Justice Assistance is a component of the Office of Justice Programs, which also includes the Bureau of Justice Statistics, the National Institute of Justice, the Office of Juvenile Justice and Delinquency Prevention, and the Office for Victims of Crime.
ACKNOWLEDGMENTS
The Bureau of Justice Assistance wishes to thank Dr. Garrett O'Keefe, principal investigator, who had overall responsibility for this project and primary roles in research design, data analysis, and the writing of this report.
Dr. Dennis Rosenbaum contributed to the research design and was responsible for compiling community level data and reporting those data applied to crime prevention practitioner analyses in section 6 of this report. He also conducted the cost effectiveness research reported in section 7.
The Northwestern University Survey Laboratory did survey sampling design and field work under the direction of Dr. Paul Lavrakas. In addition to having a key role in study design, Dr. Lavrakas contributed portions of the methodology r€iJort dealing with sampling and field work. He also conducted the media managers' community analyses in section 5.
Dr. Kathleen Reid conducted the content analyses of the previous and current National Citizens' Crime Prevention Campaign public service announcements. She also authored the findings from tile announcements in section 2.
Renee Botta had primary responsibility for survey data compilation and analysis, particularly the citizen survey and community-level media components, and the descriptions of those in the methodology.
Julia Barrett assisted on many aspects of the data analysis and presentations. Several other individuals played key roles in this effort. Notable among them were Susan Hartnett, who directed the citizen and police field studies for the Northwestern University Survey Laboratory, and Sandra Bauman, who directed the media managers study. Julie Rursch, Shelly Strom, Jean Clavette, and Chariti Gent assisted on various other phases of the project at the University of Wisconsin. Donald Faggiani assisted with community data gathering at the University of Illinois at Chicago ..
Members of a project Advisory Board apPointed by the Bureau of Justice Assistance were extremely helpful in providing background information and views concerning the media campaign. In addition to Dr. Robert Kirchner, Project Monitor, the group included Robert Brown, BJA; Lois Mock, National Institute of Justice; and Mac Gray, National Crime Prevention Council. Fred Heinzelmann of the National Institute of Justice was particularly helpful as a reviewer of this report. Members of the National Citizens' Crime Prevention Media Campaign team (Karen Zavian of the Advertising Council and Jean O'Neil of the National Crime Prevention Council) were espeCially instrumental in providing valuable background information.
iii
TABLE OF CONTENTS
ACKNOWLEDGMENTS ........................................................................................................................................... iii
EXECUTIVE SUMMARY .......................................................................................................................................... vii
INTRODUCTION ..................................................................................................................................................... 1
SECTION 1: PROJECT BACKGROUND AND OBJECTIVES ...................................................................................... 3
Public Information Campaigns ........................................................................................................................... 3
Public Service Advertising ................................................................................................................................. 4
Crime Prevention and Drug Abuse: Programs and Evaluations ........................................................................... 6
Project Justification ............................................................................................................................................ 9
Project Goals and Objectives ............................................................................................................................ 9
Overview of ,\1ethodology ............................................................................................................................... 10
Limitations ....................................................................................................................................................... 11
SECTION 2: THE NATIONAL CITIZENS' CRIME PREVENTION MEDIA CAMPAIGN ............................................ 13
Campaign Goals .............................................................................................................................................. 13
Campaign Background .................................................................................................................................... 13
Content of the PSA Messages ............................................................................................... " .......................... 14
Previous Campaign Evaluations ....................................................................................................................... 16
SECTION 3: CITIZENS, CRIME, AND CRIME PREVENTION ................................................................................... 19
Public Orientations Toward Crime .................................................................................................................. 19
Personal Victimization Experience ................................................................................................................... 20
Citizen Crime Prevention Conlpetence ............................................................................................................ 20
Competence and Concern About Criine .......................................................................................................... 21
Citizen Views on Law Enforcement and Crime Prevention ............................................................................... 22
Communication and Crime Prevention ............................................................................................................ 22
Conclusions ..................................................................................................................................................... 23
SECTION 4: PUBLIC EXPOSURE AND RESPONSE TO THE MEDIA CAMPAIGN .................................................. 2S
How Widespread Is Exposure to McGruff? ...................................................................................................... 2S
Public Response to Phase xv .......................................................................................................................... 26
Citizen Exposure and Response to Other McGruff PSA's ................................................................................. 27
Who Is Exposed to McGruff? ........................................................................................................................... 27
v
Campaign Effects on the Public ...................................................................................................................... 29
Citizen Differences in Campaign Response ..................................................................................................... 31
Allied McGruff Campaign Activities and Materials ......................................................................................... 33
Conclusions ..................................................................................................................................................... 33
SECTION 5: USE OF AND REACTIONS TO THE CAMPAIGN BY THE MEDIA ..................................................... 35
How Media Gatekeeper:i View the National Citizens' Crime Prevention Campaign ........................................ 35
Perceptions of the McGruff PSA Media Campaign and Its Impact ................................................................... 37
Media Response to Other Anti-Crime Programs Versus McGruff PSA's ............................................................ 38
Other Issues Related to Local Crime and Drug Abuse Prevention .................................................................... 38
Type of Media and the McGruff PSA Campaign ................................................................. ., ........................... 39
Other Factors Related to Campaign Use and Reactions by the Media ............................................................. 40
Cross-Validation of Community-Level Campaign Measures ............................................................................ .41
Conclusions ..................................................................................................................................................... 42
SECTION 6: USE OF THE MEDIA CAMPAIGN IN LOCAL CRIME PREVENTION EFFORTS .................................. 45
How Crime Prevention Practitioners View the Campaign ............................................................................... 45
Impact of Organizational Factors on the Use of and Value Placed on McGruff ............................................... 47
Impact of Community Factors on the Use of and Value Placed on McGruff... ................................................. 49
Conclusions ........................................................................... " ...................................................................... 51
SECTION 7: THE MEDIA CAMPAIGN COSTS AND EFFECTIVENESS ................................................................... 53
Components of Cost-Effectiveness ......................... , ........................................................................................ 53
Cost-Effectiveness Analysis ............................................................................................................................. 55
Analysis of the Efficiency of Program Delivery ................................................................................................ 56
SECTION 8: CONCLUSIONS AND RECOMMENDATIONS ................................................................................. 59
Summary of Findings ....................................................................................................................................... 59
Conclusions ..................................................................................................................................................... 61
Recommendations ........................................................................................................................................... 62
BIBLIOGRAPHY ..................................................................................................................................................... 69
APPENDIX A: TABLES NUMBERED BY SECTION .................................................................................................. 73
APPENDIX B: SOURCES FOR FURTHER INFORMATION ................................................................................... 139
vi
• --EXECUTIVE SUMNlARY
The use of mass media to promote more active citizen involvement in reducing crime and drug abuse has emerged as a major component of criminal justice policy. However, evaluation of mass media campaigns to achieve this goal is difficult at best. This report is the result of a project funded and administered by the Bureau of Justice Assistance to evaluate the impact and cost-effectiveness of the National Citizens' Crime Prevention Media Campaign's (NCCPMC) activities in producing and disseminating public service announcements (PSA's).
The media campaign under study is a component of the National Citizens' Crime Prevention Campaign, which is also funded and administered by the Bureau of Justice Assistance. Better known as the "McGruff" or "Take a Bite Out of Crime" media campaign, it is designed to teach the public crime and drug preven-
. tion behaviors; to help build safer, more caring com-,!f-, munities; to motivate citizens to take positive actions
to protect themselves and their families and communities; and to create an environment less conducive to crime and drug abuse.
It has been produced since 1979 under the auspices of the Advertising Council, with the National Crime Prevention Council serving as its formal sponsor. The campaign uses PSA's, which rely on broadcast, print, outdoor, and related media organizations to donate advertising time and space to present them to the public.
The McGruff PSA's have achieved wider media acceptance and distribution than most, and have evolved through a number of pllases and thematic changes over the years. In 1991 an anti-violence series of PSA's were developed, which received special focus in this study.
The PSA's attempt to promote and reinforce the more extensive National Citizen's Crime Prevention Campaign, which includes other activities aimed at law enforcement agencies, community groups, and
businesses. These activities include speakers' bureaus, workshops, scllool programs, public demonstrations, and related prevention efforts.
Research Objectives
A primai)' goal of this study is to make useful, objective, and empirically based recommendations about future media information campaigns on crime and drug abuse prevention. Feedback from this evaluation to concerned parties seeks to improve the effectiveness and efficiency of such media programs.
This study addresses the following issues:
• Is the program an effective method for preventing and/or controlling crime and drug use among its targeted audiences?
• What are the advantages and disadvantages of the media component to those implementing the program?
• What has been learned from the media component activities that will improve the program in the future or that will aid in the development of other programs related to crime and drug use prevention?
• What are the costs of the program and the sources of support and benefits derived?
Specific research questions include:
iii How and to what extent has the media campaign been utilized in local jurisdictional crime prevention efforts?
• To what extent are audiences: (a) exposed to the media campaign; (b) attentive to it; and (c) responsive to it?
• To what extent does the media campaign influence the crime and drug prevention competencies of targeted audiences?
vii
.. • What basic themes and messages has the media campaign communicated in its content over the years? How can those be intE.lrpreted in light of the overall goals of the campaign?
• What are the costs of the media program, and how can its impact be addret,sed in terms of benefits and efficiencies for crime and drug abuse prevention?
Methods
The evaluation included conducting national probability sample surveys during spring 1991 of citizens, crime prevention practitioners, and media managers. Nearly 1,800 interviews across 100 communities were carried out. A content analysis was conducted of campaign messages and themes. A cost effectiveness study examined the benefits derived from campaigns.
Findings
Media managers and crime prevention practitioners were surveyed to determine reach and use of the campaign in representative communities across the country. Media managers interviewed "vere "gatekeepers" responsible for deciding on PSA placement at broadcast stations and newspapers. Their responses indicated that:
• Ninety-five percent of the media managers were aware of t~le McGruff PSA's, and more than one-half of them had run at least one within a year.
II Gatekeepers rated the PSA's high on quality and relevance.
il They regarded the PSA's as effective and influential within their communities.
• Managers not using them mentioned inappropriateness to their particular media formats or audience groups, and/or lacl< of regular delivery.
• The McGruff ads appeared to complement related media programs, such as Partnership for a Drug-Free America and Crime Stoppers.
Prevention practitioners interviewed were law enforcement officers with primary responsibility for crime prevention programs in their jurisdictions. Their responses indicated that:
viii
• Ninety-eight percent of prevention practitioners were familiar with the National Citizens' Crime Prevention Campaign overall; 76 percent had used its materials, and most users said they were of high value.
II Eighty-eight percent of practitioners were aware of the McGruff PSA's.
• Seventy-seven percent of those aware of the PSA's called them valuable in providing more public exposure and awareness of crime prevention issues.
JII!I Seventy-one percent of those aware called the PSA's helpful to local efforts.
• Eighty-five percent of those aware called the PSA's effective for children, and 60 percent said they were effective for adults in building prevention awareness.
II Those crime prevention programs most receptive to National Citizens' Crime Prevention Campaign materials tended to:
o Be in larger communities.
o Face more crime problems.
o Have larger, more diverse prevention programs.
o Be more supportive of citizen prevention overall.
A national sample of 1,500 adults was interviewed to determine their awareness and perceptions of the campaign and their responsiveness to it. This survey found that:
.. Eighty percent of U.S. adults recalled having seen or heard McGruff PSA's in general, and 49 percent recalled the 1991 anti-violence PSA's.
II Most were familiar with them from television, followed by print and radio.
.. People generally paid attention to the PSA's, with 86 percent of citizens reporting high attention to the anti-violence ads.
• Most people familiar with the PSA's could name something specific they liked about them; only 11 percent named something they disliked.
• Citizens more familiar with the National Citizens' Crime Prevention Campaign PSA's displayed the following characteristics:
Q Younger, with children in the home.
CI More attentive to media overall.
CI More interested in crime prevention.
a More needful of information about it.
o More aware of neighborhood crime problems.
a More prevention responsible and confident.
o More likely to take preventive actions.
• Black adults appeared slightly more familiar with the PSA's than did white, and individuals in middle income groups were slightly more familiar with the PSA's than those from other income groups.
With respect to citizens' perceptions of the campaign's impact:
11 Nearly one-third of those familiar with the PSA's said they had learned from them.
III About one-fifth said they took specific actions as a result of the PSA's.
• Fifty-four percent reported becoming more concerned about crime.
II Thirty-six percent said they felt more confident in protecting themselves.
II Forty-seven percent felt more personally responsible for prevention.
• Most citizens said PSA's were effective in increasing the following:
CI Their own crime prevention awareness (70 percent).
CI Their awareness of drug abuse prevention (90 percent).
a Children's awareness of crime prevention (90 percent).
a Children's awareness of drug abuse prevention (88 percent).
• Somewhat greater PSA impact was found among:
a Women.
a Less educated, lower income citizens.
a Black citizens.
a Parents with children in the home.
-These findings were compared with those of a similar 1981 citizen survey. Awareness of the McGruff campaign has increased over the decade by more than 50 percent, and evaluations of its overall appeal and perceived impact have generally remained constant.
In addition, comparisons of the 1981 versus 199~ studies indicate shifts in citizen responses to crime overall. Generally, the public was taking more p"evention actions in 1992 than in 1981, including one'.; in cooperation with neighbors. Fear of crime was down on some indicators. While these changes cannot be attributed necessarily to this particular campaign, they do suggest that the collection of crime and drug abuse policy measures introduced over the decade are contributing differences.
With respect to costs and benefits, tOB raderal investment in the McGruff campaign ~,Jpears to have yielded a substantial return ir volunteer commitments for advertising production and public dissemination. In effect, a $600,000 investment for fiscal year 1991 generated an estimated $60.3 million worth of donated media time and space nationwide. In 1991 McGruff was the fjfth-ranked advertising campairJn in dol/ars in the Nation, commercial product campaigns included.
Results of a cost-effectiveness analysis also suggest that the anti-violence and other McGruff PSA's were cost-effective in stimulating changes in citizen knowledge and crime prevention behaviors. Findings also indicate that program efficiency was achieved by comprehensive planning to minimize program costs while maximizing campaign coverage and impact within markets.
Conclusions
The overall conclusion, with some caveats, is that a substantial majority of the public, the media, and the law enforcement community has accepted McGruff, Take a Bite Out of Crime, and the message themes tied to the NCCPMC as positive symbols of crime prevention. These symbols have also become associated with drug abuse prevention, although to a lesser extent. The findings reveal no indications of decreases over the years in public attention or involvement with the campaign messages; on tho
ix

• •• contrary, the campaign appears to have continued to gain in popularity and impact over the past decade.
An analysis of McGruff messages over the years indicates that this increase in popularity is likely due to two intertwined factors. First, the recurrent uses of these symbols have been carefully controlled, leaving little room for uncertainty about who McGruff is each time he appears or about what hie advoc;ates. Second, with each new campaign phase, distin(;t, novel PSA's are incorporated into the familiar theme, maintaining audience interest. Message quali\ly, simplicity, and lack of threat also appear as important elements.
More generally, the findings indicate that such a media campaign can be a productive approach for influencing public understanding and behavior in the prevention and control of crime and drug abuse. It is likely that the PSA campaign combined with the extonsive National Citizens' Crime Prevention Campaign promotional efforts, primarily interpersonal and at the community level, mutually reinforce one another to maximize impact.
The findings support other research indicating public information campaign influence in such areas as health and environmental safety. Distinctive here, however, is the persistence of campaign effectiveness over more than a decade, its national scope and the relative consistency of impact over target groups.
A limitation of this campaign, and one quite common to public information campaigns overall, is a lack of specific, measurable goals by which to judge its impact on audiences over time. Evaluations such as this would benefit from having criteria previously set by campaign planners or sponsors regarding what they would consider "successful" levels of public attention and response.
Recomrnendations
Recommendations affect future goals, strategies, and implementation of media and related campaigns aimed at crime and drug abuse prevention:
A. Keep the main themes, with continuing innovation in specific concepts and approaches with respect to
x
creation, execution, and dissemination of the campaign.
B. Maintain the distinct and credible identities the campaign has nurt'ured with the public, and continue to ensure against pot~ntially detrimental uses of those identities.
C. Examine new strategies for reaching people yet unaffected by the media campaign.
D. Continue to strive to identify distinct audience segments and attempt to reach them. Such efforts are likely to increase both the efficiency and the impact of media materials.
D.1. Continue the kinds of focus group and copy testing research used to pretest campaign concepts and materials. When appropriate and possible, identify and segment audience groups for various message and channel combinations.
D.2. Continue the emphasis on television as the main dissemination mode, but aim even more for more specific audience segments with such supplemental media as radio, magazines, and outdoor advertising.
D.3. Monitor the acceptance of the campaign by racial and ethnic groups, particularly if messages emphasize or highlight minority characters or issues.
D.4. Consider the special informational needs of the growing elderly population, whether in the context of the NCCPMC or through other avenues.
E. Be cautious about using promotions that emphasize citizens' fear of crime or that attempt to generate action by increasing such fear.
F. Strive for greater specificity and concreteness in the messages to achieve an increased sense of efficacy and empowerment among citizens.
G. Experiment further with direct access avenues such as 800 numbers and related technologies.
H. Encourage greater collaboration among campaign planners and local media and law enforcement authorities to achieve increased efficiencies and effectiveness of crime and drug abuse promotion.
I. Set more concretely defined and measurable objectives for future campaign efforts.
H &3
INTRODUCTION
/
This study, funded and administered by the Bureau of Justice Assistance (BJA), was conducted to evaluate the impact and cost effectiveness of the National Citizens' Crime Prevention Media Campaign (NCCPMC) activities in producing and disseminating public service announcements (PSA's) focusing on "McGruff, the Crime Dog," and using the "Take a Bite Out of Crime" theme. NCCPMC is a component of the National Citizens' Crime Prevention Campaign, also funded and administered by BJA.
A primary goal of this study is to make useful, objective, and empirically based recommendations regarding the future conduct of campaigns on crime and drug abuse prevention. Evaluation techniques included national probabiiity sample surveys of citizens, prevention practitioners, and media gatekeepers; content analysis of campaign materials; and cost effectiveness analyses.
This report begins with a background section on media information campaigns in general with additional perspectives on crime and drug abuse prevention programs. Section 1 discusses problems involved in the evaluation of such programs and presents the strategy for examining the impact of the NCCPMC. Section 2 provides an overview of the NCCPMC, analyzes its content in terms of basic themes and messages presented over the years, and discusses the previous research that has been conducted on it.
Section 3 provides context for examining the effect of the campaign by presenting national survey data on public views, attitudes, and behaviors related to crime and its prevention. The recent findings are compared
to those of a similar study in 1981, showing change trends over the decade.
National survey analyses of citizen awareness of and response to the Take a Bite Out of Crime PSA's are provided in section 4. The effectiveness of the campaign is addressed in terms of the kinds of audiences it reaches, public reaction to it, and perceptions of its impact by various segments of the public.
Section 5 presents views of media gatekeepers on the NCCPMC. Local community media managers' uses and perceptions of the PSA's and their effectiveness are examined and related to various media and community characteristics. Section 6 provides a similar analysis from the perspective of local community crime prevention practitioners, including their uses of related National Citizens' Crime Prevention Campaign materials.
The costs and effectiveness of the media campaign are considered in section 7. Estimates are provided of both the overall effectiveness of the campaign and its relative efficiencies. Section 8 provides implications and recommendations following from the research. Finally, appendix A provides the data tables, numbered by section, for this document, and appendix B includes sources for further information.
An extensive technical report containing a complete description of the research methodology, a detailed content analysis of the campaign and procedures used, and the survey questionnaire item descriptions is available upon request from the BJA Clearinghouse (see appendix B).
1
SECTION 1: PROJECT BACKGROUND
AND OBJECTIVES
The use of mass media to promote more active citiG
zen involvement in reducing crime and illicit drug use has emerged as a major component of criminal justice policy (see, for example: Lab, 1988; Heinzelmann, 1987; O'Keefe, 19'30; Rosenbaum, 1988; Surette, 1992). Countless State and communitywide publicity campaigns have been inaugurated, as have coordinated national efforts such as the National Citizens' Crime Prevention Campaign, Crime Stoppers, and the Drug Abuse Resistance Education (DARE) program. This trend has followed the implementation of a wide range of public information campaigns and other promotional efforts in recent years dealing with various social welfare and health-related topics (Rice and Atkin, 1989; Salmon, 1989).
The purpose of this project is to evaluate the impact and cost-effectiveness of NCCPMC activities in producing and disseminating print, radio, and television PSA's. A primary goal of this study is to make useful, objective, and empirically based recommendations regarding the conduct of future media information campaigns on crime and drug abuse prevention. Feedback from this evaluation to concerned parties seeks to improve the effectiveness and efficiency of such media programs.
The NGCPMC is designed to teach the public crime and dnlg prevention behaviors; help build safer, more caring (~ommunities; motivate citizens to take positive actions to protect themselves and their families and communities; and create an environment less conducive to crime and drug abuse.
This intrclductory section contains overviews of public informaUon campaigns and crime and drug abuse preventicln programs and the more specific objectives and methods of this study.
Public Information Campaigns
Information campaigns in general: (1) intend '''to generate specific outcomes or effects (2) in a relatively large number of individuals, (3) usually within a specified period of time and (4) through an organized set of communication activities" (Hogers and Storey, 1987, p. 821). Although public information campaigns share common interests in informing and influencing the citizenry, they often go about the job in widely varying ways, depending upon the type of problem or issue being addressed and thfa specific campaign objectives (Paisley, 1ge9). Other factors affecting campaign strategies include thr:, characteristics of the target audiences and the time, and money available for the effort (O'Keefe and Re!d, 1990). Most such projects attempt to combine public: information or media publicity campaigns with community participation and training activities (Flora et aI., 1989). Media tend to be more effective at building citizen awareness of an issue, and more direct forms of citizen contact and intervention are more apt to generate complex attitudinal or behavioral changes (Rogers and Storey, 1987).
The development of successful informational and promotional programs in crime prevention and other issue areas remains part art, part science. Even the more well-wrought efforts depend upon diverse and often scattershot approaches for reaching their audiences (Grunig, 1989; Salmon, 1989). Equally important, it is typically difficult to evaluate whether the programs have achieved their goals. The criteria for success or failure of these campaigns are often vague. Although more formal evaluations are increasing, they tend to be of low order scientific validity. Tight experimental controls are seldom used, largely because of the cost and complexity of implementing them in "naturalistic" field situations. Even when statistically Significant findings are obtained under reasonably controlled conditions, questions often
3
arise concerning how generalizable the results are to larger populations, and whether the program was cost and/or effort efficient.
Crime prevention campaigmi pose special problems in their own right. Much of the activity referred to as crime and illicit drug use prcNention fit under the umbrella of what Weinstein (1987) calls self-protective behavior. This construct also encompasses anticipatory reactions to many health risks as well as natural and occupational hazards. In identifying the key predictor variables in precautioniary behaviors, Weinstein includes beliefs about the pmbability and severity of the harm, the efficacy of a pmcautionary action, and the cost of taking action. Persuading people to increase such actions can be difficult, in part because of complex interactions amon!g the above factors, especially in crime-related situations (Lavrakas et aI., 1980).
Also, as Rogers and Storey (1987) note, programs advocating the adoption of behaviors to help prevent a possible unpleasant experience in the future tend to be less successful than those offering more timely and obvious rewards. A useful distinction may also be made between the kinds of measures persons are willing to take on a one-time initiative basis, and behaviors that need to be sustained, perhaps over a lifetime. As in the case of health protection actions, the motives for each type may be somewhat different.
Adding to the problem is that the salience of crime and drug abuse and the perceived efficacy of preventive behaviors vary considerably across social class, geographic locale, and other demographic boundaries (Rosenbaum, 1988; Lavrakas and Bennett, 1988; Greenberg, 1987; O'Keefe and Reid-Nash, 1987a). (Such variations can be found with health issues, traffic safety and other societal concerns, but for crime the differentiations are typically more visible to the average citizen and are readily documented in crime rate figures.) This heterogeneity across citizen groups calls for better care and effort in targeting messages to specific subgroups for greater effect.
Public Service Advertising
Public service advertising has become a significant vehicle through which large portions of campaign content are communicated to the public. In brief,
4
PSA's are promotional materials that address problems assumed to be of general concern to most citizens. PSA's typically attempt to increase public awareness of such problems and their possible solutions. In many instances, they also try to influence public beliefs, attitudes, and behaviors concerning those problems (sometimes with unrealistic expectations). Most PSA's emanate from not-for-profit or governmental organizations and receive gratis placement in broadcast and print media.
PSA Content
PSA's reflect the individual concerns of their sponsors. The last significant content analyses of televised PSA's dUlring the 1970's indicated that nearly one-half of 1them dealt with health or persol1al safety topics, including alcohol and drug abuse, preventive health cam, traffic safety, nutrition, and the like (Hanneman et aI., 1973; Paletz et aI., 1977). Other topics included environmental concerns, community services, educational and occupational opportunities, consumer issues, volunteer recruitment, and general humanitarian concerns. The vast majority of the ads offered informative and in some cases persuasive messages, with a smaller number being fundraising appeals. Governmental agencies were responsible for about one-fourth of all PSA's.
A more recent study of television public service directors indicates that their main crlOices of PSA content am as included alcohol and drug abuse, drunk driving, missing children, child abuse, and such health concerns as cancer and diabetes (Needham Porter Novelli, 1985). This finding in part possibly reflects a national campaign under way for the past 2 years by the National Association of Broadcasters (NAB) aimed at public education on substance abuse, particularly as related to driving habits. NAB studies have indicated that nearly 100 percent of television and radio stations carried alcohol-related PSA's during 1984-85 (NAB 1984, 1985).
PSA Placement
Media organizations donate the space and time for PSA presentations. Those PSA's warranting free media placement are ordinarily relegated to status behind regular paid ads or commercials and often are apt to appear only as space or time becomes available. Televised PSA's, for example, have traditionally run during lesser watched dayparts
(although in dOing so some may well reach their appropriate target audiences, e.g., children or teenagers). Hanneman et al. found that in the early 1~70's nearly two-thirds of all televised PSA's ran between 7:00 a.m. and 6:00 p.m. on weekdays.
However, there are recent indications of a more favorable time distribution being allocated to at least certain kinds of PSA's. During 1985, for example, the American Broadcasting Company carried more than 1,000 PSA's related to alcohol and drug abuse, with 47 percent of those being shown during prime time (32 percent were shown during daytime, and 21 percent late at night) (ABC, 1986).
Competition among PSA sponsors for media placement is heavy, and many of the ads fail to be effectively distributed to consumers. Although precise data are unavailable, competition among PSA producers for placement appears to have increased substantially over the years also, broadcast advertising has become more "cluttered" with increased emphasis on more frequent spots of shorter duration.
The dissemination of any particular PSA is at the discretion of the network, station, or publication management. In addition, content and stylistic and production factors can influence decisions on whether to present it, and if so, when and where (McGowan, 1980).
Most of the television public affairs directors surveyed by Needham Porter Novelli (1985) indicated that the local impact or relevance of the spot was a major factor (perhaps the most important factor), followed respectively by subject matter and technical quality. Provid!:"~ a local identification tag with the PSA was deemed a strong asset. Contact by a local organization promoting the PSA was likewise seen as a plus. Also the one or two inch videotape format had a greater effect than 16 mm film. Most PSA's have about a 3- to 6-month life span, and "freshness" or novelty is often a factor in media acceptance.
Comparable data on PSA placement on radio and in newspapers and magazines are unavailable. Information on outdoor advertising is unavailable as well. One suspects that such attributes as subject matter, quality, and local relevance remain critical to PSA use by these media. However, message formats and audience targeting factors obviously differ from medium to medium. More research on such variations would be useful.
PSA Effectiveness
O'Keefe and Reid (1990) found that the public is fairly attentive to PSA's, especially over television, and people have generally favorable reactions to them. However, evaluation of the impact of specific media campaigns is difficult because PSA's often form only one component of larger media or community campaigns.
Evaluations carried out during the 1940's and 1950's suggested that public information campaigns-as well as mass media in general-had minimal effects on public beliefs, attitudes, and especially behaviors (Klapper, 1960). By the early 1970's, however, some evidence began to indicate otherwise. More importantly, increaSingly sophisticated research methods allowed closer examination of the situations and conditions under which successful campaigns would be more likely to occur (Douglas, Westley, and Chaffee, 1970; Flay, 1986).
Some recent campaign successes involving PSA's have been found in the areas of mental health (Douglas, Westley, and Chaffee, 1970; Schanie and Sundel, 1978), pesticide use (Salcedo et ai, 1974), smoking cessation (Warner, 1977), heart disease risk prevention (Flora et aI., 1988), colon cancer testing (ARC, 1991), and crime prevention (O'Keefe, 1985, r9S6). There are also indications that children can learn information from certain types of PSA's (Roberts et aI., 1979).
O'Keefe and Reid (1990) conclude that campaigns in general appear more likely to succeed if they incorporate theoretical models of communication or persuasion into their development. The more effective campaigns made extensive use of commercial advertising planning principles in their design and execution. Formative research, audience segmentation, and pretesting appear as key ingredients. Clearly delineated campaign goals and measurement objectives are also highly important.
O'Keefe and Reid also imply that the effectiveness of PSA's is also highly dependent upon the extent of their dissemination by broadcast and print media, and such activity has shown a recent increase in some topic areas. The technical quality of PSA's is a clear factor in their success, as is their local community appeal. PSA's also are generally more effective when tied to more extensive campaigns, and/or when they
5
, ride on a wave of ongoing public opinion or concern. Furthermore, PSA's are likely to be more effective when they provide information about topicS most people already generally agree upon also, they are more effective if their design considers not only existing awareness, attitudes, and behaviors of the target audience with respect to the topic but audience communication preferences and behaviors as well (O'Keefe, 1986).
The extent to which most PSA-oriented campaigns meet the above criteria-and thus their effectiveness-is quite open to question. As was noted earlier for public information campaigns in general, the time, expense, and effort involved in carrying out valid evaluations of these campaigns is typically prohibitive for most PSA efforts.
Crime Prevention and Drug Abuse: Programs and Evaluations
The field of crime prevention practice has grown over the past two decades. As a result, the NCCPMC is better understood when placed in the context of this evolving field and the empirical results of earlier program evaluations. The media campaign has in turn helped create some of these changes and has responded to them. Therefore, it is an integra! part of this national picture. Prevention programs at the neighborhood level can best be outlined as falling into the categories of opportunity reduction, social prevention, and community policing.
opportunity Reduction Programs
In the late 1960's and early 1970's crime prevention was to a large extent a public relations vehicle for police administrators to improve the public's image of the police. However, in addition to promoting and defending the police department at community meetings, crime prevention officers also encouraged the public to engage in individual crime prevention measures (e.g., "avoid dangerous places," "don't carry too much cash," "report crimes to the police," etc.). Later these messages were combined with a massive push for household protection measures (e.g., "have our crime prevention officer conduct a home security check and join Operation Identification to mark your property").
6
Soon, law enforcement was ready to promote collective (group) crime prevention measures such as Neighborhood Watch because o'f its promise to help "build community," stimulate social interaction, and overcome the "fortress mentality" that characterized earlier private-minded responses to crime. From the mid-1970's to the mid-1980's, Neighborhood Watch was promoted so effectively that it was exported to Canada, Britain, and other countries. Police administrators were quite comfortable with citizens who served as the "eyes and ears" of law enforcement, but took a much more cautious attitude about citizen patrols. Police executives expressed concern about the growth of citizen patrols and their potential for vigilantism (although unfounded at the time). Today, citizen patrols are an integral part of urban life in hundreds of communities and are endorsed by many police managers who realize that neither public safety nor their own jobs are in jeopardy. f'lcceeding chapters show how the themes develope~ 1 tile early years of the NCCPMC emphasized in turn individual, household, and collective prevention strategies.
Social Prevention
Some scholars argue that crime prevention is entering a new phase and the limits of opportunity reduction strategies have been reached. Based on the argument that crime is caused by the social ills of society (e.g., poverty and its many consequences, illicit drug use, and the decline of traditional agents of socialization), the emerging "social problems" or "social prevention" approach seeks to attack the root causes of crime or at least the immediate consequences of disadvantage. Community organization of sentice delivery and related issues are often involved in such programs (cf. Brantingham, 1990; Lavrakas a.nd Bennett, 1988; Currie, 1988; Rosenbaum, 1988; Waller, 1990).
One focus of this new orientation (influenced heavily by crime prevention practices in Europe and Canada) is on disadvantaged or high-ris~~ youth. Programs often seek to engage them in positive activities (to keep them off the streets) and/or provide them with specific skills and opportunities to enhance their competence, self-respect, and likelihood of self-sufficiency. The approach is conceptually appealing and has attracted growing public support. It serves as a. useful complement to traditional approaches that t1and to focus on potential victims rather than potential offenders. Sensitive to this trend, the National Citizens' Crime Prevention Campaign has placed increasing emphasis on the
importance of primary prevention and youth-oriented programs, especially since the mid-1980's.
Community Partnerships
Since the late 1980's, more emphasis has been placed upon partnerships among citizens, police, and other agencies and groups in the public and private sectors. Such alliances have been initiated in some cases by police, while some were started by civic agencies or community groups. Opportunity reduction and social control prevention components may be included in these efforts. As will be noted below, partnerships dealing specifically with anti-drug efforts have developed as well.
In many cases, such partnerships have been reinforced by a major shift in American policing. Community policing (also known as neighborhood-oriented policing and problem-oriented policing) is emerging from a growing recognition that the police are extremely dependent on local residents to achieve their goals of reducing crime and fear of crime in neighborhoods.
Community policing is more a philosophy of policing than a specific program or set of programs. Some of the key elements of this philosophy include: "(1) a broader definition of what constitutes legitimate police work, (2) emphasis on increasing the quantity and quality of interactions between the police and the citizenry, (3) greater attention to creative problemsolving and crime prevention strategies, and (4) efforts to restructure police bureaucracies to provide more decentralized planning and service delivery" (Rosenbaum et at, in press). Thus, although crime prevention officers sometimes have been viewed as being on the perJphery of "real" police work, this new movement essentially brings the basic tenets of crime prevention practice into the mainstream of policing. In the long run, the police-citizen partnership should be strengthened and formalized as a result of community pOlicing reforms.
Crime Prevention Effectiveness
The evidence regarding the effectiveness of crime prevention is difficult to summarize because of the diversity of responses and programs, as well as inconclusiveness of prior evaluations (see Rosenbaum, 1988, for a comprehensive review of the literature). At the risk of oversimplification, a few general
conclusions are offered: research indicates that persons who avoid high-risk areas and high-risk persons are less likely to be victimized than persons who do not take such precautions. Furthermore, engaging in household target-hardening behaviors is associated with a lower risk of residential burglary. Whether these observed relationships are causal is often unclear, but the evidence is consistent with past crime prevention pOlicies.
For those who prefer a more optimistic assessment, the evaluation research literature is vulnerable to criticiSm. Even the strongest evaluations cover limited time periods and measure success by a limited set of outcome measures. Furthermore, if one were to focus on the "bigger picture" and examine trends in the 1980's during the time when opportunity reduction programs were in their heyday, a more optimistic (but less scientific) assessment would be possible. Neighborhood Watch and other opporiunity reduction programs would be expected to have ti'9 largest effects on household crimes simply because af the nature of these programs. The National Crime Vic.timization Survey shows that victimization rates for household crimes have dropped dramatically over the past decade. Residential burglary has shown the sharpest declines between 1981 and 1985 when the National Citizens' Crime Prevention Campaign and local organizations were aggressively promoting watCh-type strategies (see BJA, 1990).
In terms of collective actions, the results of numerous studies are summarized by Rosenbaum (1988, p. 375): " ... nearly one hundred reports indicate that Neighborhood Watch reduces crime, but a closer look uncovers a curious inverse relationship: the stronger the research deSign, the weaker the program effects observed." Indeed, the four strongest evaluations show limited or no effects on crime reduction, community building, and fear of crime, with one showing increases in fear as a result of Neighborhood Watch.
While progress is being made against property crime, recent trends in the rates of violent crime are not encouraging. The dominant crime prevention strategies of the 1980's (Le., opportunity reduction or situational crime prevention) focused on residential burglary as much as on personal safety, with perhaps limited effectiveness in reducing violent crime. Social crime prevention, in contrast, by addressing the root causes of delinquency and drug abuse, and by focusing on high-risk youth and high-risk neighborhoods, has the
7
potential to achieve greater impact on the problem of violence. However, to date, there have been few controlled evaluations that estimate the effects of these social prevention programs (see Lavrakas and Bennett, 1988). In addition, sizeable demonstrations have yet to be funded.
The effectiveness of community policing initiatives remains uncertain because of the limited nurnber of evaluations. One large-scale study in Houston and Newark (Pate EJt aI., 1986) reported a number of positive effects on citizens' fears and perceptions, but the ability of police departments to reorganize their bureaucracies to meet the demands of this new philosophy has never been fully tested. Less formal evaluations of problem-oriented pOlicing initiatives have documented police effectiveness in removing specific problems (e.g., Eck and Spelman, 1987). However, often there is uncertainty about whether the problems have been permanently corrected (or simply displaced), and how these changes have affected the community (for reviews of evaluations in the community policing field, see Eck and Spelman, 1987; Green and Mastrofski, 1988; Rosenbaum, 1986,1988; Rosenbaum et aI., in press; Skogan, 1990).
Anti-Drug Strategies
Over the past few years, concerned residents and voluntary organizations in most urban areas have been forced to stop work on many community agenda items and devote most of their resources to combatting the drug problem. Crime prevention has become closely related to drug abuse prevention. Americans view drugs as the most serious problem facing innercity neighborhoods. The public's growing concern about drug abuse and drug marketing has resulted in the latest manifestation of community crime prevention programming, namely, coalition building. The partnership between local residents and the police served as the backbone of community crime prevention through the 1980's. However, the drug problem has forced community leaders to recognize that the partnership would not be sufficient to tackle this complex, multifaceted problem in the 1990's.
Hence, multiagency, multigroup partnerships and coalitions have emerged in the 1990's to address this problem. The BJA-funded Community Response to Drug Abuse (CRDA) National Demonstration Program epitomizes this new orientation. At the hub of the CRDA model was a multi-agency task force for plan-
8
ning anti-drug strategies, which often included local police, social service agencies, schools, churches, businesses, community residents, and the organizing community group.
To date, there has been little research on the nature, extent, and effectiveness of citizen participation in anti-drug activities. The current national evaluation of the CRDA program provides a first glimpse at community participation (Rosenbaum et aI., 1991). Community groups have employed a wide range of anti-drug strategies to empower residents and reduce local drug-related problems such efforts include the following: strengthen partnerships between themselves and other institutions/agencies, identify drug "hot spots," close drug houses, organize rallies and marches, create drug-free school zones, organize citizen patrols and surveillance activities, offer youth programs, improve housing, and improve other aspects of the physical environment.
Levels of citizen awareness and participation in these programs are slightly higher than might be expected on the basis of previous research. Community surveys in six cities indicate that 39 percent of local residents are aware of at least one community group in their neighborhood that is concerned about drugs. In addition, 29 percent have, themselves, participated in some type of anti-drug activity (Rosenbaum et aI., 1991). The two most common types of participation are community meetings and rallies (17 percent) and patrols and watches (12 percent). At the national level, the gaps in current knowledge are wide. The levels and types of citizen participation in anti-drug activities, as well as the motivating factors, remain unknown.
Conclusions from Research on Crime and Drug Abuse Prevention
Some general conclusions and observations can be drawn from previous research on community crime and drug abuse prevention. These conclusions are included to provide greater context for study of the NCCPMC. Some of the following observations identify issues that require further study:
• Levels of citizen participation in crime/drug prevention activity are generally low. New strategies for enhancing participation must be explored. Such strategies may develop out of closer consideration of ways of stimulating other forms of self-protective behavior, such as health practices.
• Participation is generally the lowest in neighborhoods that need crime and drug prevention the most. Low-income, high-crime, heterogeneous communities are the least likely to become involved (although the drug war has modified this conclusion slightly). Although participants seem to benefit from their involvement in crime prevention programs, there is little benefit for nonparticipants-a much larger group.
• High levels of fear generally lead to restrictions of behavior and nonparticipation in collective action, and low levels of fear provide no impetus for community action. Participation levels are the highest in areas characterized by moderate levels of concern and sufficient resources (and feelings of efficacy) to take action. Participation in community action is therefore determined more by civic duty and social needs than by fear arousal.
• Creating new anti-crime organizations to specifically address crime or drugs is problematic because such groups are difficult to sustain over time. Declining rates of citizen participation are commonplace. Established, multi-issue community organizations are the best vehicles for maintaining community involvement once the initial crisis has subsided or a particular problem has been solved.
• In response to the crime problem, community organizations in high-problem areas often prefer a broad range of approaches that are tailored to local needs. Hence, the social crime prevention approach (which attacks root causes) is commonly promoted in conjunction with (or in place of) traditional prepackaged programs such as Operation ID or Neighbor-hood Watch. .
• Heavy drug trafficking in inner city neighborhoods has scared and angered many local residents, causing them to call for aggressive actions, including citizen rallies and patrols, and widespread police crackdowns. Although drug dealers in many areas have been incapacitated or displaced, these enforcement efforts have also led to renewed citizen complaints about police (and citizen) misconduct and about violations of civil liberties.
• Strong police-community partnerships are essential for community crime/drug prevention programs to flourish. When pOlice-community relations are strained, as they often are in high-problem neighborhoods, the possibilities for joint program planning and implementation are restricted.
• Comprehensive programs that involve diverse strategies and multiple resources are more likely to affect the problem than narrowly defined programs.
• Community crime prevention programs have been unable to demonstrate that they can "build community" by stimulating more social interaction, enhancing feelings of empowerment, and strengthening informal social controls in target neighborhoods. Part of the problem is the absence of good theories to describe the processes by which communities become selfregulating and the absence of good research to document communitywide effects.
• Current knowledge of (and theories about) community crime prevention has developed largely from a handful of local community-based surveys in U.S. cities. With the exception of a short questionnaire that supplemented the National Crime Victimization Survey for 1 month in 1984, this country has been without detailed national crime prevention data since the original evaluation of the NCCPMC in 1981.
Project Justification
This study assesses the effect and cost-effectiveness of the National Citizens' Crime Prevention Campaign's activities in producing and disseminating print, radio, and television PSA's. This evaluation supports BJA efforts to conduct the type of comprehensive program evaluations mandated by the Anti-Drug Abuse Act of 1988. This study aims to make useful, objective, and empirically based recommendations for future media information campaigns on crime and drug abuse prevention. Feedback from this evaluation to those involved in the campaign will seek to improve the effectiveness of the media program.
Project Goals and ObjectivE'S
. The purpose of this study is to determine whether the media component of the National Citizens' Crime Prevention Campaign is effective in teaching the public crime and drug prevention behaviors; helping build safer, more caring communities; motivating citizens to take positive actions to protect themselves and their families and communities; and creating an environment less conducive to crime and drug abuse.
9
E
The study addresses the following issues:
• Is the program an effective method for preventing and/or controlling crime and drug use among its targeted audiences?
• What are the advantages and disadvantages of the media component to those implementing the program?
• What has been learned from the media component activities that will improve the program in the future or that would aid in the development of other programs related to crime and drug use prevention?
• What are the costs of the program and the sources of support and benefits derived?
Specific research questions include the following:
• How and to what extent has the media campaign been utilized in local jurisdictional crime prevention efforts?
• To what exlent are audiences: (a) exposed to the media campaign, (b) attentive to it, and (c) responsive to it?
• To what ext~nt does the media campaign influence the crime and drug prevention competencies of targeted audiences?
• What basic themes and messages has the media campaign communicated in its content over the years? How can those be interpreted in light of the overall goals of the campaign?
Ii What are the costs of the media program, and how can its impact be addressed in terms of benefits and efficiencies for crime and drug abuse prevention?
Overview of Methodology 1~~:~1:~~~:1:'~1~~:m:l~~:1~~~~:~1:1:1:m:m§:t:~:fu~~~:1:1~~:~~~*l:l~'t~~\~~:~m:;~~~*l~:l~:~fu~~~$m:~~~~~~~~~\~~:~~~~r:f*i:l~~§:~:~~l:l:~i~*=~;:fu~:
The overall evaluation strategy used in this study involved conducting national sample surveys of crime prevention practitioners, media gatekeepers, and citizens. Measures and analyses addressed the first three questions above. An extensive content analysis assessed campaign messages and themes. A cost effectiveness analysis examined the benefits derived from the campaign. Recommendations concern the future goals, strategies, and implementation of media and related campaigns aimed at crime and drug abuse prevention.
10
The design specifically entailed gathering data on campaign influence from a national probability sample of 1,500 adults, as well as appropriate numbers of law enforcement crime prevention practitioners and media managers and gatekeepers. Although nationwide in scope, the research design also allows for the study of a wide range of community-level factors that potentially accelerate or impede the campaign's effectiveness.
This study was accomplished in part using a variation on national multistage area sampling in which the selection process was based upon sampling law enforcement jurisdictions (as opposed to such traditionally used political divisions as cities or counties). First more than 100 such jurisdictions were sampled across the United States, providing adequate variation on geographic, demographic, crime~related and law enforcement structural characteristics.
Within each jurisdiction, interviewers surveyed the leading crime prevention practitioner and prominent media managers (or gatekeepers) responsible for PSA dissemination. They also conducted telephone interviews with an average of 15 adults age 18 or over in each jurisdiction, foilowing standard multi-stage area sampling criteria for a nationwide sample of 1,500 adults. This process allowed the national sample to be partitioned by ordinal (e.g., high, medium, low) McGruff PSA exposure usage patterns as determined within the jurisdictions, which serve as the unit of analysis. This design allowed researchers to control for variation in crime rates, type of law enforcement structure, demographics, and other relevant community-level variables. Interviewing was conducted during spring 1991.
in addition, examination of the content of previous and current media campaign materials was used to develop systematic analyses of campaign themes and messages. Apart from documenting the precise nature of the stimulus being examined here, such an analysis provides important insights into the kinds of informational and persuasive message elements that might help explain aspects of campaign effect or lack thereof.
Finally, study of campaign documents for costs and related expenses was conducted along with investigation of variables that may serve as estimates of campaign benefits and cost effectiveness.
Limitations
The findings presented in this report are based upon standard socia,l research techniques and are subject to the same limitations of ali such data. The findings derive from respondents' self-reports of their own cognitions, attitudes, and behaviors and may be subject to typical respondent perceptual biases in any social research effort. Nevertheless, such survey seHreporting techniques have more than adequately demonstrated their value and validity as evaluative research tools over the decades. Moreover, the researchers believe a particularly high degree of rigor has been applied in data collection in this study.
It is also important to emphasize that the study design in this case involved a "one-time" survey of the respondent groups. Therefore the study could not trace changes over time in, for instance, citizen exposure patterns to the campaign and subsequent attitude or behavior changes. Limiting the ability to make inferences about causality. For example, if the study reveals interest in crime prevention related to campaign exposure, researchers still don't know with confidence whether the campaign promoted that interest or interest led to more attention to the campaign or whether interest and campaign exposure mutually reinforce one another.
,
11
ilL m = SECTION 2: THE NATIONAL CITIZENS'
CRIME PREVENTION MEDIA CAMPAIGN
The Bureau of Justice Assistance has supported the NCCPMC since BJA's inception in 1984. In addition, 22 States are using Formula Funds (provided undar Title I of the Omnibus Crime Control and Safe Streets Act of 1968, as amended) to fund local citizens' crime prevention campaigns.
Campaign Goals
American families are affected daily by crime and illicit drugs. Consequently, various types of prevention programs and initiatives are being conducted by Federal, State, and local governments; national and community organizations; businesses; churches; civic organizations; schools; and individual citizens. The media advertising campaign is one component of the overall National Citizens' Crime Prevention Campaign.
The media campaign's objectives mirror those of the National Citizens' Crime Prevention Campaign overall, and include forging a nationwide commitment to crime and drug prevention by the citizenry. These objectives can be achieved by encouraging people to act individually and together to prevent crime and drug abuse and to build safer, more caring communities. Although one major goal of the advertising is to create public awareness, the more ambitious goal of the overall campaign is to motivate citizens to take positive actions to protect themselves, rebuild social bonds, and assert a shared community pride, resulting in an attitude that crime and drugs will not be tolerated.
In order to achieve these goals, the campaign is working to:
• Change unwarranted feelings and attitudes about crime, drug use, and the criminal justice system.
• Generate an individual and community sense of responsibility for crime and drug prevention.
• Initiate individual and community action toward preventing crime and illicit drug use.
III Mobilize additional resources for crime and drug prevention efforts.
• Enhance existing crime and drug prevention programs and projects conducted by national, State, and local agencies and organizations.
• Develop organizational capacities to implement crime and drug prevention programs.
The National Citizens' Crime Prevention Campaign particularly promotes two aspects of crime and drug abuse prevention. it teaches people to ''watch out" to protect themselves and their property and to "help out" with mutual assistance and increased community involvement. Thus it includes both a self-protective and a more community-spirited altruistic dimension. The campaign is national in scope but local in application. Its leadership and success is directly related to how responsive it is to local crime problems, to the timeliness of the public service advertising, and to the quality of the informational material.
Campaign Background
The media campaign tS produced under the auspices of the Advertising Council, with the National Crime Prevention Council a~ its formal sponsor. The Advertising Council typically has about 30 national campaigns going at anyone time, and competition for its assistance is highly competitive. Once the Advertising Council agrees to work with a sponsor, it selects a campaign director with national marketing expertise and a volunteer agency to produce the campaign. All of these production services are without charge to the sponsor, except for out-of-pocket expenses for production materials and distribution and for monitoring and research. The Advertising Council also seeks donations of advertising space and time from national and local media organizations. In doing so, the
13
Council must compete with an increasing host of other PSA producers at the national, regional, and local market levels. The volunteer agency that initiated the Take a Bite Out of Crime campaign in 1979 was Dancer Fitzgerald Sample, now Saatchi and Saatchi, which continues in that r~le.
The NCCPMC, one of the Advertising Council's longest running, has been deemed highly successful in terms of media dissemination. It features McGruff, the Crime 009, and his ''Take a Bite Out of Crime" slogan. Before 1991, it had become the fourth most disseminated Advertising Council PSA effort in dollar value of media placement. In 1991, the cost would have exceeded $60 million if the campaign had been billed for the media play received. This made it the fifth most widespread campaign-including commercial projects-in dollar volume that year.
The trenchcoated McGruff character has probably become as familiar as Smokey the Bear to most children and adults alike. McGruff has functioned as a teacher who didn't solve crime but taught people how to help themselves. Most often, he was perceived to be trustworthy, and not intimidating. His aim was to create loyalty and believability, especially among children. Although adults have been the primalY audience of the PSA's, for certain phases more specific audiences (including children) have been targeted.
Equally important are a wide range of supplemental campaign activities promoted at local levels across the country by law enforcement agencies, community groups, and businesses. These activities include speakers' bureaus, workshops, school programs, and non-media strategies to involve the public.
Most durable advertising campaigns go through successions of incarnations using fresh individual messages and contexts. McGruff is no exception, with the campaign having evolved through more than a dozen phases, including home security, neighborhood watch, child abduction, drug abuse, community action, and, in 1992, violence prevention. A critical ingredient in the campaign's longeVity has been the tie-ins with community crime prevention-related organizations. Local practitioners have been able to capitalize on the familiarity of McGruff and to use the more general campaign themes as umbrellas for their own more interpersonally based efforts.
The objective of the 1990-92 National Citizens' Crime Prevention Campaign was "to convince people that
14
they must work together in community efforts to help defeat crime." Primary target audiences included both adults 18 and older and community law enforcement officials. Subgroups of particular interest included the following: (1) adults most likely to be crime vic:,ms, (2) adults who are involved in commur.ity activities, and (3) adults with children under i8.
Phase XV of the campaign, which commenced in October 1991 and is a focal point for this study, was aimed at caretakers of youth (e.g., parents, grandparents, teachers, significant others, and advocates) who had not yet taken an active role in crime prevention. It attempted to motivate them to make community crime prevention activities an integral part of their everyday liv!'" -::, Emphasis was on using PSA's to inform such in. 'duals that the situation will only worsen if they -:it ,,'t take action and that they can have an impact. :he PSA's for the first time publicized an "800" telephone number for people to request information they could act upon, rather than providing such information in the message. The overall approach was also more dramatic and emotive than previous PSA's, aiming to promote greater sense of urgency.
By October 1992, approximately 55,000 phone calls had been received. A survey of callers found that out of nearly 600 individuals who f;:iturned their questionnaire, the requested materials had been rated highly positive as informative and helpful.
Content of the PSA Messages
The PSA's disseminated since 1980 have focused sequentially on five major themes: (1) home security/ neighborhood watch, (2) crime prevention for a safer community, (3) child/teen protection and involvement, (4) children's drug abuse prevention, and (5) violence prevention. Each theme area includes a grouping of PSA's across media with specific audience targets. Extensive qualitative content analyses of the main television and print PSA's representing each theme were conducted for this study to more closely identify the messages to which the public has been asked to respond.
The overall analysis suggests that, in examining all 15 phases of the campaign, the PSA's can be grouped into two categories: situational and experiential. The former are based upon real-life situations that provide information to increase awareness and reinforcement

& £
of crime prevention behaviors. In these situational PSA's, crime-related problems are clearly defined, and easily followed solutions are provided. Examples of situational PSA's include many of the early home security/neighborhood watch ones ("Mimi Marth," "Gilstraps," "John Petross") as well as the 1990 "10th Anniversary" PSA's. "Real Situations" (1989) uses real-life situations and settings, such as a school, to inform children about how to say "no" to drugs.
In contrast, more experiential PSA's rely on emotive elements to increase awareness of potentia! crime situations. Solutions and information about crime prevention in more emotional settings or dilemmas may or may not be presented; rather, the audience member vicariously experiences the PSA because of emotive design elements. The recent Phase XV violence prevention PSA's, including "Blanket" and "Teddy Bear," are primary examples.
Several of the PSA's aimed specific3::Y at chi'Jdren were the first to move toward the experienti(",1. The "Users Are Losers" (1987) televised PSA presents not a drug-related problem with steps for resolving a specific situation, but children re,.anacting the folklore of the Pied Piper as they follow the sound of the music into an open field. The appeal of the "Regina" (1988) PSA is highly experiential as children are enticed to follow the tempo of the music. As these examples and the Phase XV PSA's indicate, the more visually sophisticated a PSA, the less likely it is to provide high levels of information.
A comparison of these two categories of PSA's shows that in the situational PSA, viewer identification can come about more through a sense of ownership and membership in a community. in the situational PSA, viewers are taught how to protect themselves, their families, and their neighborhoods from crime, with goals of a sense of belonging and a cooperative spirit. Often the theme is assertive. It calls for the viewer to "fight back," but never in direct confrontation with the perpetrators of crime. PSA's, such as the "John Petross" (1982-83) and "Mimi Marth" (1981) called for action, not violent aggression. These included setting up Neighborhood Watch programs and being the "eyes" of the community.
In the experiential PSA's, identification can come about more for the citizen as an isolated individual who vicariously experienced the PSA scenarios. Although community cooperation was stressed in earlier phases of the campaign, the advent of the
Phase XV "Blanket" (1991) PSA called for a mOr(:.;' individualized response to crime, most immediat61y in the form of requesting the more detailed information promoted.
The analysis also points to specific aspects of the campaign aimed at raising awareness, reinforcing existing behaviors, and developing motivation among citizens. These include reliance on two important elements: (1) emphasis on the individual and his or her community and (2) audience identification with McGruff. The PSA's throughout all fifteen phases of the campaign consistently have emphasized the importance of the individual by giving many of the messages personal tones, such as "You can help prevent crime." "Your door," "your house," dyourchild," and "your" community" established the viewers' sense of identity with and ownership of their homes and local communities,
In keeping with the concern for developing crime prevention through community efforts, the McGruff campaign has been based on the premise that, as local neighborhoods build stronger ties, a new sense of community will emerge. In the process, it is intended that individuals will feel they have some control over their lives and that they will begin to care about each other, about the neighborhood, about their schools, and about other institutions. The campaign reinforces that this sense of caring can serve as one of the best answers to crime, suggesting that the solutions are within the community.
Another important element obviously has been McGruff. The Crime Dog was the central figure in the situational PSA's, and his personality created an important ethos. Over the years, he has been described as ''believable, credible, trusted," and he has been established as a "role model" with whom audience members could identify. He acts to lighten the heavy, emotional topic of crime and crime prevention. He moves to reassure, encourage, and support individuals and communities. He appears interesting and humorous, but at the same time always serious. But mc,:>t of all, McGruff comes across as informative. Throughout the campaign, McGruff aimed to portray a sense of confidence as he offered positive, simple information that people could easily remember and steps that they could readily enact. Specific directions or recommendations for crime prevention appear easily implemented without excessive effort on the part of local citizens depicted in the PSA's. Also, McGruff PSA's appear easy to read and to understand, another important design element.
1/:· ,)
Previous Campaign Evaluations §m~~~~~::~§:J~;~:~:;:1~~~:;:;~:1:;~w:m~~~;m~~~~;~~~~~~;:~::~~~:m:~i:~~:;~~~~~~:1~:~~:i~~:;:1:1~~~~:~~~:;~~~§~:I~:m~:;~:::1~~:m:::~~~~~~~~t%W~:::1:m~~:;
The NCCPMC was the subject of one major evaluation effort upon its initiation and several smaller scale efforts over the ensuing years.
The 1980-82 National Study
Take a Bite Out of Crime appears to have been the first national PSA campaign on any topic to undergo a large-scale formal survey evaluation of its impact (O'Keefe, 1985, 1986; O'Keefe and Reid, 1989). This work was done from 1979 to 1982 under a grant from the National Institute of Justice. A dual approach was used, incorporating both a national probability sample survey of 1 ,200 adults 2 years into the campaign, and a quasi-experimental panel survey of 426 adults in three representative cities. These adults were interviewed just prior to the campaign and again 2 years later. Effects of the campaign were assessed based upon the extent to which exposure to McGruff contributed to crime prevention competence, using a model of competence that included the following characteristics: (1) awareness clf appropriate prevention techniques, (2) positive 81ttitudes toward citizen prevention actions, (3) feelings of personal effectiveness in preventing crime, (4) personal concern about crime, and (5) various crime prevention actions.
The findings indicated that McGruff had a sizable impact during its first 2 years. More than one-half of the samples studied recalled seeing at least one of the PSA's, typically via television, and the spots were regarded as well-liked and effective. Nearly one-fourth of those exposed in the national sample said they had learned something new, and about one-half said they had been reminded of things they'd forgotten about crime prevention. Although general concern about crime and sense of personal responsibility were less affected, almost one-half reported more positive attitudes toward citizen involvement in crime prevention. A quarter of citizens exposed reported taking specific preventive actions. The panel study results confirmed that exposed citizens took significantly greater action because behaviors advocated by the campaign, with no change for non-advocated behaviors. When the study controlled for such competing variables as exposure to other crime-related media content and direct victimization experience, these effects were unaffected.
16
The findings also supported a view that effects of campaigns do not always follow a traditional persuasion-model hierarchy beginning with learning, working through attitude change and motivation, and concluding in behavioral change. Rather, it was quite clear in this case that for some persons behavioral change took place independently of cognitive or attitudinal changes. Also, cognitive changes did not always appear to precede attitudinal ones. A possible explanation is that predispositions toward victimization risk, direct opportunity for action, and issue involvement were partial determinants of the kinds of effects McGruff had on anyone group of individuals.
The Saatchi and Saatchi Research Program
Smaller scale research in the mid-1980's suggests, if nothing else, a continuing presence of the campaign in the public eye. Saatcfii and Saatchi has continued focus group and copy-testing research on potential audience groups, including children, prior to new topic phases of the campaign. Mall-intercept surveys indicate increasing recognition of McGruff as a crime prevention symbol and the attribution of credibility to him (National Crime Prevention Council, 1987).
More importantly, Saatchi and Saatchi has commissioned national polls of various target groups of the campaign to help develop specific messages and dissemination plans. Findings from some of these provide estimates of previous reaction to the campaign as well. In 1989 a national poll of 535 adults was conducted by telephone, with the sample heavily stratified to reflect greater proportions of adults in higher crime areas, more community-active adults, and adults with children (Saatchi and Saatchi, 1990). Nearly three-fourths of the respondents indicated awareness of McGruff, with slightly greater awareness among adults with children and slightly less among adults in higher crime areas. Nearly two-thirds of those aware were able to associate Mcgruff with crime prevention; furthermore, 92 percent of those aware of McGruff reported having seen a PSA. Message and slogan recognitions were also relatively high, and McGruff's appeal to children was a strong positive point for respondents.
Additional insight into reactions to the campaign comes from studies of intermediaries between the campaign and the public, professional crime prevention practitioners, and television station public service
managers responsible for choosing which PSA's are aired (DFSD Research, 1987).
An early 1987 national survey with a 39 percent response rate from 759 crime prevention practitioners (typically law enforcement officers) found widespread support for McGruff as a crimefighting symbol in community prevention programs. Three-fourths of the respondents reported that booklets and pamphlets tied to McGruff circulated throughout their communities. Also, about one-half said costumed McGruff characters made personal appearances at shopping malls, parades, and schools. One-half also cited McGruff-based advertising appearing in their communities. At the time of the interviews, McGruff's tenure in most local programs had been about 3 to 5 years, and the longer he had been used, the more positive the perceptions of him.
The vast majority of practitioners said McGruff was an effective spokesperson for all age groups. Most attributed his effectiveness largely to his high recognizability and mass appeal, which they tied to his backing by a national media campaign. The advertising also made their local programs more credible and noteworthy, many said. Most respondents believed McGruff to be particularly effective among children, to whom. he appeared as a symbol of trust and security. Many said that McGruff helped children learn crime prevention steps and safety tips. Almost 90 percent agreed that the PSA's and other McGruff materials aided them in their work, and most called for more publicity and coverage using McGruff. His main perceived weakness was in reaching teens and adults effectively, but that weakness was cited by only 16 percent of the sample.
A subsequent 1989 telephone survey was conducted with a national probability sample of 200 members of the International Society of Crime Prevention Practitioners (Saatchi and Saatchi, 1990). Again, McGruff's prominence was evident, with more than 90 percent of respondents reporting use of McGruff in pamphlets and public appearances, and rating his role as very or somewhat helpful, especially for children. There was some softening on using McGruff to reach older teens, however. (Data from chief law enforcement executives regarding McGruff are consistent with that of their subordinates.) A recent national survey of 788 police chiefs and sheriffs (73 percent response rate) focused on crime prevention beliefs, policies, and practices (Lavrakas and Rosenbaum, 1989). The McGruff campaign received an average rating of 6.8
(on a 10-point scale) in terms of its "helpfulness" to their departments in preventing crime. However, these executives identified the media overall as having the most important role in mounting effective future local crime prevention programs. The media was rated as more important than schools, voluntary organizations, social service agencies, businesses, and churches.
Concurrent with the survey described above was a survey of 53 television station public service managers who were interviewed (a 33 percent response rate) about their receptivity to the continuing McGruff PSA's. Nearly all regarded McGruff as an effective crime prevention symbol, and most cited his mass appeal and status as a public figure as reasons. The researchers believed the McGruff PSA's continued to receive adequate placement by stations because the spots were of high quality, with state of the art technology, and the subject matter was of ongoing community concern, encouraging people to become involved. The McGruff messages were also seen as easily targeted, as in the case of children's programs, simplifying placement decisions. The spots were also part of an ongoing campaign at the national and local levels, and the Advertising Council sponsorship provided additional credibility (DFSD Research, 1987). Largely concurrent results were obtained in a similar study of radio station public service managers (Saatchi and Saatchi, 1990).
Although not necessarily indicative of continued public impact of the McGruff-based efforts, these results do suggest that, after several years, the program has gained a strong identity and presence in both crime prevention and mass media circles.
Limitations of the Previous Research
The above work has had considerable value in determining the validity and promise of the initial Take a Bito Out of Crime campaign efforts. In addition, it has helped determine that the PSA's have accomplished one of their major goals in establishing McGruff as a highly visible entity positively associated with crime prevention.
The overriding limitation of the O'Keefe et al. study is timeliness. It documented the success of a novel informational strategy during the first 2 years, but it tells nothing about what has happened since. The main limitation for evaluative purposes of the 1989 Saatchi and Saatchi national poll of adults is that it was
'17
primarily designed as formative research for later media messages, and, as such, it does not address the previous or concurrent influences of the McGruff PSA's. Although productive for the marketing research purposes for which it was intended, the study's demographic segmentation and small sample sizes restrict its generalizability. The value of the mall intercept and focus group studies for broader evaluation purposes is similarly limited.
18
SECTION 3: CITIZENS, CRIME, AND
CRIME PREVENTION
This section provides the context for citizens' overall views and behaviors toward crime and its prevention and examines public responses to the Take a Bite Out of Crime campaign. The citizen survey included several items addressing:
a Public orientations toward crime, including respondents' perceptions of its nature and likelihood in their neighborhoods and their concerns about it.
• Personal victimization experiences.
• Crime prevention competence. or how citizens (a) viewed themselves as knowledgeable about crime prevention techniques, (b) had positive attitudes about coping with and helping to prevent crime, (c) possessed interest and motivation to help prevent crime, and (d) took appropriate preventive acti~ns.
• Attitudes toward law enforcement and related agencies.
• Crime prevention-related communication behaviors.
Baseline findings provide background for the presentation of results in the next sections regarding the McGruff campaign. These findings are also compared when possible with those from the 1981 crime prevention campaign study. providing trend data on changing citizen views on crime and prevention.
Public Orientations Toward Crime
Eighty-three percent of the 1,500 adults interviewed said they felt ''very'' or "reasonably" safe being out alone ,;1 their neighborhoods at night, with only 6 percent reporting they felt ''very unsafe." Once again. the high proportion of citizens claiming to be relatively unfearful belies many news media reports-and some conventional wisdom-of a country "under siege" from fear of crime. On the other hand, 16 percent of the sample with neighborhood safety concerns cannot be lightly dismissed. Moreover. perceptions reported
here are limited to specific kinds of fears. They may not reflect. for example, anxieties about safety of chil· dren at play in neighborhoods or at school.
However, given the measures used here, fear of crime appears to have decreased over the decade: only 70 percent had reported feeling "safe" in the 1981 crime campaign study (table 3.1, appendix A). Similarly, 34 percent in 1992 thought it ''very'' or "somewhat" likely their homes would be burglarized, compared to 43 percent in 1981, Also, 32 percent believed it likely they would be attacked or robbed in 1992, versus 38 percent in 1981. Worry about burglary dropped slightly from 56 percent in 1981 to 51 percent in 1992, with worry about being robbed or attacked having remained about the same (45 percent versus 43 percent).
Although these changes are based on comparisons of two national sample surveys representative of the U.S. adult population and ut,ing the same questions, one must be cautious in building inferences here. Some of the differences observed may be attributable to population demography changes over the decade, rather than to individual citizens feeling less threatened by crime now as opposed to 10 years ago. For example. migration to suburban and rural areas could contribute to less concern with urban safety among some groups; also, aging of the populace could yield complex patterns of fear reduction. At any rate, the purpose at this point is to briefly describe the context of public :'"Jpinion about crime.
General demographic comparisons of the 1992 findings in the form of regression analyses indicate that women were substantially more concerned about most aspects of crime than were men, particularly with respect to fears about violence (table 3.2). Black citizens were significantly more concerned than whites. These relationships hold regardless of education or income levels. which are generally unrelated to crime fears. However, locale is a strong predictor of crime concern, with metropolitan residents significantly more fearful than smaller city or rural residents
19
-------------------- ~-----~--
on every dimension. Older citizens tended to be more concerned than younger adults.
Respondents were asked to identify specifically what kinds of crime-related problems they had in their own neighborhoods (table 3.3). Heading the list were two property crimes: (1) theft of or damage to vehicles, with 54 percent listing it as a problem in their locales, and 12 percent of those calling it a "big" problem; and (2) home break-ins, also called a problem by 54 percent, and a "big" problem by 9 percent. The buying or selling of drugs was seen as a neighborhood problem by a substantial 39 percent of the population, with 11 percent terming it a "big" problem. Crime in and around schools was also named by 39 percent. Violent crime involving children and teenagers was mentioned by 29 percent, and gang violence was cited by 15 percent. Such less salient but potentially deleterious incivilities as teenagers hanging out were called a problem by 44 percent of the sample, as were rundown property (30 percent) and garbage or litter in the streets (28 percent). There was no comparable item used in the 1981 study.
Personal Victimization Experience
Twenty-three percent said that over the previous year they had been victims of actual or attempted theft or property damage. Two percent reported they had suffered an actual or attempted attack or robbery over the past year. One-third said they knew someone who had been attacked, robbed, burglarized, or vandalized in their neighborhoods over the past year. A.gain, no directly comparable item was used in 1981.
Citizen Crime Prevention Competence
As for citizens' sense of competence regarding crime prevention, 90 percent said they believed they had "more" or "equal" responsibility compared with police prevention efforts. This is a highly encouraging figure and up slightly from 85 percent in 1981 (table 3.4). More than 90 percent were interested in crime prevention, with 53 percent "very interested." Regarding confidence in protecting themselves, 40 percent were ''very confident," and 28 percent reported "knowing a
20
great deal" about how to do so. These proportions were up Slightly from 1981 as well. Nearly 90 percent believed that ordinary citizens taking more precautions would help reduce crime at least "somewhat."
Demographicaliy, the 1992 data indicate that women tended to be more interested in crime prevention, but regarded themselves as less knowledgeable, confident, or responsible than men (table 3.5). Black citizens tended to have greater interest and to discuss the issue more, and they were more apt to see themselves in opinion leadership positions. They also viewed citizen prevention efforts as more effective tha.n do whites. Oider adults had greater interest in prevention, but somewhat less confidence. More educated and affluent individuals regarded themselves as more knowledgeable. Few other demographics discriminate among prevention competence factors.
Crime Prevention Behaviors
Increases in uses of various kinds of home security devices from 1981 to 1992 were substantial (table 3.6). Having residential outdoor security lights doubled during the period, with 88 percent of citizens saying they had them in 1992. The number of citizens with operating home burglar alarm systems tripled to 19 percent. Use of special locks on doors or windows increased by nearly 50 percent. Identification engraving on personal goods and s,ecurity checks rose modestly. Nearly 40 percent of respondents said they owned a gun for self-protection in 1992, and 20 percent said they had Mace or tear gas.
The use of more active forms of preventive behaviors increased in frequency from 1981 to 1992 as well. However, the changes have to be interpreted even more cautiously because the rt9sponse formats on the prevention behavior items were modified somewhat from 1981 to 1992. The 1981 personal interview format called for four response options to each prevention activity ("always, most of the time, once in a while, and never"). These options were displayed on cards as respondents sorted for the various actions. However, in the 1992 telephone survey, the categories were simplified to "always," "sometimes," and "never." Although it might be argued that the "always" and "never" categories appear definitive for comparison purposes, the possibility remains that this attenuation of response categories makes direct contrasts less valid.
E
Most so-called "target-hardening" behaviors seem consistently carried out by more than of three-fourths of the populace, with 86 percent "always" locking their doors when out (up from 72 percent in 1981) (table 3.7). Locking windows and screens when out increased (69 percent "always" in 1992 versus 63 percent in 1981), and 76 percent said they left on lights whenever out at night, up from 52 percent.
Certain kinds of neighborhood cooperative prevention efforts increased more substantially over the decade. Keeping watch on neighbors' property rose from 43 percent saying they "always" did in i 981 to 61 percent in 1992. Similarly, asking neighbors to watch one's own residence increased from 55 percent to 74 percent, and a parallel rise occurred for either having deliveries stopped or asking someone to bring them in when away (46 percent in 1981 compared with 69 percent in 1992). Curiously, there was no indication of gains in more formal neighborhood activities such as getting together to discuss steps against crime. If anything, that appears to have decreased, with 70 percent in 1992 saying they "never" did, as opposed to 51 percent in 1981. However, 31 percent reported belonging to organizations or groups that had been involved in crime prevention activities. Another 40 percent belonged to groups that had been involved in drug prevention activities.
Avoidant behaviors increased somewhat, with 33 percent saying they avoided certain places in their neighborhoods, compared with 23 percent in the previous study. Nearly a quarter said they "always" went out at night with either someone or something for protection.
A factor analysis of these behaviors as reported in 1992 yielded four subsets: target hardening, neighborhood watch, neighborhood cooperation, and precautionary behavior (table 3.8). For an overview, these factors were compared by regression analyse~ with demographic characteristics (table 3.9). Women were strikingly more likely to engage in precautionary behaviors and were more inclined to be watchful but were less apt to engage in cooperative efforts. Older adults were more involved in securing their homes and keeping watch on others but, 'surprisingly, were not as likely as younger citizens to take precautionary steps outside the home. Black respondents reported taking more preventive measures overall, with the exception of watch-related behavior's. Residents of
larger city areas engaged more in home security and precaution.
Respondents were asked to estimate how much they had modified their own crime-preventive behaviors over time. Forty percent reported they had been taking actions to prevent crime more often than they did 10 years earlier, and 5 percent said less often. (Percents here are reported only for respondents age 28 or older, to help avoid confusion with changes in behaviors resulting from moving from adolescence to adulthood.) This finding provides another source of validation for increased preventive activity across the country over the decade. When asked the same question in the time frame of the previous 12 months, 22 percent reported they had taken engaged in preventive behavior more often, compared with 7 percent who said less often.
Citizens also reported a variety of crime prevention programs active in their neighborhoods. A substantial 42 percent reported Neighborhood Watch programs in their immediate areas, with more than two-thirds say- . ing the program was being extensively implem~,nted. Crime Stopper media programs were noted by f?9 percent, with three-fourths terming them extem;iiv~). Notably, 48 percent reported drug-free school j:,ones operating in their neighborhoods. Anti-crime nl!lwsletters were reported by 16 percent, anti-drug rallies and marches by 21 percent, and police foot patrols by 11 percent. There is no comparable measure I'or 1981.
Competence and Concern About Crime
How do citizens' concerns about crime relate to their crime prevention competencies? Something of a disparity exists between the amount of interest expressed in prevention and the level of confidence citizens have in being able to reduce crime by their own actions. Adults who see their neighborhoods as being less safe, and themselves as more at risk, are clearly more interested in crime prevention (table 3. i 0). However, they feel significantly less confident about preventing crime and generally no more knowledgeable than people ir, safer circumstances. They also discuss crime more and are somewhat more likely to see themselves in opinion leadership positions.
21
Those who see themselves more at risk also lean significantly more toward target-hardening and precautionary preventive actions (table 3.11). Indeed, citizens who view their neighborhoods as more dangerous, and who worry more about violence, are less likely to involve themselves in watch activities. Worry about burglary or violent crime does appear to lead somewhat more toward cooperative activity, however.
As for relationships among attitudes about prevention and reported behaviors, an encouraging sign is that some citizens see themselves as more knowledgeable, interested, and generally competent. They are also more likely to engage in cooperativ~ and watchrelated activities, but not necessarily more in targethardening or precautionary ones (table 3.12). Those feeHng more confident in their ability to help prevent crime are less likely to use precautionary tactics.
Citizen Views on law Enforcement and Crime Prevention
A majority (62 percent) believed that their local police were doing a "good" to "very good" job of working with residents of their neighborhoods to solve local problems. Twenty-six percent said police were doing a ''very good" job in this area (table 3.13). However, 8 percent called police performance "poor" in this respect. Nearly 70 percent described the overall relationship between police and citizens of their neighborhoods as "good" to ''very good." Eighty percent said it was likely that their neighbors would call the police if a suspicious stranger was seen looking around their property.
With respect to preventing crime more generally, 62 percent said police were doing a "good" or better job of it, with 6 percent calling their performance "poor" (table 3.14). Just over one-half said news media were doing at least a "good" job of preventing crime, compared with 45 percent who said the same of local volunteer organizations. Interestingly, 54 percent believed their neighbors were doing a good or better job at preventing crime, and 51 percent credited themselves as doing the same.
22
Communication and Crime Prevention
One-third of respondents reported they "often" came across information from mass media and other places about how to protect themselves from crime; another 55 percent said they "occasionally" did so (table 3.15). In 1981,25 percent reported such exposure "often," implying more such information being available in the system in 1992. However, greater exposure did not equate with increased attention, with 29 percent saying they paid "a lot" of attention to information about crime prevention in 1992, compared with 27 percent in 1981. Although 70 percent in 1981 reported a need for crime prevention information, only 60 percent did so in 1992. Further, althijugh 29 percent said they had a "great need" in 1981, only 19 percent did so in 1992. It may be that such need has attenuated simply because more information is readily available to satisfy it.
Those more exposed to information about crime prevention were more likely to be women than men and black than white. They also were apt to be better educated (table 3.16). Women and black citizens were more attentive to such messages when they came across them but were also more inclined to say they still needed more such information. It is noteworthy that although 43 pen::ent of black respondents said they had a great need for prevention information, only 17 percent of white respondents did. Persons with children, and those in more populous areas, also indicated greater information need. Although older citizens paid significantly more attention to the information, younger ones indicated a greater need for it.
Citizens more exposed and attentive to prevention information were also more concerned about crime, and those with the greater need for more information were substantially mOrt9 concerned (table 3.17). By and large, the more exposed and attentive were mOire prevention competent as well (table 3.18). However, exposure and attention were unrelated to confidenc:e in one's ability to prevent crime. The more information citizens received, the more likely they were to take nearly all forms of prevention actions also (table 3.19). Those more in need of information followed these same trends, with the exception that they saw themselves as significantly less knowledgeable and less confident.
When asked where' they had learned about things they do to be safe from crime, citizens cited television news as the most popular source (table 3.20). Eightyfive percent said they had learned at least "some" things from the television medium, with 29 percent saying "a lot." Next was newspaper crime stories (with 73 percent having learned from them), followed by PSA's (70 percent) and McGruff PSA's in particular (62 percent). Local police were cited by 56 percent, neighborhood crime prevention groups by 30 percent, and personal experiences with crime by 61 percent.
The demographic correlations reported in table 3.21 indicate that the young are far more likely to cite PSA's, including McGruff, than other sources. Women and black respondents reported learning across the board from all sources. Less educated, lower income citizens appear to have drawn more knowledge from television news, compared with urban dwellers who leaned more toward neighborhood groups.
Conclusions
To briefly summarize the crime perceptions of the U.S. public in 1992:
• More than 80 percent of adults felt at least reasonably safe out at night in their neighborhoods, and nearly two-thirds said it was not very likely they would be burglarized or attacked.
• Nearly one-fourth of the sample reported having been victimized the previous year, and one-third said they knew someone who had been.
• T:-Je most conspicuous neighborhood crime problems included theft or damage to vehicles and home break-ins; drug sales were close behind, as were school-related crimes.
• Nearly all citizens believed they had at least equal responsibility with the pOlice to help prevent crime, expressed interest in doing so, and believed that such citizen involvement was an effective deterrent.
• Smaller numbers, however, indicated knowing how to go about doing so, or confidence that they could take appropriate preventive meaf,ures.
• Most citizens regularly took steps to secure their homes, but fewer numbers were engaged in cooperative or watchful activities with their neighbors; some of these behaviors had increased since 1981, however.
,
• More than one-half of the sample said they had some kind of formal crime prevention \--rogram operating in their neighborhoods; about two-thirds generally lauded police performance in their neighborhoods.
• Most citizens reported being exposed to information in the media and other channels about crime prevention, and nearly two-thirds indicated a need for more such information.
• Women and black citizens were more attentive to prevention information, with blacks in particular indicating a greater need for more.
• Television news was a highly popular source of prevention information, followed by newspapers and PSA's, including the McGruff spots.
Although crime is clearly high on the agenda of public concerns, it may be a mistake to exaggerate the numbers of citizens living under pervasive fear of it, at least as measured here. A substantia! majority appeared to feel quite safe in their own neighborhoods, and most thought it unlikely they would be burglarized, attacked, or robbed. Moreover, these fears appear to have decreased somewhat among the U.S. population as a whole since 1981. Women, black citizens, and those in more urbanized areas were the most concerned about crime.
Two observations are worth noting from a policy perspective. One is that fear of crime does not appear as rampant among the public as many press and other popular accounts seem to suggest. This may be taken as good news, but it should not obscure the fact that significant numbers of citizens do remain in rather dire circumstances. Also, it may take more effort by information programs to convince more "secure" members of the public that crime remains a serious, volatile threat to society. A second observation has to do with a dynamic of public opinion that probably deserves greater attention here. Known as the 'third person effect" or "biased optimism," the tendency for individuals to regard their own personal situations more favorably than those of 'the public" in general is fairly well documented. It may be useful in subsequent work on these issues to consider how citizens realistically regard their own situations as better or worse than citizens in other circumstances. This tendency could have a pragmatic bearing on public support for anticrime andl drug measures that citizens mayor may not see as having direct benefits to themselves. It could also have implications for the design of information programs in terms of when to emphasize
23
-behaviors that protect oneself from crime as opposed to those that may more altruistically protect others.
The increases in certain reported crime preventive behaviors over the decade appear especially encouraging in the context of the efforts made to promote them. For example, the level of perceived personal responsibility for crime prevention increased only slightly since 1981. However, the perception supports the emphasis placed on the broader theme of shared responsibility for community security that serves as an underpinning for the police/community partnerships discussed in section 1. The partial increases in neighborhood cooperation, at least in terms of watching out for the property of others, may reflect increased social responsibility. Although there was no evidence of increased discussion with one's neighbors about preventive steps, it seems quite encouraging when nearly one-half of the adult population is aware of formal crime prevention programs operating in their neighborhoods. It would seem that future crime prevention information programs can reinforce and build on themes.
24
Greater attention to prevention information among women and especially black adults deserves closer scrutiny. These samples make it difficult to break down more closely which portions of those groups might be particularly in need. Likewise, researchem lacked adequate measures (or numbers) for minority groups that might share those needs. In any case, it is important to go beyond these simple demographic indicators in information program planning. For effective campaign planning, researchers need to determine what specific kinds of crime problems are being confronted by various individuals within these segments, and what their current knowledge levels, attitudes, and behaviors are. These issues will be discussed in the context of the McGruff campaign in ensuing sections.
Finally, the utility of television news for conveying prevention information suggests that information programs such as the National Citizens' Crime Prevention Campaign should continue to emphasize local news events and features to get across important pOints. PSA's alone can accomplish only part of the task.
SECTION 4: PUBLIC EXPOSURE AND
RESPONSE TO THE MEDIA CAMPAIGN
How do citizens themselves respond to the NCCPMC? To what extent is the public exposed to the campaign, attentive to it, and responsive to it? As a wealth of information, campaign research has indicated opportunity for public exposure to messages cannot be equated with actual exposure (Rice and Atkin, 1989; Salmon, 1989; O'Keefe and Reid, 1990). Such variables as overall frequency and reach of media messages, orientation toward commercials, interest in the topic, and the like all accelerate or impede audience members' frequency of exposure to a given PSA (DeJong and Winsten, 1989).
As previous work has also demonstrated, exposure to a message is necessary but not sufficient for attentiveness to or involvement with it. Both exposure and attention are critical evaluative components that indicate how successfully messages are getting through appropriate channels, and how appealing or interestprovoking they are to their targeted audiences (Devine and Hirt, 1989). Some individuals may passively "sit through" a televised PSA while waiting for a program to resume, while others actively engage in carefully attending to elements of it (Petty and Cacciopo, 1988). Interest in the subject is of course a key factor in attentiveness but so are tile specific style and content characteristics, presentation format, clarity, and so forth (Backer, Rogers, and Sopory, 1990). Although the initial McGruff evaluation found respectable exposure levels, the impact of PSA's was far more associated with how much attention people paid rather than with how often they saw or heard the messages.
Researchers examined exposure and attention levels to the PSA's among the general public and within target audience groups. Although these levels are expected to vary by the degree of PSA dissemination within given communities noted above, it is also antiCipated that individual factors (e.g., perceived verbal and visual appeal of the PSA's, their credibility, general orientations toward crime, interest in prevention,
relevant demographics, etc.) influence exposure and attention. In sum, how exposed are various citizen groups to the McGruff PSA's? How much attention do they pay to them? What factors influence each?
How citizens respond to or internally evaluate the PSA's should be a strong mediating factor in the campaign's eventual effect on citizens (O'Keefe, 1986; DeJong and Winsten, 1988). Message effects are likely to increase in proportion to how positively or negatively the message is viewed.
The following findings are derived from telephone interviews during March and April 1992 with a national probability sample of 1,500 adults. Data tables appear in appendix A.
How Widespread Is Exposure to McGruff?
Simple exposure to McGruff PSA's overall was measured by aided recall items that followed asking respondents how much attention they paid to PSA's in general. The initial McGruff question posed follows:
Now I'm going to describe one particular kind of public service ad to you. They say, "Take a Bite Out of Crime," and include a cartoon character dog named McGruff dressed in an overcoat telling people how to protect themselves from crime. These McGruff ads have been on television and radio, in newspapers and magazines, and on posters and billboards. Do you remember having seen this ad anyplace at all?
Eighty percent said they had seen the PSA's, 18 percent said they had not, and the remainder were uncertain. In 1981, 52 percent recalled having seen a McGruff PSA.
25
• As for exposure to the Phase XV We Prevent PSA's, respondents were read the following item:
There have been a lot of different kinds of McGruff ads. I'm gOing to describe one particular kind to you, and I want you to think about whether you remember having heard or seen them anywhere. The television ads say, "We Prevent," and they an9 aimed at helping protect children and teens from violent crime. Some show children in make-believe play with guns, or parents grieving at a child's funeral. They close by saying, "Take a Bite Out of Crime." Do you remember having seen this kind of ad on television over the past few months?
While We Prevent was not a formal slogan for the campaign, it was used as a shorthand device here for referring to the campaign to respondents. Researchers believe that once the advertisements appearing in each medium were described in some detail, respondents knew what the We Prevent label referred to in subsequent questions.
Of the total sample, 27 percent reported having seen the televised We Prevent spots. Of those, 38 percent said they had only seen them once or twice, but another 41 percent reported up to 10 exposures (table 4.1, appendix A).
Parallel descriptions were given fot' the radio and printed versions of this PSA, describing main features of each. For radio, the item read:
We Prevent ads have been on radio. In one, a mother tries to explain a 6-year-old's death to another child, and in another statistics on school children as victims are given. Both end with the words, ''You must fight back." Do you remember having heard this kind of ad on radio over the past few months?
The print item read:
26
Newspapers and magazines have carried We Prevent ads showing children as possible crime victims. One has the words, "Somebody's dying for a new pair of sneakers," and another says, "This is how a desperate drug addict sees your child." These ads have also been on posters and billboards. Do you remember ever having seen this kind of ad anyplace at all?
2
Fifteen percent of adults recalled having heard the PSA on radio, and 36 percent recalled seeing it in at least one print medium. Print PSA recognition was highest for magazines, followed by newspapers, billboards, transit pieces, and other posters (table 4.1).
In all, 49 percent reported exposure to the Phase XV PSA's in at least one medium. Of those, 50 percent indicated they were most familiar with the televised versions, 37 percent said print, and 11 percent radio.
Public Response to Phase XV l:j:l:l:~:1:~:1~:l:l:j:[:t:i:j:j:f:l:i:l:j:l:l:j:j;~i:j:j:~j:~j:!:j:j:l:l:l:j:l:j:j:l:j~:l~:j:j:~j:i:l:l:j:j:j:j:~l:l:j:~j;l:j:~:j:j:j:j:j:j:l:m:l:j:l:j:j:j:j:j:j:j:j:j:j~:j:j:j:~:[:~:j:~:[:~:~:j:j:i:j:j:i:l:j:j:~:l:~~:j:j:l:~:l:j:i:i~:
Regardless of medium, 32 percent of the citizens exposed to the Phase XV ads said they had paid a great deal of attention to them, 54 percent reported some attention, and 14 percent said hardly any attention. These figures compare favorably to those for the initial McGruff PSA's in 1981 (26 percent paying a great deal of attention, 51 percent some attention, and 22 percent hardly any), suggesting continuing if not increased public attentiveness and interest in the series, at least as reflected in this We Prevent phase.
Fifty-nine percent of those recalling the We Prevent PSA could identify something about them they particularly liked, compared with only 11 percent that could name something they disliked. Specific likes mentioned covered a wide range, but among the more common were that the ads built or promoted awareness o~ crime prevention (cited by 10 percent), they were direct and to the pOint (8 percent), and they had creative appeal (catchy, well done, good symbol, etc.) (6 percent). Others cited their likes as easy recognition and attractiveness of McGruff (6 percent) and targeting of specific audiences (6 percent) (table 4.2). In general the PSA's appear liked as much for their perceived effect as for their content.
As for the dislikes, no one category was mentioned by more than 2 percent of the respondents. The mostmentioned concern centered on perceptions that the PSA's were too graphic, morbid, unpleasant, and inappropriate; however, these concerns were voiced by an extremely small minority (table 4.2).
Citizen Exposure and Response to Other MeG ruff PSA's
Respondents were also asked how often they recalled seeing or hearing McGruff ads other than the We Prevent ads over the previous 12 months. These ads could have included virtually any of the previous McGruff PSA's still run occasionally by media sources. However, it is more likely they would predominately be from Phase XIV, and perhaps from the preceding phase or two. The aim was to determine exposure and reactions to the more typical McGruff ads prior to Phase XV.
Sixty-four percent of respondents could recall having seen McGruff ads other than We Prevent. Once again, television was the dominant source, followed by radio and the various print options (table 4.3). Attention rates were lower than for We Prevent, as might be expected given that the previous PSA's were likely to have been recycled into longer shelf lives, and thus would lack novelty. Still, 22 percent of those exposed reported having paid a great deal of attention to them, 61 percent some attention, and 18 percent hardly any attention.
As for what respondents parHcularly like about these other McGruff PSA's, creative appeal was mentioned most often (by 12 percent), followed by recognition of McGruff (7 percent), and building of awareness of crime (6 percent) (table 4.4), The overall pattem of responses here suggests that, unlike the We Prevent ads, these ads were liked as much or more for their content or format than for their perceived effects. (Researchers were unaware at this point of previous research comparing positive attributes of advertising messages based on appeal versus perceived impact, and it may be a phenomenon more peculiar to PSA's. Plans are to develop this avenue of inquiry at a later time.)
Similar to the situation with We Prevent, only 6 percent of those recalling the PSA's could identify something they disliked, with the most often mentioned negative characteristics being a lack of realism and inappropriateness of the dog symbol. However, each of these was named by little more than a handful of respondents.
Who Is Exposed to MeG ruff?
Researchers examined who was more likely to have seen or heard the various McGruff PSA's based on demographic, communication, crime, and crime prevention characteristics.
Demographic Factors
Demographically, overall exposure to McGruff was greater among younger respondents, with more than 90 percent of those under age 35 reporting awareness of the PSA's. Fewer than one-half of age 65 plus adults were aware of the campaign (table 4.5). These findings parallel those of the 1981 national study, which found an overall exposure rate of 52 percent but far greater awareness among younger citizens (table 4.5). As speculated in 1981, it seems likely that the cartoon character and related themes do a better job of reaching the young rather than an older populace. (Some evidence also suggests that older adults are less likely to be attuned to many kinds of informational campaigns (O'Keefe and Reid, 1987).)
Men were significantly more exposed, although the actual difference between men's and women's exposure rates is less than 6 percent. White and minority awareness rates were about equal, as in 1981. However, black citizens tended to be more exposed than whites.
Exposure differences due to education, income, and family status were quite similar to those found in 1981. Respondents who hadn't completed high school were significantly less exposed to McGruff. However, this appears in large part an artifact of lower exposure among elderly groups, who also tend to have less formal education. Significant trends were not found for education within age categories. Middle income groups were somewhat more exposed than those either at the low or high ends of the spectrum. Marital status did not discriminate exposure rate, but individuals with children in the home had a substantially higher awareness rate.
We Prevent. Demographic differences in exposure 'to the Phase XV PSA's largely matched those for the McGruff PSA's overall (table 4.5). Nearly two-thirds of adults under 35 had seen or heard them, but less than 30 percent of elderly persons had done so. Men, black adults, and married persons were slightly more
27

exposed. Less educated and lower income persons were less aware of We Prevent, with age again a likely confounding variable. Persons with children in the household were significantly more exposed.
Demographic differences in where citizens had been exposed to the We Prevent PSA's were rather few. Younger adults generally reported having seen more of the ads across all channels-from television to posters (table 4.6). Less educated persons had more exposure to television and radio versions, but the more educated read more of them in magazines and newspapers. Billboards and transit signs were more popular sources in more urbanized areas.
Communication Factors
Persons more exposed and attentive to other kinds of information related to crime prevention were also more likely to be aware of McGruff, and especially the We Prevent PSA's (table 4.7). The same was true for citizens who indicated they had a greater need for more information about crime prevention (table 4.7). It should be kept in mind that the sporadic nature of PSA's makes it difficult, if not impossible, for interested persons to seek them out as information sources. It is likely therefore that persons who need information about crime do not seek out PSA's; rather exposure to McGruff promotes a need for more information about crime. On the other hand, given the nature of the recall data used here, the respondents with a greater need for information may remember the PSA's better when they do come across them, which can be another indicator of their salience.
As expected, adults who watched more television and listened to the radio more were more likely to be aware of the McGruff PSA's overall (table 4.8). The same trend held for the We Prevent PSA's, but it was significant only in the case of radio. However, those who read newspapers more offen were actually less likely to be aware of McGruff.
Similarly, greater attention to PSA's in general on television and radio predicted McGruff exposure (table 4.9). The effect was less pronounced for newspapers. Similar findings in 1981 were linked to increased attentiveness by some individuals to advertising overall.
Greater exposure to McGruff generally and Phase XV in particular was also tied to having learned about
28
crime prevention from a host of other sources, including media news about crime, other PSA's, local authorities and neigllborhood groups, and personal experience with crime (table 4.10).
Crime Orientation Factors
Exposure to McGruff was sporadically related to citizens' perceptions and concerns about crime. Unrelated to McGruff awareness were fear of being out alone at night, perceived likelihood of having one's home burglarized, or worry about being attacked (table 4.11). However, the respondents with greater exposure to McGruff were more prone to worry about being burglarized.
With respect to concern about neighborhood crime problems, greater exposure to McGruff overall was associated with respondents seeing more problems in their own neighborhoods with car theft, drug sales, school crime, loitering, and rundown property (table 4.12). We Prevent exposure was positively related to these characteristics as well as to seeing violent crime among children and teens as more of a problem.
Citizens who said they had been victims of crime over the previous year were more liable to report exposure to the campaign, as were those who knew someone else who had been victimized within the neighborhood (table 4.13).
Crime Preventiclll Competence factors
Citizens more exposed to McGruff believed themselves to know more about protecting themselves from crime and reported greater sense of responsibility for and confidence in doing so (table 4.14). A caution at this point: These data do not necessarily indicate that individuals became more knowledgeable, responsible, or confident as a consequence of exposure to the McGruff PSA's. It may also be that citizens already more prevention competent were more exposed to the ads, or at least more prone to remembering them. However, equally likely, the McGruff campaign may serve a reinforcing function, strengthening previous dispositions toward active crime prevention. It is worth noting, however, that the 1981 panel study, which controlled for other likely causes of these prevention characteristics, found evidence that exposure to McGruff was associated with increases in prevention characteristics over time. Moreover, it seems less likely that preexisting higher prevention
compe~ence levels would lead to exposure, because seeking out PSA's can be a fruitless task given theii often scattershot placement.
Overall, McGruff exposure was only slightly related to belief that citizens can reduce crime by taking more precautions and to discussion with others about crime prevention (table 4.15). The more exposed did see themselves more as opinion leaders in the sense of being asked more for their ideas and opinions about prevention. Exposure to We Prevent was significantly 8.3sociated with all three of these factors, suggesting that those PSA's generated more interaction among their audience.
Associations between McGruff exposure and crime prevention activity were somewhat sporadic as well, but in nearly all cases the trend was for exposure to equate with increased behavior (table 4.16). In particular, greater exposure to We Prevent was significantly linked with more cooperative activities, such as keeping watch on neighbors' properties and getting together with neighbors for steps against both crime and drug abuse. Overall, McGruff awareness was tied to these as well, although not quite as strongly. Again, these correlations do not necessarily indicate that exposure to McGruff causes increases in these behaviors. However, panel data from the previous study did support such an inference.
Interestingly, McGruff exposure was not well predicted by the presence or absence of other neighborhood crime prevention programs. Such programs as Neighborhood Watch, Crime Stoppers, citizen patrols, newsletters, and police foot patrols were all essentially unrelated to awareness of McGruff (table 4.17). A later section explores this lack of relationship more fully in terms of local law enforcement interactions with the NCCPMC.
Campaign Effects on the Public :~l@[:~~:::I:~l:~~1:~~~~:~:1:l:1:::1~:~:i:~§i:l:~:~:~:1~:I:i:l:~:l:i:l:~:~~l:l:::::~l:l:l:l:I:~:~:~I~:l:i:~i:l~~~:~~1:mt:l:l:~:1:~1:1:1:1;l:~:l:1:~l:;:1:j~:~1:l:1:::i:i:j:l:~~~l:j:~i:j:j:i:~[:::l:I:j:~
To what extent does the media campaign influence the crime and drug prevention competencies of targeted audiences? Do the PSA's make a significant difference in how citizens deal with crim~) and drug abuse in their communities? Previous work has forcefully taught us that neither exposure nor attention to media messages necessarily equate with obtaining the desired effects (McGuire, 1989; Devine and Hirt, 1989; O'Keefe, 1990).
Moreover, it is critical that the type of effect desired be carefully delineated by campaign planners and evaluators alike. Generally, message effects can be classified a~ cognitive (e.g., awareness, learning), affective (e.g., attitude change), emotive (e.g., fear arousal), motivational (e.g., building interest), or behavioral (e.g., taking action). All of these types of effects interact, although there is some disagreement over how. Some theorists posit a more orderly sequencing of persuasive effects; e.g., awareness must occur before attitude change, which must occur before action change (McGuire, 1985). Others insist that, depending on various contingencies, the sequence is less logical, with action possible without attitude change, etc. (Petty and Cacciopo, 1988). Previous work on PSA's, including McGruff, suggests the latter course is more likely.
Accordingly, researchers developed an evaluative model of citizen competence with respect to crime and drug abuse prevention. This model provides an empirical framework for objectively examining the effectiveness of the NCCPMC.
The concept of competence incorporates several key psychological orientations and behaviors that citizens may demonstrate in varying degrees with respect to crime and drug abuse prevention. The campaign can be regaraed as being effective to the extent that persons exposed to it:
• Become more fully aware of the publicized crime and drug preventive techniques.
• Hold more positive attitudes concerning their responsibilities for watching out for themselves and helping others.
n Feel more capable of carrying out preventive actions to reduce victimization risks to themselves and others.
• Are more motivated to take interest in crime and drug-related issues, to learn more about what they can do and to consider alternatives.
• Take appropriate actions or behaviors aimed at reducing crime and illicit drug use.
This approach is distinct from many other persuasion process models because it deals with levels of message effects in a nonlinear way. It assumes that individuals can, for example, be behaviorally competent but not necessarily be informationally or attitudinally
29
m
competent in a given topic. The earlier McGruff research indicated, for example, that the campaign had greater attitudinal effects on some citizens, but it had no informational effects. However, for other persons it stimulated behavior changes without concurrent attitude change.
Perceived Impact of Phase XV PSA's
To ascertain perceptions of We Prevent impact on levels of citizen crime prevention competence, respondents were asked how much they believed the PSA's had influenced their awareness, attitudes, and behaviors. Although such self-perceptions can't be taken as clear evidence of actual change, they do provide onE" indicator. Also, the 1981 data suggest a high corre~i)ondence between such self-reports of change and more valid repeated measures of change over time. After all, the main purpose of these PSA's was to generate emotional response and action in the form of requesting more information, as opposed to information gained dir.ectly from the ads.
Respondents exposed to We Prevent were asked whether the PSA's showed or told them anything they had not known about before or reminded them of things they had known but forgotten. Thirty-one percent answered affirmatively, generally paralleling the response to similar items in 1981. The vast majority said they had been more reinforced by the PSA's than told anything new. However, a wide variety of specific examples were given, ranging from being more observant and involved, to having heightened awareness of risks children face, to becoming concerned about crime in schools (table 4.18).
Fifty-nine percent of the respondents recalling the We Prevent ads said the PSA's had made them more concerned about violent crime, with only 1 percent saying they were made less concerned. However, 45 percent reported the PSA's made them feel more confident about being able to protect children from violent crime, and only 6 percent said the material made them feel less confident about dOing so. These two findings are again quite replicative of those for parallel items in 1981. Three-fourths of the citizens termed the We Prevent series helpful in learning how to protect children, with 22 percent calling them very helpful. Twenty percent considered them "not very helpful."
30
r
As for behavioral impact, 21 percent said they had done things they probably would not have, had they not seen We Prevent PSA's. This compares very favorably to the 22 percent giving the same response to the previous ads in 1981. The range of responses was exceptionally varied, incorporating community action (e.g., joining groups), personal precaution (e.g., locking up), and precautions involving children (e.g., knowing where children are) (table 4.19).
However, only 12 respondents said they had called the 800 number for more information. Although disappointingly low for analytical purposes (if no other reason), this 0.8 percent response within a national sample is not necessarily at variance with reported numbers of actual calls to the number, recorded at 31,000 by the end of March 1992 (and 55,000 by October 1992).
Perceived Impact of Other McGruff PSA's
In all, 27 percent indicated they had gained information from the McGruff PSA's other than We Prevent, with 42 percent of those saying they had been reminded of things they had known earlier. General awareness of crime, and taking precautions, were indicated by another one-third of the group. Eighteen percent said they had done things as a result of the ads, with about one-third indicating such steps as locking up or leaving on lights. Most responses tended to be more general, which is expected given the diffuse range of PSA's included here.
These proportions of falvorable and unfavorable "reviews" also appear basically unchanged from 1981, providing no evidence of a decline or increase in popularity of the PSA's.
Perceptions of Overall Campaign Impact
Respondents were asked a series of questions requiring more specific responses pertaining to both crime and drug abuse prevention and taking into account all Take a Bite Out of Crime PSA's they had seen or heard. Responses were largely quite positive on each of the attributes measured.
Crime Prevention. Seventy percent of respondents familiar with McGruff said they found the PSA's
effective in making them personally more aware of how to prevent crime in their neighborhood, including 17 percent who found them ''very effective" (table 4.20). Sixteen percent termed them "not effective at aiL" Importantly, 90 percent called them effective in building children's awareness, including 41 percent saying they were ''very effective." Seventy-six percent called them effective in making other adults more aware.
As for more attitudinally based measures, 54 percent said the PSA's made them more concerned about crime, and 36 percent indicated they made them more confident about being able to protect themselves from crime. Also, 47 percerl1 reported the ads gave them more of a sense of personal responsibility for working with others to prevent crime.
Drug Abuse. Findings for drug abuse competeme measures generally paralleled those for crime, with 60 percent calling the McGruff ads effective in making them personally more awar~ of how to prevent drug abuse in their neighborhoods (table 4.21). Again, the PSA's were seen as most effective among children, with 88 percent of citizens saying they believed the ads were effective in making children more aware of neighborhood drug abuse prevention. Seventy-four percent said the ads were effective in making other adults more aware. Just over one-half reported that the PSA's made them more concerned about drug abuse, and 46 percent said their sense of personal responsibility had been increased.
Perceptions of Preventive Activity
Respondents were asked whether they were taking actions to help prevent crime more often, as often, or less often over the previous 12 months, and over the previous 10 years. Twenty-two percent reported more activity over the past year, compared to 7 percent saying less activity. Thirty percent reported more activity over the decade, compared to 5 percent indicating less. Citizens reporting more activity in either case also were significantly more likely to be exposed to McGruff PSA's (table 4.22). Moreover, increased activity was significantly associated with increased concern and sense of responsibility gained from the PSA's. Increased activity over 12 months was also greater among citizens who reported gaining awareness and confidence in crime prevention from the McGruff PSA's.
Citizen Differences in Campaign Response :1:1~:~~:~~:1:1:1:~~~:j:j~:j:l:~1:1:1:~1:1:i:j:j:~j:i:~l:~j:j:~j:[:j:j:j:!:j:i:~i:j:i~:j:l:j:~:j:~j;~j~:j:j:j:~:~j:i~:j:l:l:j:~j:~~j:j:j:j:j:j:~j:l:l:l:l:l:~l~:~:l:~j:i:j:j:~j:l:l:j:l:1:j;j:~:~~:fj:j:l:~;1:~l:~
Given that public information media campaigns vary greatly in their impact upon citizens, researchers must also consider the kinds of factors that either enhance or impede the influence of the McGruff campaign. To what extent has the campaign influenced crime and drug prevention competence among various publics, including especially targeted groups?
phase XV
A demographic analysis of responses to the P:,ase XV PSA's reveals that more attention was paid to them by persons in the middle age groups and particularly by those with children in the home (the target group for these messages) (table 4.23). Nearly twice as many black as white adults (58 percent versus 29 percent) paid "a great deal" of attention to them. Women were significantly more attentive than men were. The less educated, and lower income earners, paid more attention. Thus the We Prevent ads appear to have succeeded at least in drawing more attention from the audiences the campaign was targeting.
However, learning from the PSA's appeared quite equal across demographic groups. No significant differences appeared in information gain across demographic groups-although groups such as blacks and respondents with children appeared somewhat more likely to report learning. Rospor.~, ')s to the attitude change items were more divl~rse, with blacks, women, and lower income citizens saying the We Prevent ads made them both more concerned about violent crime and more confident in protecting children from it. These groups, as well as those with children, also reported the PSA's to be more helpful in learning about protecting children. These same trends generally held for taking preventive actions. Significantly more blacks, women, and people with children reported taking steps they would not have otherwise.
As e}(pected, citizen responses to We Prevent PSA's varied somewhat according to their perceptions of crime. The safer respondents perceived their neighborhoods to be, the less attentive they were to the ads, and the less concern and utility they attributed to them (table 4.24). On the other hand, adults who worried more about burglary or violent crime, and who
31
&
thought themselves more at risk from violence, were more attentive to the PSA's. They were also more apt to say that the messages were helpful and made them more concerned and confident, and that they took action as a result. Given these findings, it is somewhat odd that information gain did not vary by these perceptions of crime.
Respondents who saw any of the particular offenses listed as being more of a problem in their neighborhoods were more attentive to the Phase XV ads (table 4.25). In keeping with the theme of these PSA's, however, they were most likely to report having taken action if the crimes they cited as more problematic included violence involving children, crime in schools, and buying or selling drugs. Break-ins and teenage loitering also led to more action-taking. Differences in information gain were again minima!, and those in attitude change were quite mixed.
Responses to the Phase XV PSA's were also compared to levels of crime prevention competence, with mixed results. Persons more interested in crime prevention, and those who discussed it more, were clearly mQre responsive to the messages on nearly all dimensions, from attention to attitude change to action (table 4.26). However, other competence measures associated with PSA response only sporadically.
Previous McGruff PSA's
This pattern of responses to the We Prevent ads generally followed for previous McGruff PSA's but with less well-defined demographic variation. Younger adults, women, blacks, and the less educated were more attentive but not as dramatically so (table 4.27). Women reported learning significantly more, and women, blacks, and those with children were more likely to indicate taking action. Respondents under age 24 were asked if they recalled seeing McGruff ads as a child, and 50 percent said they did. Eightynine percent of those called the ads effective in making them more aware of crime prevention as a child, and 50 percent called them very effective in dOing so.
With respect to crime perceptions, citizens who saw their neighborhoods as less safe, and who believed themselves to be more at risk and worried more about it, were more attentive to the PSA's (table 4.28). For the most part, these citizens also reported learning more from them. Those more worried about crime,
32
and who felt more at risk from violence, were more inclined to take action as well.
Perceptions of nearly all types of neighborhood crime problems were associated with increased attention to McGruff (table 4.29), and with learning from the ads. Taking action was more likely in neighborhood3 where drugs and violent crime involving children and schools were viewed as problems.
As was the case with the We Prevent PSA's, the only aspects of crime prevention competence to consistently correlate with citizen respcmse to the previous McGruff ads were interest in and discussion about prevention (tabie 4.30).
Overall Campaign Impact on Crime and Drug Abuse Prevention
To simplify the analysis of the range of crime and drug abuse prevention responses to tile Take a Bite Out of Crime PSA's overall, regression analysis was used. Each measure was specified as a dependent variable, with the demographics included as independent measures. This approach allowed inferences to be made about relationships between each demographic variable and each response measure, controlling for the impact of other demographics. Regression analysis was used in this case only as a useful, albeit somewhat imprecise, descriptive device and not as a predictive modeling tool.
Citizens who found the McGruff PSA's more effective in making them personally more aware of crime prevention techniques were more likely to be female, black, lower income, and less educated (table 4.31). Women were also particularly more likely to view the PSA's as more effective in informing children. Women also reported gaining more confidence from the PSA's. Blacks, women, and lower income persons were more likely to say McGruff made them more concerned about crime, and they also gained an increased sense of responsibility for helping to protect themselves and others.
As for drug abuse prevention, women, the less educated, and lower income persons again wer.e likelier to call the McGruff PSA's effective in raising their personal awareness and concern (table 4.32). Black respondents were more likely to indicate having an increased concern and sense of responsibility. Women were more apt to view the ads as effective in
increasing awareness of children as well as other adults.
Generally, per$ons who saw property or violent crime as more likely to happen to them, and who worried more about it, regarded the McGruff PSA's as more effective in promoting both crime prevention (table 4.33) and drug abuse prevention (table 4.34). Effectiveness of McGruff was not systematically tied to specific kinds of crime problems reported in neighborhoods, except for the selling of drugs (tables 4.35 and 4.36). The PSA's were seen as somewhat less effective on children and other adults in neighborhoods with violent crime involving children and with car theft.
Interest in crime prevention and a belief that citizen prevention efforts were useful correlated quite positively with all measures of PSA effectiveness for both crime and drug abuse prevention (tables 4.37 and 4.38). Crime prevention leadership and discussion about crime also showed correlations.
Allied McGruff Campaign Activities and Materials
About one-fourth of respondents indicated having direct contact with local events, activities, and materials allied with the Take a Bite Out of Crime campaign. As might be expec+qd, these citizens also reported greater exposure ;0 I ie McGruff PSA's (table 4.39).
A closer look at citizen contact with these other activities and materials is useful at this point. From 21 percent to 23 percent recalled having seen McGruff-related print materials, novelties, and toys or shopping mall-type displays, or they recalled attending talks or lectures featuring McGruff materials (table 4.40). Actual appearances by McGruff in costume were noted by 18 percent of citizens. Recall of these activities and materials decrea.sed proportionately with age, with many respondents likely having been involved with them as schoolchildren. It's rather striking that more than 40 percent of people in the 18-24 age group had such exposure. On the other hand, this exposure dropped to single-digit numbers among elderly persons.
Interestingly, gender differences were not found, suggesting, perhaps, that schooi participation accounted for much of the exposure. Black citizens
had substantially greater exposure, as did citizens with children in the home. Lower income and less educated individuals had greater recall. Urban areas appeared to have only slightly greater exposure to McGruff materials and appearances suggesting a healthy geographic dispersion.
Conclusions
Public awareness of McGruff obviously has reached substantial levels. The 80 percent recail, while considerable, may have been even larger if researchers could have given visual cues to respondents. It is also noteworthy that the Phase XV PSA's were recognized by nearly one-half of the sample after only a few months' play. AIf1!.)ugh the situations are not directly comparable, it took 2 years tor the initial Take a Bite Out of Crime ads to reach half the adult populace. The more graphic nature of the We Prevent materials may well have contributed to their accelerated awareness levels. Recognition of the NCCPMC PSA's is, as expected, tied to more localized McGruff-related activities and materials, which have reached substantial contact levels among younger adults.
Citizen reactions to the We Prevent messages, as well as to other recently shown NCCPMC messages, strongly suggest continuing public interest in the series, with almost surprisingly little sign of attention decay or public boredom. The PSA's still appeal to the public, with a majority of the audience able to mention specific things they liked about them. Although the Phase XV ads drew more negative responses than did the previous McGruff-emphasized PSA's, only 11 percent could identify something they disliked about them. Criticisms of the materials overall still center-as they did in 1981-on the appropriateness of the dog character and on a lack of realism.
Citizen reports of the McGruff PSA's effects on them were quite stable compared with those of 1981. Similar proportions of respondents indicated having learned from the ads (roughly one-fourth), having attitudes about crime prevention bolstered (around one-half), and having taken actions recommended by them (about one-fifth). To the extent that such selfreports can be taken as valid indicators of the campaign's impact, these numbers are not trivial when generalized to the U.S. population, even if a SOCial desirability fudge factor is allowed.
33
The question remains whether one should expect lesser or greater perceived effectiveness after so ma .... 'lY years. One argument maintains that these percentages should increase over the years if leaming or other effects are cumulative. On the other hand, longterm campaigns of any sort are typically expected to have a fatigue syndrome through which their effectiveness dwindles given repetition and increasing audience apathy. One problem in assessing what the expected results should be over time is a lack of both (a) implicit baseline criteria for spelling out what kinds of change and how much is expected over given time periods, and (b) reasonable goals for specific kinds of change for each phase of the campaign.
More than three-fourths of the public also viewed the McGruff PSA's as effectively promoting crime prevention to other adults and especially to children. Similar findings were obtained for the ads' effectiveness in drug abuse prevention. These results suggest that the
tperiodic emphasis on drug-related issues has been accepted by the public but apparently not to the detriment of the more traditional crime prevention themes. Such mixing of message topics can sometimes risk confusing audiences about what the main themes of a campaign actually are, watering down its effectiveness. That clearly does not appear to have been the case here.
Continuing the trend from 1981, McGruff is far better known by younger adults, and his familiarity drops substantially among citizens age 65 and over. People in their 20's probably had more opportunity to "grow up with" McGruff, and those in their 30's and 40's are more apt to have school-aged children. Exposure to McGruff is somewhat less among lower and upper income groups than for middle income groups, although controlling for age ameliorates this finding to a degree. One would prefer to see greater awareness especially among the lower income, more crime-prone population. These findings hold quite consistently for Phase XV as well. Both vintage McGruff and the We
34
Prevent PSA's appear to be known somewhat more widely among black adults than white, regardless of income levels.
The We Prevent PSA's appear to have had the most impact on the target audience of caretakers of children. Adults with children in the home were more attentive to the ads, said they found them more helpful in learning how to better protect children, and were more prompted to take preventive actions. Women, regardless of whether they themselves had children, reported similar effects, as did lower income persons. Black adults were markedly more attentive to the Phase XV series, reported greater attitude change, and were more inclined to act. The audiences most receptive to the We Prevent messages were S:ciu those indicating more neighborhood problemsinvolving children or teens. The previous McGruff ads had impact over a somewhat broader audience base, as one might expect.
The lack of demographic differences in information gain does not appear to support the classic "knOWledge gap" hypothesis, although further comparative analyses are needed to tease this out more fully. As was found in 1981, behavioral and attitudinal change seem to occur in some groups without information gain, providing additional evidence that "hierarchical" change models of persuasion may not be all that predictive in cases such as these.
Public assessment of the overall effectiveness of the McGruff PSA's suggests they were having relatively more impact among women, the less educated, and lower income persons. This finding holds for perceptions of the ads' effectiveness in promoting both crime and drug abuse prevention. Blacks were mom inclined than whites to rate the PSA's as effective in making them more aware of crime prevention techniques and were more apt to feel more responsible for protecting themselves and others.
eM .1
SECTION 5: USE OF AND REACTIONS
TO THE CAMPAIGN BY THE MEDIA
Decisions about which public service advertisements will be placed in commercial media are made by managers often referred to as public service or public affairs directors, community relations managers, or similar titles. These individuals serve as gatekeepers for PSA's, deciding which ads will be disseminated at all and when and where they will be placed in the daily, weekly, or monthly media mix. In larger media organizations or chains, these persons may have considerable executive authority over public information and public relations decisions more generally. In the smallest companies a publisher, advertising director, or managing editor may allocate PSA placement.
A sample of 163 of these managers was interviewed to determine their perceptions of and reactions to the NCCPMC. They were chosen out of the same 100 national sampling points as the citizen respondents to generalize to some degree. The sample was selected to represent all such managers nationally, although it is not a strict probability sample. Rather, respondents were chosen to act more as local informants regarding the campaign and crime prevention issues in their communities, and to provide in greater detail an assessment of how at least certain media personnel view the McGruff PSA's. Included were local television and radio station and newspaper executives responsible for selection of PSA's to be aired or published. Excluded here are other influential gatekeepers of McGruff, including decisionmakers from the broadcast networks, outdoor advertising companies, and transit organizations.
How Media Gatekeepers View the National Citizens' Crime Prevention Campaign
The media informants were questioned about their respective organizations' uses of the McGruff PSA media campaign, their views as to its local impact, and other more general issues related to crime preventior. and the media.
Overall Use of the McGruff PSA's
Ninety'-five percent of the media managers reported being aware of the McGrufl' ?SA campaign, including 80 percent who said they were ''fully aware" of it (14 percent reported being "somewhat aware," 1 percent were "barely aware," and 4 percent were "not at all aware").
One-third of the media organizations (32 percent) had run a McGruff PSA during the previous 6 months (30 percent reported they had not, with the remainder being uncertain). Three-fifths of the managers (59 percent) reported that their organizations had used a McGruff PSA during the previous 12 months (28 percent reported they ha.d not, with the remainder uncertain). Another 9 percent said their organization had used McGruff PSA's at some time previously. In total, 68 percent of the organizations reported using McGruff PSA's at some point. Of those who had ever used McGruff PSA's, 35 percent had started using them 10 or more years previously.
For those organizations that had used a McGrutf PSA in the previous year, the median number of times one was used was 50, with a mean of 124. (The mean can be seen as inflated due to a relatively small number of media that used the PSA's a very large number of times, the greatest being a radio station in the Seattle/ Tacoma area that reportedly ran the McGruff PSA's more than 1,000 times.)
Reasons for Not Using McGruff. Those two-fifths of media informants whose organizations had not (or were not certain if they had) run a McGruff PSA during the previous 12 months were asked a list of possible reasons why they had not (table 5.1).
The most cited reasons included the following:
• McGruff did not suit their format (37 percent).
• They hadn't received McGruff materials (34 percent).
35
• The PSA's were more appropriate for other media types (22 percent).
• The ads did not suit their audience (17 percent).
• They used only local PSA's (17 percent).
• They believed the McGruff ads would not be effective in their local communities (15 percent).
• Miscellaneous administrative problems (11 percent).
There is little indication of any trend here suggesting serious flaws in the spots themselves. Rather, the majority of media appear to choose not to use the McGruff PSA's for individual institutional or community audience-specific reasons. Although the Advertising Council reports sending PSA's to all appropriate media, one-third of the gatekeepers had no recollection of receiving them, a considerable number when extrapolated across the country. Materials may have been sent to the wrong person, or the turnover rate among such managers may be so high that many have not been in the position long enough to recall the ads.
Only 17 percent of the organizations reported that their running of McGruff had decreased during the previous 12 months, with 10 percent reporting an increase, and the remainder estimating the same amount of usage as in previous years. Reasons given for an increased use of McGruff were quite idiosyncratic, including the following: local crime was becoming a larger problem, more available space, the executive personally liked the new ads, and a new corporate policy required it. Those organizations that had decreased use of McGruff in the past year said it was largely because they had not received any new ads. Additional reasons mentioned more than once included a higher priority placed on local ads and increased competition for available space from other issues.
One-fourth of the media gatekeepers (27 percent) that had used McGruff in the past year indicated that their organizations had not done so in the previous 6 months. The most frequent reason given was that they had not received any in the past 6 months. Other explanations included: (a) they are now uSing We Prevent ads instead (a point clarified later in the interviews but noteworthy here), (b) the ads do not meet local priorities, (c) other issues are in competition for space, and (d) they have new space restrictions.
36
We Prevent. In response to specific questions about the We Prevent PSA's, one-third of the gatekeepers (34 percent) recalled having seen or heard at least one. During the previous 6 months, 20 percent of the organizations reported having run a We Prevent PSA. Of these, the median number run was 30, with a mean of 73. The primary reasons given for not having run a We Prevent PSA were that they were not local and that they had not received any.
Newspaper executives were asked if their organizations had used a new monthly column on crime prevention distributed nationwide by the National Citizens' Crime Prevention Campaign and featuring McGruff. None recalled this column being used in their newspapers; however, such materials traditionally have much larger play at weekly or community newspapers, which were not sampled here.
Law Enforcement Cooperation. Of those 95 percent of managers aware of the McGruff campaign, 37 percent reported that, during the previous 12 months, their organizations had worked with at least one local law enforcement agency ''to help get McGruff PSA's placed, or in other promotional efforts involving McGruff." Of these, one-fourth had worked with their local police or sheriff's departments ''frequently'' or ''very frequently." Executives at organizations that had not worked with any local law enforcement agency in the past year were very likely to explain that their organizations had never been asked by the local police or sheriff'S department to participate in a joint venture.
Perceptions of Communitywide Campaign Dissemination
Total exposure for media managers to McGruff PSA's in their own local areas during the previous 12 months consisted primarily of televised spots (71 percent), followed by radio (49 percent), posters, billboards, magazines, and newspapers (apprOXimately 40 percent each), and public transit posters (22 percent) (table 5.2). Television had by far the greatest frequency of reported exposure, although it is not known whether this is due to greater actual frequency or greater recall of televised ads or both.
A majority of executives (52 percent) thought that about the same number of McGruff PSA's were running in their markets as in previous years, but
one-fourth (24 percent) thought there had been a decrease, and only 4 percent reported an increase. Interestingly, 19 percent thought that media in their own markets were running fewer McGruff PSA's than media in other markets across the country, and hardly any (4 percent) thought more were being run in their own markets (36 percent said "about the same," and the remainder were uncertain).
Perceptions of the McGruff PSA Media Campaign and Its Impact :i:l:l:~l:~l:~t:~:~:~:1:1:j:~:~j:~i:~~~i:~~~i:i:l:i:i:3i:~i:l:~~:3[:i:~3fu~:~i:j:~l:j:j:j:l:j~:j:~i:l:i:~~:j:3~~~~3i:l:~~t:~~:~j:31:j:~~j~:::j:j:j:~33j:j:j:~j:l~:j:j:j:j:j:j:~~~:i:j:j:::j:j:j:j:~~:~l
We Prevent PSA's were rated quite highly compared with other PSA's the media informants had recently seen or heard. Each gatekeeper aware of the We Prevent ads was given a list of 1 0 attributes of PSA's and asked to rate We Prevent on a five-point scale, where 1 was "rates far below average," 3 was "rates about equally," and 5 was ''far above average." The vast majority of executives rated We Prevent PSA's as well above average on each attribute (table 5.3). On no attribute did more than 10 percent of the executives rate the ads as below average. Importance to the local community, audio quality, and overall production quality were the three highest rated factors, with length/space options, overall viewing appeal, and appropriateness for the organization's audience rated slightly lower than the other factors.
The 95 percent of managers who were aware of the McGruff campaign were asked to rate the NCCPMC PSA's other than We Prevent that they had heard or seen over the years on the same list of attributes (table 5.4). These ratings were slightly lower than those for We Prevent, but were consistently skewed towards "above average" on each of the 10 factors. Importance to the local community, overall production quality, and audio quality again were the three highest ratpd attributes. Length/space options, overall viewing appeal, and appropriateness for the organization's audience again were rated slightly lower than the other factors.
A near majority of executives (44 percent) regarded the McGruff PSA's "exclusively concerned" with crime prevention. One-third described them as being concerned equally with the prevention of crime and drug abuse, and another 23 percent said that although they were mai:1ly concerned with crime prevention, they also addressed drug abuse prevention. Thus, a
majority (56 percent) viewed them as including at least something of a mixed crime and drug abuse prevention focus.
Perceived Effectiveness of the PSA's. Two-thirds of the gatekeepers (65 percent) thought the McGruff PSA's ~o be helpful to their local law enforcement agencies in dealing with crime prevention needs, and more than one-half (55 percent) said that they were helpful in local drug abuse prevention efforts (table 5.5). A majority of the executives also thought the McGruff PSA's were effective in building crime prevention awareness among adults (64 percent) and, especially, among children (86 percent) (table 5.6). Fewer saw the ads as effective in the case of drug abuse prevention.
When asked to rate the level of awareness of the McGruff PSA's among their local citizenry, one-half of the informants thought that "most" (41 percent) or "nearly all" (12 percent) of the public was aware of the campaign. Another 35 percent said that "some" local citizens were aware, with 8 percent and 5 percent of executives saying "only a few" or ''very few, if any."
Executives' perceptions of public opinion about the McGruff PSA media campaign within their primary market were very much skewed toward the positive. Nearly one-fourth (23 percent) viewed their local citizenry as ''very positive," 34 percent said "somewhat positive," 25 percent saw it as "neutral or mixed," and the remaining 17 percent were uncertain. No one responded that local opinion toward the campaign was negative.
Those gatekeepers who perceived local public opinion towards the McGruff PSA's as less than positive (i.e., neutral or mixed) primarily attributed this to the following: (a) that they rarely, if ever, heard any local discussion about the campaign; (b) that there was little local exposure of the campaign; and (c) that the campaign was no longer perceived as being effective by locals or that some locals did not take the cartoon dog character seriously.
When asked what were the main advantages of the McGruff PSA's in helping to prevent crime in their local areas, nearly all executives who voiced an opinion commented that it increased awareness about crime prevention and that it was especially effective in reaching children with its message.
37
4A
Interestingly, what was seen as one of its primary strengths-its appeal to children-was also named as its major disadvantage or limitation, and sometimes by the same executive. That is, some of the media executives perceived adults and even older teens as not interested in the ads because of the cartoon character. Of note, about one-third of the executives said the campaign had no major limitations or disadvantages.
Many media managers made suggestions about what could be done to improve the McGruff PSA's to make it more likely that their organizations would disseminate them, although several said there was no problem that needed improvement. By far, the most frequent suggestion was to improve the dissemination system for the ads so that they would receive them in the first place and/or get them more regularly. This suggestion was frequently followed by the suggestion that a "more local" focus or tone be incorporated.
Media Response to Other AntiCrime Programs Versus McGruff PSA's
Compared with the two-thirds of media organizations that had used McGruff PSA's since the inception of the program, a slightly higher proportion (75 percent) had participated in the Partnership for a Drug-Free America prevention campaign, which deals only with drug abuse, as opposed to McGruff's broader focus. Of those media that had used McGruff, 83 percent had also used the Partnership for a Drug-Free America. Of those media that had never used McGruft, 54 percent had used the Partnership for a Drug-Free America. The gatekeepers perceived the Partnership for a Drug-Free America ads to be more helpful than McGruff to local agencies in dealing with drug abuse prevention (table 5.6). Three-fourths (76 percent) said the Partnership for a Drug-Free America was helpful, versus 65 percent for McGruff.
One-half of the media organizations (50 percent) reported participating in a Crime Stoppers program, compared with a two-thirds participation rate with McGruff PSA's. (Crime Stoppers projects are locally (versus nationally) organized and are typically part of news or public affairs programs. Crimes are recreated with emphasis on asking audience members to provide information to help solve them or to lead to
38
arrests of perpetrators.) Of the organizations that had used McGruff, 51 percent had also done Crime Stoppers. Of those media that had never used McGruff, 46 percent had done Crime Stoppers. The informants from media that had participated in Crime Stoppers were more positive about the helpfulness of Crime Stoppers to local law enforcement agencies' overall crime prevention efforts than they were about the helpfulness of the McGruff PSA's (table 5.6), with 94 percent saying Crime Stoppers was helpful, versus 65 percent for McGrutf.
Of additional note, 28 percent of the media organizations were reported to have used McGruff PSA's, the Partnership for a Drug-Free America, and Crime Stoppers. Executives at these media perceived Crime Stoppers to be somewhat more helpful to local law enforcement agencies' crime prevention efforts than McGruff PSA's and perceived the Partnership for a Drug-Free America to be somewhat more helpful to local law enforcement agencies' drug abuse prevention efforts than McGruff PSA's.
Other Issues Related to Local Crime and Drug Abuse Prevention
To provide a broader context within which the specific findings about the media's use of and reactions to the McGruff PSA's campaign can be understood, information was gathered from these managers about the use of various types of PSA's by their organizations and other media within their primary market area.
As shown in tables 5.7 and 5.8, these informants report that media appear to have given the relatively highest priority to the public services issues of drug abuse prevention and AIDS awareness, and the relatively lowest priorities to consumer protection and traffic safety. The priority given to crime prevention PSA's was low to moderate relative to other issues. Seventeen percent of the managers identified drug abuse as the public service issue· that had been given priority by their organization in the previous 12 months. Nine percent identified crime prevention as their organizations' PSA priority. Drug abuse was identified by 13 percent of the executives as the issue that had been given priority by other media in their primary market, but 11 percent said it was crime pre'vention in their market. Obviously, such rankings valry
---------------------------------------------------~-----
with the public agenda for issues over time, from market to market, and likely from medium to medium.
Drug Abuse Prevention Efforts. Nearly one-half of the gatekeepers (47 percent) thought their organizations had done more than most other media in their local areas with respect to drug abuse public service activity. However, 52 percent said they had done about the same amount of activity and 2 percent said "less." About one-fourth of the executives {28 percent) thought their organization had done more crime reduction public service activities than other media in their primary market. Meanwhile, 66 percent thought they had done about the same as other media and 5 percent thought it had been less.
Four-fifths of the media organizations (80 percent) have engaged in "activities over the past 2 years dealing specifically with drug abuse prevention in [their] primary market areas." The most frequently mentioned kinds of activities involved increasing the amount and type of news coverage on the problems of drug abuse and its prevention, including special news features or programming. Many also reported working in partnership with local agencies and programs, such as Drug Abuse Resistance Education (DARE), Students Against Drunk Driving (SADD), and Mothers Against Drunk Driving (MADD), or helping to sponsor fund-raisers (dances, golf tournaments, basketball games) and hosting talk shows on the topic. About one-half of these activities were done in cooperation with local law enforcement agencies or other local organizations, such as health departments, hospitals, schools, business groups, churches, and other community services organizations.
Crime Prevention Efforts. Three-fifths of the media organizations (61 percent) had reportedly engaged in "activities over the past 2 years aimed at reduction of crime, other than drug abuse, in [their] primary market area." The most frequently mentioned of these was participation in a local Crime Stoppers program. Other examples included prevention campaigns aimed at specific types of crimes, e.g., rape, burglary, arson, and family abuse. A few mentioned working to encourage the public's use of a new local 911 system. As in their involvement in local drug abuse prevention efforts, media involvement in other crime prevention activities was in cooperation with local law enforcement agencies and other local service agencies and groupls.
When asked to assess the quality of the job being done by local law ehforcement agencies in the market to ',[promote] crime prevention awareness among citizens," 10 percent thought it wa.s excellent, 55 percent said it was a good job, 32 percent said a fair job, and 3 percent thought it a poor job. Those executives who gave an excellent rating attributed it to their low rate of crime, a proactive approach taken by the police, and a cooperative and comprehensive approach, which often included targeting the schools. Those who gave a poor rating said there was neither an effort nor a willingness of law enforcement to promote awareness.
Law Enforcement Cooperation. In characterizing the relationship between the media in their primary market areas and the specific law enforcement agency that was interviewed as part of the crime prevention practitioners survey, 42 percent of the media managers characterized the relationship as "highly cooperative," 36 percent thought it was "somewhat cooperative," and only 5 percent described it as basically not cooperative. An additional 6 percent of informants said there was "no" relationship between the law enforcement agency and the media, and the remaining 9 percent were uncertain about the relationship. (Of note, there was no correlation between the executives' perception of the level of cooperation between the specific local law enforcement agency and the local media and the crime prevention practitioners' assessment of the level of cooperation.)
Those managers who had described the relationship between local law enforcement and the local media as "highly cooperative" were most likely to attribute it to the very good "communication" between the department and the media. When the law enforcement agency and the local media were perceived as not cooperating to promote crime prevention awareness among the public, most executives attributed the lack of cooperation to the ''traditional adversarial relationship" that has existed between the media and the police in many municipalities.
Type of Media and the MeG ruff PSA Campaign
As noted above, these interviews were conducted with managers at three types of media: television stations, radio stations, and daily newspapers. This
39
purposive stratification allowed for a comparison of reactions to the McGruff PSA campaign for the three types of media. Researchers compared responses among the three groups across a range of campaignrelated measures, controlling (by analysis of covariance) for the potentially intervening factors of the gender, educational attainment, and years of employment in current position of the managers; the size of the media organization; whether or not the organization had been recently contacted by the Advertising Council or the National Crime Prevention Council; and the 1990 crime rate for the local area.
Media organizations proved to be quite similar in most respects in treatment and responses to the NCCPMC (table 5.9). However, the following statistically significant differences were found:
II Television station gatekeepers reported the greatest awareness of the McGruff PSA campaign, followed by those at radio stations, with newspaper executives reporting the lowest.
II Consistent with the previous finding, television stations reportedly were most likely to have used a McGruff PSA, followed by radio stations and daily newspapers.
iii Furthermore, newspapers were less likely than radio stations, who were in turn less likely than television stations, to have used a McGruff PSA in the previous 12 months.
II However, radio stations had, on average, run more McGruff ads in the past year, compared to television and daily newspapers.
III On average, television stations had been using McGruff PSA's the greatest number of years, compared to newspapers and radio stations. (The findings for radio stations may reflect the relatively short life spans of many radio stations.)
III Executives at radio stations were more positive in their assessment of the effectiveness of the McGruff PSA campaign in building awareness about crime prevention and drug abuse prevention among adults and children than were executives at television stations, who in turn were more positive than those at daily newspapers.
II Finally, radio station executives rated public opinion in their primary market area as more positive toward the McGruff PSA's than did television station executives, who again were more positive than those at daily newspapers.
40
In sum, where differences were found among the media types, broadcast media were consistently more likely to use the McGruff PSA's and were conSistently more positive in their assessments of the campaign than were daily newspapers. Furthermore, although more television stations have used the McGruff PSA's, and for a longer period of time, radio stations appear to run the greatest average number of McGruff PSA's within a given time period.
Other Factors Related to Campaign Use and Reactions by the Media
To more fully explore differences in gatekeeper views concerning the McGruff campaign, a wide range of factors were compared against McGruff-related measures. These included three types of independent variables potentially impinging upon gatekeeper views: (1) census and other community context variables, (2) media organization measures, and (3) demographic measures of the survey respondents. These analyses were exploratory, with no formal hypotheses. Rather, the intent was to seek relationships that might provide greater context and meaning for media gatekeeper decisionmaking. Specific measures included the following:
II Local area contextual factors from the 1990 Census and other sources (median value of the owneroccupied housing units, percentage of housing units that were owner occupied, percentage of the population that was black, percentage of the population underthe age of 18, and an average rate of Part I crimes per 100,000 population for 1988-90).
• Characteristics of the media organization as reported by the managers (the number of full-time employees, the size of its audience, the pOlitical orientation of its editorials on a conservative-to-liberal continuum, whether the organization participates in the Partnership for a Drug-Free America, whether the organization participates in Crime Stoppers, whether the organization had recently been contacted by the Advertising Council or the National Crime Prevention Council regarding the McGruff campaign).
• Personal characteristics of the executives (the number 01 years having worked in the field, gender, educational attainment).
Type of organization was controlled for as well. Overall, most of these independent variables were not
significantly related to the various McGruff campaign usage and opinion measures (lable 5.10). However, some of the more salient relationships that were found included the following:
• Managers who had worked longer in their lines of employment perceived the media in their primary markets as giving crimE" prevention PSA's a relatively lower priority than otn'dr types of PSA's during the previous 12 months.
• Not surprisingly, the longer gatekeepers had worked in this line of employment, the more fully aware they were of the McGruff PSA campaign; moreover, those who had worked in this field the longest reported their organizations had been running McGruff PSA's the greatest number of years.
• Media that had participated in Crime Stoppers were most likely to have engaged in other activities dealing with the reduction of crime during the past 2 years.
• Managers at media that had participated in Crime Stoppers gave higher ratings to the job that the local law enforcement agency is doing to promote crime prevention awareness among the citizenry.
• Organizations that had partiCipated in the Partnership for a Drug-Free America, and those that were located in areas with homes of relatively low median value, were most likely to have engaged in activities dealing with drug abuse prevention during the past 2 years.
• More positive ratings of cooperation between local law enforcement agencies and local media to promote citizen crime prevention awareness were associated with a relatively high black population, a relatively high rate of owner-occupied homes, participation in Crime Stoppers, and conservative stances in their editorials.
• Organizations in areas with relatively low median housing values reportedly had wor'r<ed the most frequently with local law enforcement for placement of McGruff PSA's or in other McGruff-related promotional efforts during the previous 12 months.
• Media executives in areas with a relatively low percentage of owner-occupied housing and who had recently been contacted by the Advertising Council or the National Crime Prevention Council were most likely to have seen or heard of the We Prevent PSA's.
• Participants in the Partnership for a Drug-Free America were more likely to have run a McGruff PSA
other than We Prevent; nonparticipants were more likely to have run more We Prevent PSA's. Nonparticipants in Crime Stoppers were also more likely to have run We Prevent PSA's.
• Participation in the PartnershIp for a Drug-Free America was associated with more positive views by managers who tllought McGruff did the following: (a) made people more aware of crime and drug abuse prevention, (b) helped in aiding prevention efforts, and (c) was well received by the public.
II The helpfulness of the McGruff PSA's in aiding local crime and drug abuse prevention efforts, and in building awareness, was rated most highly by media managers ill areas with a relatively low percentage of the population who are under 18 years of age, and who have partiCipated in the Partnership for a DrugFree America.
• Higher proportions of owner-occupied housing showed correlation with greater awareness of McGruff, use of McGruff, and more favorable ratings of the PSA's.
Cross-Validation of CommunityLevel Campaign Measures
An attempt was made to construct a somewhat novel index of estimates of actual media dissemination of NCCPMC materials into each community examined. These community-level measures could then be correlated with other community data (e.g., crime and census data) to build inferences about what kinds of communities might be more likely, or less so, to disseminate campaign materials. This index would to some degree alleviate the common problem in this kind of research of relying only on respondent reports of exposure to campaign materials, rather than actual dissemination by the media. This problem is espeCially acute in examining PSA's because it is extremely difficult to track when and where messages are being shown.
The plan called for relying in part on data provided by the National Crime Prevention Council and the Advertising Council, which tracked actual airing of McGruff spots on television stations in the larger market areas. It also called for combining those data with assessments of the media managers and crime prevention practitioners in each community to '1riangulate" estimates of gross McGruff campaign dissemination.
41
• Researchers would then attempt to divide communities into broad dissemination categories on the order of "low" to "moderate" to "high."
Executing the plan became problematic almost from the outset. The Advertising Council very helpfully provided their television station tracking data for approximately 6 months preceding the sampie interviews. There were two sets of data from two competing spot advertisement tracking services, Broadcast Advertising Report (BAR) and Broadcast Data System (BOS), which use computers to monitor all channels in particular market areas and then, through scan marl'Cs on the spots, identify where and when the spots ran. For a fee, both services provide convenient summaries of data from particular spots by market area. The NCCPMC spots were among the first PSA's to be measured by this system.
Unfortunately, apparently due to differences in measurement techniques, researchers found little overlap between the two services in their reports of the McGruff spots. Without basic concurrent validation of the television spots on a market or community level, it obviously becomes more difficult to relate even less reliable personal estimates of dissemination rates. Nonetheless, several efforts were made, with the results being largely spurious correlations among the various indicators. (This discussion is not intended to criticize the BAR or BOS services-that is clearly beyond the scope of this report. Each system may serve the purposes of its users quite adequately. The difficulty lies in applying such daia in a combined form to assess relative frequency of PSA's shown across communities.)
Finally, an effort was made to combine the BAR and BDS data and all estimates at the community level for media managers, crime prevention practitioners, and citizens. Communities were split into a "higher" concentration group (n=33), a "lower" group (n=12), and a group that belonged to neither. Reliabilities for this dimension were still quite low. At any rate, researchers failed to find any meaningful crime statistics or census characteristics that discriminated between the "lower" and "higher" dissemination communities.
The exercise points again to the difficulties of measuring media stimuli that are disseminated with relatively little central control, i.e., with dependence on donated time and space. Experience teaches that even extensive and cost-prohibitive large-scale audits of
42
community media may yield data with unacceptable error rates.
Conclusions
As expected, nearly all mass media gatekeepers for PSA's were aware of the NCCPMC ads and, for the most part, were quite familiar with them. More than one-half had run a McGruff PSA during the previous year, and one-third had done so within the past 6 months. However, only 20 percent had run a Phase XV We Prevent PSA.
One-third said they had not run McGruff materials because they had not received any recently. Several stations reported running fewer McGruff PSA's than before because they had not received any new ones. When asked how the PSA's could be improved, the most mentioned suggestion was to improve the frequency and regularity of their distribution. (Gatekeepers may not always be aware of the purposive targeting of certain PSA's-that some may not be received by all stations so that certain kinds of audience groups can be targeted, and at a productive cost saving.)
Most other reasons for not using the PSA's centered on lack of appropriateness of the PSA's for a given format or audience and not on the quality of the messages. Lack of local emphasis was another reason given for not running the We Prevent series.
Media managers consistently rated the McGruff PSA's as above average on several production characteristics, and especially high on local community relevance production and audio quality. Those familiar with Phase XV PSA's rated them as even slightly higher than previous NCCPMC efforts. The majority viewed NCCPMC PSA's overall as being helpful to law enforcement agencies in terms of both crime and drug abuse prevention and in informing citizensparticularly children-about prevention. Most also thought local public opinion about the campaign was positive.
The main assets of PSA's were seen as increasing public awareness, and especially that of children. However, some managers thought the McGruff character focused on children at the risk of turning off adults and older teens. Suggestions for improvement included better distribution and more local focus.
Media organizations' involvement with Partnership for a Drug-Free America was slightly greater than with McGruff, but those using one campaign were quite likely to use the other as well. Involvement with Crime Stoppers was slightly lower than for McGruff, with again a high degree of overlap. We Prevent PSA's were more likely to have been run by media not involved with either the Partnership for a Drug-Free America or Crime Stoppers. Gatekeepers generally gave higher marks to the Partnership for a Drug-Free America than to McGruff on promoting drug abuse prevention, and they rated Crime Stoppers as more helpful than McGruff in crime prevention. These findings are in keeping with the more specific goals of the other two programs.
Drug abuse and AIDS shared the highest priority on the media managers' public service agenda, with crime being more toward the middle of the list. How~ ever, high involvement with both issues was found, with 80 percent reporting specific drug abuse prevention activities and 61 percent indicating crime pre'>'ention activities, often in cooperation with local police or sheriff's offices. Encouragingly, over one-third of the media organizations reported having
worked with local law enforcement agencies on McGruff promotions. However, the main reason given by those who had not done so was that they had never been approached by the agencies. Gatekeepers' reviews of the performance of local law enforcement agencies were mixed, with over one-third rating them as only fair jn crime prevention promotion efforts.
Television stations represented the medium most likely to have used McGruff PSA's; newspapers were least likely. Radio stations ran them more frequently, and radio managers were more positive about the impact of the spots.
Media organizations' usage of McGruff PSA's appears to be best viewed as complementary, and not in competition, with their participation in other anti-crime prevention efforts such as the Partnership foi' a DrugFree America and Crime Stoppers. Furthermore, media in areas with relatively fewer renters (e.g., suburbs and somewhat rural communities) appear to operate in an environment that is more favorable to the use of McGruff and has a more positive opinion of the campaign.
43
tt
SECTION 6: USE OF THE MEDIA
CAMPAIGN IN LOCAL CRIME
PREVENTION EFFORTS
This section addresses how and to what extent the NCCPMC has been utilized in local jurisdictional crime prevention efforts. Previous data suggest positive responses to the campaign among crime prevention practitioners and media gatekeepers. However, previous work has focused on either (a) the campaign as a whole (as viewed by crime prevention practitioners) or (b) the PSA's as viewed by media specialists. This study more clearly examines the integration of these two aspects; for example, what does the media component contribute to community crime prevention efforts?
It is also critical to idp,ntify variations in use of the media campaign in different communities. This use is referred to here specifically as the following: (1) the extent to which media campaign-related materials, messages, and themes have been emphasized in local crime prevention programs; (2) the extent to which the PSA's have been disseminated through local media channels; and (3) the degree of integration locally between the media campaign and the numerous other components of the overall Take a Bite Out of Crime campaign effort.
It should be noted that an important function of media information campaigns can be to promote awareness of and mobilize support for issues among media professionals and community leaders, regardless of direct impact of the messages on the public; at large. Therefore, our strategy was to do the following:
II Assess crime prevention practitioner views on uses and effectiveness of the campaign.
II Assess local media gatekeepers' views on uses and effectiveness of the campaign.
• Determine the extent of variation in such utilization across jurisdictions.
• Describe the types of community-level factors associated with variation in utilization (e.g., law enforcement organizational structure, crime rates, community geographic and demographic structure, media structure).
In sum, how does the dissemination of McGruff PSA's vary across communities? How are the PSA's tied to community crime prevention efforts? What differences in those ties occur across the country? To what can those differences be attributed?
This section examines these issues from the perspective of community-level crime prevention agencies and practitioners.
How Crime Prevention Practitioners View the Campaign
Researchers assessed the advantages and disadvantages of the media campaign from the point of view of 118 community crime prevention practitioners through personal interviews. One hundred of these were the ranking crime prevention officers in the communities from which the citizen sample was drawn.
Overall Use of National Citizens' Crime Prevention Campaign Materials
All but two of the practitioners interviewed said they were familiar with the overall National Citizens' Crime Prevention Campaign, and 76 percent indicated they had used McGruff materials in their local crime prevention activities or programs. Fifty-two percent said they received at least some of the materials without charge.
Of those not using MeG ruff materials, lack 01! funds was the most often cited reason (28 percent)l, along with preferred use of other programs, whethf.lr selfdeveloped or from other sources (28 percent)'. Another reason cited was lack of personnel (16 percent). Nearly two-thirds of these non-users said the~f had considered adopting McGruff-related programs.
One-third of McGruff users said they were not spending any of their own crime prevention budgets on
45
fir
McGruff materials, and another 29 percent CQuid not say how much they expended. Estimates of amounts spent on the materials by the remaining agencies varied considerably, with most being less than 10 percent but a few reporting more than one-half of their crime prevention budgets expended on the materials. Most agreed they should be spending more on the materials, with the modal response at 10 percent more, but with at least a few indicating they should be spending 50 percent more than currently.
Activities the McGruff materials were used for included the following:
• Public information, such as distribution of pamphlets or booklets at malls or public events (92 percent of users, with 44 percent indicating frequent use). ~
• Public appearances in costume at paradeJ or fairs (82 percent of users; 40 percent of frequent users).
• Elementary school visits (79 percent of users; 45 percent of frequent users).
II School-based puppet programs (64 percent of users; 34 percent of frequent users).
• High sl~hool visits at assemblies or athletic events (53 percent of users; 11 percent of frequent users).
Value of National CItizens' Crime Prevention Campaign Materials. Tile practitioners interviewed generally placed high value on the National Citizens' Crime Prevention Campaign materials. Nineteen percent of users labelled them as essential, 50 percent said valuable, and 22 percent somewhat valuable (table 6.1). Ninety-five percent termed the materials at least somewhat helpful in their overall crime prevention efforts, with 39 percent calling them very helpful (table 6.2). Three-quarters called the materials at least somewhat helpful in drug abuse prevention efforts, with 23 percent terming them very helpful (table 6.2).
Perceptions of the Media Campaign and Its Impact
To clearly distinguish it from the materials discussed above, the NCCPMC component was described to respondents as follows:
46
"Apart from the McGruff materials used by some individual law enforcement agencies, the National Crime Prevention Council and the Advertising
Council distribute McGruff public service advertisements, or PSA's, nationwide to local television and radio stations, newspapers and magazines, billboard companies and the like. The media involved run these without charge as a public service. This is sometimes done independently of local law enforcement agencies, and sometimes with their cooperation."
Oniy 12 percent of the practitioners indicated they were unaware of the PSA component as described. Fifty-three percent said they were "fully aware" of it, 28 percent were "somewhat aware," with 7 percent "barely aware." Regardless of their awareness level, the respondents were most likely to have seen the PSA's on television, with 92 percent having done so over the previous 12 months (table 6.3). Poster sightings were reported by 72 percent, with other media sources following closely behind. Transit posters were ttle least mentioned (by 31 percent).
The Phase XV PSA series was introduced to respondents by the statement:
"As you may know, the McGruff media PSA's change themes and content every few months. The newest phase began last October under the theme "We Preve!lt," and is aimed at helping protect children and teens from violent crime. It features an "800" phone number people can call to obtain free detailed information."
Slightly more than 40 percent of practitioners reported having seen these PSA's on television, and about one-fifth said they had seen or heard them in each of the other media mentioned (table 6.4).
Value of McGruff PSA's. Generally high value was ascribed to the McGruff PSA's overall, with 10 percent calling them essential to their agency's crime prevention prog:-ams, 32 percent terming them valuable, and 35 percent saying they were somewhat valuable (table 6.1).
Although a wide. range of reasons for these responses were cited, positive ones tended to focus on the value of ongoing recognition of the PSA's and McGruff, and on the greater expo~ure mass media offered in promoting crime prevention awareness. More negative responses suggested that the media channels used were too limited, or that they duplicated what was being done with local programs.
Similarly, 71 percent of the practitioners said the PSA's were at least somewhat helpful to overall crime prevention efforts, with 24 percent calling them very helpful (table 6.2). These figures are somewhat lower than those for the locally used McGruff materials Dut can still be viewed as quite positive. Reasons given as to why the PSA's were helpful or not closely paralleled those given above for the value of the ads.
A strong majority of practitioners believed the McGruff PSA's were effective in building public awareness in their jurisdictions about preventing both crime and drug abuse. They were seen as being more effective among children than adults. Although more than 85 percent called the PSA's at least somewhat effective in making children more aware, closer to 60 percent said the same for adults (table 6.3). Nearly one-half of the respondents called them very effective in promoting crime prevention awareness among children. Overall, the PSA's were rated slightly more effective for crime as compared with drug abuse prevention among c.hildren and adults.
Impact of Organizational Factors on the Use of and Value Placed on McGruff
One objective of this study is to examine various Of
ganizatuonal and community characteristics that might influenc:e law enforcement's IUse and evaluation of McGruff materials and their assessment of the national media campaign. Because of the large number of survley items involved, several mUlti-item scales were developed to help com::eptualize the analysis and to reduce the data set to a manageable level. Relevant characteristics of the organization and the community are described in this section and the following one. Law enforcement's use and evaluation of McGruff were measured in the following ways:
II Use and evaluation of McGruff materials. As was noted above, a single survey item was used to measure whether law enforcement agencies use McGruff mater:als in their crime prevention programs. A three-item scale was created to measure the frequency of McGruff ma.terials use. In addltion, a threeitem scale was created to measure whether law enforcement practitioners felt the materials were valuable or helpful to crime prevention and drug prevention programs.
i _
• .l~wareness and frequency of McGruff PSA's. As noted, individual survey items were designed to me~:lsure the practitioner's awareness of the national media campaign, perceived changes in the number of PSA's since last year, and the number of PSA's relative to other jurisdictions. In addition, a seven-item scah:~ was created to measure the frequency of seeing, hearing, or reading McGruff PSA's locally during the past year. Another seven-item scale was created to achieve the same objective for the We Prevent PSA's.
• Evaluation of McGl'uff helpfulness and effectIveness. A three-item scale was developed to measure the perceived helpfulness of the McGruff campaign in supporting the departments' crime prevention and drug abuse prevention programs. A fouritem scale was needed to measure the perceived effectiveness of the McGruff campaign at building awareness among adults and children of crime and drug arlJse prevention.
• Relationship with local media. One survey item measured the frequency with which law enforcement agencies worked with local media to place the McGruff PSA's. A three-item scale was created to measure the number of local media organizations that use McGruff PSA's.
The following analysis focuses on the relationship between specific organizational characteristics and various measures of McGruff use and evaluation as outlined above.
Number of Crime Prevention Programs. Law enforcement agencies reported substantial differences in their level of involvement in crime prevention programs. This disparity provided an opporiunity to examine the effects of this variation on awareness, use, and evaluation of McGruff materials and the media campaign. Crime prevention managers were asked about 17 different types of programs (ranging from Crime Stoppers to Neighborhood Watch), and their responses were combined into a single indicator of the number of crime prevention programs currently implemented within their jurisdiction {ranging from 0 to 17}. Simple correlational analyses indicate that an agency's involvement in crime prevention programs was associated with the manager's awareness and evaluation of the McGruff campaign. Specifically, the greater the number of crime prevention programs being used, the more likely the crime prevention managers were to use McGruff materials in their
47

department's crime prevention activities (p<.01). Furthermore, the more frequently they used McGruff materials (p<.01), the greater their awareness of the national McGruff media PSA's (p<.05), and the greater the total estimat~d usage of PSA's by local television, radio, and newspaper organizations (p<.05). Some of these findings are illustrated in table 6.6, in which departments with 10 or fewer crime prevention programs are compared with departments that have 11 or more such programs. For example, 85 percent of the departments with 11 or more crime prevention programs reported using McGruff materials in their crime prevention programs, compared with 64 percent of the departments having 10 or fewer programs.
These findings, however, may be indicative of noncausal relationships 01' causal relationships that are more complex in nature. When other organizational variables were included in a multiple regression analysis, these significant relations did not hold up. In other words, when controlling for the effects of other organizational characteristics, the breadth of an agency's involvement in crime prevention programs does not have a significant independent influence on the use or evaluation of McGruff materials or tile national campaign. In sum, use of the materials appears dependent on several interrelated factors.
Internal Support for Crime Prevention. A four-item scale was created to measure the extent of internal organizational support for crime prevention activities by police officers (e.g., incentives for doing crime prevention work, relative prestige associated with different assignments within the department, and level of support from command staff). Internal support for crime prevention was not a good predictor of practitioners' reactions to McGruff. It was associated with more frequent use of McGruff materials (p<.05), but this relationship was not sustained in the multiple regression analysis which controlled for other organizational variables.
Partnerships with Other Agencies or Organizan
tions. A seven-item scale was created to measure the strength of working partnerships that the department has developed with other agencies and organizations for purposes of anti-drug activities. Crime prevention managers were asked how frequently their agencies work with specific organizations: churches, schools, social service agencies, local businesses, grassroots organizations, the media, and other government
48
agencies. The results indicate that the frequency or intensity of interacting with these agencies is a good predictor of how often the department will use McGruff materials. That is, the more frequently a department works with other anti-crime partners, the more often it will use McGruff materials in its crime prevention programs (p<.01). This relationship was sustained in the multiple regression analysis.
Priority Given to Citizen Participation. A sevenitem scale was created to measure the extent of departmental support in educating citizens about crime prevention and encouraging their participation in anticrime activities. This scale captures the priority given to departmental activities such as disseminating crime prevention information to all citizens, advising crime victims on preventative techniques, encouraging citizens to join Neighborhood Watch, and working with community organizations to build community cohesion.
The organizational priority given to citizen participation in crime prevention was a good predictor of the practitioners' reactions to McGruff. Specifically, law enforcement organizations that placed a priority on citizen participation were more likely to use McGruff materials on a frequent basis (p<.01). They found the materials more valuable or helpful to their crime prevention and drug abuse programs (p<.05). Furthermore, they expressed greater awareness of the national media campaign (p<.05) and reported working more frequently with local media to place McGruff PSA's (p<.01). Some of these findings are illustrated in table 6.7. For example, 67 percent of the departments that placed a high priority on encouraging citizen partiCipation were "fully aware" of the McGruff PSA's, although only 37 percent of the departments in the low priority group gave this response. Nevertheless, none of these relationships was sustained in the multiple regression analysis.
Priority Given to Working with Other Organizations and Agencies. A four-item scale was developed to measure the level of organizational priority given to working with other organizations and agencies to prevent crime and drug abuse. The results indicate that departments that place a high priority on developing these relationships were more likely to use McGruff materials on a frequent basis than departments that place a low priOrity on partnerships (p<.O'I). This relationship was not sustained in the regression analysis.
. Priority Given to Primary Prevention. A three-item scale was created to measure the level of organizational priority given to youth-oriented crime prevention and other early intervention approaches. Responses on this scale were not associated with responses to McGruff materials and the media campaign in any of the analyses.
Police-Citizen Ratio. The number of law enforcement officers per 1,000 citizens was computed to reflect ths department's ability to provide police service to its jurisdiction. This variable was not related to practitioners' use or evaluation of McGruff in any of the analyses.
Percentage of Civilian Personnel. The percentage of total personnel that is civilian (as opposed to sworn officers) was calculated. This variable was associated with two factors. Departments with a higher percentage of civilian employees were les~ likely to be aware of the We Prevent PSA's (p<.05) and gave more favorable ratings of the effectiveness of McGruff PSA's in building public awareness (p<.05). Neither relationship held up in the regression analysis.
Size of Crime Prevention Budget. The percentage of the total departmental budget devoted to crime prevention was requestsd during the interview. This figure was correlated with the department's use of McGruff materials but not in the direction that some mi8i1t expect. The larger the percentage of the total budget committed to crime prevention, the less likely the department is to use McGruff materials (p<.01). This relationship was not sustained in the regression analysis. Including other programs, such as DARE, in their budgets could be a factor here.
Presence of Crime Prevention Bureau. Assuming that the presence of a crime prevention bureau within the organization reflects a commitment to prevention, one would expect that departments with such units would exhibi'l positive reactions to the McGruff campaign. The results seem to support this hypothesis. Law enforcement agencies with a deSignated crime prevention bureau were more likely (than nonbureau departments) to use McGruff materials in their crime prevention activities (p<.05). Also they were more likely to use McGruff materials on a frequent basis (p<.01), and they found the materials more valuable or helpful to their crime prevention and drug abuse programs (p<.05). In addition, these agencies were more aware of the national media campaign (p<.01),
they were more likely to see or hear the PSA's locally (p<.05), and they gave more favorable ratings of the effectiveness of McGruff in building public awareness (p<.05). Furthermore, they reported working more frequently with local media to place McGruff PSA's (p<.01). Some of these findings are illustrated in table 6.B. For example, 51 percent of the departments with a crime prevention bureau frequently use the McGruff materials, but only 27 percent of the agencies without a bureau can be characterized as frequent users. This partiGular relationship was sustained in the regression analysis, but the other corrolations were no longer significant.
Size of the Force. Researchers expected to find some differences between large and small law enforcement agencies, and indeed, the calculations of the number of sworn personnel confirmed this expectation. Specifically, larger departments were more likely to use McGruff materials in their crime prevention activities (p<.01). Also these departments were more likely to use McGruff materials on a frequent basis (p<.05), were more aware of the national media campaign (p<.01), were more likely to see or hear the PSA's locally (p<.05). and reported working more frequently with local media to place McGruff PSA's (p<.01). These findings are displayed in table 6.9. For example, 69 percent of the departments with more than 75 sworn employees were ''fully aware" of the McGruff PSA's, compared with only 34 percent in departments with 75 or fewer employees. Only this relationship was sustained in the regression analysis.
Type of Organization. Approximately one-fifth of law enforcement agencies in the sample were sheriff's departments, and the remaining four-fifths were pOlice departments. Hence, researchers examined whether the type of law enforcement agency-police or sheriff's department-would influence responses to the campaign. The results revealed no difference in responses between the two agency types.
Impact of Community Factors on the Use of and Value Placed on McGruff
How a law enforcement agency operated in the community context was examined as a set of factors that could influence the agency's use and evaluation of
49
McGruff. To explore this possibility, data on community characteristics were gleaned from the 1990 census, the FBI's Uniform Crime Reports, and the crime prevention practitioner survey. Information on crime, neighborhood problems, citizen participation levels, population demographics, and housing characteristics were analyzed in relationship to the agency's use and evaluation of McGruff materials and the media campaign.
Crime Rate. Using data from the Uniform Crime Reports, the crime rate per 100,000 population for all Part I crimes was calculated. Overall, the local crime rate was not a good predictor of responses to the McGruff campaign. One exception was uncovered in the regression analyses-the lower tile community crime rate, the higher the practitioners' assessment of the value and helpfulness of the McGruff materials to their crime prevention and drug abuse prevention programs.
Perceived Violence and Fear Problem. A five-item scale was constructed to measure the severity of the community's violence problem and the accompanying fear of crime as judged by local crime prevention practitioners. TI.le results indicate that law enforcement agencies serving communities judged to have a serious violence/fear problem were more likely to use McGruff materials in their crime prevention activities (p<.05). Moreover, the agencies gave more favorable ratings of the et/ectiveness of McGruff PSA's in building public awareness (p<.01), and reportedworking more frequently with local media to place McGruff PSA's (p<.05). The effect of this factor on ratings of effectiveness was sustained in the regression analysis.
Perceived Drug Problem. A two-item scale was created to measure the perceived severity of the local illegal drug problem. The results indicate that the perceived drug problem was unrelated to police usage or evaluation of McGruff.
Perceived Property Crime Problem. A three-item scale was created to measure the perceived severity of the local property crime problem. Correlational analyses reveal that communities with larger perceived property crime problems also had police departments that are more likely to use McGruff materials in their crime prevention activities (p<.01) and that give more favorable ratings regarding the effectiveness of McGruff PSA's in building public
50
=
awareness (p<.05). Regression analysiS indicates that the perceived property crime problem continues to be associated with the use of McGruff materials, but the favorable ratings effect was no longer $ignificant.
Citizen Participation. A three-item scale was developed to measure the community's level of citizen participation in drug prevention activities, crime prevention activities, and grassroots organizations. The results indicate that higher levels of citizen participation in these activities (as judged by the crime prevention practitioners) were associated with a greater awareness of the McGruff PSA's among practitioners (p<.05), and a tendency to work more frequently with local media to place the PSA's (p<.05).
Public Support for Community Crime Prevention. A three-item scale was developed to measure the level of public support for citizen involvement in crime prevention and willingness to work with the police. The results indicate that communities holding favorable attitudes about citizens playing a role in crime prevention were more likely to have police practitioners who were aware of the McGruff PSA's (p<.05). Nevertheless, this relationship was not sustained in the regression analysis.
Total Population. Communities were grouped into one of four population categories based on their 1990 total population count in the census. The results indicate that communities with larger populations had police practitioners who were more likely to use McGruff materials in their crime prevention activities (p<.01). Also these practitioners were more aware of the national media campaign (p<.01), gave more favorable ratings of the effectiveness of McGruff in building public awareness (p<.05), and reported working more frequently with local media to place McGruff PSA's (p<.01). In the regression analysiS, population size was associated only with awareness of the national media campaign.
Black Population. Data on the percentage of the total community population that is black were obtained from the 1990 census. Communities with a higher percentage of blacks had police practitioners who worked more frequently with local media to place McGruff PSA's (p<.05). The regression analysiS showed that communities with a higher percentage of blacks had police practitioners who found the McGruff materials more valuab!e or helpful to their crime pre~ vention and drug abuse programs (p<.05).
White Population. Again, the 1990 census was used to obtain community-level information on the percentage of the total population that is white. This race variable was a good predictor of responses to the McGruff campaign. The regression analyses showed the following: Communities with a higher percentage of whites had police practitioners who were more likely to describe McGruff materials as valuable or helpful to their crime prevention and drug abuse programs. Furthermore, they were more aware of the national media campaign, were more likely to see or hear the PSA's locally, and were more likely to find McGruff PSA's valuable or helpful to their crime prevention and drug abuse programs.
Population Under 18. The percentage of the local population under 18 years of age (as determined by the 1990 census) did not predict responses to the McGruff campaign.
Housing Ownership. The percentage of owneroccupied local housing units versus rentals (as determined by the 1990 census) was associated with responses to the McGruff campaign. Communities with a higher percentage of rental units had police practitioners who were more likely to use the McGruff materials (p<.01). These practitioners also gave more favorable ratings of the effectiveness of McGruff in building public awareness (p<.05), and reported working more frequently with local media to place McGruff PSA's (p<.05).
Housing Value. Data on the median value of owneroccupied housing (as determined by the 1990 census) were grouped into 'four categories. The results indicate that the value of owner-occupied housing in a given community was unrelated to local law enforcement's use or evaluation of the McGruff campaign.
Conclusions
Crime prevention practitioners in general reported fairly positive responses to McGruff materials and McGruff PSA's. Their pattems of usage and evaluation of McGruff were sometimes conditionEld by the characteristics of their law enforcement agencies and by the characteristics of the communities they serve. Data from crime prevention practitioners, the Bureau
of the Census, and the Uniform Crime Reports suggest that both organizational and community characteristics playa role in determining how local law enforcement responds to the McGruff materials and the campaigns.
Organizational Characteristics
Several organizational characteristics were consistently associated with responses to the McGruff program. Greater awareness of McGruff programs, more frequent use of McGruff materials, and more favorable evaluations of the helpfulness and effectiveness of the program were more commonly found in law enforcement agencies with the followin~ characteristics:
• Employ a large and diverse group of crime prevention programs.
• Support efforts to educate citizens about crime prevention and encourage their participation in anticrime activities.
• Have a crime prevention bureau.
• Employ a large number of sworn personnel.
Some of these characteristics may be interrelated (e.g., larger police departments are more likely to have a crime prevention bureau and employ a large number of crime prevention programs). The regression analysis helped to untangle these relationships but yielded substantially fewer significant findings. (See table 6.10.) USing the other organizational characteristics as controls (covariants), the multiple regression results suggest that larger law enforcement agencies are more aware of McGruff PSA's. Furthermore, the presence of a crime prevention bureau and more anti-crime partnerships with other organizations are associated with an increased use of McGruff materials. Additional predictors may have been identified in the regression analysis if the sample size were larger (n=1 00), and the number of predictor variables in each equation were fewer (n=12). Several relationships that were marginally significant are not reported here.
Community Characteristics
Several community characteristics were associated with the use and evaluation of the McGruff program by law enforcement. The following community factors
51
were linked to greater use of McGruff materials and more favorable evaluations of McGruff PSA's:
• Communities with larger total populations.
II Communities with a higher percentage of rental units.
• Communities with a larger estimated violence/fear problem.
Again, some of these relationships may be overlapping (Le., explaining the same variance in the dependent variable). The regression analysis produced fewer significant findings (see table 6.11). Nevertheless, the findings with regard to population size and percentagl3 of rental units noted above were confirmed in the regression analysis. The pattern of results for crime-related indicators suggests the following: McGruff materials are used more in communities judged to have a problem with property crime. The PSA's are evaluated more favorably in communities judged to have a violence/fear problem. However,
52
communities with higher crime rates judge the McGruff materials as less helpful to their crime prevention and drug abuse programs. These findings seem inconsistent, but because they involve different outcome measures, they are difficult to interpret.
Perhaps the most consistent predictor of law enforcement practitioners' responses to McGruff in the regression analyses is the percentage of the population that is white. Practitioners in communities with a larger proportion of whites tended to respond more favorably to the McGruff program and report greater community exposure to the PSA's, which may be at least in part a reflection on practitioners' perceptions. This is not to suggest that McGruff was adversely received by law enforcement in communities with a substantial percentage of minorities. The size of the African-American population, for example, was generally unrelated to responses to McGruff, and in fact, was positively correlated with the perceived helpfulness of McGruff materials.
La
SECTION 7: THE MEDIA CAMPAIGN
COSTS AND EFFECTIVENESS
What are the costs of the media program in relationship to its estimated benefits and effects on the target audience? A limited efficiency analysis was conducted to examine program costs, sources of support, and benefits derived. The basic principle underlying cost-benefit and cost-effectiveness analyses, as Rossi and Freeman (1985) note, is to determine whether the preferred program is one that "produces the most impact on the most targets for a given level of expenditure" (p. 325). Because of the nature of the media campaign, precise and reliable estimates of program benefits, costs, and effects are not. possible from this evaluation. The diffuse nature and national focus of the program, as well as its emphasis on preventing future problems that are multidetermined (Le., drug abuse and crime), further complicate matters.
Another note of caution about cost-benefit analyses is in order. Although interest in judging the efficiency of social interventions has grown in recent years, the "correct" procedures for conducting such analyses are strongly debated (see Rossi and Freeman, 1985; Boatman et aI., 1979). Above all, evaluators of social programs are typically faced with imperfect measures of program costs, benefits, and effects. Consequently, calculations based on these measures are often open to several interpretations, and assumptions underlying them must be carefully weighed.
However, for this evaluation, monetary and nonmonetary estimates have been generated in areas where data are available and can be connected to the program in a meaningful way. Researchers performing this evaluation believe a cost-effectiveness analysis is preferable in this case to a cost-benefit analysis. The latter would examine the economic efficiency of the media campaign in terms of the relationship between monetary costs and monetary gains. This examination would be difficult because of the need to place monetary value on each of the expected benefits. However, a cost-effectiveness analysis compares monetary costs to some standard program outcomes in terms of units (e.g., percentage increase
in citizens' knowledge about crime prevention or change in crime prevention behaviors because of the media campaign). Therefore, a cost-effectiveness analysis is more informative for campaign policy decisions.
Even in a cost-effectiveness analysiS, however, the assumption is that the observed changes can be confidently attributed to the media program and not to some other competing social forces or programs. To the extent pOSSible, this evaluation has tried to rule out some obvious rival hypotheses. Nevertheless, certain threats to validity cannot be controlled, and therefore, the inference that changes in outcome units are the sole result of the media program must be guarded against.
Nevertheless, the efficiency analysis was employed to give some general guidance regarding program costs, benefits, and effects. A full-blown efficiency analysis is beyond the scope of this evaluation, but some of the conventional approaches were used. The analysis begins with a discussion of some potential costs and benefits at the national level, despite the difficulty of attributing these outcomes to McGruff and assigning them preCise monetary values. The evaluation also includes a cost-effectiveness analysis, where program effects are expressed as standard unit outcomes (and an outcome-to-cost ratio is calculated). A few examples are provided. Some discussion of intangible benefits is offered for policymakers to evaluate within their own dimensions.
Components of Cost-Effectiveness
The costs and benefits of the media program can be examined from different angles. A fundamental question is, ''who pays and who benefits?" In theory, costs and benefits can be calculated for individual program participants (target groups), the program sponsor, and society at large. Each is discussed on the following pages.
53
The Program Sponsor
The McGruff campaign is sponsored by the Bureau of Justice Assistance, U.S. Department of Justice, with voluntary contributions from the Advertising Council, Saatchi and Saatchi, numerous media organizations, and the National Crime Prevention Council. The direct costs of the campaign can be determined fairly easily. The entire National Citizens' Crime Prevention Campaign cost the Federal government approximately $2.7 million in fiscal year 1991 (BJA, 1991). However, this cost includes ail aspects of the campaign, including the publication of brochures, po~/;.ers, and other crime prevention materials for students of all ages. Also included are the formation and maintenance of an information clearinghouse, as well as training seminars for community, police, and school groups across the country, etc. The portion of the budget that was used specifically for producing and disseminating the PSA's was approximately $600,000 for fiscal year 1991. Hence, this amount is the cost to the taxpayers for the media component of the campaign.
This investment in the McGruff campaign yields a substantial return in volunteer commitments by advertising experts who develop and monitor the campaign, and above all, donate advertiSing space. Each year the Advertising Council and Saatchi and Saatchi donate literally hundreds of hours of staff time to work with the National Crime Prevention Council to develop, disseminate, and evaluate the McGruff PSA's. The most important outcome of this Federal and private investment is the amount of donated advertising space that was produced. According to the Advertising Council, the total value of donated advertising time and space for McGruff PSA's during 1991 was $60.3 million, thus ranking it fifth in the Nation for advertiSing dollars. (Note: The top four rankings were paid advertiSing, with first place going to Cheerio's cereals at $68.1 million.) This amount represents a 19 percent increase in donated advertising space from the previous year.
In sum, the $600,000 support from the Federal Government represents only 1/100 of the $60 million in media support that makes this campaign fully operational. The Federal investment can be viewed as seed money that has stimulated contributions from media outlets across the Nation for the benefit of crime and drug prevention.
54
Societal Impact
The costs and benefits of McGruff for SOCiety at large are difficult to isolate (although this entire report addresses this question in many different ways). Even though trends cannot be attributed necessarily to the program, general patterns of crime and drug abuse in the United States, as well as the costs associated with these problems can be explored. The costs of crime and drug abuse to society have been substantial. The criminal justice system at the Federal, State, and local levels cost the taxpayers an estimated $74.2 billion in 1991 (BJS, 1991). In addition, there is the loss in work productivity because of injury or death from crime/drugs. Furthermore, property values are lowered because of uncontrolled crime and local drug markets. Other factors that exist are difficult to measure with any preCision. The national cost of drug abuse was estimated at $59.7 billion in 1983; this cost included lost productivity, criminal justice costs, social welfare expenditures, and health care services (see BJS, 1988). These costs are often rough estimates subject to debate.
In response to these problems, throughout the 1980's, the McGruff campaign consistently ran PSA's, as well as a host of other educational initiatives, to encourage crime prevention and drug prevention behaviors among the U.S. population. Although the impact of the McGruff campaign on crime and drug abuse cannot be established, the national trends are certainly consistent with the objectives of this national program. Reliable measures of criminal victimization and illegal drug use have been captured in several ongoing national surveys. The National Household Survey on Drug Abuse, for example, has registered a 46 percent drop between 1985 and 1991 in the number of Americans more than 26 years of age who have used any illegal drug during the past month (National Institute on Drug Abuse, 1993). The High School Senior Survey shows similar declines in illicit drug use among the Nation's youth. The percent of high school seniors who report using at least one illicit drug during the past year has dropped from a peak of 54 percent in 1979 to 29 percent in 1992 (Johnston et aI., 1992).
The pattern is similar for criminal victimization. The National Crime Victimization Survey shows that between 1981 and 1991, the victimization rate (per 1,000 persons) dropped 23.4 percent for personal crimes and 27.9 percent for household crimes (BJS, 1992; see table 7.1). Note that household burglary-
a prime target of McGruff during the early 1980'shas declined nearly 40 percent.
To the extent that some portion of the direct costs cited earlier can be avoided as a result of the declining rates of crime and drug abuse, they can be counted as indicators of direct benefits. Direct benefits are "estimations of savings on direct costs" (Bootman et aI., 1979) and include expenditures on prevention, enforcement, treatment, incarceration (including capital investments), and other tangible services that result from the problem. If $74 billion is spent to operate a criminal justice system that processes 14.5 million known offenses per year, the average cost per crime to operate the system is more than $5,000. Any reduction in crime could, conceivably, save the taxpayers a substantial sum of money, assuming the size of the criminal justice system was reduced proportionately.1
National trends are interesting, but smaller units of analysiS are preferred when attempting to separate the effects of the McGruff campaign from the vast number of changes in the country that covary with the decline in illegal drug use and criminal victimization during the 1980's. McGruff exposure was significantly related to various crime prevention responses as discussed below.
Individual Impact
At the individual level, the direct costs of society's failure to prevent crime and drug abuse are certainly sizeable but are not always measurable. The direct costs to the individual and family members can include victims' medical expenses resulting from injuries, time lost from work, property damage, and increased expenditures on private security. The loss of property from the commission of an offense can be substantial by itself. For example, FBI data on known offenses in 1990 indicate that the average property loss (in dollars) was $783 per robbery, $1,133 per household burglary, $480 per larceny-theft, $5,0.32 per motor vehicle theft, and $13,078 per arson (FBI, 1990). Using specific reporting rates for each type of Part I crime (Flanagan and Maguire, 1992), the 34.4 million offenses in 1990 (reported and unreported) cost an estimated total of $30.6 billion in property loss alone. Again, for each offense prevented, individual
1. Unfortunately, the cost of operating the criminal justice system during the 1980's did not decline (but rather increased) in response to a reduced level of criminal activity.
victirnt; of crime will save hundreds (and sometimes thousands) of dollars.
But preventing crime can also be expensive. According to media reports, the cost of private security, such as the purchase of guns, alarm systems, and deadbolt locks, has increased dramatically in recent years as the market continues to expand, but sales figures are not available by community. The total expenditures in the private sector for products and services for 1980 was estimated at $21.7 billion, but the portion attributable to private citizens (versus businesses) was unknown, and the reliabiiity of such estimates is suspect (see Cunningham and Taylor, 1985). Finally, although some aspects of the cost for citizens are quantifiable, the emotional pain and suffering that is inflicted on victims and their families by crime and drug abuse cannot be easily measured. On the positive side, the survey research methods allow quantification of some of the positive effects of exposure to prevention programs designed to reduce the risk of criminal victimization. The McGruff program is no exception.
Cost-Effectiveness Analysis
Researchers prepared a cost-effectiveness analysis that focuses on key attitudinal and behavioral outcomes of the McGruff campaign. Using the survey data cnllected in this evaluation and data on campaign costs, they were able to compare monetary costs to some standard program outcome units. Using survey data focused on the McGruff campaign, citizens' reports about their own knowledge and behavior can be related to the PSA's with some degree of confidence. Furthermore, the direct costs of the media campaign are unambiguous.
The impact of the McGruff PSA's was examined by looking at whether the campaign influenced the crime and drug prevention competencies of the target audience. As noted earlier in this report, evidence of campaign effectiveness is indicated by citizens' selfreports about changes in their knowledge, perceived responsibility, feeling of efficacy, and personal actions in crime prevention. Some specific examples are used here for a cost-effectiveness analYSis of the We Prevent and other McGruff PSA's.
55
n=
We Prevent
Respondents exposed to the We Prevent campaign were asked whether the PSA's showed or told them anything they had not known about before or reminded them of things they had known but forgotten. Thirty-one percent answered yes to this question. When translated to the Nation as a whole, this means that approximately 15 percent (plus or minus 2 percent sampling error) of the adult population 18 years or older (or about 27 million people) learned something new from the We Prevent ads.
By dividing the total direct costs of the McGruff media campaign ($600,000) by the estimated number of Americans who learned something from the PSA's (about 27 million), researchers computed a costeffectiveness ratio of 2.2 cents per person educated. A ratio of cost-to-percentage pOints was also calculated. This ratio suggests that every 1 percent increase in the number of American adults who learn something about crime prevention from the PSA's costs approximately $40,000.
In terms of behavioral outcomes, 21 percent of those exposed to We Prevent PSA's reported that they had done things they probably would not have if they had not seen the ads. In national terms, this means that approximately 11 percent of the adult population has taken some type of action or changed their behavior as a result of exposure to the We Prevent information. Again, by dividing the total direct costs of the media campaign ($600,000) by the estimated number of Americans who reported behavioral change as a result of the PSA's (20.3 million), a cost-effectiveness ratio of 2.9 cents for each person who changed their behavior can be computed. A ratio of cost to percentage paints was also calculated. This ratio suggests that every 1 percent increase in the number of American adults who changed their crime prevention behavior costs approximately $54,545.
Other McGruff PSA's
Cost-effectiveness ratios were calculated for changes attributable to McGruff PSA's other than We Prevent. For those citizens who reported exposure to other McGruff PSA's, 42 percent stated they had learned something new or were reminded of things they had known earlier. When extrapolated to the Nation as a whole, approximately 18 percent of the adult population 18 or older (I.e., 33.3 million people) learned
56
something new from other McGruff ads. The costeffectiveness ratio ($600,000 divided by 33.3 million) indicates that the McGruff campaign cost 1.8 cents per educated person. A ratio of cost to percentage indicates that every 1 percent increase in the number of American adults who changed their clime prevention behavior cost approximately $33,333.
In terms of behavioral change, 18 percent of the exposed group claimed they had changed their behavior as a result of the ads. This number constitutes approximately 11 percent of the adult population in the United States (or 20.3 million people). The costeffectiveness ratio indicates that the campaign cost 2.9 cents for each person who reported a change in crime prevention behavior. This corresponds to a ratio of $54,545 for each percentage point increase in the adult population.
In sum, the cost-effectiveness analyses suggest that the We Prevent and other McGruff PSA's were equally effective and cost-effective in stimulatino changes in crime prevention behavior. The present analysis also suggests that the other McGruff PSA's were more effective and cost-effective than We Prevent in the area of increasing citizens' knowledge about crime prevention. This should not be unexpected, since We Prevent was aimed more at getting citizens to seek more information from other sources. These results should be viewed with extreme caution because they assume that the two campaigns were equally costly. This assumption is unlikely to be true, yet separate cost figures were not available when this report was prepared.
Analysis of the Efficiency of Program Delivery
The efficiency of program delivery is another important area that may affect program costs for the sponsor and may influence program impact. The interface between the national campaign team and local media outlets (e.g., whether the PSA's are produced, distributed, and used in a timely and regular manner) and the selection of media outlets for PSA's are examples of processes that could have a large effect on the efficiency of the McGruff program. Although this is not a process or implementation evaluation, a few observations about process efficiency and related decision-making at the na.tional level are in order.
One way of framing the question is to ask, "Have the National Crime Prevention Council, the Advertising Council, and Saatchi and Saatchi done a good job of getting the maximum bang for the buck?" Although the process of developing and executing the campaign was not studied in detail, limited observations suggest that considerable effort is made each year to identify the best media markets for the McGruff PSA's. The $60 million in donated advertising space speaks for itself, but it does not answer the question of whether the spots are effective or are the best that can be achieved with the budget available.
In addition to the relevant survey results presented throughout this report, the examination of memoranda and other documents suggests that budget constraints have served to facilitate a concern for efficiency among the Crime Prevention Campaign Team. This group is concerned not simply with finding advertising space but with where and how to achieve the largest and most appropriate audience for the McGruff campaign. For example, the memos suggest that the following information is regularly shared regarding such topics:
• What types of ads will receive the most "play," e.g., how the size and color of the ad will affect space.
• What response rate will be achieved with targeting versus mass mailings.
• How expenses can be lowered on television, radio, and print mailing kits by using new packaging.
I!!I How to identify new media sources to reach minority groups or other segments of the market, such as children.
• How and why local stations select PSA's.
• How stations differ from networks in their approach to PSA's.
• What advantages and disadvantages are associated with using different types of media for McGruff (e.g., radio versus television versus print).
These efforts suggest that the campaign team has sought to minimize program cost while at the same time maximizing coverage and impact within selected markets. Clearly, some degree of efficiency has been achieved by these efforts, and the Federal funds have been invested with considerable planning.
57
SECTION 8: CONCLUSIONS AND
RECOMMENDATIONS
The purpose of this study has been to evaluate the public impact and cost effectiveness olf the National Citizens' Crime Prevention Media Campaign. Previous sections have identified the scope, of study and the research objectives, described the campaign and its message themes, and presented findings regarding its impact gathered from media galtekeepers, crime prevention practitioners, and the! public at large. This final section summarizes those findings and offers conclusions and recommendations based upon them.
Summary of Findings
The findings are summarized in the context of the initial research questions:
1. How and to what extent has the media campaign been utilized in local jurisdictional crime prevention efforts?
A national survey of media gatekeepers found the following:
• Ninety-five percent of media managers were aware of the National Citizens' Crime Prevention Campaign PSA's, and more than one-half of them had run at least one within the past year.
• Gatekeepers rated the PSA's high in quality and relevance.
• They regarded the PSA'f. as effective and influential within their communities.
• Managers not using them reported the reasons as inappropriateness to their particular media formats or audience groups and/or lack of regular delivery.
• The McGruff ads appeared to complement related media programs, such as Partnership for a Drug-Free America and Crime Stoppers.
Data gathered from a national survey of community crime prevention practitioners indicated that:
• Ninety-eight percent of prevention practitioners were familiar with the National Citizens' Crime Prevention Campaign overall, 76 percent had used its materials, and most users said they were of high value.
• Eighty-eight percent of practitioners were aware of the McGruff PSA's.
• Seventy-seven percent of those aware of the PSA's called them valuable in providing more public exposure and awareness of crime prevention issues.
• Seventy-one percent of those aware of the PSA's called the PSA's helpful to local efforts.
• Eighty-five percent of those aware of the PSA's called them effective for children, and 60 percent said they were effective for adults in building prevention awareness.
• Those crime prevention programs most receptive to the materials tended to have the following characteristics:
Q Be in larger communities.
o Face more crime problems.
o Have larger, more diverse prevention programs.
Q Be more supportive of citizen prevention overall.
2. To what extent are audiences (a) exposed to the media campaign, (b) attentive to it, and (c) responsive to it?
Results from a national probability sample survey of 1,500 adults indicated that:
• Eighty percent of U.S. adults recalled having seen or heard McGruff PSA's in general, and 49 percent recalled the 1991 anti-violence PSA's.
• Most were familiar with them from television, followed by print and radio.
59
e
• People generally were attentive to the PSA's; 86 percent of citizens interviewed reported high attention to the anti··violence ads.
• Most people familiar with the PSA's could name somethin~J specific they liked about them; only 11 percent named something they disliked.
II Citizens more familiar with the PSA's shared the following characteristics:
a Relatively young with children in the home.
a More attentive to media overall.
a More interested in crime prevention.
o More needful of prevention information.
a More aware of neighborhood crime problems.
o More prevention responsible, confident.
a More likely to take preventive actions.
• Black adults appeared slightly more familiar with the PSA's than did white, and middle income groups were slightly more familiar with them than other income groups.
3. To what extent does the media campaign influence the crime and drug prevention competencies of targeted audiences?
The survey of citizens indicated that of those familiar with the Ngtional Citizens' Crime Prevention Campaign:
• Nearly one-third said they had learned from the PSA's.
• About one-fifth said they took specific actions as a result of the PSA's.
• Fifty-four percent reported becoming more concerned about crime.
• Thirty-six percent said they felt more confident in protecting themselves.
• Forty-seven percent felt more personally responsible for prevention.
• Most citizens said PSA's were effective in increasing the following:
60
a Their own crime prevention awareness (70 percent).
a Their awareness of drug abuse prevention (90 percent).
o Children's awareness of crime prevention (90 percent).
a Children's awareness of drug abuse prevention (88 percent).
• The following groups were more likely to report being influenced by the PSA's:
a Women.
a Less educated, lower income citizens.
a Black citizens.
a Parents with children in the home.
These findings were compared with those of a similar 1981 citizen survey. Awareness of the McGruff campaign had increased over the decade by more than 50 percent, and evaluations of its overall appeal and perceived impact have generally remained constant. In addition, comparisons of the 1981 versus 1992 studies indicate shifts in citizen responses to crime overall. Generally, the public was taking more preventive actions in 1992 than in 1981, including ones in cooperation with neighbors. Fear of crime was down on some indicators. Although these changes cannot be attributed necessarily to this particular campaign, they do suggest that the collection of crime and drug abuse policy measures introduced over the decade are contributing differences.
4. What are the costs of the media program, and how can its impact be addressed in terms of benQ
eflts and eiticlencies for crIme and dr.ug abuse prevention?
The Federal investment in the McGruff campaign appears to have yielded a substantial return in the way of volunteer commitments for advertising production and public dissemirlcl.tion. In effect, a $600,000 investment for fiscal year 1991 generated donated media time and space estimated at $60.3 million nationwide. In 1991 McGruff was the fifth-ranked advertising campaign in dollar value in the Nation, commercial product campaigns included.
Results of a cost-effectiveness analysis suggest that the anti-violence and other McGruff PSA's were costeffective in stimulating changes in citizen knowledge and behaviors in crime prevention. Findings also indicate that the program is extremely efficient because it encompasses considerable planning efforts aimed at minimizing program costs while maximizing campaign coverage and impact within markets.
Conclusions
The overall conclusion, with some caveats, is that a substantial majority of the public, media, and law enforcement community has accepted McGruff, Take a Bite Out of Crime, and the message themes tied to the NCCPMC as positive symbols of crime prevention. These symbols have also become associated with drug abuse prevention, although to a lesser extent. Also, there is no indication that public attention to or involvement with the campaign messages has decreased over the years; on the contrary, the campaign appears to have continued to gain in popularity and impact over the past decade.
This continued increase in impact is due to two intertwined factors. One is that recurrent uses of these symbols have been carefully controlled, leaving little room for the unexpected in terms of who McGruff is each time he appears or of what he advocates. The second factor is that with each new campaign phase, distinct and novel PSA's are incorporated into U',e familiar theme, maintaining audience interest. These factors are common to successful advertising campaigns overall (as well as to situation comedies, soap operas, professional sports, etc.).
Nevertheless, knowing this textbook approach to campaign design and being able to implement it successfully are two different things. Many campaigns fail because the initial hook-McGruff in this case-does not catch on. Or, given successful adoption of the main theme, producers may wander too far afield from the basic concept as the campaign progresses, breaking the tie of association for the audience and resulting in confusion and lack of reinforcement of the initial symbol. Once that tie is disassociated, each new segment or phase has to begin anew to gain recognition and credibility. Other long-term campaigns fail because producers stleer too close to the initial concept, resulting in earl~' audience boredom at seeing little variation in the basic theme. Producers of the NCCPMC seem to have navigated a careful course between these extremes.
Some risk may have been involved in transferring McGruif to duty on the drug abuse prevention beat. Although drawing attention--particularly among children-to drug.-related issues, it could have diministled his credibility as a c,'ime specialist. That does not appear to have happened, possibly in part because audiences already associated drug abuse quite
.' closely with crime. It may have seemed quite appropriate for McGruff to make the association as well, perhaps even reinforcing it.
The handling of the anti-violence Phase XV PSA's also could have been problematic. However, minimizing McGruff's role in those may have kept him clear of a darker connotation involving violence, and temporarily removing him from the field does not appear to have had deleterious consequences.
More generally, the findings indicate that such a media campaign can be a productive approach for influencing public understanding and behavior with respect to the prevention and control of crime and drug abuse. However, it must be emphasized that the claim cannot be made that this media campaign alone has been responsible for such impact. Rather, it is more likely that the PSA campaign and extensive National Citizens' Crime Prevention Campaign promotional efforts based on more directed and interpersonal communications at the community level work together, mutually reinforcing social change. Generally, media messages are more effective at promoting awareness, and group-level or interpersonal communications more directly affect behavioral change. The more careful the linking between the two, presumably the greater the impact on, in this case, overall crime prevention competence.
This linkage or "systems" effect has been found to be the case in related campaign studies (noted in section 1) dealing with public health, environmental safety, and related issues. Among the singular contributions of this study to such research is demonstration of the persistence of such campaign effectiveness over more than a decade, the national scope of the findings, and the general consistency of impact on target population groups.
Previous research also suggests several propositions about what makes some information campaigns more successful (Rogers and Story, 1987; O'Keefe and Reid, 1990; Backer et aI., 1992). This campaign has included many ingredients tied to more effective programs. Those ingredients reviewed should be to provide a broader context for the findings. More successful PSA campaigns, including this one, have included the following:
• Use of commercial advertiSing research and planning strategies in PSA design and execution, including precampaign focus groups, copy testing, and campaign tracking.
61
• Segmenting of the public into target audience groups with messages tailored specifically for them.
• Use Clf coordinated efforts across media (televisio!1, radio, newspapers, magazines, outdoor, etc.).
l~ !1SP/3tition of messages and themes over time and ac/Oss media.
• Rel:atively high levels of dissemination across all media (often a problem for PSA's in particular).
II HiOh creative and production quality, leading to both oreater media play and public acceptance.
• Use of entertaining characters, story lines, or visuals to convey information in an interesting way.
• Sponsorship by recognized, reputable organization!.s (Bureau of Justice Assistance, U.S. Department of Justice; Advertising Council; National Crime Prevention Council).
• Tying of PSA's to community issues and problems, enlisting local advocacy for disseminating PI3A's .
• , Emphasis on providing information to help remedy problems citizens already agree are important (e.g., relating PSA's to specific types of crime problems as they gain prominence).
III Emphasis on the positive rewards to be gained in the recommended actions, versus negative threats or fear arousal.
Other elements tied to more influential campaigns overall-PSA-related or not-have included use of specific principles or models of persuasive communication in campaign design. It is likely that all of these elements come together as a result of the cumulative experiences of the Advertising Counc.i1 and through member agenc~' skills at advertising message design in general.
Another such element that is less apparent is the setting of specific, measurable goals for the desired level of audience impact across successive stages of the campaign. These goals are commonplace in campaigns for commercial products, where such indicators as sales figures and consumer preferences are easier to monitor. The setting of such criteria for "social marketing," however, is obviously more difficult and costly. Nevertheless, evaluations such as this one would benefit from some previous projections by campaign sponsors and planners as to what levels of impact they would term "successful" in judging
62
campaign performance. Assessing what results one should expect of the McGruff PSA's over time would call for (a) establishing implicit baseline criteria for spelling out the kinds and amount of changes expected over given time periods, and (b) setting reasonable Huals for specific kinds of change for each phase of the campaign.
The findings comparing citizen response to crime in 1992 versus 1981 are supportive of a long-term change in the crime prevention attitudes and behaviors of the U.S. public. Generally, people were taking more preventive actions in 1992 than in 1981, including ones in cooperation with their neighbors. Fear of crime was down on certain indicators. Although these changes cannot be attributed to this particular campaign, they do suggest a difference is being made by the collection of various crime and drug abuse prevention policy measures introduced over that decade.
Recomnlendations
The following recommendations are based on the findings of this study. They begin with overall campaign theme design, then move to audience and specific message considerations and finally address general strategy issues.
Recommendation A
Keep the main themes, with continuing innovation In specific concepts and approaches for creation, execution, and dissemination of the campaign.
The campaign's visibility and effectiveness are due in large part to the creative and technical quality of the PSA's, as attested to by media professionals and audiences alike. There is no reason to expect that quality to diminish, assuming continued cooperation among the current sponsors and producers. As was noted jn the preceding section, the process has elements of both effectiveness and efficiency.
This recommendation is not a call simply for the media campaign to remain as is, but for it to continue creatively coping with emerging crime and drug abuse issues, and with changing public policy and response to those issues. Many of the recommendations that follow include possible strategies for helping bring about such deliberate variations.
Recommendation B
Maintain the distinct ;md credible identities the campaign has nurtured with the public, and continue to ensure against potentially detrimental uses of these.
In the 1981 campaign evaluation, it was suggested that McGruff could well approach the popularity of Smokey the Bear as a campaign symbol. That clearly has happened, and among younger, more urban generations McGruff may be even better known than Smokey the Bear. Camp~:gn p!!.mners should continue to take advantage of this high acceptance.
Maintaining the credibility of campaign sponsorship and the campaign theme and logo is extremely critical. The Advertising Council can be assumed to have long-term sponsor credibility, and the National Crime Prevention Council has gained in recognition over the years. The Advertising Council may contribute trustworthiness or honesty to the messages, while the National Crime Prevention Council may deliver perceived expertise on crime prevention. Uses of the campaign theme and logo by other sources-whether public, not-for-profit, or commercial-need to be carefully controlled. This includes not only misuses of them in messages that mc.:.y provide inaccurate information, but in ones of poor production quality as well. Such uses can only diminish the well-nurtured attractiveness and credibility of McGruff and the central themes.
Recommendation C
Examine new strategies for reaching people who remain unaffected by the media campaign.
It must be kept in mind that media campaigns have their limits. Even those that are termed successful in the aggregate cannot be expected to reach all groups of the public. Although these findings indicate a broad reach for the NCCPMC, there are groups who remain unexposed to the campaign, who are not informed by it, or who are unable or unwilling to act upon its recommendations. These subgroups were difficult to identify specifically. The lower income and education levels of those less exposed sugg1est that, for example, they may include inner-city residents and perhaps the rural poor. Of note is that among the lower income and education groups who were exposed, impact was in many cases greater, making reaching
these groups all the more productive. Many older adults are less inclined to respond. It may be beneficial to more closely examine, perhaps more through local resources, how the needs of such groups may be more fruitfully addressed by either modified media strategies or concerted community-based, and possibly more interpersonal, efforts.
Also, although media campaigns can be effective in informing people about issues or courses of action, they may remain less so in consistently promoting changes in behavior. The McGruff PSA's are clearly no exception. Therefore, it would be worthwhile to explore other avenues, including interpersonal ones, for continuing to increase the number of citizens actively participating in crime and drug abuse prevention activities. However, the ability of the media carr'lpaign to reinforce positive dispositions to prevent crime can help establish such actions as normative in this society.
Recommendation D
Continue to strive to identify distinct audience segments and to attempt to reach them. Such efforts are likely to increase both the efficiency and the Impact of media materials.
Phase XV activities targeted audiences identifiable as caretakers of children. Thus, these audiences were more exposed to the McGruff PSA's, and they reported having been affected by them to a greater extent. Audience segmentation or targeting is highly deSirable in campaign deSign because it helps planners choose specific message and media strategies most likely to affect the identified group. Such segmentation is often difficult when PSll,'s are used, because access to the most appropriate media channels for reaching the targeted audiences may not be available. It is clear from this study. however, that with appropriately designed messages and some selectivity of the media for ads distribution, broadly outlined target populations can be reached through PSA's.
On another level, audience segmentation can also involve aiming messages at particular groups on the basis of more psychological than demographic or structural characteristics. The NCCPMC team might consider, for example, identifying citizen groups on tile basis of knowledge of crime and drug abuse prevention techniques, attitudes toward them, and existing behaviors. The present research, as well as
63
previous works, may supply adequate background material for determining existing opportunities and constraints in increasing prevention competence according to fairly specific dimensions. For example, persom3 who are low in information, but high in motivation and need for information, might be reached more effectively by one strategy, whereas citizens informed and motivated, yet inactive, might call for another strategy. It may also be of value to try to identify and reduce constraints on behavior for those persons who may be informed and motivated, but still inactive. The focus in this case is more on designing messages that would more directly address the specific needs of such groups.
Several more specific recommendations follow from this:
Recommendation 0.1. Continue the kinds of focus group and copy testing research used to pretest campaign concepts and materials. When appropriate and possible, identify and segment audience groups for various message and channel combinations. Audience-directed formative research can present profiles of the mass and interpersonal communication patterns of specific target groups and can identify their needs regarding information about crime and drug abuse preventiDn. The volatility and personal nature of crime and drug abuse pose special problems in this regard, particularly given the wide variation in citizen response to it. Previous examples of this kind of research include focus group studies conducted among Hispanic audiences, or on a larger scale, the NIJsponsored work on ways of meeting the crime prevention information needs of elderly persons. Elements such as source credibility, fear appeals, use of humor, message design, and the information capacities of various channels all have Lleen the subject of considerable research. The NCCPMC team more than likely is aware of such reseal'ch.
Recommendation 0.2. Continue the emphasis on television as the main dissemination mode, but aim to target specific audience segments with supplemental media such as radio, magazines, and outdoor advertising. Television is clearly the main mass audience purveyor of the NCCPMC messages, and it arguably has the greatest audience potential. It provides the most complete picture of McGRIff and can dynamically portray the sometimes complex and emotional messages needed to promote crime prevention. The campaign should continue to depend upon television to carry the main themes of the campaign. As was
64
£
noted in section 5, it will also be useful to continue aiming for local McGruff-related coverage on television news programming.
This recommendation is not intended to understate the importance of the other media-some of which have received only slight attention in this study. Radio, magazines, newspapers, and outdoor media are highly important in contributing in separate ways toward reaching more specialized audiences for specific purposes. These other media may be quite effective at reaching audiences who remain unaffected by the campaign. The use of radio to reach particular audience segments should continue to be emphasized.
Recommendation 0.3. Monitor the acceptance of the campaign by racial and ethnic groups, particularly if messages emphasize or highlight minority characters or issues. It is notable that the campaign has been as eff(jctive in reaching the significant minority population of black citizens as in reaching whites, perhaps even more effective. Unfortunately, the relatively small sample of blacks in the survey did not allow for more detailed analysis of its appeal among demographic and other subgroups within the black community. Th9 campaign overall appears to have maintained a racial and ethnic, as well as economic, neutrality in the audiences it reaches. This finding becomes even more important in light of the findings from section 5 that black citizens indicate a higher need for information about crime prevention. Again, there is a need to leam what particular characteristics within the black audience cal! for more attention, and what kinds of existing attitudes, behaviors, and situations should be addressed. Only then can more productive communication strategies be designed.
Continuous caution and careful prior copy testing are needed in dealing with such themes. For example, the McGruff PSA's aimed at Hispanic citizens appear to have been carefully researched before dissemination. Post-evaluation of that phase to determine acceptance of the PSA's would be beneficial.
Recommendation D.4. Consider the special informational needs of a growing elderly population, whether in the context of the NCCPMC or through other avenues. This suggestion goes beyond the realm of the media campaign; however, the 1981 evaluation noted that elderly citizens reported a distinct lack of exposure to, interest in, and impact from the McGruff campaign. Subsequent research identified particular nt:cds of the elderly for crime prevention information
.. t'
and recommended ways to reach them more effectively (O'Keefe and Reid, 198?). Among those recommendations was the need for materials that are specifically directed at elderly groups but that do not identify them as a homogenous mass because their crime-related viewpoints, experiences, and behaviors were found to be-as expected-highly diverse.
The data from this current study indicate little relative gain in the impact of NCCPMC efforts on the elderly. It is uncertain if special efforts have been made by the campaign to do so. Although the McGruff campaign should be used to reach all groups as effectively as possible, it remains an open question as to whether the central campaign themes could be incorporated in ways directed more toward an older adult audience. The findings here clearly suggest that McGruff simply has less appeal to the audience age 60 and over. (On the other hand, the results also indicate a generational maturation with McGruff, with middle-aged adults far more attuned to the PSA's in 1992 than a decade earlier. Within not too many years, the elderly segment will doubtless be more familiar with McGruff.)
Recommendation E
Be cautious about using promotions that emphasize citizens' fear of crime or that attempt to generate action by increasing such fear.
The Phas.e XV PSA's had the greatest potential for evoking emotive reactions to violence as any in the NCCPMC series. They appear to have generated greater concern about crime and possibly generated some fear among audiences. However, thsre were no indications of citizens tuning out the messages because of too much fear. Continued caution is urged, however, if the campaign chooses to use similar techniques. Careful pretesting to determine already existing anxiety levels regarding a particular content area can do much to allow more effective channeling of information.
As noted in the 1981 study, any discussion of crime is apt to raise at least some anxieties among audience members, and there may be no need to go further. A large body of research on appeals to fear indicates that they work best when a moderate amount of anxiety is generated. However, these appeals also have to be coupled with information that shows the audience how anxiety can be reduced through productive action. For instance, a message raising the specter of a child being kidnapped on the way home from school
may invoke fear in parents and children, but ending the same message with specific actions the child can take to minimize such risk will presumably alleviate the fear. The hypothetically aroused fear leads to increased attention to and retention of the message.
Such appeals to fear may be more useful when the threat is unknown or new to the audience, for example, in the early stages of a new health epidemic such as AIDS, or at the beginning of a new type of crime wave unfamiliar to a given population, such as, carjackings. Fear techniques may be effeciive in getting audiences to pay closer attention to messages. When fear is deliberately invoked, however, there is always the risk that citizens will tune out information they find uncomfortable or do not want to confront.
This study is unable to clearly determine the causal direction of increased concern or fear arousal. It cannot identify (a) whether persons who were already more concerned or fearful were more apt to be exposed to, or more attentive to, the PSA's, or (b) whether being exposed to the PSA's made persons more concerned or fearful. It is possible that persons somewhat concerned may have become more concerned by seeing or hearing the messages. A quasiexperimental before-and-after measurement design is needed to distinguish among these options.
Recommendation f
Strive for greater specificity and concreteness in the messages to achieve an increased sense of efficacy and empowerment among citizens.
The existing credibility of the McGruff messages can be used to increase public education about crime and drug abuse prevention by inserting more detailed information about specific actions and tools. One strategy recommended by the 1981 study is the use of more concrete evidence demonstrating the ability of citizen-based preventive measures to reduce the risk and severity of crime.
Demonstrating such actions may form a basis for teachable moments for some citizens, making them more responsive to other crime prevention messages as well. These messages may be even more productive now, and they could include use of validated statistics showing how specific techniques can reduce crime rates, or fear of crime. Attempting to tie these techniqu('s to local situations could be even more productive. Innovative strategies through cooperative
65
community partnerships aimed at crime and drug abuse prevention may be one productive strategy.
The finding that certain preventive actions, including cooperative ones, have increased over the decade can be a firm basis for providing specific information to reinforce those trends. The ability to provide such information would be greatly enhanced by further research to determine in which populations such shifts occurred.
Recommendation G
Experiment further with more direct access avenues such as 800 numbers and related technologies.
The direct response offered by the 800 number in Phase XV was a worthwhile experiment. The ability for audiences to take some form of immediate action following a message can heighten opportunity for more involvement. Although the cost of this approach is clearly a factor, options similar to the national Cancer Information Ser/ice hot line could be explored or, preferably, more localized information telephone services for individual communities could be investigated.
Recommendation H
Encourage greater collaboration among campaign planners and local media and law enforcement authorities to achieve increased efficIencies and effectiveness of crime and drug abuse promotion.
Overall, the media are quite positive about the campaign materials, especially the Phase XV PSA's. They perceive the messages as being effective in promoting crime and drug abuse prevention in their communities. Prevention practitioners were even more positive in these respects.
Other anti-crime and anti-drug abuse programs, such as Crime Stoppers and Partnership for a Drug-Free America, appear to complement the McGruff campaign rather than to compete with it or supplement it. There may be situations or communities in which greater coordination between McGruff and related programs could be attempted. This coordination could include more planned phasing together of related campaign themes or scheduling of PSA distribution to avoid overloading media by the different campaigns
66
simultaneously. However, such coordination needs to be done cautiously: it may not be in the best interest of prevention programs overall to have their identities confused in citizens' minds.
Giving McGruff a local focus provides the potential for even greater PSA placement, particularly if the local thrust is directly linked to the PSA's. It would also be beneficial to remind prevention practitioners and local recipients of NCCPMC materials of the need to work with their local media organizations to keep McGruff in the spotlight. Community crime prevention practitioners appear highly appreciative of national media efforts; therefore, increasing their involvement through regular receipt of PSA materials, press kits, etc., could be of great service to them.
A collaborative suggestion for crime prevention promotion in general is that leaders in the field examine opportunities for reaching the public through a variety of mass media channels. Obviously, crime is already a popular topic of the entertainment media, including "infotainment" and "docudramas," especially on television. To what extent can crime and drug prevention abuse specialists work more closely with the producers of such programs? For example, how can this collaboration promote topics such as the value of citizen involvement in prevention and specific, valid prevention techniques that can be adopted?
Moreover, corporate-sponsored public issues advertising has greatly increased recently, particularly as related to health and environmental issues. The Partnership for a Drug-Free America serves as one largescale example of this increased interest. Individual corporations also have "adopted" particular causes, such as Anheuser Busch's alcohol and traffic safety advertisements. Can any such corporate linkages be useful for crime prevention?
Recommendation I
Set more concretely defined and measurable objectives for future campaign efforts.
Campaign planners should specify more precisely the outcomes being sought in particular campaign phases. it is known that McGruff has "reached" 80 percent of the public, and that more than one-third reported having learned something, and that about one-fifth reported having taken some form of action. However, no criteria exist for measuring the relative
\'t1i1 14
"success" indicated by such numbers. This is a key problem across public information campaigns more generally. Comparable data for similar public information efforts do not yet exist, and there are no "sales" or "profit" figures that can be matched here.
Too often in public information programs overall, such terms as "awareness gain" or "motivation" are used as audience goals, without adequate specification of what is meant by these terms, or of the kind of audience, or proportion of audience members, in which one hopes to bring about the change. The competence model imposed on this evaluation was done so out of necessity: to provide more objective baselines.
These baselines could include estimating, for example, what levels of citizen participation in various activities are optimal for crime reduction in given categories. This information would allow more exact targeting of the campaign toward inducing more appropriate citizen activities within certain groups. Furthermore, it would provide baseline indicators for later comparison purposes. Presumably, such strategies could lead to far more efficient and effective use of media strategies in crime and drug abuse reduction efforts.
Ideally, campaign managers should already have criteria in place. They should attempt to define more clearly the extent to which campaign objectives include simple awareness, information gain, attitude change, motivation, and taking of action. For example, given the kinds of data provided in this and previous evaluations, what proportion of citizens should be encouraged to adopt what kinds of additional preventive behaviors? What kinds of target audiences should receive greater priority? What kinds of audiences particularly need to be made aware of a practice? Among what types of audiences might
attempts be made at changing an attitude toward, say, citizen responsibility for preventing crime?
it's important to stress that criteria for campaign success not be limited to how well it brings about change in the form of increases in desirable knowledge, attitudes, and behaviors. The effectiveness of the campaign can be determined also by the extent to which it reinforces existing positive dispositions in citizens. Everyone needs to be reminded and prodded to stay on track as situations change, as new options become available, and as simple boredom with routine occurs. Mass media have long proven to be highly effective at such reinforcement, whether it involves loyalty to consumer brands or political candidates, or long-term cultural norms.
New issues and causes come to the forefront regularly in the media. Since McGruff's inception alone, the number of significant new issues has included the rise of AIDS, abortion rights, global warming, and a Middle East war, to name but a few. Public service campaigns can make a strong contribution merely by keeping an issue such as crime relatively high on the public agenda in the face of highly serious but competing perils. Unfortunately, measuring such reinforcement from particular media messages is typically more difficult than documenting change because the results are less tangible.
With respect to setting goals and criteria overall, at the very least sponsors can continue building on the data provided by the two national evaluations of the campaign to date. In addition to the NCCPMC evaluative findings, these studies can provide substantial information on changing public views of activity concerning crime and drug abuse. This information can, in turn, provide the context for public policy in that area.
67
- a
BIBLIOGR)\.PHY
ABC (1986). Alcohol and Drug-Related Public Service Announcements. New York, NY: Social Research Unit, American Broadcasting Company.
ABC (1989). Major Alcohol and DrL!g-Related Public Service Announcements: 1970-1984. New York, NY: Social Research Unit, American Broadcasting Company.
ARF (1991). A Strategic Research Approach to Measuring Advertising Effectiveness. New York, NY: Advertising Research Foundation.
Backer, T.E., Rogers, E.M., and Sopory, P. (1992). Designing Health Communication Campaigns: What Works? Newbury Park, CA: Sage.
Bootman, J.L., Rowland, C., and Wertheimer, A.1. (1979). "Cost-Benefit Analysis: A Research for Evaluating Innovative Health Programs." Evaluation and the Health Professions, 2(2): 129-154.
BJA (1991). Enforcement Assistance Program, FY 1991 Discretionary Program Application Kit. Washington, DC: Bureau of Justice Assistance, U.S. Department of Justice.
BJS (1988). Report to the Nation on Crime and Justice. Washington, DC: Bureau of Justice Statistics. U.S. Department of Justice.
Cunningham, W.C., and Taylor, T.H. (1985). Private Security and Policing in America: The Hal/crest Report. Portland, OR: Chaneller Press.
DeJong, W., and Winsten, J.A. (1989). Recommendations for Future Mass Media Campaigns To Prevent Preteen and Adolescent Substance Abuse.
Devine, P.G., and Hirt, E.R. (1989). "Message Strategies for Information Campaigns: A Social Psychological Analysis." In C.Salmon (ed.), Information Campaigns: Balancing Social Values With Social Change. (pp. 229-258). Newbury Park, CA: Sage.
Douglas, D., Westley, B., and Chaffee, S.H. (1970). "An Information Campaign That Changed Community Attitudes." Journalism Quarterly, 47, 479-487.
Eck, J.E., Spelman, W., Hill, D., Stephens, D.W., Stedman, J.R., and Murphy, G.R. (1987). Problem Solving: Problem-Oriented Policing in Newport News. Washington, DC: Police Executive Research Forum.
Federal Bureau of Investigation, U.S. Department of Justice (1991). Crime in the United States, 1990. Washington, DC: U.S. Government Printing Office.
Flanagan, T.J., and Maguire, K. (eds., 1992). Sourcebook of Criminal Justice Statistics 1991. U.S .. Department of Justice, Bureau of Statistics. Washington, DC: U.S. Govemment Printing Office.
Flay, B.R. (1986). Mass Media and Smoking Cessation. Paper presented at the annual convention of the International Communication Association, Chicago,IL.
Flora, J., Roser, C., Chaffee, S., and Farquhar, J.W. (1988). Communication for Heart Disease Prevention. Paper presented to the annual conference of thEI International Communication Association.
Flora, J.A., Maccoby, N., and Farquhar, J.W. (1989). "Communication Campaigns To Prevent Cardiovascular Disease: Tile Stanford Community Studies .. " In R. Rice and C. Atkin, Public Communication Campaigns (2d Ed.). (pp. 233-252). Newbury Park, CA: Sage.
Flora, J.A., Maibach, E., and Maccoby, N. (1~i89). ''The Role of Media Across Four Levels of Hflalth Promotion Intervention." Annual Review of Public Health, 10, pp. 181-201.
Greenberg, S.W. (1987). "Why People Take Precautions Against Crime: A Review of the Literature on Individual and Collective Responses to Crime." In N.D. Weinstein (ed.), Taking Care: Understanding and Encouraging Self-Protective Behavior. (pp. 231-253). New York, NY: Cambridge University.
69
i ,
Greene, J.R., and Mastrofski, S.D. (1988). Community Policing: Rhetoric or Reality. New York, NY: Praeger.
Grunig, J.E. (1989). "Publics, Audiences and Market Segments: Segmentation Principles for Campaigns." In C. Salmon (ed.), Information Campaigns: Balancing Social Values With Social Change. (pp. 199-f!28). Newbury Park, CA: Sage.
Hanneman, G.H., McEwen, W., and Coyne, S. (1973). "Public Service Advertising on Television." Journal of Broadcasting, "17,387-404.
Heinzelmann, F. "Promoting Citizen Involvement in Crime Prevention and Control." In N.D. Weinstein (ed.), Taking Care: Understanding and Encouraging Self-Protective Behavior. (pp. 254-335). New York, NY: Cambridge University Press.
Henry, G.T. (1990). Practical Sampling. Newbury Park, CA: Sage.
Johnston, L.D., O'Malley, P.M., and Bachman, J.G. (1991). Drug Use Among American High School Seniors, College Students, and Young Adults, 1975-1990. Volume 1: High School Seniors. (DHHS Publication No. ADM 91-1813). Rockville, MD: National Institute of Drug Abuse.
Klapper, J.T. (1990). The Effects of Mass Communication. New York, NY: The Free Press.
Kotler, P., and Andreasen, W. (1988). Social Marketing. Englewood Cliffs, NJ: Prentice Hall.
Lab, S.P. (1988). Crime Prevention: Approaches, Practices and Evaluations. New York, NY: Anderson Publishing.
Lavrakas, P.J. (1985). "Citizen Self-Help and Neighborhood Crime Prevention." In L. Curtis (ed.), American Violence and Public Policy. New Haven: Yale University Press.
Lavrakas, P.J., and Bennett, S.F. (1988). "Thinl,ing About the Implementation Citizen Anti-Crime Mea~ sures." In T. Hope and M. Shaw (eds.), Communities and Crime Reduction. London: Home Office.
Lavrakas, P.J., and Rosenbaum, D.P. (198.9). Crime Prevention Beliefs, Policies, and Practices of C'Jief
70
Law Enforcement Executives. Washington, DC: National Crime Prevention Council.
Lavrakas, P.,J., Rosenbaum, D.P., and Lurigio, AJ. (1990). "Media Cooperation with the Police: The Case of Crime Stoppers." In R. Surette (ed.), The Media and Criminal Justice Polfcy. Springfield, IL: Charles C. Thomas.
Lurigio, AJ., and Rosenbaum, D.P. (in press). "The Effects of Mass Media on Crime Prevention Awareness, Attitudes, and Behavior: The Case of Crime Stoppers." Aml3r;can Journal of Criminal Justice.
Lurigio, AJ., and Rosenbaum, D.P. (1990). "Evaluation Research in Community Crime Prevention: A Critical Look at the Field." In D.P. Rosenbaum (ed.), Community Crime Prevention: Does It Work? Beverly Hills, CA: Sage.
McGowan, A. (1980). "Public Service Announcements: What, Where, How." Channels. 4, 38-45.
McGuire, W. (1985). "Attitudes and Attitude Change." In G. Lindzey and E. Aronson (eds.), The Handbook of Social Psychology (3d Ed.). New York, NY: Random House.
McGuire, W.J. (1989). ''Theoretical Foundations of Campaigns." In R.E. Rice and CK Atkin (eds.), Public Communicllition Campaigns (2d Ed.). (pp. 39-42). Newbury Par~;, CA: Sage.
NAB (1984).1984 Public Affairs Survey Regarding Broadcastem' Contributions To Prevent Drunk Driving and Alcohol Misuse. Washington, DC: National Association of Broadcasters.
NAB (1985). The Fight Against Alcohol Misuse: Broadcasters' Contributions November 1984-May 1985. Washington, DC: National Association of Broadcasters.
NCPC (1987). An Attitude and Awareness Study of McGruffthe Crime Dog. Washington, DC: National Crime Prf~vention Council.
NIJ (199((). Evaluating Drug Control and System Improvem€mt Projects. Washington, DC: Nationallnstitute of J~lstice. U.S. Department of Justice.
Needham Porter Novelli. (1985). Survey of Public Service Directors from TV StaUons Representing High and Low Play of High Blood Pressure Messages. Washington, DC: National High Blood Pressure Education Program, National Heart, Lung and Blood Institute.
O'Keefe, G.J. (1985). "Taking the Bite Out of Crime: The Impact of a Public Information Campaign." Communication Research, 12, 147-178.
O'Keefe, G.J. (1986). ''The 'McGruff' National Media Campaign: Its Public Impact and Future Implications." In D. Rosenbaum (ed.), Community Crime Prevention: Does It Work? Beverly Hills, CA: Sage.
O'Keefe, G.J. (1989). "Strategies and Tactics in Political Campaigns." In C. Salmon (ed.), Information Campaigns: Balancing Social Values with Social Change. (pp. 259-284). Newbury Park, CA: Sage.
O'Keefe, G.J., and Reid, K. (1989). "The McGruff Crime Prevention Campaign." In R.E. Rice and C.K. Atkin (eds.), Public Communication Campaigns (2d Ed.). (pp. 210-211). Newbury Park, CA: Sage.
O'Keefe, G.J., and Reid, K. (1990a). "The Uses and Effects of Service Advertising." In J. Grunig and L. Grunig (eds.), Public Relations Research Annual (Vol. 2). Hillsdale, N.J.: Erlbaum.
O'Kf~efe, G.J., and Reid, K. (1990b). "Media Public Information Campaigns and Criminal Justice PolicyBellond 'McGruff.'" In R. Surette and C.C. Thomas (eds.), The Media and Criminal Justice Policy. Springfield, IL.
O'Keefe, G.J., and Reid-Nash, K. (1987). Promoting Crime Prevention Competence Among the Elderly. Washington, DC: National Institute of Justice, U.S. Department of Justice.
Paisley, W. (1989). "Public Communication Campaigns: The American Experience." In R.E. Rice and C.K. Atkin (eds.), Public Communication Campaigns (2d Ed.). (pp. 15-38). Newbury Park, CA: Sage.
Palatz, D.L., Person, R., and Willis, D. (1977). Politics in Public Service Advertising on Television. New York, NY: Springer.
Petty, R.E., and Cacioppo, J.T. (1986). Communication and Persuasion: Central and Peripheral Routes to Attitude Change. New York, NY: Springer.
Rice, RE., and Atkin, C. (1989). Public Communication Campaigns (2d Ed.). Newbury Park, CA: Sage.
Roberts, D., Bachen, C., Christenson, P., and Gibson, W. (1979). Children's Responses to Consumer Information and Nutrition, Information Television Spots. Paper presented at the meeting of the American Psychological Association, New York, NY.
Roehl, J.A., Hersch, R., and Cook, R.F. (1989). Evaluation of the National Crime Prevention Council. New York, NY: Institute for Social Analysis.
Rogers, E.M., and Storey, J.D. "Communication Campaigns." In C. Berger and S. Chaffee, Handbook of Communication Science. (pp. 817-846). Beverly Hills, CA: Sage Publications.
Rosenbaum, D.P. (ed., 1986), Community Crime Prevention: Does It Work? Beverly Hills, CA: Sage Publications.
Rosenbaum, D.P. (1987). ''The Theory and Research Beyond Neighbortlood Watch: Is It a Sound Fear and Crime Reduction Strategy?" Crime and Delinquency, 33, 103-134.
Rosenbaum, D.P. (1988). "Commun!ty Crime Prevention: A Review and Synthesis of the Literature." Justice Quarterly, 5, 323-395.
Rosenbaum, D.P., Bennett, S.F., Lindsay, B., Wilkinson, D., Davis, S., Taranowski, C., and Lavrakas, P.J. (1991). Community Responses to Drug Abuse National Demonstration Program: Results of the Process Evaluation (Report prepared for the National Institute of Justice).
Rosenbaum, D.P., Hernandez, E., and Daughtry, Jr., S. (in press). "Crime Prevention, Fear Reduction, and the Community." In W.A. GeUer (ed.), Local Government Police Management. Washington, DC: International City Management Association.
Rosenbaum, D.P., and Lurigio, A.J. (1985). "Crime Stoppers: Paying the Price." Psychology Today, June, 56-61.
71
Rosenbaum, D.P., and Lurigio, AJ. (1989). "Enhancing Citizen Participation and Solving Serious Crime: A National Evaluation of Crime Stoppers Programs." Crime and Delinquency, 35, 401-420.
Rosenbaum, D.P., Lurigio, A.J., and Lavrakas, P.J. (1S87). Crime Stoppers: A National Evaluation of Program Operations and Effects. Washington, DC: National Institute of Justice.
Rossi, P.H., and Freeman, H.E. (1989). Evaluation: A Systematic Approach (4th Ed.). Beverly Hills, CA: Sage Publications.
Saatchi and Saatchi (1990a). Results of a Tracking Study Conducted To Assess Attitudes and Behavior Among Crime Prevention Practitioners. Washington, DC: National Crime Prevention Council.
Saatchi and Saatchi (1990b). Results of Wave I of a Tracking Study Conducted To Assess Attitudes and Behavior Among the General Public Regarding Crime Prevention. Washington, DC: National Crime Prevention Council.
Saatchi and Saatchi (1990c). Communication Check for "McGruff Files" Execution. Washington, DC: National Crime Prevention Council.
Salcedo, R., Read, H., Evans, J., and Kong, A. (1974). "A Successful Information Campaign on Pesticides." Journalism Quarterly, 51, 91-95.
Salmon, C.T. (1989a). Information Campaigns: Managing the Process of Social Change. Newbury Park, CA: Sage.
Salmon, C. (1989b) "Campaigns for Social 'Improvement': An Overview of Values, Rationales, and Impacts." In C. Salmon (ed.), Information Campaigns: Balancing Social Values and Social Change. (pp.19-53). Newbury Park, CA: Sage.
72
Schanie, C., and Sundel, M. (1978). "A Community Mental Health Innovation in Mass Media Preventive Education: The Alternative Project." American Journal of Community Psychology, 6, 573-581.
Shadish, W.R., Cook, T.D., and Leviton, L.C. (1991). Foundations of Program Evaluation. Newbury Park, CA: Sage.
Skogan, W.G. (1990). Disorder and Decline: Crime and the Spiral of Decay in American Neighborhoods. New York, NY: The Free Press.
Solomon, D.S. (1989). "A Social Marketing Perspective on Communication Campaigns." In R.E. Rice and C.K. Atkin (eds.), Public Communication Campaigns (2d Ed.). Newbury Park: Sage.
Wallerstein, N., and Bernstein, E. (1988). "Empowerment Education: Freire's Ideas Adapted to Health Education." Health Education Quarterly, 15, 379-394.
Weinstein, N.D. (1987a). "Cross-Hazard Consistencies: Conclusions About Self-Protective Behavior." In N. D. Weinstein (ed.), Taking Care: Understanding and Encouraging Self-Protective Behavior. (pp. 325-335). New York, NY: Cambridge University Press.
Weinstein, N.D. (1987b). "Studying Self-Protective Behavior." In N.D. Weinstein (ed.), Taking Car'']: Understanding and Encouraging Self-Protective Behavior. (pp. 1-14). New York, NY: Cambridge University Press.
r ,

ApPENDIX A
TABLES N UMBERED BY SECTION
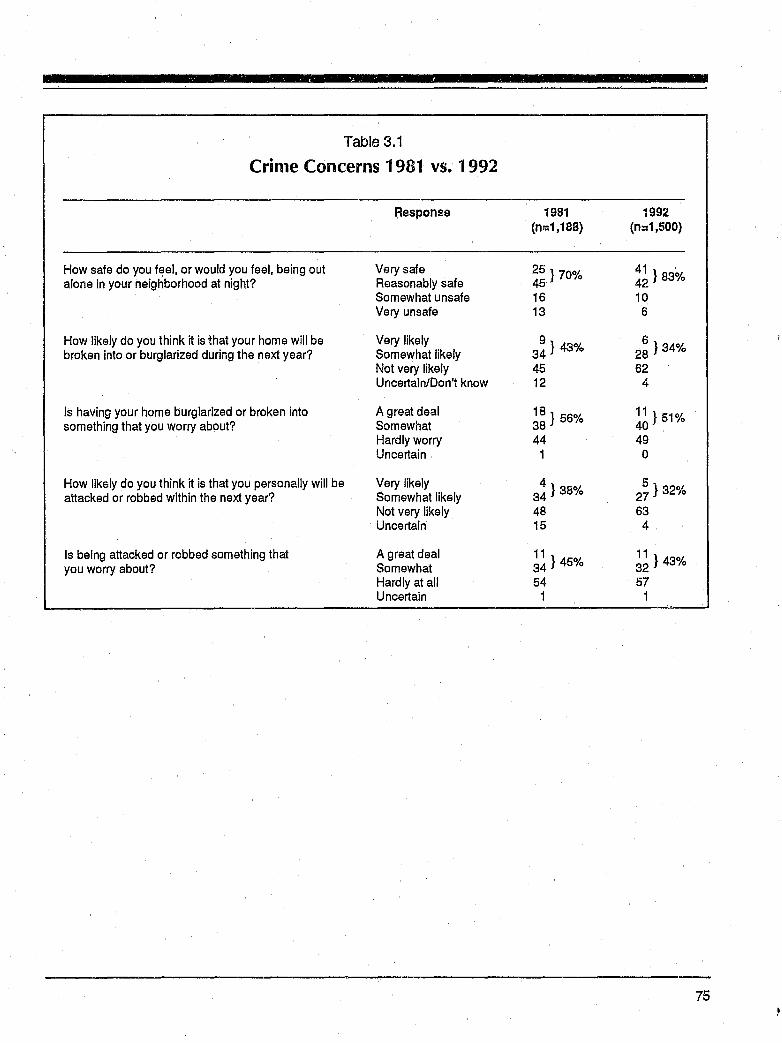
Table 3.1
Crime Concerns 1981 VS. 1992
Response 1981 1992 (n=1,188) (n:1,500)
How safe do you feel, or would you feel, being out Very safe ~~} 70% :1} 83% alone in your neighborhood at night? Reasonably safe Somewhat unsafe 16 10 Very unsafe 13 6
How likely do you think it is that your home will be Very likely 3~} 43% 2~ } 34% broken into or burglarized during the next year? Somewhat likely Not very likely 45 62 Uncertain/Don't know 12 4
Is having your home burglarized or broken into A great deal ~:} 56% !6} 51% something that you worry about? Somewhat Hardly worry 44 49 Uncertain 1 0
How likely do you think it is that you personally will be Very likely 3:} 38% 2~} 32% attacked or robbed within the next year? Somewhat likely
Not very likely 48 63 Uncertain 15 4
Is being attacked or robbed something that A great deal ~!} 45% ~~} 43% you worry about? Somewhat Hardly at all 54 57 Uncertain 1 1
75
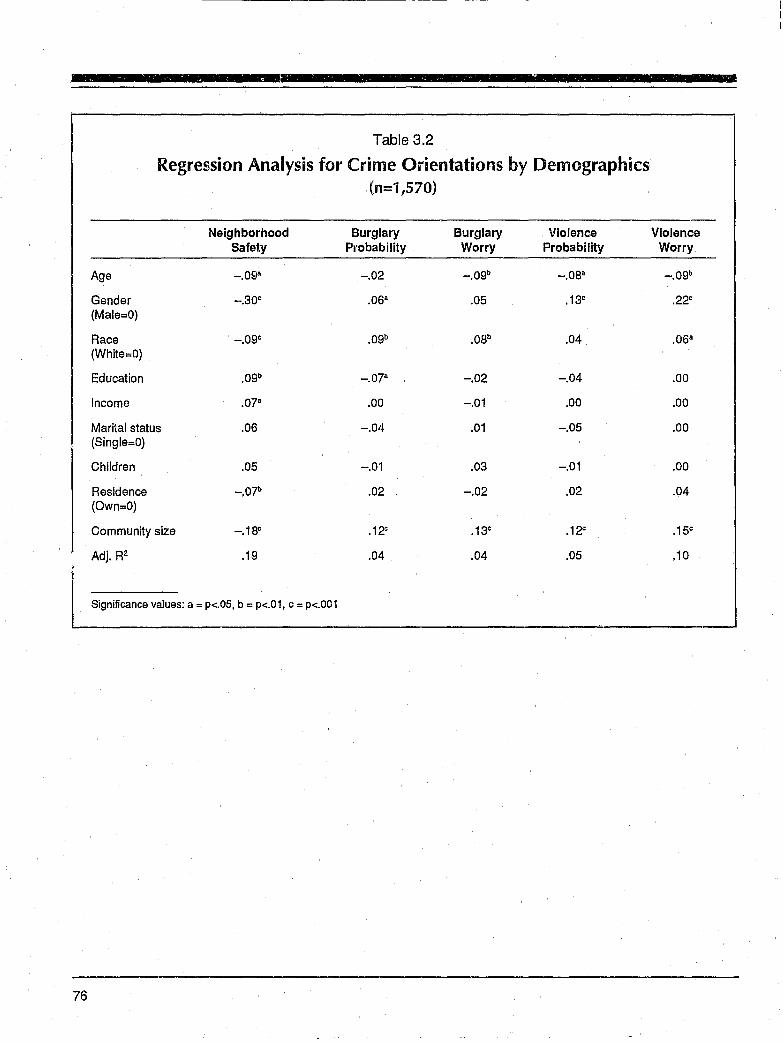
76
.W;
Table 3.2
Regression Analysis for Crime Orientations by Demographics (n=1,570)
Neighborhood Burglary Burglary Violence Safety Probability Worry Probability
Age _.oga -.02 _.Ogb -.08a
Gender -.30C .06a .05 .13c
(Male=O)
Race _.Ogc .Ogb .0Bb .04 (White=O)
Education .Ogb -.07" -.02 -.04
Income .07a .00 -.01 .00
Mar~al status .06 -.04 .01 -.05 (Single=O)
Children .05 -.01 .03 -.01
Residence -.07b .02 -.02 .02 (Own=O)
Community size -.18c .12c .13c .12c
Adj. R2 .19 .04 .04 .05
Significance values: a = p<.05, b = p<.01, C = p<.OO1
-I I
Violence Worry
_.Ogb
.22c
.06a
.00
.00
.00
.00
.04
.150
.10
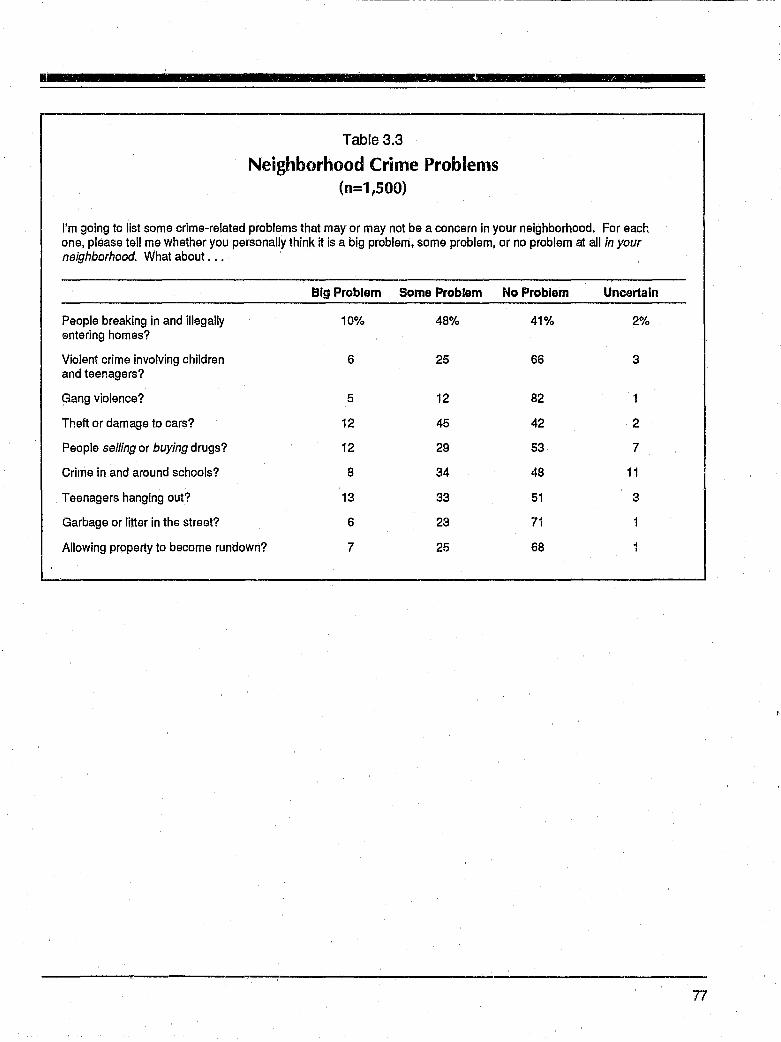
I
Table 3.3
Neighborhood Crime Problems (n=1,500)
I'm going to list some crime-related problems that mayor may not be a concern in your neighborhood. For each one, please tell me whether you personally think it is a big problem, some problem, or no problem at all in your neighborhood. What about .•.
Big Problem
People breaking in and illegally 10% entering homes?
Violent crime involving children 6 and teenagers?
Gang violence? 5
Theft or damage to cars? 12
People selling or buying drugs? 12
Crime in and around schools? 8
Teenagers hanging out? 13
Garbage or litter in the street? 6
Allowing property to become rundown? 7
Some Problem
48%
25
12
45
29
34
33
23
25
No Problem
41%
66
82
42
53
48
51
71
68
Uncertain
2%
3
2
7
11
3
77
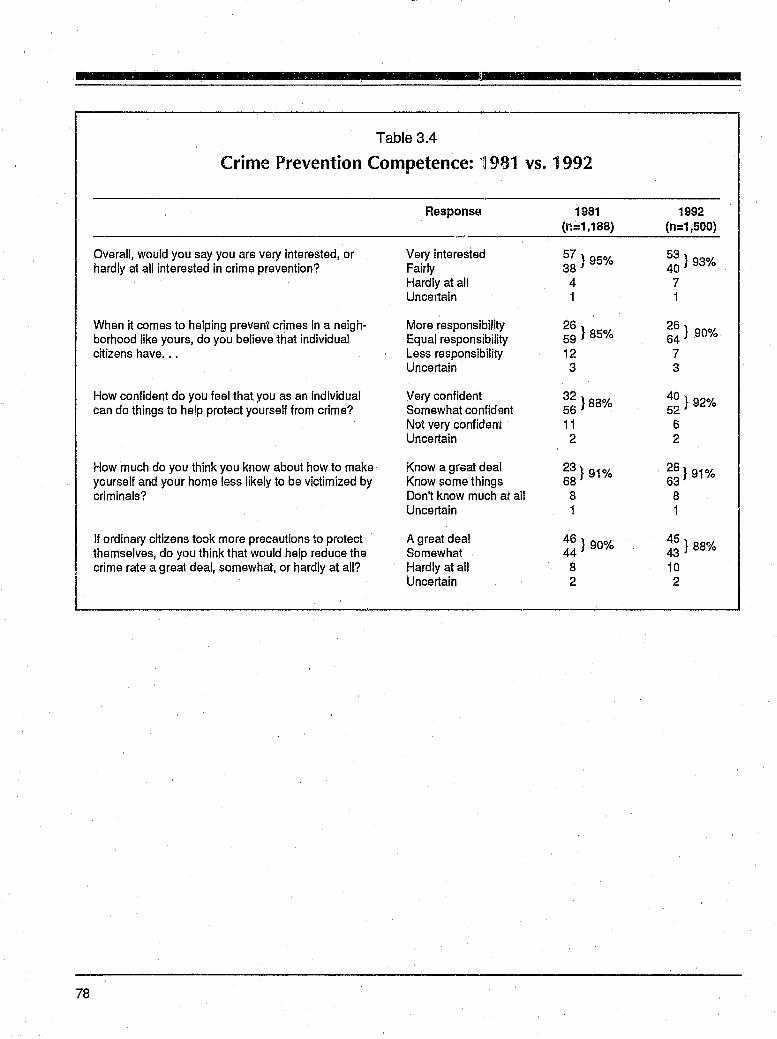
FF
Table 3.4
Crime Prevention Competence: '11981 vs. 1992
Overall, would you say you are very interested, or hardly at all interested in crime prevention?
When it comes to helping prevent crimes in a neighborhood like yours, do you believe that individual citizens have, . ,
How confident do you feel that you as an individual can do things to help protect yourself from crime?
How much do you think you know about how to make yourself and your home less likely to be victimized by criminals?
If ordinary citizens took more precautions to protect themselves, do YI)U think that would help reduce the
Ce a great deal, somewhat, or hardly at all?
78
Response
Very interested Fairly Hardly at all Uncertain
More responsibil1ity Equal responsibility Less responsibility Uncertain
Very confident Somewhat confidtmt N10t very confident Uncertain
Know a great deal Know some things Don't know much at all Uncertain
A great deal Somewhat Hardly at all Uncertain
1981 (n=1,188)
571 950/. 38 j 0
4 1
26 59} 85%
12 3
;~} 88%
11 2
~~} 91%
8 1
:~} 90%
a 2
1992 (n=1,500)
:;} 93%
7 1
~~} 90"/0
7 3
:~} 92%
6 2
~~} 91%
a 1
45} aarro 43 10 2
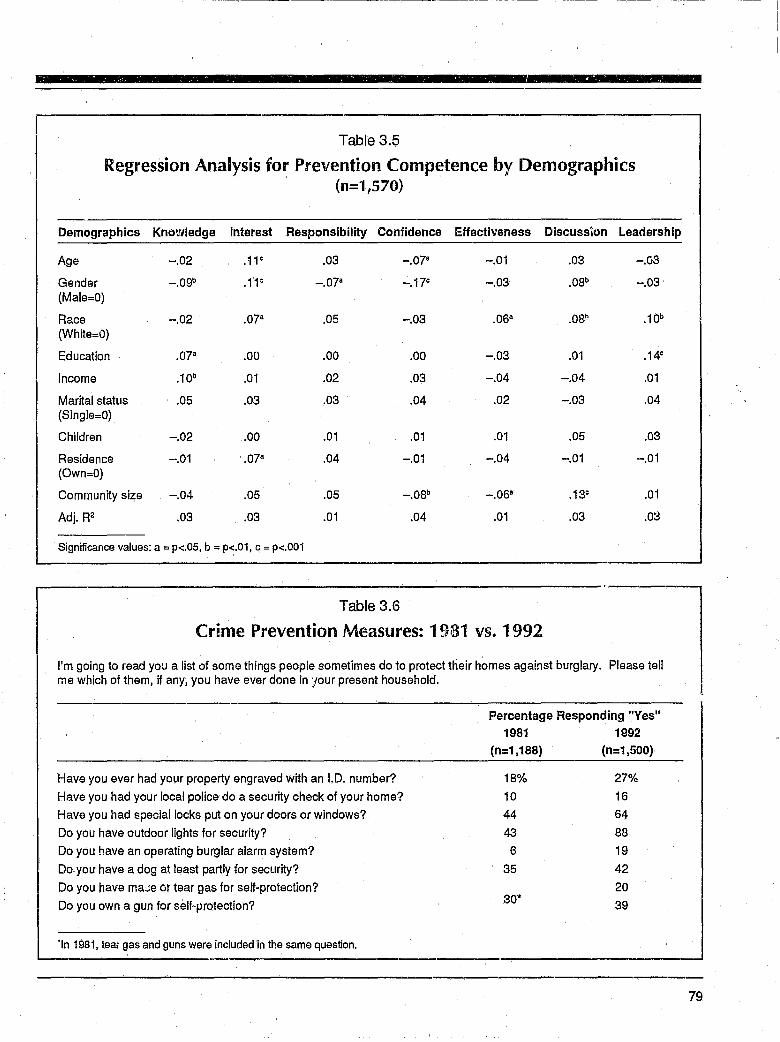
Table 3.5
Regression Analysis for Prevention Competence by Demographics (n=1,570)
Demographics Knowledge Interest Responsibility Confidence Effectiveness Discusslun Leadership
Age -.02 .11 c .03 -.07a ~-.O1 .03 -.03
Gender -.09b .11" -.07a -.17c -.03 .08b -.03 (Male=O)
Race -.02 .078 .05 -.03 .06a .08~ .10b
(White=O)
Education .07a .00 .00 .00 -.03 .01 .14c
Income .10b .01 .02 .03 -.04 -.04 .01
Marital status .05 .03 .03 .04 .02 -.03 .04 (8ingle=0)
Children -.02 .00 .01 .01 .01 .05 .03
Residence -.01 .07a .04 -.01 -.04 -.01 -.01 (Own=O)
Community size -.04 .05 .05 -.08b -.06a .13c .01
Adj. R2 .03 .03 .01 .04 .01 .03 .0:3
Significance values: a = p<.05, b = p<.01, c = p<.OOi
Table 3.6
Crime Prevention Measures: 1981 VS. 1992
I'm going to read you a list of some things people sometimes do to protect their homes against burglary. Please tell me which of them, if any, you have ever done in Jour present household.
Have you ever had your property engraved with an I.D. number?
Have you had your local police do a security check of your home?
Have you had special locks put on your doors or windows?
Do you have outdoor lights for security?
Do you have an operating burglar alarm system?
Do you have a dog at least partly for seculrity?
Do you have maDe or tear gas for self-protection?
Do you own a gun for self-protection?
'In 1981, tea; gas and guns were included in the same question. ~----------"~'--"~'---------
Percentage Responding "Yes"
1981 1992 (n=1,188) (n=1,500)
18% 27%
10 16
44 64
43 88
6 19
35 42
20 30* 39
79
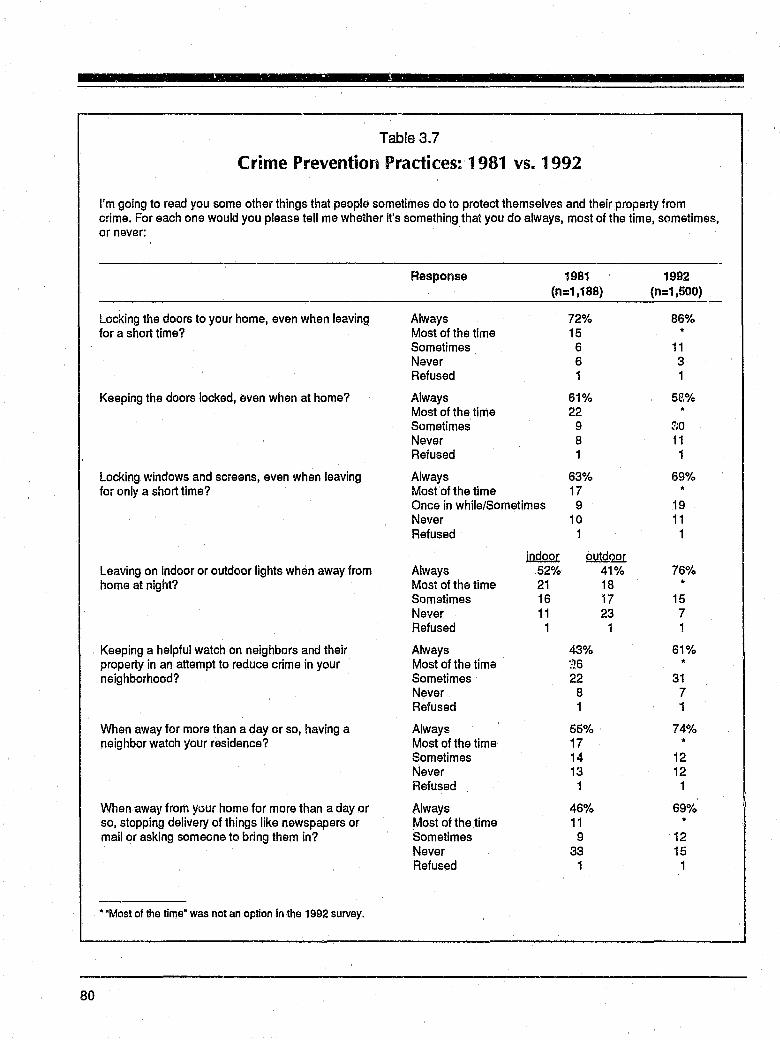
80
- -- --------
Table 3.7
Crime Prevention Practices: 1981 VS. 1992
I'm going to read you some other things that people sometimes do to protect themselves and their property from crime. For each one would you please tell me whether it's something that you do always, most of the time, sometimes, or never:
Locking the doors to your home, even when leaving for a short time?
Keeping the doors locked, even when at home?
Locking windows and screens, even when leaving for only a short time?
Leaving on indoor or outdoor lights when away from home at night?
Keeping a helpful watch on neighbors and their property in an attempt to reduce crime in your neighborhood?
When away for more than a day or so, having a neighbor watch your residence?
When away from your home for more than a day or so, stopping delivery of things like newspapers or mail or asking someone to bring them in?
• "Most of the time" was not an option in the 1992 survey.
Response 1981 (n=1,188)
Always 72% Most of the time 15 Sometimes 6 Never 6 Refused 1
Always 61% Most of the time 22 Sometimes 9 Never 8 Refused 1
Always 63% Most of the time 17 Once in while/Sometimes 9 Never 10 Refused 1
iDQQQr Ql!!Q.QQL Always 52% 41% Most of the time 21 18 Sometimes 16 17 Never 11 23 Refused 1 1
Always 43% Most of the time :16 Sometimes 22 Never 8 Refused 1
Always 55% Most of the time 17 Sometimes 14 Never 13 Refused 1
Always 46% Most of the time 11 Sometimes 9 Never 33 Refused 1
1992 (n=1,500)
86% *
11 3 1
5(',%
~IO
11 1
69%
19 11 1
76% *
15 7 1
61% *
31 7 1
74%
12 12
1
69% *
12 15
1
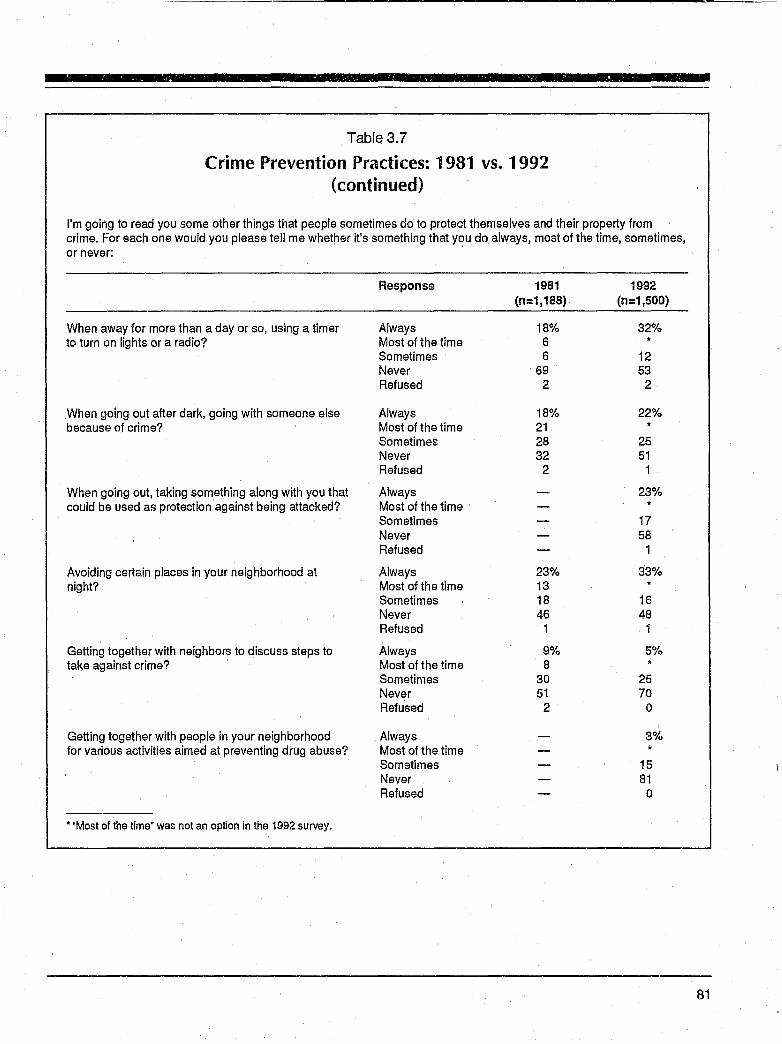
Table 3.7
Crime Prevention Practices: 1981 vs. 1992 (continued)
I'm going to read you some other things that people sometimes do to protect themselves and their property from crime. For each one would you please tell me whether it's something that you do always, most of the time, sometimes, or never:
When away for more than a day or so, using a timer to turn on lights or a radio?
When going out after dark, going with someone else because of crime?
When going out, taking something along with you that could be used as protection against being attacked?
Avoiding certain places in your neighborhood at night?
Getting together with neighbors to discuss steps to take against crime?
Getting together with people in your neighborhood for various activities aimed at preventing drug abuse?
• "Most of the time" was not an option in the 1992 survey.
Response
Always Most of the time Sometimes Never Refused
Always Most of the time Sometimes Never Refused
Always Most of the time Sometimes Never Refused
Always Most of the time Sometimes Never Refused
Always Most of the time Sometimes Never Refused
Always Most of the time Sometimes Never Refused
1981 (n=1,188)
18% 6 6
69 2
18% 21 28 32
2
23% 13 18 46 1
9% 8
30 51
2
1992 (n=1,500)
32%
12 53
2
22% *
25 51 1
23% *
17 58
1
33%
16 48
i
5%
25 70 o
3%
15 81 o
81
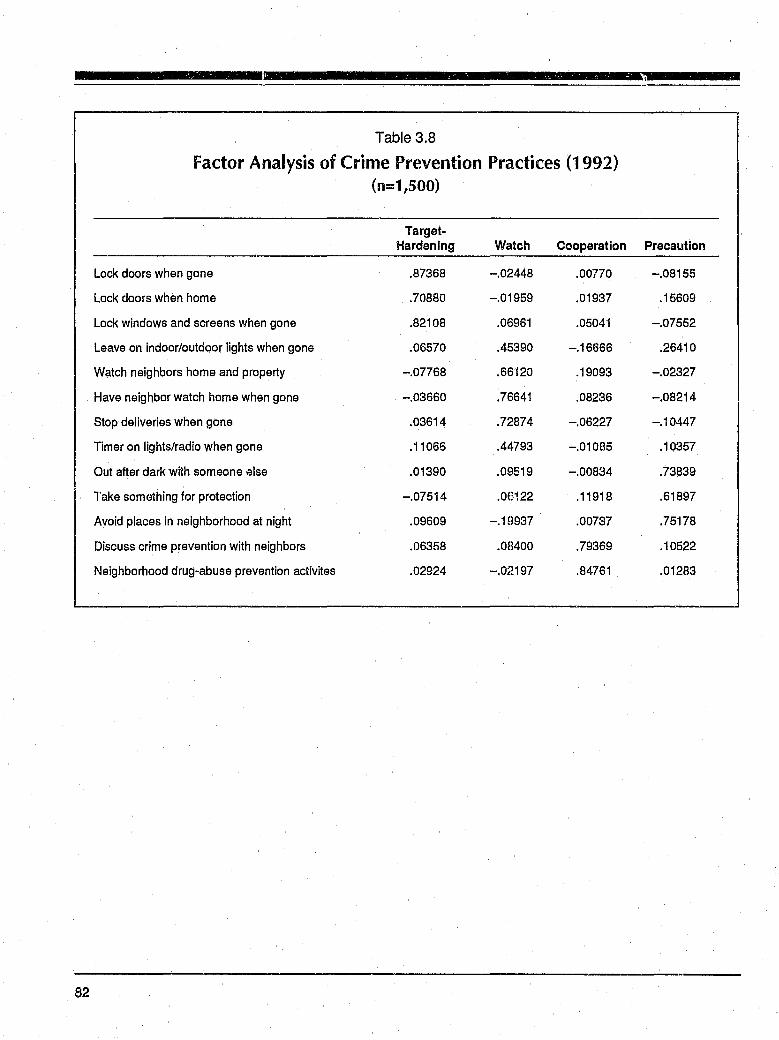
Table 3.8
Factor Analysis of Crime Prevention Practices (1992) (n=1,500)
Target. Hardening Watch Cooperation Precaution
Lock doors when gone .87368 -.02448 .00770 -.08155
Lock doors when home .70880 -.01959 .01937 .15609
Lock windows and screens when gone .82108 .06961 .05041 -.07552
Leave on indoor/outdoor lights when gone .06570 .45390 -.16666 .26410
Watch neighbors home and property -.07768 .66120 .19093 -.02327
Have neighbor watch home when gone -.03660 .76641 .08236 -.08214
Stop deliveries when gone .03614 .72874 -.06227 -.10447
Timer on lights/radio when gone .11066 .44793 -.01085 .10357
Out after dark with someone 1~lse .01390 .09519 -.00834 .73839
rake something for protection -.07514 .0E3122 .11918 .61897
Avoid places in neighborhood at night .09609 -.19937 .00737 .75178
Discuss crime prevention with neighbors .06358 .08400 .79369 .10522
Neighborhood drug-abuse prevention activites .02924 -.02197 .84761 .01283
82
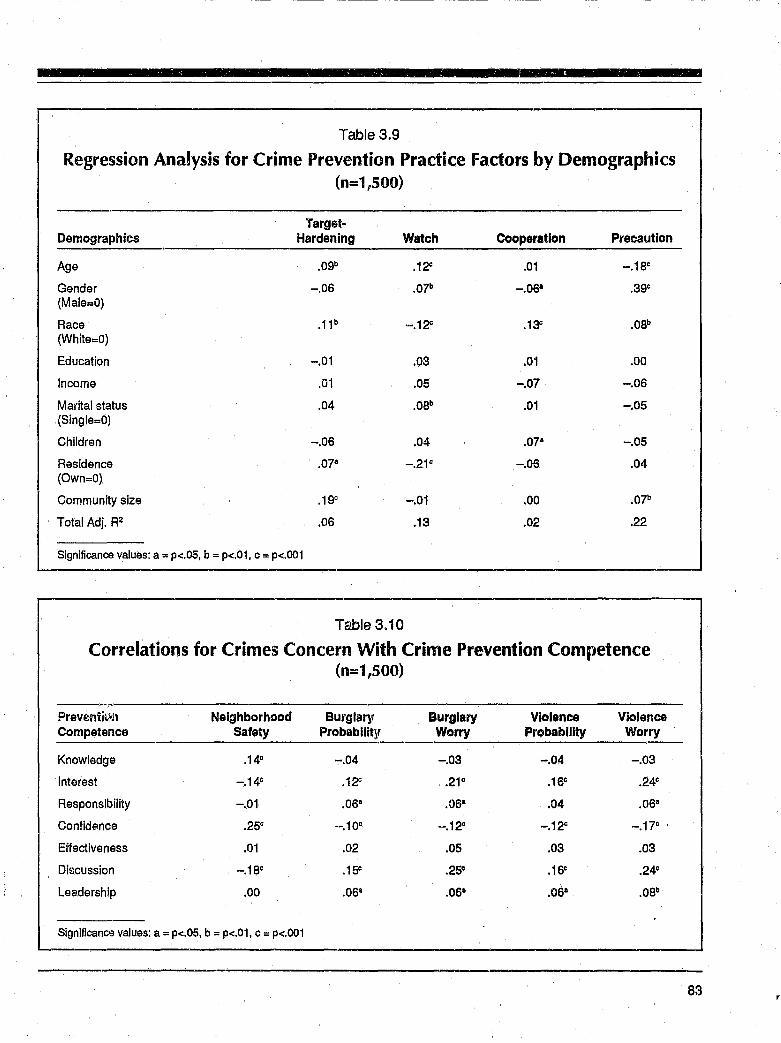
Table 3.9
Regression Analysis for Crime Prevention Practice Fa.ctors by Demographics (n=1,500)
Target-Demographics Hardening Watch Cooperation Precaution
Age .09b .12- .01 -.18C
Gender -.OS .07" -.OS· .39c
(Male=O)
Race .11b -.12- .13" .0Bb (White=O)
Education -.01 .03 .01 .00
Income .01 .05 -.07 -.OS
Marital status .04 .0Bb .01 -.05 (Single=O)
Children -.OS .04 .07a -.05
Residence .07' -.21 C -.06 .04 (Own=O)
Community size .19c -.01 .00 .07b
Total Adj. R2 .06 .13 .02 .22
Significance values: a = p<.05, b = p<.01, c = p<.OO1
Table 3.10
Correlations for Crimes Concern With Crime Prevention Competence (n=1,500)
Prev~nii~'~l Neighborhood Burglal1( Burglary Violence Violence Competence Safety Probabllit~' Worry Probability Worry
Knowledge .14c -.04 -.03 -.04 -.03
Interest -.14c .12" .21c .1Sc .24c
Responsibility -.01 .osa .OS· .04 .OS"
Confide-nee .25C -.10c -.12C -.12c -.17"
Effectiveness .01 .02 .05 .03 .03
Di~lcussion -.1B" .15" .25· .1Sc .24"
Leadership .00 .osa .OS8 .OS- .0Bb
SignificanClil values: a = p<.05, b = p<.01, C = p<.OO1
83
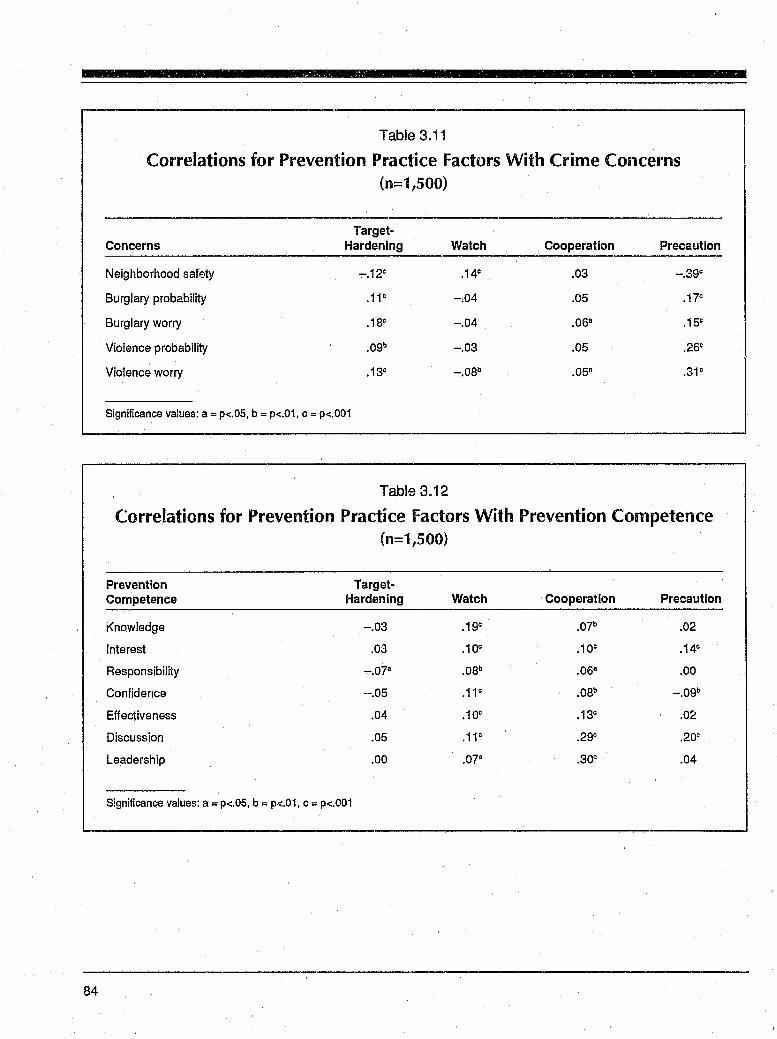
Table 3.11
Correlations for Prevention Practice Factors With Crime Concerns (n=1,500)
Target-Concerns Hardening
Neighborhood safe·ty -.12c
Burglary probability .11C
Burglary worry .1Sc
Violence probability .09h
Watch
.14·
-.04
-.04
-.03
Cooperation
.03
.05
.06"
.05
Precaution
-.39C
.17C
.15C
.26C
•
Violence worry 1 <;lc -.OSb • v
L ______________________ ·_
05
" ____ ._31
CJ _ Significance values: a = p<.05, b = p<.01, C = p<.001
84
Table 3.12
Correlatiions for Prevention Practice Factors With Prevention Competence (n=1,500)
Prevention Target-Competence Hardening Watch Cooperation Precaution
Knowledge -.03 .19C .07b .02
Interest .03 .10c .10c .14C
Responsibility -.07" .0Sb .06" .00
Confidence -.05 .11c .0Sb -.OSb
Effectiveness .04 .10c .13c .02
Discussion .05 .11c .2Sc .20C
Leadership .00 .07" .30C .04
Significance values: a = p<.05, b = p<..01, C = p<.001
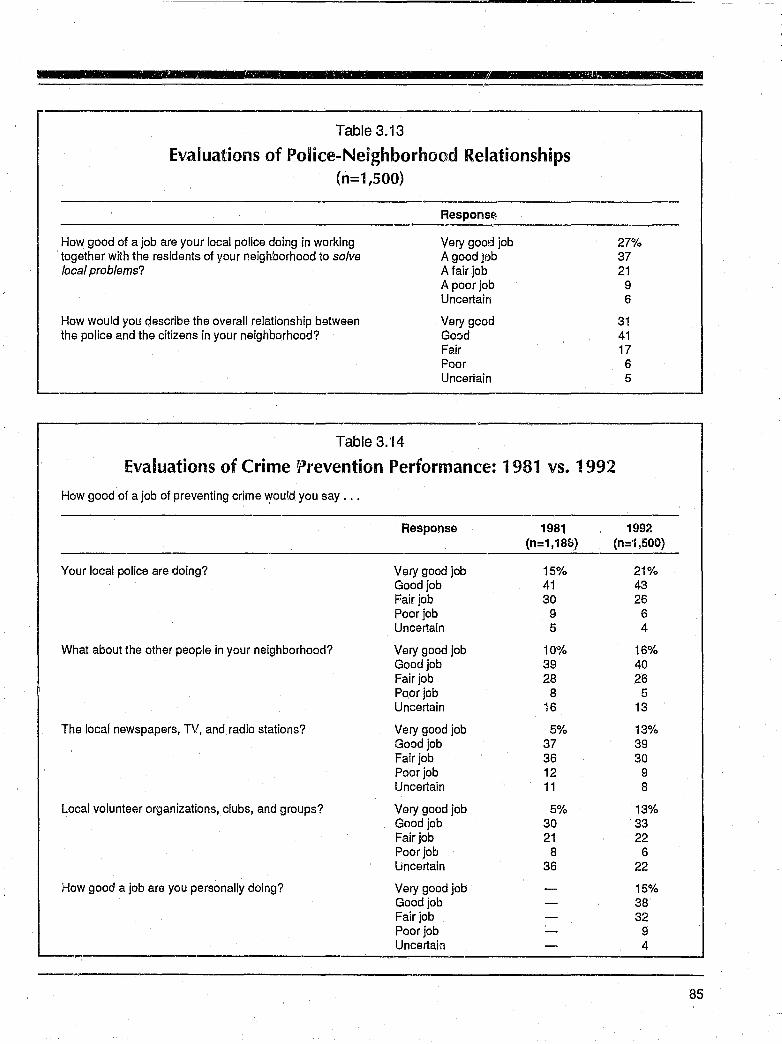
m i.
Table 3.13
Evaluations of Police-Neighborhood Relationships (n=1,500)
How good of a job are your local police doing in working together with the residents of your neighborhood to solve local problems?
How would you cjescribe the overall relationship between the police and the citizens in your neighborhood?
Table 3.14
ResponsE>
Very good job A good jt>b A fair job A poor job Uncertain
Very good Good Fair Poor Uncertain
..
27% 37 21
9 6
31 41 17
6 5
Evaluations of Crime Prevention Performance: 1981 vs. 1992
How good of a job of preventing crime woul.d you say ...
Response 1981 1992 (n=1,18&) (n=1,500)
Your local police are doing? Very good job 15% 21% Good job 41 43 Fair job 30 26 Poor job 9 6 Uncertain 5 4
What about the other people in your neighborhood? Very good job 10% 16% Good job 39 40 Fair job 28 26 Poor job 8 5 Uncertain 16 13
The local newspapers, TV, and radio stations? Very good job 5% 13% Good job 37 39 Fair job 36 30 Poor job 12 9 Uncertain 11 8
Local volunteer organizations, clubs, and groups? Very good job 5% 13% Good job 30 33 Fair job 21 22 Poor job 8 6 Uncertain 36 22
How good a job are you personally doing? Very good job 15% Good job 38 Fair job 32 Poor job 9 Uncertain 4
--.,-------------------85
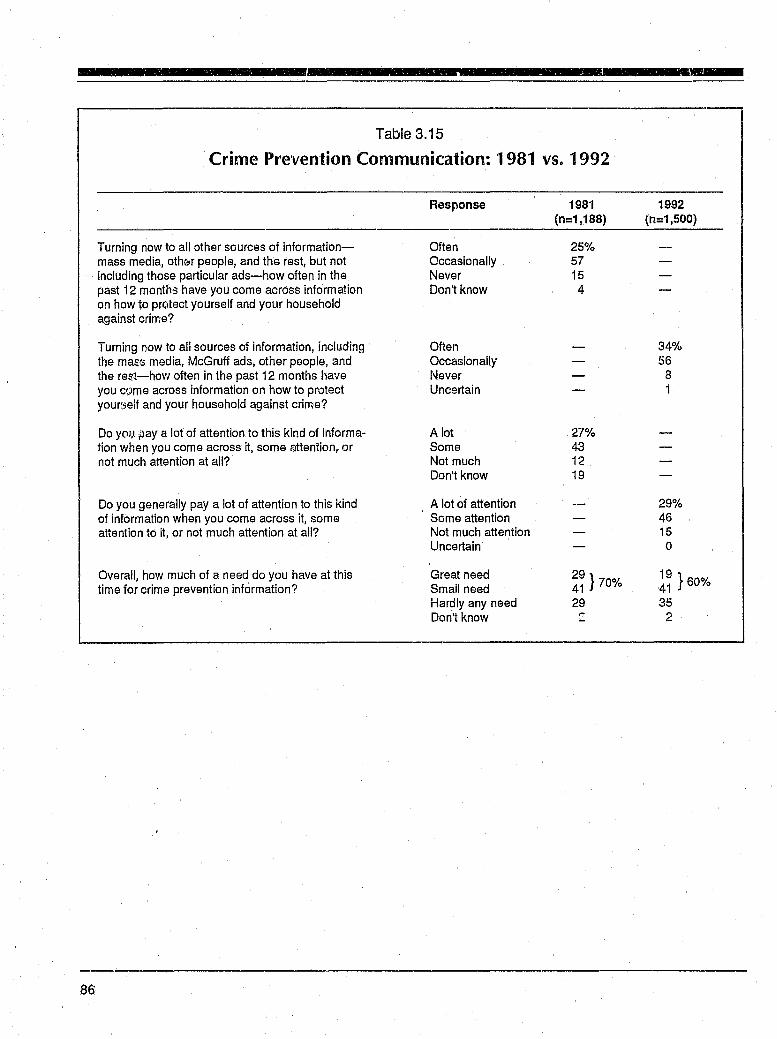
-
86
Table 3.15
Crime Prevention Communication: '1981 vs. 1992
Turning now to all other sources of informationmass media, oth!';;r people, and the rest, but not including those particular ads-how often in the past 12 months have you come across information on how to protect yourself and your household against crime?
Turning now to all sources of information, including the ma~s media, McGruff ads, other people, and the reS;.l-how often in the past 12 months have you come across information on how to protect youn~elf and your household against crime?
Do Y('ll) pay a lot of attention to this kind of information when you come across it, some mttention, or not much attention at all?
Do you generally pay a lot of attention to this kind of information when you come across it, some attention to it, or not much attention at all?
Overall, how much of a need do you have at this time for crime prevention information?
Response
Often Occasionally Never Don't know
Often Occasionally Never Uncertain
A lot Some Not much Don't know
A lot of attention Some attention Not much attention Uncertain
Great need Small need Hardly any need Don't know
1981 (n=1,188)
25% 57 15
4
27% 43 12 19
~~} 70%
29 ... -
1992 (n=1,500)
34% 56
8 i
29% 46 15
0
l~ } 60%
35 2
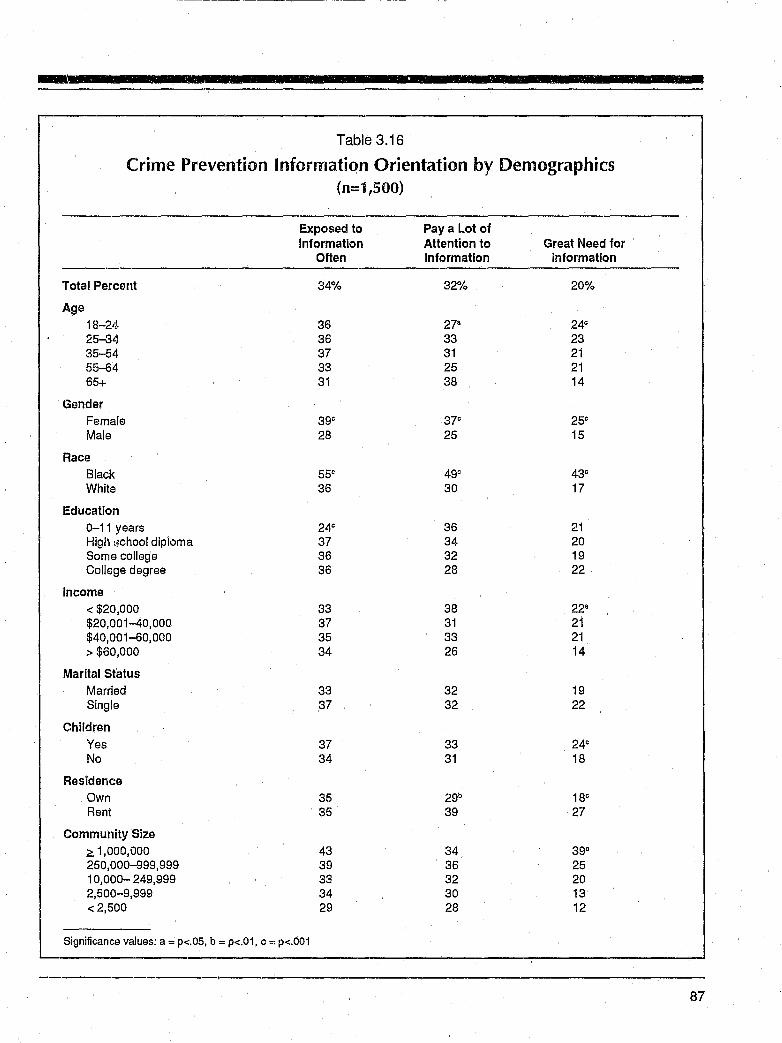
Table 3.16
Crime Prevention Information Orientation by Demographics (n=1,500)
Exposed to Pay a Lot of Information Attention to Great Need for
Often Information Information -_. Total Pe.rcent 34% 32% 20%
Age 18-24 36 27" 24° 25-34 36 33 23 35-54 37 31 21 55-B4 33 25 21 65+ 31 38 14
Gender Female 39° 37° 25° Male 28 25 15
Race Black 55° 49° 43° White 36 30 17
Education 0-11 years 24° 36 21 High lj;chool diploma 37 34 20 Some college 36 32 19 College degree 36 28 22
Income < $20,000 33 38 22" $20,001-40,000 37 31 21 $40,OO1-B0,OOO 35 33 21 > $60,000 34 26 14
Marital Status Married 33 32 19 Single 37 32 22
Children Yes 37 33 24° No 34 31 18
Residence Own 35 2gb 18° Rent 35 39 27
Community Size ~ 1,000,000 43 34 39° 250,000-999,999 39 36 25 10,000- 249,999 33 32 20 2,500-9,999 34 30 13 < 2,500 29 28 12
Significance values: a = p<.05, b = p<.01, c :, p<.OO1
87
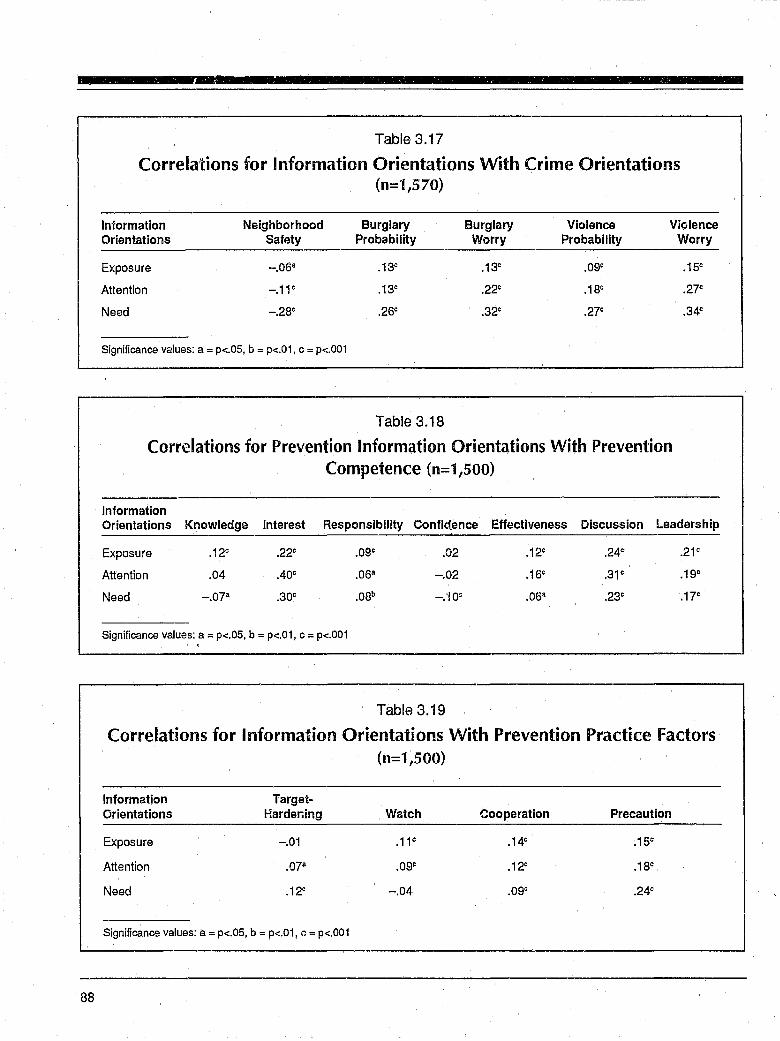
88
Table 3.17
Correlations for Information Orientations With Crime Orientations (n=1,570)
Information Neighborhood Burglary Burglary Violence Viplence Orientations Safety Probability Worry Probability
Exposure -.06a .13C .13c .09C
Attention -.11C .13C .22c .18C
Need -.28C .26C .32C .27C
Significance values: a = p<.05, b = p<.01, C = p<.OO1
Table 3.18
Correlations for Prevention Information Orientations With Prevention Competence (n=1,500)
Information
Worry
.15C
.27C
.34c
Orientations Knowledge Interest Responsibility Confidence Effectiveness Discussion Leadership
Exposure .12c .22C .09c .02 .12c .24c .21C
Attention .04 .40c .06a -.02 .16c .31 c .19C
Need -.07a .30C .0Sb _.'jOO .06a .23C .17c
Significance values: a = p<.05, b = p<.01, C = p<.OO1 "
Table 3.19
Correlations for Information Orientations With Prevention Practice Factors (n=1,500)
Information Target-Orientations Hardening Watch Cooperation Precaution
Exposure -.01 .11 c .14c .15C
Attention .07a .09" .12c .18C
Need .12C -.04 .09C .24c
Significance values: a = p<.05, b = p<.01, C = p<,001
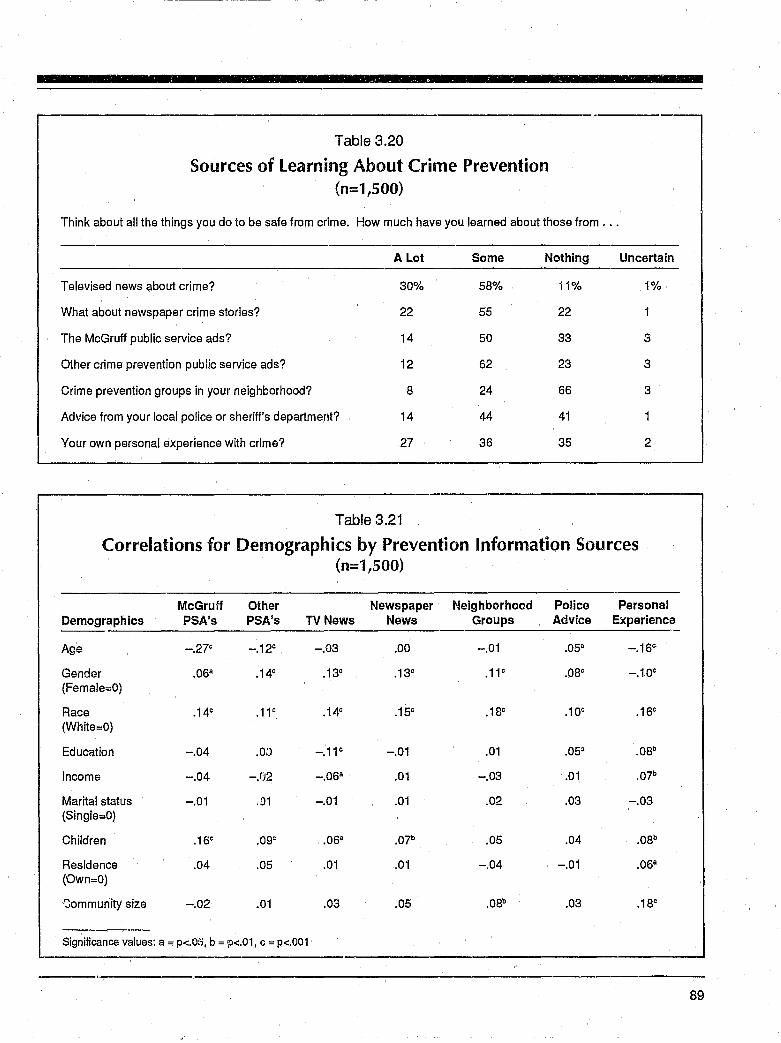
Table 3.20
Sources of learning About Crime Prevention (n=1,500)
Think about all the things you do to be safe from crime. How much have you learned about those from ...
A Lot
Televised news about crime? 30%
What about newspaper crime stories? 22
The McGruff public service ads? 14
Other crime prevention public service ads? 12
Crime prevention groups in your neighborhood? 8
Advice from your local police or sheriff's department? 14
Your own personal experience with crime? 27
Table 3.21
Some
58%
55
50
62
24
44
36
Nothing
11%
22
33
23
66
41
35
Uncertain
1%
3
3
3
2
Correlations for Demographics by Prevention Information Sources (n=1,500)
McGruff Other Newspaper Neighborhood Police Personal Demographics PSA's PSA's TV News News Groups Advice Experience
Age -.27C -.12c -.03 .00 -.01 .05a -.16C
Gender .06· .14c .13c .13t .11 c .08C -.10c
(Female=O)
Race .14C .11c .14e .15e .18e .10e .16e
(White=O)
Education -.04 .OD -.11" -.01 .01 .05~ .08b
Income -.04 -,(.12 -.06a .01 -.03 .01 .07b
Marital status -.01 ,D1 -.01 .01 .02 .03 -.03 (Single=O)
Children .16e .0ge .06a .07b .05 .04 .08b
Residence .04 .05 .01 .01 -.04 -.01 .06· COwn=O)
.r:)ommunity size -.02 .01 .03 .05 .08b .03 .18e
Significance values: a = p<.OfJ, b = ))<.01, C = p<.001
89
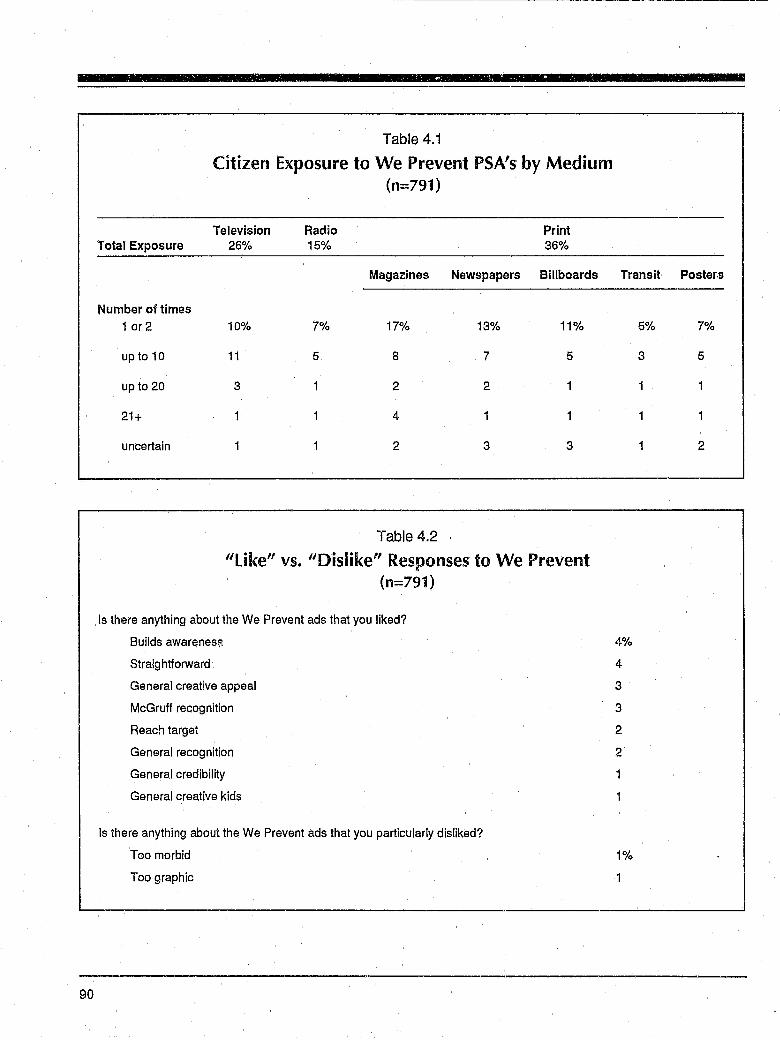
90
Table 4.1
Citizen Exposure to We Prevent PSA's by Medium (n=791)
Television Radio Print Total Exposure 26% 15% 36%
Magazines Newspapers Billboards
Number of times
1 or 2 10% 7% 17% 13% 11%
up to 10 11 5 8 7 5
up to 20 3 2 2
21+ 4
uncertain 2 3 3
Table 4.2 .
"Like" vs. "Dislike" Responses to We Prevent (n=791)
Is there anything about the We Prevent ads that you liked?
Builds awarenesf,
Straig htforward
General creative appeal
McGruff recognition
Reach target
General recognition
General credibility
General creative kids
Is there anything about the We Prevent ads that you particularly disliked?
Too morbid
Too graphic
Transit
4%
4
3
3
2
2
1
1%
5%
3
Postenl
7%
5
2
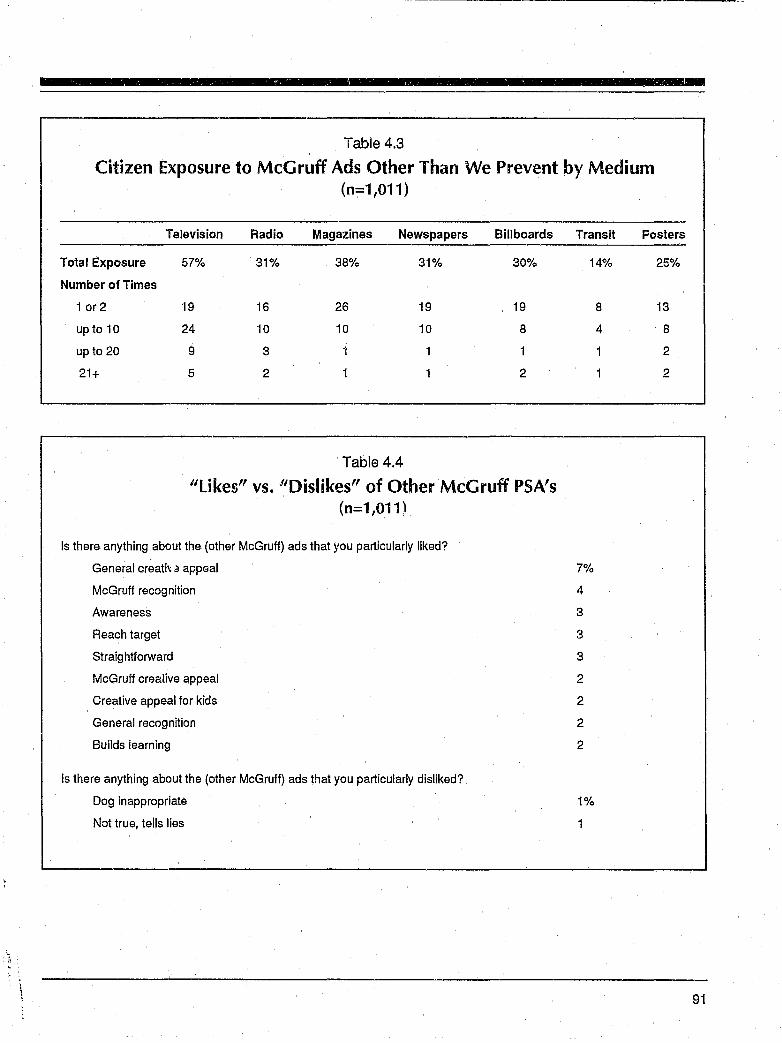
Table 4.3
Citizen Exposure to McGruff Ads Other Than We Prevent by Medium (n=l,Oll)
Television Radio Magazines Newspapers Billboards Transit Posters
Total Exposure 57% 31% 38% 31% 30%
Number of Times
1 or 2 19 16 26 19 19
up to 10 24 10 10 10 8
up to 20 9 3
21+ 5 2 2
Table 4.4
"Ukes" vs. "Dislikes" of Other McGruff PSA's (n=1,011)
Is there anything about the (other McGruff) ads that you particularly liked?
General creati\ d appeal
McGruf! recognition
Awareness
Reach target
Straightforward
McGruff creative appeal
Creative appeal for kids
General recognition
Builds learning
Is there anything about the (other McGruff) ads that you particularly disliked?
Dog inappropriate
Not true, tells lies
14% 25%
8 13
4 8
2
2
7%
4
3
3
3
2
2
2
2
1%
91
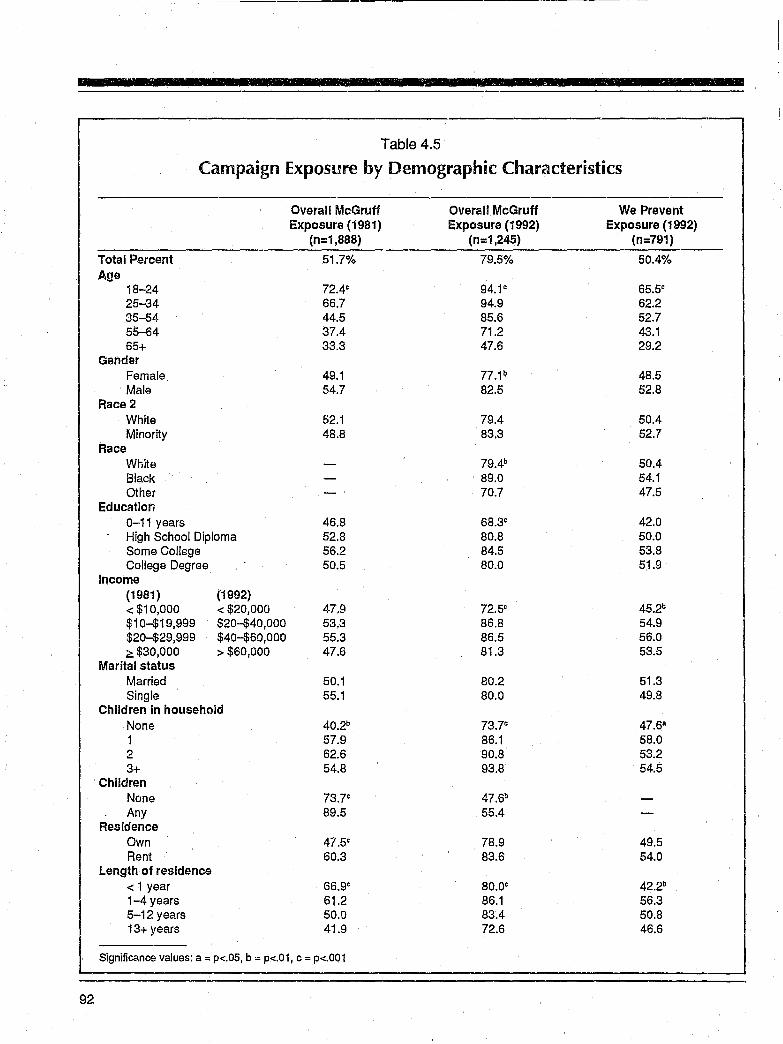
92
Table 4.5
Campaign Exposure by Demographic Characteristics
Overall McGruff Exposure (1981)
(n:1,888)
Total Percent 51.7% Age
18-24 72.4e
25-34 66.7 35-54 44.5 55-64 37.4 65+ 33.3
Gender Female 49,1 Male 54.7
Race 2 White 52.1 Minority 48.8
Race White Black Other
Education 0-11 years 46.8 High School Diploma 52,8 Some College 56.2 College Degree 50.5
Income (1981) (1992) < $10,000 < $20,000 47.9 $10-$19,999 $20-$40,000 53.3 $20-$29,999 $40-$60,000 55.3 2$30,000 > $60,000 47.6
Marital status Married 50.1 Single 55.1
Children in household None 40.2b 1 57.9 2 62.6 3+ 54.8
Children None 73.7" Any 89,5
Residence Own 47.5" Rent 60.3
Length of residence < 1 year 66,ge
1-4 years 61.2 5-12 years 50.0 13+ ~Iears 41.9
Significance values: a = p<.05, b = p<.01, C = p<.OO1
Overall McGruff Exposure (1992)
(n=1,245)
79.5%
94.1e 94.9 85.6 71.2 47.6
77.1 b
82.5
79.4 83,3
79.4b
89.0 70.7
68.3e
80.8 84.5 80.0
72.5e
86.8 86.5 81.3
80.2 80.0
73,7" 86.1 90.8 93.8
47.6b
55.4
78.9 83,6
80.0e
86.1 83.4 72.6
We Prevent Exposure (1992)
(n=791)
50.4%
65.5e
62.2 52.7 43.1 29.2
48.5 52.8
5004 52.7
50.4 54.1 47.5
42.0 50.0 53.8 51.9
45.2b 54.9 56.0 53.5
51.3 49.8
47.6" 58.0 53.2 54.5
49.5 54.0
42.2b 56.3 50.8 46.6
Ie
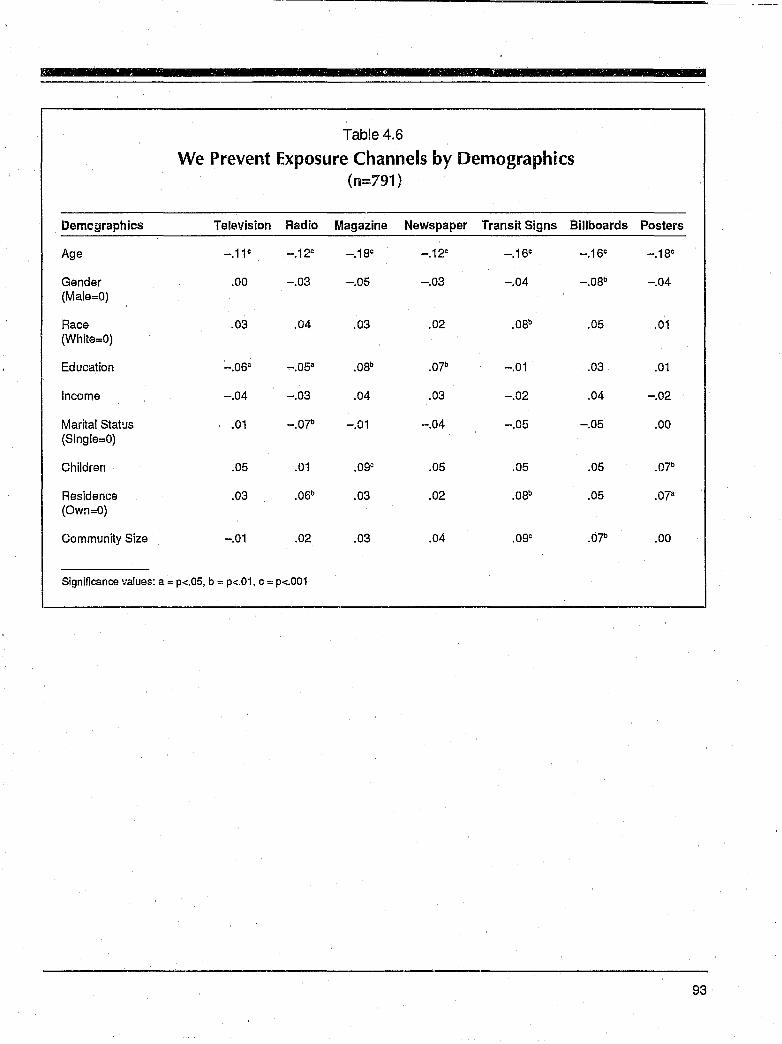
8
Table 4.6
We Prevent Exposure Channels by Demographics (n::791 )
Demcgraphics Television Radio Magazine Newspaper Transit Signs Billboards Posters
Age -.11" -.12° -.18° -.12° -.16° -.16° -.18°
Gender .00 -.03 -.05 -.03 -.04 -.OBb -.04 (Male=O)
Race .03 .04 .03 .02 .0Bb .05 .01 (White=O)
Education -.06a -.05a .0Bb .07b -.01 .03 .01
Income -.04 -.03 .04 .03 -.02 .04 -.02
Marital Status .01 -.o?b -.01 -.04 -.05 -.05 .00 (Single=O)
Children .05 .01 .09° .05 .05 .05 .07b
Residence .03 .06b .03 .02 .0Bb .05 .07a
(Own=O)
Community Size -.01 .02 .03 .04 .0ge .07b .00
Significance values: a = p<.05, b = p<.01. c = p<.OO1
93
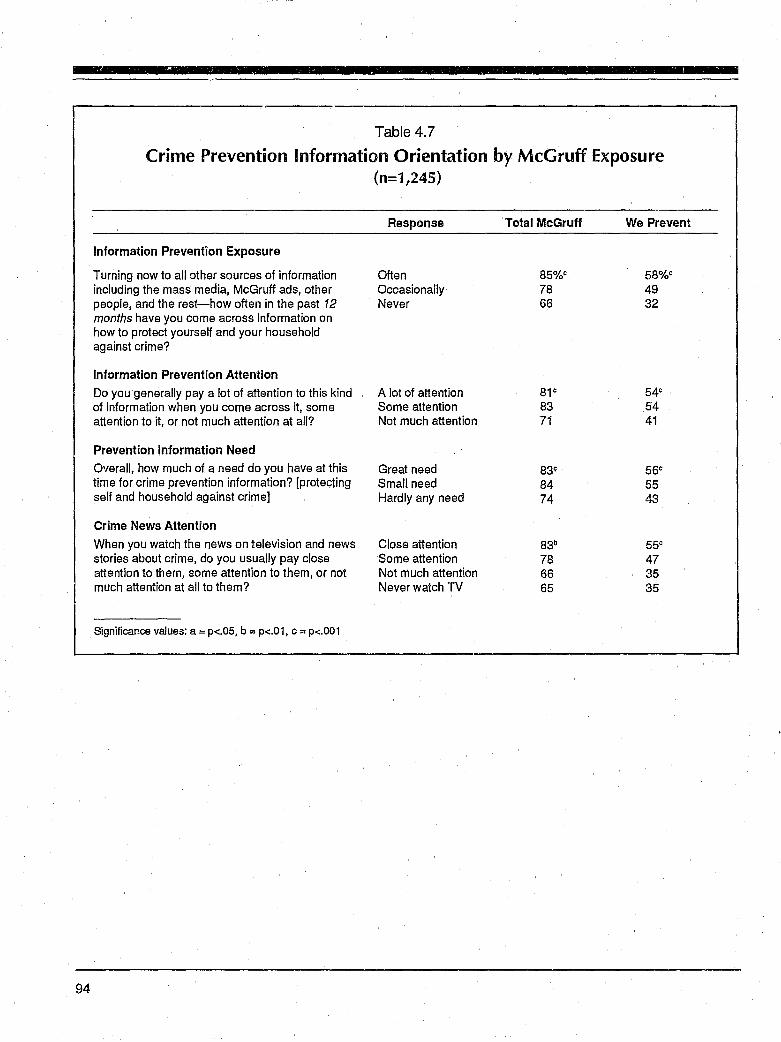
94
Table 4.7
Crime Prevention Information Orientation by MeG ruff Exposure (n=1,245)
Response Total McGruff We Prevent
Information Prevention Exposure
Turning now to all other sources of information Often 85%" 58%" including the mass media, McGruff ads, other Occasionally 78 49 people, and the rest-how often in the past 12 Never 66 32 months have you come across information on how to protect yourself and your household against crime?
Information Prevention Attention
Do you generally pay a lot of attention to this kind A lot of attention 81" 54c
of information when you come across it, some Some attention 83 54 attention to it, or not much attention at all? Not much attention 71 41
Prevention Information Need
O'lerall, how much of a need do you have at this Great need 83" 56" time for crime prevention information? [protecting Small need 84 55 self and household against crime] Hardly any need 74 43
Crime News Attention
When you watch the news on television and news Close attention 83b 55" stories about crime, do you usually pay close Some attention 78 47 attention to them, some attention to them, or not Not much attention 66 35 much attention at all to them? Never watch TV 65 35
Significance values: a = p<.05, b = p<.01, C = p<.OO1
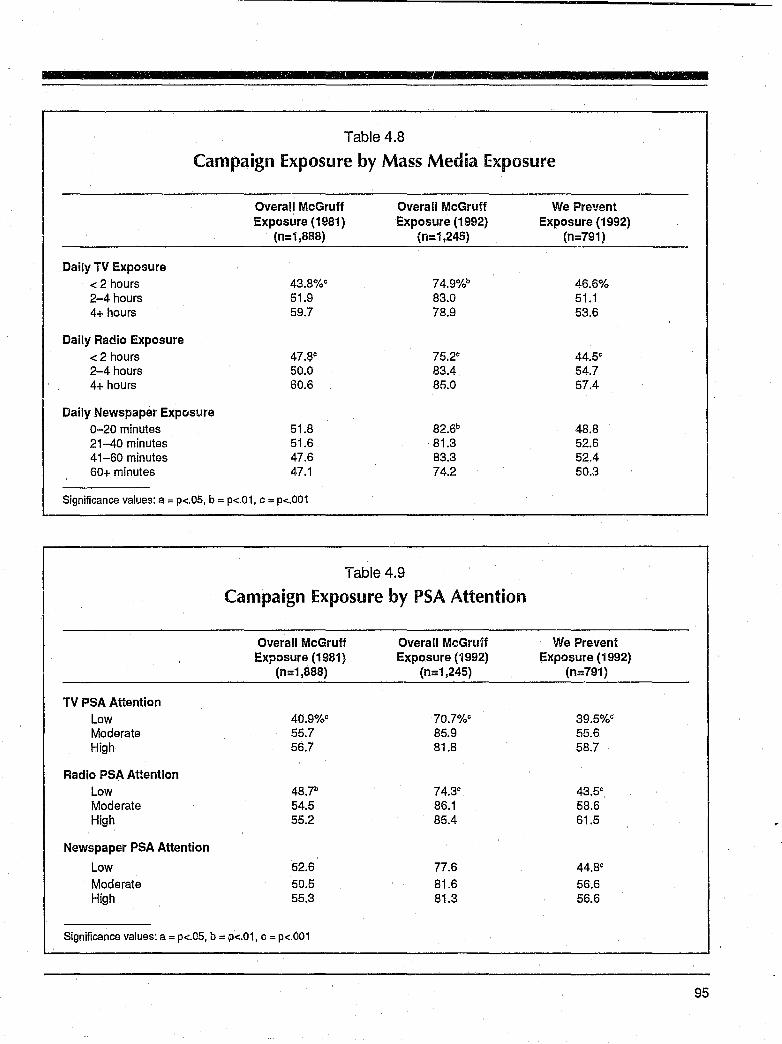
Table 4.8
Campaign Exposure by Mass Media Exposure
Overall McGruff Overall McGruff We Prevent Exposure (1981) Exposure (1992) Exposure (1992)
(n=1,888) (n=1,245) (n=791)
Daily TV Exposure < 2 hours 43.8%" 74.9%b 46.6% 2-4 hours 51.9 83.0 51.1 4+ hours 59.7 78.9 53.6
Daily Radio Exposure < 2 hours 47.8c 75.2c 44.5° 2-4 hours 50.0 83.4 54.7 4+ hours 60.6 85.0 57.4
Daily Newspaper Exposure 0-20 minutes 51.8 82.6b 48.8 21-40 minutes 51.6 81.3 52.6 41-60 minutes 47.6 83.3 52.4 60+ minutes 47.1 74.2 50.3
Significance values: a = p<.05, b = p<.01, C = p<..OO1
Table 4.9
Campaign Exposure by PSA Attention
Overall McGruff Overall McGru1ff We Prevent Exposure (1981) Exposure (1992) Exposure (1992)
(n=1,888) (n=1,245) (n=791) -------------------------------------------------------------TV PSA Attention
Low Moderate High
Radio PSA Attention Low Moderate High
Newspaper PSA Attention
Low Moderate High
40.9%C 55.7 56.7
48.7b
54.5 55.2
52.6 50.5 55.3
Significance values: a = p<.05, b = p<.01, C = p<.001
70.7%° 85.9 81.8
74.3C
86.1 85.4
77.6 81.6 81.3
39.5%C 55.6 58.7
43.5° 58.6 61.5
44.8C
56.6 56.6
95
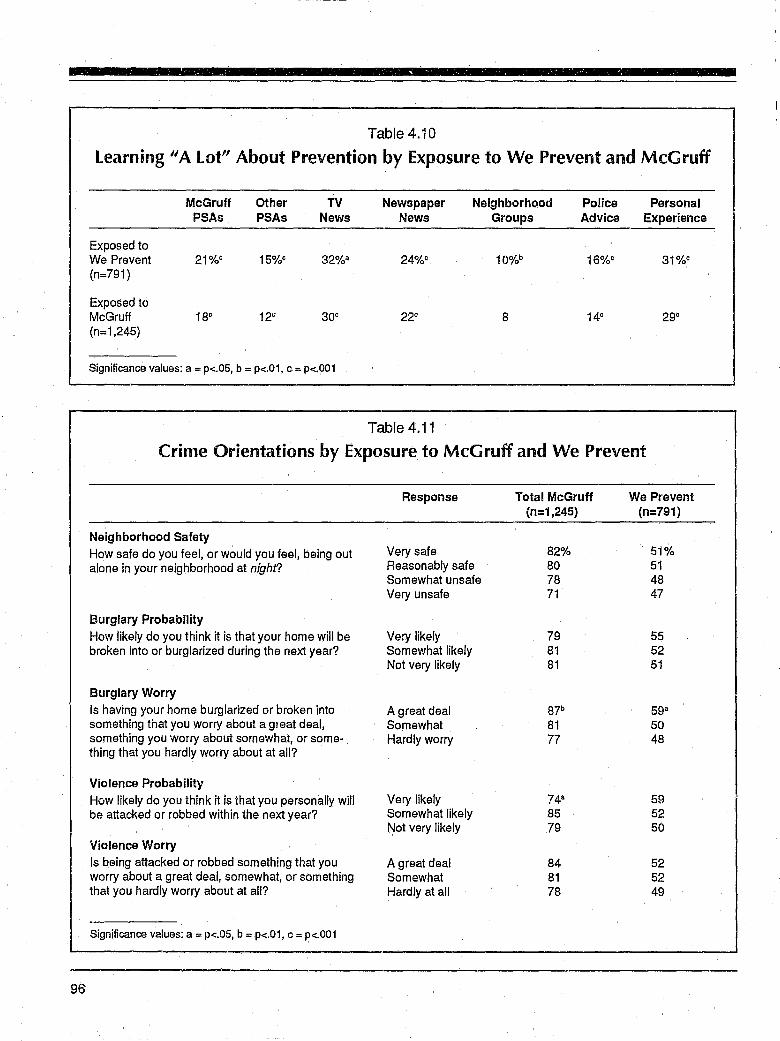
96
Table 4.10
Learning "A Lot" About Prevention by Exposure to We Prevent and McGruff
McGruff other TV Newspaper Neighborhood Police Personal PSAs PSAs News News Groups Advice Experience
Exposed to We Prevent 21%C 15%0 32%- 24%C 10%b 16%C 31%C (n=791 )
Exposed to McGruff 18c 12" 30c 22c 8 14c 29c
(n=1,245)
Significance values: a = p<.05, b = p<.01, c '" p<.OO1
Table 4.11
Crime Orientations by Exposure to MeG ruff and We Prevent
Neighborhood Safety How safe do you feel, or would you feel, being out alone in your neighborhood at night?
Burglary Probability How likely do you think it is that your home will be broken into or burglarized during the next year?
Burglary Worry Is having your home burglarized or broken into something that you worry about a great deal, something you worry about somewhat, or something that you hardly worry about at all?
Violence Probability How likely do you think it is that you personally will be attacked or robbed within the next year?
Violence Worry Is being attacked or robbed something that you worry about a great deal, somewhat, or something that you hardly worry about at all?
Significance values: a = p<.05, b = p<.01, c = p<.001
Response
Very safe Reasonably safe Somewhat unsafe Very unsafe
Very likely Somewhat likely Not very likely
A great deal Somewhat Hardly worry
Very likel~' Somewhat likely Not very likely
A great deal Somewhat Hardly at all
Total McGruff We Prevent (n=1,245) (n=791)
82% 51% 80 51 78 48 71 47
79 55 81 52 81 51
87b 59-81 50 77 48
74- 59 85 52 79 50
84 52 81 52 78 49
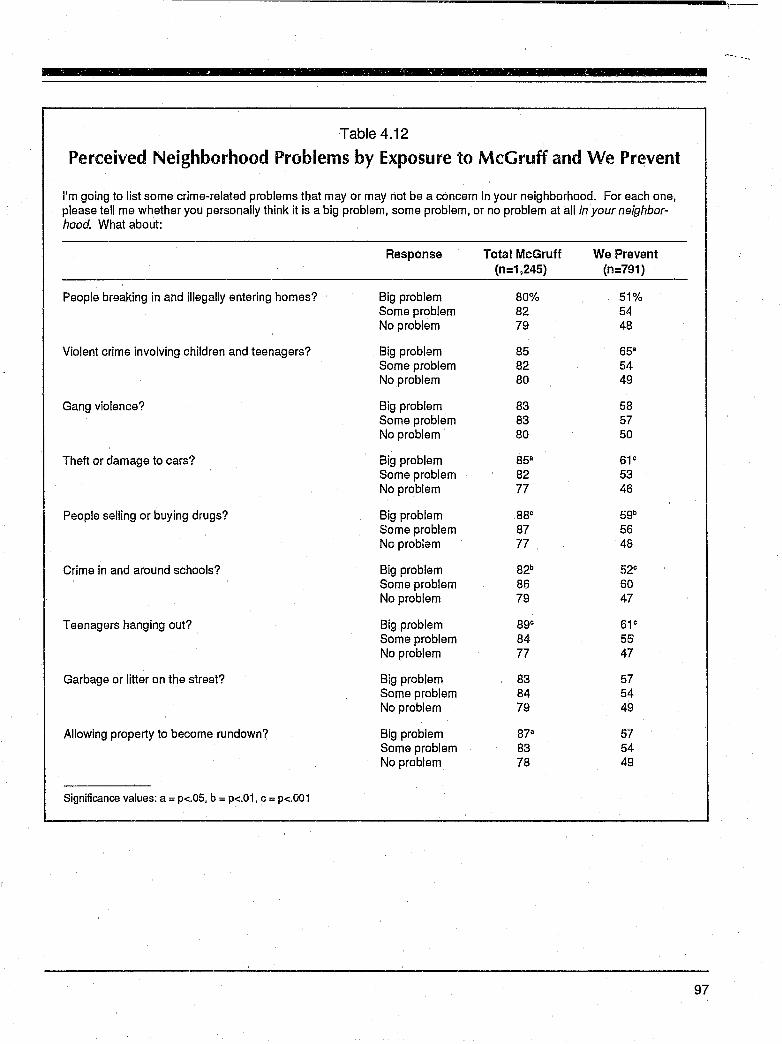
Table 4.12
Perceived Neighborhood Problems by Exposure to McGruff and We Prevent
I'm going to list some crime-related problems that mayor may not be a concern in your neighborhood. For each one, please tell me whether you personally think it is a big problem, some problem, or no problem at all In your neighborhood. What about:
Response Total McGruff We Prevent (n=1,245) (n=791)
People breaking in and illegally entering homes? Big problem 80% 51% Some problem 82 54 No problem 79 48
Violent crime involving children and teenagers? Big problem 85 65" Some problem 82 54 No problem 80 49
Gang violence? Big problem 83 58 Some problem 83 57 No problem 80 50
Theft or damage to cars? Big problem 85" 61 c
Some problem 82 53 No problem 77 46
People selling or buying drugs? Big problem 88C 59b
Some problem 87 56 No problem 77 48
Crime in and around schools? Big problem 82b 52C
Some problem 86 60 No problem 79 47
Teenagers hanging out? Big problem 89C 61 C
Some problem 84 55 No problem 77 47
Garbage or litter on the street? Big problem 83 57 Some problem 84 54 No problem 79 49
Allowing property to become rundown? Big problem 87" 57 Some problem 83 54 No problem 78 49
Significance values: a = p<.05, b = p<.01, c = p<.OO1
97
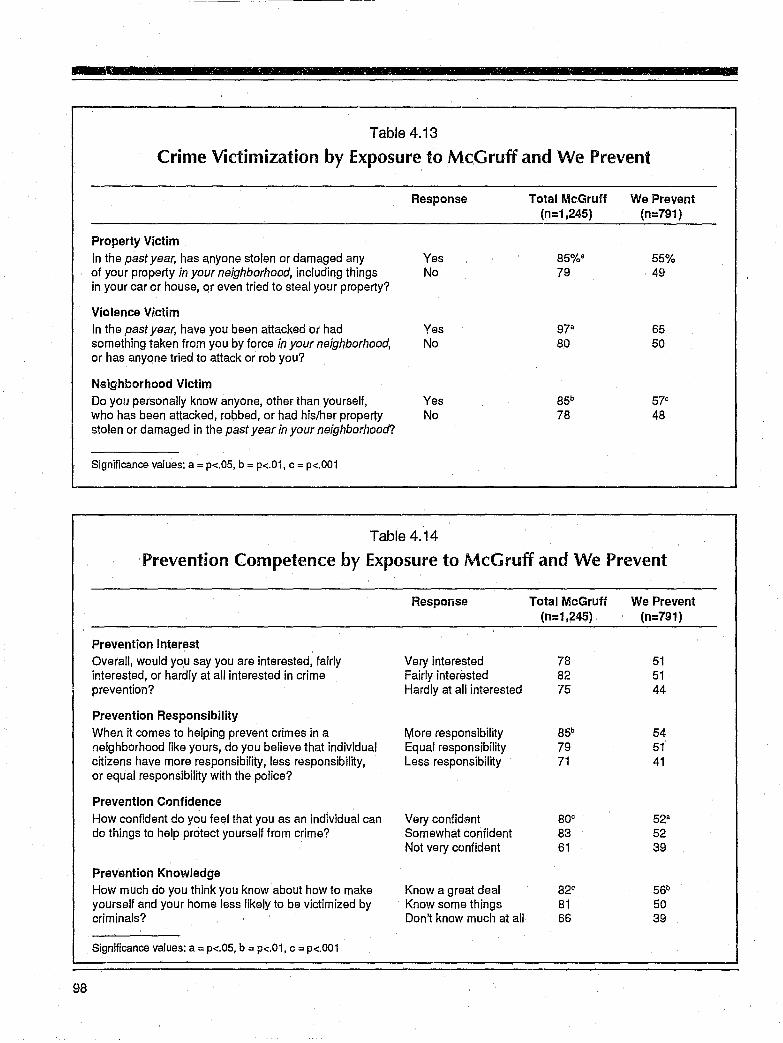
98
Table 4.13
Crime Victimization by Exposure to MeG ruff and We Prevent
Response Total McGruff We Prevent {n=1,245} (n=791)
Property Victim
In the past year; has anyone stolen or damaged any Yes 85%a 55% of your property in your neighborhood, including things No 79 49 in your car or house, or even tried to steal your property?
Violence Victim
In the past year, have you bean attacked or had Yes 97a 65 something taken from you by force in your neighborhood, No 80 50 or has anyone tried to attack or rob you?
Neighborhood Victim
Do you personally know anyone, other than yourself, Yes 85b 57C
who has been attacked, robbed, or had his/her property No 78 48 stolen or damaged in the past year in your neighborhood?
Significance values: a = p<.05, b = p<.01, c = p<.OO1
Table 4.14
Prevention Competence by Exposure to MeG ruff and We Prevent
Prevention Interest
Overall, would you say you are interested, fairly interested, or hardly at all interested in crime preventioi1?
Prevention Responsibility
When it comes to helping prevent crimes in a neighborhood like yours, do you believe that individual citizens have more responsibility, less responsibility, or equal responsibility with the police?
Prevention Ct:mfidence
How confident do you feel that you as an individual can do things to help protect yourself from crime?
Prevention Knowledge
How much do you think you know about how to make yourself and your home less likely to be victimized by criminals?
Significance values: a = p<.05, b = p<.01, C = p<.001
Response
Very interested Fairly interested Hardly at all interested
More responsibility Equal responsibility Less responsibility
Very confident Somewhat confident Not very confident
Know a great deal Know some things Don't know much at all
Total McGruff We Prevent (n:1,245) (n=791)
78 51 82 51 75 44
85b 54 79 51 71 41
80C 52a 83 52 61 39
82C 56b
81 50 66 39
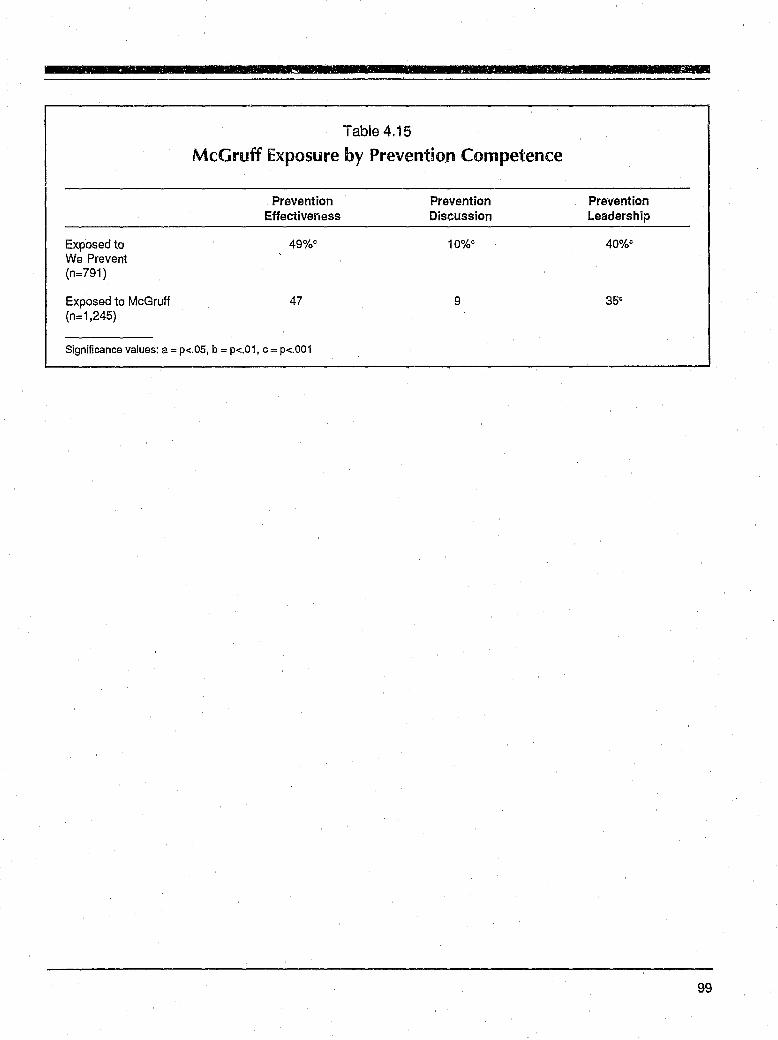
A
Table 4.15
McGruff Exposure by Prevent!o.n Competence
Exposed to We Prevent (n=791 )
Exposed to McGruff (n=1,245)
Prevention Effectiveness
49%0
47
Significance values: a = p<.05, b = p<.01, C = p<.001
Prevention Discussion
10%0
9
Prevention Leadership
40%0
35e
99
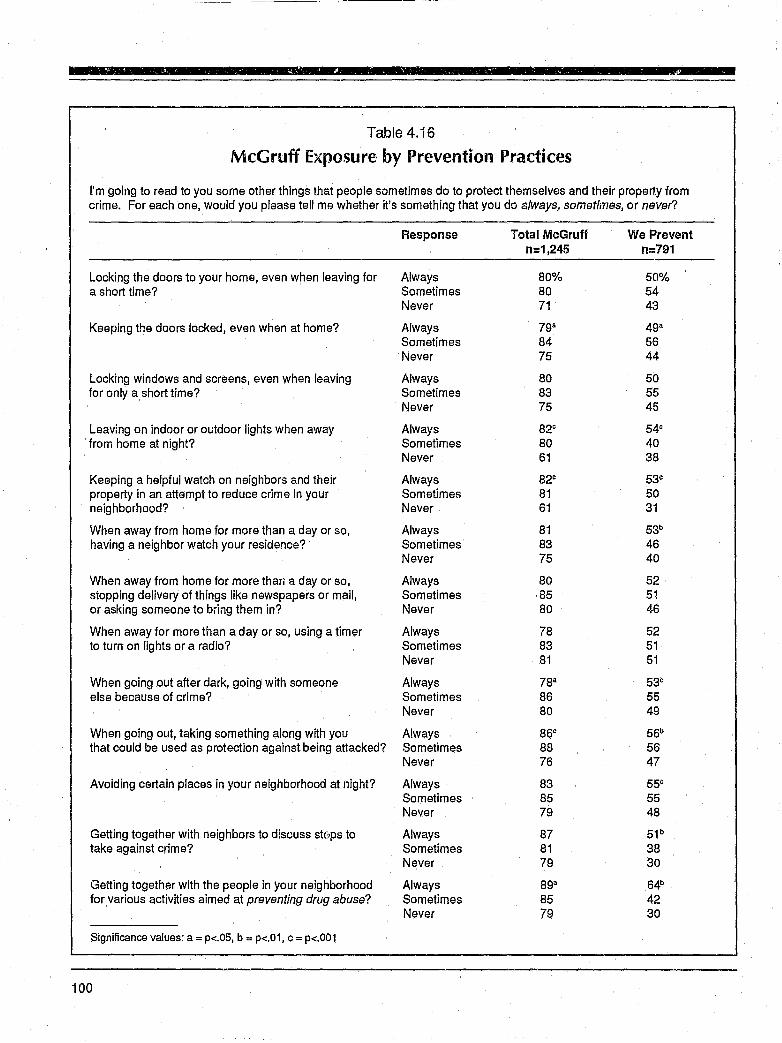
- .V
Table 4.16
MeG ruff Exposure by Prevention Practices
I'm going to read to you some other things that people sometimes do to protect themselves and their property from crime. For each one, would you please tell me whether it's something that you do a/ways, sometimes, or never?
Response Total McGruff We Prevent n=1,245 n=791
Locking the doors to your home, even when leaving for Always 80% 50% a short time? Sometimes 80 54
Never 71 43
Keeping the doors locked, even when at home? Always 79" 49" Sometimes 84 56 Never 75 44
Locking windows and screens, even when leaving Always 80 50 for only a short time? Sometimes 83 55
Never 75 45
Leaving on indoor or outdoor lights when away Always 82C 54C
from home at night? Sometimes 80 40 Never 61 38
Keeping a helpful watch on neighbors and their Always 82C 53e
property in an attempt to reduce crime in your Sometimes 81 50 neighborhood? Never 61 31
When away from home for more than a day or so, Always 81 53b
having a neighbor watch your residence? Sometimes 83 46 Never 75 40
When away from home for more than a day or so, Always 80 52 stopping delivery of things like newspapers or mail, Sometimes 85 51 or asking someone to biing them in? Never 80 46
When away for more than a day or so, using a timer Always 78 52 to turn on lights or a radio? Sometimes 83 51
Never 81 51
When going out after dark, going with someone Always 78" 53C
else because of crime? Sometimes 86 55 Never 80 49
When going out, taking something along with you Always 86C 56b
that could be used as protection against being attacked? Sometimes 88 56 Never 76 47
Avoiding certain places in your neighborhood at night? Always 83 55C
Sometimes 85 55 Never 79 48
Getting together with neighbors to discuss st~)ps to Always 87 51 b
take against crime? Sometimes 81 38 Never 79 30
Getting together with the people in your neighborhood Always 89" 64b
for various activities aimed at preventing drug abuse? Sometimes 85 42 Never 79 30
Significance values: a = p<.05, b = p<.01, C = p<.OO1
100
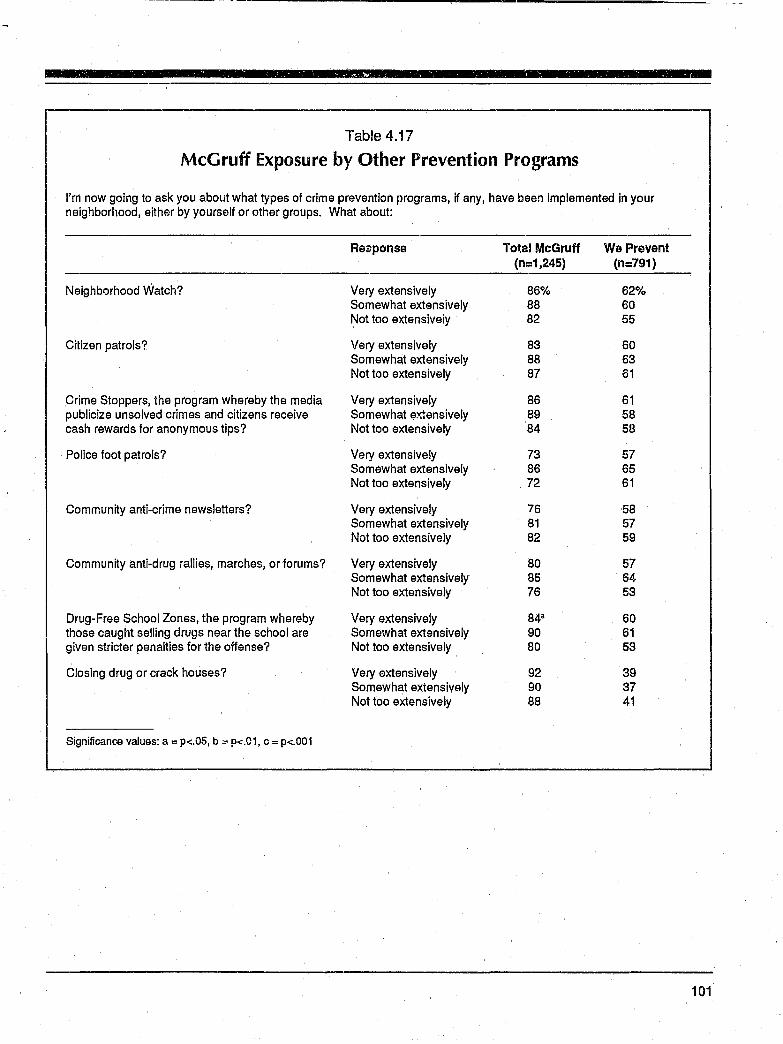
- i!W
Table 4.17
McGruff Exposure by Other Prevention Programs
I'm now going to ask you about what types of crime prevention programs, if any, have been implemented in your neighborhood, either by yourself or other groups. What about:
Neighborhood Watch?
C~izen patrols?
Crime Stoppers, the program whereby the media publicize unsolved crimes and citizens receive cash rewards for anonymous tips?
Police foot patrols?
Community anti-crime newsletters?
Community anti-drug rallies, marches, or forums?
Drug-Free School Zones, the program whereby those caught selling drugs near the school are given stricter penalties for the offense?
Closing drug or crack houses?
Significanc,s values: a = p<.05, b '" p..;.C1, C ,. p<.001
Re~ponse
Very extensively Somewhat extensively Not too extensively
Very extensively Somewhat extensively Not too extensively
Very extensively Somewhat extensively Not too extensively
Very extensively Somewhat extensively Not too extensively
Very extensively Somewhat extensively Not too extensively
Very extensively Somewhat extensively Not too extensively
Very extensively Somewhat extensively Not too extensively
Very extensively Somewhat extensively Not too extensively
Total McGruff We Prevent (n=1,245) (n:791)
86% 62% 88 60 82 55
83 60 88 63 87 61
86 61 89 58 84 58
73 57 86 65 72 61
76 58 81 57 82 59
80 57 85 64 76 53
848 60 90 61 80 53
92 39 90 37 88 41
101
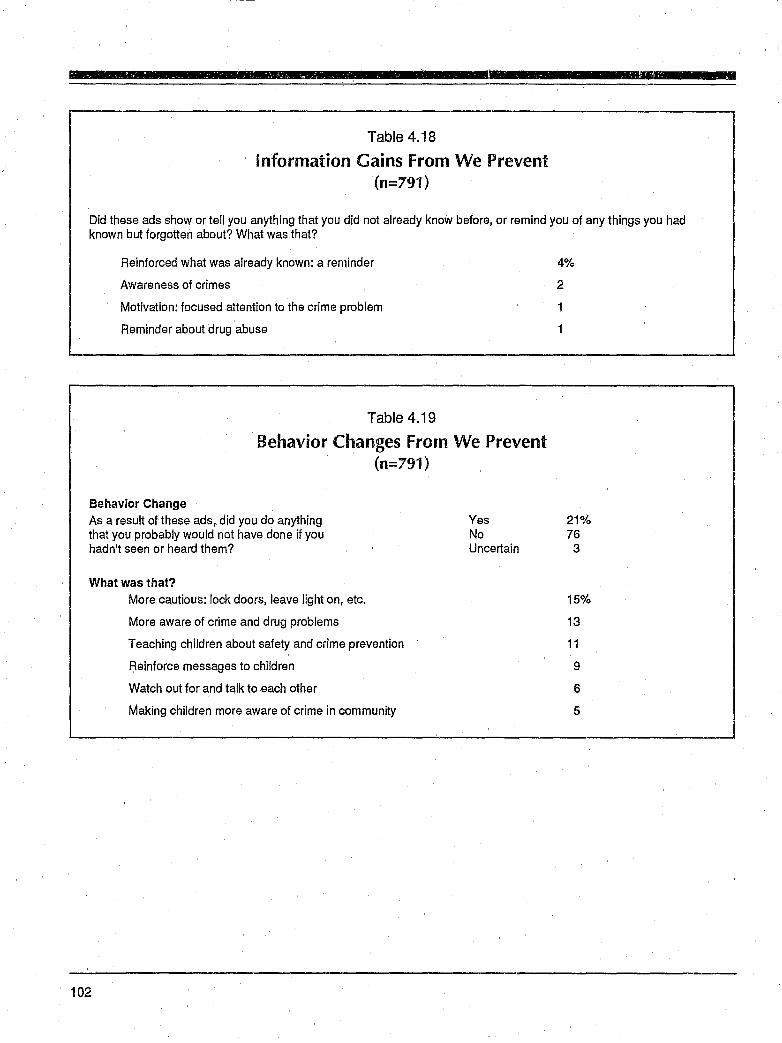
il L
Table 4.18
Information Gains From We P'revent (n=791)
1M
Did these ads show or tell you anything that you did not already know before, or remind you of any things you had known but forgotten about? What was that?
Reinforced what was already known: a reminder
Awareness of crimes
Motivation: focused attention to the crime problem
Reminder about drug abuse
Table 4.19
Behavior Changes From We Prevent (n=791)
Behavior Change
As a result of these ads, did you do anything that you probably would not have done if you hadn't seen or heard them?
What was that? More cautious: lock doors, leave light on, etc.
More aware of crime and drug problems
Teaching children about safety and crime prevention
Reinforce messages to children
Watch out for and talk to each other
Making children more aware of crime in community
Yes No Uncertain
4%
2
21% 76
3
15%
13
11
9
6
5
102
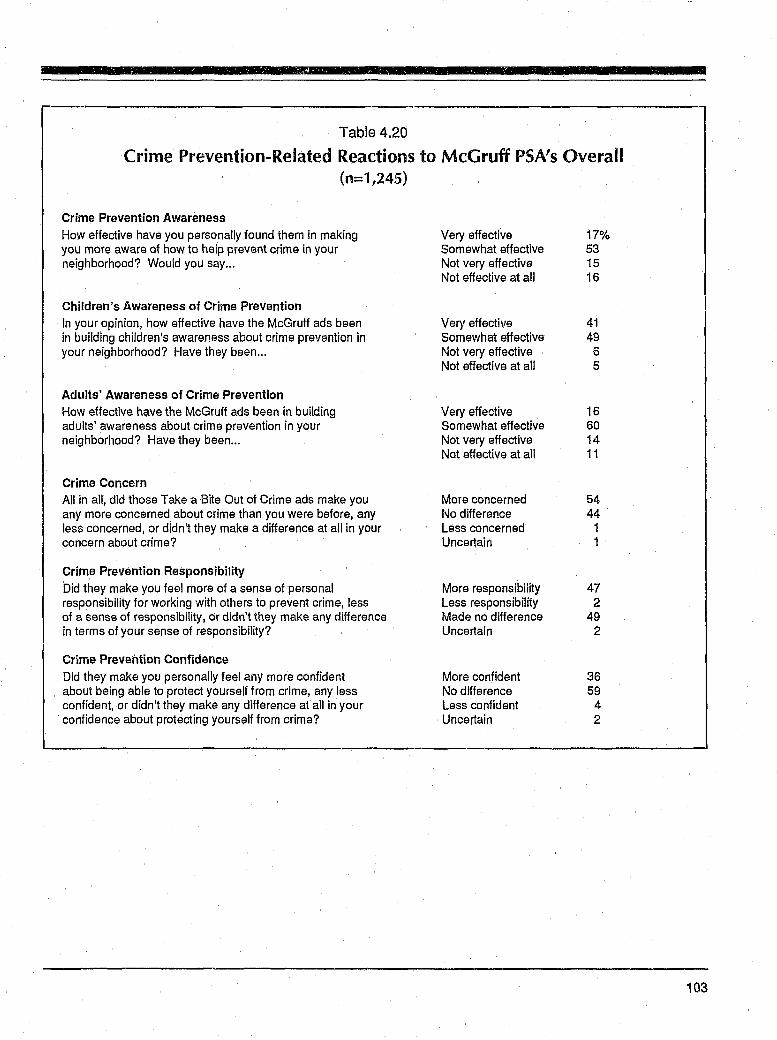
Table 4.20
Crime Prevention-Related Reactions to MeG ruff PSA's Overall (n=1,245)
Crime Prevention Awareness
How effective have you personally found them in making you more aware of how to help prevent crime in your neighborhood? Would you say ...
Children's Awareness of Crime Prevention
In your opinion, how effective have the McGruff ads been in building children's awareness about crime prevention in your neighborhood? Have they been ...
Adults' Awareness of Crime Prevention
How effective have the MeG ruff ads been in building adults' awareness about crime prevention in your neighborhood? Have they been ...
Crime Concern All in all, did those Take a Bite Out of Crime ads make you any more concerned about crime than you were before, any less concerned, or didn't they make a difference at all in your concern about crime?
Crime Prevention Responsibility
Did they make you feel more of a sense of personal responsibility for working with others to prevent crime, less of a sense of responsibility, or didn't they make any difference in terms of your sense of responsibility?
Crime Prevention Confidence
Did they make you personally feel any more confident about being able to protect yourself from crime, any less confident, or didn't they make any difference at all in your
. confidence about protecting yourself from crime?
Very effective Somewhat effective Not very effective Not effective at all
Very effective Somewhat effective Not very effective Not effective at all
Very effective Somewhat effective Not very effective Not effective at aU
More concerned No difference Less concerned Uncertain
More responsibil~y Less responsibility Made no difference Uncertain
More confident No difference Less confident Uncertain
17% 53 15 16
41 49 6 5
16 60 14 11
54 44 1 1
47 2
49 2
36 59
4 2
103
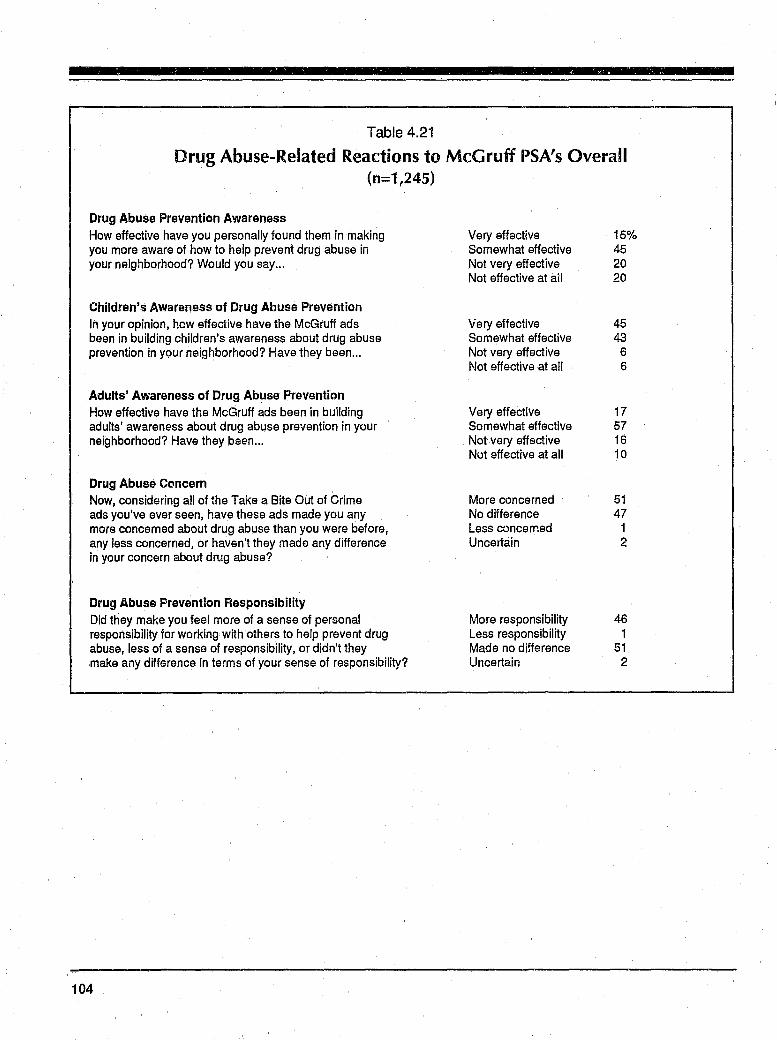
Table 4.21
Drug Abuse-Related Reactions to MeG ruff PSA's Overall (n=1,245)
Drug Abuse Prevention Awareness How effective have you personally found them in making you more aware of how to help prevent drug abuse in your neighborhood? Would you say ...
Children'$ Awareness of Drug Abuse Prevention In your opinion, hew effective have the McGruff ads been in building children's awareness about drug abuse prevention in your neighborhood? Have they been ...
Adults' Awareness of Drug Abuse Prevention How effective have the McGruff ads been in building adults' awareness about drug abuse prevention in your . neighborhood? Have they been ...
Drug Abuse Concern Now, considering all of the Take a Bite Out of Crime ads you've ever seen, have these ads made you any more concerned about drug abuse than you were before, any less concerned, or haven't they made any difference in your concern about drug abuse?
Drug Abuse Prevention Responsibility Did they make you feel more of a sense of personal responsibility for working with others to help prevent drug abuse, less of a sense of responsibility, or didn't they make any difference in terms of your sense of responsibility?
104
Very effective Somewhat effective Not very effective Not effective at ail
Very effective Somewhat effective Not very effective Not effective at all
Very effective Somewhat effective Not very effective Nut effective at all
More ci)ncerned No difference Less concerned Uncertain
More responsibility Less responsibility Made no difference Uncertain
15% 45 20 20
45 43
6 6
17 57 16 10
51 47
1 2
46 1
51 2
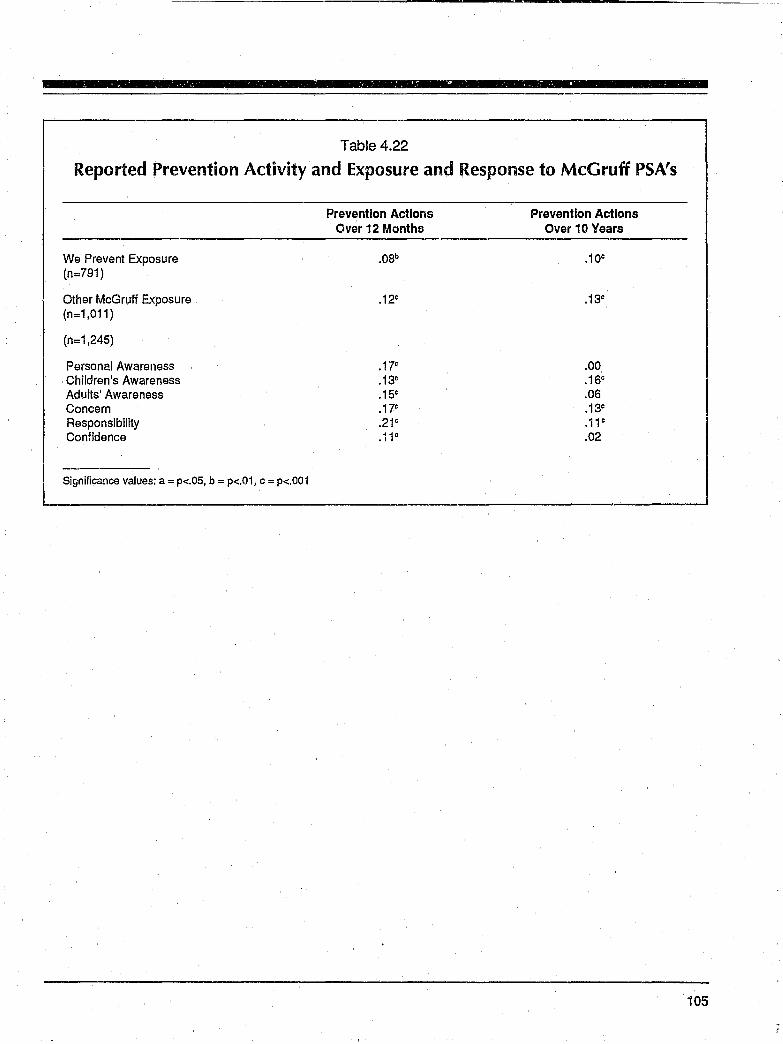
Table 4.22
Reported Prevention Activity and Exposure and Response to McGruff PSA's
We Prevent Exposure (n=791)
Other McGruff Exposure (n=1,011)
(n=1,245)
Personal Awareness Children's Awareness Adults' Awareness Concern Responsibility Confidence
Significance values: a = p<.05, b = p<.01, c = p<.001
Prevention Actions Over 12 Months
.12C
.17C
.13"
.15c
.17c
.21c
.11c
Prevention Actions Over 10 Years
.1 DC
.13C
.00
.16c
.06
.13c
.11c
.02
105
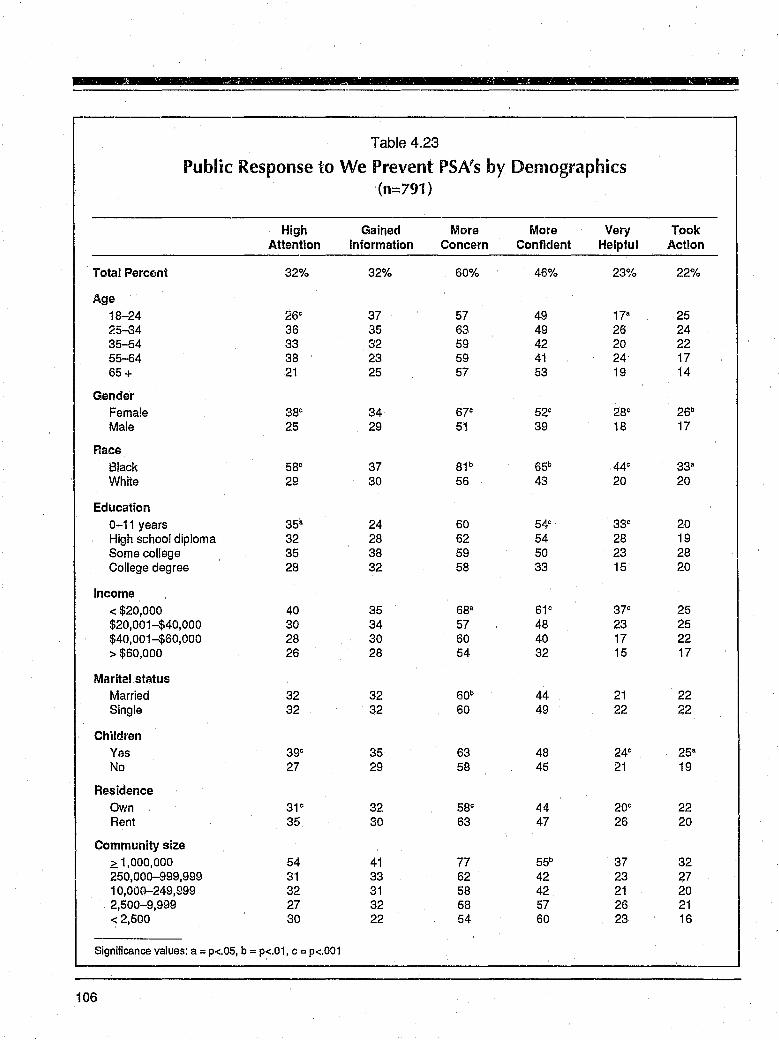
g Wi
Table 4.23
Public Response to We Prevent PSA's by Demographics (n=791)
High Gained More More Very Took Attention Information Concern Confident Helpful Action
Total Percent 32% 32% 60% 46% 23% 22%
Age
18-24 26c 37 57 49 17a 25 25-34 36 35 63 49 26 24 35-54 33 32 59 42 20 22 55-64 38 23 59 41 24 17 65+ 21 25 57 53 19 14
Gender Fema!e 38C 34 67C 52C 28C 26b
Male 25 29 51 39 18 17
Aace
B!ack 58C 37 81 b 65b 44c 33a
White 29 30 56 43 20 20
Education
0-11 years 35a 24 60 54c 33c 20 High school diploma 32 28 62 54 28 19 Some college 35 38 59 50 23 28 College degree 28 32 58 33 15 20
Income
< $20,000 40 35 68a 61 c 37c 25 $20,001-$40,000 30 34 57 48 23 25 $40,001-$60,000 28 30 60 40 17 22 > $60,000 26 28 54 32 15 17
Marital status Married 32 32 60b 44 21 22 Single 32 32 60 49 22 22
Children Yes 39c 35 63 48 24c 25a
No 27 29 58 45 21 19
Residence
Own 31 c 32 58C 44 2OC 22 Rent 35 30 63 47 26 20
Community size ~ 1,000,000 54 41 77 55b 37 32 250,000-999,999 31 33 62 42 23 27 10,000-249,999 32 31 58 42 21 20 2,500-9,999 27 32 58 57 26 21 < 2,500 30 22 54 60 23 16
Significance values: a = p<.05, b = p<.01, C = p<.OO1
106
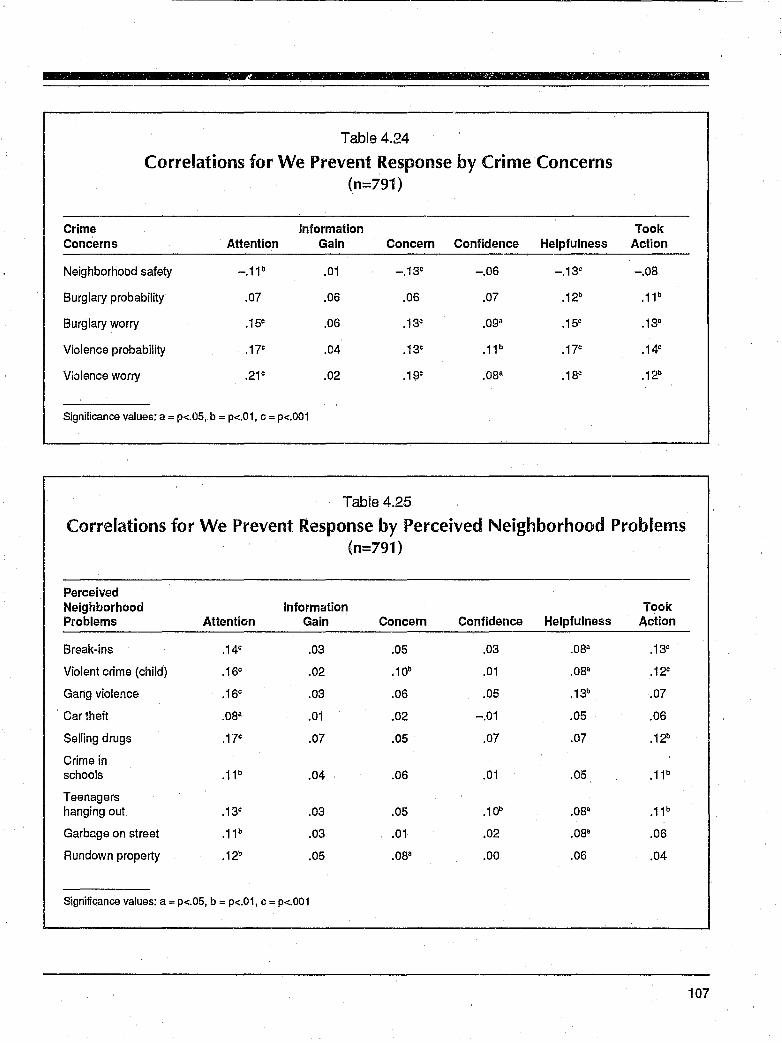
Table 4.24
Correlations for We Prevent Response by Crime Concerns (n=791)
Crime Information Concerns Attention Gain Concern Confidence Helpfulness
Neighborhood safety -.11b .01 -.13c -.06 -.13c
Burglary probability .07 .06 .06 .07 .12b
Burglary worry .15c .06 .13c .09a .15c
Violence probability .17c .04 .13c .11b .17c
Violence worry .21c .02 .19c .08a .18c
Significance values: a = p<.05, b = p<.01, c = p<.OO1
Took Action
-.08
.11 b
.13C
.14c
.12b
Table 4.25 ~ Correlations for We Prevent Response by Perceived Neighborhood Problems I
(n=791)
Perceived Neighborhood Information Took Problems Attention Gain Concern Confidence Helpfulness Action
Break-ins .14c .03 .05 .03 .08a .13c
Violent crime (child) .16C .02 .10b .01 .08a .12"
Gang violence .16c .03 .06 .05 .13b .07
Car theft .08a .01 .02 -.01 .05 .06
Selling drugs .17c .07 .05 .07 .07 .12b
Crime in schools .11 b .04 .06 .01 .05 .11b
Teenagers hanging out .13c .03 .05 .10b .08a .11b
Garbage on street .11 b .03 .01 .02 .08a .06
Rundown property .12b .05 .08a .00 .06 .04
Significance values: a = p<.05, b = p<.01, c = p<.OO1
107
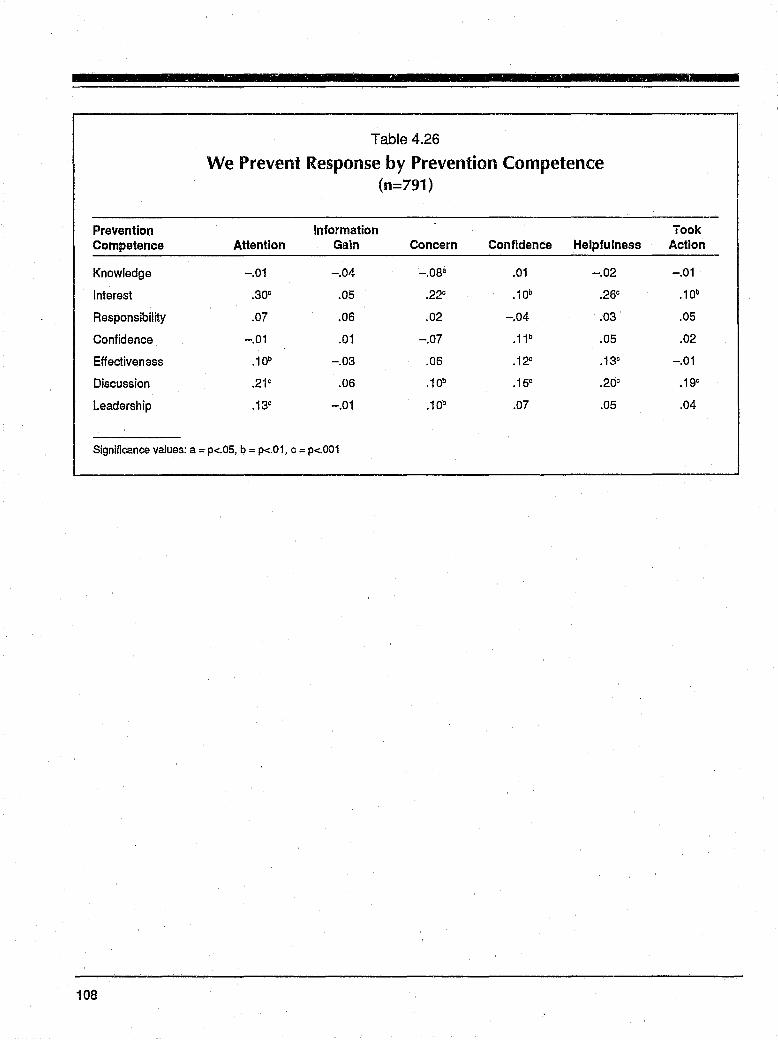
Prevention Competence
Knowledge
Interest
Responsibility
Confidence
Effectivenass
Discussion
Leadership
Table 4.26
We Prevent Response by Prevention Competence (n=791)
Information Attention Gain Concern Confidence Helpfulness
-.01 -.04 -.osa .01 -.02
.30c .05 .22c .10b .26c
.07 .06 .02 -.04 .03
-.01 .01 -.07 .11b .05
.10b -.03 .06 .12c .13c
.21c .06 .1 Qb .15c .20c
.13c -.01 .10b .07 .05
Significance values: a = p<.05, b = p<.01, c = p<.OO1
108
Took Action
-.01
.10b
.05
.02
-.01
.19C
.04
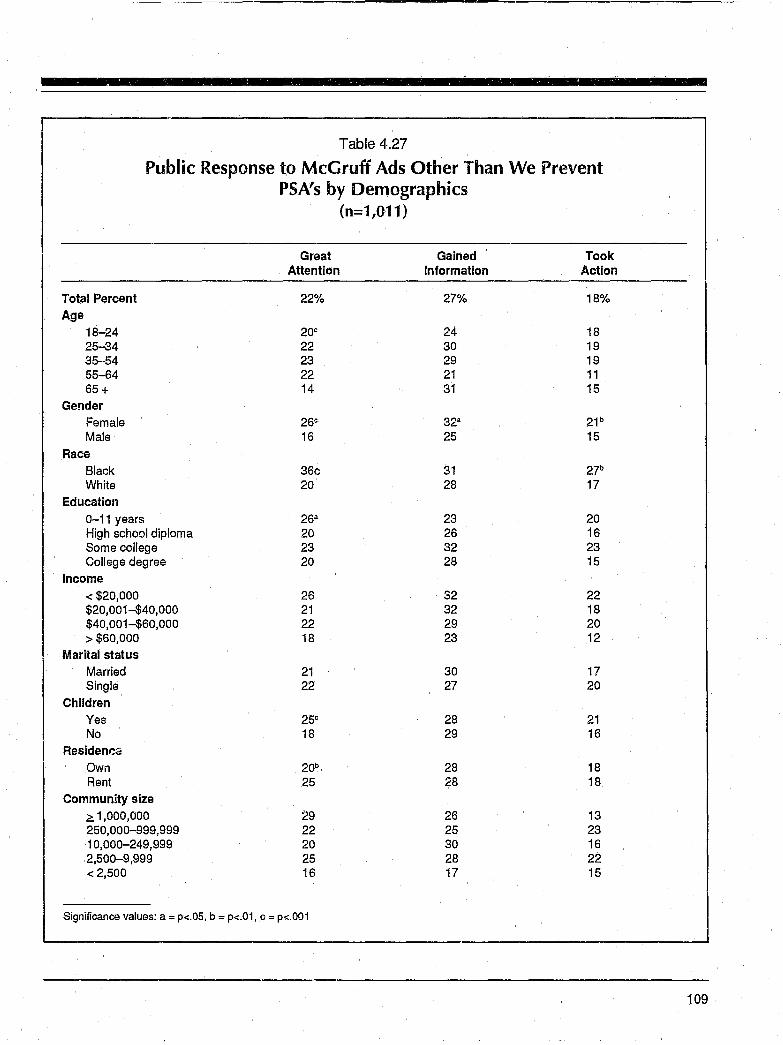
Table 4.27
Public Response to MeG ruff Ads Other Than We Prevent PSA's by Demographics
(n=1,011)
Great Gained Took Attention Information Action
Total Percent 22% 27% 18%
Age 18-24 20C 24 18 25-34 22 30 19 35-54 23 29 19 55-64 22 21 11 65+ 14 31 15
Gender Female 26c 328 21b Male 16 25 15
Race Black 36c 31 27b
White 20 28 17
Education 0-11 years 268 23 20 High school diploma 20 26 16 Some college 23 32 23 College degree 20 28 15
Income < $20,000 26 32 22 $20,001-$40,000 21 32 18 $40,001-$60,000 22 29 20 > $60,000 18 23 12
Marital status Married 21 30 17 Single 22 27 20
Children Yes 25c 28 21 No 18 29 16
Residen~d
Own 20b 28 18 Rent 25 28 18
Community size ;=:,1,000,000 29 26 13 250,000-999,999 22 25 23 10,000-249,999 20 30 16 2,500-9,999 25 28 22 < 2,500 16 17 15
Significance values: a = p<.05, b = p<.01, c = p<.OO1
109
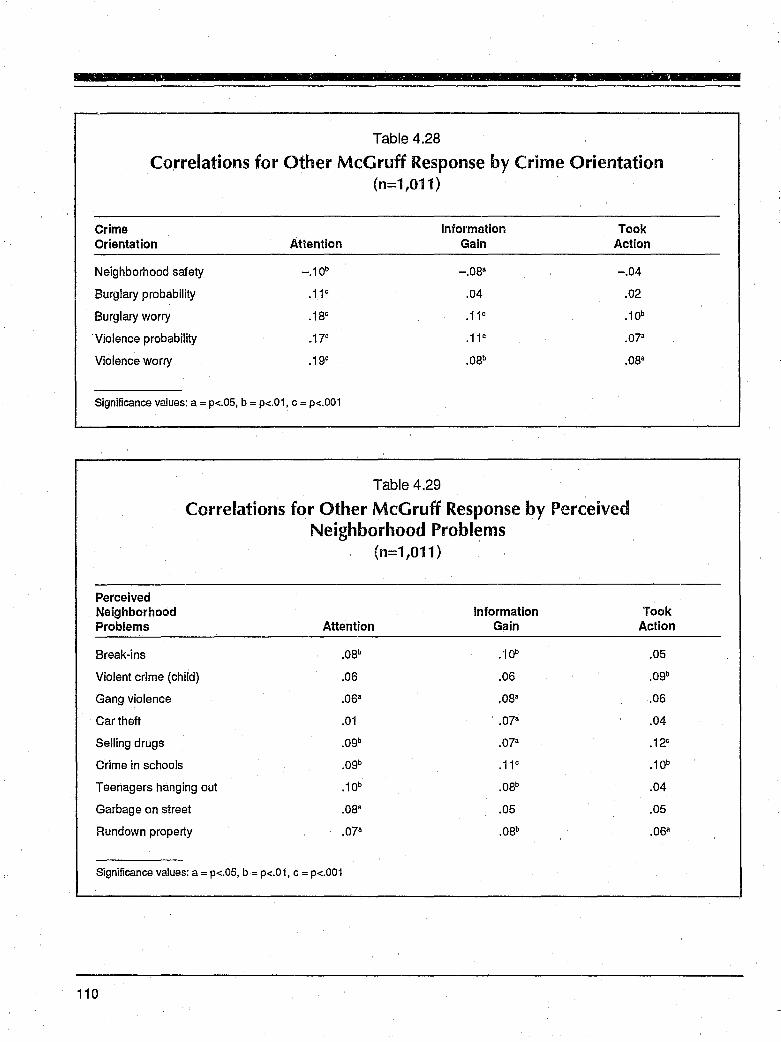
Table 4.28
Correlations for Other McGruff Response by Crime Orientation (n=1,011)
Crime Information Took Orientation Attention Gain Action
Neighborhood safety -.10b -.osa -.04
Burglary probability .11 c .04 .02
Burglary worry .1Sc .11 c .10b
'Violence probability .17C .11 c .07"
Violence worry .19c .0Sb .osa
Significance values: a = p<.05, b = p<.01, c = p<.OO1
Table 4.29
Correlations for Other MeG ruff Response by Perceived Neighborhood Problems
(n=l,Oll)
Perceived Neighborhood Information Took Problems Attention Gain Action
Break-ins .0Sb .10b .05
Violent crime (child) .06 .06 .09b
Gang violence .06a .osa .06
Car theft .01 .07a .04
Selling drugs .09b .07a .12c
Crime in schools .09b .11 c .10b
Teenagers hanging out .10b .0Sb .04
Garbage on street .osa .05 .05
Rundown property .07a .0Sb .06a
Significance values: a = p<.05, b = p<.01, c = p<.001
110
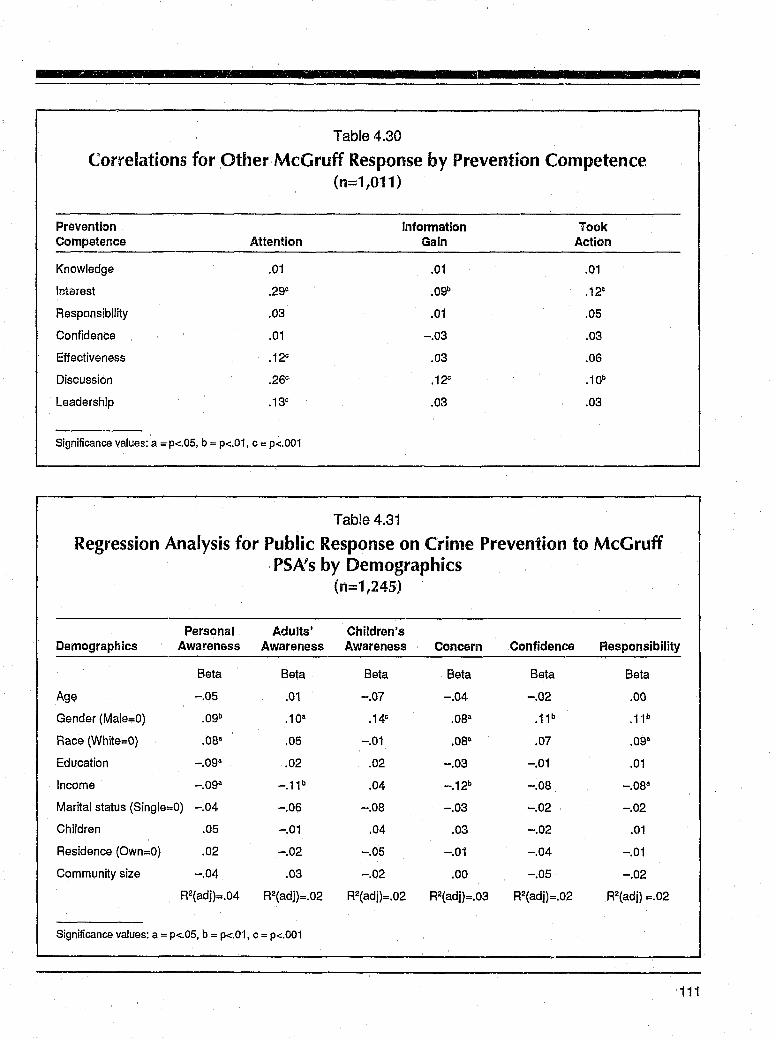
Table 4.30
Correlations for Other McGruff Response by Prevention Competence (n=l,011)
Prevention Informat!on Took Competence Attention Gain Action
Knowledge .01 .01 .01
Inii3rest .2go .Ogb .120
Responsibility .03 .01 .05
Confidence .01 -.03 .03
Effectiveness .12" .03 .06
Discussion .26" .12- .10b
Leadership .130 .03 .03
Significance values: a = p<.05, b = p<.01, C = p<.OO1
Table 4.31
Regression Analysis for Public Response on Crime Prevention to McGruff PSA's by Demographics
(n=l,245)
Personal Adults' Children's
..
Demographics Awareness Awareness Awareness Concern Confidence Responsibility
Beta Beta Beta Beta Beta Beta
Age -.05 .01 -.07 -.04 -.02 .00
Gender (Male=O) .Ogb .10" .14" .OS" .11b .11 b
Race (White=O) .08a .05 -.01 .OS" .07 .Og"
Education _.oga .02 .02 -.03 -.01 .01
Income -.09a -.11b .04 -.12b -.08 -.OS"
Marital status (Single=O) -.04 -.06 -.OS -.03 -.02 -.02
Children .05 -.01 .04 .03 -.02 .01
Residence (Own=O) .02 -.02 -.05 -.01 -.04 -.01
Community size -.04 .03 -.02 .00 -.05 -.02
R2(adj)=.04 R2(adj)=.02 R2(adj)=.02 R2(adj)=.03 R2(adj)=.02 R2(adj) =.02
Significance values: a = p<.05, b = p<.01, C = p<.OO1
111
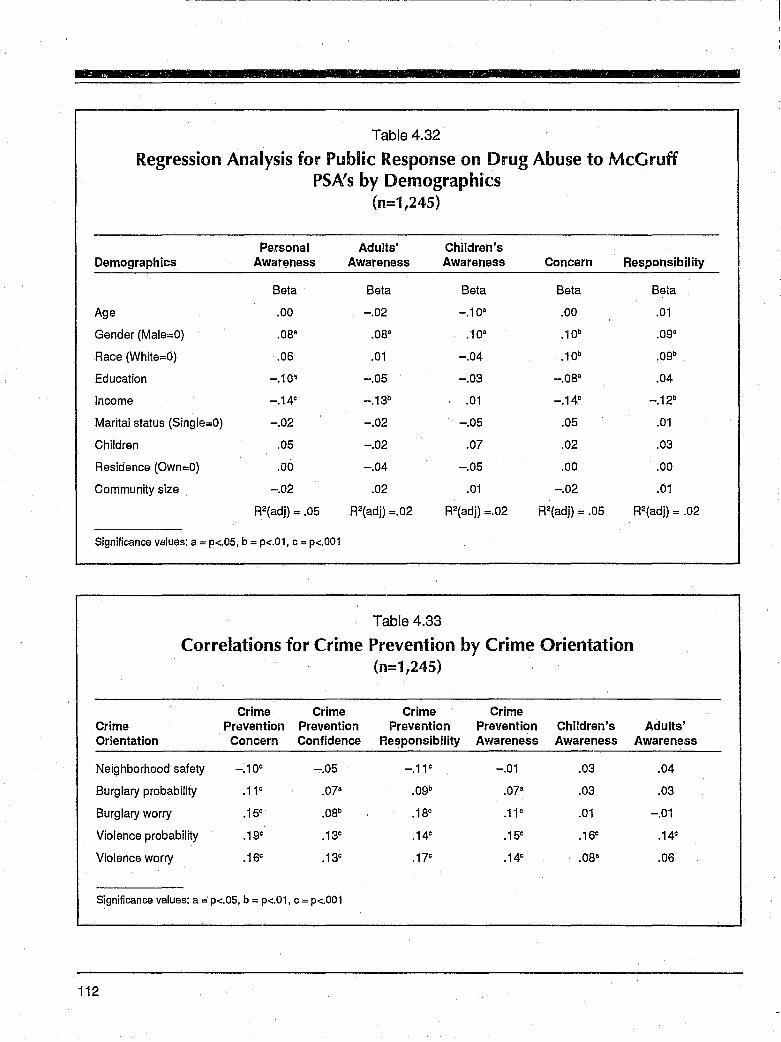
-Table 4.32
Regression Analysis for Public Response on Drug Abuse to MeG ruff PSA's by Demographics
(n=1,245)
Personal Adults' Children's Demographics Awareness Awareness Awareness Concern Responsibility
Beta Beta Beta Beta
Age .00 -.02 -.10' .00
Gender (Male=O) .OS" .OS" .10" .10b
Race (White=O) .06 .01 -.04 .10b
Education -.10~ -.05 -.03 -.osa
Income -.14e -.13b .01 -.14e
Marital status (Single=O) -.02 -.02 -.05 .05
Children .05 -.02 .07 .02
Residence (Own=O) .00 -.04 -.05 .00
Community size -.02 .02 .01 -.02
R2(adj) = .05 R2(adj) =.02 R2(adj) =.02 R2(adj) = .05
Significance values: a = p<.05, b = p<.01, C = p<.OO1
Table 4.33
Correlations for Crime Prevention by Crime Orientation (n=1,245)
Crime Crime Crime Crime Crime Prevention Prevention Prevention Prevention Children's Orientation Concern Confidence Responsibility Awareness Awareness
Neighborhood safety -.10e -.05 -.11 e -.01 .03
Burglary probability .11 e .07a .Ogb .07a .03
Burglary worry .15e .0Sb .1se .11 e .01
Violence probability .1 ge .13e .14e .15e .16e
Violence worry .16e .13e .17e .14e .osa
Significance values: a = p<.05, b = p<.01, C = p<.OO1
Beta
.01
.Og·
.Ogb
.04
-.12b
.01
.03
.00
.01
R2(adj) = .02
Adults' Awareness
.04
.03
-.01
.14e
.06
112
F
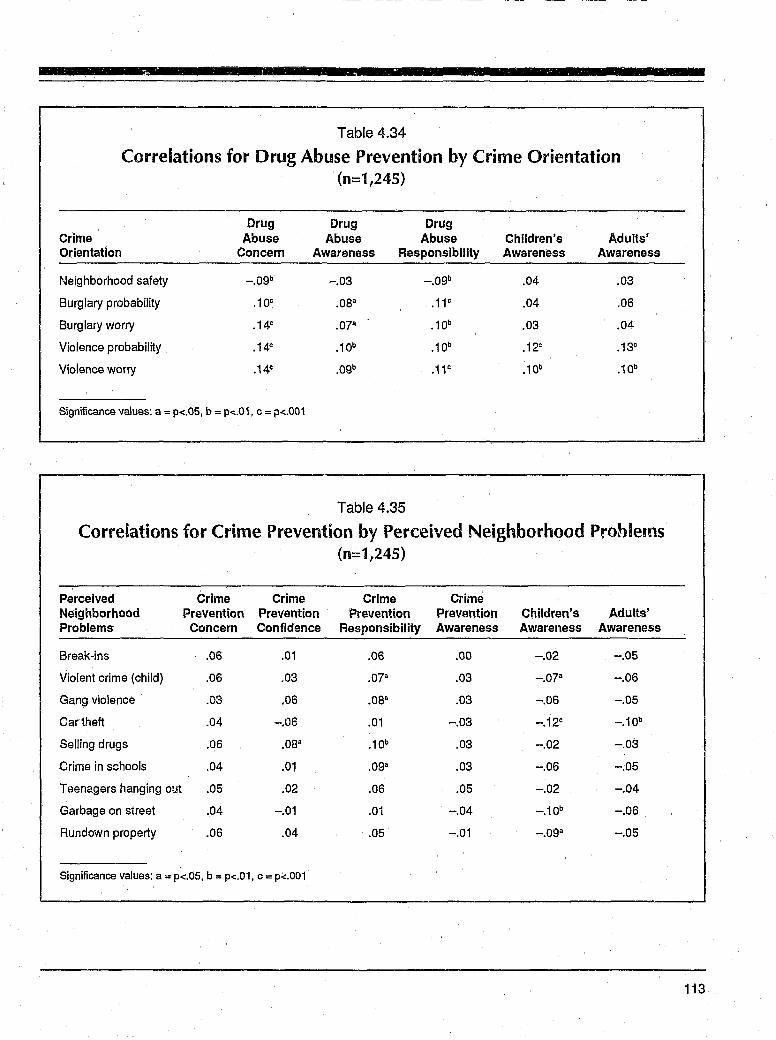
j
Table 4.34
Correlations for Drug Abuse Prevention by Crime Orientation (n=1,245)
Drug Drug Drug Crime Abuse Abuse Abuse Children's Adults' Orientation Concern AWareness Responsibility Awareness Awareness
Neighborhood safety _.Ogb -.03 _.Ogb .04 .03
Burglary probability .10" .08" .11 " .04 .06
Burglary worry .14" .07" .10b .03 .04
Violence probability .14" .10b .10b .12" .13"
Violence worry .14" .Ogb .11 " .10b .10b
Significance values: a = p<.05, b = p<.01, C = p<.001
Table 4.35
Correlations for Crime Prevention by Perceived Neighborhood Problems (n=1,245)
Perceived Crime Crime Crime Crime Neighborhood Prevention Prevention Prevention Prevention Children'S Adults' Problems Concern Confidence Responsibility Awareness Awareness Awareness
Break-ins .06 .01 .06 .00 -.02 -.05
Violent crime (child) .06 .03 .07" .03 -.07a -.06
Gang violence .03 .06 .08" .03 -.06 -.05
Car theft .04 -.06 .01 -.03 -.12" -.10b
Selling drugs .06 .08" .10b .03 -.02 -.03
Crime in schools .04 .01 .oga .03 -.06 -.05
Teenagers hanging out .05 .02 .06 .05 -.02 -.04
Garbage on street .04 -.01 .01 -.04 _.10b -.06
Rundown property .06 .04 .05 -.01 -.Og" -.05
Significance values: a = p<.05, b = p<.01, C = p<.OO1
-
113
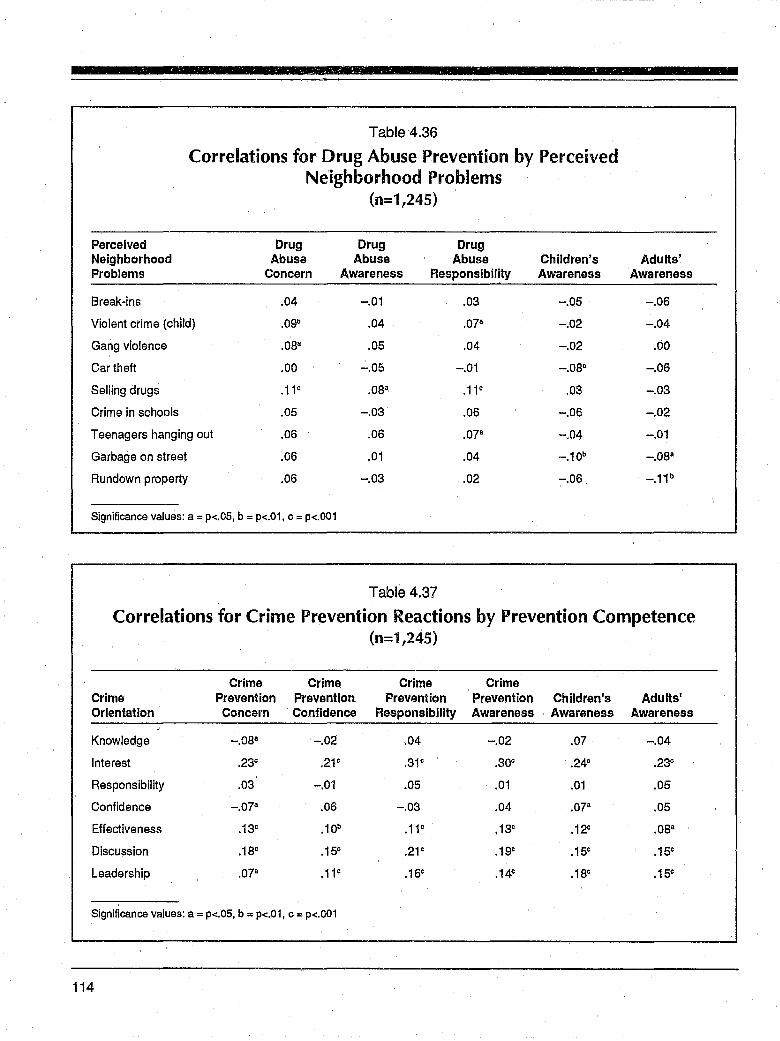
Table 4.36
Correlations for Drug Abuse Prevention by Perceived Neighborhood Problems
(n=1,245)
Perceived Drug Drug Drug Neighborhood Abuse Abuse Abuse Children's Problems Concern Awareness Responsibility Awareness
Break-ins .04 -.01 .03 -.05
Violent crime (child) .09b .04 .07a -.02
Gang violence .OS" .05 .04 -.02
Car theft .00 -.05 -.01 -.osa Selling drugs .11 c .08a .11 c .03
Crime in schools .05 -.03 .06 -.06
Teenagers hanging out .06 .06 .07a -.04
Garbage on street .06 .01 .04 _.10b
Rundown property .06 -.03 .02 -.06
Significance values: a = p<.05, b = p<.01, C = p<.OO1
Table 4.37
Adults' Awareness
-.06
-.04
.00
-.06
-.03
-.02
-.01
-.osa -.11b
Correlations for Crime Prevention Reactions by Prevention Competence (n=1,245)
Crime Crime Crime Crime Crime Prevention Prevention Prevention Prevention Children's Adults' Orientation Concern Confidence Responsibility Awareness Awareness Awareness
Knowledge -.08a -.02 .04 -.02 .07 -.04
Interest .23C .21c .31c .30C .24C .23C
Responsibility .03 -.01 .05 .01 .01 .05
Confidence -.07a .06 -.03 .04 .07a .05
Effectiveness .13C .10b .11c .13c .12c .osa Discussion .1SC .15c .21c .19c .15C .15C
Leadership .07a .11c .16C .14c .1Sc .15c
Significance values: a = p<.05, b = p<.01, C = p<.OO1
114
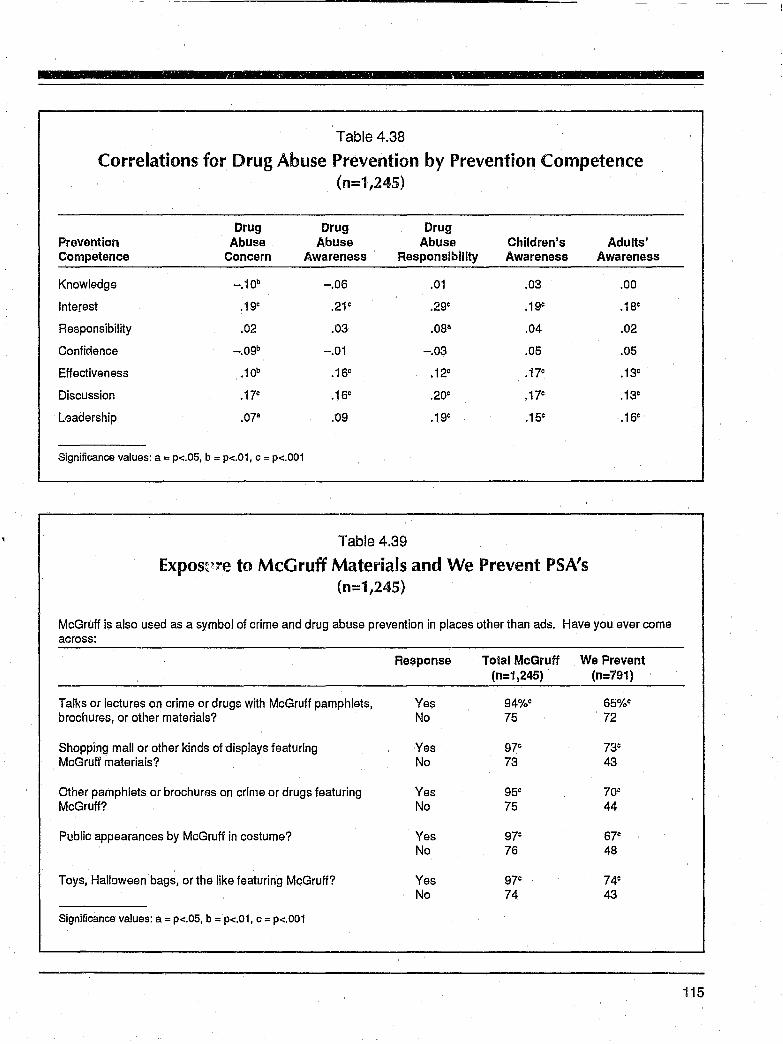
»
Table 4.38
Correlations for Drug Abuse Prevention by Prevention Competence (n=1,245)
Drug Drug Drug Prevention Abuse Abuse Abuse Children's Competence Concern Awareness Responsibility Awareness
Knowledge -.10b -.06 .01 .03
Interest .19c .21c .29c .19c
Responsibility .02 .03 .08a .04
Confidence -.09b -.01 -.03 .05
Effectiveness .10b .16C .12C .17C
Discussion .17C .16C .20C .17C
Ll3adership .07a .09 .19c .15c
Significance values: a = p<.05, b = p<.01, C = p<.OO1
Table 4.39
Expos~~re to MeG ruff Materials and We Prevent PSA's (n=1,245)
Adults' Awareness
.00
.18C
.02
.05
.13C
.13C
.16c
McGruff is also used as a symbol of crime and drug abuse prevention in places other than ads. Have you ever come across:
Response Total McGruff We Prevent (n=1,245) (n=791)
Talks or lectures on crime or drugs with McGruff pamphlets, Yes 94%C 65%C brochures, or other materials? No 75 72
Shopping mall or other kinds of displays featuring Yes 97C 73C
McGruft' materials? No 73 43
Other pamphlets or brochures on crime or drugs featuring Yes 95C 70· McGruff? No 75 44
Public appearances by MeG ruff in costume? Yes 97C 67C
No 76 48
Toys, Halloween bags, or the like featuring McGruff? Yes 97C 74C
No 74 43
Significance values: a = p<.05, b = p<.01, c = p<.OO1
115
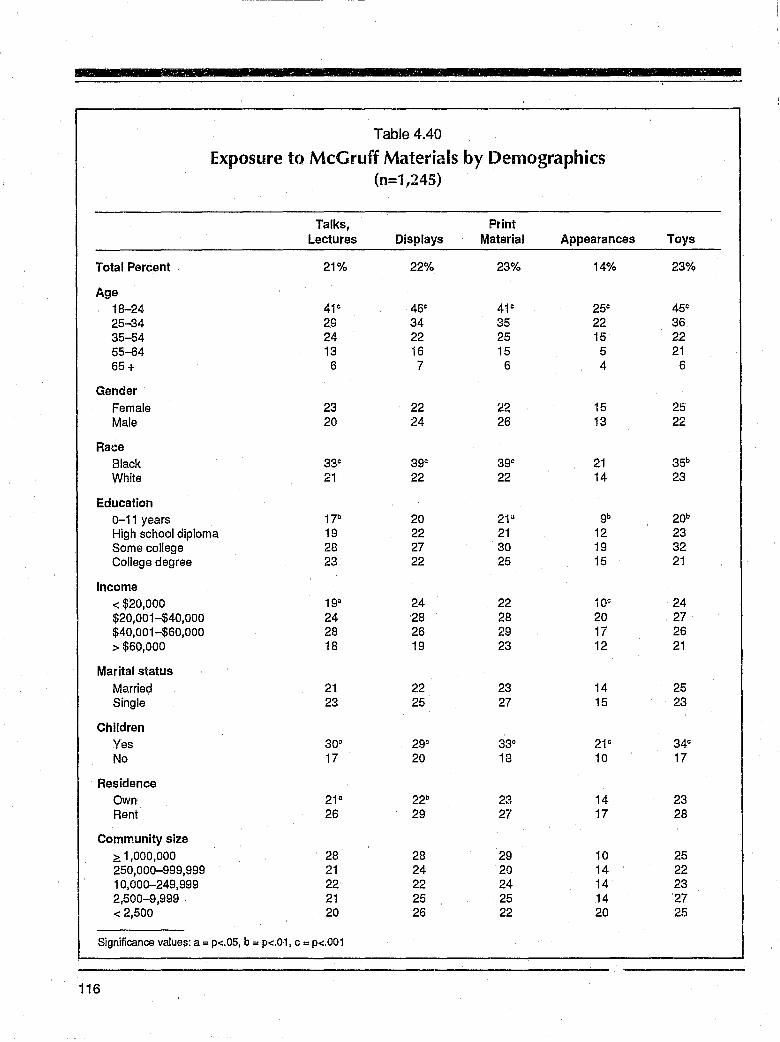
Table 4.40
Exposure to MeG ruff Materials by Demographics (n=1,245)
Talks, Print Lectures Displays Material Appearances Toys
Total Percent 21% 22% 23% 14% 23%
Age 18-24 41 e 46e 41° 25e 45e
25-34 29 34 35 22 36 35-54 24 22 25 15 22 55-64 13 16 15 5 21 65+ 6 7 6 4 6
Gender Female 23 22 22 15 25 Male 20 24 26 13 22
Race Black 33e 3ge 3ge 21 35b
White 21 22 22 14 23
Education 0-11 years 17b 20 21" 9b 20b
High school diploma 19 22 21 12 23 Some college 28 27 30 19 32 College degree 23 22 25 15 21
Income < $20,000 19" 24 22 10e 24 $20,001--$40,000 24 28 28 20 27 $40,001-$60,000 28 26 29 17 26 > $60,000 18 19 23 12 21
Marital status Married 21 22 23 14 25 Single 23 25 27 15 23
Children Yes 30e 2ge 33" 21 e 34e
No 17 20 18 10 17
Residence Own 21 8 22b 23 14 23 Rent 26 29 27 17 28
Community size ~ 1,000,000 28 28 29 10 25 250,000-999,999 21 24 20 14 22 10,000-249,999 22 22 24 14 23 2,500-9,999 21 25 25 14 27 < 2,500 20 26 22 20 25
Significance values: a = p<.05, b = p<.01, c = p<.OO1
116
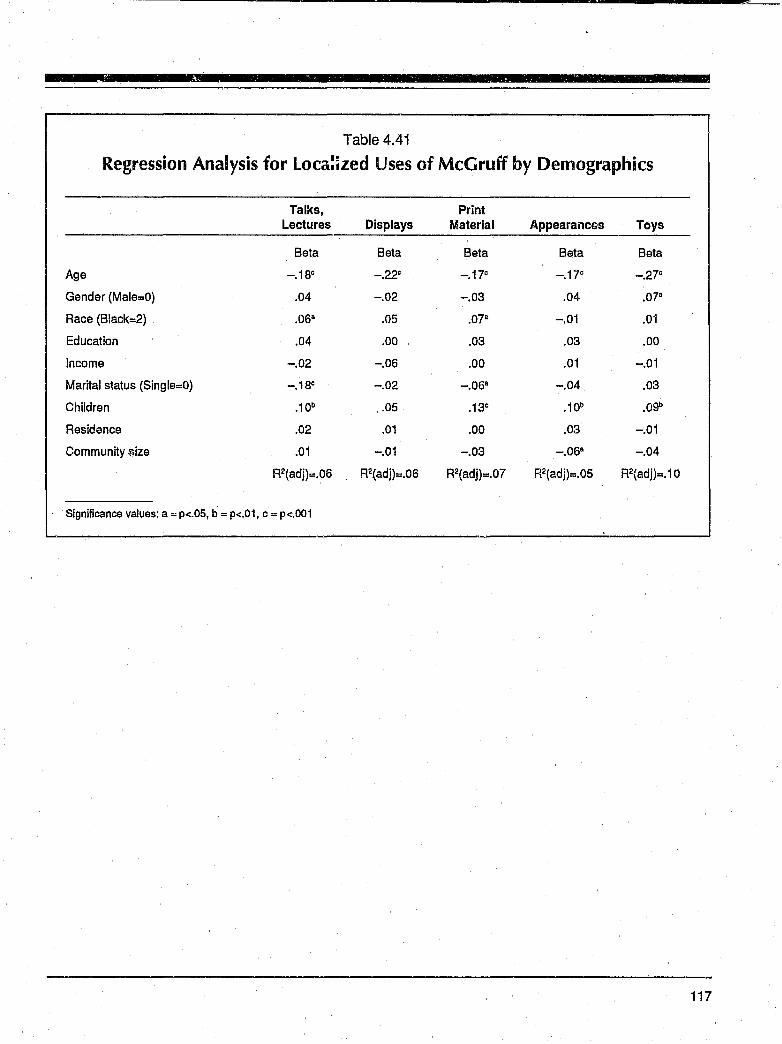
Table 4.41
Regression Analysis for loea:~zed Uses of MeG ruff by Demographics
Talks, Print Lectures Displays Material Appearancss Toys
Beta Beta Beta Beta Beta
Age -.18" -.22c -.17" -.17" -.27"
Gender (Male=O) .04 -.02 -.03 .04 .07a
Race (Black=2) .068 .05 .07a -.01 .01
Education .04 .00 .03 .03 .00
Income -.02 -.06 .00 .01 -.01
Marital status (Single=O) -.18c -.02 -.06a -.04 .03
Children .10b .05 .13" .10b .09b
Residence .02 .01 .00 .03 -.01
Community %';ize .01 -.01 -.03 -.06a -.04
R2(adj)=.06 R2(adj)=.06 R2(adj)=.07 R2(adj)=.05 R2(adj)=.10
Significance values: a = p<.05, b = p<.01, c = p<.OO1
117
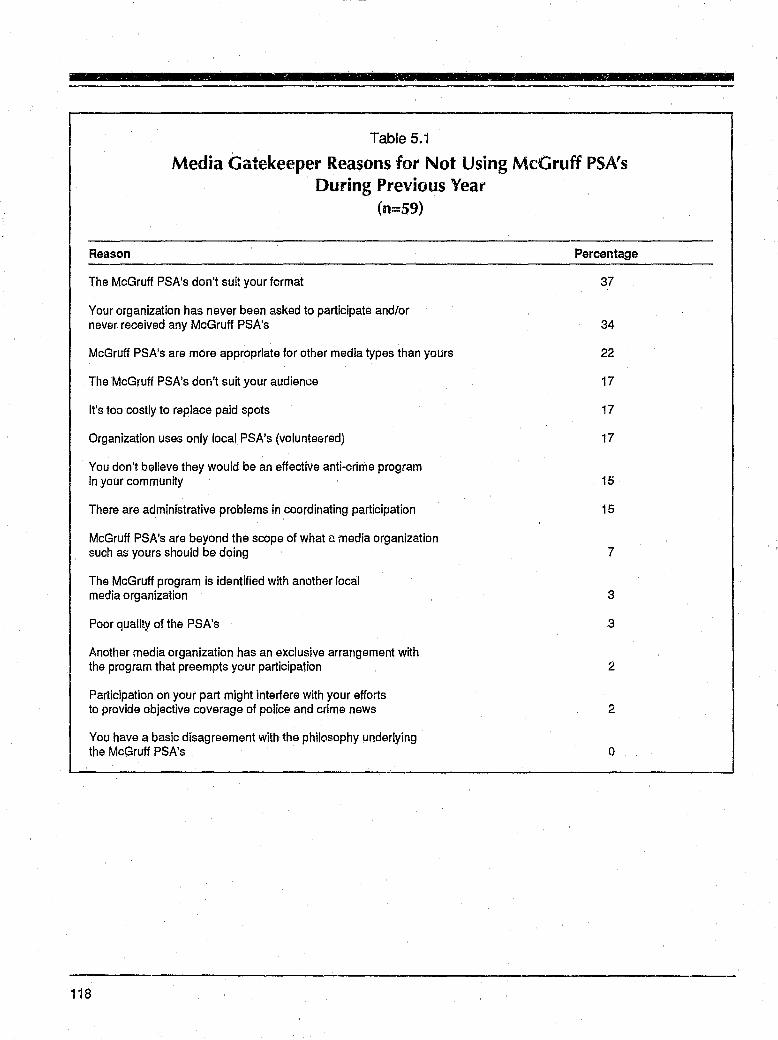
Table 5.1
Media Gatekeeper Reasons for Not Using MeG ruff PSA's During Previous Year
(n=59)
Reason
The McGruff PSA's don't suit your format
Your organization has never been asked to participate andlor never received any MeG ruff PSA's
McGruff PSA's are more appropriate for other media types than yours
The McGruff PSA's don't suit your audience
It's too costly to replace paid spots
Organization uses only local PSA's (volunteered)
You don't believe they would be an effective anti-crime program in your community
There are administrative problems in coordinating participation
McGruff PSA's are beyond the scope of what \:l media organization such as yours should be doing
The MeG ruff program is identified with another local media organization
Poor quality of the PSA's
Another media organization has an exclusive arrangement with the program that preempts your participation
Participation on your part might interfere with your efforts to provide objective coverage of police and crime news
You have a basic disagreement with the philosophy underlying the McGruff PSA's
118
Percentage
37
34
22
17
17
17
15
15
7
3
3
2
2
o
-
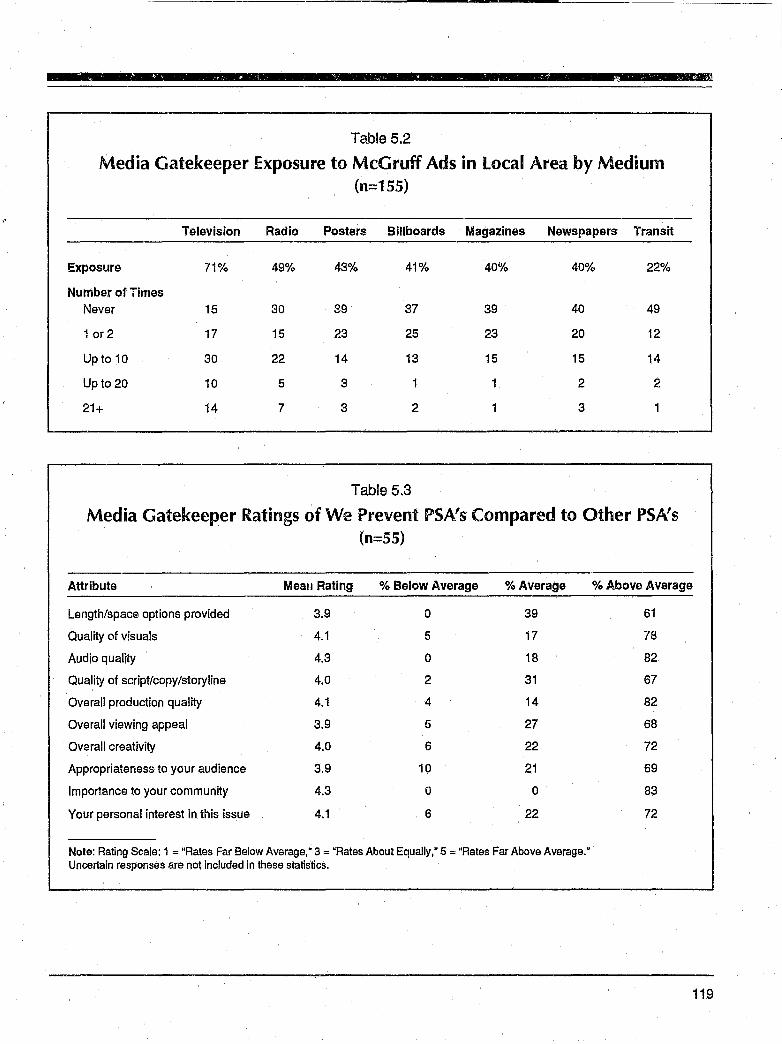
-TG1ble 5.2
Media Gatekeeper Exposure to MeG ruff Ads in local Area by Medium (n=155)
Television Radio Posters Billboards Magazines Newspapers Transit
Exposure 71% 49% 43% 41% 40% 40% 22%
Number of Times
Never 15 30 39 37 39 40 49
1 or 2 17 15 23 25 23 20 12
Up to 10 30 22 14 13 15 15 14
Up to 20 10 5 3 2 2
21+ 14 7 3 2 3
Table 5.3
Media Gatekeeper Ratings of We Prevent PSA's Compared to Other PSA's (n=55)
Attribute Mean Rating % Below Average % Average % Above Average
Length/space options provided 3.9 0 39 61
Quality of visuals 4.1 5 17 78
Audio quality 4.3 0 18 82
Quality of script/copy/storyline 4.0 2 31 67
Overall production quality 4.1 4 14 82
Overall viewing appeal 3.9 5 27 68
Overall creativity 4.0 6 22 72
Appropriateness to your audience 3.9 10 21 69
Importance to your community 4.3 0 0 83
Your personal interest in this issue 4.1 6 22 72
Note: Rating Scale: 1 = "Rates Far Below Average: 3 = "Rates About Equally," 5 = "Rates Far Above Average." Uncertain responses are not included in these statistics.
'.
119
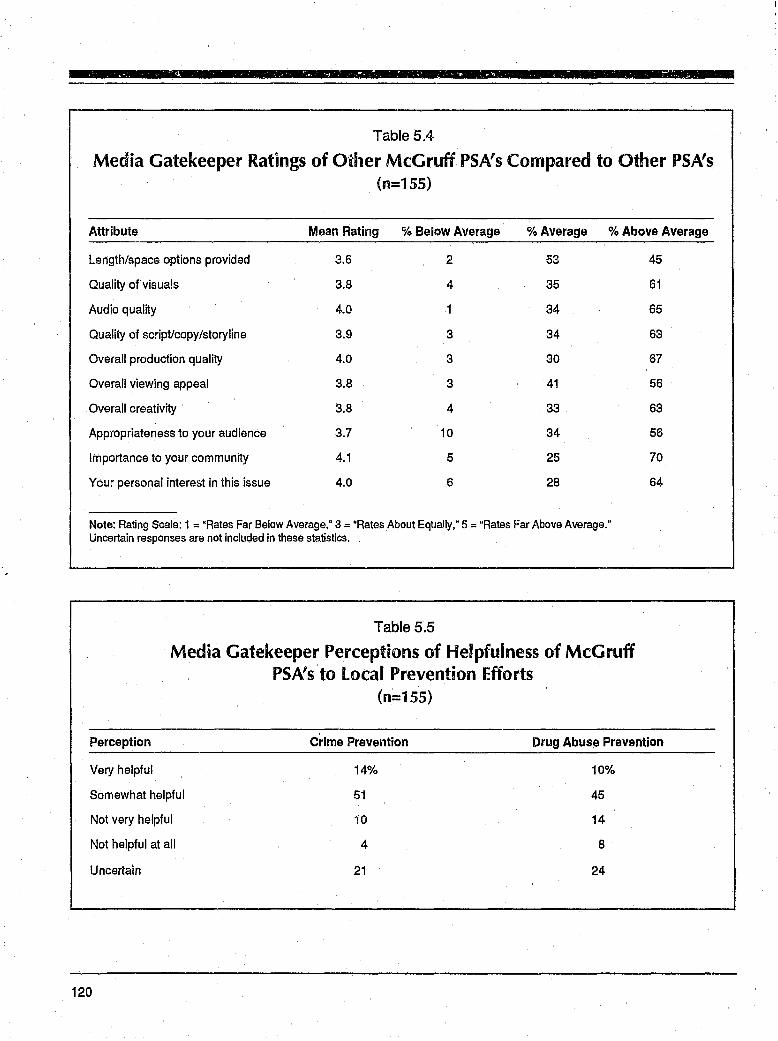
Table 5.4
Media Gatekeeper Ratings of Other McGruff PSA's Compared to Other PSA's (n=155)
Attribute Mean Rating % Below Average % Average % Above Average
Length/space options provided 3.6 2 53
Quality of visuals 3.8 4 35
Audio quality 4.0 1 34
Quality of scripVcopy/storyline 3.9 3 34
Overall production quality 4.0 3 30
Overall viewing appeal 3.8 3 41
Overall creativity 3.8 4 33
Appropriateness to your audience 3.7 10 34
Importance to your community 4.1 5 25
Your personal interest in this issue 4.0 6 28
Note: Rating Scale: 1 = "Rates Far Below Average," 3 = "Rates About EqUally," 5 = "Rates Far Above Average." Uncertain responses are not included in these statistics. .
Table 5.5
Media Gatekeeper Perceptions of Helpfulness of MeG ruff PSA's to local Prevention Efforts
(n=155)
45
61
65
63
67
56
63
56
70
64
Perception Crime Prevention Drug Abuse Prevention
Very helpful 14% 10%
Somewhat helpful 51 45
Not very helpful iO 14
Not helpful at all 4 8
Uncertain 21 24
120
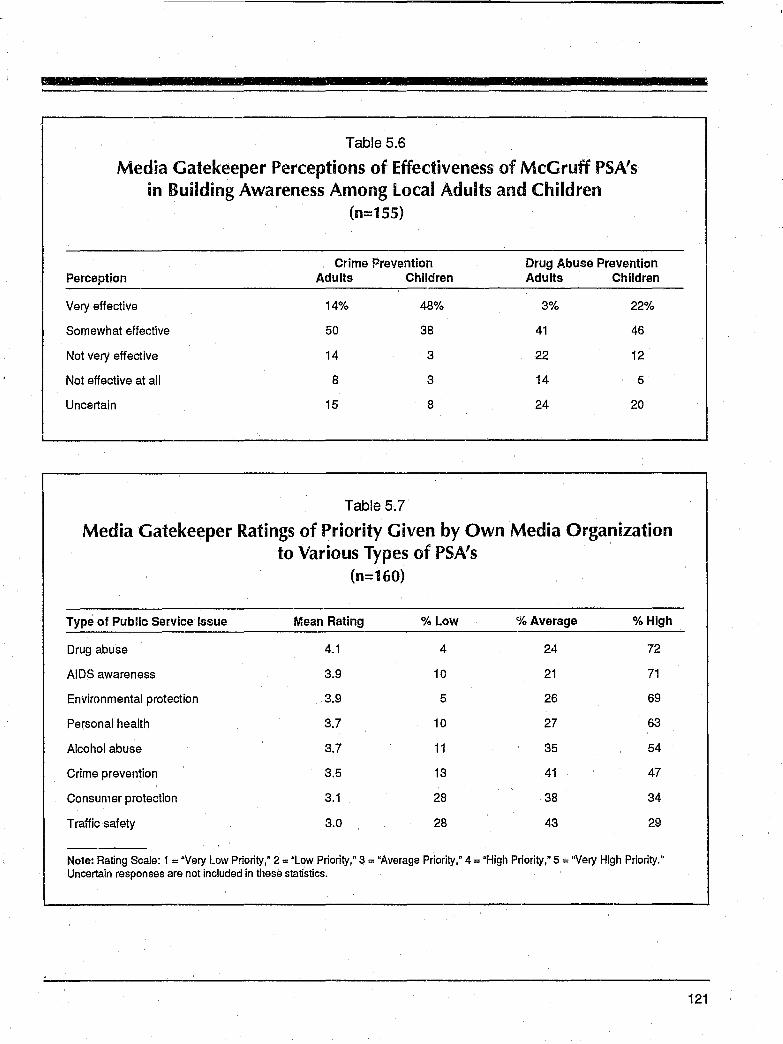
Table 5.6
Media Gatekeeper Perceptions of Effectiveness of MeG ruff PSA's in Building Awareness Among local Adults and Children
(n=155)
Crime Prevention Drug Abuse Prevention Perception Adults Children Adults Children
Very effective 14% 48% 3% 22%
Somewhat effective 50 38 41 46
Not very effective 14 3 22 12
Not effective at all 8 3 14 5
Uncertain 15 8 24 20
Table 5.7
Media Gatekeeper Ratings of Priority Given by Own Media Organization to Various Types of PSA's
(n=160)
Type of Public Service Issue Mean Rating % Low % Average % High
Drug abuse 4.1 4 24 72
AIDS awareness 3.9 10 21 71
Environmental protection 3.9 5 26 69
Personal health 3.7 10 27 63
Alcohol abuse 3.7 11 35 54
Crime preven1ion 3.5 13 41 47
Consumer protection 3.1 28 38 34
Traffic safety 3.0 28 43 29
Note: Rating Scale: 1 = "Very Low Priority: 2 = "Low Priority,· 3 = "Average Priority,· 4 = "High Priority,· 5 = "Very High Priority." Uncertain responses are not included in these statistics.
121
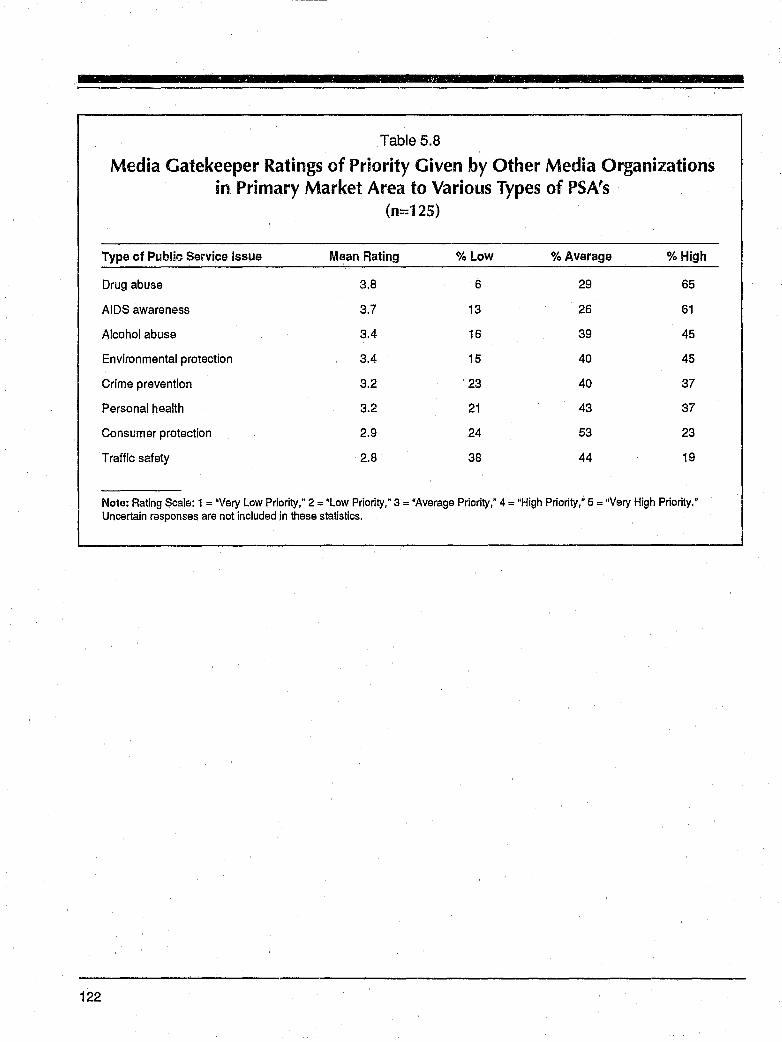
122
Table 5.8
Media Gatekeeper Ratings of Priority Given by Other Media Organizations in Primary Market Area to Various Types of PSA's
(n=125)
Type of Public Service Issue Mean Rating % Low % Average % High
Drug abuse 3.8 6 29 65
AIDS awareness 3.7 13 26 61
Alcohol abuse 3.4 16 39 45
Environmental protection 3.4 15 40 45
Crime prevention 3.2 23 40 37
Personal health 3.2 21 43 37
Consumer protection 2.9 24 53 23
Traffic safety 2.8 38 44 19
Note: Rating Scale: 1 = "Very Low Priority; 2 = "Low Priority; 3 = "Average Priority; 4 = "High Priority; 5 = "Very High Priority." Uncertain responses are not included in these statistics.
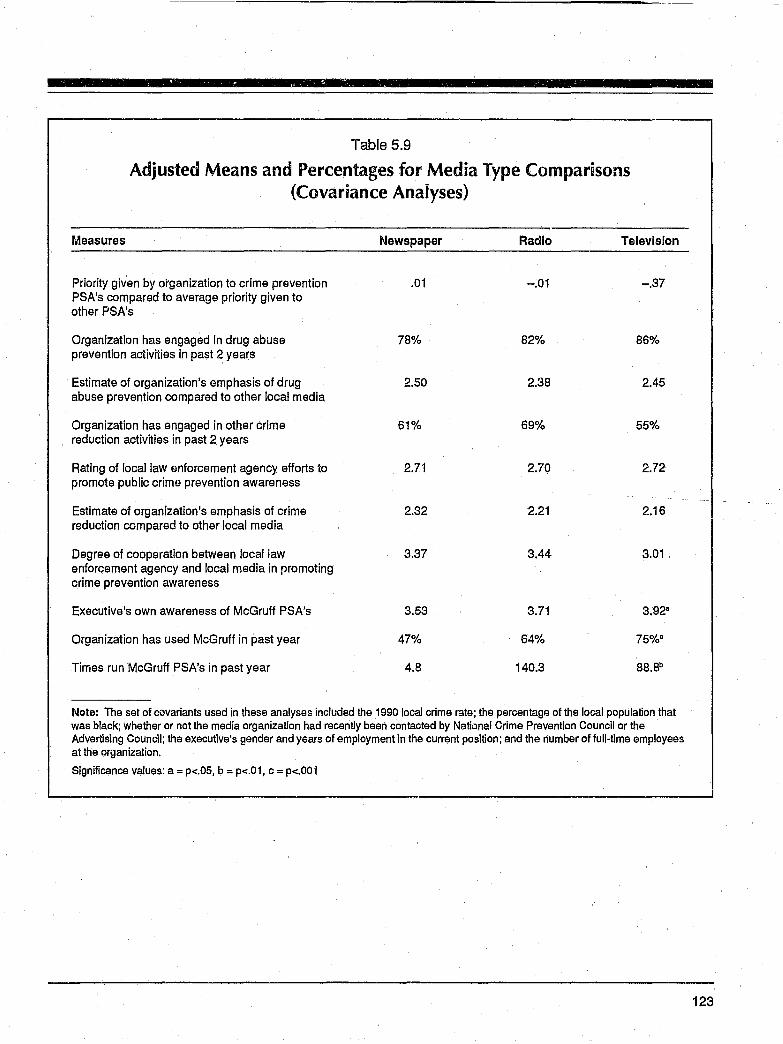
Table 5.9
Adjusted Means and Percentages for Media Type Comparusons (Covariance Analyses)
Measures Newspaper Radio Television
Priority given by otganization to crime prevention PSA's compared to average priority given to other PSA's
Organization has engaged in drug abuse prevention activities in past 2 years
Estimate of organization's emphasis of drug abuse prevention compared to other local media
Organization has engaged in other crime reduction activities in past 2 years
Rating of local law enforcement agency efforts to promote public crimo prevention awareness
Estimate of organization's emphasis of crime reduction compared to other local media
Degree of cooperation between local law enforcement agency and local media in promoting crime prevention awareness
Executive's own awareness of McGruff PSA's
Organization has used MeG ruff in past year
Times run McGruff PSA's in past year
.01
78%
2.50
61%
2.71
2.32
3.37
3.53
47%
4.8
-.01 -.37
82% 86%
2.38 2.45
69% 55%
2.70 2.72
2.21 2.16
3.44 3.01
3.71 3.928
64% 75%8
140.3
Note: The set of cavariants used in these analyses included the 1990 local crime rate; the percentage of the local popUlation that was black; whether or not the media organization had recently been contacted by National Crime Prevention Council or the Advertising Co.uncil; the executive's gender and years of employment in the current position; and the number of full-time employees at the prganization.
Significance values: a = p<.05, b = p<.01, c = p<.OO I
123
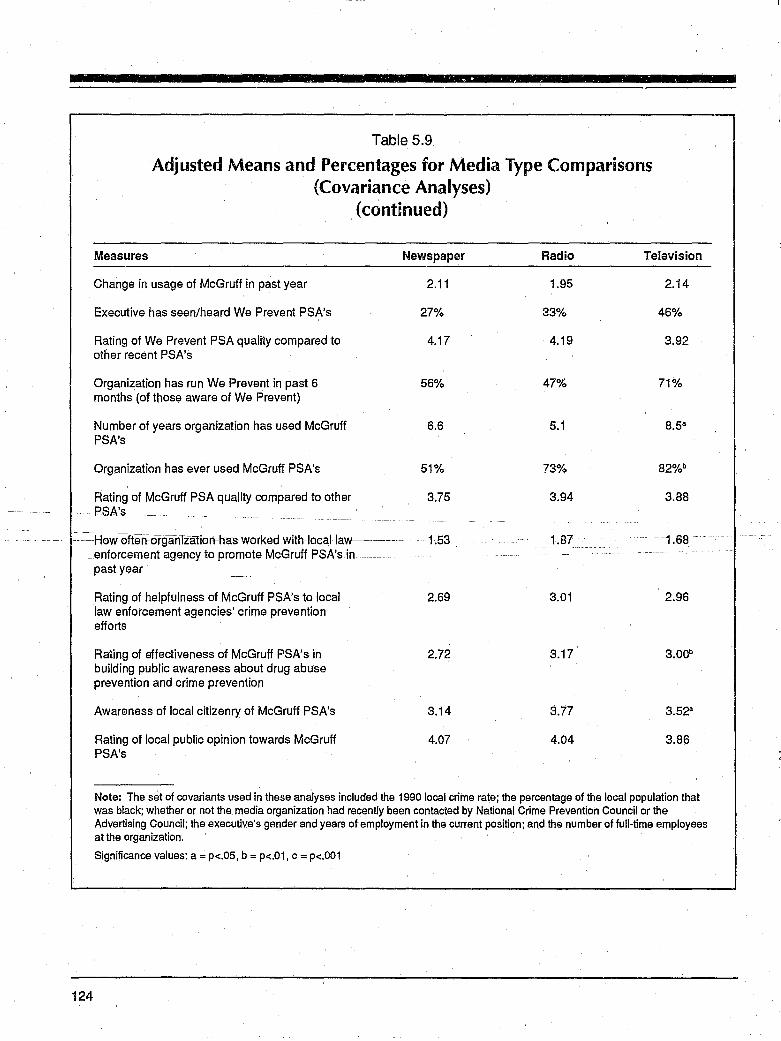
zm
Table 5.9
Adjusted Means and Pel'centages for Media Type Comparisons {Covariance Analyses}
(contcnued)
Measures Newspaper Radio Television
Change in usage of McGruff in past year 2.11 1.95 2.14
Executive has seen/heard We Prevent PSA's 27% 33% 46%
Rating of We Prevent PSA quality compared to 4.17 4.19 3.92 other recent PSA's
Organization has run We Prevent in past 6 56% 47% 71% months (of those aware of We Prevent)
Number of years organization has used McGruff 6.6 5.1 8.5" PSA's
Organization has ever used McGruff PSA's 51% 73% 82%b
Rating of McGruff PSA quality compared to other 3.75 3.94 3.88 PSA's
~--~-How offe-rl~organTz-ation-has worked with loeallaw-------- 1.53 1.87 1 ;68- -_enforcement agency to promote McGruff PSA's in --
124
past year
Rating of helpfulness of McGruff PSA's to local 2.69 3.01 2.96 law enforcement agencies' crime prevention efforts
Ra'ling of effectiveness of MeG ruff PSA's in 2.72 3.17 3.00b
building public awareness about drug abuse prevention and crime prevention
Awareness of local citizenry of McGruff PSA's 3.14 3.77 3.52"
Rating of local public opinion towards McGruff 4.07 4.04 3.86 PSA's
Note: The set of covariants used in these analyses included the 1990 local crime rate; the percentage of the local population that was black; whether or not the media organization had recently been contacted by National Crime Prevention Council or the Advertising COllncil; the executive's gender and years of employment in the current position; and the number of full-time employees at the organization.
Significance values: a = p<.05, b = p<.01, c = p<.001
--
:1
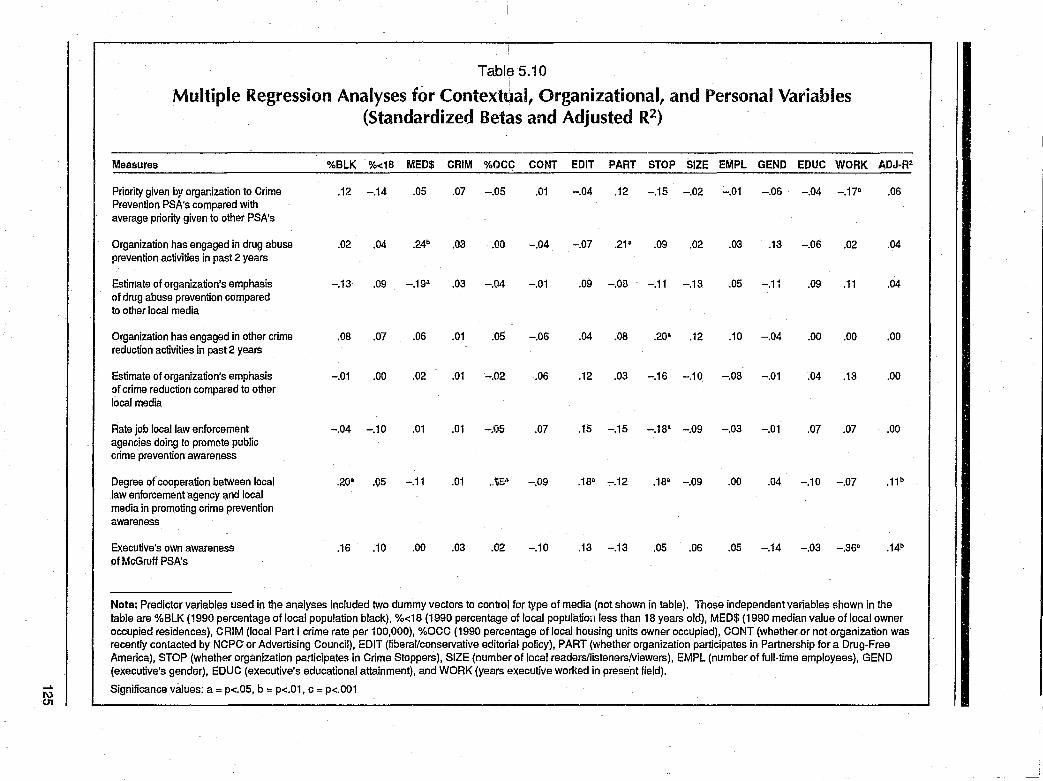
i
Tabl~ 5.10
Multiple Regression Analyses for Context~al, Organizational, and Personal Variables (Standardized Betas and Adjusted R2)
Measures %BLK %<18 MED$ CRIM %OCC CONT EDIT PART STOP SIZE EMPL GEND EDUC WORK ADJ·R2
Priority 9iven by organization to Crime .12 -.14 .05 .07 -.05 .01 -.04 .12 -.15 -.02 -.01 -.06 -.04 -.17- .06 Prevention PSA's compared with average priority given to other PSA's
Organization has engaged in drug abuse .02 .04 .24b .03 .00 -.04 -.07 .21- .09 .02 .03 .13 -.06 .02 .04 prevention activities in past 2 years
Estimate of organization's emphasis -.13 .09 -.19- .03 -.04 -.01 .09 -.08 -.11 -.13 .05 -.11 .09 .11 .04 of dmg abuse prevention compared to other local media
Organization has engaged in other crime .OS .07 .06 .01 .05 -.06 .04 .OS .20- .12 .10 -.04 .00 .00 .00 reduction activities in past 2 years
Estimate of organization's emphasis -.01 .00 .02 .01 -.02 .06 .12 .03 -.16 -.10 -.OS -.01 .04 .13 .00 of crime reduction compared to other local media
Rate job local law enforcement -.04 -.10 .01 .01 -XiS .07 .15 -.15 -.is" -.09 -.03 -.01 .07 .07 .00 agencies doing to promote public crime prevention awareness
Degree of cooperation between local .20- .05 -.11 .01 ,.WB" -.09 .1S" -.12 .1S" -.09 .00 .04 -.10 -.07 .11b law enforcement agency and local media in promoting crime prevention awareness
Executive's own awareness .16 .10 .00 .03 .02 -.10 .13 -.13 .05 .06 .05 -.14 -.03 -.36e .14b of McGruff PSA's
Note: Predictor variables used in the analyses included two dummy vectors to control for type of media (not shown in table). Those independent variables shown in the table are %BLK (1990 percentage of local population black), %<1S (1990 percentage of local population less than is years old), MED$ (1990 median value of local owner occupied residences), CRIM (local Part I crime rate per 100,000), %OCC (1990 percentage of local housing units owner occupied), CONT (whether or not organization was recently contacted by NCPC or Advertising Council), EDIT (liberal/conservative editorial policy), PART (whether organization participates in Partnership for a Drug·Free America), STOP (whether organization participates in Crime Stoppers), SIZE (number of local readers/listenerslviewers), EMPL (number of full·time employees), GEND (executive's gender), EDUC (executive's educational attainment), and WORK (years executive worked in present field).
..... Significance values: a = p<.05, b = p<.01, c = p<.001 I\) C1I
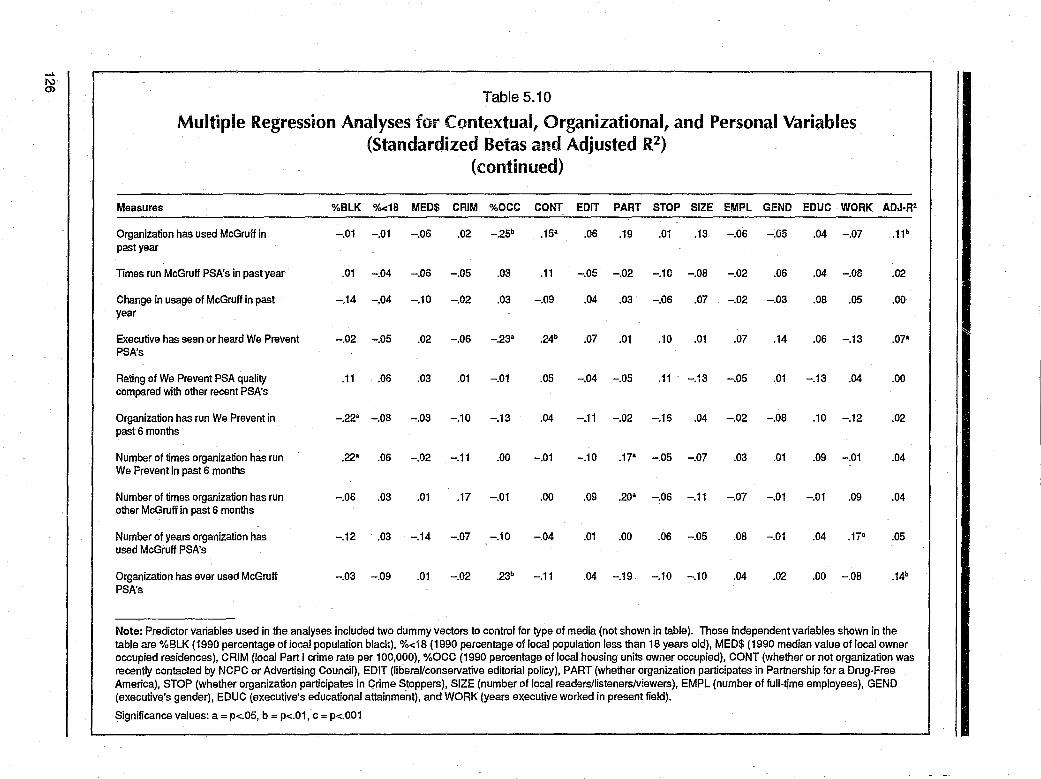
-I. I\:) 0> .
Table 5.10
Multiple Regression Analyses for Contextual, Organizational, and Personal Variables (Standardized Betas and Adjusted R2)
(continued)
Measures %BLK %<18 MED$ CRIM %OCC CONT EDIT PART STOP SIZE EMPL GEND EDUC WORK ADJ·R2
Organization has used McGruff in -.01 -.01 -.06 .02 -.25b .15" .06 .19 .01 .13 -.06 -.05 .04 -.07 .11b past year
Times run McGruff PSA's in past year .01 -.04 -.06 -.05 .03 .11 -.05 -.02 -.10 -.08 -.02 .06 .04 -.08 .02
Change in usage of McGruff in past -.14 -.04 -.10 -.02 .03 -.09 .04 .03 -.06 .07 -.02 -.03 .08 .05 .00 year
Executive has seen or heard We Prevent -.02 -.05 .02 -.06 -.23" .24b .07 .01 .10 .01 .07 .14 .06 -.13 .07" II
PSA's
Rating of We Prevent PSA quality .11 .06 .03 .01 -.01 .05 -.04 -.05 .11 -.13 -.05 .01 -.13 .04 .00 compared with other recent PSA's
Organization has run We Prevent in -.22" -.08 -.03 -.10 -.13 .04 -.11 -.02 -.16 .04 -.02 -.08 .10 -.12 .02 past 6 months
Number of times organization has run .22" .06 -.02 -.11 .00 -.01 -.10 .17" -.05 -.07 .03 .01 .09 -.01 .04 We Prevent in past 6 months
Number of times organization has run -.06 .03 .01 .17 -.01 .00 .09 .20" -.06 -.11 -.07 -.01 -.01 .09 .04 other McGruff in past 6 months
Number of years organization has -.12 .03 -.14 -.07 -.10 -.04 .01 .00 .06 -.05 .08 -.01 .04 r"" . I .05 used McGruff PSA's
Organization has ever used McGruff -.03 -.09 .01 -.02 .23b -.11 .04 -.19 -.10 -.10 .04 .02 .00 -.08 .14b PSA's
Note: Predictor variables used in the analyses included two dummy vectors to control for type of media (not shown in table). Those independent variables shown in the table are %BLK (1990 percentage of local population black), %<18 (1990 percentage of local population less than 18 years old), MED$ (1990 median value of local owner occupied residences), CRIM (local Part I crime rate per 100,000), %OCC (1990 percentage of local housing units owner occupied), CONT (whether or not organization was recently contacted by NCPC or Advertising Council), EDIT (liberal/conservative editorial policy), PART (whether organization participates in Partnership for a Drug·Free America), STOP (whether organization participates in Crime Stoppers), SIZE (number of local readars/listenerslviewers), EMPL (number of full·time employees), GEND (executive's gender), EDUC (executive'S educational attainment), and WORK (years executive worked in present field).
Significance values: a = p<.05, b = p<.01, c = p<.OO1
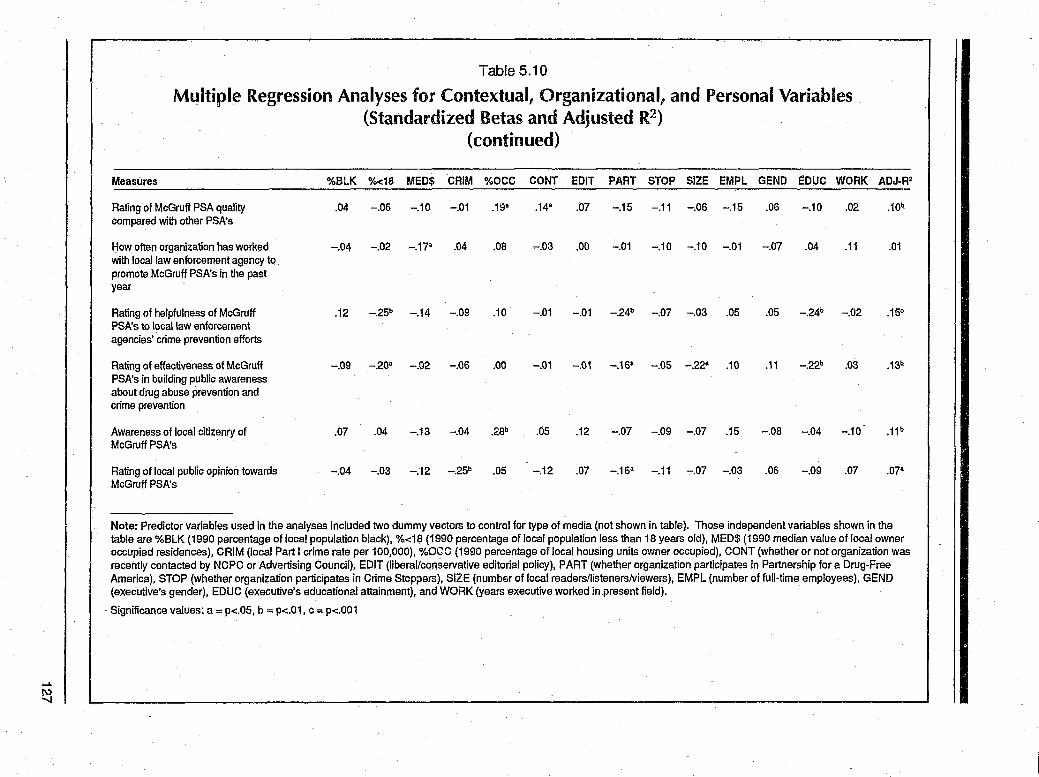
.... ~
Table 5.10
Multiple Regression Analyses for Contextual, Organizational, and Personal Variables (Standardized Betas and Adjusted R2)
(continued)
Measures %BLK %<18 MED$ CAlM %OCC CONT EDIT PART STOP SIZE EMPL GEND EOUC WORK ADJ·R2
Rating of McGruff PSA quality compared with other PSA"s
How often organization has worked with local law enforcement agency to promote McGruff PSA's in the past year
Rating of helpfulness of McGruff PSA's to local law enforcement agencies' crime prevention efforts
Rating of effectiveness of McGruff PSA's in building public awareness about drug abuse prevention and crime prevention
Awareness of local citizenry of McGruff PSA's
Rating of local public opinion towards McGruff PSA's
.04 -.06 -.10 -.01 .1~"
-.04 -.02 -.17" .04 .08
.12 -.25b -.14 -.09 .10
-.09 -.20" -.02 -.06 .00
.07 .04 -.13 -.04 .28b
-.04 -.03 -.12 -.25b .05
.14' .07 -.15 -.11 -.06 -.15 .06 -.10 .02 .10b
-.03 .00 -.01 -.10 -.10 -.01 -.Q7 .04 .11 .01
-.01 -.01 -.24b -.07 -.03 .05 .05 --.24b -.02 .15C
-.01 -.0"1 -.16" -.05 -.22" .10 .11 -.22b .03 .13b
.05 .12 -.07 -.09 -.07 .15 -.08 -.04 -.10 .11b
-.12 .07 -.16" -.11 -.07 -.03 .06 -.09 .07 .07"
Note: Predictor variables used in the analyses included two dummy vectors to control for type of media (not shown in table). Those independent variables shown in the table are %BLK (1990 percentage of local population black), %<18 (1990 percentage of local population less than 18 years old), MED$ (1990 median value of local owner occupied residences), CRIM (local Part I crime rate per 100,000), %OGC (1990 percentage of local housing units owner occupied), CONT (whether or not organization was recently contacted by NCPC or Advertising Council), EDIT (liberal/conservative editorial policy), PART (whether organization participates in Partnership for a Drug-Free America), STOP (whether organization participates in Crime Stoppers), SIZE (number of local readersllisteners!viewers), EMPL (number of full-time employees), GEND (executive's gender), EDUC (executive'S educational attainment), and WORK (years executive worked in present field).
Significance values: a = p<.05, b = p<.01. c = p<.001
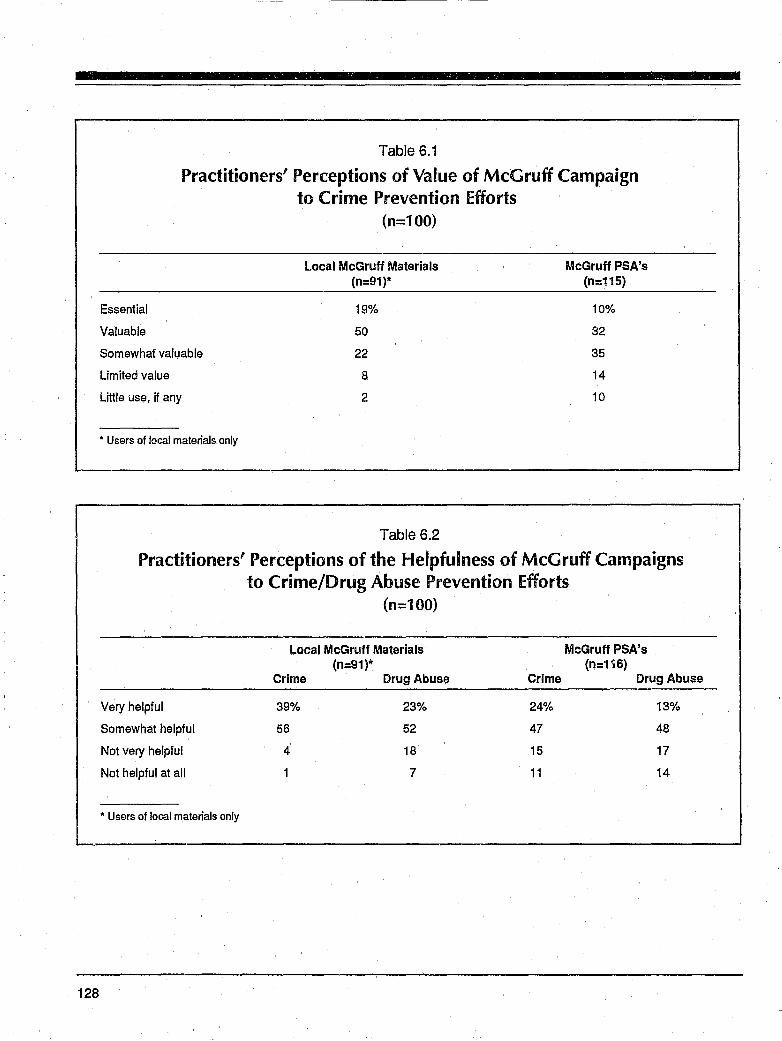
=
128
Table 6.1
Practitioners' Perceptions of Value of McGruff Campaign to Crime Prevention Efforts
Essential
Valuable
Somewhat valuable
Limited value
Little use, if any
* Users of local materials only
(n=100)
Local McGruff Materials (n=91)*
19%
50
22
8
2
Table 6.2
McGruff PSA's (n=115)
10%
32
35
14
10
Practitioners' Perceptions of the Helpfulness of McGruff Campaigns to Crime/Drug Abuse Prevention Efforts
Very helpful
Somewhat helpful
Not very helpful
Not helpful at all
* Users of local materials only
(n=100)
Local M~Gruff Materials (n=91)*
Crime
39%
56
4
Drug Abuse
23%
52
18
7
Crime
24%
47
15
11
McGruff PSA's (n=116)
Drug Abuse
13%
48
17
14
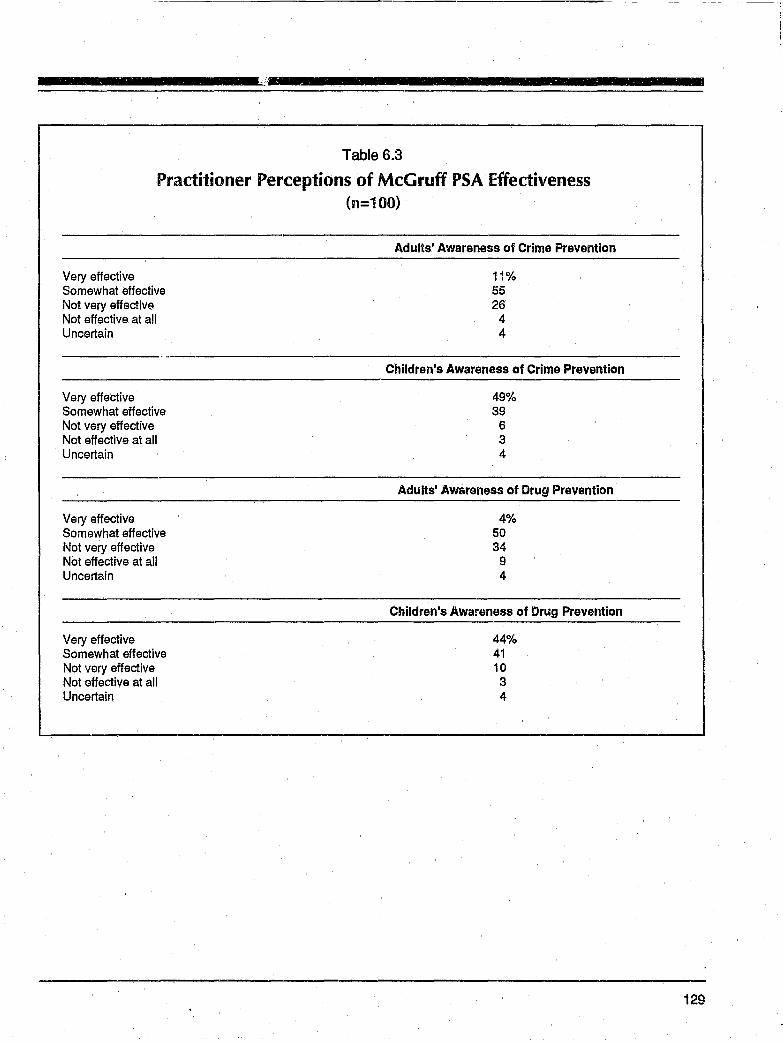
~ .:.
Table 6.3
Practitioner Perceptions of MeG ruff PSA Effectiveness (n=100)
Very effective Somewhat effective Not very effective Not effective at all Uncertain
Very effective Somewhat effective Not very effective Not effective at all Uncertain
Very effective Somewhat effective Not very effective Not effective at all Uncertain
Very effective Somewhat effective Not very effective Not effective at all Uncertain
Adults' Awareness of Crime Prevention
11% 55 26
4 4
Children's Awareness of Crime Prevention
49% 39
6 3 4
AduHs' Awareness of Drug Prevention
4% 50 34
9 4
Children's Awa~eness of Drug Prevention
44% 41 10 3 4
129
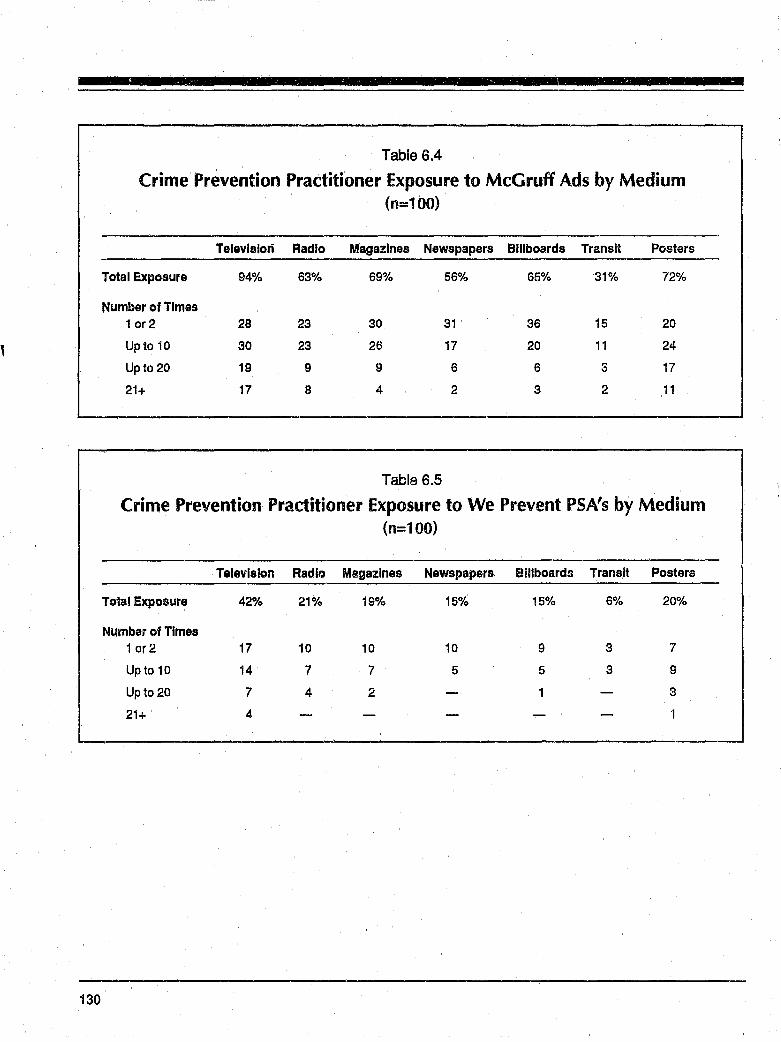
130
Table 6.4
Crime Prevention Practitioner Exposure to McGruff Ads by Medium (n=100)
Television Radio Magazines Newspapers Billboards Transit Posters
Total Exposure 94% 63% 69% 56% 65% 31% 72%
Number of Times 1or2 28 23 30 31 36 15 20
Up to 10 30 23 26 17 20 11 24
Upto 20 19 9 9 6 6 3 17
21+ 17 8 4 2 3 2 11
Table 6.5
Crime Prevention Practitioner Exposure to We Prevent PSA's by Medium (n=100)
Television Radii, Megazlnes Newspapers FJillboards Transit Posters
Total Exposure 42% 21% 19% 15% 15% 6% 20%
Number of Times 1 or 2 17 10 10 10 9 3 7
Up to 10 14 7 7 5 5 3 9
Upto 20 7 4 2 3
21+ 4
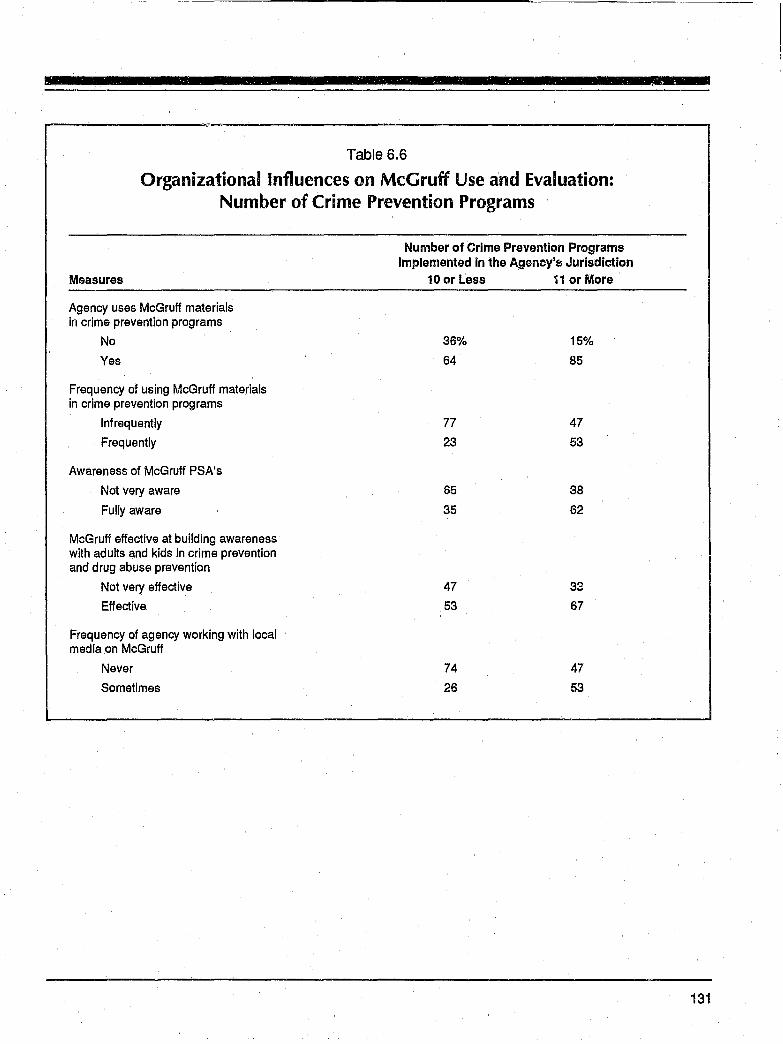
-------------------------------------
. Table 6.6 I Organizational Influences on MeG ruff Use and Evaluation:
Number of Crime Prevention Programs
Measures
Agency uses McGruff materials in crime prevention programs
No
Yes
Frequency of using McGruff materials in crime prevention programs
Infrequently
Frequently
Awareness of McGruff PSA's
Not very aware
Fully aware
MeG ruff effective at building awareness with adults and kids in crime prevention and drug abuse prevention
Not very effective
Effective
Frequency of agency working with local media on McGruff
Never
Sometimes
Number of Crime Prevention Programs Implemented in the Agency's Jurisdiction
10 or Less 11 or More
36%
64
77
23
65
35
47 53
74
26
15%
85
47 53
38
62
33
67
47 53
131

132
Table 6.7
Organizational Influences on McGruff Use and Evaluation: Priority Placed on Citizen Education and Involvement in Crime Prevention
Measures
Agency uses McGruff materials in crime prevention programs
No
Yes
Frequency of using McGrufT materials in crime prevention programs
Infrequent.ly
Frequently
Awareness of McGruff PSA's
Not very awars
Fully aware
McGruff effective at building awareness with adults and kids in crime prevention and drug abuse prevention
Not very effective
Effective
Frequency r,. ';.,'ency working with local media on Mt..!:':, ..Iff
Naver
Sometimes
Priority Placed on Citizen Education and Involvement In Crime Prevention
Low Priority High Priority
36%
70
68
32
63
37
42
58
65
35
16%
84
47 53
33
67
33
67
49
51
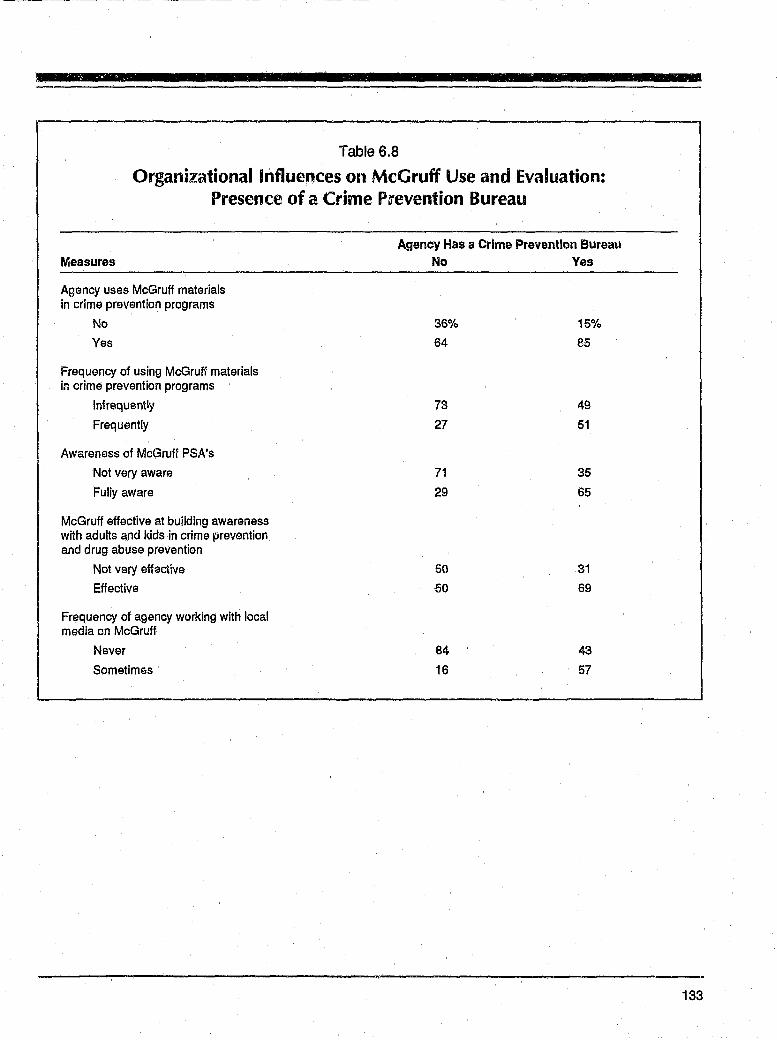
Table 6.8
Organizational Influences on McGruff Use and Evaluation: Presence of a Crime Prevention Bureau
Measures
Agency uses McGruff materials in crime prevention programs
No
Yes
Frequency of using McGruff materials in crime prevention programs
Infrequently
Frequently
Awareness of McGruff PSA's
Not vary aware
Fully aware
MeG ruff effective at building awareness with adults and kids in crime prevention and drug abuse prevention
Not very effactive
Effective
Frequency of agency working with local media on McGruff
Never
Sometimes
Agency Has a Crime Prevention Bureau No Yes
36%
64
73 27
71
29
50
50
84
16
15%
85
49
51
35
65
31
69
43
57
=
133
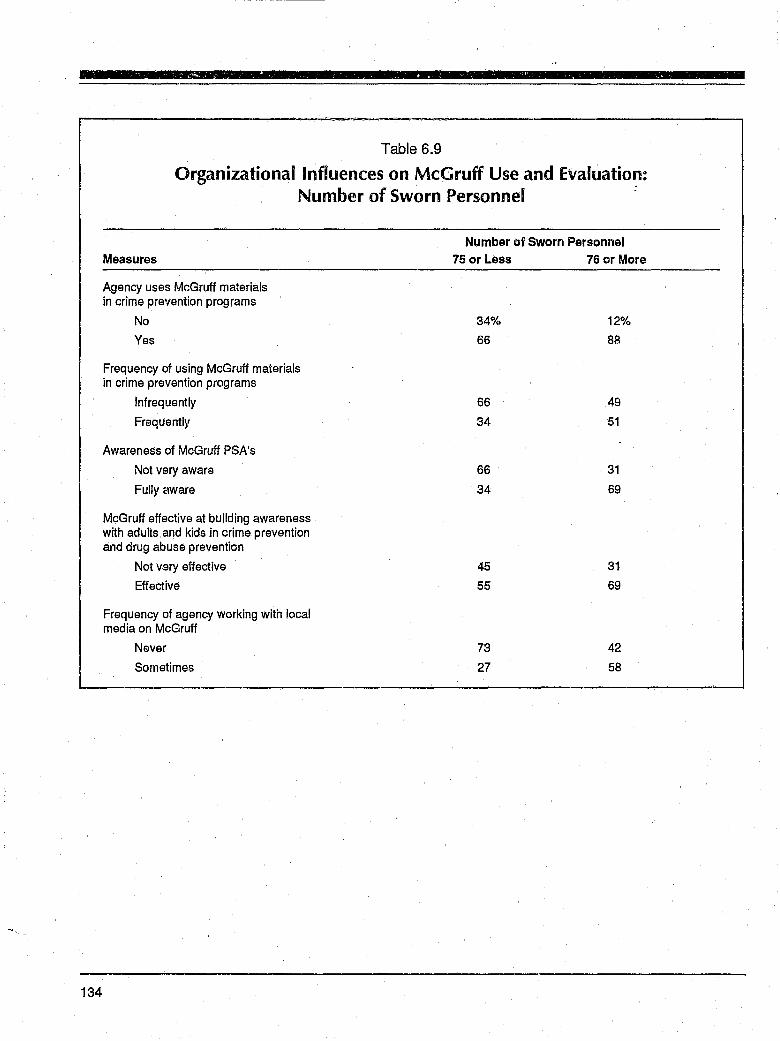
r--------------------------~~.~=------=-------------------------------------~
134
Table 6.9
Organizational Influences on McGruff Use and Evaluation: Number of Sworn Personnel :
Measures
Agency uses MeG ruff materials in crime prevention programs
No
Yes
Frequency of using McGruff materials in crime prevention programs
Infrequently
Frequently
Awareness of McGruff PSA's
Not very aware
Fully aware
McGruff effective at building awareness with adults and kids in crime prevention and drug abuse prevention
Not very effective
Effective
Frequency of agency working with local media on McGruff
Never
Sometimes
Number of Sworn Personnel 75 or Less
34%
66
66
34
66
34
45
55
73
27
76 or More
12%
88
49
51
31
69
31
69
42
58
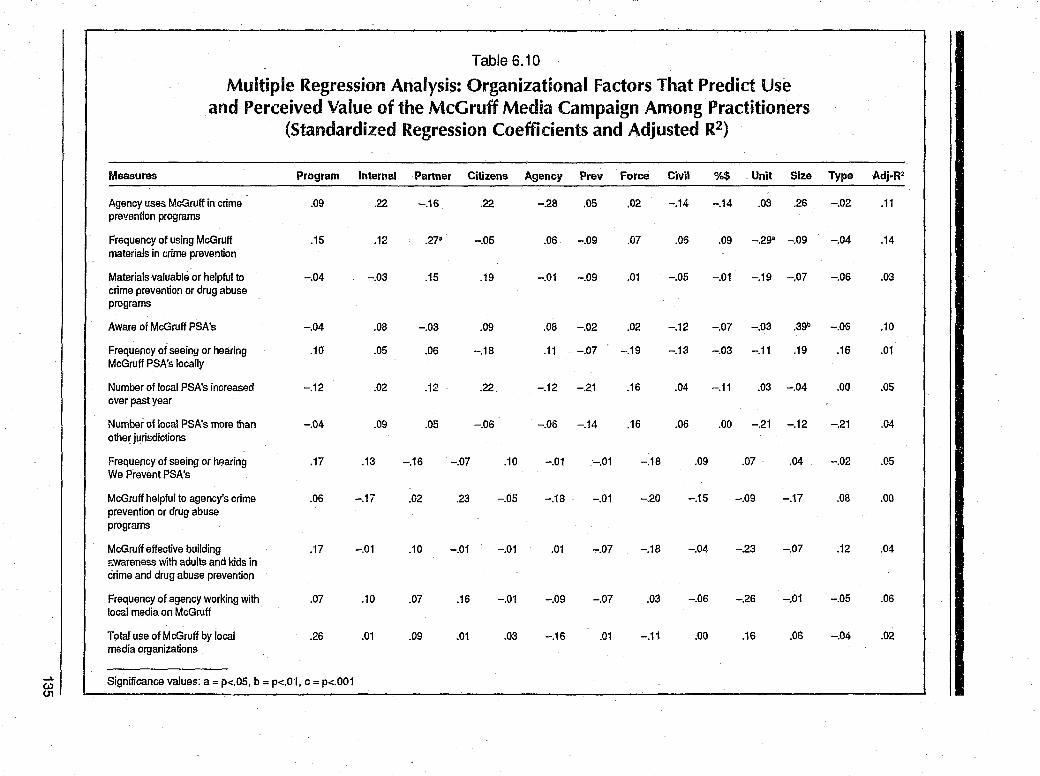
Table 6.10
Multiple Regression Analysis: Organizational factors That Predict Use and Perceived Value of the McG ruff Media Campaign Among Practitioners
(Standardized Regression Coefficients and Adjusted R2)
Measures Program Internal Partner Citizens Agency Prey Force Civil "/0$ Unit Size Type Adj·R2
Agency uses McGruff in crime .09 .22 -.16 .22 -.28 .05 .02 -.14 -.14 .03 .26 -.02 .11 prevention programs
Frequency of using McGruff .15 .12 .27" -.05 .06 -.09 .07 .05 .09 -.29" -.09 -.04 .14 materials in crime prevention
Materials valuable or helpful to -.04 -.03 .15 .19 -.01 -.09 .01 -.05 -.01 -.19 -.07 -.06 .03 crime prevention or drug abuse programs
Aware of McGruff PSA's -.04 .08 -.03 .09 .08 -.02 .02 -.12 -.07 -.03 .39b -.06 .10
Frequency of seeing or hearing .10 .05 .06 -.18 .11 -.07 -.19 -.13 -.03 -.11 .19 .16 .01 McGruff PSA's locally
Number of local PSA's increased -.12 .02 .12 .22 -.12 -.21 .16 .04 -.11 .03 -.04 .00 .05 over past year
Number of local PSA's more than -.04 .09 .05 -.06 -.06 -.14 .16 .06 .00 -.21 -.12 -.21 .04 other jurisdictions
Frequency of seeing or hl3aring .17 .13 -.16 -.07 .10 -.01 -.01 -.18 .09 .07 .04 -.02 .05 We Prevent PSA's
McGruff helpful to agency's crime .06 -.17 .02 .23 -.05 -.18 -.01 -.20 -.15 -.09 -.17 .08 .00 prevention or drug abuse programs
McGruff effective building .17 -.01 .10 -.01 -.01 .01 -.07 -.18 -.04 -.23 -.07 .12 .04 ~wareness with adults and kids in crime and drug abuse prevention
Frequency of agency working with .07 .10 .07 .16 -.01 -.09 -.07 .03 -.06 -.26 -.01 -.05 .06 local media on McGruff
Total use of McGruff by local .26 .01 .09 .01 .03 -.16 .01 -.11 .00 .16 .06 -.04 .02 media organizations
wi I Significance values: a = p<.05, b = p<.01, C = p<.OO1 c.n
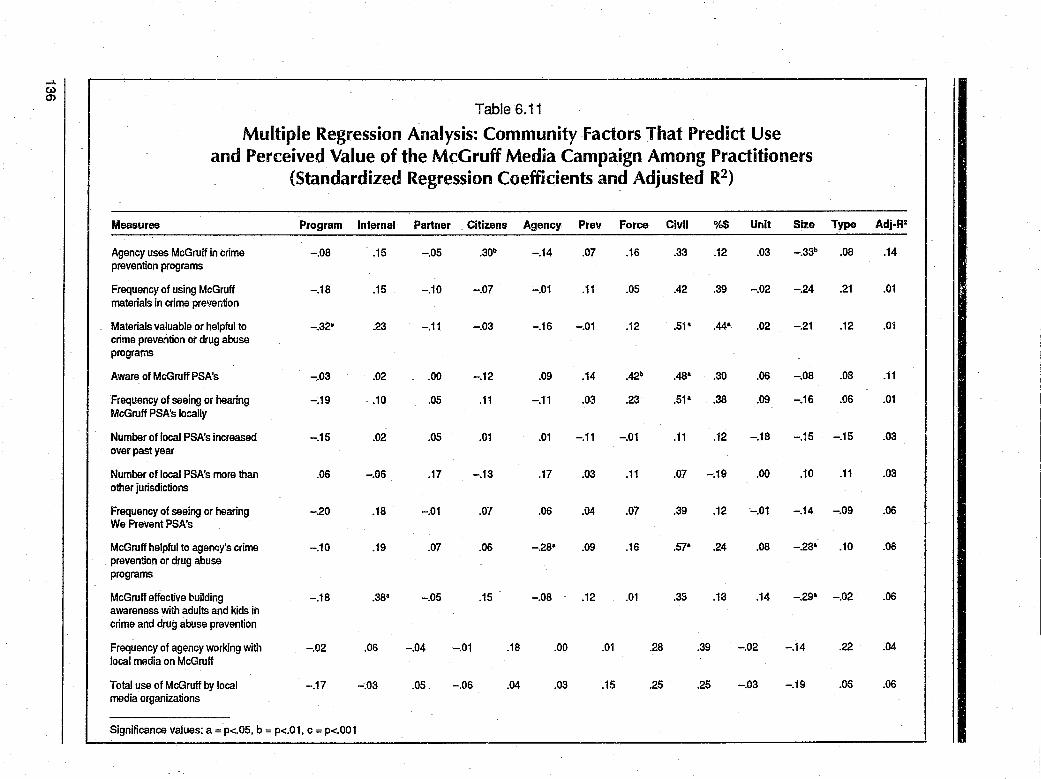
..... c.> 0>
Table 6.11
Multiple Regression Analysis: Community Factors That Predict Use and Perceived Value of the McGruff Media Campaign Among Practitioners
(Standardized Regression Coefficients and Adjusted R2)
Measures Program Internal Partner Citizens Agency Prey Force Civil %$ Unit Size Type Adj·R2
Agency uses McGruff in crime -.08 .15 -.05 .30b -.14 .07 .16 .33 .12 .03 -.33b .08 .14 prevention programs
Frequency of using MeG ruff -.18 .15 -.10 -.07 -.01 .11 .05 .42 .39 -.02 -.24 .21 .01 materials in crime prevention
Materials valuable or helpful to -.32" .23 -.11 -.03 -.16 -.01 .12 .51- .44" .02 -21 .12 .01 crime prevention or drug abuse programs
Aware of McGruff PSA's -.03 .02 .00 -.12 .09 .14 .42b .48" .30 .06 -.08 .08 .11
Frequency of seeing or hearing -.19 .10 .05 .11 -.11 .0-3 .23 .51" .38 .09 -.16 .06 .01 McGruff PSA's locally
Number of local PSA's increased -.15 .02 .05 .01 .01 -.11 -.01 .11 .12 -.18 -.15 -.15 .03 over past year
Number of local PSA's more than .06 -.06 .17 -.13 .17 .03 .11 .07 -.19 .00 .10 .11 .03 other jurisdictions
Frequency of seeing or hearing -.20 .18 -.01 .07 .06 .04 .07 .39 .12 -.01 -.14 -.09 .06 We Prevent PSA's
McGruff helpful to agen<:y's crime -.10 .19 .07 .06 -.28" .09 .16 .57" .24 .08 -.28" .10 .06 prevention or drug abuse programs
McGruff effective building -.18 .38a -.05 .15 -.08 .12 .01 .33 .13 .14 -.29" -.02 .06 awareness with adults and kids in crime and drug abuse prevention
Frequency of agency working with -.02 .06 -.04 -.01 .18 .00 .01 .28 .39 -.02 -.14 .22 .04 local media on McGruff
Total use of McGruff by local -.17 -.03 .05 -.06 .04 .03 .15 .25 .25 -.03 -.19 .OS .06 media organizations
Significance values: a = p<.05, b = p<.01, c = p<.OO1
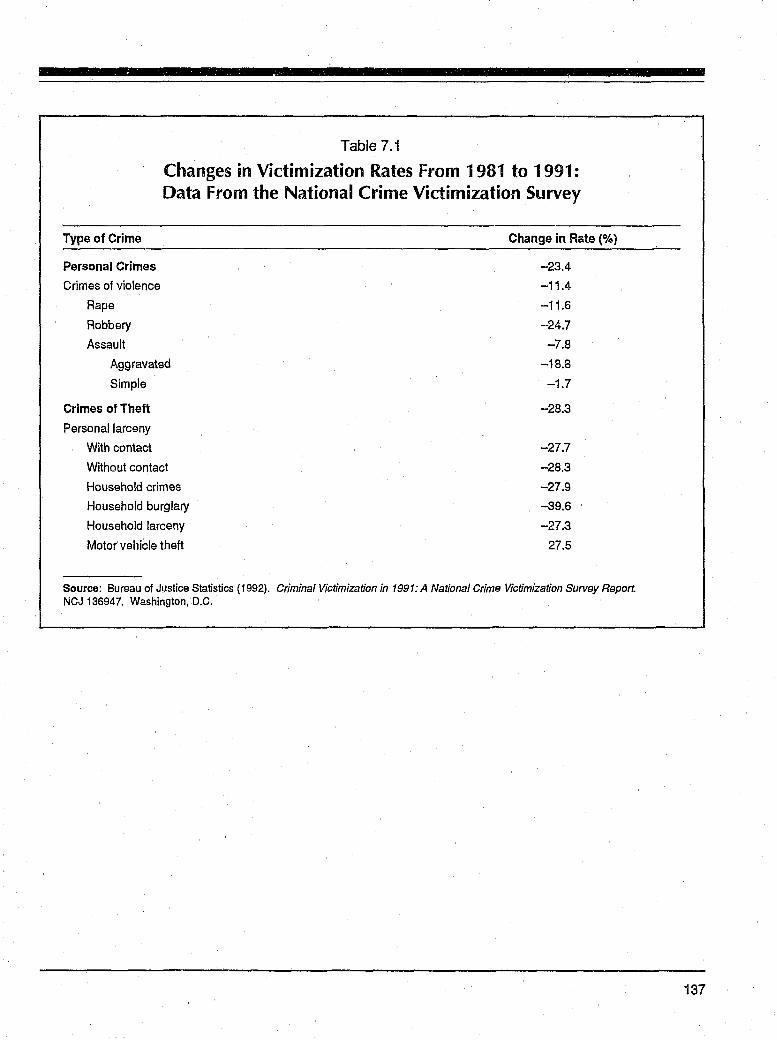
Table 7.1
Changes in Victimization Rates From 1981 to 1991: Data From the National Crime Victimization Survey
Type of Crime Change in Rate (%)
Personal Crimes -23.4
Crimes of violence -11.4
Rape -11.6
Robbery -24.7
Assault -7.8
Aggravated -18.B
Simple -1.7
Crimes of Theft -28.3
Personal larceny
With contact -27.7
Without contact -28.3
Household crimes -27.9
Household burglary -39.6
Household larceny -27.3
Motor vehicle theft 27.5
Source: Bureau of Justice Statistics (1992). Criminal Victimization in 1991: A National Crime Victimization Survey Report. NCJ 136947. Washington, D.C.
137
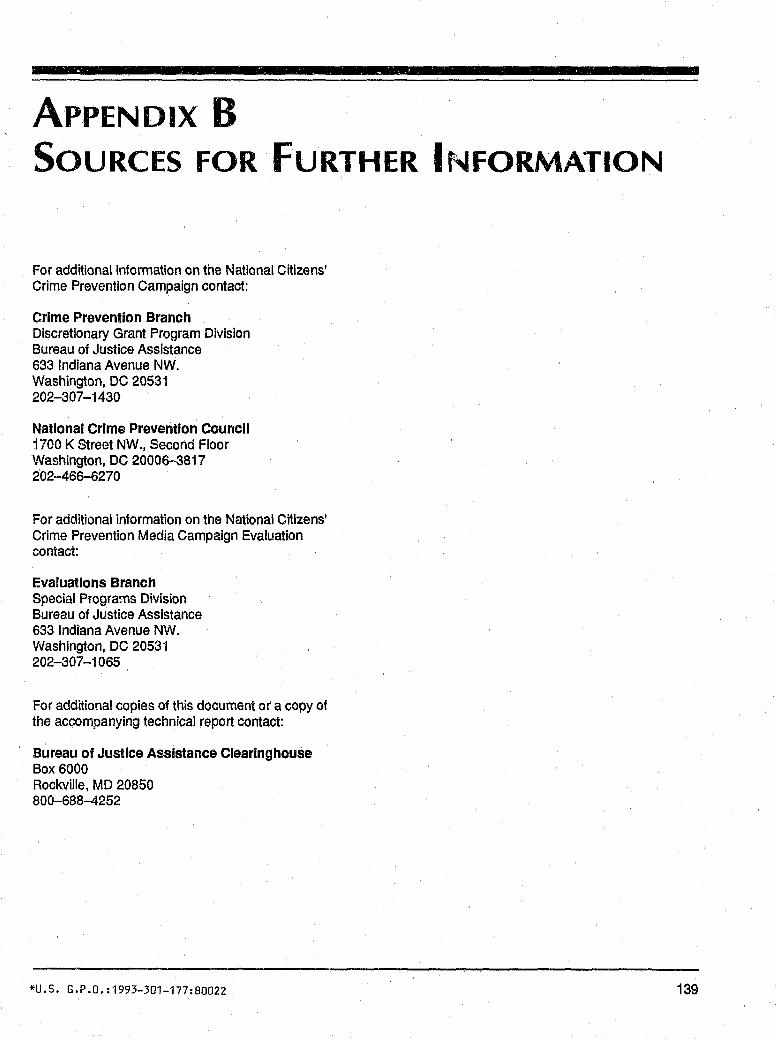
ApPENDIX B SOURCES FOR FURTHER INFORMATION
For additional information on the National Citizens' Crime Prevention Campaign contact:
Crime Prevention Branch Discretionary Grant Program Division Bureau of Justice Assistance 633 Indiana Avenue NW. Washington, DC 20531 202-307-1430
National Crime Prevention Council 1700 K Street NW., Second Floor Washington, DC 20006-3817 202-466-6270
For additional information on the National Citizens' Crime Prevention Media Campaign Evaluation contact:
Evaluations Branch Special Programs Division Bureau of Justice ASSistance 633 Indiana Avenue NW. Washington, DC 20531 202-307-1065
For additional copies of this document or a copy of the accompanying technical report contact:
Bureau of Justice Assistance Clearinghouse Box 6000 Rockville, MD 20850 800-688-4252
*U.S. G.P.O.:1993-301-177:80022 139
u.s. Department of Justice Office of Justice Programs Bureau of Justice Assistance
Washington, D.C 20531
Official Business Penalty for Private Use $300
BULK RATE POSTAGE & FEES PAID
DOl/BJA Pennit No. G-91
Related Documents