Crime in Delaware 2013 – 2017 Executive Brief September 2018 Prepared by the Statistical Analysis Center Delaware Criminal Justice Council In Conjunction with the State Bureau of Identification

Welcome message from author
This document is posted to help you gain knowledge. Please leave a comment to let me know what you think about it! Share it to your friends and learn new things together.
Transcript

Crime in Delaware 2013 – 2017
Executive Brief
September 2018
Prepared by the Statistical Analysis Center
Delaware Criminal Justice Council In Conjunction with the
State Bureau of Identification
Crime in Delaware 2013 – 2017 Executive Brief Page 1
Crime in Delaware: 2013 – 2017 Executive Brief
An Analysis of Serious Crime in Delaware
Spencer Price Director
Authors: Eric Rager & Jim Salt
This report is supported by the State Justice Statistics Grant Number 2014-BJ-CX-K028.
The points of view expressed in this document do not necessarily represent the official position of the United States Department of Justice.
State of Delaware Document number 100703-18-08-02
Please visit our website at http://cjc.delaware.gov/sac/publications/crime.shtml
Crime in Delaware 2013 – 2017 Executive Brief Page 2
Crime in Delaware 2013 – 2017 Executive Brief
This executive brief provides an overview of the findings presented in the full report, Crime in Delaware 2013 – 2017. Crime in Delaware is the official report of serious crime known to Delaware law enforcement agencies. This report covers data about serious crimes reported to state, county, and local police agencies for the years 2013 through 2017.
Crime in Delaware provides information for 24 Violent, Serious Property, Drug/Narcotic and Other Property and Social offenses reported in Delaware’s implementation of the National Incident-Based Reporting System (NIBRS) operated by the State Bureau of Identification of the Delaware State Police. Additional years of data are included in specific graphs to illustrate long term trends.
The full Crime in Delaware 2013 – 2017 report contains extensive data and is available on the Statistical Analysis Center’s website (http://cjc.delaware.gov/sac/publications/crime.shtml).
Crime in Delaware 2013 – 2017 Executive Brief Page 3
Key Findings/Trends The full Crime in Delaware 2013 – 2017 report contains extensive data and statistics on serious offenses, clearances, adult and juvenile arrests, and crimes against law enforcement officers. The report includes a summary of this data at the state and county levels, followed by a detailed breakdown based on five major topic areas: 1) Violent Offenses, 2) Serious Property Offenses, 3) Drug/Narcotic Offenses, 4) Other Property and Social Offenses, and 5) crimes against law enforcement officers. The data for each topic area are organized by state and county. Below are key findings from this extensive set of Delaware crime data.
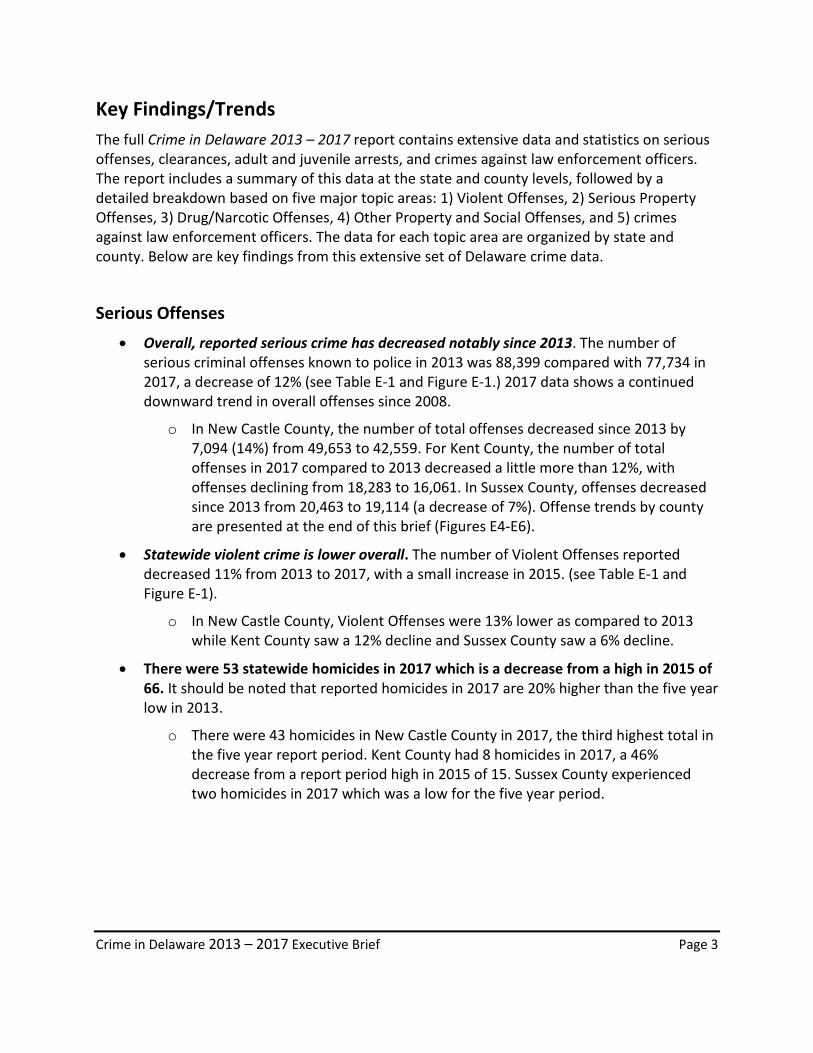
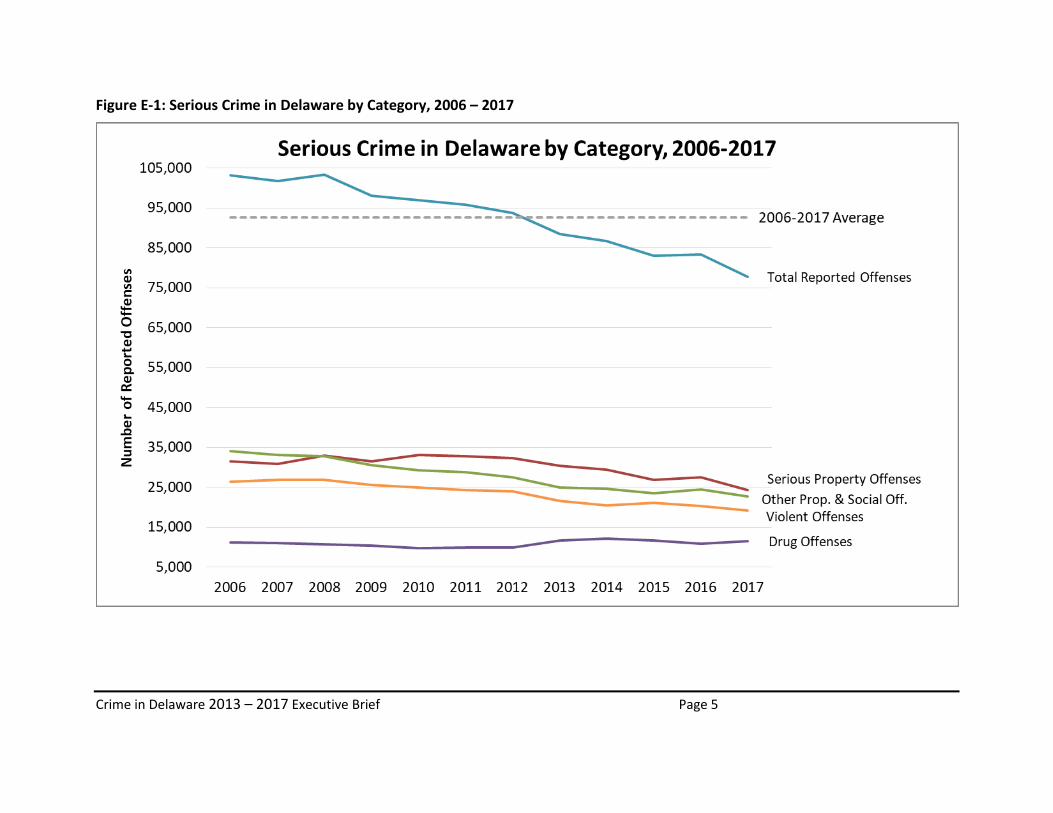
Serious Offenses • Overall, reported serious crime has decreased notably since 2013. The number of
serious criminal offenses known to police in 2013 was 88,399 compared with 77,734 in 2017, a decrease of 12% (see Table E-1 and Figure E-1.) 2017 data shows a continued downward trend in overall offenses since 2008.
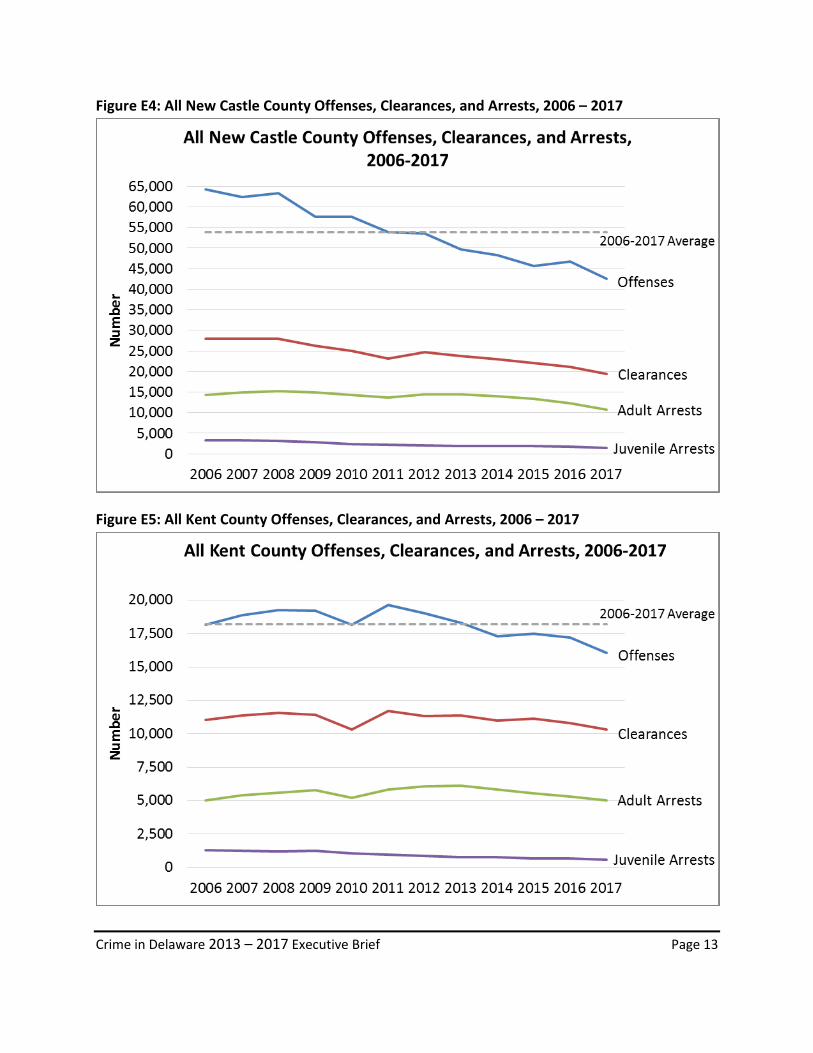
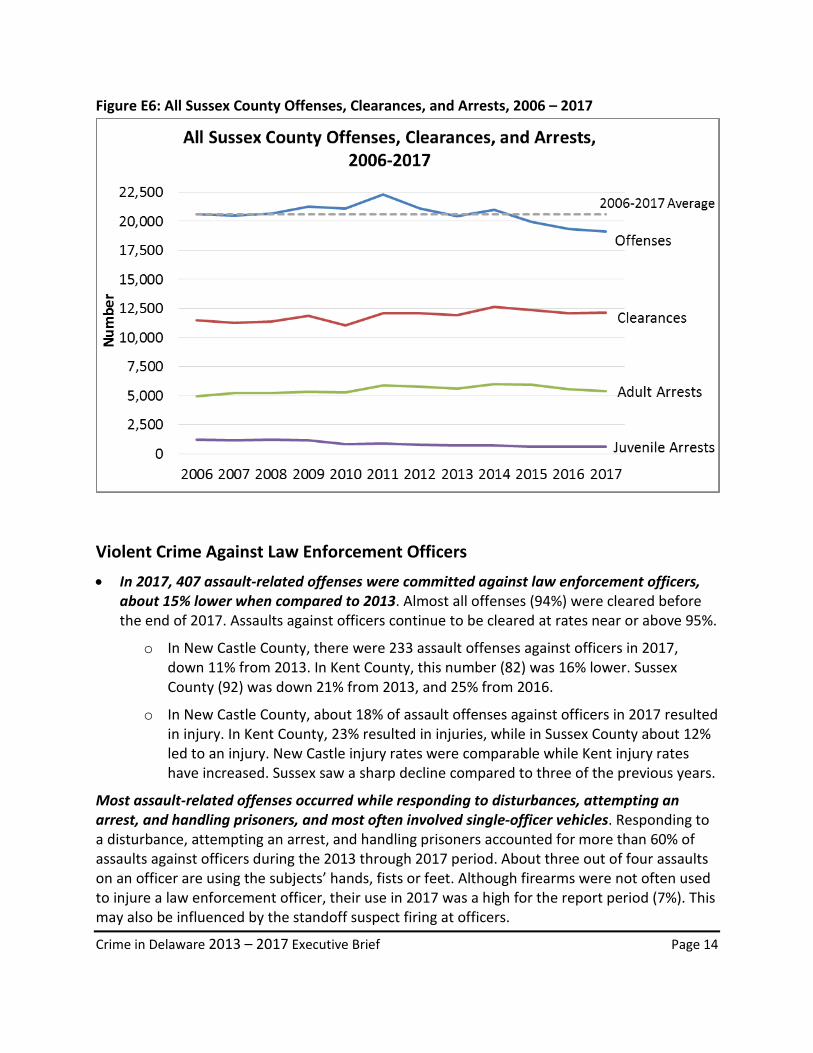
o In New Castle County, the number of total offenses decreased since 2013 by 7,094 (14%) from 49,653 to 42,559. For Kent County, the number of total offenses in 2017 compared to 2013 decreased a little more than 12%, with offenses declining from 18,283 to 16,061. In Sussex County, offenses decreased since 2013 from 20,463 to 19,114 (a decrease of 7%). Offense trends by county are presented at the end of this brief (Figures E4-E6).
• Statewide violent crime is lower overall. The number of Violent Offenses reported decreased 11% from 2013 to 2017, with a small increase in 2015. (see Table E-1 and Figure E-1).
o In New Castle County, Violent Offenses were 13% lower as compared to 2013 while Kent County saw a 12% decline and Sussex County saw a 6% decline.
• There were 53 statewide homicides in 2017 which is a decrease from a high in 2015 of 66. It should be noted that reported homicides in 2017 are 20% higher than the five year low in 2013.
o There were 43 homicides in New Castle County in 2017, the third highest total in the five year report period. Kent County had 8 homicides in 2017, a 46% decrease from a report period high in 2015 of 15. Sussex County experienced two homicides in 2017 which was a low for the five year period.

Crime in Delaware 2013 – 2017 Executive Brief Page 4
Table E-1: Delaware Statewide Serious Crime Summary, 2013 – 2017
Serious Offenses Reported 2013 – 2017
2013 2014 2015 2016 2017
Violent Offenses 21,551 20,484 21,101 20,343 19,115
Serious Property Offenses 30,329 29,413 26,834 27,565 24,298
Drug Offenses 11,608 12,113 11,613 10,920 11,545
Other Property, Social Offenses 24,911 24,600 23,354 24,514 22,776
Total Offenses Reported 88,399 86,610 83,082 83,342 77,734
Percentage Difference in Serious Offenses Reported
13 - 14 14 – 15 15 – 16 16 - 17 13 – 17 Average 13-16 - 17
Violent Offenses -4.95% 3.01% -3.59% -6.04% -11.30% -8.41%
Serious Property Offenses -3.02% -8.77% 2.72% -11.85% -19.89% -14.85%
Drug Offenses 4.35% -4.13% -5.97% 5.72% -0.54% -0.16%
Other Property, Social Offenses -1.25% -4.33% 4.16% -7.09% -8.57% -6.62%
Total Offenses Reported -2.02% -4.07% 0.31% -6.73% -12.06% -8.93%
Crime in Delaware 2013 – 2017 Executive Brief Page 5
Figure E-1: Serious Crime in Delaware by Category, 2006 – 2017

Crime in Delaware 2013 – 2017 Executive Brief Page 6
• Serious property crime is lower. The number of reported Serious Property Offenses decreased 20% from 2013 to 2017. This category of offenses has been on an overall decline during the five year report period but did show a small increase (3%) from 2015 to 2016. Burglary offenses statewide decreased 39%. Larceny offenses have been decreasing overall with a small increase in 2016. (See Table E-1 and Figure E-1)
o In New Castle County, the number of Serious Property Offenses in 2017 was 18% lower compared to 2013. Kent county saw a 22% decrease while Sussex county saw a 23% decrease during this period.
In New Castle County, Burglary has decreased 36% from 2013. Aside from a spike in 2016, Larceny has decreased 15% since 2013.
For Kent County, Burglary has decreased 37% since 2013 which mirrors the overall state trend. Larceny and Motor Vehicle Theft have both decreased roughly 20% over the same period (20% and 21% respectively).
In Sussex County, Burglary has dropped 45% since 2013, which is the largest percentage decrease of the three counties. Larceny has decreased 13% while Motor Vehicle Theft decreased 25%.
• Overall Drug/Narcotic Offenses were equivalent to 2013. Drug/Narcotic possession offenses have increased 19% over this period, while Drug Equipment offenses decreased 27%. Drug offenses are overall flat with 2013 totals. (See Table E-1 and Figure E-1)
o In New Castle County, overall Drug Offenses have decreased 17% since 2013 but increased very slightly from 2016 to 2017. Possession offenses increased 2% since 2013, but were overshadowed by a 52% decrease in Drug Equipment offenses.
o Kent County has seen a 5% increase since 2013, mainly attributed to a 26% increase in possession offenses, although equipment offenses were down 18%.
o Sussex County overall Drug Offenses increased 31% from 2013. Possession offenses are up substantially (59%) from 2013. Drug equipment offenses are also up 2%, unlike New Castle and Kent counties that saw substantial decreases.
Note: In December 2015, Delaware passed legislation that decriminalized certain marijuana possession offenses. Depending on various circumstances, these offenses are civil offenses. Due to the Federal Government still recording these offenses as criminal, they are part of the Drug Offense totals in this report.

Crime in Delaware 2013 – 2017 Executive Brief Page 7
• Fewer Other Property and Social Offenses were reported from 2013 to 2017. From 2013 to 2017, there was a 9% decrease in these offenses (see Table E-1 and Figure E-1). Weapon law violations saw a 10% decrease. Stolen Property offenses increased 5%.
o Between 2013 and 2017, both New Castle and Kent counties experienced decreases in Other Property and Social Offenses of at least 9%. The number of these offenses in Sussex County showed a smaller decline during this period.
• The trends for firearm-related offenses from 2013 to 2017 were mixed. Weapons Law Violations (2,129 in 2017) were 10% lower compared to 2013 totals. Robberies with a Firearm (583 offenses in 2016) decreased 14% from 2013 with a 24% decline from 2016 totals. Assaults with a Firearm (1,016 in 2017) have increased every year with the exception of a 13% decrease from 2016 to 2017.
o In New Castle County, offenses of Robbery with a Firearm are down 8% since 2013, but have decreased notably from 2015. Offenses of Assault with a Firearm have increased 37% since 2013, with a decrease in 2017. Weapons Law Violations are down from 2013.
o In Kent County, Robbery with a Firearm has shown a 46% increase from 2013, but has experienced large swings from year to year. Offenses of Assault with a Firearm are essentially even with 2013, but the overall trend has been mixed. Weapons Law Violations have decreased almost 9% from 2013.
o In Sussex County, offenses of Robbery with a Firearm are flat compared with 2013 totals. Offenses of Assault with a Firearm have decreased 15% since 2013. The number of Weapons Law Violations has decreased 8%.
• The crime rate is lower. The Statewide Crime Rate moved from 95.5 offenses per 1,000 persons in 2013 to 80.3 in 2017, a difference of around 16%. This change in the Crime Rate reflects a 12% decrease in the number of offenses and a 5% increase in Delaware’s population.

Crime in Delaware 2013 – 2017 Executive Brief Page 8
Figure E-2: Most Common Serious Crimes in Delaware, 2006 – 2017
Crime in Delaware 2013 – 2017 Executive Brief Page 9
Clearances For crime reporting and analysis purposes, an offense is considered cleared when a suspect is either arrested and subsequently referred for prosecution or cannot be arrested, but is otherwise clearly identifiable.
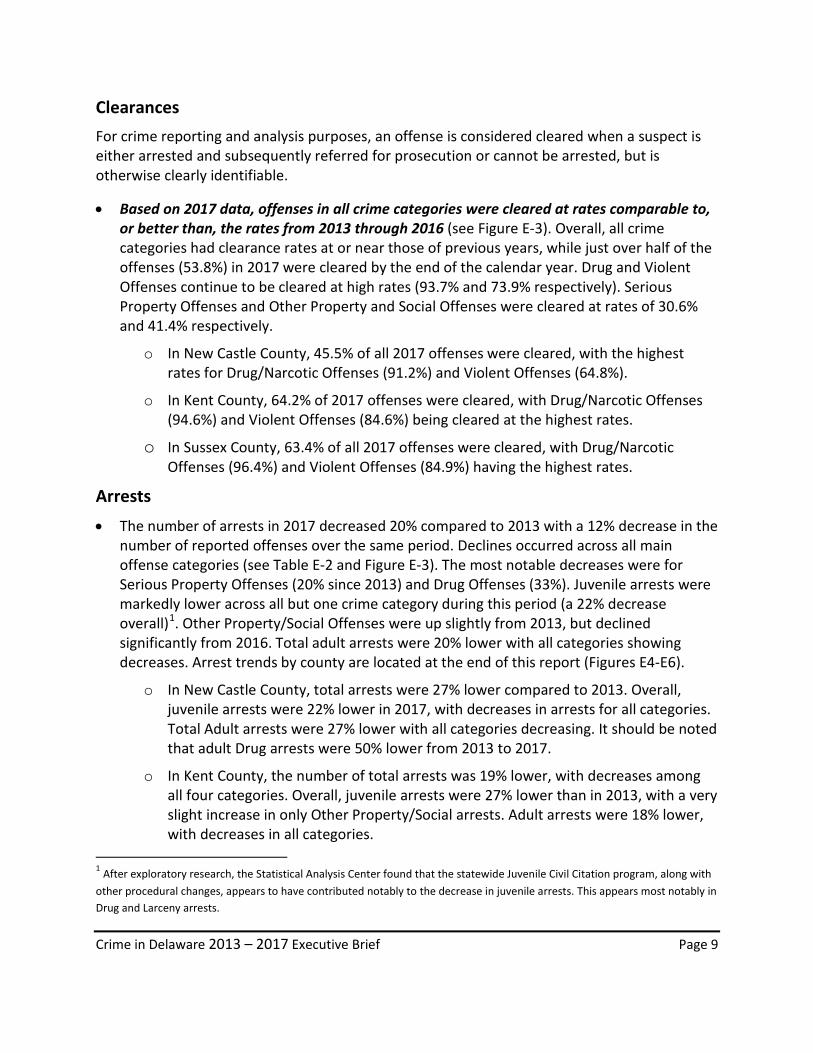
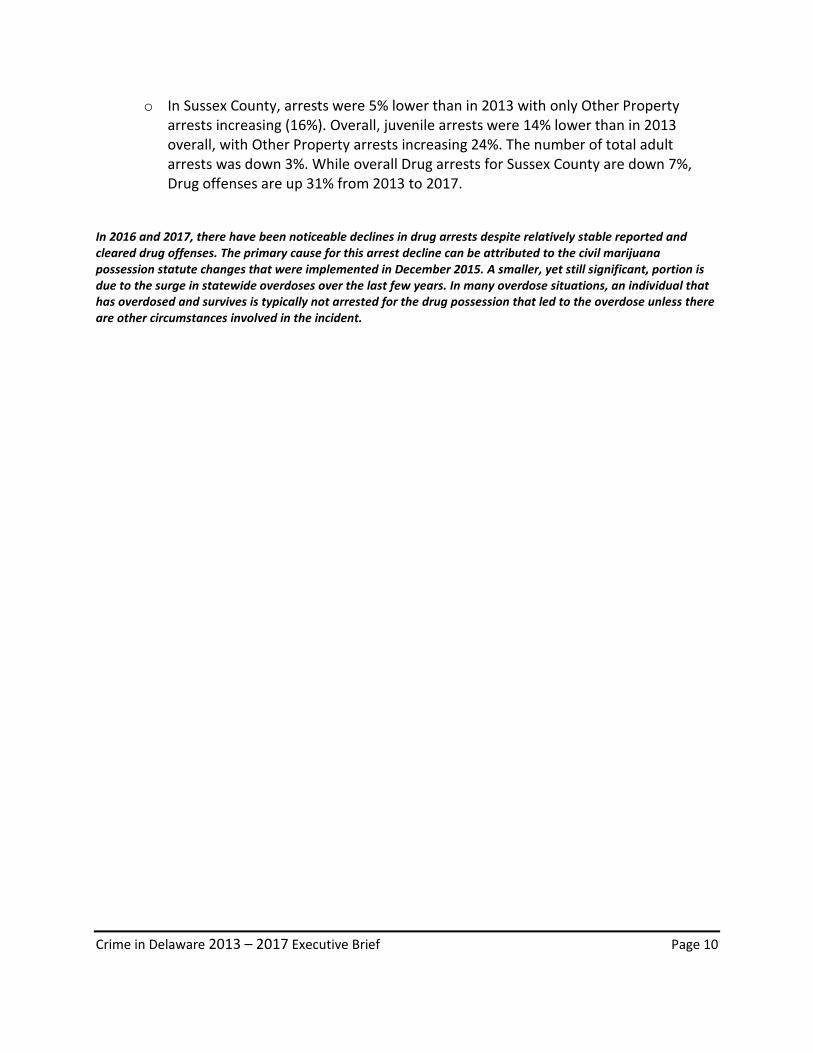
• Based on 2017 data, offenses in all crime categories were cleared at rates comparable to, or better than, the rates from 2013 through 2016 (see Figure E-3). Overall, all crime categories had clearance rates at or near those of previous years, while just over half of the offenses (53.8%) in 2017 were cleared by the end of the calendar year. Drug and Violent Offenses continue to be cleared at high rates (93.7% and 73.9% respectively). Serious Property Offenses and Other Property and Social Offenses were cleared at rates of 30.6% and 41.4% respectively.
o In New Castle County, 45.5% of all 2017 offenses were cleared, with the highest rates for Drug/Narcotic Offenses (91.2%) and Violent Offenses (64.8%).
o In Kent County, 64.2% of 2017 offenses were cleared, with Drug/Narcotic Offenses (94.6%) and Violent Offenses (84.6%) being cleared at the highest rates.
o In Sussex County, 63.4% of all 2017 offenses were cleared, with Drug/Narcotic Offenses (96.4%) and Violent Offenses (84.9%) having the highest rates.
Arrests • The number of arrests in 2017 decreased 20% compared to 2013 with a 12% decrease in the
number of reported offenses over the same period. Declines occurred across all main offense categories (see Table E-2 and Figure E-3). The most notable decreases were for Serious Property Offenses (20% since 2013) and Drug Offenses (33%). Juvenile arrests were markedly lower across all but one crime category during this period (a 22% decrease overall)1. Other Property/Social Offenses were up slightly from 2013, but declined significantly from 2016. Total adult arrests were 20% lower with all categories showing decreases. Arrest trends by county are located at the end of this report (Figures E4-E6).
o In New Castle County, total arrests were 27% lower compared to 2013. Overall, juvenile arrests were 22% lower in 2017, with decreases in arrests for all categories. Total Adult arrests were 27% lower with all categories decreasing. It should be noted that adult Drug arrests were 50% lower from 2013 to 2017.
o In Kent County, the number of total arrests was 19% lower, with decreases among all four categories. Overall, juvenile arrests were 27% lower than in 2013, with a very slight increase in only Other Property/Social arrests. Adult arrests were 18% lower, with decreases in all categories.
1 After exploratory research, the Statistical Analysis Center found that the statewide Juvenile Civil Citation program, along with other procedural changes, appears to have contributed notably to the decrease in juvenile arrests. This appears most notably in Drug and Larceny arrests.
Crime in Delaware 2013 – 2017 Executive Brief Page 10
o In Sussex County, arrests were 5% lower than in 2013 with only Other Property arrests increasing (16%). Overall, juvenile arrests were 14% lower than in 2013 overall, with Other Property arrests increasing 24%. The number of total adult arrests was down 3%. While overall Drug arrests for Sussex County are down 7%, Drug offenses are up 31% from 2013 to 2017.
In 2016 and 2017, there have been noticeable declines in drug arrests despite relatively stable reported and cleared drug offenses. The primary cause for this arrest decline can be attributed to the civil marijuana possession statute changes that were implemented in December 2015. A smaller, yet still significant, portion is due to the surge in statewide overdoses over the last few years. In many overdose situations, an individual that has overdosed and survives is typically not arrested for the drug possession that led to the overdose unless there are other circumstances involved in the incident.

Crime in Delaware 2013 – 2017 Executive Brief Page 11
Table E-2: Statewide Arrests for Serious Offenses, 2013 – 2017 Statewide Arrests for Serious Offenses
2013 2014 2015 2016 2017
Total Arrests 29,584 29,219 27,994 26,039 23,739
Violent Offenses 10,171 9,526 9,508 9,313 8,591
Serious Property Offenses 7,717 8,149 7,442 7,218 6,201
Drug Offenses 7,378 7,413 7,016 5,300 4,928
Other Property and Social Offenses 4,318 4,131 4,028 4,208 4,019
Total Adult Arrests 26,235 25,811 24,792 23,031 21,103
Violent Offenses 8,663 8,010 8,030 7,910 7,356
Serious Property Offenses 6,780 7,183 6,602 6,487 5,530
Drug Offenses 6,845 6,892 6,587 4,937 4,577
Other Property and Social Offenses 3,947 3,726 3,573 3,697 3,640
Total Juvenile Arrests 3,349 3,408 3,202 3,008 2,636
Violent Offenses 1,508 1,516 1,478 1,403 1,235
Serious Property Offenses 937 966 840 731 671
Drug Offenses 533 521 429 363 351
Other Property and Social Offenses 371 405 455 511 379
Crime in Delaware 2013 – 2017 Executive Brief Page 12
Figure E-3: All Delaware Offenses, Clearances, and Arrests, 2006 – 2017
Crime in Delaware 2013 – 2017 Executive Brief Page 13
Figure E4: All New Castle County Offenses, Clearances, and Arrests, 2006 – 2017
Figure E5: All Kent County Offenses, Clearances, and Arrests, 2006 – 2017
Crime in Delaware 2013 – 2017 Executive Brief Page 14
Figure E6: All Sussex County Offenses, Clearances, and Arrests, 2006 – 2017
Violent Crime Against Law Enforcement Officers • In 2017, 407 assault-related offenses were committed against law enforcement officers,
about 15% lower when compared to 2013. Almost all offenses (94%) were cleared before the end of 2017. Assaults against officers continue to be cleared at rates near or above 95%.
o In New Castle County, there were 233 assault offenses against officers in 2017, down 11% from 2013. In Kent County, this number (82) was 16% lower. Sussex County (92) was down 21% from 2013, and 25% from 2016.
o In New Castle County, about 18% of assault offenses against officers in 2017 resulted in injury. In Kent County, 23% resulted in injuries, while in Sussex County about 12% led to an injury. New Castle injury rates were comparable while Kent injury rates have increased. Sussex saw a sharp decline compared to three of the previous years.
Most assault-related offenses occurred while responding to disturbances, attempting an arrest, and handling prisoners, and most often involved single-officer vehicles. Responding to a disturbance, attempting an arrest, and handling prisoners accounted for more than 60% of assaults against officers during the 2013 through 2017 period. About three out of four assaults on an officer are using the subjects’ hands, fists or feet. Although firearms were not often used to injure a law enforcement officer, their use in 2017 was a high for the report period (7%). This may also be influenced by the standoff suspect firing at officers.

Crime in Delaware 2013 – 2017 Executive Brief Page 15
Two officers were killed in 2017 and about 17% of assault-related offenses resulted in injuries. Overall, two officers were killed in the line of duty during the 2013 through 2017 period. The percentage of assault-related offenses in 2017 that resulted in injury is comparable to the past four years. There were a record 24 attempted homicides of officers. This is mainly attributed (18 offenses) to the shooting death of an officer and subsequent stand-off where the subject fired upon multiple responding officers. Excluding that specific event, attempted homicides of officers were still up significantly from previous years.
Table E-3: Violent Offenses Committed Against Delaware Law Enforcement Officers, 2013–17
Violent Offenses Against Delaware Law Enforcement Officers 2013 – 2017
2013 2014 2015 2016 2017
Officers Assaulted 478 387 386 414 407 Officers Killed 0 0 0 0 2 Attempted Homicides on Officers 1 2 0 1 24
Assaults Resulting in Officer Injury 17.2% 14.7% 17.9% 18.8% 17.4% Assault-related Offenses Cleared 94.8% 97.2% 96.1% 97.1% 93.6%
Related Documents