Crime, Cost, and Consequences: Is It Time to Get Smart on Crime?

Welcome message from author
This document is posted to help you gain knowledge. Please leave a comment to let me know what you think about it! Share it to your friends and learn new things together.
Transcript
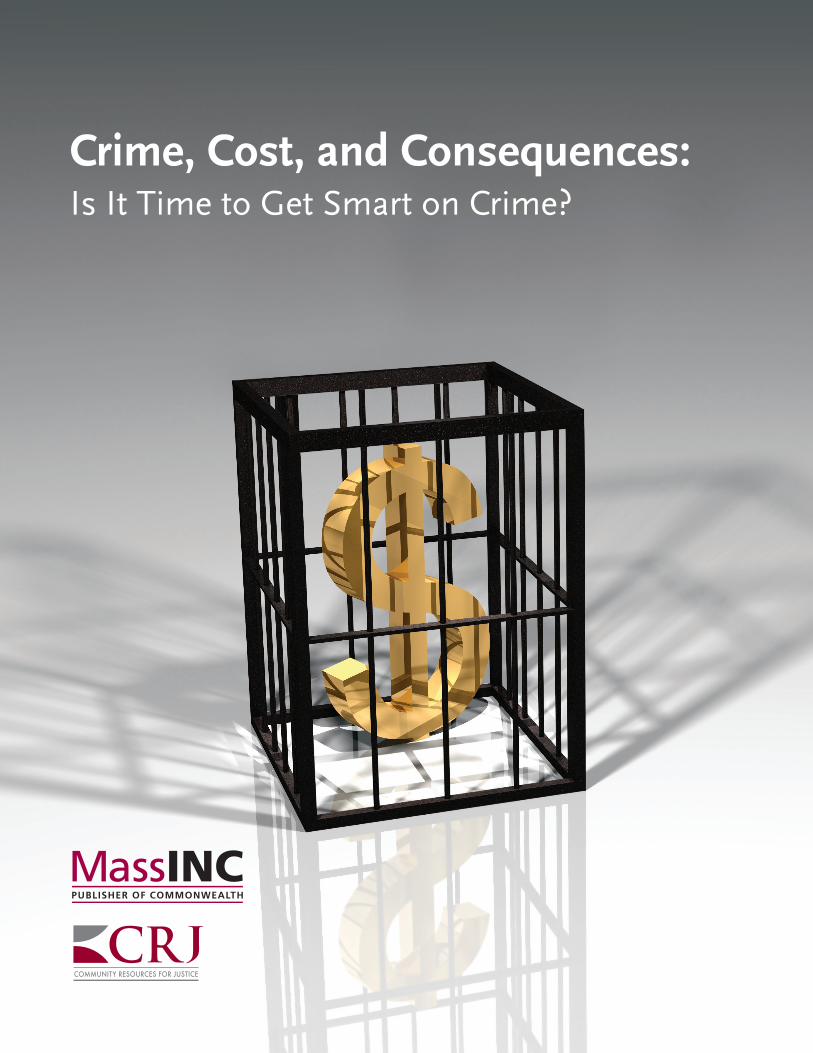
Crime, Cost, and Consequences:Is It Time to Get Smart on Crime?
ABOUT MASSINC
Massachusetts Institute for a New Commonwealth (MassINC) is a non-partisan think tank and civic
organization focused on putting the American Dream within the reach of everyone in Massachusetts.
MassINC uses three distinct tools — research, journalism, and civic engagement — to fulfill its mission,
each characterized by accurate data, careful analysis, and unbiased conclusions. MassINC sees its role not
as an advocacy organization, but as a new kind of think tank, rigorously non-partisan, whose outcomes
are measured by the influence of its products in helping to guide advocates and civic and policy leaders
toward decisions consistent with MassINC’s mission, and in helping to engage citizens in understanding
and seeking to influence policies that affect their lives.
ABOUT COMMUNITY RESOURCES FOR JUSTICE
For more than 130 years, Community Resources for Justice has been improving public safety while
helping some our society’s most challenged individuals develop their full potential. We help men and
women released from incarceration to successfully re-enter mainstream society; we steer at-risk youth
away from crime and toward productive lives; we offer adults with developmental disabilities the chance
to flourish while living in the community. Our national-scale research and consulting practice accelerates
system-level changes in corrections policy by using evidence-based practices. Working with our partners,
we strengthen individuals, families, and communities. More information available at www.crj.org.
ABOUT THE MASSACHUSETTS CRIMINAL JUSTICE REFORM COALITION
The Massachusetts Criminal Justice Reform Coalition, formed in 2012, is a diverse group of prosecutors
and corrections practitioners, defense lawyers, community organizers, and businessmen and women who
find common ground in the need for corrections reform in Massachusetts. The Coalition co-chairs are:
Wayne Budd, former US Attorney; Kevin Burke, former Secretary of Public Safety; and Max Stern,
President of the Massachusetts Association of Criminal Defense Lawyers. The Coalition’s purpose is to
work with lawmakers to make major changes in the criminal justice system in Massachusetts, including:
• Placing a moratorium on new prison construction
• Reestablishing and empowering the state’s Sentencing Commission
• Building a statewide reentry initiative modeled after Boston’s Emergency Reentry program
• Redirecting resources from the most costly settings to pre-release and drug programming
• Developing clear lines of responsibility for post-release supervision
ACKNOWLEDGMENTS
MassINC would like to acknowledge the Shaw Foundation, the Public Welfare Foundation, the Boston
Foundation, and individual donors for providing generous financial support to the Massachusetts
Criminal Justice Reform Coalition. We also express our gratitude to Coalition members and others inside
and outside of state government, who devoted a considerable amount of their time to review drafts of this
report and provide us with insightful comments.
Crime, Cost, and Consequences:Is It Time to Get Smart on Crime?
Benjamin Forman
ResearchDirector,MassINC
John Larivee
CEO,CommunityResourcesforJustice
March 2013

2 THE MASSACHUSETTS INSTITUTE FOR A NEW COMMONWEALTH
March 2013
Dear Friends,
The Massachusetts Criminal Justice Reform Coalition is proud to present Crime, Cost, and Consequences:
Is It Time to Get Smart on Crime? This report provides the foundation for the Coalition’s effort to fuse
research, public education, and civic discourse into a multi-year campaign to make the Commonwealth a
leader in the field of corrections.
Our Coalition is made up of experts with diverse backgrounds and perspectives. We are prosecutors and
corrections practitioners, defense lawyers and community organizers, and businessmen and women
drawn together by a sense of urgency about reforming the criminal justice system in Massachusetts —
a system that costs taxpayers $1.2 billion a year and lags behind the country in implementing reforms
proven to reduce costs and improve public safety.
In this first report, the Coalition seeks to provide the public with information on the real costs of
our current approach to criminal justice. As crime rates continue to drop nationally and here in
Massachusetts, the state’s prison population spirals ever higher because of outdated “tough on crime”
policies that have more political than practical value.
In this difficult fiscal environment, corrections budgets are unnecessarily crowding out other state spend-
ing, including funding for public health, higher education, and local aid. Without a change of course, the
Executive Office of Administration and Finance estimates that at least $1 billion will be needed for new
facilities, with operating costs growing by $120 million annually.
This new report looks to models developed elsewhere, including in many “red states” that have stopped
prison construction, reduced mandatory sentences, and invested in evidence-based programs to cut cost
and increase public safety. Instead of spending more on what doesn’t work, states like Arkansas, Georgia,
South Carolina, and Texas are spending less on what does.
As the report points out, these are instructive examples for Massachusetts. We hope this research sparks
a serious discussion on how to bring the Commonwealth into line with innovative reform efforts around
the country, and in doing so, lower costs and increase public safety.
Sincerely,
Massachusetts Criminal Justice Coalition Co-Chairs
Wayne A. Budd Kevin Burke Max D. Stern
Former US Attorney Former Secretary of Partner
Senior Counsel Public Safety and Security Stern Shapiro Weissberg & Garin LLP
Goodwin Procter LLP Visiting Professor President
Endicott College Massachusetts Association of
Criminal Defense Lawyers
CRIME, COST, AND CONSEQUENCES 3
Crime, Cost, and Consequences:Is it Time to Get Smart on Crime?
TABLE OF CONTENTS
Executive Summary . . . . . . . . . . . . . . . . . . . . . . . . . . . . . . . . . . . . . . . . . . . . 5
Introduction . . . . . . . . . . . . . . . . . . . . . . . . . . . . . . . . . . . . . . . . . . . . . . . . 8
I. The Price Tag For Massachusetts’s “Tough On Crime” Corrections Era . . . . . . . . . . . . . 12
The Direct Costs. . . . . . . . . . . . . . . . . . . . . . . . . . . . . . . . . . . . . . . . . 12
The Opportunity Costs . . . . . . . . . . . . . . . . . . . . . . . . . . . . . . . . . . . . . 18
The Collateral Costs . . . . . . . . . . . . . . . . . . . . . . . . . . . . . . . . . . . . . . . 19
II. Massachusetts In An Era Of Justice Reinvestment . . . . . . . . . . . . . . . . . . . . . . . . 22
Justice Reinvestment Nationally . . . . . . . . . . . . . . . . . . . . . . . . . . . . . . . . 22
Reinventing Justice In Massachusetts . . . . . . . . . . . . . . . . . . . . . . . . . . . . . 22
III. Reinventing Justice In Massachusetts To Reduce Cost And Enhance Public Safety . . . . . . 27
Appendix . . . . . . . . . . . . . . . . . . . . . . . . . . . . . . . . . . . . . . . . . . . . . . . . 31

4 THE MASSACHUSETTS INSTITUTE FOR A NEW COMMONWEALTH
CRIME, COST, AND CONSEQUENCES 5
EXECUTIVE SUMMARYMassachusetts boasts an impressive track record
as a progressive laboratory of democracy. In major
spheres of public policy, including clean energy,
education, and healthcare, the Commonwealth
continues to break new ground and provide
national leadership. Unfortunately, with criminal
justice, an issue that cuts to the core of our social
fabric, Massachusetts has passed the baton.
Since the early 1980s, the percentage of the
population confined in the state’s prisons and jails
has tripled. This stunning growth is the result of
criminal justice policies adopted in the late 1980s
and early 1990s. Due to these laws and practices,
those who commit a felony today are more likely
to face imprisonment and they will spend more
time behind bars compared with offenders in the
past. Massachusetts was not alone in pursuing this
“tough on crime” approach. However, as a grow-
ing body of research began to reveal the high cost
and poor outcomes associated with it, many states
replaced this outmoded model with a set of more
objective, data-driven corrections policies; in stark
contrast, Massachusetts has resisted change.
Crime, Cost, and Consequences: Is It Time to
Get Smart on Crime? is a call to action. The report
advances the reform dialogue by: highlighting the
direct and indirect costs of Massachusetts’s current
approach to corrections; presenting innovations
from other states that can reduce these costs and
improve public safety; and outlining recommenda-
tions that will position our corrections system to
achieve similar outcomes in the Commonwealth.
Major findings are summarized below:
1. When weighing the public safety gains against
the direct cost to the taxpayer, Massachusetts’s
current policies appear to carry a hefty price tag.
Lack of data and limited transparency make it dif-
ficult to perform true cost-benefit analysis. Never-
theless, a review of trends reveals four inefficient
cost drivers:
• The cost of incarcerating offenders for longer
periods. Massachusetts spends an estimated
$150 million annually to keep inmates confined
for longer stays than those committing similar
offenses in 1990. Because actual data are not
available to track changes in average time served,
this estimate assumes Massachusetts is near the
national average of a one-third increase since
1990. Studies demonstrate that keeping many
types of nonviolent offenders in prison longer
provides little to no public safety benefit.
• The cost of keeping more drug offenders in state
prisons. Reducing the number of inmates serv-
ing time for drug offenses to 1985 levels would
save $90 million annually. Drug offenders
account for more than one-quarter of the growth
in the state prison population since 1990. This
stands out as a particularly inefficient product of
sentencing policy — 70 percent of DOC inmates
currently incarcerated for a drug offense were
sentenced under mandatory minimum statutes.
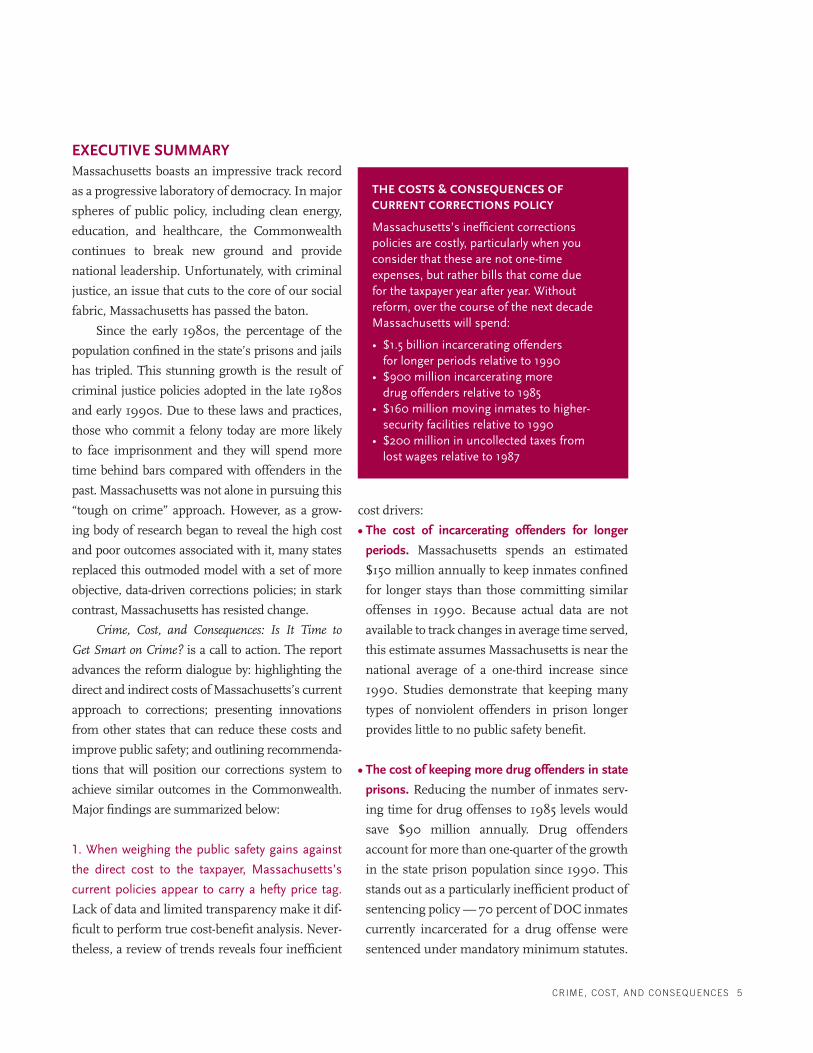
THE COSTS & CONSEQUENCES OF CURRENT CORRECTIONS POLICY
Massachusetts’s inefficient corrections policies are costly, particularly when you consider that these are not one-time expenses, but rather bills that come due for the taxpayer year after year. Without reform, over the course of the next decade Massachusetts will spend:
• $1.5 billion incarcerating offenders for longer periods relative to 1990
• $900 million incarcerating more drug offenders relative to 1985
• $160 million moving inmates to higher-security facilities relative to 1990
• $200 million in uncollected taxes from lost wages relative to 1987
6 THE MASSACHUSETTS INSTITUTE FOR A NEW COMMONWEALTH
Research suggests these policies are not cost-
effective since incarcerating drug offenders for
longer periods does little to deter the commis-
sion of these crimes and serving prison time
makes these inmates more likely to reoffend
upon release.
• The cost of confining more offenders in higher-
security settings. The shift to higher-security set-
tings relative to the 1990 classification structure
costs the state approximately $16 million annu-
ally. Moving an inmate up a security level costs
about $10,000 annually. In 1990, less than 8
percent of DOC inmates were confined in maxi-
mum-security facilities; these prisons held more
than 18 percent of DOC inmates in 2012. In
absolute terms, the number of offenders serving
time in the most secure facilities grew by more
than 200 percent over the last two decades.
• The cost of elevated repeat offending resulting
from unsupervised release and inadequate reen-
try programming. If Massachusetts could reduce
the number of recidivists by just 5 percent, it
would generate up to $150 million in annual sav-
ings. New data following the 2005 release cohort
show that about 60 percent of inmates exiting
state facilities and a similar fraction of those
leaving county facilities are convicted on new
charges within six years of release. In FY 2011,
nearly two-thirds of drug offenders and almost
60 percent of non-drug offenders received sen-
tences where the minimum and maximum
were very similar. This sentence structure limits
parole eligibility, reducing the incentive offend-
ers have to take steps to self-rehabilitate while
in prison. It also means more offenders return
to the community without supervision. In 2011,
nearly half of inmates released to the street from
DOC facilities received no supervision.
2. “Tough on crime” policies are increasingly
linked to both opportunity costs and collateral
costs. Fully accounting for these indirect costs
provides additional evidence that these policies
are not cost-effective.
• In this challenging fiscal environment, every
additional dollar spent on corrections is offset
by cuts to other state agencies. This reduces
the availability of services that have a preventa-
tive effect on crime. For example, a decade ago,
state support for higher education surpassed
spending on corrections by 24 percent. Today,
the budget for prisons, probation, and parole is
6 percent greater than the state higher education
budget.
• Incarceration has a lasting impact on the eco-
nomic potential of ex-offenders with real impli-
cations for their families. On average, former
inmates earn 40 percent less annually than they
would have had they not been sent to prison.
Based on this national estimate, formerly incar-
cerated workers in Massachusetts lose approxi-
mately $760 million in wages annually. For the
state, this amounts to as much as $20 million a
year in reduced tax collections relative to 1987
incarceration rates.
• Incarceration also has important implications for
the communities that disproportionately bear
the burden of sending and receiving offenders.
Just 10 Massachusetts cities, representing only
one-quarter of the state’s population, suffered
from more than half of all violent crime commit-
ted in the Commonwealth in 2010. Homicides,
which cause the most social upheaval, were even
more highly concentrated, with more than two-
thirds of all murders in the state occurring in
these 10 communities. Similarly, 10 communities
received half of all DOC inmates released to the
street in 2011.
CRIME, COST, AND CONSEQUENCES 7
3. A significant number of states, including many
with politically conservative leadership, have rec-
ognized that they cannot build their way to public
safety with more prisons. These states have aggres-
sively reduced prison terms and reprogrammed
resources toward less costly, evidence-based alter-
natives to incarceration, pushing down prison
populations and crime rates simultaneously. The
approach these states have taken is rooted in hard
data and careful cost-benefit analysis. While Massa-
chusetts has flirted with this model, the Legislature
has not created the structures in statute to move the
bureaucracy solidly in this reform direction.
The development of this policy framework,
known as Justice Reinvestment, has received inten-
sive support from the Pew Center for the States and
the Council of State Governments. These indepen-
dent intermediaries have brought real resources to
support reform efforts in more than a dozen states.
The US Bureau of Justice Assistance has also rede-
fined the federal role. Instead of providing grants
to states that build more prisons, the agency now
provides resources to states that move toward Jus-
tice Reinvestment.
Massachusetts has repeatedly pursued these
reforms. The Romney administration formed two
commissions that made progress but ultimately
proved to be unable to achieve deep systemic
change. In 2011, the Legislature assembled the
Special Commission to Study the Criminal Justice
System, and the Patrick administration has courted
the Pew Center on the States. But support for Justice
Reinvestment in Massachusetts remains lukewarm,
as evidenced by the passage of legislation commonly
referred to as the Three Strikes Bill in August 2012.
This law requires a life sentence without the possi-
bility of parole for habitual offenders who have two
previous convictions with felony sentences result-
ing in imprisonment for over three years. While the
Three Strikes law also includes a number of reform
provisions, it excludes the push for rigorous assess-
ment and cost-benefit analysis that have grounded
successful reform legislation in other states.
4. If Massachusetts continues on the current course,
the analysis contained in this report suggests the
state will spend more than $2 billion over the next
decade on corrections policies that produce lim-
ited public safety benefit. To prevent the inefficient
allocation of future resources, the Massachusetts
Criminal Justice Reform Coalition offers eight rec-
ommendations. Implementing these reforms will
put the Commonwealth on the path toward a data-
driven approach that protects public safety, holds
offenders accountable, and controls correctional
costs. 1. Place a moratorium on the expansion of
state and county prisons;
2. Empower the Sentencing Commission to revisit the state’s approach to sentencing and sanctions;
3. Clearly delineate responsibility for all post-release supervision to the Parole Board and pretrial and diversion to the Probation Department;
4. Expand the use of community supervision and pre-release;
5. Make Boston’s Emergency Reentry Pro gram a model for urban centers across the state;
6. Complete an extensive survey of condi-tions of confinement, programming, and pro gram quality across the system;
7. Standardize data systems and reporting protocols, and funnel information to a cen-tral research center;
8. Understand how the state’s corrections system can be oriented toward Justice Reinvest ment and develop a strategy to build a cul ture of data-driven decision-making with the agencies.
8 THE MASSACHUSETTS INSTITUTE FOR A NEW COMMONWEALTH
INTRODUCTIONSince the early 1980s, the percentage of the Mas-
sachusetts population confined in the state’s pris-
ons and jails has tripled. This sobering reality is
largely the result of criminal justice policy. Those
who commit a felony today are more likely to face
imprisonment and they will spend more time
behind bars compared with offenders in the past.1
The shift toward greater use of confinement
is not unique to Massachusetts. In the 1980s and
1990s, states around the country entered a “tough
on crime” era in which legislatures replaced judi-
cial discretion across a wide range of offenses with
mandatory minimum sentencing statutes. On one
level, these laws performed as designed, putting
offenders in prison and keeping them there longer.
Since 1990, violent crime has fallen by 45
percent nationally and by 37 percent in Massachu-
setts.2 Many leaders credit the prison boom for
this unprecedented improvement in public safety.
While increased use of incarceration likely con-
tributed, research suggests higher rates of con-
finement account for no more than one-quarter of
the reduction in the national crime rate and per-
haps much less (see text box on Page 9).
Achieving the modest share of crime reduc-
tion that we can attribute to imprisonment has
been enormously costly. Between 1987 and 2007,
adjusted for inflation, state corrections budgets
grew by 127 percent.3 With state revenue stagnant
over this period, virtually every dollar that went
into prisons led to cuts in public support for other
vital state services, including a number of pro-
grams that have a known preventative effect on
criminality (e.g., law enforcement, mental health,
higher education, and job training).
With prison populations continuing on their
upward trajectory and budget pressures mount-
ing, states throughout the country have revisited
their tough on crime approach to corrections.
Many adopted a new model known as Justice Rein-
vestment. Pioneered by a handful of states in the
early 2000s (with support from the federal govern-
ment, major foundations, and other not-for-profit
partners), this approach involves collecting hard
data and performing careful cost-benefit analysis.
With this information in hand, legislatures have
aggressively reduced prison terms and repro-
grammed resources toward less costly, evidence-
based alternatives to incarceration. In short order,
these states have seen their prison populations fall
with crime rates declining simultaneously.
Massachusetts would have much to gain from
a successful transition to the Justice Reinvestment
model. The state’s prison population continues to
climb. Without a change of course, the Executive
Office of Administration and Finance estimates
that at least $1 billion will be needed to build new
facilities to ease the burden on already overcrowded
prisons; operating these new facilities would cost
$120 million annually.4 With real unmet needs in
other part of the state budget, particularly educa-
tion and infrastructure, covering these growing
prison costs would be excruciatingly difficult.
Massachusetts has flirted with the Justice
Reinvestment–style reforms that would allow us to
avoid these unnecessary costs, but we have proven
doggedly reluctant to embrace major change.
High-profile failures, from Willie Horton to Domi-
nic Cinelli, continue to politicize criminal justice
policy in the Commonwealth, making it difficult to
marshal the will to transform the state’s fractured
system of corrections. Commission after com-
mission recommends evidence-based reform, but
deep and systemic change remains elusive.
As catalogued in the pages that follow, the
legacy of two decades of tough on crime polices in
Massachusetts is overcrowded prisons, where too
few offenders who could benefit from treatment
achieving the modest share of crime reduction that we
can attribute to imprisonment has been enormously costly
CRIME, COST, AND CONSEQUENCES 9
and reentry services receive them. In contrast to an
early era when the system focused on successfully
integrating prisoners back into the community,
today nearly half of all inmates exiting prison are
simply released to the street with no supervision.
New data following the 2005 release cohort show
that about 60 percent of inmates exiting state facil-
ities and a similar fraction of those leaving county
facilities are convicted on new charges within six
years of release.5 The price for this high level of
recidivism is felt disproportionately by a handful
of mostly minority communities that receive ex-
offenders with few job prospects, and at high risk
to commit new crime and create new victims.
This report explores these collateral costs and
the performance of the state’s corrections system
more generally. Perhaps the most striking finding
is the lack of data to quantify outcomes and evalu-
ate the return that taxpayers receive on the very
sizeable investment they have made in the state’s
corrections agencies. Just as it obscures underper-
formance, the lack of data and transparency hides
the success that pioneering county sheriffs have
had with reentry models in their Houses of Cor-
rection; difficulty documenting results makes it
harder to exploit lessons from these models for
systems change.6
In spite of this lack of transparency, survey data
show that residents across the Commonwealth
recognize the problem and embrace reform. In
stark contrast to a 1997 MassINC public opinion
poll, which found that a majority of voters favored
DIMINISHING RETURNS
The relationship between incarceration and crime is complicated. The threat of incarceration deters some property crimes and tak-
ing serial criminals off the street keeps them from offending while they are incapacitated behind bars. But in any society, there are a
limited number of people who make it their business to steal and cause mayhem. As states increased the use of incarceration with
mandatory minimum sentences blind to the circumstances of an individual offender, they began to capture felons whose actions
were driven by youth, substance abuse and mental health conditions, or an unusual lapse of self-control. Incarcerating these offend-
ers in restrictive conditions that make it difficult for them to reenter society may actually breed greater criminality in the community.
If incarceration were the major driver in the unprecedented drop in crime in the US, the costs associated with greater use
of imprisonment would be easier to justify as a reasonable tradeoff for enhanced public safety. But rigorous research suggests
that higher incarceration rates explain only a fraction of the decline in crime. The University of Chicago Economist Steven Levitt
estimates that incarceration accounted for only about one-third of the decline in crime during the 1990s.8 And others believe the
prison boom’s contribution was even lower. The noted criminologist Franklin Zimring estimates the increased prison popula-
tion of the 1990s accounts for between 10 percent and 27 percent of the steep drop of crime over the decade. His book, The
GreatAmericanCrimeDecline, illustrates how Canada and the US experienced very similar reductions in crime during the 1990s.
But in sharp contrast to the US, Canada’s prison population remained relatively stable over the decade.9 Other international
comparisons show that most European countries also experienced dramatic reductions in crime without a corresponding
increase in their incarceration rates.10 Many have noted that these Western countries have homicide rates about five times lower
than the US, with incarceration rates that are seven to 10 times lower.11
If incarceration wasn’t a major driver, what does explain the steep reduction in crime in the US and Europe? The truth is,
so many factors combined to put downward pressure on crime rates it’s very difficult to sort it all out. Demographic change,
including the aging population and the increase in immigration (immigrants have been found to commit crimes at lower rates)
played a big role. Putting more police on the streets and hardening targets with closed circuit cameras, private security guards,
and anti-theft vehicle technology has also been a factor, particularly for property crime. Reductions of high blood lead levels
in children, the increased use of antidepressant and antipsychotic drugs, the legalization of abortion, and the improvement in
women’s economic status have all been associated with declines in violent crime.12
10 THE MASSACHUSETTS INSTITUTE FOR A NEW COMMONWEALTH
Over the past several decades, the role of prisons as a compo-
nent in the larger criminal justice system charged with protect-
ing the public has fluctuated dramatically. In the 1960s and
1970s, state corrections policy throughout the US was focused
on rehabilitation. During these years, judges mostly imposed
indeterminate sentences, which allowed corrections officials
to release inmates from facilities when they felt they were
ready for a safe return to society. In response to rising crime
in the 1980s and 1990s, states started to take the opposite
tack. Determinate sentences that required offenders to serve
a mandatory minimum period of time confined in a prison
proliferated. The nation entered a tough on crime era and the
US incarceration rate rose dramatically.13
Up until the 1980s, prisons in Massachusetts held a small
number of offenders, and corrections officials were intensely
focused on rehabilitating the few inmates in their custody. In
fact, Massachusetts was highly regarded for developing innova-
tive programs to reduce recidivism, as well as its work evaluating
these programs with the strongest research methods available at
the time. As crime rates rose, however, the state changed course,
enacting mandatory minimum statutes for firearms offenses
(1974), drug dealing (1980), and vehicular homicide (1982). For
a time, prosecutors often opted to charge defendants under less
restrictive statutes and even when they won convictions under
mandatory minimum laws, early release was still possible with
good behavior.
When the infamous case of Willie Horton became a defining
issue in Governor Michael Dukakis’s 1988 presidential campaign,
the environment changed radically. Responding to a public that
had already been alarmed by the growing crack epidemic, politi-
cians reacted swiftly with increasingly tough sentencing policies.
Dukakis, who for years had advocated a “presumptive” approach
to sentencing (a middle ground that would ensure punishment
was proportional based on the severity of offenses and the
culpability of offenders, but still allowed for judicial discretion),
supported and signed into law a number of strict mandatory mini-
mum bills. In 1988, the Legislature quickly passed a mandatory
minimum drug law with limited support from police and prosecu-
tors.14 The following year the Legislature enacted a school zone
statute, which led to penalty enhancement zones that effectively
doubled sentences for those convicted of drug offenses within
the vicinity of schools, parks, and playgrounds. In 1990, Dukakis
signed another mandatory minimum bill imposing tougher sen-
tences on drug dealers employing minors to buy or sell.
With criminal justice policy increasingly politicized, Bill
Weld entered the fray, promising to “reintroduce our inmates
to the joys of busting rocks” as he campaigned for governor in
1990. The landmark Federal Crime Bill signed by President Bill
Clinton in 1994 added fuel to the fire, giving states monetary
incentives to adopt reforms that led to longer periods of incar-
ceration and reduced the incentives for prisoners to partici-
pate in rehabilitative programming.
After the Federal Crime Bill went through, Massachusetts
was quick to comply, passing a “Truth in Sentencing” law. This
legislation required judges to impose a mandatory minimum
sentence for several drug offenses, restricted parole eligibility
for inmates serving mandatory minimums, and reduced the
amount of time inmates could earn toward early release with
good behavior. These changes made actual time served much
closer to the sentence imposed by the judge, a welcome and
beneficial outcome for victims of crime. The tradeoff, however,
was that judges now faced obstacles in providing flexible sen-
tencing for offenders working to become law-abiding citizens.
As the tough on crime era reached its apex in Massa-
chusetts and across the country in the early 1990s, crime rates
were already beginning to fall. With incarceration rates climbing
steadily higher throughout the 1990s and 2000s, it became
apparent that perhaps it was time to reexamine this approach.
A number of states, many of them politically conservative, with
soaring budget deficits and growing prison populations started
to look for alternative practices rooted in hard data.
In Massachusetts, despite reform recommendations
from several recent commissions, corrections policy remains
highly politicized, as evidenced by the passage of legislation
commonly referred to as the Three Strikes Bill in August 2012,
which requires judges to impose the maximum term of the
triggering felony for habitual offenders with two previous felony
sentences resulting in imprisonment for over three years.
While the law also includes increases in earned good time and
reduces mandatory minimums for certain drug offenses, there
is no consensus on whether the law will reduce or increase the
state’s prison population over the long term. Passage of this
major piece of legislation without a rigorous assessment of how
it will influence prison spending is at odds with reform laws in
other states, which typically require an impact analysis before
significant alterations to corrections policy can be adopted.15
THE TOUGH ON CRIME ERA IN MASSACHUSETTS
CRIME, COST, AND CONSEQUENCES 11
building a new 1,000-cell prison (even after learn-
ing about the costs to construct and operate the
facility), a 2005 Boston Foundation survey found
that two-thirds of the public wanted the state to
focus on prevention and rehabilitation rather than
longer sentences or more prisons.7
Given the intransigency of our criminal jus-
tice system, translating public sentiment into
action will require trusted leaders who can come
forward and exert significant influence. Toward
that end, MassINC has assembled a diverse coali-
tion of experts in criminal justice policy. Answer-
ing the call to service, they have offered their time
and talent to provide those best positioned to
usher in challenging reforms with credible analy-
sis and unbiased recommendations.
In this spirit, informed by the new coali-
tion’s members, this first report makes the case
for systemic innovation, teasing out the costs
of the state’s current corrections policies across
multiple dimensions, highlighting steps that
other states have successfully taken to improve
public safety performance, and providing recom-
mendations to guide a reform effort that drives
Massachusetts into the age of Justice Reinvest-
ment — reducing the costs of corrections while
enhancing public safety for all citizens of the
Commonwealth.
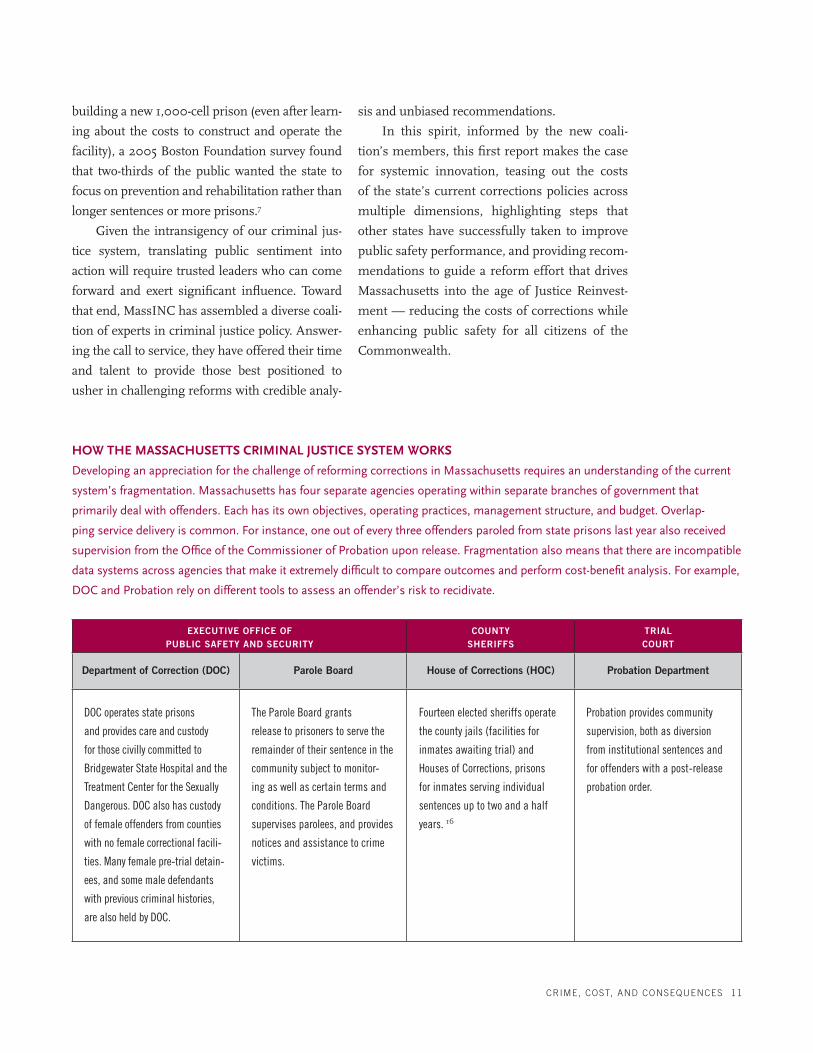
HOW THE MASSACHUSETTS CRIMINAL JUSTICE SYSTEM WORKS
Developing an appreciation for the challenge of reforming corrections in Massachusetts requires an understanding of the current
system’s fragmentation. Massachusetts has four separate agencies operating within separate branches of government that
primarily deal with offenders. Each has its own objectives, operating practices, management structure, and budget. Overlap-
ping service delivery is common. For instance, one out of every three offenders paroled from state prisons last year also received
supervision from the Office of the Commissioner of Probation upon release. Fragmentation also means that there are incompatible
data systems across agencies that make it extremely difficult to compare outcomes and perform cost-benefit analysis. For example,
DOC and Probation rely on different tools to assess an offender’s risk to recidivate.
EXECUTIVE OFFICE OF PUBLIC SAFETY AND SECURITY
COUNTY SHERIFFS
TRIAL COURT
Department of Correction (DOC) Parole Board House of Corrections (HOC) Probation Department
DOC operates state prisons
and provides care and custody
for those civilly committed to
Bridgewater State Hospital and the
Treatment Center for the Sexually
Dangerous. DOC also has custody
of female offenders from counties
with no female correctional facili-
ties. Many female pre-trial detain-
ees, and some male defendants
with previous criminal histories,
are also held by DOC.
The Parole Board grants
release to prisoners to serve the
remainder of their sentence in the
community subject to monitor-
ing as well as certain terms and
conditions. The Parole Board
supervises parolees, and provides
notices and assistance to crime
victims.
Fourteen elected sheriffs operate
the county jails (facilities for
inmates awaiting trial) and
Houses of Corrections, prisons
for inmates serving individual
sentences up to two and a half
years. 16
Probation provides community
supervision, both as diversion
from institutional sentences and
for offenders with a post-release
probation order.
12 THE MASSACHUSETTS INSTITUTE FOR A NEW COMMONWEALTH
Tallying the full cost of tough on crime policies
and practices makes clear the rationale for mov-
ing aggressively to the Justice Reinvestment
model clear. As described below, the state’s cur-
rent approach to corrections produces both direct
and indirect costs. When weighing the benefits
associated with reducing crime through greater
use of confinement against the costs that accrue
in a variety of forms, the hefty price tag becomes
more difficult to accept.
TheDirectCostsThe direct costs of the corrections policies that
Massachusetts has put in place over the last two
decades fall into four primary categories: 1) The
cost of incarcerating offenders for longer periods;
2) The cost of confining more drug offenders and
lifers in state prisons; 3) The cost of confining
more offenders in higher-security settings; and
4) The cost of elevated repeat offending resulting
from unsupervised release and inadequate reen-
try programming.
1. The cost of incarcerating offenders for longer periods.Unlike many states, Massachusetts has not kept
data to provide a precise estimate of the extent to
which offenders today serve more time in prison
compared with offenders committing similar fel-
onies in the past.17 Despite the absence of these
records, there are several indications that statu-
tory and policy changes put in place over the last
two decades have significantly increased the aver-
age length of time that inmates serve.
The state’s rising prison population relative
to new court commitments is the clearest signal
that time served has risen substantially. All indi-
cations suggest that the severity of crimes com-
mitted over the last two decades has not changed
dramatically.18 It follows, then, that the prison
population should rise (or fall) as judges order
more (or fewer) offenders to prisons. This hasn’t
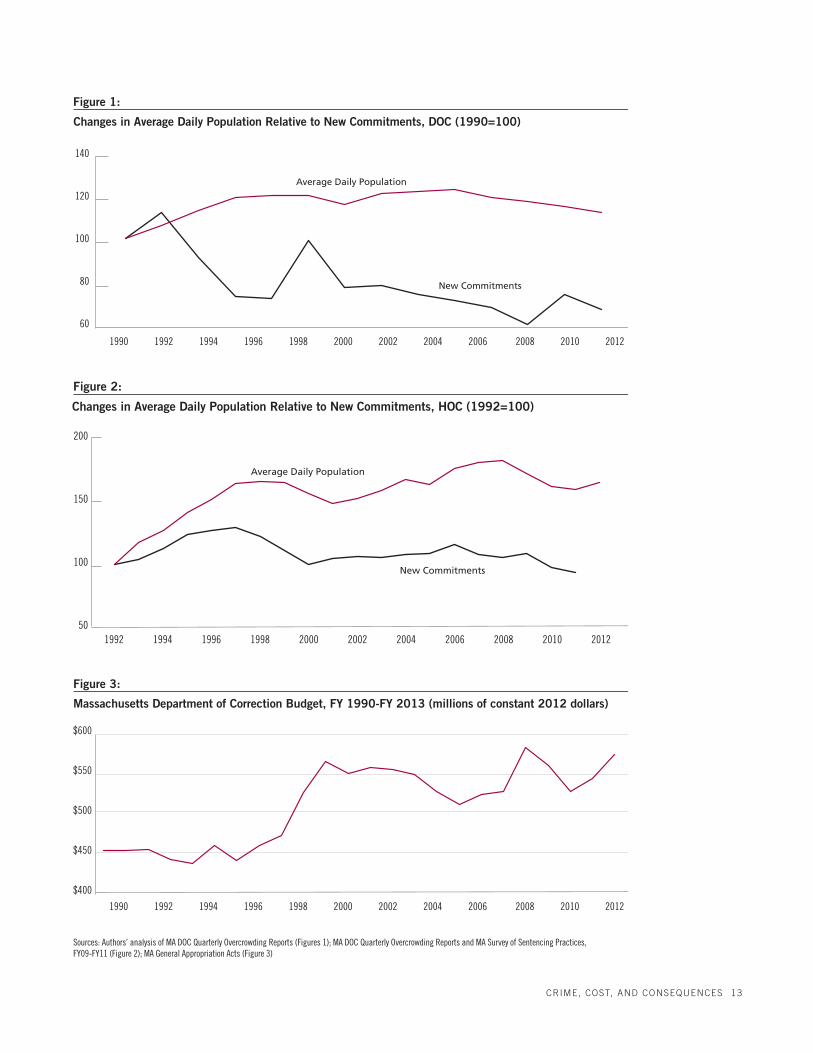
been the pattern. Since 1990, new commitments
to DOC prisons have fallen by 20 percent, yet the
DOC’s average daily population has increased
by one-third (Figure 1). The disparity between
annual commitments and average daily popula-
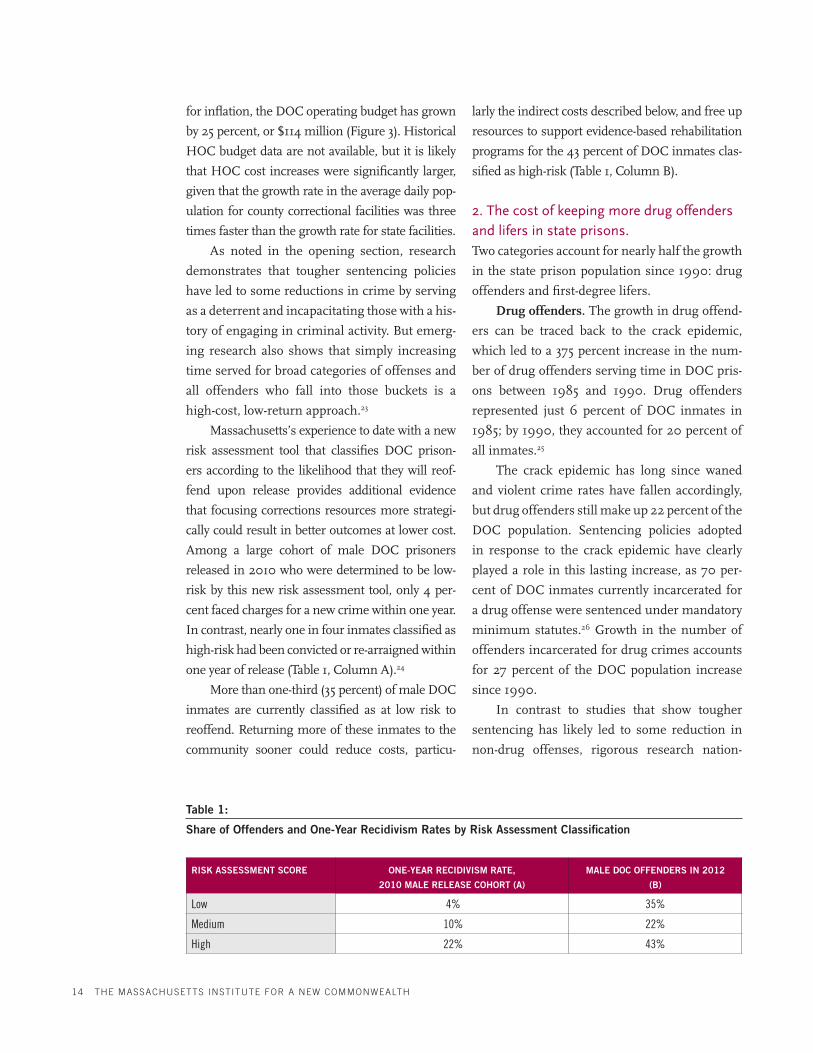
tion is even sharper with county HOCs. Available
data show that county facilities saw their popula-
tions increase by 65 percent between 1992 and
2012; over this period, new commitments to
HOCs fell by about 7 percent (Figure 2).19
An analysis of inmates serving time at Middle-
sex County’s Billerica House of Correction provides
more confirmation that county facilities have seen a
particularly sharp increase in the average length of
stay. Prepared by Northeastern University research-
ers who assembled data from individual records,
the study found that between 1994 and 2007, the
average length of stay at the Billerica House of Cor-
rection increased by 42 percent overall and by 80
percent for drug offenders.20
While data limitations make it hard to pin-
point the exact increase in time served across
all state and county facilities and the associated
cost, given that the Massachusetts incarceration
rate has risen nearly as fast as the national rate
over the last three decades, it is not unreasonable
to assume that the Commonwealth falls some-
where near the national average — a one-third
increase in the typical length of stay since 1990.21
This equates to an additional year for the aver-
age state inmate and an additional 41 days for the
average county inmate. At a cost of $45,500 per
year for state prisoners and $37,000 per year for
county inmates, increasing time served by one-
third translates to an added cost of $150 million
per year.22
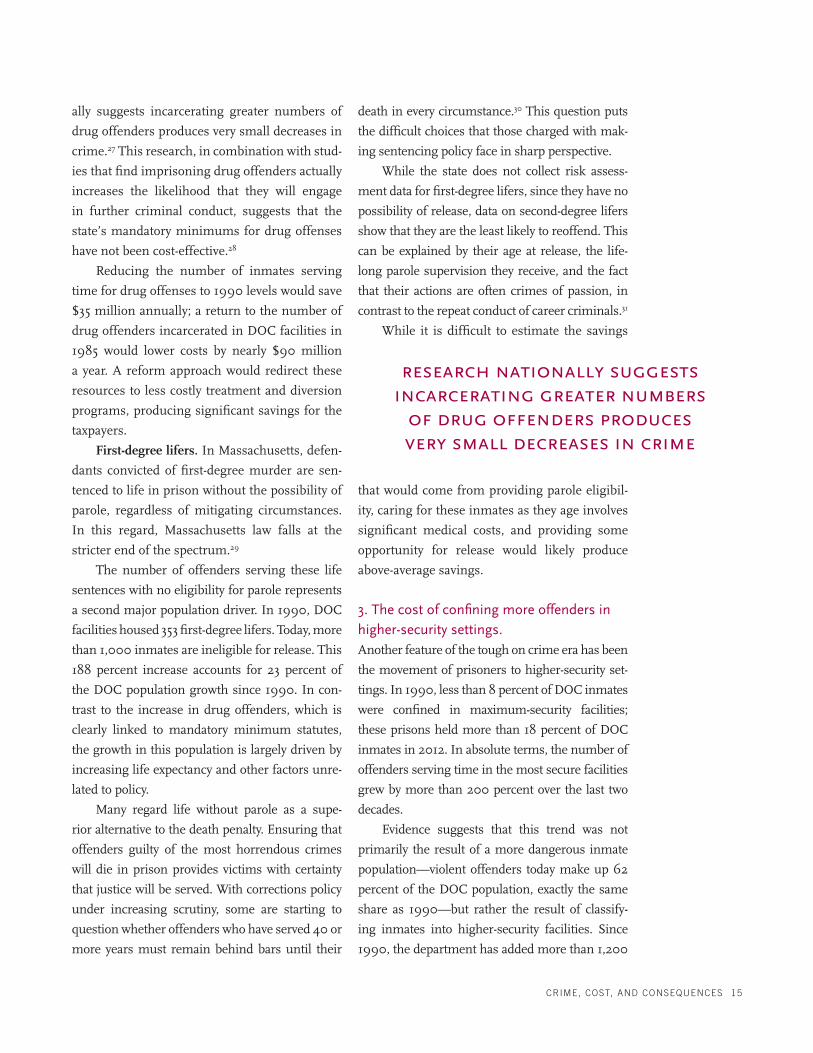
This figure is in line with available data on state
prison cost increases. Since FY 1990, accounting
I. THE PRICE TAG FOR MASSACHUSETTS’S “TOUGH ON CRIME” CORRECTIONS ERA
CRIME, COST, AND CONSEQUENCES 13
Figure 1:
Changes in Average Daily Population Relative to New Commitments, DOC (1990=100)
Source: Authors’ analysis from MA DOC Quarterly Overcrowding Report
1990 1992 1994 1996 1998 2000 2002 2004 2006 2008 2010 2012
140
120
100
80
60
Average Daily Population
New Commitments
Figure 2:
Changes in Average Daily Population Relative to New Commitments, HOC (1992=100)
Source: Authors’ analysis from MA DOC Quarterly Overcrowding Report
1992 1994 1996 1998 2000 2002 2004 2006 2008 2010 2012
200
150
100
50
Average Daily Population
New Commitments
Massachusetts Department of Correction Budget, FY 1990-FY 2013 (millions of constant 2012 dollars)
Sources: Authors’ analysis of MA DOC Quarterly Overcrowding Reports (Figures 1); MA DOC Quarterly Overcrowding Reports and MA Survey of Sentencing Practices, FY09-FY11 (Figure 2); MA General Appropriation Acts (Figure 3)
Figure 3:
1990 1992 1994 1996 1998 2000 2002 2004 2006 2008 2010 2012
$600
$550
$500
$450
$400
14 THE MASSACHUSETTS INSTITUTE FOR A NEW COMMONWEALTH
for inflation, the DOC operating budget has grown
by 25 percent, or $114 million (Figure 3). Historical
HOC budget data are not available, but it is likely
that HOC cost increases were significantly larger,
given that the growth rate in the average daily pop-
ulation for county correctional facilities was three
times faster than the growth rate for state facilities.
As noted in the opening section, research
demonstrates that tougher sentencing policies
have led to some reductions in crime by serving
as a deterrent and incapacitating those with a his-
tory of engaging in criminal activity. But emerg-
ing research also shows that simply increasing
time served for broad categories of offenses and
all offenders who fall into those buckets is a
high-cost, low-return approach.23
Massachusetts’s experience to date with a new
risk assessment tool that classifies DOC prison-
ers according to the likelihood that they will reof-
fend upon release provides additional evidence
that focusing corrections resources more strategi-
cally could result in better outcomes at lower cost.
Among a large cohort of male DOC prisoners
released in 2010 who were determined to be low-
risk by this new risk assessment tool, only 4 per-
cent faced charges for a new crime within one year.
In contrast, nearly one in four inmates classified as
high-risk had been convicted or re-arraigned within
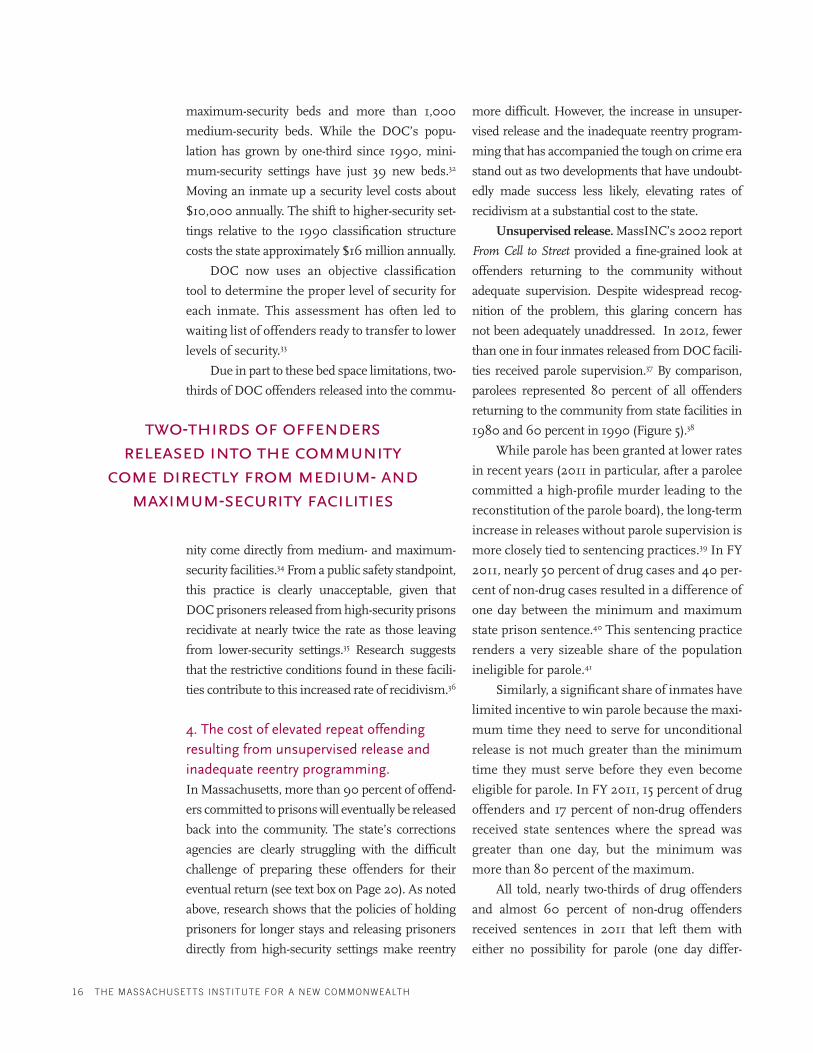
one year of release (Table 1, Column A).24
More than one-third (35 percent) of male DOC
inmates are currently classified as at low risk to
reoffend. Returning more of these inmates to the
community sooner could reduce costs, particu-
larly the indirect costs described below, and free up
resources to support evidence-based rehabilitation
programs for the 43 percent of DOC inmates clas-
sified as high-risk (Table 1, Column B).
2. The cost of keeping more drug offenders and lifers in state prisons.Two categories account for nearly half the growth
in the state prison population since 1990: drug
offenders and first-degree lifers.
Drug offenders. The growth in drug offend-
ers can be traced back to the crack epidemic,
which led to a 375 percent increase in the num-
ber of drug offenders serving time in DOC pris-
ons between 1985 and 1990. Drug offenders
represented just 6 percent of DOC inmates in
1985; by 1990, they accounted for 20 percent of
all inmates.25
The crack epidemic has long since waned
and violent crime rates have fallen accordingly,
but drug offenders still make up 22 percent of the
DOC population. Sentencing policies adopted
in response to the crack epidemic have clearly
played a role in this lasting increase, as 70 per-
cent of DOC inmates currently incarcerated for
a drug offense were sentenced under mandatory
minimum statutes.26 Growth in the number of
offenders incarcerated for drug crimes accounts
for 27 percent of the DOC population increase
since 1990.
In contrast to studies that show tougher
sentencing has likely led to some reduction in
non-drug offenses, rigorous research nation-
Table 1:
Share of Offenders and One-Year Recidivism Rates by Risk Assessment Classification
RISK ASSESSMENT SCORE ONE-YEAR RECIDIVISM RATE,
2010 MALE RELEASE COHORT (A)
MALE DOC OFFENDERS IN 2012
(B)
Low 4% 35%
Medium 10% 22%
High 22% 43%
CRIME, COST, AND CONSEQUENCES 15
ally suggests incarcerating greater numbers of
drug offenders produces very small decreases in
crime.27 This research, in combination with stud-
ies that find imprisoning drug offenders actually
increases the likelihood that they will engage
in further criminal conduct, suggests that the
state’s mandatory minimums for drug offenses
have not been cost-effective.28
Reducing the number of inmates serving
time for drug offenses to 1990 levels would save
$35 million annually; a return to the number of
drug offenders incarcerated in DOC facilities in
1985 would lower costs by nearly $90 million
a year. A reform approach would redirect these
resources to less costly treatment and diversion
programs, producing significant savings for the
taxpayers.
First-degree lifers. In Massachusetts, defen-
dants convicted of first-degree murder are sen-
tenced to life in prison without the possibility of
parole, regardless of mitigating circumstances.
In this regard, Massachusetts law falls at the
stricter end of the spectrum.29
The number of offenders serving these life
sentences with no eligibility for parole represents
a second major population driver. In 1990, DOC
facilities housed 353 first-degree lifers. Today, more
than 1,000 inmates are ineligible for release. This
188 percent increase accounts for 23 percent of
the DOC population growth since 1990. In con-
trast to the increase in drug offenders, which is
clearly linked to mandatory minimum statutes,
the growth in this population is largely driven by
increasing life expectancy and other factors unre-
lated to policy.
Many regard life without parole as a supe-
rior alternative to the death penalty. Ensuring that
offenders guilty of the most horrendous crimes
will die in prison provides victims with certainty
that justice will be served. With corrections policy
under increasing scrutiny, some are starting to
question whether offenders who have served 40 or
more years must remain behind bars until their
death in every circumstance.30 This question puts
the difficult choices that those charged with mak-
ing sentencing policy face in sharp perspective.
While the state does not collect risk assess-
ment data for first-degree lifers, since they have no
possibility of release, data on second-degree lifers
show that they are the least likely to reoffend. This
can be explained by their age at release, the life-
long parole supervision they receive, and the fact
that their actions are often crimes of passion, in
contrast to the repeat conduct of career criminals.31
While it is difficult to estimate the savings
that would come from providing parole eligibil-
ity, caring for these inmates as they age involves
significant medical costs, and providing some
opportunity for release would likely produce
above-average savings.
3. The cost of confining more offenders in higher-security settings. Another feature of the tough on crime era has been
the movement of prisoners to higher-security set-
tings. In 1990, less than 8 percent of DOC inmates
were confined in maximum-security facilities;
these prisons held more than 18 percent of DOC
inmates in 2012. In absolute terms, the number of
offenders serving time in the most secure facilities
grew by more than 200 percent over the last two
decades.
Evidence suggests that this trend was not
primarily the result of a more dangerous inmate
population—violent offenders today make up 62
percent of the DOC population, exactly the same
share as 1990—but rather the result of classify-
ing inmates into higher-security facilities. Since
1990, the department has added more than 1,200
research nationally suggests incarcerating greater numbers
of drug offenders produces very small decreases in crime
16 THE MASSACHUSETTS INSTITUTE FOR A NEW COMMONWEALTH
maximum-security beds and more than 1,000
medium-security beds. While the DOC’s popu-
lation has grown by one-third since 1990, mini-
mum-security settings have just 39 new beds.32
Moving an inmate up a security level costs about
$10,000 annually. The shift to higher-security set-
tings relative to the 1990 classification structure
costs the state approximately $16 million annually.
DOC now uses an objective classification
tool to determine the proper level of security for
each inmate. This assessment has often led to
waiting list of offenders ready to transfer to lower
levels of security.33
Due in part to these bed space limitations, two-
thirds of DOC offenders released into the commu-
nity come directly from medium- and maximum-
security facilities.34 From a public safety standpoint,
this practice is clearly unacceptable, given that
DOC prisoners released from high-security prisons
recidivate at nearly twice the rate as those leaving
from lower-security settings.35 Research suggests
that the restrictive conditions found in these facili-
ties contribute to this increased rate of recidivism.36
4. The cost of elevated repeat offending resulting from unsupervised release and inadequate reentry programming.In Massachusetts, more than 90 percent of offend-
ers committed to prisons will eventually be released
back into the community. The state’s corrections
agencies are clearly struggling with the difficult
challenge of preparing these offenders for their
eventual return (see text box on Page 20). As noted
above, research shows that the policies of holding
prisoners for longer stays and releasing prisoners
directly from high-security settings make reentry
more difficult. However, the increase in unsuper-
vised release and the inadequate reentry program-
ming that has accompanied the tough on crime era
stand out as two developments that have undoubt-
edly made success less likely, elevating rates of
recidivism at a substantial cost to the state.
Unsupervised release. MassINC’s 2002 report
From Cell to Street provided a fine-grained look at
offenders returning to the community without
adequate supervision. Despite widespread recog-
nition of the problem, this glaring concern has
not been adequately unaddressed. In 2012, fewer
than one in four inmates released from DOC facili-
ties received parole supervision.37 By comparison,
parolees represented 80 percent of all offenders
returning to the community from state facilities in
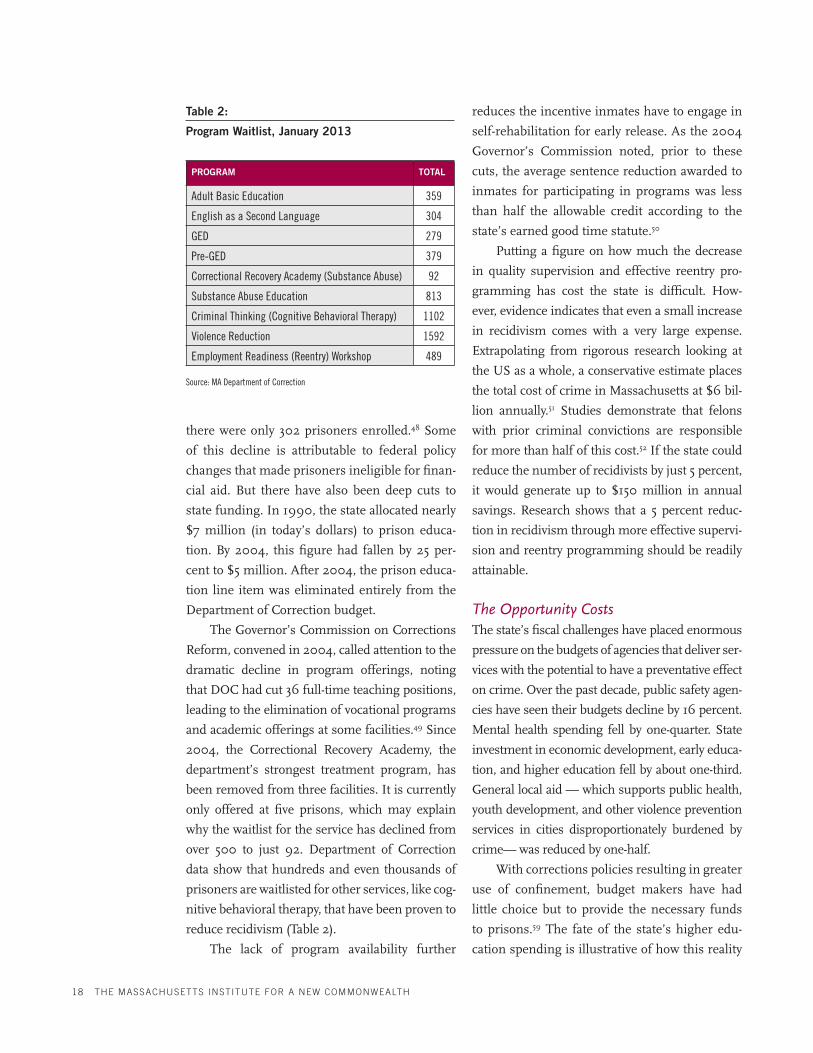
1980 and 60 percent in 1990 (Figure 5).38
While parole has been granted at lower rates
in recent years (2011 in particular, after a parolee
committed a high-profile murder leading to the
reconstitution of the parole board), the long-term
increase in releases without parole supervision is
more closely tied to sentencing practices.39 In FY
2011, nearly 50 percent of drug cases and 40 per-
cent of non-drug cases resulted in a difference of
one day between the minimum and maximum
state prison sentence.40 This sentencing practice
renders a very sizeable share of the population
ineligible for parole.41
Similarly, a significant share of inmates have
limited incentive to win parole because the maxi-
mum time they need to serve for unconditional
release is not much greater than the minimum
time they must serve before they even become
eligible for parole. In FY 2011, 15 percent of drug
offenders and 17 percent of non-drug offenders
received state sentences where the spread was
greater than one day, but the minimum was
more than 80 percent of the maximum.
All told, nearly two-thirds of drug offenders
and almost 60 percent of non-drug offenders
received sentences in 2011 that left them with
either no possibility for parole (one day differ-
two-thirds of offenders released into the community
come directly from medium- and maximum-security facilities
CRIME, COST, AND CONSEQUENCES 17
ences) or very limited incentive to attain it (mini-
mum more than 80 percent of the maximum).42
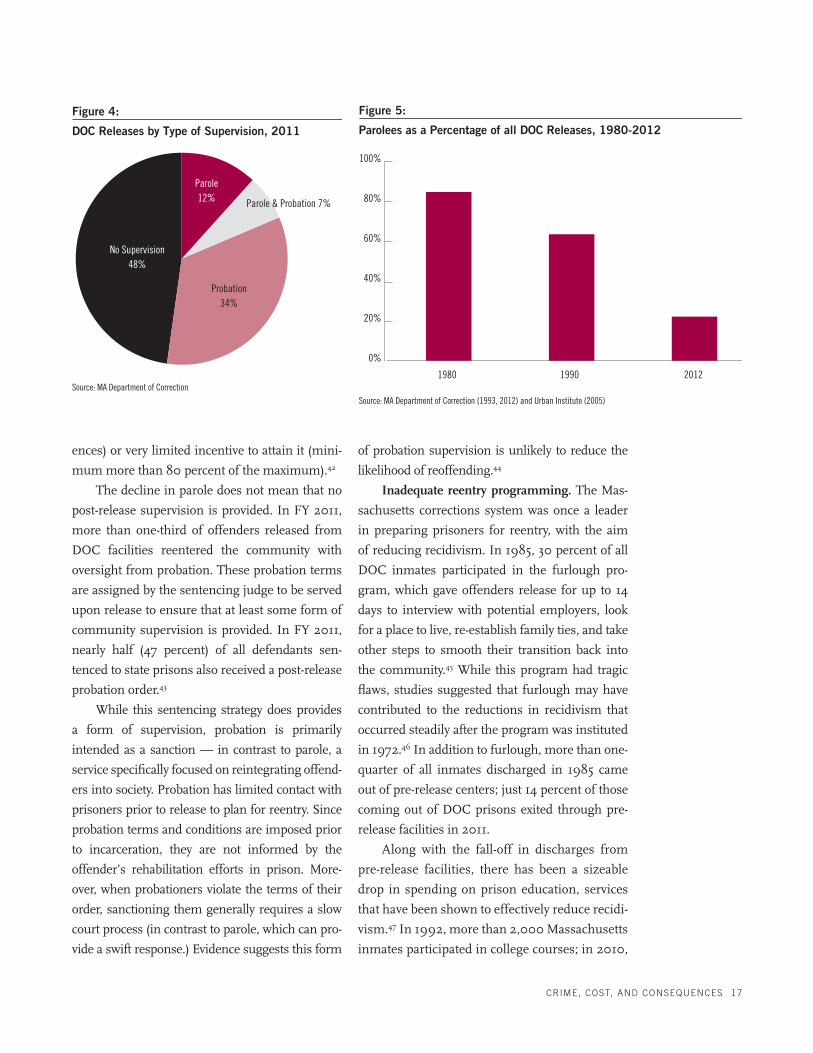
The decline in parole does not mean that no
post-release supervision is provided. In FY 2011,
more than one-third of offenders released from
DOC facilities reentered the community with
oversight from probation. These probation terms
are assigned by the sentencing judge to be served
upon release to ensure that at least some form of
community supervision is provided. In FY 2011,
nearly half (47 percent) of all defendants sen-
tenced to state prisons also received a post-release
probation order.43
While this sentencing strategy does provides
a form of supervision, probation is primarily
intended as a sanction — in contrast to parole, a
service specifically focused on reintegrating offend-
ers into society. Probation has limited contact with
prisoners prior to release to plan for reentry. Since
probation terms and conditions are imposed prior
to incarceration, they are not informed by the
offender’s rehabilitation efforts in prison. More-
over, when probationers violate the terms of their
order, sanctioning them generally requires a slow
court process (in contrast to parole, which can pro-
vide a swift response.) Evidence suggests this form
of probation supervision is unlikely to reduce the
likelihood of reoffending.44
Inadequate reentry programming. The Mas-
sachusetts corrections system was once a leader
in preparing prisoners for reentry, with the aim
of reducing recidivism. In 1985, 30 percent of all
DOC inmates participated in the furlough pro-
gram, which gave offenders release for up to 14
days to interview with potential employers, look
for a place to live, re-establish family ties, and take
other steps to smooth their transition back into
the community.45 While this program had tragic
flaws, studies suggested that furlough may have
contributed to the reductions in recidivism that
occurred steadily after the program was instituted
in 1972.46 In addition to furlough, more than one-
quarter of all inmates discharged in 1985 came
out of pre-release centers; just 14 percent of those
coming out of DOC prisons exited through pre-
release facilities in 2011.
Along with the fall-off in discharges from
pre-release facilities, there has been a sizeable
drop in spending on prison education, services
that have been shown to effectively reduce recidi-
vism.47 In 1992, more than 2,000 Massachusetts
inmates participated in college courses; in 2010,
DOC Releases by Type of Supervision, 2011
Source: MA Department of Correction
Figure 4:
No Supervision48%
Parole12%
Probation34%
Parole & Probation 7%
Parolees as a Percentage of all DOC Releases, 1980-2012
Source: MA Department of Correction (1993, 2012) and Urban Institute (2005)
Figure 5:
1980 1990 2012
100%
80%
60%
40%
20%
0%
18 THE MASSACHUSETTS INSTITUTE FOR A NEW COMMONWEALTH
there were only 302 prisoners enrolled.48 Some
of this decline is attributable to federal policy
changes that made prisoners ineligible for finan-
cial aid. But there have also been deep cuts to
state funding. In 1990, the state allocated nearly
$7 million (in today’s dollars) to prison educa-
tion. By 2004, this figure had fallen by 25 per-
cent to $5 million. After 2004, the prison educa-
tion line item was eliminated entirely from the
Department of Correction budget.
The Governor’s Commission on Corrections
Reform, convened in 2004, called attention to the
dramatic decline in program offerings, noting
that DOC had cut 36 full-time teaching positions,
leading to the elimination of vocational programs
and academic offerings at some facilities.49 Since
2004, the Correctional Recovery Academy, the
department’s strongest treatment program, has
been removed from three facilities. It is currently
only offered at five prisons, which may explain
why the waitlist for the service has declined from
over 500 to just 92. Department of Correction
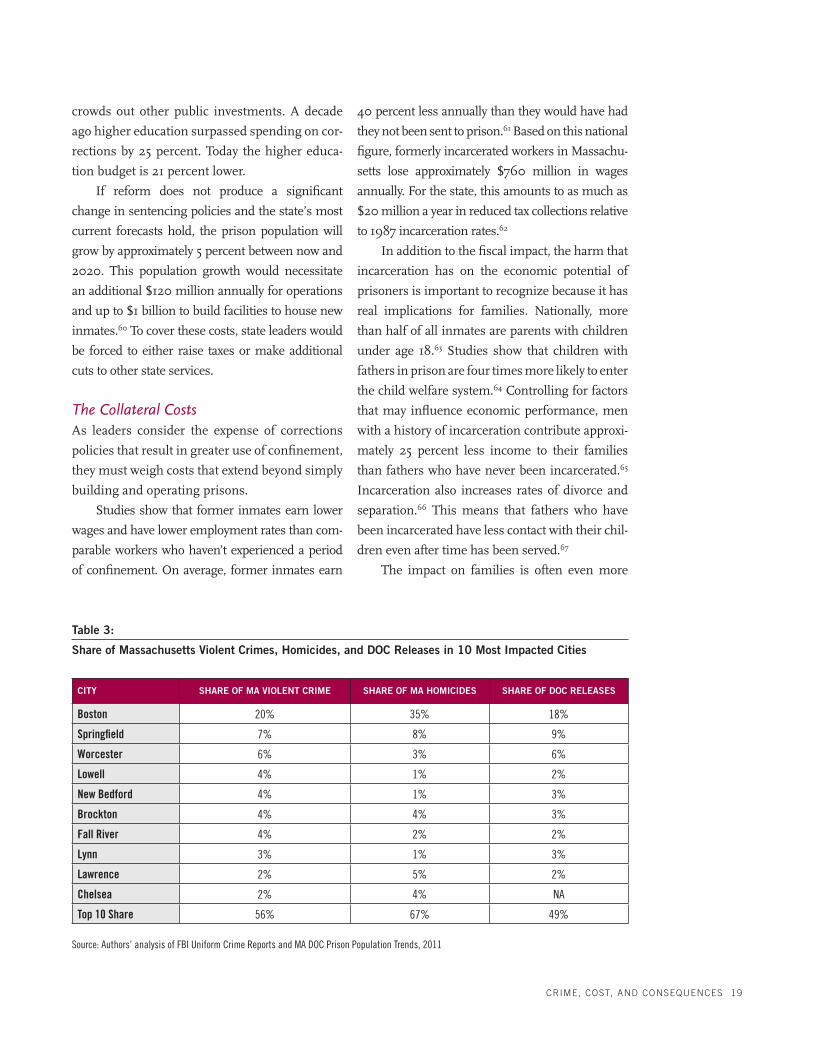
data show that hundreds and even thousands of
prisoners are waitlisted for other services, like cog-
nitive behavioral therapy, that have been proven to
reduce recidivism (Table 2).
The lack of program availability further
reduces the incentive inmates have to engage in
self-rehabilitation for early release. As the 2004
Governor’s Commission noted, prior to these
cuts, the average sentence reduction awarded to
inmates for participating in programs was less
than half the allowable credit according to the
state’s earned good time statute.50
Putting a figure on how much the decrease
in quality supervision and effective reentry pro-
gramming has cost the state is difficult. How-
ever, evidence indicates that even a small increase
in recidivism comes with a very large expense.
Extrapolating from rigorous research looking at
the US as a whole, a conservative estimate places
the total cost of crime in Massachusetts at $6 bil-
lion annually.51 Studies demonstrate that felons
with prior criminal convictions are responsible
for more than half of this cost.52 If the state could
reduce the number of recidivists by just 5 percent,
it would generate up to $150 million in annual
savings. Research shows that a 5 percent reduc-
tion in recidivism through more effective supervi-
sion and reentry programming should be readily
attainable.
TheOpportunityCostsThe state’s fiscal challenges have placed enormous
pressure on the budgets of agencies that deliver ser-
vices with the potential to have a preventative effect
on crime. Over the past decade, public safety agen-
cies have seen their budgets decline by 16 percent.
Mental health spending fell by one-quarter. State
investment in economic development, early educa-
tion, and higher education fell by about one-third.
General local aid — which supports public health,
youth development, and other violence prevention
services in cities disproportionately burdened by
crime— was reduced by one-half.
With corrections policies resulting in greater
use of confinement, budget makers have had
little choice but to provide the necessary funds
to prisons.59 The fate of the state’s higher edu-
cation spending is illustrative of how this reality
Table 2:
Program Waitlist, January 2013
PROGRAM TOTAL
Adult Basic Education 359
English as a Second Language 304
GED 279
Pre-GED 379
Correctional Recovery Academy (Substance Abuse) 92
Substance Abuse Education 813
Criminal Thinking (Cognitive Behavioral Therapy) 1102
Violence Reduction 1592
Employment Readiness (Reentry) Workshop 489
Source: MA Department of Correction
CRIME, COST, AND CONSEQUENCES 19
crowds out other public investments. A decade
ago higher education surpassed spending on cor-
rections by 25 percent. Today the higher educa-
tion budget is 21 percent lower.
If reform does not produce a significant
change in sentencing policies and the state’s most
current forecasts hold, the prison population will
grow by approximately 5 percent between now and
2020. This population growth would necessitate
an additional $120 million annually for operations
and up to $1 billion to build facilities to house new
inmates.60 To cover these costs, state leaders would
be forced to either raise taxes or make additional
cuts to other state services.
TheCollateralCostsAs leaders consider the expense of corrections
policies that result in greater use of confinement,
they must weigh costs that extend beyond simply
building and operating prisons.
Studies show that former inmates earn lower
wages and have lower employment rates than com-
parable workers who haven’t experienced a period
of confinement. On average, former inmates earn
40 percent less annually than they would have had
they not been sent to prison.61 Based on this national
figure, formerly incarcerated workers in Massachu-
setts lose approximately $760 million in wages
annually. For the state, this amounts to as much as
$20 million a year in reduced tax collections relative
to 1987 incarceration rates.62
In addition to the fiscal impact, the harm that
incarceration has on the economic potential of
prisoners is important to recognize because it has
real implications for families. Nationally, more
than half of all inmates are parents with children
under age 18.63 Studies show that children with
fathers in prison are four times more likely to enter
the child welfare system.64 Controlling for factors
that may influence economic performance, men
with a history of incarceration contribute approxi-
mately 25 percent less income to their families
than fathers who have never been incarcerated.65
Incarceration also increases rates of divorce and
separation.66 This means that fathers who have
been incarcerated have less contact with their chil-
dren even after time has been served.67
The impact on families is often even more
Table 3:
Share of Massachusetts Violent Crimes, Homicides, and DOC Releases in 10 Most Impacted Cities
CITY SHARE OF MA VIOLENT CRIME SHARE OF MA HOMICIDES SHARE OF DOC RELEASES
Boston 20% 35% 18%
Springfield 7% 8% 9%
Worcester 6% 3% 6%
Lowell 4% 1% 2%
New Bedford 4% 1% 3%
Brockton 4% 4% 3%
Fall River 4% 2% 2%
Lynn 3% 1% 3%
Lawrence 2% 5% 2%
Chelsea 2% 4% NA
Top 10 Share 56% 67% 49% Source: Authors’ analysis of FBI Uniform Crime Reports and MA DOC Prison Population Trends, 2011
20 THE MASSACHUSETTS INSTITUTE FOR A NEW COMMONWEALTH
injurious when mothers are incarcerated. The
number of women serving time in Massachusetts
prisons has nearly tripled since the 1980s. Esti-
mates suggest two-thirds of female inmates have
minor children. For many children, these women
are the only parent in the household. Because
the mark incarceration leaves on women is often
much deeper than the economic stain that men
struggle with, their interaction with the prison
system can be profoundly more injurious for
them and their families (see text box on Page 21).
Corrections policy also has important implica-
tions for communities, particularly the urban cen-
ters that drive regional economies across the state.
Data reported to the FBI show that just 10 Mas-
sachusetts cities, representing only one-quarter of
the state’s population, suffer from more than half
of all violent crime committed in the Common-
wealth. Homicides, which cause the most social
upheaval, are even more highly concentrated, with
more than two-thirds of all murders in the state
occurring in these 10 communities.
Just as these cities are more likely to shoul-
der the burden of crime, they are disproportion-
ately called upon to help repair the lives of those
who have served time. According to figures from
the state Department of Correction, 10 commu-
nities received half of all DOC inmates released
to the street in 2011 (Table 3).
The upheaval in the lives of families associated
with the constant churn of people removed and
returning from prison creates significant stress
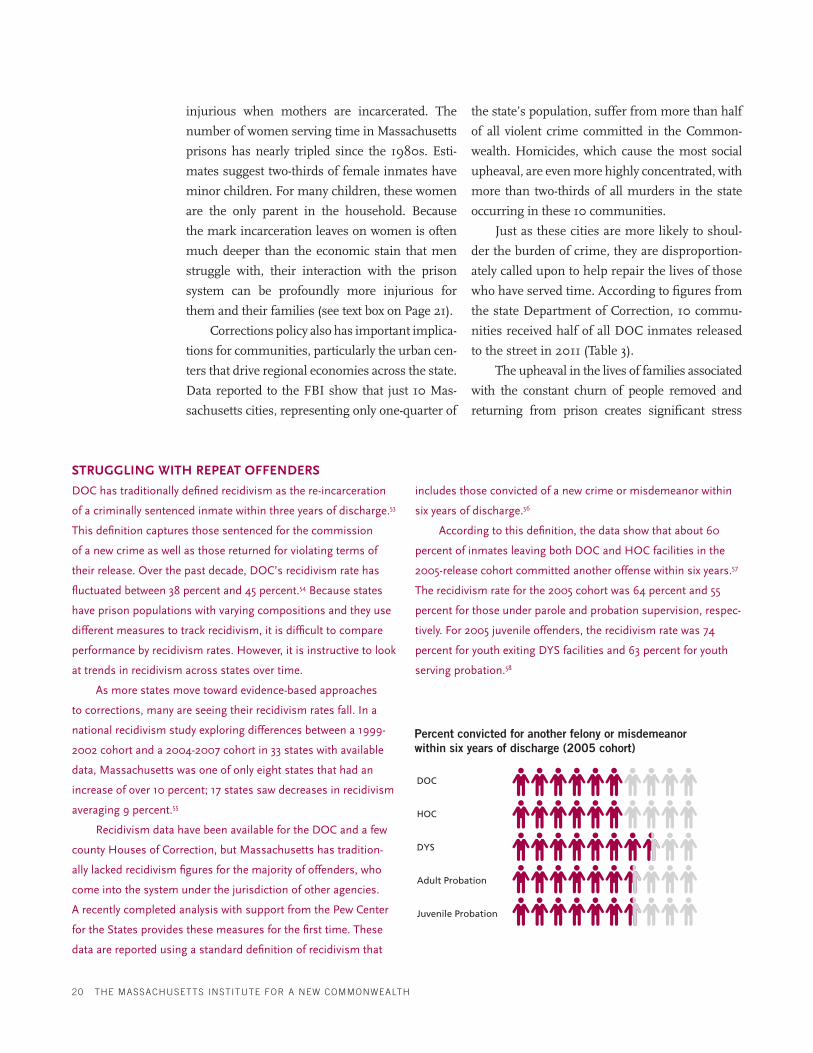
DOC has traditionally defined recidivism as the re-incarceration
of a criminally sentenced inmate within three years of dis charge.53
This definition captures those sentenced for the commission
of a new crime as well as those returned for violating terms of
their release. Over the past decade, DOC’s recidivism rate has
fluctuated between 38 percent and 45 percent.54 Because states
have prison populations with varying compositions and they use
different measures to track recidivism, it is difficult to compare
performance by recidivism rates. However, it is instructive to look
at trends in recidivism across states over time.
As more states move toward evidence-based approaches
to corrections, many are seeing their recidivism rates fall. In a
national recidivism study exploring differ ences between a 1999-
2002 cohort and a 2004-2007 cohort in 33 states with available
data, Massachusetts was one of only eight states that had an
increase of over 10 percent; 17 states saw decreases in recidivism
averaging 9 percent.55
Recidivism data have been available for the DOC and a few
county Houses of Correction, but Massachusetts has tradition-
ally lacked recidivism figures for the majority of offenders, who
come into the system under the jurisdiction of other agencies.
A recently completed analysis with support from the Pew Center
for the States provides these measures for the first time. These
data are reported using a standard definition of recidivism that
includes those convicted of a new crime or misdemeanor within
six years of discharge.56
According to this definition, the data show that about 60
percent of inmates leaving both DOC and HOC facilities in the
2005-release cohort committed another offense within six years.57
The recidivism rate for the 2005 cohort was 64 percent and 55
percent for those under parole and probation supervision, respec-
tively. For 2005 juvenile offenders, the recidivism rate was 74
percent for youth exiting DYS facilities and 63 percent for youth
serving probation.58
STRUGGLING WITH REPEAT OFFENDERS
Percent convicted for another felony or misdemeanor within six years of discharge (2005 cohort)
DOC
HOC
DYS
Adult Probation
Juvenile Probation
CRIME, COST, AND CONSEQUENCES 21
upon these communities that many researchers
believe leads to actual increases in the crime rate. 68
In addition to disproportionately impacting
some places over others, incarceration policies
have implications for the state’s minority residents
and their potential for upward economic mobility.
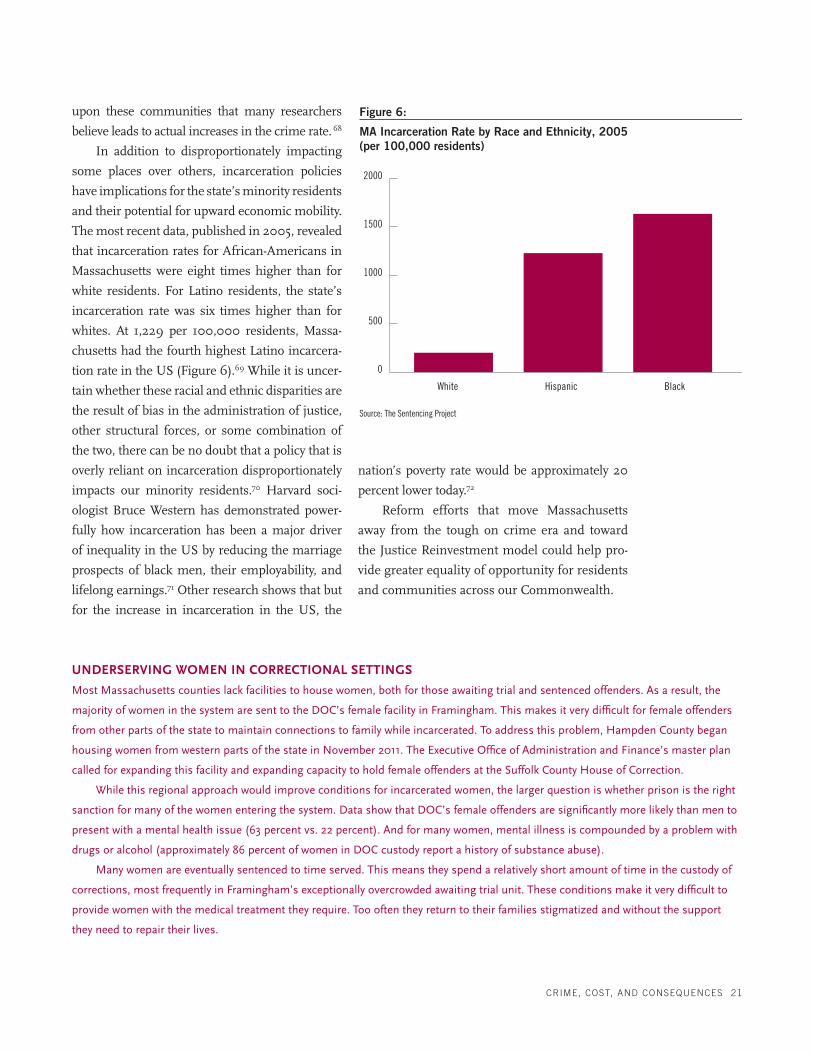
The most recent data, published in 2005, revealed
that incarceration rates for African-Americans in
Massachusetts were eight times higher than for
white residents. For Latino residents, the state’s
incarceration rate was six times higher than for
whites. At 1,229 per 100,000 residents, Massa-
chusetts had the fourth highest Latino incarcera-
tion rate in the US (Figure 6).69 While it is uncer-
tain whether these racial and ethnic disparities are
the result of bias in the administration of justice,
other structural forces, or some combination of
the two, there can be no doubt that a policy that is
overly reliant on incarceration disproportionately
impacts our minority residents.70 Harvard soci-
ologist Bruce Western has demonstrated power-
fully how incarceration has been a major driver
of inequality in the US by reducing the marriage
prospects of black men, their employability, and
lifelong earnings.71 Other research shows that but
for the increase in incarceration in the US, the
nation’s poverty rate would be approximately 20
percent lower today.72
Reform efforts that move Massachusetts
away from the tough on crime era and toward
the Justice Reinvestment model could help pro-
vide greater equality of opportunity for residents
and communities across our Commonwealth.
MA Incarceration Rate by Race and Ethnicity, 2005 (per 100,000 residents)
Source: The Sentencing Project
Figure 6:
White Hispanic Black
0
500
1000
1500
2000
UNDERSERVING WOMEN IN CORRECTIONAL SETTINGS
Most Massachusetts counties lack facilities to house women, both for those awaiting trial and sentenced offenders. As a result, the
majority of women in the system are sent to the DOC’s female facility in Framingham. This makes it very difficult for female offenders
from other parts of the state to maintain connections to family while incarcerated. To address this problem, Hampden County began
housing women from western parts of the state in November 2011. The Executive Office of Administration and Finance’s master plan
called for expanding this facility and expanding capacity to hold female offenders at the Suffolk County House of Correction.
While this regional approach would improve conditions for incarcerated women, the larger question is whether prison is the right
sanction for many of the women entering the system. Data show that DOC’s female offenders are significantly more likely than men to
present with a mental health issue (63 percent vs. 22 percent). And for many women, mental illness is compounded by a problem with
drugs or alcohol (approximately 86 percent of women in DOC custody report a history of substance abuse).
Many women are eventually sentenced to time served. This means they spend a relatively short amount of time in the custody of
corrections, most frequently in Framingham’s exceptionally overcrowded awaiting trial unit. These conditions make it very difficult to
provide women with the medical treatment they require. Too often they return to their families stigmatized and without the support
they need to repair their lives.
22 THE MASSACHUSETTS INSTITUTE FOR A NEW COMMONWEALTH
Nationally, prison populations have begun to
trend downward for the first time in 35 years.
This reversal is at least partially the result of a sig-
nificant number of states where legislatures, rec-
ognizing that they cannot build the way to public
safety with more prisons, have started reinvent-
ing corrections policy and moving toward the
Justice Reinvestment model. Federal agencies
and private foundations have been key partners
in these efforts, helping states ground reform in
evidenced-based research. While Massachusetts
has flirted with this approach, leaders have yet to
unify behind a comprehensive, data-driven Jus-
tice Reinvestment policy, as demonstrated by the
passage of the Three Strikes Bill in the 2011-2012
legislative session.
JusticeReinvestmentNationallyThree decades after criminologists led state leg-
islatures toward determinative sentencing with a
series of reports concluding that “nothing works”
to reduce recidivism, researchers applied more
rigorous methods in the late 1990s and reversed
themselves, finding that the right programs tar-
geted toward the right set of offenders can reduce
recidivism by up to 20 percent.73
The Washington State Institute for Public
Policy (WSIPP), a national leader in cost-benefit
analysis, was at the forefront of this effort, working
with a direct mandate from the state legislature. In
1999, Washington passed legislation moving cor-
rections agencies from a sanction-based sentenc-
ing regime to a system focused on mitigating risk.
WSIPP researchers identified evidence-based treat-
ment and corrections programs that would produce
financial savings without jeopardizing public safety.
Many states have since followed Washington’s
lead, relying heavily on independent outside part-
ners to provide technical assistance in pinpointing
reforms and convening public agencies around the
Justice Reinvestment approach. Over the last decade,
the Council of State Governments has worked
with 17 states, including Connecticut, New Hamp-
shire, Rhode Island, and Vermont, to analyze data,
achieve policy reform, and measure performance.
Pew’s Public Safety Performance Project, formed in
2006 and a key partner in the Council’s effort, has
worked intensively with Arkansas, Georgia, South
Carolina, Texas, and, more recently, Oregon and
South Dakota. Community Resources for Justice, a
Massachusetts-based organization staffed by some
of the nation’s leading criminal justice experts, has
partnered with Pew, helping states around the coun-
try legislate and implement reform.
The US Bureau of Justice Assistance (BJA) is
redefining the federal role. Moving from the old
model, which encouraged the building of more
prisons with grants to states, the BJA is providing
resources to states and counties that pursue the
Justice Reinvestment model.
In 2010, the BJA, Pew, and the Council of
State Governments assembled in Washington for
a National Summit on Justice Reinvestment.74 The
conference report provides case studies and sum-
maries of best practices from leading states, high-
lighting four principles:
1. A focus on individuals most likely to
reoffend;
2. Programs based on science and efforts
to ensure quality implementation;
3. Effective community supervision policies
and practices; and
4. Place-based strategies.
While it is still too soon to document results
for many of the states that have just recently
adopted this model, for those with a longer his-
tory, the results to date have been impressive (as
catalogued in the text box on Page 24).
ReinventingJusticeinMassachusettsAs leading states blazed a trail, Massachusetts
took smaller steps to transform its approach to
II. MASSACHUSETTS IN AN ERA OF JUSTICE REINVESTMENT
CRIME, COST, AND CONSEQUENCES 23
corrections. In thinking about the way forward, a
look at recent efforts to reform the state’s criminal
justice system over the past two administrations
provides important context.
Governor Mitt Romney took office as the
Justice Reinvestment movement began to gain
real traction around the country. His pragmatic
approach to government and pledge to bring pri-
vate-sector efficiency to state agencies made him an
ideal candidate to guide Massachusetts out of the
tough on crime era and toward the Justice Rein-
vestment model. The fact that Lieutenant Governor
Kerry Healey was previously a professor of crimi-
nology made a reform effort led by the Romney
administration seem all the more promising.
In the administration’s first year, Healey was
appointed to head the Governor’s Commission
on Criminal Justice Innovation. The commission
was tasked with conducting a comprehensive look
at the entire criminal justice system, examining
cutting-edge practices and innovative solutions.
Among many recommendations, the commis-
sion called for mandatory post-release supervision
and sentencing reforms that would extend parole
eligibility to more prisoners.
While the Healey Commission was still com-
pleting its work, Romney established a second
commission in the fall of 2003 in response to the
murder of a high-profile inmate. Chaired by for-
mer attorney general Scott Harshbarger, the Gov-
ernor’s Commission on Corrections Reform was
charged with conducting a comprehensive review
of the Department of Correction and providing
recommendations for improvement. The Harsh-
barger Commission proved up to the task. The
Commission’s final report, issued in June 2004,
provided a detailed blueprint for reform, includ-
ing a number of major recommendations pertain-
ing to supervision and reentry.75
In his first step to implement the plan, Rom-
ney filed legislation in 2005 calling for mandatory
post-release supervision. While his bill stalled in
the Legislature, Romney was able to win resources
to establish regional reentry centers, where all pris-
oners leaving DOC facilities would be taken upon
release. Without supervision, however, ex-offenders
could not be compelled to participate in services, a
sharp departure from proven reentry models.
Romney also worked to implement a number
of the Harshbarger Commission’s recommenda-
tions administratively. A 2007 review found that
many of these reforms had taken hold within the
Department of Correction. For instance, major
emphasis is now placed on recidivism, and the
department has undertaken extensive analysis to
better understand the patterns of repeat offend-
ers. To aid in this effort, COMPAS, an evidence-
based risk assessment tool, was adopted.76
In other ways, however, efforts to act on many
of the Harshbarger Commission’s major recom-
mendations fell short. From legislation dealing
with sentencing reform and post-release supervi-
sion to performance management and accountabil-
ity systems to track which prisoners have received
and completed programs, the systemic change
sought by the commission did not occur. In frus-
tration, Harshbarger resigned in December 2005.77
As Romney’s attention turned toward the
2008 presidential campaign, the administration
lost its focus on tackling corrections reform. Gover-
nor Deval Patrick assumed the office in 2007 with
a more limited corrections reform agenda, placing
CORI (Criminal Offender Record Information)
reform at the top of his list of first-term priorities.
Tough on crime era policies made data on
individual criminal histories more accessible to
the public. Many believed that these records had
created a real obstacle for offenders returning to
the community and seeking employment. After
a tough fight, Patrick won passage for his CORI
reform bill in 2010.78 (Quietly included in the
the systemic change sought by the
commission did not occur
24 THE MASSACHUSETTS INSTITUTE FOR A NEW COMMONWEALTH
CORI reform law were provisions making drug
offenders serving mandatory minimums in county
prisons eligible for parole after completing half of
their maximum sentence. However, because most
mandatory minimum drug offenses result in state
prison sentences, this reform impacted only a
small subset of the HOC population.)79
As the governor’s CORI reform bill was mak-
ing its way toward passage at the end of the 2009-
2010 legislative session, the Boston Globe drew
focus to patronage hires at the probation depart-
ment. The Globe’s reporting raised serious ques-
tions about whether the scale of the problem had
jeopardized the professional operation of an agency
STATE PROFILESThis sample of efforts to move from tough on crime to
smart on crime is notable for the number of politically
conservative states at the vanguard. Republican leaders like
Newt Gingrich, Jeb Bush, and Grover Norquist are driv-
ing the country away from policies heavy on incarceration
toward models focused on preparing offenders to reenter
society successfully. The Texas-based Right on Crime Coali-
tion has pushed hard for change. The group includes leaders
driven by a desire to eliminate inefficient government spend-
ing as well as leaders with faith-based motivations.
NEW YORK. New York passed a reform bill ending indeter-
minate drug crime sentences and doubling the threshold
amount of drugs for mandatory sentences in 2004. Addi-
tional reform passed in 2009, providing for judicial discre-
tion for drug treatment instead of incarceration, diversion
for certain crimes and second felony offenses, availability
of resentencing for those sentenced under the indetermi-
nate laws prior to 2005, sealing provisions, and the ability
to dismiss a case when treatment was completed. In addi-
tion to these drug law reforms, New York has put in place
a Drug Treatment Alternative Program to divert defendants
from prison to treatment, as well as an Alternatives to
Incarceration program. New York also has given prisoners
many options and incentives to participate in earned good
time programming. Through these efforts, between 1999
and 2009, the state reduced its prison population by 20
percent, which allowed it to shut three prisons and some
buildings at six additional prisons.80
NEW JERSEY. New Jersey has expanded its drug court
model and discretion for judges regarding drug-free zones
(schools and parks). The state also implemented a risk
assessment tool to aid in making parole decisions, which
led to an increase in the parole-granting rate. New Jersey
has reduced parole revocations by increasing the use of day
reporting and electronic monitoring and by establishing
Regional Assessment Centers, where parolees can be held
for 15 to 30 days while parole revocations decisions are
made. The share of parole violators returned to prison has
dropped from 81 percent to 46 percent. Between 1999 and
2009, the New Jersey prison population fell by 19 percent. 81
TEXAS. In 2007, the Texas legislature adopted the Justice
Reinvestment model after recognizing that the state could
not afford a projected $2 billion in new prison construction
and operating costs under current policies. Texas invested
$241 million in treatment and diversion programs for drug
offenders.82 These investments saved $210 million in the
2008-2009 fiscal biennium and brought about a 4.5 per-
cent decline in the incarceration rate.83
SOUTH CAROLINA. In 2010, facing projected prison
growth of 3,200 inmates over five years, which would have
cost $458 million in operating and construction costs
for new prisons, South Carolina passed major sentenc-
ing reform legislation. Among many provisions, the law
reduced penalties for nonviolent burglary and made the
offense parole-eligible; restructured controlled-substance
offenses to allow for probation, parole, and work release
in certain cases; revised work release provisions in the last
three years of a sentence; allowed parole for terminally ill,
geriatric, or permanently incapacitated inmates; and estab-
lished earned time incentives for good behavior on proba-
tion. In addition, the law required a fiscal impact statement
for any future legislation that would establish a new offense
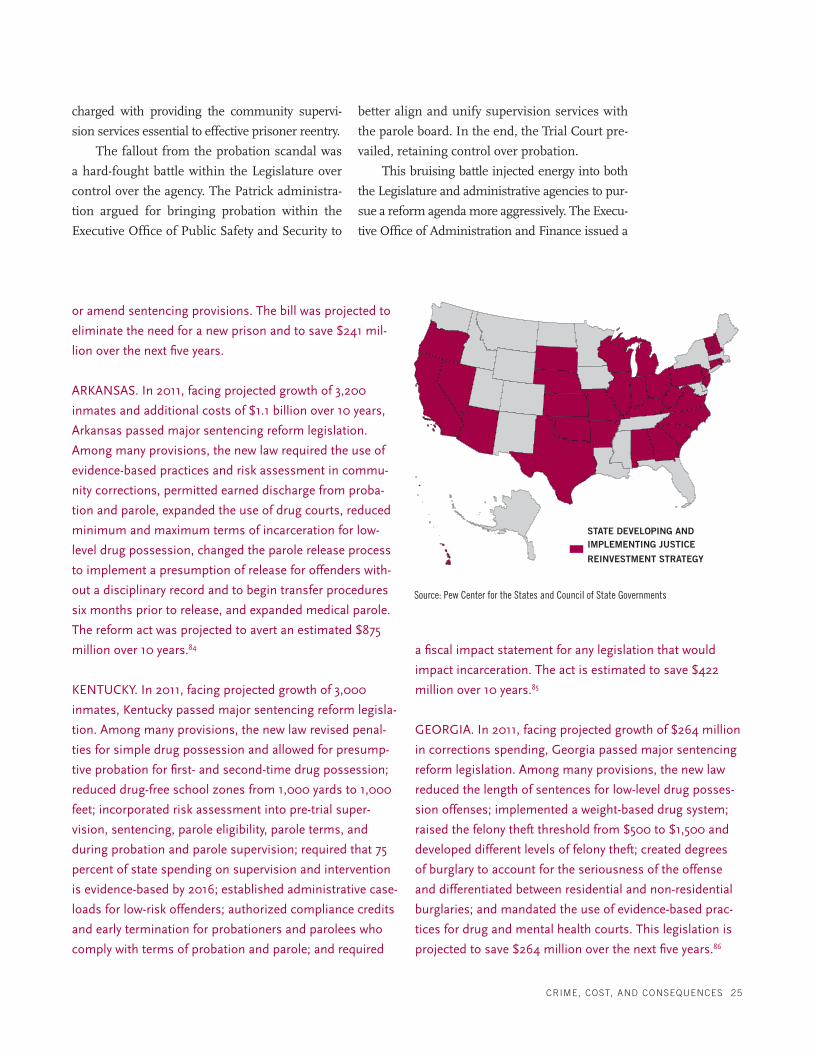
CRIME, COST, AND CONSEQUENCES 25
charged with providing the community supervi-
sion services essential to effective prisoner reentry.
The fallout from the probation scandal was
a hard-fought battle within the Legislature over
control over the agency. The Patrick administra-
tion argued for bringing probation within the
Executive Office of Public Safety and Security to
better align and unify supervision services with
the parole board. In the end, the Trial Court pre-
vailed, retaining control over probation.
This bruising battle injected energy into both
the Legislature and administrative agencies to pur-
sue a reform agenda more aggressively. The Execu-
tive Office of Administration and Finance issued a
or amend sentencing provisions. The bill was projected to
eliminate the need for a new prison and to save $241 mil-
lion over the next five years.
ARKANSAS. In 2011, facing projected growth of 3,200
inmates and additional costs of $1.1 billion over 10 years,
Arkansas passed major sentencing reform legislation.
Among many provisions, the new law required the use of
evidence-based practices and risk assessment in commu-
nity corrections, permitted earned discharge from proba-
tion and parole, expanded the use of drug courts, reduced
minimum and maximum terms of incarceration for low-
level drug possession, changed the parole release process
to implement a presumption of release for offenders with-
out a disciplinary record and to begin transfer procedures
six months prior to release, and expanded medical parole.
The reform act was projected to avert an estimated $875
million over 10 years.84
KENTUCKY. In 2011, facing projected growth of 3,000
inmates, Kentucky passed major sentencing reform legisla-
tion. Among many provisions, the new law revised penal-
ties for simple drug possession and allowed for presump-
tive probation for first- and second-time drug possession;
reduced drug-free school zones from 1,000 yards to 1,000
feet; incorporated risk assessment into pre-trial super-
vision, sentencing, parole eligibility, parole terms, and
during probation and parole supervision; required that 75
percent of state spending on supervision and intervention
is evidence-based by 2016; established administrative case-
loads for low-risk offenders; authorized compliance credits
and early termination for probationers and parolees who
comply with terms of probation and parole; and required
a fiscal impact statement for any legislation that would
impact incarceration. The act is estimated to save $422
million over 10 years.85
GEORGIA. In 2011, facing projected growth of $264 million
in corrections spending, Georgia passed major sentencing
reform legislation. Among many provisions, the new law
reduced the length of sentences for low-level drug posses-
sion offenses; implemented a weight-based drug system;
raised the felony theft threshold from $500 to $1,500 and
developed different levels of felony theft; created degrees
of burglary to account for the seriousness of the offense
and differentiated between residential and non-residential
burglaries; and mandated the use of evidence-based prac-
tices for drug and mental health courts. This legislation is
projected to save $264 million over the next five years.86
STATE DEVELOPING AND IMPLEMENTING JUSTICE
REINVESTMENT STRATEGY
Source: Pew Center for the States and Council of State Governments
26 THE MASSACHUSETTS INSTITUTE FOR A NEW COMMONWEALTH
master plan outlining the capital costs associated
with current policies and practices and the new
facilities that will soon be required in the absence
of overarching reform.
In 2011, the Legislature passed a provision
calling for the formation of a Special Commis-
sion to Study the Criminal Justice System. The
language called for a final report from the com-
mission by March 2012. While the report has not
been issued, in the spring of 2012, Massachusetts
became one of 13 states to join Pew’s Results First
Initiative. Results First is working to advance data-
driven decision-making, and there is hope that it
will lead to a relationship with Pew’s more inten-
sive Public Safety Performance Project.
The data assembled with support from Pew
are also aiding the state in efforts to pioneer the
use of social impact bonds. In May 2010, the Pat-
rick administration issued a Request for Informa-
tion soliciting ideas for how the state could imple-
ment this novel approach, which led to impressive
improvements in the performance of the UK cor-
rections system. In August 2012, Massachusetts
awarded “Pay for Performance” contracts to two
organizations, one working to reduce recidivism
among youth. When these contracts are finalized,
Massachusetts will become the first state to use
social innovation financing. Taken to scale, this
model could become its own variant of Justice
Reinvestment.
While these developments within the Legis-
lature and executive branch are noteworthy and
encouraging, the debate leading up to the passage
of the 2012 Three Strikes Bill shows that criminal
justice policy is still heavily politicized. The focus
for this legislative effort was taking away judicial
discretion for cases involving a very small num-
ber of violent habitual offenders. Reformers were
able to win reductions in mandatory minimums
for drug offenders. However, this improvement
aside, the larger takeaway is that in contrast to suc-
cessful Justice Reinvestment efforts in other states,
the package was not built around hard data and a
consensus that systemic reforms were needed to
reduce costs and enhance public safety.
CRIME, COST, AND CONSEQUENCES 27
Is it time to get smart on crime? The transition
to a Justice Reinvestment–style approach calls for
political leadership that fully embraces the model.
This commitment is necessary to achieve the real-
location of resources required.
Across all levels and branches of Massachu-
setts’s criminal justice system, there are many
hard-working practitioners hungry for change.
The makeup of the Coalition is reflective of the
energy for a new approach that can be found in
state and county corrections, the judiciary, and
Probation and Parole, as well as among prosecu-
tors and the defense bar. These experts recognize
the opportunity Justice Reinvestment affords to
hold offend ers accountable, while reducing cor-
rectional costs and enhancing public safety.
With the release of this report, the Coalition
seeks to build and demonstrate consensus among
the public that now is the time to get smart on
crime, giving our elected leaders a mandate to
implement the recommendations outlined below,
following the four core principles of the Justice
Reinvestment model:
1.AFocusonIndividualsMostLikelytoReoffend• Place a moratorium on the expansion of state and
county prisons. The Coalition calls for a morato-
rium on the expansion of state and county pris-
ons until Massachusetts has fully embraced and
implemented Justice Reinvestment–style reform.
The moratorium will signal a commitment to
ensure that future investment of the state’s finite
public safety resources is grounded in rigorous
cost-benefit analysis.
• Standardize data systems and reporting protocols,
and funnel information to a central research cen-
ter. Weak information systems need an upgrade
before Massachusetts can successfully transition
to the Justice Reinvestment model. Currently, each
agency uses a different data system, which makes it
difficult to analyze offender outcomes. While agen-
cies must have tools suited to their unique popu-
lations, data systems should be compatible to the
greatest extent possible and standards must be in
place for capturing common metrics. For a $1.2 bil-
lion operation carrying out a critical public safety
function, the capacity for data analysis is severely
underdeveloped throughout the system. The coali-
tion believes the Department of Correction should
have the resources and the mandate to standard-
ize, collect, and synthesize data from state prisons,
county Houses of Correction, the Parole Board, and
Probation.
• Empower the Sentencing Commission to revisit
the state’s approach to sentencing and sanctions.
Allocating resources between agencies and across
the branches of government that make up the
criminal justice system is extremely challenging.
Many states use sentencing commissions to assist
the legislature in making these decisions. Sen-
tencing commissions can develop guidelines that
promote consistency and fairness, while estab-
lishing priorities for the use of limited resources to
manage population growth. In addition to criminal
offenses, sentencing commissions have been given
broad powers in several states to issue guidelines
for juvenile offenders, intermediate sanctions, mis-
demeanors, probation revocation, and the granting
of parole.87
By comparison, the Massachusetts Sentenc ing
Commission has relatively limited authority. The
Legislature has never given the guidelines it has
produced the force of law, and there is no mandate
III. REINVENTING JUSTICE IN MASSACHUSETTS TO REDUCE COST AND ENHANCE PUBLIC SAFETY
the coalition calls for a moratorium on the expansion of
state and county prisons
28 THE MASSACHUSETTS INSTITUTE FOR A NEW COMMONWEALTH
to analyze the implications of sen tencing guidelines
relative to the allocation of system resources. As
such, the Commission’s guidelines have not been
updated since they were first introduced in 1996.
With new tools to analyze the risk posed by
offenders and new research providing a more
nuanced understanding of what works, the role
and responsibility of the state’s sentencing com-
mission should be reexamined. In addition to
more efficient allocation of resources, con necting
the administration of justice to hard data will pro-
vide new ways to assess fairness and bet ter under-
stand challenges like racial and ethic disparities.
Toward this end:
• Governor Patrick should reconstitute the
Sentencing Commission and appoint new
members to fill vacancies. This revitalized
body could then be tasked with updating
the sentencing guidelines.
• Concurrently, the Legislature could signal
engagement in this process by including
language in the FY 2014 budget calling for
the completion of the update within one
year, and providing the Commission with a
small line item to support this work.
• Upon completion, provide training on the
goals of the new sentencing guidelines and
efforts to improve community supervision
for all judges and prosecutors.
2.ProgramsBasedonScienceandEffortstoEnsureQualityImplementation• Complete an extensive survey of conditions of
confinement, programming, and program qual-
ity across the system. From prison education to
cognitive behavioral therapy, research demon-
strates specific interventions that, with a carefully
specified dose to a specific population, produce
benefits for taxpayers that outweigh the costs.88
As a starting point, leaders must know the extent
to which these models are administered in Mas-
sachusetts corrections agencies according to the
standards outlined in the literature. (In the prep-
aration of this report, efforts were made to collect
these data from both the Department of Correc-
tion and Houses of Correction. This information
was largely unavailable.)
In addition to understanding the availability
of evidence-based programming, more informa-
tion about the barriers to participation is critical.
Others have cataloged the statutes and policies
that prohibit certain classes of offenders from
receiving services.89 In light of recent reforms,
this analysis requires updating. Decision mak-
ers will also need to know more about how these
laws and policies interact with overcrowding and
physical constraints to limit the availability of
programming, particularly for female offenders
and other special populations.
• Understand how the state’s corrections system
can be oriented toward Justice Reinvestment and
develop a strategy to build a culture of data-driven
decision-making with the agencies. Research on the
adoption of evidence-based practices by the Crime
and Justice Institute documents how moving
toward the Justice Reinvestment model requires a
change in agency culture at each level of the organi-
zation.90 From frontline workers to agency leaders,
all involved must embrace a data-driven approach.
Justice Reinvestment calls for an environment in
which employees are eager to focus their efforts
on interventions that work and all involved are pre-
pared to adjust or abandon practices that are not
delivering results. Taking careful stock of the cul-
ture within and between agencies at the outset, and
building buy-in throughout these organizations as
reform efforts unfold, will be an important comple-
ment to any effort to legislate change.
3.EffectiveCommunitySupervisionPoliciesandPractices• Expand the use of community supervision and
pre-release. The Coalition believes prisoners should
generally be released with supervision. “Presump-
tive parole” is one model that leading states are

CRIME, COST, AND CONSEQUENCES 29
adopting: In the absence of special circumstances,
prisoners are released under parole supervision
when they are eligible in order to facilitate their
successful re-integration into society.
Within a presumptive parole policy, Massa-
chusetts must place particular focus on provid-
ing post-release supervision for those most likely
to reoffend. Reorienting the state’s approach to
reentry so that resources are targeted toward
these high-risk inmates will require a significant
shift in policy and practice. Currently, many high
risk inmates are barred from pre-release facili-
ties by both statute and regulation. In addition
to reducing recidivism, efforts to address this
conflict could result in significant cost savings
in both capital and annual operating budgets, as
documented in the Executive Office of Admin-
istration and Finance master plan. While recent
legislative reform has started to address this
challenge, a full reorientation will require a sys-
temic approach.
Overtime, as the state shifts to a data-driven
approach to parole, additional research will help
determine the best mechanism for ensuring
cost-effective post-release supervision of offend-
ers returning to the community.
• Clearly delineate responsibility for all post-release
supervision to the Parole Board and pretrial and
diversion to the Probation Department. Over-
lapping responsibility for supervising offenders
returning to communities from state and county
facilities reduces efficiency and accountability. To
address this problem, Governor Patrick called for
combining parole and probation under a new office
of Community Supervision within the executive
branch. This restructuring was estimated to reduce
costs by $40 million to $50 million annually, and
improve coordination to enhance public safety.91
While the administration’s proposal ultimately
failed, the Probation Department has introduced
reforms that reduce the need for urgent change.
However, as Massachusetts reinvents cor-
rections, tightening accountability for providing
supervision to offenders leaving secure facilities
is critical. The majority of the Probation Depart-
Summary of the Massachusetts Criminal Justice Reform Coalition’s Recommendations
SHORT-TERM • Place a moratorium on the expansion of state and county prisons until Massachusetts has fully implemented Justice Reinvestment–style reform.
• Reconstitute the Massachusetts Sentencing Commission and task the body with presenting updated sentencing guidelines within one year.
• Partner with local officials to plan integrated reentry programs for the state’s 10 largest urban centers.
• Assess conditions of confinement, programming, and program quality across all components of the system and subpopulations served.
MEDIUM-TERM • Give the Department of Correction resources and a mandate to standardize, collect, and synthesize data from county Houses of Correction, the Parole Board, and Probation.
• Provide training on the goals of the new sentencing guidelines and efforts to improve community supervision for all judges and prosecutors.
• Use new data tools to increase our understanding of racial and ethnic disparities in incarceration.
LONG-TERM • Clearly delineate responsibility for all post-release supervision to the Parole Board and pretrial and diversion to the Probation Department
• Expand the use of community supervision and pre-release for those most likely to reoffend.
30 THE MASSACHUSETTS INSTITUTE FOR A NEW COMMONWEALTH
ment’s effort involves pretrial services and the
supervision of probationers serving suspended
sentences in the community. Keeping these func-
tions within the jurisdiction of the courts is logical,
just as it makes sense to ensure that all post-incar-
ceration supervision is integrated with the work of
the Parole Board.
The Coalition recommends separating the
parole and probation functions, clearly delineating
responsibility for all post-release supervision to the
Parole Board and pretrial and diversion to the Pro-
bation Department. The Coalition recognizes that if
sentencing guidelines are reinvigorated and more
high-risk offenders receive post-release supervi-
sion (as outlined above), judges will no longer feel
compelled to include “from and after” probation
terms to ensure that some form of supervision is
provided. But improving reentry is the core of the
Justice Reinvestment strategy. If the Legislature
does not place post-release supervision under one
agency, the delivery of these services would need
to be strengthened across two agencies, duplicating
the challenging task associated with better manag-
ing risk and reducing recidivism.
4.Place-BasedStrategies• Make Boston’s Emergency Reentry Program a
model for other urban centers. Half of state inmates
released to the street return to just 10 cities. To
reduce the impact that these offenders have on the
communities that receive them, each of these cities
needs an integrated reentry program that brings law
enforcement and human service providers together
with corrections officials to manage the risk posed
by the most disruptive offenders. The Emergency
Reentry program being developed in Boston as a
result of the crisis at the state Crime Lab should be
fully funded. The approach should then be care-
fully documented, researched, and replicated in
cities that receive a highly disproportionate share of
inmates returning from state and county facilities.
THE COALITION’S COMMITMENT Delivering on the formula outlined above is a com-
plicated undertaking requiring a high degree of
focus over an extended period. The Massachusetts
Criminal Justice Reform Coalition is committed to
providing leadership and support throughout this
process. In the months ahead, the Coalition will:
• Issue a number of policy briefs, drilling
down further into the themes raised in
this framing report, such as the availabil-
ity of programming and program quality
and conditions of confinement for female
offenders and other subgroups.
• Publish public opinion data, updating sur-
vey work from 1997 and 2005 to provide a
sharper understanding of how voter per-
ception on these issues has evolved.
• Convene criminal justice leaders from around
the country to learn more about innovative
Justice Reinvestment models.
• Host a series of public events across the Com-
monwealth to elevate the topic and engage
the community in the effort to reinvent the
state’s criminal justice policies.
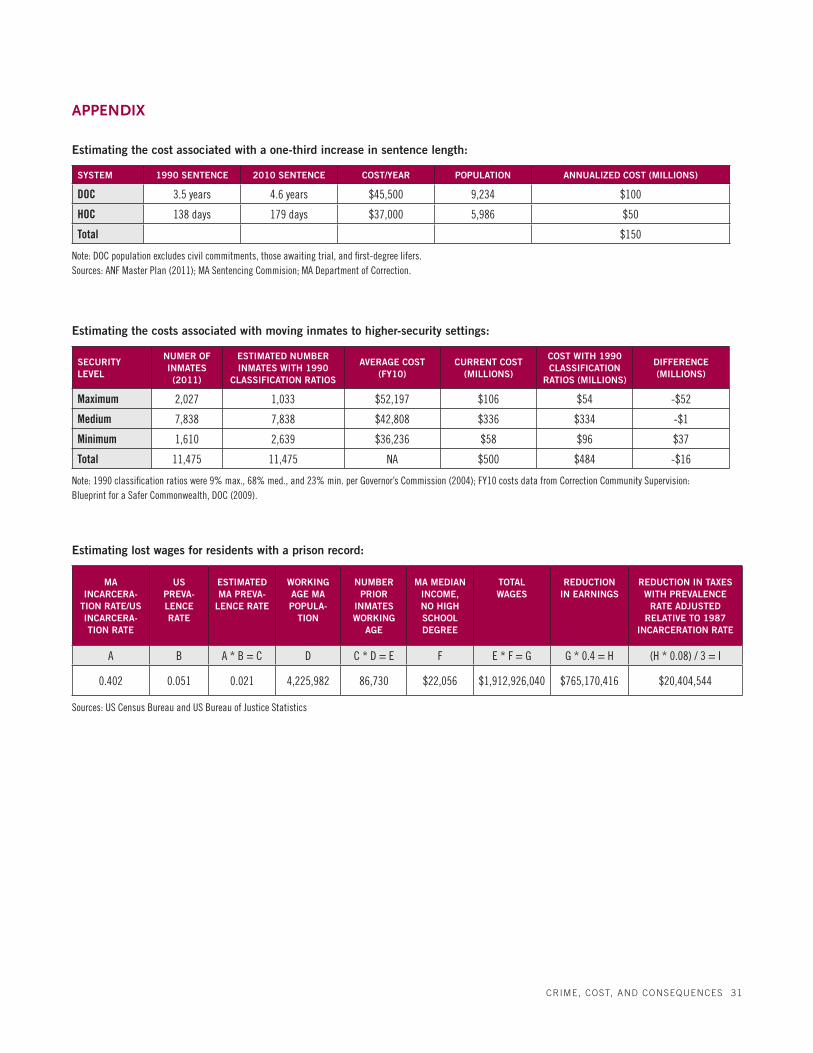
CRIME, COST, AND CONSEQUENCES 31
APPENDIX
Estimating the cost associated with a one-third increase in sentence length:
SYSTEM 1990 SENTENCE 2010 SENTENCE COST/YEAR POPULATION ANNUALIZED COST (MILLIONS)
DOC 3.5 years 4.6 years $45,500 9,234 $100
HOC 138 days 179 days $37,000 5,986 $50
Total $150
Note: DOC population excludes civil commitments, those awaiting trial, and first-degree lifers. Sources: ANF Master Plan (2011); MA Sentencing Commision; MA Department of Correction.
Estimating the costs associated with moving inmates to higher-security settings:
SECURITY LEVEL
NUMER OF INMATES (2011)
ESTIMATED NUMBER INMATES WITH 1990
CLASSIFICATION RATIOS
AVERAGE COST (FY10)
CURRENT COST (MILLIONS)
COST WITH 1990 CLASSIFICATION
RATIOS (MILLIONS)
DIFFERENCE (MILLIONS)
Maximum 2,027 1,033 $52,197 $106 $54 -$52
Medium 7,838 7,838 $42,808 $336 $334 -$1
Minimum 1,610 2,639 $36,236 $58 $96 $37
Total 11,475 11,475 NA $500 $484 -$16
Note: 1990 classification ratios were 9% max., 68% med., and 23% min. per Governor’s Commission (2004); FY10 costs data from Correction Community Supervision: Blueprint for a Safer Commonwealth, DOC (2009).
Estimating lost wages for residents with a prison record:
MA INCARCERA-
TION RATE/US INCARCERA-TION RATE
US PREVA-LENCE RATE
ESTIMATED MA PREVA-
LENCE RATE
WORKING AGE MA POPULA-
TION
NUMBER PRIOR
INMATES WORKING
AGE
MA MEDIAN INCOME, NO HIGH SCHOOL DEGREE
TOTAL WAGES
REDUCTION IN EARNINGS
REDUCTION IN TAXES WITH PREVALENCE
RATE ADJUSTED RELATIVE TO 1987
INCARCERATION RATE
A B A * B = C D C * D = E F E * F = G G * 0.4 = H (H * 0.08) / 3 = I
0.402 0.051 0.021 4,225,982 86,730 $22,056 $1,912,926,040 $765,170,416 $20,404,544
Sources: US Census Bureau and US Bureau of Justice Statistics
32 THE MASSACHUSETTS INSTITUTE FOR A NEW COMMONWEALTH
ENDNOTES1 The incarceration rate in Massachusetts rose from 0.17 percent in
1982 to 0.53 percent in 2007. See Jeffrey McLeod. “State Efforts in Sentencing and Corrections Reform” (Washington, DC: National Governor’s Association, 2011). There are no data available to break down the growth in the Massachusetts prison population according to arrest rates, conviction rates, incarceration rates, and time served per offense. Criminal justice policy in Massachusetts has followed the national trend, therefore it is likely that the composition is similar to that of states nationally. For this breakdown, see William Sabol, “Implications of Criminal Justice System Adaptation for Prison Population Growth and Corrections Policy.” Paper presented at the Symposium on Crime and Justice, Albany, NY (2010).
2 Authors’ analysis of FBI Uniform Crime Reports, 1990-2010.
3 Jenifer Warren and others, “One in 100: Behind Bars in America 2008” (Washington, DC: Pew Center for the States, 2008).
4 “A System Master Plan for Massachusetts Corrections” (Boston, MA: Executive Office of Administration and Finance, December 2011).
5 These estimates come form preliminary data assembled by the Pew Results First initiative and presented to the Special Commission to Study the Criminal Justice System on February 25, 2013. Further analysis of the DOC cohort found that for 60 percent of the recidivists, the new crime was either a misdemeanor or a felony property offense.
6 While conducting research for this report, many cited innovative reentry efforts currently underway in Barnstable, Essex, Middlesex, Hampden, and Suffolk Counties.
7 Tubby Harrison, “Criminal Justice in Massachusetts: The Public’s View” (Boston, MA: MassINC, 1997); Cheryl Roberts and others, “Rethinking Justice in Massachusetts: Public Attitudes toward Crime and Punishment” (Boston, MA: Boston Foundation, 2005).
8 See Steven Levitt, “Understanding Why Crime Fell in the 1990s: Four Factors That Explain the Decline and Six That Do Not,” The Journal of Economic Perspectives, 18(1) (2004).
9 Franklin E. Zimring, The Great American Crime Decline (New York, NY: Oxford University Press, 2007).
10 Steven Meesner and others, “Cross National Homicide Trends in the Latter Decades of the Twentieth Century: Losses and Gains in Insti-tutional Control?” in Control of Violence: Historical and International Perspectives on Violence in Modern Societies, edited by Wilhelm Heitmeyer and others, (New York, NY: Springer Science+Business Media, 2011); Manuel Eisner, “Modernity Strikes Back? A Historical Perspective on the Latest Increase in Interpersonal Violence (1960-1990),” Journal of Conflict and Violence 2 (2008).
11 Christopher Hartney, “US Rates of Incarceration: A Global Perspective” (Oakland, CA: National Council on Crime and Delinquency, 2006).
12 For an excellent review of the literature, Eric Baumer and Kevin Wolff, “Evaluating Contemporary Crime Drop(s) in America, New York City, and Many Other Places,” Justice Quarterly (2012).
13 See Judith Greene, “Getting Tough on Crime: The History and Political Context of Sentencing Reform Developments Leading to the Passage of the 1994 Crime Act,” in Sentencing and Society: International Perspectives, Cyrus Tata and Neil Hutton, editors (Hampshire, England: Ashgate Publishing Limited, 2002).
14 Kevin Cullen, “Strict New Drug Law a Puzzle to Authorities,” The Boston Globe (September 10, 1988).
15 Massachusetts Session Laws 2012. Chapter 192, “An Act Relative to Sentencing and Improving Law Enforcement Tools.” For contrast with the national Justice Reinvestment model, see Marshall Clement and others, “The National Summit on Justice Reinvestment and Public Safety” (New York, NY: Council of State Governments Justice Center, 2011).
16 The 30-month ceiling on House of Correction sentences is for each individual conviction. With convictions on multiple charges, offenders can be sentenced to longer than 30 months in a House of Correction.
17 See “Time Served: The High Cost, Low Return of Longer Prison Terms” (Washington, DC: Pew Center on the States, 2012).
18 For example, the share of offenders serving time for violent offenses has not changed over the last two decades.
19 According to the Executive Office of Administration and Finance’s recent master plan, the HOCs house approximately 1,000 federal inmates. Removing these from the 2012 count still yields an 85 percent increase over 1990 levels. The end of the Concord Reforma-tory Sentence may partially explain the disproportionate increase at HOCs. Without the option to send prisoners to a DOC facility with an indeterminate sentence, judges often sentence offenders to serve multiple “from and after” sentences at HOCs where they are more likely to parole.
20 The study attributes this growth to both longer sentences and inmates serving a larger portion of their sentence. See Natasha Frost and others, “Recidivism among Inmates Released from the Billerica House of Correction” (Boston, MA: Northeastern University, 2009).
21 Pew Center on the States (2012).
22 These are average cost figures as opposed to lower marginal cost estimates for additional bed space in existing facilities. Average cost is appropriate here because the numbers involved are large enough that policy change leads to bringing entire facilities in and out of service. Also note that this estimate excludes offenders serving life without parole sentences. While these inmates are also serving more years due to increases in life expectancy, this is not a matter of sentencing policy.
23 Pew Center on the States (2012).
24 Daniel Feagans and Hollie Matthews, “Analysis of General Recidivism Risk Score Levels” (Milford, MA: Massachusetts Department of Cor-rection, September 2012).
25 Linda Holt, “A Statistical Description of Residents of Massachusetts Correctional Institutions on January 1, 1990” (Milford, MA: Massachu-setts Department of Correction, 1990).

CRIME, COST, AND CONSEQUENCES 33
26 Karyn Rautenberg, “Offense Categories: An Analysis of the 2011 New Court Commitments and the Snapshot Population on January 1, 2012” (Milford, MA: Massachusetts Department of Correction, 2012).
27 Ilyana Kuziemkoa and Steven D. Levitt, “An empirical analysis of imprisoning drug offenders,” Journal of Public Economics 88(9–10) (2004).
28 Cassia Spohn and David Holleran, “The Effect of Imprisonment on Recidivism Rates of Felony Offenders: A Focus on Drug Offenders,” Criminology 40 (2) (2002).
29 Ashley Nellis, “Throwing Away the Key: The Expansion of Life without Parole Sentences in the United States,” Federal Sentencing Reporter 23(1) (2010).
30 See John Tierney, “For Lesser Crimes, Rethinking Life Behind Bars,” The New York Times (December 11, 2012); Tom Ashbrook, “The Cost of Prison,” On Point (February 20, 2013).
31 “2010 Annual Report” (Milford, MA: Massachusetts Department of Correction, 2011).
32 Bed count provided in email correspondence with the Massachusetts Department of Correction.
33 See Governor’s Commission on Corrections Reform, Strengthening Public Safety, Increasing Accountability and Instituting Fiscal Disci-pline in the Department of Correction (Boston, MA: Executive Office of Public Safety, June 2004). This report also notes statutory and policy restrictions that prevent certain offenders from transitioning down. Recent reforms have at least partially addressed this constraint.
34 Rhiana Kohl and others, “2011 Prison Population Trends” (Milford, MA: Massachusetts Department of Correction, 2012).
35 Kohl and others (2012).
36 Keith Chen and Jesse Shapiro, “Do Harsher Prison Conditions Reduce Recidivism? A Discontinuity-based Approach,” American Law and Economics Review 9(1) (2007).
37 Authors’ email correspondence with the Parole Board.
38 Lisa Brooks and others, “Prisoner Reentry in Massachusetts” (Washington, DC: Urban Institute); Michael White, “Statistical Tables Describing the Background Characteristics and Recidivism Rates for Releases from Massachusetts Correctional Facilities” (Boston, MA: Massachusetts Department of Correction, 1993).
39 Between 2006 and 2010, the parole rate for both state and county inmates fell from 69 percent to 58 percent. However, the total number of parole releases grew slightly. In the short term, available data show the 2011 parole crisis has had a dramatic impact on parole releases from DOC facilities. The number of parole releases fell 45 percent from the second quarter of 2010 to the second quarter of 2012. See Massachusetts Parole Board, Annual Statistical Reports, 2006 – 2010; Matthew Moniz, “Current Parole Admission and Release Trends at the Massachusetts Department of Correction” (July 2012).
40 In response to a data request, the Massachusetts Sentencing Commission found that 61 percent of mandatory minimum drug sentences are at the bottom of the sentencing range. “Survey of Sen-tencing Practices FY 2011” (May 2012). Massachusetts Sentencing Commission, “Survey of Sentencing Practices FY 2011” (May 2012).
41 Explaining how this practice developed is difficult but it likely involved a complex combination of forces, including relatively high mandatory minimums, defendants eager to avoid intensive supervi-sion upon release, prosecutors wanting a determinate sentence, and judicial uncertainty around whether parole will be granted.
42 Massachusetts Sentencing Commission, “Survey of Sentencing Prac-tices FY 2011” (May 2012). Massachusetts Sentencing Commission, “Survey of Sentencing Practices FY 2011” (May 2012).
43 Massachusetts Sentencing Commission, “Survey of Sentencing Practices FY 2011” (May 2012).
44 Researchers find that mandatory parolees, the equivalent of a post-release probation order, fare no better than similar offenders released without supervision. See Amy Solomon and others, “Does Parole Work?” (Washington, DC: Urban Institute, 2005).
45 Holt (1990).
46 Daniel LeClair and Susan Guarino-Ghezzi, “Does Incapacitation Guarantee Public Safety? Lessons from the Massachusetts Furlough and Prerelease Programs,” Justice Quarterly 8(1) (1991).
47 Eric Jensen and Gary Reed, “Adult Correctional Education Programs: An Update on Current Status Based on Recent Studies,” Journal of Offender Rehabilitation 44(1) (2007). Laura Winterfield and others, “The Effects of Postsecondary Correctional Education” (Washington, DC: Urban Institute, 2009).
48 James Alan Fox, “CORI reform - too little, too late,” boston.com (May 28, 2010).
49 Governor’s Commission on Corrections Reform (2004).
50 Governor’s Commission on Corrections Reform (2004).
51 Authors’ estimate based on FBI UCR data and estimates published in Kathryn McCollister and others, “The Cost of Crime to Society: New Crime-Specific Estimates for Policy and Program Evaluation,” Drug and Alcohol Dependence 108(1-2) (2010). See appendix for full calculation.
52 Brian Reaves, “Violent Felons in Large Urban Counties,” Bureau of Justice Statistics Special Report (July 2006).
53 Ashley Montgomery and Hollie Matthews, “Recidivism Rates: 2007 Release Cohort” (Milford, MA: Massachusetts Department of Correc-tion, 2012).
54 Ashley Montgomery and Hollie Matthews, “Recidivism Rates: 2006 Release Cohort” (Milford, MA: Massachusetts Department of Correc-tion, 2012).
55 The Pew Center on the States, “State of Recidivism: The Revolving Doors of America’s Prisons,” April 2011.

34 THE MASSACHUSETTS INSTITUTE FOR A NEW COMMONWEALTH
56 Pew Recommends tracking recidivism over a 15-year window to facilitate meaningful cost-benefit analysis. Due to data limitations in Massachusetts, the study went back six years with this initial report.
57 Further analysis of DOC recidivists found that 60 percent of the new charges were for either a misdemeanor or a felony property offense.
58 These preliminary recidivism data from the Pew Results First initia-tive were presented to the Special Commission to Study the Criminal Justice System on February 25, 2013.
59 The corrections budget was largely insulated from cuts, declining by just 8 percent between FY 2002 and FY 2012.
60 Massachusetts Division of Capital Assessment Management, “A Systems Master Plan for Massachusetts Corrections: The Corrections Master Plan - The Final Report” (December 2011).
61 Western and Pettit (2010).
62 This estimate is biased downward by a state incarceration rate estimate that excludes county inmates. A stronger cost-benefit analysis would account for the impact of alternative sanctions that a Justice Reinvestment approach would employ. Research is needed to understand the extent to which these interventions result in lost wages. It should also be noted that prevalence rates will change slowly over time as ex-offenders age out of the workforce.
63 Lauren Glaze and Laura Maruschak, “Parents in Prison and Their Minor Children” (Washington, DC: Bureau of Justice Statistics, 2008).
64 Center for Research on Child Well-Being, “Parental Incarceration and Child Wellbeing in Fragile Families,” Fragile Families Research Brief (Princeton, N.J.: Princeton University, 2008).
65 Amanda Geller and others, “Paternal Incarceration and Support for Children in Fragile Families,” Demography 48(1) (2011).
66 Donald Braman, Doing Time on the Outside: Incarceration and Family Life in Urban America (Ann Arbor, MI: University of Michigan Press, 2004).
67 Leonard Lopoo and Bruce Western, “Incarceration, Marriage, and Family Life” in Punishment and Inequality in America, Bruce Western, editor (New York, NY: Russell Sage, 2006).
68 See Todd Clear, “Imprisoning Communities: How Mass Incarceration Makes Disadvantaged Neighborhoods Worse” (New York, NY: Oxford University Press, 2007).
69 Marc Mauer and Ryan King, “Uneven Justice: State Rates of Incar-ceration by Race and Ethnicity” (Washington, DC: The Sentencing Project, 2007).
70 For a review of studies exploring root causes, see Alex Piquero, “Dis-proportionate Minority Contact,” The Future of Children 18(2) (2008).
71 Bruce Western, Punishment and Inequality in America (New York, NY: Russell Sage Foundation, 2006).
72 Robert DeFina and Lance Hannon, “The Impact of Mass Incarceration on Poverty,” Crime and Delinquency (February 23, 2009).
73 Francis Cullen and Paul Gendreau, “Assessing Correctional Reha-bilitation: Policy, Practice, and Prospects” in Policies, Processes, and Decisions of the Criminal Justice System Volume 3 (Washington, DC: US Department of Justice, 2000); Elizabeth Drake and others, “Evidence-Based Public Policy Options to Reduce Crime and Criminal Justice Costs: Implications in Washington State,” Victims and Of-fenders 4 (2009).
74 Clement and others (2011).
75 Governor’s Commission on Corrections Reform (2004).
76 “Implementation of the Major Recommendations for the Governor’s Commission on Corrections Reform” (Boston, MA: Executive Office of Public Safety and Security, 2007).
77 “Prison protest,” The Boston Globe (December 10, 2005).
78 The act banned employers from inquiring about criminal history on application forms. They can request this information in interviews. It also sealed certain criminal and misdemeanor records after set periods.
79 Drug offenses involving violence, a weapon, or children, or directing the activities of another are still excluded from parole consideration before the minimum is served.
80 Judith Greene and Marc Mauer. “Downscaling Prisons – Lesson from Four States” (Washington, DC: The Sentencing Project, 2010).
81 The Sentencing Project, “Downscaling Prisons – Lessons from Four States” (2010).
82 Council on State Governments Justice Center, “Justice Reinvestment State Brief: Texas” (2007).
83 Texas Public Policy Foundation, “Texas Criminal Justice Reform: Lower Crime, Lower Cost” (January 2010).
84 The Pew Center on the States, “Arkansas’s 2011 Public Safety Reform: Legislation to Reduce Recidivism and Curtail Prison Growth” (July 2011).
85 The Pew Center on the States, “2011 Kentucky Reforms Cut Recidivism, Costs. Brad Bill Enacts Evidence-Based Strategies” (July 2011).
86 The Pew Center on the States, “Georgia HB 1176- Summary of Provisions from the Report of the Special Council on Criminal Justice Reform” (March 2012).
87 Richard Frase, “State Sentencing Guidelines: Diversity, Consensus, and Unresolved Policy Issues” Columbia Law Review 105(4) (2005).
88 Elizabeth Drake and others (2009).
89 “Policy and Statutory Restrictions Impact on Inmate Placement” (Milford, MA: Massachusetts Department of Correction, January 2004).
90 See Elyse Clawson and Meghan Guevara, “Putting the Pieces to-gether: Practical Strategies for Adopting Evidence-Based Practices” (Washington, DC: National Institute of Corrections, 2011).
91 “Correcting Community Supervision: Blueprint for a Safer Common-wealth” (Boston, MA: Executive Office of Public Safety and Security, October 2009).

CRIME, COST, AND CONSEQUENCES 35

36 THE MASSACHUSETTS INSTITUTE FOR A NEW COMMONWEALTH

MASSACHUSETTS CRIMINAL JUSTICE REFORM COALITION
MEMBERSTruesee AllahDirector of Boston Reentry Initiative Suffolk County Sheriff’s Department
Jay Ash City Manager City of Chelsea
Michael J. Ashe, Jr. Sheriff Hampden County Sheriff’s Department
Molly BaldwinExecutive Director Roca
Anthony BenedettiChief Counsel Committee for Public Counsel Services Christine M. ColeExecutive Director of Program in Criminal Justice Policy and Management Harvard University Kennedy School of Government
Thomas E. CouryExecutive Director Gardiner Howland Shaw Foundation
Edward DavisCommissioner Boston Police Department
Kathleen M. Dennehy Former CommissionerMassachusetts Department of Correction
Lewis FinferDirector & Organizer Massachusetts Communities Action Network
Thomas H. GreenFormer 1st Assistant Attorney General Managing Director, Infrastructure Group Citigroup
John GrossmanPartner & General Counsel Third Sector Capital Partners
Reverend Dr. Ray HammondPastor Bethel AME Church
Martin W. HealyChief Operating Officer & Chief Legal CounselMassachusetts Bar Association
Lisa M. HewittGeneral Counsel Committee for Public Counsel Services
Tripp JonesManaging DirectorNew Profit Inc.
Albert KanebChairman Barnstable Corporation
Michael B. KeatingPartner & Chair of Litigation Foley Hoag LLP
Brian KyesChief of Police Chelsea Police Department
John LariveeCEO Community Resources for Justice
Edward MurphyCEOThe MENTOR Network
Betsy PattulloFounder & Chair of the Board Beacon Health Strategies LLC
Dean RichlinFormer 1st Assistant Attorney GeneralPartner Foley Hoag LLP
Steven A. TolmanPresident Massachusetts AFL-CIO
Robert TravagliniFormer Massachusetts Senate PresidentFounder & Principal Travaglini, Eisenberg & Kiley
Leo VercollonePresident & CEO VERC Enterprises
Leslie WalkerExecutive Director Prisoners’ Legal Services
Thomas WalshAssociate Dean Boston College Graduate School of Social Work
Bruce WesternProfessor of Sociology Harvard Kennedy School of Government
Michael J. WidmerPresident Massachusetts Taxpayers Foundation
As of March 2013
CO-CHAIRSWayne A. Budd Former US AttorneySenior CounselGoodwin Procter LLP
Kevin BurkeFormer Secretary of Public Safety and SecurityVisiting Professor Endicott College
Max D. SternPartner Stern Shapiro Weissberg & Garin LLPPresident, Massachusetts Association of Criminal Defense Lawyers

11 Beacon Street, Suite 500Boston, MA 02108massinc.org@massinc
union bug
Related Documents