CRESOL NOVOLAC/EPOXY NETWORKS: SYNTHESIS, PROPERTIES, AND PROCESSABILITY by Sheng Lin-Gibson Dissertation submitted to the faculty of the Virginia Polytechnic Institute and State University in partial fulfillment of the requirements for the degree of Doctor of Philosophy in Chemistry Judy S. Riffle, Chair John J. Lesko James E. McGrath Allan R. Shultz Thomas C. Ward 12 April 2001 Blacksburg, Virginia Keywords: Cresol novolac, controlled molecular weight, phenolic, epoxy, structure- property relationships, flame retardance, composite, latent catalyst Copyright 2001, Sheng Lin-Gibson

Welcome message from author
This document is posted to help you gain knowledge. Please leave a comment to let me know what you think about it! Share it to your friends and learn new things together.
Transcript
CRESOL NOVOLAC/EPOXY NETWORKS:SYNTHESIS, PROPERTIES, AND PROCESSABILITY
bySheng Lin-Gibson
Dissertation submitted to the faculty of the Virginia Polytechnic Institute and StateUniversity in partial fulfillment of the requirements for the degree of
Doctor of Philosophyin
Chemistry
Judy S. Riffle, ChairJohn J. Lesko
James E. McGrathAllan R. Shultz
Thomas C. Ward
12 April 2001Blacksburg, Virginia
Keywords: Cresol novolac, controlled molecular weight, phenolic, epoxy, structure-property relationships, flame retardance, composite, latent catalyst
Copyright 2001, Sheng Lin-Gibson
ii
Cresol Novolac/Epoxy Networks:Synthesis, Properties and Processability
Sheng Lin-Gibson
Abstract
Void-free phenolic networks have been prepared by the reaction of phenolic
novolac resins with various diepoxides. The stoichiometric ratio can be adjusted to
achieve networks with good mechanical properties while maintaining excellent flame
retardance. A series of linear, controlled molecular weight, 2,6-dimethylphenol
endcapped cresol novolac resins have been synthesized and characterized. The molecular
weight control was achieved by adjusting the stoichiometric ratio of cresol to 2,6-
dimethylphenol and using an excess of formaldehyde. A dynamic equilibrium reaction
was proposed to occur which allowed the targeted molecular weight to be obtained.
A 2000 g/mol ortho-cresol novolac resin was crosslinked by a diepoxide oligomer
and by an epoxidized phenolic oligomer in defined weight ratios and the structure-
property relationships were investigated. The networks comprised of 60 or 70 weight
percent cresol novolac exhibited improved fracture toughness, high glass transition
temperatures, low water uptake, and good flame retardance. The molecular weights
between crosslinks were also determined for these networks. The stress relaxation moduli
were measured as a function of temperature near the glass transition temperatures.
Crosslink densities as well as the ability to hydrogen bond affect the glassy moduli of
these networks. Rheological measurements indicated that cresol novolac/epoxy mixtures
have an increased processing window compared to phenolic novolac/epoxy mixtures.
Maleimide functionalities were incorporated into cresol novolac oligomers, and
these were crosslinked with bisphenol-A epoxy. The processability of oligomers
containing thermally labile maleimides were limited to lower temperatures. However,
sufficiently high molecular weight oligomers were necessary to obtain good network

iii
mechanical properties. Networks prepared from 1250 g/mol cresol novolac containing
maleimide functionilities and epoxy exhibited good network properties and could be
processed easily.
Latent triphenylphosphine catalysts which are inert at processing temperatures
(~140°C) but possess significant catalytic activity at cure temperatures 180-220°C were
necessary for efficient composite fabrication using phenolic novolac/epoxy matrix resins.
Both sequestered catalyst particles and sizings were investigated for this purpose.
Phenolic novolac/epoxy mixtures containing sequestered catalysts exhibited significantly
longer processing time windows than those containing free catalysts. The resins also
showed accelerated reaction rates in the presence of sequestered catalysts at cure
temperatures. Trihexylamine salt of a poly(amic acid) was sized onto reinforcing carbon
fibers and the composite properties indicated that fast phenolic novolac/epoxy cure could
be achieved in its presence.

iv
Acknowledgements
I would like to dedicate this dissertation to my family; especially my loving
husband Ben, who gave me constant love, support, and encouragement, and my parents
Yin-Nian and Qin who instilled in me the important value of continued education and a
strong work ethic. I am truly blessed to have such wonderful parents who dedicated their
lives to bettering the lives of my brother, Dave, and I.
I am grateful and fortunate to have an incredible committee with a great wealth of
knowledge in polymer science and an undying devotion to the field. I express sincere
gratitude to, and the utter most respect for, my adviser and mentor, Dr. Judy S. Riffle
who opened my eyes to the world of polymer science. She is truly an inspiration to all of
her students as well as a role model for women in science. She has provided me with
both technical and personal guidance throughout my undergraduate and graduate studies.
I am also deeply indebted to Dr. James E. McGrath who constantly provided insight on
various aspects of polymer chemistry, Dr. Allan R. Shultz for his invaluable suggestions
and comments related to my research, Dr. John J. Lesko for his guidance on composite
properties, and Dr. Thomas C. Ward for his suggestions on the physical chemistry aspect
of my research. I would also like to thank the other CASS faculty and staff members,
especially Dr. John Dillard and Dr. Jim Wightman, who gave me the opportunity for
undergraduate research here at Virginia Tech.
I would like to thank my fellow graduate students in the “McGrath” group, the
“Lesko” group, and the “Poly-P-Chem” group, and especially the “Riffle” group, for their
advice and critical suggestions. I am grateful to the “Riffle girls” and Brian Starr with
whom I developed valuable friendships throughout my years at Virginia Tech. I would
particularly like to thank Angie and Mark Flynn for their invaluable assistance. Lastly, I
would like to acknowledge the summer undergraduate students who assisted me in my
research, Michael “Shane” Thompson and Vince Baranauskas.
v
Contents
Abstract............................................................................................................................... iiAcknowledgements............................................................................................................ ivContents...............................................................................................................................vList of Figures ................................................................................................................... ixList of Tables .....................................................................................................................xv1. Introduction................................................................................................................... 12. Literature Review .......................................................................................................... 3
2.1. Introduction............................................................................................................ 32.2. Materials for the synthesis of novolac and resole phenolic oligomers .............. 4
2.2.1. Phenols.............................................................................................................. 42.2.2. Formaldehyde and formaldehyde sources ........................................................ 5
2.3. Novolac resins......................................................................................................... 72.3.1. Synthesis of novolac resins............................................................................... 82.3.2. “High ortho” novolac resins ............................................................................. 92.3.3. Model phenolic oligomer synthesis ................................................................ 112.3.4. Reaction conditions and copolymer effects .................................................... 122.3.5. Molecular weight and molecular weight distribution calculations ................. 152.3.6. Hydrogen bonding .......................................................................................... 192.3.7. Novolac crosslinking with Hexamethylene Tetramine (HMTA) ................... 21
2.3.7.1. Initial reactions of novolacs with HMTA ................................................ 222.3.7.2. Hydroxybenzylamine and Benzoxazine decompositions innovolac/HMTA cures............................................................................................ 27
2.4. Resole resins and networks ................................................................................. 322.4.1. Resole resin syntheses..................................................................................... 32
2.4.2. Crosslinking reactions of resole resins............................................................ 432.4.3. Resole characterization ................................................................................... 452.4.4. Resole network properties............................................................................... 502.4.5. Modified phenol-formaldehyde resins............................................................ 51
2.5. Epoxy/phenol networks ....................................................................................... 522.5.1. Mechanism of the epoxy/phenolic reaction .................................................... 532.5.2. Epoxy phenolic reaction kinetics .................................................................... 552.5.3. Epoxy/phenol network properties ................................................................... 58
2.6. Benzoxazines......................................................................................................... 622.7. Phenolic triazine (PT) resins ............................................................................... 652.8. Thermal and thermo-oxidative degradation ..................................................... 66
3. Controlled Molecular Weight Cresol-Formaldehyde Oligomers............................... 75
vi
3.1. Introduction......................................................................................................... 753.2. Experimental ........................................................................................................ 79
3.2.1. Materials ......................................................................................................... 793.2.2. Molecular Weight Calculations ...................................................................... 793.2.3. Synthesis of 2,6-Dimethylphenol Endcapped Cresol Novolac Resin............. 793.2.4. Sample Preparation for Viscosity Measurements ........................................... 80
3.2. Characterization .................................................................................................. 803.2.1. Nuclear Magnetic Resonance Spectroscopy................................................... 803.2.2. Gel Permeation Chromatography ................................................................... 803.2.3. Viscosity Determinations................................................................................ 81
3.3. Results and Discussion......................................................................................... 813.3.1. Introduction..................................................................................................... 813.3.2. Molecular Weight Control and Calculations .................................................. 833.3.3. Structure of Reaction Intermediates and Products.......................................... 863.3.4. Molecular Weight and Molecular Weight Distributions Determined via GPC................................................................................................................................. 1003.3.5. Dynamic Viscosities of Cresol Novolac Resins ........................................... 104
3.4. Conclusions......................................................................................................... 105Chapter 4. Structure-Property Relationships of Cresol Novolac/Epoxy Networks..... 107
4.1. Introduction........................................................................................................ 1074.1.1. Crosslink density and its affects on network properties ............................... 1074.1.2. Cooperativity................................................................................................. 1124.1.3. Thermal and thermo-oxidative stability of novolac/epoxy networks ........... 116
4.2. Experimental ...................................................................................................... 1204.2.1. Materials ....................................................................................................... 1204.2.2. Methods......................................................................................................... 120
4.2.2.1. Preparation of ortho-cresol novolac networks cured with epoxies........ 1204.2.2.2. Sample preparation for viscosity determinations................................... 1214.2.2.3. Network formation of phenolic control ................................................. 121
4.2.3. Characterization ............................................................................................ 1214.2.3.1. Resin glass transition temperatures........................................................ 1214.2.3.2. Network glass transition temperatures................................................... 1214.2.3.3. Critical stress intensity factor, KIC ......................................................... 1224.2.3.4. Sol/gel fraction separation ..................................................................... 1234.2.3.5. 1H NMR sol fraction characterization.................................................... 1234.2.3.6. Room temperature density measurements ............................................. 1244.2.3.7. Determination of coefficient of thermal expansion (α) ......................... 1244.2.4.8. Rubbery moduli determination via creep tests....................................... 1244.2.3.9. 10sec relaxation moduli determination via stress relaxation tests ......... 1254.2.3.10. Flame retardance measured via cone calorimeter ................................ 1264.2.3.11. Thermal and thermo-oxidative degradation......................................... 1264.2.3.12. Viscosity measurements....................................................................... 1274.2.3.13. Equilibrium moisture uptake................................................................ 127
vii
4.2.3.14. Kinetic studies via DSC....................................................................... 1284.2.3.15. Flexural strength and moduli of composites........................................ 128
4.3. Results and Discussion....................................................................................... 1294.3.1. Properties of ortho-cresol novolac/epoxy networks ..................................... 129
4.3.1.1. Network formation and characterization ............................................... 1294.3.1.2. Master curves and cooperativity ............................................................ 1374.3.1.3. Thermal and thermo-oxidative stability................................................. 1424.3.1.4. Flame results .......................................................................................... 1444.3.1.5. Water absorption and diffusion efficient ............................................... 1464.3.1.6. Reaction kinetics.................................................................................... 1484.3.1.7. Processability ......................................................................................... 151
4.3.2. Composites properties................................................................................... 1564.3.3. Para-cresol based networks and their properties.......................................... 157
4.4. Conclusions......................................................................................................... 1595. Maleimide Containing Cresol Novolac Networks and Their Properties ................. 161
5.1. Introduction........................................................................................................ 1615.2. Experimental ...................................................................................................... 166
5.2.1. Reagents........................................................................................................ 1665.2.2. Synthetic Methods ........................................................................................ 166
5.2.2.1. Synthesis of 4-Hydroxyphenylmaleimide (4-HPM).............................. 1665.2.2.2. Synthesis of 2-hydroxy-5-methylphenylmaleimide............................... 1675.2.2.3. Synthesis of 2,6-dimethylphenol endcapped o-cresol-co-HPM novolacoligomers............................................................................................................. 1675.2.2.4. Synthesis of cresol novolacs with 2-Hydroxy-5-methylphenylmaleimideendgroups............................................................................................................ 169
5.2.3. Characterization ............................................................................................ 169
5.3. Results and Discussion....................................................................................... 1695.3.1. 4-Hydroxyphenylmaleimide synthesis and characterization ........................ 1695.3.2. Cresol-co-HPM novolac oligomers and their properties .............................. 1725.3.3. Cresol-co-HPM novolac/epoxy network properties ..................................... 1735.3.4. Characterization of 2-Hydroxy-5-methylphenylmaleimide.......................... 178
5.4. Conclusions......................................................................................................... 1806. Latent Initiators for Novolac/Epoxy Cure Reactions .............................................. 181
6.1. Introduction........................................................................................................ 1816.2. Experimental ...................................................................................................... 190
6.2.1. Materials ....................................................................................................... 1906.2.2. Methods......................................................................................................... 196
6.2.2.1. Melt mixing of phenolic novolac/epoxy resins...................................... 1966.2.2.2. Preparation of polymer/TPP sequestered catalysts ................................ 1976.2.2.3. Synthesis of Poly(arylene ether phosphine oxide)................................. 1976.2.2.4. Reduction of Poly(arylene ether phosphine oxide)................................ 1996.2.2.5. Synthesis of Ultem type poly(amic acid)............................................... 199
viii
6.2.2.6. Preparation of Ultem type poly(amic acid) salt with TTMPP ............... 2016.2.2.7. Synthesis of FDA/BPDA based poly(amic acid) salts........................... 201
6.2.3. Characterization ............................................................................................ 2026.2.3.1. Differential scanning calorimetry (DSC)............................................... 2026.2.3.2. Viscosity measurements......................................................................... 2036.2.3.4. 1H NMR ................................................................................................. 2036.2.3.5. 31P NMR ................................................................................................ 2036.2.3.6. Scanning electron microscopy ............................................................... 2046.2.3.7. Thermogravimetric analysis................................................................... 204
6.2.4. Composite preparation and testing methods ................................................. 2046.2.4.1. Synthesis of Ultem type poly(amic acid) salt with trihexylamine......... 2046.2.4.2. Sizing of carbon fiber............................................................................. 2056.2.4.3. Hot-melt prepregging and composite fabrication .................................. 2066.2.4.4. Composite fiber volume fraction ........................................................... 2076.2.4.5. Kinetic studies of novolac/epoxy reaction with trihexylamine.............. 2086.2.4.6. Flexural properties ................................................................................. 2086.2.4.7. Tensile testing ........................................................................................ 2096.2.4.8. Mode II Toughness (GIIC) ...................................................................... 210
6.3. Results and Discussion....................................................................................... 2126.3.1. Miscible polyimide/TPP sequestered catalysts............................................. 213
6.3.1.1. Effect of TPP on the glass transition temperatures of the blends .......... 2136.3.1.2. Particle formation and characterization ................................................. 2146.3.1.3. Processing windows and cure times ...................................................... 2156.3.1.4. Surface and cross-section morphologies of the catalyst particles.......... 220
6.3.2. Udel/TPP sequestered catalysts .................................................................. 2226.3.2.1. Blend Composition ................................................................................ 2226.3.2.2. Processing windows and cure times ...................................................... 2236.3.2.3. SEM of Udel/TPP Sequestered catalysts ............................................... 224
6.3.3. Partially reduced poly(arylene ether phosphine oxide)s............................... 2256.3.3.1. Reduction of P(AEPO) .......................................................................... 2256.3.3.2. Processing windows and cure times ...................................................... 227
6.3.4. Poly(amic acid) salts ..................................................................................... 2296.3.5. Processability of a lower molecular weight phenolic novolac mixed withepoxy....................................................................................................................... 2356.3.6. Properties of poly(amic acid)/trihexylamine salt sized carbon fiber reinforcednovolac/epoxy composites ...................................................................................... 237
6.3.6.1. Reaction Kinetics ................................................................................... 2376.3.6.2. Flexural properties ................................................................................. 2396.3.6.2. Mode II toughness.................................................................................. 2406.3.6.3. Quasistatic tensile properties ................................................................. 241
6.4. Conclusions......................................................................................................... 2427. Conclusions ................................................................................................................ 2448. Recommendation for Future Work ........................................................................... 248
ix
List of Figures
Figure 2. 1. Preparation of phenol monomer ...................................................................... 5Figure 2. 2. Synthesis of formaldehyde .............................................................................. 6Figure 2. 3. Formation of hemiformals............................................................................... 6Figure 2. 4. Depolymerization of aqueous polyoxymethylene glycol ................................ 7Figure 2. 5. Synthesis of hexamethylenetetramine ............................................................. 7Figure 2. 6. Mechanism of novolac synthesis via electrophilic aromatic substitution ....... 8Figure 2. 7. Byproducts of novolac synthesis ..................................................................... 9Figure 2. 8. High ortho novolacs ...................................................................................... 10Figure 2. 9. Proposed chelate structures in the synthesis of high ortho novolac oligomers
....................................................................................................................... 10Figure 2. 10. Intramolecular hydrogen bonding of high ortho novolacs ....................... 11Figure 2. 11. Selective ortho coupling reaction using bromomagnesium salts.............. 11Figure 2. 12. Synthesis of model phenolic compound ................................................... 12Figure 2. 13. Initial reaction of novolac and HMTA via a hydrogen bonding mechanism
................................................................................................................... 23Figure 2. 14. Decomposition of HMTA......................................................................... 24Figure 2. 15. Possible reaction intermediates for reaction of 2,4-xylenol with HTMA. 26Figure 2. 16. Thermal decomposition of hydroxybenzylamine ..................................... 27Figure 2. 17. Thermal decomposition of benzoxazine ................................................... 28Figure 2. 18. Reaction of benzoxazines and 2,4-xylenol ............................................... 28Figure 2. 19. Reaction pathways for formation of ortho-ortho, ortho-para, and para-
para through the reaction of para-trishydroxybenzylamine and 2,4-xylenol........... 30Figure 2. 20. Mechanism of resole synthesis ................................................................. 33Figure 2. 21. Reaction pathways for phenol/formaldehyde reactions under alkaline
conditions.................................................................................................................. 33Figure 2. 22. Condensation of hydroxymethyl groups................................................... 34Figure 2. 23. Dehydration of methylols or benzylic ethers to form quinone methides.. 35Figure 2. 24. Resonance of quinone methides................................................................ 35Figure 2. 25. Dimer and trimer structures of ortho quinone methides ........................... 36Figure 2. 26. Quinoid resonance forms activating the para ring position...................... 37Figure 2. 27. Preferential formation of para quinone methides ..................................... 40Figure 2. 28. Reactions of a quinone methide with a hydroxymethyl substituted
phenolate ................................................................................................................... 41Figure 2. 29. Reaction mechanism of phenol and formaldehyde using base catalyst
involving the formation of chelate............................................................................ 42Figure 2. 30. Ethane and ethene linkages derived from quinone methide structures..... 44Figure 2. 31. Reaction of hydroxymethylphenol and urea ............................................. 51Figure 2. 32. Reaction of hydroxymethylphenol and melamine .................................... 52Figure 2. 33. Reaction of phenol and epichlorohydrin to form epoxidized novolacs .... 53Figure 2. 34. Mechanism for the triphenylphosphine catalyzed phenol/epoxy reaction 54Figure 2. 35. Proposed mechanism for tertiary amine catalyzed phenol/epoxy reaction55Figure 2. 36. Network formation of phenolic novolac and epoxy.................................. 58
x
Figure 2. 37. Diepoxide structures: (1) bisphenol-A based diepoxide, (2) brominatedbisphenol-A based diepoxide, and (3) siloxane diepoxide ...................................... 59
Figure 2. 38. Synthesis of bisphenol-A based benzoxazines ......................................... 63Figure 2. 39. Reaction of benzoxazines with free ortho positions on phenolic
compounds ................................................................................................................ 64Figure 2. 40. Synthesis of phenolic triazine resins......................................................... 65Figure 2. 41. Dehydration of hydroxyl groups............................................................... 67Figure 2. 42. Thermal crosslinking of phenolic hydroxyl and methylene linkages ....... 67Figure 2. 43. Thermal bond rupture: a) fragmentation reaction b) oxidation degradation.
................................................................................................................... 68Figure 2. 44. Oxidation degradation on methylene carbon ............................................ 69Figure 2. 45. Formation of benzenoid species................................................................ 69Figure 2. 46. Decomposition via phenoxy radical pathways ......................................... 70Figure 2. 47. Condensation of ortho hydroxyl groups ................................................... 71Figure 2. 48. Char formation .......................................................................................... 71Figure 2. 49. Decomposition of tribenzylamine............................................................. 72
Figure 3. 1. Mechanism for the major process of phenolic novolac resin synthesis ...... 76Figure 3. 2. Synthesis of 2,6-dimethylphenol endcapped para-cresol novolac resins... 82Figure 3. 3. 13C NMR spectra monitoring a 2000g/mol ortho-cresol novolac resin
synthesis as a function of reaction time. The product was reacted for 24 hours at100°C, then heated to 200°C under mild vacuum to decompose the catalyst. ......... 89
Figure 3. 4. Condensation of ortho-hydroxymethyl substituent forming stable ortho-linked dimethylene ethers ......................................................................................... 90
Figure 3. 5. Expanded 13C NMR spectra monitoring a 2000 g/mol ortho-cresol novolacresin synthesis as a function of reaction time ........................................................... 91
Figure 3. 6. Deconvolution of methyl carbon peaks....................................................... 92Figure 3. 7. Expanded 13C NMR spectra of a series of ortho-cresol novolac resins with
various molecular weights: a) methyl carbons within the repeat units, b) methylcarbons on the endgroups.......................................................................................... 93
Figure 3. 8. 13C NMR spectra of a 2000g/mol para-cresol novolac resin synthesismonitored as a function of reaction time ................................................................. 95
Figure 3. 9. Expanded 13C NMR spectra monitoring the synthesis of a 2000g/mol para-cresol novolac resin................................................................................................... 96
Figure 3. 10. 1H NMR spectra of a) ortho-cresol, and b) a 2000 g/mol ortho-cresolnovolac ................................................................................................................... 98
Figure 3. 11. 1H NMR spectra of a) para-cresol, and b) a 2000 g/mol para-cresolnovolac ................................................................................................................... 99
Figure 3. 12. GPC monitoring the synthesis of a 2000 g/mol ortho-cresol novolac resinas a function of reaction time.................................................................................. 100
Figure 3. 13. GPC of cresol novolac resins with various molecular weights: a)ortho-cresol novolac, b)para-cresol novolac.................................................................... 101
Figure 3. 14. Dynamic viscosity of cresol novolacs measured as a function of molecularweight a) ortho-cresol novolac resins, and b) para-cresol novolac resins ............. 105
xi
Figure 4. 1. Idealized phenolic/epoxy networks ........................................................... 111Figure 4. 2. a) Stress-relaxation experiment, and b) creep experiments....................... 113Figure 4. 3. Illustration of cooperativity domain size where z = 7 ............................... 114Figure 4. 4. Schematic of a cone calorimeter................................................................ 118Figure 4. 5. Experimental implementation of the eccentric axial load technique......... 122Figure 4. 6. Crosslinking reaction of ortho-cresol novolac and epoxy (Epon 828 or
D.E.N. 438) using triphenylphosphine as the catalyst ............................................ 131Figure 4. 7. 1H NMR of the sol fraction of cresol novolac/Epon 828 networks............ 133Figure 4. 8. 10s Relaxation moduli as functions of temperatures for cresol novolac/Epon
828 networks........................................................................................................... 136Figure 4. 9. 10s Relaxation moduli as functions of temperatures for phenolic
novolac/Epon 828 networks.................................................................................... 136Figure 4. 10. 10s Stress relaxation moduli as functions of temperatures for cresol
novolac crosslinked with D.E.N. 438 epoxy........................................................... 137Figure 4. 11. Master curve constructions for a typical cresol novolac/epoxy network: a)
stress relaxation moduli of a cresol novolac/epoxy network measured from Tg-60°Cto Tg+40°C at 5°C intervals, and b) the master curve............................................. 138
Figure 4. 12. The shift factor plot................................................................................. 139Figure 4. 13. Cooperativity plots of cresol novolac/Epon 828 networks .................... 140Figure 4. 14. Cooperativity plots of cresol novolac/D.E.N. 438 networks ................. 140Figure 4. 15. Weight loss measured as a function of temperature for cresol
novolac/Epon 828 networks A) in air, and B) in nitrogen...................................... 143Figure 4. 16. Cone calorimetry results of A) cresol novolac/Epon 828 (70:30 wt:wt
ratio), and B) cresol novolac/D.E.N. 438 (70:30 wt:wt ratio) ................................ 144Figure 4. 17. Room temperature weight percent water uptake for cresol novolac/Epon
828 networks (70:30 wt:wt ratio)............................................................................ 146Figure 4. 18. Water uptake results for cresol novolac networks at room temperature and
62ºC ................................................................................................................. 147Figure 4. 19. Log heating rate versus 1/T for cresol novolac/epoxy mixture (70:30 wt:wt
ratio) with 1 mole % TPP catalyst .......................................................................... 149Figure 4. 20. Rate constant (k) versus temperature for a cresol novolac/epoxy mixture
(70:30 wt:wt ratio) with 1 mole % TPP catalyst..................................................... 150Figure 4. 21. Dynamic DSC scans of an untreated sample versus a heat treated sample ..
................................................................................................................. 151Figure 4. 22. Complex viscosity of a 2000 g/mol neat cresol novolac resin measured as
a function of temperature ........................................................................................ 152Figure 4. 23. Complex viscosity of a phenolic novolac resin before and after heat
treatment (2 hours at 160°C)................................................................................... 153Figure 4. 24. Viscosity measurements of cresol novolac/Epon 828 mixtures A) dynamic
scans for various compositions, B) isothermal scan of the 70:30 composition at145°C, and C) isothermal scan of the 60:40 composition at 120°C ....................... 154
Figure 4. 25. Isothermal viscosity measurements: A) 65:35 wt:wt phenolicnovolac/Epon 828 mixture measured at 140°C, and B) 70:30 wt:wt cresolnovolac/Epon 828 mixture measured at 145°C ...................................................... 155
Figure 4. 26. Viscosity measurements for cresol novolac/D.E.N. 438 mixtures: A)dynamic measurements, B) isothermal scan for the 60:40 composition at 160°C . 156

xii
Figure 4. 27. 2000 g/mol para-cresol novolac cured with Epon 828 ............................. 158Figure 4. 28. Viscosity of a 2000g/mol para-cresol novolac resin (heat rate = 2.5°C
/min) ................................................................................................................. 158
Figure 5. 1. Preparation of bismaleimide from a diamine and maleic anhydride......... 161Figure 5. 2. Reactions of bismaleimide in the presence of a diamine: A) chain extension
due to an amine addition, and B) crosslinking obtained by maleimidehomopolymerization reactions................................................................................ 163
Figure 5. 3. Synthesis of novolac resins containing maleimide functionalities............ 165Figure 5. 4. Synthesis of 4-hydroxyphenylmaleimide .................................................. 167Figure 5. 5. Synthesis of 2-hydroxyl-5-methylphenylmaleimide ................................. 167Figure 5. 6. Synthesis of 2,6-dimethylphenol endcapped cresol-co-HMP novolac resin...
..................................................................................................................... 168Figure 5. 7. Synthesis of 2-hydroxy-5-methylphenylmaleimide terminated cresol
novolac resins.......................................................................................................... 169Figure 5. 8. 1H NMR spectrum of 4-hydroxyphenylmaleimide monomer ................... 170Figure 5. 9. Melting point of 4-HPM determined via DSC ......................................... 171Figure 5. 10. Thermal stability of 4-HPM monomer measured via TGA (10°C/min, N2) ..
................................................................................................................. 171Figure 5. 11. 1H NMR of a typical cresol-co-HPM novolac resin ................................. 172Figure 5. 12. Percent weight loss for cresol-co-HPM novolac/epoxy networks (80:20
wt:wt ratio) prepared with different oligomer molecular weights, monitored usingthermogravimetric analysis..................................................................................... 175
Figure 5. 13. Heat release rate curves for cresol-co-HPM novolac/Epon 828 networks .................................................................................................................... 177
Figure 5. 14. 1H NMR of 2-hydroxy-4-methylphenylmaleimide................................. 178Figure 5. 15. Successive dynamic DSC scans of 2-hydorxy-4-methylphenylmaleimide ..
................................................................................................................. 179Figure 5. 16. TGA monitoring the weight loss of 2-hydroxy-4-methylphenylmaleimide
monomer as a function of temperature (10°C/min, N2).......................................... 180
Figure 6. 1. Mechanism of TPP catalyzed phenolic novolac/epoxy reaction................ 182Figure 6. 3. Diagram of pultrusion processing .............................................................. 183Figure 6. 4. High temperature imidization of PAAS to release TTMPP catalyst .......... 185Figure 6. 5. The chemical structure of N-benyzlpyrazinium hexafluoroantimonate ..... 186Figure 6. 6. Decarboxylation reaction of salicylic acid salt to form phenolate ............ 188Figure 6. 7. Preparation of phosphonium ylides ........................................................... 189Figure 6. 8. Synthesis of poly(arylene ether phosphine oxide)..................................... 198Figure 6. 9. Reduction of phosphine oxide to phosphine using phenylsilane............... 199Figure 6. 10. Synthesis of Ultem type poly(amic acid) salt with TTMPP..................... 200Figure 6. 11. Synthesis of biphenyl dianhydride and FDA based poly(amic acid) and
poly(amic acid) salt................................................................................................. 202Figure 6. 12. Preparation of Ultem type poly(amic acid) salt with trihexylamine....... 205Figure 6. 13. Schematic of a sizing line ....................................................................... 206Figure 6. 14. Schematic representation of the hot melt prepregging process .............. 207
xiii
Figure 6. 15. Composite ply lay up to form crossply or unidirectional specimen fortensile testing .......................................................................................................... 209
Figure 6. 16. Tensile test specimen with epoxy/glass fiber tabs .................................. 209Figure 6. 17. Compliance determination of the uncracked sample .............................. 211Figure 6. 18. Compliance determination of cracked samples ...................................... 211Figure 6. 19. Glass transition temperature of polyimide/ TPP blend measured as a
function of TPP content a) Ultem /TPP blend b) Matrimid /TPP blend............ 213Figure 6. 20. Percent weight loss of Matrimid/TPP blend as a function of temperature ...
................................................................................................................. 214Figure 6. 21. SEM of Matrimid/TPP particles a) before separation, b) fine particles that
passed through the sieve, and c) larger particles that did not pass through the sieves .................................................................................................................. 215
Figure 6. 22. Isothermal DSC at 135ºC for phenolic novolac/Epon 828 epoxy mixtureswith no catalyst, with a Matrimid/TPP (50:50) sequestered catalyst, or with freetriphenylphosphine catalyst (arbitrary vertical placements of curves) .................. 216
Figure 6. 23. Isothermal DSC at 200ºC for phenolic novolac/Epon 828 epoxy mixtureswith no catalyst, with a Matrimid/TPP (50:50) sequestered catalyst, or with freetriphenylphosphine catalyst .................................................................................... 217
Figure 6. 24. Isothermal DSC at 220ºC for phenolic novolac/Epon 828 epoxy mixtureswith no catalyst, with a Matrimid/TPP (50:50) sequestered catalyst, or with freetriphenylphosphine catalyst .................................................................................... 218
Figure 6. 25. Isothermal viscosity at 140ºC for phenolic novolac /Epon 828 epoxymixtures with Matrimid/TPP sequestered catalysts (50:50), unwashed, acetonewashed and methanol washed. ................................................................................ 219
Figure 6. 26. SEM of Matrimid/TPP particle surfaces................................................. 221Figure 6. 27. SEM of a cross-section of a Matrimid/TPP particle ............................... 221Figure 6. 28. 1H NMR of TPP, Udel, Udel/TPP, and methanol washed Udel/TPP..... 222Figure 6. 29. DSC scans of phenolic novolac/epoxy mixtures containing Udel/TPP
catalyst ................................................................................................................. 223Figure 6. 30. Isothermal viscosity determination of phenolic novolac/epoxy mixtures at
140°C without catalyst, with 0.65 mol % catalyst, and with 1.6 mol % catalyst. .. 224Figure 6. 31. SEM of a cross-section of an Udel/TPP particle .................................... 225Figure 6. 32. Glass transition temperature vs. percent reduction of P(AEPO.............. 226Figure 6. 33. Percent reduction of (P=O) as a function of reaction time for P=O:SiH3Ph
(1:1.5 molar ratio) ................................................................................................... 226Figure 6. 34. Isothermal DSC of phenolic novolac/Epon 828 with 1 mol % reduced
P(AEPO) at 140°C and at 220°C ........................................................................... 228Figure 6. 35. Isothermal viscosity (140°C) of phenolic novolac/Epon 828 epoxy with
reduced P(AEPO).................................................................................................... 228Figure 6. 36. Poly(amic acid) salts 1) Ultem type PAAS/TTMPP, 2) FDA/BPDA based
PAAS/imidazole, and 3) FDA/BPDA based PAAS/trihexylamine........................ 230Figure 6. 37. Dynamic DSC scans of (1) Ultem PAAS/TTMPP, (2) FDA/BPDA based
PAAS/imidazole, and (3) FDA/BPDA based PAAS/trihexylamine....................... 231Figure 6. 38. Dynamic DSC scans of novolac/epoxy mixture with 2 mole % PAAS (1)
Ultem PAAS/TTMPP, (2) FDA/BPDA PAAS/imidazole, and (3) FDA/BPDAPAAS/trihexylamine ............................................................................................... 232
xiv
Figure 6. 39. Phenolic novolac/epoxy with 2 mol % Ultem type PAAS/TTMPP ....... 232Figure 6. 40. Phenolic novolac/epoxy with 2 mol % PAAS (FDA/BPDA) imidazole......
................................................................................................................ 233Figure 6. 41. Isothermal DSC at 140oC for novolac/epoxy mixtures: no catalyst, with
PAAS (FDP/BPDA/trihexylamine), and with free trihexylamine.......................... 234Figure 6. 42. Isothermal DSC at 200oC of phenolic novolac/epoxy without catalyst, with
PAAS (FDP/BPDA/trihexylamine), and with free trihexylamine.......................... 234Figure 6. 43. Viscosity during heating and holding at 140°C of phenolic novolac/epoxy
with 2 mole % PAAS-3 (FDP/BPDA/trihexylamine), ........................................... 235Figure 6. 44: Isothermal viscosities of phenolic novolac/epoxy mixtures, Novolac G
(Georgia Pacific resin, f(OH) = 7) and Novolac O (Occidental resin, f(OH) = 4.4)... 236Figure 6. 45: Isothermal viscosity of lower molecular weight phenolic novolac/epoxy
mixtures with and without sequestered catalysts .................................................... 237Figure 6. 46. Dynamic DSC scans of a novolac/epoxy/trihexylamine mixture measured
at different heating rates. The peak shift due to the instrument response lag wascorrected by measuring the indium melting point at these same heating rates....... 238
Figure 6. 47. a) log heating rate (β) versus 1/peak temperature of the exotherm, and b)rate constant versus temperature for a novolac/epoxy mixture containing 3 molepercent trihexylamine.............................................................................................. 239
Figure 6. 48. Stress vs. transverse strain for crossply PAAS/trihexylamine sized AS-4carbon fiber reinforced phenolic novolac/epoxy composites ................................. 242
xv
List of Tables
Table 2. 1. U.S. Phenolic production (in millions of pounds on a gross weight basis) .... 3Table 2. 2. Relative reaction rates of various phenols with formaldehyde under basic
conditions.................................................................................................................. 13Table 2. 3. Peak assignments for 13C NMR chemical shifts of phenolic resins , ............ 18Table 2. 4. Relative positional reaction rates in base catalyzed phenol-formaldehyde
reaction...................................................................................................................... 37Table 2. 5. Second order rate constants for reaction of phenolic monomers with
formaldehyde ............................................................................................................ 38Table 2. 6. % yield of methylene and ether linkages of 2-hydroxylmethyl-4,6-
dimethylphenol self-reaction, 1:1 with 2,4-xylenol, and 1:1 with 2,6-xylenol......... 44Table 2. 7. FTIR absorption band assignment of resole resins ....................................... 48Table 2. 8. Tg and KIC of phenolic novolac/epoxy networks .......................................... 60Table 2. 9. Flame retardance of networks prepared form a phenolic novolac crosslinked
with various epoxies ................................................................................................. 61
Table 3. 1. Molecular weight of ortho- and para-cresol novolac resins calculated using13C NMR. The molecular weights were controlled by adjusting NAA/NZA’ ratio.... 86
Table 3. 2. 13C NMR assignments for novolac resins and related reaction intermediates......................................................................................................................... 87
Table 3. 3. Mole percent ortho-dimethylene ether linkages ........................................... 90Table 3. 4. Percentage isomers formed in ortho-cresol novolac resins .......................... 93Table 3. 5. Polydispersities and intrinsic viscosities of cresol novolac resins.............. 103Table 3. 6. Tg of cresol novolac resins as a function of molecular weight.................... 103
Table 4. 1. Fracture toughness of phenolic novolac/epoxy networks........................... 111Table 4. 2. Cone calorimetry results on phenolic novolac/epoxy networks (65:35 wt:wt
ratio) ..................................................................................................................... 119Table 4. 3. Phenolic materials and their properties........................................................ 130Table 4. 4. Network properties of ortho-cresol novolac/epoxy networks ................... 132Table 4. 5. Crosslink densities of cresol novolac/epoxy networks ............................... 134Table 4. 6. Fragility measuring the crosslink densities and degree of hydrogen boning
interaction for cresol novolac/epoxy networks ....................................................... 141Table 4. 7. Flame retardance of cresol novolac/epoxy networks................................. 145Table 4. 8. Diffusion efficient of cresol novolac/epoxy networks................................ 148Table 4. 9. Cure condition determination for ortho-cresol novolac/Epon 828 network
(70:30 wt:wt %), no catalyst ................................................................................... 157Table 4. 10. Flexural strength and moduli of composites............................................... 157Table 4. 11. KIC and Tg of para-cresol novolac/Epon 828 networks.............................. 159
Table 5. 1. Tg of cresol-co-HMP oligomer as a function of Mn.................................... 173Table 5. 2. Properties of ortho-cresol-co-HPM/Epon 828 networks ............................ 174Table 5. 3. Thermal stability of cresol-co-HMP novolac/epoxy networks measured using
thermogravimetric analysis..................................................................................... 175
xvi
Table 5. 4. Cone calorimetry measuring the peak heat release rate (PHRR) and the charyield of 1250 g/mol cresol-co-HPM/epoxy networks............................................. 176
Table 5. 5. Cone calorimetry results for 60:40 wt:wt cresol-co-HPM/epoxy networksprepared with different molecular weight oligomers.............................................. 177
Table 6. 2. Processing windows and cure times of phenolic novolac/epoxy and Matrimidsequestered catalysts ............................................................................................... 220
Table 6. 3. Particle compositions of unwashed and methanol washed Udel/TPP particles..................................................................................................................... 223
Table 6. 4. Properties of partially reduced P(AEPO).................................................... 227Table 6. 5. Resin and network properties of novolac resins of different molecular
weights .................................................................................................................... 236Table 6. 6. Transverse flexural strength and modulus of unidirectional AS-4 carbon fiber
reinforced phenolic novolac/epoxy composites...................................................... 240Table 6. 7. Mode II composite toughness of unidirectional AS-4 carbon fiber reinforced
phenolic novolac/epoxy composites ....................................................................... 241Table 6. 8. Static tensile properties of AS-4 carbon fiber reinforced phenolic
novolac/epoxy composites ...................................................................................... 241
1
1. Introduction
Fiber reinforced polymer matrix composites for structural applications, generally
comprised of continuous fiber embedded in a polymer matrix, have high strength to
weight ratios. Such composites also have superior oxidative resistance relative to steel
and better freeze-thaw durability relative to concrete. However, the high combustibility
of organic matrix materials limits their use in construction or transportation applications.
Phenolics are widely used as adhesives, coatings, and in various electric, structural,
and aerospace applications. The main advantages of phenolic resins, both novolacs and
resoles, and their networks are excellent flame retardance and low cost. A significant
amount of academic research, therefore, has been devoted to understanding phenolic
resin synthesis and network formation both mechanistically and kinetically. The thermal
and thermo-oxidative degradation pathways have also been extensively investigated. A
survey on phenolic resin syntheses, network formations, and degradation pathways is
included in a phenolic chemistry literature review (chapter 2). One major shortcoming of
typical phenolic networks is their large void contents due to released volatiles in the cure
reactions. This, and the lack of control over network crosslink density, gives rise to
brittle networks. Therefore, we and others have investigated phenolic or phenolic
network modifications in order to improve these mechanical properties while retaining
high thermal stability and flame retardance.
Previous work in our group focused on developing novolac/epoxy networks as
composite matrix materials for structural applications.1 A relatively high molecular
weight novolac (7 hydroxyl groups per chain) was reacted with various diepoxides where
the phenolic was the major component. The network density was controlled by adjusting
the ratio of phenol to epoxy. Fracture toughness of the networks having 3 to 5 phenols
per epoxy exceeded that of an untoughened epoxy control (bisphenol-A
stoichiometrically cured with 4,4’-DDS) and far exceeded that of phenolic resoles. The
flame retardance of the phenolic novolac/epoxy networks was significantly improved
relative to the epoxy control.
1 C. S. Tyberg, “Void-Free Flame Retardant Phenolic Networks: Properties andProcessability,” Dissertation, Virginia Tech, March 22, 2000.

2
Latent catalysts were subsequently developed to allow melt processing of the
phenolic novolac/bisphenol-A epoxy mixtures. Catalysts were encapsulated onto the
fiber, which eliminated resin/catalyst contact, and therefore prevented premature curing
during processing. Results indicated that a poly(amic acid) salt of tris-(trimethoxy-
phenylphosphine) was effective in catalyzing the phenolic novolac/epoxy reaction.
The ultimate goal of this research was to develop tough, flame retardant matrix resins
which can be processed easily using typical composite fabrication methods. Attempts
were also made to improve the specific drawbacks on existing phenolic novolac/epoxy
systems such as high water uptake, and relatively short processing windows even in the
absence of added catalysts. Following a literature review, the specific work of this
dissertation is presented. This work has four major sections.
1) The first section focuses on the synthesis and characterization of controlled
molecular weight cresol novolac resins. Specific reaction conditions and means
to achieve molecular weight control are described.
2) The second section discusses in detail the network properties of a 2000 g/mol
cresol novolac resin crosslinked with various epoxies at defined compositions. It
investigates the network structure-property relationships, which allowed for
understanding of the parameters that affect the network mechanical properties,
flame retardance and processability. It also examines the molecular relaxation
behaviors (cooperativity) and its relationships with network crosslink density and
chemical structures.
3) The third section extends the results obtained in section 2 and assesses the effects
of incorporating maleimide functionalities into cresol novolac/epoxy networks.
The balance between network properties and processability is addressed.
4) The last section considers various approaches to sequester and encapsulate tertiary
amines or phosphine catalysts which can be added directly to novolac/epoxy
mixtures at melt processing temperatures. It also presents poly(amic
acid)/trihexylamine as a more cost effective latent catalyst sizing for phenolic
novolac/epoxy reactions.

3
2. Literature ReviewChemistry and Properties of Phenolic Resins and Networks
2.1. IntroductionPhenolic resins comprise a large family of oligomers and polymers (Table 2. 1),
which are various products of phenols, reacted with formaldehyde. They are versatile
synthetic materials with a large range of commercial applications. Plywood adhesives
account for nearly half of all phenolic applications while wood binding and insulation
materials also make up a significant portion.2 Other uses for phenolics include coatings,
adhesives, binders for abrasives, automotive and electrical components, electronic
packaging and as matrices for composites.
Table 2. 1. U.S. Phenolic production (in millions of pounds on a gross weight basis)3
1998 1997 % Change3940 3734 5.5
Phenolic oligomers are prepared by reacting phenol or substituted phenols with
formaldehyde or other aldehydes. Depending on the reaction conditions (e.g., pH) and
the ratio of phenol to formaldehyde, two types of phenolic resins are obtained. Novolacs
are derived from an excess of phenol under neutral to acidic conditions, while reactions
under basic conditions using an excess of formaldehyde result in resoles.
Phenolic resins were discovered by Baeyer in 1872 through acid catalyzed
reactions of phenols and acetaldehyde. Kleeberg found in 1891 that resinous products
could also be formed by reacting phenol with formaldehyde. But it was Baekeland who
was granted patents in 1909 describing both base catalyzed resoles (known as Bakelite
resins) and acid catalyzed novolac products.4
This chapter emphasizes the recent mechanistic and kinetic findings on both
phenolic oligomer syntheses and network formation. The synthesis and characterization
2 Society of Plastic Industries Facts and Figures, SPI, Washington, D.C. (1994).3 Society of Plastic Industries Facts and Figures, SPI, Washington D.C. (1999).

4
of both novolac and resole type phenolic resins and their resulting networks are
described. Three types of networks, novolac/hexamethylene tetramine (HMTA),
novolac/epoxies, and thermally cured resoles will be primarily discussed. Other phenolic
based networks include benzoxazines and cyanate esters. Since phenolic materials
possess excellent flame retardance, a discussion of the thermal and thermo-oxidative
degradation pathways will be included. Detailed information on the chemistry,
applications, and processing of phenolic materials can be found in a number of
references.4,5,6,7,8
2.2. Materials for the synthesis of novolac and resole phenolic oligomers
2.2.1. PhenolsThe most common precursor to phenolic resins is phenol. More than 95% of
phenol is produced via the cumene process developed by Hock and Lang (Figure 2. 1).
Cumene is obtained from the reaction of propylene and benzene through acid catalyzed
alkylation. Oxidation of cumene in air gives rise to cumene hydroperoxide, which
decomposes rapidly at elevated temperatures under acidic conditions to form phenol and
acetone. A small amount of phenol is also derived from coal.
4 A. Knop and L. A. Pilato, Phenolic Resins--Chemistry, Applications and Performance,
Springer-Verlag, Berlin, 1985.5 A. Knop, W and W. Scheib, Chemistry and Application of Phenolic Resins, Springer-
Verlag, New York, 1979.6 S. R Sandler and W. Karo, Polymer Synthesis, 2nd editions, Academic Press, Boston,
Vol. 2, 1992.7 P. W. Kopf in J. I. Kroschulitz, ed., Encyclopedia of Chemical Technology, 4th Ed., Vol
18, John Wiley & Sons, 1996, pp 603-644.8 R.T. Conley, Thermal Stability of Polymers, Marcel Dekker, Inc., New York, 1970, pp.
459-496.

5
CH3 CH CH2 O2
catalyst
OOH
H+
OH
CH3 CO
CH3phosphoric acid
+
Figure 2. 1. Preparation of phenol monomer
Substituted phenols such as cresols, p-tert-butylphenol, p-phenylphenol,
resorcinol, and cardanol (derived from cashew nut shells) have also been used as
precursors for phenolic resins. Alkylphenols with at least three carbons in the substituent
lead to more hydrophobic phenolic resins which are compatible with many oils, natural
resins and rubbers.9 Such alkylphenolic resins are used as modifying and crosslinking
agents for oil varnishes, as coatings and printing inks, and as antioxidants and stabilizers.
Bisphenol-A (2,2-p-hydroxyphenylpropane), a precursor to a number of phenolic resins,
is the reaction product of phenol and acetone under acidic conditions.
An additional activating hydroxyl group on the phenolic ring allows resorcinol to
react rapidly with formaldehyde even in the absence of catalysts.10 This provides a
method for room temperature cure of resorcinol-formaldehyde resins or mixed phenol-
formaldehyde/resorcinol-formaldehyde resins. Trihydric phenols have not achieved
commercial importance, probably due to their higher costs.
2.2.2. Formaldehyde and formaldehyde sourcesFormaldehyde, produced by dehydrogenation of methanol, is used almost
exclusively in the synthesis of phenolic resins (Figure 2. 2). Iron oxide, molybdenum
oxide or silver catalysts are typically used for preparing formaldehyde. Air is a safe
source of oxygen for this oxidation process.
9 K. Hultzsch “Recent Chemical and Technical Aspects on Alkylphenolic Resins,”
American Chemical Society, Division of Organic Coating & Plastic Chemistyr, Pap.
26(1), 121-128 (1966)10 U.S. Patents 2,385,370 (1947) A. J. Norton; U.S Patents 2,385,372 (1946) P. H.
Phodes.

6
+ H2OH C HOcatalyst1/2 O2+CH3 OH
Figure 2. 2. Synthesis of formaldehyde
Since formaldehyde is a colorless pungent irritating gas, it is generally marketed
as a mixture of oligomers of polymethylene glycols either in aqueous solutions (formalin)
or in more concentrated solid forms (paraformaldehyde). The concentration of formalin
ranges between about 37 and 50 wt %. A 40 wt % aqueous formalin solution at 35°C
typically consists of methylene glycols with 1 to 10 repeat units. The molar
concentration of methylene glycol with one repeat unit (HO-CH2-OH) is highest and the
concentrations decrease with increasing numbers of repeat units.11 Paraformaldehyde, a
white solid, contains mostly polymethylene glycols with 10 to 100 repeat units. It is
prepared by distilling aqueous formaldehyde solutions and generally contains 1-7 wt %
water.
Methanol, the starting reagent for producing formaldehyde, stabilizes the formalin
solution by forming acetal endgroups and is usually present in at least small amounts
(Figure 2. 3). Methanol may also be formed by disproportionation during storage. The
presence of methanol reduces the rate of phenol/formaldehyde reactions but does not
affect the activation energies.12 It is generally removed by stripping at the end of the
reaction.
nnCH3 OH HO CH2 O H CH3 O CH2 O H H2O+ +
Figure 2. 3. Formation of hemiformals
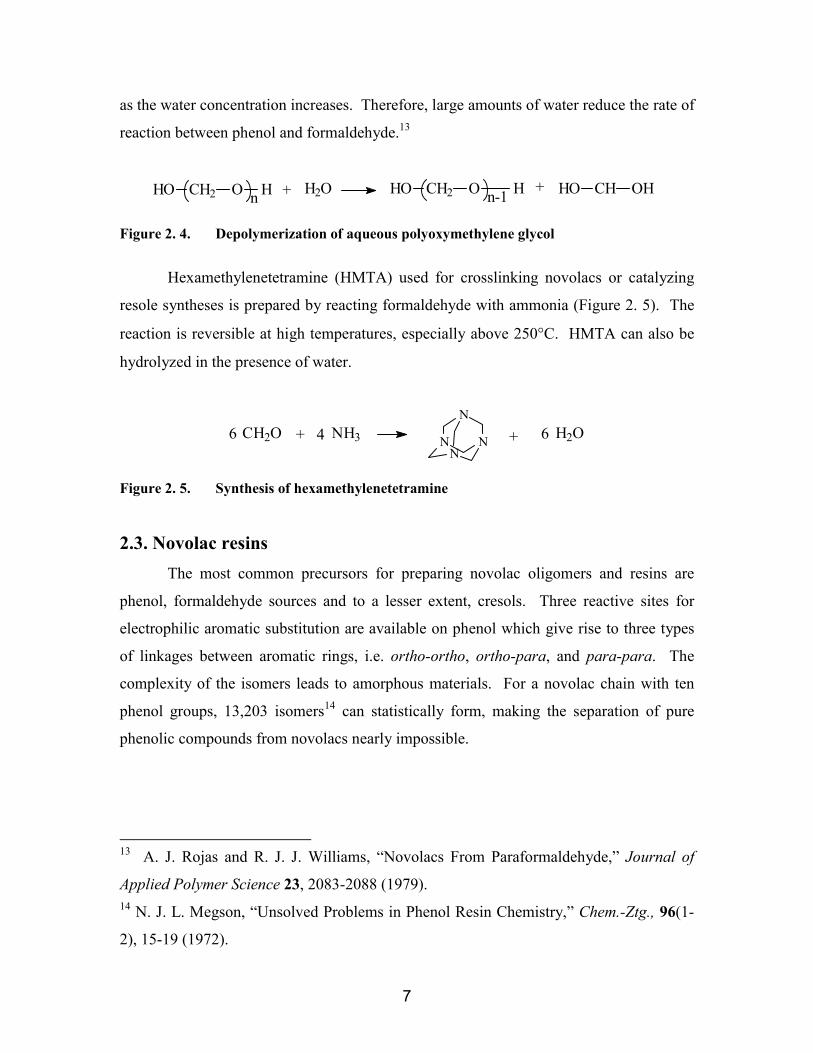
Water is necessary for decomposing paraformaldehyde to formaldehyde (Figure
2. 4). However, water can serve as an ion sink and water-phenol mixtures phase separate
11 H Diehm and A. Hit, “Formaldehyde” Ullmanns Encyclopadie der Techn. Chem., 4th
ed, Verlag Chemie, Weinheim, Vol.11, 1976.12 C. M. Chen and S. L. Chen, “Effects of Methanol on the Reactions of the Phenol-
Formaldehyde System,” Forest Products Journal 38(5), 49-52 (1988).
7
as the water concentration increases. Therefore, large amounts of water reduce the rate of
reaction between phenol and formaldehyde.13
HO CH2 O Hn-1n CH OHHOHO CH2 O H H2O ++
Figure 2. 4. Depolymerization of aqueous polyoxymethylene glycol
Hexamethylenetetramine (HMTA) used for crosslinking novolacs or catalyzing
resole syntheses is prepared by reacting formaldehyde with ammonia (Figure 2. 5). The
reaction is reversible at high temperatures, especially above 250°C. HMTA can also be
hydrolyzed in the presence of water.
6 H2O+ NH34+ 6 CH2O N N
N
N
Figure 2. 5. Synthesis of hexamethylenetetramine
2.3. Novolac resinsThe most common precursors for preparing novolac oligomers and resins are
phenol, formaldehyde sources and to a lesser extent, cresols. Three reactive sites for
electrophilic aromatic substitution are available on phenol which give rise to three types
of linkages between aromatic rings, i.e. ortho-ortho, ortho-para, and para-para. The
complexity of the isomers leads to amorphous materials. For a novolac chain with ten
phenol groups, 13,203 isomers14 can statistically form, making the separation of pure
phenolic compounds from novolacs nearly impossible.
13 A. J. Rojas and R. J. J. Williams, “Novolacs From Paraformaldehyde,” Journal of
Applied Polymer Science 23, 2083-2088 (1979).14 N. J. L. Megson, “Unsolved Problems in Phenol Resin Chemistry,” Chem.-Ztg., 96(1-
2), 15-19 (1972).
8
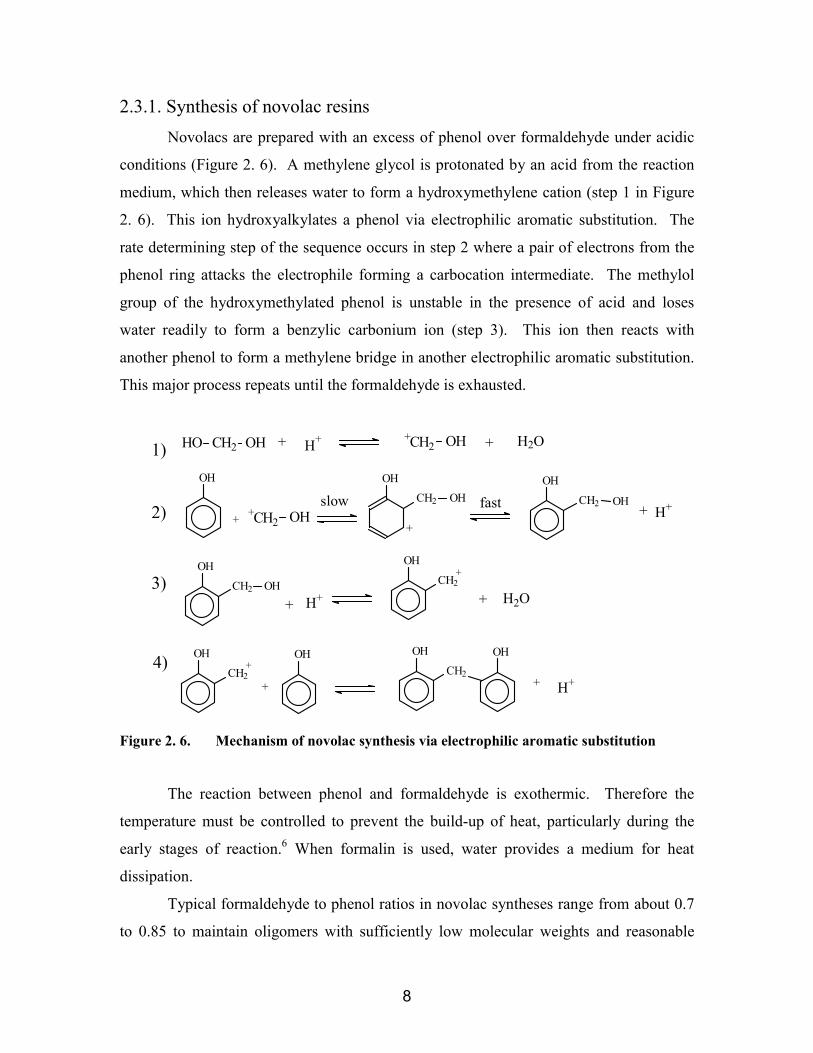
2.3.1. Synthesis of novolac resinsNovolacs are prepared with an excess of phenol over formaldehyde under acidic
conditions (Figure 2. 6). A methylene glycol is protonated by an acid from the reaction
medium, which then releases water to form a hydroxymethylene cation (step 1 in Figure
2. 6). This ion hydroxyalkylates a phenol via electrophilic aromatic substitution. The
rate determining step of the sequence occurs in step 2 where a pair of electrons from the
phenol ring attacks the electrophile forming a carbocation intermediate. The methylol
group of the hydroxymethylated phenol is unstable in the presence of acid and loses
water readily to form a benzylic carbonium ion (step 3). This ion then reacts with
another phenol to form a methylene bridge in another electrophilic aromatic substitution.
This major process repeats until the formaldehyde is exhausted.
H+HO CH2 OH +CH2 OH + H2O
OH
+ +CH2 OH
OH
CH2 OH
+
OH
CH2 OH+ H+
OH
CH2 OHH++
OH
CH2+
+OH
CH2+
OH OH
CH2
OH
+ H+
1)
2)
3)
4)
slow fast
+
+ H2O
Figure 2. 6. Mechanism of novolac synthesis via electrophilic aromatic substitution
The reaction between phenol and formaldehyde is exothermic. Therefore the
temperature must be controlled to prevent the build-up of heat, particularly during the
early stages of reaction.6 When formalin is used, water provides a medium for heat
dissipation.
Typical formaldehyde to phenol ratios in novolac syntheses range from about 0.7
to 0.85 to maintain oligomers with sufficiently low molecular weights and reasonable
9
melt viscosities. This is especially important since phenol is trifunctional and a gel
fraction begins to form as conversion increases. As a result, the number average
molecular weights of novolac resins are generally below 1000g/mol.
The acidic catalysts used for these reactions include formic acid, HX (X=F, Cl,
Br), oxalic acid, phosphoric acid, sulfuric acid, sulfamic acid, and p-toluenesulfonic
acid.6 Oxalic acid is preferred since resins with low color can be obtained. Oxalic acid
also decomposes at high temperatures (>180°C) to CO2, CO and water, which facilitates
the removal of this catalyst thermally. Typically, 1-6 wt % catalyst is used.
Hydrochloric acid results in corrosive materials and reportedly releases carcinogenic
chloromethyl ether by-products during resin synthesis.4
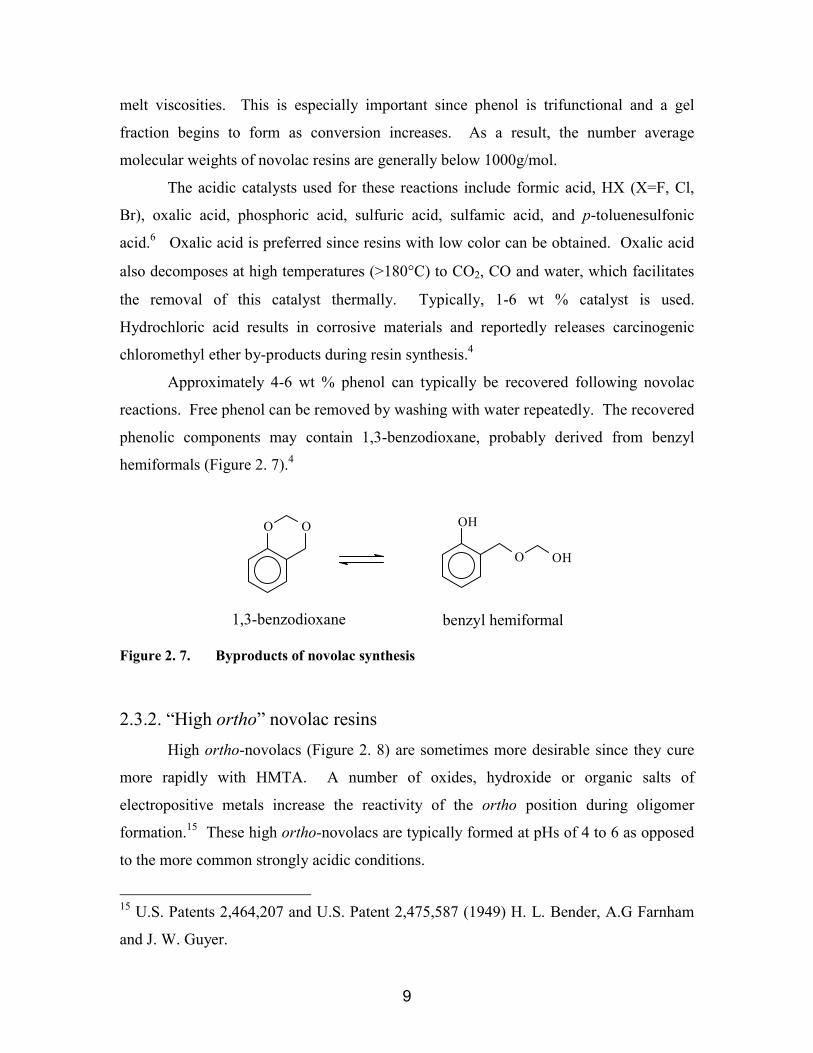
Approximately 4-6 wt % phenol can typically be recovered following novolac
reactions. Free phenol can be removed by washing with water repeatedly. The recovered
phenolic components may contain 1,3-benzodioxane, probably derived from benzyl
hemiformals (Figure 2. 7).4
benzyl hemiformal1,3-benzodioxane
OH
O OH
OO
Figure 2. 7. Byproducts of novolac synthesis
2.3.2. “High ortho” novolac resinsHigh ortho-novolacs (Figure 2. 8) are sometimes more desirable since they cure
more rapidly with HMTA. A number of oxides, hydroxide or organic salts of
electropositive metals increase the reactivity of the ortho position during oligomer
formation.15 These high ortho-novolacs are typically formed at pHs of 4 to 6 as opposed
to the more common strongly acidic conditions.
15 U.S. Patents 2,464,207 and U.S. Patent 2,475,587 (1949) H. L. Bender, A.G Farnham
and J. W. Guyer.

10
mn
OH OH
OHO
OH OH
Figure 2. 8. High ortho novolacs
Metal hydroxides of first and second group elements can enhance ortho
substitution, the degree of which depends on the strength of metal chelating effects
linking the phenolic oxygen with the formaldehyde as it approaches the ortho position.
Transition metal ions of elements such as Fe, Cu, Cr, Ni, Co, Mn and Zn as well as boric
acid also direct ortho substitutions via chelating effects (Figure 2. 9).
CH2
OM
O
OHPh
H
CH2
OM
O
OHPh
H
CH2
OB
O
OHHO
H
M = transition metal
Figure 2. 9. Proposed chelate structures in the synthesis of high ortho novolac oligomers
Phenol-formaldehyde reactions catalyzed by zinc acetate as opposed to strong
acids have been investigated, but this results in lower yields and requires longer reaction
times. The reported ortho-ortho content yield was as high as 97%. Several divalent
metal species such as calcium, barium, strontium, magnesium, zinc, cobalt and lead
combined with an organic acid (such as sulfonic and/or fluoroboric acid) improved the
reaction efficiencies.16 The importance of an acid catalyst was attributed to facilitated
decomposition of any dibenzyl ether groups formed in the process. It was also found the
reaction rates could be accelerated with continuous azeotropic removal of water.
An interesting aspect of high ortho novolac oligomers is their so-called
“hyperacidity”. The enhanced acidity of high ortho novolac resins, intermediate between
16 U.S. Pat. 4,113,700 (Sept. 12, 1978), W. Aubertson (to Monsanto Co.).
11
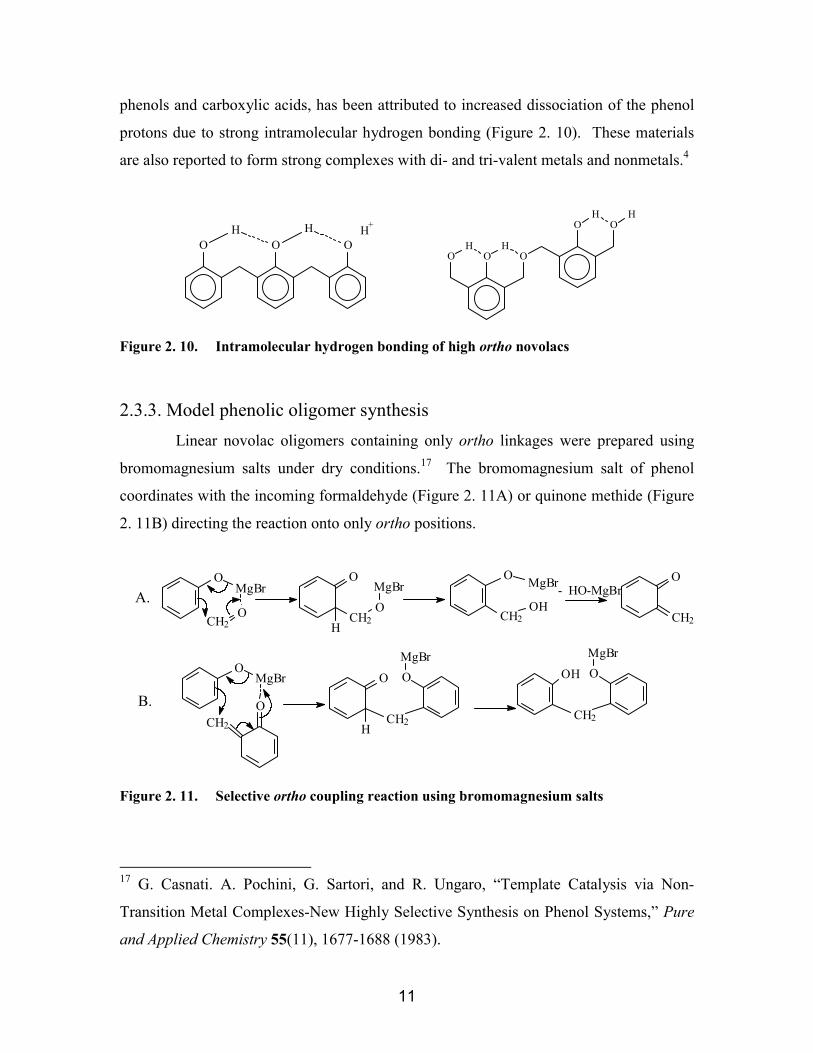
phenols and carboxylic acids, has been attributed to increased dissociation of the phenol
protons due to strong intramolecular hydrogen bonding (Figure 2. 10). These materials
are also reported to form strong complexes with di- and tri-valent metals and nonmetals.4
OOH
OH
OH
OH
H+
O O OH H
Figure 2. 10. Intramolecular hydrogen bonding of high ortho novolacs
2.3.3. Model phenolic oligomer synthesis Linear novolac oligomers containing only ortho linkages were prepared using
bromomagnesium salts under dry conditions.17 The bromomagnesium salt of phenol
coordinates with the incoming formaldehyde (Figure 2. 11A) or quinone methide (Figure
2. 11B) directing the reaction onto only ortho positions.
OMgBr
CH2O CH2H
O
OMgBr
O
CH2
MgBr
OHCH2
O
OMgBr
OCH2 CH2
H
O OMgBr
CH2
OMgBr
OH
A.
B.
- HO-MgBr
Figure 2. 11. Selective ortho coupling reaction using bromomagnesium salts
17 G. Casnati. A. Pochini, G. Sartori, and R. Ungaro, “Template Catalysis via Non-
Transition Metal Complexes-New Highly Selective Synthesis on Phenol Systems,” Pure
and Applied Chemistry 55(11), 1677-1688 (1983).
12
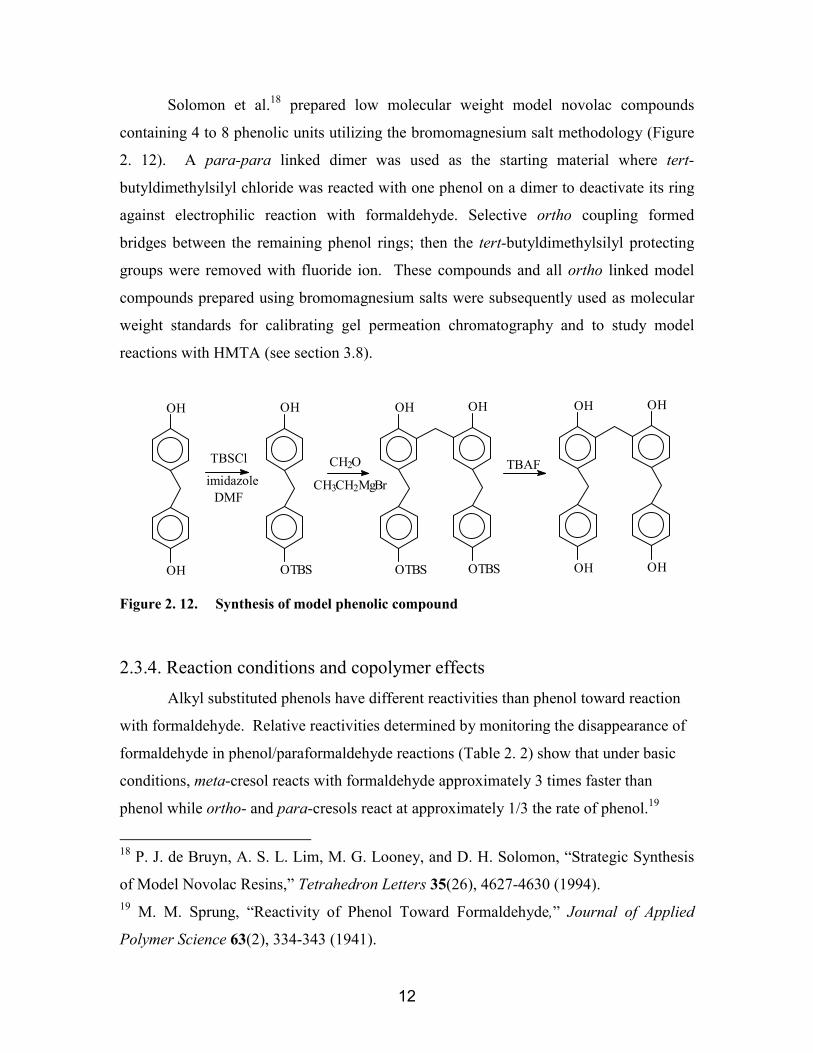
Solomon et al.18 prepared low molecular weight model novolac compounds
containing 4 to 8 phenolic units utilizing the bromomagnesium salt methodology (Figure
2. 12). A para-para linked dimer was used as the starting material where tert-
butyldimethylsilyl chloride was reacted with one phenol on a dimer to deactivate its ring
against electrophilic reaction with formaldehyde. Selective ortho coupling formed
bridges between the remaining phenol rings; then the tert-butyldimethylsilyl protecting
groups were removed with fluoride ion. These compounds and all ortho linked model
compounds prepared using bromomagnesium salts were subsequently used as molecular
weight standards for calibrating gel permeation chromatography and to study model
reactions with HMTA (see section 3.8).
TBAFCH3CH2MgBr
CH2O
DMFimidazole
TBSCl
OH
OTBS
OH
OTBS
OH
OH
OH
OH
OH
OTBS
OH
OH
Figure 2. 12. Synthesis of model phenolic compound
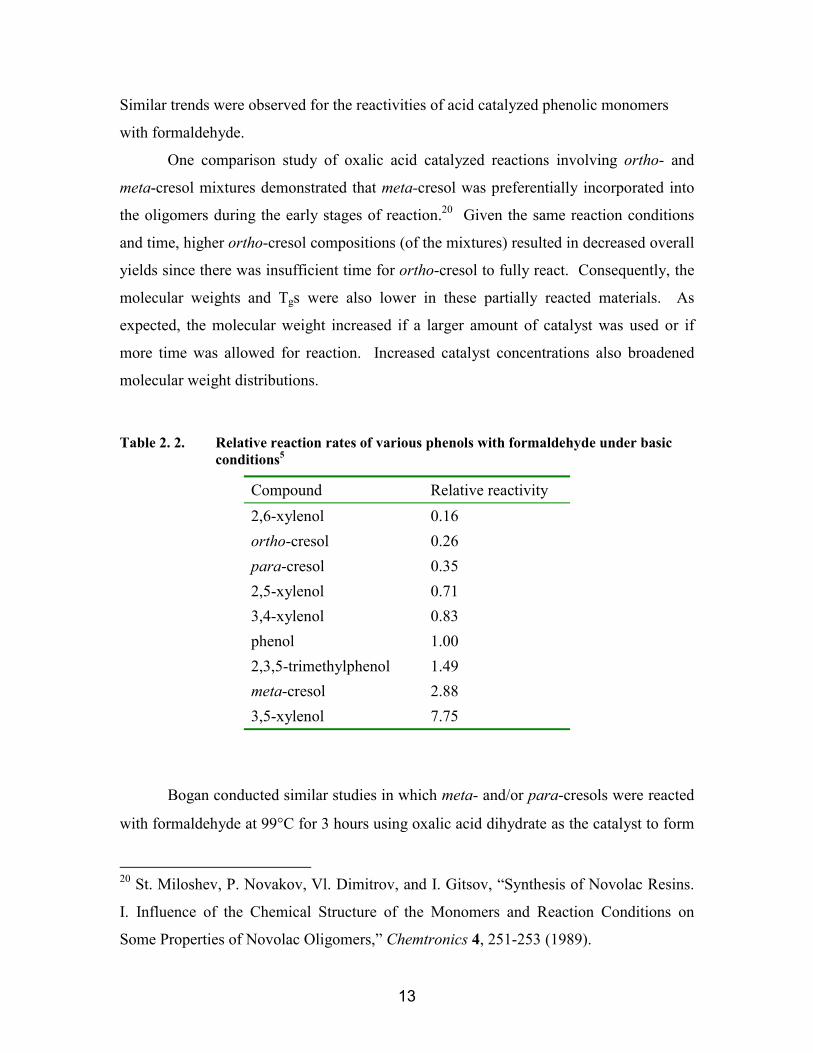
2.3.4. Reaction conditions and copolymer effectsAlkyl substituted phenols have different reactivities than phenol toward reaction
with formaldehyde. Relative reactivities determined by monitoring the disappearance of
formaldehyde in phenol/paraformaldehyde reactions (Table 2. 2) show that under basic
conditions, meta-cresol reacts with formaldehyde approximately 3 times faster than
phenol while ortho- and para-cresols react at approximately 1/3 the rate of phenol.19
18 P. J. de Bruyn, A. S. L. Lim, M. G. Looney, and D. H. Solomon, “Strategic Synthesis
of Model Novolac Resins,” Tetrahedron Letters 35(26), 4627-4630 (1994).19 M. M. Sprung, “Reactivity of Phenol Toward Formaldehyde,” Journal of Applied
Polymer Science 63(2), 334-343 (1941).
13
Similar trends were observed for the reactivities of acid catalyzed phenolic monomers
with formaldehyde.
One comparison study of oxalic acid catalyzed reactions involving ortho- and
meta-cresol mixtures demonstrated that meta-cresol was preferentially incorporated into
the oligomers during the early stages of reaction.20 Given the same reaction conditions
and time, higher ortho-cresol compositions (of the mixtures) resulted in decreased overall
yields since there was insufficient time for ortho-cresol to fully react. Consequently, the
molecular weights and Tgs were also lower in these partially reacted materials. As
expected, the molecular weight increased if a larger amount of catalyst was used or if
more time was allowed for reaction. Increased catalyst concentrations also broadened
molecular weight distributions.
Table 2. 2. Relative reaction rates of various phenols with formaldehyde under basicconditions5
Compound Relative reactivity2,6-xylenol 0.16ortho-cresol 0.26para-cresol 0.352,5-xylenol 0.713,4-xylenol 0.83phenol 1.002,3,5-trimethylphenol 1.49meta-cresol 2.883,5-xylenol 7.75
Bogan conducted similar studies in which meta- and/or para-cresols were reacted
with formaldehyde at 99°C for 3 hours using oxalic acid dihydrate as the catalyst to form
20 St. Miloshev, P. Novakov, Vl. Dimitrov, and I. Gitsov, “Synthesis of Novolac Resins.
I. Influence of the Chemical Structure of the Monomers and Reaction Conditions on
Some Properties of Novolac Oligomers,” Chemtronics 4, 251-253 (1989).
14
novolac type structures.21 Using a relative reactivity of 0.09±0.03 for para-cresol with
formaldehyde versus. meta-cresol with formaldehyde, a statistical model was employed
to predict the amounts of unreacted cresols during the reactions, branching density, and
m/p-cresol copolymer compositions. Good agreement was found between the predictions
and experimental results. Since para-cresol reacted much slower that meta-cresol, it was
to a first approximation considered an unreactive diluent. When meta- and para-cresol
mixtures were reacted, oligomers consisting of mostly meta-cresol formed first, then
when the meta-cresol content was depleted, para-cresol incorporation was observed
(mostly at the chain ends). Full conversions were not achieved in these investigations,
probably due to insufficient reaction times for para-cresol to react completely.
Linear novolac resins prepared by reacting para-alkylphenols with
paraformaldehyde are of interest for adhesive tackifiers. As expected for step-growth
polymerization, the molecular weights and viscosities of such oligomers prepared in one
exemplary study increased as the ratio of formaldehyde to para-nonylphenol was
increased from 0.32 to 1.00.22 As is usually the case, however, these reactions were not
carried out to full conversion and the measured Mn of an oligomer prepared with an
equimolar phenol to formaldehyde ratio was 1400 g/mol. Plots of apparent shear
viscosity vs. shear rate of these p-nonylphenol novolac resins showed non-Newtonian
rheological behavior.
Reaction media play an important role in meta-cresol/paraformaldehyde
reactions.23 Higher molecular weight resins, especially those formed from near
21 L. E. Bogan, Jr., in P. N. Prasad, ed., “Understanding the Novolac Synthesis Reaction,”
Frontiers of Polymers and Advanced Materials, Plenum Press, New York, 1994, 311-
318.22 C. N. Cascaval, D. Rosu, and F. Mustata, “Synthesis and Characterization of Some
para-Nonylphenol Formaldehyde Resins,” European Polymer Journal 30(3), 329-333
(1994).23 St. Miloshev, P. Novakov, Vl. Dimitrov, and I. Gitsov, “Synthesis of Novolac Resins:
2. Influence of the Reaction Medium on the Properties of the Novolac Oligomers,”
Polymer 32(16), 3067-3070 (1991).
15
equimolar meta-cresol to formaldehyde ratios, can be obtained by introducing a water
miscible solvent such as ethanol, methanol, or dioxane to the reaction. Small amounts of
solvent (0.5 moles solvent per mole cresol) increased reaction rates by reducing the
viscosity and improving homogeneity. Further increases in solvent, however, diluted the
reagent concentrations to an extent that decreased the rates of reaction.
2.3.5. Molecular weight and molecular weight distribution calculationsThe molecular weights and molecular weight distributions of phenolic oligomers
have been evaluated using gel permeation chromatography (GPC),24,25 NMR
spectroscopy,26 vapor-pressure osmometry,27 intrinsic viscosity,28 and more recently by
matrix assisted laser desorption/ionization time of flight mass spectrometry (MALDI –
TOFMS). 29
24 T. Yoshikawa, K. Kimura and S. Fujimura, “The Gel Permeation Chromatography of
Phenolic Compound,” Journal of Applied Polymer Science 15, 2513-2520 (1971).25 T. A. Yamagishi, M. Nomoto, S. Ito, S. Ishida, and Y. Nakamoto, “Preparation and
Characterization of High Molecular Weight Novolac Resins,” Polymer Bulletin 32, 501-
507 (1994).26 L. E. Bogan, Jr., “Determination of Cresol Novolac Copolymer and Branch Density
Using C-13 NMR Spectroscopy,” Macromolecules 24, 4807-4812 (1991).27 M. G. Kim, W. L. Nieh, T. Sellers, Jr., W. W. Wilson, and J. W. Mays, “Polymer
Solution Properties of a Phenol-Formaldehyde Resol Resin by Gel Permeation
Chromatography, Intrinsic-Viscosity, Static Light-Scattering, and Vapor Pressure
Osmometric Methods,” Industrial & Engineering Chemistry Research 31(3), 973-979
(1992).28 F. L. Tobiason, C. Chandler, and F. E. Schwarz, “Molecular Weight-Intrinsic Viscosity
Relationships for Phenol-Formaldehyde Novolak Resins,” Macromolecules 5(3), 321-325
(1972).29 H. Mandal and A. S. Hay, “M.A.L.D.I.-T.O.F. Mass Spectrometry Characterization of
4-Alkyl Substituted Phenol-Formaldehyde Novolac Type Resins,” Polymer 38(26), 6267-
6271 (1997).
16
The most widely used molecular weight characterization method has been GPC
which separates compounds based on hydrodynamic volume. State-of-the-art GPC
instruments are equipped with a concentration detector (e.g., differential refractometer,
UV and/or IR) in combination with viscosity or light scattering. A viscosity detector
provides in-line solution viscosity data at each elution volume, which in combination
with a concentration measurement, can be converted to specific viscosity. Since the
polymer concentration at each elution volume is quite dilute, the specific viscosity is
considered a reasonable approximation for the dilute solution intrinsic viscosity. The plot
of log[η]M vs. elution volume (where [η] is the intrinsic viscosity) provides a universal
calibration curve where absolute molecular weights of a variety of polymers can be
obtained. Unfortunately, many reported analyses for phenolic oligomers and resins are
simply based on polystyrene standards and only provide relative molecular weights
instead of absolute numbers.
Dargaville et al.30 and Yoshikawa et al.24 recognized the difficulties in obtaining
accurate GPC molecular weights of phenolic resins due to large amounts of isomers and
their associated differences in hydrodynamic sizes. These workers generated GPC
calibration curves using a series of low molecular weight model novolac compounds: (1)
linear compounds with only ortho-ortho methylene linkages, (2) compounds with ortho-
ortho methylene linked backbones and where each unit had a pendent para-para
methylene linked unit, and (3) compounds with ortho-ortho methylene linked backbones
and where each unit had a pendent para-ortho methylene linked unit.30 For a given
molecular weight, the hydrodynamic volume of oligomers with only the ortho-ortho
methylene links was smaller than the others. It was reasoned that the reduced
hydrodynamic volume was caused by “extra” intramolecular hydrogen bonding in high-
ortho novolacs, which was a similar argument to that suggested previously by Yoshikawa
et al.24 Based on the GPC calibration curves of the model compounds and their known
30 T. R. Dargaville, F. N. Guerzoni, M. G. Looney, D. A. Shipp, D. H. Solomon, and X.
Zhang, “Determination of Molecular Weight Distribution of Novolac Resins by Gel
Permeation Chromatography,” Journal of Polymer Science. Part A: Polymer Chemistry
35(8), 1399-1407 (1997).

17
chemical structures, simulated calibration curves were generated for idealized 100%
ortho-para methylene linked oligomers and for 100% para-para linked oligomers.
GPC chromatograms for a series of commercial novolacs, including resins with
statistical distributions of ortho and para linkages and high ortho novolac resins were
measured. Carbon-13 NMR provided the relative compositions of o,o, o,p, and p,p
linked methylene groups. Molecular weights from GPC were calculated by considering
the fractions of each type of linkage multiplied by the MW calculated from each of the 3
o,o (experimental), o,p (simulated), and o,o (simulated) GPC calibration curves. Good
agreement was found between the resin molecular weights measured from 1H NMR and
the interpolated GPC numbers for oligomers up to an average of 4-5 units per chain,
whereas more deviation was observed for higher molecular weights. This was attributed
to complicated intramolecular hydrogen bonding in the higher molecular weight
materials. Another factor may be that branching becomes significant in the higher
molecular weight materials and the hydrodynamic volume effects of architecture are also
complicated.1H NMR integrations of methylene and aromatic regions can be used to calculate
the number average molecular weights of novolac resins.30
[CH2]/[Ar] = (2n-2)/(3n+2) (2. 1)
where [CH2]/[Ar] is the ratio of methylene protons to aromatic protons and n is the
number of phenolic units. The method is quite accurate for novolacs with less than 8
repeat units.
Solution 13C NMR has been used extensively to examine the chemical structures
of phenolic resins.26,31 By ratioing the integration of peaks, degree of polymerization,
number average molecular weights, degrees of branching, numbers of free ortho and para
positions, and isomer distributions have been evaluated. A typical 13C NMR spectrum of
a novolac resin shows three regions (Table 2. 3): the methylene linkages resonate
between 30 and 40 ppm; the peaks between 146-157 ppm are due to hydroxyl substituted
31 R. A. Pethrick and B. Thomson, “13C Nuclear Magnetic Resonance Studies of Phenol-
Formaldehyde Resins 1-Model Compounds,” British Polymer Journal 18(3), 171-180
(1986).
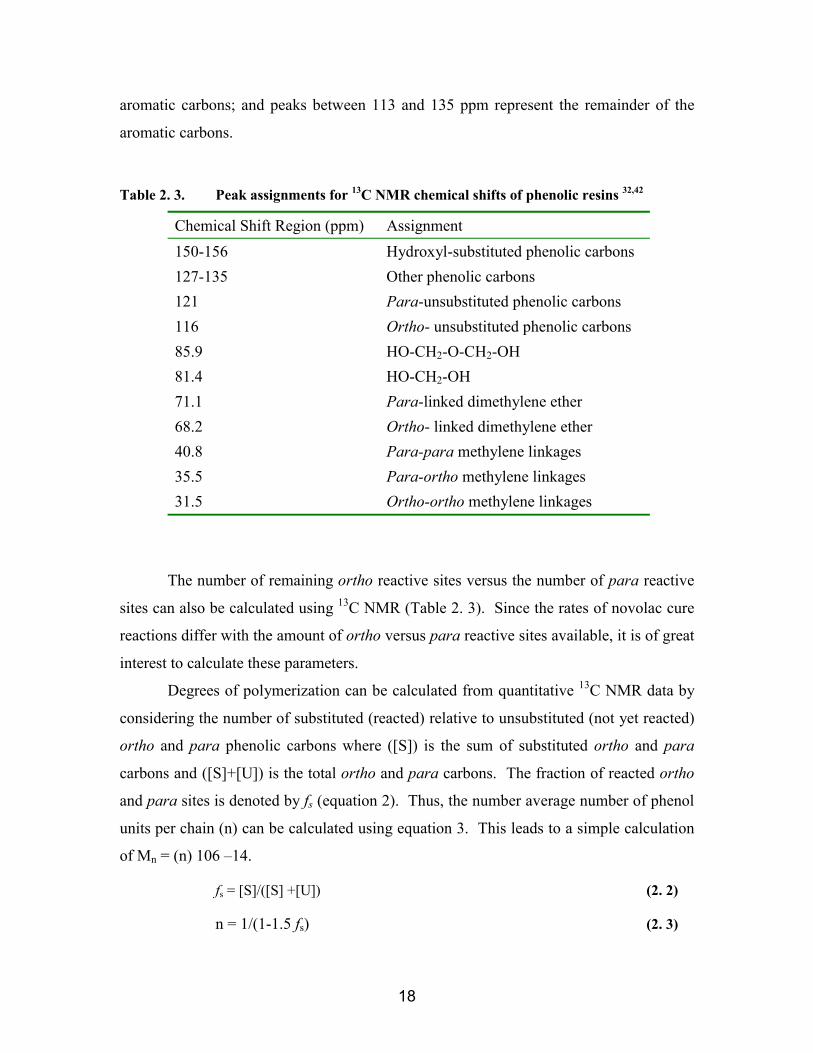
18
aromatic carbons; and peaks between 113 and 135 ppm represent the remainder of the
aromatic carbons.
Table 2. 3. Peak assignments for 13C NMR chemical shifts of phenolic resins 32,42
Chemical Shift Region (ppm) Assignment150-156 Hydroxyl-substituted phenolic carbons127-135 Other phenolic carbons121 Para-unsubstituted phenolic carbons116 Ortho- unsubstituted phenolic carbons85.9 HO-CH2-O-CH2-OH81.4 HO-CH2-OH71.1 Para-linked dimethylene ether68.2 Ortho- linked dimethylene ether40.8 Para-para methylene linkages35.5 Para-ortho methylene linkages31.5 Ortho-ortho methylene linkages
The number of remaining ortho reactive sites versus the number of para reactive
sites can also be calculated using 13C NMR (Table 2. 3). Since the rates of novolac cure
reactions differ with the amount of ortho versus para reactive sites available, it is of great
interest to calculate these parameters.
Degrees of polymerization can be calculated from quantitative 13C NMR data by
considering the number of substituted (reacted) relative to unsubstituted (not yet reacted)
ortho and para phenolic carbons where ([S]) is the sum of substituted ortho and para
carbons and ([S]+[U]) is the total ortho and para carbons. The fraction of reacted ortho
and para sites is denoted by fs (equation 2). Thus, the number average number of phenol
units per chain (n) can be calculated using equation 3. This leads to a simple calculation
of Mn = (n) 106 –14.
fs = [S]/([S] +[U]) (2. 2)
n = 1/(1-1.5 fs) (2. 3)
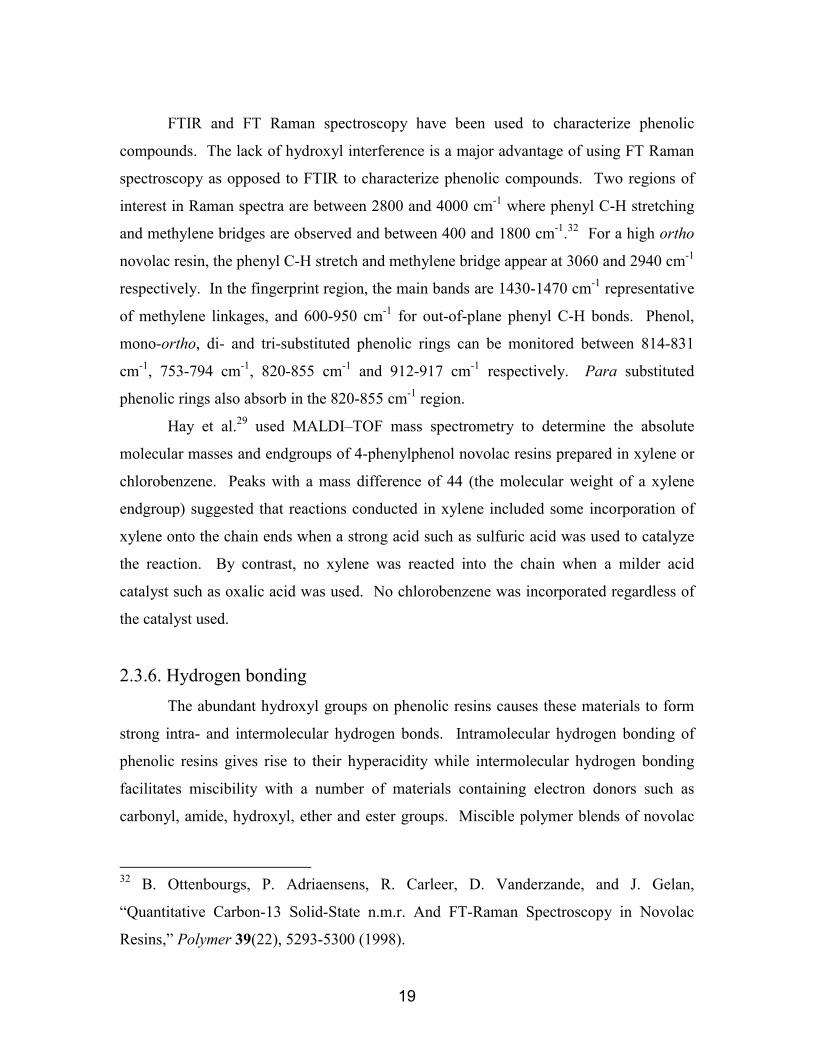
19
FTIR and FT Raman spectroscopy have been used to characterize phenolic
compounds. The lack of hydroxyl interference is a major advantage of using FT Raman
spectroscopy as opposed to FTIR to characterize phenolic compounds. Two regions of
interest in Raman spectra are between 2800 and 4000 cm-1 where phenyl C-H stretching
and methylene bridges are observed and between 400 and 1800 cm-1.32 For a high ortho
novolac resin, the phenyl C-H stretch and methylene bridge appear at 3060 and 2940 cm-1
respectively. In the fingerprint region, the main bands are 1430-1470 cm-1 representative
of methylene linkages, and 600-950 cm-1 for out-of-plane phenyl C-H bonds. Phenol,
mono-ortho, di- and tri-substituted phenolic rings can be monitored between 814-831
cm-1, 753-794 cm-1, 820-855 cm-1 and 912-917 cm-1 respectively. Para substituted
phenolic rings also absorb in the 820-855 cm-1 region.
Hay et al.29 used MALDI–TOF mass spectrometry to determine the absolute
molecular masses and endgroups of 4-phenylphenol novolac resins prepared in xylene or
chlorobenzene. Peaks with a mass difference of 44 (the molecular weight of a xylene
endgroup) suggested that reactions conducted in xylene included some incorporation of
xylene onto the chain ends when a strong acid such as sulfuric acid was used to catalyze
the reaction. By contrast, no xylene was reacted into the chain when a milder acid
catalyst such as oxalic acid was used. No chlorobenzene was incorporated regardless of
the catalyst used.
2.3.6. Hydrogen bondingThe abundant hydroxyl groups on phenolic resins causes these materials to form
strong intra- and intermolecular hydrogen bonds. Intramolecular hydrogen bonding of
phenolic resins gives rise to their hyperacidity while intermolecular hydrogen bonding
facilitates miscibility with a number of materials containing electron donors such as
carbonyl, amide, hydroxyl, ether and ester groups. Miscible polymer blends of novolac
32 B. Ottenbourgs, P. Adriaensens, R. Carleer, D. Vanderzande, and J. Gelan,
“Quantitative Carbon-13 Solid-State n.m.r. And FT-Raman Spectroscopy in Novolac
Resins,” Polymer 39(22), 5293-5300 (1998).
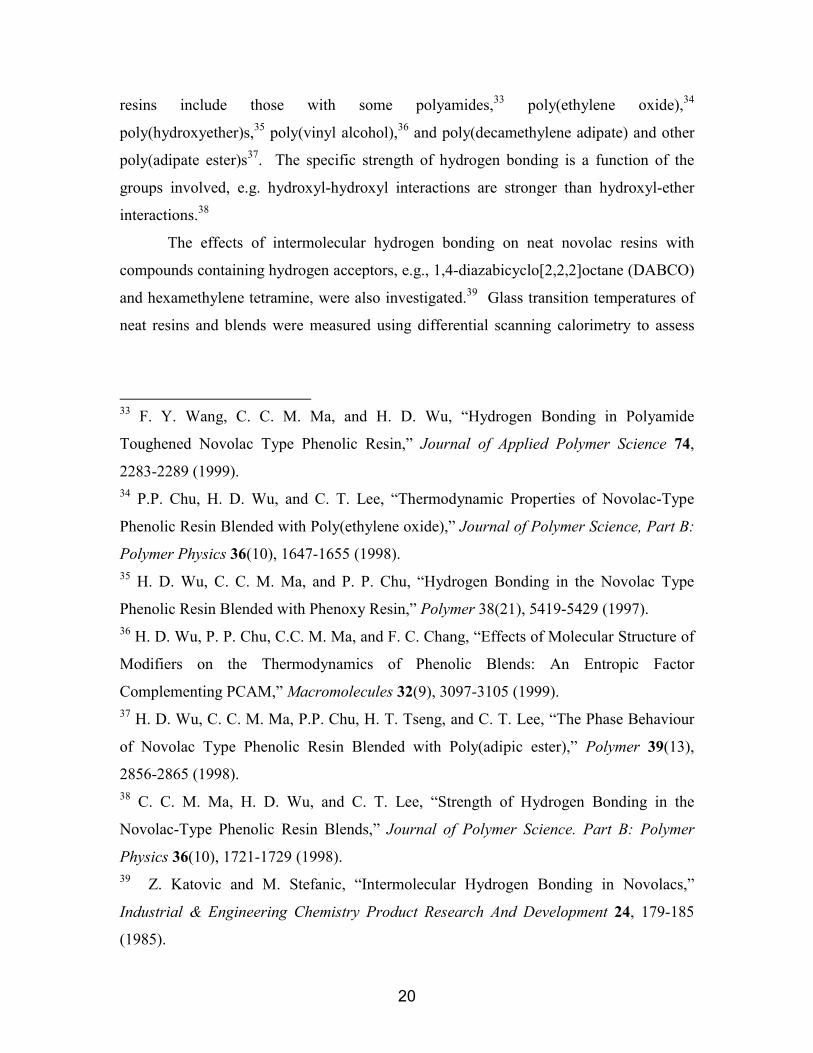
20
resins include those with some polyamides,33 poly(ethylene oxide),34
poly(hydroxyether)s,35 poly(vinyl alcohol),36 and poly(decamethylene adipate) and other
poly(adipate ester)s37. The specific strength of hydrogen bonding is a function of the
groups involved, e.g. hydroxyl-hydroxyl interactions are stronger than hydroxyl-ether
interactions.38
The effects of intermolecular hydrogen bonding on neat novolac resins with
compounds containing hydrogen acceptors, e.g., 1,4-diazabicyclo[2,2,2]octane (DABCO)
and hexamethylene tetramine, were also investigated.39 Glass transition temperatures of
neat resins and blends were measured using differential scanning calorimetry to assess
33 F. Y. Wang, C. C. M. Ma, and H. D. Wu, “Hydrogen Bonding in Polyamide
Toughened Novolac Type Phenolic Resin,” Journal of Applied Polymer Science 74,
2283-2289 (1999).34 P.P. Chu, H. D. Wu, and C. T. Lee, “Thermodynamic Properties of Novolac-Type
Phenolic Resin Blended with Poly(ethylene oxide),” Journal of Polymer Science, Part B:
Polymer Physics 36(10), 1647-1655 (1998).35 H. D. Wu, C. C. M. Ma, and P. P. Chu, “Hydrogen Bonding in the Novolac Type
Phenolic Resin Blended with Phenoxy Resin,” Polymer 38(21), 5419-5429 (1997).36 H. D. Wu, P. P. Chu, C.C. M. Ma, and F. C. Chang, “Effects of Molecular Structure of
Modifiers on the Thermodynamics of Phenolic Blends: An Entropic Factor
Complementing PCAM,” Macromolecules 32(9), 3097-3105 (1999).37 H. D. Wu, C. C. M. Ma, P.P. Chu, H. T. Tseng, and C. T. Lee, “The Phase Behaviour
of Novolac Type Phenolic Resin Blended with Poly(adipic ester),” Polymer 39(13),
2856-2865 (1998).38 C. C. M. Ma, H. D. Wu, and C. T. Lee, “Strength of Hydrogen Bonding in the
Novolac-Type Phenolic Resin Blends,” Journal of Polymer Science. Part B: Polymer
Physics 36(10), 1721-1729 (1998).39 Z. Katovic and M. Stefanic, “Intermolecular Hydrogen Bonding in Novolacs,”
Industrial & Engineering Chemistry Product Research And Development 24, 179-185
(1985).

21
the degrees of hydrogen bonding. Hydrogen-bonding interactions of novolac resins with
electron donor sites such as oxygen, nitrogen, or chlorine atoms resulted in increased Tgs.
The propensity for dry novolac resins to absorb water at room temperature under
100% humidity is another indication that strong hydrogen bonds form. Approximately
15 wt% water is absorbed after 4 days which corresponds to one water molecule per
hydroxyl group.39
Holland et al.40 conducted dielectric measurements on novolac resins to evaluate
the degrees of inter- and intramolecular hydrogen bonding. The frequency dependence of
complex permittivity (ε*) within a relaxation region can be described with a Havriliak
and Negami function (HN function, equation 4)
γβοτω
εεεε
)) (i -
S
+(1+= ∞
∞∗ (2. 4)
where εS and ε∞ are the relaxed and unrelaxed dielectric constants, � is the angular
frequency, τo is the relaxation time, and β and γ are fitting parameters. The complex
permittivity is comprised of permittivity (ε’) and dielectric loss (ε”). Fitting parameters
in the HN function are related to shape parameters, m and n, which describe the limiting
behavior of dielectric loss (ε”) at low and high frequencies respectively. Intermolecular
(characterized by “m”) and intramolecular (characterized by ‘n’) hydrogen bonding can
be correlated with m and n values which range from 0 to 1 (where lower values
correspond to stronger hydrogen bonding). For one novolac resin examined (Mn = 1526
determined via GPC using polystyrene standards, MWD = 2.6, Tg = 57°C), m was 0.52
and n was 0.2. These results were considered indicative of strong intramolecular
hydrogen bonding within the novolac structures.
2.3.7. Novolac crosslinking with Hexamethylene Tetramine (HMTA)The most common crosslinking agent for novolac resins is HMTA which provides
a source of formaldehyde. Novolac resins prepared from a P/F ratio of 1/0.8 can be cured
40 C. Holland, W. Stark, and G. Hinrichsen, “Dielectric Investigations on Novolac
Phenol-Formaldehyde Resins,” Acta Polymer 46, 64-67 (1995).
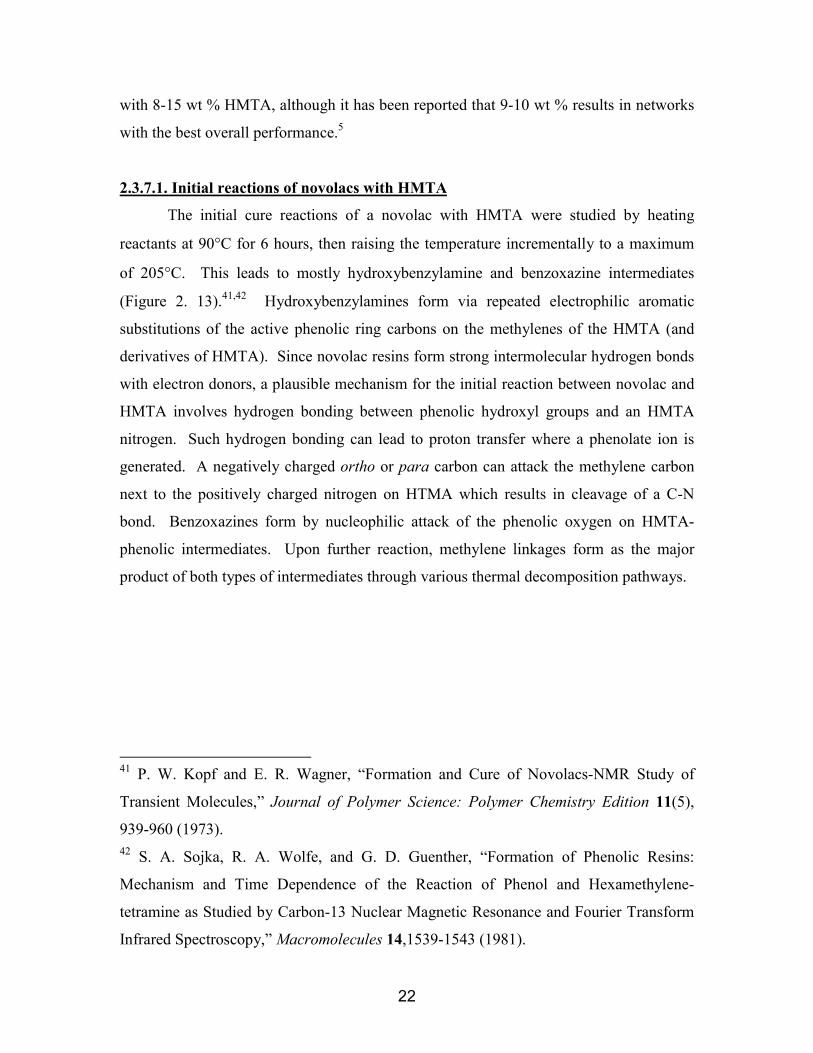
22
with 8-15 wt % HMTA, although it has been reported that 9-10 wt % results in networks
with the best overall performance.5
2.3.7.1. Initial reactions of novolacs with HMTA
The initial cure reactions of a novolac with HMTA were studied by heating
reactants at 90°C for 6 hours, then raising the temperature incrementally to a maximum
of 205°C. This leads to mostly hydroxybenzylamine and benzoxazine intermediates
(Figure 2. 13).41,42 Hydroxybenzylamines form via repeated electrophilic aromatic
substitutions of the active phenolic ring carbons on the methylenes of the HMTA (and
derivatives of HMTA). Since novolac resins form strong intermolecular hydrogen bonds
with electron donors, a plausible mechanism for the initial reaction between novolac and
HMTA involves hydrogen bonding between phenolic hydroxyl groups and an HMTA
nitrogen. Such hydrogen bonding can lead to proton transfer where a phenolate ion is
generated. A negatively charged ortho or para carbon can attack the methylene carbon
next to the positively charged nitrogen on HTMA which results in cleavage of a C-N
bond. Benzoxazines form by nucleophilic attack of the phenolic oxygen on HMTA-
phenolic intermediates. Upon further reaction, methylene linkages form as the major
product of both types of intermediates through various thermal decomposition pathways.
41 P. W. Kopf and E. R. Wagner, “Formation and Cure of Novolacs-NMR Study of
Transient Molecules,” Journal of Polymer Science: Polymer Chemistry Edition 11(5),
939-960 (1973).42 S. A. Sojka, R. A. Wolfe, and G. D. Guenther, “Formation of Phenolic Resins:
Mechanism and Time Dependence of the Reaction of Phenol and Hexamethylene-
tetramine as Studied by Carbon-13 Nuclear Magnetic Resonance and Fourier Transform
Infrared Spectroscopy,” Macromolecules 14,1539-1543 (1981).
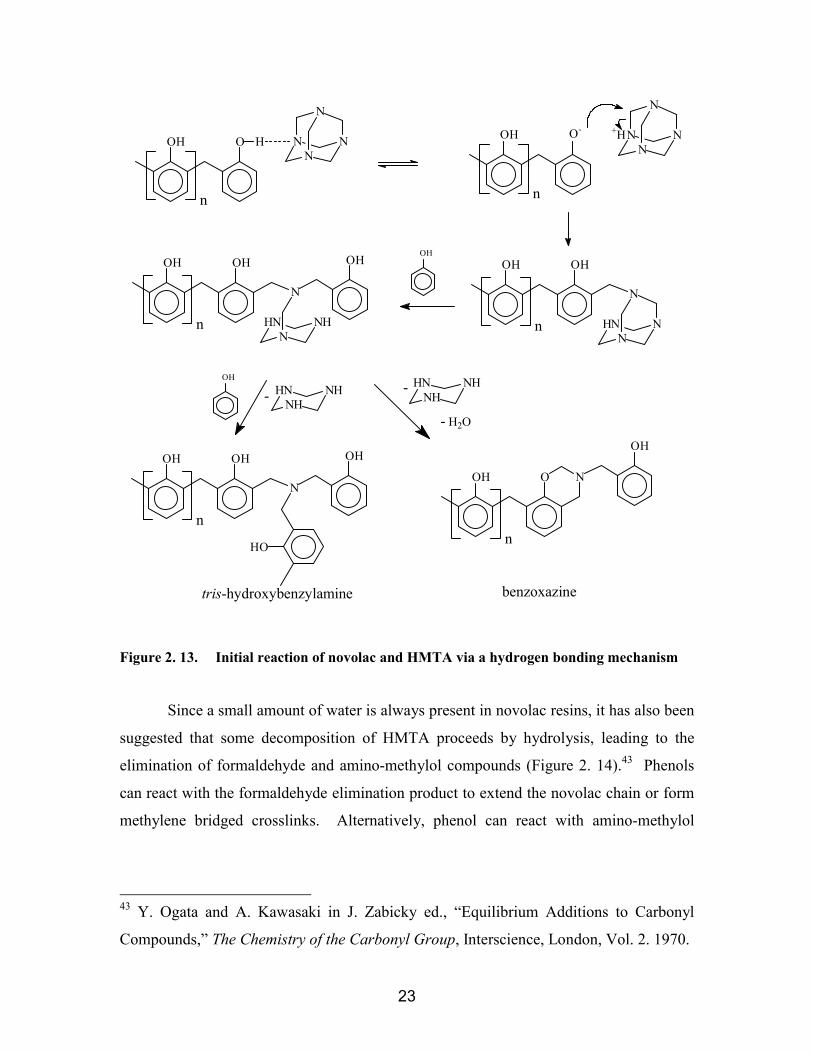
23
NHN
N
N
OH OH
n
+HN
N
N
NOH O-
nn
OH O HN
N
N
N
n
OH
NHN
N
NH
OH OH
n
NHHN NH
OH
N
OH OH
HO
-
n
OH
OH
OH
OH O N
NHHN NH -
- H2O
benzoxazinetris-hydroxybenzylamine
Figure 2. 13. Initial reaction of novolac and HMTA via a hydrogen bonding mechanism
Since a small amount of water is always present in novolac resins, it has also been
suggested that some decomposition of HMTA proceeds by hydrolysis, leading to the
elimination of formaldehyde and amino-methylol compounds (Figure 2. 14).43 Phenols
can react with the formaldehyde elimination product to extend the novolac chain or form
methylene bridged crosslinks. Alternatively, phenol can react with amino-methylol
43 Y. Ogata and A. Kawasaki in J. Zabicky ed., “Equilibrium Additions to Carbonyl
Compounds,” The Chemistry of the Carbonyl Group, Interscience, London, Vol. 2. 1970.
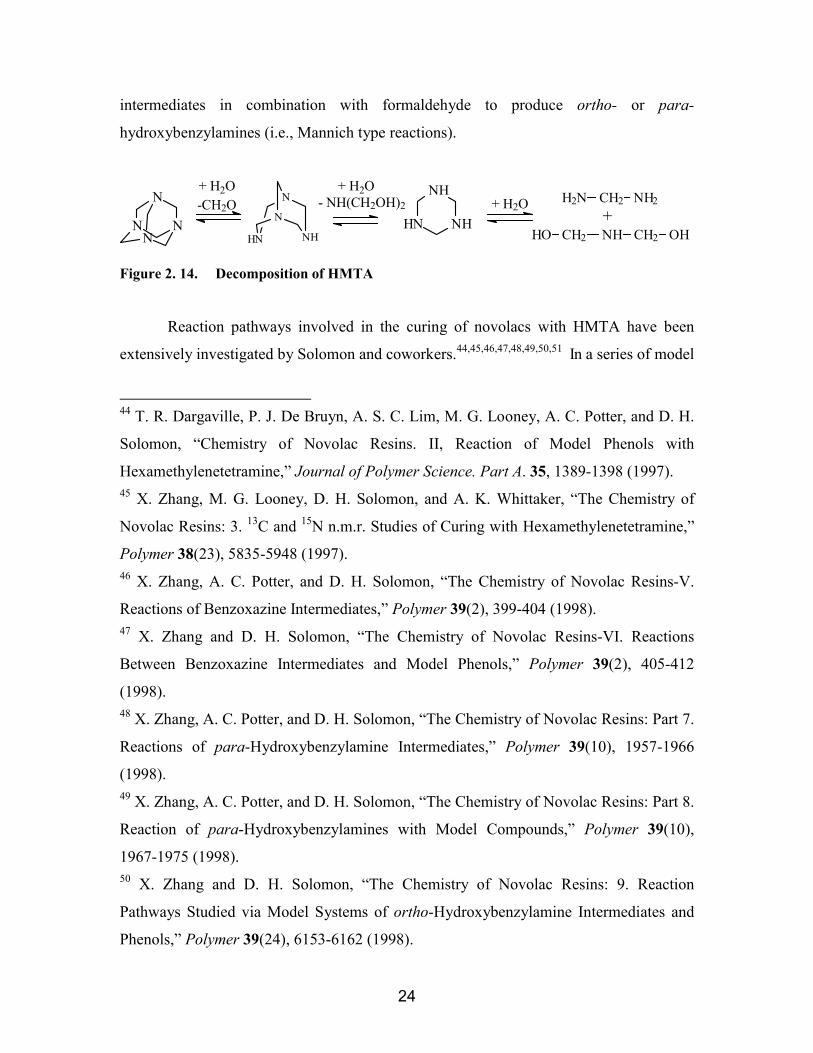
24
intermediates in combination with formaldehyde to produce ortho- or para-
hydroxybenzylamines (i.e., Mannich type reactions).
+ H2O+ H2O
N N
N
N
-CH2ON
HN
N
NH
- NH(CH2OH)2
HN NH
NH H2N CH2 NH2
CH2 NH CH2 OHHO+
+ H2O
Figure 2. 14. Decomposition of HMTA
Reaction pathways involved in the curing of novolacs with HMTA have been
extensively investigated by Solomon and coworkers.44,45,46,47,48,49,50,51 In a series of model
44 T. R. Dargaville, P. J. De Bruyn, A. S. C. Lim, M. G. Looney, A. C. Potter, and D. H.
Solomon, “Chemistry of Novolac Resins. II, Reaction of Model Phenols with
Hexamethylenetetramine,” Journal of Polymer Science. Part A. 35, 1389-1398 (1997).45 X. Zhang, M. G. Looney, D. H. Solomon, and A. K. Whittaker, “The Chemistry of
Novolac Resins: 3. 13C and 15N n.m.r. Studies of Curing with Hexamethylenetetramine,”
Polymer 38(23), 5835-5948 (1997).46 X. Zhang, A. C. Potter, and D. H. Solomon, “The Chemistry of Novolac Resins-V.
Reactions of Benzoxazine Intermediates,” Polymer 39(2), 399-404 (1998).47 X. Zhang and D. H. Solomon, “The Chemistry of Novolac Resins-VI. Reactions
Between Benzoxazine Intermediates and Model Phenols,” Polymer 39(2), 405-412
(1998).48 X. Zhang, A. C. Potter, and D. H. Solomon, “The Chemistry of Novolac Resins: Part 7.
Reactions of para-Hydroxybenzylamine Intermediates,” Polymer 39(10), 1957-1966
(1998).49 X. Zhang, A. C. Potter, and D. H. Solomon, “The Chemistry of Novolac Resins: Part 8.
Reaction of para-Hydroxybenzylamines with Model Compounds,” Polymer 39(10),
1967-1975 (1998).50 X. Zhang and D. H. Solomon, “The Chemistry of Novolac Resins: 9. Reaction
Pathways Studied via Model Systems of ortho-Hydroxybenzylamine Intermediates and
Phenols,” Polymer 39(24), 6153-6162 (1998).

25
studies where 2,6-xylenol and/or 2,4-xylenol were reacted with HMTA, these workers
found that the types of linkages formed were affected by the initial chemical structure of
the novolac, i.e. amount of ortho vs. para reactive positions, the amount of HMTA, and
the pH. Reaction intermediates for the cure were identified, mostly via FTIR, 13C NMR
and 15N NMR.
As previously described, the main intermediates generated from the initial
reaction between ortho reactive sites on novolac resins and HMTA are
hydroxybenzylamines and benzoxazines.45 Triazines, diamines, and in the presence of
trace amounts of water, benzyl alcohols and ethers also form (Figure 2. 15). Similar
intermediates, with the exception of benzoxazines, are also observed when para sites
react with HMTA.
The thermolysis rates to form methylene linkages depend on the stabilities of
hydroxybenzylamine and benzoxazine intermediates. Comparatively, ortho-linked
hydroxybenzylamine intermediates are more stable than para-linked structures because
six-membered rings can form between the nitrogen and phenolic hydroxyl groups via
intramolecular hydrogen bonding. For the same reason, benzoxazines are the most stable
intermediates and decompose only at higher temperatures (185°C).46 If a high ortho-
novolac resin is cured with HMTA, the reaction occurs at lower temperatures due to
formation of relatively unstable intermediates and the amount of side products is low. If,
however, a typical novolac is used, the reaction temperature must be higher to decompose
the more thermally stable ortho intermediates, and the amount of nitrogen containing side
products is significantly higher.47,48
51 A. S. C. Lim, D. H. Solomon, and X. Zhang, “Chemistry of Novolac Resins. X.
Polymerization Studies of HMTA and Strategically Synthesized Model Compounds,”
Journal of Polymer Science Part A: Polymer Chemistry 37, 1347-1355 (1999).
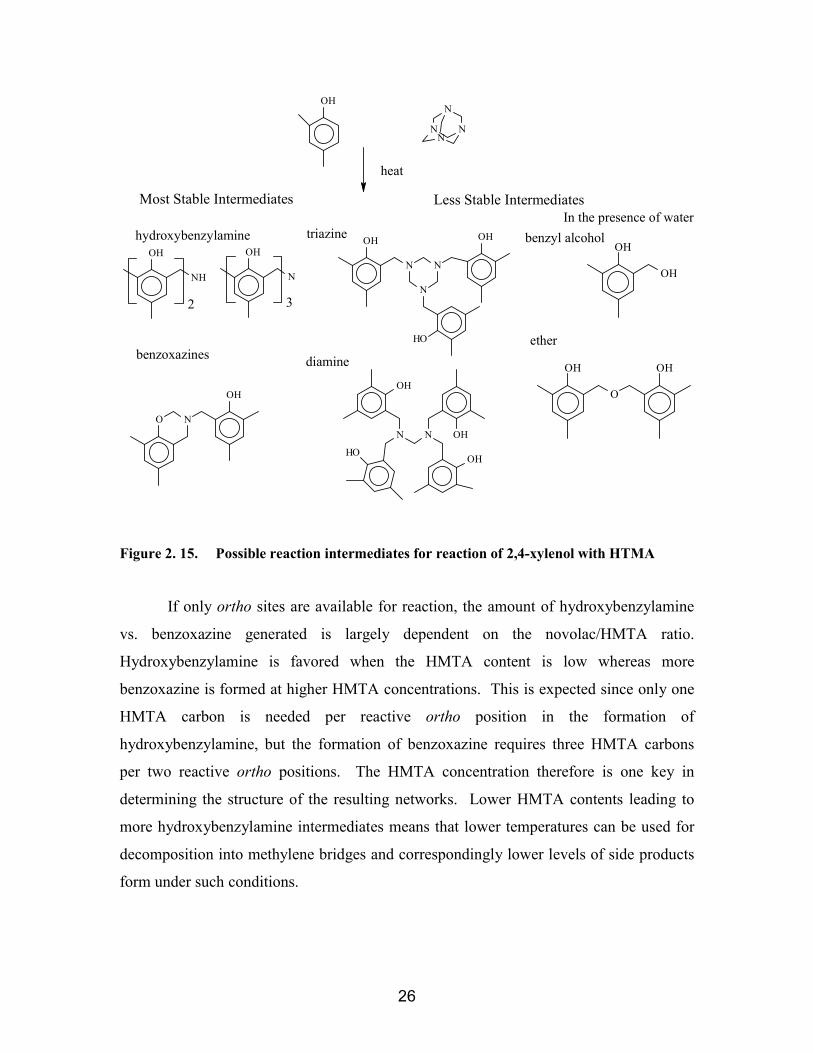
26
ether
benzyl alcoholIn the presence of water
OH
O
OH
OH
OH
OH
N N
N
N
NO
OH
OH
N
32
OH
NHN
N
N
OH OH
HO
N N
OH
OH
OHHO
heat
benzoxazines
hydroxybenzylamine triazine
diamine
Most Stable Intermediates Less Stable Intermediates
Figure 2. 15. Possible reaction intermediates for reaction of 2,4-xylenol with HTMA
If only ortho sites are available for reaction, the amount of hydroxybenzylamine
vs. benzoxazine generated is largely dependent on the novolac/HMTA ratio.
Hydroxybenzylamine is favored when the HMTA content is low whereas more
benzoxazine is formed at higher HMTA concentrations. This is expected since only one
HMTA carbon is needed per reactive ortho position in the formation of
hydroxybenzylamine, but the formation of benzoxazine requires three HMTA carbons
per two reactive ortho positions. The HMTA concentration therefore is one key in
determining the structure of the resulting networks. Lower HMTA contents leading to
more hydroxybenzylamine intermediates means that lower temperatures can be used for
decomposition into methylene bridges and correspondingly lower levels of side products
form under such conditions.

27
2.3.7.2. Hydroxybenzylamine and Benzoxazine decompositions in novolac/HMTA
cures
Thermal Decomposition of Hydroxybenzylamines. Depending on the concentration of
HMTA and mobility of the system, hydroxybenzylamine and benzoxazine intermediates
react by a number of pathways to form crosslinked novolac networks. Tris-
hydroxybenzylamines eliminate benzoquinone methide between 90-120°C to form bis-
hydroxybenzylamines, which decompose to methylene linkages with elimination of
CH2=NH at higher temperatures (Figure 2. 16).47
- CH2 NH
OH OH
NH
OH
23
N
OH OCH2
-
Figure 2. 16. Thermal decomposition of hydroxybenzylamine
Thermal Decomposition of Benzoxazines. Thermal decomposition of benzoxazines does
not occur substantially until the temperature reaches ~160°C. This begins with proton
transfer from a phenolic hydroxyl group to a nitrogen. Cleavage of the C-O bond with
water generates a tertiary hydroxymethylamine which can eliminate formaldehyde, then
CH2=NH, to form methylene linkages (Figure 2. 17A). Alternatively, C-N bond cleavage
in the benzoxazine leads to elimination of a benzoquinone methide, which can react with
phenols to primarily yield the product methylene bridged species (Figure 2. 17B).46
Further decomposition of benzoxazines can also lead to a variety of side products in
small amounts.

28
B
A
-HCHO
- CH2=NH
OH OH
OH
NH
OHOH
N
OH
CH2
OH
NO
OH
NHO
O
OH2C
NHO
+
H2O
OH
Figure 2. 17. Thermal decomposition of benzoxazine
Reactions of Benzoxazines with Phenols. In the presence of 2,4-xylenol, benzoxazine
intermediates react at lower temperatures (~90°C) to form hydroxybenzylamines (Figure
2. 18), which can then decompose to ortho-ortho methylene linkages (as described in
Figure 2. 16).47 The reaction between benzoxazine and free ortho reactive positions on
2,4-xylenol occurs via electrophilic aromatic substitution facilitated by hydrogen bonding
between benzoxazine oxygen and phenolic hydroxyl groups (Figure 2. 18).
OH
NO
OHNOH
OHHO
Figure 2. 18. Reaction of benzoxazines and 2,4-xylenol
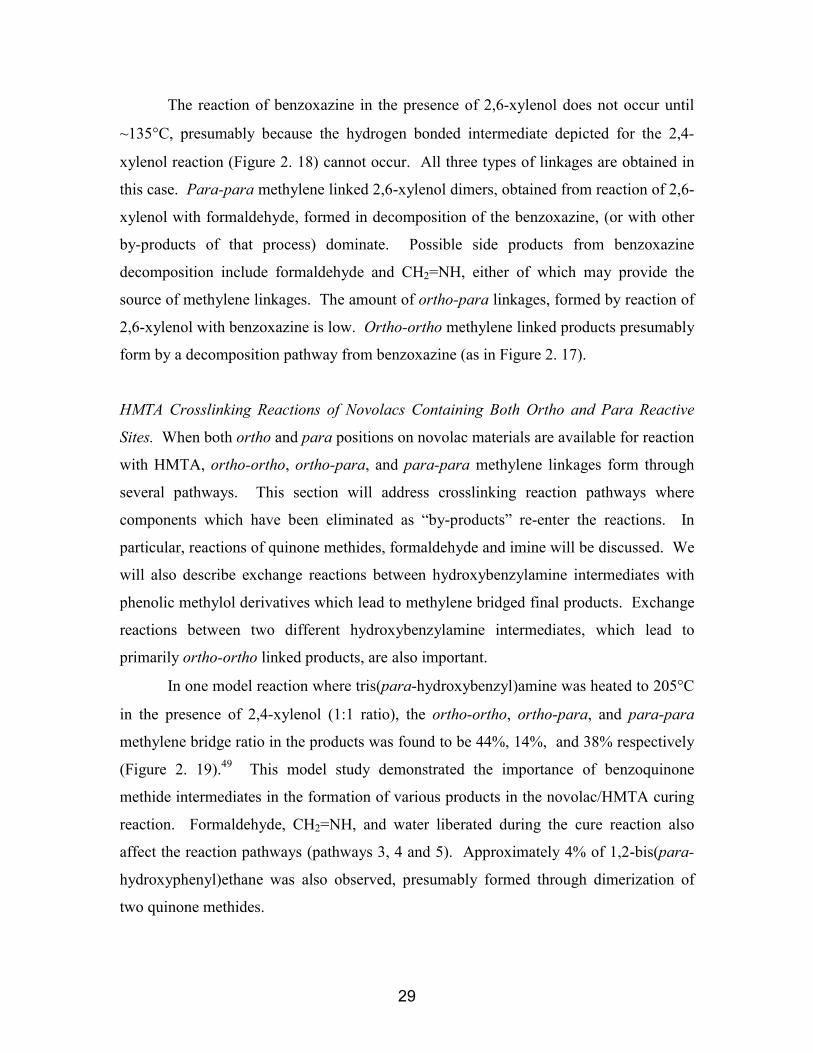
29
The reaction of benzoxazine in the presence of 2,6-xylenol does not occur until
~135°C, presumably because the hydrogen bonded intermediate depicted for the 2,4-
xylenol reaction (Figure 2. 18) cannot occur. All three types of linkages are obtained in
this case. Para-para methylene linked 2,6-xylenol dimers, obtained from reaction of 2,6-
xylenol with formaldehyde, formed in decomposition of the benzoxazine, (or with other
by-products of that process) dominate. Possible side products from benzoxazine
decomposition include formaldehyde and CH2=NH, either of which may provide the
source of methylene linkages. The amount of ortho-para linkages, formed by reaction of
2,6-xylenol with benzoxazine is low. Ortho-ortho methylene linked products presumably
form by a decomposition pathway from benzoxazine (as in Figure 2. 17).
HMTA Crosslinking Reactions of Novolacs Containing Both Ortho and Para Reactive
Sites. When both ortho and para positions on novolac materials are available for reaction
with HMTA, ortho-ortho, ortho-para, and para-para methylene linkages form through
several pathways. This section will address crosslinking reaction pathways where
components which have been eliminated as “by-products” re-enter the reactions. In
particular, reactions of quinone methides, formaldehyde and imine will be discussed. We
will also describe exchange reactions between hydroxybenzylamine intermediates with
phenolic methylol derivatives which lead to methylene bridged final products. Exchange
reactions between two different hydroxybenzylamine intermediates, which lead to
primarily ortho-ortho linked products, are also important.
In one model reaction where tris(para-hydroxybenzyl)amine was heated to 205°C
in the presence of 2,4-xylenol (1:1 ratio), the ortho-ortho, ortho-para, and para-para
methylene bridge ratio in the products was found to be 44%, 14%, and 38% respectively
(Figure 2. 19).49 This model study demonstrated the importance of benzoquinone
methide intermediates in the formation of various products in the novolac/HMTA curing
reaction. Formaldehyde, CH2=NH, and water liberated during the cure reaction also
affect the reaction pathways (pathways 3, 4 and 5). Approximately 4% of 1,2-bis(para-
hydroxyphenyl)ethane was also observed, presumably formed through dimerization of
two quinone methides.

30
or
or hydroxybenzylamine
HO
N
3 2HO
NH
HO OH
CH2 NH-
OH
OH
OH
CH2 NH
OHCH2NH2
OH
NH
OH
N
HO
OH
OH
OHCH2OH
2
HO
N
HO
NH
3
HO
N
OH
O
OH OH OH
OH
N
OH
OH
1.
2.
3.
5.
OH
OHCH2OH HO
N
3
4.
mainly
3HO
N
OH
+ para-para (44%) + ortho-para (14%) + ortho-ortho(38%)
para-para formation:
OCH2
ortho-para formation:
OCH2
CH HO
-NH3
OH
O
OH
HO
NH
2
CH HO
-
ortho-ortho formation:
dimerize
H2O-
-
- CH HO
OH
NH
OH
Figure 2. 19. Reaction pathways for formation of ortho-ortho, ortho-para, and para-parathrough the reaction of para-trishydroxybenzylamine and 2,4-xylenol

31
Para-para methylene linkages appeared first via hydroxybenzylamine
decomposition at lower temperatures (pathway 1 in Figure 20). Ortho-para methylene
linkages also formed at the lower reaction temperatures (pathway 2). Since the only
source of an ortho- methylene linked phenol product was the 2,4-xylenol starting
material, these mixed products must have formed by reaction of 2,4-xylenol with either a
para-hydroxybenzylamine or with a quinone methide eliminated in pathway 1. Ortho-
para methylene linkages also formed at higher reaction temperatures, which were
attributed to exchange reactions between a methylol derivative of 2,4-xylenol and a
hydroxybenzylamine (pathway 3). Ortho-ortho methylene linkages formed only at
higher temperatures via hydroxybenzylamine exchange and methylol dimerization
reactions described in pathways 4 and 5. The reactions depicted in pathway 4 involved
sequential exchanges between para- and ortho- substituted intermediates through
nucleophilic substitutions on hydroxybenzylamines. Since the amount of ortho-para
linked products was low, it was suggested that the major product of pathway 4 was the
ortho-ortho linkage. This is reasonable since the equilibrium of these exchange reactions
lies toward ortho-hydroxybenzylamines where hydrogen bonding provides stability.
These more thermally stable hydroxybenzylamines then decompose at higher
temperatures to form ortho-ortho linkages.
Small amounts of various phenolic side products incorporating groups such as
imines, amides, ethers and ethanes into the networks also form. A number of these side
products undergo further reactions which eventually lead to methylene linkages. Some
side products generally remain in the networks even after heating at 205°C.
Solomon et al. also investigated HMTA-phenolic reactions with somewhat larger
model compounds (e.g., 2 and 4 ring compounds), and established that similar reaction
pathways to those described previously occurred.51 For these model compounds (as
opposed to 1-ring model compounds) that are more representative of typical oligomeric
systems, increased molecular weight favored the formation of hydroxybenzylamines, but
not benzoxazines. This was suggested to be a steric effect.
Other crosslinking agents that provide sources of formaldehyde for methylene
linkages include paraformaldehyde and trioxane, but these have only achieved limited
importance. Quantitative 13C solid-state NMR and FT-Raman spectroscopy were used to

32
monitor the cure reactions of a high ortho-novolac resin using paraformaldehyde under
different conditions.32 The weight percent paraformaldehyde needed to achieve the
maximum crosslinking (1.5 moles formaldehyde per mole phenol) for the particular
novolac examined (Mn=430 g/mol determined via 13C NMR) was calculated to be 17.76
wt %. Eleven weight percent formaldehyde (1.18 moles formaldehyde relative to phenol)
was used in these studies so that phenol sites were in excess. The degree of conversion
was assessed by comparing the formaldehyde to phenol ratio in the polymer to 1.18. As
expected, higher temperatures and/or pressures lead to higher reaction conversions.
However, none of these reaction conversions reached 100%, and this was attributed to a
lack of mobility.
2.4. Resole resins and networks
2.4.1. Resole resin synthesesResoles are prepared under alkaline conditions using an excess of formaldehyde
over phenol (1:1 to 3:1) at typical temperatures of 60-80°C. The basic catalysts
commonly used are NaOH, Na2CO3, KOH, K2CO3, Ba(OH) 2, R4NOH, NH3, RNH2 and
R2NH.6 In aqueous solutions, ammonia and HMTA are easily hydrolyzed to amines and
also catalyze resole syntheses. Typical resole resins comprise a mixture of monomers,
dimers, trimers, and small amounts of higher molecular weight oligomers with multiple
methylol functional groups.
Resole syntheses entail substitution of formaldehyde (or formaldehyde
derivatives) on phenolic ortho and para positions (Figure 2. 20) followed by methylol
condensation reactions which form dimers and oligomers (Figure 2. 22). Under basic
conditions, phenolate rings are the reactive species for electrophilic aromatic substitution
reactions. A simplified mechanism is generally used to depict the formaldehyde
substitution on the phenol rings (Figure 2. 20). It should be noted that this mechanism
does not account for pH effects, the type of catalyst, or the formation of hemiformals.
Mixtures of mono-, di-, and tri-hydroxymethyl substituted phenols are produced.
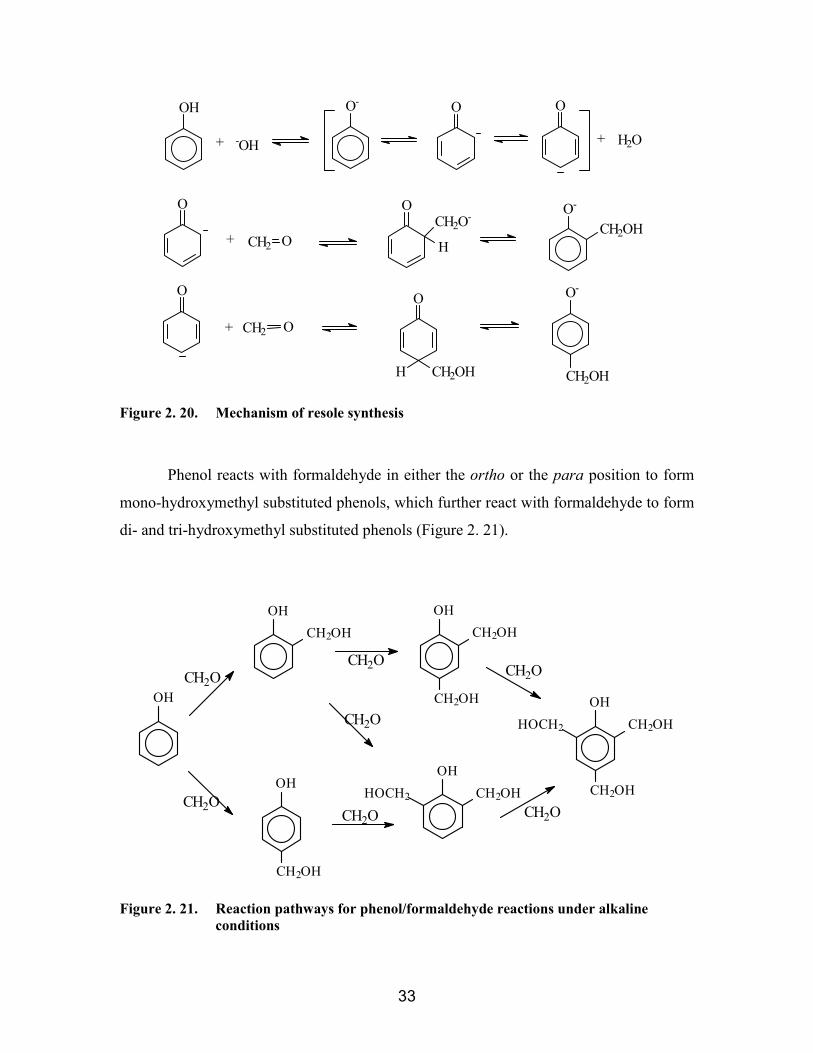
33
O
H CH2OH CH2OH
O-
CH2OHO-O
CH2O-
H
CH2 O
O
+
+
O
+ H2O
OOO-
-OH
CH2 O+
OH
Figure 2. 20. Mechanism of resole synthesis
Phenol reacts with formaldehyde in either the ortho or the para position to form
mono-hydroxymethyl substituted phenols, which further react with formaldehyde to form
di- and tri-hydroxymethyl substituted phenols (Figure 2. 21).
OHCH2OH
OHCH2OH
CH2OH OHCH2OHHOCH2
CH2OHOH
CH2OHHOCH2
OH
OH
CH2OH
CH2O
CH2OCH2O
CH2O
CH2OCH2O
CH2O
Figure 2. 21. Reaction pathways for phenol/formaldehyde reactions under alkalineconditions
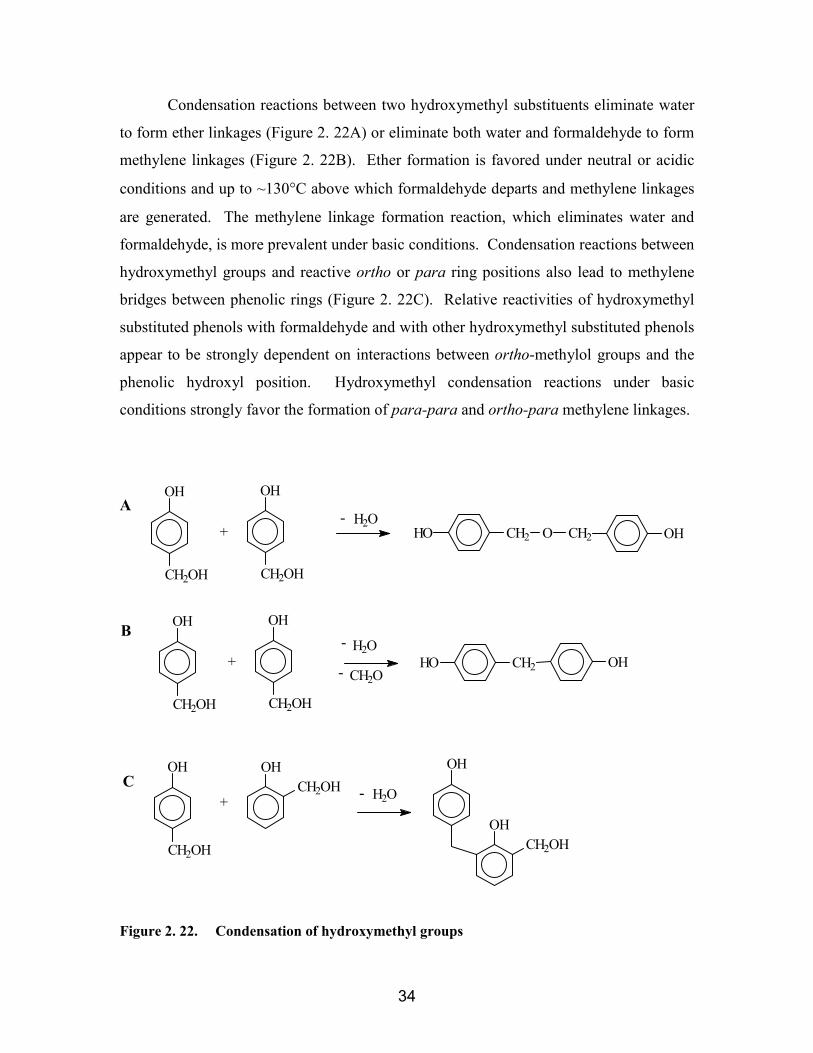
34
Condensation reactions between two hydroxymethyl substituents eliminate water
to form ether linkages (Figure 2. 22A) or eliminate both water and formaldehyde to form
methylene linkages (Figure 2. 22B). Ether formation is favored under neutral or acidic
conditions and up to ~130°C above which formaldehyde departs and methylene linkages
are generated. The methylene linkage formation reaction, which eliminates water and
formaldehyde, is more prevalent under basic conditions. Condensation reactions between
hydroxymethyl groups and reactive ortho or para ring positions also lead to methylene
bridges between phenolic rings (Figure 2. 22C). Relative reactivities of hydroxymethyl
substituted phenols with formaldehyde and with other hydroxymethyl substituted phenols
appear to be strongly dependent on interactions between ortho-methylol groups and the
phenolic hydroxyl position. Hydroxymethyl condensation reactions under basic
conditions strongly favor the formation of para-para and ortho-para methylene linkages.
CH2OHOH
OH
+CH2OH
OH
CH2OH
OH
CH2OH
OH
CH2OH
OH
+ OHCH2HO
A
B
C
OHCH2HO O CH2+
CH2OH
OH
CH2OH
OH
- H2O
H2O-
CH2O-
H2O-
Figure 2. 22. Condensation of hydroxymethyl groups

35
Quinone methides are the key intermediates in both resole resin syntheses and
crosslinking reactions. They form by dehydration of hydroxymethylphenols or
dimethylether linkages (Figure 2. 23).
OHCH2 OH
OCH2
CH2
OHO CH2
OH OCH2
-H2O
-H2O2
Figure 2. 23. Dehydration of methylols or benzylic ethers to form quinone methides
Resonance forms for quinone methides include both quinoid and benzoid
structures (Figure 2. 24). The oligomerization or crosslinking reaction proceeds by
nucleophilic attack on the quinone methide carbon.
O-
CH2+
O
CH2
O-
CH2+
OCH2
Figure 2. 24. Resonance of quinone methides
Ortho-quinone methides are difficult to isolate due to their high reactivity which
leads to rapid Diels-Alder dimerization or trimerization (Figure 2. 25). At 150°C, a
partial retro-Diels-Alder reaction of the trimer can occur to form ortho-quinone methide
and bis(2-hydroxy-3,5-dimethylphenyl) ethane (dimer).52
52 K. Lenghaus, G. G. Qiao, and D. H. Solomon, “Model Studies of the Curing of Resole
Phenol-Formaldehyde Resins Part 1. The Behavior of ortho Quinone Methide in a Curing
Resin,” Polymer 41, 1973-1979 (2000).
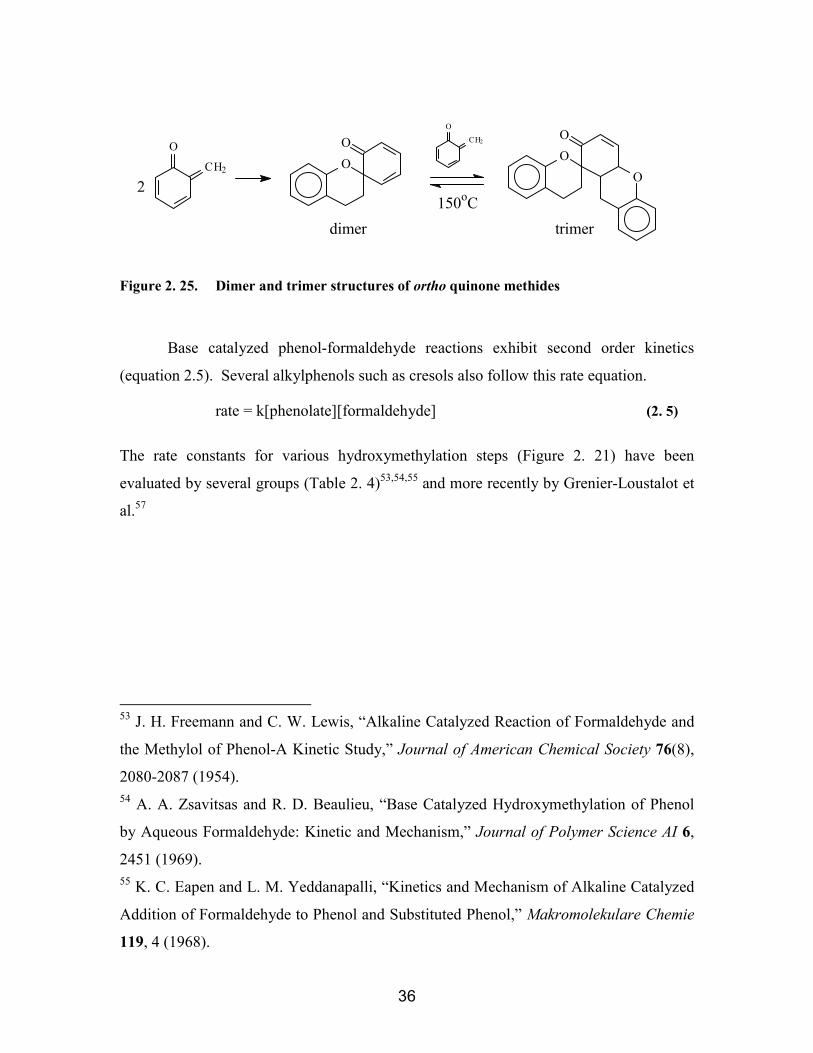
36
OO
OO
O
dimer trimer
CH2
O
2150oC
CH2
O
Figure 2. 25. Dimer and trimer structures of ortho quinone methides
Base catalyzed phenol-formaldehyde reactions exhibit second order kinetics
(equation 2.5). Several alkylphenols such as cresols also follow this rate equation.
rate = k[phenolate][formaldehyde] (2. 5)
The rate constants for various hydroxymethylation steps (Figure 2. 21) have been
evaluated by several groups (Table 2. 4)53,54,55 and more recently by Grenier-Loustalot et
al.57
53 J. H. Freemann and C. W. Lewis, “Alkaline Catalyzed Reaction of Formaldehyde and
the Methylol of Phenol-A Kinetic Study,” Journal of American Chemical Society 76(8),
2080-2087 (1954).54 A. A. Zsavitsas and R. D. Beaulieu, “Base Catalyzed Hydroxymethylation of Phenol
by Aqueous Formaldehyde: Kinetic and Mechanism,” Journal of Polymer Science AI 6,
2451 (1969).55 K. C. Eapen and L. M. Yeddanapalli, “Kinetics and Mechanism of Alkaline Catalyzed
Addition of Formaldehyde to Phenol and Substituted Phenol,” Makromolekulare Chemie
119, 4 (1968).
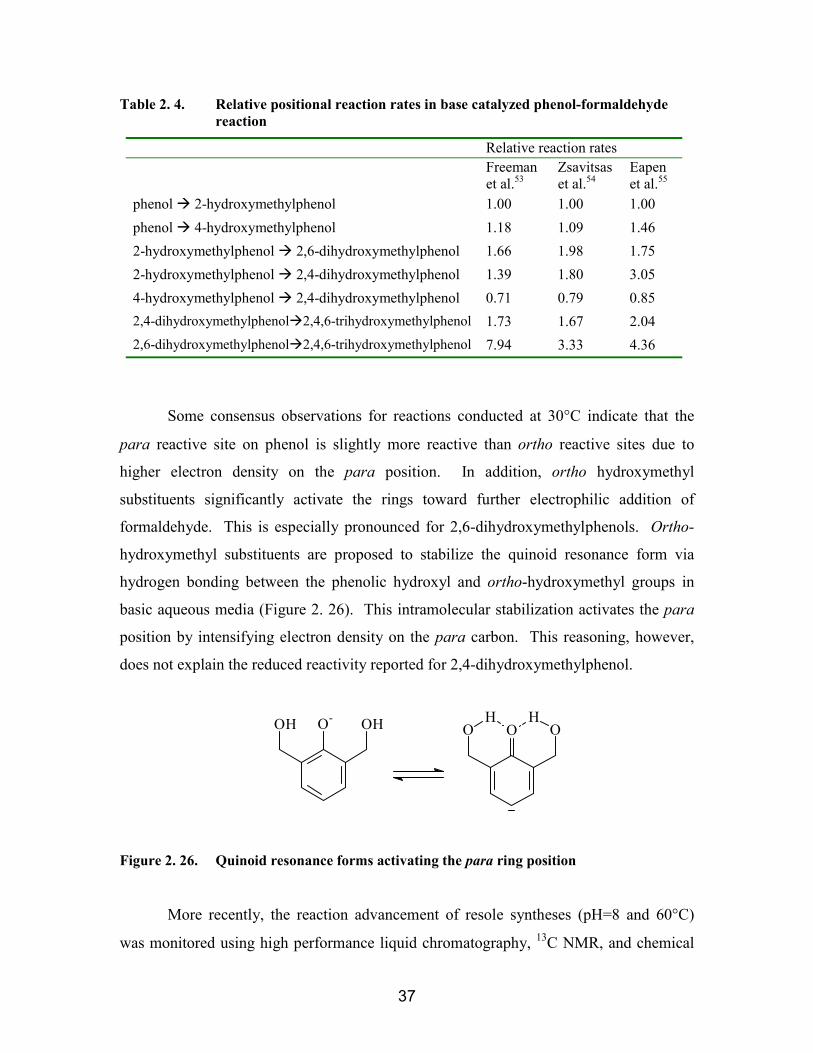
37
Table 2. 4. Relative positional reaction rates in base catalyzed phenol-formaldehydereaction
Relative reaction ratesFreemanet al.53
Zsavitsaset al.54
Eapenet al.55
phenol 2-hydroxymethylphenol 1.00 1.00 1.00phenol 4-hydroxymethylphenol 1.18 1.09 1.462-hydroxymethylphenol 2,6-dihydroxymethylphenol 1.66 1.98 1.752-hydroxymethylphenol 2,4-dihydroxymethylphenol 1.39 1.80 3.054-hydroxymethylphenol 2,4-dihydroxymethylphenol 0.71 0.79 0.852,4-dihydroxymethylphenol 2,4,6-trihydroxymethylphenol 1.73 1.67 2.042,6-dihydroxymethylphenol 2,4,6-trihydroxymethylphenol 7.94 3.33 4.36
Some consensus observations for reactions conducted at 30°C indicate that the
para reactive site on phenol is slightly more reactive than ortho reactive sites due to
higher electron density on the para position. In addition, ortho hydroxymethyl
substituents significantly activate the rings toward further electrophilic addition of
formaldehyde. This is especially pronounced for 2,6-dihydroxymethylphenols. Ortho-
hydroxymethyl substituents are proposed to stabilize the quinoid resonance form via
hydrogen bonding between the phenolic hydroxyl and ortho-hydroxymethyl groups in
basic aqueous media (Figure 2. 26). This intramolecular stabilization activates the para
position by intensifying electron density on the para carbon. This reasoning, however,
does not explain the reduced reactivity reported for 2,4-dihydroxymethylphenol.
O- OHOH OO OH H
Figure 2. 26. Quinoid resonance forms activating the para ring position
More recently, the reaction advancement of resole syntheses (pH=8 and 60°C)
was monitored using high performance liquid chromatography, 13C NMR, and chemical
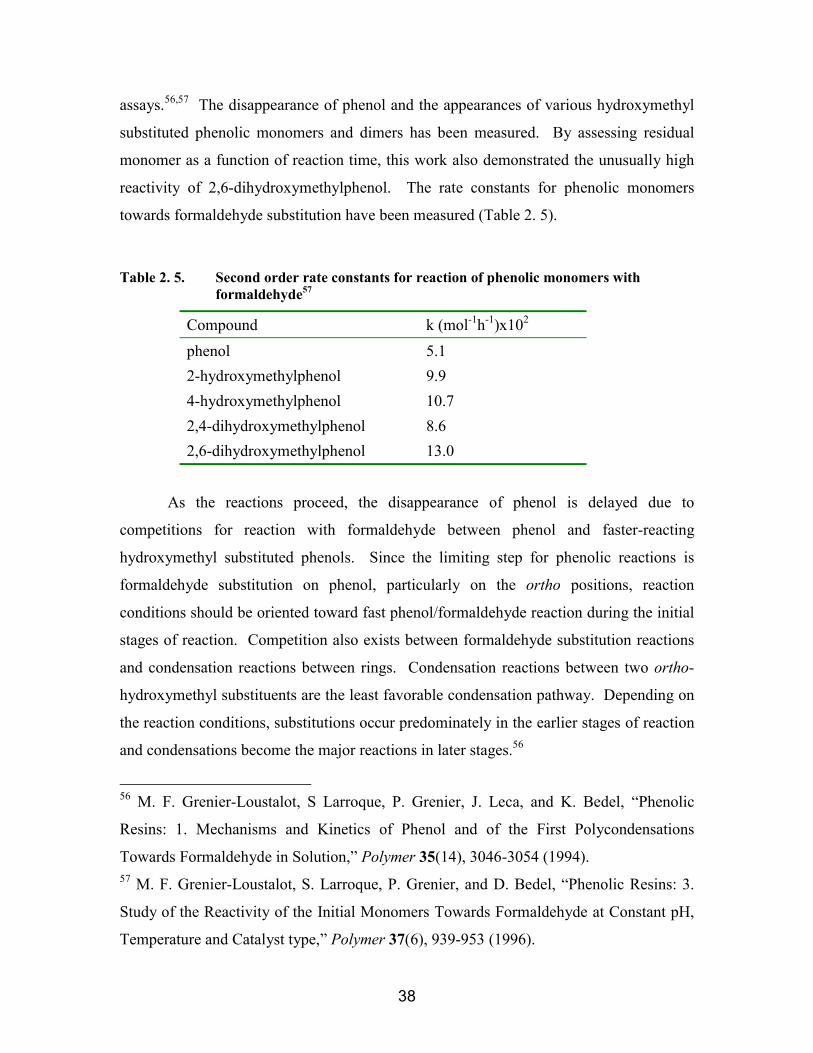
38
assays.56,57 The disappearance of phenol and the appearances of various hydroxymethyl
substituted phenolic monomers and dimers has been measured. By assessing residual
monomer as a function of reaction time, this work also demonstrated the unusually high
reactivity of 2,6-dihydroxymethylphenol. The rate constants for phenolic monomers
towards formaldehyde substitution have been measured (Table 2. 5).
Table 2. 5. Second order rate constants for reaction of phenolic monomers withformaldehyde57
Compound k (mol-1h-1)x102
phenol 5.12-hydroxymethylphenol 9.94-hydroxymethylphenol 10.72,4-dihydroxymethylphenol 8.62,6-dihydroxymethylphenol 13.0
As the reactions proceed, the disappearance of phenol is delayed due to
competitions for reaction with formaldehyde between phenol and faster-reacting
hydroxymethyl substituted phenols. Since the limiting step for phenolic reactions is
formaldehyde substitution on phenol, particularly on the ortho positions, reaction
conditions should be oriented toward fast phenol/formaldehyde reaction during the initial
stages of reaction. Competition also exists between formaldehyde substitution reactions
and condensation reactions between rings. Condensation reactions between two ortho-
hydroxymethyl substituents are the least favorable condensation pathway. Depending on
the reaction conditions, substitutions occur predominately in the earlier stages of reaction
and condensations become the major reactions in later stages.56
56 M. F. Grenier-Loustalot, S Larroque, P. Grenier, J. Leca, and K. Bedel, “Phenolic
Resins: 1. Mechanisms and Kinetics of Phenol and of the First Polycondensations
Towards Formaldehyde in Solution,” Polymer 35(14), 3046-3054 (1994).57 M. F. Grenier-Loustalot, S. Larroque, P. Grenier, and D. Bedel, “Phenolic Resins: 3.
Study of the Reactivity of the Initial Monomers Towards Formaldehyde at Constant pH,
Temperature and Catalyst type,” Polymer 37(6), 939-953 (1996).
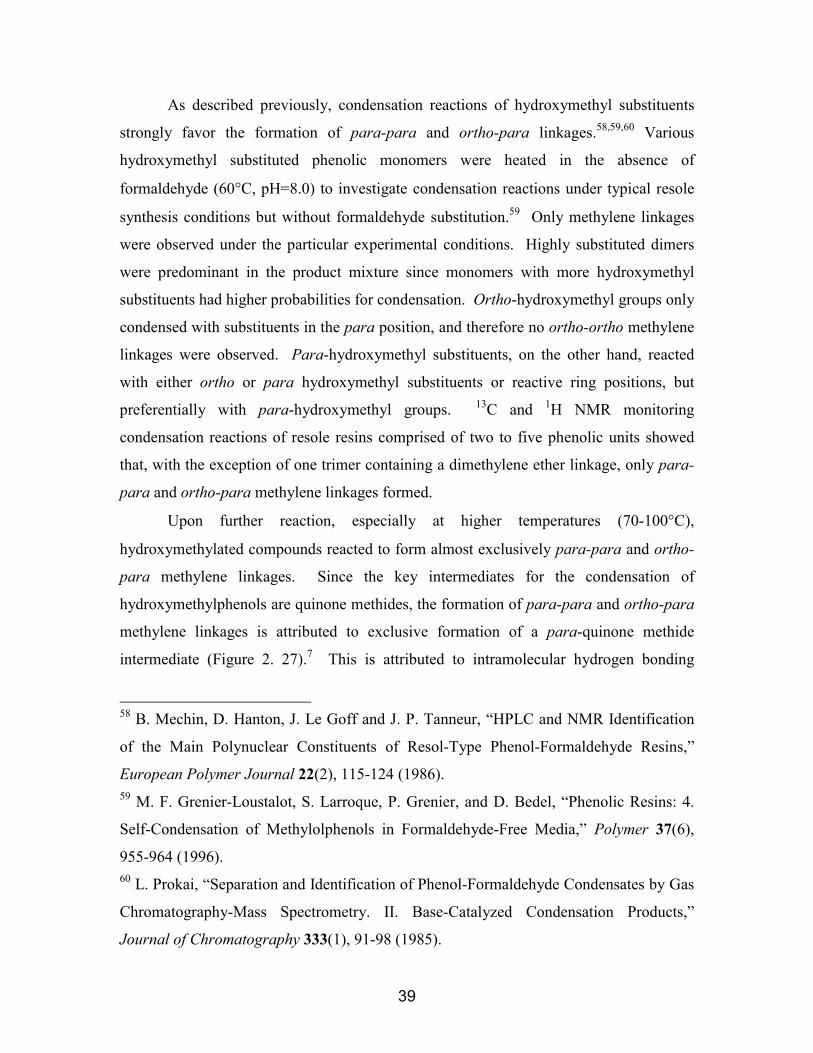
39
As described previously, condensation reactions of hydroxymethyl substituents
strongly favor the formation of para-para and ortho-para linkages.58,59,60 Various
hydroxymethyl substituted phenolic monomers were heated in the absence of
formaldehyde (60°C, pH=8.0) to investigate condensation reactions under typical resole
synthesis conditions but without formaldehyde substitution.59 Only methylene linkages
were observed under the particular experimental conditions. Highly substituted dimers
were predominant in the product mixture since monomers with more hydroxymethyl
substituents had higher probabilities for condensation. Ortho-hydroxymethyl groups only
condensed with substituents in the para position, and therefore no ortho-ortho methylene
linkages were observed. Para-hydroxymethyl substituents, on the other hand, reacted
with either ortho or para hydroxymethyl substituents or reactive ring positions, but
preferentially with para-hydroxymethyl groups. 13C and 1H NMR monitoring
condensation reactions of resole resins comprised of two to five phenolic units showed
that, with the exception of one trimer containing a dimethylene ether linkage, only para-
para and ortho-para methylene linkages formed.
Upon further reaction, especially at higher temperatures (70-100°C),
hydroxymethylated compounds reacted to form almost exclusively para-para and ortho-
para methylene linkages. Since the key intermediates for the condensation of
hydroxymethylphenols are quinone methides, the formation of para-para and ortho-para
methylene linkages is attributed to exclusive formation of a para-quinone methide
intermediate (Figure 2. 27).7 This is attributed to intramolecular hydrogen bonding
58 B. Mechin, D. Hanton, J. Le Goff and J. P. Tanneur, “HPLC and NMR Identification
of the Main Polynuclear Constituents of Resol-Type Phenol-Formaldehyde Resins,”
European Polymer Journal 22(2), 115-124 (1986).59 M. F. Grenier-Loustalot, S. Larroque, P. Grenier, and D. Bedel, “Phenolic Resins: 4.
Self-Condensation of Methylolphenols in Formaldehyde-Free Media,” Polymer 37(6),
955-964 (1996).60 L. Prokai, “Separation and Identification of Phenol-Formaldehyde Condensates by Gas
Chromatography-Mass Spectrometry. II. Base-Catalyzed Condensation Products,”
Journal of Chromatography 333(1), 91-98 (1985).

40
between both ortho hydroxymethyl substituents with quinone methide oxygen, which
lead to stable para-quinone methide structures. The para-quinone methide intermediates
then react with ortho or para reactive positions to form ortho-para and para-para
methylene linkages; or the quinone methide reacts with hydroxymethyl groups to form
ethers which further advance to methylene linkages.
+
OCH2HOCH2
CH2OH
O
CH2
HOCH2 CH2OHOH
CH2OHHOCH2
CH2OH
Figure 2. 27. Preferential formation of para quinone methides
The mechanisms for model condensation reactions of para-hydroxymethyl
substituted phenol (and therefore para-quinone methide) with reactive ortho positions are
described in Figure 2. 28. The phenolate derivatives react with para-quinone methide via
a Michael type addition to form methylene linkages (Figure 2. 28 A). Hydroxyl groups
on methylol can also attack methide carbons to form dibenzyl ether linkages which
subsequently eliminate formaldehyde to form methylene links (Figure 2. 28 B). An ipso
substitution where a nucleophilic ring carbon having a hydroxymethyl substituent attacks
a quinone methide has also been postulated to generate methylene linkages (Figure 2. 28
C).
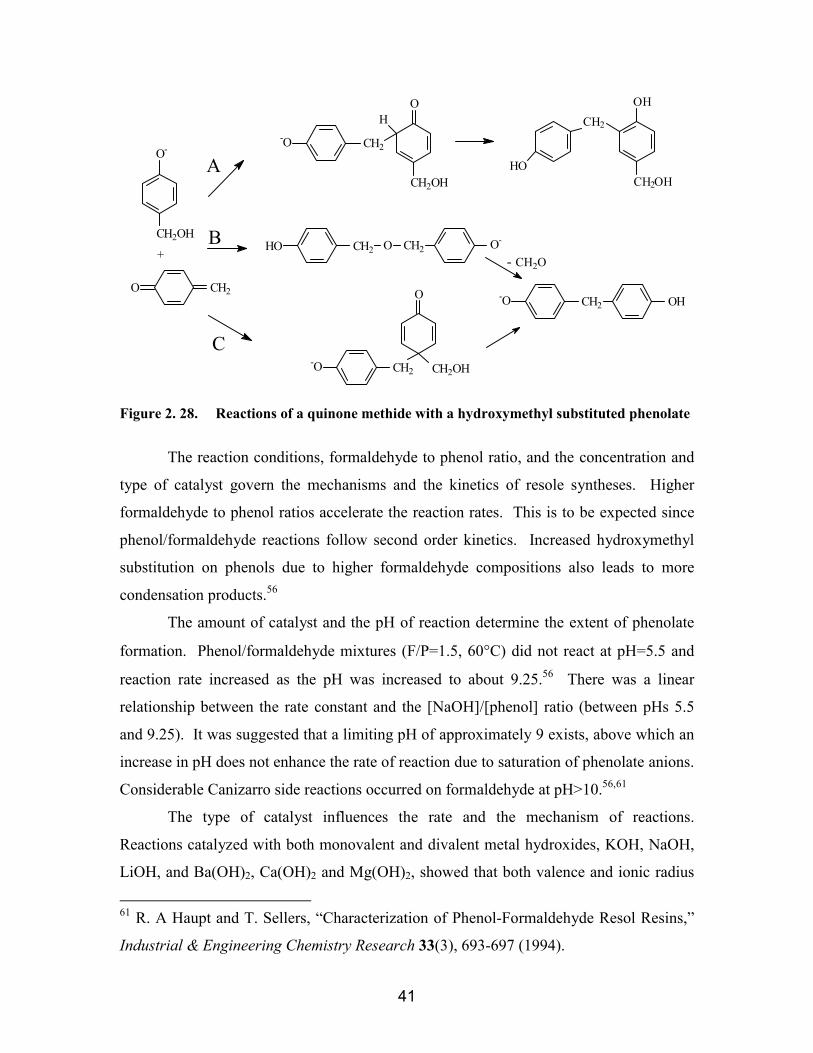
41
+
CH2-O OH
-O CH2
O
CH2OH
CH2 O CH2HO O-
CH2OH
OH
CH2-O
CH2OH
O-
CH2O
OHCH2
CH2OHHOA
B
C
- CH2O
Figure 2. 28. Reactions of a quinone methide with a hydroxymethyl substituted phenolate
The reaction conditions, formaldehyde to phenol ratio, and the concentration and
type of catalyst govern the mechanisms and the kinetics of resole syntheses. Higher
formaldehyde to phenol ratios accelerate the reaction rates. This is to be expected since
phenol/formaldehyde reactions follow second order kinetics. Increased hydroxymethyl
substitution on phenols due to higher formaldehyde compositions also leads to more
condensation products.56
The amount of catalyst and the pH of reaction determine the extent of phenolate
formation. Phenol/formaldehyde mixtures (F/P=1.5, 60°C) did not react at pH=5.5 and
reaction rate increased as the pH was increased to about 9.25.56 There was a linear
relationship between the rate constant and the [NaOH]/[phenol] ratio (between pHs 5.5
and 9.25). It was suggested that a limiting pH of approximately 9 exists, above which an
increase in pH does not enhance the rate of reaction due to saturation of phenolate anions.
Considerable Canizarro side reactions occurred on formaldehyde at pH>10.56,61
The type of catalyst influences the rate and the mechanism of reactions.
Reactions catalyzed with both monovalent and divalent metal hydroxides, KOH, NaOH,
LiOH, and Ba(OH)2, Ca(OH)2 and Mg(OH)2, showed that both valence and ionic radius
61 R. A Haupt and T. Sellers, “Characterization of Phenol-Formaldehyde Resol Resins,”
Industrial & Engineering Chemistry Research 33(3), 693-697 (1994).
42
of hydrated cations affect the formation rate and final concentrations of various reaction
intermediates and products.62 For the same valence, a linear relationship was observed
between formaldehyde disappearance rate and ionic radius of hydrated cations where
larger cation radii gave rise to higher rate constants. In addition, irrespective of the ionic
radii, divalent cations lead to faster formaldehyde disappearance rates than monovalent
cations. For the proposed mechanism where an intermediate chelate participates in the
reaction (Figure 2. 29), an increase in positive charge density in smaller cations was
suggested to improve the stability of the chelate complex, and therefore, decrease the rate
of the reaction. The radii and valence also affect the formation and disappearance of
various hydroxymethylated phenolic compounds which dictate the composition of final
products.
O- +Na
CH2 O
O
HCH2
O
Na+
O
HCH3
Oδ−
δ+δ− δ−
Na++ or
OCH2O- +Na
O- +NaCH2OH
OH
OHCH2OH
O- +Na
+
Figure 2. 29. Reaction mechanism of phenol and formaldehyde using base catalystinvolving the formation of chelate
Tetraalkylammonium hydroxides have slightly lower catalytic activities than
NaOH in resole syntheses. Increased alkyl length on tetraalkylammonium ions (larger
ionic radii) decreased the catalytic activity. Contrary to the chelating effect, the reduced
activity observed with tetraalkylammonium hydroxides was attributed to screening
effects of alkyl groups. Water solubility was limited to resole resins prepared with
62 M. F. Grenier-Loustalot, S. Larroque, D. Grande, P. Grenier, and D. Bedel, “Phenolic
Resins: 2. Influence of Catalyst Type on Reaction Mechanisms and Kinetics,” Polymer
37(8), 1363-1369 (1996).
43
tetramethylammonium hydroxide and tetraethylammonium hydroxide. These catalysts
also give rise to resins with longer gelation times.
Resole syntheses catalyzed with various amounts of triethylamine (pH adjusted to
8 using NaOH) and various pHs (pH = 8.0, 8.23 and 8.36) were monitored.63 As
expected, shorter condensation times, faster reaction rates, and higher advancement in
polymerizations were reached with increased catalyst concentrations. The pH, on the
other hand, did not affect these parameters significantly. The reaction mechanisms
differed when NaOH was used to adjust the pH since the hydroxide formed phenolate
ions which favored para addition reactions. In the absence of NaOH, free phenolic
hydroxyl groups formed complexes with triethylamine to promote ortho substitution.
2.4.2. Crosslinking reactions of resole resinsResole resins are generally crosslinked under neutral conditions between 130 and
200°C or in the presence of an acid catalyst such as hydrochloric acid, phosphoric acid,
p-toluenesulfonic acid, and phenolsulfonic acid under ambient conditions.5 The
mechanisms for crosslinking under acidic conditions are similar to acid catalyzed novolac
formation. Quinone methides are the key reaction intermediates. Further condensation
reactions in resole resin syntheses under basic conditions at elevated temperatures also
lead to crosslinking.
The self-condensation of ortho-hydroxymethyl substituents and the condensation
between this substituent with ortho or para reactive sites were investigated under neutral
conditions.52 2-Hydroxymethyl-4,6-dimethylphenol was reacted 1) alone, 2) in the
presence of 2,4-xylenol, and 3) in the presence of 2,6-xylenol. The rates of methylene
versus dimethylether formation between rings at 120°C were monitored as a function of
time and the percent yields after 5 hours were recorded (Table 2. 6). The ether linkage
was more prevalent in the self-condensation of 2-hydroxymethyl-4,6-dimethylphenol.
Possibly the 5% methylene bridged product formed via ipso substitution of an ortho
63 G. Astarloa-Aierbe, J.M. Echeverria, A. Vazquez, and I. Mondragon, “Influence of the
Amount of Catalyst and Initial pH on the Phenolic Resole Resin Formation,” Polymer 41,
3311-3315 (2000).
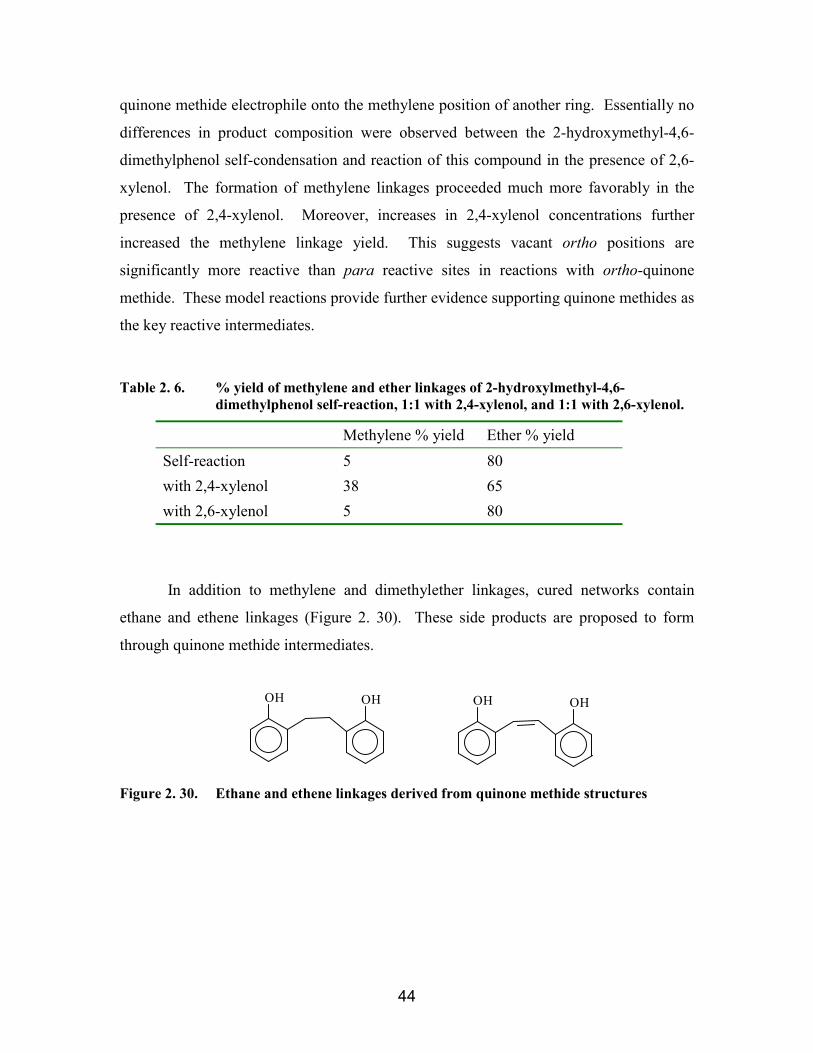
44
quinone methide electrophile onto the methylene position of another ring. Essentially no
differences in product composition were observed between the 2-hydroxymethyl-4,6-
dimethylphenol self-condensation and reaction of this compound in the presence of 2,6-
xylenol. The formation of methylene linkages proceeded much more favorably in the
presence of 2,4-xylenol. Moreover, increases in 2,4-xylenol concentrations further
increased the methylene linkage yield. This suggests vacant ortho positions are
significantly more reactive than para reactive sites in reactions with ortho-quinone
methide. These model reactions provide further evidence supporting quinone methides as
the key reactive intermediates.
Table 2. 6. % yield of methylene and ether linkages of 2-hydroxylmethyl-4,6-dimethylphenol self-reaction, 1:1 with 2,4-xylenol, and 1:1 with 2,6-xylenol.
Methylene % yield Ether % yieldSelf-reaction 5 80with 2,4-xylenol 38 65with 2,6-xylenol 5 80
In addition to methylene and dimethylether linkages, cured networks contain
ethane and ethene linkages (Figure 2. 30). These side products are proposed to form
through quinone methide intermediates.
OH OH OH OH
Figure 2. 30. Ethane and ethene linkages derived from quinone methide structures
45
Crosslinking resoles in the presence of sodium carbonate or potassium carbonate
lead to preferential formation of ortho-ortho methylene linkages.64 Resole networks
crosslinked under basic conditions showed that crosslink density depends on the degree
of hydroxymethyl substitution, which is affected by the formaldehyde to phenol ratio and
the reaction time, the type and concentration of catalyst (uncatalyzed, with 2% NaOH,
with 5% NaOH).65 As expected, NaOH accelerated the rates of both hydroxymethyl
substitution and methylene ether formation. Significant rate increases were observed for
ortho substitutions as the amount of NaOH increased. The para substitution, which does
not occur in the absence of the catalyst, formed only in small amounts in the presence of
NaOH.
.
2.4.3. Resole characterizationA number of analytical techniques such as Fourier transform infrared
spectroscopy (FTIR),66,67 13C NMR,68,69 solid-state 13C NMR,70 gel permeation
64 B. D. Park and B. Riedl, “C-13-NMR Study of Cure-Accelerated Phenol-
Formaldehyde Resins with Carbonates,” Journal of Applied Polymer Science 77(6),
1284-1293 (2000).65 M. Grenier-Loustalot, S. Larroque and P. Grenier, “Phenolic Resins: 5. Solid-State
Physicochemical Study of Resoles with Variable F/P Ratios,” Polymer 37(4), 639-650
(1996).66 T. Holopainen, L. Alvila, J. Rainio, and T. T. Pakkanen, “IR Analysis of Phenol-
Formaldehyde Resole Resins,” Journal of Applied Polymer Science 69(11), 2175-2185
(1998).67 G. Carotenuto and L. Nicolais, “Kinetic Study of Phenolic Resin Cured by IR
Spectroscopy,” Journal of Applied Polymer Science 74(11), 2703-2715 (1999).68 T. Holopainen, L. Alvila, J. Rainio, and T. T. Pakkanen, “Phenol-Formaldehyde Resol
Resins Studied by C-13-NMR Spectroscopy, Gel Permeation Chromatography, and
Differential Scanning Calorimetry,” Journal of Applied Polymer Science 66(6), 1183-
1193 (1997).
46
chromatography or size exclusion chromatography (GPC),68,69,71,72,73 high performance
liquid chromatography (HPLC),74 mass spectrometric analysis,75 differential scanning
calorimetry (DSC),68,76,77 and dynamic mechanical analysis (DMA)78,79 have been utilized
69 M. G. Kim, L.W. Amos, and E. E. Barnes, “Study of the Reaction Rates and
Structures of a Phenol Formaldehyde Resol Resin by C-13 NMR and Gel-Permeation
Chromatography,” Industrial & Engineering Chemistry Research 29(10), 2032-2037
(1990).70 P. Luukko, L. Alvila, T. Holopainen, J. Rainio, and T. T. Pakkanen, “Optimizing the
Conditions of Quantitative 13C NMR Spectroscopy Analysis for Phenol-Formaldehyde
Resole Resins,” Journal of Applied Polymer Science 69, 1805-1812 (1998).71 T. Sellers and M. L. Prewitt “Applications of Gel-Filtration Chromatography for
Resole Phenolic Resins using Aqueous Sodium-Hydroxide and Solvent,” Journal of
Chromatography 513, 271-278 (1990).72 G. Gobec, M. Dunky, T. Zich, and K. Lederer, “Gel Permeation Chromatography and
Calibration of Resolic Phenol-Formaldehyde Condensates,” Angewandte
Makromolekulare Chemie 251, 171-179 (1997).73 M.G. Kim, W. L. Nieh, T. Sellers, W.W. Wilson, and J. W. Mays, “Polymer-Solution
Properties of a Phenol Formaldehyde Resol Resin by Gel-Permeation Chromatography,
Intrinsic-Viscosity, Static Light Scattering, and Vapor-Pressure Osmometric Methods,”
Industrial & Engineering Chemistry Research 31(3), 973-979 (1992).74 G. Astarloa-Aierbe, J. M. Echeverria, J. L. Egiburu, M, Ormaetxea, and I. Mondradon,
“Kinetics of Phenolic Resol Resin Formation by HPLC,” Polymer 39(14), 3147-3153
(1998).75 L. Prokai and W. J. Simonsick, “Direct Mass-Spectrometric Analysis of Phenol
Formaldehyde Oligocondensates- A Comparative Desorption Ionization Study,”
Macromolecules 25(24), 6532-6539 (1992).76 J. M. Kenny, G. Pisaniello, F. Farina, and S. Puzziello, “Calorimetric Analysis of the
Polymerization Reaction of a Phenolic Resin,” Thermochimica Acta 269, 201-211(1995).

47
to characterize resole syntheses and crosslinking reactions. Packed-column supercritical
fluid chromatography with a negative-ion atmospheric-pressure chemical ionization mass
spectrometric detector has also been used to separate and characterize resole resins.80
This section provides some examples of how these techniques are used in practical
applications.
Using FTIR spectroscopy, resole resin formation and cure reactions can be
examined (Table 2. 7). FTIR can be used to monitor the appearance and disappearance
of hydroxymethyl groups and/or methylene ether linkages, ortho reactive groups, and
para reactive groups for resole resin syntheses. Other useful information deduced from
FTIR are the type of hydrogen bonding, i.e. intra- vs. inter-molecular, the amount of free
phenol present in the product, and the formaldehyde/phenol molar ratio. FTIR bands and
patterns for various mono-, di-, and tri-substituted phenols have been identified using a
series of model compounds.
The kinetics of resole cure reactions via FTIR indicates that a diffusion
mechanism dominates below 140°C. The cure above 140°C exhibits a homogeneous first
order reaction rate. The activation energy of the cure reaction was ~ 49.6 KJ/mol.67
77 W. W. Focke, M. S. Smit, A. T. Tolmay, L. S. Vandervalt, and W. L. Vanwyk,
“Differential Scanning Calorimetry Analysis of Thermoset Cure Kinetics- Phenolic Resol
Resin,” Polymer Engineering and Science 31(23), 1665-1669 (1991).78 M. G. Kim, W. L. S. Nieh, and R. M. Meacham, “Study of the Curing of Phenol-
Formaldehyde Resol Resins by Dynamic Mechanical Analysis,” Industrial &
Engineering Chemistry Research 30(4), 798-803 (1991).79 R. A. Follensbee, J. A. Koutsky, A.W. Christiansen, G.E. Myers, and R. L. Geimer,
“Development of Dynamic Mechanical Methods to Characterize the Cure State of
Phenolic Resole Resins,” Journal of Applied Polymer Science 47(8), 1481-1496 (1993).80 M. J. Carrott and G. Davidson, “Separation of Characterization of Phenol-
Formaldehyde (Resole) Prepolymers using Packed-Column Supercritical Fluid
Chromatography with APCI Mass Spectrometric Detection,” Analyst 124(7), 993-997
(1999).
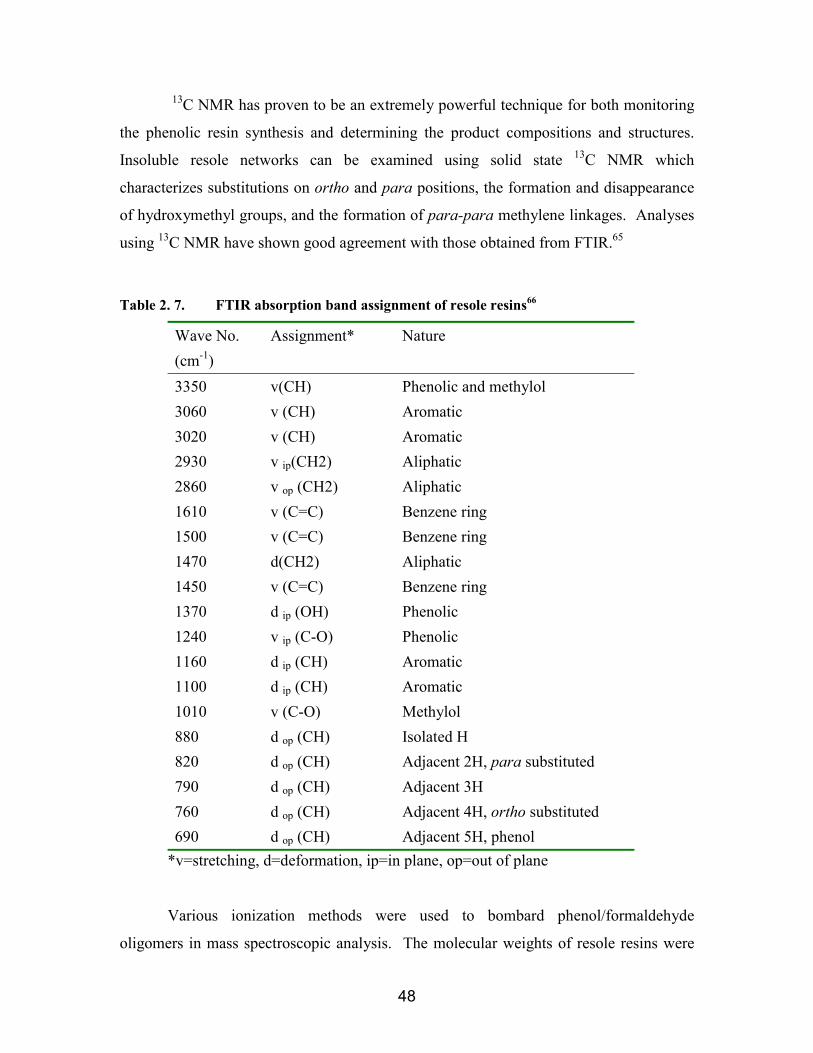
48
13C NMR has proven to be an extremely powerful technique for both monitoring
the phenolic resin synthesis and determining the product compositions and structures.
Insoluble resole networks can be examined using solid state 13C NMR which
characterizes substitutions on ortho and para positions, the formation and disappearance
of hydroxymethyl groups, and the formation of para-para methylene linkages. Analyses
using 13C NMR have shown good agreement with those obtained from FTIR.65
Table 2. 7. FTIR absorption band assignment of resole resins66
Wave No.(cm-1)
Assignment* Nature
3350 v(CH) Phenolic and methylol3060 v (CH) Aromatic3020 v (CH) Aromatic2930 v ip(CH2) Aliphatic2860 v op (CH2) Aliphatic1610 v (C=C) Benzene ring1500 v (C=C) Benzene ring1470 d(CH2) Aliphatic1450 v (C=C) Benzene ring1370 d ip (OH) Phenolic1240 v ip (C-O) Phenolic1160 d ip (CH) Aromatic1100 d ip (CH) Aromatic1010 v (C-O) Methylol880 d op (CH) Isolated H820 d op (CH) Adjacent 2H, para substituted790 d op (CH) Adjacent 3H760 d op (CH) Adjacent 4H, ortho substituted690 d op (CH) Adjacent 5H, phenol
*v=stretching, d=deformation, ip=in plane, op=out of plane
Various ionization methods were used to bombard phenol/formaldehyde
oligomers in mass spectroscopic analysis. The molecular weights of resole resins were
49
calculated using field desorption mass spectroscopy of acetyl-derivatized samples.75
Peracetylation was used to enable quantitative characterization of all molecular fractions
by increasing the molecular weight in increments of 42.
Dynamic DSC scans of resole resins show two distinguishable reaction peaks,
which correspond to formaldehyde addition and formation of ether and methylene
bridges characterized by different activation energies. Kinetic parameters calculated
using a regression analysis show good agreement with experimental values.76
DMA was used to determine the cure times and the onset of vitrification in resole
cure reactions.78 The time at which two tangents to the storage modulus curve intersect
(near the final storage modulus plateau) was suggested to correspond to the cure times.
In addition, the time to reach the peak of the tan delta curve was suggested to correspond
to the vitrification point. As expected, higher cure temperatures reduced the cure times.
DMA was also used to measure the degree of cure achieved by resole resins subsequent
to their exposure to combinations of reaction time, temperature and humidity.78 The
ultimate moduli increased with longer reaction times and lower initial moisture contents.
The area under the tan delta curve during isothermal experiments was suggested to be
inversely proportional to the degree of cure developed in samples prior to the
measurement.
A NaOH catalyzed resole resin, acetylated or treated with an ion exchange resin
(neutralized and free of sodium), was analyzed using GPC in THF solvent. 81 The
molecular weight of the ion exchange treated resin, calculated by GPC using polystyrene
standards, was significantly lower than that estimated for the acetylated resin. The
molecular weight for the ion exchange treated resin calculated by 1H NMR and VPO
agreed with the results from GPC. The higher molecular weight observed for the
acetylated resin was attributed to higher hydrodynamic volume and/or intermolecular
association in acetylated samples.
81 Y. Yazaki, P. J. Collins, M. J. Reilly, S. D. Terrill and T. Nikpour, “Fast-Curing
Phenol-Formaldehyde (PF) Resins,” Holzforschung 48(1), 41-48 (1994).
50
2.4.4. Resole network propertiesVoids in resole networks detract from the mechanical properties. Irrespective of
the curing conditions, all resole networks contain a significant amount of voids due to
volatiles released during the cure reactions. The catalyst concentration in resole
crosslinking reactions can lead to different pore microstructures, which influence the
mechanical properties.82 Resole networks cured using p-toluenesulfonic acid between 40
and 80°C showed that increased catalyst concentrations led to reduced average void
diameters. Higher cure temperatures also resulted in reduced void diameters although the
effect was not as substantial. The same study showed that while the catalyst
concentration did not affect the network Tgs, higher cure and post-cure temperatures
increased Tgs and reduced fracture strains.
In another exemplary study, optical microscopy revealed that the void content of
resole networks ranged from 0.13 to 0.21.83 Resole networks prepared from different F/P
molar ratios showed comparable void distributions. A bimodal distribution was observed
for all networks, which was attributed to thermodynamic phase separations of reaction
volatile (free phenol, formaldehyde and water) and reaction kinetics.
The glass transition temperatures were determined from the peaks of tan delta
curves measured using dynamic mechanical analysis for a series of resole networks
(prepared with F/P molar ratios ranging from 1 to 2.5).83 Networks obtained from resoles
with high F/P molar ratios (>1.2) had fairly consistent Tgs (between 240 and 260°C). The
lowest Tg (190°C) was observed for networks prepared with low hydroxymethyl
substituted resoles (F/P=1) and this was attributed to the low network crosslink densities
at this ratio. The highest Tg occurred at F/P=1.2 (~280°C), but it superimposed the
degradation temperatures. The width of the tan delta curves was used to assess the
82 J. Wolfrum and G. W. Ehrenstein, “Interdependence Between the Curing, Structure,
and the Mechanical Properties of Phenolic Resins,” Journal of Applied Polymer Science
74, 3173-3185 (1999).83 L. B. Manfredi, O. de la Osa, N. Galego Fernandez, and A. Vazquez, “Structure-
Properties Relationship for Resoles with Different Formaldehyde/Phenol Molar Ratio,”
Polymer 40, 3867-3875 (1999).
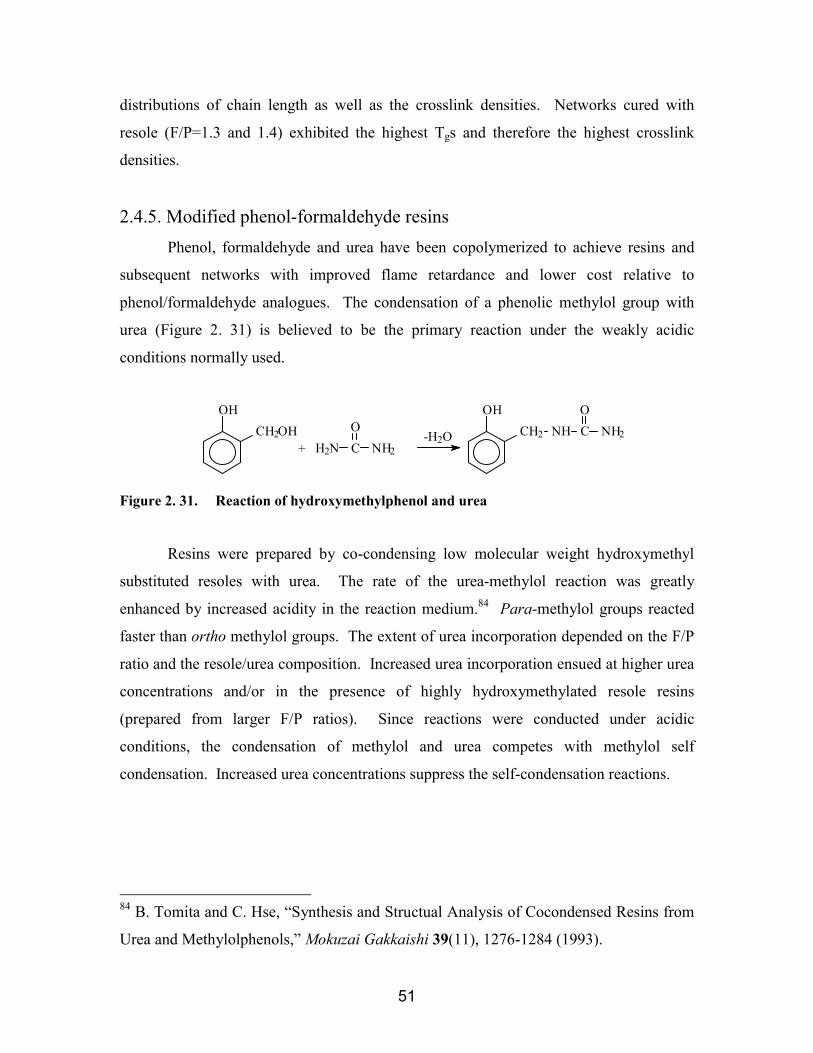
51
distributions of chain length as well as the crosslink densities. Networks cured with
resole (F/P=1.3 and 1.4) exhibited the highest Tgs and therefore the highest crosslink
densities.
2.4.5. Modified phenol-formaldehyde resinsPhenol, formaldehyde and urea have been copolymerized to achieve resins and
subsequent networks with improved flame retardance and lower cost relative to
phenol/formaldehyde analogues. The condensation of a phenolic methylol group with
urea (Figure 2. 31) is believed to be the primary reaction under the weakly acidic
conditions normally used.
+
OHCH2 NH C NH2
O
-H2OH2N C NH2
OOH
CH2OH
Figure 2. 31. Reaction of hydroxymethylphenol and urea
Resins were prepared by co-condensing low molecular weight hydroxymethyl
substituted resoles with urea. The rate of the urea-methylol reaction was greatly
enhanced by increased acidity in the reaction medium.84 Para-methylol groups reacted
faster than ortho methylol groups. The extent of urea incorporation depended on the F/P
ratio and the resole/urea composition. Increased urea incorporation ensued at higher urea
concentrations and/or in the presence of highly hydroxymethylated resole resins
(prepared from larger F/P ratios). Since reactions were conducted under acidic
conditions, the condensation of methylol and urea competes with methylol self
condensation. Increased urea concentrations suppress the self-condensation reactions.
84 B. Tomita and C. Hse, “Synthesis and Structual Analysis of Cocondensed Resins from
Urea and Methylolphenols,” Mokuzai Gakkaishi 39(11), 1276-1284 (1993).

52
The curing process of tri-hydroxymethylphenol reacted with urea was monitored
using torsional braid analysis.85 Curing proceeded in two stages where the first stage
occurred at lower temperatures and was attributed to the reaction of para-hydroxymethyl
and urea groups. The second stage was due to the higher temperature reaction of ortho-
hydroxymethyl and urea groups.
Condensation reactions of hydroxymethyl groups on phenolic resoles and amines
on melamine take place between pHs 5 and 6 (Figure 2. 32). Only self-condensations of
hydroxymethyl substituents occur under strongly acidic or basic conditions.
+
OHCH2 NH
N N
N NH2
NH2
-H2O
N
N N
H2N NH2
NH2
OHCH2OH
Figure 2. 32. Reaction of hydroxymethylphenol and melamine
2.5. Epoxy/phenol networksVoid free phenolic networks can be prepared by crosslinking novolacs with
epoxies instead of HMTA. A variety of difunctional and multifunctional epoxy reagents
can be used to generate networks with excellent dielectric properties.4 One example of
epoxy reagents used in this manner is the epoxidized novolac (Figure 2. 33) derived from
the reaction of novolac oligomers with an excess of epichlorohydrin.
85 B. Tomita, M. Ohyama, A. Itoh, K. Doi, and C. Hse “Analysis of Curing Process and
Thermal Properties of Phenol-Urea-Formaldehyde Cocondensation Resins,” Mokuzai
Gakkaishi 40(2), 170-175 (1994).
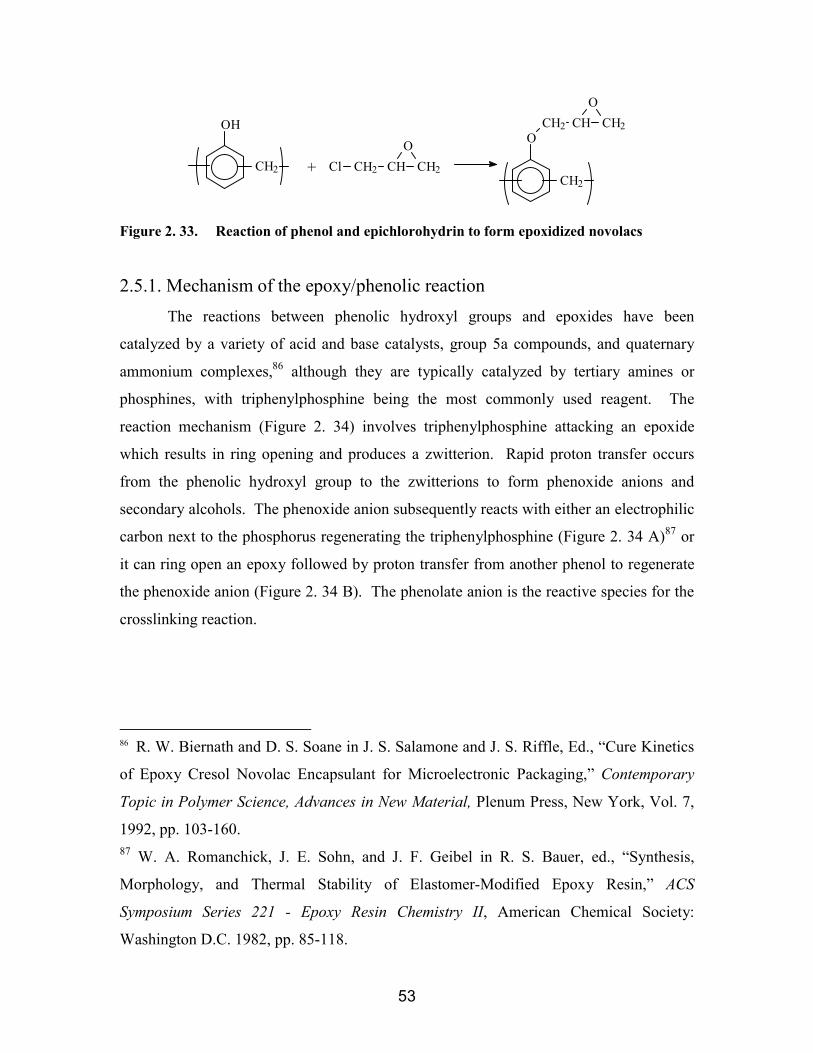
53
OCH2 CH CH2
O
CH2CH2
OH
CH2 CH CH2
OCl+
Figure 2. 33. Reaction of phenol and epichlorohydrin to form epoxidized novolacs
2.5.1. Mechanism of the epoxy/phenolic reactionThe reactions between phenolic hydroxyl groups and epoxides have been
catalyzed by a variety of acid and base catalysts, group 5a compounds, and quaternary
ammonium complexes,86 although they are typically catalyzed by tertiary amines or
phosphines, with triphenylphosphine being the most commonly used reagent. The
reaction mechanism (Figure 2. 34) involves triphenylphosphine attacking an epoxide
which results in ring opening and produces a zwitterion. Rapid proton transfer occurs
from the phenolic hydroxyl group to the zwitterions to form phenoxide anions and
secondary alcohols. The phenoxide anion subsequently reacts with either an electrophilic
carbon next to the phosphorus regenerating the triphenylphosphine (Figure 2. 34 A)87 or
it can ring open an epoxy followed by proton transfer from another phenol to regenerate
the phenoxide anion (Figure 2. 34 B). The phenolate anion is the reactive species for the
crosslinking reaction.
86 R. W. Biernath and D. S. Soane in J. S. Salamone and J. S. Riffle, Ed., “Cure Kinetics
of Epoxy Cresol Novolac Encapsulant for Microelectronic Packaging,” Contemporary
Topic in Polymer Science, Advances in New Material, Plenum Press, New York, Vol. 7,
1992, pp. 103-160.87 W. A. Romanchick, J. E. Sohn, and J. F. Geibel in R. S. Bauer, ed., “Synthesis,
Morphology, and Thermal Stability of Elastomer-Modified Epoxy Resin,” ACS
Symposium Series 221 - Epoxy Resin Chemistry II, American Chemical Society:
Washington D.C. 1982, pp. 85-118.
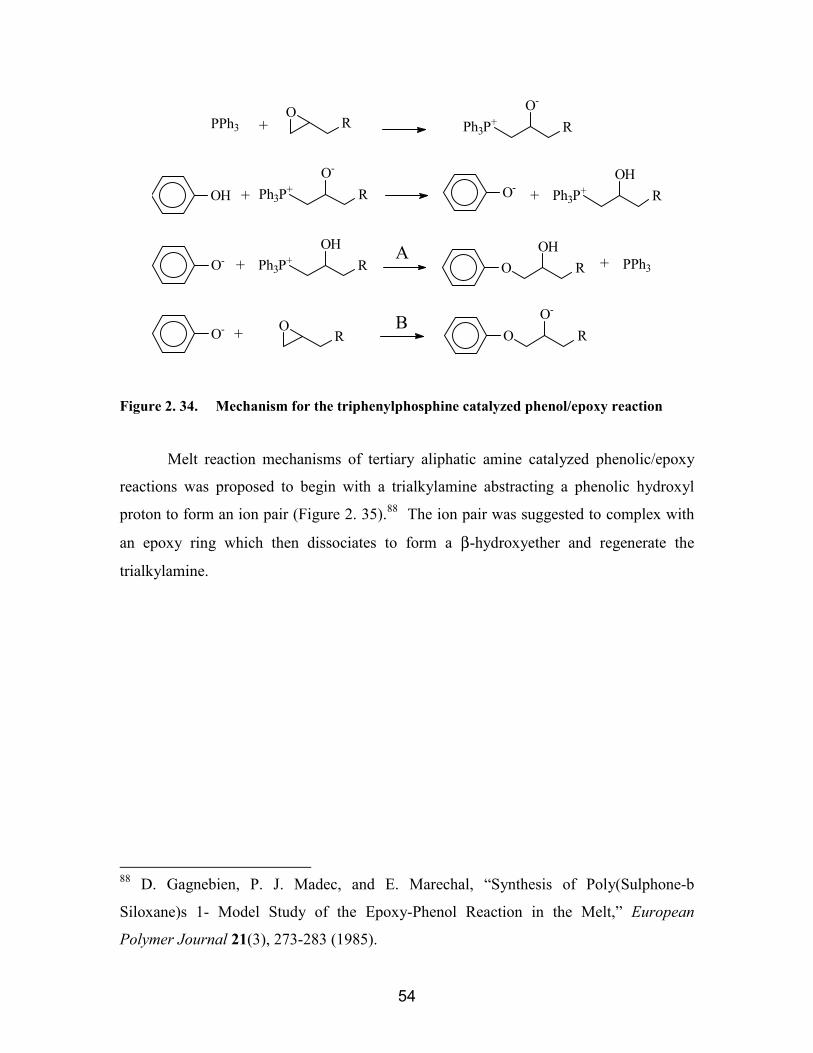
54
+
++
+
+
PPh3O ROH
O- Ph3P+ ROH
Ph3P+ ROH
O-OH Ph3P+ RO-
Ph3P+ RO-
RO
PPh3
O- + RO
O RO-
A
B
Figure 2. 34. Mechanism for the triphenylphosphine catalyzed phenol/epoxy reaction
Melt reaction mechanisms of tertiary aliphatic amine catalyzed phenolic/epoxy
reactions was proposed to begin with a trialkylamine abstracting a phenolic hydroxyl
proton to form an ion pair (Figure 2. 35).88 The ion pair was suggested to complex with
an epoxy ring which then dissociates to form a β-hydroxyether and regenerate the
trialkylamine.
88 D. Gagnebien, P. J. Madec, and E. Marechal, “Synthesis of Poly(Sulphone-b
Siloxane)s 1- Model Study of the Epoxy-Phenol Reaction in the Melt,” European
Polymer Journal 21(3), 273-283 (1985).
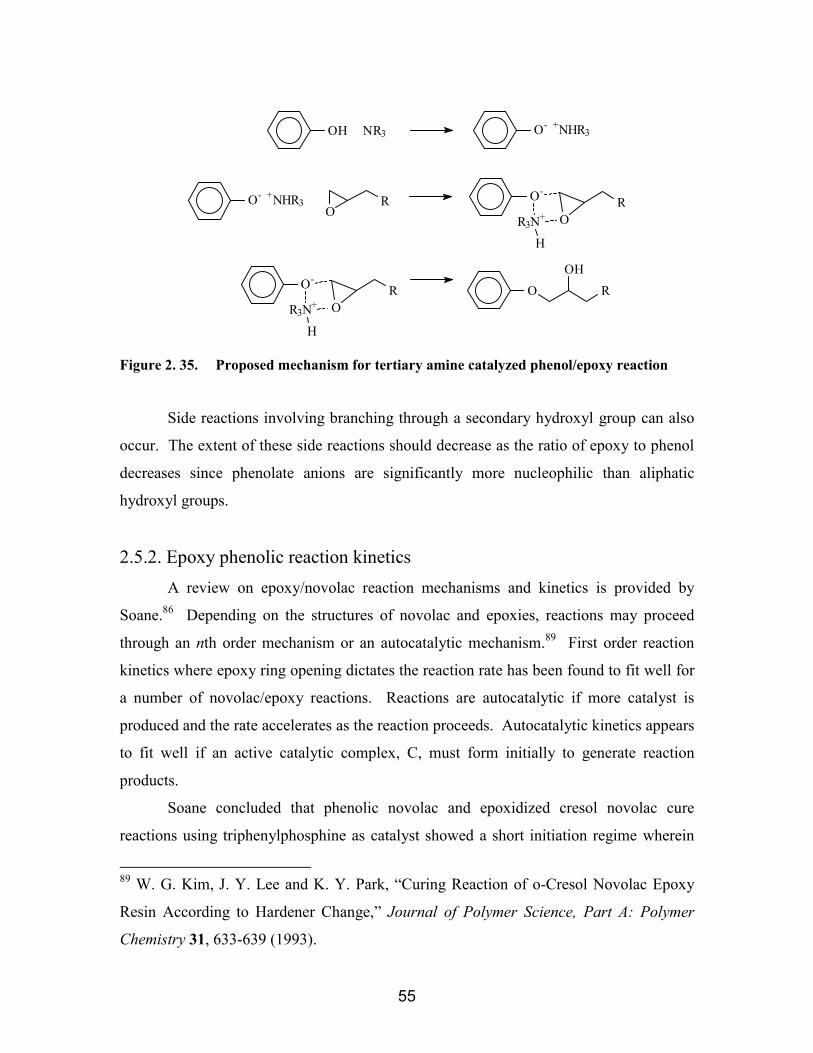
55
OH NR3 O- +NHR3
O- +NHR3 RO
O-R
OR3N+
H
O-R
OR3N+
H
OOH
R
Figure 2. 35. Proposed mechanism for tertiary amine catalyzed phenol/epoxy reaction
Side reactions involving branching through a secondary hydroxyl group can also
occur. The extent of these side reactions should decrease as the ratio of epoxy to phenol
decreases since phenolate anions are significantly more nucleophilic than aliphatic
hydroxyl groups.
2.5.2. Epoxy phenolic reaction kineticsA review on epoxy/novolac reaction mechanisms and kinetics is provided by
Soane.86 Depending on the structures of novolac and epoxies, reactions may proceed
through an nth order mechanism or an autocatalytic mechanism.89 First order reaction
kinetics where epoxy ring opening dictates the reaction rate has been found to fit well for
a number of novolac/epoxy reactions. Reactions are autocatalytic if more catalyst is
produced and the rate accelerates as the reaction proceeds. Autocatalytic kinetics appears
to fit well if an active catalytic complex, C, must form initially to generate reaction
products.
Soane concluded that phenolic novolac and epoxidized cresol novolac cure
reactions using triphenylphosphine as catalyst showed a short initiation regime wherein
89 W. G. Kim, J. Y. Lee and K. Y. Park, “Curing Reaction of o-Cresol Novolac Epoxy
Resin According to Hardener Change,” Journal of Polymer Science, Part A: Polymer
Chemistry 31, 633-639 (1993).

56
the concentration of phenolate ion increased followed by a (steady-state) propagation
regime where the number of reactive phenolate species was constant.86 The epoxy ring
opening reaction was reportedly first-order in the “steady-state” regime.
)( max1 ααα −= kdtd
(2. 6)
where α is the fraction of epoxy reacted, αmax is the maximum fraction of epoxy reacted
at the given stoichiometry and temperature, and k1 is the first order kinetic rate constant.
The isothermal reaction rate for autocatalytic cure kinetics is calculated using
nmkdtd )1(' ααα −= (2. 7)
where k’ is the kinetic rate constant, and m and n are the reaction orders.
To describe the reaction rate where the initial rate is not zero, the following
modification was made90
nmkkdtd )1)(( 21 ααα −+= (2. 8)
where k1 and k2 are kinetic rate constants.
The mechanism for the tertiary amine catalyzed reaction between phenol and
epoxy was proposed by Sorokin and Shode91
E + P + B Ik1
E + P + I k2 Pr + I (2. 9)
90 M. R. Kamal, “Thermoset Characterization for Moldability Analysis,” Polymeric
Engineering Science 14(3), 231-239 (1974).91 M. F. Sorokin and L. G. Shode, “Reactions of �-Oxides with Proton Donor
Compounds in the Presence of Tertiary Amines. 1. Reaction of Phenyl Glycidyl Ether
with Phenol in the Presence of Teritary Amines” Zhurnal Organicheskoi Khimii 2(8),
1463-1468 (1966).

57
where E represents epoxy groups, P the phenol, B the basic catalyst, I an intermediate
complex, PR the product of the phenol and epoxide reaction, and k1 and k2 the kinetic
constants. This mechanism suggests that the isothermal reaction rate is directly
proportional to catalyst concentration. Thus, the catalyst concentration may be
introduced into the rate expression.
A diffusion effect was incorporated into equation 7 to improve the conversion vs.
time prediction fit above 90 % conversion.92 The diffusion factor f(α) is based on free
volume principles.93
[ ] )−+= αααα ( )1)(''( 21 fBkkdtd nm (2. 10)
)](exp[11)(
cCf
ααα
−+= (2. 11)
where C is the material constant, αc is the critical conversion, and k1’ and k2’ are
“normalized” kinetic rate constants. For α << αc, in which the rate of diffusion is not
reaction rate limiting, f(α) is essentially equal to unity. As α approaches αc, the diffusion
factor decreases. The measured reaction conversion for triphenylphosphine catalyzed
biphenyl epoxy/phenol novolac cure plotted vs. reaction time fits extremely well the
conversion values calculated via the above expression for all catalyst concentrations over
the conversion range.
Ortho-cresol novolac epoxy oligomers were cured with a phenolic novolac or a
phenolic novolac acetate resin catalyzed by 2-methylimidzole.94 While the phenolic
92 S. Han, H. G. Yoon, K. S. Suh, W. G. Kim and T. J. Moon, “Curing Kinetics of
Biphenyl Epoxy-Phenol Novolac Resin System Using Triphenylphosphine as Catalyst,”
Journal Polymeric Science, Part A: Polymeric Chemistry 37, 713-720 (1999).93 C. S. Chern and G.W. Poehlein, “A Kinetic Model for Curing Reaction of Epoxides
with Amines,” Polymer Engineering & Science 27(11), 788-795 (1987).94 X. W. Luo, Z. H. Ping, J. P. Ding, Y. D. Ding, and S. J. Li, “Mechanism Studies on
Water Sorption and Permeation in Epoxy Resin by Impedance Spectroscopy. II. Cure
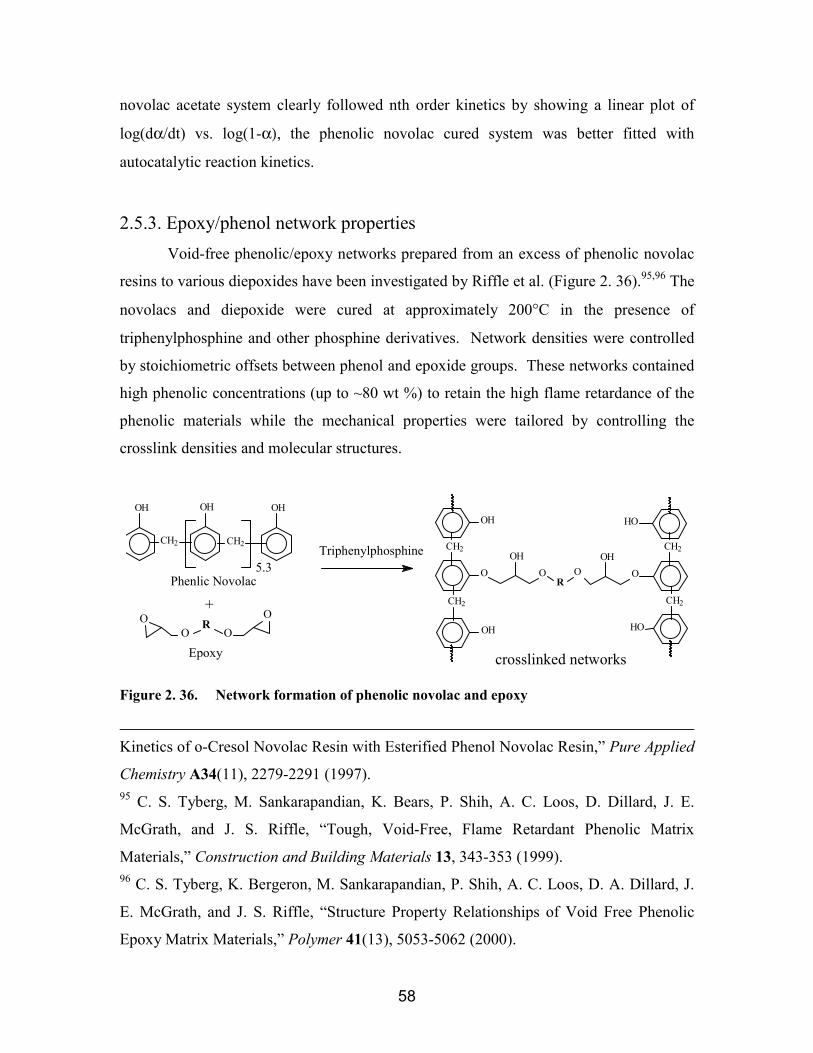
58
novolac acetate system clearly followed nth order kinetics by showing a linear plot of
log(dα/dt) vs. log(1-α), the phenolic novolac cured system was better fitted with
autocatalytic reaction kinetics.
2.5.3. Epoxy/phenol network propertiesVoid-free phenolic/epoxy networks prepared from an excess of phenolic novolac
resins to various diepoxides have been investigated by Riffle et al. (Figure 2. 36).95,96 The
novolacs and diepoxide were cured at approximately 200°C in the presence of
triphenylphosphine and other phosphine derivatives. Network densities were controlled
by stoichiometric offsets between phenol and epoxide groups. These networks contained
high phenolic concentrations (up to ~80 wt %) to retain the high flame retardance of the
phenolic materials while the mechanical properties were tailored by controlling the
crosslink densities and molecular structures.
OH
CH2
OH
CH2
OH
5.3Triphenylphosphine
OH
OOH
OR
O OOH
OH
HO
HO
CH2
CH2
CH2
CH2
OR
OO O
+
Epoxy
Phenlic Novolac
crosslinked networks
Figure 2. 36. Network formation of phenolic novolac and epoxy
Kinetics of o-Cresol Novolac Resin with Esterified Phenol Novolac Resin,” Pure Applied
Chemistry A34(11), 2279-2291 (1997).95 C. S. Tyberg, M. Sankarapandian, K. Bears, P. Shih, A. C. Loos, D. Dillard, J. E.
McGrath, and J. S. Riffle, “Tough, Void-Free, Flame Retardant Phenolic Matrix
Materials,” Construction and Building Materials 13, 343-353 (1999).96 C. S. Tyberg, K. Bergeron, M. Sankarapandian, P. Shih, A. C. Loos, D. A. Dillard, J.
E. McGrath, and J. S. Riffle, “Structure Property Relationships of Void Free Phenolic
Epoxy Matrix Materials,” Polymer 41(13), 5053-5062 (2000).
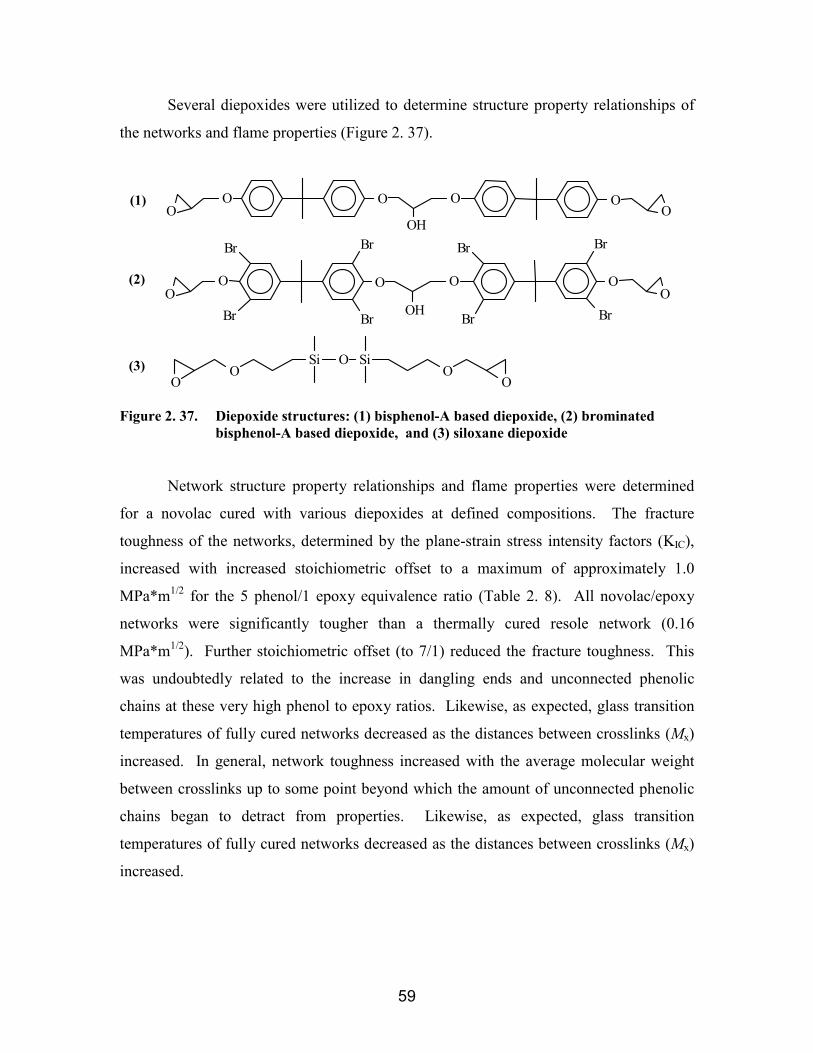
59
Several diepoxides were utilized to determine structure property relationships of
the networks and flame properties (Figure 2. 37).
(3)
(2)
(1)
Si O SiO O
OO
OO O O
OH
OO
O
Br
Br
Br
Br
O O O
OH Br
Br
Br
Br
OO
Figure 2. 37. Diepoxide structures: (1) bisphenol-A based diepoxide, (2) brominatedbisphenol-A based diepoxide, and (3) siloxane diepoxide
Network structure property relationships and flame properties were determined
for a novolac cured with various diepoxides at defined compositions. The fracture
toughness of the networks, determined by the plane-strain stress intensity factors (KIC),
increased with increased stoichiometric offset to a maximum of approximately 1.0
MPa*m1/2 for the 5 phenol/1 epoxy equivalence ratio (Table 2. 8). All novolac/epoxy
networks were significantly tougher than a thermally cured resole network (0.16
MPa*m1/2). Further stoichiometric offset (to 7/1) reduced the fracture toughness. This
was undoubtedly related to the increase in dangling ends and unconnected phenolic
chains at these very high phenol to epoxy ratios. Likewise, as expected, glass transition
temperatures of fully cured networks decreased as the distances between crosslinks (Mx)
increased. In general, network toughness increased with the average molecular weight
between crosslinks up to some point beyond which the amount of unconnected phenolic
chains began to detract from properties. Likewise, as expected, glass transition
temperatures of fully cured networks decreased as the distances between crosslinks (Mx)
increased.

60
Table 2. 8. Tg and KIC of phenolic novolac/epoxy networks
Epoxy Phenol/Epoxy(wt/wt)
Phenol/Epoxy(mol:mol)
Tg
(Cº)KIC
(MPa*m1/2)Mx
(g/mol)Bisphenol-A Epoxy cured with 4,4’-DDS
-- 127 0.62
Phenolic control (thermally curedresole)
-- -- 0.16
80/20 7:1 114 070 4539Bisphenol-A 65/35 3:1 127 0.85 1413
50/50 2:1 151 0.64 64365/35 5.8:1 130 0.74 3511Brominated
Bisphenol-A 50/50 3.1:1 148 0.84 155480/20 7.2:1 96 0.62 4051Disiloxane epoxy65/35 3:1 87 0.77 1030
The flame retardance was measured using a cone calorimeter with a heat flux of
50 kW/m2 and 20.95 mol % O2 content (atmospheric oxygen). All phenolic
novolac/epoxy networks with relatively high novolac compositions showed much lower
peak heat release rates (PHRR) than a typical amine cured epoxy network (bisphenol-A
epoxy stoichiometrically cured with p,p’-diaminodiphenylsulfone) (Table 2. 9).
Brominated epoxy reagents were also investigated since halogenated materials are well
known for their roles in promoting flame retardance. Networks cured with the
brominated diepoxide showed the lowest peak heat release rates, but the char yields of
these networks were lower and the smoke toxicity (CO yield /CO2 yield) was increased.
Incorporating siloxane moieties into networks reduced the peak heat release rates and
smoke toxicities compared to the novolac networks cured with bisphenol-A diepoxides.

61
Table 2. 9. Flame retardance of networks prepared form a phenolic novolac crosslinkedwith various epoxies97
Epoxy Phenolic/Epoxy(wt/wt)
PHRR(KW/m2)
Charyield(%)
SmokeToxicity*(x10-3)
Bisphenol-A Epoxy cured with 4,4’-DDS 1230 5 44Phenolic control (thermally cured resole) 116 63Bisphenol-A 80/20 260 33 27Bisphenol-A 65/35 360 29 34Bisphenol-A 50/50 380 23 36Brominatedbisphenol-A
65/35 165 8 189
Brominatedbisphenol-A
50/50 158 9 175
Disiloxane epoxy 80/20 226 35 15Disiloxane epoxy 65/35 325 24 27
*smoke toxicity: CO/CO2 release
A biphenol diglycidyl ether based epoxy resin was crosslinked with amine curing
agents (4,4’-diaminodiphenylmethane and aniline novolac) and phenol curing agents
(phenol novolac and catechol novolac), and the thermo-mechanical properties were
investigated.98 Unlike bisphenol-A epoxy based networks, distinct Tgs were not observed
with the amine cured biphenol epoxy networks. This was hypothesized to be caused by
the mesogenic nature of the biphenol groups which allowed the chains to be more closely
packed. Thus, it was reasoned that the mobility did not decrease significantly with the
transition into the rubbery region. The presence of a distinct Tg when phenols were used
to cure biphenol based diepoxide depended on the phenolic structure. Whereas a distinct
Tg was evident in the phenolic novolac cured systems, no definite Tgs were observed
when catechol novolac was used. The higher moduli shown by the catechol novolac
97 Tests were conducted at Naval Surface Warfare Center, Carderock, Maryland.98 M. Ochi, N. Tsuyuno, K. Sakaga, Y. Nakanishi, and Y. Murata, “Effect of Network
Structure on Thermal and Mechanical Properties of Biphenyl-Type Epoxy Resins Cured
with Phenols,” Journal of Applied Polymer Science 56, 1161-1167 (1995).
62
cured networks were attributed to the orientation of mesogenic biphenyl groups which
suppressed micro-Brownian chain motions.
Network properties and microscopic structures of various epoxy resins
crosslinked by phenolic novolacs were investigated by Suzuki et al.99 Positron
annihilation spectroscopy (PAS) was utilized to characterize intermolecular-spacing of
networks and the results were compared to bulk polymer properties. The lifetime (τ3)
and intensity (I3) of the active species (positronium ions) correspond to volume and
number of “holes” which constitute the free volume in the network. Networks cured with
flexible epoxies had more “holes” throughout the temperature range, and were more
affected by the temperature changes. Glass transition temperatures and thermal
expansions (α) were calculated from plots of τ3 (free volume) versus temperature. The
Tgs and thermal expansion efficients obtained from PA were lower than these obtained
from thermomechanical analysis. These differences were attributed to the micro-
Brownian motions determined by PAS versus large-scale polymer properties determined
by thermomechanical analysis. The differences in Tgs and thermal expansion efficients
were more pronounced for the more highly crosslinked materials. The rate of moisture
absorption is proportional to I3 of the network, therefore networks with larger free
volume absorbed water at a faster rate.
2.6. BenzoxazinesBenzoxazines are heterocyclic compounds obtained from Mannich reactions of
phenols, primary amines, and formaldehyde (Figure 2. 38).100,101 As described previously,
99 T. Suzuki, Y. Oki, M. Numajiri, T. Miura, K. Kondo, Y. Shiomi, and Y. Ito, “Novolac
Epoxy Resins and Positron Annihilation,” Journal of Applied Polymer Science 49, 1921-
1929 (1993).100 W. J. Burke, E. L. M. Glennie, and C. Weatherbee, “Condensation of Halophenols
with Formaldehyde and Primary Amines,” Journal Organic Chemistry 29, 909 (1964).101 X. Ning and H. Ishida, “Phenolic Materials via Ring-Opening Polymerization:
Synthesis and Characterization of Bisphenol-A Based Benzoxazines and Their

63
they are key reaction intermediates in the hexamethylenetetramine (HMTA) novolac cure
reaction.41,44 Crosslinking benzoxazines at high temperatures give rise to void free
networks with high Tgs, excellent heat resistance, good flame retardance, and low smoke
toxicity.102 As in HMTA cured novolac networks, further structural rearrangement may
occur at higher temperatures.
HO OH CH2O
NH2
42O O
N
N
++
Figure 2. 38. Synthesis of bisphenol-A based benzoxazines
A difunctional bisphenol-A epoxy based benzoxazine has been synthesized and
characterized by GPC and 1H NMR.101 A small of amount of dimers and oligomers also
formed. Thermal crosslinking of bisphenol-A benzoxazine containing dimers and
oligomers resulted in networks with relatively high Tgs. Dynamic mechanical analysis of
the network showed a peak of tan delta at approximately 185°C.
The kinetics of bisphenol-A benzoxazine crosslinking reactions was studied using
differential scanning calorimetry.102 The activation energy, estimated from plots of
conversion as a function of time for different isothermal cure temperatures, was between
102 and 116 KJ/mol. Phenolic compounds with free ortho positions were suggested to
initiate the benzoxazine reaction (Figure 2. 39).103 Fast reactions between benzoxazines
Polymers,” Journal of Polymer Science. Part A: Polymer Chemistry 32, 1121-1129
(1994).102 H. Ishida and Y. Rodriguez, “Cure Kinetics of a New Benzoxazine-Based Phenolic
Resin by Differential Scanning Calorimetry,” Polymer 36(16), 3151-3158 (1995).103 G. Riess, J. M. Schwob, G. Guth, M. Roche, and B. Lande in B. M. Culbertson and J.
E. McGrath, eds, “Ring Opening Polymerization of Benzoxazines-A New Route to

64
and free ortho phenolic positions, which formed hydroxybenzylamines, were facilitated
by hydrogen bonding between the phenol hydroxyl and benzoxazine oxygen (as shown in
Figure 2. 18). Subsequent thermal decompositions of these less stable
hydroxybenzylamines lead to more rapid thermal crosslinking (as described for the
HMTA/novolac cure).
OH
R1
+
NOR2
R1
OH
R1
NR2 n
Figure 2. 39. Reaction of benzoxazines with free ortho positions on phenolic compounds
The reaction of bisphenol-A benzoxazine under strong and weak acidic conditions
was also investigated.104 The proposed mechanism for the benzoxazine ring opening
reaction in the presence of a weak acid involves an initial tautomerization between the
benzoxazine ring and chain forms. Electrophilic aromatic substitution reaction between a
phenolic ring position and the chain tautomer, an iminium ion was suggested to follow.
Strongly acidic conditions, high temperatures and the presence of water lead to various
side reactions, including benzoxazine hydrolysis in a reverse Mannich reaction. Side
reactions could also terminate reaction or lead to crosslinking.
The oxazine ring in benzoxazine assumes a distorted semi-chair conformation.105
The ring strain and the strong basicity of the nitrogen and oxygen allow benzoxazines to
Phenolic Resins,” in Advances in Polymer Synthsis,. Plenum Press, New York, 1985, pp
27-50.104 J. Dunkers and H. Ishida, “Reaction of Benzoxazine-Based Phenolic Resins with
Strong and Weak Carboxylic Acids and Phenol as Catalysts,” Journal of Polymer
Science. Part A: Polymer Chemistry 37(13), 1913-1921 (1999).105 H. Ishida and D. J. Allen, “Physical and Mechanical Characterization of Near Zero
Shrinkage Polybenzoxazines,” Journal Polymer Science. Polymer Physical Ed. 34(6),
1019-1031 (1996).
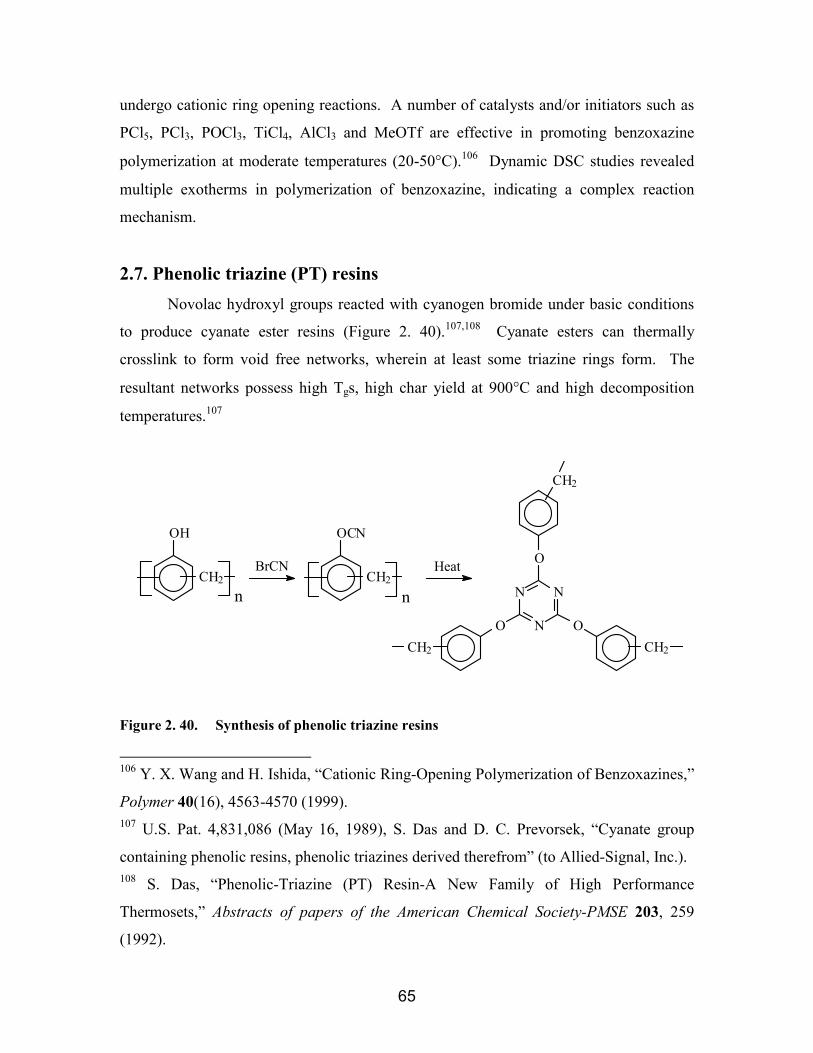
65
undergo cationic ring opening reactions. A number of catalysts and/or initiators such as
PCl5, PCl3, POCl3, TiCl4, AlCl3 and MeOTf are effective in promoting benzoxazine
polymerization at moderate temperatures (20-50°C).106 Dynamic DSC studies revealed
multiple exotherms in polymerization of benzoxazine, indicating a complex reaction
mechanism.
2.7. Phenolic triazine (PT) resinsNovolac hydroxyl groups reacted with cyanogen bromide under basic conditions
to produce cyanate ester resins (Figure 2. 40).107,108 Cyanate esters can thermally
crosslink to form void free networks, wherein at least some triazine rings form. The
resultant networks possess high Tgs, high char yield at 900°C and high decomposition
temperatures.107
OH
CH2
n
BrCN
nCH2
OCN
N
N
N
O
OO
CH2
CH2 CH2
Heat
Figure 2. 40. Synthesis of phenolic triazine resins
106 Y. X. Wang and H. Ishida, “Cationic Ring-Opening Polymerization of Benzoxazines,”
Polymer 40(16), 4563-4570 (1999).107 U.S. Pat. 4,831,086 (May 16, 1989), S. Das and D. C. Prevorsek, “Cyanate group
containing phenolic resins, phenolic triazines derived therefrom” (to Allied-Signal, Inc.).108 S. Das, “Phenolic-Triazine (PT) Resin-A New Family of High Performance
Thermosets,” Abstracts of papers of the American Chemical Society-PMSE 203, 259
(1992).
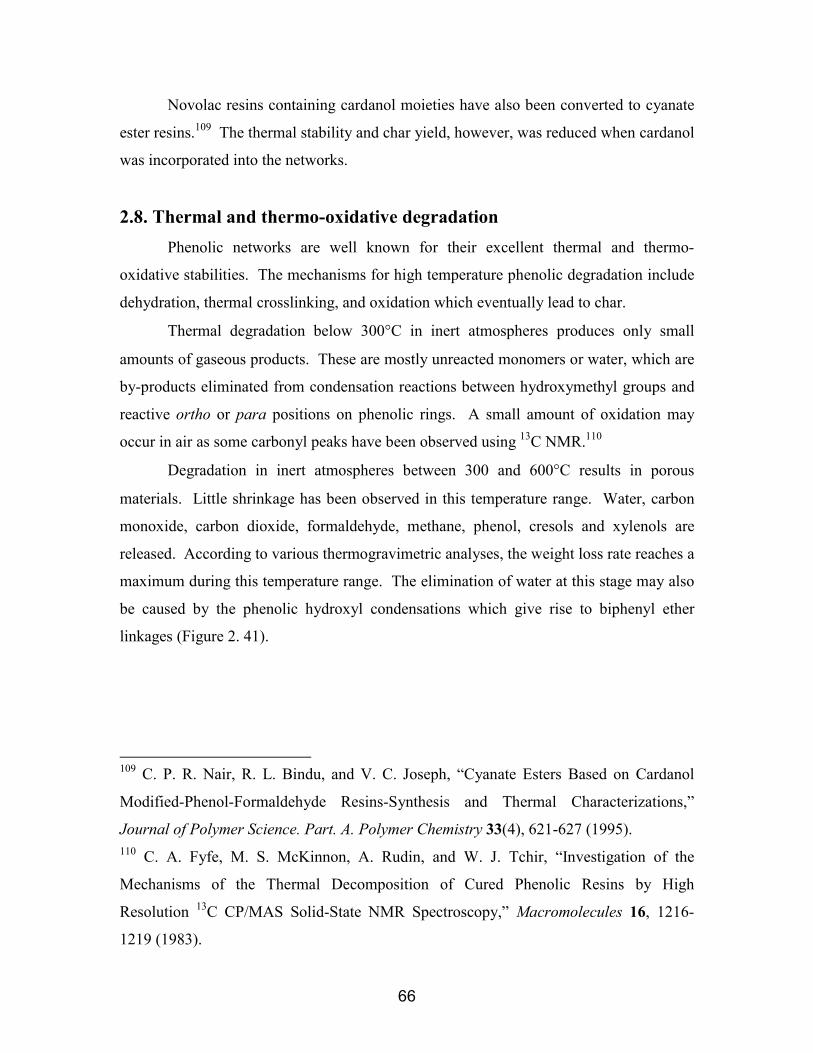
66
Novolac resins containing cardanol moieties have also been converted to cyanate
ester resins.109 The thermal stability and char yield, however, was reduced when cardanol
was incorporated into the networks.
2.8. Thermal and thermo-oxidative degradationPhenolic networks are well known for their excellent thermal and thermo-
oxidative stabilities. The mechanisms for high temperature phenolic degradation include
dehydration, thermal crosslinking, and oxidation which eventually lead to char.
Thermal degradation below 300°C in inert atmospheres produces only small
amounts of gaseous products. These are mostly unreacted monomers or water, which are
by-products eliminated from condensation reactions between hydroxymethyl groups and
reactive ortho or para positions on phenolic rings. A small amount of oxidation may
occur in air as some carbonyl peaks have been observed using 13C NMR.110
Degradation in inert atmospheres between 300 and 600°C results in porous
materials. Little shrinkage has been observed in this temperature range. Water, carbon
monoxide, carbon dioxide, formaldehyde, methane, phenol, cresols and xylenols are
released. According to various thermogravimetric analyses, the weight loss rate reaches a
maximum during this temperature range. The elimination of water at this stage may also
be caused by the phenolic hydroxyl condensations which give rise to biphenyl ether
linkages (Figure 2. 41).
109 C. P. R. Nair, R. L. Bindu, and V. C. Joseph, “Cyanate Esters Based on Cardanol
Modified-Phenol-Formaldehyde Resins-Synthesis and Thermal Characterizations,”
Journal of Polymer Science. Part. A. Polymer Chemistry 33(4), 621-627 (1995).110 C. A. Fyfe, M. S. McKinnon, A. Rudin, and W. J. Tchir, “Investigation of the
Mechanisms of the Thermal Decomposition of Cured Phenolic Resins by High
Resolution 13C CP/MAS Solid-State NMR Spectroscopy,” Macromolecules 16, 1216-
1219 (1983).

67
OH HO O-H2O
+
Figure 2. 41. Dehydration of hydroxyl groups
Morterra and Low111,112 proposed that thermal crosslinking may occur between
300°C and 500°C where phenolic hydroxyl groups react with methylene linkages to
eliminate water (Figure 2. 42). Evidence for this mechanism is provided by IR spectra
which show decreased OH stretches and bending absorptions as well as increased
complexity of the aliphatic CH stretch patterns in this temperature range.
OH
HO
OH
-H2O+
HO
OH
Figure 2. 42. Thermal crosslinking of phenolic hydroxyl and methylene linkages
At elevated temperatures, methylene carbons cleave from aromatic rings to form
radicals (Figure 2. 43). Further fragmentation decomposes xylenol to cresols and
methane (Figure 2. 43A). Alternatively, auto-oxidation occurs (Figure 2. 43B).
Aldehydes and ketones are intermediates before decarboxylation or decarbonylation takes
place to generate cresols and carbon dioxide. These oxidative reactions are possible even
in inert atmospheres due to the presence of hydroxyl radicals and water.7
111 C. Morterra and M. I. D. Low, “IR Studied of Carbons-VII. The Pyrolysis of a Phenol-
Formaldehyde Resin,” Carbon 23(5), 525-530 (1985).112 C. Morterra and M. I. D. Low, “Infrared Studies of Carbon. 8. The Oxidation of
Phenol-Formaldehyde Chars,” Langmuir 1, 320-326 (1985).
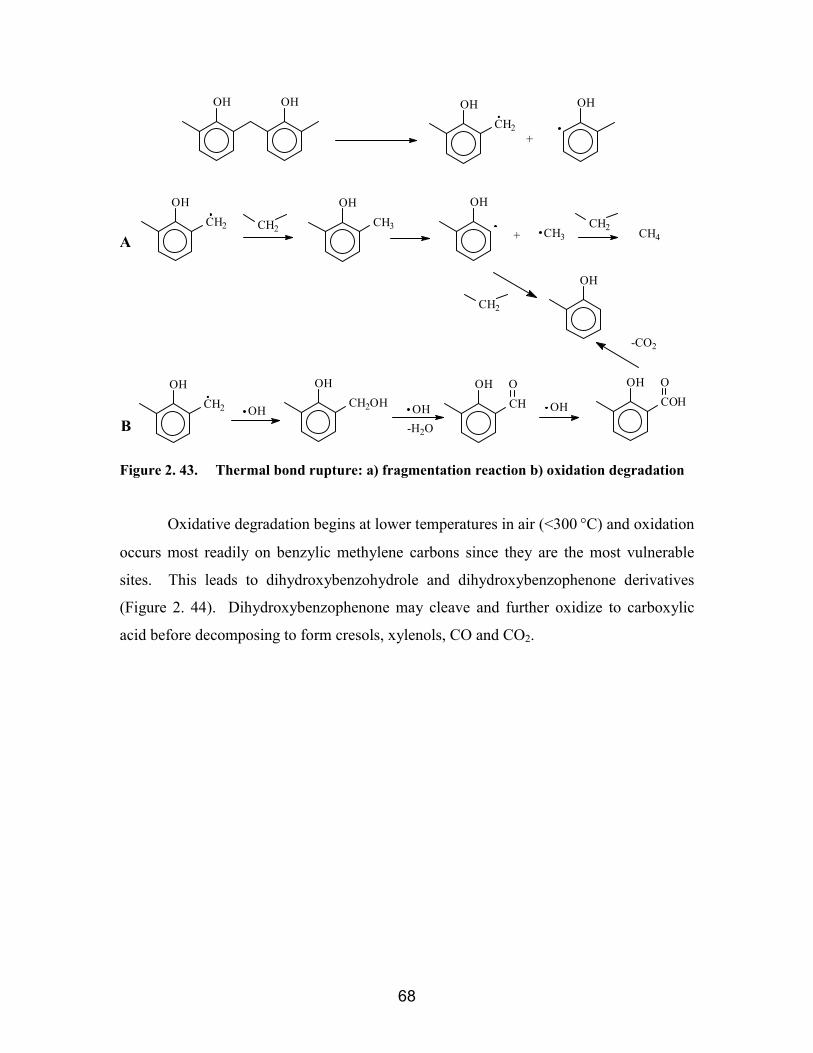
68
B
A
-CO2
-H2O
+
+
OHCOHOOH
CHO
OHOH
OHCH2OH
OH
OHCH2
CH4
CH2
CH2
OH
CH3
OHOHCH3CH2
OHCH2
OHOHCH2
OH OH
Figure 2. 43. Thermal bond rupture: a) fragmentation reaction b) oxidation degradation
Oxidative degradation begins at lower temperatures in air (<300 °C) and oxidation
occurs most readily on benzylic methylene carbons since they are the most vulnerable
sites. This leads to dihydroxybenzohydrole and dihydroxybenzophenone derivatives
(Figure 2. 44). Dihydroxybenzophenone may cleave and further oxidize to carboxylic
acid before decomposing to form cresols, xylenols, CO and CO2.
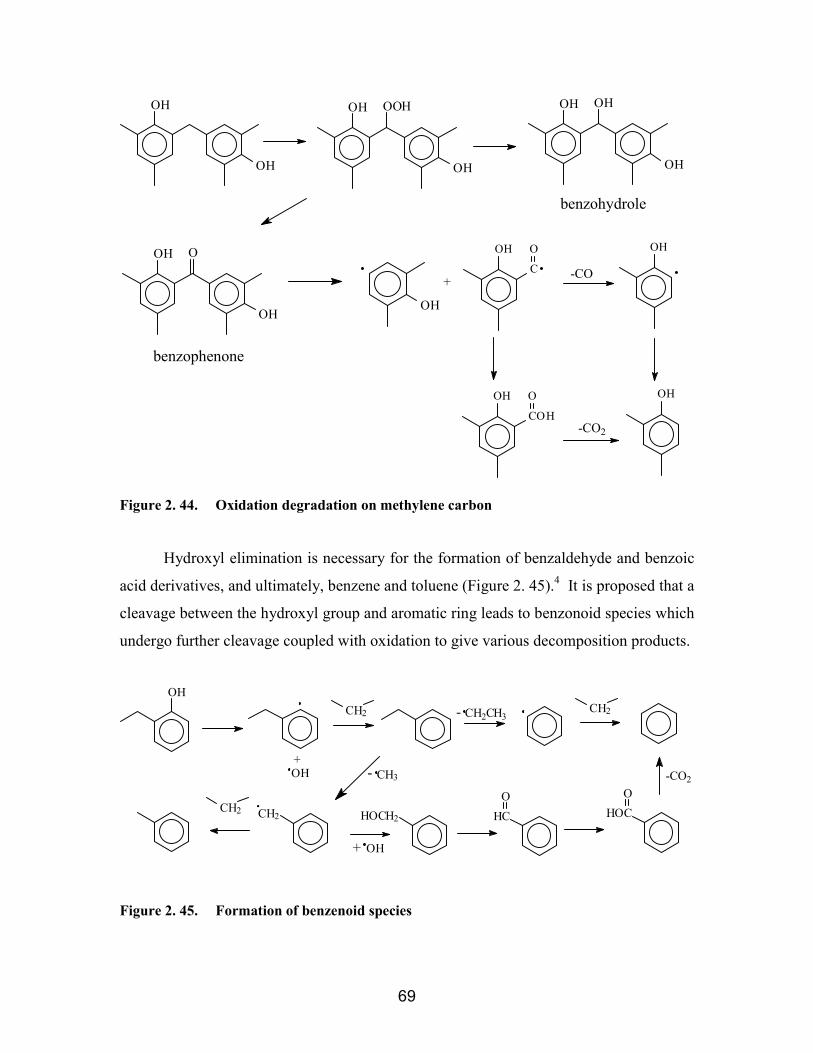
69
benzophenone
benzohydrole
+
-CO2
OH
COH
O
-CO
OH
OH
C
O
OH
OH
OH
OH
OH
O
OH
OH
OOH
OH
OH
OH
OH
Figure 2. 44. Oxidation degradation on methylene carbon
Hydroxyl elimination is necessary for the formation of benzaldehyde and benzoic
acid derivatives, and ultimately, benzene and toluene (Figure 2. 45).4 It is proposed that a
cleavage between the hydroxyl group and aromatic ring leads to benzonoid species which
undergo further cleavage coupled with oxidation to give various decomposition products.
-CO2
CH2
+ OH
- CH3
+
CH2CH2
OH
HOCO
HCO
HOCH2CH2
OH
CH2CH3-
Figure 2. 45. Formation of benzenoid species
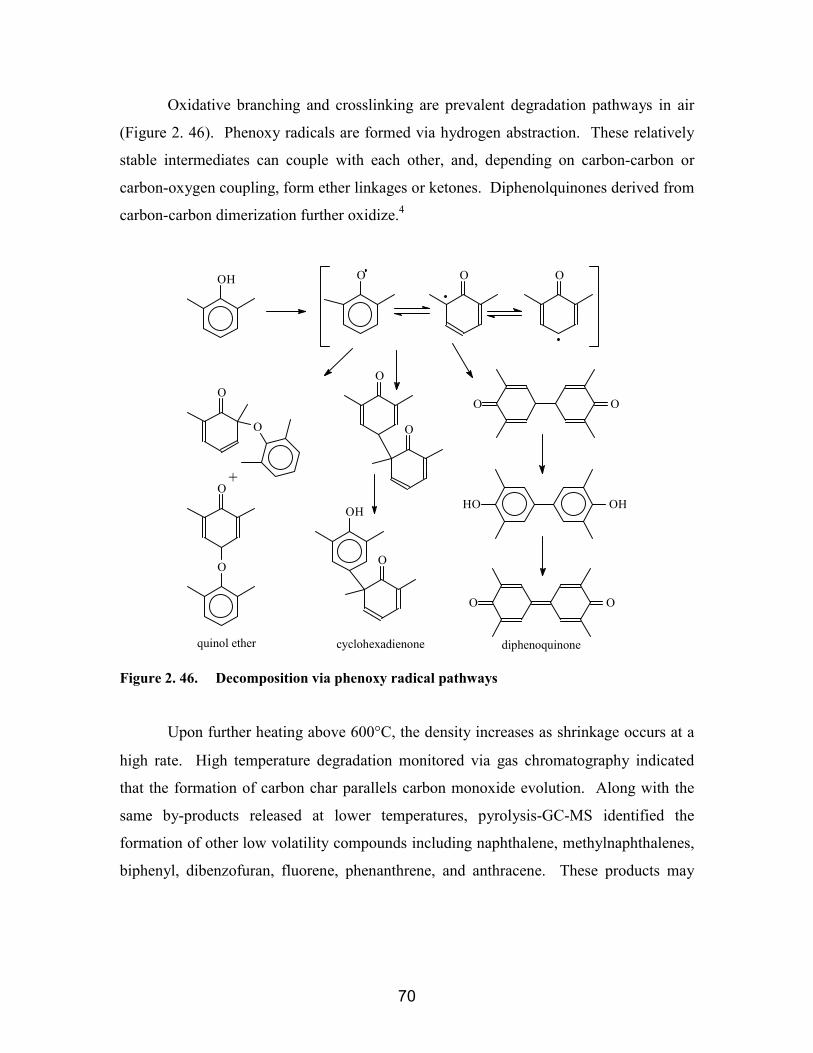
70
Oxidative branching and crosslinking are prevalent degradation pathways in air
(Figure 2. 46). Phenoxy radicals are formed via hydrogen abstraction. These relatively
stable intermediates can couple with each other, and, depending on carbon-carbon or
carbon-oxygen coupling, form ether linkages or ketones. Diphenolquinones derived from
carbon-carbon dimerization further oxidize.4
+
diphenoquinonecyclohexadienonequinol ether
O O
OHHO
O O
O
O
O
O
O
O
O
OOOH
OH
O
Figure 2. 46. Decomposition via phenoxy radical pathways
Upon further heating above 600°C, the density increases as shrinkage occurs at a
high rate. High temperature degradation monitored via gas chromatography indicated
that the formation of carbon char parallels carbon monoxide evolution. Along with the
same by-products released at lower temperatures, pyrolysis-GC-MS identified the
formation of other low volatility compounds including naphthalene, methylnaphthalenes,
biphenyl, dibenzofuran, fluorene, phenanthrene, and anthracene. These products may

71
result from condensation of hydroxyl groups of adjacent ortho-ortho linked phenolic
rings113 (Figure 2. 47).
OHOOH
CH2-H2O
Figure 2. 47. Condensation of ortho hydroxyl groups
The reaction sequence for char formation was also proposed to occur through
initial formation of quinone type linkages, which lead to polycyclic products7 (Figure 2.
48). The quinone functionalities were confirmed through IR studies. NMR spectra
showed that at 400°C almost all methylene linkages and carbonyl groups shift or
disappear. Mostly aromatic species are present. This is consistent with the proposed char
forming mechanism but is also compatible with the formation of biphenyls through direct
elimination of CO.110
+
+
OOH OH
CO
OH
OHHOC
OOO
OOH OH
Figure 2. 48. Char formation 113 J. Hetper and M. Sobera, “Thermal Degradation of Novolac Resins by Pyrolysis-Gas
Chromatography with a Movable Reaction Zone,” Journal of Chromatography A 833,
277-281 (1999).

72
Conley showed that the primary degradation route for resole networks is
oxidation regardless of the atmosphere.8 By contrast, Morterra et al. found that auto-
oxidation was not the major degradation pathway for novolac resins.111 The degradation
is proposed to occur in two stages depending on the temperature. Fragmentation of the
polymer chain, beginning at approximately 350°C, does not affect the polymer integrity.
Above 500°C the network collapses as polyaromatic domains form.
Novolac network degradation mechanisms vary from those of resole networks due
to differences in crosslinking methods. Nitrogen containing linkages must also be
considered when HMTA (or other crosslinking agent) was used to cure novolac
networks. For example, tribenzylamines, formed in HMTA cured novolac networks,
decompose to cresols and azomethines (Figure 2. 49).
OHOH
N
3
OH
N
OH
+
Figure 2. 49. Decomposition of tribenzylamine
Novolacs and networks which had been slowly heated in an inert atmosphere
were studied. 1-2 wt. % of water and phenol evolved between 100 and 350°C.114 Above
that temperature, small quantities of CO, CO2, CH4, and low molecular weight aromatics
evolved leaving behind 75–85% by weight of polymer. The degradation of these pre-
exposed networks were then studied at temperatures up to ~700°C in both air and
nitrogen. The rate of weight loss in air suggested that degradation under these conditions
is a multistage process. Evidence suggested that this multistage thermo-oxidative process
was due to two types of linking units present, which pyrolyzed at 375-400°C and 500-
550°C respectively. By contrast, the degradation process in nitrogen was a single stage
process. Both processes formed a char representing 90-95% by weight of the pre-
114 V. Jha, A. Banthia, and A. Paul, “Thermal Analysis of Phenolic Resin Based
Pyropolymers,” Journal of Thermal Analysis 35, 1229-1235 (1989).
73
exposed materials. As expected, lower weight loss occurred with increased levels of the
HMTA crosslinking reagent introduced into the network.
Oxygen indices of a series of phenolic networks, i.e. heat cured resoles, novolacs
cured with formaldehyde, trioxane, or terephthaloyl chloride were investigated.115 It has
been previously shown that oxygen indices (OI) correlate linearly with char yields at
800°C in nitrogen except for cases involving gas phase retarders such as halogenated
aromatic materials (van Krevelen). Meta- and para-cresol formaldehyde networks
exhibited slightly lower OI values than unsubstituted phenolics, presumably due to the
presence of flammable methyl substituents. The halogenated phenolics showed higher OI
values but lower char yields since halogenated materials undergo a gas phase retardation
of burning and the heavy halogen substituents convert to gaseous products. The
crosslinking agent also has an affect on OI. Networks with methylene linkages derived
from formaldehyde crosslinking reagents give rise to higher OI values than these with
ester linkages derived from terephthaloyl chloride. The formaldehyde cured novolacs
also showed higher OI than trioxane cured materials since less stable ether linkages were
formed in the trioxane crosslinked systems.
The effects of structures and the levels of crosslink densities on thermal stabilities
of novolac resins were investigated.116 Three types of novolacs were prepared by
reacting phenol with formaldehyde, meta-cresol with formaldehyde, and para-cresol with
formaldehyde in formaldehyde/phenol molar ratio of 0.95. Lightly crosslinked networks
were obtained when the trifunctional phenol or meta-cresol was used. As expected, para-
cresol novolac was linear. The thermal degradation behaviors for the lightly crosslinked
networks, the para-cresol novolac as well as typical novolac resins were examined.
Under inert atmosphere, TGA results revealed that the crosslinked samples had lower
115 Y. Zaks, J. Lo, D. Raucher, and E.M. Pearce, “Some Structural Property Relationships
in Polymer Flammability: Studies of Phenolic-Derived Polymers,” Journal Applied
Polymer Science 27, 913-930 (1982).116 L. Costa, L. Rossi di Montelera, G. Camino, E. D. Weil, and E. M. Pearce, “Structure-
Charring Relationship in Phenol-Formaldehyde Type Resins,” Polymer Degradation and
Stability 56, 27-35 (1997).
74
decomposition temperatures but the char yields were significantly higher. The greater
stabilities exhibited at higher temperatures (500°C+) for the crosslinked materials were
attributed to lesser fragmentation, and therefore, lower volatiles. In air, the crosslinked
materials were less stable throughout the whole temperature range with complete
degradation occurring 50°C below the low molecular weight resins. It was suggested that
the crosslinked materials may be less susceptible to oxidation, and therefore, unable to
form more thermally stable intermediates. Comparatively, the phenol-formaldehyde resin
showed the highest thermal and thermal oxidative stability, followed by the meta-cresol-
formaldehyde resin. The para-cresol-formaldehyde showed the least stability. Since the
reactivity of starting phenolic monomer was different, novolac oligomers prepared via the
same approach resulted in different structures. The results obtained in this study therefore
could not be compared quantitatively.
A low molecular weight para-cresol novolac resin (Mn~560) prepared by
Belbachir et al.117 showed high crystalline ratio according to X-ray diffraction. No
weight loss was observed below 400°C. However, the morphology changes to a
semicrystalline state after repeat thermal heating/cooling cycles.
117 A. Hamou, C. Devallencourt, F. Burel, J. M. Saiter, and M. Belbachir, “Thermal
Stability of a para-Cresol Novolac Resin,” Journal of Thermal Analysis 52, 697-703
(1998).

75
3. Controlled Molecular Weight Cresol-FormaldehydeOligomers
3.1. IntroductionPhenolic resins are among the oldest known and highest volume thermosetting
materials produced in the United States.118 Among the numerous attractive properties of
phenolic resins and their networks are low cost and excellent flame retardance.119,120
Therefore, we and others are investigating this class of materials as possible matrix resins
for flame retardant structural composites. The most common phenolic prepolymers are
derived from reacting phenol with formaldehyde or with formaldehyde derivatives. This
reaction occurs most rapidly under extremely acidic or basic conditions. The pH of the
reactions and the stoichiometric ratio of the monomers give rise to two classes of
phenolic prepolymers known as novolacs and resoles.
Novolac oligomers are prepared in acidic media using an excess of phenol over
formaldehyde. The mechanism associated with this reaction has been described in four
steps (Figure 3. 1). First a methylene glycol is protonated by an acid from the reaction
medium, which then releases water to form a hydroxymethylene carbonium ion (step 1).
This ion acts as a hydroxyalkylating agent by reacting with a phenol via electrophilic
aromatic substitution. A pair of electrons from the benzene ring attacks the electrophile
forming a carbocation intermediate followed by deprotonation and regain of aromaticity
(step 2). The methylol group of the hydroxymethylated phenol is unstable under acidic
conditions and loses water readily to form a benzylic carbonium ion (step 3). This ion
118 A. Knopp and L. A. Pilato, Phenolic Resins: Chemistry, Application and
Performance-Future Directions; Springer-Verlag, New York, 2000.119 F. Y. Hsieh and H. D. Beeson, “Flammability Testing of Flame Retarded Epoxy
Composites and Phenolic Composites,” Fire and Materials 21, 41-49 (1997).120 C. J. Hilado, A M. Machado, and D. P. Brauer, “Effect of Char Yield and Chemical
Structure on Toxicity of Pyrolysis Gases,” Proc. West. Pharmacol. Soc. 22, 201-4 (1979).

76
then reacts with another phenol to form a methylene bridge in another electrophilic
aromatic substitution. This major process repeats until the formaldehyde is exhausted.121
Typically 0.75 to 0.85 moles of formaldehyde are used for each mole of phenol in
the synthesis of low molecular weight novolacs,118 and branched oligomers with phenol
endgroups are formed since phenol is used in excess. These prepolymers are thermally
stable and can be stored effectively. Novolac crosslinking is usually achieved by
introducing a source of methylene groups to form additional methylene bridges between
aromatic rings. Hexamethylenetetramine (HMTA) is the most widely used curing agent
(source of formaldehyde) for these reactions. Other curing agents with limited
importance include paraformaldehyde and trioxane.118
Figure 3. 1. Mechanism for the major process of phenolic novolac resin synthesis
Resoles are obtained by reacting an excess of formaldehyde with phenol under
basic conditions. This produces resins with aromatic methylol groups derived from the
excess of formaldehyde. Resoles are fairly stable at ambient temperatures, but react
rapidly at elevated temperatures forming methylene linkages by eliminating water and
121 A. Knopp and W. Scheib, Chemistry and Application of Phenolic Resins, Springer-
Verlag, New York, 1979.
H+HO CH2 OH +CH2 OH + H2O
OH
+ +CH2 OH
OHCH2 OH
+
OHCH2 OH
+ H+
OH
CH2 OHH++
OH
CH2+
+OH
CH2+
OH OH
CH2
OH
+ H+
1)
2)
3)
4)
slow fast
+
+ H2O
77
other by-products. Since these materials can be “self”-crosslinked thermally, long-term
storage is more difficult.
Regardless of the curing method, either by introducing a crosslinking agent or by
thermal self-condensation, the network forming process is accompanied by the generation
of volatile by-products such as ammonia, water and formaldehyde. Volatiles often cause
voids in the networks.122,123,124 This, along with a lack of control over crosslink density,
results in brittle networks.
Void-free networks can be prepared by reacting phenolic novolacs with epoxies in
reactions where the phenolic hydroxyl groups react with the epoxy groups.125,126,127,128
Workers in our laboratories have previously demonstrated that phenolic-epoxy networks
with high phenolic compositions, and with a relatively high phenol functionality per
chain (~7), exhibit significantly improved toughness while retaining most of the flame-
122 C. M. Branco, J. M. Ferreira, and M. O. W. Richardson, “A Comparative Study of the
Fatigue Behaviour of GRP Hand Lay-up and Pultruded Phenolic Composites,” Int. J.
Fatigue 18(4), 255-2643 (1995).123 J. Wolfrum and G. W. Ehrenstein, “Interdependence Between the Curing, Structure,
and the Mechanical Properties of Phenolic Resins,” Journal of Applied Polymer Science
74, 3173-3185 (1999).124 L. B. Manfredi, O. de la Osa, N. Galego Fernandez, and A. Vazquez, “Structure-
Properties Relationship for Resoles with Different Formaldehyde/Phenol Molar Ratio,”
Polymer 40, 3867-3875 (1999).125 Potter, W. G, Epoxide Resins, Springer-Verlag, New York, 1970.126 A. Hale, C. W. Macosko, and H. E. Bair, “DSC and C-13-NMR Studies of the
Imidazole-Accelerated Reaction Between Epoxides and Phenols,” Journal of Applied
Polymer Science 38(7), 1253-1269 (1989).127 M. Ogata, N. Kinjo, and T. Kawata, “Effects of Crosslinking on Physical Properties of
Phenol-Formaldehyde Novolac Cured Epoxy Resins,” Journal of Applied Polymer
Science 48, 583-601 (1993).128 A. K. Banthia and J. E. McGrath,.“Catalysts for Bisphenol-Diglycidyl Ether Linear
Step-Growth Polymerization,” ACS Polym. Prepr. Div. Polym. Chem. 20(2), 629 (1979).
78
retardant properties.129,130 These improved mechanical properties have been correlated
with increased molecular weight between crosslinks achieved by leaving many phenolic
hydroxyl groups unreacted.
Linear, cresol novolac oligomers, obtained by reacting difunctional ortho- or
para-cresol with formaldehyde, are widely used as coatings, adhesives, electronic
insulation materials, and for automotive applications.118 Low molecular weight
oligomers have also been reacted with epichlorohydrin to form epoxy resins.125 A para-
cresol novolac (Mn=580 g/mol) exhibited a semi-crystalline structure with good thermal
stability.131 Ortho- and para-cresol have also been copolymerized with meta-cresol for
use in the electronic industry as photoresists. Since ortho- and para-cresol have slower
reaction rates with formaldehyde than meta-cresol, oligomers with meta-cresol blocks
were obtained having primarily ortho- or para-cresol endgroups.132,133
Ortho- or para-cresol novolac formation, which involves exclusively difunctional
monomers, are linear condensation polymerizations. The molecular weights of these
129 C. S. Tyberg, K. Bergeron, M. Sankarapandian, P. Shih, A. C. Loos, D. A. Dillard, J.
E. McGrath, and J. S. Riffle; “Structure Property Relationshiips of Void Free Phenolic
Epoxy Matrix Materials,” Polymer 41(13), 5053-5062 (2000).130 H. Ghassemi, H. K. Shoba, M. Sankarapandian, A. Shultz, C. L. Sensenich, J. S.
Riffle, J. J. Lesko, and J. E. McGrath, “Volatile-Free Phenolic Networks for
Infrastructure,” in Fiber Composites in Infrastructure, H. Saasatamanesh, M. R. Ehsani,
editors, 1, 14-22 (1998).131 A. Hamou, C. Devallencourt, F. Burel, J. M. Saiter, and M. Belbachir, “Thermal
Stability of a para-Cresol Novolac Resin,” Journal of Thermal Analysis and Calorimetry
52(3), 697-703 (1998).132 L. E. Bogan, Jr., in P. N. Prasad, ed., “Understanding the Novolac Synthesis
Reaction,” Frontiers of Polymers and Advanced Materials, Plenum Press, New York,
1994, 311-318.133 St. Miloshev, P. Novakov, Vl. Dimitrov, and I. Gitsov, “Synthesis of Novolac Resins.
I. Influence of the Chemical Structure of the Monomers and Reaction Conditions on
Some Properties of Novolac Oligomers,” Chemtronics 4, 251-253 (1989).

79
cresol novolacs, therefore, should depend on the monomer feed ratio. However, to date,
cresol resin syntheses follow typical phenolic novolac synthesis procedures where
reactions are terminated at a pre-determined viscosity or reaction time. The difficulty in
molecular weight control arises from side reactions, which offset the stoichiometric ratio
necessary to obtain target molecular weights. This paper describes the synthesis of linear
controlled molecular weight cresol novolacs. The degree of molecular weight control
achievable and properties such as glass transition temperatures, molecular weight
distributions, and melt viscosities will be discussed. These cresol novolacs have also
been crosslinked with epoxies. The network formation reactions and their properties will
be addressed in a separate paper.
3.2. Experimental
3.2.1. MaterialsOrtho-cresol (99+%), para-cresol (99%), 2,6-dimethylphenol (99%),
paraformaldehyde (powder, 95%), formaldehyde (37 wt % solution in water), and oxalic
acid dihydrate (99%) were obtained from Aldrich. A commercial phenolic resin was
kindly provided by Georgia-Pacific (Product #GP-2073). All reagents were used as
received.
3.2.2. Molecular Weight CalculationsThe following method was used to calculate the stoichiometric ratio of monomers
required to obtain specified number average molecular weights. The molecular weight of
two endcapping molecules, 2,6-dimethylphenol, and one methylene linkage, -CH2-, were
subtracted from the total targeted molecular weight. The remaining weight was divided
by the molecular weight of each repeat unit (120 g/mol) to obtain the number of repeat
units within the chain (x). The stoichiometric ratio then consisted of two moles of 2,6-
dimethylphenol, x moles of cresol, and x+1 moles of formaldehyde.
3.2.3. Synthesis of 2,6-Dimethylphenol Endcapped Cresol Novolac ResinOrtho-cresol novolac and para-cresol novolac resins were prepared in the same
manner. The following shows a sample reaction for preparing a 2000 g/mol ortho-cresol
80
novolac resin. In a resin kettle equipped with a stainless steel mechanical stirrer and a
condenser connected to an outlet, ortho-cresol (303.5g, 2.81mol) and 2,6-dimethylphenol
(47.2g, 0.39mol) and paraformaldehyde (94.9g, 3.0 mol) were added. This mixture,
along with oxalic acid dihydrate (2.5 wt. % (2.14 mol %) based on the weight of cresol,
7.59g) was heated for approximately 6 hours at 100°C, then an ~10mol % excess of
formaldehyde (37 wt. % formaldehyde in water, 27 ml) was added to the reaction. The
reaction was continued for an additional 18 hours. It was washed twice with boiling
deionized water, then stripped under mild vacuum while being slowly heated to 215°C.
3.2.4. Sample Preparation for Viscosity MeasurementsAll cresol novolac resins and the control commercial phenolic resin were vacuum
stripped (30 Hg) for 2 hours at 165°C prior to any measurements.
3.2. Characterization
3.2.1. Nuclear Magnetic Resonance Spectroscopy1H NMR and 13C NMR spectra were obtained on a Varian Unity 400 NMR
spectrometer. For 1H NMR, 5 mm diameter tubes containing approximately 20 mg
samples dissolved in DMSO-d6 were analyzed under ambient conditions. The
experimental parameters included a 1.0 second relaxation delay, 23.6 degree pulse, and
6744.9 Hz spectral width. Thirty-two repetitions were performed for each sample. For13C NMR, samples of approximately 0.6 g were dissolved in ~ 2 ml acetone or DMSO.
The samples were placed in 10 mm diameter tubes for analysis under ambient conditions.
An inverse gated decoupling technique with a 90 degree pulse, a 6 second relaxation
delay, a frequency of 100.578 MHz, and 1.2 seconds acquisition time were used to obtain
quantitative 13C NMR data. Approximately 1000 repetitions were used for each sample.
3.2.2. Gel Permeation ChromatographyGPC was conducted on a Waters GPC/ALC 150-C chromatograph equipped with
a differential refractometer detector connected in parallel to a differential viscometer

81
detector Viscotek model 150R. The injection and column compartment, connecting line,
and DV detector were individually controlled and maintained at the same temperature
(60°C). The signals from the RI and DV detectors permitted the calculation of intrinsic
viscosity for universal calibration purposes by using Viscotek software Unical 4.04
assuming that the polymer concentration at the outlet of the SEC columns approached
infinite dilution due to separation and column dispersion. The mobile phase was NMP
(dried over phosphorus pentoxide, then vacuum distilled) with a flow rate of one ml/min.
The columns were Styragel HT with pore sizes of 103 and 104 angstroms. The injection
volume was 100 µl.
3.2.3. Viscosity DeterminationsComplex viscosities were obtained from a Bohlin VOR Rheometer operating in
continuous oscillation mode at a frequency of 1 Hz. Temperature control was
accomplished with a Bohlin HTC. The auto-strain was set to maintain the torque at 25%
of the maximum torque allowed. The maximum strain for the instrument was 0.25.
Approximately 0.7g of cresol novolac pellets were placed between the preheated 25 mm
diameter parallel plates of the rheometer. The gap was closed to approximately 1mm and
the sides were scraped to remove excess sample before the run was started.
The glass transition temperatures of neat resins were obtained with a Perkin-
Elmer DSC-7 instrument. The DSC was calibrated with indium and zinc standards, and
ice water was used as the coolant. Samples in aluminum pans were heated from 20°C to
180°C. The glass transition temperatures were calculated as the midpoints of the curves.
3.3. Results and Discussion
3.3.1. IntroductionA series of linear, controlled molecular weight, 2,6-dimethylphenol endcapped
cresol novolac resins have been synthesized via electrophilic aromatic substitution
(Figure 3. 2). The use of ortho- or para-cresol as a monomer allows for preparing linear
oligomers since the cresol ring has only two activated positions for formaldehyde

82
substitution. By contrast, phenol has three reactive sites (i.e. both ortho and the para
positions) and therefore, branching is inevitable as higher molecular weight develops.
For example, branching has been shown to occur significantly once the molecular weight
reached 900-1000 g/mol.118 Addition of calculated amounts of 2,6-dimethylphenol
endgroups to the linear ortho- or para-cresol-formaldehyde reactions allows for
controlled molecular weight materials to be generated.
HO
H3C
H3C
OH
CH3
CH3
OH
CH3
CH2CH2
+
OHCH3CH3
OH
CH3
H O CH2 O Hn+
m
2.5 wt % oxalic acid dihydrate
100oC
Figure 3. 2. Synthesis of 2,6-dimethylphenol endcapped para-cresol novolac resins
The reactivity rates for phenol versus cresol formaldehyde substitutions are
different. Phenol reacts with formaldehyde approximately three times faster than ortho-
or para-cresol.134 Water reduces the rate of reaction between phenol and formaldehyde if
used in large amounts.121 In this work, cresol novolacs were prepared with
paraformaldehyde, as opposed to aqueous formaldehyde, to achieve faster reaction rates.
Paraformaldehyde contains only 1-9 wt. % water whereas the formaldehyde typically
used in phenolic syntheses contains approximately 50 to 63 wt. % water.
Oxalic acid dihydrate was used as the catalyst since it is a relatively strong acid.
Oxalic acid dihydrate is preferred over other catalysts because resins with less color can
134 M. M. Sprung, “Reactivity of Phenol Toward Formaldehyde,” Journal of Applied
Polymer Science 63(2), 334-343 (1941).
83
be obtained. Moreover, there is no need to remove the catalyst after the reaction since it
can be thermally decomposed to CO, CO2, and water above approximately 180°C.118
In these reactions, the initial viscosities were low and the solutions were miscible.
However, as the reactions proceeded and molecular weights increased, the solutions
phase separated. The low molecular weight oligomers formed a water-insoluble melt,
while the acid catalyst and the formaldehyde probably remained predominantly in the
aqueous phase. Slow reaction rates were observed which are probably attributable to the
2-phase nature. The formaldehyde added toward the end of the reactions was in an
aqueous solution. Water was desirable in this stage to plasticize the reaction mixtures
and lower the viscosities. This was particularly important in the syntheses of higher
molecular weight cresol novolacs when the viscosities were high.
3.3.2. Molecular Weight Control and CalculationsTypical phenolic novolac syntheses lack molecular weight control. The reactions
are generally terminated after a certain reaction time or once a specified viscosity is
reached.135 The molecular weights of the cresol novolac resins described herein were
strategically controlled by the stoichiometric ratio of cresol to 2,6-dimethylphenol (Table
3. 1). The molecular weights of oligomers increased as the amount of endcapping
reagent was decreased.
The number average molecular weights in these cresol novolac syntheses was
controlled by the cresol to endgroup molar ratio. However, in contrast to usual practice,
it was necessary to add formaldehyde in excess to achieve full conversions of phenolic
reactive ring positions. When the calculated amounts of formaldehyde were used, the
molecular weights of products were always lower than the targeted molecular weights,
and it was evident from 13C NMR spectra that unreacted ring positions on cresols
remained under such conditions. Formaldehyde was added in two portions to couple all
of the reactive sites on cresol. Initially, the stoichiometrically calculated amount of
formaldehyde was charged to the reactions with cresol and 2,6-dimethylphenol at 100ºC.
135 S. R Sandler and W. Karo, Polymer Synthesis, 2nd edition, Academic Press, Boston,
Vol. 2, 1992, p49-86.

84
The early stages of reactions were exothermic and the reactions refluxed. After 6 hours,
more formaldehyde (10 mol % of the calculated amount in the form of formalin) was
added to ensure that sufficient formaldehyde was available to complete the reactions.
Targeted molecular weights were consistently achieved using the approach of
adding excess formaldehyde as described above. This suggests a reversible reaction
between cresol or its derivatives and formaldehyde whereby substitution and elimination
of formaldehyde occurs. This would allow for coupling regenerated ring positions and
methylols to form methylene linkages and achieve the targeted molecular weights. It is
also possible that some gaseous formaldehyde, formed by depolymerization of
polyoxymethylene, escaped from the reactions during the initial exothermic stages.
The required stoichiometries for controlling molecular weights were calculated
using the Carother’s approach. A step-growth polymerization was considered involving
the reaction of monomers AWA, BYB, and AZ in which the functional groups A react
with functional groups B. It was assumed that very high conversion was achieved and
that stoichiometric amounts of A and B groups were in the reaction feed. This latter
assumption can be expressed as
N(BB) = N(AA) + N(A)/2 (3. 1)
where N(BB) = moles of BYB
N(AA) = moles of AWA
N(A) = moles of AZ
The reaction of N(AA) with N(BB) yields a statistically determined size
distribution of N(A)/2 moles of product molecules (oligomeric and polymeric) plus by-
product molecules which can be represented schematically as follows:
N(AA) + N(BB) + N(A) ∑ [ZA-BYB-(AWA-BYB-)x – AZ] + by-products (3. 2)
85
A “combined endgroup” is defined as ZA-BYB- plus –AZ and an “internal repeat
unit” is defined as –AWA-BYB-. Each mole of a given product molecule therefore has
one mole of combined endgroup and x moles of internal repeat units.
The number average molecular weight of the reaction product is then:
moleculesproduct of moles
moleculesproduct of mass total Mn =
N(A)/2)m x (m
M uen
∑ ⋅+= (3. 3)
where me is the molar mass of the combined endgroup and mu is the molar mass
of an internal unit. The summation is over all N(A)/2 moles of product molecules and all
x values. This leads to
unen mX m M ⋅+= (3. 4)
where Xn is the number average number of internal units in the product
molecules.
By inspection of the schematic molecular structure (3.2) and equation
(3.4), one sees that
N(A)N(AA) 2
N(A)/2N(AA) xn == (3. 5)
Arbitrarily choosing the number of moles of AWA, then substituting equation
(3.5) into equation (3.4) and rearranging, one now has a complete description of the feed
composition required to achieve a target Mn:
moles of monomer AWA: N(AA)
moles of endcapper AZ: N(AA)m - M
m 2 N(A)
en
u ⋅
=
moles of monomer BYB: N(BB) = N(AA) + N(A)/2 (3. 6)
In the present work AWA is cresol, AZ is 2,6-dimethylphenol, and BYB is
formaldehyde.
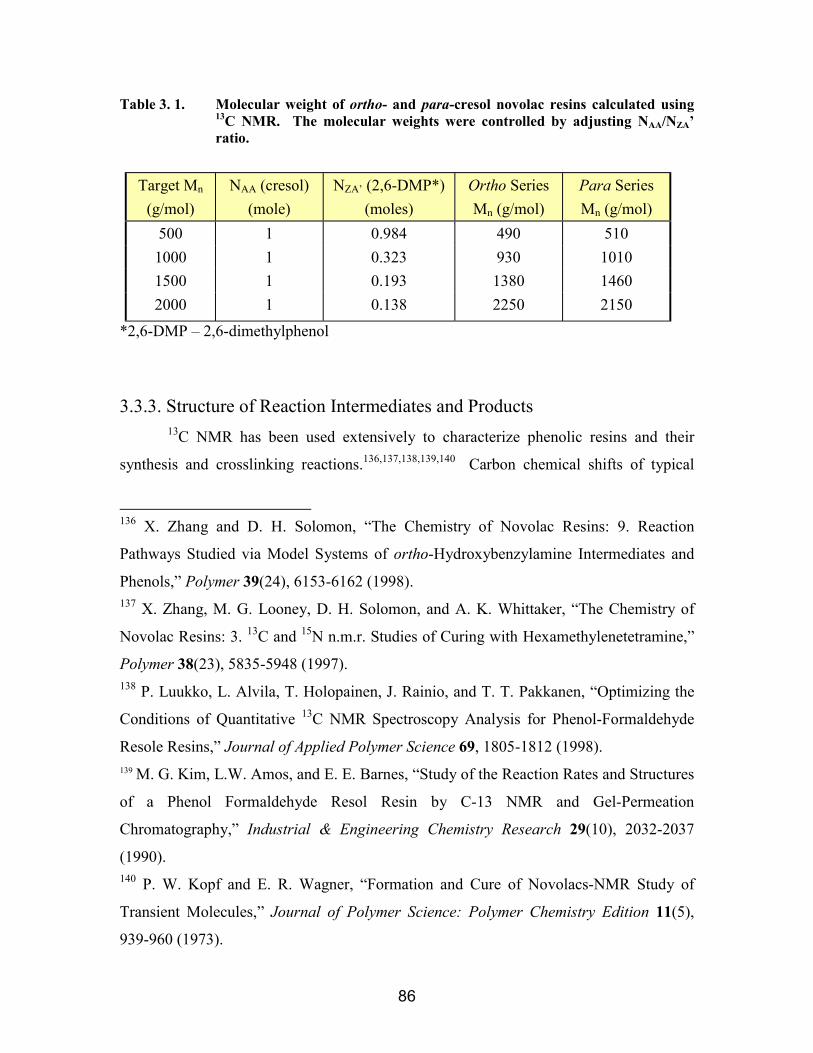
86
Table 3. 1. Molecular weight of ortho- and para-cresol novolac resins calculated using13C NMR. The molecular weights were controlled by adjusting NAA/NZA’ratio.
Target Mn
(g/mol)NAA (cresol)
(mole)NZA’ (2,6-DMP*)
(moles)Ortho SeriesMn (g/mol)
Para SeriesMn (g/mol)
500 1 0.984 490 5101000 1 0.323 930 10101500 1 0.193 1380 14602000 1 0.138 2250 2150
*2,6-DMP – 2,6-dimethylphenol
3.3.3. Structure of Reaction Intermediates and Products13C NMR has been used extensively to characterize phenolic resins and their
synthesis and crosslinking reactions.136,137,138,139,140 Carbon chemical shifts of typical
136 X. Zhang and D. H. Solomon, “The Chemistry of Novolac Resins: 9. Reaction
Pathways Studied via Model Systems of ortho-Hydroxybenzylamine Intermediates and
Phenols,” Polymer 39(24), 6153-6162 (1998).137 X. Zhang, M. G. Looney, D. H. Solomon, and A. K. Whittaker, “The Chemistry of
Novolac Resins: 3. 13C and 15N n.m.r. Studies of Curing with Hexamethylenetetramine,”
Polymer 38(23), 5835-5948 (1997).138 P. Luukko, L. Alvila, T. Holopainen, J. Rainio, and T. T. Pakkanen, “Optimizing the
Conditions of Quantitative 13C NMR Spectroscopy Analysis for Phenol-Formaldehyde
Resole Resins,” Journal of Applied Polymer Science 69, 1805-1812 (1998).139 M. G. Kim, L.W. Amos, and E. E. Barnes, “Study of the Reaction Rates and Structures
of a Phenol Formaldehyde Resol Resin by C-13 NMR and Gel-Permeation
Chromatography,” Industrial & Engineering Chemistry Research 29(10), 2032-2037
(1990).140 P. W. Kopf and E. R. Wagner, “Formation and Cure of Novolacs-NMR Study of
Transient Molecules,” Journal of Polymer Science: Polymer Chemistry Edition 11(5),
939-960 (1973).

87
phenolic resins and some related reaction intermediates are provided in Table 3. 2.
Quantitative 13C NMR was used in this study to monitor reaction progress and to
determine the molecular weights of the final products. Acetone was the preferred solvent
for the ortho-cresol novolacs since its carbon peak did not overlap with the sample peaks
but para-cresol novolacs were not soluble in acetone. DMSO, which was used to analyze
the para-cresol novolacs, resonates at 40 ppm and overlapped with the para-para
methylene linkages. There were no significant differences in the chemical shifts in these
two solvents.
Table 3. 2. 13C NMR assignments for novolac resins and related reactionintermediates137
Chemical Shift Region (ppm)
Assignment
150-156 Hydroxyl-substituted phenolic carbons127-135 Other phenolic carbons
121 Para-unsubstituted phenolic carbons116 Ortho-unsubstituted phenolic carbons85.9 HO-CH2-O-CH2-OH81.4 HO-CH2-OH71.1 Para-linked dimethylene ether68.2 Ortho- linked dimethylene ether40.8 Para-para methylene linkages35.5 Ortho-para methylene linkages31.5 Ortho-ortho methylene linkages
13C NMR spectra provided an excellent means for structural characterization of
the cresol novolac oligomers (Figure 3. 3). The chemical shifts for cresol novolac resins
matched well with those observed for phenolic novolacs. The peaks between 150-156
ppm represent hydroxyl substituted aromatic carbons. Ortho-unsubstituted aromatic
carbons resonate at 118 ppm, and para-unsubstituted aromatic carbons are observed at
120 ppm. The rest of the aromatic carbon peaks resonate between 121 and 136 ppm. 13C
NMR spectra can define three distinct types of methylene linkages between aromatic
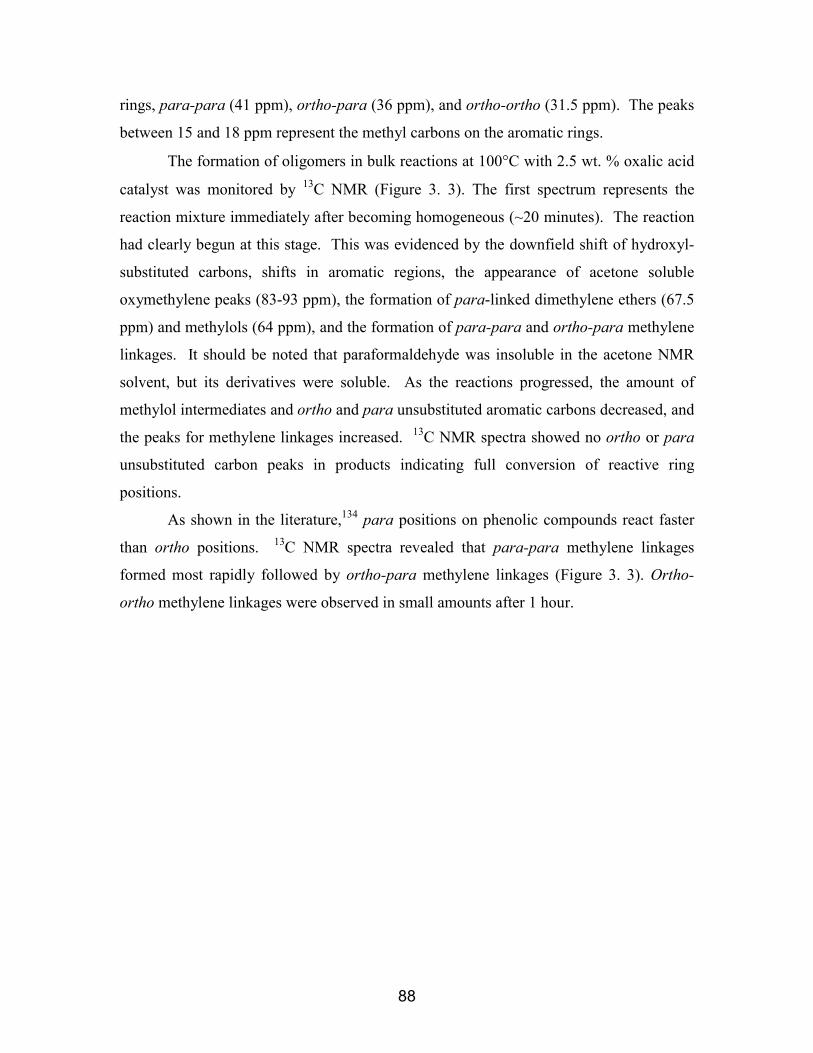
88
rings, para-para (41 ppm), ortho-para (36 ppm), and ortho-ortho (31.5 ppm). The peaks
between 15 and 18 ppm represent the methyl carbons on the aromatic rings.
The formation of oligomers in bulk reactions at 100°C with 2.5 wt. % oxalic acid
catalyst was monitored by 13C NMR (Figure 3. 3). The first spectrum represents the
reaction mixture immediately after becoming homogeneous (~20 minutes). The reaction
had clearly begun at this stage. This was evidenced by the downfield shift of hydroxyl-
substituted carbons, shifts in aromatic regions, the appearance of acetone soluble
oxymethylene peaks (83-93 ppm), the formation of para-linked dimethylene ethers (67.5
ppm) and methylols (64 ppm), and the formation of para-para and ortho-para methylene
linkages. It should be noted that paraformaldehyde was insoluble in the acetone NMR
solvent, but its derivatives were soluble. As the reactions progressed, the amount of
methylol intermediates and ortho and para unsubstituted aromatic carbons decreased, and
the peaks for methylene linkages increased. 13C NMR spectra showed no ortho or para
unsubstituted carbon peaks in products indicating full conversion of reactive ring
positions.
As shown in the literature,134 para positions on phenolic compounds react faster
than ortho positions. 13C NMR spectra revealed that para-para methylene linkages
formed most rapidly followed by ortho-para methylene linkages (Figure 3. 3). Ortho-
ortho methylene linkages were observed in small amounts after 1 hour.
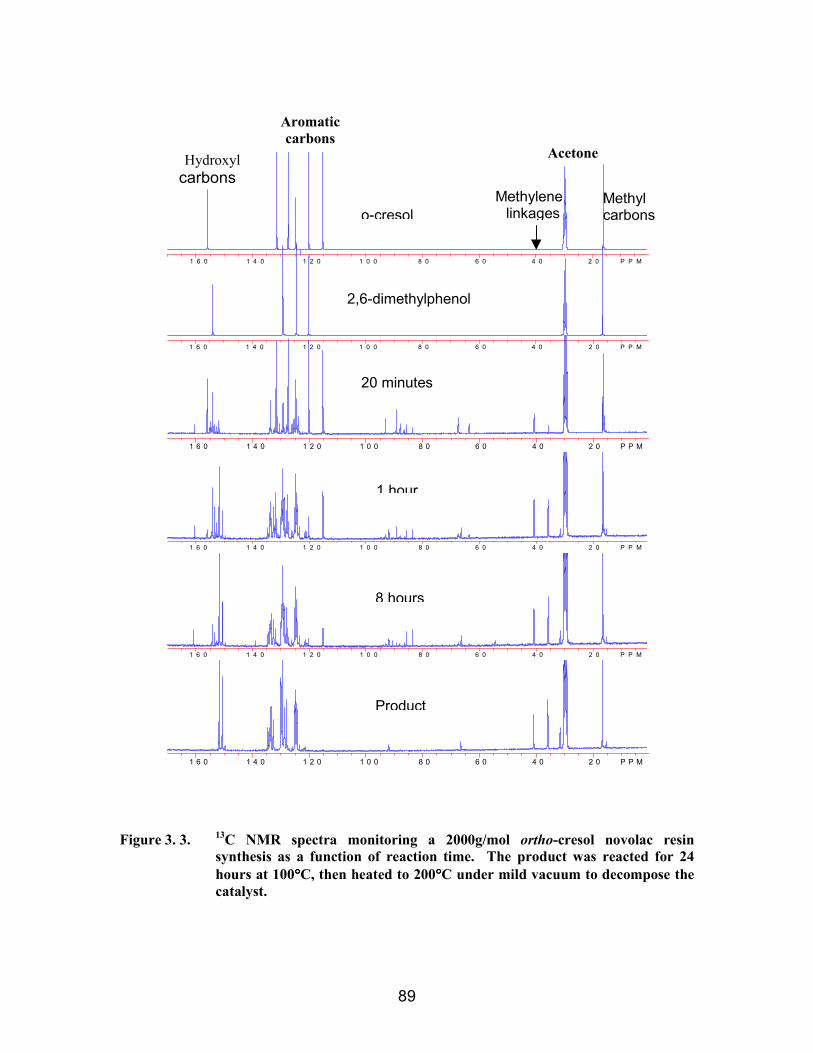
89
Figure 3. 3. 13C NMR spectra monitoring a 2000g/mol ortho-cresol novolac resinsynthesis as a function of reaction time. The product was reacted for 24hours at 100°°°°C, then heated to 200°°°°C under mild vacuum to decompose thecatalyst.
Methylcarbons
Methylenelinkageso-cresol
2,6-dimethylphenol
20 minutes
1 hour
8 hours
Product
Aromaticcarbons
Hydroxylcarbons
Acetone
1 6 0 1 4 0 1 2 0 1 0 0 8 0 6 0 4 0 2 0 P P M
1 6 0 1 4 0 1 2 0 1 0 0 8 0 6 0 4 0 2 0 P P M
1 6 0 1 4 0 1 2 0 1 0 0 8 0 6 0 4 0 2 0 P P M
1 6 0 1 4 0 1 2 0 1 0 0 8 0 6 0 4 0 2 0 P P M
1 6 0 1 4 0 1 2 0 1 0 0 8 0 6 0 4 0 2 0 P P M
1 6 0 1 4 0 1 2 0 1 0 0 8 0 6 0 4 0 2 0 P P M
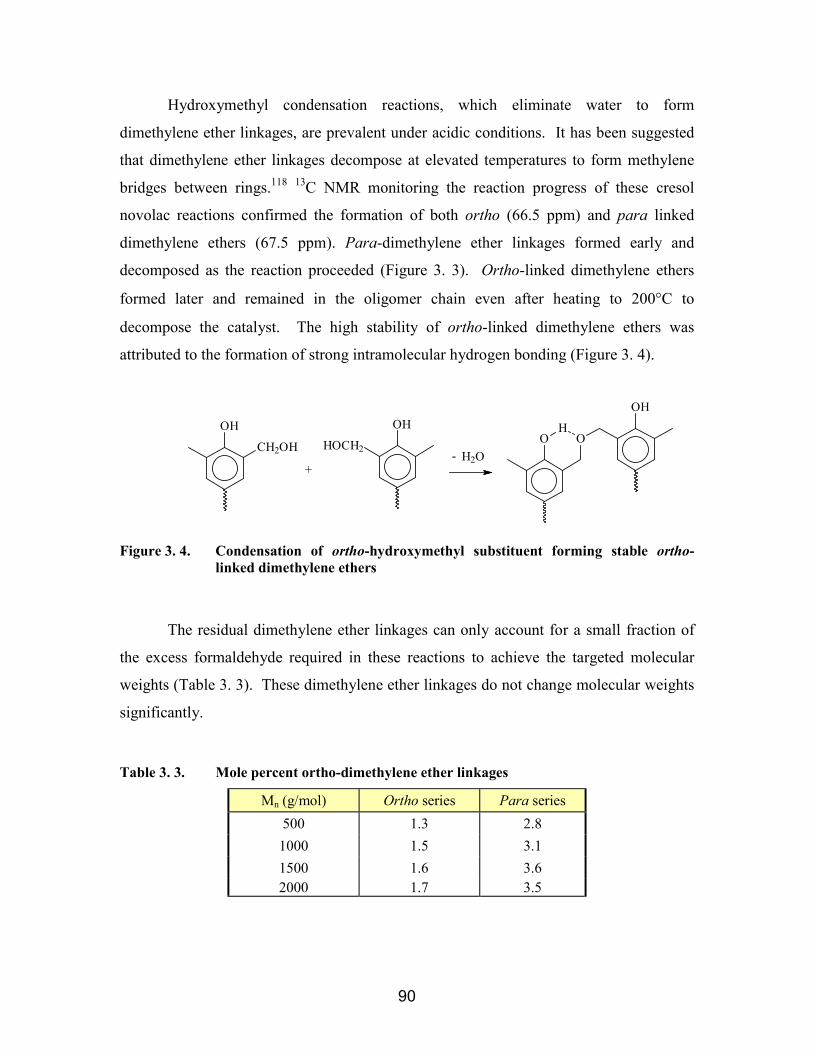
90
Hydroxymethyl condensation reactions, which eliminate water to form
dimethylene ether linkages, are prevalent under acidic conditions. It has been suggested
that dimethylene ether linkages decompose at elevated temperatures to form methylene
bridges between rings.118 13C NMR monitoring the reaction progress of these cresol
novolac reactions confirmed the formation of both ortho (66.5 ppm) and para linked
dimethylene ethers (67.5 ppm). Para-dimethylene ether linkages formed early and
decomposed as the reaction proceeded (Figure 3. 3). Ortho-linked dimethylene ethers
formed later and remained in the oligomer chain even after heating to 200°C to
decompose the catalyst. The high stability of ortho-linked dimethylene ethers was
attributed to the formation of strong intramolecular hydrogen bonding (Figure 3. 4).
OH
CH2OH
OH
HOCH2O O
H
OH
H2O-+
Figure 3. 4. Condensation of ortho-hydroxymethyl substituent forming stable ortho-linked dimethylene ethers
The residual dimethylene ether linkages can only account for a small fraction of
the excess formaldehyde required in these reactions to achieve the targeted molecular
weights (Table 3. 3). These dimethylene ether linkages do not change molecular weights
significantly.
Table 3. 3. Mole percent ortho-dimethylene ether linkages
Mn (g/mol) Ortho series Para series500 1.3 2.8
1000 1.5 3.11500 1.6 3.62000 1.7 3.5
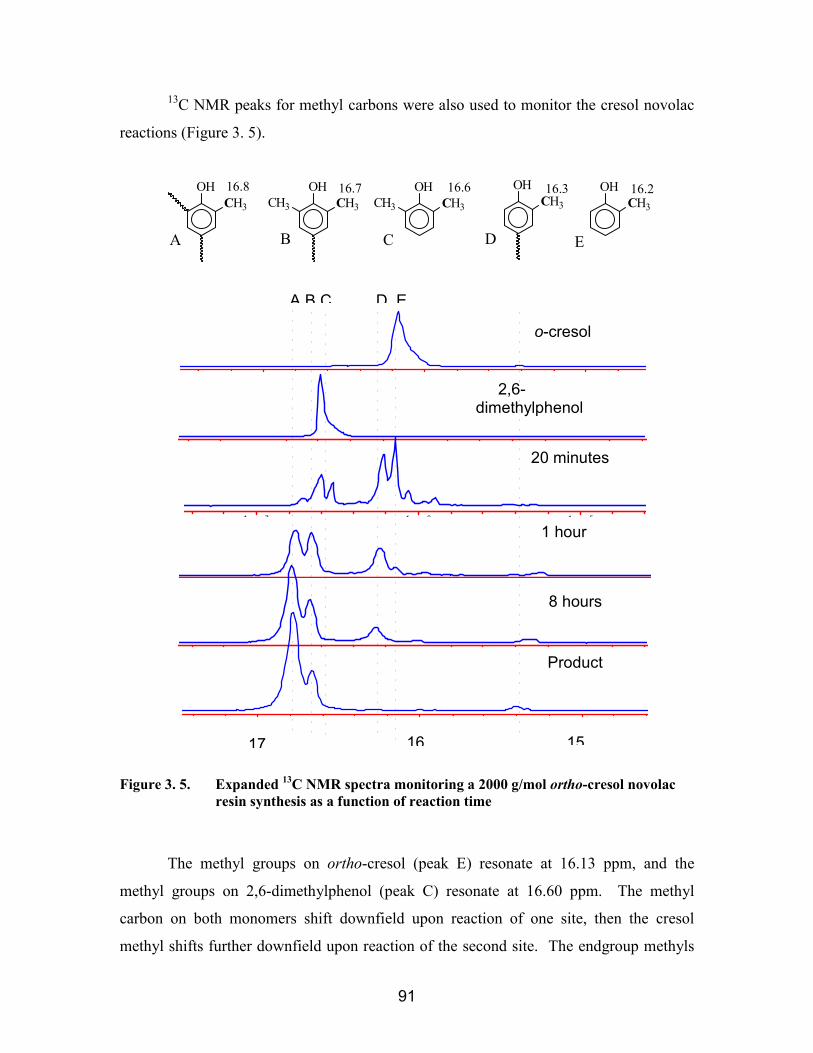
91
13C NMR peaks for methyl carbons were also used to monitor the cresol novolac
reactions (Figure 3. 5).
16.216.6 16.316.716.8 OHCH3CH3
OHCH3
OHCH3
OHCH3CH3
OHCH3
A B C D E
Figure 3. 5. Expanded 13C NMR spectra monitoring a 2000 g/mol ortho-cresol novolacresin synthesis as a function of reaction time
The methyl groups on ortho-cresol (peak E) resonate at 16.13 ppm, and the
methyl groups on 2,6-dimethylphenol (peak C) resonate at 16.60 ppm. The methyl
carbon on both monomers shift downfield upon reaction of one site, then the cresol
methyl shifts further downfield upon reaction of the second site. The endgroup methyls
1 7 1 6 1 5
A B C D E
o-cresol
2,6-dimethylphenol
20 minutes
1 hour
8 hours
Product
17 16 15
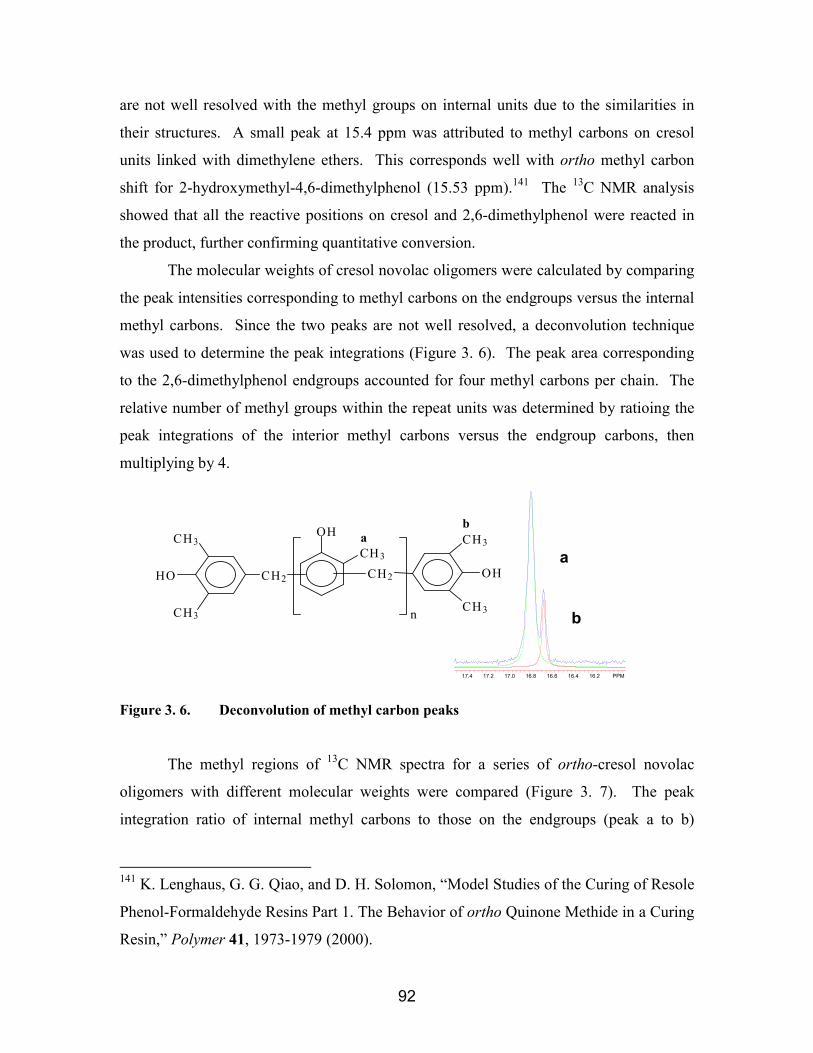
92
are not well resolved with the methyl groups on internal units due to the similarities in
their structures. A small peak at 15.4 ppm was attributed to methyl carbons on cresol
units linked with dimethylene ethers. This corresponds well with ortho methyl carbon
shift for 2-hydroxymethyl-4,6-dimethylphenol (15.53 ppm).141 The 13C NMR analysis
showed that all the reactive positions on cresol and 2,6-dimethylphenol were reacted in
the product, further confirming quantitative conversion.
The molecular weights of cresol novolac oligomers were calculated by comparing
the peak intensities corresponding to methyl carbons on the endgroups versus the internal
methyl carbons. Since the two peaks are not well resolved, a deconvolution technique
was used to determine the peak integrations (Figure 3. 6). The peak area corresponding
to the 2,6-dimethylphenol endgroups accounted for four methyl carbons per chain. The
relative number of methyl groups within the repeat units was determined by ratioing the
peak integrations of the interior methyl carbons versus the endgroup carbons, then
multiplying by 4.
Figure 3. 6. Deconvolution of methyl carbon peaks
The methyl regions of 13C NMR spectra for a series of ortho-cresol novolac
oligomers with different molecular weights were compared (Figure 3. 7). The peak
integration ratio of internal methyl carbons to those on the endgroups (peak a to b)
141 K. Lenghaus, G. G. Qiao, and D. H. Solomon, “Model Studies of the Curing of Resole
Phenol-Formaldehyde Resins Part 1. The Behavior of ortho Quinone Methide in a Curing
Resin,” Polymer 41, 1973-1979 (2000).
a
b
CH3
HO
CH3
CH2
OH
CH3
CH2
CH3
OH
CH3n
ab
17.4 17.2 17.0 16.8 16.6 16.4 16.2 PPM

93
increased as the molecular weight increased. This was expected since more repeat units,
relative to endgroups, were incorporated as higher molecular weights developed.
Figure 3. 7. Expanded 13C NMR spectra of a series of ortho-cresol novolac resins withvarious molecular weights: a) methyl carbons within the repeat units, b)methyl carbons on the endgroups
The type of methylene linkages (ortho-ortho, ortho-para, and para-para) and the
amount in which they form can be calculated using 13C NMR. Since the endgroups
formed only para methylene linkages, the number of para linked species was higher for
low molecular weight oligomers (Table 3. 4). As the molecular weight was increased,
the para-para, ortho-para, and ortho-ortho linked methylenes approached the expected
1:2:1 statistical distribution.
Table 3. 4. Percentage isomers formed in ortho-cresol novolac resins
Mn (g/mol) p-p (%) o-p (%) o-o (%)500 45.2 47.8 7.01000 31.2 49.7 19.11500 30.0 49.8 20.12000 29.2 49.3 21.5
a
b
500 g/mol
5 1 7 .0 1 6 .5 1 6 .0
a
b
2000 g/mol
17.0 16.5 16.0
ba
1500 g/mol
5 1 7 .0 1 6 .5 1 6 .1 7 .0 1 6 .5 1 6 .0
a
b
1000 g/mol

94
Para-cresol novolacs syntheses, monitored by 13C NMR, showed similar reaction
progress as the ortho-cresol novolac reactions (Figure 3. 8). Formations of para-cresol
novolacs were accompanied by the downfield shift of hydroxyl substituted aromatic
carbon peaks, increases in both the ortho-ortho (36.5 ppm) and the ortho-para (40.5
ppm) methylene carbon peaks, and upfield shifts of methyl carbon peaks. The DMSO
solvent peak overlapped with the para-para methylene carbon peak. However, this was
not as important for monitoring the syntheses of para-cresol novolac resins since para-
para methylene linkages only formed when two 2,6-dimethylphenol units dimerized and
this was assumed to form in small amounts (especially at low 2,6-dimethylphenol
concentrations).
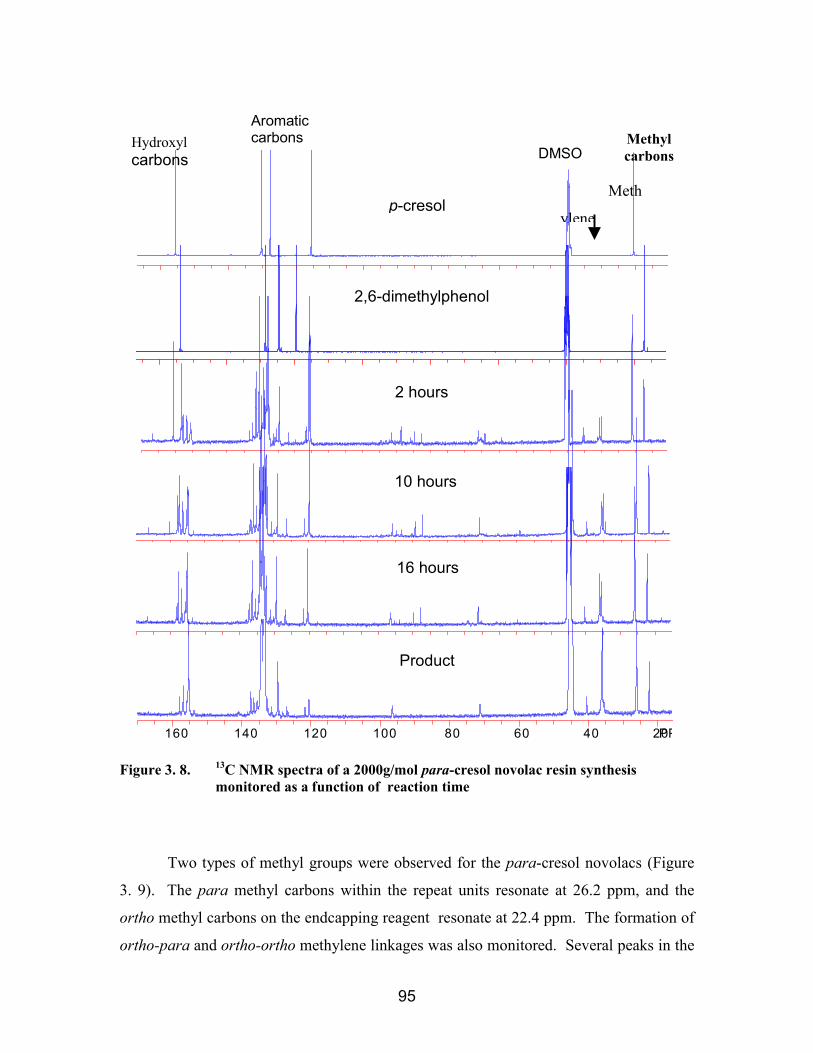
95
Figure 3. 8. 13C NMR spectra of a 2000g/mol para-cresol novolac resin synthesismonitored as a function of reaction time
Two types of methyl groups were observed for the para-cresol novolacs (Figure
3. 9). The para methyl carbons within the repeat units resonate at 26.2 ppm, and the
ortho methyl carbons on the endcapping reagent resonate at 22.4 ppm. The formation of
ortho-para and ortho-ortho methylene linkages was also monitored. Several peaks in the
p-cresol
2,6-dimethylphenol
2 hours
10 hours
16 hours
Product
Hydroxylcarbons
Aromaticcarbons
DMSO
Meth
ylene
Methylcarbons
160 140 120 100 80 60 40 20PP

96
ortho-ortho methylene region were observed early in the reaction which were attributed
to reaction intermediates. At the end of the reaction, only one sharp peak was present in
this region.
fe
d
c
b
a
2.5 wt % oxalic acid dihydrate
100oCm
+n
H O CH2 O HOH
CH3
OHCH3CH3
+OH
CH3
CH2CH2HO
H3C
H3C
OH
CH3
CH3
Figure 3. 9. Expanded 13C NMR spectra monitoring the synthesis of a 2000g/mol para-cresol novolac resin
b
a
c
4 0 3 5 3 0 2 5 2 0
p-cresol
2,6-dimethylphenol
2
10 hours
16 hours
produc
ef d

97
1H NMR was used to analyze the monomers and the novolac oligomers to
confirm their expected structures (Figure 3. 10 and Figure 3. 11). Six distinct sets of
peaks were in the ortho-cresol spectrum (Figure 3. 10a). The 1H NMR spectrum of a
2000 g/mol ortho-cresol novolac resin (Figure 3. 10b) had broader peaks than the
monomer due to the different isomer sequences present. The methyl protons resonated
between 1.9 and 2.2 ppm and three sets of peaks between 3.5 and 3.9 ppm were from
protons on the methylene linkages. These corresponded to ortho-ortho (3.5ppm), ortho-
para (3.6ppm), and para-para (3.7ppm) methylene units. Small amounts of dimethylene
ether also formed which resonated at 4.8 ppm.
Similar peaks were observed for para-cresol novolacs (Figure 3. 11). Fours sets
of peaks were observed for the para-cresol monomer. The main difference between the
chain structures of ortho-cresol versus para-cresol novolac resins was the type of
methylene linkages. Only ortho-ortho linkages are possible between the repeat units for
para-cresol novolac resins. Therefore, protons on the methylene linkages resonated
closer together and were well resolved from any residual water. The hydroxyl proton
peaks were also sharper for the para-cresol novolacs.

98
g
ef
n
CH2
CH3
OH
CH3
OH
CH3
CH3
HO
CH3
CH2
h
Figure 3. 10. 1H NMR spectra of a) ortho-cresol, and b) a 2000 g/mol ortho-cresol novolac
DMSOwater
ab
c OHCH3
a
b
c
9 8 7 6 5 4 3 2 1
DMSO
ab
cd
9 8 7 6 5 4 3 2 PPM

99
g
e
f
n
CH2
CH3
OH
CH3
OH
CH3
CH3
HO
CH3
CH2
h
Figure 3. 11. 1H NMR spectra of a) para-cresol, and b) a 2000 g/mol para-cresol novolac
b
c
DMSO
8 6 4 2
wate
OH
CH3 a
b
c
d ad
10 9 8 7 6 5 4 3 2 PPM
h
gf
e
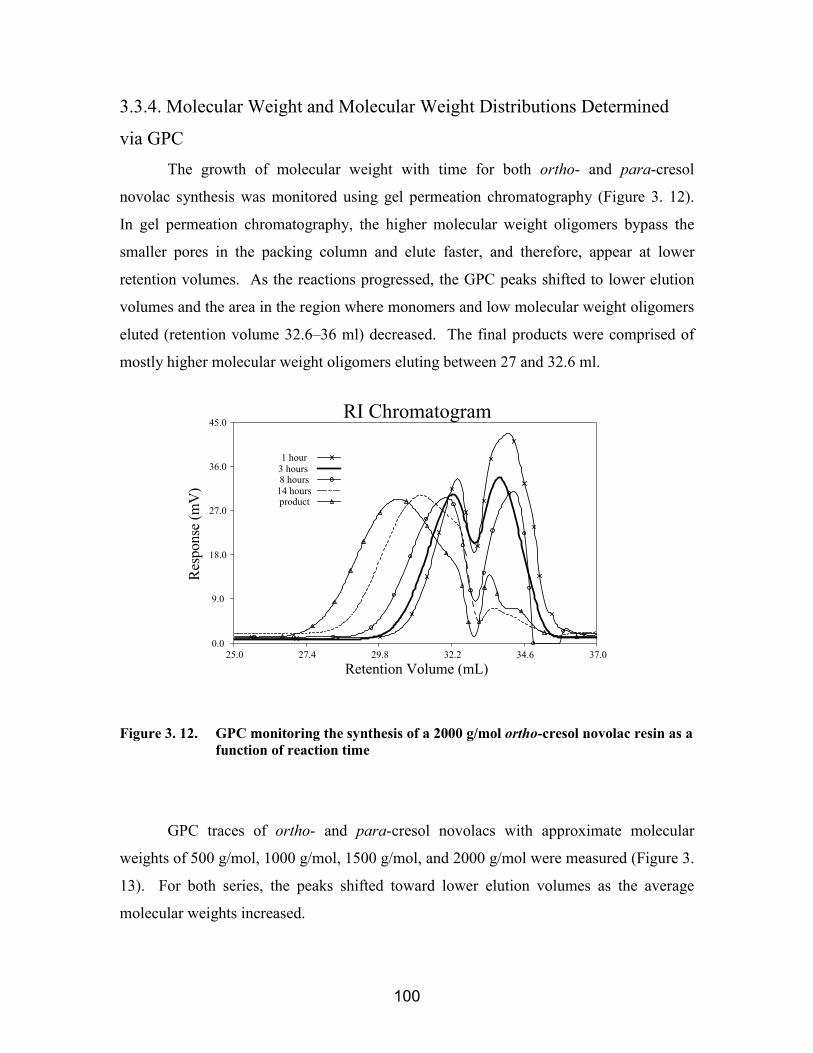
100
3.3.4. Molecular Weight and Molecular Weight Distributions Determined
via GPCThe growth of molecular weight with time for both ortho- and para-cresol
novolac synthesis was monitored using gel permeation chromatography (Figure 3. 12).
In gel permeation chromatography, the higher molecular weight oligomers bypass the
smaller pores in the packing column and elute faster, and therefore, appear at lower
retention volumes. As the reactions progressed, the GPC peaks shifted to lower elution
volumes and the area in the region where monomers and low molecular weight oligomers
eluted (retention volume 32.6–36 ml) decreased. The final products were comprised of
mostly higher molecular weight oligomers eluting between 27 and 32.6 ml.
Figure 3. 12. GPC monitoring the synthesis of a 2000 g/mol ortho-cresol novolac resin as afunction of reaction time
GPC traces of ortho- and para-cresol novolacs with approximate molecular
weights of 500 g/mol, 1000 g/mol, 1500 g/mol, and 2000 g/mol were measured (Figure 3.
13). For both series, the peaks shifted toward lower elution volumes as the average
molecular weights increased.
RI Chromatogram
1 hour3 hours 8 hours
14 hoursproduct
25.0 27.4 29.8 32.2 34.6 37.0 0.0
9.0
18.0
27.0
36.0
45.0
Retention Volume (mL)
Resp
onse
(mV
)

101
Figure 3. 13. GPC of cresol novolac resins with various molecular weights: a)ortho-cresolnovolac, b)para-cresol novolac
GPC was used to qualitatively compare the molecular weights. Absolute
molecular weights could not be derived from GPC using the viscosity detector due to
their low molecular weights and correspondingly low solution viscosities. Thus, only the
polydispersities of these oligomers and their intrinsic viscosities were evaluated (Table 3.
5). Since cresol novolac resin syntheses are condensation polymerizations, the
polydispersity should approach 2 as the molecular weight increases. Low molecular
RI Chromatogram
500 g/mol1000 g/mol1500 g/mol2000 g/mol
25.0 27.4 29.8 32.2 34.6 37.0 0.0
9.0
18.0
27.0
36.0
45.0
Retention Volume (mL)
Resp
onse
(mV
)A
g
500 g/mol1000 g/mol1500 g/mol2000 g/mol
25.0 27.4 29.8 32.2 34.6 37.0 0.0
11.0
22.0
33.0
44.0
55.0
Retention Volume (mL)
Resp
onse
(mV
)
B
102
weight oligomers (500-1000 g/mol) had low polydispersities, but the polydispersity
increased as the molecular weight was increased.
As expected, the intrinsic viscosities increased as the molecular weight increased.
However, when comparing ortho-cresol novolacs to para-cresol novolacs with similar
number average molecular weights, ortho-cresol novolacs consistently had higher
intrinsic viscosities (Table 3. 5). This suggested that ortho-cresol novolacs have higher
hydrodynamic volumes in the NMP chromatography solvent. It was previously reported
that different novolac isomers have different elution behaviors.142,143 The difference in
hydrodynamic volumes from isomer structures of ortho-ortho, ortho-para, and para-para
was due to varying degrees of solvation. Oligomers with high compositions of ortho-
ortho linkages (i.e. para-cresol novolac resins) may have a higher degree of
intramolecular hydrogen bonding, resulting in less solvation and lower hydrodynamic
volumes. The propensity for hydrogen bonding may be disrupted for ortho-cresol
novolacs since three types of methylene linkages are available and were distributed
randomly.
142 T. R. Dargaville, F. N. Guerzoni, M. G. Looney, D. A. Shipp, D. H. Solomon, and X.
Zhang, “Determination of Molecular Weight Distribution of Novolac Resins by Gel
Permeation Chromatography,” Journal of Polymer Science. Part A: Polymer Chemistry
35(8), 1399-1407 (1997).143 T. Yoshikawa, K. Kimura and S. Fujimura, “The Gel Permeation Chromatography of
Phenolic Compound,” Journal of Applied Polymer Science 15, 2513-2520 (1971).
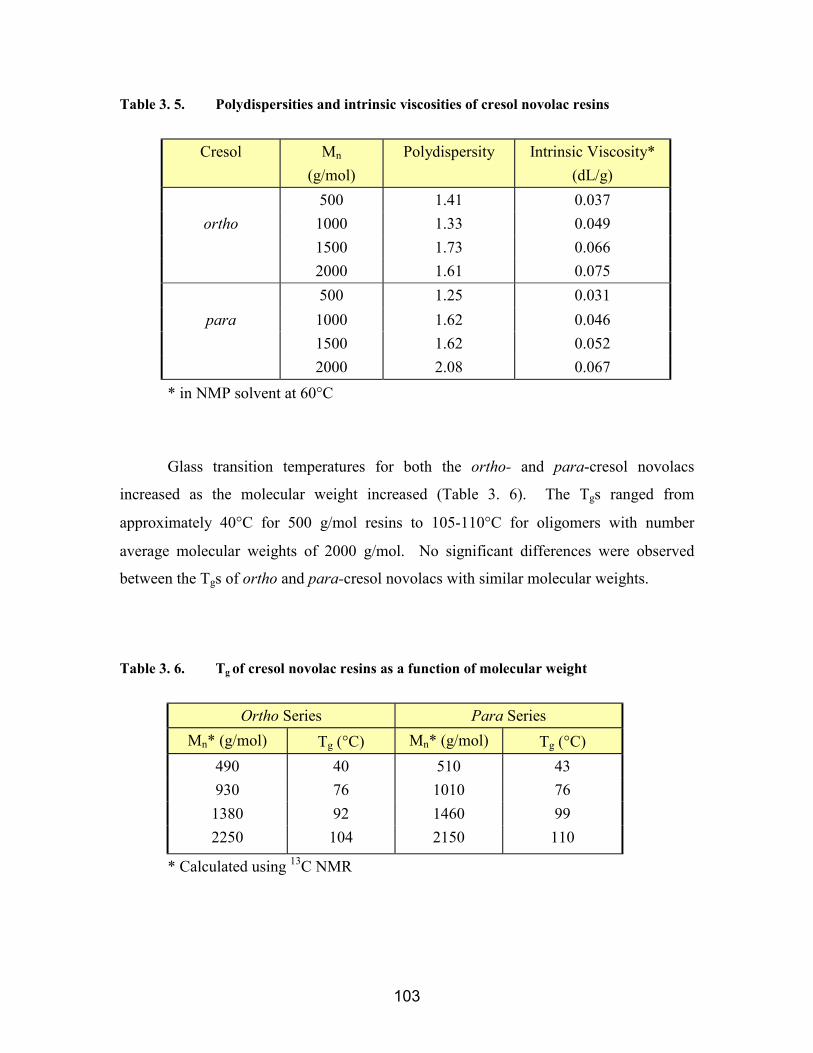
103
Table 3. 5. Polydispersities and intrinsic viscosities of cresol novolac resins
Cresol Mn
(g/mol)Polydispersity Intrinsic Viscosity*
(dL/g)500 1.41 0.037
ortho 1000 1.33 0.0491500 1.73 0.0662000 1.61 0.075500 1.25 0.031
para 1000 1.62 0.0461500 1.62 0.0522000 2.08 0.067
* in NMP solvent at 60°C
Glass transition temperatures for both the ortho- and para-cresol novolacs
increased as the molecular weight increased (Table 3. 6). The Tgs ranged from
approximately 40°C for 500 g/mol resins to 105-110°C for oligomers with number
average molecular weights of 2000 g/mol. No significant differences were observed
between the Tgs of ortho and para-cresol novolacs with similar molecular weights.
Table 3. 6. Tg of cresol novolac resins as a function of molecular weight
Ortho Series Para SeriesMn* (g/mol) Tg (°C) Mn* (g/mol) Tg (°C)
490 40 510 43930 76 1010 761380 92 1460 992250 104 2150 110
* Calculated using 13C NMR
104
3.3.5. Dynamic Viscosities of Cresol Novolac ResinsEfficient melt composite fabrication procedures require low viscosity resins to
wet out the fiber. The viscosity profiles of a typical phenolic novolac resin with a
molecular weight of ~700 g/mol (Mn) and a series of cresol novolacs were examined as a
function of temperature at a heating rate of 2.5°C/minute (Figure 3. 14). All samples
were vacuum stripped at 165°C for 2 hours prior to the measurements to remove residual
water. As molecular weights were increased, the temperatures required for the viscosity
to fall to 10 Pa*s increased for both series of cresol novolac materials. Ortho-cresol
novolacs (Figure 3. 14. a) had similar viscosities to the para-cresol novolacs (Figure 3.
14. b) with similar molecular weights at any given temperature. The viscosity of the
2000 g/mol para-cresol oligomer decreased with increased temperature until ~180°C,
then gradually increased upon further heating. The reason for this increase in viscosity at
high temperatures is presumed to be attributable to degradative crosslinking, but this is as
yet unclear. It is possible that the increase in viscosity is due to o’,o’-dimethylene ether
oxidation to o’,o’-dimethylene ether hydroperoxide followed by degradative crosslinking.
The viscosity of the phenolic control reached 10 Pa*s at ~165°C, a higher temperature
than that required by a 1500 g/mol cresol novolacs to reach the same viscosity. This
suggested that the cresol oligomers may be significantly more amenable to melt
processing relative to phenol derived oligomers due to a wider processing window. The
phenolic novolac control material behaved similarly to the 2000 g/mol para-cresol
novolac resin where the viscosity showed a minimum at ~180°C.

105
0
5
10
15
20
80 100 120 140 160 180 200
Temperature (oC)
Visc
osity
(Pa
s) 500g/mol1000 g/mol1500 g/mol2000 g/molcontrol
Figure 3. 14. Dynamic viscosity of cresol novolacs measured as a function of molecularweight a) ortho-cresol novolac resins, and b) para-cresol novolac resins
3.4. ConclusionsA series of controlled molecular weight, 2,6-dimethylphenol endcapped
cresol novolac resins have been synthesized. An excess of formaldehyde was required to
achieve the targeted molecular weights. The number average molecular weights,
determined from 13C NMR spectra, showed good agreement with the targeted number
0
5
10
15
20
25
80 100 120 140 160 180 200
Temperature (oC)
Visc
osity
(Pa
s) 500 g/mol1000 g/mol1500 g/mol2000 g/mol
A
B
106
average molecular weights for both ortho- and para-cresol novolacs. The amount of
ortho-ortho, ortho-para and para-para methylene linkages for the ortho-cresol novolac
resins, also determined from 13C NMR, approached the statistical distribution as the
molecular weights were increased and the contributions from endgroups were less
significant. The polydispersities obtained from GPC suggested that molecular weight
distributions were reasonably narrow (< 2). The glass transition temperatures increased
from ~40°C to 110°C as the molecular weights were increased from 500g/mol to
2000g/mol, but there were no significant differences between the ortho and para-cresol
novolacs with similar molecular weights.
In general, the viscosities of ortho- and para-cresol novolacs with similar
molecular weights were almost identical, but were significantly lower than phenol based
oligomers. These cresol novolac resins will be crosslinked with various epoxy resins to
form void-free flame retardant networks. Network properties such as toughness, flame
retardance, and water uptake, as well as processability will be investigated.
107
Chapter 4. Structure-Property Relationships of CresolNovolac/Epoxy Networks
4.1. IntroductionA 2000 g/mol linear ortho-cresol novolac resin was crosslinked with various
epoxies at defined compositions for use as tough and flame retardant matrix resins. The
cresol novolac/epoxy network mechanical and flame properties were compared to a
phenolic control, an epoxy control, and a phenolic novolac/epoxy network. Undoubtedly
the network properties depended on both the chemical and the network structures, thus
this research focused on determining the influences of network structures on properties.
The processability of cresol novolac/epoxy mixtures was also evaluated.
4.1.1. Crosslink density and its affects on network properties
Crosslink density (ν) or degree of crosslinking is a measure of the total links
between chains in a given mass of materials. It is frequently represented in terms of the
molecular weight between crosslinks (Mc) where higher crosslink densities correspond to
lower Mc values and vice versa.144 The portion of crosslinked networks that remains
soluble and has finite molecular weights is referred to as the sol fraction. The insoluble
crosslinked portion is termed the gel fraction.
Two general types of experimental methods widely used to determine the degree
of crosslinking are based on swelling and mechanical testing. However, the observed
molecular weight between crosslinks frequently deviates from the theoretically calculated
Mc value due to over-simplified assumptions relating swelling or mechanical properties
to crosslink densities. For example, trapped physical entanglements should improve the
mechanical properties and therefore lead to higher apparent crosslink densities. The
presence of dangling chain ends, on the other hand, does not contribute mechanically, and
therefore is expected to reduce the apparent crosslink densities. It is also argued that not
144 Encyclopedia of Polymer Science and Engineering, Vol 4. J. I. Kroschwitz, Ed. John
Wiley & Sons, New York, 1986.
108
all crosslink points are mechanically effective which may also introduce errors in the
calculations.
For a perfect network with no elastically inactive chains or dangling ends, the
swelling by a good solvent at equilibrium is given by
1/ν = ( ) 2
1
1/3
+ +/2=
φχφφφφρ
-1ln - V - M P1c (4. 1)
where V1 = molar volume of the solvent
ρP = density of the polymer
φ = volume fraction of the polymer in the swollen state
χ1 = polymer solvent (Flory-Huggins) interaction parameter
The elastically inactive chains in the networks may be accounted for by dividing the Mc
values by a correction factor, 1-2Mc/Mn, where Mn is the number average molecular
weight of the polymer before crosslinking. This procedure is most accurate for
calculating crosslink densities of typical vulcanized rubbers (Mc ~ 5000 g/mol).
Although the general trend of increasing Mc with increasing swelling still holds true for
more highly crosslinked networks, this method is no longer effective at these lower Mc
values.145
Crosslink densities can also be derived from mechanical testing such as stress-
strain or stress-relaxation experiments for polymers at temperatures well above their Tgs.
According to the theory of rubber elasticity, the shear modulus (G) of an ideal rubber is
given by
G = νRT = νRT/Mc (4. 2)
where ν = density,
R = gas constant,
T = absolute temperature (K)
145 L. E. Nielsen, “Crosslinking-Effects on Physical Properties of Polymers,” Journal of
Macromolecular Science-Reviews Macromolecular Chemistry C3(1), 69-103 (1969).
109
The correction factor described previously is sometimes incorporated equation (4.2) to
account for dangling polymer chain ends
G = νRT/Mc (1-2Mc/Mn) (4. 3)
The Young’s modulus (E) is approximated by
E = 3G (4. 4)
Four major assumptions are made in developing the statistical theory of rubber
elasticity: 1) the internal energy of the system is independent of the conformation of the
individual chains, 2) the network chains obey Gaussian statistics, 3) the total number of
conformations of an isotropic network is the sum of the number of conformations of the
individual network chains, and 4) crosslinked junctions in the network are fixed at their
mean position; an affine transformation occurs upon deformation.146
Crosslinking and the crosslink density greatly influence material properties
especially above Tg. Unlike linear polymer chains, which undergo viscous flow above Tg
and are incapable of sustaining a constant load, crosslinked networks show elastic
characteristics above their Tgs. Crosslinking generally improves physical properties
especially above the glass transition temperature. For example, network glassy moduli
generally vary slightly as a function of crosslink density, whereas the rubbery moduli
increase significantly with increasing degrees of crosslinking. The glass transition
temperatures increase with higher degrees of crosslinking. The extent of Tg increase as a
function of crosslink density has been approximated by
∆Tg = Aν (4. 5)
146 J. J. Aklonis and W. J. MacKnight, Introduction to Polymer Viscoelasticity, Second
Edition, John Wiley and Sons, New York, 1983.
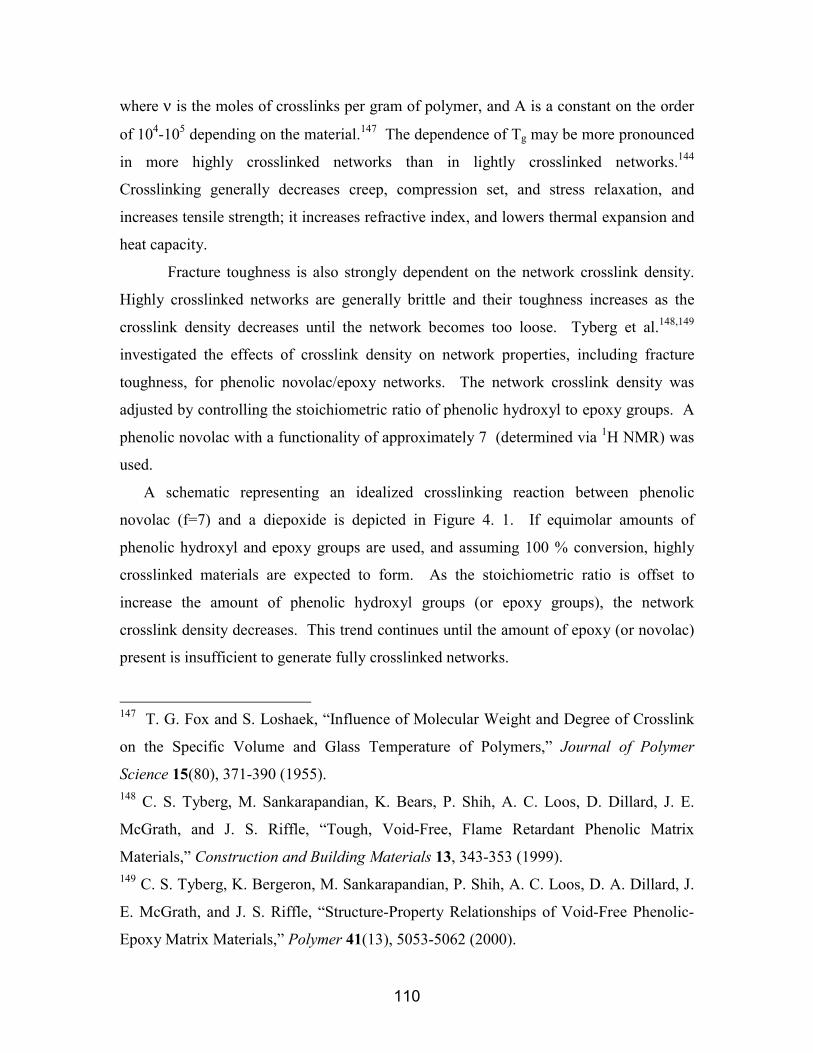
110
where ν is the moles of crosslinks per gram of polymer, and A is a constant on the order
of 104-105 depending on the material.147 The dependence of Tg may be more pronounced
in more highly crosslinked networks than in lightly crosslinked networks.144
Crosslinking generally decreases creep, compression set, and stress relaxation, and
increases tensile strength; it increases refractive index, and lowers thermal expansion and
heat capacity.
Fracture toughness is also strongly dependent on the network crosslink density.
Highly crosslinked networks are generally brittle and their toughness increases as the
crosslink density decreases until the network becomes too loose. Tyberg et al.148,149
investigated the effects of crosslink density on network properties, including fracture
toughness, for phenolic novolac/epoxy networks. The network crosslink density was
adjusted by controlling the stoichiometric ratio of phenolic hydroxyl to epoxy groups. A
phenolic novolac with a functionality of approximately 7 (determined via 1H NMR) was
used.
A schematic representing an idealized crosslinking reaction between phenolic
novolac (f=7) and a diepoxide is depicted in Figure 4. 1. If equimolar amounts of
phenolic hydroxyl and epoxy groups are used, and assuming 100 % conversion, highly
crosslinked materials are expected to form. As the stoichiometric ratio is offset to
increase the amount of phenolic hydroxyl groups (or epoxy groups), the network
crosslink density decreases. This trend continues until the amount of epoxy (or novolac)
present is insufficient to generate fully crosslinked networks.
147 T. G. Fox and S. Loshaek, “Influence of Molecular Weight and Degree of Crosslink
on the Specific Volume and Glass Temperature of Polymers,” Journal of Polymer
Science 15(80), 371-390 (1955).148 C. S. Tyberg, M. Sankarapandian, K. Bears, P. Shih, A. C. Loos, D. Dillard, J. E.
McGrath, and J. S. Riffle, “Tough, Void-Free, Flame Retardant Phenolic Matrix
Materials,” Construction and Building Materials 13, 343-353 (1999).149 C. S. Tyberg, K. Bergeron, M. Sankarapandian, P. Shih, A. C. Loos, D. A. Dillard, J.
E. McGrath, and J. S. Riffle, “Structure-Property Relationships of Void-Free Phenolic-
Epoxy Matrix Materials,” Polymer 41(13), 5053-5062 (2000).
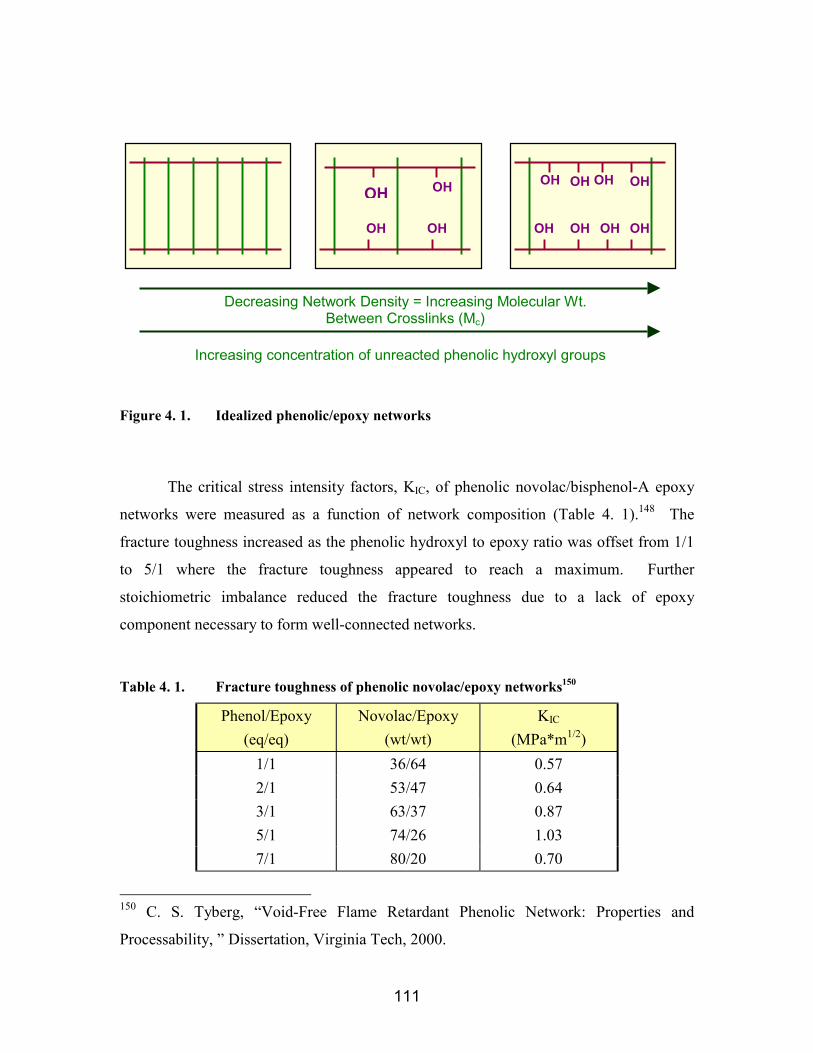
111
Figure 4. 1. Idealized phenolic/epoxy networks
The critical stress intensity factors, KIC, of phenolic novolac/bisphenol-A epoxy
networks were measured as a function of network composition (Table 4. 1).148 The
fracture toughness increased as the phenolic hydroxyl to epoxy ratio was offset from 1/1
to 5/1 where the fracture toughness appeared to reach a maximum. Further
stoichiometric imbalance reduced the fracture toughness due to a lack of epoxy
component necessary to form well-connected networks.
Table 4. 1. Fracture toughness of phenolic novolac/epoxy networks150
Phenol/Epoxy(eq/eq)
Novolac/Epoxy(wt/wt)
KIC
(MPa*m1/2)1/1 36/64 0.572/1 53/47 0.643/1 63/37 0.875/1 74/26 1.037/1 80/20 0.70
150 C. S. Tyberg, “Void-Free Flame Retardant Phenolic Network: Properties and
Processability, ” Dissertation, Virginia Tech, 2000.
Decreasing Network Density = Increasing Molecular Wt.Between Crosslinks (Mc)
OH OH OH
OHOHOH
OH OH OH
OH OH OH
Increasing concentration of unreacted phenolic hydroxyl groups
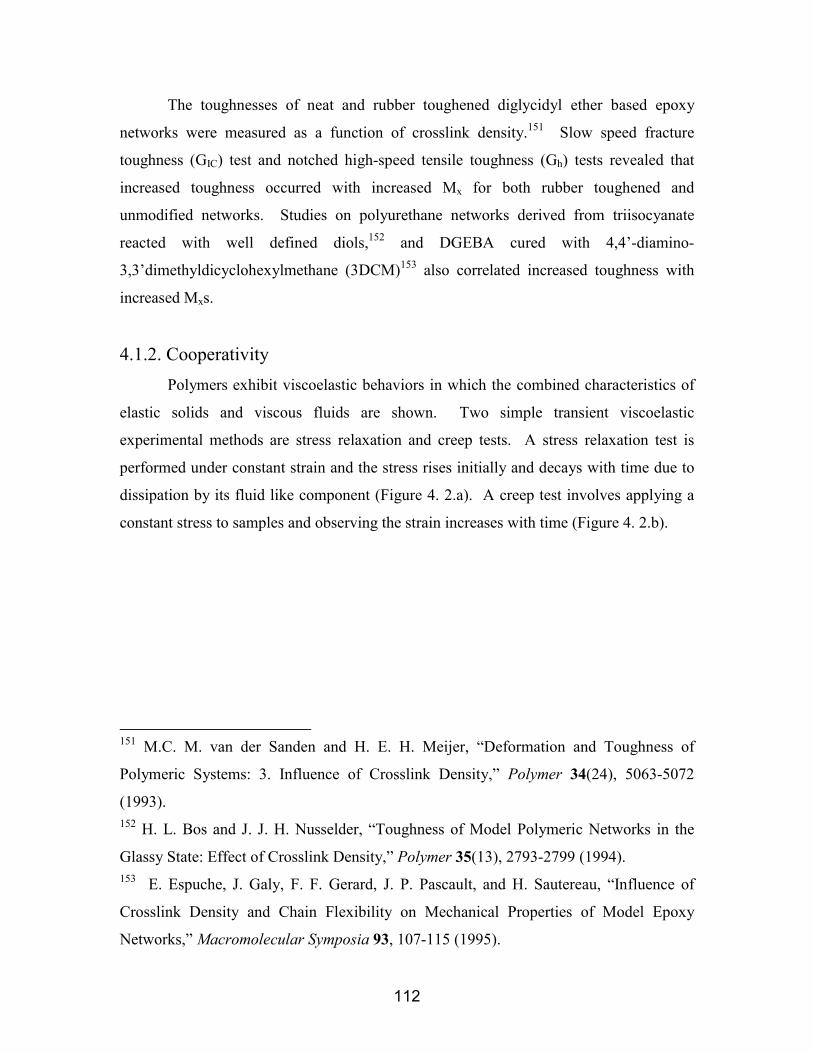
112
The toughnesses of neat and rubber toughened diglycidyl ether based epoxy
networks were measured as a function of crosslink density.151 Slow speed fracture
toughness (GIC) test and notched high-speed tensile toughness (Gh) tests revealed that
increased toughness occurred with increased Mx for both rubber toughened and
unmodified networks. Studies on polyurethane networks derived from triisocyanate
reacted with well defined diols,152 and DGEBA cured with 4,4’-diamino-
3,3’dimethyldicyclohexylmethane (3DCM)153 also correlated increased toughness with
increased Mxs.
4.1.2. CooperativityPolymers exhibit viscoelastic behaviors in which the combined characteristics of
elastic solids and viscous fluids are shown. Two simple transient viscoelastic
experimental methods are stress relaxation and creep tests. A stress relaxation test is
performed under constant strain and the stress rises initially and decays with time due to
dissipation by its fluid like component (Figure 4. 2.a). A creep test involves applying a
constant stress to samples and observing the strain increases with time (Figure 4. 2.b).
151 M.C. M. van der Sanden and H. E. H. Meijer, “Deformation and Toughness of
Polymeric Systems: 3. Influence of Crosslink Density,” Polymer 34(24), 5063-5072
(1993).152 H. L. Bos and J. J. H. Nusselder, “Toughness of Model Polymeric Networks in the
Glassy State: Effect of Crosslink Density,” Polymer 35(13), 2793-2799 (1994).153 E. Espuche, J. Galy, F. F. Gerard, J. P. Pascault, and H. Sautereau, “Influence of
Crosslink Density and Chain Flexibility on Mechanical Properties of Model Epoxy
Networks,” Macromolecular Symposia 93, 107-115 (1995).
113
Figure 4. 2. a) Stress-relaxation experiment, and b) creep experiments
When an external force is applied to polymer chains in their equilibrium state, a
relaxation process occurs to redistribute the chain conformations until equilibrium is
reached. The relaxation of the smallest units in polymer chain requires the shortest
relaxation time. Polymer chains composed of many relaxation units can cooperatively
relax as a larger unit, which requires a longer relaxation time. A polymer relaxation
process, which consists of several mechanisms, can be described using a distribution of
relaxation times, or a relaxation spectrum
) t - ( expG G(t)i
iιτ∑= (4. 6)
where G(t), the relaxation modulus at time t, is the sum of individual relaxing elements
each with a relaxation time τi and a relative intensity Gi.
In a continuum relaxation process, the smallest unit should exhibit the shortest
relaxation time. A deformation study on polypropylene showed that the rotation of main
chain bonds, most likely between trans and gauche conformations, represents the smallest
domain and therefore is the predominate mode of deformation.154 The rate of rotation
from one stable conformation to another is controlled by the number of bonds exceeding
154 D. N. Theodorou and U. W. Suter, “Shape of Unperturbed Linear Polymer:
Polypropylene,” Macromolecules 18(6), 1206-1214 (1985).
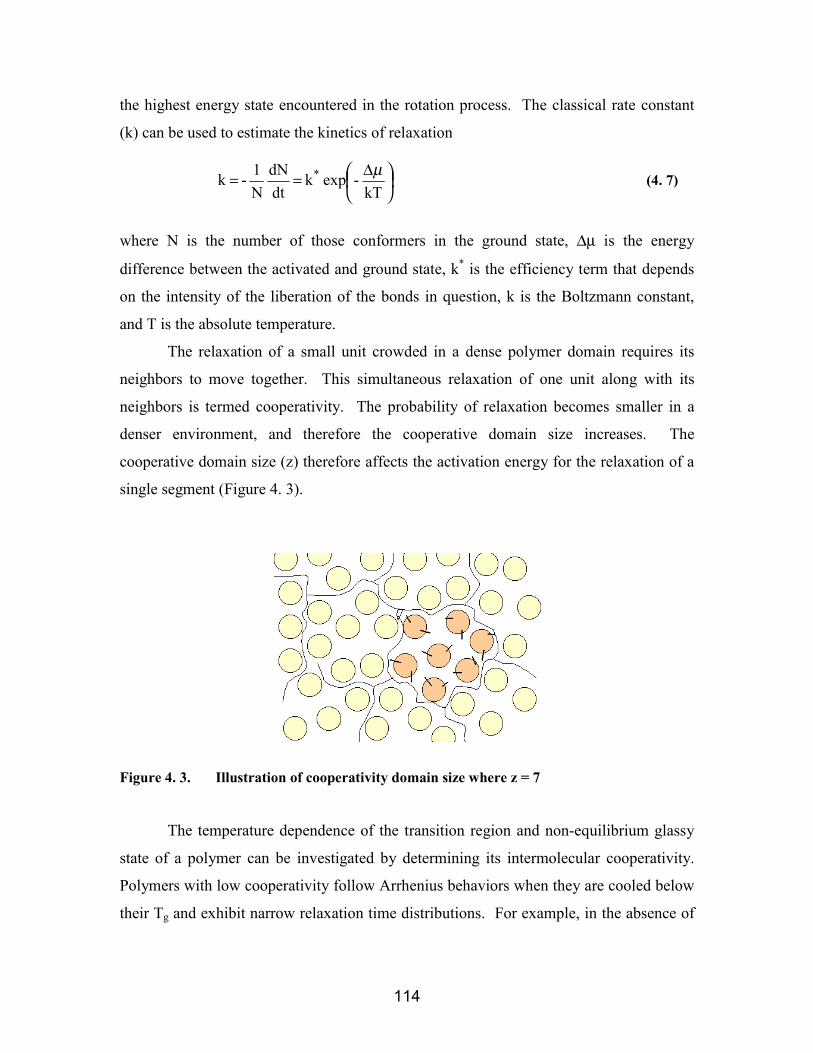
114
the highest energy state encountered in the rotation process. The classical rate constant
(k) can be used to estimate the kinetics of relaxation
∆==
kT -exp k
dtdN
N1 - k * µ
(4. 7)
where N is the number of those conformers in the ground state, ∆µ is the energy
difference between the activated and ground state, k* is the efficiency term that depends
on the intensity of the liberation of the bonds in question, k is the Boltzmann constant,
and T is the absolute temperature.
The relaxation of a small unit crowded in a dense polymer domain requires its
neighbors to move together. This simultaneous relaxation of one unit along with its
neighbors is termed cooperativity. The probability of relaxation becomes smaller in a
denser environment, and therefore the cooperative domain size increases. The
cooperative domain size (z) therefore affects the activation energy for the relaxation of a
single segment (Figure 4. 3).
Figure 4. 3. Illustration of cooperativity domain size where z = 7
The temperature dependence of the transition region and non-equilibrium glassy
state of a polymer can be investigated by determining its intermolecular cooperativity.
Polymers with low cooperativity follow Arrhenius behaviors when they are cooled below
their Tg and exhibit narrow relaxation time distributions. For example, in the absence of

115
neighbor interference, the following Arrhenius equation can be used to describe the
relaxation time, τ
∆+= *
*
RT1 -
RT1 ln ln µττ (4. 8)
where ∆µ = activation energy of conformer rotation (or change)
R = gas constant
T = absolute temperature
T* = temperature at which the conformer can rotate freely without any
neighbor interference
τ* = relaxation time at which the conformer can rotate freely without any
neighbor interference
For cooperative relaxation, the domain size (z) must be introduced. The
relaxation time of polymers that consist of larger sterically hindered units must be
described using a non-Arrhenius equation
∆+= *
*
RT1 -
RTz ln ln µττ (4. 9)
The above equation is non-Arrhenius since z is temperature dependent.
Materials with Arrhenius behaviors are described as “strong”; on the other hand,
materials with non-Arrhenius behaviors are referred to as “fragile”. Fragility therefore is
a measure of the temperature dependence of the most probable segmental relaxation time
near Tg where more fragile corresponds to higher temperature dependence and vice versa.
Connolly and Karasz155 have correlated fragility to the degree of cooperativity. A
fragility plot, or cooperativity plot, can be generated by plotting the time temperature
shift factor versus (Tg/T). The slope of the line at T = Tg is termed fragility (m) and is
proportional to the apparent activation energies normalized by Tg.
155 M. Connolly and F. Karasz, “Viscoelastic and Dielectric Relaxation Behavior of
Substituted Poly(p-Phenylenes) ,” Macromolecules 28, 1872-1881 (1995).

116
m = ∆E/2.303 R Tg (4. 10)
A higher m value corresponds to a more fragile material with a greater degree of
intermolecular cooperativity which therefore exhibits a higher temperature sensitivity.
Hydrogen bonding plays an important role in cooperativity for both low
molecular weight materials and polymers. The cooperativity of a series of disubstituted
benzenes with various potentials for hydrogen bonding, investigated by Angell,156
showed that materials that can form stronger hydrogen bonding were more fragile.
Bohmer et al.157 and Roland and Ngai158 observed the same trends. Phenolic
novolac/bisphenol-A epoxy networks, showed that both the crosslink density and
hydrogen bonding affected the glass formation processes.150 On the contrary, relatively
non-polar polymers such as polyethylene and polytetrahydrofuran showed low fragility
values which corresponded to weak intermolecular interactions.
4.1.3. Thermal and thermo-oxidative stability of novolac/epoxy networksPhenolic networks are well known for their excellent thermal and thermo-
oxidative stabilities. A detailed review on the decomposition pathways can be found in
chapter 1.8. The present work focuses on characterizing novolac/epoxy networks using
cone calorimetry.
The cone calorimetry, so called because of the geometric arrangement of the
electric heater, measures the heat release rate, total heat released, ignitability, effective
heat of combustion, specific extinction area (a measure of the smoke production), soot
yield, mass loss rate, and the evolution of carbon monoxide, carbon dioxide, and other
156 C. A. Angell, “Transport Processes, Relaxation, and Glass Formation in Hydrogen-
Bonded Liquids,” Hydrogen Bonded liquids, J. C. Dore and J. Teixeira, Eds., Vol. 329,
pp59-79, 1991.157 R. Bohmer, K. L. Ngai, C. A. Angel, and D. J. Plazek, “Nonexponential Relaxations
in Strong and Fragile Glass Formers,” Journal of Chemistry and Physics 99(5), 4201-
4209 (1993).158 C. M. Roland and K. L. Ngai, “Normalization of the Temperature Dependence of
Segmental Relaxation Times,” Macromolecules 25(21), 5765-5768 (1992).
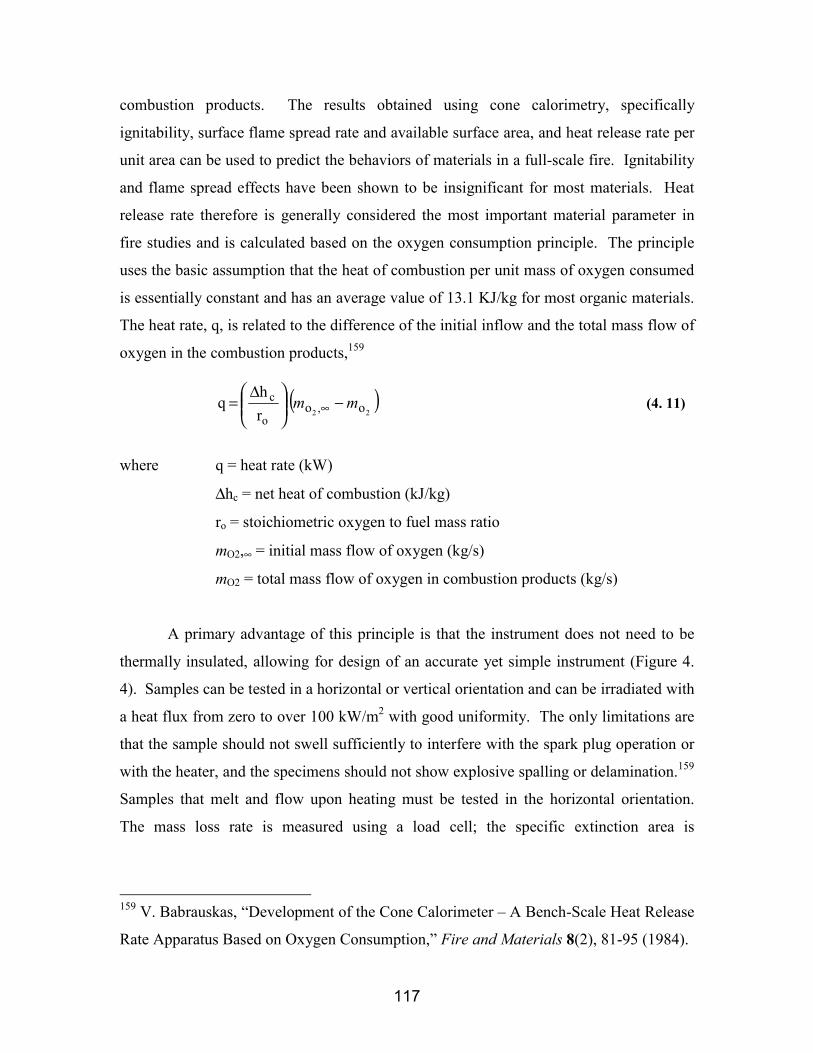
117
combustion products. The results obtained using cone calorimetry, specifically
ignitability, surface flame spread rate and available surface area, and heat release rate per
unit area can be used to predict the behaviors of materials in a full-scale fire. Ignitability
and flame spread effects have been shown to be insignificant for most materials. Heat
release rate therefore is generally considered the most important material parameter in
fire studies and is calculated based on the oxygen consumption principle. The principle
uses the basic assumption that the heat of combustion per unit mass of oxygen consumed
is essentially constant and has an average value of 13.1 KJ/kg for most organic materials.
The heat rate, q, is related to the difference of the initial inflow and the total mass flow of
oxygen in the combustion products,159
( )22 oo
rh
q ,o
c mm −
∆= ∞ (4. 11)
where q = heat rate (kW)
∆hc = net heat of combustion (kJ/kg)
ro = stoichiometric oxygen to fuel mass ratio
mO2,∞ = initial mass flow of oxygen (kg/s)
mO2 = total mass flow of oxygen in combustion products (kg/s)
A primary advantage of this principle is that the instrument does not need to be
thermally insulated, allowing for design of an accurate yet simple instrument (Figure 4.
4). Samples can be tested in a horizontal or vertical orientation and can be irradiated with
a heat flux from zero to over 100 kW/m2 with good uniformity. The only limitations are
that the sample should not swell sufficiently to interfere with the spark plug operation or
with the heater, and the specimens should not show explosive spalling or delamination.159
Samples that melt and flow upon heating must be tested in the horizontal orientation.
The mass loss rate is measured using a load cell; the specific extinction area is
159 V. Babrauskas, “Development of the Cone Calorimeter – A Bench-Scale Heat Release
Rate Apparatus Based on Oxygen Consumption,” Fire and Materials 8(2), 81-95 (1984).
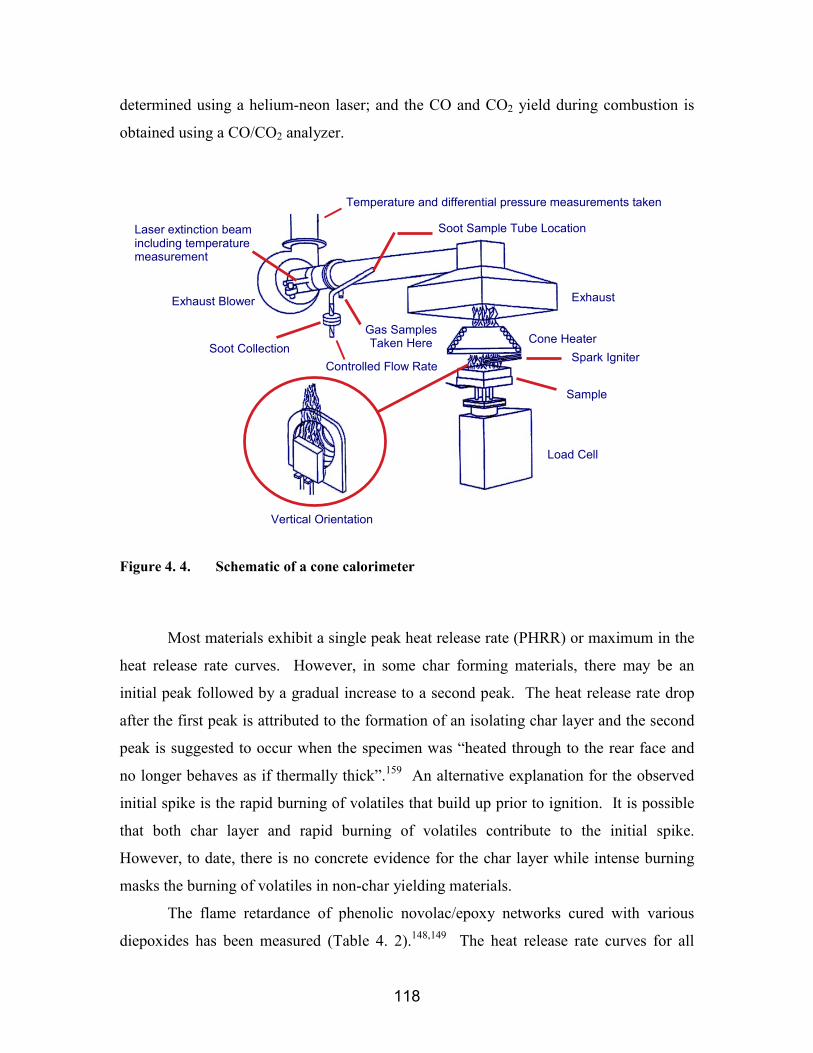
118
determined using a helium-neon laser; and the CO and CO2 yield during combustion is
obtained using a CO/CO2 analyzer.
Figure 4. 4. Schematic of a cone calorimeter
Most materials exhibit a single peak heat release rate (PHRR) or maximum in the
heat release rate curves. However, in some char forming materials, there may be an
initial peak followed by a gradual increase to a second peak. The heat release rate drop
after the first peak is attributed to the formation of an isolating char layer and the second
peak is suggested to occur when the specimen was “heated through to the rear face and
no longer behaves as if thermally thick”.159 An alternative explanation for the observed
initial spike is the rapid burning of volatiles that build up prior to ignition. It is possible
that both char layer and rapid burning of volatiles contribute to the initial spike.
However, to date, there is no concrete evidence for the char layer while intense burning
masks the burning of volatiles in non-char yielding materials.
The flame retardance of phenolic novolac/epoxy networks cured with various
diepoxides has been measured (Table 4. 2).148,149 The heat release rate curves for all
Vertical Orientation
Load Cell
Sample
Spark IgniterCone Heater
Exhaust
Soot Sample Tube Location
Controlled Flow Rate
Gas SamplesTaken HereSoot Collection
Exhaust Blower
Laser extinction beamincluding temperaturemeasurement
Temperature and differential pressure measurements taken

119
networks investigated exhibited an initial spike in addition to the peak heat release rate.
The brominated bisphenol-A epoxy cured networks had the lowest peak heat release
rates, but produced large amounts of toxic CO gas (high CO/CO2 ratio). In addition,
bromine incorporation released HBr and other carcinogenic by-products during burning.
Phenolic novolac cured with siloxane based epoxy yielded networks with low peak heat
release rates and the lowest toxicity. Surprisingly, curing networks with bisphenol-F
epoxy, fluorinated epoxy, or stilbene epoxy did not alter the peak heat release rates in
comparison with the bisphenol-A epoxy cured networks. Networks cured with
bisphenol-F epoxy gave rise to higher smoke toxicity compared to the bisphenol-A cured
networks.
Table 4. 2. Cone calorimetry results on phenolic novolac/epoxy networks (65:35 wt:wtratio)
Epoxy PHRR(kW/m2)
Char Yield(wt %)
Smoke Toxicity(CO/CO2) (x10-3)
Phenolic Control (Resole) 116 65 11Epoxy Control 1230 5 44Bisphenol-A 357 29 34
Brominated bisphenol-A 165 8 189Bisphenol-F 397 17 76Disiloxane 325 22 24Fluorinated 353 -- --
Stilbene 407 -- --
As expected, compositions containing larger amounts of phenolic component
showed lower peak heat release rates, higher char yield, and lower smoke toxicity. The
same trend in char yield was observed using thermogravimetric analysis.148,149
Cone calorimetry was used to evaluate the flame properties of brominated epoxy
composites and phenolic composites reinforced with fiberglass, aramid, or graphite fiber
under controlled oxygen atmospheres.160 The time to ignition (TTI) was essentially
160 F. Hshieh and H. D. Beeson, “Flammability Testing of Flame-Retarded Epoxy
Composites and Phenolic Composites,” Fire and Materials 21, 41-49 (1997).

120
identical for all of the epoxy composites under normal oxygen atmosphere. The
epoxy/graphite composite showed higher TTI under oxygen-depleted environments,
probably due to the higher thermal conductivity of the graphite fiber. The TTI of
phenolic composites were proportional to their thermal conductivities at all oxygen
levels. Using the TTI to PHRR ratio as an indication of the propensity to flashover,
increased oxygen concentration reduced the flame resistance for both epoxy composites
and phenolic composites. As expected, phenolic composites showed more resistance to
flame and had much lower smoke productions than epoxy composites.
4.2. Experimental
4.2.1. MaterialsThe 2000 g/mol cresol novolac resin was prepared according to procedures
described in chapter 3. Triphenylphosphine (TPP) was purchased from Aldrich. The
commercial phenolic novolac resin used in the control experiments was provided by
Georgia Pacific (Product #GP-2073). Epon 828 epoxy resin was obtained from Shell
Chemical. D.E.N. 438 epoxy was supplied by the Dow Chemicals Co. All reagents were
used as received.
4.2.2. Methods
4.2.2.1. Preparation of ortho-cresol novolac networks cured with epoxies
A 2000 g/mol ortho-cresol novolac resin was cured with a difunctional or a
multifunctional epoxy using triphenylphosphine as the catalyst. To a three neck round
bottom flask equipped with a vacuum tight mechanical stirrer and a vacuum adapter was
added cresol novolac and ~85 weight % of the required epoxy. The flask was heated in
an oil bath to 170°C. When the novolac began to soften at ~170°C, mechanical stirring
was begun. Vacuum was applied incrementally to prevent the material from foaming into
the vacuum line. Once full vacuum was achieved (2-5 Torr) the solution was stirred for
about 10 minutes to degas the blend. During this time the remaining epoxy, with the
121
catalyst (0.1 mol % based on the total weight of epoxy) dissolved in it, was degassed in a
vacuum oven at ~80°C. The vacuum was temporarily released to add the remaining
epoxy with catalyst. This was stirred for about 3 minutes to fully degas the samples. The
melt was then poured into a mold and placed in a preheated oven. The samples were
cured at 200°C for 2 hours and then 220°C for 2 hours.
4.2.2.2. Sample preparation for viscosity determinations
Ortho-cresol novolac/epoxy mixtures were melt mixed at 165°C. The exposure
time to heat was maintained for less than 3 minutes to prevent premature curing. The
mixed samples were quenched in dry ice/isopropanol chilled aluminum pans. The
samples were ground into powder prior to use.
4.2.2.3. Network formation of phenolic control
A resole resin was cured thermally to form a typical phenolic network (phenolic
control). The cure cycle consisted of 70°C for 4 days, 130°C for 24 hours, and then
200°C for 24 hours.
4.2.3. Characterization
4.2.3.1. Resin glass transition temperatures
The glass transition temperatures of neat resins were obtained via a Perkin-Elmer
differential scanning calorimetry (DSC-7 Instrument). The DSC was calibrated with
indium and zinc standards, and ice water was used as the coolant. Samples in aluminum
pans were heated from 25 to 180°C at 10°C/min. The glass transition temperatures were
calculated as the midpoints of the curves obtained from the second temperature scan.
4.2.3.2. Network glass transition temperatures
A Perkin-Elmer dynamic mechanical analyzer (model DMA-7), in a three-point
bending mode, was used to determine the glass transition temperatures of cured networks.
The Tgs were calculated from the peaks of the tan delta curves. The static force was set
to 200 mN and the dynamic force was set to 175 mN. Samples were heated at 5°C/min
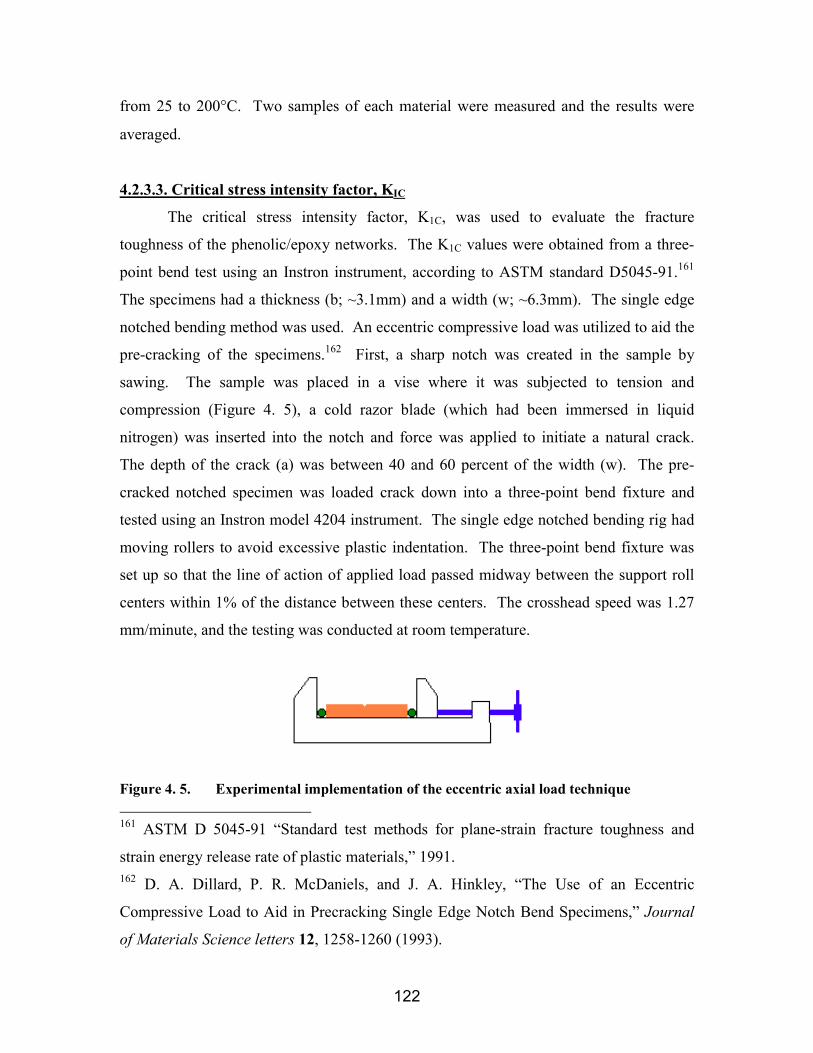
122
from 25 to 200°C. Two samples of each material were measured and the results were
averaged.
4.2.3.3. Critical stress intensity factor, KIC
The critical stress intensity factor, K1C, was used to evaluate the fracture
toughness of the phenolic/epoxy networks. The K1C values were obtained from a three-
point bend test using an Instron instrument, according to ASTM standard D5045-91.161
The specimens had a thickness (b; ~3.1mm) and a width (w; ~6.3mm). The single edge
notched bending method was used. An eccentric compressive load was utilized to aid the
pre-cracking of the specimens.162 First, a sharp notch was created in the sample by
sawing. The sample was placed in a vise where it was subjected to tension and
compression (Figure 4. 5), a cold razor blade (which had been immersed in liquid
nitrogen) was inserted into the notch and force was applied to initiate a natural crack.
The depth of the crack (a) was between 40 and 60 percent of the width (w). The pre-
cracked notched specimen was loaded crack down into a three-point bend fixture and
tested using an Instron model 4204 instrument. The single edge notched bending rig had
moving rollers to avoid excessive plastic indentation. The three-point bend fixture was
set up so that the line of action of applied load passed midway between the support roll
centers within 1% of the distance between these centers. The crosshead speed was 1.27
mm/minute, and the testing was conducted at room temperature.
Figure 4. 5. Experimental implementation of the eccentric axial load technique 161 ASTM D 5045-91 “Standard test methods for plane-strain fracture toughness and
strain energy release rate of plastic materials,” 1991.162 D. A. Dillard, P. R. McDaniels, and J. A. Hinkley, “The Use of an Eccentric
Compressive Load to Aid in Precracking Single Edge Notch Bend Specimens,” Journal
of Materials Science letters 12, 1258-1260 (1993).

123
The critical stress intensity factor, KIC, was calculated using the following
equation.
3/2
21/2
3/2 x)-(1 2x)(1 2)]2.7x3.93x-(2.15 x)-(1x -[1.99 (x) 3
WBS P K IC
++= (4. 12)
where P = maximum load (kN)
S = span (cm)
B = specimen thickness (cm)
W = specimen depth or width (cm)
a = crack length
x = the ratio of crack length to width of the specimen, (a/W)
4.2.3.4. Sol/gel fraction separation
The sol/gel fractions of the networks were determined as follows. Samples of
approximately 0.6g were submerged at room temperature in ~15 ml acetone for 3 days.
The sol fractions were soluble and the gel fractions stayed intact. The gel fractions were
separated from the sol fractions by filtering the solids from the solutions. The gel
fractions were dried in a vacuum oven at 180°C for 24 hours and compared to their initial
weights. The acetone in the sol fractions was evaporated at room temperature in a
vacuum oven. The sol fractions were also analyzed by 1H NMR in order to determine
their chemical contents.
4.2.3.5. 1H NMR sol fraction characterization1H NMR spectra were obtained on a Varian Unity 400 NMR spectrometer. 5 mm
tubes containing approximately 20 mg sample dissolved in DMSO-d6 or acetone-d6 were
analyzed under ambient conditions. The experiment’s parameters include 1.000 second
relaxation delay, 23.6 degrees pulse, and 6744.9 Hz widths. Thirty-two repetitions were
performed for each sample.

124
4.2.3.6. Room temperature density measurements
Room temperature density measurements were conducted using a Mettler-Toledo
AG204 balance adapted with a Mettler-Toledo density determination kit for AT/AG and
PG/PR balance. Samples with dimensions of approximately 19 mm x 6.4 mm x 3.2 mm
were sanded, then polished, to prevent any trapping of air bubbles. Deionized water was
degassed in a vacuum oven at room temperature for 30 min prior to use. Using this
setup, the weight of the solid in air (A) and the weight of the solid in water (B) were
measured. The temperature of the water was recorded to within 0.1°C and the density of
distilled water at that temperature (ρ(H2O)) was obtained from a density table. Room
temperature densities were calculated using the following equation
ρ= [A/(A-B)] ρ(H2O) (4. 13)
The densities at Tg+50°C were calculated using the densities at room temperature and the
coefficients of thermal expansion (CTE) below and above the Tg.
4.2.3.7. Determination of coefficient of thermal expansion (αααα)
One dimension thermal expansion was measured using a thermomechanical
analyzer equipped with a large quartz parallel plate. The specimen height was monitored
as the sample was heated from 25°C to 200°C at 5°C/min. The coefficients of thermal
expansion (CTE) were determined by calculating the slope above and below the Tg of the
material.
4.2.4.8. Rubbery moduli determination via creep tests
The rubbery moduli (E) of networks at 50°C above the glass transition
temperatures were determined using a stress-strain test via a Dynastat instrument.
Samples with dimensions of approximately 19mm x 6.3mm x 3.1mm were placed in a
three-point bend fixture and heated to 50°C above the Tg. A small load (0.01kg) was
placed on the sample and the displacements at equilibrium were measured. Equilibrium
was reached within 5 seconds. The load was increased by increments of 0.01 kg up to
about 0.08 kg while the equilibrium displacement was recorded at each load. The
125
rubbery moduli were determined from the slopes of load versus displacement curves.
The displacement values measured from the Dynastat are accurate to within 0.05 mm.
∆=
I 48L P g E
3
(4. 14)
where g = gravitational constant = 9.81 m/s2
P/∆ = slope of load versus displacement
L = length between supports = 2.54 cm
and
I = (1/12)wb3 (4. 15)
where w = width of the sample
b = height of the sample
According to the theory of rubber elasticity, the number average molecular weight
between crosslinks (Mx) is inversely proportional to the rubbery modulus,
Mx = 3RTρ/E (4. 16)
where R = gas constant,
T = experimental temperature (K)
ρ = density of the sample at the experimental temperature; calculated
from the room temperature density and CTE values of the samples,
E = elastic modulus obtained from the Dynastat measurements.
4.2.3.9. 10sec relaxation moduli determination via stress relaxation tests
Stress relaxation experiments were also conducted on the Dynastat instrument in
the three-point bend mode. The samples were initially heated to 70°C below the Tg (Tg
determined from the peak of the DMA tan delta curve). The upper beam was set to a
position just above the sample with no contact or applied forces, and the instrument was
equilibrated for at least 3 minutes. To begin testing, the upper beam was lowered by 0.1
126
mm. The load was measured and recorded as a function of time as the sample relaxed for
1000 seconds. The displacement was then removed and the samples were allowed to
recover for 2000 seconds. This test was repeated at each temperature interval from Tg-
70°C to Tg+30°C at 5°C increments. In addition to the applied displacement, the
displacement increased with temperature increases due to thermal expansion by the
instrument and the sample. The CTE of instrument was approximately 0.0033 mm/°C
and the CTE of the samples was determined using TMA. The sample expansion can be
ignored since it is insignificant compared to the instrument expansion and applied
displacement. The modulus at each temperature for each displacement was calculated
using equation (4.14). The modulus calculated after 10 seconds relaxation was plotted as
a function of temperature.
Master curves were constructed from these stress relaxation results according to
the time-temperature superposition principle. After a reference spectrum was assigned
(generally at the Tg of the network), other spectra, determined at various temperatures,
were shifted horizontally until a single continuous curve was generated.
4.2.3.10. Flame retardance measured via cone calorimeter
Cone calorimetry was used to measure the flame retardance of novolac/epoxy
networks. Sample panels of approximately 6.3 mm thickness and surface dimensions of
10x10 cm were tested at a 50.0 kW/m2 incident heat flux in a controlled atmosphere cone
calorimeter. The ignitability, peak heat release rate, the evolution of CO and CO2, and
the time to sustained ignition are among some of the parameters measured.
4.2.3.11. Thermal and thermo-oxidative degradation
A Perkin-Elmer TGA-7 thermogravimetric analyzer was used to determine the
thermal and thermo-oxidative stabilities of cresol novolac/epoxy networks. Samples of
approximately 5-8 mg were placed in a platinum sample pan and heated in a furnace at
10°C/min from 30 to 900°C. Air or nitrogen was used as the carrier gas. The sample
weight loss was monitored as a function of temperature.

127
4.2.3.12. Viscosity measurements
Dynamic complex viscosities were obtained from a Bohlin VOC Rheometer
operating in continuous oscillation mode with a frequency of 1 Hz. Temperature control
was accomplished with a Bohlin HTC. The auto-strain was set to maintain the torque at
25% of the maximum torque allowed. The maximum strain for the instrument was 0.25.
Approximately 0.7g of dry powder sample were pressed into pellets, then placed between
the preheated 25 mm diameter parallel plates of the rheometer. The gap was closed to
approximately 1mm and the sides were scraped to remove excess sample before the run
was started.
A Brookfield DV-III Programmable Rheometer was used to determine the
isothermal viscosities of novolac/epoxy mixtures. Approximately 10g of powder samples
were placed in disposable sample tubes and heated to the test temperatures. A spindle,
which was driven through a calibrated spring, was immersed in the test fluid. The
viscous drag of the fluid against the spindle was measured by the spring deflection. The
torque was used to calculate the viscosities.
η (cp) = (100/rpm) x Tk x SMC x torque (4. 17)
where rpm = 10
Tk = a constant, equal to 1.0 in these experiments
SMC = a constant which depends on the spindle diameter = 25
4.2.3.13. Equilibrium moisture uptake
To investigate moisture uptake, samples with dimensions of approximately 19
mm x 6.35mm x 1 mm were dried in a vacuum oven for 12 hours at 150°C. The initial
weight of each sample was recorded. The samples were then placed in vials containing
deionized water. The weights of each sample were measured as a function of time until a
constant weight was reached. Water absorption at room temperature and at 62°C was
determined. The sample thickness, the dimension in which water penetrates most
rapidly, was normalized as the results were plotted as percent water uptake versus
t1/2/thickness.

128
4.2.3.14. Kinetic studies via DSC
Arrhenius activation energies, pre-exponential factors, and first order rate
constants for novolac/epoxy cure reactions were determined using differential scanning
calorimetry according to ASTM E 698–79.163 Samples were heated at various heating
rates and the exothermic reaction peaks were recorded. The temperatures at which the
exotherm peaks occurred were plotted as a function of their respective heating rates.
Kinetic parameters were calculated from the slope of this plot. The time that was
required to reach 50% conversion, or the half-life time, can be predicted. A sample was
aged to reach 50% conversion according to the predicted time at the selected temperature
and compared to an unaged sample to confirm the validity of this method.
4.2.3.15. Flexural strength and moduli of composites
Transverse flexural tests were performed according to ASTM standard D 790–98.
Composite samples with dimensions of 127 mm x 12.7 mm x 2.4 mm were measured in a
three-point bend set up. The rate of crosshead motion (R) used was 7.11 mm/min which
was calculated based on the following equation,
R = ZL2/6d (4. 18)
where L = support span length (101.6 mm),
d = depth of the beam (2.4 mm),
Z = rate of straining of the outer fiber (0.01).
Flexural strength (σf) and modulus (E) were calculated as follows,
σf = 3PL/2bd2 (4. 19)
E = L3m/4bd3 (4. 20)
where P = load
b = width of beam tested (12.7 mm)
163 ASTM E 698-79 (reapproved 1993) “Standard test method for Arrhenius kinetic
constant for thermally unstable materials,” 1993.

129
L = support span length (101.6 mm),
d = depth of the beam (2.4 mm),
m = slope of the tangent to the initial straight-line portion of the
load-deflection curve.
4.3. Results and Discussion
4.3.1. Properties of ortho-cresol novolac/epoxy networks4.3.1.1. Network formation and characterization
Network structures in crosslinked systems generally have an enormous influence
over the mechanical properties. For example, high crosslink densities generally correlate
with high strengths but low fracture toughnesses. Typical phenolic novolac networks
crosslinked with hexamethylenetetramine (HMTA) are brittle because they are highly
crosslinked and filled with voids. Tough, void-free, networks have been prepared by
curing phenolic novolacs with epoxies. In addition, if the phenolic novolac was used in
excess, the resulting networks exhibited excellent flame retardance properties.148
The fracture toughness of crosslinked networks is related to the molecular weight
between crosslinks. Increased molecular weight between crosslinks (Mc), or decreased
crosslink densities, generally gave rise to tougher networks up to some point where
dangling chain ends begin to dominate properties.
A primary objective of this research was to improve the fracture toughness of
novolac/epoxy networks while retaining excellent flame retardance. The approach
utilizes the known direct correlation between molecular weight between crosslinks and
fracture toughness by using higher molecular weight oligomers in the network formation.
However, increasing the molecular weight of the phenolic novolac is impractical since
branching occurs once the molecular weight reaches 900-1000 g/mol.164 Branching may
lead to higher viscosities and reduce the processability. Branching sites on oligomers
164 Knopp, A.; Pilato, L. A., Phenolic Resins: Chemistry, Application and Performance-
Future Directions; Springer-Verlag, New York, 1985.

130
translate to crosslink points in the cured networks, which effectively increase the
crosslink densities. Cresol novolac resins, on the other hand, are linear. Moreover, the
molecular weight was strategically controlled with an endcapping reagent.
Table 4. 3. Phenolic materials and their properties
Sample Mn (g/mol) Tg (°C)Phenolic novolac ~ 700 78
Ortho-cresol novolac ~ 2000 104
In this study, a controlled molecular weight 2000g/mol ortho-cresol novolac resin
was crosslinked with two epoxies, a difunctional bisphenol-A epoxy (Epon 828) and a
multifunctional epoxidized novolac (D.E.N. 438) in systematically controlled weight
ratios (Figure 4. 6). The used of Epon 828 epoxy was expected to offer better
processabilities since it significantly reduced the melt viscosities of novolac/epoxy
mixtures. Networks crosslinked with DEN 438 were anticipated to be more flame
retardant. The properties of these cresol novolac networks were evaluated and compared
to an epoxy control (Epon 828 crosslinked with a stoichiometrical amount of p,p’-
diaminodiphenylsulfone [4,4-DDS]), a phenolic control (heat cured resole network), and
a phenolic novolac/Epon 828 network (65:35 wt:wt ratio).
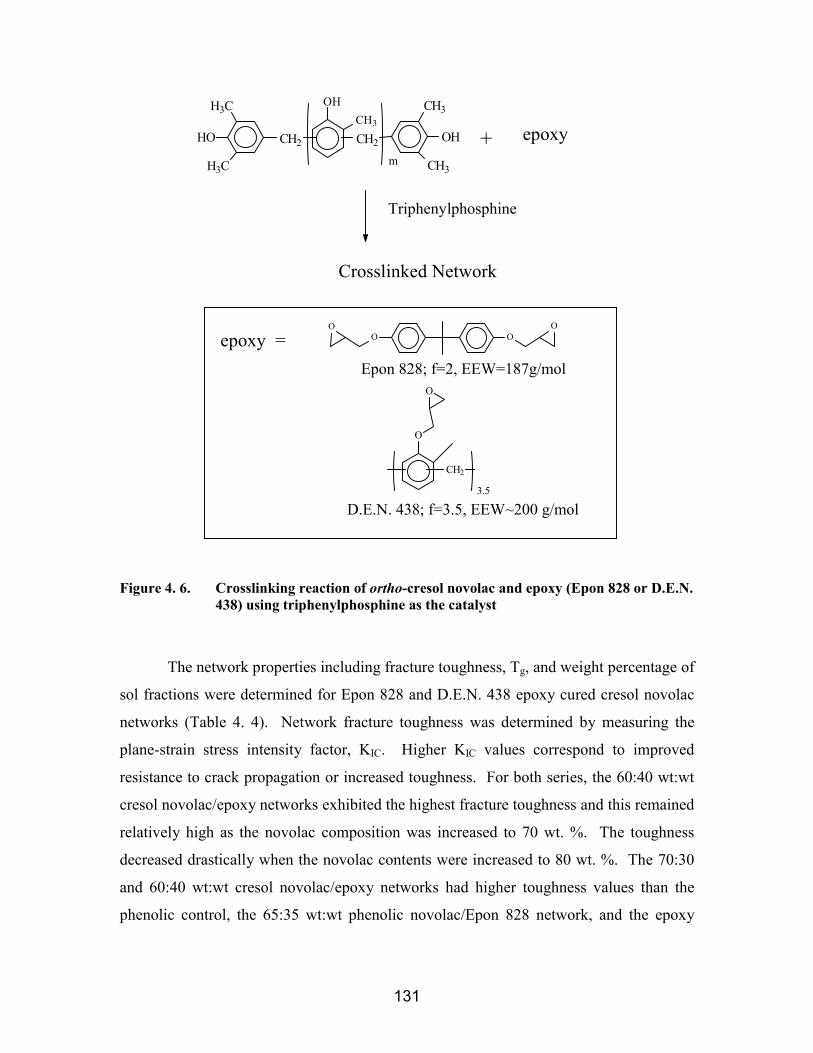
131
D.E.N. 438; f=3.5, EEW~200 g/mol
Epon 828; f=2, EEW=187g/mol
O OO O
epoxy =
epoxy
Crosslinked Network
Triphenylphosphine
+
3.5
CH2
O
O
m
OHCH3
OH
CH3
CH3
CH2HO
H3C
H3C
CH2
Figure 4. 6. Crosslinking reaction of ortho-cresol novolac and epoxy (Epon 828 or D.E.N.438) using triphenylphosphine as the catalyst
The network properties including fracture toughness, Tg, and weight percentage of
sol fractions were determined for Epon 828 and D.E.N. 438 epoxy cured cresol novolac
networks (Table 4. 4). Network fracture toughness was determined by measuring the
plane-strain stress intensity factor, KIC. Higher KIC values correspond to improved
resistance to crack propagation or increased toughness. For both series, the 60:40 wt:wt
cresol novolac/epoxy networks exhibited the highest fracture toughness and this remained
relatively high as the novolac composition was increased to 70 wt. %. The toughness
decreased drastically when the novolac contents were increased to 80 wt. %. The 70:30
and 60:40 wt:wt cresol novolac/epoxy networks had higher toughness values than the
phenolic control, the 65:35 wt:wt phenolic novolac/Epon 828 network, and the epoxy

132
control. The 70:30 compositions had the highest Tgs and lowest sol fractions. The Tg
and the sol fraction increased when the novolac composition was increased or decreased.
Table 4. 4. Network properties of ortho-cresol novolac/epoxy networks
Epoxy NovolacWt %
OH:epoxy K1C(MPa/m1/2)
Tg(oC)
Sol fraction(%)
Epoxy Control -- -- 0.62 127 --Phenolic control -- -- 0.16 -- --
Epon 828* 63 3.0:1 0.85 137 12.580 6.2:1 0.65±0.06 144 16.7
Epon 828** 70 3.6:1 1.06±0.04 154 5.460 2.3:1 1.20±0.12 133 7.180 5.0:1 0.46±0.04 145 15.6
D.E.N. 438** 70 2.9:1 1.05±0.09 152 4.360 1.9:1 1.08±0.10 142 11.7
* Phenolic novolac/epoxy networks** Ortho-cresol novolac/epoxy networks
To understand these unexpected network properties, network structures were
investigated in an attempt to relate the structures with properties.
A simple approach that determined the chemical compositions of the sol fractions
is 1H NMR (Figure 4. 7). Since epoxides show five distinct sets of peaks, the presence of
epoxy functionality can be detected with ease. 1H NMR of sol fractions showed traces of
epoxy for the network compositions higher in novolac (80:20 and 70:30 wt:wt cresol
novolac/epoxy networks). The sol fractions of the 60:40 wt:wt cresol novolac/epoxy
network, on the other hand, consisted of large amounts of unreacted epoxies, even though
these had a stoichiometric excess of phenol. This suggests that the networks at 60:40
compositions became too dense for further phenolic hydroxyl/epoxy reactions to occur
since post-curing well above Tg did not promote any further reactions. This may also
explain why the fracture toughness reached a certain maximum limit above which an
increase in epoxy content did not increase the toughness.

133
Figure 4. 7. 1H NMR of the sol fraction of cresol novolac/Epon 828 networks
The effect of network structures on Tg was also explored (Table 4. 4). For both
series, the Tg was highest for the 70:30 wt:wt cresol novolac/epoxy networks. This is
consistent with the low sol fractions in these compositions suggesting that the chains in
these networks are well connected. By contrast, the 60:40 wt:wt cresol novolac/epoxy
networks which contained a significant amount of unreacted epoxy groups had lower Tgs.
The 80:20 composition also exhibited lower Tgs due to their low crosslink densities and
high sol fractions. Tg is a function of crosslink density and the amount of sol
fraction/dangling ends in the networks.
To further understand the network structures, the molecular weights between
crosslinks were calculated (Table 4. 5). The theory of rubbery elasticity was used to
4.5 4.0 3.5 3.0 2.5 2.0 1.5 PPM
Epon
80:20 sol
70:30 sol
60:40 sol

134
estimate the molecular weight between crosslinks for the cresol novolac/epoxy networks.
According to this theory, network rubbery moduli are inversely proportional to the
molecular weights between crosslinks. The rubbery moduli were measured using a
stress-strain test in a three-point bend set up at Tg+50°C, a temperature well above the
material glass transition temperature. The network glass transition temperatures and
densities at the measurement temperature (Tg+50°C) were determined prior to
calculation. It should be noted that the rubbery moduli should be measured for networks
containing only the gel fraction. However, the rubbery moduli were measured on
unextracted networks in these experiments.
Table 4. 5. Crosslink densities of cresol novolac/epoxy networks
Epoxy NovolacWt %
Tg
(ºC)ρ
(25ºC)ρ
(Tg+50ºC)ModulusTg+50ºC
Mx
(g/mol)Epon828* 65 127 1.23 1.18 9.35 x 10⁶ 1413
80 144 1.178 1.163 1.82 x 10⁶ 665070 154 1.183 1.168 8.25 x 10⁶ 1510Epon 828**60 133 1.181 1.168 3.20 x 10⁶ 373080 145 1.199 1.184 2.63 x 10⁶ 470070 152 1.191 1.173 9.12 x 10⁶ 1360D.E.N. 438**60 142 1.191 1.174 8.02 x 10⁶ 1510
* Phenolic novolac/epoxy networks** o-Cresol novolac/epoxy networks
For cresol novolac/Epon 828 networks, the 70:30 composition exhibited the
highest rubbery modulus and therefore the lowest apparent Mx. The calculated Mx (1510
g/mol) is a reasonable value for well connected networks prepared with a 2000 g/mol
oligomer. The rubbery modulus decreased and the Mx increased significantly at the
60:40 composition. According to the 1H NMR analysis on sol fractions, a large amount
of epoxy remained unreacted at this composition. The low molecular weight fraction,
along with dangling chain ends, probably did not contribute mechanically, and therefore
reduced the rubber modulus and increased the apparent molecular weight between
crosslinks. When the cresol novolac content was increased to 80 weight percent, the

135
rubbery modulus again decreased. The high molecular weight between crosslinks was
attributed to a looser network formed with less epoxy. The same trends were observed
for the D.E.N. 438 epoxy cured cresol novolac networks.
Surprisingly, these results indicated that the networks comprised of 80:20 wt:wt
cresol novolac/epoxy (or 6.2 hydroxyl per 1 epoxy) did not form sufficiently well
connected networks. The stoichiometric ratio was optimized at 70:30 wt:wt cresol
novolac/epoxy compositions (or 3.6 hydroxyl per 1 epoxy) where all the epoxies were
reacted into the networks and the apparent Mx was most reasonable. At this composition,
networks with superior properties, i.e. high fracture toughness, high Tgs, low sol
fractions, and sufficiently high crosslink densities were generated. At the 60:40
composition (2.3 hydroxyl per 1 epoxy), the networks became too dense. The lack of
molecular mobility probably prevented further phenolic hydroxyl/epoxy reactions,
thereby leaving unreacted epoxies in the sol fractions.
Both the glassy and the rubbery moduli were evaluated from a plot of 10-second
stress relaxation moduli verses temperature. As described earlier, these moduli were
evaluated for unextreacted cresol novolac/epoxy networks. As expected, the rubbery
moduli for cresol novolac/Epon 828 networks (Figure 4. 8), phenolic novolac/Epon 828
networks (Figure 4. 9), and cresol novolac/DEN 438 networks (Figure 4. 10) increased as
the network crosslink density increased. For most materials, the same trends are
observed for glassy moduli where higher crosslink densities lead to slightly higher glassy
moduli. However, for Epon 828 cured cresol novolac and phenolic novolac networks, the
glassy moduli for the 80:20 composition was significantly higher than for the 70:30 and
60:40 compositions. This increase in the glassy modulus for the 80:20 composition was
most likely due to its ability to form strong hydrogen bonding between unreacted
phenolic hydroxyl groups. Since the sol fractions were not removed prior to
measurement, an antiplasticization effect could also led to the increased glassy moduli.
The hydrogen bonding interactions did not play an as important role in the 70:30 and the
60:40 compositions since more hydroxyl groups were reacted with epoxies at these
compositions.

136
7
8
9
10
40 70 100 130 160 190Temperature (oC)
log
E' (P
a)
80:20 Epon 82870:30 Epon 82860:40 Epon 828
Figure 4. 8. 10s Relaxation moduli as functions of temperatures for cresol novolac/Epon828 networks
Figure 4. 9. 10s Relaxation moduli as functions of temperatures for phenolicnovolac/Epon 828 networks
The hydrogen bonding interaction, which affects the glassy moduli, was not
observed for the D.E.N. 438 cured cresol novolac networks. The glassy moduli for all
compositions were comparable (Figure 4. 10). Both the rubbery and the glassy moduli
follow the expected trends.
7
7.5
8
8.5
9
9.5
10
45 65 85 105 125 145 165 185
Temperature (°C)
80/20
65/35
50/50
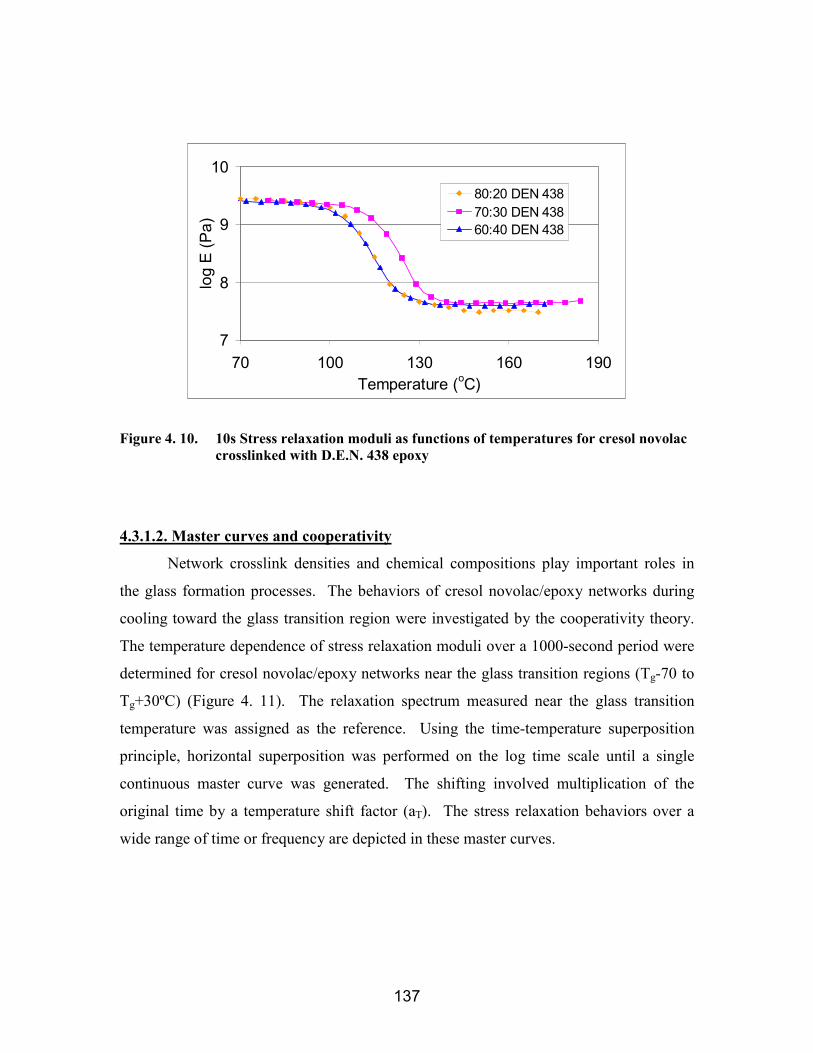
137
7
8
9
10
70 100 130 160 190Temperature (oC)
log
E (P
a)80:20 DEN 43870:30 DEN 43860:40 DEN 438
Figure 4. 10. 10s Stress relaxation moduli as functions of temperatures for cresol novolaccrosslinked with D.E.N. 438 epoxy
4.3.1.2. Master curves and cooperativity
Network crosslink densities and chemical compositions play important roles in
the glass formation processes. The behaviors of cresol novolac/epoxy networks during
cooling toward the glass transition region were investigated by the cooperativity theory.
The temperature dependence of stress relaxation moduli over a 1000-second period were
determined for cresol novolac/epoxy networks near the glass transition regions (Tg-70 to
Tg+30ºC) (Figure 4. 11). The relaxation spectrum measured near the glass transition
temperature was assigned as the reference. Using the time-temperature superposition
principle, horizontal superposition was performed on the log time scale until a single
continuous master curve was generated. The shifting involved multiplication of the
original time by a temperature shift factor (aT). The stress relaxation behaviors over a
wide range of time or frequency are depicted in these master curves.

138
Figure 4. 11. Master curve constructions for a typical cresol novolac/epoxy network: a)stress relaxation moduli of a cresol novolac/epoxy network measured fromTg-60°°°°C to Tg+40°°°°C at 5°°°°C intervals, and b) the master curve
7
8
9
0.7 1.2 1.7 2.2 2.7 3.2log Time (s)
log
E (P
a)
7
8
9
-8 -4 0 4 8log Time (s)
log
E (P
a)
reference
reference

139
The log of the shift factors were plotted against T-Tg (Figure 4. 12). Both the
master curve and the shift factor plot must be continuous and show a reasonable shape for
this approach to be valid.
-5
0
5
10
-50 -25 0 25 50T-Tg
log
a T
Figure 4. 12. The shift factor plot
The nature of segmental motions from glass to rubber transition was investigated
using cooperativity plots (or fragility plots), which are generated by plotting log aT versus
Tg/T (Figure 4. 13 and Figure 4. 14). Data were fitted to a 3rd degree polynomial curve.
The slope of the curve where Tg/T equals 1 is described as its fragility (m). As a material
is heated from its glassy state through the Tg into its rubbery region, the chains begin to
relax. Due to crowding, the relaxation of a single chain requires its neighboring chains to
relax simultaneously. The larger the volume of neighboring chains, the more cooperative
the material becomes. The fragility (m) therefore depends on the local friction
coefficient, inter- and intra-molecular hydrogen bonding, and when applicable, the
stiffness of the chain, the morphology, and low molecular weight additives.
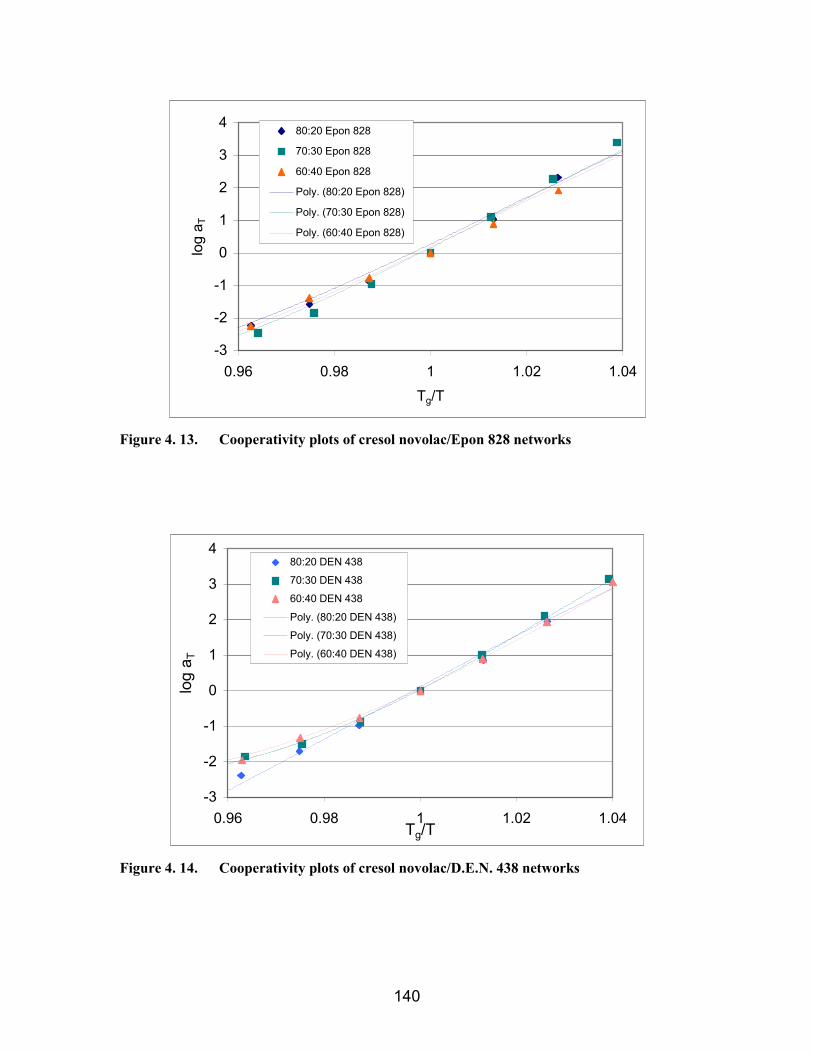
140
-3
-2
-1
0
1
2
3
4
0.96 0.98 1 1.02 1.04Tg/T
log
a T
80:20 Epon 828
70:30 Epon 828
60:40 Epon 828
Poly. (80:20 Epon 828)
Poly. (70:30 Epon 828)
Poly. (60:40 Epon 828)
Figure 4. 13. Cooperativity plots of cresol novolac/Epon 828 networks
-3
-2
-1
0
1
2
3
4
0.96 0.98 1 1.02 1.04Tg/T
log
a T
80:20 DEN 438
70:30 DEN 438
60:40 DEN 438
Poly. (80:20 DEN 438)
Poly. (70:30 DEN 438)
Poly. (60:40 DEN 438)
Figure 4. 14. Cooperativity plots of cresol novolac/D.E.N. 438 networks
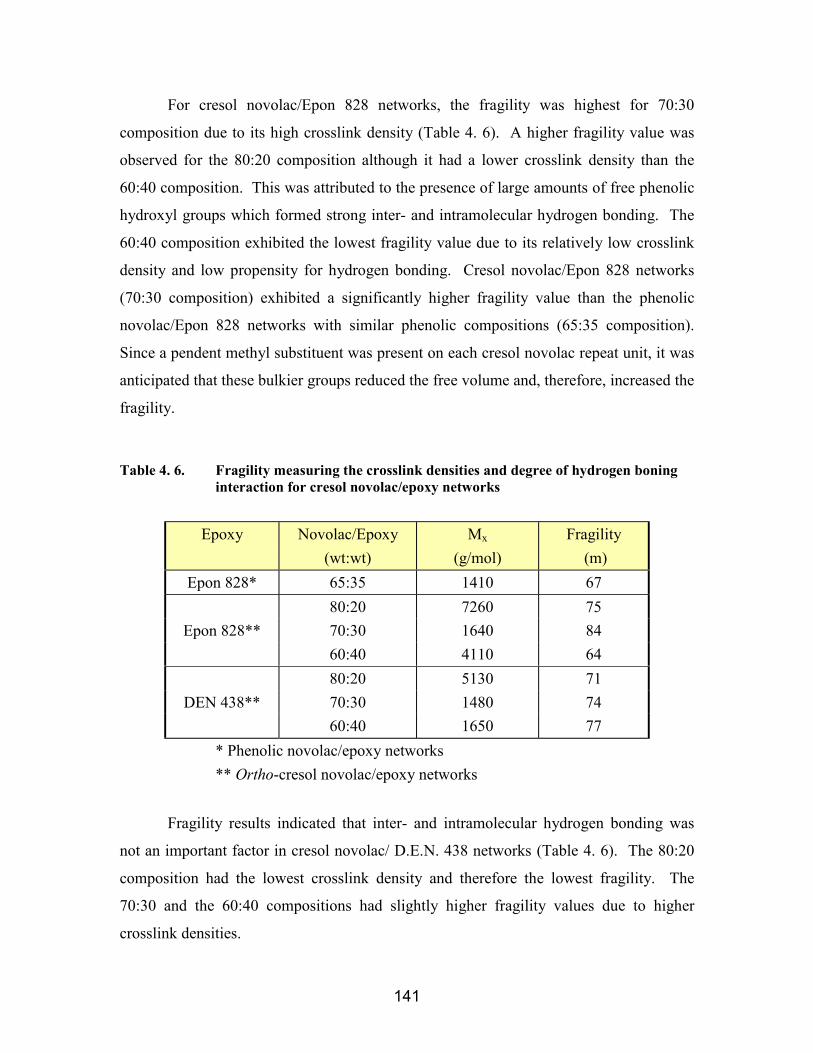
141
For cresol novolac/Epon 828 networks, the fragility was highest for 70:30
composition due to its high crosslink density (Table 4. 6). A higher fragility value was
observed for the 80:20 composition although it had a lower crosslink density than the
60:40 composition. This was attributed to the presence of large amounts of free phenolic
hydroxyl groups which formed strong inter- and intramolecular hydrogen bonding. The
60:40 composition exhibited the lowest fragility value due to its relatively low crosslink
density and low propensity for hydrogen bonding. Cresol novolac/Epon 828 networks
(70:30 composition) exhibited a significantly higher fragility value than the phenolic
novolac/Epon 828 networks with similar phenolic compositions (65:35 composition).
Since a pendent methyl substituent was present on each cresol novolac repeat unit, it was
anticipated that these bulkier groups reduced the free volume and, therefore, increased the
fragility.
Table 4. 6. Fragility measuring the crosslink densities and degree of hydrogen boninginteraction for cresol novolac/epoxy networks
Epoxy Novolac/Epoxy(wt:wt)
Mx
(g/mol)Fragility
(m)Epon 828* 65:35 1410 67
80:20 7260 75Epon 828** 70:30 1640 84
60:40 4110 6480:20 5130 71
DEN 438** 70:30 1480 7460:40 1650 77
* Phenolic novolac/epoxy networks** Ortho-cresol novolac/epoxy networks
Fragility results indicated that inter- and intramolecular hydrogen bonding was
not an important factor in cresol novolac/ D.E.N. 438 networks (Table 4. 6). The 80:20
composition had the lowest crosslink density and therefore the lowest fragility. The
70:30 and the 60:40 compositions had slightly higher fragility values due to higher
crosslink densities.
142
4.3.1.3. Thermal and thermo-oxidative stability
The thermal and thermo-oxidative stabilities of cresol novolac networks were
investigated using a thermogravimetric analyzer; the weight loss profiles were recorded
as functions of temperature. Samples analyzed in air measured thermo-oxidative stability
(Figure 4. 15a). All cresol novolac/Epon 828 epoxy networks were stable up to 400°C,
above which the materials began to degrade. A two-step degradation was observed for
all samples and the weight loss profiles were similar for all compositions. The 80:20
composition showed a slightly higher thermo-oxidative stability than the 70:30 and the
60:40 compositions. The networks completely degraded at approximately 630°C in air as
the weight loss approached 100 percent.
The thermal stabilities were investigated by examining the same samples under
nitrogen (Figure 4. 15b). The weight loss began at a lower temperature in nitrogen than
in air. The weight loss occurred mainly between 400°C and 500°C where the weight
dropped from greater than 90% to ~ 35%. The 80:20 composition again showed only
slightly higher heat resistance and had a slightly higher char yield at 900°C. Cresol
novolac/D.E.N. 438 networks showed almost identical results as the cresol novolac/Epon
828 networks. Approximately 20 to 30 weight percent char remained for all cresol
novolac networks examined in nitrogen.
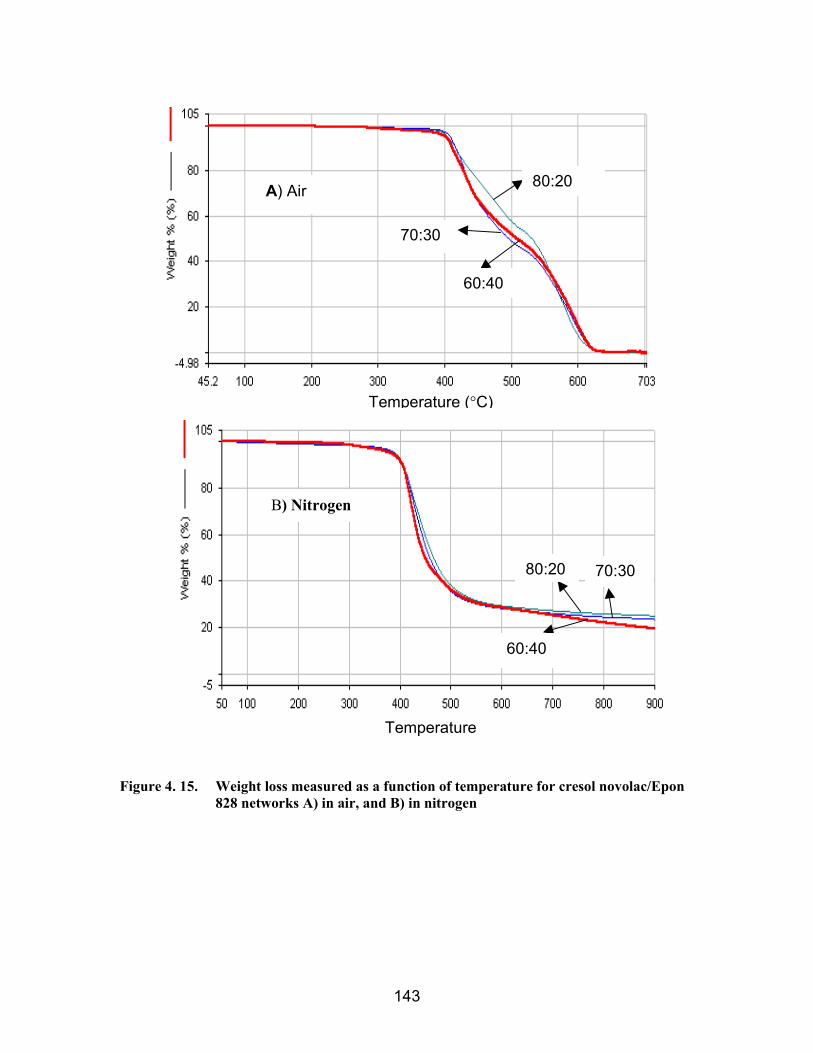
143
Figure 4. 15. Weight loss measured as a function of temperature for cresol novolac/Epon828 networks A) in air, and B) in nitrogen
Temperature (°C)
A) Air
B) Nitrogen
60:40
80:20 70:30
80:20
70:30
60:40
Temperature
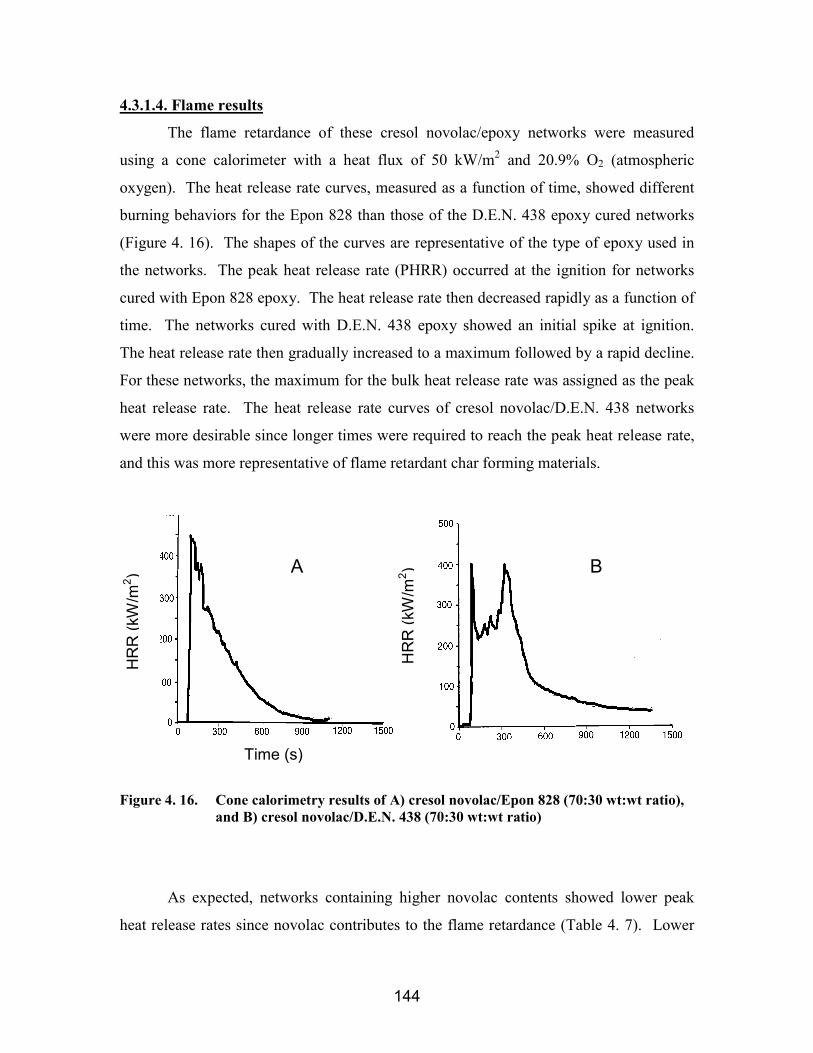
144
4.3.1.4. Flame results
The flame retardance of these cresol novolac/epoxy networks were measured
using a cone calorimeter with a heat flux of 50 kW/m2 and 20.9% O2 (atmospheric
oxygen). The heat release rate curves, measured as a function of time, showed different
burning behaviors for the Epon 828 than those of the D.E.N. 438 epoxy cured networks
(Figure 4. 16). The shapes of the curves are representative of the type of epoxy used in
the networks. The peak heat release rate (PHRR) occurred at the ignition for networks
cured with Epon 828 epoxy. The heat release rate then decreased rapidly as a function of
time. The networks cured with D.E.N. 438 epoxy showed an initial spike at ignition.
The heat release rate then gradually increased to a maximum followed by a rapid decline.
For these networks, the maximum for the bulk heat release rate was assigned as the peak
heat release rate. The heat release rate curves of cresol novolac/D.E.N. 438 networks
were more desirable since longer times were required to reach the peak heat release rate,
and this was more representative of flame retardant char forming materials.
Figure 4. 16. Cone calorimetry results of A) cresol novolac/Epon 828 (70:30 wt:wt ratio),and B) cresol novolac/D.E.N. 438 (70:30 wt:wt ratio)
As expected, networks containing higher novolac contents showed lower peak
heat release rates since novolac contributes to the flame retardance (Table 4. 7). Lower
HR
R (k
W/m
2 )
HR
R (k
W/m
2 )
Time (s)
A B
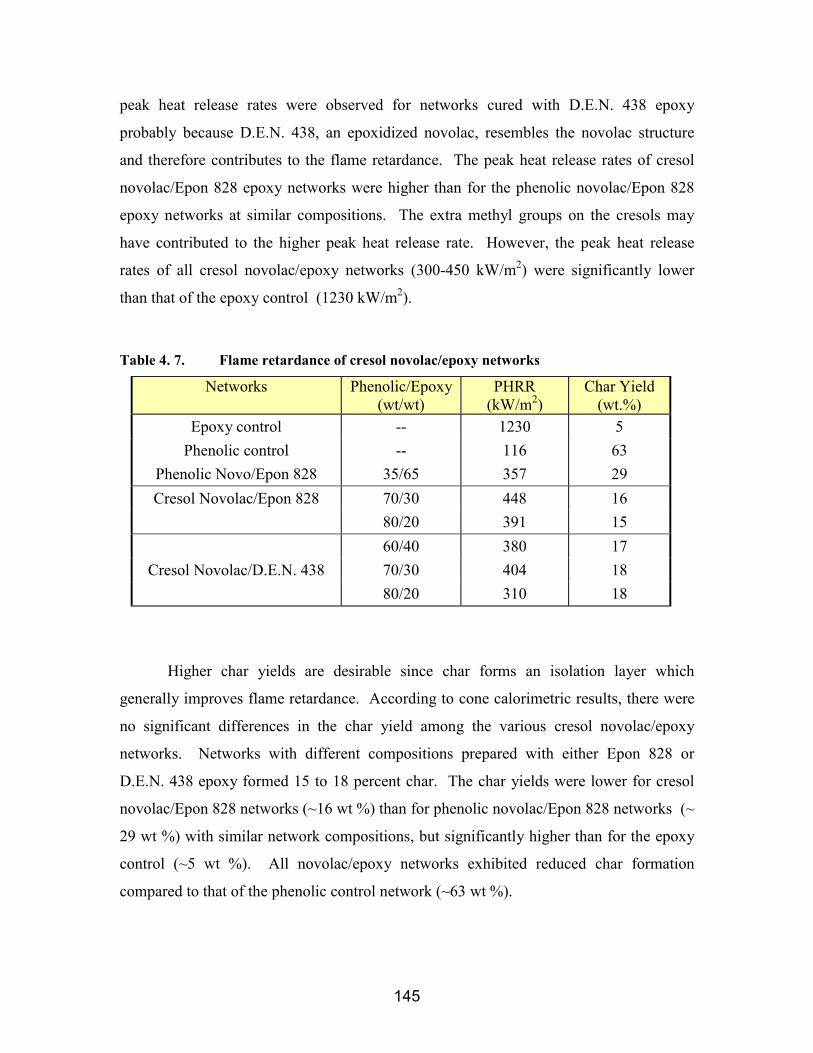
145
peak heat release rates were observed for networks cured with D.E.N. 438 epoxy
probably because D.E.N. 438, an epoxidized novolac, resembles the novolac structure
and therefore contributes to the flame retardance. The peak heat release rates of cresol
novolac/Epon 828 epoxy networks were higher than for the phenolic novolac/Epon 828
epoxy networks at similar compositions. The extra methyl groups on the cresols may
have contributed to the higher peak heat release rate. However, the peak heat release
rates of all cresol novolac/epoxy networks (300-450 kW/m2) were significantly lower
than that of the epoxy control (1230 kW/m2).
Table 4. 7. Flame retardance of cresol novolac/epoxy networks
Networks Phenolic/Epoxy(wt/wt)
PHRR(kW/m2)
Char Yield(wt.%)
Epoxy control -- 1230 5Phenolic control -- 116 63
Phenolic Novo/Epon 828 35/65 357 2970/30 448 16Cresol Novolac/Epon 82880/20 391 1560/40 380 1770/30 404 18Cresol Novolac/D.E.N. 43880/20 310 18
Higher char yields are desirable since char forms an isolation layer which
generally improves flame retardance. According to cone calorimetric results, there were
no significant differences in the char yield among the various cresol novolac/epoxy
networks. Networks with different compositions prepared with either Epon 828 or
D.E.N. 438 epoxy formed 15 to 18 percent char. The char yields were lower for cresol
novolac/Epon 828 networks (~16 wt %) than for phenolic novolac/Epon 828 networks (~
29 wt %) with similar network compositions, but significantly higher than for the epoxy
control (~5 wt %). All novolac/epoxy networks exhibited reduced char formation
compared to that of the phenolic control network (~63 wt %).

146
4.3.1.5. Water absorption and diffusion efficient
Water has a Tg of –130°C. Polymers that absorb water are also plasticized by
water. Therefore, water generally has a negative effect on the Tg’s of polymers and
reduces the upper temperature limit for the polymers’ applications. Typical phenolic
materials are fairly hydrophilic because each phenolic repeat unit contains a free
hydroxyl group. By adding a hydrocarbon substituent, such as a methyl group, in close
proximity of the hydroxyl groups, such as in the case of cresol novolac, the polymer
chains should become less polar and absorb less water.
Equilibrium moisture uptake was studied at both room temperature and 62°C for a
series of cresol novolac/epoxy networks. The 62°C water uptake test was designed as an
accelerated protocol, but these networks also absorb more water at higher temperatures.
Three samples of each specimen were measured at room temperature and the results were
extremely reproducible (Figure 4. 17).
00.5
11.5
22.5
3
0 20 40 60
t1/2/thickness
% w
t
sample 1sample 2sample 3
Figure 4. 17. Room temperature weight percent water uptake for cresol novolac/Epon828 networks (70:30 wt:wt ratio)
The water absorption levels for cresol novolac/epoxy networks were relatively
unaffected by the structures of the epoxies (Figure 4. 18). The 80:20 cresol
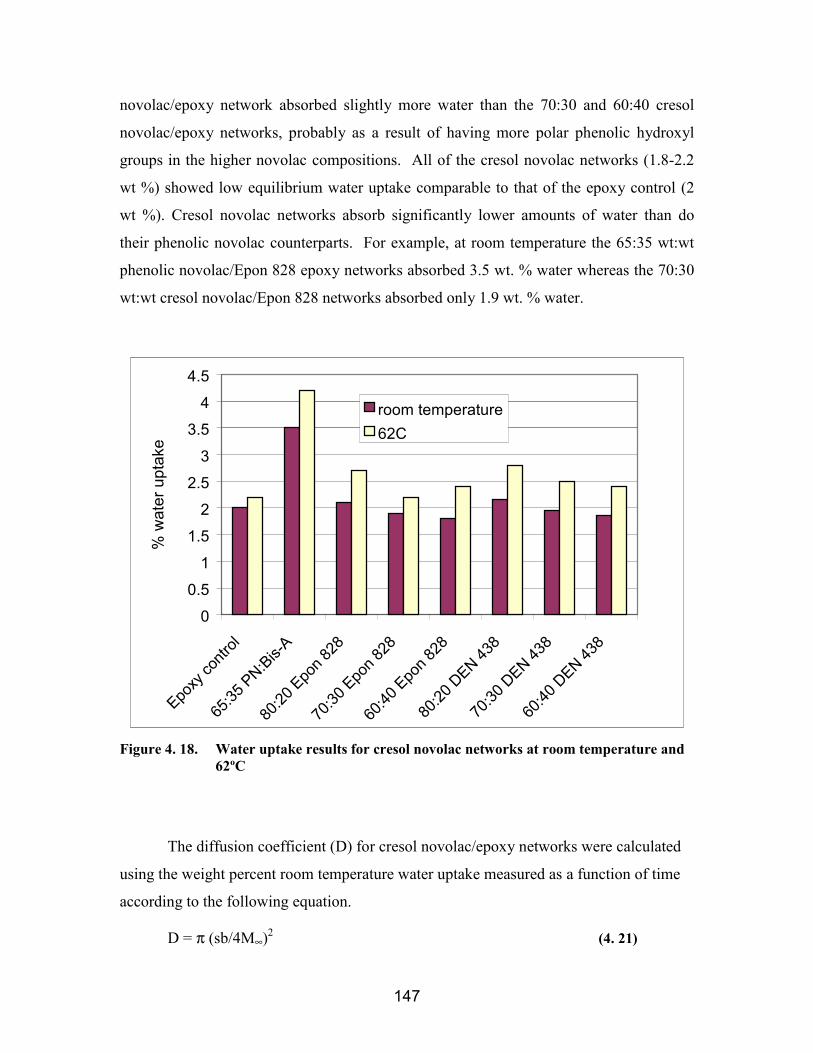
147
novolac/epoxy network absorbed slightly more water than the 70:30 and 60:40 cresol
novolac/epoxy networks, probably as a result of having more polar phenolic hydroxyl
groups in the higher novolac compositions. All of the cresol novolac networks (1.8-2.2
wt %) showed low equilibrium water uptake comparable to that of the epoxy control (2
wt %). Cresol novolac networks absorb significantly lower amounts of water than do
their phenolic novolac counterparts. For example, at room temperature the 65:35 wt:wt
phenolic novolac/Epon 828 epoxy networks absorbed 3.5 wt. % water whereas the 70:30
wt:wt cresol novolac/Epon 828 networks absorbed only 1.9 wt. % water.
0
0.5
1
1.5
2
2.5
3
3.5
4
4.5
Epoxy
contr
ol
65:35
PN:Bis-A
80:20
Epon 8
28
70:30
Epon 8
28
60:40
Epon 8
28
80:20
DEN 43
8
70:30
DEN 43
8
60:40
DEN 43
8
% w
ater
upt
ake
room temperature62C
Figure 4. 18. Water uptake results for cresol novolac networks at room temperature and62ºC
The diffusion coefficient (D) for cresol novolac/epoxy networks were calculated
using the weight percent room temperature water uptake measured as a function of time
according to the following equation.
D = π (sb/4M∞)2 (4. 21)
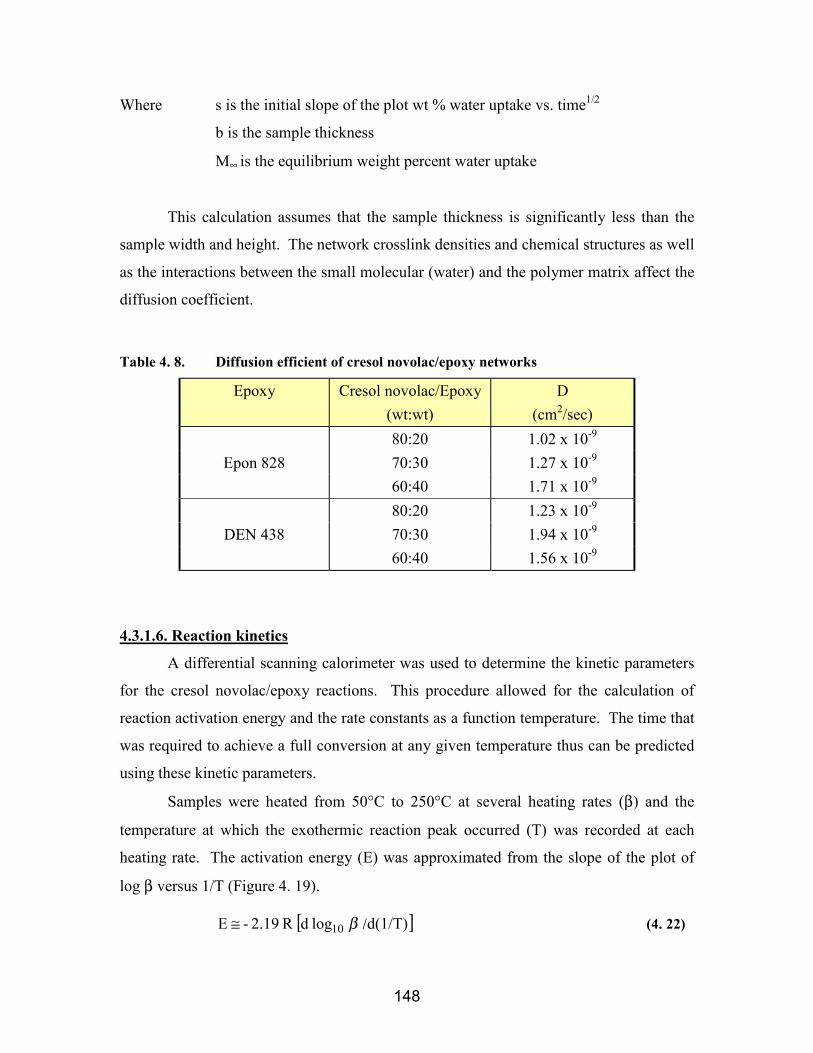
148
Where s is the initial slope of the plot wt % water uptake vs. time1/2
b is the sample thickness
M∞ is the equilibrium weight percent water uptake
This calculation assumes that the sample thickness is significantly less than the
sample width and height. The network crosslink densities and chemical structures as well
as the interactions between the small molecular (water) and the polymer matrix affect the
diffusion coefficient.
Table 4. 8. Diffusion efficient of cresol novolac/epoxy networks
Epoxy Cresol novolac/Epoxy(wt:wt)
D(cm2/sec)
80:20 1.02 x 10⁻⁹
Epon 828 70:30 1.27 x 10⁻⁹
60:40 1.71 x 10⁻⁹
80:20 1.23 x 10⁻⁹
DEN 438 70:30 1.94 x 10⁻⁹
60:40 1.56 x 10⁻⁹
4.3.1.6. Reaction kinetics
A differential scanning calorimeter was used to determine the kinetic parameters
for the cresol novolac/epoxy reactions. This procedure allowed for the calculation of
reaction activation energy and the rate constants as a function temperature. The time that
was required to achieve a full conversion at any given temperature thus can be predicted
using these kinetic parameters.
Samples were heated from 50°C to 250°C at several heating rates (β) and the
temperature at which the exothermic reaction peak occurred (T) was recorded at each
heating rate. The activation energy (E) was approximated from the slope of the plot of
log β versus 1/T (Figure 4. 19).
[ ]d(1/T) log d R 2.19- E 10 /≅ β (4. 22)

149
where R is the gas constant (8.3145 J K-1 mol-1).
Figure 4. 19. Log heating rate versus 1/T for cresol novolac/epoxy mixture (70:30 wt:wtratio) with 1 mole % TPP catalyst
The activation energy was refined according to the procedures described in
ASTM E 698 until self-consistent. For cresol novolac/epoxy reactions, the activation
energy was found to be ~69 KJ/mol, which is comparable to those cited in literature for
epoxy ring opening reactions.
The Arrhenius pre-exponential factor (Z) was calculated as follows
2
(E/RT)
RTe E = βZ (4. 23)
where β is a heating rate (taken from the middle of the range tested) and T is the
temperature (K) in the middle of the range.
The kinetic rate constant, k, was calculated using the activation energy of the
reaction and the pre-exponential factor
−=
RTE exp Z k (4. 24)
y = -4084.7x + 9.9934R2 = 0.9993
0.5
0.8
1.1
1.4
0.0021 0.00215 0.0022 0.00225 0.00231/T (K-1)
log
β

150
The rate constant was plotted as a function of temperature (Figure 4. 20). As expected,
the rate constant increased with increased temperatures.
Figure 4. 20. Rate constant (k) versus temperature for a cresol novolac/epoxy mixture(70:30 wt:wt ratio) with 1 mole % TPP catalyst
To confirm the rate constant by an isothermal test, a time (t) was calculated to treat
the sample at a chosen temperature (150°C) to achieve 50 % cure,
t1/2 = 0.693/k (4. 25)
The aged sample and an unaged sample were run in a dynamic scan and compared
(Figure 4. 21). The reaction kinetics was confirmed if on an equal weight basis, the peak
area or displacement from baselines of the aged sample is approximately one half of that
of the unaged sample.
0
0.01
0.02
0.03
0.04
90 120 150 180 210Temperature (oC)
k (1
/sec
) k= Ze-E/RT
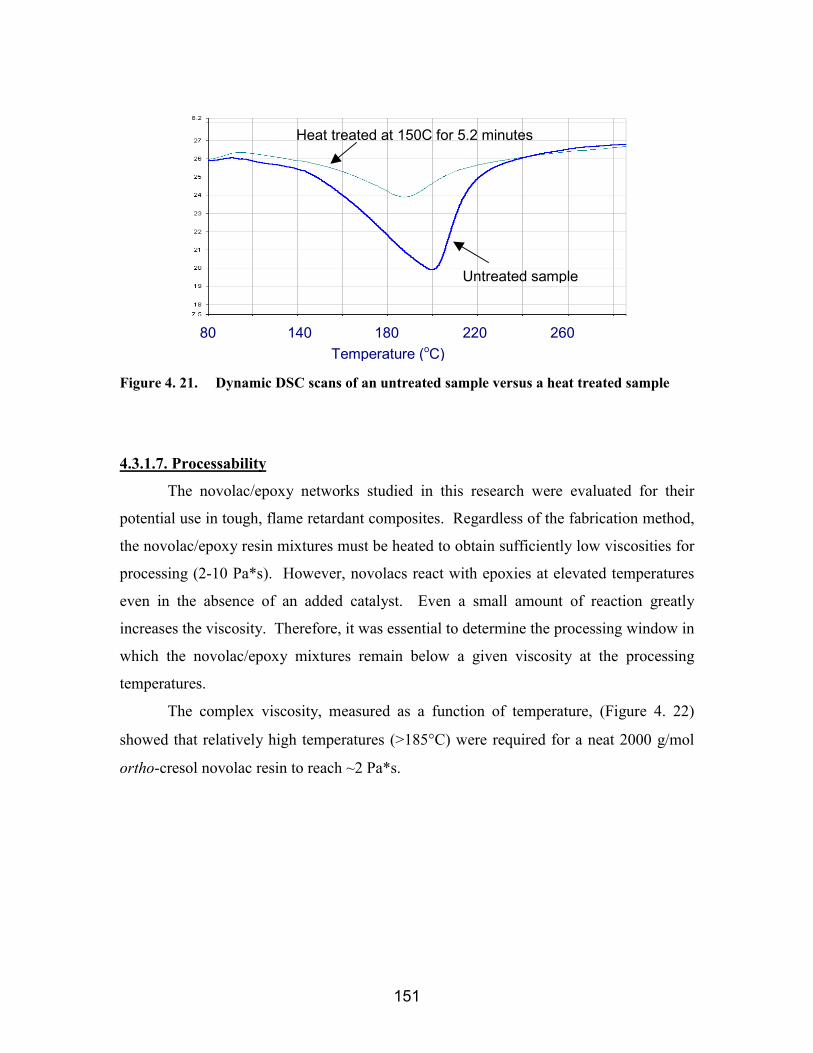
151
Figure 4. 21. Dynamic DSC scans of an untreated sample versus a heat treated sample
4.3.1.7. Processability
The novolac/epoxy networks studied in this research were evaluated for their
potential use in tough, flame retardant composites. Regardless of the fabrication method,
the novolac/epoxy resin mixtures must be heated to obtain sufficiently low viscosities for
processing (2-10 Pa*s). However, novolacs react with epoxies at elevated temperatures
even in the absence of an added catalyst. Even a small amount of reaction greatly
increases the viscosity. Therefore, it was essential to determine the processing window in
which the novolac/epoxy mixtures remain below a given viscosity at the processing
temperatures.
The complex viscosity, measured as a function of temperature, (Figure 4. 22)
showed that relatively high temperatures (>185°C) were required for a neat 2000 g/mol
ortho-cresol novolac resin to reach ~2 Pa*s.
80 140 180 220 260 Temperature (oC)
Heat treated at 150C for 5.2 minutes
Untreated sample
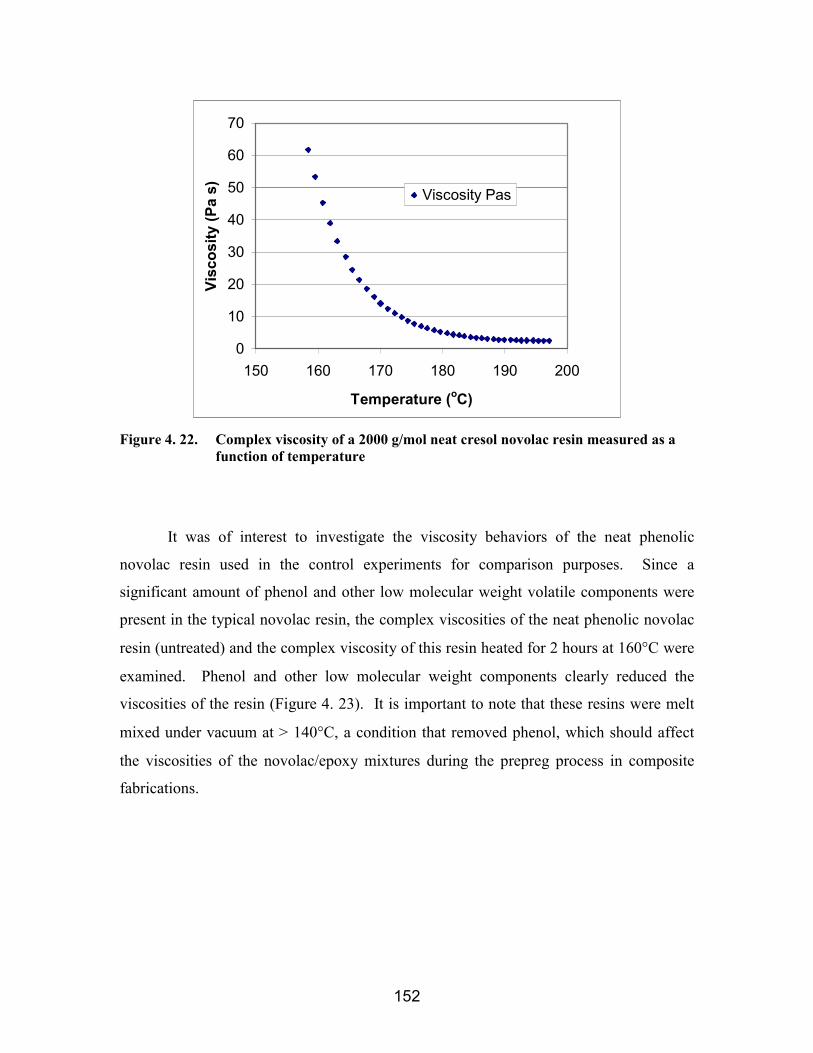
152
0
10
20
30
40
50
60
70
150 160 170 180 190 200
Temperature (oC)
Visc
osity
(Pa
s) Viscosity Pas
Figure 4. 22. Complex viscosity of a 2000 g/mol neat cresol novolac resin measured as afunction of temperature
It was of interest to investigate the viscosity behaviors of the neat phenolic
novolac resin used in the control experiments for comparison purposes. Since a
significant amount of phenol and other low molecular weight volatile components were
present in the typical novolac resin, the complex viscosities of the neat phenolic novolac
resin (untreated) and the complex viscosity of this resin heated for 2 hours at 160°C were
examined. Phenol and other low molecular weight components clearly reduced the
viscosities of the resin (Figure 4. 23). It is important to note that these resins were melt
mixed under vacuum at > 140°C, a condition that removed phenol, which should affect
the viscosities of the novolac/epoxy mixtures during the prepreg process in composite
fabrications.

153
0
30
60
90
120
150
120 140 160 180
Temperature (oC)
Visc
osity
(Pa
s) Before
After
Figure 4. 23. Complex viscosity of a phenolic novolac resin before and after heattreatment (2 hours at 160°°°°C)
Dynamic viscosity measurements for cresol novolac/Epon 828 mixtures showed
that increased epoxy content reduced the melt viscosities (Figure 4. 24 a), and therefore,
the processability was enhanced as the amount of low molecular weight epoxy increased.
From dynamic viscosity measurements, the temperature at which the viscosity reached
approximately 2 Pa*s was chosen as the processing temperature. Higher processing
temperatures were necessary for compositions with lower amounts of epoxies. The
isothermal viscosities were then evaluated at the processing temperatures of each
composition to determine the processing windows (Figure 4. 24 b and c). The 70:30 and
60:40 compositions both exhibited great stabilities at their processing temperatures
(140°C and 120°C respectively) with very little viscosity increase over 150 minutes.

154
A
0
2
4
6
8
10
110 120 130 140 150 160 170 180
Temperature (oC)
Visc
osity
(Pa
s)
80:2070:3060:40
B
0
2
4
6
8
10
0 20 40 60 80 100 120
Time (min)
Visc
osity
(Pa
s)
C
0
2
4
6
8
10
0 30 60 90 120 150Time (min)
Visc
osity
(Pa
s)
Figure 4. 24. Viscosity measurements of cresol novolac/Epon 828 mixtures A) dynamicscans for various compositions, B) isothermal scan of the 70:30 compositionat 145°°°°C, and C) isothermal scan of the 60:40 composition at 120°°°°C

155
Isothermal viscosities were measured for the 65:35 wt:wt phenolic novolac/Epon
828 mixture (140°C) and compared with those of the 70:30 cresol novolac/Epon 828
mixture (145°C) (Figure 4. 25). The cresol novolac/epoxy mixture showed only a slight
viscosity increase (from 2.5 to 3 Pa*s) over a 2-hour period, whereas the viscosity of the
phenolic novolac/epoxy mixture increased substantially over the same period (3 to 12
Pa*s). Thus, the processing window for the cresol novolac/epoxy mixtures is
significantly more desirable than for the phenolic novolac/epoxy mixtures. This increase
in the processing window was attributed to the lower reactivity of the cresol novolac with
epoxy groups. The methyl group ortho to the hydroxyl group probably caused extra
steric hindrance to the phenolic hydroxyl/epoxy reactions.
A
0
5
10
15
0 30 60 90 120Time (min)
Visc
osity
(Pa
s)
B
0
5
10
15
0 30 60 90 120Time (min)
Visc
osity
(Pa
s)
Figure 4. 25. Isothermal viscosity measurements: A) 65:35 wt:wt phenolic novolac/Epon828 mixture measured at 140°°°°C, and B) 70:30 wt:wt cresol novolac/Epon828 mixture measured at 145°°°°C
D.E.N. 438 epoxy was not as effective as Epon 828 epoxy in reducing the melt
viscosities of cresol novolac/epoxy mixtures (Figure 4. 26A). At the same compositions,
higher temperatures were needed to obtain similar viscosities when D.E.N. 438 epoxy
was used. All cresol novolac/D.E.N. 438 mixtures required at least 160°C to reach the
processable viscosities. At these temperatures, the inherent reaction between cresol
novolac and epoxies became apparent as the viscosities increased from approximately 1.5
Pa*s to approximately 3 Pa*s over 100 minutes (Figure 4. 26B).

156
A
0
2
4
6
8
10
130 140 150 160 170 180 190
Temperature (oC)
Visc
osity
(Pa
s)
80:2070:3060:40
B
0
2
4
6
8
10
0 20 40 60 80 100
Time (min)
Visc
osity
(Pa
s)
Figure 4. 26. Viscosity measurements for cresol novolac/D.E.N. 438 mixtures: A) dynamicmeasurements, B) isothermal scan for the 60:40 composition at 160°°°°C
4.3.2. Composites propertiesFlexural properties were examined for cresol novolac/Epon 828 composites. The
70:30 composition was chosen since it had the best overall properties, i.e. high KIC and
Tg, low sol fractions, good flame retardance, and excellent processability. The
composites were reinforced with phenoxy-sized carbon fiber. No catalysts were used for
the cresol novolac/epoxy cure reaction. To determine the cure conditions necessary to
achieve a cured network, the glass transition temperature was measured as a function of
cure time (Table 4. 9). The cresol novolac/epoxy reaction processed very slowly, even at

157
220°C, in the absence of a catalyst. A sample cured at 220°C for over 10 hours had a Tg
that was significantly lower than that of a fully cured (TPP catalyzed) network.
Table 4. 9. Cure condition determination for ortho-cresol novolac/Epon 828 network(70:30 wt:wt %), no catalyst
sample Cure conditions Tg (°C)1 1 hr @ 180°C, 4 hrs @ 220°C Soluble2 1 hr @ 180°C, 6.5 hrs @ 220°C Partially soluble3 1 hr @ 180°C, 8.5 hrs @ 220°C 1204 1 hr @ 180°C, 10.5 hrs @ 220°C 1355 TPP cured sample* 154
* cured using 0.1 mole % TPP at 200°C for 2 hours and 220°C for 2 hours
Composite properties were evaluated for the cresol novolac/Epon 828 networks
cured under condition 4, i.e. the network was not fully cured. The flexural properties
were superior to those of the control epoxy, but they were not as high as the fully cured
phenolic novolac/Epon 828 composites (Table 4. 10). The properties of composites with
fully cured cresol novolac/epoxy matrix resin should exhibit comparable to those
properties of the phenolic novolac/epoxy based composites.
Table 4. 10. Flexural strength and moduli of composites
Sample σmax
(MPa)Eb
(GPa)Control epoxy 29 8.9
Phenolic novolac/Epon 828 (65:35) 66 11.3Cresol novolac/Epon 828 (70:30) 46 10.1
4.3.3. Para-cresol based networks and their propertiesThe networks prepared using a 2000 g/mol para-cresol novolac and their
properties were somewhat explored (Figure 4. 27).

158
O O O
OH
OOO
n
Crosslinked Network
Triphenylphosphine
n
CH2 OHCH2HO
OH
CH3+
Figure 4. 27. 2000 g/mol para-cresol novolac cured with Epon 828
The viscosity profile of a neat 2000 g/mol para-cresol novolac resin showed an
unexpected increase at higher temperatures (>175°C) (Figure 4. 28). Para-cresol novolac
oligomers are highly stereo-regular, and therefore may form ordered structures at higher
temperatures. In sample preparations, high temperatures were required to obtain low
viscosities for proper degassing; however, increasing the temperature to ~ 170°C
increased the viscosity when para-cresol novolac resin was used. Therefore, sample
preparations for these para-cresol novolac/epoxy networks became more challenging
especially at high novolac compositions (80:20 wt:wt ratio). The 70:30 and 60:40
compositions were successfully prepared.
Figure 4. 28. Viscosity of a 2000g/mol para-cresol novolac resin (heat rate = 2.5°°°°C /min)
10152025303540
160 180 200Temperature (oC)
Visc
osity
(Pa
s)
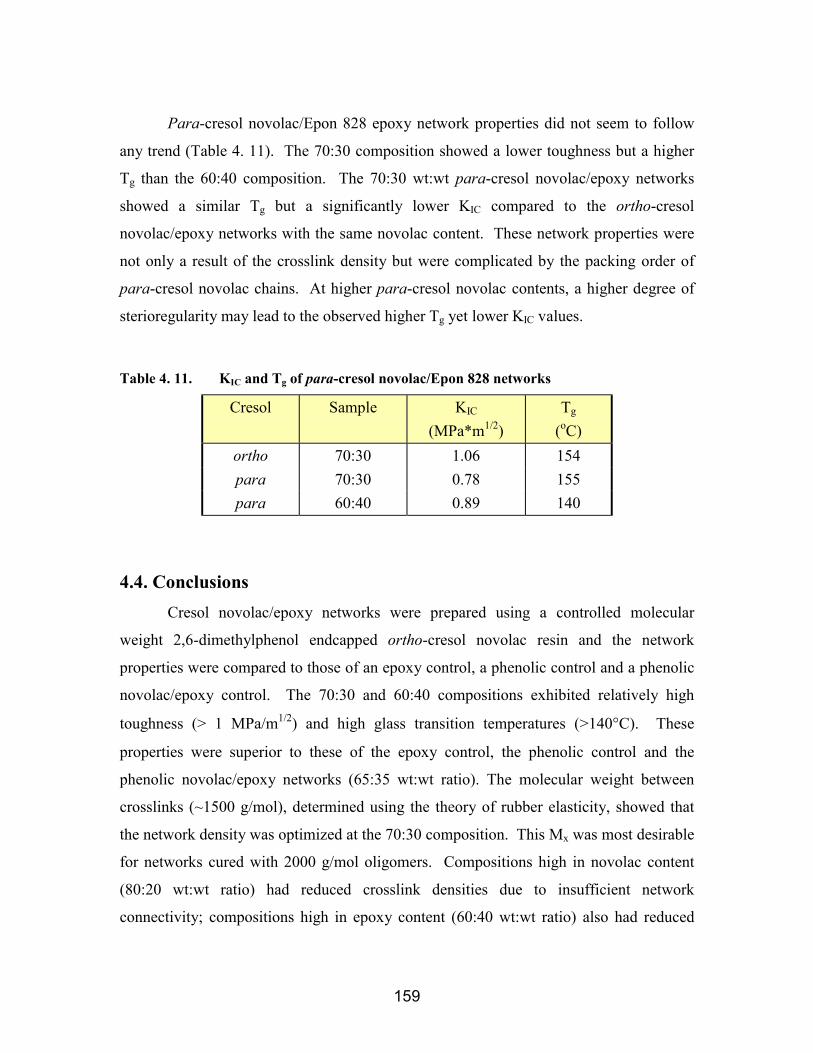
159
Para-cresol novolac/Epon 828 epoxy network properties did not seem to follow
any trend (Table 4. 11). The 70:30 composition showed a lower toughness but a higher
Tg than the 60:40 composition. The 70:30 wt:wt para-cresol novolac/epoxy networks
showed a similar Tg but a significantly lower KIC compared to the ortho-cresol
novolac/epoxy networks with the same novolac content. These network properties were
not only a result of the crosslink density but were complicated by the packing order of
para-cresol novolac chains. At higher para-cresol novolac contents, a higher degree of
sterioregularity may lead to the observed higher Tg yet lower KIC values.
Table 4. 11. KIC and Tg of para-cresol novolac/Epon 828 networks
Cresol Sample KIC
(MPa*m1/2)Tg
(oC)ortho 70:30 1.06 154para 70:30 0.78 155para 60:40 0.89 140
4.4. ConclusionsCresol novolac/epoxy networks were prepared using a controlled molecular
weight 2,6-dimethylphenol endcapped ortho-cresol novolac resin and the network
properties were compared to those of an epoxy control, a phenolic control and a phenolic
novolac/epoxy control. The 70:30 and 60:40 compositions exhibited relatively high
toughness (> 1 MPa/m1/2) and high glass transition temperatures (>140°C). These
properties were superior to these of the epoxy control, the phenolic control and the
phenolic novolac/epoxy networks (65:35 wt:wt ratio). The molecular weight between
crosslinks (~1500 g/mol), determined using the theory of rubber elasticity, showed that
the network density was optimized at the 70:30 composition. This Mx was most desirable
for networks cured with 2000 g/mol oligomers. Compositions high in novolac content
(80:20 wt:wt ratio) had reduced crosslink densities due to insufficient network
connectivity; compositions high in epoxy content (60:40 wt:wt ratio) also had reduced
160
apparent crosslink densities because a lack of mobility prohibited further phenolic/epoxy
reactions, which led to increased epoxy sol fractions.
Master curves and cooperativity plots were generated for cresol novolac/epoxy
networks. The fragility was used to investigate the temperature dependence of segmental
relaxation through the transition region. Both crosslink density and hydrogen bonding
affected the properties of Epon 828 epoxy cured cresol novolac networks. Crosslink
density seemed to be the dominating factor in the D.E.N. 438 epoxy cured cresol novolac
networks.
Cresol novolac/epoxy networks exhibited comparable, relatively low, equilibrium
water absorptions similar to that of the epoxy control (~ 2 wt % at room temperature).
Their equilibrium water uptake were relatively unaffected by the network compositions.
The methyl group on each novolac repeat unit probably reduced water absorption.
The peak heat release rates of ortho-cresol novolac/epoxy networks were between
300-450 kW/m2. The presence of a methyl group on each repeat unit slightly increased
the peak heat release rates and reduced the char yields of cresol novolac networks relative
to those of phenol novolac networks. The flame retardance of all the novolac/epoxy
networks were significantly superior to that of the epoxy control, but inferior to that of
the phenolic control.
The kinetic parameters were determined for the cresol novolac/epoxy reactions.
The activation energy for these reactions was approximately 69 KJ/mol, which was
comparable to the literature values for phenolic hydroxyl/epoxy ring opening reactions.
The kinetic parameters allowed for prediction of the cure time required to achieve 99%
conversion.
Cresol novolac resins gave rise to longer processing window times when mixed
with epoxies at elevated temperatures. This was again attributed to the methyl group in
close proximity to the hydroxyl group which sterically hindered the phenolic
hydroxyl/epoxy reaction.
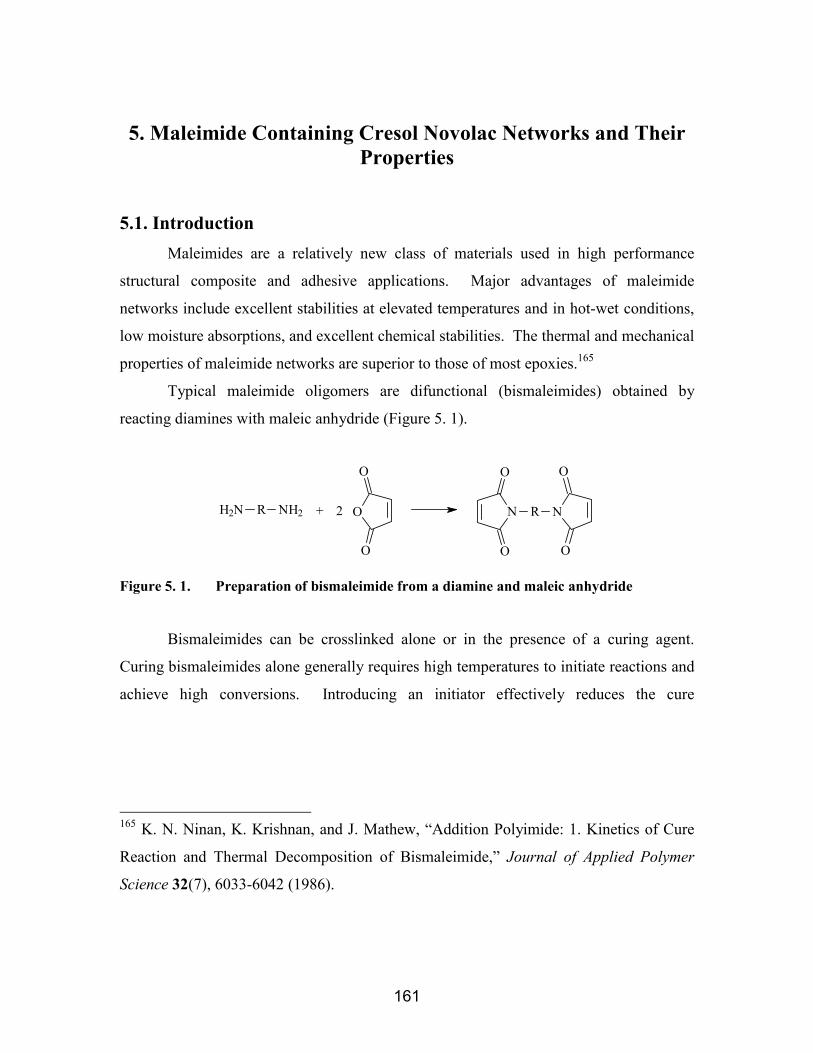
161
5. Maleimide Containing Cresol Novolac Networks and TheirProperties
5.1. IntroductionMaleimides are a relatively new class of materials used in high performance
structural composite and adhesive applications. Major advantages of maleimide
networks include excellent stabilities at elevated temperatures and in hot-wet conditions,
low moisture absorptions, and excellent chemical stabilities. The thermal and mechanical
properties of maleimide networks are superior to those of most epoxies.165
Typical maleimide oligomers are difunctional (bismaleimides) obtained by
reacting diamines with maleic anhydride (Figure 5. 1).
NN R
O O
OO
+ O
O
O
H2N R NH2 2
Figure 5. 1. Preparation of bismaleimide from a diamine and maleic anhydride
Bismaleimides can be crosslinked alone or in the presence of a curing agent.
Curing bismaleimides alone generally requires high temperatures to initiate reactions and
achieve high conversions. Introducing an initiator effectively reduces the cure
165 K. N. Ninan, K. Krishnan, and J. Mathew, “Addition Polyimide: 1. Kinetics of Cure
Reaction and Thermal Decomposition of Bismaleimide,” Journal of Applied Polymer
Science 32(7), 6033-6042 (1986).
162
temperatures. Adding peroxide initiators166 results in free-radical initiations while adding
tertiary amines or imidazole167 leads to anionic initiations.
The thermal cure of bismaleimides such as 4,4’-bismaleimidodiphenylmethane in
the absence of initiator was suggested to proceed via a free radical process.168 This was
supported by the increased activation energies observed in the presence of a small
amount of impurities, which was proposed to interfere with the free radical reaction.
Thermally initiated polymerization of maleimide was also suggested to occur in a
heterogeneous manner.169 Gelation was reached rapidly in the form of microgels, which
were attributed to slow initiation rates but fast propagation rates. Macrogelation occurred
much later in the reactions.
Anionically initiated maleimide polymerizations proceeded via a more
homogeneous mechanism.169 Both initiation and propagation occurred more rapidly. As
expected, maleimide polymerization rates decreased significantly after vitrification due to
slow diffusion.
Bismaleimides have been cured with amines to increase the toughness by
reducing the network crosslink densities. Curing bismaleimides with diamines involves
both a lower temperature primary amine addition to maleimide double bonds (Figure 5.
2a) and a higher temperature homopolymerization of maleimide double bonds (Figure 5.
166 M. Acevedo, J. de Abajo, and J. G. de la Campa, “Kinetic Study of the Cross-linking
Reaction of Flexible Bismaleimide,” Polymer 31, 1955, (1990).167 H. D. Stenzenberger, M. Herzog, W. Romer, R. Scherblich, S. Pierce, and M.
Canning, “Compimides: A Family of High Performance Bismaleimide Resins,” 30th Nat.
SAMPL Symp. 30, 1568-1586 (1985).168 I. M. Brown and T. C. Sandreczki, “Crosslinking Reactions in Maleimide and
Bis(maleimide) Polymers-an ESR Study,” Macromolecules 23(1), 94-100, (1990).169 A. Seris, M. Feve, F. Mechin, and J. P. Pascault, “Thermally and Anionically Initiated
Cure of Bismaleimide Monomers,” Journal of Applied Polymer Science 48, 257-269
(1993).

163
2b).170 The cure reaction of 1,1-(methylenedi-4,1-phenylene) bismaleimide and 4,4’-
methylenedianiline, monitored by FTIR and DSC, showed that the nucleophilic addition
of amine to the maleimide double bond, which resulted in extension of network chains,
occurred via a second-order reaction. The homopolymerization, which led to
crosslinking, proceeded at a rate at least two orders of magnitude lower than did the
amine addition. The homopolymerization involved thermal initiations and chain
propagations. Lower cure temperatures or increased diamine contents therefore favored
the chain extension reactions over the crosslinking reactions.171
B
A
N
O
O N
O
O
NNH
O
O
N
O
ONH2
+
N
O
O N
O
O
+
Figure 5. 2. Reactions of bismaleimide in the presence of a diamine: A) chain extensiondue to an amine addition, and B) crosslinking obtained by maleimidehomopolymerization reactions
According to DSC measurements, the temperature of exothermic transition due to
bismaleimide/amine reactions decreased as the basicity of the amines increased. It was
suggested that faster reactions could be achieved if more basic amines were used in the
170 A. V. Tungare and G. C. Martin, “Analysis of the Curing Behavior of Bismaleimide
Resins,” Journal of Applied Polymer Science 46, 1125-1135 (1992).171 T. M. Donnellan and D. Roylance, “Relationships in Bismaleimide Resin System. Part
I: Cure Mechanisms,” Polymer Engineering and Science 32(6), 409-414 (1992).

164
reactions. However, post-curing above 200°C was necessary for all maleimide/amine
reactions to achieve high conversions.172
The structures of maleimide and amine affect the network thermal stabilities and
flame retardance. For example, higher char yields were obtained for bismaleimides cured
with phosphorus based amines.172
Several mechanisms were proposed to be involved in the
bismaleimide/diallylbisphenol cure. They include 1) homopolymerization of maleimide
groups, 2) homopolymerization of allyl groups, 3) reactions between maleimide double
bonds and allyl groups via a Diels-Alder reaction, 4) reactions of maleimide with the allyl
component and/or another maleimide via a free radical site,173 and 5) crosslinking
reactions via dehydration of the allylbisphenol hydroxyl groups (self-condensation).174
Cure reaction of 4,4’-methylenebis-(maleimidobenzene) and 2,2’-diallylbisphenol A,
monitored using near-IR spectroscopy, showed that the principal reaction pathway
involved alternating copolymerization of maleimide and allyl double bonds.175
Maleimide homopolymerization was found to be significant only during the initial stage
of the reaction when heated above 200°C. The self-condensation reactions (pathway 5),
which released water as the by-product, were observed over the entire temperature range
investigated (140°C to 250°C).
172 I.K. Varma and D.S. Varma “Addition Polyimides. III. Thermal Behavior of
Bismaleimide,” Journal of Polymer Science: Polymer Chemistry Ed. 22, 1419-1483
(1984).173 I. M. Brown and T. C. Sandreczki, “Characterization of Bismaleimide Cure Reaction
by Electron-Spin Resonance Techniques,” Abstract Paper to American Chemical Society,
S, Polymer Material Science and Engineering-128, 169 (1988).174 R. J. Morgan, R. J. Jurek, A, Yen, and T Donnellan, “Toughening Procedures,
Processing and Performance of Bismaleimide Carbon Fiber Composites,” Polymer 34(4),
835-843 (1993)175 J. Mijovic and S. Andjelic “Study of the Mechanism and Rate of Bismaleimide Cure
by Remote in-situ Real Time Fiber Optic Near-Infrared Spectroscopy,” Macromolecules
29, 239-246 (1996).

165
Addition curable novolac resins containing maleimide functionalities were
prepared by co-reacting phenol and N-4-hydroxylphenylmaleimide with formaldehyde
(Figure 5. 3). The oligomers were thermally crosslinked or cured with epoxy resins for
structural adhesive applications.176 Network adhesion properties depended on the cure
conditions and the test temperatures. Self-cured networks had low lap shear strength and
low T-peel strength under ambient conditions, but these properties improved at higher
temperatures. The enhanced adhesion at higher temperatures was attributed to thermally
induced molecular relaxations in the tightly crosslinked networks. Maleimide-novolac
oligomers cured with epoxies showed improved adhesions and higher thermal stabilities
compared to novolac/epoxy networks without maleimide. Improved adhesions were
attributed to secondary forces of attraction induced by the polar imide groups through
their partial polymerization.
OH
N OO
OH OH
x y
+ C HH
O OH
N OO
CH2 CH2
Figure 5. 3. Synthesis of novolac resins containing maleimide functionalities
The goal of this part of the research was to incorporate the maleimide moiety into cresol
novolac/epoxy networks and determine the network properties. Cresol novolac oligomers
containing maleimide groups (cresol-co-HPM novolac) were first synthesized, followed by
crosslinking with bisphenol-A epoxy to form networks. Maleimide groups were expected to
behave as latent crosslink sites since the self-cure occurs only at higher temperatures. Adding
maleimide groups into networks therefore should improve thermal stabilities and may enhance
flame retardance.
176 C. Gouri, C. P. Reghunadhan Nair, and R. Ramaswamy, “Adhesive and Thermal
Characteristics of Maleimide-Functional Novolac Resins,” Journal of Applied Polymer
Science 73, 695-705 (1999).
166
5.2. Experimental
5.2.1. Reagents2-Amino-p-cresol, 4-aminophenol, ortho-cresol, 2,6-dimethylphenol, formaldehyde (37
wt% solution in water), maleic anhydride, oxalic acid dihydrate, paraformaldehyde
(powder, 95%), phosphorus pentoxide, and triphenylphosphine were purchased from
Aldrich. N,N-dimethylformamide, hexane, and diethyl ether were obtained from EM
Science. Isopropanol was purchased from Allied Signal, and sulfuric acid was obtained
from Fisher Chemical. All reagents were used as received.
5.2.2. Synthetic Methods5.2.2.1. Synthesis of 4-Hydroxyphenylmaleimide (4-HPM)
To a 2000 ml 3-neck round bottom flask equipped with a mechanical stirrer and
an addition funnel was added maleic anhydride (grounded into small pieces) (180g,
1.1mol) and DMF (250 ml) (Figure 5. 4). Once the maleic anhydride completely
dissolved, 4-aminophenol (109g, 1mol) was added gradually to the reaction flask through
a powder funnel. The mixture was allowed to react at room temperature for 2 hours. In a
separate 1000 ml one-neck round bottom flask, P2O5 (57 g) and DMF (350 ml) were
added. While stirring, H2SO4 (25 g) was added drop wise. The H2SO4/P2O5/DMF
mixture was stirred until a homogenous solution was obtained; it was then added drop
wise to the reaction through the addition funnel. The reaction mixture was heated to
70°C and held at this temperature for 2 hours to achieve full imidization. To work up the
reaction product, approximately 250 ml DMF was removed via vacuum distillation. The
reaction mixture was precipitated in ice water, filtered through a Buchner funnel, and
then rinsed with deionized water 5 times or until the product was neutral. It was
recrystallized in isopropanol, then washed with hexane. The 4-HPM product was dried at
70°C for 2 hours under vacuum prior to use.
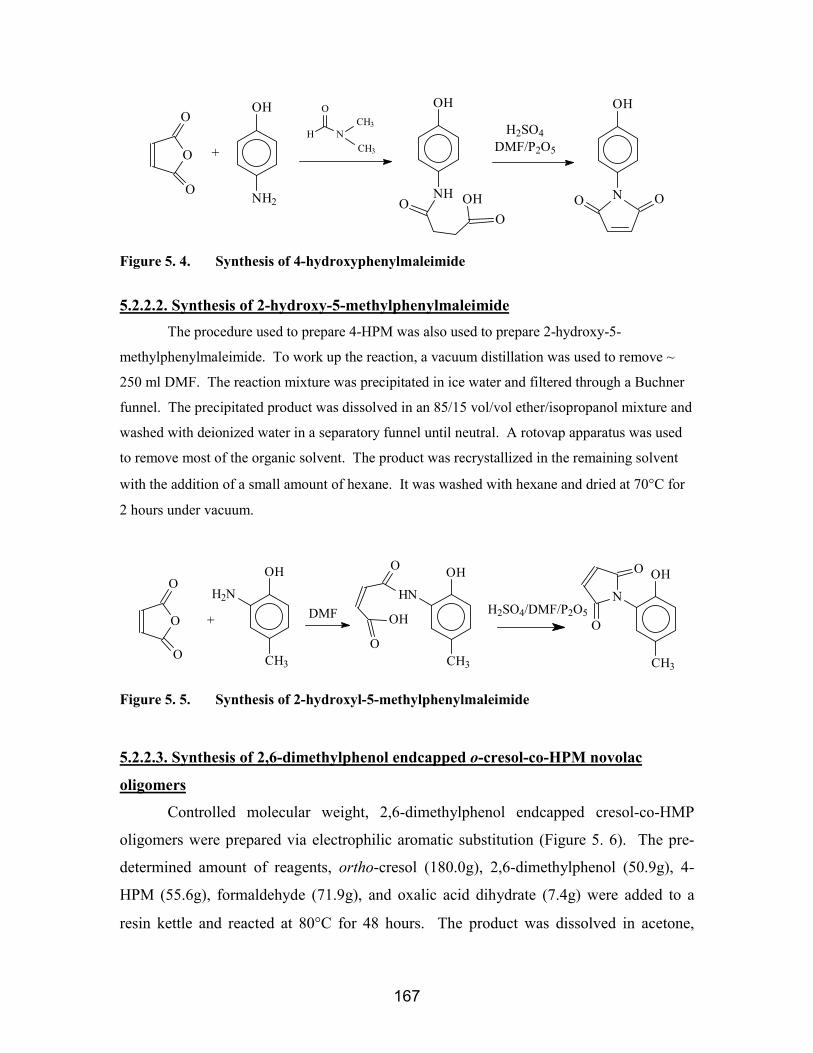
167
OH
NH2
O
O
O
OH
NHO
OOH
OH
N OO
H N
OCH3
CH3
H2SO4DMF/P2O5+
Figure 5. 4. Synthesis of 4-hydroxyphenylmaleimide
5.2.2.2. Synthesis of 2-hydroxy-5-methylphenylmaleimideThe procedure used to prepare 4-HPM was also used to prepare 2-hydroxy-5-
methylphenylmaleimide. To work up the reaction, a vacuum distillation was used to remove ~
250 ml DMF. The reaction mixture was precipitated in ice water and filtered through a Buchner
funnel. The precipitated product was dissolved in an 85/15 vol/vol ether/isopropanol mixture and
washed with deionized water in a separatory funnel until neutral. A rotovap apparatus was used
to remove most of the organic solvent. The product was recrystallized in the remaining solvent
with the addition of a small amount of hexane. It was washed with hexane and dried at 70°C for
2 hours under vacuum.
OH
H2N
CH3
O
O
O
OH
CH3
HN
OH
O
O
OH
N
CH3
O
OH2SO4/DMF/P2O5+ DMF
Figure 5. 5. Synthesis of 2-hydroxyl-5-methylphenylmaleimide
5.2.2.3. Synthesis of 2,6-dimethylphenol endcapped o-cresol-co-HPM novolac
oligomers
Controlled molecular weight, 2,6-dimethylphenol endcapped cresol-co-HMP
oligomers were prepared via electrophilic aromatic substitution (Figure 5. 6). The pre-
determined amount of reagents, ortho-cresol (180.0g), 2,6-dimethylphenol (50.9g), 4-
HPM (55.6g), formaldehyde (71.9g), and oxalic acid dihydrate (7.4g) were added to a
resin kettle and reacted at 80°C for 48 hours. The product was dissolved in acetone,
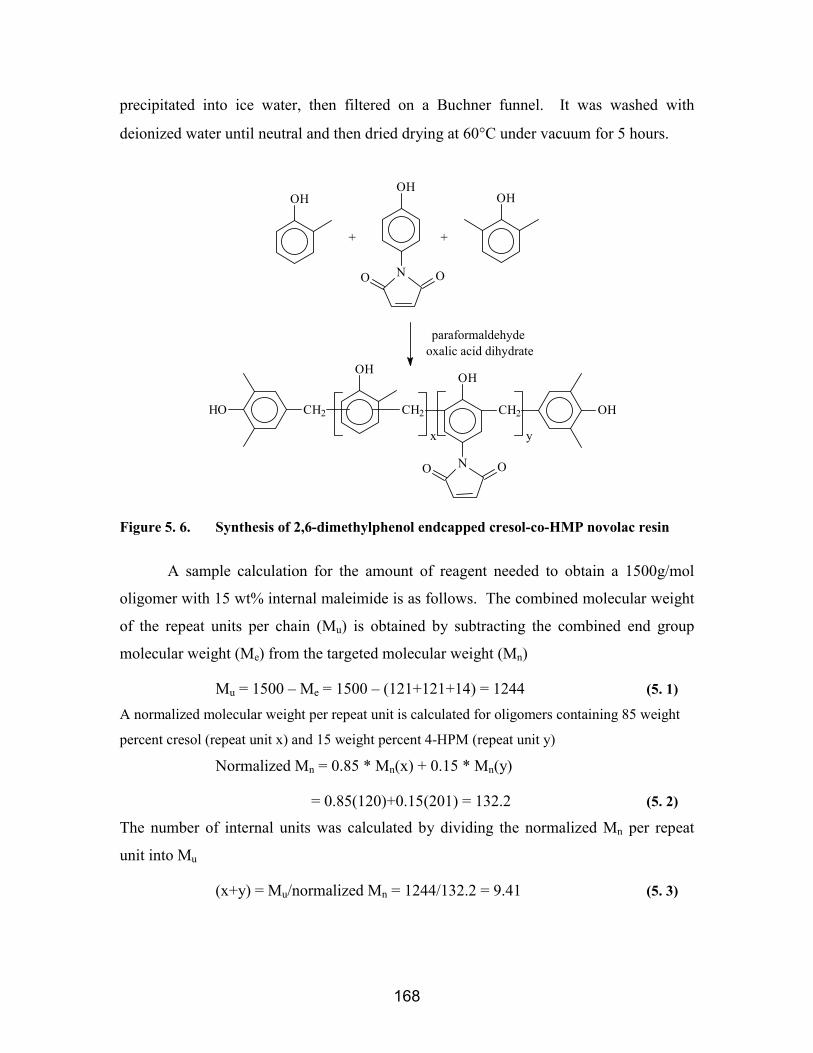
168
precipitated into ice water, then filtered on a Buchner funnel. It was washed with
deionized water until neutral and then dried drying at 60°C under vacuum for 5 hours.
OH
N OO
OH OH
oxalic acid dihydrateOH
OH
N OO
CH2 CH2 OHCH2HO
x y
+ +
paraformaldehyde
Figure 5. 6. Synthesis of 2,6-dimethylphenol endcapped cresol-co-HMP novolac resin
A sample calculation for the amount of reagent needed to obtain a 1500g/mol
oligomer with 15 wt% internal maleimide is as follows. The combined molecular weight
of the repeat units per chain (Mu) is obtained by subtracting the combined end group
molecular weight (Me) from the targeted molecular weight (Mn)
Mu = 1500 – Me = 1500 – (121+121+14) = 1244 (5. 1)
A normalized molecular weight per repeat unit is calculated for oligomers containing 85 weight
percent cresol (repeat unit x) and 15 weight percent 4-HPM (repeat unit y)
Normalized Mn = 0.85 * Mn(x) + 0.15 * Mn(y)
= 0.85(120)+0.15(201) = 132.2 (5. 2)
The number of internal units was calculated by dividing the normalized Mn per repeat
unit into Mu
(x+y) = Mu/normalized Mn = 1244/132.2 = 9.41 (5. 3)
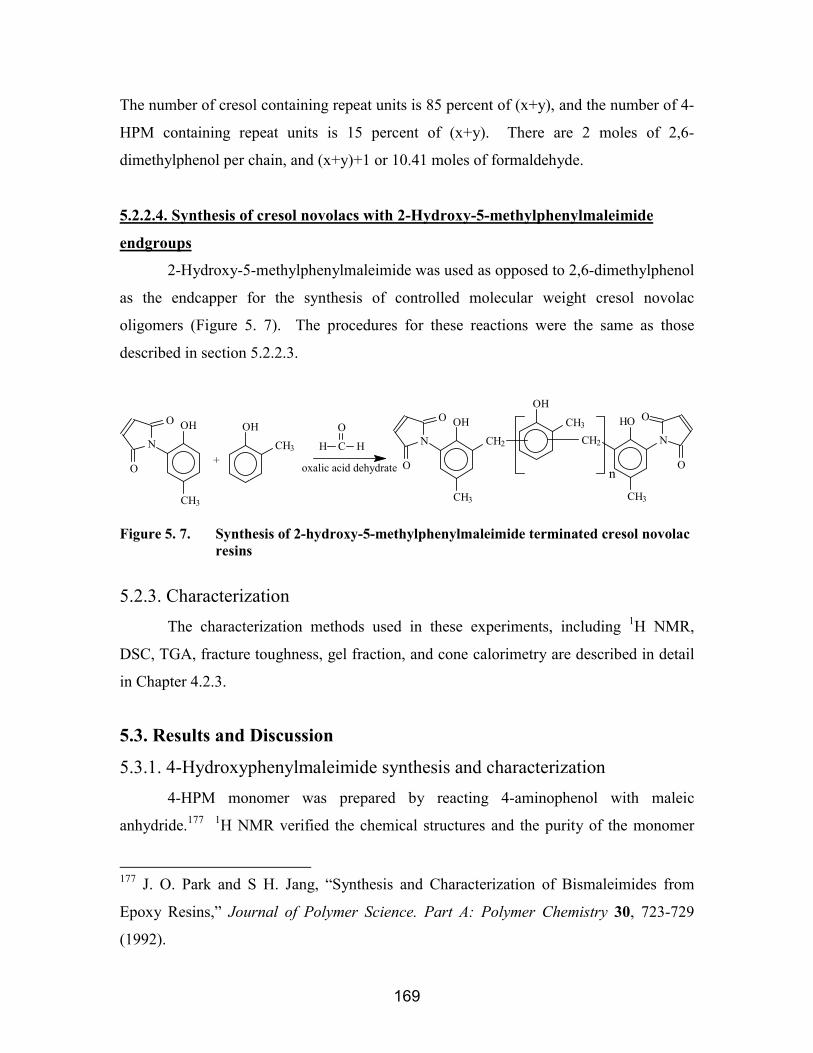
169
The number of cresol containing repeat units is 85 percent of (x+y), and the number of 4-
HPM containing repeat units is 15 percent of (x+y). There are 2 moles of 2,6-
dimethylphenol per chain, and (x+y)+1 or 10.41 moles of formaldehyde.
5.2.2.4. Synthesis of cresol novolacs with 2-Hydroxy-5-methylphenylmaleimide
endgroups
2-Hydroxy-5-methylphenylmaleimide was used as opposed to 2,6-dimethylphenol
as the endcapper for the synthesis of controlled molecular weight cresol novolac
oligomers (Figure 5. 7). The procedures for these reactions were the same as those
described in section 5.2.2.3.
OH
N
CH3
O
O+
H C
O
H
HO
N
CH3
O
O
CH2
OH
CH3
oxalic acid dehydrate
OH
N
CH3
O
O
CH2
OH
CH3
n
Figure 5. 7. Synthesis of 2-hydroxy-5-methylphenylmaleimide terminated cresol novolacresins
5.2.3. CharacterizationThe characterization methods used in these experiments, including 1H NMR,
DSC, TGA, fracture toughness, gel fraction, and cone calorimetry are described in detail
in Chapter 4.2.3.
5.3. Results and Discussion
5.3.1. 4-Hydroxyphenylmaleimide synthesis and characterization4-HPM monomer was prepared by reacting 4-aminophenol with maleic
anhydride.177 1H NMR verified the chemical structures and the purity of the monomer
177 J. O. Park and S H. Jang, “Synthesis and Characterization of Bismaleimides from
Epoxy Resins,” Journal of Polymer Science. Part A: Polymer Chemistry 30, 723-729
(1992).

170
(Figure 5. 8). As expected, four sets of peaks were observed for 4-HPM. Protons on
imide double bonds (a) resonate at 7.1 ppm; two types of aromatic protons (b and c) are
observed at 6.8 and 7.06 ppm, respectively. Phenolic hydroxyl protons resonate at 9.8
ppm. Water and DMSO were found at 3.4 and 2.5 ppm respectively. A clean 1H NMR
spectrum of 4-HMP showed that the monomer was relatively pure
Figure 5. 8. 1H NMR spectrum of 4-hydroxyphenylmaleimide monomer
The melting point of 4-HPM was measured using differential scanning
calorimetry (Figure 5. 9). The observed melting point (191°C) was comparable to that
cited in the literature.177 Further heating above the melting point led to an exotherm
which was attributed to the crosslinking reactions.
7 .1 7 .0 6 .9 6 .8 6 .7 P P M
10 9 8 7 6 5 4 3 2PPM
a bc
OH
N OO
d
a
c
b
d
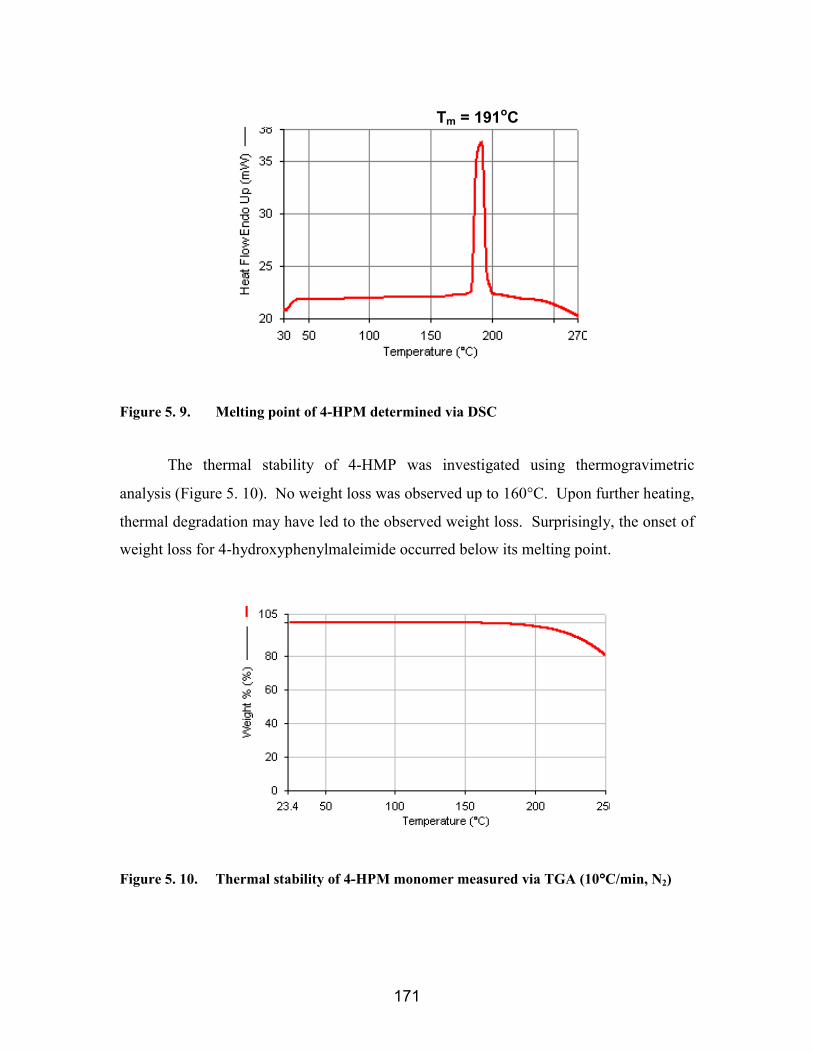
171
Figure 5. 9. Melting point of 4-HPM determined via DSC
The thermal stability of 4-HMP was investigated using thermogravimetric
analysis (Figure 5. 10). No weight loss was observed up to 160°C. Upon further heating,
thermal degradation may have led to the observed weight loss. Surprisingly, the onset of
weight loss for 4-hydroxyphenylmaleimide occurred below its melting point.
Figure 5. 10. Thermal stability of 4-HPM monomer measured via TGA (10°°°°C/min, N2)
Tm = 191oC

172
5.3.2. Cresol-co-HPM novolac oligomers and their propertiesMaleimide functionalities were incorporated into cresol novolac oligomers via
electrophilic aromatic substitution reactions of cresol and 4-HPM with formaldehyde.
The hydroxyl group on 4-HPM should dominate in electron donating compared to the
imide group, therefore the monomer was assumed to be difunctional in formaldehyde
substitution reactions. The molecular weight of presumed linear cresol-co-HPM novolac
oligomers was controlled by adjusting the stoichiometric ratio of monomers (cresol and
4-HPM) to endgroups (2,6-dimethylphenol) (as discussed in Chapter 2).Cresol-co-HPM novolac oligomers were prepared in three molecular weights. The 1500
and 1250 g/mol oligomers contained 15 mole % maleimide. At this composition, there was at
least one maleimide group per chain statistically. A higher maleimide composition was necessary
to maintain one maleimide site per chain (statistically) at lower oligomer molecular weights (such
as 1000g/mol).
The molecular weights of cresol-co-HMP novolac could not be calculated
quantitatively using 1H NMR or 13C NMR spectroscopy due to the complexity of the
spectra and extensive peak overlapping. 1H NMR spectra confirmed the presence of
maleimide groups which were clearly distinguishable from the other aromatic peaks
(Figure 5. 11). Methylene linkages are also evident between 3.4 and 3.9 ppm.
Figure 5. 11. 1H NMR of a typical cresol-co-HPM novolac resin
9 8 7 6 5 4 3 2 1 P P M
7 . 4 7 . 2 7 . 0 6 . 8 6 . 6 6 . 4 6 . 2 P P M
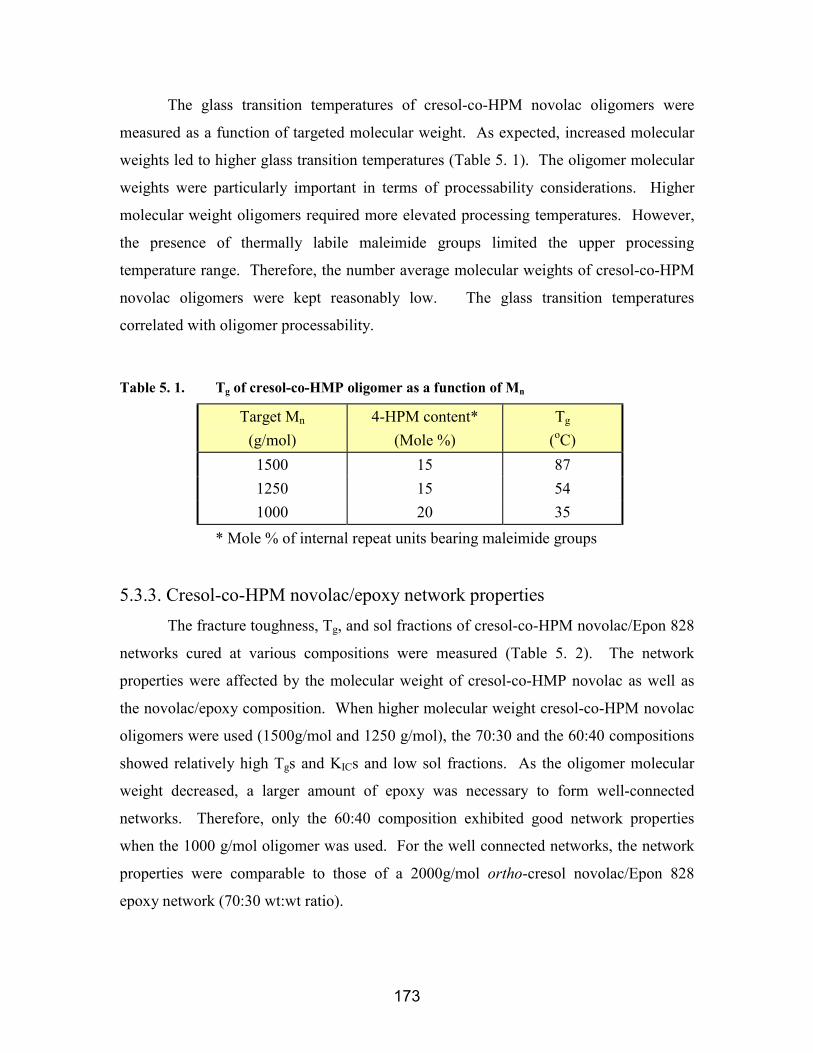
173
The glass transition temperatures of cresol-co-HPM novolac oligomers were
measured as a function of targeted molecular weight. As expected, increased molecular
weights led to higher glass transition temperatures (Table 5. 1). The oligomer molecular
weights were particularly important in terms of processability considerations. Higher
molecular weight oligomers required more elevated processing temperatures. However,
the presence of thermally labile maleimide groups limited the upper processing
temperature range. Therefore, the number average molecular weights of cresol-co-HPM
novolac oligomers were kept reasonably low. The glass transition temperatures
correlated with oligomer processability.
Table 5. 1. Tg of cresol-co-HMP oligomer as a function of Mn
Target Mn
(g/mol)4-HPM content*
(Mole %)Tg
(oC)1500 15 871250 15 541000 20 35
* Mole % of internal repeat units bearing maleimide groups
5.3.3. Cresol-co-HPM novolac/epoxy network propertiesThe fracture toughness, Tg, and sol fractions of cresol-co-HPM novolac/Epon 828
networks cured at various compositions were measured (Table 5. 2). The network
properties were affected by the molecular weight of cresol-co-HMP novolac as well as
the novolac/epoxy composition. When higher molecular weight cresol-co-HPM novolac
oligomers were used (1500g/mol and 1250 g/mol), the 70:30 and the 60:40 compositions
showed relatively high Tgs and KICs and low sol fractions. As the oligomer molecular
weight decreased, a larger amount of epoxy was necessary to form well-connected
networks. Therefore, only the 60:40 composition exhibited good network properties
when the 1000 g/mol oligomer was used. For the well connected networks, the network
properties were comparable to those of a 2000g/mol ortho-cresol novolac/Epon 828
epoxy network (70:30 wt:wt ratio).
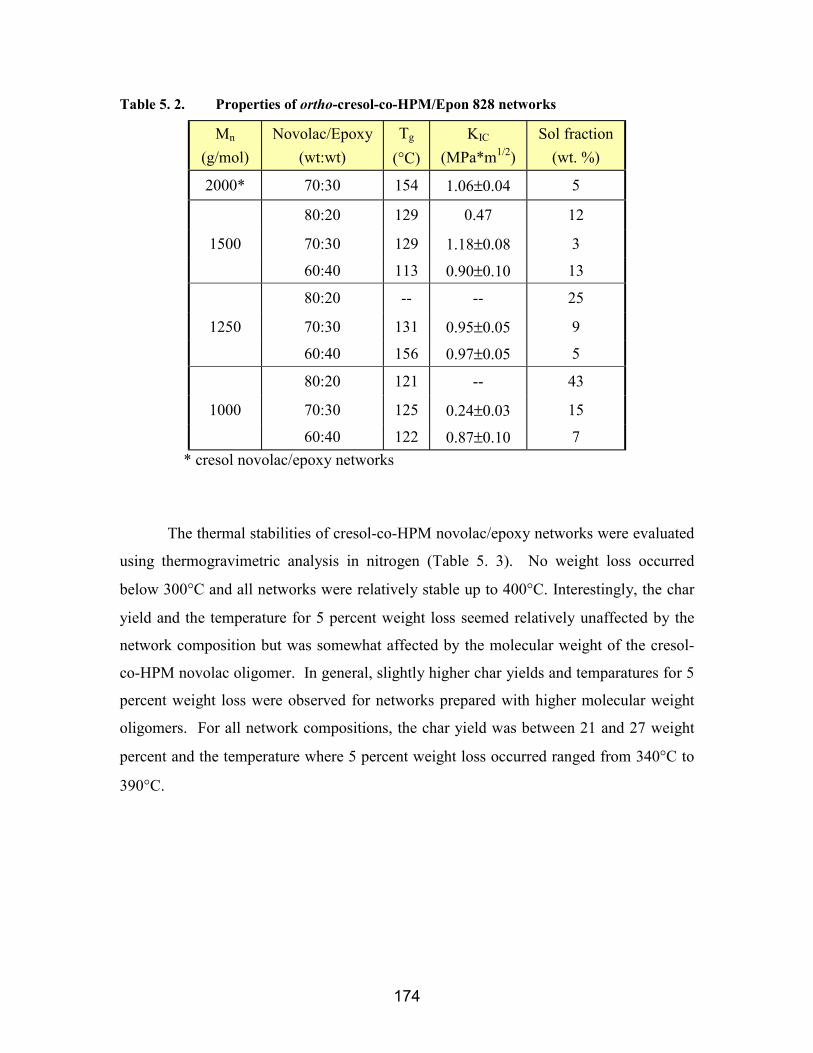
174
Table 5. 2. Properties of ortho-cresol-co-HPM/Epon 828 networks
Mn
(g/mol)Novolac/Epoxy
(wt:wt)Tg
(°C)KIC
(MPa*m1/2)Sol fraction
(wt. %)
2000* 70:30 154 1.06±0.04 5
80:20 129 0.47 12
1500 70:30 129 1.18±0.08 3
60:40 113 0.90±0.10 13
80:20 -- -- 25
1250 70:30 131 0.95±0.05 9
60:40 156 0.97±0.05 5
80:20 121 -- 43
1000 70:30 125 0.24±0.03 15
60:40 122 0.87±0.10 7 * cresol novolac/epoxy networks
The thermal stabilities of cresol-co-HPM novolac/epoxy networks were evaluated
using thermogravimetric analysis in nitrogen (Table 5. 3). No weight loss occurred
below 300°C and all networks were relatively stable up to 400°C. Interestingly, the char
yield and the temperature for 5 percent weight loss seemed relatively unaffected by the
network composition but was somewhat affected by the molecular weight of the cresol-
co-HPM novolac oligomer. In general, slightly higher char yields and temparatures for 5
percent weight loss were observed for networks prepared with higher molecular weight
oligomers. For all network compositions, the char yield was between 21 and 27 weight
percent and the temperature where 5 percent weight loss occurred ranged from 340°C to
390°C.

175
Table 5. 3. Thermal stability of cresol-co-HMP novolac/epoxy networks measured usingthermogravimetric analysis
Mn
(g/mol)Novolac/Epoxy
(wt:wt)Char yield(Wt. %)
Temperature(5 wt% loss)
80:20 25 388
1500 70:30 26 370
60:40 27 376
80:20 26 358
1250 70:30 27 362
60:40 23 357
80:20 23 348
1000 70:30 25 340
60:40 21 369
Cresol-co-HPM novolac/epoxy networks (80/20 composition) derived from
higher molecular weight novolac oligomers showed slightly higher initial degradation
temperatures (Figure 5. 12). The char yields at 800°C were similar for these networks.
Figure 5. 12. Percent weight loss for cresol-co-HPM novolac/epoxy networks (80:20 wt:wtratio) prepared with different oligomer molecular weights, monitored usingthermogravimetric analysis
1500 g/mol
1250 g/mol
1000 g/mol

176
Cone calorimetry was used to evaluate the flame retardance of cresol-co-HPM
novolac epoxy networks. Samples were ignited at 50 kW/m2 radiant heat flux under
atmospheric air conditions. The effects of network composition were investigated using
networks prepared with 1250 g/mol cresol-co-HPM novolac oligomers (Table 5. 4). The
80:20 and 70:30 compositions showed comparable relatively low peak heat release rates
(~400 kW/m2). The char yield for the 80:20 composition was slightly higher than for the
70:30 composition. As expected, the composition with the highest epoxy content (60:40
wt:wt ratio) exhibited the highest peak heat release rate and the lowest char yield.
Table 5. 4. Cone calorimetry measuring the peak heat release rate (PHRR) and thechar yield of 1250 g/mol cresol-co-HPM/epoxy networks
Novolac:Epoxy
(wt:wt)
PHRR
(kW/m2)
Char yield
(°C)
80:20 407 16
70:30 396 15
60:40 572 12
The heat release rate curves of the 1250 g/mol cresol-co-HPM novolac/epoxy
networks showed a two stage burning for the 80:20 and the 70:30 compositions (Figure 5.
13). The burning intensified to a single peak heat release for the 60:40 composition.
Although the 80:20 and the 70:30 compositions had similar peak heat release rates, the
heat released at both stages was significantly lower for the 80:20 composition.
Therefore, the 80:20 composition showed superior flame resistance compared to the
70:30 composition.
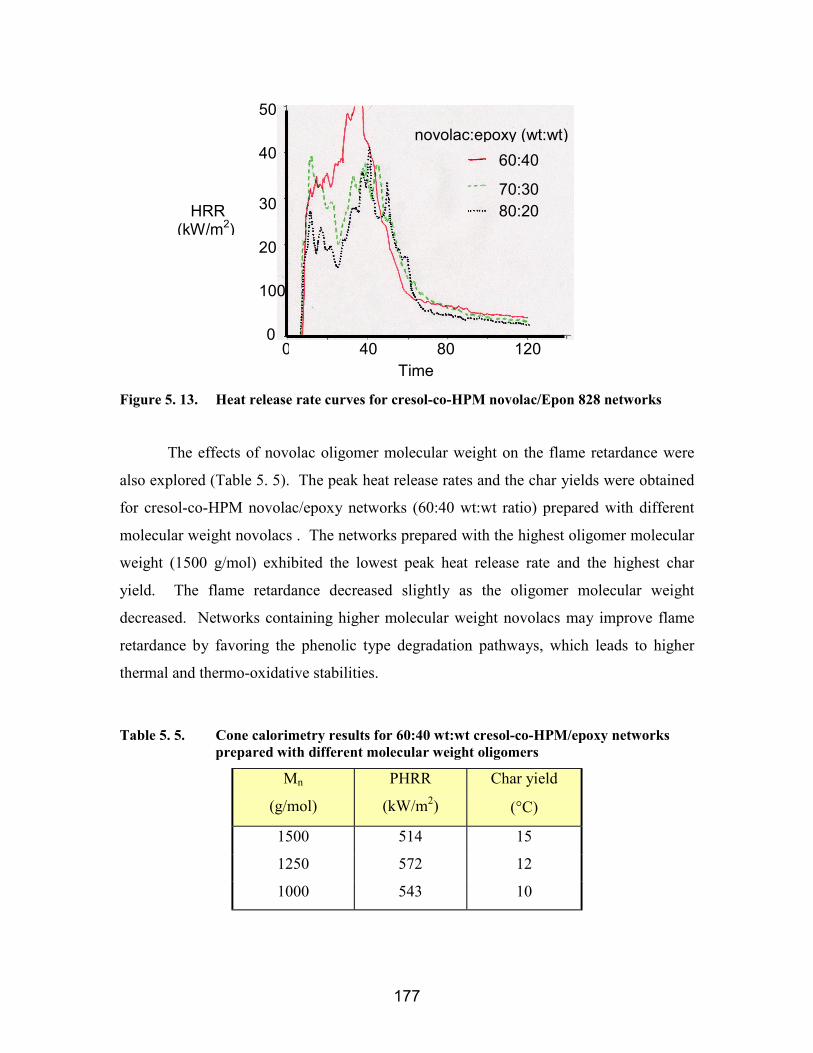
177
Figure 5. 13. Heat release rate curves for cresol-co-HPM novolac/Epon 828 networks
The effects of novolac oligomer molecular weight on the flame retardance were
also explored (Table 5. 5). The peak heat release rates and the char yields were obtained
for cresol-co-HPM novolac/epoxy networks (60:40 wt:wt ratio) prepared with different
molecular weight novolacs . The networks prepared with the highest oligomer molecular
weight (1500 g/mol) exhibited the lowest peak heat release rate and the highest char
yield. The flame retardance decreased slightly as the oligomer molecular weight
decreased. Networks containing higher molecular weight novolacs may improve flame
retardance by favoring the phenolic type degradation pathways, which leads to higher
thermal and thermo-oxidative stabilities.
Table 5. 5. Cone calorimetry results for 60:40 wt:wt cresol-co-HPM/epoxy networksprepared with different molecular weight oligomers
Mn
(g/mol)
PHRR
(kW/m2)
Char yield
(°C)
1500 514 15
1250 572 12
1000 543 10
0 40 80 120
100
20
30
50
40 60:40
70:3080:20
0
novolac:epoxy (wt:wt)
Time
HRR(kW/m2)
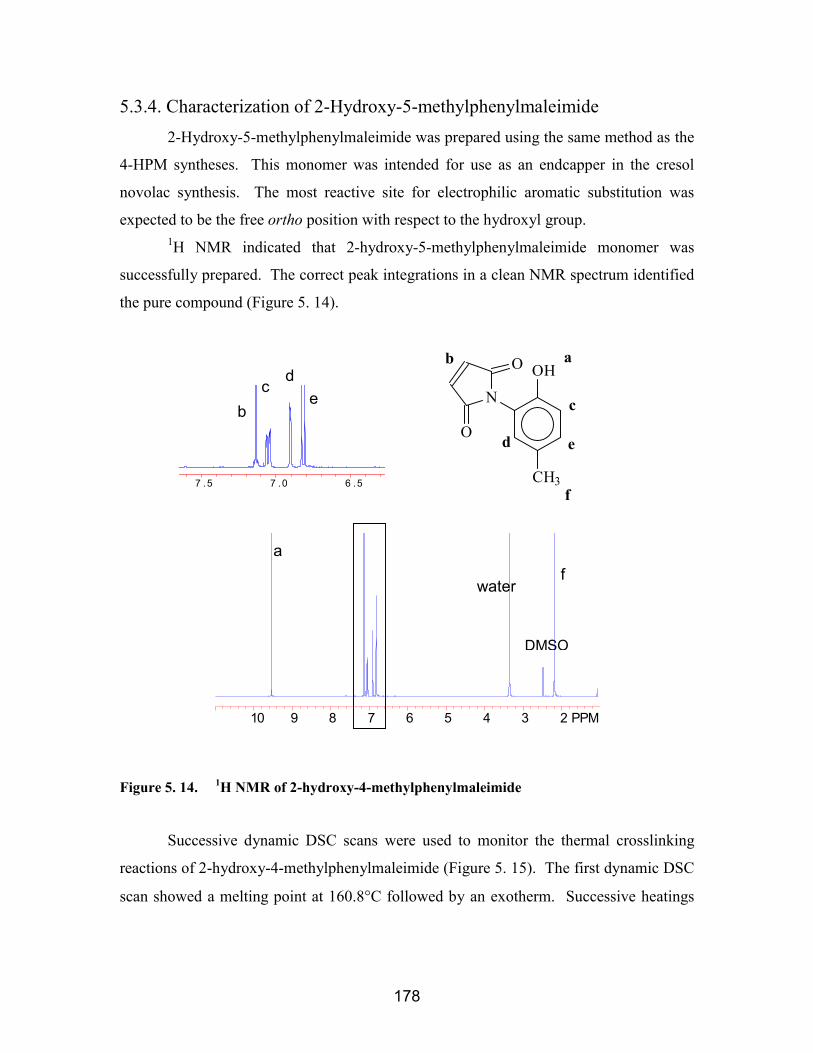
178
5.3.4. Characterization of 2-Hydroxy-5-methylphenylmaleimide2-Hydroxy-5-methylphenylmaleimide was prepared using the same method as the
4-HPM syntheses. This monomer was intended for use as an endcapper in the cresol
novolac synthesis. The most reactive site for electrophilic aromatic substitution was
expected to be the free ortho position with respect to the hydroxyl group.1H NMR indicated that 2-hydroxy-5-methylphenylmaleimide monomer was
successfully prepared. The correct peak integrations in a clean NMR spectrum identified
the pure compound (Figure 5. 14).
OH
N
CH3
O
O
ab
c
d e
f
Figure 5. 14. 1H NMR of 2-hydroxy-4-methylphenylmaleimide
Successive dynamic DSC scans were used to monitor the thermal crosslinking
reactions of 2-hydroxy-4-methylphenylmaleimide (Figure 5. 15). The first dynamic DSC
scan showed a melting point at 160.8°C followed by an exotherm. Successive heatings
DMSO
waterf
a
10 9 8 7 6 5 4 3 2 PPM
cb
de
7 .5 7 .0 6 .5

179
showed increased Tgs with each heating cycle which was indicative of increases in
molecular weight. The amount of exotherm decreased with each heating cycle.
Figure 5. 15. Successive dynamic DSC scans of 2-hydorxy-4-methylphenylmaleimide
The thermal stabilities of 2-hydroxy-4-methylphenylmaleimide, investigated
using TGA, indicated that the monomer was thermally unstable even below its melting
point. The degradation initiated at approximately 110°C (Figure 5. 16). Only 20 weight
percent remained at 250°C for 2-hydroxy-4-methylphenylmaleimide as opposed to 80
weight percent for 4-HPM (Figure 5. 10). The major difference between 2-hydroxy-4-
methylphenylmaleimide and 4-HPM is the position of the imide group relative to the
hydroxyl group. The two functionalities are para to each other on 4-HPM, which
eliminates the possibility for interactions. The imide and hydroxyl group are ortho to
each other on the 2-hydroxy-4-methylphenylmaleimide. The observed ease for 2-
hydroxy-4-methylphenylmaleimide degradation may be facilitated by the interaction
between the hydroxyl and carbonyl oxygen on the imide group. This degradation, which
produced volatile materials, prohibited the use of 2-hydroxy-4-methylphenylmaleimide
monomer in void free networks.
1st
2nd
3rd
4th

180
Figure 5. 16. TGA monitoring the weight loss of 2-hydroxy-4-methylphenylmaleimidemonomer as a function of temperature (10°°°°C/min, N2)
5.4. Conclusions4-hydroxyphenylmaleimide and 2-hydroxy-4-methylphenylmaleimde were
synthesized and characterized. 4-HPM was significantly more thermally stable than 2-
hydroxy-4-methylphenylmaleimide which begin to degrade even at 110°C. 4-HPM was
incorporated into 2,6-dimethylphenol endcapped cresol novolac oligomers. Cresol-co-
HPM oligomers prepared in different molecular weights were subsequently crosslinked
with Epon 828 epoxy. The network properties and processability depended on the
molecular weight of the cresol-co-HPM novolac oligomers and the novolac to epoxy
ratios. Lower molecular weight novolac oligomers favored processability, whereas
higher molecular weight novolac oligomers led to superior network properties. Network
composition also played an important role since compositions high in novolac exhibited
enhanced flame retardance, but a sufficient amount of epoxy was required to form fully
crosslinked networks with good physical integrity. The 1250 g/mol cresol-co-HPM
novolac/Epon 828 network (70:30 wt:wt ratio) presented a good compromise by which
networks with excellent properties could be processed easily.

181
6. Latent Initiators for Novolac/Epoxy Cure Reactions
6.1. IntroductionComposites are becoming increasingly more important in replacing metals and
concrete in structural applications due to their excellent oxidative stability and freeze
thaw durability. One factor governing the feasibility of mass production is processability,
which may comprise up to 80 percent of the final cost. Therefore, efficient processing is
essential in producing cost effective composites.
Novolac/epoxy networks are investigated in this research as matrix materials for
tough, flame retardant composites. The mechanism for triphenylphosphine (TPP)
catalyzed phenolic novolac/epoxy cure reactions was proposed to consist of two steps (
Figure 6. 1).178 The reaction initiates with a triphenylphosphine attack on an epoxy ring
to form a zwitterion (A). In the presence of phenolic hydroxyl groups, the zwitterion
undergoes rapid proton transfer to generate a phenolate anion and an alcohol (B). The
propagation step consists of phenolate anion attacking another epoxy group (C) or an
electrophilic carbon next to the triphenylphosphine to form a linkage and regenerate the
catalyst. These steps are repeated until a crosslinked network is formed.
178 R. W. Biernath and D. S. Soane, “Cure Kinetics of Epoxy Cresol Novolac
Encapsulants for Microelectronics Packaging,” Contemporary Topics in Polymer
Science, J. C. Salamone and J. S. Riffle Eds., 7, 130-159 (1992).
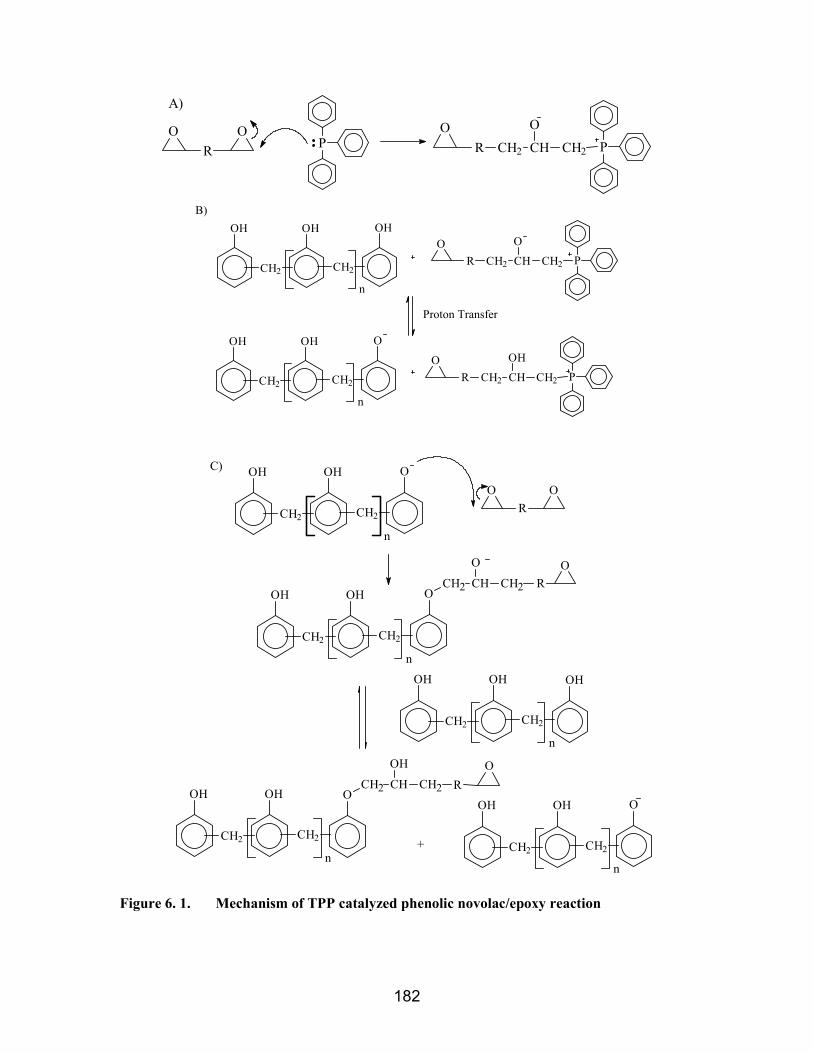
182
OR
OP
OR CH2 CH
O
CH2 P
A)
OH
CH2
OH
CH2
OH
n
OR CH2 CH
O
CH2 P
OR CH2 CH
OH
CH2 P
n
O
CH2
OH
CH2
OH
Proton Transfer
B)
OH
CH2
OH
CH2
O
n
OR
O
n
OCH2 CH
O
CH2 RO
CH2
OH
CH2
OH
n
OH
CH2
OH
CH2
OH
n
O
CH2
OH
CH2
OHOH
CH2
OH
CH2
OCH2 CH
OH
CH2 RO
n+
C)
Figure 6. 1. Mechanism of TPP catalyzed phenolic novolac/epoxy reaction

183
One method for composite fabrication is pultrusion (Figure 6. 3) where spools of
carbon fiber are pulled through a bath containing a low viscosity resin or the resin is
poured onto the fibers. The fiber embedded in resin then enters a heated metal mold
where rapid cure proceeds. Regardless of the fabrication method, a low viscosity resin (<
10 Pa*s) is a requisite for the wetting of the fibers. Once the resin reaches the heated
metal mold, fast cure (99% conversion within 5 to 10 minutes) is ideal.
Figure 6. 3. Diagram of pultrusion processing
The major setback thus far with these phenolic novolac/epoxy systems has been
optimizing the processing conditions such that long processing time windows and short
cure times are obtained. Phenolic novolac/epoxy mixtures (65:35 wt:wt ratio) must be
heated to approximately 140°C to reduce the viscosity to the processable range (2-10
Pa*s). At this temperature, the resin mixture reacts slowly and remains processable for
approximately 100 minutes. However, curing uninitiated phenolic novolac/epoxy
mixtures requires one hour at 240ºC. The cure rates can be greatly accelerated at reduced
temperatures with the addition of an initiator such as TPP. However, adding as little as
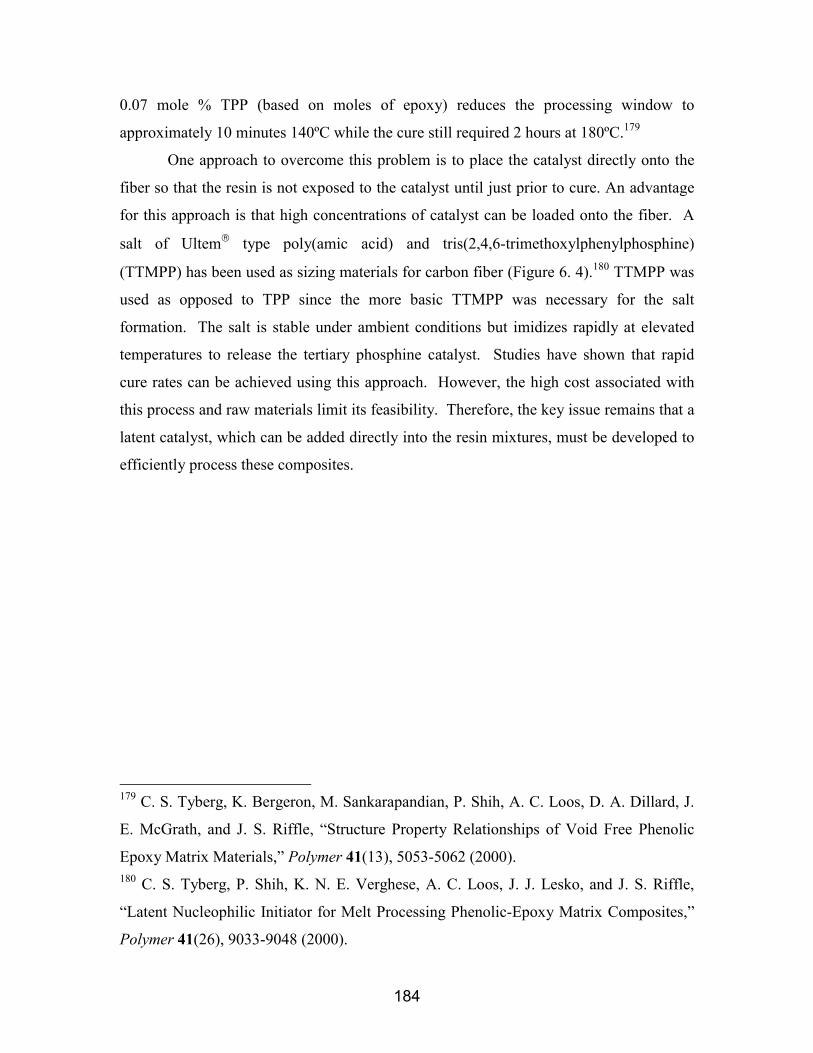
184
0.07 mole % TPP (based on moles of epoxy) reduces the processing window to
approximately 10 minutes 140ºC while the cure still required 2 hours at 180ºC.179
One approach to overcome this problem is to place the catalyst directly onto the
fiber so that the resin is not exposed to the catalyst until just prior to cure. An advantage
for this approach is that high concentrations of catalyst can be loaded onto the fiber. A
salt of Ultem type poly(amic acid) and tris(2,4,6-trimethoxylphenylphosphine)
(TTMPP) has been used as sizing materials for carbon fiber (Figure 6. 4).180 TTMPP was
used as opposed to TPP since the more basic TTMPP was necessary for the salt
formation. The salt is stable under ambient conditions but imidizes rapidly at elevated
temperatures to release the tertiary phosphine catalyst. Studies have shown that rapid
cure rates can be achieved using this approach. However, the high cost associated with
this process and raw materials limit its feasibility. Therefore, the key issue remains that a
latent catalyst, which can be added directly into the resin mixtures, must be developed to
efficiently process these composites.
179 C. S. Tyberg, K. Bergeron, M. Sankarapandian, P. Shih, A. C. Loos, D. A. Dillard, J.
E. McGrath, and J. S. Riffle, “Structure Property Relationships of Void Free Phenolic
Epoxy Matrix Materials,” Polymer 41(13), 5053-5062 (2000).180 C. S. Tyberg, P. Shih, K. N. E. Verghese, A. C. Loos, J. J. Lesko, and J. S. Riffle,
“Latent Nucleophilic Initiator for Melt Processing Phenolic-Epoxy Matrix Composites,”
Polymer 41(26), 9033-9048 (2000).
185
O O
O
N
O
N
O
O
O
O
H H
PH
OCH3
OCH3
H3CO PH
OCH3
OCH3
H3CO
n
3 3
260oC~3 minutes - H2O
O ONN
O
O
O
On
+3
P
OCH3
OCH3
H3CO
Figure 6. 4. High temperature imidization of PAAS to release TTMPP catalyst
The use of latent catalysts or initiators have been somewhat explored. Latent
catalysts, which form active species by external stimulation such as heating or photo-
irradiation to catalyze or initiate the polymerization or curing, enhance the pot life and
the handling of the thermosetting resins, or increase the processability of the resins.
Latent catalysts comprised of primary or secondary amine salts of a strong acid
have been added to phenolic resole resins to extend storage stabilities while retaining
rapid cure characteristics of typical acid catalyzed resole resins.181 These resins can be
cured in the presence of a strong acid to enhance the reaction rate without heating to
excessively high temperatures. However, the pot life of such compositions suffers in the
presence of strong acid catalysts. Strong acids, especially sulfonic acids, were therefore
mixed with amines to form latent catalysts which dissociate at elevated temperature to
regenerate the acids. The cure rates in the presence of an amine salt of a strong acid were
found to be comparable to those of the free strong acid catalyzed resole reactions; the pot
life, on the other hand, was extended relative to that of the free strong acid catalyzed
resoles.
181 U.S. Patent 5,344,909 to D. A. Jutching, T. M. McVay, and R. F. Pennock “Latent
Catalyzed Phenolic Resole Resin Composition,” Sep. 6, 1994.

186
A cationic salt, N-benzylpyrazinium hexafluoroantimonate (BPH) (Figure 6. 5),
was investigated as a latent thermal catalyst for epoxy/phenolic novolac reactions.182
BPH was considered as a latent catalyst since no appreciable amount of reaction occurred
below 100°C in its presence. An autocatalytic reaction kinetic mechanism was proposed
to occur for the epoxy/phenolic novolac/BPH cure. Dynamic differential scanning
calorimetry showed that an increased phenolic novolac content resulted in decreased
initial cure temperatures and therefore reduced the cure times.
CH2
N
N
SbF6
Figure 6. 5. The chemical structure of N-benyzlpyrazinium hexafluoroantimonate
Microencapsulated reactant and/or platinum or tin catalysts were utilized in storage
stable hydrosilation reactions.183 Mixtures of organohydrogensiloxane reactants and
catalyst are only stable under ambient conditions for a few hours. Encapsulating the
reactant or the catalyst in a thermoplastic organic polymer, which has a Tg higher than
room temperature but lower than the cure temperature, effectively isolates the two under
storage conditions. The reagents are liberated to allow rapid mixing at the desired cure
temperatures.
Microencapsulated catalysts can be prepared using chemical, physico-chemical,
or physical methods. The chemical methods184,185 generally involve in-situ free radical or
182 S. Park, M. Seo, and J. Lee, “Isothermal Cure Kinetics of Epoxy/Phenol-Novolac
Resin Blend System Initiated by Cationic Latent Thermal Catalyst,” Journal of Polymer
Science: Part A: Polymer Chemistry 38, 2945-2956 (2000).183 U.S. Patent Re. 33,749 to C. Lee, D.R. Juen, J. C. Saam, and R. L. Willis, Jr., “Storage
Stable Heat Curable Organosiloxane Compositions Containing Microencapsulated
Platinum-Containing Catalysts,” Reissued Date: Nov. 19, 1991.184 US. Patent 3,859,228 to M. Morishita, Y. Inaba, S. Kobari, M. Fukushima, and J. Abe,
“Method of microcapsule preparation,” Jan. 7, 1975.
187
condensation polymerization of polymers on the surface of finely divided catalyst in the
form of solid particles or droplets. An example of a physico-chemical method involves
emulsifying or dispersion in the continuous phase 1) the finely divided particles or
droplets, and 2) a solution of the encapsulant in a liquid that is immiscible with the
continuous phase. The encapsulant solvent is evaporated, and the emulsion/dispersion is
then precipitated, and dried. The physical method involves direct mixing of catalyst and
polymer via physical means such as dissolving in a common solvent followed by
evaporation of the solvent.
Special care must be taken to isolate the catalyst within the encapsulated particles
and away from the exterior surface. For example, in the hydrosilation reactions, even
trace amounts of catalyst on the surface lead to premature curing of organosiloxane
compositions.183 Encapsulated particles were often washed with a solvent to remove the
excess reagents collected on the surface of the capsules. The shell of microencapsulation
must also be sufficiently thick to prevent diffusion of reagents from the interior to the
surface.
Salicyclic acid salts have been used as thermal latent catalysts for the preparation
of linear polycarbonates from cyclic oligomers.186 Salicyclic acids salts have carboxylate
groups which are stable up to 220°C and are not sufficiently nucleophilic to initiate
reactions. At higher temperatures (>220°C), salicyclic acid salts were suggested to
undergo a decarboxylation reaction to form phenolates (Figure 6. 6). The decomposition
reaction occurred slowly between 220°C and 240°C and more rapidly at higher
temperatures. Phenolates were significantly more nucleophilic and catalyzed the
polymerization of the carbonate cyclics. The addition of such catalysts allowed the cyclic
oligomers to be heated to low viscosities in composite fabrications and promoted rapid
cure at higher temperatures.
185 U.S. Patent 4,462,982 to M. Samejina, G. Hirata, Y. Koida, Y. Kobayashi, A. Kida,
“Microcapsules and method of preparing same,” July 31, 1984.186 U.S. Patent 5,087,692 to K. R. Steward and A. J. Salem, “Preparation of Linear
Polycarbonates from Cyclic Oligomer Compositions With Salicylic Acid Salt as
Catalyst,” Feb. 11, 1992.

188
OH
O
O Li
> 220oC OH
O Li
+ CO2
Figure 6. 6. Decarboxylation reaction of salicylic acid salt to form phenolate
Several onium salts, such as iodonium,187 sulfonium,188 ammonium,189 pyridinium,190
and phosphonium salts,191 have been reported as excellent thermally latent cationic
catalysts. However, drawbacks for these cationic catalysts include poor solubility in
monomers and organic solvents, and the residual salts in cured resins may lead to
undesirable properties. Recently, phosphonium ylides were introduced as non-salt
thermally latent catalysts.192 Phosphonium ylides were prepared by reacting
187 J.V. Crivello, “The Discovery and Development of Onium Salt Cationic
Photoinitiators,” Journal of Polymer Science. Part A: Polymer Chemistry 37(23), 4241-
4254, (1999).188 F. Hamazu, S. Akashi, T. Koizumi, T. Takata, and T. Endo, “Novel Benzyl Sulfonium
Salt Having an Aromatic Group on Sulfur Atom as a Latent Thermal Initiator,” Journal
of Polymer Science. Part A: Polymer Chemistry 29(11), 1675-1680 (1991).189 S. Nakano and T. Endo, “Cationic Polymerization of Glycidyl Phenyl Ether by
Benzylammonium salts,” Journal of polymer Science. Part A. Polymer Chemistry 33(3),
505-512 (1995).190 S. B. Lee, T. Takata, and T. Endo, “(para-Methoxybenzyl)-p-Cyanopyridinium and
(alpha-Methylbenzyl)-p-Cyanopyridinium Hexafluoroantimonates-Activated Latent
Thermal Catalysts,” Macromolecules 23(2), 431-434 (1990).191 K. Takuma, T. Takata, and T. Endo, “Cationic Polymerization of Epoxide with Benzyl
Phosphonium Salts as the Latent Thermal Initiators,” Macromolecules 26(4), 862-863
(1993).192 M. Kobayashi, F. Sanda, and T. Endo, “Application of Phosphonium Ylides to Latent
Catalysts for Polyaddition of Bisphenol A Diglycidyl Ether with Bisphenol A: Model
System of Epoxy-Novolac Resin,” Macromolecules 32(15), 4751-4756 (1999).
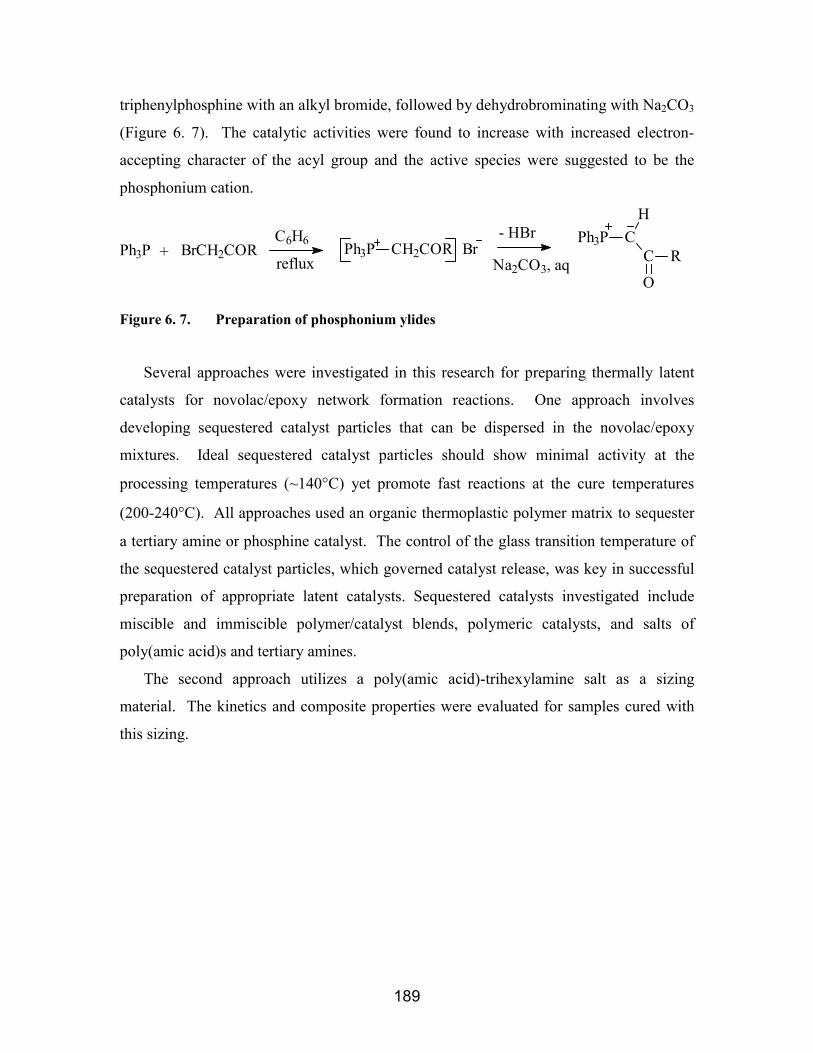
189
triphenylphosphine with an alkyl bromide, followed by dehydrobrominating with Na2CO3
(Figure 6. 7). The catalytic activities were found to increase with increased electron-
accepting character of the acyl group and the active species were suggested to be the
phosphonium cation.
Ph3P + BrCH2CORC6H6
refluxPh3P CH2COR Br
- HBr
Na2CO3, aq
Ph3P CH
C
O
R
Figure 6. 7. Preparation of phosphonium ylides
Several approaches were investigated in this research for preparing thermally latent
catalysts for novolac/epoxy network formation reactions. One approach involves
developing sequestered catalyst particles that can be dispersed in the novolac/epoxy
mixtures. Ideal sequestered catalyst particles should show minimal activity at the
processing temperatures (~140°C) yet promote fast reactions at the cure temperatures
(200-240°C). All approaches used an organic thermoplastic polymer matrix to sequester
a tertiary amine or phosphine catalyst. The control of the glass transition temperature of
the sequestered catalyst particles, which governed catalyst release, was key in successful
preparation of appropriate latent catalysts. Sequestered catalysts investigated include
miscible and immiscible polymer/catalyst blends, polymeric catalysts, and salts of
poly(amic acid)s and tertiary amines.
The second approach utilizes a poly(amic acid)-trihexylamine salt as a sizing
material. The kinetics and composite properties were evaluated for samples cured with
this sizing.

190
6.2. Experimental
6.2.1. Materials
Acetic acid (Glacial)
Supplier: Aldrich FW: 60.06
CH3COOH
Used as received
1,2,4,5-Benzenetetracarboxylic dianhyride (pyromellitic dianhydride or PMDA)
Supplier: Aldrich FW: 218.12 m.p., °C 283-286
OO
O
O
O
O
Purification: PMDA was obtained in polymer grade purity and was dried at ~180°C
under vacuum for at least 12 hours prior to use.
3,4,3’,4’-Biphenyltetracarboxylic dianhydride (BPDA)
Supplier: Aldrich FW: 294.224 m.p., °C 300
O O
O O
OO
Purification: BPDA was obtained in polymer grade purity and was dried at ~180°C under
vacuum for at least 12 hours prior to use.
N,N-Dimethylacetamide (DMAc)
Supplier: Aldrich FW: 87.12 m.p., °C 164.5-166
CH3 C
O
NCH3
CH3
Purification: DMAc was dried using activated molecular sieves prior to use.
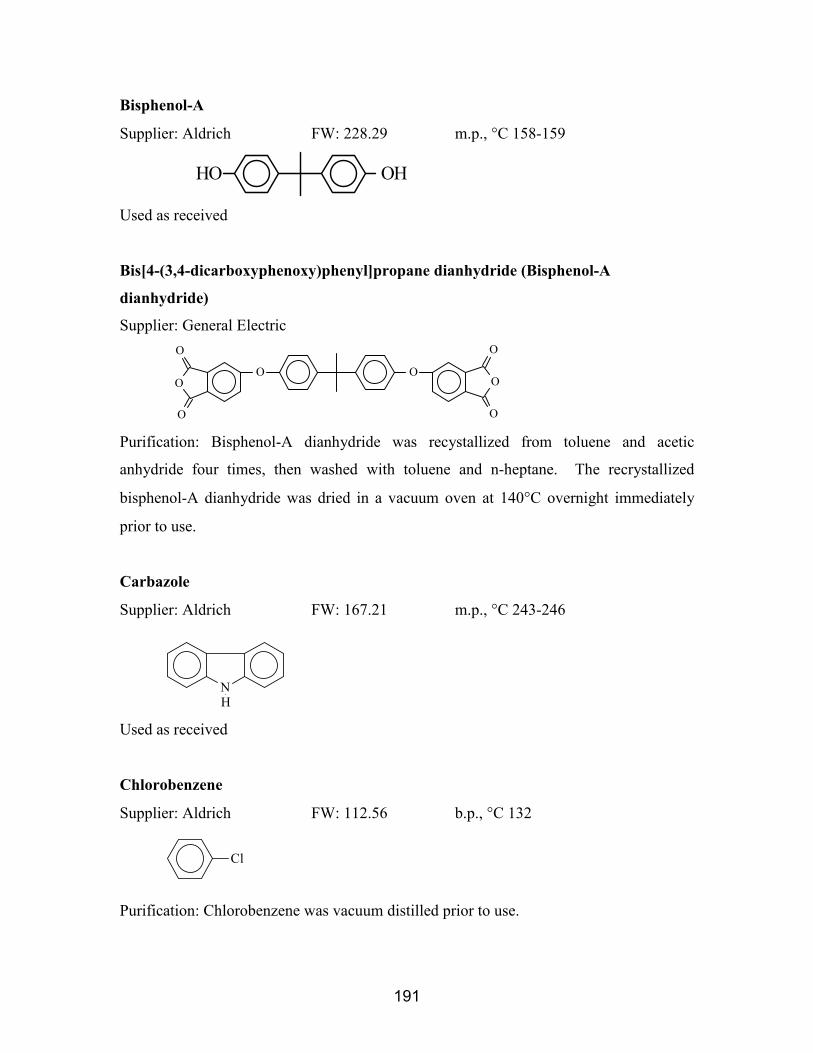
191
Bisphenol-A
Supplier: Aldrich FW: 228.29 m.p., °C 158-159
HO OH Used as received
Bis[4-(3,4-dicarboxyphenoxy)phenyl]propane dianhydride (Bisphenol-A
dianhydride)
Supplier: General Electric
O OOO
O
O
O
O
Purification: Bisphenol-A dianhydride was recystallized from toluene and acetic
anhydride four times, then washed with toluene and n-heptane. The recrystallized
bisphenol-A dianhydride was dried in a vacuum oven at 140°C overnight immediately
prior to use.
Carbazole
Supplier: Aldrich FW: 167.21 m.p., °C 243-246
NH
Used as received
Chlorobenzene
Supplier: Aldrich FW: 112.56 b.p., °C 132
Cl
Purification: Chlorobenzene was vacuum distilled prior to use.
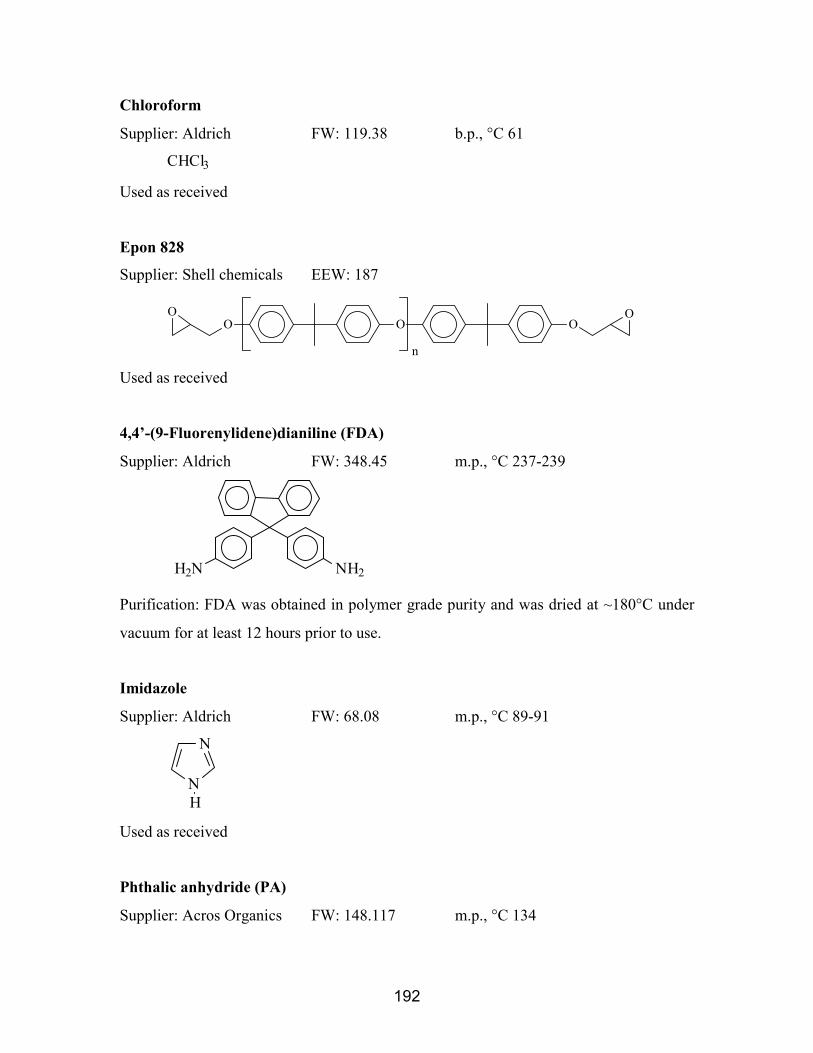
192
Chloroform
Supplier: Aldrich FW: 119.38 b.p., °C 61
CHCl3
Used as received
Epon 828
Supplier: Shell chemicals EEW: 187
O OO
OO
n
Used as received
4,4’-(9-Fluorenylidene)dianiline (FDA)
Supplier: Aldrich FW: 348.45 m.p., °C 237-239
H2N NH2
Purification: FDA was obtained in polymer grade purity and was dried at ~180°C under
vacuum for at least 12 hours prior to use.
Imidazole
Supplier: Aldrich FW: 68.08 m.p., °C 89-91
N
NH
Used as received
Phthalic anhydride (PA)
Supplier: Acros Organics FW: 148.117 m.p., °C 134

193
O
O
O
Purification: PA was sublimed under vacuum at ~ 120°C prior to use.
Matrimid
Supplier: Ciba Chemicals Tg, °C 300
n
O O N N
O
O O
O
Used as received
Methyl alcohol (methanol, CH3OH)
Supplier: Aldrich FW: 32.04 b.p., °C 64.7
Methanol was obtained in HPLC grade and used as received
1-Methyl-2-pyrroilidinone (NMP)
Supplier: Fisher Scientific FW: 99.13 b.p., °C 202 (81-82°/10mm)
N O
CH3
Purification: NMP was purified for use in poly(amic acid) synthesis by drying over
calcium hydride for at least 12 hours, followed by distillation under reduced pressure.
Phenolic novolac
Supplier: Georgia-Pacific (Product # GP-2073) n=5
Supplier: Occidental (Product # 29-619 ) n=2.4
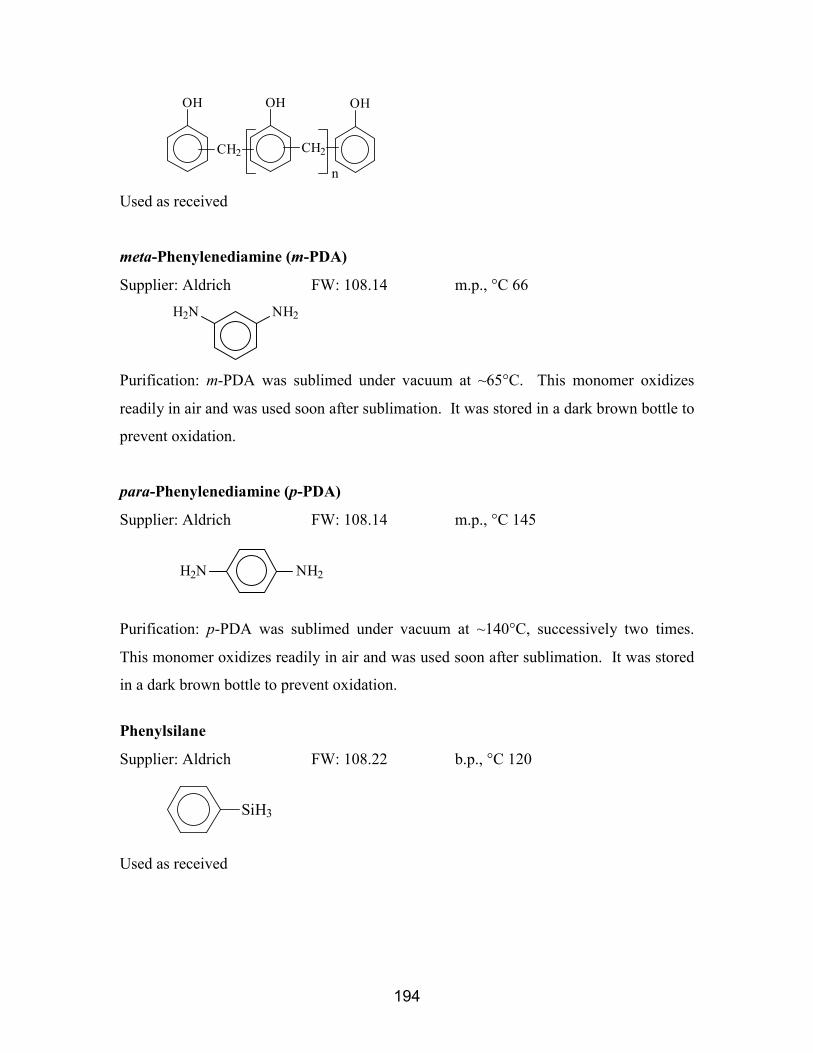
194
OH
CH2
OH
CH2
OH
n
Used as received
meta-Phenylenediamine (m-PDA)
Supplier: Aldrich FW: 108.14 m.p., °C 66H2N NH2
Purification: m-PDA was sublimed under vacuum at ~65°C. This monomer oxidizes
readily in air and was used soon after sublimation. It was stored in a dark brown bottle to
prevent oxidation.
para-Phenylenediamine (p-PDA)
Supplier: Aldrich FW: 108.14 m.p., °C 145
H2N NH2
Purification: p-PDA was sublimed under vacuum at ~140°C, successively two times.
This monomer oxidizes readily in air and was used soon after sublimation. It was stored
in a dark brown bottle to prevent oxidation.
Phenylsilane
Supplier: Aldrich FW: 108.22 b.p., °C 120
SiH3
Used as received

195
2-Propanol (isopropanol)
Supplier: Aldrich FW: 60.10 b.p., °C 97
CH OHCH3
CH3
Isopropanol was obtained in the HPLC grade and used as received
Potassium carbonate (K2CO3)
Supplier: Aldrich FW: 138.21 m.p., °C 891
Used as received
Tetrahydrofuran (THF)
Supplier: EM Science FW: 72.11 b.p., °C 65-67
O
Purification: In the poly(amic acid) synthesis, THF was refluxed over sodium with a
small amount of bezophenone as an indicator for dryness and distilled immediately prior
to use.
Toluene
Supplier: Aldrich FW: 92.14 b.p., °C 110.6
CH3
THP was obtained in the HPLC grade and used as received
Trihexylamine
Supplier: Aldrich FW: 269.52 b.p., °C 263-265
N((CH2)5CH3)3
Used as received

196
Triphenylphosphine (TPP)
Supplier: Aldrich FW: 262.29 m.p., °C 79-81
P
Used as received
Udel
Supplier: Amoco Tg: 187 °C
n
S O O
O
O
Used as received
Ultem
Supplier: GE
nN
O
O
O O
N
O
O
N
O
O
N
O
O
Used as received
6.2.2. Methods6.2.2.1. Melt mixing of phenolic novolac/epoxy resins
Kinetic studies were evaluated for phenolic novolac/Epon 828 epoxy mixtures
prepared with novolac (n=5 or n=2.4). A 65/35 composition was used for the novolac
having n=5 and a 60/40 composition was used for the novolac having n=2.4. Unless
otherwise stated, the novolac resin having n=5 was used in the Results and Discussion
section. Novolac (65 g) was charged to a 500 ml three-necked round bottom flask

197
equipped with a mechanical stirrer and heated to 160°C until a viscous fluid was formed.
Epon 828 epoxy (35 g) was then added. The phenolic novolac/epoxy mixture was stirred
vigorously for 3-5 minutes until a homogenous mixture was obtained. The mixture was
poured into aluminum pans chilled over an isopropanol/dry ice bath, then ground into a
fine powder and stored for later use.
6.2.2.2. Preparation of polymer/TPP sequestered catalysts
Polyimides (Ultem or Matrimid) or polysulfone (Udel) and triphenylphosphine
(up to 50 wt %) were dissolved in a minimal amount of chloroform. The homogeneous
solution was dried in a hood until a viscous material was formed. The mixture was then
chilled under liquid nitrogen and the solidified material was ground into a powder using a
mortar and pestle. The powder was separated using a sieve (mesh size 60). The larger
particles were reground until a fine powder was obtained. This reground powder was
then combined with the original fine powder fraction. The particles were dried under
vacuum for 8 hours at room temperature, then 2 hours at 80°C. Only the “small”
particles which passed through the sieve were used in the kinetic studies described herein.
To remove residual catalyst on the surface of the particles, a thin layer of the
sequestered catalyst particles was placed on a piece of filter paper in a Buchner funnel
and washed with acetone or warm methanol (~30°C). The total exposure time of the
particles in the solvent was limited to approximately 3 minutes.
6.2.2.3. Synthesis of Poly(arylene ether phosphine oxide)
Poly(arylene ether phosphine oxide) [P(AEPO)] was synthesized using the
procedures described in literature.193 The Carother’s equation was used to determine the
amount of reagents needed to obtain a targeted number average molecular weight. A
typical reaction procedure for the synthesis of a 20,000 g/mol P(AEPO) is as follows
193 C. D. Smith, H. Grubbs, H.F. Webster, J. P. Wightman, and J. E. McGrath,
“Poly(Arylene Ether Phosphine Oxide)s. 1. Overview of Chemistry, Thermal-Stability
and Oxygen Plasma Resistance,” Abstract of Papers of the American Chemical Society,
PMSE 52(part 2), 202, (1991).
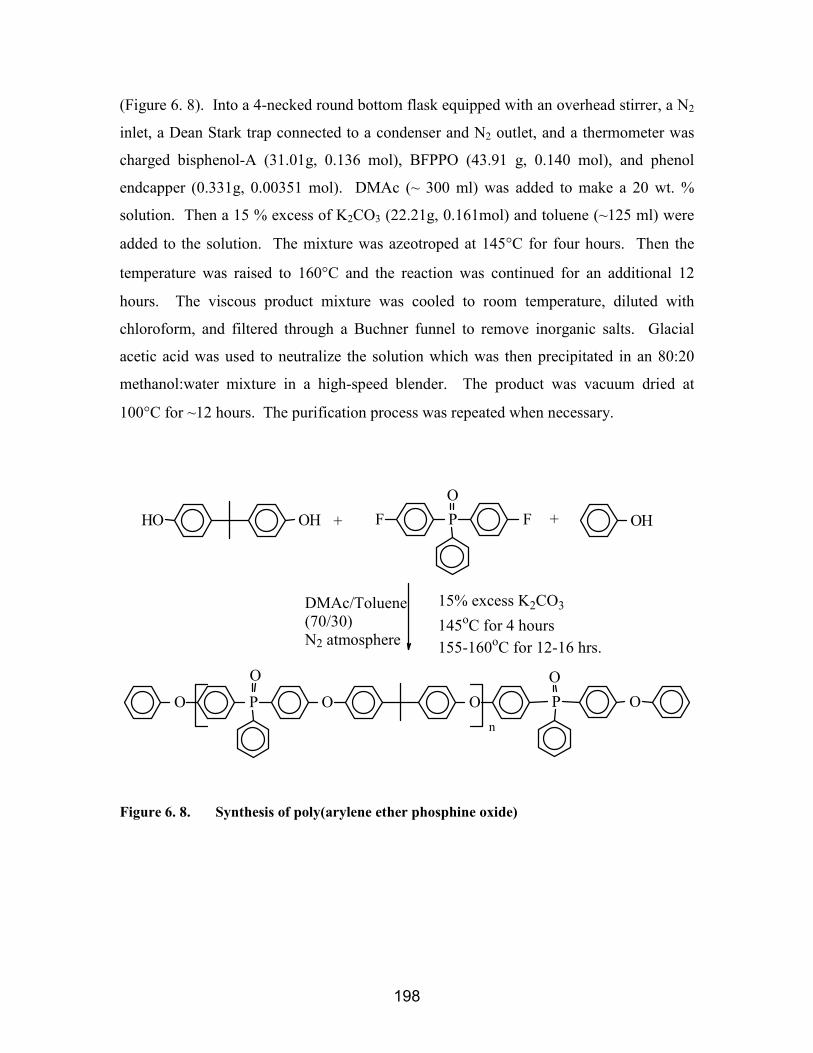
198
(Figure 6. 8). Into a 4-necked round bottom flask equipped with an overhead stirrer, a N2
inlet, a Dean Stark trap connected to a condenser and N2 outlet, and a thermometer was
charged bisphenol-A (31.01g, 0.136 mol), BFPPO (43.91 g, 0.140 mol), and phenol
endcapper (0.331g, 0.00351 mol). DMAc (~ 300 ml) was added to make a 20 wt. %
solution. Then a 15 % excess of K2CO3 (22.21g, 0.161mol) and toluene (~125 ml) were
added to the solution. The mixture was azeotroped at 145°C for four hours. Then the
temperature was raised to 160°C and the reaction was continued for an additional 12
hours. The viscous product mixture was cooled to room temperature, diluted with
chloroform, and filtered through a Buchner funnel to remove inorganic salts. Glacial
acetic acid was used to neutralize the solution which was then precipitated in an 80:20
methanol:water mixture in a high-speed blender. The product was vacuum dried at
100°C for ~12 hours. The purification process was repeated when necessary.
HO OH PF FO
OH
15% excess K2CO3
145oC for 4 hours155-160oC for 12-16 hrs.
DMAc/Toluene(70/30)N2 atmosphere
P OO
O P
O
O O
+ +
n
Figure 6. 8. Synthesis of poly(arylene ether phosphine oxide)
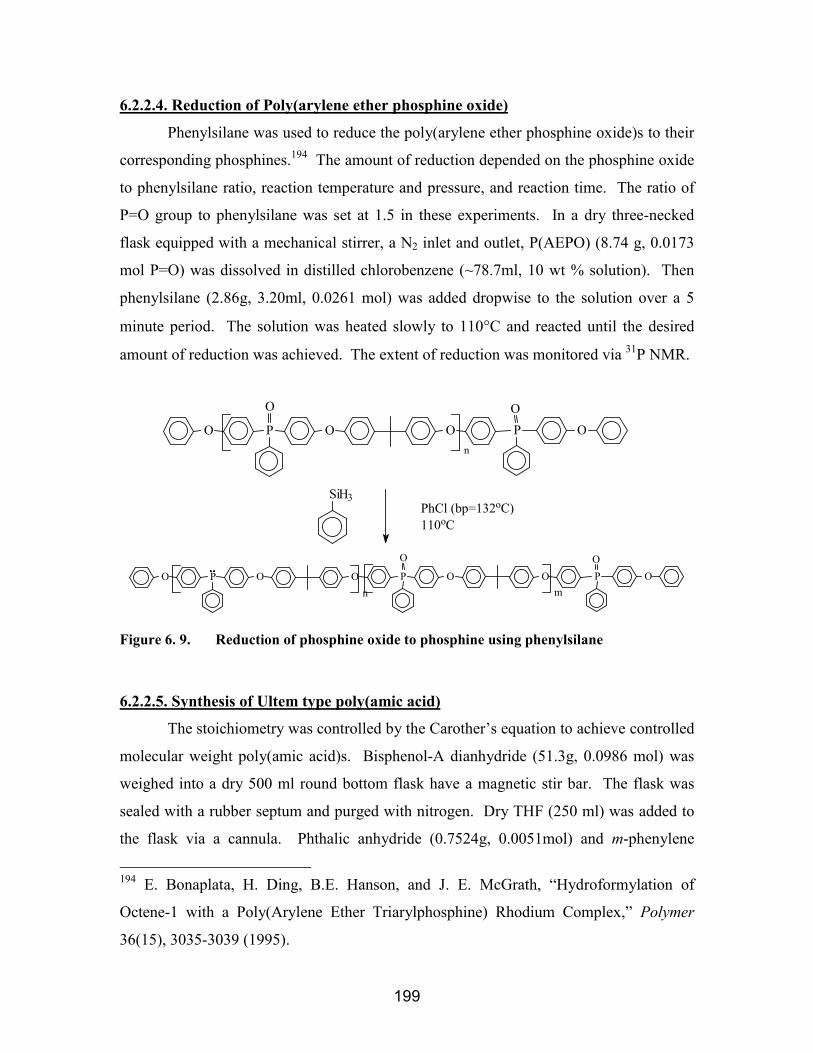
199
6.2.2.4. Reduction of Poly(arylene ether phosphine oxide)
Phenylsilane was used to reduce the poly(arylene ether phosphine oxide)s to their
corresponding phosphines.194 The amount of reduction depended on the phosphine oxide
to phenylsilane ratio, reaction temperature and pressure, and reaction time. The ratio of
P=O group to phenylsilane was set at 1.5 in these experiments. In a dry three-necked
flask equipped with a mechanical stirrer, a N2 inlet and outlet, P(AEPO) (8.74 g, 0.0173
mol P=O) was dissolved in distilled chlorobenzene (~78.7ml, 10 wt % solution). Then
phenylsilane (2.86g, 3.20ml, 0.0261 mol) was added dropwise to the solution over a 5
minute period. The solution was heated slowly to 110°C and reacted until the desired
amount of reduction was achieved. The extent of reduction was monitored via 31P NMR.
PhCl (bp=132oC)110oC
SiH3
n
n
P OO
O P
O
O O
P OO
P
O
O OO P O Om
Figure 6. 9. Reduction of phosphine oxide to phosphine using phenylsilane
6.2.2.5. Synthesis of Ultem type poly(amic acid)
The stoichiometry was controlled by the Carother’s equation to achieve controlled
molecular weight poly(amic acid)s. Bisphenol-A dianhydride (51.3g, 0.0986 mol) was
weighed into a dry 500 ml round bottom flask have a magnetic stir bar. The flask was
sealed with a rubber septum and purged with nitrogen. Dry THF (250 ml) was added to
the flask via a cannula. Phthalic anhydride (0.7524g, 0.0051mol) and m-phenylene
194 E. Bonaplata, H. Ding, B.E. Hanson, and J. E. McGrath, “Hydroformylation of
Octene-1 with a Poly(Arylene Ether Triarylphosphine) Rhodium Complex,” Polymer
36(15), 3035-3039 (1995).
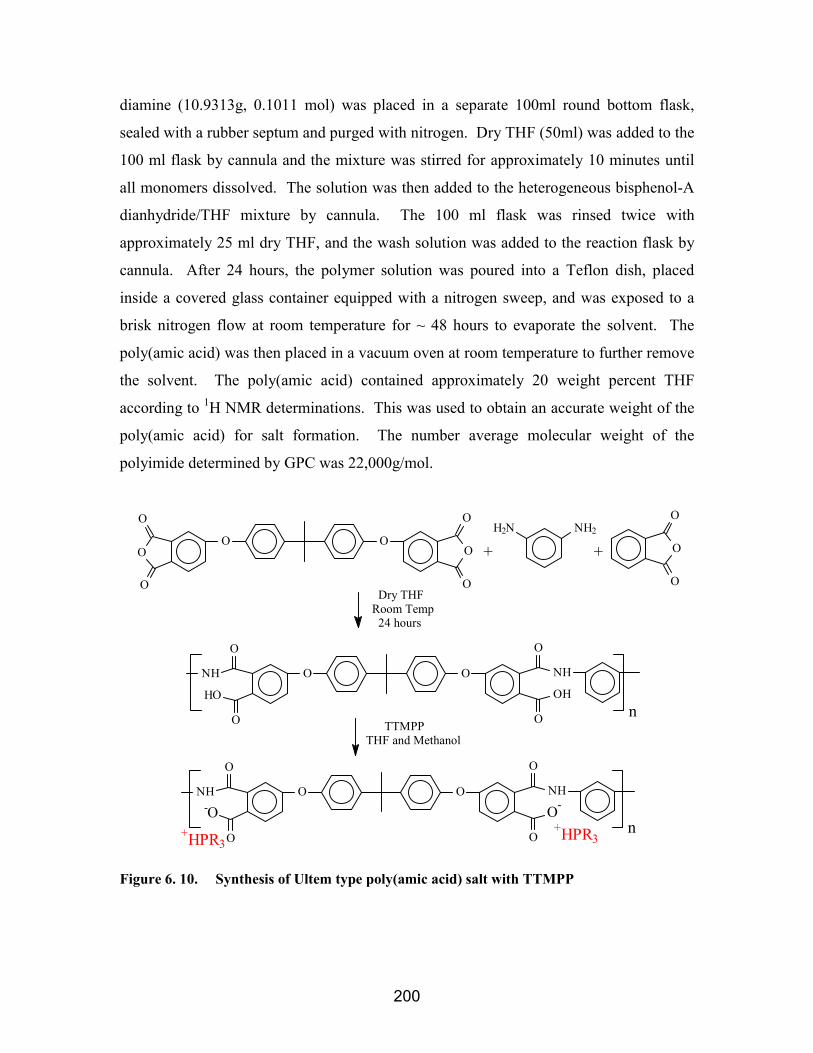
200
diamine (10.9313g, 0.1011 mol) was placed in a separate 100ml round bottom flask,
sealed with a rubber septum and purged with nitrogen. Dry THF (50ml) was added to the
100 ml flask by cannula and the mixture was stirred for approximately 10 minutes until
all monomers dissolved. The solution was then added to the heterogeneous bisphenol-A
dianhydride/THF mixture by cannula. The 100 ml flask was rinsed twice with
approximately 25 ml dry THF, and the wash solution was added to the reaction flask by
cannula. After 24 hours, the polymer solution was poured into a Teflon dish, placed
inside a covered glass container equipped with a nitrogen sweep, and was exposed to a
brisk nitrogen flow at room temperature for ~ 48 hours to evaporate the solvent. The
poly(amic acid) was then placed in a vacuum oven at room temperature to further remove
the solvent. The poly(amic acid) contained approximately 20 weight percent THF
according to 1H NMR determinations. This was used to obtain an accurate weight of the
poly(amic acid) for salt formation. The number average molecular weight of the
polyimide determined by GPC was 22,000g/mol.
O OOO
O
O
O
O
H2N NH2
O
O
O Dry THFRoom Temp 24 hours
O O
O
O O
O
NH
HO
NH
OHn
+ +
TTMPPTHF and Methanol
n
O O
O
O O
O
NH-O
NH
O-
+HPR3+HPR3
Figure 6. 10. Synthesis of Ultem type poly(amic acid) salt with TTMPP
201
6.2.2.6. Preparation of Ultem type poly(amic acid) salt with TTMPP
To a 2000 ml beaker with a magnetic stir bar was added THF (1000ml), methanol
(500 ml), and TTMPP (52.3 g, 0.098 mol, a 10 % excess relative to carboxylic acid
groups). Once the TTMPP had dissolved, the poly(amic acid) (28.1 g, 0.089 mol) was
added. The solution was stirred for 6 hours until all of the poly(amic acid) had dissolved,
then poured into a Teflon boat to evaporate the solvent.
6.2.2.7. Synthesis of FDA/BPDA based poly(amic acid) salts
Tertiary amine salts of FDA/BPDA poly(amic acid)s were prepared using the
following general approach. In a flame dried 100 ml round bottom flask containing a
magnetic stir bar, BPDA (2.51 g, 0.008475 mol) and FDA (3 g, 0.008460 mol) were
dissolved in distilled DMAc (20 ml) and reacted at room temperature for 2-3 hours to
form poly(amic acid). Tertiary amine, trihexylamine or imidazole (0.00888 mol),
predissolved in isopropanol was added dropwise to the poly(amic acid) solution while
stirring vigorously. The stirring was continued until a homogenous solution was
obtained. The poly(amic acid) salt solution was vacuum distilled at ~70°C to remove
most of the solvent and then placed in a vacuum oven at ~80°C overnight.
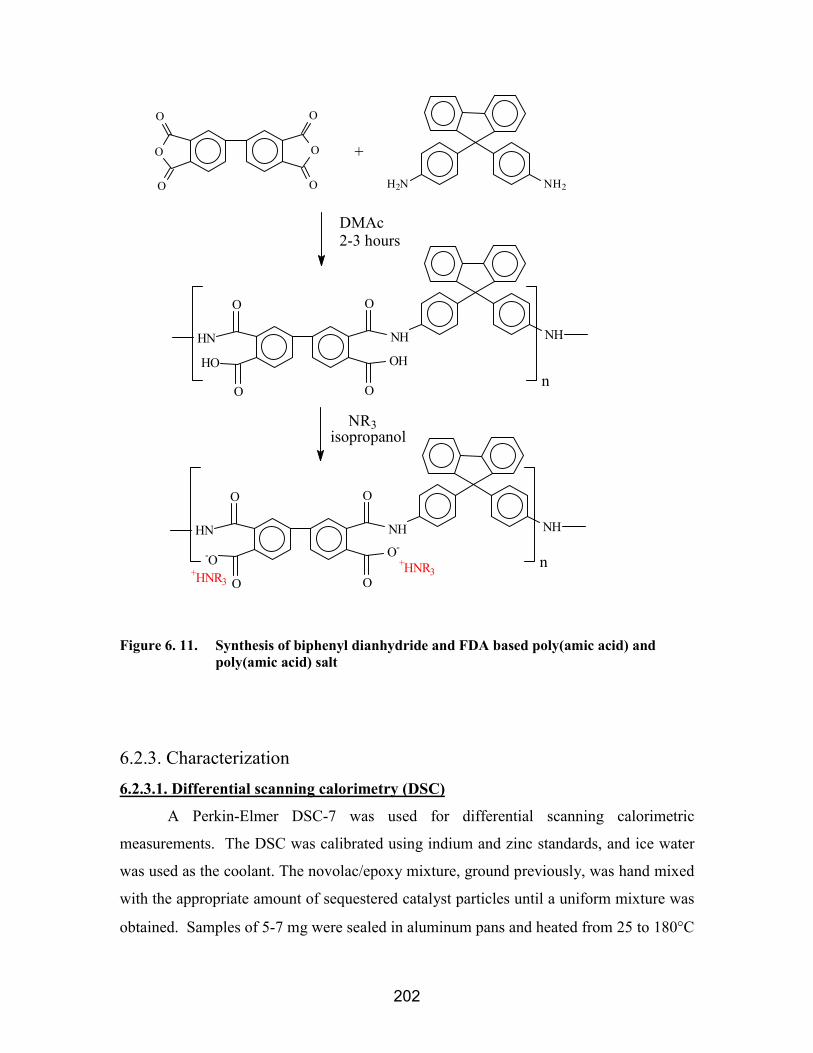
202
O O
O O
OO H2N NH2
+
NH
O
O
O
O
HN
HO
NH
OH
DMAc2-3 hours
NR3isopropanol
NH
O
O
O
O
HN
-O
NH
O-+HNR3+HNR3
n
n
Figure 6. 11. Synthesis of biphenyl dianhydride and FDA based poly(amic acid) andpoly(amic acid) salt
6.2.3. Characterization6.2.3.1. Differential scanning calorimetry (DSC)
A Perkin-Elmer DSC-7 was used for differential scanning calorimetric
measurements. The DSC was calibrated using indium and zinc standards, and ice water
was used as the coolant. The novolac/epoxy mixture, ground previously, was hand mixed
with the appropriate amount of sequestered catalyst particles until a uniform mixture was
obtained. Samples of 5-7 mg were sealed in aluminum pans and heated from 25 to 180°C
203
at 10°C/min. The glass transition temperatures were calculated as the midpoint of the
curves.
For isothermal analysis, samples were heated from room temperature to the
chosen processing or reaction temperature at 200ºC/min, followed by monitoring the heat
capacity as a function of time. The time to 99 % conversion was calculated by using the
partial peak area from the exotherm of isothermal DSC analyses.
6.2.3.2. Viscosity measurements
A Brookfield DV-III Programmable Rheometer was used to determine the
isothermal viscosities of novolac/epoxy mixtures at processing temperatures.
Approximately 10 g of powder samples were placed in disposable sample tubes and
heated to the test temperatures. A spindle, which was driven through a calibrated spring,
was immersed in the test fluid. The viscous drag of the fluid against the spindle was
measured by the spring deflection. The torque was used to calculate the viscosities.
6.2.3.4. 1H NMR1H NMR and 13C NMR spectra were obtained on a Varian Unity 400 NMR
spectrometer. For 1H NMR, 5 mm tubes containing approximately 20 mg sample
dissolved in chloroform-d, acetone-d6, or DMSO-d6 were analyzed under ambient
conditions. The experimental parameters included a 1.0 second relaxation delay, 23.6
degree pulse, and 6744.9 Hz spectral width. Thirty-two repetitions were performed for
each sample.
6.2.3.5. 31P NMR
Solution Phosphorus (31P) NMR spectra were also obtained on a Varian 400 MHz
instrument, corresponding to a phosphorus frequency of 161.9 MHz. All spectra were
referenced to 85% H3PO4 at 0 ppm, and dichlorophenyl phosphine sulfide was used as a
standard (76.05 ppm).

204
6.2.3.6. Scanning electron microscopy
SEM was used to investigate the surface structures as well as the cross-sections of
particles. For particle surface analysis, particles were adhered to the plate. For cross-
section analysis, particles were potted in epoxy resin and microtomed until a smooth
cross-section was obtained.
6.2.3.7. Thermogravimetric analysis
A Perkin-Elmer TGA-7 Thermogravimetric analyzer was used to determine the
thermal and thermo-oxidative stabilities of the cresol novolac/epoxy networks. Samples
of approximately 5-8 mg were placed in a platinum sample pan and heated in a furnace
from 30 to 900°C at 10°C/min. Air or nitrogen was used as the carrier gas. The sample
weight loss was monitored as a function of temperature or time.
6.2.4. Composite preparation and testing methods6.2.4.1. Synthesis of Ultem type poly(amic acid) salt with trihexylamine
An Ultem type poly(amic acid) salt was obtained by first reacting Bisphenol-A
dianhydride with meta-phenylene diamine to form poly(amic acid); it was then mixed
with trihexylamine to form the poly(amic acid) salt (Figure 6. 12). Bisphenol-A
dianhydride (22.97 g, 0.04415 mol) was dissolved in dry THF (150 ml) in a flame-dried
500 ml round bottom flask with a stir bar. In a separate 100 ml flame dried flask, meta-
phenylene diamine (4.877g, 0.04512 mol) was dissolved in dry THF (25 ml). The meta-
phenylene diamine solution was added to the Bisphenol-A solution via a cannula. The
100 ml flask was rinsed twice with ~ 25 ml dried THF, and the wash solution was added
to the reaction flask. The mixture was allowed to react at room temperature for 24 hours.
Trihexylamine (25g, 0.101 mol, 5 % excess over the acid groups), dissolved in methanol
(60 ml), was added dropwise to the poly(amic acid) solution. The mixture was stirred for
2 hours. The solution containing the poly(amic acid) acid salt was poured into a Teflon
dish, air dried at room temperature overnight, then placed in a vacuum oven to further
remove the solvent.
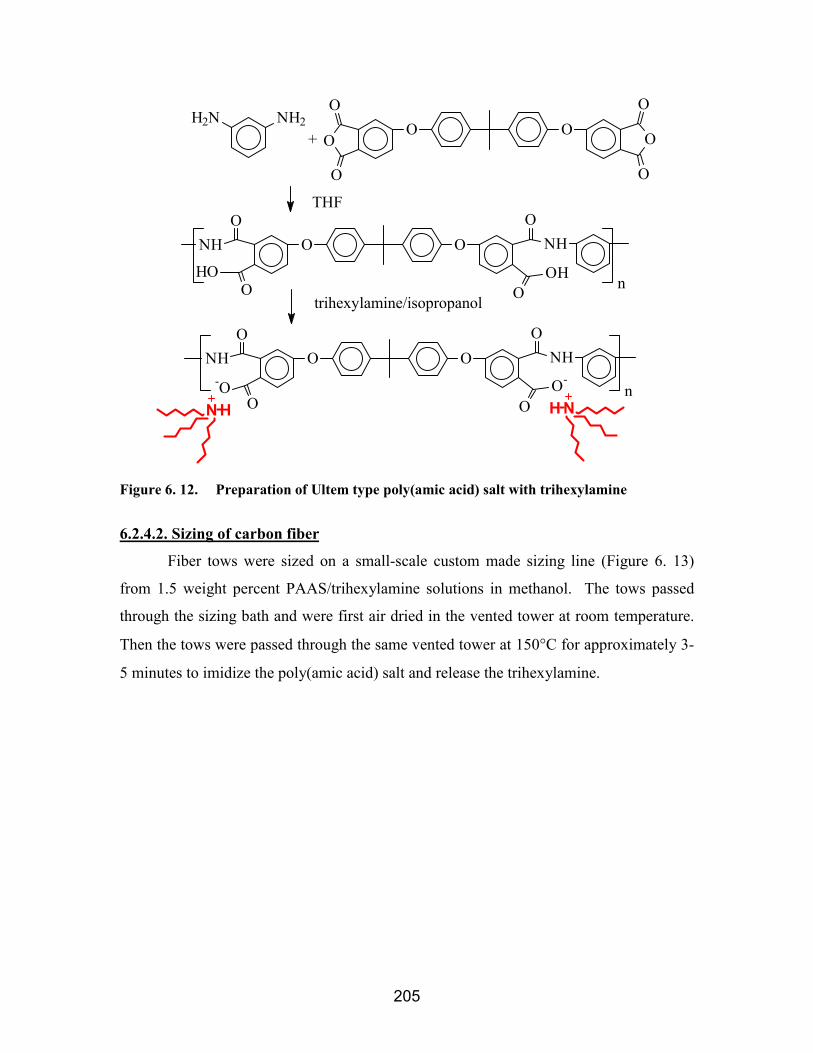
205
trihexylamine/isopropanol
THF
+ O O OO
O
O
O
O
n
O OO
O O
ONH NH
OHHO
O OO
O O
ONH
-O
NH
O-n
N H NH
H2N NH2
Figure 6. 12. Preparation of Ultem type poly(amic acid) salt with trihexylamine
6.2.4.2. Sizing of carbon fiber
Fiber tows were sized on a small-scale custom made sizing line (Figure 6. 13)
from 1.5 weight percent PAAS/trihexylamine solutions in methanol. The tows passed
through the sizing bath and were first air dried in the vented tower at room temperature.
Then the tows were passed through the same vented tower at 150°C for approximately 3-
5 minutes to imidize the poly(amic acid) salt and release the trihexylamine.
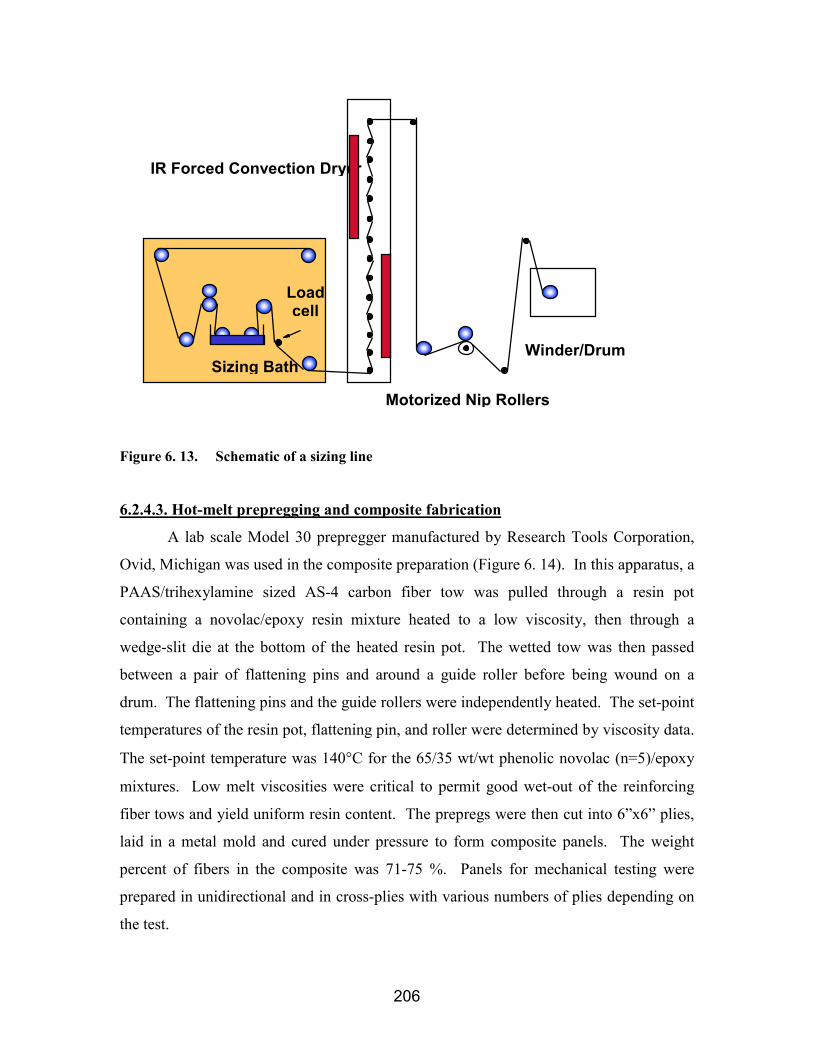
206
Figure 6. 13. Schematic of a sizing line
6.2.4.3. Hot-melt prepregging and composite fabrication
A lab scale Model 30 prepregger manufactured by Research Tools Corporation,
Ovid, Michigan was used in the composite preparation (Figure 6. 14). In this apparatus, a
PAAS/trihexylamine sized AS-4 carbon fiber tow was pulled through a resin pot
containing a novolac/epoxy resin mixture heated to a low viscosity, then through a
wedge-slit die at the bottom of the heated resin pot. The wetted tow was then passed
between a pair of flattening pins and around a guide roller before being wound on a
drum. The flattening pins and the guide rollers were independently heated. The set-point
temperatures of the resin pot, flattening pin, and roller were determined by viscosity data.
The set-point temperature was 140°C for the 65/35 wt/wt phenolic novolac (n=5)/epoxy
mixtures. Low melt viscosities were critical to permit good wet-out of the reinforcing
fiber tows and yield uniform resin content. The prepregs were then cut into 6”x6” plies,
laid in a metal mold and cured under pressure to form composite panels. The weight
percent of fibers in the composite was 71-75 %. Panels for mechanical testing were
prepared in unidirectional and in cross-plies with various numbers of plies depending on
the test.
Sizing Bath
IR Forced Convection Dryer
Motorized Nip Rollers
Loadcell
Winder/Drum

207
Figure 6. 14. Schematic representation of the hot melt prepregging process
6.2.4.4. Composite fiber volume fraction
The fiber volume fractions of the composites were calculated by first determining
the density of the composite using Archimedes’ principle. The weight of a composite
specimen was measured in air and in water. The density of the composite can be
calculated using the following equation.
ρc = Wair/(Wair-Wwater) * ρwater (6. 1)
where ρc is the density of the composite, ρwater is the density of water, Wair is the weight
of the sample in air, and Wwater is weight of the sample in water. The fiber volume
fraction was then calculated using the rule of mixtures
ν = (ρc-ρresin)/( ρfiber-ρresin) (6. 2)
where ν is the fiber volume fraction, ρfiber is the density of the carbon fiber = 1.8 g/cc,
ρresin is the density of the resin = 1.23 g/cc, and ρc is the composite density calculated
from equation (6.1).
Tensioner
Guid Roller
Resin Pot
Wedge-slit Die
Flattening Pins
Guide Roller
Drum Winder
Fiber Spool
36K Sized AS4 Carbon Fiber Tow
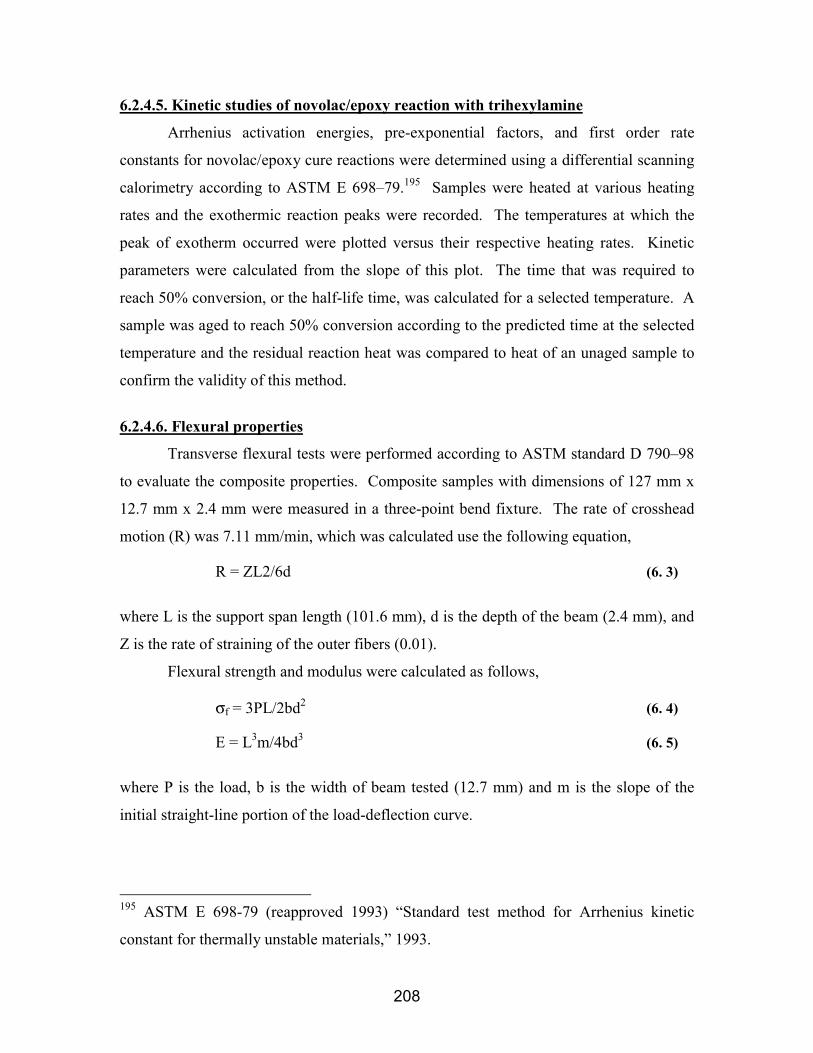
208
6.2.4.5. Kinetic studies of novolac/epoxy reaction with trihexylamine
Arrhenius activation energies, pre-exponential factors, and first order rate
constants for novolac/epoxy cure reactions were determined using a differential scanning
calorimetry according to ASTM E 698–79.195 Samples were heated at various heating
rates and the exothermic reaction peaks were recorded. The temperatures at which the
peak of exotherm occurred were plotted versus their respective heating rates. Kinetic
parameters were calculated from the slope of this plot. The time that was required to
reach 50% conversion, or the half-life time, was calculated for a selected temperature. A
sample was aged to reach 50% conversion according to the predicted time at the selected
temperature and the residual reaction heat was compared to heat of an unaged sample to
confirm the validity of this method.
6.2.4.6. Flexural properties
Transverse flexural tests were performed according to ASTM standard D 790–98
to evaluate the composite properties. Composite samples with dimensions of 127 mm x
12.7 mm x 2.4 mm were measured in a three-point bend fixture. The rate of crosshead
motion (R) was 7.11 mm/min, which was calculated use the following equation,
R = ZL2/6d (6. 3)
where L is the support span length (101.6 mm), d is the depth of the beam (2.4 mm), and
Z is the rate of straining of the outer fibers (0.01).
Flexural strength and modulus were calculated as follows,
σf = 3PL/2bd2 (6. 4)
E = L3m/4bd3 (6. 5)
where P is the load, b is the width of beam tested (12.7 mm) and m is the slope of the
initial straight-line portion of the load-deflection curve.
195 ASTM E 698-79 (reapproved 1993) “Standard test method for Arrhenius kinetic
constant for thermally unstable materials,” 1993.
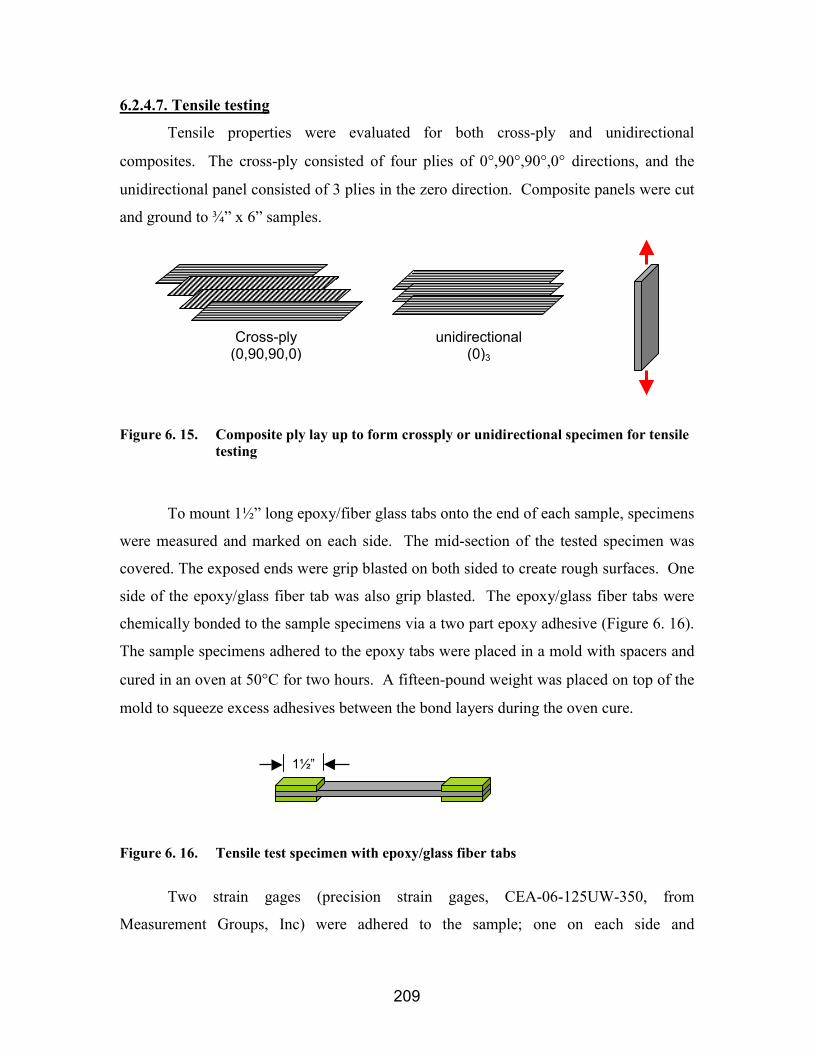
209
6.2.4.7. Tensile testing
Tensile properties were evaluated for both cross-ply and unidirectional
composites. The cross-ply consisted of four plies of 0°,90°,90°,0° directions, and the
unidirectional panel consisted of 3 plies in the zero direction. Composite panels were cut
and ground to ¾” x 6” samples.
Figure 6. 15. Composite ply lay up to form crossply or unidirectional specimen for tensiletesting
To mount 1½” long epoxy/fiber glass tabs onto the end of each sample, specimens
were measured and marked on each side. The mid-section of the tested specimen was
covered. The exposed ends were grip blasted on both sided to create rough surfaces. One
side of the epoxy/glass fiber tab was also grip blasted. The epoxy/glass fiber tabs were
chemically bonded to the sample specimens via a two part epoxy adhesive (Figure 6. 16).
The sample specimens adhered to the epoxy tabs were placed in a mold with spacers and
cured in an oven at 50°C for two hours. A fifteen-pound weight was placed on top of the
mold to squeeze excess adhesives between the bond layers during the oven cure.
Figure 6. 16. Tensile test specimen with epoxy/glass fiber tabs
Two strain gages (precision strain gages, CEA-06-125UW-350, from
Measurement Groups, Inc) were adhered to the sample; one on each side and
Cross-ply(0,90,90,0)
unidirectional(0)3
1½”

210
perpendicular to each other. The transverse strain and the axial strain can thus be
measured by monitoring the changes in voltages due to expansion or contraction of the
test specimen. Wires were soldered onto the strain gages.
Tests were performed on a servo-hydraulic MTS test frame in load control mode.
A loading rate of 100 pounds per second was applied. The loading cycle was
programmed into the MicroprofilerTM, which controlled the instrument once a test was
begun. A pair of MTS Model 647 hydraulic wedge grips, a 448.82 test controller, a
418.91 MicroprofilerTM, a 413.81 master controller and a 464.80 data display unit were
used. The signals from the extensometers were amplified using a 2310 Vishay
Measurement group amplifier box. LabView software was used to monitor the load,
stroke and strain signals during the tests.
The ultimate tensile strength (Ftu) was determined using
Ftu = Pmax/A (6. 6)
where Pmax is the maximum load prior to failure and A is the average cross-sectional area
of the specimen. The tensile strain (εi) was calculated from the extensometer
displacement (δi) and the extensometer gage length (Lg)
εi = δi/Lg (6. 7)
The Poissons ratio (ν) relates transverse strain (∆εt) and axial strain (∆εl)
ν = - ∆εt/∆εl (6. 8)
6.2.4.8. Mode II Toughness (GIIC)
Ten plies of unidirectional fiber with 0.05 mm thick delamination tab placed
midway through the laminate were cured. The delamination tab was 2” (50.8 mm) from
the outside edge of the panel. The panel was cut and ground to 12.5x2.0 cm (5”x0.79”)
sample size with approximately 1½” tab remaining in the composite. A natural initial
crack approximately 1 mm past the delamination tab was generated by placing a thin
wedge in the crack and tapping lightly with a hammer.
The compliance (C’) of the uncracked portion of the sample was tested using an
end notched flexural specimen geometry in a three-point bend loading (Figure 6. 17).

211
Figure 6. 17. Compliance determination of the uncracked sample
The flexural modulus (Ef) can be calculated using
3
3
f h C' b 4L E = (6. 9)
where L = half the span,
b = specimen width,
C’ = compliance of the uncracked sample
h = half of the specimen height.
The sample was then loaded in a 4” (101.1 mm) span in a three point bend fixture.
The sample was placed such that a/I ~ 0.5. The sample was tested at 0.5 mm/min
deflection rate until the crack propagated to the center of the sample.
Figure 6. 18. Compliance determination of cracked samples
A corrected crack length (acorr) was calculated using the flexural modulus and the
compliance of the pre-crack sample.
31
3f
corr 3Cbh E 8 a
= (6. 10)
3
0.5 mm/minLoad up to 0.25N
1 0.5 mm/min deflection rateuntil the crack propagated tothe center of the sample
4

212
where C is the compliance of the pre-crack sample.
The GIIC can then be calculated from the load and displacement at failure (P and
∆) and the corrected crack length.
)3a L (2 b 2Pa 9 3
c3
2c
2C+
∆=G (6. 11)
The failure was assigned as the onset of the crack. The specimen did not break when the
crack reached the midpoint.
6.3. Results and DiscussionThe phenolic novolac (n=5) /epoxy resin system investigated in this research must
be heated to approximately 140°C to achieve the low viscosities necessary to wet-out the
reinforcing fiber in composite preparations. The addition of a small amount of tertiary
amine or phosphine catalyst in novolac/epoxy mixtures at this temperature causes
premature reactions and reduces the processing window to minutes or even seconds.
Curing novolac/epoxy mixtures in the absence of a catalyst requires long cure times at
high temperatures and is unpractical. Therefore, a latent catalyst is needed for the
novolac/epoxy reaction to achieve both good processability at 140°C and reasonably fast
cure rates between 200-240°C. The ideal catalyst would be inert at processing
temperatures, yet would cause reactivity at cure temperatures.
Several approaches for preparing thermally latent catalysts were examined in this
research. The basic principle involves encapsulating or sequestering a tertiary amine or
phosphine in a thermoplastic polymer where the Tg of the sequestered catalyst fall
between the processing temperature and the cure temperature. Ideally, the amine or
phosphine catalyst will be immobilized in the glassy material at the processing
temperature, but is released at the cure temperature to catalyze the novolac/epoxy
reaction.

213
6.3.1. Miscible polyimide/TPP sequestered catalysts6.3.1.1. Effect of TPP on the glass transition temperatures of the blends
Two commercially available polyimides, Ultem and Matrimid, were examined.
The miscibility of the polyimide with TPP was established by measuring the glass
transition temperatures of the blends as a function of blend composition. A single glass
transition temperature between those of the two pure components is indicative of a
miscible blend. As expected, TPP plasticized both polyimides as shown by the decreased
glass transition temperatures with increased TPP content (Figure 6. 19).
120140160180200220
0 10 20
TPP Content (%)
Tg (o C
)
190
240
290
340
0 20 40 60
TPP content (%)
Tg (o C
)
Figure 6. 19. Glass transition temperature of polyimide/ TPP blend measured as afunction of TPP content a) Ultem /TPP blend b) Matrimid /TPP blend
Only small amounts of TPP (3-9 wt %) can be added to Ultem while maintaining
the preferred blend glass transition temperatures (between the processing temperature and
cure temperature, preferably between 180 and 200°C). For these blends to be used as
catalysts, large loadings would be required to achieve high reaction rates since the TPP
contents are low in these particles. Udel/TPP catalysts are thus impractical for catalyzing
the novolac/epoxy reactions. Matrimid, on the other hand, possesses a much higher glass
transition temperature. Therefore significantly more TPP can be mixed with Matrimid
while maintaining the desirable Tgs. The 50/50 Matrimid/TPP blend composition had a
glass transition temperature (~200°C) which lay in the targeted range.
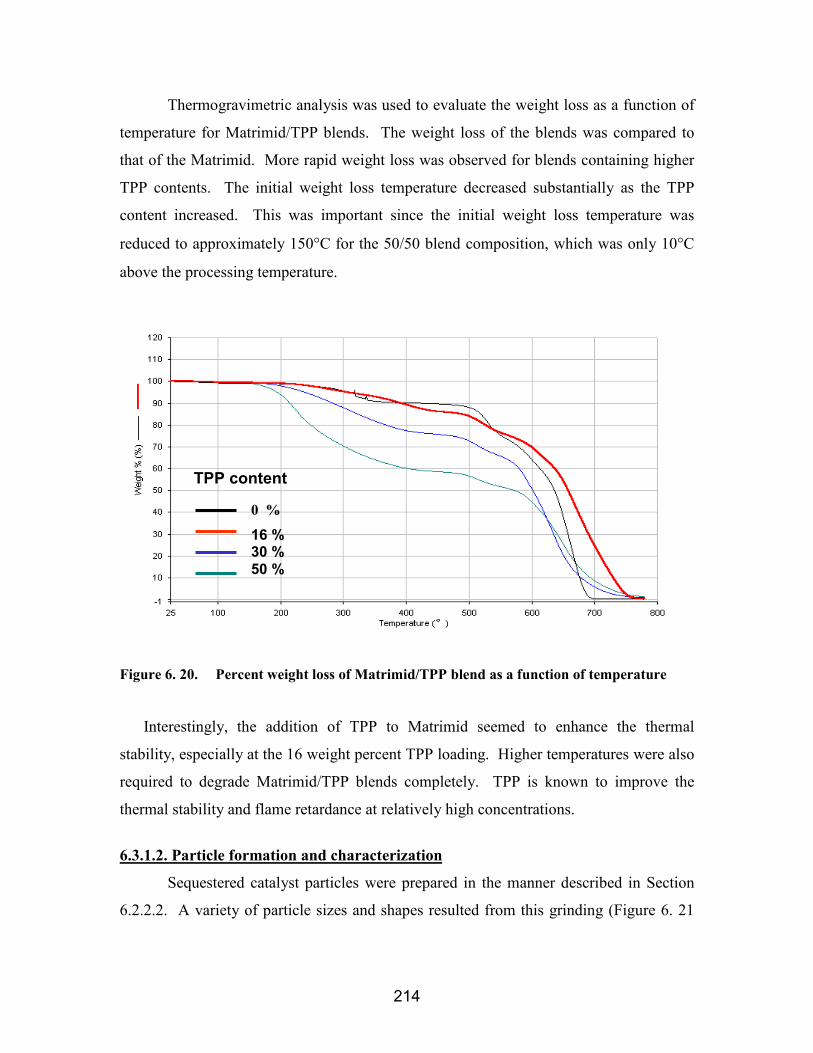
214
Thermogravimetric analysis was used to evaluate the weight loss as a function of
temperature for Matrimid/TPP blends. The weight loss of the blends was compared to
that of the Matrimid. More rapid weight loss was observed for blends containing higher
TPP contents. The initial weight loss temperature decreased substantially as the TPP
content increased. This was important since the initial weight loss temperature was
reduced to approximately 150°C for the 50/50 blend composition, which was only 10°C
above the processing temperature.
Figure 6. 20. Percent weight loss of Matrimid/TPP blend as a function of temperature
Interestingly, the addition of TPP to Matrimid seemed to enhance the thermal
stability, especially at the 16 weight percent TPP loading. Higher temperatures were also
required to degrade Matrimid/TPP blends completely. TPP is known to improve the
thermal stability and flame retardance at relatively high concentrations.
6.3.1.2. Particle formation and characterization
Sequestered catalyst particles were prepared in the manner described in Section
6.2.2.2. A variety of particle sizes and shapes resulted from this grinding (Figure 6. 21
0 %
16 %30 %50 %
TPP content
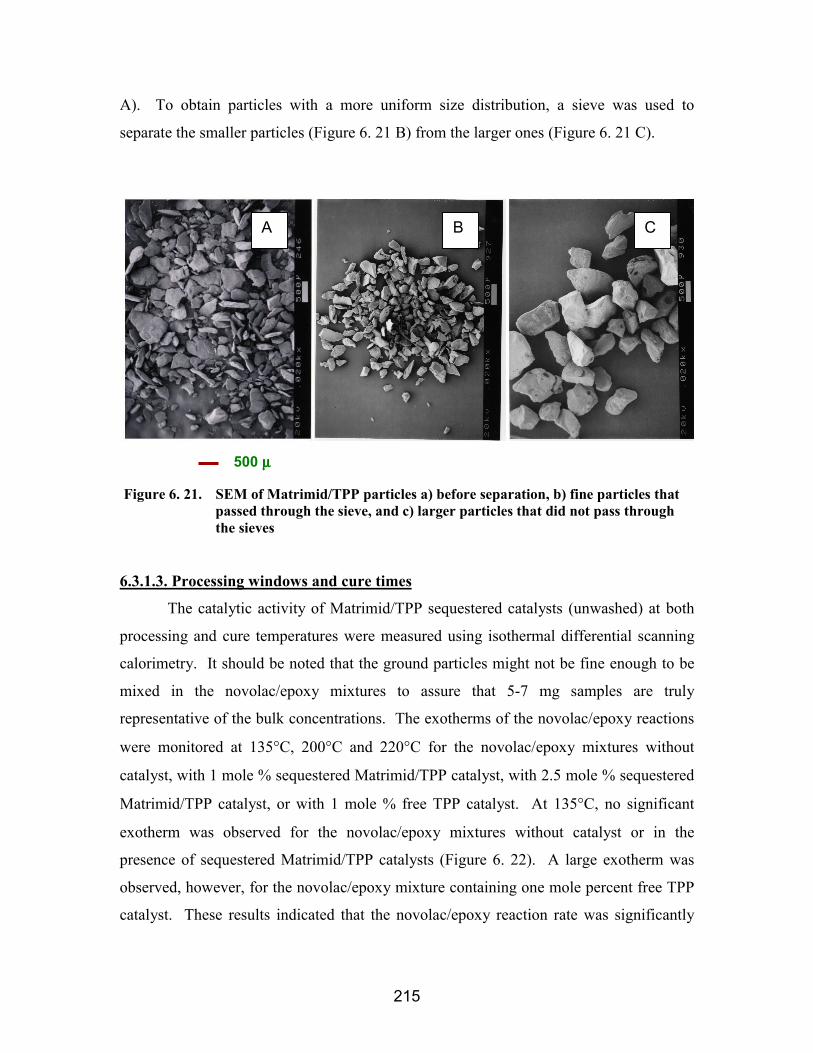
215
A). To obtain particles with a more uniform size distribution, a sieve was used to
separate the smaller particles (Figure 6. 21 B) from the larger ones (Figure 6. 21 C).
Figure 6. 21. SEM of Matrimid/TPP particles a) before separation, b) fine particles thatpassed through the sieve, and c) larger particles that did not pass throughthe sieves
6.3.1.3. Processing windows and cure times
The catalytic activity of Matrimid/TPP sequestered catalysts (unwashed) at both
processing and cure temperatures were measured using isothermal differential scanning
calorimetry. It should be noted that the ground particles might not be fine enough to be
mixed in the novolac/epoxy mixtures to assure that 5-7 mg samples are truly
representative of the bulk concentrations. The exotherms of the novolac/epoxy reactions
were monitored at 135°C, 200°C and 220°C for the novolac/epoxy mixtures without
catalyst, with 1 mole % sequestered Matrimid/TPP catalyst, with 2.5 mole % sequestered
Matrimid/TPP catalyst, or with 1 mole % free TPP catalyst. At 135°C, no significant
exotherm was observed for the novolac/epoxy mixtures without catalyst or in the
presence of sequestered Matrimid/TPP catalysts (Figure 6. 22). A large exotherm was
observed, however, for the novolac/epoxy mixture containing one mole percent free TPP
catalyst. These results indicated that the novolac/epoxy reaction rate was significantly
500 µµµµ
A B C
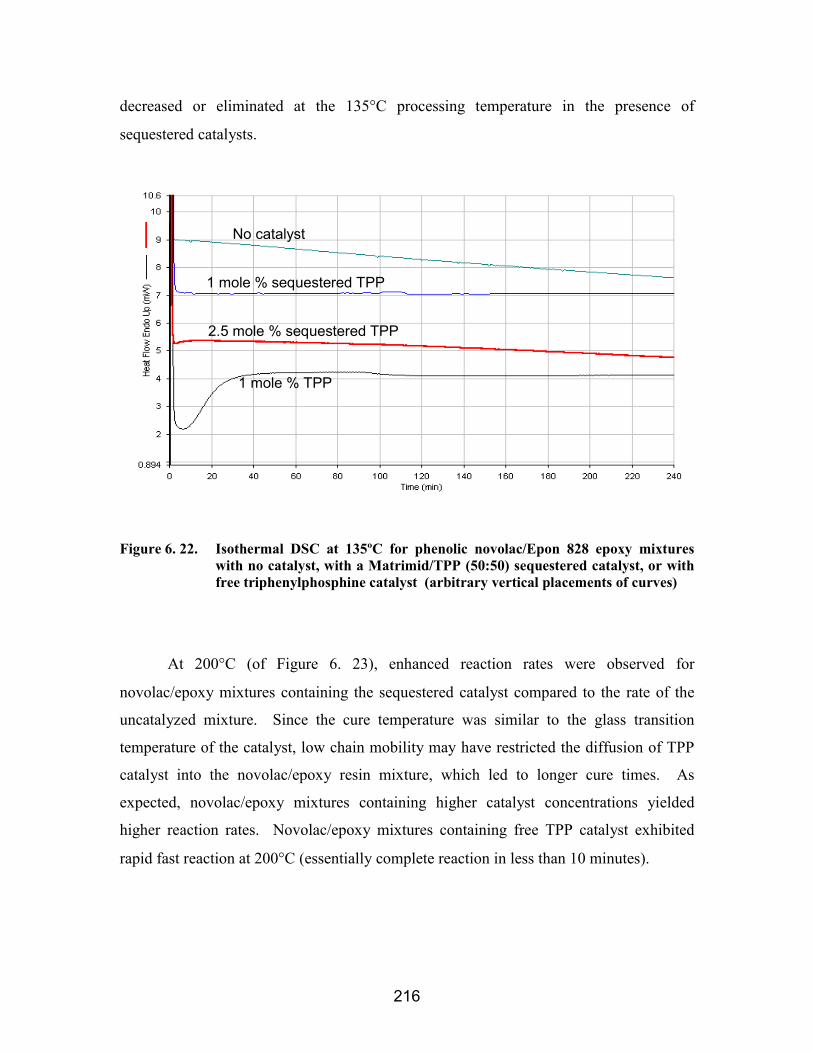
216
decreased or eliminated at the 135°C processing temperature in the presence of
sequestered catalysts.
Figure 6. 22. Isothermal DSC at 135ºC for phenolic novolac/Epon 828 epoxy mixtureswith no catalyst, with a Matrimid/TPP (50:50) sequestered catalyst, or withfree triphenylphosphine catalyst (arbitrary vertical placements of curves)
At 200°C (of Figure 6. 23), enhanced reaction rates were observed for
novolac/epoxy mixtures containing the sequestered catalyst compared to the rate of the
uncatalyzed mixture. Since the cure temperature was similar to the glass transition
temperature of the catalyst, low chain mobility may have restricted the diffusion of TPP
catalyst into the novolac/epoxy resin mixture, which led to longer cure times. As
expected, novolac/epoxy mixtures containing higher catalyst concentrations yielded
higher reaction rates. Novolac/epoxy mixtures containing free TPP catalyst exhibited
rapid fast reaction at 200°C (essentially complete reaction in less than 10 minutes).
1 mole % TPP
1 mole % sequestered TPP
No catalyst
2.5 mole % sequestered TPP
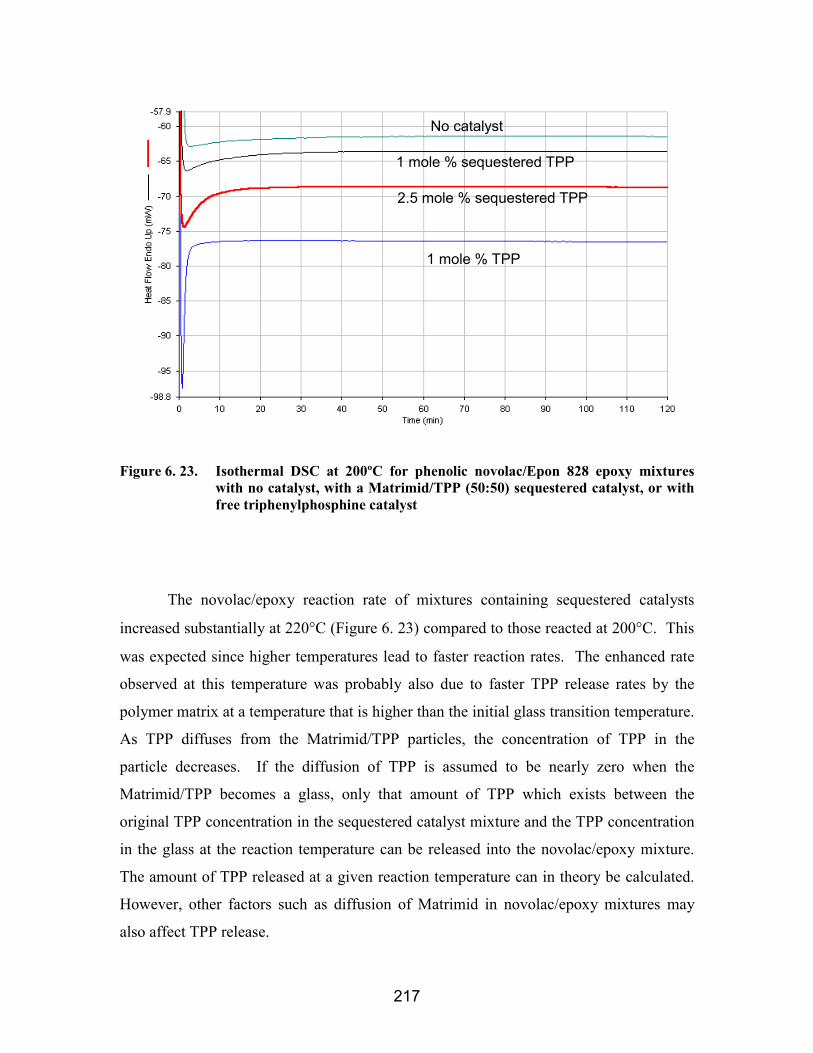
217
Figure 6. 23. Isothermal DSC at 200ºC for phenolic novolac/Epon 828 epoxy mixtureswith no catalyst, with a Matrimid/TPP (50:50) sequestered catalyst, or withfree triphenylphosphine catalyst
The novolac/epoxy reaction rate of mixtures containing sequestered catalysts
increased substantially at 220°C (Figure 6. 23) compared to those reacted at 200°C. This
was expected since higher temperatures lead to faster reaction rates. The enhanced rate
observed at this temperature was probably also due to faster TPP release rates by the
polymer matrix at a temperature that is higher than the initial glass transition temperature.
As TPP diffuses from the Matrimid/TPP particles, the concentration of TPP in the
particle decreases. If the diffusion of TPP is assumed to be nearly zero when the
Matrimid/TPP becomes a glass, only that amount of TPP which exists between the
original TPP concentration in the sequestered catalyst mixture and the TPP concentration
in the glass at the reaction temperature can be released into the novolac/epoxy mixture.
The amount of TPP released at a given reaction temperature can in theory be calculated.
However, other factors such as diffusion of Matrimid in novolac/epoxy mixtures may
also affect TPP release.
1 mole % TPP
No catalyst
1 mole % sequestered TPP
2.5 mole % sequestered TPP
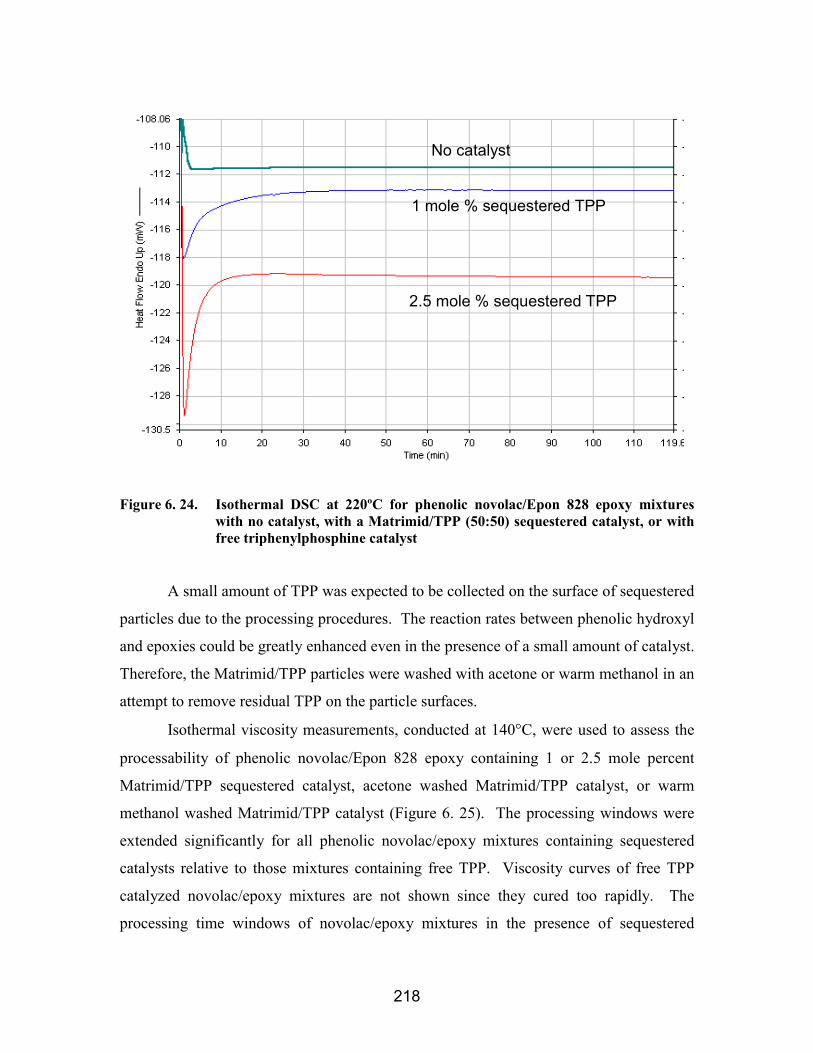
218
Figure 6. 24. Isothermal DSC at 220ºC for phenolic novolac/Epon 828 epoxy mixtureswith no catalyst, with a Matrimid/TPP (50:50) sequestered catalyst, or withfree triphenylphosphine catalyst
A small amount of TPP was expected to be collected on the surface of sequestered
particles due to the processing procedures. The reaction rates between phenolic hydroxyl
and epoxies could be greatly enhanced even in the presence of a small amount of catalyst.
Therefore, the Matrimid/TPP particles were washed with acetone or warm methanol in an
attempt to remove residual TPP on the particle surfaces.
Isothermal viscosity measurements, conducted at 140°C, were used to assess the
processability of phenolic novolac/Epon 828 epoxy containing 1 or 2.5 mole percent
Matrimid/TPP sequestered catalyst, acetone washed Matrimid/TPP catalyst, or warm
methanol washed Matrimid/TPP catalyst (Figure 6. 25). The processing windows were
extended significantly for all phenolic novolac/epoxy mixtures containing sequestered
catalysts relative to those mixtures containing free TPP. Viscosity curves of free TPP
catalyzed novolac/epoxy mixtures are not shown since they cured too rapidly. The
processing time windows of novolac/epoxy mixtures in the presence of sequestered
No catalyst
1 mole % sequestered TPP
2.5 mole % sequestered TPP

219
catalysts were reduced relative to those of the uncatalyzed mixtures. Mixtures containing
larger amounts of catalyst not only led to reduced processing windows but also to higher
initial viscosities (5-6 Pa*s) than those having lower concentrations (3-4 Pa*s). The
processing windows improved for novolac/epoxy mixtures containing washed
Matrimid/TPP sequestered catalysts.
0
4
8
12
16
20
0 20 40 60 80Time (min)
Visc
osity
(Pa
s) 1 mol% unwashed
2.5 mol % unwashed
1 mol % acetone washed
2.5 mol % acetone washed
1 mol % methanol washed
2 5 l % h l
Figure 6. 25. Isothermal viscosity at 140ºC for phenolic novolac /Epon 828 epoxy mixtureswith Matrimid/TPP sequestered catalysts (50:50), unwashed, acetonewashed and methanol washed.
The processing windows and the cure times for phenolic novolac/epoxy mixtures
containing sequestered catalysts are summarized in Table 6. 1. The cure times were
estimated from isothermal differential scanning calorimetry measurements as the times at
which the exotherm curves returned to the baseline. Longer cure times were required for
novolac/epoxy mixtures containing Matrimid/TPP sequestered catalysts compared to
mixtures containing the free catalyst. The slower rates in mixtures containing
sequestered catalysts were attributed to the diffusion of the catalysts. There may be a
time lag due to the kinetics of TPP diffusion from Matrimid into the novolac/epoxy
mixtures. Moreover, as described previously, the glass transition temperatures of
Matrimid/TPP particles depended on the blend composition. As TPP diffused into the
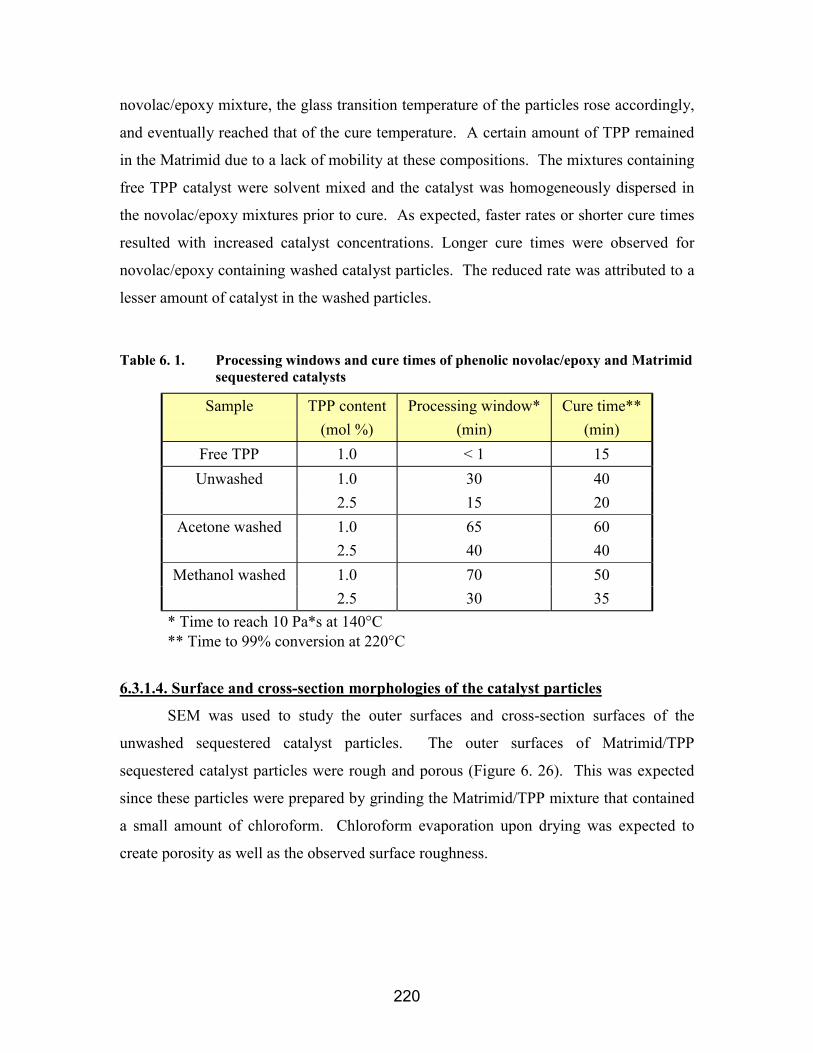
220
novolac/epoxy mixture, the glass transition temperature of the particles rose accordingly,
and eventually reached that of the cure temperature. A certain amount of TPP remained
in the Matrimid due to a lack of mobility at these compositions. The mixtures containing
free TPP catalyst were solvent mixed and the catalyst was homogeneously dispersed in
the novolac/epoxy mixtures prior to cure. As expected, faster rates or shorter cure times
resulted with increased catalyst concentrations. Longer cure times were observed for
novolac/epoxy containing washed catalyst particles. The reduced rate was attributed to a
lesser amount of catalyst in the washed particles.
Table 6. 1. Processing windows and cure times of phenolic novolac/epoxy and Matrimidsequestered catalysts
Sample TPP content(mol %)
Processing window*(min)
Cure time**(min)
Free TPP 1.0 < 1 151.0 30 40Unwashed2.5 15 201.0 65 60Acetone washed2.5 40 401.0 70 50Methanol washed2.5 30 35
* Time to reach 10 Pa*s at 140°C** Time to 99% conversion at 220°C
6.3.1.4. Surface and cross-section morphologies of the catalyst particles
SEM was used to study the outer surfaces and cross-section surfaces of the
unwashed sequestered catalyst particles. The outer surfaces of Matrimid/TPP
sequestered catalyst particles were rough and porous (Figure 6. 26). This was expected
since these particles were prepared by grinding the Matrimid/TPP mixture that contained
a small amount of chloroform. Chloroform evaporation upon drying was expected to
create porosity as well as the observed surface roughness.
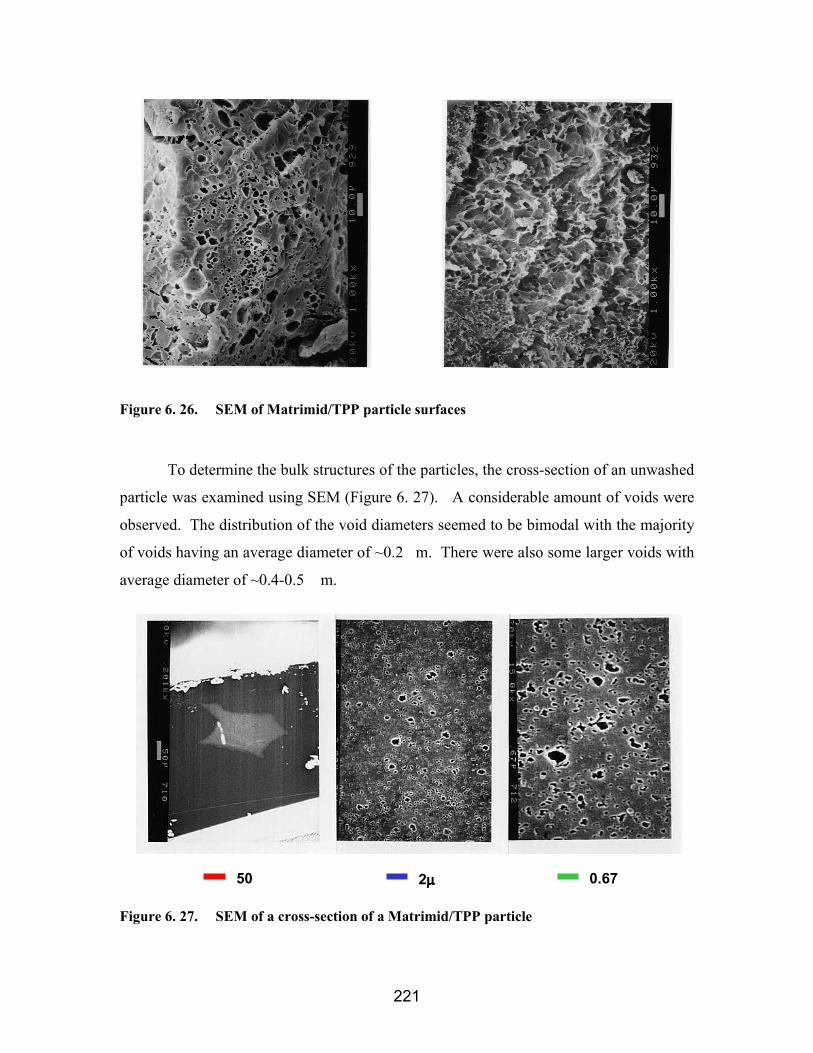
221
Figure 6. 26. SEM of Matrimid/TPP particle surfaces
To determine the bulk structures of the particles, the cross-section of an unwashed
particle was examined using SEM (Figure 6. 27). A considerable amount of voids were
observed. The distribution of the void diameters seemed to be bimodal with the majority
of voids having an average diameter of ~0.2�m. There were also some larger voids with
average diameter of ~0.4-0.5 �m.
Figure 6. 27. SEM of a cross-section of a Matrimid/TPP particle
50 2µµµµ 0.67
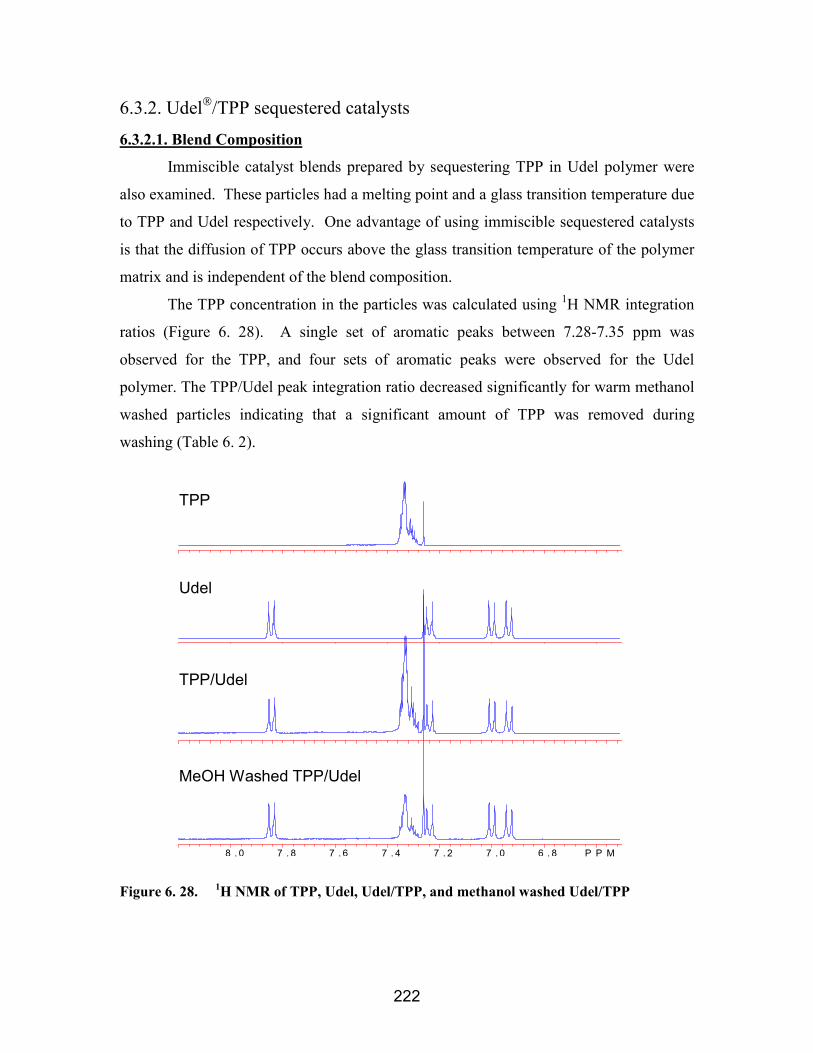
222
6.3.2. Udel/TPP sequestered catalysts
6.3.2.1. Blend Composition
Immiscible catalyst blends prepared by sequestering TPP in Udel polymer were
also examined. These particles had a melting point and a glass transition temperature due
to TPP and Udel respectively. One advantage of using immiscible sequestered catalysts
is that the diffusion of TPP occurs above the glass transition temperature of the polymer
matrix and is independent of the blend composition.
The TPP concentration in the particles was calculated using 1H NMR integration
ratios (Figure 6. 28). A single set of aromatic peaks between 7.28-7.35 ppm was
observed for the TPP, and four sets of aromatic peaks were observed for the Udel
polymer. The TPP/Udel peak integration ratio decreased significantly for warm methanol
washed particles indicating that a significant amount of TPP was removed during
washing (Table 6. 2).
Figure 6. 28. 1H NMR of TPP, Udel, Udel/TPP, and methanol washed Udel/TPP
8 . 0 7 . 8 7 . 6 7 . 4 7 . 2 7 . 0 6 . 8 P P M
TPP
Udel
TPP/Udel
MeOH Washed TPP/Udel

223
Table 6. 2. Particle compositions of unwashed and methanol washed Udel/TPP particles
Sample TPP (wt %) Udel (wt %)Unwashed 49 51
Warm methanol washed 36 64
6.3.2.2. Processing windows and cure times
Phenolic novolac/epoxy reactions in the presence of unwashed Udel/TPP
sequestered catalyst were monitored using isothermal differential scanning calorimetry at
140°C and at 200°C (Figure 6. 29). No exotherm was detected at the processing
temperature (140°C) for novolac/epoxy mixtures containing 0.65 or 1.6 mole %
Udel/TPP sequestered catalyst. At 200°C, the sequestered catalysts catalyzed the
mixtures. The reaction appeared to reach completion in 15 minutes when 1.6 mol %
catalyst was used.
Figure 6. 29. DSC scans of phenolic novolac/epoxy mixtures containing Udel/TPP catalyst
Isothermal viscosity measurements, determined at 140°C, were used to evaluate
the processabilities of the phenolic novolac/epoxy mixtures containing unwashed
Udel/TPP sequestered catalyst particles (Figure 6. 30). The processing time window
increased significantly for novolac/epoxy mixtures containing Udel/TPP sequestered
0.65 mol % at 140°C
1.6 mol % at 140°C
0.65 mol % at 200°C1.6 mol % at 200°C
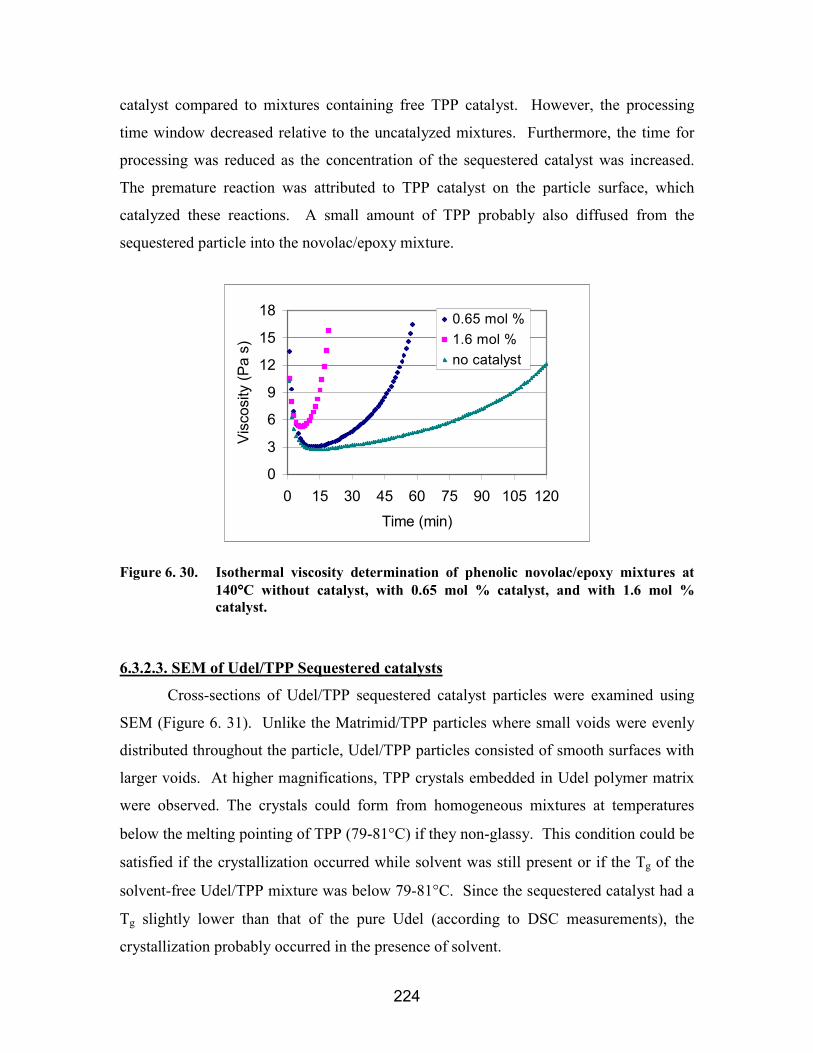
224
catalyst compared to mixtures containing free TPP catalyst. However, the processing
time window decreased relative to the uncatalyzed mixtures. Furthermore, the time for
processing was reduced as the concentration of the sequestered catalyst was increased.
The premature reaction was attributed to TPP catalyst on the particle surface, which
catalyzed these reactions. A small amount of TPP probably also diffused from the
sequestered particle into the novolac/epoxy mixture.
0
3
6
9
12
15
18
0 15 30 45 60 75 90 105 120Time (min)
Visc
osity
(Pa
s)
0.65 mol %1.6 mol %no catalyst
Figure 6. 30. Isothermal viscosity determination of phenolic novolac/epoxy mixtures at140°°°°C without catalyst, with 0.65 mol % catalyst, and with 1.6 mol %catalyst.
6.3.2.3. SEM of Udel/TPP Sequestered catalysts
Cross-sections of Udel/TPP sequestered catalyst particles were examined using
SEM (Figure 6. 31). Unlike the Matrimid/TPP particles where small voids were evenly
distributed throughout the particle, Udel/TPP particles consisted of smooth surfaces with
larger voids. At higher magnifications, TPP crystals embedded in Udel polymer matrix
were observed. The crystals could form from homogeneous mixtures at temperatures
below the melting pointing of TPP (79-81°C) if they non-glassy. This condition could be
satisfied if the crystallization occurred while solvent was still present or if the Tg of the
solvent-free Udel/TPP mixture was below 79-81°C. Since the sequestered catalyst had a
Tg slightly lower than that of the pure Udel (according to DSC measurements), the
crystallization probably occurred in the presence of solvent.
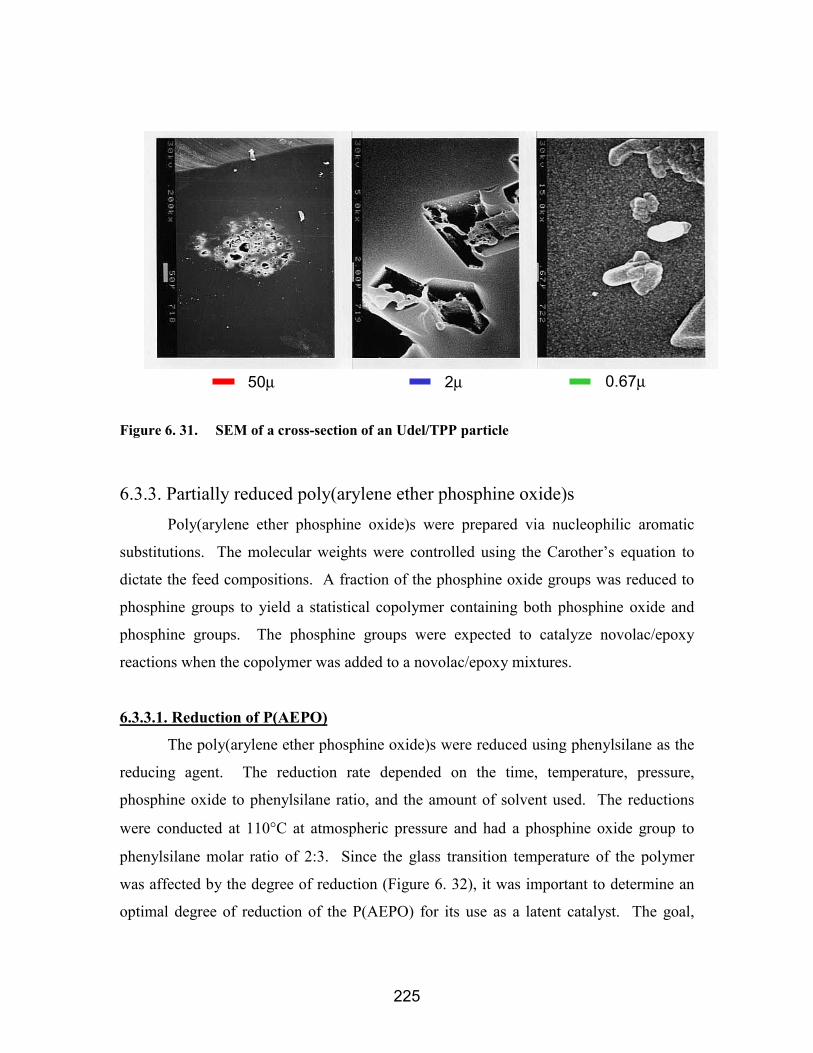
225
Figure 6. 31. SEM of a cross-section of an Udel/TPP particle
6.3.3. Partially reduced poly(arylene ether phosphine oxide)sPoly(arylene ether phosphine oxide)s were prepared via nucleophilic aromatic
substitutions. The molecular weights were controlled using the Carother’s equation to
dictate the feed compositions. A fraction of the phosphine oxide groups was reduced to
phosphine groups to yield a statistical copolymer containing both phosphine oxide and
phosphine groups. The phosphine groups were expected to catalyze novolac/epoxy
reactions when the copolymer was added to a novolac/epoxy mixtures.
6.3.3.1. Reduction of P(AEPO)
The poly(arylene ether phosphine oxide)s were reduced using phenylsilane as the
reducing agent. The reduction rate depended on the time, temperature, pressure,
phosphine oxide to phenylsilane ratio, and the amount of solvent used. The reductions
were conducted at 110°C at atmospheric pressure and had a phosphine oxide group to
phenylsilane molar ratio of 2:3. Since the glass transition temperature of the polymer
was affected by the degree of reduction (Figure 6. 32), it was important to determine an
optimal degree of reduction of the P(AEPO) for its use as a latent catalyst. The goal,
50µ 2µ 0.67µ
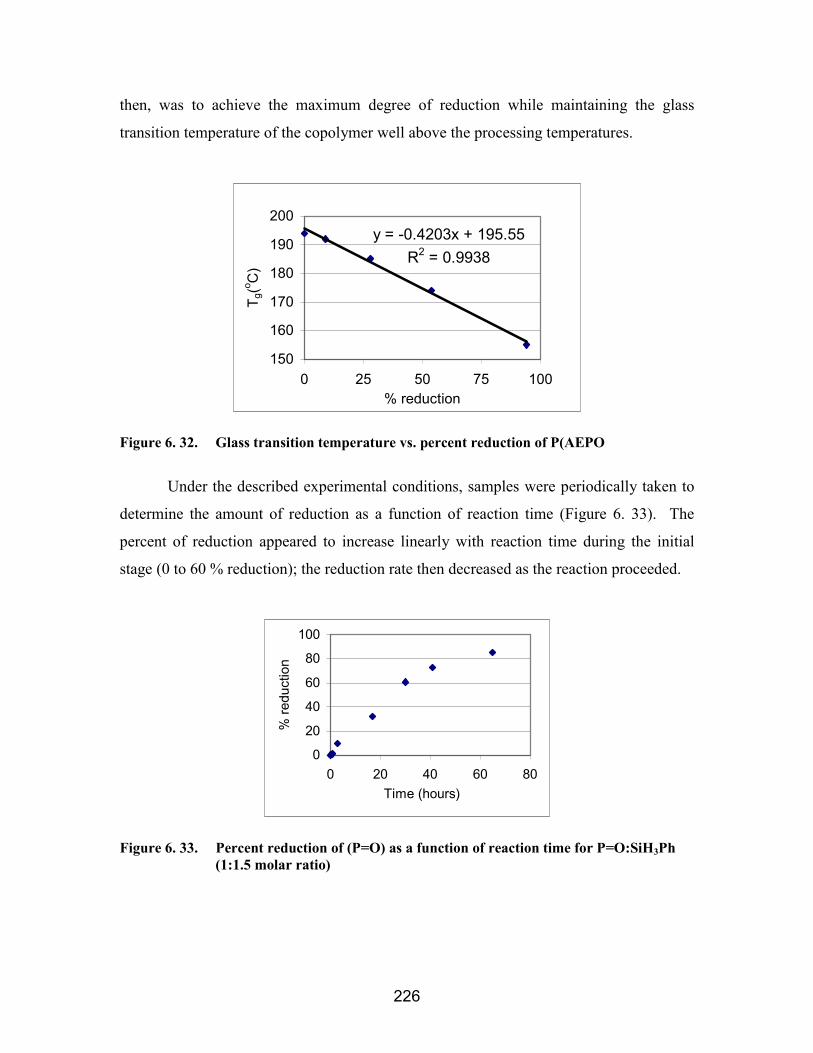
226
then, was to achieve the maximum degree of reduction while maintaining the glass
transition temperature of the copolymer well above the processing temperatures.
y = -0.4203x + 195.55R2 = 0.9938
150
160
170
180
190
200
0 25 50 75 100% reduction
T g(o C
)
Figure 6. 32. Glass transition temperature vs. percent reduction of P(AEPO
Under the described experimental conditions, samples were periodically taken to
determine the amount of reduction as a function of reaction time (Figure 6. 33). The
percent of reduction appeared to increase linearly with reaction time during the initial
stage (0 to 60 % reduction); the reduction rate then decreased as the reaction proceeded.
0
20
40
60
80
100
0 20 40 60 80Time (hours)
% re
duct
ion
Figure 6. 33. Percent reduction of (P=O) as a function of reaction time for P=O:SiH3Ph(1:1.5 molar ratio)
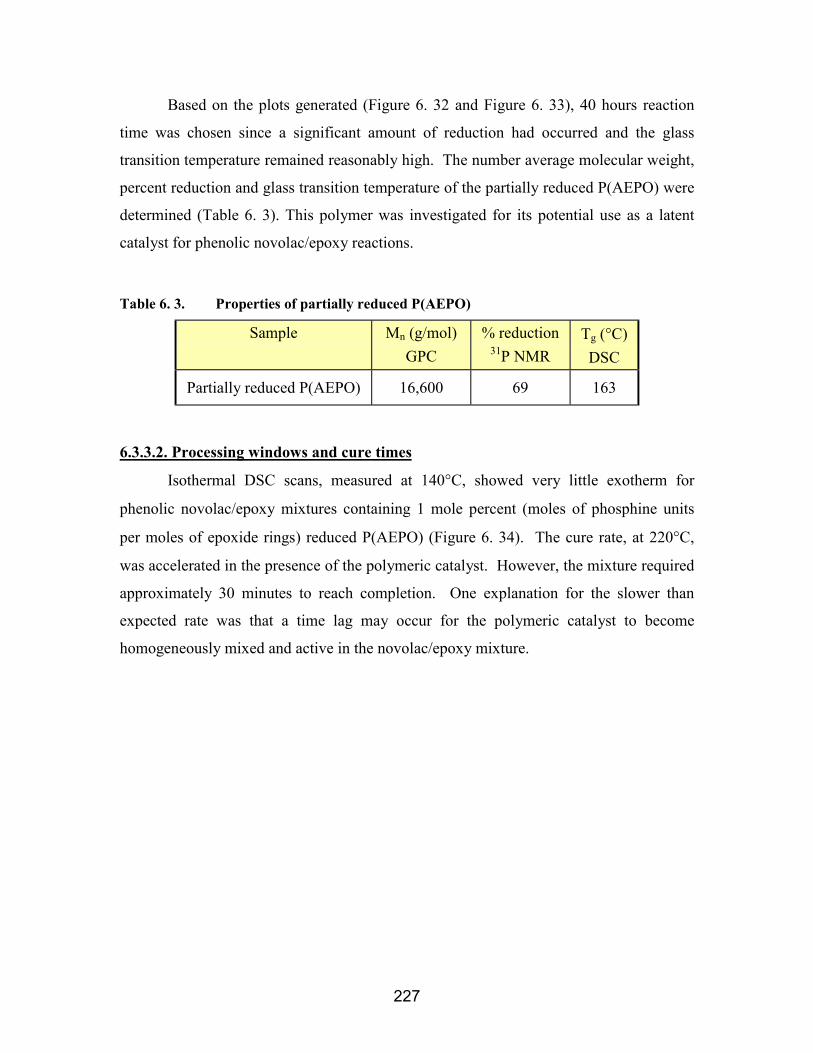
227
Based on the plots generated (Figure 6. 32 and Figure 6. 33), 40 hours reaction
time was chosen since a significant amount of reduction had occurred and the glass
transition temperature remained reasonably high. The number average molecular weight,
percent reduction and glass transition temperature of the partially reduced P(AEPO) were
determined (Table 6. 3). This polymer was investigated for its potential use as a latent
catalyst for phenolic novolac/epoxy reactions.
Table 6. 3. Properties of partially reduced P(AEPO)
Sample Mn (g/mol)GPC
% reduction31P NMR
Tg (°C)DSC
Partially reduced P(AEPO) 16,600 69 163
6.3.3.2. Processing windows and cure times
Isothermal DSC scans, measured at 140°C, showed very little exotherm for
phenolic novolac/epoxy mixtures containing 1 mole percent (moles of phosphine units
per moles of epoxide rings) reduced P(AEPO) (Figure 6. 34). The cure rate, at 220°C,
was accelerated in the presence of the polymeric catalyst. However, the mixture required
approximately 30 minutes to reach completion. One explanation for the slower than
expected rate was that a time lag may occur for the polymeric catalyst to become
homogeneously mixed and active in the novolac/epoxy mixture.

228
Figure 6. 34. Isothermal DSC of phenolic novolac/Epon 828 with 1 mol % reducedP(AEPO) at 140°°°°C and at 220°°°°C
Isothermal viscosity, measured at 140°C, showed that the phenolic novolac/epoxy
mixture containing 1 mol % polymeric catalyst had improved processability compared to
the mixtures containing free TPP catalyst, but reduced processability compared to the
uncatalyzed mixtures (Figure 6. 35). The processing window decreased from 110
minutes to 45 minutes when the polymeric catalyst was introduced. The immobilized
phosphine groups on the surface of the particles may have catalyzed the reaction causing
premature cure.
0
5
10
15
0 30 60 90 120Time (min)
Visc
osity
(Pa*
s)
1 mol % catalystno catalyst
Figure 6. 35. Isothermal viscosity (140°°°°C) of phenolic novolac/Epon 828 epoxy withreduced P(AEPO)
140°C
220°C
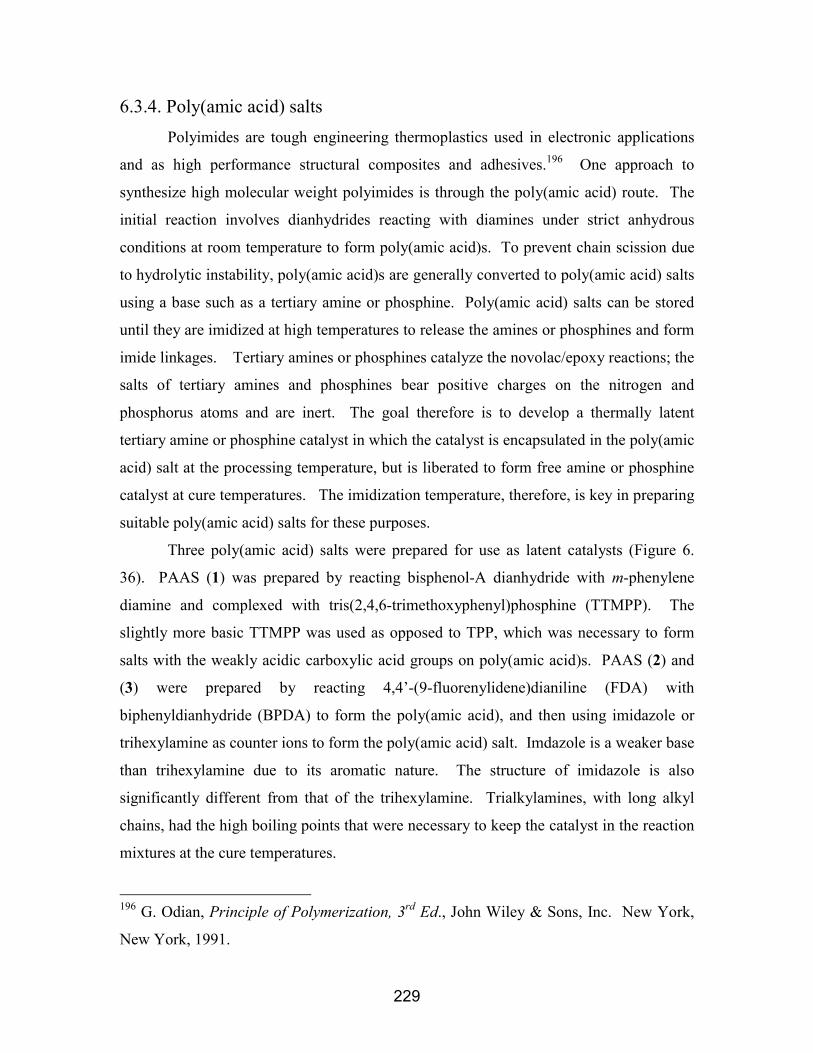
229
6.3.4. Poly(amic acid) saltsPolyimides are tough engineering thermoplastics used in electronic applications
and as high performance structural composites and adhesives.196 One approach to
synthesize high molecular weight polyimides is through the poly(amic acid) route. The
initial reaction involves dianhydrides reacting with diamines under strict anhydrous
conditions at room temperature to form poly(amic acid)s. To prevent chain scission due
to hydrolytic instability, poly(amic acid)s are generally converted to poly(amic acid) salts
using a base such as a tertiary amine or phosphine. Poly(amic acid) salts can be stored
until they are imidized at high temperatures to release the amines or phosphines and form
imide linkages. Tertiary amines or phosphines catalyze the novolac/epoxy reactions; the
salts of tertiary amines and phosphines bear positive charges on the nitrogen and
phosphorus atoms and are inert. The goal therefore is to develop a thermally latent
tertiary amine or phosphine catalyst in which the catalyst is encapsulated in the poly(amic
acid) salt at the processing temperature, but is liberated to form free amine or phosphine
catalyst at cure temperatures. The imidization temperature, therefore, is key in preparing
suitable poly(amic acid) salts for these purposes.
Three poly(amic acid) salts were prepared for use as latent catalysts (Figure 6.
36). PAAS (1) was prepared by reacting bisphenol-A dianhydride with m-phenylene
diamine and complexed with tris(2,4,6-trimethoxyphenyl)phosphine (TTMPP). The
slightly more basic TTMPP was used as opposed to TPP, which was necessary to form
salts with the weakly acidic carboxylic acid groups on poly(amic acid)s. PAAS (2) and
(3) were prepared by reacting 4,4’-(9-fluorenylidene)dianiline (FDA) with
biphenyldianhydride (BPDA) to form the poly(amic acid), and then using imidazole or
trihexylamine as counter ions to form the poly(amic acid) salt. Imdazole is a weaker base
than trihexylamine due to its aromatic nature. The structure of imidazole is also
significantly different from that of the trihexylamine. Trialkylamines, with long alkyl
chains, had the high boiling points that were necessary to keep the catalyst in the reaction
mixtures at the cure temperatures.
196 G. Odian, Principle of Polymerization, 3rd Ed., John Wiley & Sons, Inc. New York,
New York, 1991.
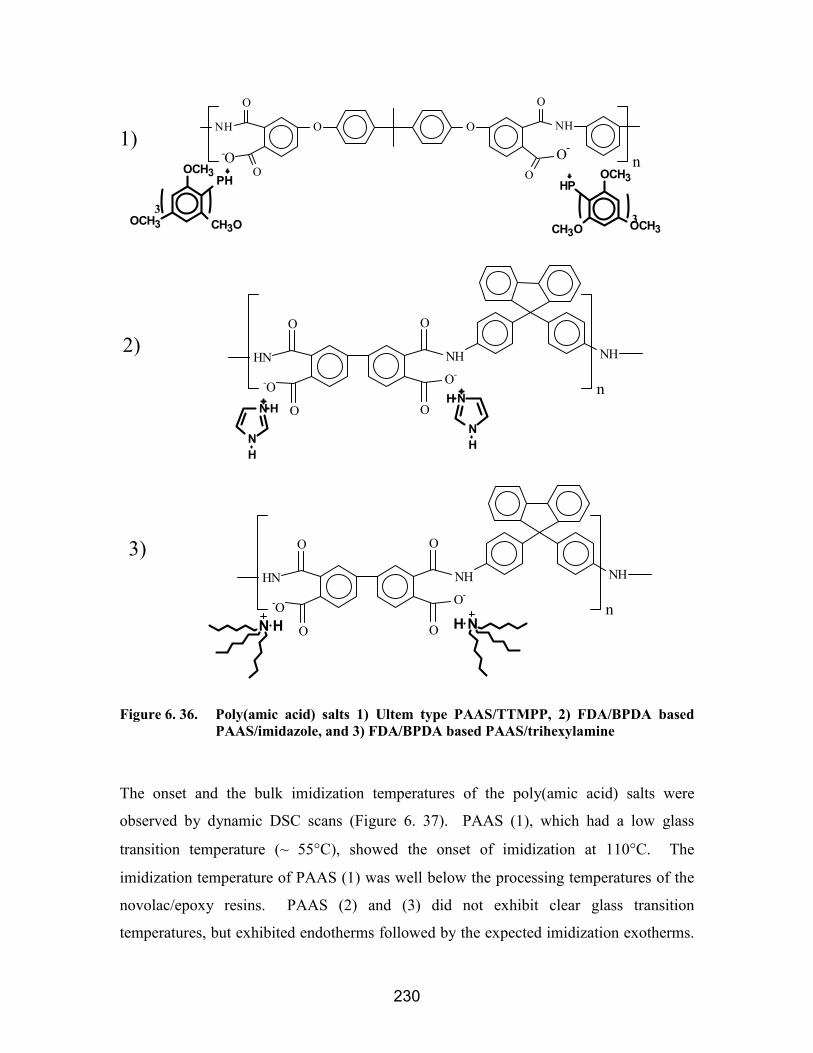
230
n
O O
O
O O
O
NH
-O
NH
O-
HPOCH3
OCH3CH3O3
NH
O
O
O
O
HN
-O
NH
O-
n
n
NH
O
O
O
O
HN
-O
NH
O-
N
NH
HN
NH
H
3
PHOCH3
OCH3 CH3O
N H NH
1)
2)
3)
Figure 6. 36. Poly(amic acid) salts 1) Ultem type PAAS/TTMPP, 2) FDA/BPDA basedPAAS/imidazole, and 3) FDA/BPDA based PAAS/trihexylamine
The onset and the bulk imidization temperatures of the poly(amic acid) salts were
observed by dynamic DSC scans (Figure 6. 37). PAAS (1), which had a low glass
transition temperature (~ 55°C), showed the onset of imidization at 110°C. The
imidization temperature of PAAS (1) was well below the processing temperatures of the
novolac/epoxy resins. PAAS (2) and (3) did not exhibit clear glass transition
temperatures, but exhibited endotherms followed by the expected imidization exotherms.
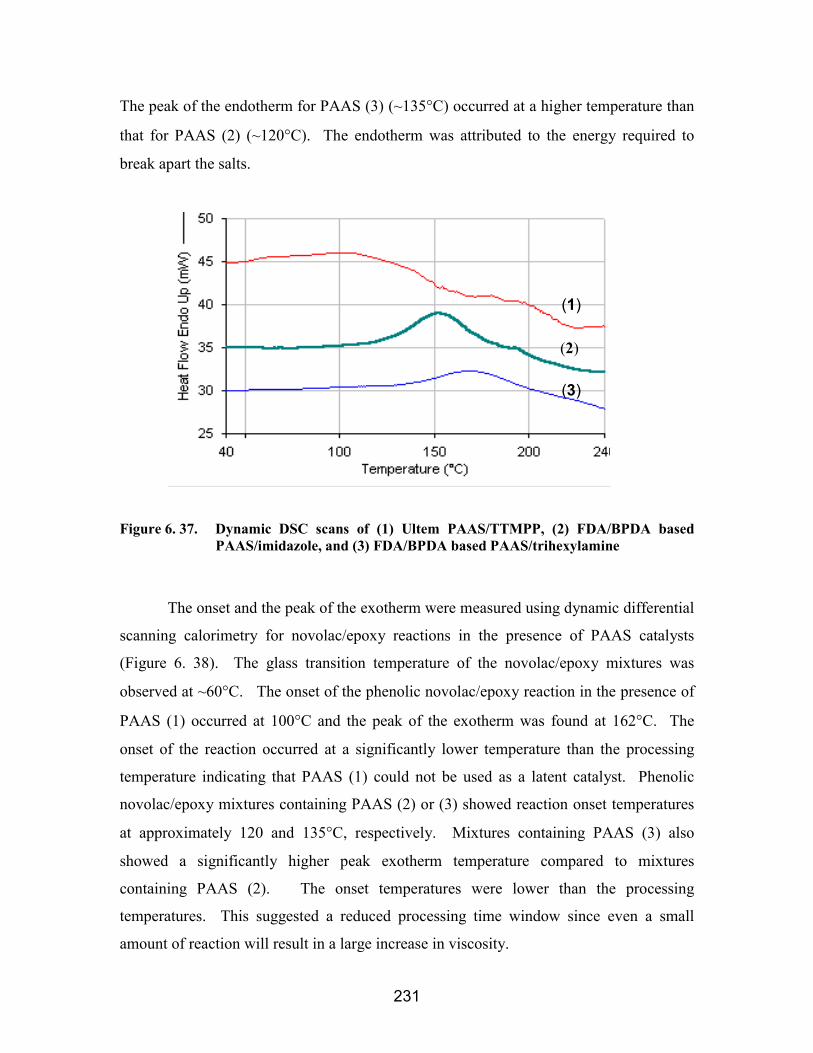
231
The peak of the endotherm for PAAS (3) (~135°C) occurred at a higher temperature than
that for PAAS (2) (~120°C). The endotherm was attributed to the energy required to
break apart the salts.
Figure 6. 37. Dynamic DSC scans of (1) Ultem PAAS/TTMPP, (2) FDA/BPDA basedPAAS/imidazole, and (3) FDA/BPDA based PAAS/trihexylamine
The onset and the peak of the exotherm were measured using dynamic differential
scanning calorimetry for novolac/epoxy reactions in the presence of PAAS catalysts
(Figure 6. 38). The glass transition temperature of the novolac/epoxy mixtures was
observed at ~60°C. The onset of the phenolic novolac/epoxy reaction in the presence of
PAAS (1) occurred at 100°C and the peak of the exotherm was found at 162°C. The
onset of the reaction occurred at a significantly lower temperature than the processing
temperature indicating that PAAS (1) could not be used as a latent catalyst. Phenolic
novolac/epoxy mixtures containing PAAS (2) or (3) showed reaction onset temperatures
at approximately 120 and 135°C, respectively. Mixtures containing PAAS (3) also
showed a significantly higher peak exotherm temperature compared to mixtures
containing PAAS (2). The onset temperatures were lower than the processing
temperatures. This suggested a reduced processing time window since even a small
amount of reaction will result in a large increase in viscosity.
(1)
(2)
(3)
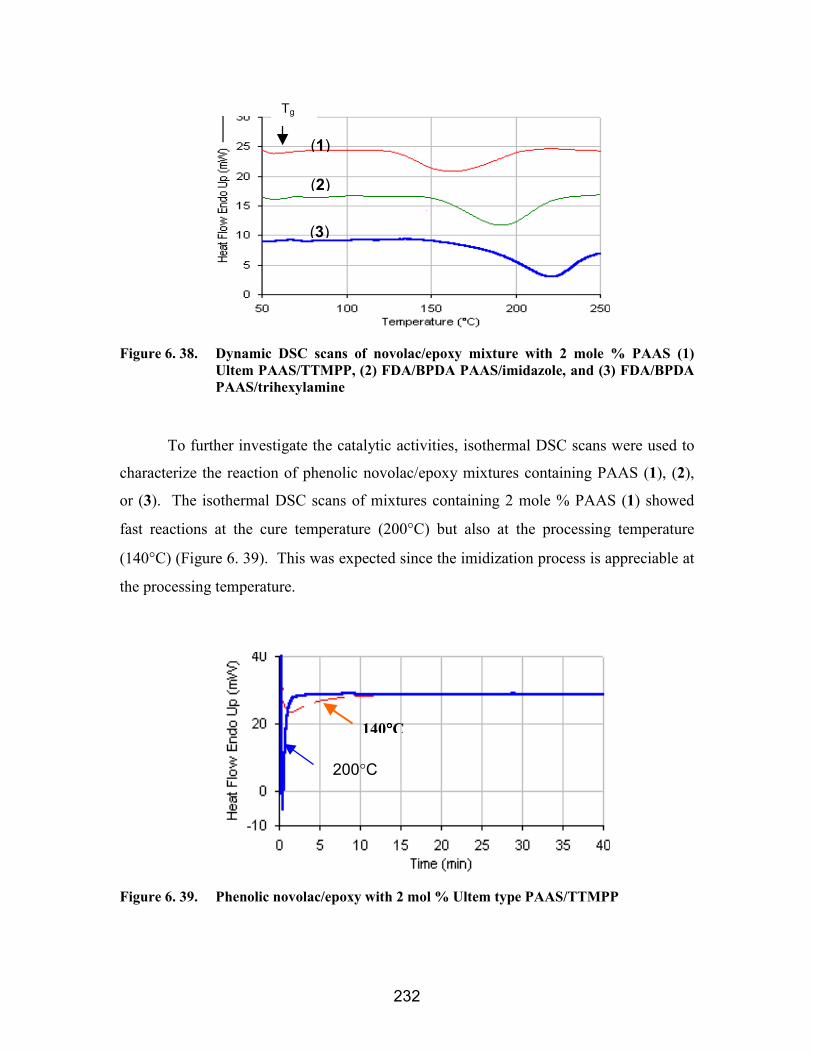
232
Figure 6. 38. Dynamic DSC scans of novolac/epoxy mixture with 2 mole % PAAS (1)Ultem PAAS/TTMPP, (2) FDA/BPDA PAAS/imidazole, and (3) FDA/BPDAPAAS/trihexylamine
To further investigate the catalytic activities, isothermal DSC scans were used to
characterize the reaction of phenolic novolac/epoxy mixtures containing PAAS (1), (2),
or (3). The isothermal DSC scans of mixtures containing 2 mole % PAAS (1) showed
fast reactions at the cure temperature (200°C) but also at the processing temperature
(140°C) (Figure 6. 39). This was expected since the imidization process is appreciable at
the processing temperature.
Figure 6. 39. Phenolic novolac/epoxy with 2 mol % Ultem type PAAS/TTMPP
200°C
140°°°°C
(1)
(2)
(3)
Tg
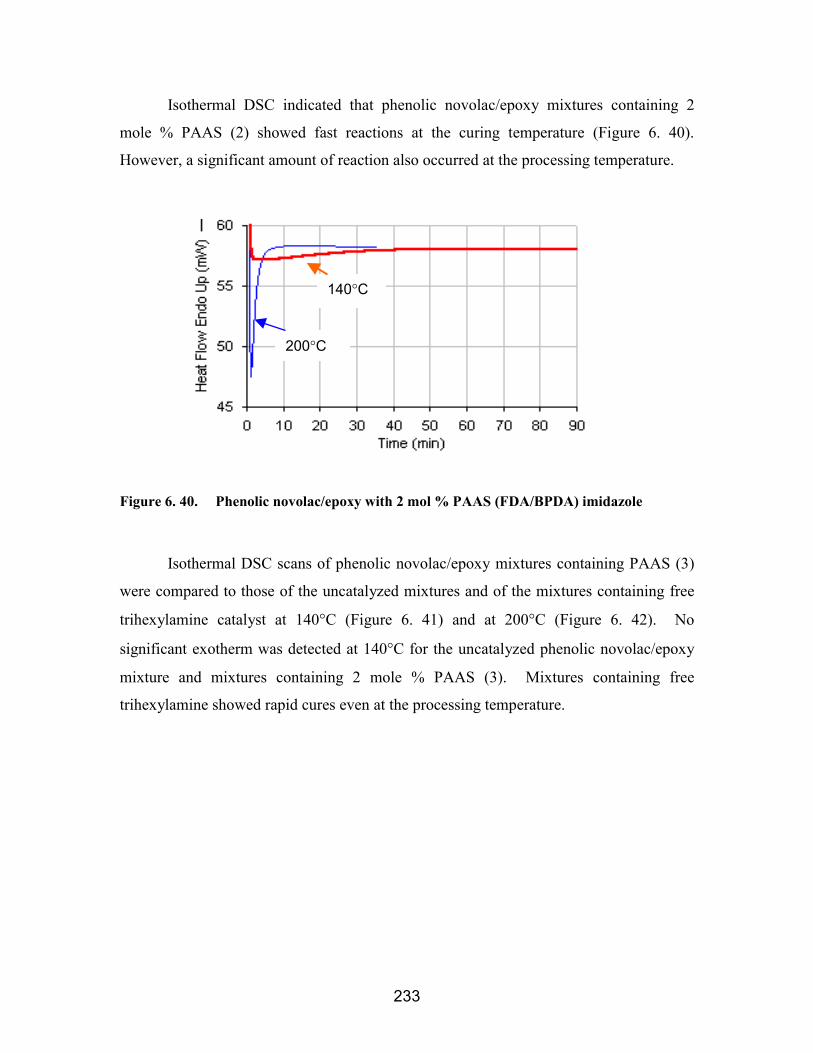
233
Isothermal DSC indicated that phenolic novolac/epoxy mixtures containing 2
mole % PAAS (2) showed fast reactions at the curing temperature (Figure 6. 40).
However, a significant amount of reaction also occurred at the processing temperature.
Figure 6. 40. Phenolic novolac/epoxy with 2 mol % PAAS (FDA/BPDA) imidazole
Isothermal DSC scans of phenolic novolac/epoxy mixtures containing PAAS (3)
were compared to those of the uncatalyzed mixtures and of the mixtures containing free
trihexylamine catalyst at 140°C (Figure 6. 41) and at 200°C (Figure 6. 42). No
significant exotherm was detected at 140°C for the uncatalyzed phenolic novolac/epoxy
mixture and mixtures containing 2 mole % PAAS (3). Mixtures containing free
trihexylamine showed rapid cures even at the processing temperature.
140°C
200°C
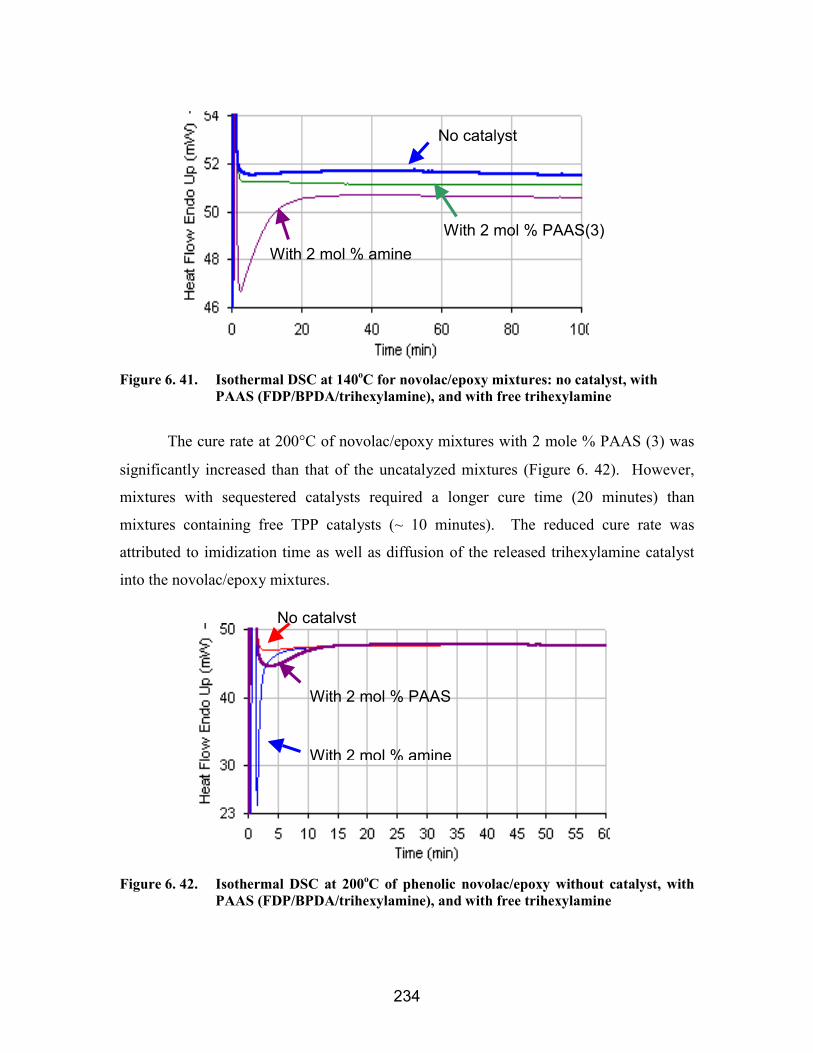
234
Figure 6. 41. Isothermal DSC at 140oC for novolac/epoxy mixtures: no catalyst, withPAAS (FDP/BPDA/trihexylamine), and with free trihexylamine
The cure rate at 200°C of novolac/epoxy mixtures with 2 mole % PAAS (3) was
significantly increased than that of the uncatalyzed mixtures (Figure 6. 42). However,
mixtures with sequestered catalysts required a longer cure time (20 minutes) than
mixtures containing free TPP catalysts (~ 10 minutes). The reduced cure rate was
attributed to imidization time as well as diffusion of the released trihexylamine catalyst
into the novolac/epoxy mixtures.
Figure 6. 42. Isothermal DSC at 200oC of phenolic novolac/epoxy without catalyst, withPAAS (FDP/BPDA/trihexylamine), and with free trihexylamine
No catalyst
With 2 mol % PAAS
With 2 mol % amine
No catalyst
With 2 mol % PAAS(3)With 2 mol % amine
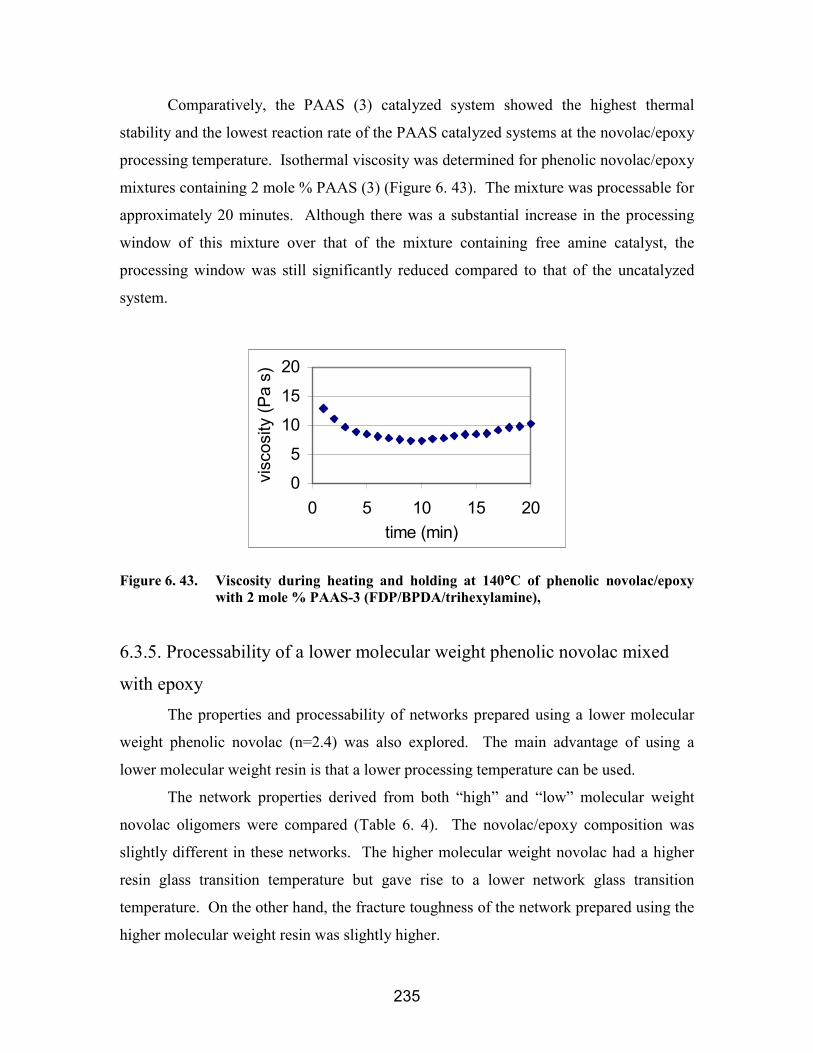
235
Comparatively, the PAAS (3) catalyzed system showed the highest thermal
stability and the lowest reaction rate of the PAAS catalyzed systems at the novolac/epoxy
processing temperature. Isothermal viscosity was determined for phenolic novolac/epoxy
mixtures containing 2 mole % PAAS (3) (Figure 6. 43). The mixture was processable for
approximately 20 minutes. Although there was a substantial increase in the processing
window of this mixture over that of the mixture containing free amine catalyst, the
processing window was still significantly reduced compared to that of the uncatalyzed
system.
05
1015
20
0 5 10 15 20time (min)
visc
osity
(Pa
s)
Figure 6. 43. Viscosity during heating and holding at 140°°°°C of phenolic novolac/epoxywith 2 mole % PAAS-3 (FDP/BPDA/trihexylamine),
6.3.5. Processability of a lower molecular weight phenolic novolac mixed
with epoxyThe properties and processability of networks prepared using a lower molecular
weight phenolic novolac (n=2.4) was also explored. The main advantage of using a
lower molecular weight resin is that a lower processing temperature can be used.
The network properties derived from both “high” and “low” molecular weight
novolac oligomers were compared (Table 6. 4). The novolac/epoxy composition was
slightly different in these networks. The higher molecular weight novolac had a higher
resin glass transition temperature but gave rise to a lower network glass transition
temperature. On the other hand, the fracture toughness of the network prepared using the
higher molecular weight resin was slightly higher.
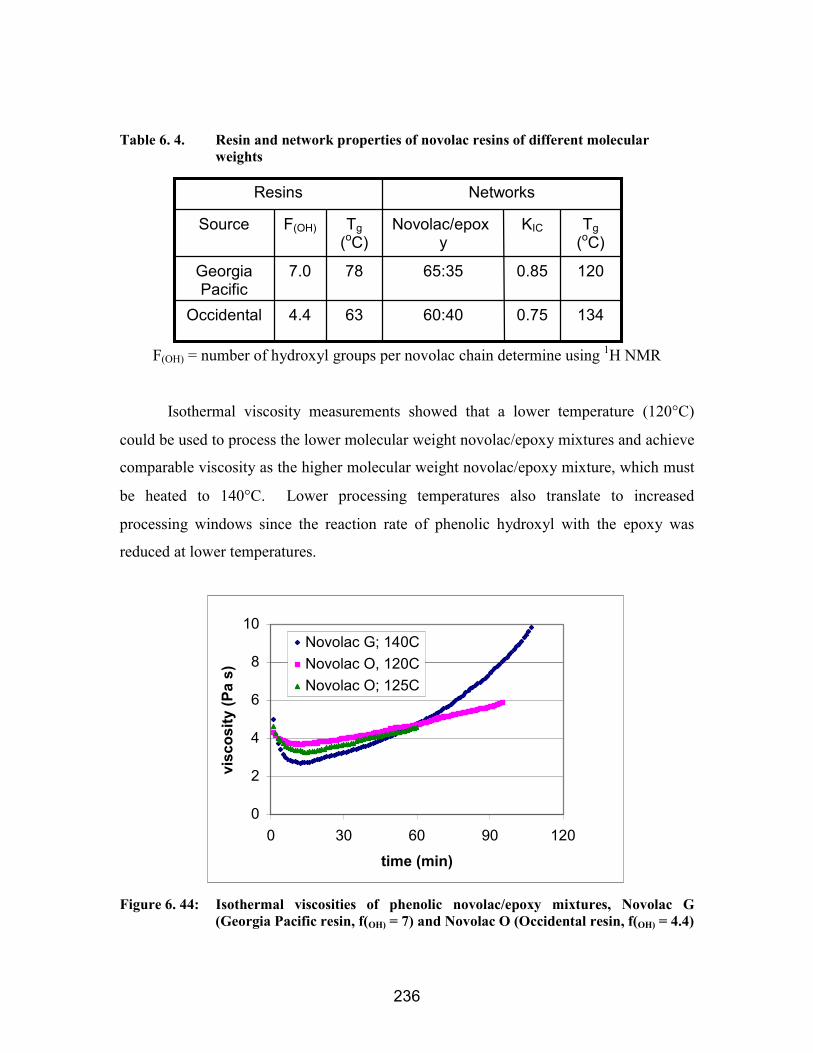
236
Table 6. 4. Resin and network properties of novolac resins of different molecularweights
F(OH) = number of hydroxyl groups per novolac chain determine using 1H NMR
Isothermal viscosity measurements showed that a lower temperature (120°C)
could be used to process the lower molecular weight novolac/epoxy mixtures and achieve
comparable viscosity as the higher molecular weight novolac/epoxy mixture, which must
be heated to 140°C. Lower processing temperatures also translate to increased
processing windows since the reaction rate of phenolic hydroxyl with the epoxy was
reduced at lower temperatures.
Figure 6. 44: Isothermal viscosities of phenolic novolac/epoxy mixtures, Novolac G(Georgia Pacific resin, f(OH) = 7) and Novolac O (Occidental resin, f(OH) = 4.4)
NetworksResins
1340.7560:40634.4Occidental
1200.8565:35787.0GeorgiaPacific
Tg(oC)
KICNovolac/epoxy
Tg(oC)
F(OH)Source
0
2
4
6
8
10
0 30 60 90 120
time (min)
visc
osity
(Pa
s)
Novolac G; 140CNovolac O, 120CNovolac O; 125C

237
Isothermal viscosities of the “low” molecular weight phenolic novolac (Novolac
O) mixed with epoxy with and without sequestered catalysts were measured (Figure 6.
45). PAAS (3) [FDA/BPDA/trihexylamine] and methanol washed Udel/TPP sequestered
catalysts were investigated. Although the processing temperature was reduced to 120°C,
adding the sequestered catalysts reduced the processing time windows. Mixtures
containing either catalyst had a processing window between 25 and 30 minutes.
Figure 6. 45: Isothermal viscosity of lower molecular weight phenolic novolac/epoxymixtures with and without sequestered catalysts
6.3.6. Properties of poly(amic acid)/trihexylamine salt sized carbon fiberreinforced novolac/epoxy composites
6.3.6.1. Reaction Kinetics
A thorough understanding of the reaction kinetics of the novolac/epoxy catalyzed
by non-sequestered trihexylamine was necessary for determining the appropriate cure
cycles for composites containing latent initiator sizings. The kinetic parameters such as
activation energy, pre-exponential factor, and first order rate constants were calculated
according to ASTM E 698.
0
3
6
9
12
15
0 15 30 45 60time (min)
visc
osity
(Pa
s)
no catalyst
1 mol% PAAS
1 mol% Udel/TPP
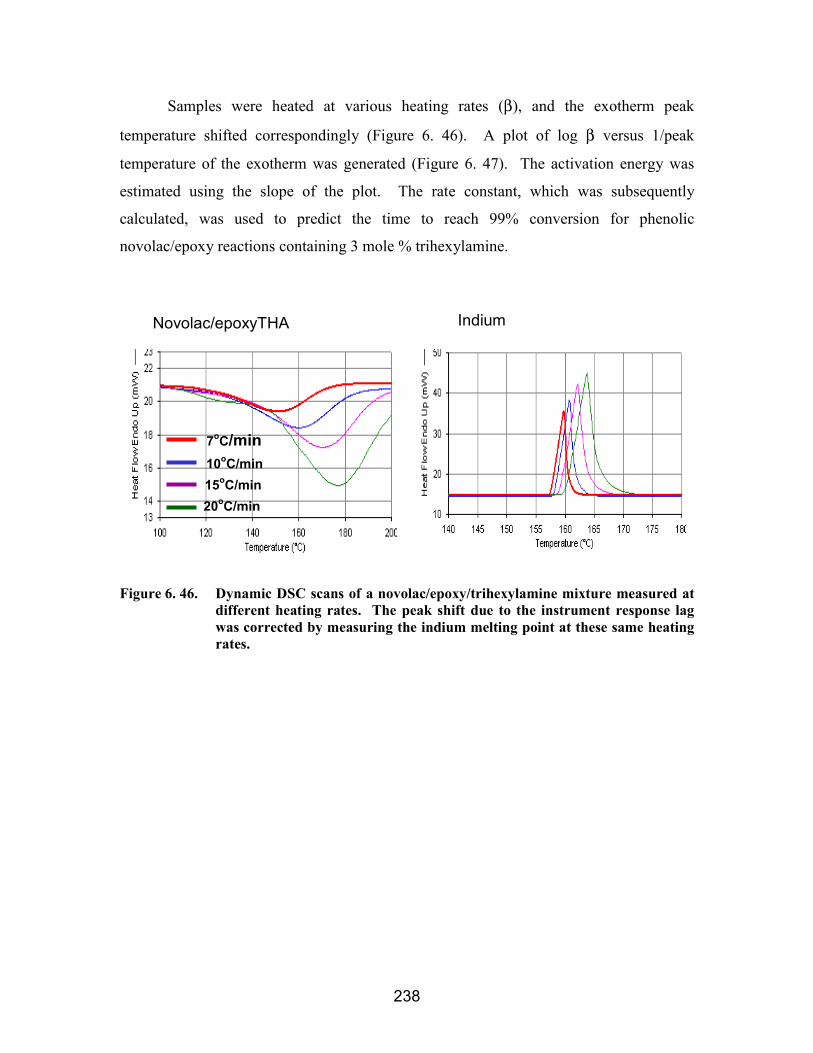
238
Samples were heated at various heating rates (β), and the exotherm peak
temperature shifted correspondingly (Figure 6. 46). A plot of log β versus 1/peak
temperature of the exotherm was generated (Figure 6. 47). The activation energy was
estimated using the slope of the plot. The rate constant, which was subsequently
calculated, was used to predict the time to reach 99% conversion for phenolic
novolac/epoxy reactions containing 3 mole % trihexylamine.
Figure 6. 46. Dynamic DSC scans of a novolac/epoxy/trihexylamine mixture measured atdifferent heating rates. The peak shift due to the instrument response lagwas corrected by measuring the indium melting point at these same heatingrates.
Novolac/epoxyTHA Indium
7oC/min10oC/min15oC/min20oC/min
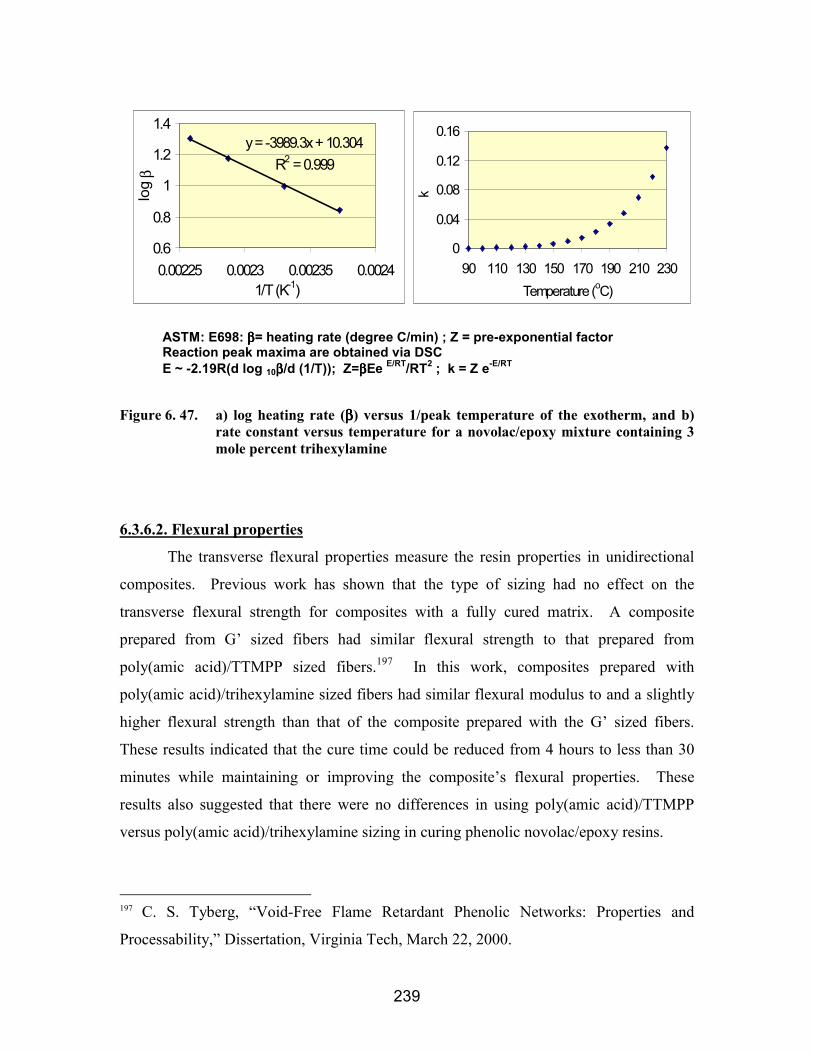
239
Figure 6. 47. a) log heating rate (ββββ) versus 1/peak temperature of the exotherm, and b)rate constant versus temperature for a novolac/epoxy mixture containing 3mole percent trihexylamine
6.3.6.2. Flexural properties
The transverse flexural properties measure the resin properties in unidirectional
composites. Previous work has shown that the type of sizing had no effect on the
transverse flexural strength for composites with a fully cured matrix. A composite
prepared from G’ sized fibers had similar flexural strength to that prepared from
poly(amic acid)/TTMPP sized fibers.197 In this work, composites prepared with
poly(amic acid)/trihexylamine sized fibers had similar flexural modulus to and a slightly
higher flexural strength than that of the composite prepared with the G’ sized fibers.
These results indicated that the cure time could be reduced from 4 hours to less than 30
minutes while maintaining or improving the composite’s flexural properties. These
results also suggested that there were no differences in using poly(amic acid)/TTMPP
versus poly(amic acid)/trihexylamine sizing in curing phenolic novolac/epoxy resins.
197 C. S. Tyberg, “Void-Free Flame Retardant Phenolic Networks: Properties and
Processability,” Dissertation, Virginia Tech, March 22, 2000.
ASTM: E698: ββββ= heating rate (degree C/min) ; Z = pre-exponential factorReaction peak maxima are obtained via DSCE ~ -2.19R(d log 10ββββ/d (1/T)); Z=ββββEe E/RT/RT2 ; k = Z e-E/RT
y = -3989.3x + 10.304R2 = 0.999
0.6
0.8
1
1.2
1.4
0.00225 0.0023 0.00235 0.00241/T (K-1)
log
β
0
0.04
0.08
0.12
0.16
90 110 130 150 170 190 210 230Temperature (oC)
k

240
Table 6. 5. Transverse flexural strength and modulus of unidirectional AS-4 carbonfiber reinforced phenolic novolac/epoxy composites
Sizing Phenolic/Epoxywt/wt
Cure Cycle 90° FlexuralStrength (MPa)
90° FlexuralModulus (GPa)
G’197 70/30200°C (1hr)220°C (3hr)
66 11.3
PAAS/THA 65/35180°C (20min)200°C (10min)
74±3 11.1±0.2
PAAS/THA= Ultem type poly(amic acid)/trihexylamine salt
6.3.6.2. Mode II toughness
The mode II toughness of composites prepared with the poly(amic
acid)/trihexylamine sized fibers appeared to be slightly lower than that of the composites
prepared with G’ or poly(amic acid)/TTMPP sized fibers. The mode II toughness
calculated for composites having poly(amic acid)/trihexylamine salt sized fiber was lower
than that calculated for composites having poly(amic acid)/TTMPP salt, but the
toughness values were within the standard deviations of each other. The composite
prepared with the poly(amic acid)/trihexylamine sizing also had a slightly lower fiber
volume fraction. All of these phenolic novolac/epoxy composites exhibited a relatively
high mode II toughness, similar to the value of toughened epoxies,198 and exceeding the
toughness of untoughened carbon fiber/epoxy composites.199
198 M. S. Mdahakar and L. T. Drzal, “Fiber-Matrix Adhesion and its Effect on Composite
Mechanical Properties: IV. Mode I and Mode II Fracture Toughness of Graphite/Epoxy
Composites,” Journal of Composite Materials 26(7), 936-968 (1992).199 E. M. Woo, and K. L. Mao, “Interlaminar Morphology Effects on Fracture Resistance
of Amorphous Polymer-Modified Epoxy/Carbon Fiber Composites,” Composites Part A
27A, 625-631 (1996).
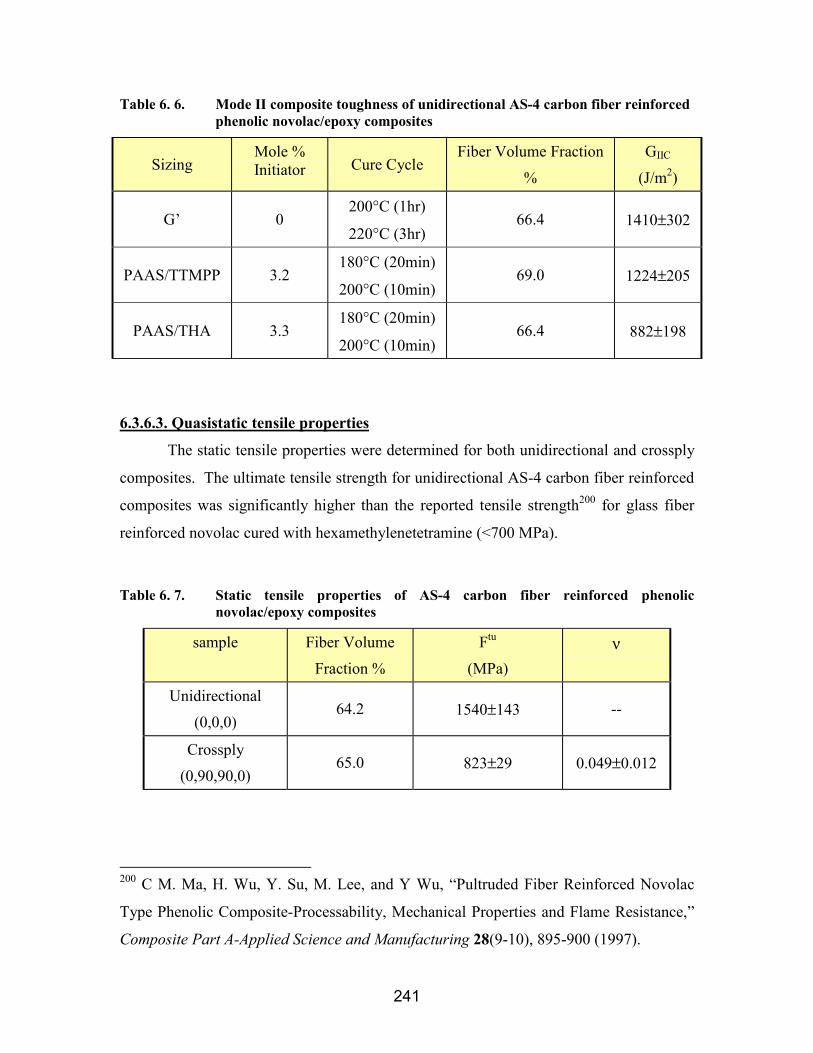
241
Table 6. 6. Mode II composite toughness of unidirectional AS-4 carbon fiber reinforcedphenolic novolac/epoxy composites
SizingMole %Initiator Cure Cycle
Fiber Volume Fraction
%
GIIC
(J/m2)
G’ 0200°C (1hr)
220°C (3hr)66.4 1410±302
PAAS/TTMPP 3.2180°C (20min)
200°C (10min)69.0 1224±205
PAAS/THA 3.3180°C (20min)
200°C (10min)66.4 882±198
6.3.6.3. Quasistatic tensile properties
The static tensile properties were determined for both unidirectional and crossply
composites. The ultimate tensile strength for unidirectional AS-4 carbon fiber reinforced
composites was significantly higher than the reported tensile strength200 for glass fiber
reinforced novolac cured with hexamethylenetetramine (<700 MPa).
Table 6. 7. Static tensile properties of AS-4 carbon fiber reinforced phenolicnovolac/epoxy composites
sample Fiber Volume
Fraction %
Ftu
(MPa)ν
Unidirectional
(0,0,0)64.2 1540±143 --
Crossply
(0,90,90,0)65.0 823±29 0.049±0.012
200 C M. Ma, H. Wu, Y. Su, M. Lee, and Y Wu, “Pultruded Fiber Reinforced Novolac
Type Phenolic Composite-Processability, Mechanical Properties and Flame Resistance,”
Composite Part A-Applied Science and Manufacturing 28(9-10), 895-900 (1997).
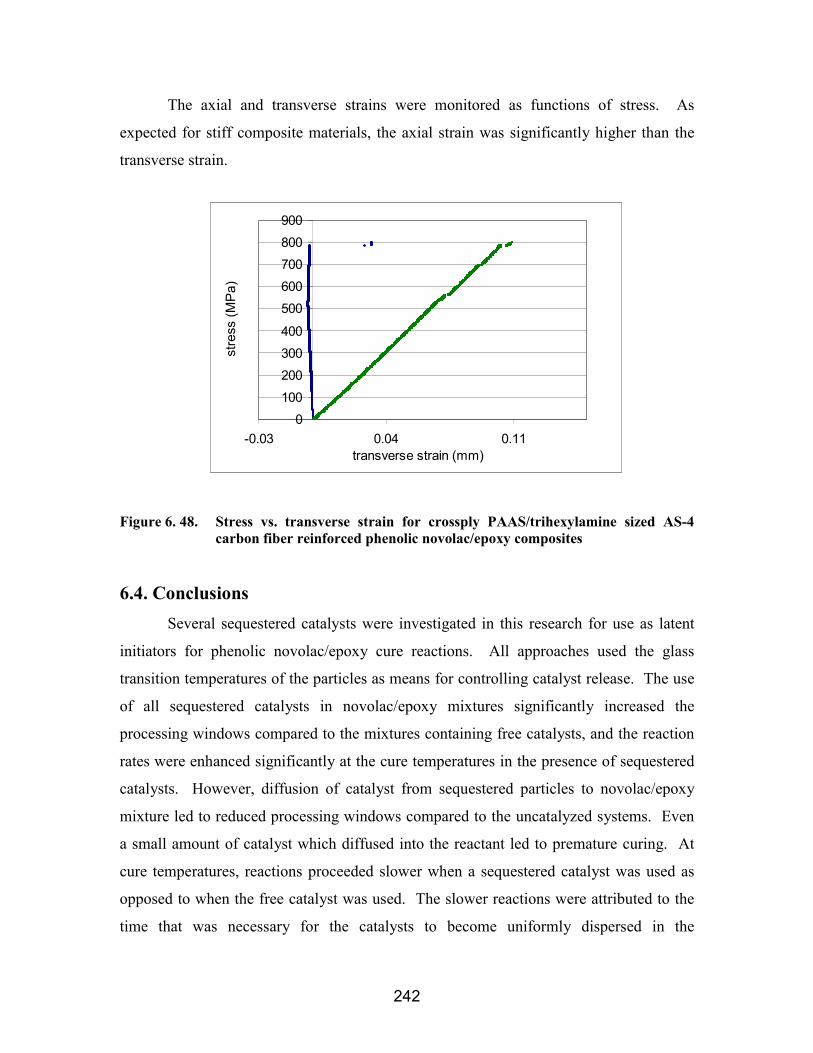
242
The axial and transverse strains were monitored as functions of stress. As
expected for stiff composite materials, the axial strain was significantly higher than the
transverse strain.
Figure 6. 48. Stress vs. transverse strain for crossply PAAS/trihexylamine sized AS-4carbon fiber reinforced phenolic novolac/epoxy composites
6.4. ConclusionsSeveral sequestered catalysts were investigated in this research for use as latent
initiators for phenolic novolac/epoxy cure reactions. All approaches used the glass
transition temperatures of the particles as means for controlling catalyst release. The use
of all sequestered catalysts in novolac/epoxy mixtures significantly increased the
processing windows compared to the mixtures containing free catalysts, and the reaction
rates were enhanced significantly at the cure temperatures in the presence of sequestered
catalysts. However, diffusion of catalyst from sequestered particles to novolac/epoxy
mixture led to reduced processing windows compared to the uncatalyzed systems. Even
a small amount of catalyst which diffused into the reactant led to premature curing. At
cure temperatures, reactions proceeded slower when a sequestered catalyst was used as
opposed to when the free catalyst was used. The slower reactions were attributed to the
time that was necessary for the catalysts to become uniformly dispersed in the
0100200300400
500600700800900
-0.03 0.04 0.11transverse strain (mm)
stre
ss (M
Pa)
243
novolac/epoxy mixtures. The failure to release all of the catalyst when the reaction
temperature lag below the Tg of the pure polymer sequestering agent reduced the actual
TPP concentration in novolac/epoxy mixtures.
A poly(amic acid)/trihexylamine salt was synthesized for use as a latent initiator
sizing for carbon fiber reinforced composites. Reaction kinetics indicated that fast
phenolic novolac/epoxy reaction rates could be achieved in the presence of
trihexylamine. Composites prepared with poly(amic acid)/trihexylamine sized fiber
showed properties comparable to those prepared with the G’ sized and poly(amic
acid)/TTMPP sized fiber. These results suggested that poly(amic acid)/trihexylamine
sizing could be used as a latent initiator for phenolic novolac/epoxy composite
fabrications.

244
7. Conclusions
The ultimate goal of this research was to develop tough, flame-retardant,
processable carbon fiber reinforced composites for structural applications. The focus has
been on oligomer syntheses, network formation and properties, and latent initiator
preparation.
An important aspect of this research was to synthesize linear controlled molecular
weight cresol novolac resins. In these reactions, difunctional ortho- or para-cresol was
reacted with monofunctional 2,6-dimethylphenol as an endcapping reagent,
paraformaldehyde and oxalic acid dihydrate at 100°C for 24 hours followed by heating
gradually to 200°C under mild vacuum. The molecular weights were controlled by the
cresol to endcapping reagent ratio and an excess of formaldehyde was necessary to
achieve the targeted molecular weights. The need for about 10 mol % excess
formaldehyde was unexpected. Some of the excess formaldehyde needed could be
attributed to small amounts evolving from the reaction apparatus during synthesis, and
also to formaldehyde lost to dimethylene ether linkage formation. However, it was
reasoned that a dynamic equilibrium reaction between formaldehyde substitution and
elimination must also occur to allow for the desired molecular weights to be generated.
This synthetic method consistently produced oligomer molecular weights very close to
the targeted values based on endcapper to cresol predicted ratios. An effective method
was developed for monitoring the reaction progression and calculation the molecular
weight using 13C NMR. Various chemical shifts allowed for confirmation of very high
reaction conversions. High conversions of reactive phenolic ring positions were
necessary to achieve the targeted molecular weights.
The network structure-property relationships were determined for a linear cresol
novolac resin crosslinked with Epon 828 (Bisphenol-A epoxy) or DEN 438 (epoxidized
novolac) at defined compositions. Cresol novolac/epoxy networks were prepared using a
2000 g/mol controlled molecular weight 2,6-dimethylphenol endcapped ortho-cresol
novolac resin and the network properties were compared to an epoxy control, a phenolic
control and a phenolic novolac/epoxy network (65:35 wt:wt ratio). The 70:30 and 60:40

245
compositions exhibited relatively high toughness (KIC > 1 MPa/m1/2) and high glass
transition temperatures (>144-154°C). It is important to note that the properties of these
networks prepared from readily available cresol monomers exceeded those of the epoxy
control, the phenolic control and the phenolic novolac/epoxy networks. The increased
glass transition temperatures were attributed to the methyl carbon on cresols which
hindered chain rotations while the increased toughness was achieved by controlling the
network crosslink density.
The molecular weight between crosslinks showed that the network density was
optimized at the 70:30 composition (3.6:1 eq:eq ratio) (Mx ~1500 g/mol). These
molecular weights between crosslinks were most desirable for networks cured with 2000
g/mol oligomers. Compositions high in novolacs (80:20 wt:wt ratio) had reduced
crosslink densities due to insufficient network connectivity; compositions high in epoxies
(60:40 wt:wt ratio) also had reduced apparent crosslink densities since the lack of
mobility prohibited further phenolic/epoxy reactions, which led to increased epoxy sol
fractions.
The molecular relaxation behavior into the glassy region were investigated to
assess the network crosslink density and chemical structures in the glassy state. Master
curves and cooperativity plots were generated for cresol novolac/epoxy networks. The
fragility, which was used to investigate the temperature dependence of segmental
relaxation through the transition region, showed that both crosslink density and hydrogen
bonding affected the Epon 828 epoxy cured cresol novolac networks. It was possible that
an antiplasticizer effect caused by the low molecular weight sol fractions in the network
also led to the apparent increased glassy moduli. Crosslink density seemed to be the
dominating factor in the D.E.N. 438 epoxy cured cresol novolac networks.
The major chemical difference between phenolic novolac and cresol novolac is
the pendent methyl substituent on cresol. In the present work, all methyl groups are
ortho with respect to the hydroxyl substituent. This provided a steric affect which
reduced the equilibrium water uptake by increasing the hydrophobicity. Cresol
novolac/epoxy networks exhibited comparable relatively low equilibrium water
absorptions as the epoxy control (~ 2 wt. % at room temperature) and were relatively
unaffected by the network compositions. The ortho-methyl substituent also reduced the

246
reaction rate of the hydroxyl group with epoxies due to a steric effect. This produced
longer processing time windows when the novolac were reacted with epoxies at elevated
temperatures.
The presence of the methyl group on each repeat unit slightly increased the peak
heat release rates and reduced the char yields for cresol novolac networks. The peak heat
release rates of ortho-cresol novolac/epoxy networks were between 300-450 kW/m2. The
flame retardance of all of the novolac/epoxy networks were significantly improved
compared to that of the epoxy control, but inferior to the flame retardance of phenolic
control.
Another important aspect of this research involved developing latent initiators or
catalysts for the novolac/epoxy reaction. Several sequestered catalysts were investigated
for use as latent initiators to enable melt processing of novolac/epoxy mixtures. Ideal
sequestered catalysts are inert at the processing temperature but catalyze reaction
efficiently at the cure temperatures. All approaches used the glass transition temperatures
of the particles as the means for controlling catalyst release. The use of all sequestered
catalysts in novolac/epoxy mixtures significantly increased the processing windows
compared to the windows for mixtures containing free catalysts, and the reaction rates
were accelerated considerably by the sequestered catalysts at the cure temperature.
However, diffusion of catalyst from the sequestered catalyst particles into the
novolac/epoxy mixture led to reduced processing windows compared to that of the
uncatalyzed systems. At cure temperatures, reactions proceeded slower when a
sequestered catalyst was used than when the free catalyst was used. The slower reactions
were attributed to slow catalyst diffusion to form uniform dispersions in the
novolac/epoxy mixtures.
An alternative method involved placing the catalyst directly onto the carbon fiber
as a sizing. A poly(amic acid)/trihexylamine salt was synthesized for use as a latent
initiator sizing for carbon fiber reinforced composites which would release trihexylamine
upon imidization. Reaction kinetics indicated that fast phenolic novolac/epoxy reaction
rates could be achieved in the presence of trihexylamine. Composites prepared with
poly(amic acid)/trihexylamine salt sized fiber showed properties comparable to those
prepared with the G’ sized and poly(amic acid)/tris-(trimethoxyphenylphosphine) salt

247
sized fiber. These results suggested that the poly(amic acid)/trihexylamine salt sizing
could be used as a latent initiator for phenolic novolac/epoxy carbon fiber composite
fabrications.

248
8. Recommendation for Future Work
The properties of cresol novolac/epoxy networks approach those required by the
microelectronics industry, i.e. high glass transition temperatures combined with
toughness and flame retardance. The toughness of cresol novolac/epoxy networks may
be improved by incorporating elastomeric or thermoplastic modifiers. Adding
phosphorus or nitrogen based additives may also improve the flame retardance.
The primary need for achieving efficient composite fabrication is to develop
latent catalysts which can be added directly into the novolac/epoxy mixtures under melt
processing conditions. The present work demonstrated that the sequestered catalysts
prepared by the physical blending method were inadequate for obtaining good melt
processability in the phenolic novolac/epoxy systems studied. Alternative methods
should be explored to obtain fully encapsulated controlled size particles. Fully
encapsulated catalyst particles should eliminate pre-mature curing at the processing
temperature yet promote fast reactions at the cure temperature. Proposed methods for
preparing such particles might include a chem-physical approach in which a layer of
polymer is coated onto the catalyst particle surface via co-precipitation or a chemical
approach in which monomers are reacted in-situ onto the catalyst particle surface to form
a protective polymeric layer. These methods should also allow better control over
particle size, which is necessary to form uniformly dispersed novolac/epoxy/particle resin
mixtures.
It is also recommended that the melt processability of the less reactive cresol
novolac/epoxy mixtures be investigated in the presence of sequestered catalysts
developed in this research. Longer processing-time windows are expected in this
combination. However, this approach will only be effective if the polymer in the
sequestered particles is immiscible with the cresol novolac/epoxy mixture.
249
VITA
Sheng Lin-Gibson was born in Shanghai, China in 1975. She grew up in
Shenyang, a northeastern city in the Liaoning province. Sheng came to America when
she was 12 years old and lived with her parents and brother in Greenbelt, Maryland.
There she attended middle school and high school. Her family moved to Blacksburg,
Virginia in 1992, where Sheng finished her high school career at Blacksburg High
School. Upon graduation in 1993, Sheng stayed in Blacksburg to attend Virginia Tech
and pursue degrees in Biochemistry and Chemistry. While taking Organic Chemistry as
a freshman, she was given the opportunity to conduct undergraduate research under the
direction of Dr. Judy S. Riffle and the Center for Adhesives and Sealant Science (CASS).
Upon graduation in May of 1997, Sheng participated in IBM’s summer internship
program at the T.J. Watson research laboratory and returned to Virginia Tech in the fall
to pursue a Ph.D. in chemistry under the guidance of Dr. Riffle. Sheng defended her
dissertation in April 2001. She received a National Research Council Fellowship and
will be conducting research related to nanocomposites and nanotubes at the National
Institute of Standard and Technology (NIST) in Gaithersburg, Maryland.
Related Documents