49 Comments to the financial statements Consolidated income statement Consolidated balance sheet Consolidated statement of source and application of funds Consolidated off-balance sheet business Notes to the consolidated financial statements Report of the Group’s auditors Income statement (parent company) Balance sheet before allocation of retained earnings (parent company) Notes to the financial statements (parent company) Proposed allocation of retained earnings Report of the statutory auditors 50 52 54 55 56 58 101 102 103 104 108 109 FINANCIAL REPORT

credit swisseAnnual Report Part 2 Financial report 1998 / 1999
Jun 07, 2015
Welcome message from author
This document is posted to help you gain knowledge. Please leave a comment to let me know what you think about it! Share it to your friends and learn new things together.
Transcript
FINANCIAL REPORT
03_CSGB_E_Financial Report 30.4.1999 21:17 Uhr Seite 49
Comments to the financial statements
Consolidated income statement
Consolidated balance sheet
Consolidated statement of sourceand application of funds
Consolidated off-balance sheet business
Notes to the consolidated financial statements
Report of the Group’s auditors
Income statement (parent company)
Balance sheet before allocation of retained earnings (parent company)
Notes to the financial statements (parent company)
Proposed allocation of retained earnings
Report of the statutory auditors
50
52
54
55
56
58
101
102
103
104
108
109
49

03_CSGB_E_Financial Report 30.4.1999 21:17 Uhr Seite 50
COMMENTS TO THE FINANCIAL STATEMENTS
Credit Suisse Group’s Annual Report contains two sets of financial statements: the conso-
lidated annual financial statements of Credit Suisse Group at 31 December 1998 and the
annual financial statements of Credit Suisse Group, parent company, for the financial year
ended 31 March 1999. Both sets of statements have been examined by independent auditors.
Their reports are presented on pages 101 and 109.
The consolidated financial statements include Credit Suisse First Boston, Credit Suisse, Neue
Aargauer Bank, the Private Banks, the financial subsidiaries of Credit Suisse Group in
Guernsey, and Winterthur Insurance.
For the banking and financial businesses, the consolidated financial statements were
prepared pursuant to the accounting rules for banks; for the insurance business, the
accounting rules for insurance companies were applied. “Winterthur” Swiss Insurance
Company (Winterthur) is included in the consolidated financial statements using the pooling
of interests method. Significant information about insurance operations is shown separately
in the balance sheet and income statement; figures for previous periods have been adjusted
as prescribed by the pooling of interests method.
The 1998 financial year As of 1 January 1998, the business activities of Bank Leu Ltd
were focused on private banking. Individual and corporate customer relationships were
transferred to the responsibility of Credit Suisse. On 1 June 1998 (legally into force with
retroactive effect on 1 January 1998) Affida Bank, Zurich, was integrated into Bank Leu
Ltd, Zurich, and Bank Heusser, Basle, into Clariden Bank, Zurich. Affida Bank was fully
amalgamated with Bank Leu’s organisation, whilst the former Bank Heusser retained its
structures and operates under the name “Clariden Heusser, Basel”. On 31 July 1998, the
acquisition of the Garantia Group (São Paulo and Nassau) announced in June 1998 was
completed at a price of USD 675 m. In addition, Credit Suisse First Boston acquired two
leading brokerage firms in Australia and New Zealand, First Pacific Group, Sydney, and
First NZ Capital, Wellington. All these acquisitions are included in the consolidated financial
statements of Credit Suisse First Boston as of the acquisition date. Winterthur sold the
majority of its participation in HIH (Australia) in the first half of 1998; CHF 101 m profit was
recorded in extraordinary income. In the second half of 1998 the sale of Winterthur’s active
reinsurance business to PartnerRe was closed; extraordinary income of CHF 442 m was
recorded from this transaction.
In connection with the class action settlement for World War II, in August 1998
Credit Suisse Group and UBS AG reached a comprehensive settlement with the plaintiffs,
and the settlement contracts were signed in February 1999. Credit Suisse Group expects
its portion of the settlement payment to amount to CHF 381 m after tax. This amount is
included under extraordinary expenses in the Credit Suisse Group’s financial statements
and, as announced when the 1998 half-year results were released, it has been offset by
booking the appropriate sum from reserves for general banking risks to extraordinary income.
In addition, in order to create provisions for credit risks, another CHF 552 m of reserves for
general banking risks have been released through extraordinary income.
50

03_CSGB_E_Financial Report 30.4.1999 21:17 Uhr Seite 51
Total provisions of CHF 1,349 m were set aside in 1996 and 1997 for Credit Suisse
Group’s expected restructuring costs. Costs of CHF 298 m in 1996, CHF 450 m in 1997
and CHF 456 m in 1998 have been charged to these provisions. At the end of 1998, the
balance of the restructuring provision thus stood at CHF 145 m. In 1997, Credit Suisse
First Boston created provisions of CHF 332 m (CHF 237 m after tax) against extraordinary
expenses to cover expected restructuring costs associated with the acquisition of the Euro-
pean investment banking business of BZW. The integration of the business areas acquired
was completed during 1998, with CHF 204 m of the provision used for the purpose. At
Bank Leu, a provision of CHF 115 m (CHF 82 m after tax) was created against extraordin-
ary expenses in 1997 in order to implement the bank’s new organisational structure, which
became effective on 1 January 1998. CHF 12 m of this provision was used for this pur-
pose in 1997, CHF 75 m in 1998. A provision of CHF 375 m (CHF 300 m after tax) was
made for integration and restructuring costs incurred by the insurance business; a balance
of CHF 165 m remained as at 31 December 1998. Overall, the charges to these restructur-
ing provisions in 1998 amounted to CHF 965 m, leaving a total balance of CHF 446 m in
restructuring provisions. An extraordinary provision of CHF 523 m (CHF 453 m for banking
areas, CHF 70 m for insurance) was created in 1997 to cover technology costs, primarily
those associated with the IT changes required to prepare for the year 2000 and the launch
of the euro. Over the course of 1998, CHF 276 m (CHF 241 m for banking and CHF 35 m
for insurance) of this provision was spent accordingly. At the end of 1998, the total balance
of this provision came to CHF 247 m.
Pursuant to Swiss Stock Exchange legislation, the minority interests in Credit Suisse
First Boston, Credit Suisse and Winterthur were acquired in 1998; Credit Suisse Group
now holds 100% of the voting and ownership rights in the two banks and the insurance
company.
As at 31 March 1998, CS Life was transferred from Credit Suisse Group to Winterthur
and subsequently retroactively merged with the latter’s existing life insurance company,
Winterthur Life, as at 1 January 1998.
On 1 January 1999, the method of tax assessment in the Canton of Zurich was
changed to the current-year method. The figure for Swiss taxes in the 1998 income state-
ment thus includes a one-off relief from tax due to the Canton of Zurich amounting to
CHF 118 m.
Subsequent events On 15 February 1999, Credit Suisse Group announced the acquisition
of Warburg Pincus Asset Management Inc., and a stake of 19.9% in Warburg, Pincus & Co.’s
private equity business. Subject to regulatory approval, this transaction is scheduled to close
in June 1999.
Following organisational changes at Credit Suisse First Boston which combine the
Fixed Income division and Credit Suisse Financial Products into a new division, in April
1999 Credit Suisse Group repurchased Swiss Re’s 20% minority position in Credit Suisse
Financial Products.
51
03_CSGB_E_Financial Report 30.4.1999 21:17 Uhr Seite 52
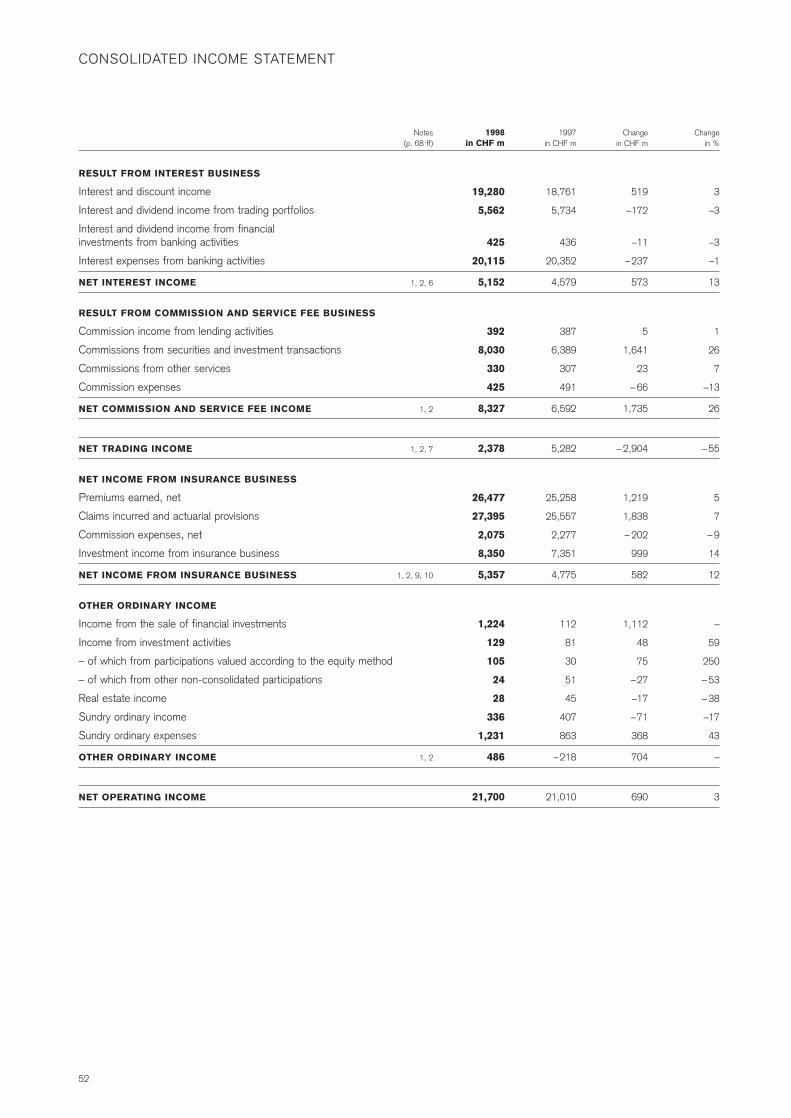
RESULT FROM INTEREST BUSINESS
Interest and discount income
Interest and dividend income from trading portfolios
Interest and dividend income from financial investments from banking activities
Interest expenses from banking activities
NET INTEREST INCOME
RESULT FROM COMMISSION AND SERVICE FEE BUSINESS
Commission income from lending activities
Commissions from securities and investment transactions
Commissions from other services
Commission expenses
NET COMMISSION AND SERVICE FEE INCOME
NET TRADING INCOME
NET INCOME FROM INSURANCE BUSINESS
Premiums earned, net
Claims incurred and actuarial provisions
Commission expenses, net
Investment income from insurance business
NET INCOME FROM INSURANCE BUSINESS
OTHER ORDINARY INCOME
Income from the sale of financial investments
Income from investment activities
– of which from participations valued according to the equity method
– of which from other non-consolidated participations
Real estate income
Sundry ordinary income
Sundry ordinary expenses
OTHER ORDINARY INCOME
NET OPERATING INCOME
Changein %
3
–3
–3
–1
13
1
26
7
–13
26
– 55
5
7
– 9
14
12
–
59
250
– 53
– 38
–17
43
–
3
Changein CHF m
519
–172
–11
–237
573
5
1,641
23
– 66
1,735
– 2,904
1,219
1,838
– 202
999
582
1,112
48
75
–27
–17
–71
368
704
690
1997in CHF m
18,761
5,734
436
20,352
4,579
387
6,389
307
491
6,592
5,282
25,258
25,557
2,277
7,351
4,775
112
81
30
51
45
407
863
–218
21,010
1998in CHF m
19,280
5,562
425
20,115
5,152
392
8,030
330
425
8,327
2,378
26,477
27,395
2,075
8,350
5,357
1,224
129
105
24
28
336
1,231
486
21,700
Notes(p. 68 ff)
1, 2, 6
1, 2
1, 2, 7
1, 2, 9, 10
1, 2
CONSOLIDATED INCOME STATEMENT
52

03_CSGB_E_Financial Report 30.4.1999 21:17 Uhr Seite 53
NET OPERATING INCOME CONTINUED
Personnel expenses
Other operating expenses
TOTAL OPERATING EXPENSES
GROSS OPERATING PROFIT
Depreciation and write-offs on non-current assets
Valuation adjustments, provisions and losses from banking business
DEPRECIATION, VALUATION ADJUSTMENTS, LOSSES
GROUP PROFIT BEFORE EXTRAORDINARY ITEMS AND TAXES
Extraordinary income
Extraordinary expenses
Taxes
GROUP PROFIT
Minority interests
NET PROFIT (AFTER MINORITY INTERESTS)
Changein %
3
7
12
8
– 6
11
21
19
– 28
17
– 84
– 46
435
–28
–
Changein CHF m
690
655
494
1,149
– 459
67
551
618
–1,077
231
– 2,961
– 499
2,614
–57
2,671
1997in CHF m
21,010
9,931
3,979
13,910
7,100
590
2,624
3,214
3,886
1,323
3,534
1,074
601
204
397
1998in CHF m
21,700
10,586
4,473
15,059
6,641
657
3,175
3,832
2,809
1,554
573
575
3,215
147
3,068
Notes(p. 68 ff)
1, 2
1
1, 8
1, 3
1, 4
1, 2
1
53
03_CSGB_E_Financial Report 30.4.1999 21:17 Uhr Seite 54
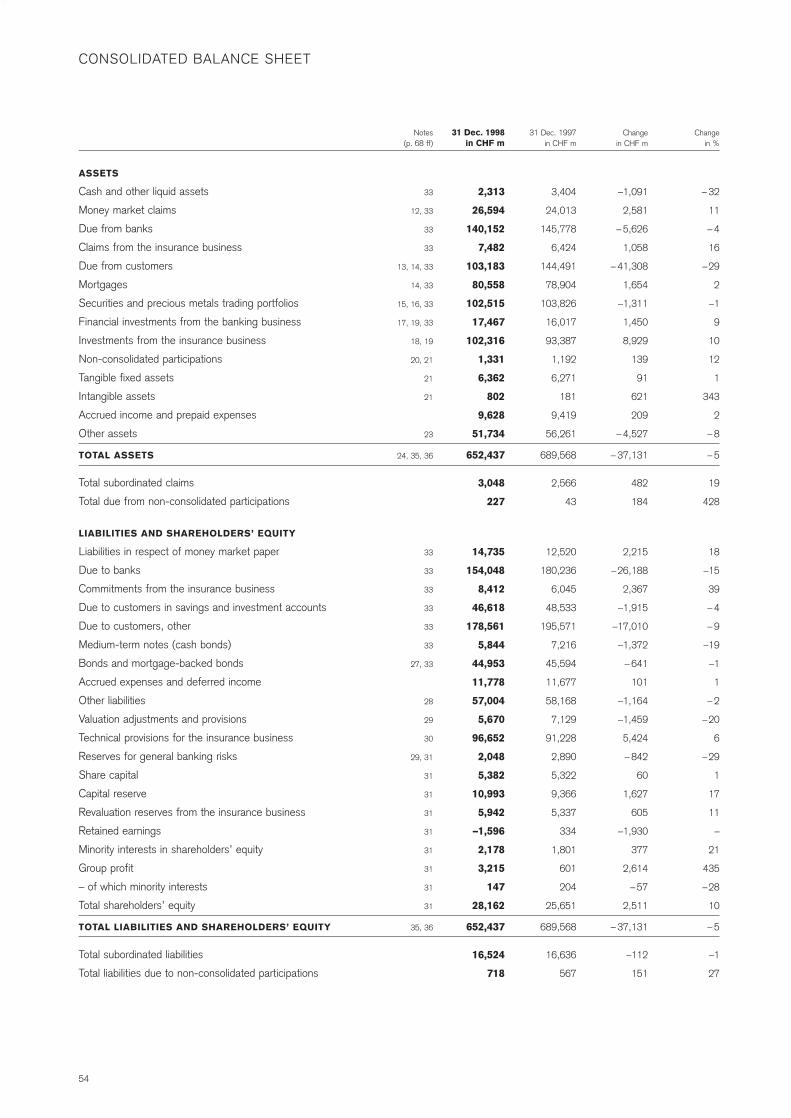
LIABILITIES AND SHAREHOLDERS’ EQUITY
Liabilities in respect of money market paper
Due to banks
Commitments from the insurance business
Due to customers in savings and investment accounts
Due to customers, other
Medium-term notes (cash bonds)
Bonds and mortgage-backed bonds
Accrued expenses and deferred income
Other liabilities
Valuation adjustments and provisions
Technical provisions for the insurance business
Reserves for general banking risks
Share capital
Capital reserve
Revaluation reserves from the insurance business
Retained earnings
Minority interests in shareholders’ equity
Group profit
– of which minority interests
Total shareholders’ equity
TOTAL LIABILITIES AND SHAREHOLDERS’ EQUITY
Total subordinated liabilities
Total liabilities due to non-consolidated participations
ASSETS
Cash and other liquid assets
Money market claims
Due from banks
Claims from the insurance business
Due from customers
Mortgages
Securities and precious metals trading portfolios
Financial investments from the banking business
Investments from the insurance business
Non-consolidated participations
Tangible fixed assets
Intangible assets
Accrued income and prepaid expenses
Other assets
TOTAL ASSETS
Total subordinated claims
Total due from non-consolidated participations
Notes(p. 68 ff)
33
12, 33
33
33
13, 14, 33
14, 33
15, 16, 33
17, 19, 33
18, 19
20, 21
21
21
23
24, 35, 36
CONSOLIDATED BALANCE SHEET
31 Dec. 1998in CHF m
2,313
26,594
140,152
7,482
103,183
80,558
102,515
17,467
102,316
1,331
6,362
802
9,628
51,734
652,437
3,048
227
31 Dec. 1997in CHF m
3,404
24,013
145,778
6,424
144,491
78,904
103,826
16,017
93,387
1,192
6,271
181
9,419
56,261
689,568
2,566
43
Changein CHF m
–1,091
2,581
– 5,626
1,058
– 41,308
1,654
–1,311
1,450
8,929
139
91
621
209
– 4,527
– 37,131
482
184
Changein %
– 32
11
– 4
16
–29
2
–1
9
10
12
1
343
2
– 8
– 5
19
428
33
33
33
33
33
33
27, 33
28
29
30
29, 31
31
31
31
31
31
31
31
31
35, 36
14,735
154,048
8,412
46,618
178,561
5,844
44,953
11,778
57,004
5,670
96,652
2,048
5,382
10,993
5,942
–1,596
2,178
3,215
147
28,162
652,437
16,524
718
12,520
180,236
6,045
48,533
195,571
7,216
45,594
11,677
58,168
7,129
91,228
2,890
5,322
9,366
5,337
334
1,801
601
204
25,651
689,568
16,636
567
2,215
–26,188
2,367
–1,915
–17,010
–1,372
– 641
101
–1,164
–1,459
5,424
– 842
60
1,627
605
–1,930
377
2,614
– 57
2,511
– 37,131
–112
151
18
–15
39
– 4
– 9
–19
–1
1
– 2
–20
6
–29
1
17
11
–
21
435
–28
10
– 5
–1
27
54

03_CSGB_E_Financial Report 30.4.1999 21:17 Uhr Seite 55
FROM OPERATIONS, EQUITY TRANSACTIONS AND INVESTMENTS
OPERATING ACTIVITIES
Net profit for the year
Provisions for credit and other risks
Losses
Provisions for taxes
Depreciation and write-offs
Creation of extraordinary valuation adjustmentsand provisions
Extraordinary income
Valuation of companies valued accordingto the equity method
Accrued income and prepaid expenses
Accrued expenses and deferred income
EQUITY TRANSACTIONS
Share capital
Capital surplus and retained earnings
Dividends paid
Foreign exchange differences
Minority interests
INVESTMENTS IN LONG-TERM ASSETS
Investments in companies
Real estate
Other tangible and intangible fixed assets
FINANCIAL INVESTMENTS, PROVISIONS,OTHER ASSETS AND LIABILITIES
Investments from the banking business
Investments from the insurance business
Valuation adjustments and provisions
Technical provisions 1
Other assets
Other liabilities
FROM OTHER BALANCE SHEET ITEMS
ASSETS
Money market claims
Due from banks
Claims from the insurance business
Due from customers
Mortgages
LIABILITIES
Liabilities in respect of money market paper
Due to banks
Commitments from the insurance business
Due to customers in savings and investment accounts
Due to customers, other
Bonds and medium-term notes
CHANGE IN LIQUID ASSETS
Securities and precious metals trading portfolios
Cash and accounts with central banks
1 In line with insurance practice, the change in the technical provisions is shown as a total amount under changes in provisions affecting the cash flow.
1997Net in/outflow
in CHF m
–24
8,317
1,746
93
–10,180
18,942
–15,833
34,775
18,918
Applicationin CHF m
1,213
30
1,916
1,114
38
1,000
4,436
12,274
1,198
14,642
3,936
23,133
407
2,227
14,336
Sourcein CHF m
601
2,617
133
1,250
617
3,330
2,928
1,436
1,358
104
813
280
7,378
14,992
13,870
1,284
1,033
1,237
29,008
16,549
18,446
472
1998Net
in/outflowin CHF m
1,186
5,917
226
– 874
– 4,083
– 3,588
38,956
– 42,544
– 2,402
Applicationin CHF m
1,488
105
209
1,457
363
1,430
1,450
8,929
3,108
1,164
2,581
1,058
3,265
26,188
1,915
17,010
2,013
1,311
1,091
Sourcein CHF m
3,215
2,584
101
575
681
462
101
60
1,922
64
514
42
5,424
5,144
5,626
40,234
2,215
2,367
CONSOLIDATED STATEMENT OF SOURCE AND APPLICATION OF FUNDS
55
03_CSGB_E_Financial Report 30.4.1999 21:17 Uhr Seite 56
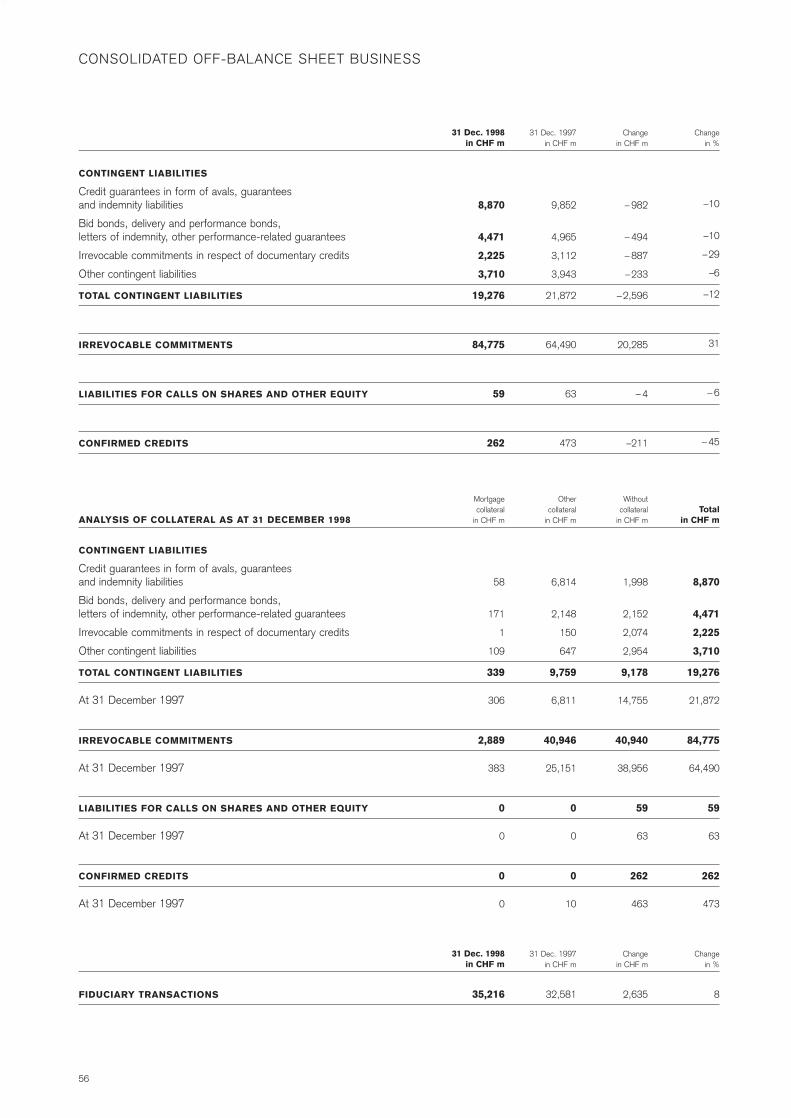
ANALYSIS OF COLLATERAL AS AT 31 DECEMBER 1998
CONTINGENT LIABILITIES
Credit guarantees in form of avals, guarantees and indemnity liabilities
Bid bonds, delivery and performance bonds,letters of indemnity, other performance-related guarantees
Irrevocable commitments in respect of documentary credits
Other contingent liabilities
TOTAL CONTINGENT LIABILITIES
At 31 December 1997
IRREVOCABLE COMMITMENTS
At 31 December 1997
LIABILITIES FOR CALLS ON SHARES AND OTHER EQUITY
At 31 December 1997
CONFIRMED CREDITS
At 31 December 1997
FIDUCIARY TRANSACTIONS
CONTINGENT LIABILITIES
Credit guarantees in form of avals, guarantees and indemnity liabilities
Bid bonds, delivery and performance bonds, letters of indemnity, other performance-related guarantees
Irrevocable commitments in respect of documentary credits
Other contingent liabilities
TOTAL CONTINGENT LIABILITIES
IRREVOCABLE COMMITMENTS
LIABILITIES FOR CALLS ON SHARES AND OTHER EQUITY
CONFIRMED CREDITS
Changein %
–10
–10
–29
–6
–12
31
– 6
– 45
Changein CHF m
– 982
– 494
– 887
–233
–2,596
20,285
– 4
–211
31 Dec. 1997in CHF m
9,852
4,965
3,112
3,943
21,872
64,490
63
473
31 Dec. 1998in CHF m
8,870
4,471
2,225
3,710
19,276
84,775
59
262
CONSOLIDATED OFF-BALANCE SHEET BUSINESS
Total in CHF m
8,870
4,471
2,225
3,710
19,276
21,872
84,775
64,490
59
63
262
473
Changein %
8
Withoutcollateral
in CHF m
1,998
2,152
2,074
2,954
9,178
14,755
40,940
38,956
59
63
262
463
Changein CHF m
2,635
Othercollateral
in CHF m
6,814
2,148
150
647
9,759
6,811
40,946
25,151
0
0
0
10
31 Dec. 1997in CHF m
32,581
Mortgagecollateral
in CHF m
58
171
1
109
339
306
2,889
383
0
0
0
0
31 Dec. 1998in CHF m
35,216
56

03_CSGB_E_Financial Report 30.4.1999 21:17 Uhr Seite 57
DERIVATIVE INSTRUMENTS
INTEREST RATE PRODUCTS
Forward rate agreements
Swaps
Options bought and sold (OTC)
Forwards
Futures
Options bought and sold (traded)
TOTAL INTEREST RATE PRODUCTS
FOREIGN EXCHANGE PRODUCTS
Forwards1
Swaps 2
Options bought and sold (OTC)
Futures
Options bought and sold (traded)
TOTAL FOREIGN EXCHANGE PRODUCTS
PRECIOUS METALS PRODUCTS
Forwards1
Options bought and sold (OTC)
Futures
Options bought and sold (traded)
TOTAL PRECIOUS METALS PRODUCTS
EQUITY/INDEX-RELATED PRODUCTS
Forwards
Options bought and sold (OTC)
Futures
Options bought and sold (traded)
TOTAL EQUITY/INDEX-RELATED PRODUCTS
OTHER PRODUCTS
Forwards
Options bought and sold (OTC)
Futures
Options bought and sold (traded)
TOTAL OTHER PRODUCTS
TOTAL, GROSS
TOTAL REPLACEMENT VALUESACCORDING TO THE BALANCE SHEET
1 including outstanding spot transactions2 cross-currency interest rate swaps3 positive replacement value after deduction of CHF 4.4 bn (1997: CHF 3.1 bn) of assets pledged as security4 No replacement values are shown for traded derivatives (futures and traded options) subject to daily margining requirements.
Total positive and negative replacement values on traded derivatives amount to CHF 1.4 bn and CHF 2.1 bn respectively.5 of which from the insurance business: positive replacement values CHF 1.3 bn (1997 CHF 0.4 bn), negative replacement values CHF 0.6 bn (1997 CHF 0.2 bn)
31 Dec. 1997Negative gross
replacementvalue
in CHF bn
0.1
38.2
5.0
0.0
–
–
43.3
17.7
10.3
5.7
–
–
33.7
2.0
0.7
–
–
2.7
0.0
10.4
–
–
10.4
0.0
0.0
–
–
0.0
90.1
50.9 5
31 Dec. 1997Positive gross
replacementvalue
in CHF bn
0.3
39.6
5.1
0.0
–
–
45.0
19.2
9.2
5.3
–
–
33.7
1.6
0.5
–
–
2.1
0.1
10.4
–
–
10.5
0.0
0.1
–
–
0.1
91.4
50.2 3, 5
31 Dec. 1997Notionalamount
in CHF bn
193.7
1,551.2
598.3
0.1
420.8
219.0
2,983.1
667.6
216.8
534.2
0.4
0.1
1,419.1
26.3
8.6
1.8
0.0
36.7
2.0
204.4
21.0
63.4
290.8
0.0
3.1
9.5
0.6
13.2
4,742.9
31 Dec. 1998Negative gross
replacementvalue 4
in CHF bn
0.1
60.3
8.8
0.3
–
–
69.5
16.9
11.6
6.1
–
–
34.6
1.1
0.9
–
–
2.0
0.6
14.7
–
–
15.3
0.0
0.1
–
–
0.1
121.5
49.2 5
31 Dec. 1998Positive gross
replacementvalue 4
in CHF bn
0.1
65.3
8.5
0.2
–
–
74.1
14.7
9.3
5.5
–
–
29.5
0.9
0.5
–
–
1.4
0.7
13.8
–
–
14.5
0.0
0.3
–
–
0.3
119.8
43.13, 5
31 Dec. 1998Notionalamount
in CHF bn
152.7
2,383.1
914.1
54.0
539.2
633.8
4,676.9
782.2
247.4
342.3
1.5
0.3
1,373.7
18.8
15.4
0.2
0.4
34.8
8.2
191.4
38.6
63.2
301.4
0.1
4.0
8.5
0.1
12.7
6,399.5
57
03_CSGB_E_Financial Report 30.4.1999 21:17 Uhr Seite 58
NOTES TO THE CONSOLIDATED FINANCIAL STATEMENTS
GENERAL PRINCIPLES
The Group financial statements have been drawn up based on the accounting rules of
the Implementing Ordinance to the Swiss Federal Law on Banks and Savings Banks of
1 February 1995 and the Federal Banking Commission guidelines of 14 December
1994 (with the amendments of 14 November 1996 and 22 October 1997), supple-
mented by the pooling of interests method and the provisions of the Swiss accounting
and reporting recommendations with respect to insurance companies (FER 14). As
required by the pooling of interests method, the consolidated financial statements of
Credit Suisse Group show the combined results of Credit Suisse Group and Winterthur
as if the merger had been effective for all previous periods shown. In addition, the
consolidation and valuation policies reflect the accounting principles set out in the
Swiss stock exchange listing regulations; they also largely conform to the provisions of
the 4th and 7th EU directives and the EU directive governing the financial statements
of banks. The financial year for the Group ends on 31 December. Group companies
with a different closing date prepare interim financial statements as at 31 December for
consolidation purposes. For subsidiaries acquired after 1 January 1997, goodwill
(the amount paid in excess of the equity acquired when purchasing an interest in a
company) is stated in the balance sheet under “Intangible assets” and amortised over
its estimated useful life (not exceeding 20 years).
SCOPE AND METHOD OF CONSOLIDATION
The assets and liabilities, off-balance sheet transactions and income and expenses
of all the banking, insurance and financial institutions in which Credit Suisse Group
has a direct or an indirect interest of more than 50% as of the balance sheet date are
fully consolidated in the financial statements. For the “Winterthur” Swiss Insurance
Company subgroup, the capital is consolidated according to the pooling of interests
method. For the other Group companies the capital is consolidated according to the
purchase method as of 1 January 1990 (or later, if acquired thereafter). Intercompany
transactions and unrealised gains therefrom are eliminated. Minority interests in share-
holders’ equity and net profit are indicated separately, but are viewed as forming an
integral part of the corporate base. Other companies in which the Group has a stake of
20% or more are accounted for using the equity method. Long-term holdings which are
designated for resale are booked as “Financial investments”. Subsidiaries and long-term
holdings outside the core business, and less significant holdings are not consolidated.
58

03_CSGB_E_Financial Report 30.4.1999 21:17 Uhr Seite 59
CHANGES TO THE SCOPE OF CONSOLIDATION
The scope of consolidation has undergone the following material changes:
Group division Winterthur Insurance
HIH Winterthur, Sydney
The majority participation in HIH Winterthur of 51.2% was sold mid-1998. The approximately
7% stake still held by the Winterthur Group is included in investments from the insurance
business. HIH Winterthur was deconsolidated retroactively as at 1 January 1998.
Winterthur Reinsurance Corporation of America, New York
Winterthur Life U.S. Holdings, Inc., Wilmington
Winterthur Life Re Insurance Company, Dallas
The investments in the three above mentioned companies were sold as at 1 October
1998. Thus, the income statements of these companies are only included up to
30 September 1998.
Group division Credit Suisse First Boston
Banco di Investimentos Garantia S.A., São Paulo
Garantia Banking Limited, Nassau
For a price of USD 675 m, Credit Suisse First Boston took over 100% of the share
capital of both companies as at 31 July 1998. The companies operate under the name
of Banco de Investimentos Credit Suisse First Boston Garantia S.A. and Credit Suisse
First Boston Garantia Banking Limited respectively.
BZW business areas in the Asian region
In early 1998 selected BZW business areas in Asian investment banking were
acquired. The names of the individual companies are listed in note 37.
FOREIGN CURRENCY TRANSLATIONS
In the annual accounts of the individual Group companies, income and expense items
denominated in foreign currencies are translated into the relevant local reporting curren-
cies on the basis of the exchange rate as of the transaction date. Assets, liabilities and
off-balance sheet items are translated as of the year-end rate. Hedged assets and
liabilities are carried at their forward hedging rates. For the purposes of consolidation,
the balance sheets of foreign Group companies are translated into Swiss francs at the
year-end exchange rate, and their income statements are translated using the average
exchange rate for the financial year. Translation differences are credited or debited to
shareholders’ equity and are shown separately in the statement of shareholders’ equity.
The key foreign exchange rates are listed in the notes to the consolidated financial
statements on page 100.
59
60
NOTES TO THE CONSOLIDATED FINANCIAL STATEMENTS
03_CSGB_E_Financial Report 30.4.1999 21:17 Uhr Seite 60
DEVIATIONS FROM THE RELEVANT EU DIRECTIVES
The Swiss accounting rules for banks conform in essence to EU directives and guidelines.
The areas in which Group accounting policies deviate from the accounting principles set
out in the directives of the European Union (4th and 7th EU directives and the EU direc-
tive governing the financial statements of banks) can be summarised as follows:
– The classification criteria used in the balance sheet and the income statement differ
from those set out in the EU directive governing the financial statements of banks.
– The proportions of overall income and expenditure for operations outside Switzerland
are not detailed by geographical location but are provided as combined totals.
– No specific information is given concerning compensation or liabilities towards Members
of the Board of Directors or Members of the Executive Board of Credit Suisse Group.
– Securities and precious metals treated as trading positions are carried at their fair value.
Historical differences between cost and fair value are not disclosed in the notes to the
financial statements.
– Subsidiaries and long-term holdings which are not in the banking, finance or insurance
sectors are not consolidated.
– There is no formal management report on the business year.
The following are significant deviations from the EU directives governing the financial
statements of insurance companies:
– The classification and presentation used in the financial statements have been adjusted
from those set out in the EU directives governing the financial statements of insurance
companies. Winterthur Group publishes an annual report which focuses on the presentation
of the result of the insurance business.
– Unrealised gains on life business investments are taken to revaluation reserves as part
of shareholders’ equity and not to funds for future distribution to shareholders and
policyholders.
GENERAL ACCOUNTING AND VALUATION PRINCIPLES
Recording of business All completed business is recorded in the financial statements
as follows: foreign exchange, money market and precious metal transactions are recorded
on value (settlement) date. Prior to the value date, foreign exchange and precious metal
transactions are recorded as off-balance sheet business. Securities transactions are
recorded on a trade date basis.
Reclassification of prior year figures Certain amounts in the consolidated financial
statements for 1997 have been reclassified to conform to the 1998 presentation. Material
reclassification: In the insurance business, stamp duty is no longer included in “Tax expenses”
but in “Operating expenses” (1997: CHF 132 m) and in “Investment income”
(1997: CHF 44 m).

03_CSGB_E_Financial Report 30.4.1999 21:17 Uhr Seite 61
Repo business Repurchase and reverse repurchase transactions are shown in the
balance sheet as advances secured by securities or as deposits against which the
bank’s securities are pledged. Depending on the type of counterparty, they are shown
as claims on (“Due from”) or liabilities to (“Due to”) banks or customers. They are carried
in the balance sheet at the amounts at which the securities were initially acquired or
sold as specified by the respective agreements, plus interest accrued to the balance
sheet date.
Transactions involving non-monetary assets Claims and liabilities from lending
and borrowing transactions of non-monetary assets such as money market paper,
precious metals or commodities and those arising from securities lending and borrowing
are marked to market and, depending on the counterparty, are shown as claims on
or liabilities towards banks or customers. Securities positions arising as a result of
securities lending and borrowing are included in the securities and precious metals
trading portfolios.
Cash, bank balances, money market paper and loans Receivables and liabilities
are generally accounted for at nominal value. Money market instruments held for
trading are carried at their fair value. The necessary provisions for recognisable risks
and potential losses are normally deducted from the appropriate asset items in the
balance sheet. Endangered interest and commission income due from customers and
banks are not booked as “Income from interest business”. Instead, they are only included
in the income statement following payment. Provisions for exposures subject to country
risk, default risks and other bank risks are booked to “Valuation adjustments and
provisions”. This position contains no undisclosed reserves.
Leasing All leased items (capital goods, vehicles and real estate) are valued using
the annuity method and are stated as a separate item under lendings. The depreciation
charges contained in the rental income are set off directly against the book values of
the corresponding leased assets, so that only the interest portion of the rental income is
shown in the income statement.
Real estate Real estate is valued at the cost (including capital improvements) less
depreciation over its useful life (40–67 years). No depreciation is charged on land
except where valuation adjustments have been made to allow for a reduction in the
market value.
61

62
NOTES TO THE CONSOLIDATED FINANCIAL STATEMENTS
03_CSGB_E_Financial Report 30.4.1999 21:17 Uhr Seite 62
Other tangible fixed assets Other tangible fixed assets such as computers,
machinery, furnishings, vehicles and other equipment, as well as alterations and impro-
vements to rented premises, are depreciated using the straight line method over their
estimated useful life (in general 3–5 years).
Intangible assets The goodwill included in this balance sheet position arises from
the majority holdings acquired from 1 January 1997 in connection with the capital
consolidation. This goodwill is amortised over its estimated useful life (maximum 20 years).
Pension fund As a rule, employees are affiliated to legally autonomous staff pension
funds which are independent of the Group. The requisite contributions are made to the
pension funds and posted under “Personnel expenses”.
Taxes Tax expense is calculated on the basis of the annual results reported in the
individual financial statements of the Group companies. Deferred tax assets and liabili-
ties are established for the expected future tax implications of temporary differences
between the carrying amounts and the tax bases of assets and liabilities. Deferred tax
assets and liabilities calculated at the expected tax rate on the basis of adjustments in
the valuation of assets and liabilities for Group purposes are charged to tax expense
and recorded as other assets or provisions. No provision is made for non-recoverable
withholding taxes on undistributed profits of Group companies nor is a deferred tax
asset recognised arising from tax losses brought forward.
Claims and liabilities of related companies Claims and liabilities in respect of
related companies towards Group companies which are accounted for using the equity
method are reported in the notes to the consolidated financial statements.
03_CSGB_E_Financial Report 30.4.1999 21:17 Uhr Seite 63
VALUATION AND ACCOUNTING POLICIES IN RELATION
TO BANK-SPECIFIC POSITIONS
Securities trading portfolio The trading portfolio consists of balances held in
connection with the trading of readily realisable securities, securities acquired as a
result of underwriting activities and holdings of precious metals. Securitised and non-
securitised options are shown under “Other assets”.
Trading balances in bonds, shares and similar securities and precious metal
accounts and holdings are carried at fair value (amount for which an asset could be
exchanged, or a liability settled, between knowledgeable, willing parties in an arm’s-
length transaction) as of the balance sheet date. Profits and losses from the valuation
of the trading portfolio and realised gains and losses on these positions are shown
under “Income from trading”. Interest and dividend income from the trading portfolio is
credited to “Result from interest business”.
Financial investments from the banking business This balance sheet item
comprises securities and precious metal positions purchased as a long-term invest-
ment. It also includes real estate and holdings assumed from the lending business
and designated for resale.
Fixed-interest debt securities which are being held until final maturity are valued
according to the accrual method. In this case, premiums and discounts are accrued or
deferred over the term of the instrument until final maturity in the relevant balance sheet
position. Realised profits or losses which are interest related and which arise from the
early disposal or redemption of the instrument are accrued or deferred over the remain-
ing term of the instrument, i.e. to the original final maturity, and credited to or debited
from “Result from interest business” as appropriate.
Investment holdings of equities and debt securities which are designated for
resale and which do not constitute trading balances are valued according to lower of
cost or market. The notes to the consolidated financial statements include details of
both the cost price and the market value of these holdings.
Capital gains resulting from the sale of financial investments at above the
purchase price are shown under “Income from the sale of financial investments”.
Unrealised losses on equity positions as a result of a decrease in their market value, and
unrealised profits up to the original result of changes in creditworthiness, are accounted
for in the same way as credit business.
Real estate assumed from the lending business and designated for resale is
valued according to lower of cost or market.
63

64
NOTES TO THE CONSOLIDATED FINANCIAL STATEMENTS
03_CSGB_E_Financial Report 1.5.1999 15:36 Uhr Seite 64
Reserves for general banking risks Reserves for general banking risks are precau-
tionary reserves charged to “Extraordinary expenses” to hedge against latent risks in the
bank’s operating activities. Releases are credited to extraordinary income.
Derivatives Forward rate agreements, futures, swaps, options, forward contracts and
other over-the-counter off-balance sheet instruments held for trading purposes are
carried at their fair value and the resulting profits and losses are included in “Net trading
income” in the income statement. The resulting replacement values are included in
“Other assets” or “Other liabilities” as appropriate and are presented net by counterparty
for transactions in those products where the bank has a legal right of set off; otherwise
the replacement values are presented gross by contract.
Hedging transactions are valued using the same procedures as for the underlying
transactions they hedge.
Strategic positions are valued at lower of cost or market. Derivative financial
instruments which are deployed in the context of interest rate risk management are
valued according to the accrual method. The interest component is accrued or deferred
over the term of the instrument according to the annuity method. Realised profits or
losses which are interest related and which arise from the early disposal or redemption
of the instrument are also accrued or deferred over the remaining term of the instru-
ment, i.e. to the original final maturity.
CHANGES TO ACCOUNTING PRINCIPLES
Endangered interest Starting in 1998, the set up and release of provisions for
endangered interest is recorded under “Interest income”. Prior to 1998, provisions set
up for endangered interest overdue for less than 90 days and the reclassification of
provisions for endangered interest, which were no longer necessary from an economic
point of view, were recorded under “Valuation adjustments, provisions and losses”. The
prior year’s financial statements have not been restated. Impact on the 1998 financial
statement:
Net interest income: CHF – 99 m
Valuation adjustments, provisions and losses: CHF – 99 m
FINANCIAL INVESTMENTS
Assets held in the trading book Assets held in the trading book are carried at their
fair values as at the 1998 balance sheet date. Prior to 1998, the trading portfolio was
valued at market value. Assets that were not traded on a recognised stock exchange or
on a representative market were carried at the lower of cost or market value. The prior
year financial statements have not been restated. Impact on the 1997 consolidated
balance sheet and income statement would be:
Valuation adjustments and provisions: CHF – 69 m
Net trading income: CHF 69 m

03_CSGB_E_Financial Report 30.4.1999 21:17 Uhr Seite 65
YEAR 2000
The challenge faced by financial institutions worldwide as the year 2000 approaches is
substantial. It extends to almost every aspect of daily operations and interaction with the
markets. Credit Suisse Group began work on the year 2000 issue in 1996, utilising a
priority-driven methodology, encompassing inventory and assessment, remediation or
replacement, testing, third-party risk analysis and contingency planning.
Business-critical systems in the banking area are being addressed first, and, having
identified over 1,500 systems that require remediation, 84% were completed and put
back into production by 31 December 1998. Remediation of non-compliant date formats
has been achieved either by expanding the date format to incorporate four-digit years, or
by “windowing” for century determination. To mitigate third-party risks, during 1998 over
7,000 customers and business partners were contacted in relation to their own year 2000
projects. In addition, the Group’s banks have participated in 30 industry tests during
1998 and are committed to taking part in 59 industry tests planned during 1999. However,
with systems of such size and complexity, with multiple interfaces to and high reliance
upon external systems, no guarantee can be given that there will be no adverse effects
from the year 2000 issue. As a consequence, the banks have started a contingency
planning process which includes the formation of management teams to quickly respond
to unexpected events.
The Board of Directors and the Executive Board of Credit Suisse Group are provided
with regular status reports and have given the highest priority to the year 2000 project.
EVENTS SINCE THE BALANCE SHEET DATE
On 15 February 1999 Credit Suisse Group announced that Credit Suisse Asset Management
will acquire Warburg Pincus Asset Management, Inc., a leading US asset manager with
260 employees and USD 22 bn in assets under management, as well as a 19.9% pas-
sive minority equity stake in Warburg, Pincus & Co.’s private equity business. The price
of the asset management transaction was fixed at USD 650 m, including an initial
USD 450 m and an additional USD 200 m earn-out over three years. Subject to
regulatory approval, the agreement is expected to close by mid-1999.
Following the organisational changes at Credit Suisse First Boston which combine the
Fixed Income division and Credit Suisse Financial Products in a new division, in April 1999
Credit Suisse Group repurchased Swiss Re’s 20% minority position in Credit Suisse
Financial Products.
65

66
NOTES TO THE CONSOLIDATED FINANCIAL STATEMENTS
03_CSGB_E_Financial Report 30.4.1999 21:17 Uhr Seite 66
VALUATION AND ACCOUNTING POLICIES IN RELATION
TO INSURANCE-SPECIFIC POSITIONS
INVESTMENTS IN RESPECT OF INSURANCE BUSINESS
Real estate Real estate is valued at the market price. The market value of a property
is calculated at its capitalised rental income at the interest rate applied in the country
or market in question. Undeveloped plots of land and buildings under construction are
carried at cost.
Bonds and loans Bonds and loans are valued according to the amortised cost method.
The difference between the purchase price and the redemption value is distributed over
the remaining life so that a constant yield is achieved. The corresponding valuation
adjustment is shown under the position “Net investment income from insurance busi-
ness”. Default risk is accounted for through the use of write-offs. Intercompany trans-
actions and unrealised gains have been eliminated, with the exception of assets booked
as investments from insurance business.
Shares Listed shares are marked to market at year-end. Unlisted shares are valued
at cost. If the yield or intrinsic value is endangered, a valuation adjustment is made.
Derivatives Derivatives and other financial instruments are generally used to hedge
the exposure to changes in the fair value of recognised assets, liabilities and firm
commitments. Any gains and losses are therefore recognised in the income statement
together with the offsetting loss or gain on the hedged item.
Investments for the benefit of life insurance policyholders who bear the
investment risk Investments for the benefit of life insurance policyholders who bear
the investment risk are carried at their market value.
Statement of higher and lower values arising from the uniform valuation of
investments in the Group accounts and revaluation reserves Higher or lower
values arising from the uniform valuation of investments in the Group accounts in com-
parison with the figures contained in the statutory accounts are recorded as follows:
Valuation differences resulting from the revaluation of fixed-interest securities and
mortgages, unlisted shares and non-consolidated long-term holdings are included in the
income statement (under “Net investment income from insurance business”).
In the case of listed shares and real estate, compensated write-offs in respect of the
difference between the balance sheet value in the statutory accounts and the cost value
are stated in the income statement (“Net investment income from insurance business”).
Valuation differences between cost and market values are allocated to shareholders’ equity
(“Revaluation reserves from the insurance business”) directly, without affecting the income
statement, after deferred tax calculated on the basis of a full provision on unrealised gains
for which there is no contractual obligation to pay to policyholders upon realisation.

03_CSGB_E_Financial Report 30.4.1999 21:17 Uhr Seite 67
Technical provisions The amount of the technical provisions is based on the ex-
pected liabilities due to the insured and the claimants. As a rule, calculations are made
individually, i.e. depending on the insurance contract or claim. Statistical or mathematical
calculation methods are applied if these lead to approximately the same results and if
they conform to the methods approved by the supervisory authorities of the respective
countries. The equalisation reserves legally prescribed and locally created in some
countries are not included in the Group accounts. As a rule, provisions for claims out-
standing are not discounted. Technical provisions for life business are calculated with
regard to local regulations. The surplus due to policyholders is accounted for on the
basis of the resolutions passed by the individual companies as to the distribution of profit.
CHANGES TO ACCOUNTING PRINCIPLES
Equalisation reserves and discount The amounts taken over from the local
accounts in the previous years in order to create equalisation reserves as well as the
discounts made in accordance with local regulations are no longer considered. The
one-time change-over effect has a positive influence on the income statement
amounting to CHF 71.8 m.
67

NOTES TO THE CONSOLIDATED FINANCIAL STATEMENTS
03_CSGB_E_Financial Report 30.4.1999 21:17 Uhr Seite 68
Banking business Insurance business Total1 SPLIT OF INCOME STATEMENT INTO BANKING
AND INSURANCE BUSINESS
Net interest income
Net commission and service fee income
Net trading income
Net income from insurance business
Other ordinary income
NET OPERATING INCOME
Salaries and other compensation
Employee benefits
Other personnel expenses
Personnel expenses
Premises and real estate expenses
Expenses for IT, machinery, furnishing,vehicles and other equipment
Sundry operating expenses
Other operating expenses
Total operating expenses
GROSS OPERATING PROFIT
Depreciation and write-offs on non-current assets
Valuation adjustments, provisions and losses
Total depreciation, valuation adjustments,losses
GROUP PROFIT BEFORE EXTRAORDINARYITEMS AND TAXES
Extraordinary income
Extraordinary expenses
Taxes
GROUP PROFIT
Minority interests
NET PROFIT (AFTER MINORITY INTERESTS)
Expenses due to the handling of both claims and investments are allocated to the income from insurance business.1 personnel expenses CHF 510 m (previous year CHF 573 m)2 other operating expenses CHF 321 m (previous year CHF 312 m)
1997in CHF m
4,579
6,592
5,282
4,775
–218
21,010
8,368
942
621
9,931
773
855
2,351
3,979
13,910
7,100
590
2,624
3,214
3,886
1,323
3,534
1,074
601
204
397
1998in CHF m
5,152
8,327
2,378
5,357
486
21,700
8,919
1,005
662
10,586
885
921
2,667
4,473
15,059
6,641
657
3,175
3,832
2,809
1,554
573
575
3,215
147
3,068
1997in CHF m
0
0
0
4,775 1,2
– 594
4,181
1,401
310
209
1,920 1
242
166
751
1,159 2
3,079
1,102
17
0
17
1,085
0
445
232
408
90
318
1998in CHF m
0
0
0
5,357 1,2
–900
4,457
1,332
325
224
1,881 1
213
137
826
1,176 2
3,057
1,400
90
0
90
1,310
543
0
371
1,482
111
1,371
1997in CHF m
4,579
6,592
5,282
0
376
16,829
6,967
632
412
8,011
531
689
1,600
2,820
10,831
5,998
573
2,624
3,197
2,801
1,323
3,089
842
193
114
79
1998in CHF m
5,152
8,327
2,378
0
1,386
17,243
7,587
680
438
8,705
672
784
1,841
3,297
12,002
5,241
567
3,175
3,742
1,499
1,011
573
204
1,733
36
1,697
68
03_CSGB_E_Financial Report 30.4.1999 21:17 Uhr Seite 69
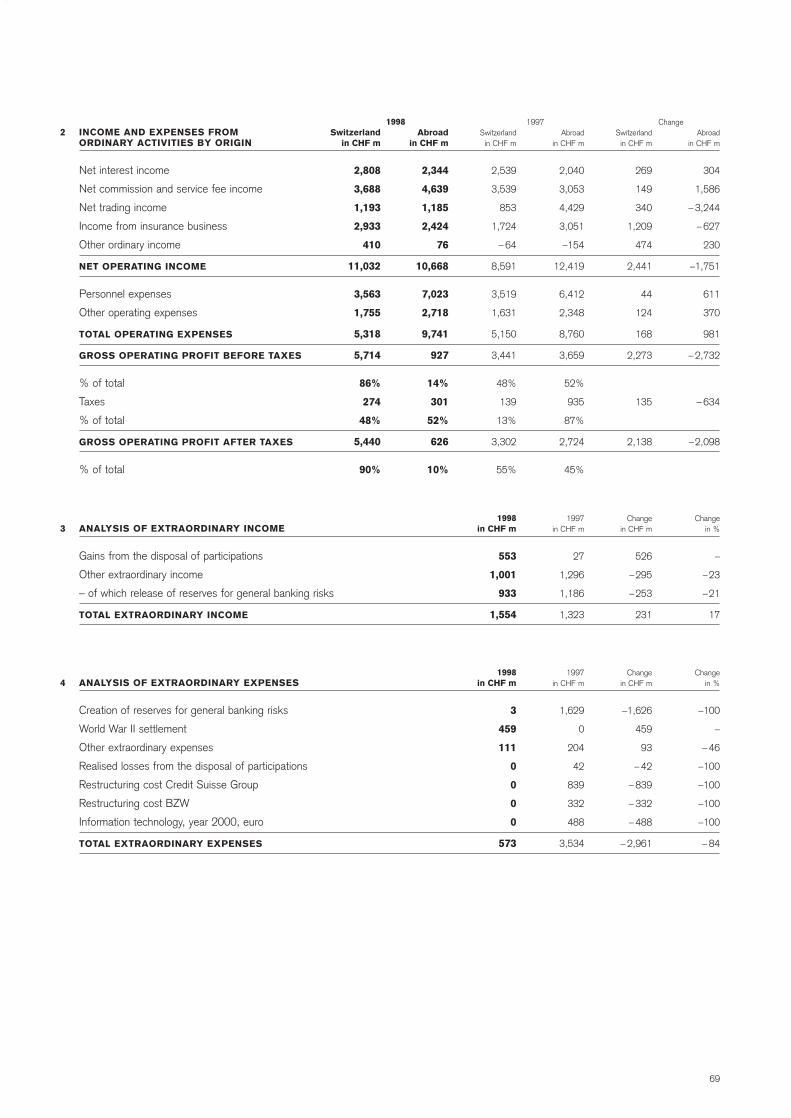
1998 1997 Change2 INCOME AND EXPENSES FROM
ORDINARY ACTIVITIES BY ORIGIN
Net interest income
Net commission and service fee income
Net trading income
Income from insurance business
Other ordinary income
NET OPERATING INCOME
Personnel expenses
Other operating expenses
TOTAL OPERATING EXPENSES
GROSS OPERATING PROFIT BEFORE TAXES
% of total
Taxes
% of total
GROSS OPERATING PROFIT AFTER TAXES
% of total
3 ANALYSIS OF EXTRAORDINARY INCOME
Gains from the disposal of participations
Other extraordinary income
– of which release of reserves for general banking risks
TOTAL EXTRAORDINARY INCOME
4 ANALYSIS OF EXTRAORDINARY EXPENSES
Creation of reserves for general banking risks
World War II settlement
Other extraordinary expenses
Realised losses from the disposal of participations
Restructuring cost Credit Suisse Group
Restructuring cost BZW
Information technology, year 2000, euro
TOTAL EXTRAORDINARY EXPENSES
Abroadin CHF m
304
1,586
– 3,244
– 627
230
–1,751
611
370
981
– 2,732
– 634
–2,098
Changein %
–
–23
–21
17
Changein %
–100
–
– 46
–100
–100
–100
–100
– 84
Switzerlandin CHF m
269
149
340
1,209
474
2,441
44
124
168
2,273
135
2,138
Changein CHF m
526
–295
–253
231
Changein CHF m
–1,626
459
93
– 42
– 839
– 332
– 488
– 2,961
Abroadin CHF m
2,040
3,053
4,429
3,051
–154
12,419
6,412
2,348
8,760
3,659
52%
935
87%
2,724
45%
1997in CHF m
27
1,296
1,186
1,323
1997in CHF m
1,629
0
204
42
839
332
488
3,534
Switzerlandin CHF m
2,539
3,539
853
1,724
– 64
8,591
3,519
1,631
5,150
3,441
48%
139
13%
3,302
55%
1998in CHF m
553
1,001
933
1,554
1998in CHF m
3
459
111
0
0
0
0
573
Abroadin CHF m
2,344
4,639
1,185
2,424
76
10,668
7,023
2,718
9,741
927
14%
301
52%
626
10%
Switzerlandin CHF m
2,808
3,688
1,193
2,933
410
11,032
3,563
1,755
5,318
5,714
86%
274
48%
5,440
90%
69

NOTES TO THE CONSOLIDATED FINANCIAL STATEMENTS
03_CSGB_E_Financial Report 30.4.1999 21:17 Uhr Seite 70
5 INCOME STATEMENT OF BANKING BUSINESS
NET INTEREST INCOME
RESULT FROM COMMISSION AND SERVICE FEE ACTIVITIES
Commission income from lending activities
Commissions from securities and investment transactions
Commissions from other services
Commission expenses
NET COMMISSION AND SERVICE FEE INCOME
NET TRADING INCOME
OTHER ORDINARY INCOME
Income from the sale of financial investments
Income from investment activities
– of which from participations valued according to the equity method
– of which from other non-consolidated participations
Real estate income
Sundry ordinary income
Sundry ordinary expenses
OTHER ORDINARY INCOME
NET OPERATING INCOME
Personnel expenses
Other operating expenses
TOTAL OPERATING EXPENSES
GROSS OPERATING PROFIT
Depreciation and write-offs on non-current assets
– of which on real estate
– of which on other tangible and intangible fixed assets
– of which on non-consolidated participations
Valuation adjustments, provisions and losses
DEPRECIATION, VALUATION ADJUSTMENTS, LOSSES
ANNUAL PROFIT BEFORE EXTRAORDINARY ITEMS AND TAXES
Extraordinary income
Extraordinary expenses
Taxes
ANNUAL PROFIT
Minority interests
NET PROFIT (AFTER MINORITY INTERESTS)
Changein %
13
1
26
7
–13
26
– 55
–
65
177
– 59
– 38
14
135
269
2
9
17
11
–13
–1
– 32
6
–
21
17
– 46
– 24
– 81
–76
–
– 68
–
Changesin CHF m
573
5
1,641
23
– 66
1,735
–2,904
1,112
37
53
–16
–17
40
162
1,010
414
694
477
1,171
–757
– 6
– 38
27
5
551
545
–1,302
– 312
–2,516
– 638
1,540
–78
1,618
1997in CHF m
4,579
387
6,389
307
491
6,592
5,282
112
57
30
27
45
282
120
376
16,829
8,011
2,820
10,831
5,998
573
120
453
0
2,624
3,197
2,801
1,323
3,089
842
193
114
79
1998in CHF m
5,152
392
8,030
330
425
8,327
2,378
1,224
94
83
11
28
322
282
1,386
17,243
8,705
3,297
12,002
5,241
567
82
480
5
3,175
3,742
1,499
1,011
573
204
1,733
36
1,697
Notes
6
7
8
70

03_CSGB_E_Financial Report 30.4.1999 21:17 Uhr Seite 71
6 ANALYSIS OF THE RESULT FROM INTEREST BUSINESS
Interest and discount income
Interest income on claims due from customers
Interest income on claims due from banks
Interest income from money market claims
Credit commissions treated as interest earnings
Interest income from leasing operations
Total interest and discount income
Interest and dividend income from trading portfolios
Interest income
Dividend income
Total interest and dividend income from trading portfolios
Interest and dividend income from financial investments
Interest income
Dividend income
Total interest and dividend income from financial investments
Interest expense
Interest expenses for liabilities due to customers
Interest expenses for liabilities due to banks
Total interest expense
– of which interest expenses for subordinated liabilities
TOTAL INTEREST INCOME
7 ANALYSIS OF TRADING INCOME
Income from securities and commodities trading
Income from foreign exchange and banknote trading
Income from precious metals trading
Income from trading in interest rate instruments
TOTAL TRADING INCOME
8 ANALYSIS OF VALUATION ADJUSTMENTS,PROVISIONS AND LOSSES
For default risks (credit and country risks)
For other business risks
Losses
– of which losses from lending activities
VALUATION ADJUSTMENTS, PROVISIONS AND LOSSES
Changein %
18
–18
26
15
– 3
3
– 8
147
– 3
–7
28
– 3
20
– 31
–1
–14
13
Changein %
– 58
– 86
– 22
–19
– 55
Changein %
18
64
–24
–19
21
Changein CHF m
1,731
–1,464
204
50
–2
519
– 451
279
–172
–28
17
–11
2,414
–2,651
–237
–107
573
Changein CHF m
–1,796
– 874
– 47
–187
–2,904
Changein CHF m
393
190
– 32
–12
551
1997in CHF m
9,634
7,943
775
330
79
18,761
5,544
190
5,734
376
60
436
11,900
8,452
20,352
757
4,579
1997in CHF m
3,085
1,014
210
973
5,282
1997in CHF m
2,193
298
133
64
2,624
1998in CHF m
11,365
6,479
979
380
77
19,280
5,093
469
5,562
348
77
425
14,314
5,801
20,115
650
5,152
1998in CHF m
1,289
140
163
786
2,378
1998in CHF m
2,586
488
101
52
3,175
71

NOTES TO THE CONSOLIDATED FINANCIAL STATEMENTS
03_CSGB_E_Financial Report 30.4.1999 21:17 Uhr Seite 72
9 INCOME STATEMENT OF INSURANCE BUSINESS
NON-LIFE BUSINESS
Premiums written
Change in provisions for unearned premiumsand in actuarial provisions (health)
PREMIUMS EARNED
Claims and annuities paid
Change in provision for claims and annuities outstanding
CLAIMS INCURRED
Dividends paid
Change in provision for dividend
DIVIDENDS TO POLICYHOLDERS INCURRED
OPERATING EXPENSES
UNDERWRITING RESULT NON-LIFE
Net investment income
Interest on deposits and bank accounts (incl. exchange rate differences)
Other interest paid
Other income and expenses
PROFIT BEFORE TAX AND MINORITY INTERESTS
LIFE BUSINESS
Premiums written
Change in provisions for unearned premiums
PREMIUMS EARNED
Claims paid
Change in provisions for claims outstanding
CLAIMS INCURRED
CHANGE IN ACTUARIAL PROVISIONS
Bonus allocation
Change in participation fund
ALLOCATION TO PARTICIPATION
OPERATING EXPENSES
Net investment income
Interest on deposits and bank accounts
Interest on bonuses credited to policyholders
Other interest paid
Other income and expenses (incl. exchange rate differences)
PROFIT BEFORE TAX AND MINORITY INTERESTS
Changein %
–10
14
–11
– 9
–37
–12
21
0
14
– 8
0
7
9
38
– 5
18
22
–100
23
16
–
13
27
9
81
18
8
15
75
– 6
60
377
17
Changein CHF m
–1,437
– 57
–1,494
783
451
1,234
– 40
0
– 40
306
6
138
12
–27
10
139
2,602
111
2,713
– 949
141
– 808
–1,958
–121
–169
– 290
– 98
752
89
7
–113
– 230
64
1997in CHF m
13,694
– 397
13,297
– 8,940
–1,214
–10,154
–189
–106
–295
– 4,077
–1,229
2,123
128
–71
–190
761
12,072
–111
11,961
– 6,038
–113
– 6,151
– 7,305
–1,420
–208
–1,628
–1,261
5,006
118
–124
–189
– 61
366
1998in CHF m
12,257
– 454
11,803
– 8,157
–763
– 8,920
–229
–106
– 335
– 3,771
–1,223
2,261
140
– 98
–180
900
14,674
0
14,674
– 6,987
28
– 6,959
– 9,263
–1,541
– 377
–1,918
–1,359
5,758
207
–117
– 302
– 291
430
Notes
10
11
10
11
72
03_CSGB_E_Financial Report 30.4.1999 21:17 Uhr Seite 73
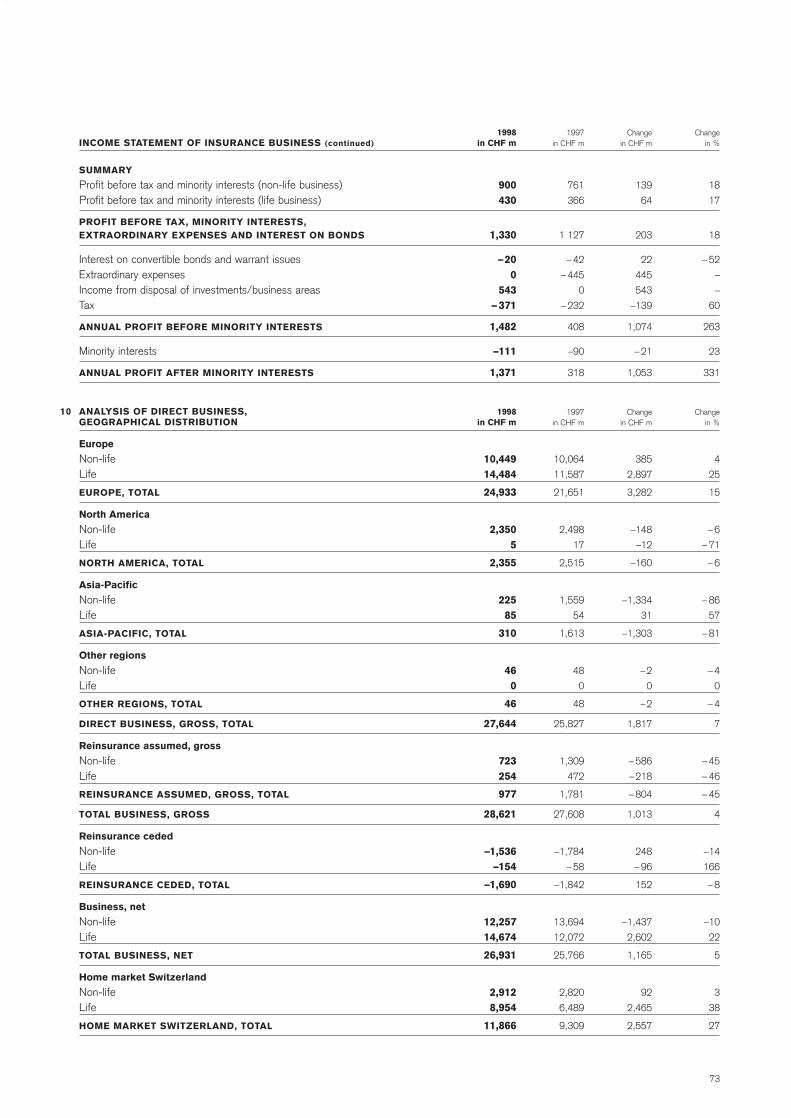
INCOME STATEMENT OF INSURANCE BUSINESS (continued)
SUMMARY
Profit before tax and minority interests (non-life business)Profit before tax and minority interests (life business)
PROFIT BEFORE TAX, MINORITY INTERESTS, EXTRAORDINARY EXPENSES AND INTEREST ON BONDS
Interest on convertible bonds and warrant issuesExtraordinary expensesIncome from disposal of investments/business areasTax
ANNUAL PROFIT BEFORE MINORITY INTERESTS
Minority interests
ANNUAL PROFIT AFTER MINORITY INTERESTS
10 ANALYSIS OF DIRECT BUSINESS,GEOGRAPHICAL DISTRIBUTION
Europe
Non-life Life
EUROPE, TOTAL
North America
Non-lifeLife
NORTH AMERICA, TOTAL
Asia-Pacific
Non-lifeLife
ASIA-PACIFIC, TOTAL
Other regions
Non-life Life
OTHER REGIONS, TOTAL
DIRECT BUSINESS, GROSS, TOTAL
Reinsurance assumed, gross
Non-life Life
REINSURANCE ASSUMED, GROSS, TOTAL
TOTAL BUSINESS, GROSS
Reinsurance ceded
Non-lifeLife
REINSURANCE CEDED, TOTAL
Business, net
Non-life Life
TOTAL BUSINESS, NET
Home market Switzerland
Non-life Life
HOME MARKET SWITZERLAND, TOTAL
Changein %
18
17
18
– 52
–
–
60
263
23
331
Changein %
4
25
15
– 6
– 71
– 6
– 86
57
– 81
– 4
0
– 4
7
– 45
– 46
– 45
4
–14
166
– 8
–10
22
5
3
38
27
Changein CHF m
139
64
203
22
445
543
–139
1,074
– 21
1,053
Changein CHF m
385
2,897
3,282
–148
–12
–160
–1,334
31
–1,303
–2
0
–2
1,817
– 586
–218
– 804
1,013
248
– 96
152
–1,437
2,602
1,165
92
2,465
2,557
1997in CHF m
761
366
1 127
– 42
– 445
0
– 232
408
–90
318
1997in CHF m
10,064
11,587
21,651
2,498
17
2,515
1,559
54
1,613
48
0
48
25,827
1,309
472
1,781
27,608
–1,784
– 58
–1,842
13,694
12,072
25,766
2,820
6,489
9,309
1998in CHF m
900430
1,330
–200
543– 371
1,482
–111
1,371
1998in CHF m
10,44914,484
24,933
2,3505
2,355
22585
310
460
46
27,644
723254
977
28,621
–1,536–154
–1,690
12,25714,674
26,931
2,9128,954
11,866
73
NOTES TO THE CONSOLIDATED FINANCIAL STATEMENTS
03_CSGB_E_Financial Report 30.4.1999 21:17 Uhr Seite 74
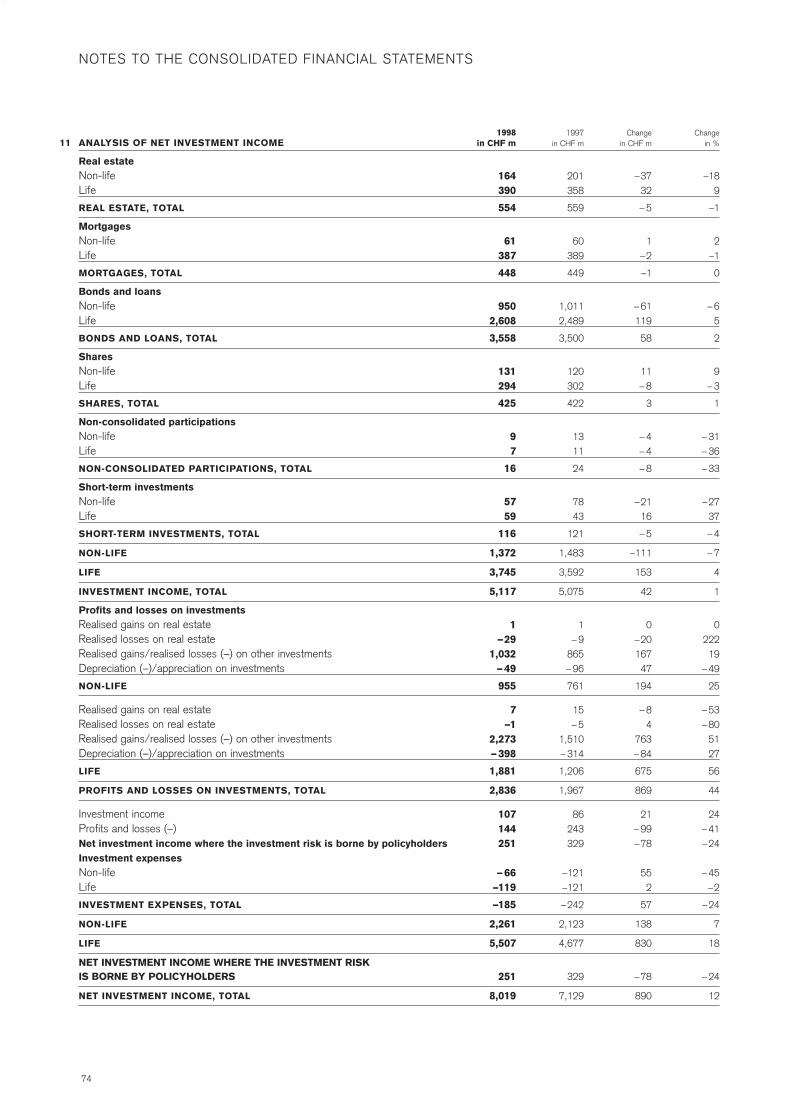
11 ANALYSIS OF NET INVESTMENT INCOME
Real estate Non-lifeLife
REAL ESTATE, TOTAL
MortgagesNon-life Life
MORTGAGES, TOTAL
Bonds and loansNon-life Life
BONDS AND LOANS, TOTAL
SharesNon-life Life
SHARES, TOTAL
Non-consolidated participationsNon-life Life
NON-CONSOLIDATED PARTICIPATIONS, TOTAL
Short-term investmentsNon-life Life
SHORT-TERM INVESTMENTS, TOTAL
NON-LIFE
LIFE
INVESTMENT INCOME, TOTAL
Profits and losses on investmentsRealised gains on real estateRealised losses on real estateRealised gains/realised losses (–) on other investmentsDepreciation (–)/appreciation on investments
NON-LIFE
Realised gains on real estate Realised losses on real estate Realised gains/realised losses (–) on other investmentsDepreciation (–)/appreciation on investments
LIFE
PROFITS AND LOSSES ON INVESTMENTS, TOTAL
Investment incomeProfits and losses (–)Net investment income where the investment risk is borne by policyholdersInvestment expensesNon-life Life
INVESTMENT EXPENSES, TOTAL
NON-LIFE
LIFE
NET INVESTMENT INCOME WHERE THE INVESTMENT RISKIS BORNE BY POLICYHOLDERS
NET INVESTMENT INCOME, TOTAL
Changein %
–189
–1
2–1
0
– 65
2
9– 3
1
– 31– 36
– 33
–2737
– 4
– 7
4
1
022219
– 49
25
– 53– 80
5127
56
44
24– 41–24
– 45–2
–24
7
18
– 24
12
Changein CHF m
–3732
– 5
1–2
–1
– 61119
58
11– 8
3
– 4– 4
– 8
–2116
– 5
–111
153
42
0–2016747
194
– 84
763– 84
675
869
21– 99–78
552
57
138
830
–78
890
1997in CHF m
201358
559
60389
449
1,0112,489
3,500
120302
422
1311
24
7843
121
1,483
3,592
5,075
1– 9
865– 96
761
15– 5
1,510– 314
1,206
1,967
86243329
–121–121
–242
2,123
4,677
329
7,129
1998in CHF m
164390
554
61387
448
9502,608
3,558
131294
425
97
16
5759
116
1,372
3,745
5,117
1–29
1,032– 49
955
7–1
2,273– 398
1,881
2,836
107144251
– 66–119
–185
2,261
5,507
251
8,019
74

03_CSGB_E_Financial Report 30.4.1999 21:17 Uhr Seite 75
12 MONEY MARKET CLAIMS
Bills of exchange and money market paper rediscountable or pledgeable at central banks
– of which treasury bills
Other bills of exchange and money market paper
TOTAL MONEY MARKET CLAIMS
13 DUE FROM CUSTOMERS FROM FINANCIAL LEASES
Car leasing
Real estate leasing
Leasing of capital goods
TOTAL DUE FROM CUSTOMERS FROM FINANCIAL LEASES
14 ANALYSIS OF LOAN COLLATERAL AT 31 DECEMBER 1998
Due from customers
Mortgages
Residential properties
Business and office properties
Commercial and industrial properties
Other properties
TOTAL LOAN COLLATERAL
At 31 December 1997
15 SECURITIES AND PRECIOUS METALS TRADING PORTFOLIOS
Interest bearing securities and rights
listed on stock exchange
unlisted
– of which own bonds and medium-term notes
Equities
– of which own shares
Precious metals
TOTAL SECURITIES AND PRECIOUS METALS TRADING PORTFOLIOS
– of which securities rediscountable or pledgeable at central banks
Substantial claims and liabilities included in other balance sheet positions.These are valued at fair value and any profit/loss on them is shown under trading income.
Lent trading positions (Due from banks and customers)
Borrowed trading positions (Due to banks and customers)
Positive replacement values of derivative instruments from trading activities (Other assets)
Negative replacement values of derivative instruments from trading activities (Other liabilities)
Changein %
129
340
– 55
11
Changein %
3
3
16
10
Totalin CHF m
103,183
80,558
183,741
223,395
Changein %
– 5
0
–12
–72
8
20
12
–1
– 4
31
20
– 8
–2
Changein CHF m
11,084
12,552
–8,503
2,581
Changein CHF m
9
8
126
143
Without collateral
in CHF m
43,406
43,406
44,171
Changein CHF m
–3,767
129
–3,896
– 852
2,262
393
194
–1,311
–1,322
10,715
6,367
– 4,338
–903
31 Dec. 1997in CHF m
8,585
3,691
15,428
24,013
31 Dec. 1997in CHF m
353
284
777
1,414
Othercollateral
in CHF m
53,581
53,581
92,370
31 Dec. 1997in CHF m
72,597
41,009
31,588
1,185
29,624
1,951
1,605
103,826
29,508
34,244
31,120
51,384
51,316
31 Dec. 1998in CHF m
19,669
16,243
6,925
26,594
31 Dec. 1998in CHF m
362
292
903
1,557
Mortgagecollateral
in CHF m
6,196
80,558
52,912
11,339
9,337
6,970
86,754
86,854
31 Dec. 1998in CHF m
68,830
41,138
27,692
333
31,886
2,344
1,799
102,515
28,186
44,959
37,487
47,046
50,413
75
NOTES TO THE CONSOLIDATED FINANCIAL STATEMENTS
03_CSGB_E_Financial Report 30.4.1999 21:17 Uhr Seite 76
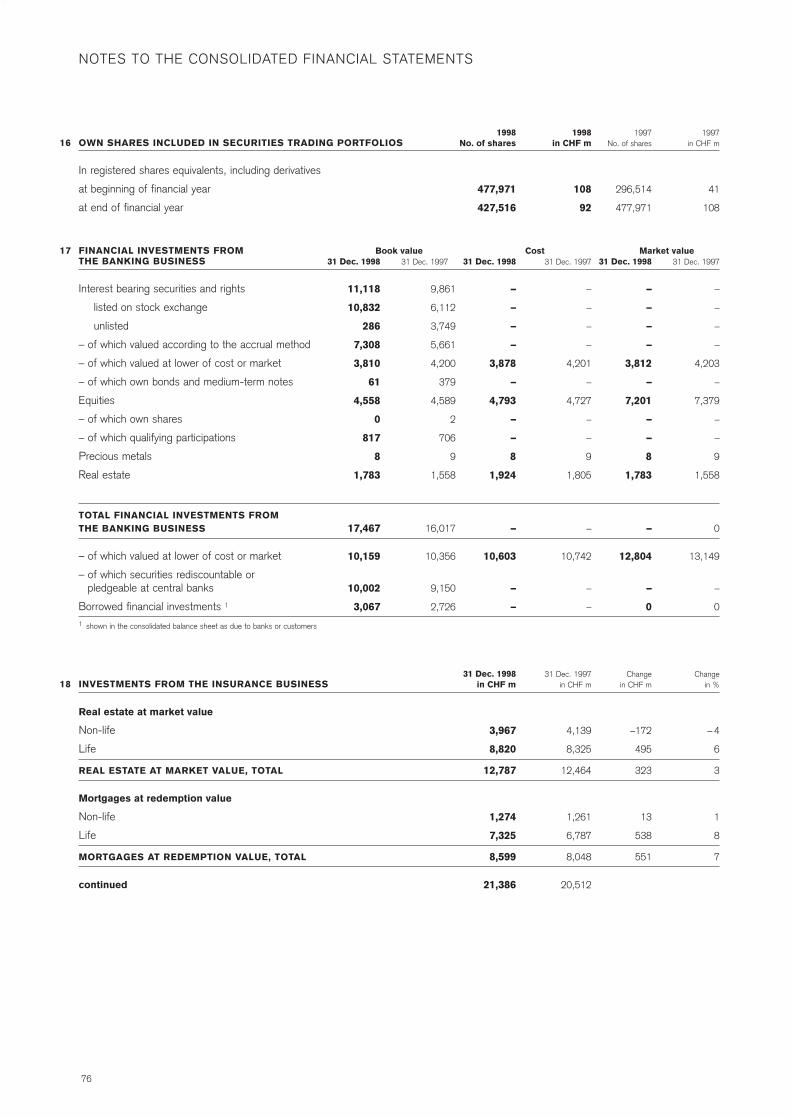
16 OWN SHARES INCLUDED IN SECURITIES TRADING PORTFOLIOS
In registered shares equivalents, including derivatives
at beginning of financial year
at end of financial year
17 FINANCIAL INVESTMENTS FROM Book value Cost Market valueTHE BANKING BUSINESS
Interest bearing securities and rights
listed on stock exchange
unlisted
– of which valued according to the accrual method
– of which valued at lower of cost or market
– of which own bonds and medium-term notes
Equities
– of which own shares
– of which qualifying participations
Precious metals
Real estate
TOTAL FINANCIAL INVESTMENTS FROM THE BANKING BUSINESS
– of which valued at lower of cost or market
– of which securities rediscountable or pledgeable at central banks
Borrowed financial investments 1
1 shown in the consolidated balance sheet as due to banks or customers
18 INVESTMENTS FROM THE INSURANCE BUSINESS
Real estate at market value
Non-life
Life
REAL ESTATE AT MARKET VALUE, TOTAL
Mortgages at redemption value
Non-life
Life
MORTGAGES AT REDEMPTION VALUE, TOTAL
continued
1997in CHF m
41
108
31 Dec. 1997
–
–
–
–
4,203
–
7,379
–
–
9
1,558
0
13,149
–
0
Changein %
– 4
6
3
1
8
7
1997No. of shares
296,514
477,971
31 Dec. 1998
–
–
–
–
3,812
–
7,201
–
–
8
1,783
–
12,804
–
0
Changein CHF m
–172
495
323
13
538
551
1998in CHF m
108
92
31 Dec. 1997
–
–
–
–
4,201
–
4,727
–
–
9
1,805
–
10,742
–
–
31 Dec. 1997in CHF m
4,139
8,325
12,464
1,261
6,787
8,048
20,512
1998No. of shares
477,971
427,516
31 Dec. 1998
–
–
–
–
3,878
–
4,793
–
–
8
1,924
–
10,603
–
–
31 Dec. 1998in CHF m
3,967
8,820
12,787
1,274
7,325
8,599
21,386
31 Dec. 1997
9,861
6,112
3,749
5,661
4,200
379
4,589
2
706
9
1,558
16,017
10,356
9,150
2,726
31 Dec. 1998
11,118
10,832
286
7,308
3,810
61
4,558
0
817
8
1,783
17,467
10,159
10,002
3,067
76

03_CSGB_E_Financial Report 30.4.1999 21:17 Uhr Seite 77
18 INVESTMENTS FROM THE INSURANCE BUSINESS
continued
Bonds and loans at amortised cost
Non-life
Life
BONDS AND LOANS AT AMORTISED COST, TOTAL
Shares at market value
Non-life
Life
SHARES AT MARKET VALUE, TOTAL
Non-consolidated participations at cost
Non-life
Life
NON-CONSOLIDATED PARTICIPATIONS AT COST, TOTAL
Short-term investments at par value
Non-life
Life
SHORT-TERM INVESTMENTS AT PAR VALUE, TOTAL
Investments where the investment risk is borne by policyholders
Real estate at market
Bonds and loans at amortised cost
Shares at market value
Short-term investments at par value
INVESTMENTS WHERE THE INVESTMENT RISK IS BORNE BY POLICYHOLDERS, TOTAL
Less mortgages and non-consolidated participations not included in investments from the insurance business
TOTAL INVESTMENTS FROM THE INSURANCE BUSINESS
ADDITIONAL DATA ON INVESTMENTS
Real estate at cost value
Non-life
Life
REAL ESTATE AT COST VALUE, TOTAL
Shares at cost value
Non-life
Life
SHARES AT COST VALUE, TOTAL
Bonds and loans at market value
Non-life
Life
BONDS AND LOANS AT MARKET VALUE, TOTAL
Changein %
–2
11
8
– 5
12
7
–11
–17
–14
–2
186
48
6
50
98
10
67
5
10
– 5
7
3
–10
–2
– 4
0
12
8
Changein CHF m
–289
4,545
4,256
–265
1,811
1,546
– 45
– 49
– 94
–37
1,005
968
5
225
1,543
63
1,836
457
8,929
–184
551
367
451
– 302
– 753
– 66
4,896
4,830
31 Dec. 1997in CHF m
20,512
15,197
39,594
54,791
5,640
15,712
21,352
402
282
684
1,483
541
2,024
81
453
1,575
647
2,756
8,732
93,387
3,508
7,502
11,010
4,318
12,819
17,137
15,850
41,944
57,794
31 Dec. 1998in CHF m
21,386
14,908
44,139
59,047
5,375
17,523
22,898
357
233
590
1,446
1,546
2,992
86
678
3,118
710
4,592
9,189
102,316
3,324
8,053
11,377
3,867
12,517
16,384
15,784
46,840
62,624
77

NOTES TO THE CONSOLIDATED FINANCIAL STATEMENTS
03_CSGB_E_Financial Report 30.4.1999 21:17 Uhr Seite 78
19 OWN SHARES INCLUDED IN FINANCIAL INVESTMENTSFROM THE BANKING AND INSURANCE BUSINESS
Registered shares, at beginning of financial year
Additions (purchase price)
Disposals (selling price)
Registered shares, at end of financial year
20 NON-CONSOLIDATED PARTICIPATIONS
Participations valued according to the equity method
Other non-consolidated participations
TOTAL NON-CONSOLIDATED PARTICIPATIONS
With market value
Without market value
21 ANALYSIS OF CAPITAL ASSETS IN CHF M
Participations valued according to the equity method
Other non-consolidatedparticipations
Non-consolidated participations
Own used premises
Other real estate
Real estate
Other tangible fixed assets
Intangible assets
TOTAL
1 write-offs to the amount of CHF 24 million in extraordinary expenses
22 ADDITIONAL INFORMATION ON FIXED ASSETS
Fire insurance value of real estate
Fire insurance value of other tangible fixed assets
Future leasing instalments from operating leases
23 OTHER ASSETS
Positive replacement value of derivative instruments
– Contracts on behalf of Credit Suisse Group
– of which trading
– of which other
Compensation account
Other
TOTAL OTHER ASSETS
1997in CHF m
321
35
501
18
Changein %
48
–11
12
2
14
Changein %
4
3
– 53
Changein %
–10
–8
– 63
–100
24
– 8
1997No. of shares
2,442,401
239,776
2,492,969
189,208
Changein CHF m
221
– 82
139
6
133
Changein CHF m
555
69
–104
Changein CHF m
– 5,300
– 4,338
– 962
– 24
797
– 4,527
1998 in CHF m
18
4
16
5
31 Dec. 1997in CHF m
458
734
1,192
244
948
31 Dec. 1997in CHF m
15,347
2,358
197
31 Dec. 1997in CHF m
52,913
51,384
1,529
24
3,324
56,261
1998 No. of shares
189,208
14,827
182,710
21,325
31 Dec. 1998in CHF m
679
652
1,331
250
1,081
31 Dec. 1998in CHF m
15,902
2,427
93
31 Dec. 1998in CHF m
47,613
47,046
567
0
4,121
51,734
Historicalvalue
458
734
1,192
4,430
591
5,021
3,750
240
10,203
Write-offs/accumulateddepreciation
0
0
0
– 790
– 44
– 834
–1,666
– 59
–2,559
Book value at31 Dec.
1997
458
734
1,192
3,640
547
4,187
2,084
181
7,644
Change inscope of
consolidation
0
0
0
45
0
45
– 35
–23
–13
Additions
176
130
306
112
31
143
904
690
2,043
Disposals
–38
–151
–189
–1
–60
– 61
–35
–3
–288
Write-offs/depreciation 1
–1
– 4
– 5
– 68
–14
–82
– 551
– 43
– 681
Foreign ex-change diff.
and reclassifi-cations
84
– 57
27
83
–13
70
– 307
0
– 210
Bookvalue at31 Dec.
1998
679
652
1,331
3,811
491
4,302
2,060
802
8,495
78
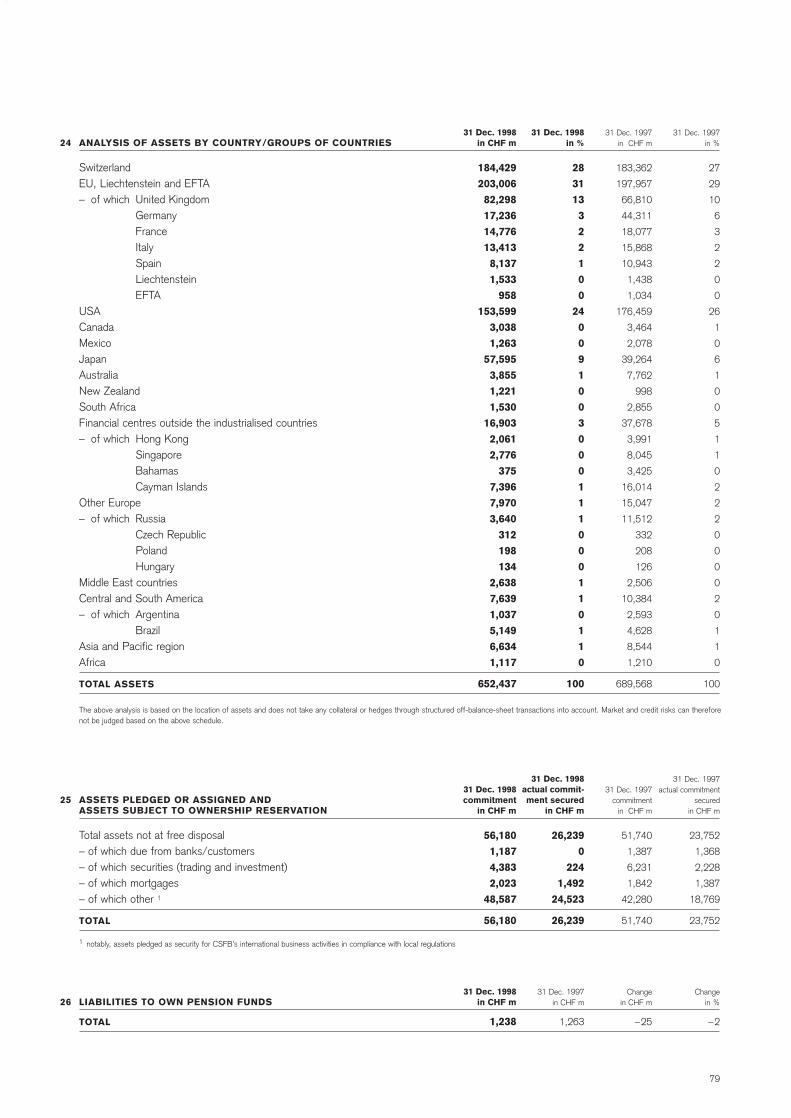
03_CSGB_E_Financial Report 30.4.1999 21:17 Uhr Seite 79
24 ANALYSIS OF ASSETS BY COUNTRY/GROUPS OF COUNTRIES
SwitzerlandEU, Liechtenstein and EFTA– of which United Kingdom
GermanyFranceItalySpainLiechtensteinEFTA
USACanadaMexicoJapanAustraliaNew ZealandSouth AfricaFinancial centres outside the industrialised countries– of which Hong Kong
SingaporeBahamasCayman Islands
Other Europe– of which Russia
Czech RepublicPolandHungary
Middle East countriesCentral and South America– of which Argentina
BrazilAsia and Pacific regionAfrica
TOTAL ASSETS
The above analysis is based on the location of assets and does not take any collateral or hedges through structured off-balance-sheet transactions into account. Market and credit risks can therefore not be judged based on the above schedule.
25 ASSETS PLEDGED OR ASSIGNED ANDASSETS SUBJECT TO OWNERSHIP RESERVATION
Total assets not at free disposal– of which due from banks/customers– of which securities (trading and investment)– of which mortgages– of which other 1
TOTAL
1 notably, assets pledged as security for CSFB’s international business activities in compliance with local regulations
26 LIABILITIES TO OWN PENSION FUNDS
TOTAL
31 Dec. 1997in %
27
29
10
6
3
2
2
0
0
26
1
0
6
1
0
0
5
1
1
0
2
2
2
0
0
0
0
2
0
1
1
0
100
31 Dec. 1997actual commitment
securedin CHF m
23,752
1,368
2,228
1,387
18,769
23,752
Changein %
–2
31 Dec. 1997in CHF m
183,362
197,957
66,810
44,311
18,077
15,868
10,943
1,438
1,034
176,459
3,464
2,078
39,264
7,762
998
2,855
37,678
3,991
8,045
3,425
16,014
15,047
11,512
332
208
126
2,506
10,384
2,593
4,628
8,544
1,210
689,568
31 Dec. 1997commitment
in CHF m
51,740
1,387
6,231
1,842
42,280
51,740
Changein CHF m
–25
31 Dec. 1998in %
28
31
13
3
2
2
1
0
0
24
0
0
9
1
0
0
3
0
0
0
1
1
1
0
0
0
1
1
0
1
1
0
100
31 Dec. 1998actual commit-ment secured
in CHF m
26,239
0
224
1,492
24,523
26,239
31 Dec. 1997in CHF m
1,263
31 Dec. 1998in CHF m
184,429
203,006
82,298
17,236
14,776
13,413
8,137
1,533
958
153,599
3,038
1,263
57,595
3,855
1,221
1,530
16,903
2,061
2,776
375
7,396
7,970
3,640
312
198
134
2,638
7,639
1,037
5,149
6,634
1,117
652,437
31 Dec. 1998commitment
in CHF m
56,180
1,187
4,383
2,023
48,587
56,180
31 Dec. 1998in CHF m
1,238
79

NOTES TO THE CONSOLIDATED FINANCIAL STATEMENTS
03_CSGB_E_Financial Report 30.4.1999 21:17 Uhr Seite 80
27 OUTSTANDING BONDS ISSUED – SUMMARY
Bonds
Bonds issued by the central issuing office
Mortgage bonds issued by the central mortgage bond institutions
TOTAL
27a BONDS ISSUED BY CREDIT SUISSE GROUP
Year Earliest date Par valueRedemption Interest rate of issue callable in m
23.02.2000 7.00% 1990 CHF 200
28.02.2000 2.25% Convertible Bond 1997 CHF 400 1
06.08.2001 2.25% 1993 CHF 500 7
15.12.2003 6.00% 1994 CHF 250 1
31.10.2006 4.00% 1997 CHF 800
23.05.2007 4.00% 1997 CHF 1,000
15.09.2008 3.50% 1998 CHF 500
27b BONDS ISSUED BY SUBSIDIARIES
Credit Suisse Group Finance (Guernsey) Ltd., Guernsey
29.07.1999 6.75% 1994 DEM 400
19.11.2002 4.88% Convertible Bond 1992 USD 24 1
All bonds issued by Credit Suisse Group Finance (Guernsey) Ltd. are guaranteed by Credit Suisse Group.
Credit Suisse First Boston, Zurich
01.01.1999 7.50% 1991 CHF 100 6
11.03.1999 7.00% 1991 CHF 5
15.05.1999 4.50% 1994 CHF 100 6
15.05.1999 6.50% 1991 CHF 5
08.09.1999 5.00% 1994 CHF 200
16.09.1999 6.75% 1991 CHF 4
31.01.2000 7.25% 1990 CHF 150 1
15.09.2000 4.50% 1995 CHF 250
15.10.2000 5.79% 1997 15.10.1999 USD 1,996 2
05.06.2001 7.25% 1990 CHF 170
31.07.2001 7.00% 1991 CHF 150 1
15.09.2001 6.00% 1989 15.09.1999 CHF 200 1
15.10.2001 5.79% 1997 USD 1,496 2
15.01.2002 7.00% 1992 CHF 100
20.02.2002 7.50% 1991 CHF 200 1,6
15.05.2002 6.75% 1992 CHF 60
01.03.2002 7.25% 1990 01.03.2000 CHF 150 6
01.01.2003 7.75% 1991 CHF 100 6
01.01.2003 7.25% 1992 CHF 100 6
01.02.2003 5.00% 1988 01.02.2000 CHF 170 6
31.03.2003 3.50% 1993 CHF 75 1
31.03.2003 3.50% 1993 CHF 125 1
Changein %
– 2
– 29
12
–1
Changein CHF m
– 748
– 47
154
– 641
31 Dec. 1997in CHF m
44,131
160
1,303
45,594
31 Dec. 1998in CHF m
43,383
113
1,457
44,953
80

03_CSGB_E_Financial Report 30.4.1999 21:17 Uhr Seite 81
BONDS ISSUED BY SUBSIDIARIES (continued) Year Earliest date Par valueRedemption Interest rate of issue callable in m
25.04.2003 2.00% 1996 USD 74 3
29.09.2003 6.25% 1993 USD 200 1,3
18.11.2003 6.13% 1993 DEM 600 1,3
20.02.2004 5.00% 1989 20.02.1999 CHF 300 1,6
22.04.2004 4.38% 1996 CHF 200
18.11.2004 8.50% 1994 USD 300 1,3
30.12.2004 6.13% 1994 DEM 100 1,3
01.02.2005 5.50% 1995 CHF 100 6
31.03.2005 5.75% 1995 CHF 225 1
17.11.2005 3.13% 1995 CHF 300 6
17.11.2005 2.00% 1997 USD 100 3
10.11.2005 2.00% 1997 USD 200 3
30.06.2006 7.21% 1996 USD 238 1,4
30.06.2006 6.84% 1997 USD 95 1,4
perpetual 7.90% 1997 01.05.2007 USD 500 1,3
perpetual 6.50% 1997 12.06.2007 FRF 750 1,3
perpetual 6.50% 1997 12.06.2007 FRF 500 1,3
06.07.2007 5.25% 1995 CHF 150 1
06.07.2007 5.25% 1995 CHF 100 1
perpetual 4.38% 1997 23.07.2007 CHF 498 1,3
19.02.2008 4.50% 1996 CHF 200 6
19.02.2008 2.00% 1998 USD 250 3
01.05.2008 6.50% 1998 USD 200 1,5
perpetual 8.25% 1997 10.07.2009 GBP 150 1,3
11.05.2010 5.75% 1998 DEM 415 1,3
10.03.2016 5.00% 1986 10.03.2006 CHF 200 1
perpetual 7.74% 1997 10.07.2007 USD 100 1
perpetual 4.51% 1998 01.12.2029 JPY 10,000 1,3
Credit Suisse, Zurich
31.10.1999 5.50% 1994 CHF 100
18.04.2000 7.25% 1990 CHF 110 1
20.02.2001 7.50% 1991 CHF 150 1
28.07.2001 5.00% 1994 CHF 200
17.09.2001 7.00% 1991 CHF 150 1
17.12.2001 2.75% 1993 CHF 125 7
16.03.2002 6.75% 1992 CHF 200
30.06.2002 7.25% 1992 CHF 100
25.09.2002 7.75% 1992 CHF 100 1
31.03.2003 5.25% 1993 CHF 250
28.04.2005 5.75% 1995 CHF 120 1
12.10.2005 5.00% 1995 CHF 150 1
05.01.2006 4.38% 1996 CHF 150 1
31.07.2009 4.00% 1997 CHF 200 1
2001–2010 2.55%–7.4% Mortgage bonds issued by the Swiss Mortgage 1989–1998 CHF 597Bond Bank, Zurich
81

NOTES TO THE CONSOLIDATED FINANCIAL STATEMENTS
03_CSGB_E_Financial Report 30.4.1999 21:17 Uhr Seite 82
BONDS ISSUED BY SUBSIDIARIES (continued) Year Earliest date Par valueRedemption Interest rate of issue callable in m
Neue Aargauer Bank, Aarau
28.06.2002 4.25% 1996 CHF 100
26.06.1999 6.13% Central issuing office of the Association of Swiss Regional Banks 1989 CHF 7 1
10.04.2000 7.13% Central issuing office of the Association of Swiss Regional Banks 1990 CHF 5 1
11.03.2001 7.25% Central issuing office of the Association of Swiss Regional Banks 1991 CHF 5 1
1999–2001 4.5%–7.6% Central issuing office of the Association of 1991–1993 CHF 96Swiss Regional Banks
1999–2007 2.8%–7.4% Mortgage bonds issued by the Swiss Mortgage 1989–1998 CHF 860Bond Bank, Zurich
Credit Suisse (Luxembourg) S.A., Luxembourg
31.12.2001 9.13% 1991 LUF 2,500 1
06.08.2003 7.25% 1993 LUF 1,500 1
Credit Suisse First Boston Finance (Guernsey) Ltd., Guernsey
01.02.2000 0.00% 1990 CAD 500
22.10.2002 0.00% 1992 DEM 500
Credit Suisse First Boston International (Guernsey) Ltd., Guernsey
18.03.1999 various 1998 USD 60
18.03.1999 various 1998 USD 65
24.03.1999 5.28% 1998 USD 100
14.04.1999 various 1998 USD 30
10.07.1999 various 1998 USD 325
14.10.1999 various 1998 USD 25
03.04.2000 5.93% 1998 USD 10
02.04.2001 4.34% 1998 DEM 10
02.04.2001 4.23% 1998 DEM 3
29.08.2003 2.67% 1998 CHF 19
Credit Suisse First Boston Finance B.V., Amsterdam (The Netherlands)
31.03.1999 6.07% 1993 USD 250
22.03.1999 5.25% 1993 CHF 150
21.09.1999 6.05% 1992 USD 56
22.09.1999 6.05% 1992 USD 85
22.02.2000 7.50% 1992 NLG 350
15.06.2000 7.75% 1993 LUF 2,000 1
01.07.2003 6.07% 1993 LUF 3,000 1
26.05.2003 5.88% 1993 USD 200 1
25.08.2003 5.50% 1993 USD 200 1
perpetual 5.69% 1986 USD 150
82
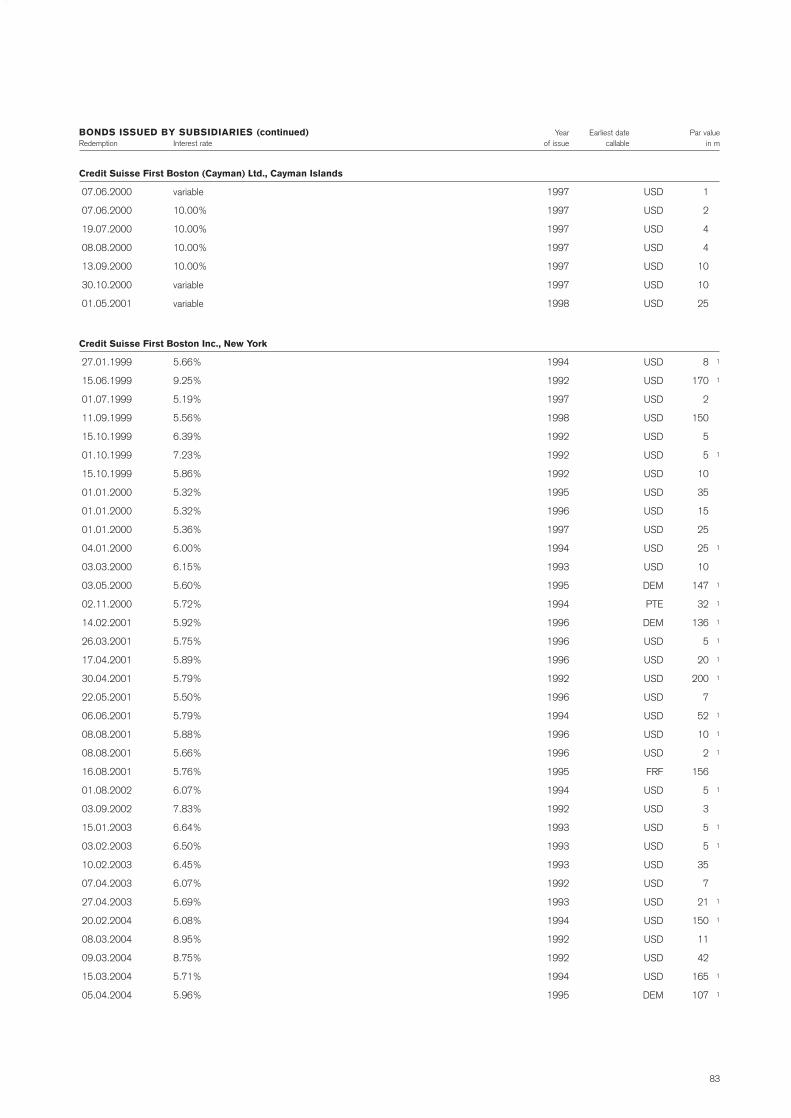
03_CSGB_E_Financial Report 30.4.1999 21:17 Uhr Seite 83
BONDS ISSUED BY SUBSIDIARIES (continued) Year Earliest date Par valueRedemption Interest rate of issue callable in m
Credit Suisse First Boston (Cayman) Ltd., Cayman Islands
07.06.2000 variable 1997 USD 1
07.06.2000 10.00% 1997 USD 2
19.07.2000 10.00% 1997 USD 4
08.08.2000 10.00% 1997 USD 4
13.09.2000 10.00% 1997 USD 10
30.10.2000 variable 1997 USD 10
01.05.2001 variable 1998 USD 25
Credit Suisse First Boston Inc., New York
27.01.1999 5.66% 1994 USD 8 1
15.06.1999 9.25% 1992 USD 170 1
01.07.1999 5.19% 1997 USD 2
11.09.1999 5.56% 1998 USD 150
15.10.1999 6.39% 1992 USD 5
01.10.1999 7.23% 1992 USD 5 1
15.10.1999 5.86% 1992 USD 10
01.01.2000 5.32% 1995 USD 35
01.01.2000 5.32% 1996 USD 15
01.01.2000 5.36% 1997 USD 25
04.01.2000 6.00% 1994 USD 25 1
03.03.2000 6.15% 1993 USD 10
03.05.2000 5.60% 1995 DEM 147 1
02.11.2000 5.72% 1994 PTE 32 1
14.02.2001 5.92% 1996 DEM 136 1
26.03.2001 5.75% 1996 USD 5 1
17.04.2001 5.89% 1996 USD 20 1
30.04.2001 5.79% 1992 USD 200 1
22.05.2001 5.50% 1996 USD 7
06.06.2001 5.79% 1994 USD 52 1
08.08.2001 5.88% 1996 USD 10 1
08.08.2001 5.66% 1996 USD 2 1
16.08.2001 5.76% 1995 FRF 156
01.08.2002 6.07% 1994 USD 5 1
03.09.2002 7.83% 1992 USD 3
15.01.2003 6.64% 1993 USD 5 1
03.02.2003 6.50% 1993 USD 5 1
10.02.2003 6.45% 1993 USD 35
07.04.2003 6.07% 1992 USD 7
27.04.2003 5.69% 1993 USD 21 1
20.02.2004 6.08% 1994 USD 150 1
08.03.2004 8.95% 1992 USD 11
09.03.2004 8.75% 1992 USD 42
15.03.2004 5.71% 1994 USD 165 1
05.04.2004 5.96% 1995 DEM 107 1
83

NOTES TO THE CONSOLIDATED FINANCIAL STATEMENTS
03_CSGB_E_Financial Report 30.4.1999 21:17 Uhr Seite 84
BONDS ISSUED BY SUBSIDIARIES (continued) Year Earliest date Par valueRedemption Interest rate of issue callable in m
30.04.2004 9.30% 1992 USD 100
27.10.2005 5.60% 1993 USD 200 1
07.11.2005 6.95% 1995 USD 5 1
15.05.2006 6.09% 1996 USD 265 1
27.02.2007 5.98% 1995 USD 15 1
27.02.2007 5.95% 1995 USD 15 1
28.02.2007 5.98% 1995 USD 15 1
28.02.2007 5.95% 1995 USD 15 1
15.02.2013 8.50% 1993 USD 3
02.04.2018 7.71% 1993 USD 5 1
various 6.50% div. USD 6 1
various variable 1993 USD 143 1
various variable 1993–95 USD 9 1
various variable 1995–96 USD 66 1
Credit Suisse Financial Products, London
1999 various 1996–1997 CHF 78
1999 various 1995–1996 DEM 71
22.11.1999 1.25% 1994 GBP 60
1999 various 1998 HKD 1,210
1999 various 1996–1997 ITL 17,000
1999 various 1996–1998 JPY 60,021
13.07.1999 1.25% 1994 NLG 25
1999 1.00% 1998 PTE 2,370
1999 various 1997–1998 SEK 325
1999 various 1992–1998 USD 431
30.04.1999 7.75% 1992 XEU 47 1
2000 various 1997–1998 DEM 41
21.12.2000 3.00% 1995 FIM 25
06.11.2000 7.50% 1997 GBP 25
14.04.2000 10.25% 1998 GRD 10,000
2000 various 1997–1998 ITL 109,000
2000 various 1995–1998 JPY 22,417
2000 0.00% Zero Coupon Notes 1994–1998 NLG 56
2000 variable Floating Rate Notes 1997–1998 PTE 6,750
2000 various 1998 SEK 197
2000 various 1992–1998 USD 453
13.06.2001 6.50% 1997 BEF 100
2001 various 1996–1998 DEM 100
2001 various 1997–1998 ITL 188,000
2001 various 1995–1998 JPY 18,817
24.09.2001 0.00% Zero Coupon Notes 1998 NLG 18
01.10.2001 variable Floating Rate Notes 1998 PTE 1,500
01.02.2001 various 1998 SEK 150
2001 various 1995–1998 USD 629
15.08.2001 variable Floating Rate Notes 1991 USD 109 1
84

03_CSGB_E_Financial Report 30.4.1999 21:17 Uhr Seite 85
BONDS ISSUED BY SUBSIDIARIES (continued) Year Earliest date Par valueRedemption Interest rate of issue callable in m
10.05.2001 variable 1994 XEU 15
31.10.2002 variable Floating Rate Notes 1997 CHF 75 1
2002 various 1996–1998 DEM 70
19.12.2002 0.00% Zero Coupon Notes 1997 ITL 20,000 1
2002 various 1996–1998 JPY 88,530
2002 various 1992 LUF 3,500 1
2002 various 1996–1998 USD 183
30.07.2002 0.00% Zero Coupon Notes 1997 XEU 10
01.08.2003 various 1998 ATS 400
13.06.2003 8.00% 1997 BEF 200
06.11.2003 0.00% Zero Coupon Notes 1995 FRF 25
2003 various 1997–1998 GBP 39
16.04.2003 0.00% 1998 GRD 14,393
2003 various 1997–1998 ITL 139,000
2003 various 1997–1998 JPY 14,400
19.03.2003 7.63% 1993 LUF 1,500 1
2003 various 1994–1998 USD 853
2003 various 1998 XEU 12
01.12.2004 0.00% Zero Coupon Notes 1994 CHF 13 1
2004 variable 1997 DEM 25
2004 various 1996–1997 ITL 430,000
2004 0.00% Zero Coupon Notes 1997–1998 ITL 105,000 1
2004 various 1995–1998 JPY 5,500
2004 0.00% Zero Coupon Notes 1997 NOK 110
2004 various 1995–1998 USD 216
16.06.2004 8.50% 1997 XEU 3
01.12.2004 0.00% 1994 XEU 10 1
08.06.2005 8.25% 1995 BEF 200 1
27.09.2005 variable Floating Rate Notes 1995 DEM 47 1
08.12.2005 0.00% Zero Coupon Notes 1997 FRF 200
2005 various 1997–1998 ITL 406,000
2005 various 1997–1998 ITL 70,000 1
2005 various 1996–1998 JPY 7,200
19.12.2005 0.00% Zero Coupon Notes 1997 NOK 160
26.04.2005 variable Floating Rate Notes 1998 PTE 500
2005 0.00% Zero Coupon Notes 1997 PTE 9,362 1
2005 various 1995–1998 USD 51,286
2006 variable 1996–1998 DEM 19 1
06.11.2006 0.00% Zero Coupon Notes 1997 FIM 50
16.02.2006 9.13% 1998 GBP 5
2006 various 1997–1998 ITL 347,980
2006 0.00% Zero Coupon Notes 1998 ITL 30,000 1
19.12.2006 5.70% 1996 JPY 500
2006 various 1995–1998 USD 118
28.07.2006 0.00% Zero Coupon Notes 1994 USD 40 1
2007 various 1996–1997 CHF 120
85

NOTES TO THE CONSOLIDATED FINANCIAL STATEMENTS
03_CSGB_E_Financial Report 30.4.1999 21:17 Uhr Seite 86
BONDS ISSUED BY SUBSIDIARIES (continued) Year Earliest date Par valueRedemption Interest rate of issue callable in m
2007 various 1997 DEM 70
23.05.2007 variable Floating Rate Notes 1997 DEM 80 1
06.11.2007 0.00% Zero Coupon Notes 1997 FIM 50
2007 various 1997 ITL 113,600
2007 various 1996–1998 JPY 45,200
2007 various 1996–1998 USD 204
02.07.2007 variable Floating Rate Notes 1997 USD 40 1
2008 various 1998 DEM 155
2008 0.00% Zero Coupon Notes 1993–1994 DEM 153 1
2008 various 1997–1998 ITL 118,000
24.02.2008 variable 1998 ITL 100,000 1
2008 various 1997–1998 JPY 3,300
2008 various 1998 PTE 2,500
2008 various 1995–1998 USD 303
2009 various 1997–1998 DEM 108
2009 0.00% Zero Coupon Notes 1994–1996 DEM 213 1
30.05.2009 variable 1997 ITL 17,000
2009 various 1996–1997 JPY 3,100
2009 various 1997–1998 USD 18
06.01.2010 0.00% Zero Coupon Notes 1997 DEM 20
20.06.2010 0.00% Zero Coupon Notes 1997 DEM 60 1
18.10.2010 0.00% 1998 ITL 27,500
01.03.2010 0.00% Zero Coupon Notes 1995 ITL 30,000 1
2010 various 1997–1998 USD 109
2011 various 1993–1998 USD 113
01.06.2012 0.00% Zero Coupon Notes 1997 DEM 35
01.04.2012 variable 1998 ITL 12,000
30.04.2012 8.00% 1998 ITL 20,000 1
2012 various 1996–1998 USD 29
02.04.2013 variable 1998 ITL 27,500
2013 various 1998 JPY 13,600
20.12.2014 0.00% Zero Coupon Notes 1994 ITL 250,000 1
30.10.2014 0.00% Zero Coupon Notes 1995 USD 29
22.09.2016 variable Floating Rate Notes 1998 USD 20
15.09.2017 0.00% Zero Coupon Notes 1997 DEM 15
15.05.2017 variable 1997 JPY 5,000
01.09.2017 0.00% Zero Coupon Notes 1997 PTE 1,700
16.02.2018 6.00% 1998 DEM 30 1
2018 variable 1997–1998 ITL 74,000
2018 various 1998 JPY 2 100
07.01.2020 variable Floating Rate Notes 1996 CAD 162
19.09.2021 variable 1996 JPY 10,000
15.12.2021 0.00% Zero Coupon Notes 1995 USD 81 1
02.10.2022 0.00% Zero Coupon Notes 1997 DEM 40
27.02.2025 0.00% Zero Coupon Notes 1998 USD 20
86

03_CSGB_E_Financial Report 30.4.1999 21:17 Uhr Seite 87
BONDS ISSUED BY SUBSIDIARIES (continued) Year Earliest date Par valueRedemption Interest rate of issue callable in m
01.12.2028 10.76% 1998 USD 133
perpetual various 1995–1998 CHF 130 1
perpetual various 1998 DEM 610 1
perpetual 10.25% 1995 GBP 100 1
perpetual variable 1998 ITL 50,000 1
perpetual variable 1993–1995 JPY 20,000 1
perpetual various 1995–1997 NLG 60 1
perpetual 0.00% 1998 PTE 1,250 1
perpetual variable 1992–1997 USD 220 1
Bank Leu Ltd., Zurich
17.11.2006 5.00% 1986 CHF 100 1
Winterthur Finance Ltd., British Virgin Islands
29.04.1999 2.25% Issue of bonds with warrants 1994 CHF 300
DBV-Winterthur, Wiesbaden
28.07.2003 0.88% Convertible Bond 1998 DEM 100
28.07.2003 0.75% Convertible Bond 1998 DEM 100
1 subordinated bonds2 issued by Credit Suisse First Boston Guernsey branch3 issued by Credit Suisse First Boston London branch4 issued by Credit Suisse First Boston Nassau branch5 issued by Credit Suisse First Boston New York branch6 This bond has been partially or fully transferred to Credit Suisse as a subparticipation.7 issue of bonds with warrants: ex warrant
87

NOTES TO THE CONSOLIDATED FINANCIAL STATEMENTS
03_CSGB_E_Financial Report 30.4.1999 21:17 Uhr Seite 88
28 OTHER LIABILITIES
Negative replacement value of derivative instruments
– Contracts on behalf of Credit Suisse Group
– of which trading
– of which other
Compensation account
Other
TOTAL OTHER LIABILITIES
Changein %
– 4
–2
– 80
–
12
– 2
Changein CHF m
–2,002
– 903
–1,099
189
649
–1,164
31 Dec. 1997in CHF m
52,684
51,316
1,368
0
5,484
58,168
31 Dec. 1998in CHF m
50,682
50,413
269
189
6,133
57,004
29 VALUATION ADJUSTMENTS ANDPROVISIONS/RESERVES FORGENERAL BANKING RISKS IN CHF M
Valuation adjustments and provisions for default risks (credit and country risk)
Valuation adjustments and provisions for other business risks
Provisions for taxes and deferred taxes
Provisions for restructuring
Other provisions
Total
Less valuation adjustments directlynetted with assets
TOTAL VALUATION ADJUSTMENTS ANDPROVISIONS AS PER BALANCE SHEET
RESERVES FOR GENERALBANKING RISKS
1 CHF –55 m for deferred income tax due to BZW retention award; CHF 128 m relates to a reclassification of reserves for the liquidation of Corne-à-Vin from bank premises; CHF 107 mrelates to various reclassifications from other liabilities. CHF –50 m relates to a classification from default risks to financial investments; CHF 152 m relates to a reclassificationof trading securities to default risks; CHF –90 m reclassification from reorganisation of Bank Leu
2 CHF 3 m booked as extraordinary income3 CHF 617 m deviation to tax expense due to increase of tax assets that are not included in the provisions, CHF 2 m booked as extraordinary income
Balance at31 Dec.
1997
12,503
922
3,231
1,421
766
18,843
–11,714
7,129
2,890
Specificusage and
releases
–1,623
–233
–1,850
– 972
– 489
– 5,167
0
Change indefinition of
purpose(reclassifi-
cation)
–1
269
– 48
0
– 4
216 1
90
Recoveries,doubtfulinterest,currency
differences
410
–21
182
– 9
19
581
0
Changein the
scope ofcon-
solidation
– 38
– 23
–15
–1
44
– 33
– 2
New creation
charged toincome
statement
2,583 2
0
1,190 3
44
451
4,268
3
Newcreationchargedto equity
–
–
306
–
–
306
–
Releasescredited to
incomestatement
0
– 36
0
0
0
– 36
– 933
Balanceat
31 Dec.1998
13,834
878
2,996
483
787
18,978
–13,308
5,670
2,048
88

03_CSGB_E_Financial Report 30.4.1999 21:17 Uhr Seite 89
30 TECHNICAL PROVISIONS FORTHE INSURANCE BUSINESS IN CHF M
NON-LIFE
Provision for unearned premiums
Actuarial provisions (health)
Provisions for claims outstanding
Actuarial provision for annuities
Provision for dividends to policyholders
Equalisation reserve prescribed by law
NON-LIFE, TOTAL
LIFE
Provisions for unearned premiums
Actuarial provisions
Provisions for claims outstanding
Participation fund
Bonuses left on deposit
LIFE, TOTAL
Technical provisions in life business where the investment risk is borne by policyholders
TECHNICAL PROVISIONS FOR THEINSURANCE BUSINESS, TOTAL
Changenet
– 626
369
–2,365
89
126
– 335
–2,742
50
5,685
– 5
376
252
6,358
1,808
5,424
Changegross
– 356
420
–1,293
82
126
– 335
–1,356
58
5,994
–17
365
252
6,652
1,808
7,104
31 Dec. 1997net
4,162
2,003
16,406
599
700
335
24,205
735
57,738
393
2,142
3,169
64,177
2,846
91,228
31 Dec. 1997gross
4,835
2,012
18,791
614
700
335
27,287
746
58,423
430
2,155
3,169
64,923
2,846
95,056
31 Dec. 1998net
3,536
2,372
14,041
688
826
0
21,463
785
63,423
388
2,518
3,421
70,535
4,654
96,652
31 Dec. 1998gross
4,517
2,432
17,498
696
826
0
25,969
804
64,417
413
2,520
3,421
71,575
4,654
102,198
89

NOTES TO THE CONSOLIDATED FINANCIAL STATEMENTS
03_CSGB_E_Financial Report 30.4.1999 21:17 Uhr Seite 90
31 STATEMENT OF SHAREHOLDERS’ EQUITY
SHAREHOLDERS’ EQUITY AT BEGINNING OF FINANCIAL YEAR
Share capital
Capital reserve
Retained earnings
Revaluation reserves from the insurance business
Reserves for general banking risks
Group profit/Group loss
TOTAL SHAREHOLDERS’ EQUITY AT BEGINNING OF FINANCIAL YEAR
Reclassification from valuation adjustments and provisions
Release/creation of reserves for general banking risks, net
Dividends paid
Capital increases, par value and capital surplus
Capital increases, minority interests
Acquisition of minority interests
Pooling adjustment
Foreign exchange differences
Change in revaluation reserves from the insurance business
Valuation adjustments relating to subsidiaries
Capital surplus increase in Winterthur prior to business combination
Group profit
TOTAL SHAREHOLDERS’ EQUITY AT END OF FINANCIAL YEAR
of which: Share capital
Capital reserve
Minority interests in capital reserve
Retained earnings
Minority interests in retained earnings
Revaluation reserves from the insurance business
Minority interests in insurance revaluation reserves
Reserves for own shares
Reserves for general banking risks
Group profit
– of which minority interests
32 LOANS TO THE BANK’S GOVERNING BODIES
Loans to the bank’s governing bodies
Loans to the bank’s governing bodies comprise advances to members of the Board of Directors, the Executive Board as well as the Statutory Auditors and companies controlled by these individuals orlegal entities.
Changein %
37
– 9
– 66
78
21
–
12
53
–
31
– 34
– 98
–100
–100
–
– 63
–100
–100
435
10
1
17
108
–
0
11
59
0
–29
435
–28
Changein %
– 47
Changein CHF m
1,436
– 985
– 3,133
2,539
502
2,431
2,790
31
–1,373
– 343
–517
– 85
237
1,298
– 304
–1,596
151
– 392
2,614
2,511
60
1,627
112
–1,930
–2
605
267
0
– 842
2,614
–57
Changein CHF m
– 40
1997in CHF m
3,886
10,455
4,713
3,249
2,388
–1,830
22,861
59
443
–1,114
1,508
87
–238
–1,298
– 38
2,539
–151
392
601
25,651
5,322
9,366
104
–266
1,246
5,337
451
600
2,890
601
204
31 Dec. 1997in CHF m
86
1998in CHF m
5,322
9,470
1,580
5,788
2,890
601
25,651
90
– 930
–1,457
991
2
–1
0
– 342
943
0
0
3,215
28,162
5,382
10,993
216
–2,196
1,244
5,942
718
600
2,048
3,215
147
31 Dec. 1998in CHF m
46
90

03_CSGB_E_Financial Report 30.4.1999 21:17 Uhr Seite 91
33 MATURITY STRUCTURE OFCURRENT ASSETS, FINANCIAL INVESTMENTS AND BORROWED FUNDSAT 31 DECEMBER 1998 IN CHF M
CURRENT ASSETS
Cash and other liquid assets
Money market claims
Due from banks
Claims from the insurance business
Due from customers
Mortgages
Securities and precious metalstrading portfolios
TOTAL CURRENT ASSETS
At 31 December 1997
TOTAL FINANCIAL INVESTMENTS 1
At 31 December 1997
BORROWED FUNDS
Liabilities in respect of money market paper
Due to banks
Commitments from insurance business
Due to customers in savings andinvestment accounts
Due to customers, other
Medium-term notes
Bonds and mortgage-backed bonds
TOTAL BORROWED FUNDS
At 31 December 1997
1 excluding investments from the insurance business
34 SECURITIES BORROWING AND LENDINGAND REPURCHASE AGREEMENTS
Due from banks
Due from customers
SECURITIES LENDING
Due from banks
Due from customers
REVERSE REPURCHASE AGREEMENTS
Due to banks
Due to customers
SECURITIES BORROWING
Due to banks
Due to customers
REPURCHASE AGREEMENTS
Total
2,313
26,594
140,152
7,482
103,183
80,558
102,515
462,797
506,840
17,467
16,017
14,735
154,048
8,412
46,618
178,561
5,844
44,953
453,171
495,715
Real estate
0
0
1,783
1,558
Dueafter
5 years
–
0
129
0
4,932
2,781
–
7,842
6,597
1,932
688
162
708
0
53
2,400
220
17,536
21,079
19,240
Due within12 monthsto 5 years
–
1
1,354
0
10,040
31,726
–
43,121
39,546
3,361
3,222
6,425
792
0
19
3,334
3,232
22,088
35,890
35,584
Duewithin 3 to12 months
–
4,066
3,071
0
12,201
18,430
–
37,768
52,412
2,012
1,497
1,940
3,727
0
3
15,810
1,392
3,552
26,424
36,523
Duewithin 3months
–
22,519
125,477
0
56,638
5,930
–
210,564
248,273
3,813
3,224
5,949
94,630
0
132
117,363
1,000
1,777
220,851
265,512
Redeemableby notice
–
5
3,064
7,482
19,372
21,691
–
51,614
42,688
14
1,230
259
1,046
8,412
46,411
1,908
–
–
58,036
60,165
At sight
2,313
3
7,057
0
0
–
102,515
111,888
117,324
4,552
4,598
0
53,145
0
0
37,746
–
–
90,891
78,691
31 Dec. 1998in CHF m
34,349
11,823
46,172
43,940
18,262
62,202
29,751
15,592
45,343
38,819
21,080
59,899
31 Dec. 1997in CHF m
29,556
5,618
35,174
74,663
56,861
131,524
10,100
21,832
31,932
71,076
46,365
117,441
Changein CHF m
4,793
6,205
10,998
– 30,723
– 38,599
– 69,322
19,651
– 6,240
13,411
– 32,257
– 25,285
– 57,542
Changein %
16
110
31
– 41
– 68
– 53
195
– 29
42
– 45
– 55
– 49
91

NOTES TO THE CONSOLIDATED FINANCIAL STATEMENTS
03_CSGB_E_Financial Report 30.4.1999 21:17 Uhr Seite 92
35 BALANCE SHEET BY ORIGIN IN CHF M
ASSETS
Cash and other liquid assets
Money market claims
Due from banks
Claims from the insurance business
Due from customers
Mortgages
Securities and precious metals trading portfolios
Financial investments from the banking business
Investments from the insurance business
Non-consolidated participations
Tangible fixed assets
Intangible assets
Accrued income and prepaid expenses
Other assets
TOTAL ASSETS
LIABILITIES AND SHAREHOLDERS’ EQUITY
Liabilities in respect of money market paper
Due to banks
Commitments from the insurance business
Due to customers in savings and investment accounts
Due to customers, other
Medium-term notes
Bonds and mortgage-backed bonds
Accrued expenses and deferred income
Other liabilities
Valuation adjustments and provisions
Technical provisions for the insurance business
Shareholders’ equity (excluding minority interests)
Minority interests
TOTAL LIABILITIES
Abroad Change
– 839
3,026
– 4,352
749
– 40,072
416
–1,607
2,097
2,399
116
588
570
313
–1,603
– 38,199
2,169
– 32,562
– 41
52
–11,777
0
279
383
75
– 761
1,672
– 716
311
– 40,916
SwitzerlandChange
– 252
– 445
–1,274
309
–1,236
1,238
296
– 647
6,530
23
– 497
51
–104
– 2,924
1,068
46
6,374
2,408
–1,967
– 5,233
–1,372
– 920
–282
–1,239
– 698
3,752
2,907
9
3,785
Abroad 31 Dec. 1997
1,088
20,858
141,145
3,376
117,710
11,420
92,636
11,428
50,732
609
1,496
181
7,693
45,835
506,207
12,017
162,692
2,921
4,243
132,004
0
32,823
8,181
48,727
3,417
47,426
12,357
1,958
468,766
Switzerland31 Dec. 1997
2,316
3,155
4,633
3,048
26,781
67,484
11,190
4,589
42,655
583
4,775
0
1,726
10,426
183,361
503
17,544
3,124
44,290
63,567
7,216
12,771
3,496
9,441
3,712
43,802
11,289
47
220,802
Abroad 31 Dec. 1998
249
23,884
136,793
4,125
77,638
11,836
91,029
13,525
53,131
725
2,084
751
8,006
44,232
468,008
14,186
130,130
2,880
4,295
120,227
0
33,102
8,564
48,802
2,656
49,098
11,641
2,269
427,850
Switzerland31 Dec. 1998
2,064
2,710
3,359
3,357
25,545
68,722
11,486
3,942
49,185
606
4,278
51
1,622
7,502
184,429
549
23,918
5,532
42,323
58,334
5,844
11,851
3,214
8,202
3,014
47,554
14,196
56
224,587
92
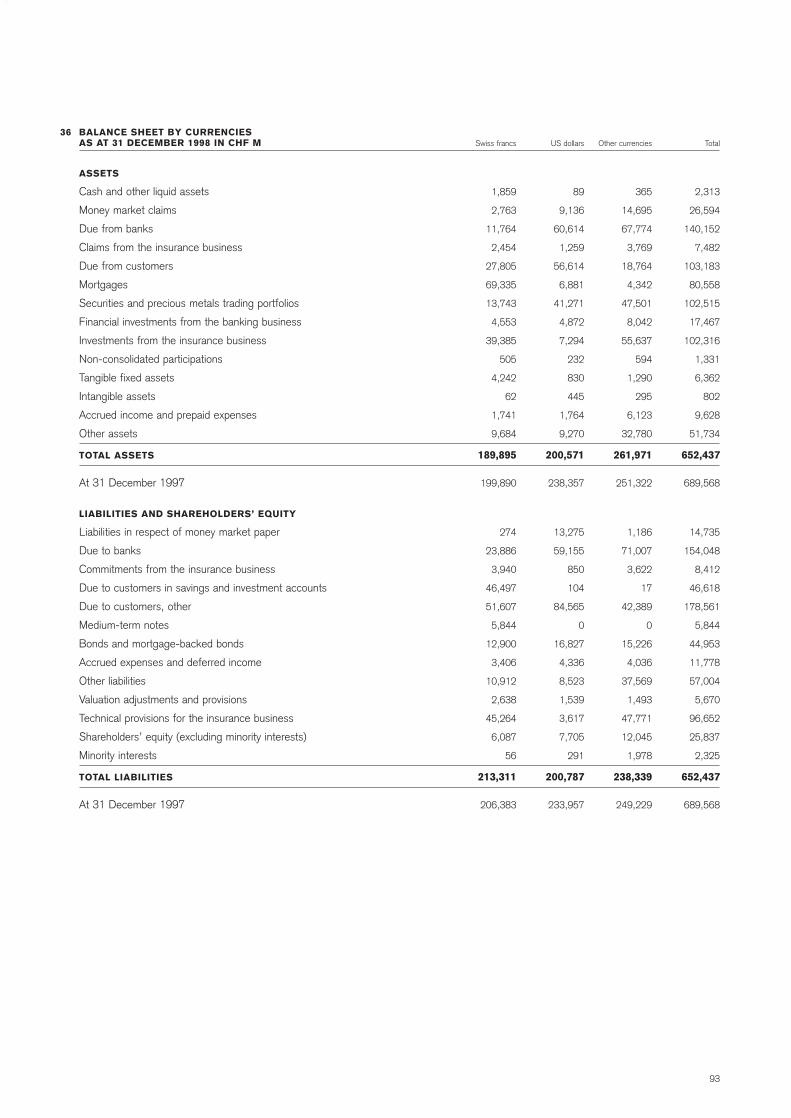
03_CSGB_E_Financial Report 30.4.1999 21:17 Uhr Seite 93
36 BALANCE SHEET BY CURRENCIESAS AT 31 DECEMBER 1998 IN CHF M
ASSETS
Cash and other liquid assets
Money market claims
Due from banks
Claims from the insurance business
Due from customers
Mortgages
Securities and precious metals trading portfolios
Financial investments from the banking business
Investments from the insurance business
Non-consolidated participations
Tangible fixed assets
Intangible assets
Accrued income and prepaid expenses
Other assets
TOTAL ASSETS
At 31 December 1997
LIABILITIES AND SHAREHOLDERS’ EQUITY
Liabilities in respect of money market paper
Due to banks
Commitments from the insurance business
Due to customers in savings and investment accounts
Due to customers, other
Medium-term notes
Bonds and mortgage-backed bonds
Accrued expenses and deferred income
Other liabilities
Valuation adjustments and provisions
Technical provisions for the insurance business
Shareholders’ equity (excluding minority interests)
Minority interests
TOTAL LIABILITIES
At 31 December 1997
Total
2,313
26,594
140,152
7,482
103,183
80,558
102,515
17,467
102,316
1,331
6,362
802
9,628
51,734
652,437
689,568
14,735
154,048
8,412
46,618
178,561
5,844
44,953
11,778
57,004
5,670
96,652
25,837
2,325
652,437
689,568
Other currencies
365
14,695
67,774
3,769
18,764
4,342
47,501
8,042
55,637
594
1,290
295
6,123
32,780
261,971
251,322
1,186
71,007
3,622
17
42,389
0
15,226
4,036
37,569
1,493
47,771
12,045
1,978
238,339
249,229
US dollars
89
9,136
60,614
1,259
56,614
6,881
41,271
4,872
7,294
232
830
445
1,764
9,270
200,571
238,357
13,275
59,155
850
104
84,565
0
16,827
4,336
8,523
1,539
3,617
7,705
291
200,787
233,957
Swiss francs
1,859
2,763
11,764
2,454
27,805
69,335
13,743
4,553
39,385
505
4,242
62
1,741
9,684
189,895
199,890
274
23,886
3,940
46,497
51,607
5,844
12,900
3,406
10,912
2,638
45,264
6,087
56
213,311
206,383
93

NOTES TO THE CONSOLIDATED FINANCIAL STATEMENTS
03_CSGB_E_Financial Report 30.4.1999 21:17 Uhr Seite 94
37 PARTICIPATIONS, AT 31 DECEMBER 1998Principal fully consolidated participations Company(% of equity capital held by the company exercising control) Domicile Capital in m Business unit
Credit Suisse Group Zurich
100.00 Credit Suisse Zurich CHF 3,114.7 CS/CSPB
100.00 Credit Suisse First Boston Zurich CHF 3,260.3 CSFB/CSAM
100.00 “Winterthur” Swiss Insurance Company Winterthur CHF 193.7 Winterthur
98.63 Neue Aargauer Bank Aarau CHF 273.8 CS
50.00 Swisscard AECS AG Zurich CHF 0.1 CS
100.00 Bank Leu Ltd. Zurich CHF 200.0 CSPB
100.00 Bank Hofmann AG Zurich CHF 20.0 CSPB
88.69 Clariden Holding AG Zurich CHF 8.0 CSPB
100.00 Banque Leu (Luxembourg) SA Luxembourg CHF 25.0 CSPB
100.00 Credit Suisse Fides Zurich CHF 5.0 CSPB
100.00 Credit Suisse Trust Zurich CHF 5.0 CSPB
100.00 Credit Suisse Trust Holdings Ltd. St. Peter Port GBP 2.0 CSPB
66.67 IT Services AG Dübendorf CHF 2.4
100.00 Credit Suisse Group Finance (Guernsey) Ltd. Guernsey CHF ~
100.00 Credit Suisse First Boston Private Equity Zug CHF 0.1 CSFB
100.00 Merban Equity Zug CHF 0.1 CSFB
100.00 CSFB IGP Zug CHF 0.1 CSFB
100.00 CSFB RGP Zug CHF 0.1 CSFB
49.00 Credit Suisse First Boston, Inc. New York USD 2.2 CSFB
100 Credit Suisse Zurich CHF 3,114.7 CS/CSPB
90 City Bank Zurich CHF 5.0 CS
100 Denaro-Hypo Bank Aarau CHF 5.0 CS
100 Schweizerische Schiffshypothekenbank Basle CHF 15.0 CS
100 Credit Suisse Leasing AG Zurich CHF 31.0 CS
100 Credit Suisse Immobilien Leasing AG Zurich CHF 3.0 CS
90 Innoventure Capital AG Zurich CHF 10.0 CS
100 WECO Inkasso AG Zurich CHF 0.5 CS
51 Swiss NetPay AG Zurich CHF 0.5 CS
100 ABZ Finanz- und Beteiligungsgesellschaft AG Zug CHF 4.0 CS
100 Bank für Handel und Effekten Zurich CHF 30.0 CSPB
100 Credit Suisse (UK) Ltd. London GBP 16.5 CSPB
100 Credit Suisse (Guernsey) Ltd. St. Peter Port GBP 3.0 CSPB
100 Credit Suisse (Gibraltar) Ltd. Gibraltar GBP 5.0 CSPB
100 Credit Suisse (Bahamas) Ltd. Nassau USD 12.0 CSPB
87 Credit Suisse Hottinguer Paris FRF 346.9 CSPB
100 Credit Suisse (Deutschland) Aktiengesellschaft Frankfurt DEM 20.0 CSPB
100 Credit Suisse (Italy) S.p.A. Milan ITL 56,000.0 CSPB
100 Credit Suisse Investment Consulting (Taiwan) Ltd. Taipei TWD 30.0 CSPB
100 Credit Suisse (Luxembourg) S.A. Luxembourg CHF 25.0 CSPB
100 Credit Suisse (Monaco) S.A.M. Monte Carlo FRF 65.0 CSPB
100 Credit Suisse Securities Ltd. London GBP 10.0 CSPB
100 Swiss American Corporation New York USD 38.9 CSPB
93 Swiss American Securities, Inc. New York USD 8.3 CSPB
94
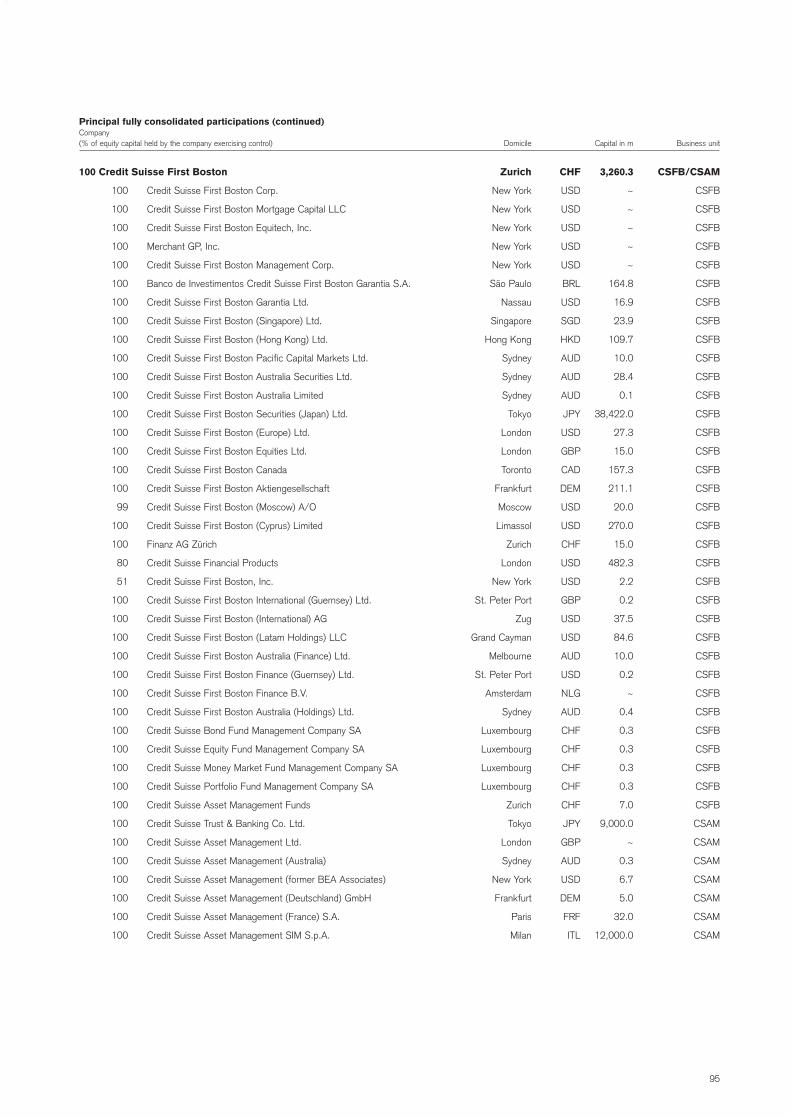
03_CSGB_E_Financial Report 30.4.1999 21:17 Uhr Seite 95
Principal fully consolidated participations (continued)Company(% of equity capital held by the company exercising control) Domicile Capital in m Business unit
100 Credit Suisse First Boston Zurich CHF 3,260.3 CSFB/CSAM
100 Credit Suisse First Boston Corp. New York USD ~ CSFB
100 Credit Suisse First Boston Mortgage Capital LLC New York USD ~ CSFB
100 Credit Suisse First Boston Equitech, Inc. New York USD ~ CSFB
100 Merchant GP, Inc. New York USD ~ CSFB
100 Credit Suisse First Boston Management Corp. New York USD ~ CSFB
100 Banco de Investimentos Credit Suisse First Boston Garantia S.A. São Paulo BRL 164.8 CSFB
100 Credit Suisse First Boston Garantia Ltd. Nassau USD 16.9 CSFB
100 Credit Suisse First Boston (Singapore) Ltd. Singapore SGD 23.9 CSFB
100 Credit Suisse First Boston (Hong Kong) Ltd. Hong Kong HKD 109.7 CSFB
100 Credit Suisse First Boston Pacific Capital Markets Ltd. Sydney AUD 10.0 CSFB
100 Credit Suisse First Boston Australia Securities Ltd. Sydney AUD 28.4 CSFB
100 Credit Suisse First Boston Australia Limited Sydney AUD 0.1 CSFB
100 Credit Suisse First Boston Securities (Japan) Ltd. Tokyo JPY 38,422.0 CSFB
100 Credit Suisse First Boston (Europe) Ltd. London USD 27.3 CSFB
100 Credit Suisse First Boston Equities Ltd. London GBP 15.0 CSFB
100 Credit Suisse First Boston Canada Toronto CAD 157.3 CSFB
100 Credit Suisse First Boston Aktiengesellschaft Frankfurt DEM 211.1 CSFB
99 Credit Suisse First Boston (Moscow) A/O Moscow USD 20.0 CSFB
100 Credit Suisse First Boston (Cyprus) Limited Limassol USD 270.0 CSFB
100 Finanz AG Zürich Zurich CHF 15.0 CSFB
80 Credit Suisse Financial Products London USD 482.3 CSFB
51 Credit Suisse First Boston, Inc. New York USD 2.2 CSFB
100 Credit Suisse First Boston International (Guernsey) Ltd. St. Peter Port GBP 0.2 CSFB
100 Credit Suisse First Boston (International) AG Zug USD 37.5 CSFB
100 Credit Suisse First Boston (Latam Holdings) LLC Grand Cayman USD 84.6 CSFB
100 Credit Suisse First Boston Australia (Finance) Ltd. Melbourne AUD 10.0 CSFB
100 Credit Suisse First Boston Finance (Guernsey) Ltd. St. Peter Port USD 0.2 CSFB
100 Credit Suisse First Boston Finance B.V. Amsterdam NLG ~ CSFB
100 Credit Suisse First Boston Australia (Holdings) Ltd. Sydney AUD 0.4 CSFB
100 Credit Suisse Bond Fund Management Company SA Luxembourg CHF 0.3 CSFB
100 Credit Suisse Equity Fund Management Company SA Luxembourg CHF 0.3 CSFB
100 Credit Suisse Money Market Fund Management Company SA Luxembourg CHF 0.3 CSFB
100 Credit Suisse Portfolio Fund Management Company SA Luxembourg CHF 0.3 CSFB
100 Credit Suisse Asset Management Funds Zurich CHF 7.0 CSFB
100 Credit Suisse Trust & Banking Co. Ltd. Tokyo JPY 9,000.0 CSAM
100 Credit Suisse Asset Management Ltd. London GBP ~ CSAM
100 Credit Suisse Asset Management (Australia) Sydney AUD 0.3 CSAM
100 Credit Suisse Asset Management (former BEA Associates) New York USD 6.7 CSAM
100 Credit Suisse Asset Management (Deutschland) GmbH Frankfurt DEM 5.0 CSAM
100 Credit Suisse Asset Management (France) S.A. Paris FRF 32.0 CSAM
100 Credit Suisse Asset Management SIM S.p.A. Milan ITL 12,000.0 CSAM
95

NOTES TO THE CONSOLIDATED FINANCIAL STATEMENTS
03_CSGB_E_Financial Report 30.4.1999 21:17 Uhr Seite 96
Principal fully consolidated participations (continued)Company(% of equity capital held by the company exercising control) Domicile Capital in m Business unit
100 “Winterthur” Swiss Insurance Company Winterthur CHF 193.7 Winterthur
Switzerland
100 Winterthur Life Winterthur CHF 175.0 Winterthur
100 The Federal Zurich CHF 10.0 Winterthur
67 Winterthur Legal Assistance Winterthur CHF 9.0 Winterthur
100 Vitodurum Insurance Winterthur CHF 40.0 Winterthur
100 Vitodurum Holding Winterthur CHF 5.0 Winterthur
100 Swissline Wallisellen CHF 0.5 Winterthur
100 Winterthur International Winterthur CHF 1.0 Winterthur
Germany
100 Winterthur Beteiligungsgesellschaft m.b.H. Wiesbaden DEM 0.1 Winterthur
75 WINCOM Versicherungs-Holding AG Wiesbaden DEM 102.7 Winterthur
60 DBV-Winterthur Group Wiesbaden DEM 170.2 Winterthur
Italy
100 Winterthur Holding Italia Milan ITL 260,000.0 Winterthur
100 Winterthur Assicurazioni Milan ITL 250,882.0 Winterthur
100 Winterthur Vita S.p.A. Milan ITL 81,500.0 Winterthur
Spain
100 Hispanowin S.A. Barcelona ESP 13,098.5 Winterthur
100 Winterthur Seguros Generales Barcelona ESP 5,744.3 Winterthur
80 Winterthur Asistencia Barcelona ESP 350.0 Winterthur
100 Winterthur Vida Española Barcelona ESP 5,819.0 Winterthur
100 Winterthur Salud de Seguros Barcelona ESP 1,225.8 Winterthur
100 Equitativa Riesgos Diversos Madrid ESP 2,342.6 Winterthur
100 Winterthur Pensiones Barcelona ESP 970.0 Winterthur
Belgium
85 Winterthur-Europe Assurances Brussels BEF 1.9 Winterthur
100 Assurance Group Josi Brussels BEF 1,250.0 Winterthur
100 ASG Accidents du Travail Brussels BEF 160.0 Winterthur
Luxembourg
100 Winterthur-Europe Life Luxembourg LUF 177.2 Winterthur
UK
100 Winterthur (UK) Holdings London GBP 42.6 Winterthur
100 Churchill Insurance Bromley GBP 60.0 Winterthur
100 Winterthur Life UK Holdings Basingstoke GBP ~ Winterthur
100 Winterthur Life UK Basingstoke GBP 26.4 Winterthur
100 Winterthur International London GBP 120.0 Winterthur
Austria
100 Winterthur Versicherungen Vienna ATS 127.5 Winterthur
100 Winterthur Pensionskassen Vienna ATS 70.0 Winterthur
100 Wintisa Vienna ATS 1.0 Winterthur
Portugal
100 Europeia Seguros Lisbon PTE 3,150.0 Winterthur
96

03_CSGB_E_Financial Report 30.4.1999 21:17 Uhr Seite 97
Principal fully consolidated participations (continued) Company(% of equity capital held by the company exercising control) Domicile Capital in m Business unit
“Winterthur” Swiss Insurance Company (continued)
France
50 Assurcrédit Paris FRF 150.0 Winterthur
75 Rhodia Assurance Lyon FRF 60.0 Winterthur
Czech Republic
65 Winterthur pojist’ouna, a.s. Prague CZK 363.0 Winterthur
79 Winterthur penzijní fond a.s. Brno CZK 142.4 Winterthur
Hungary
65 Winterthur Pénztárszolgáltató Rt. Budapest HUF 600.0 Winterthur
65 Winterthur Biztosító Rt. Budapest HUF 1,000.0 Winterthur
Poland
73 Winterthur S.A. Warsaw PLN 20.0 Winterthur
76 Winterthur Zycie Warsaw PLN 17.5 Winterthur
70 Winterthur Powszechne Towarzystwo Warsaw PLN 100.0 Winterthur
USA
100 Winterthur U.S. Holdings Wilmington, DE USD 30.0 Winterthur
100 Blue Ridge Simsbury, CT USD 3.6 Winterthur
100 General Casualty Sun Prairie, WI USD 3.0 Winterthur
100 Republic Financial Services Dallas, TX USD ~ Winterthur
100 Southern Guaranty Montgomery, AL USD 2.0 Winterthur
100 Unigard Bellevue, WA USD 60.0 Winterthur
100 Winterthur Life U.S. Holdings Wilmington, DE USD ~ Winterthur
Canada
100 Winterthur Canada Financial Toronto CAD 0.0 Winterthur
100 The Citadel General Toronto CAD 34.1 Winterthur
100 L’Unique Quebec CAD 7.0 Winterthur
Other countries
100 Winterthur Empreendimentos e Participações São Paulo BRL 1.6 Winterthur
100 Winterthur International (SA) Johannesburg ZAR 1.0 Winterthur
100 Winterthur International Argentina S.A. Buenos Aires USD 0.5 Winterthur
100 Winterthur Holdings Australia Sydney AUD 54.2 Winterthur
97 Winterthur Insurance (Far East) Singapore SGD 17.5 Winterthur
100 Winterthur Swiss Insurance (Asia) Hong Kong HKD 175.0 Winterthur
100 Winterthur Insurance (Asia) Hong Kong HKD 150.0 Winterthur
60 Winterthur Life Indonesia Jakarta IDR 26,500.0 Winterthur
91 Winterthur International Hamilton, Bermuda USD 2.4 Winterthur
96 Winterthur Overseas Hamilton, Bermuda USD 0.3 Winterthur
100 Windsor Parc Ltd. Hamilton, Bermuda USD 1.0 Winterthur
100 Winterthur Finance Ltd. British Virgin Islands GBP ~ Winterthur
29 Harrington Holdings Hamilton, Bermuda USD 70.0 Winterthur
97
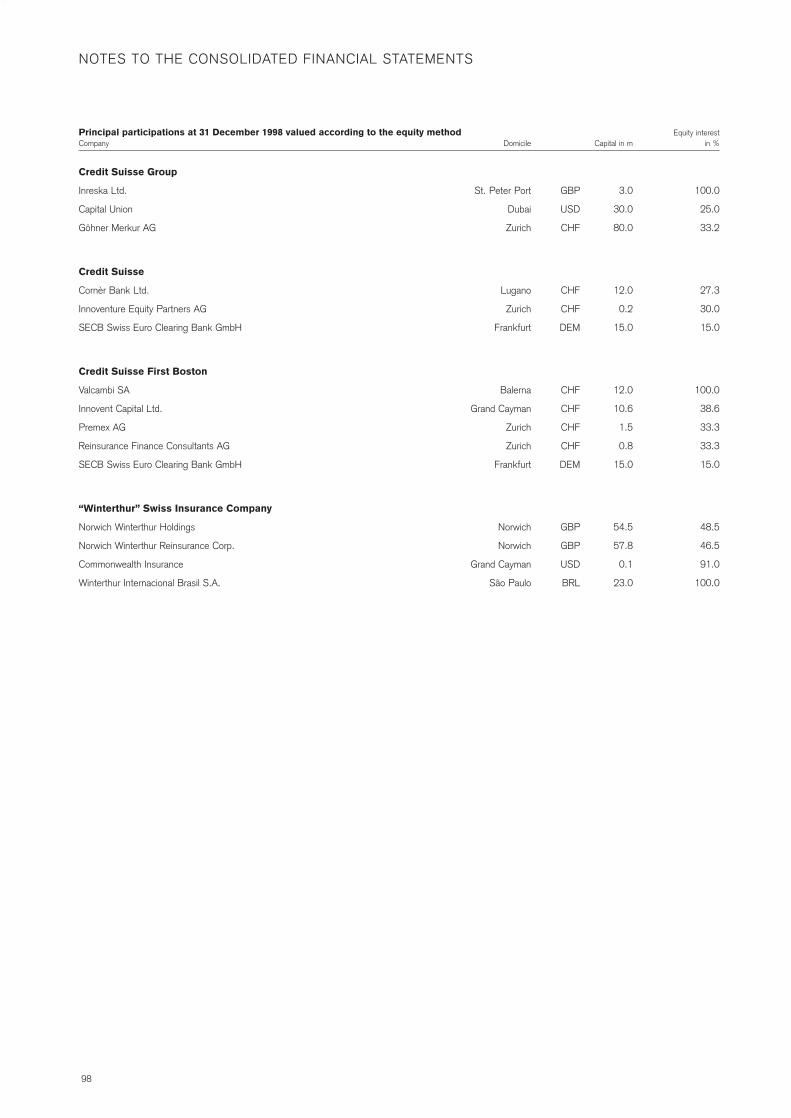
NOTES TO THE CONSOLIDATED FINANCIAL STATEMENTS
03_CSGB_E_Financial Report 30.4.1999 21:17 Uhr Seite 98
Principal participations at 31 December 1998 valued according to the equity method Equity interestCompany Domicile Capital in m in %
Credit Suisse Group
Inreska Ltd. St. Peter Port GBP 3.0 100.0
Capital Union Dubai USD 30.0 25.0
Göhner Merkur AG Zurich CHF 80.0 33.2
Credit Suisse
Cornèr Bank Ltd. Lugano CHF 12.0 27.3
Innoventure Equity Partners AG Zurich CHF 0.2 30.0
SECB Swiss Euro Clearing Bank GmbH Frankfurt DEM 15.0 15.0
Credit Suisse First Boston
Valcambi SA Balerna CHF 12.0 100.0
Innovent Capital Ltd. Grand Cayman CHF 10.6 38.6
Premex AG Zurich CHF 1.5 33.3
Reinsurance Finance Consultants AG Zurich CHF 0.8 33.3
SECB Swiss Euro Clearing Bank GmbH Frankfurt DEM 15.0 15.0
“Winterthur” Swiss Insurance Company
Norwich Winterthur Holdings Norwich GBP 54.5 48.5
Norwich Winterthur Reinsurance Corp. Norwich GBP 57.8 46.5
Commonwealth Insurance Grand Cayman USD 0.1 91.0
Winterthur Internacional Brasil S.A. São Paulo BRL 23.0 100.0
98

03_CSGB_E_Financial Report 30.4.1999 21:17 Uhr Seite 99
Principal participations at 31 December 1998 valued at cost Equity interestCompany Domicile Capital in m in %
Credit Suisse Group
Fides Information Services Zurich CHF 1.0 67
Wincasa Winterthur CHF 1.5 100
Watt AG Glarus CHF 87.5 20
Credit Suisse
Swiss Mortgage Bond Bank Zurich CHF 300.0 16.8
Credit Suisse First Boston
Banco General de Negocios Buenos Aires ARG 163.0 24.1
Banco Exterior Suiza S.A. Geneva CHF 115.0 10.0
Banco Comercial S.A. Montevideo URU 215.9 19.9
Telekurs Holding AG Zurich CHF 45.0 17.4
Intersettle Swiss Corp. Zurich CHF 36.0 9.5
SEGA Schweiz. Effekten-Giro AG Olten CHF 10.0 18.5
SNOC Swiss Nominee Company Zurich CHF 2.0 25.0
Euro-Clear Clearance System Ltd. London GBP 2.5 6.0
NCO Dealer Soc. Fin. Lisbon POR 500.0 18.0
San Luis Financial and Investment Co. Ltd. Panama City PAN 0.5 12.1
North Bay Ltd. Nassau USD 8.0 100.0
SWIFT La Hulpe BEF 439.9 1.6
“Winterthur” Swiss Insurance Company
Auto-Bestandteil-Wiederverwertung AG Grolley CHF 0.2 50.0
Expertisa Columna Beratungen Winterthur CHF 0.2 100.0
Gartenhotel Winterthur CHF 2.5 100.0
Intershop Holding Zurich CHF 137.2 24.1
IT Services AG Dübendorf CHF 2.4 33.3
Lehr- und Versuchswerkstätte Volketswil CHF 0.3 100.0
Tertianum Management AG Herrenschwanden CHF 0.5 14.9
Technopark Immobilien Zurich CHF 40.0 25.0
Wincare Versicherungen Winterthur CHF 0.1 100.0
Winterthur Financial Services Winterthur CHF 0.5 100.0
Zürcher Freilager AG Zurich CHF 4.0 36.2
DBV Allgemeine Dilbeek near Brussels BEF 500.0 100.0
Winterthur Fund Management Co. Luxembourg LUF 5.0 100.0
Winterthur Research SA Barcelona ESP 15.0 100.0
Winterthur-Service SA Barcelona ESP 25.0 100.0
Chiyoda Fire & Marine Insurance Tokyo JPY 19,390.8 6.0
Winterthur International Services Hamilton, Bermuda USD 0.0 100.0
Seguros ATLAS Mexico City MXN 50.0 30.0
99

NOTES TO THE CONSOLIDATED FINANCIAL STATEMENTS
03_CSGB_E_Financial Report 30.4.1999 21:17 Uhr Seite 100
Year-end rate used Average rate usedin the balance sheet at 31 Dec. in the income statement
FOREIGN CURRENCY TRANSLATION RATES IN CHF 1998 1997 1998 1997
1 US dollar (USD) 1.375 1.44 1.43 1.44
1 British pound sterling (GBP) 2.29 2.41 2.37 2.35
1 euro (EUR) 1.61 1.60 1.61 1.62
1 Canadian dollar (CAD) 0.888 1.01 0.97 1.04
1 Singapore dollar (SGD) 0.8235 0.85 0.86 0.97
1 Hong Kong dollar (HKD) 0.1775 0.1852 0.1845 0.1850
100 Deutsche marks (DEM) 82.33 80.90 81.60 82.90
100 Dutch guilders (NLG) 73.07 71.36 72.35 73.65
100 French francs (FRF) 24.55 24.02 24.30 24.60
100 Italian lire (ITL) 0.0832 0.0817 0.0825 0.0840
100 Japanese yen (JPY) 1.21 1.11 1.1 1.19
100 Spanish pesetas (ESP) 0.9678 0.9455 0.956 0.977
100

03_CSGB_E_Financial Report 30.4.1999 21:17 Uhr Seite 101
REPORT OF THE GROUP’S AUDITORS TO THE ANNUAL GENERAL MEETING OF CREDIT SUISSE GROUP, ZURICH
As auditors of the Group, we have audited the consolidated financial statements (income statement, balance sheet, statement of source
and application of funds and notes) of Credit Suisse Group for the year ended 31 December 1998.
These consolidated financial statements are the responsibility of the Board of Directors. Our responsibility is to express an opinion on
these consolidated financial statements based on our audit. We confirm that we meet the legal requirements concerning professional quali-
fication and independence.
Our audit was conducted in accordance with auditing standards promulgated by the profession in Switzerland and with the Internatio-
nal Standards on Auditing issued by the International Federation of Accountants (IFAC), which require that an audit be planned and perfor-
med to obtain reasonable assurance about whether the consolidated financial statements are free from material misstatement. We have
examined on a test basis evidence supporting the amounts and disclosures in the consolidated financial statements. We have also asses-
sed the accounting principles used, significant estimates made and the overall consolidated financial statement presentation. We believe
that our audit provides a reasonable basis for our opinion.
In our opinion, the consolidated financial statements give a true and fair view of the financial position, results of operations and the
source and application of funds based on the Swiss accounting rules for banks and the Swiss accounting and reporting recommendations
(ARR) for the insurance business of the Group, which are explained in the notes to the consolidated financial statements, and comply with
Swiss law. Furthermore, the consolidated financial statements comply with European Union directives (4th, 7th and directive for banks),
except for the deviations described in the notes to the consolidated financial statements.
We recommend that the consolidated financial statements submitted to you be approved.
KPMG Klynveld Peat Marwick Goerdeler SA
Brendan R. Nelson Peter Hanimann
Chartered Accountant Certified Accountant
Auditors in Charge
Zurich, 15 March 1999
101
Related Documents