CREDIBILITY FROM THE EYES OF THE CUSTOMER Michael Round Rational Systems August 11, 1999

CREDIBILITY FROM THE EYES OF THE CUSTOMER Michael Round Rational Systems August 11, 1999.
Dec 13, 2015
Welcome message from author
This document is posted to help you gain knowledge. Please leave a comment to let me know what you think about it! Share it to your friends and learn new things together.
Transcript

CREDIBILITYFROM THE EYES OF THE CUSTOMER
Michael Round
Rational Systems
August 11, 1999

Rational Systems, formed by Michael Round in 1999, and located in Overland Park, Kansas, specializes in statistical and
actuarial improvement.
For a copy of “Credibility”, please e-mail me at: [email protected]
We are now accepting clients.

INTRODUCTION & BACKGROUND
BACKGROUND
DISRAELI vs. HUCKLEBERRY FINN
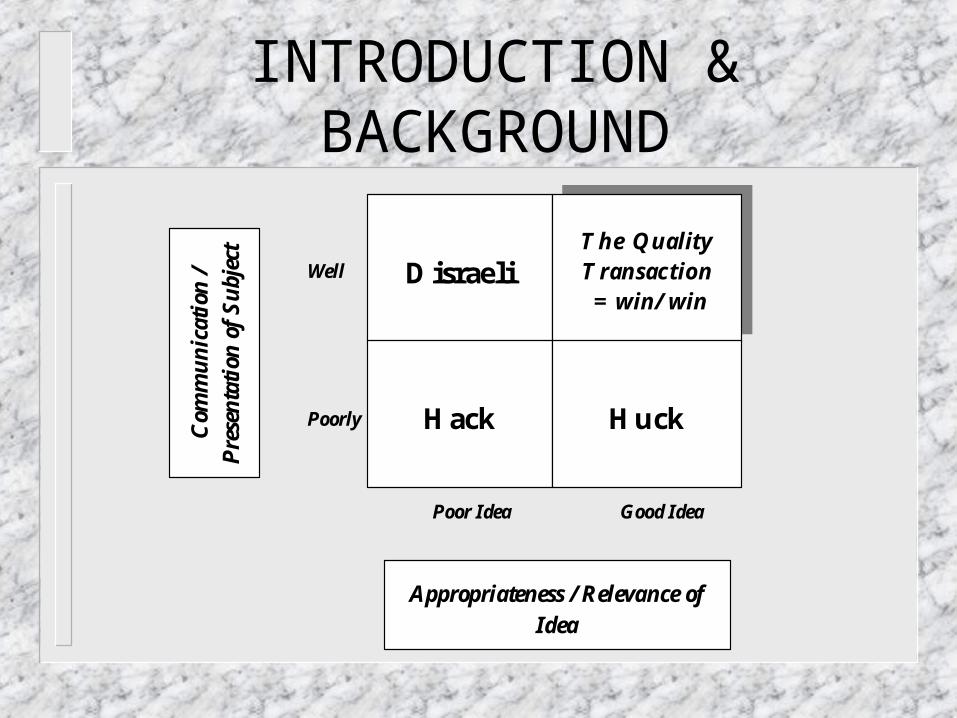
INTRODUCTION & BACKGROUND
Well
Poorly
Poor Idea Good Idea
DisraeliThe Quality Transaction = win/ win
Hack Huck
Com
mu
nic
atio
n /
Pre
sen
tati
on o
f S
ubj
ect
Appropriateness / Relevance of Idea

THE EXISTENCE OF A PROBLEM
CONTEXT: the renewal rating process, the pricing actuary, and the group representative / layperson - all addressing the impending anniversary date of the group.

THE ACTUARIAL POSITION
We want to have a reasonably priced insurance product.
The pricing actuary must take into account claims variability.
Credibility is used in the renewal rating process.
goal requirements prerequisite
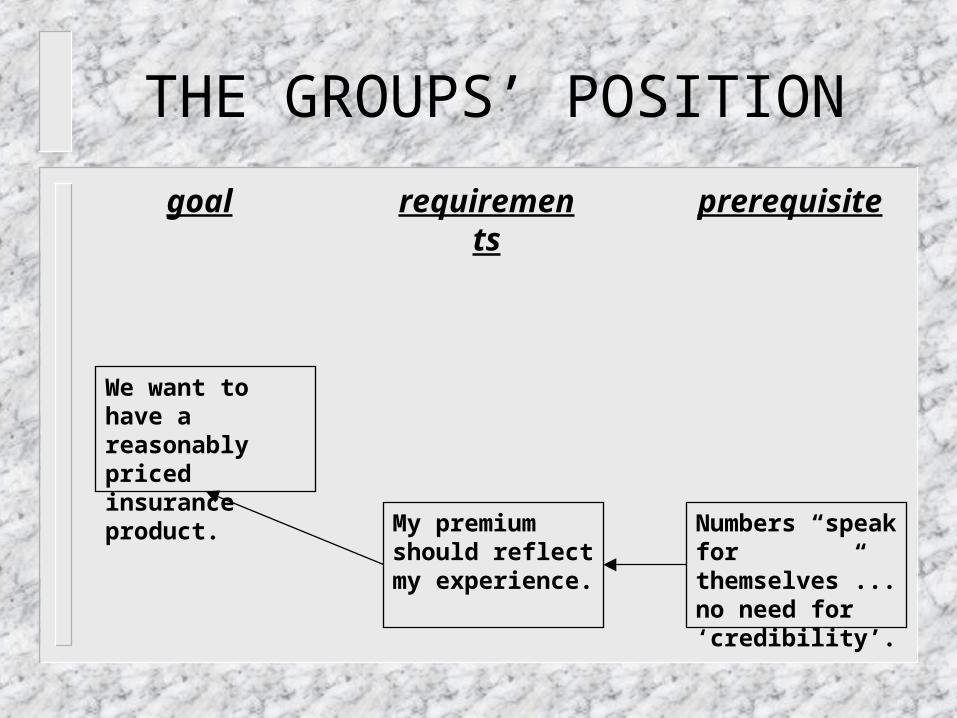
THE GROUPS’ POSITION
We want to have a reasonably priced insurance product.
My premium should reflect my experience.
Numbers “speak for themselves”... no need for ‘credibility’.
goal requirements prerequisite

THE CONFLICT
We want to have a reasonably priced insurance product.
My premium should reflect my experience.
Numbers “speak for themselves”... no need for ‘credibility’.
The pricing actuary must take into account claims variability.
Credibility is used in the renewal rating process.
goal requirements prerequisite

CONFLICT CONSEQUENCES
Numbers “speak for themselves”... no need for ‘credibility’.
Credibility is used in the renewal rating process.
My group has an empirically low loss ratio.
My expectation is a low renewal rate increase.
Credibility may adjust data to an “average renewal rate increase”.

UNDESIREABLE EFFECT
My expectation is a low renewal rate increase.
Credibility may adjust data to an “average renewal rate increase”.
Unhappy, angry, and confused, I go to the market for competing quotes.

THE ROOT CAUSE
At first glance, we might suggest the root cause of the conflict and the inevitable action of the group is:
FAILURE OF THE CLIENT TO UNDERSTAND THAT ADJUSTMENT OF DATA IS NECESSARY IN THE RENEWAL PROCESS . . . After all, the client has the perception:
THE DATA IS WHAT IT IS!!
However ...
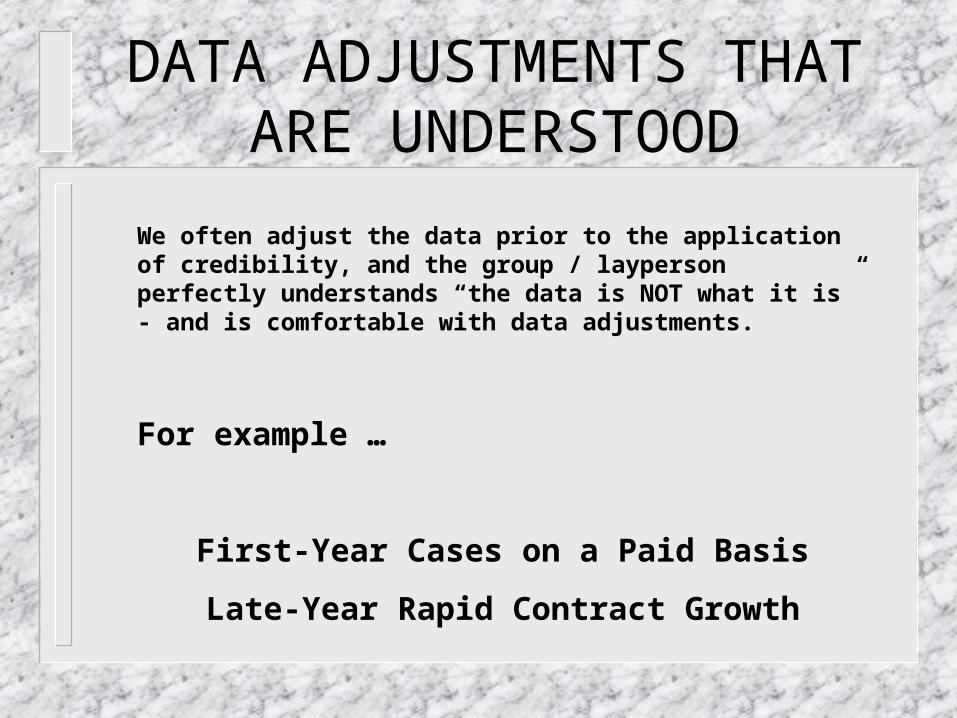
DATA ADJUSTMENTS THAT ARE UNDERSTOOD
We often adjust the data prior to the application of credibility, and the group / layperson perfectly understands “the data is NOT what it is” - and is comfortable with data adjustments.
For example …
First-Year Cases on a Paid Basis
Late-Year Rapid Contract Growth

DATA ADJUSTMENTS THAT ARE UNDERSTOOD
Empirical Data Apples-to-ApplesPaid Paid Paid Paid
Month Premium Claims Premium ClaimsJanuary $10,000 $0 $0 $0February $10,000 $0 $0 $0March $10,000 $0 $0 $0April $10,000 $7,143 $10,000 $7,143May $10,000 $10,000 $10,000 $10,000June $10,000 $14,286 $10,000 $14,286July $10,000 $5,714 $10,000 $5,714August $10,000 $2,857 $10,000 $2,857September $10,000 $3,571 $10,000 $3,571October $10,000 $5,143 $10,000 $5,143
Totals $100,000 $48,714 $70,000 $48,714
Loss Ratio 49% 70%

DATA ADJUSTMENTS THAT ARE UNDERSTOOD
Empirical Data Apples-to-ApplesPaid Paid Paid Paid
Month Contracts Premium Claims Premium ClaimsJanuary 100 $10,000 $7,143 $10,000 $7,143February 100 $10,000 $10,000 $10,000 $10,000March 100 $10,000 $14,286 $10,000 $14,286April 100 $10,000 $5,714 $10,000 $5,714May 100 $10,000 $2,857 $10,000 $2,857June 100 $10,000 $3,571 $10,000 $3,571July 100 $10,000 $5,143 $10,000 $5,143August 200 $20,000 $6,959 $10,000 $6,959September 200 $20,000 $6,933 $10,000 $6,933October 200 $20,000 $6,495 $10,000 $6,495
Totals $130,000 $69,101 $100,000 $69,101
Loss Ratio 53% 69%

THE ROOT PROBLEM
Credibility adjusts data in a numerical “black box”.
The group accepts “data adjustments” they can understand.
The group often does not understand the adjustment of their “good” data when adjusted via credibility.

INJECTION TO SOLVE THE PROBLEM
CREDIBILITY - and what gives rise to its need - ARE INTUITIVELY presented.
The group accepts “data adjustments” they can understand.
The group has an understanding of what has happened to their data - and may not be as dissatisfied with the perceived gap between the “expected” and “actual” renewal rate increase.

THE SOLUTION TO THE PROBLEM
CREDIBILITY seeks to quantify the variability, uncertainty, and predictability of a block of data.
To intuitively present this idea, we need to bridge the gap between our level of knowledge and that of the group representative / lay-person - OR PROVIDE A VISUAL MEANS OF AFFORDING THE LAY-PERSON THE INTUITIVE KNOWLEDGE OF WHAT VARIABILITY IS.
SIMULATION is an excellent mechanism for demonstrating variability and uncertainty at an intuitive level.

SIMULATING VARIABILITY
IF the essence of credibility is “degree of predictability”, THEN one method of communicating intuitively this concept is a simple simulation probability distribution for three different group sizes:
25 Members
250 Members
2500 Members

A ‘25-MEMBER’ GROUP ...

A ‘250-MEMBER’ GROUP ...

A ‘2500-MEMBER’ GROUP ...
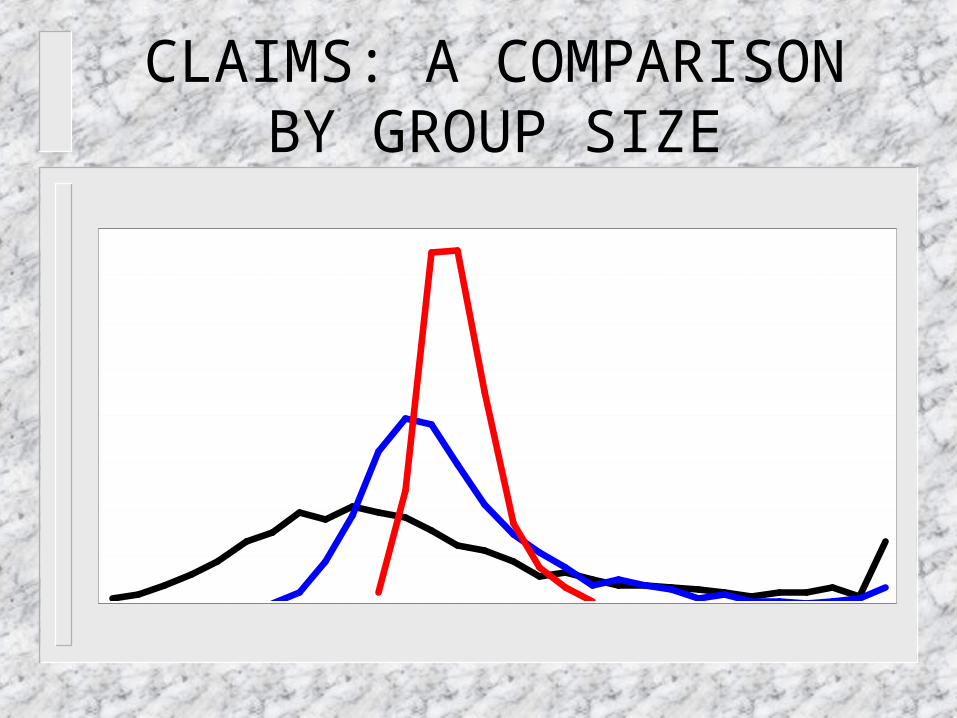
CLAIMS: A COMPARISON BY GROUP SIZE

EXPLAINING CREDIBILITY
IF we have achieved our goal of visually demonstrating the meaning of “variability”, “uncertainty”, and “predictability” [all of which CREDIBILITY is addressing], THEN the group representative / lay-person has some feel why their data is being adjusted.
WHY NOT USE THE SAME SIMULATION PROCESS THAT EXPRESSES VARIABILITY VISUALLY TO TABULATE THE CREDIBILITY FACTORS WE NEED TO ACTUALLY ADJUST THE DATA?
THE ADVANTAGES
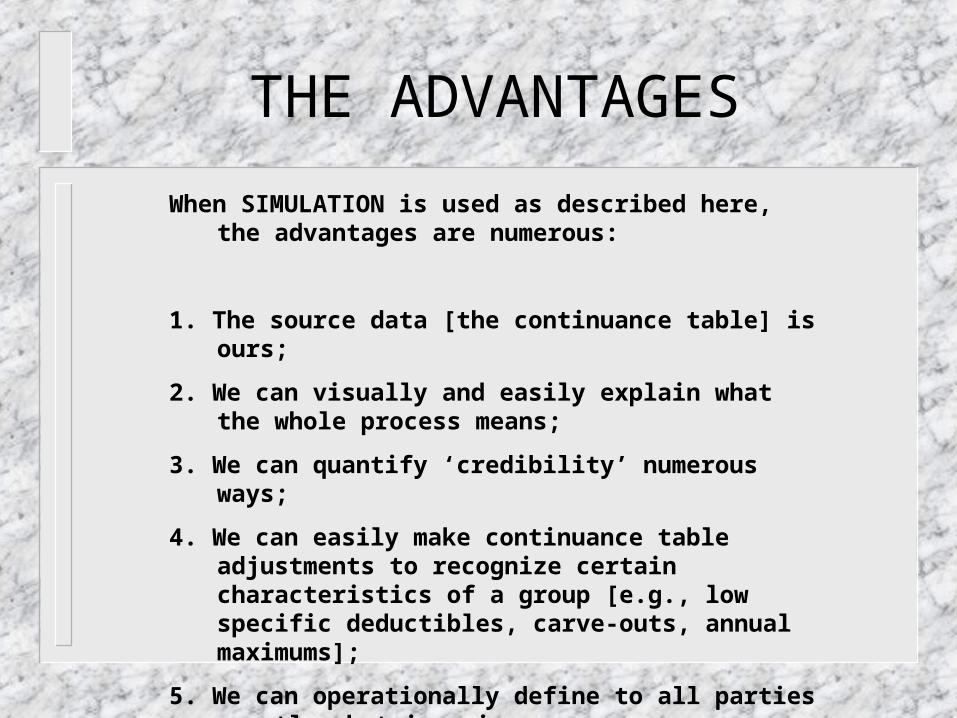
When SIMULATION is used as described here, the advantages are numerous:
1. The source data [the continuance table] is ours;
2. We can visually and easily explain what the whole process means;
3. We can quantify ‘credibility’ numerous ways;
4. We can easily make continuance table adjustments to recognize certain characteristics of a group [e.g., low specific deductibles, carve-outs, annual maximums];
5. We can operationally define to all parties exactly what is going on.

TABULATING CREDIBILITY
There are many ways to tabulate credibility when approached from the perspective defined here. The two basic categories are:
1. Percentage of simulations falling within +/- x% of the expected PMPM;
2. Percentage of simulation dollars falling within +/- x% of the total expected dollars.

CREDIBILITY FOR OUR PURPOSES
CREDIBILITY TABULAR DATA PROBABILITY MEASURE: # OF SIMULATED GROUPS
Simulated Rates Group Size in Members
in Relation to
Expected Rates 10 25 50 100 250 500 1000 2500 5000
0%-5% 0.1% 0.0% 0.0% 0.0% 0.0% 0.0% 0.0% 0.0% 0.0%
5%-15% 3.1% 0.1% 0.0% 0.0% 0.0% 0.0% 0.0% 0.0% 0.0%
15%-25% 8.6% 1.8% 0.0% 0.0% 0.0% 0.0% 0.0% 0.0% 0.0%
25%-35% 11.2% 5.9% 1.6% 0.1% 0.0% 0.0% 0.0% 0.0% 0.0%
35%-45% 10.6% 9.3% 5.5% 1.7% 0.0% 0.0% 0.0% 0.0% 0.0%
45%-55% 10.6% 12.3% 11.1% 6.4% 0.8% 0.1% 0.0% 0.0% 0.0%
55%-65% 8.7% 12.5% 14.3% 13.6% 6.9% 1.7% 0.1% 0.0% 0.0%
65%-75% 7.9% 11.1% 14.1% 16.3% 15.7% 9.2% 3.9% 0.3% 0.0%
75%-85% 6.9% 9.1% 11.7% 14.5% 18.3% 20.3% 17.5% 7.7% 2.3%
85%-95% 5.0% 7.8% 9.6% 11.1% 15.8% 20.9% 25.1% 29.4% 27.6%
95%-105% 4.0% 5.3% 6.3% 7.9% 13.1% 15.4% 20.9% 33.2% 44.3%
105%-115% 3.0% 4.2% 4.8% 6.3% 8.1% 10.3% 12.8% 19.3% 21.1%
115%-125% 2.5% 3.5% 3.5% 4.1% 5.1% 6.7% 8.9% 7.2% 4.3%
125%-135% 2.6% 2.5% 2.9% 3.5% 3.4% 4.6% 5.5% 2.2% 0.4%
135%-145% 1.9% 1.7% 2.0% 2.9% 2.9% 3.0% 2.5% 0.5% 0.0%
145%-155% 1.6% 1.4% 1.4% 2.1% 2.2% 2.6% 1.4% 0.1% 0.0%
155%-165% 1.0% 1.2% 1.4% 1.9% 1.8% 2.0% 0.9% 0.0% 0.0%
165%-175% 1.1% 1.1% 1.2% 1.1% 1.2% 1.3% 0.3% 0.0% 0.0%
175%-185% 0.9% 0.9% 1.3% 0.7% 0.8% 0.7% 0.1% 0.0% 0.0%
185%-195% 0.9% 0.8% 0.8% 0.4% 0.4% 0.7% 0.1% 0.0% 0.0%
195%-205% 0.5% 0.6% 0.7% 0.3% 0.5% 0.2% 0.0% 0.0% 0.0%
205%-215% 0.4% 0.7% 0.9% 0.2% 0.6% 0.1% 0.0% 0.0% 0.0%
215%-225% 0.3% 0.4% 0.5% 0.3% 0.6% 0.1% 0.0% 0.0% 0.0%
225%-235% 0.2% 0.3% 0.5% 0.4% 0.6% 0.1% 0.0% 0.0% 0.0%
235%-999% 6.3% 5.4% 3.9% 4.2% 1.2% 0.1% 0.0% 0.0% 0.0%
CREDIBILITY
as # of Groups
with experience 12.1% 17.3% 20.7% 25.3% 37.0% 46.7% 58.8% 81.9% 93.0%
within +/- 15%
of expected rates
as # of Groups
with experience 21.5% 29.9% 35.8% 43.9% 60.4% 73.7% 85.2% 96.8% 99.6%
within +/- 25%
of expected rates
CREDIBILITY TABULAR DATA PROBABILITY MEASURE: AMOUNT OF SIMULATED CLAIM $
Simulated Rates Group Size in Members
in Relation to
Expected Rates 10 25 50 100 250 500 1000 2500 5000
0%-5% 0.0% 0.0% 0.0% 0.0% 0.0% 0.0% 0.0% 0.0% 0.0%
5%-15% 0.4% 0.0% 0.0% 0.0% 0.0% 0.0% 0.0% 0.0% 0.0%
15%-25% 1.8% 0.4% 0.0% 0.0% 0.0% 0.0% 0.0% 0.0% 0.0%
25%-35% 3.4% 1.8% 0.5% 0.0% 0.0% 0.0% 0.0% 0.0% 0.0%
35%-45% 4.3% 3.8% 2.3% 0.7% 0.0% 0.0% 0.0% 0.0% 0.0%
45%-55% 5.3% 6.3% 5.6% 3.2% 0.4% 0.0% 0.0% 0.0% 0.0%
55%-65% 5.2% 7.7% 8.7% 8.2% 4.3% 1.1% 0.1% 0.0% 0.0%
65%-75% 5.5% 7.9% 10.0% 11.4% 11.1% 6.5% 2.8% 0.2% 0.0%
75%-85% 5.6% 7.4% 9.4% 11.5% 14.8% 16.2% 14.1% 6.3% 1.9%
85%-95% 4.6% 7.2% 8.7% 10.0% 14.3% 18.7% 22.6% 26.7% 25.2%
95%-105% 4.1% 5.4% 6.3% 7.9% 13.1% 15.3% 20.9% 33.2% 44.3%
105%-115% 3.4% 4.8% 5.3% 6.9% 9.0% 11.3% 14.0% 21.1% 23.0%
115%-125% 3.1% 4.3% 4.2% 4.9% 6.1% 8.0% 10.7% 8.6% 5.1%
125%-135% 3.4% 3.4% 3.8% 4.6% 4.5% 5.9% 7.1% 2.9% 0.5%
135%-145% 2.7% 2.5% 2.8% 4.1% 4.1% 4.2% 3.5% 0.7% 0.0%
145%-155% 2.4% 2.2% 2.1% 3.2% 3.3% 3.8% 2.1% 0.2% 0.0%
155%-165% 1.7% 2.0% 2.3% 3.0% 3.0% 3.2% 1.4% 0.0% 0.0%
165%-175% 1.8% 1.9% 2.0% 1.9% 2.0% 2.2% 0.5% 0.0% 0.0%
175%-185% 1.7% 1.6% 2.3% 1.2% 1.4% 1.2% 0.2% 0.0% 0.0%
185%-195% 1.8% 1.6% 1.6% 0.8% 0.8% 1.2% 0.1% 0.0% 0.0%
195%-205% 1.0% 1.3% 1.4% 0.7% 0.9% 0.3% 0.0% 0.0% 0.0%
205%-215% 0.8% 1.4% 1.9% 0.4% 1.2% 0.2% 0.0% 0.0% 0.0%
215%-225% 0.7% 0.9% 1.1% 0.6% 1.3% 0.3% 0.0% 0.0% 0.0%
225%-235% 0.6% 0.8% 1.2% 1.0% 1.5% 0.1% 0.0% 0.0% 0.0%
235%-999% 34.8% 23.6% 16.6% 13.7% 3.1% 0.3% 0.0% 0.0% 0.0%
CREDIBILITY
as # of Claim $
with experience 12.0% 17.3% 20.3% 24.8% 36.4% 45.3% 57.4% 81.0% 92.5%
within +/- 15%
of expected rates
as # of Claim $
with experience 20.6% 29.0% 33.9% 41.3% 57.2% 69.5% 82.2% 95.9% 99.5%
within +/- 25%
of expected rates
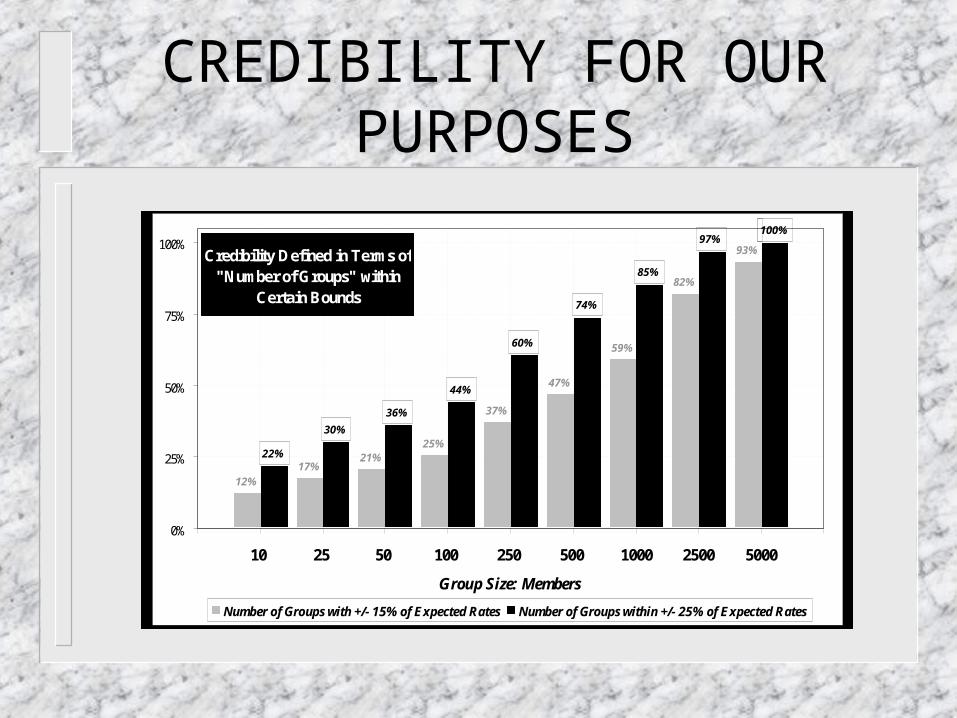
CREDIBILITY FOR OUR PURPOSES
12%17%
21%25%
37%
47%
59%
82%
93%
22%
30%
36%
44%
60%
74%
85%
97%100%
0%
25%
50%
75%
100%
10 25 50 100 250 500 1000 2500 5000
Group Size: Members
Number of Groups with +/- 15% of Expected Rates Number of Groups within +/- 25% of Expected Rates
Credibility Defined in Terms of "Number of Groups" within
Certain Bounds

CREDIBILITY FOR OUR PURPOSES
12%17%
20%25%
36%
45%
57%
81%
93%
21%
29%34%
41%
57%
70%
82%
96%100%
0%
25%
50%
75%
100%
10 25 50 100 250 500 1000 2500 5000
Group Size: Members
Amount of Claim $ with +/- 15% of Expected Rates Amount of Claim $ within +/- 25% of Expected Rates
Credibility Defined in Terms of "Amount of Claim $" within
Certain Bounds
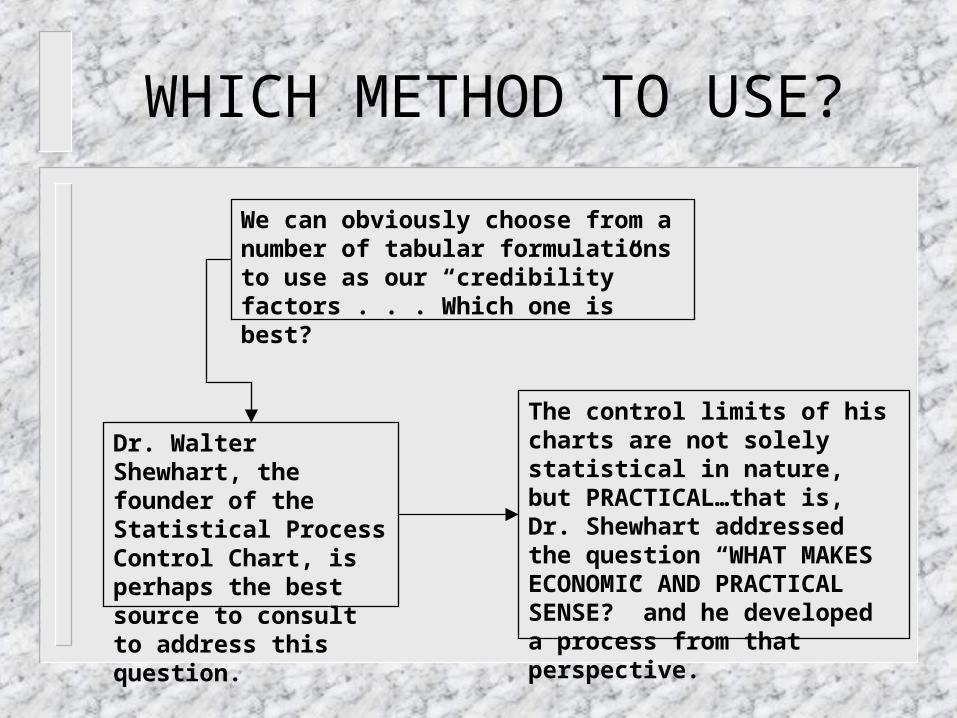
WHICH METHOD TO USE?
We can obviously choose from a number of tabular formulations to use as our “credibility” factors . . . Which one is best?
Dr. Walter Shewhart, the founder of the Statistical Process Control Chart, is perhaps the best source to consult to address this question.
The control limits of his charts are not solely statistical in nature, but PRACTICAL…that is, Dr. Shewhart addressed the question “WHAT MAKES ECONOMIC AND PRACTICAL SENSE?” and he developed a process from that perspective.

THE ANSWER?
What tabular selection is best? Which should be used in the adjustment of data?
WHICHEVER METHOD IS BEST FOR YOU IN YOUR MARKET DEALING WITH THE PEOPLE IN YOUR MARKET AND THE COMPETITION IN YOUR MARKET.`
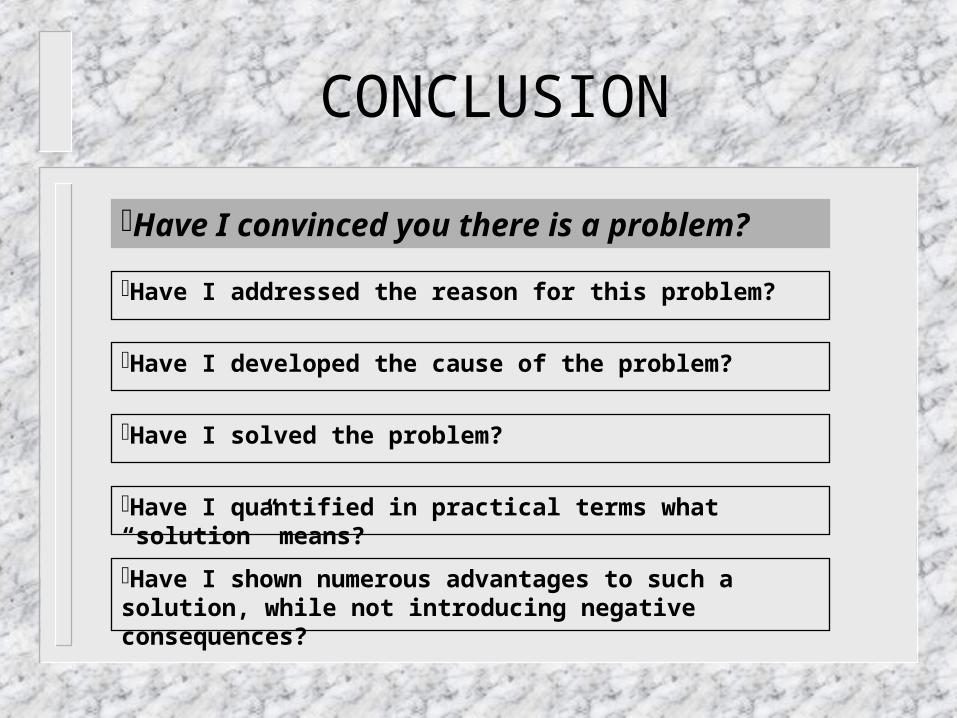
CONCLUSION
Have I convinced you there is a problem?
Have I addressed the reason for this problem?
Have I developed the cause of the problem?
Have I solved the problem?
Have I quantified in practical terms what “solution” means?
Have I shown numerous advantages to such a solution, while not introducing negative consequences?
Related Documents