1 WWC Intervention Report The Creative Curriculum ® for Preschool August 2009 What Works Clearinghouse WWC Intervention Report U.S. DEPARTMENT OF EDUCATION 1. The descriptive information for this program was obtained from a publicly available source: the program’s website (http://www.teachingstrategies.com/page/ CCPS_Overview.cfm, downloaded July 2009). The WWC requests developers to review the program description sections for accuracy from their perspective. Further verification of the accuracy of the descriptive information for this program is beyond the scope of this review. 2. The studies in this report were reviewed using WWC Evidence Standards, Version 1.0 (see the WWC Standards). 3. The evidence presented in this report is based on available research. Findings and conclusions may change as new research becomes available. 4. These numbers show the average and range of student-level improvement indices for all findings across the studies. The Creative Curriculum ® was found to have no discernible effects on oral language, print knowledge, phonological processing, or math. Oral language Print knowledge Phonological processing Early reading and writing Cognition Math Rating of effectiveness No discernible effects No discernible effects No discernible effects na na No discernible effects Improvement index 4 Average: +3 percentile points Average: +3 percentile points Average: –2 percentile points na na Average: +4 percentile points Range: –6 to +9 percentile points Range: –7 to +8 percentile points Range: –4 to +1 percentile points Range: –5 to +8 percentile points na = not applicable The Creative Curriculum ® for Preschool is a project-based early childhood curriculum designed to foster the development of the whole child through teacher-led small and large group activities. The curriculum provides information on child development, working with families, and organizing the classroom around 11 interest areas. Child assessments are an ongoing part of the curriculum, and an online program provides record-keeping tools to assist teachers with the maintenance and organization of child portfolios, individualized planning, and report production. One study of The Creative Curriculum ® meets What Works Clearinghouse (WWC) evidence standards, and two studies meet WWC evidence standards with reservations. The three studies included a total of 844 children from 101 classrooms in more than 88 preschools located in Tennessee, North Carolina, and Georgia. 3 Based on these three studies, the WWC considers the extent of evidence for The Creative Curriculum ® to be medium to large for oral language, print knowledge, phonological processing, and math. No studies that meet WWC evidence standards with or without reservations examined the effectiveness of The Creative Curriculum ® in the early reading and writing or cognition domains. Effectiveness Research 2 Program Description 1 The Creative Curriculum ® for Preschool Early Childhood Education August 2009

Creative Curriculum
Dec 22, 2015
psychology
Welcome message from author
This document is posted to help you gain knowledge. Please leave a comment to let me know what you think about it! Share it to your friends and learn new things together.
Transcript

1WWC Intervention Report The Creative Curriculum® for Preschool August 2009
What Works ClearinghouseWWC Intervention Report U.S. DEPARTMENT OF EDUCATION
1. The descriptive information for this program was obtained from a publicly available source: the program’s website (http://www.teachingstrategies.com/page/CCPS_Overview.cfm, downloaded July 2009). The WWC requests developers to review the program description sections for accuracy from their perspective. Further verification of the accuracy of the descriptive information for this program is beyond the scope of this review.
2. The studies in this report were reviewed using WWC Evidence Standards, Version 1.0 (see the WWC Standards).3. The evidence presented in this report is based on available research. Findings and conclusions may change as new research becomes available.4. These numbers show the average and range of student-level improvement indices for all findings across the studies.
The Creative Curriculum® was found to have no discernible effects on oral language, print knowledge, phonological processing,
or math.
Oral languagePrint knowledge
Phonological processing
Early reading and writing Cognition Math
Rating of effectiveness
No discernible effects
No discernible effects
No discernible effects
na na No discernible effects
Improvement index4
Average: +3 percentile points
Average: +3 percentile points
Average: –2 percentile points
na na Average: +4 percentile points
Range: –6 to +9 percentile points
Range: –7 to +8 percentile points
Range: –4 to +1 percentile points
Range: –5 to +8 percentile points
na = not applicable
The Creative Curriculum® for Preschool is a project-based early childhood curriculum designed to foster the development of the whole child through teacher-led small and large group activities. The curriculum provides information on child development, working with families, and organizing the classroom around
11 interest areas. Child assessments are an ongoing part of the curriculum, and an online program provides record-keeping tools to assist teachers with the maintenance and organization of child portfolios, individualized planning, and report production.
One study of The Creative Curriculum® meets What Works Clearinghouse (WWC) evidence standards, and two studies meet WWC evidence standards with reservations. The three studies included a total of 844 children from 101 classrooms in more than 88 preschools located in Tennessee, North Carolina, and Georgia.3
Based on these three studies, the WWC considers the extent of evidence for The Creative Curriculum® to be medium to large for oral language, print knowledge, phonological processing, and math. No studies that meet WWC evidence standards with or without reservations examined the effectiveness of The Creative Curriculum® in the early reading and writing or cognition domains.
Effectiveness
Research2
Program Description1
The Creative Curriculum® for Preschool Early Childhood Education August 2009

2The Creative Curriculum® for Preschool August 2009WWC Intervention Report
Additional program information
The PCER Consortium (2008) study summarized in this inter-
vention report had numerous contributors, including staff of
Mathematica Policy Research, Inc. (MPR). Because the principal
investigator for the WWC Early Childhood Education review is
also an MPR staff member, the study was rated by Chesapeake
Research Associates, who also prepared the intervention report.
The report was then reviewed by the principal investigator, a
WWC Quality Assurance reviewer, and an external peer reviewer.
Developer and contactDeveloped by Diane Trister Dodge, Laura Colker, and Cate Hero-
man, The Creative Curriculum® is distributed by Teaching Strate-
gies, Inc. Address: 7101 Wisconsin Ave., Suite 700, Bethesda, MD
20814. Email: [email protected]. Web:
http://www.teachingstrategies.com/. Telephone: (800) 637-3652.
Scope of useNo information on the scope of use or the demographic charac-
teristics of program users is available.
TeachingThe Creative Curriculum® is an early childhood curriculum
designed to foster children’s social/emotional, physical, cogni-
tive, and language development and to enhance learning in liter-
acy, math, science, social studies, the arts, and technology. The
curriculum includes information on children’s development and
learning, classroom organization and structure, teaching strate-
gies, instructional goals and objectives, and guidance on how to
engage families in their children’s learning. Intentional, teacher-
guided learning experiences are provided in large and small
group settings. Children are offered learning opportunities in the
following interest areas: blocks, dramatic play, toys and games,
art, library, discovery, sand and water, music and movement,
cooking, computers, and outdoors. The curriculum describes
the learning that occurs through play in each area, the cor-
responding stages of play, and teacher interactions to promote
and scaffold children’s learning. The curriculum incorporates the
use of “studies,” which are project-based investigations focused
on meaningful science and social studies topics that provide
children with an opportunity to apply skills in literacy, math, the
arts, and technology. The Creative Curriculum® also emphasizes
the use of ongoing, observation-based child assessments to
help guide instruction. CreativeCurriculum.net is a web-based
application that enables teachers to link curriculum and assess-
ment and streamline the assessment process. Adaptations in all
resources are suggested for children with disabilities and dual
language learners. In addition to the general curriculum guide,
separate literacy, mathematics, and science and social studies
guides can be purchased, and implementation and evaluation
guidance and professional development services are available.
CostThe curriculum materials can be purchased separately depend-
ing on program needs with prices ranging from $12.95 for an
individual Study Starter to $49.95 for The Creative Curriculum®
for Preschool, 4th edition. Preschool assessment materials cost
$114.95 for 25 children. The Creative Curriculum® does not require
any special materials or manipulatives other than those that may
be found in most well-equipped preschool classrooms; however,
a series of literacy and mathematics kits containing materials that
align with curriculum activities are available for $499.95 each.
Teaching Strategies also offers The Creative Curriculum®
Classroom Resource Kit, which provides all the resources
necessary to implement the program in a classroom. The kit
contains the following materials: The Creative Curriculum® for
Preschool (2 copies), The Creative Curriculum® for Preschool
in Action DVD (1 copy), The Creative Curriculum® for Preschool
Implementation Checklist (1 copy), Setting Up a Classroom for
20 Preschool Children® (1 copy), The Creative Curriculum for
Preschool Developmental Continuum Assessment Toolkit for
Ages 3–5® (1 toolkit), 20 subscriptions to CreativeCurriculum.
net, The Power of Observation, 2nd edition (1 copy), Literacy:
The Creative Curriculum® Approach (1 copy), Mathematics:
Absence of conflict of interest
3The Creative Curriculum® for Preschool August 2009WWC Intervention Report
Additional program information (continued)
Research
The Creative Curriculum Approach® (1 copy), The Creative Cur-
riculum® Study Starters: A Step-by-Step Guide to Project-Based
Investigations in Science and Social Studies (complete set of 12
topics and the Teacher’s Guide), Using The Creative Curriculum®
LearningGames With Families: A Teacher’s Guide (1 copy), A
Parent’s Guide to Preschool (2 sets with 10 copies in each set),
Reading Right from the Start (2 sets with 10 copies in each set),
The Creative Curriculum® LearningGames® 48–60 months (1 set
containing 20 copies). The kit costs $1,595. Professional devel-
opment costs vary depending on the type of service provided.
Eight studies reviewed by the WWC investigated the effects
of The Creative Curriculum®. One study (Chapter 3 in PCER
Consortium, 2008) was a randomized controlled trial that meets
WWC evidence standards. One study (Chapter 2 in PCER
Consortium, 2008) used a randomized controlled trial design that
had nonrandom allocations after random assignment, but the
analytic groups were shown to be equivalent, so the study meets
WWC evidence standards with reservations. One study (Henry
et al., 2004) is a quasi-experimental design in which the analytic
groups were shown to be equivalent, so the study meets WWC
evidence standards with reservations. The remaining five studies
do not meet WWC evidence standards.
Meets evidence standards PCER Consortium [Chapter 3] (2008) conducted a randomized
controlled trial of teachers and children in five Head Start centers
in North Carolina and Georgia.5 Randomization of teachers was
conducted in the pilot year. Twenty teachers were blocked on
education and teacher certification status and then randomly
assigned equally to treatment or control. Eighteen of the class-
rooms were maintained during the evaluation year. Then, children
within a center were sorted into blocks based on gender, dis-
ability status, and ethnicity and randomly assigned to treatment
or control classrooms. Each of the five participating Head Start
centers included both treatment and control classrooms. Data
were collected for 171 children (90 Creative Curriculum® and 81
control). The study investigated effects on oral language, print
knowledge, phonological processing, and math. The control
condition consisted of teacher-developed, nonspecific curricula
with a focus on basic school readiness. The study reported chil-
dren’s outcomes in the spring of the preschool year and again at
the end of kindergarten.
Meets evidence standards with reservationsPCER Consortium [Chapter 2] (2008) assessed the effective-
ness of The Creative Curriculum® as part of the PCER effort.
This study of 28 preschools in Tennessee was a randomized
controlled trial with severe attrition. In the pilot year, 36 full-day
preschool classrooms were sorted into blocks based on demo-
graphic and achievement characteristics and then randomly
assigned to The Creative Curriculum®, to Bright Beginnings, or to
the control group. Also in the pilot year, 21 of the 36 classrooms
(7 from each group) were randomly selected to become part of
the PCER study in the following year. After the pilot year, 8 class-
rooms from the PCER study dropped out. Eight classrooms were
randomly selected from the local study classrooms to replace
those that had dropped out, bringing the total to 7 classrooms
per group again for the PCER evaluation (7 Creative Curriculum®
and 7 control). The study investigated effects on oral language,
print knowledge, phonological processing, and math. The WWC
based its effectiveness ratings on findings from comparisons
of 93 students who received The Creative Curriculum® and
100 control group students who received teacher-developed,
nonspecific curricula with a focus on basic school readiness.
The study demonstrated the baseline equivalence of the
outcome measures for the analytic sample of intervention and
5. The study was part of the Preschool Curriculum Evaluation Research Consortium (2008) that evaluated a total of 14 preschool curricula, including The Creative Curriculum®, in comparison to the respective control conditions.
4The Creative Curriculum® for Preschool August 2009WWC Intervention Report
Research (continued)
FindingsThe WWC review of interventions for Early Childhood Education
addresses child outcomes in six domains: oral language, print
knowledge, phonological processing, early reading and writing,
cognition, and math. The studies included in this report cover
four domains: oral language, print knowledge, phonological
processing, and math. The findings below present the authors’
estimates and WWC-calculated estimates of the size and the
statistical significance of the effects of The Creative Curriculum®
on children.8
Oral language. Three studies presented findings in the oral lan-
guage domain. PCER Consortium [Chapter 3] (2008) analyzed the
effectiveness of The Creative Curriculum® on oral language using
the Peabody Picture Vocabulary Test–III (PPVT-III) and the Test
of Language Development–Primary: III (TOLD-P:3). The authors
report, and the WWC confirms, that differences between The
Creative Curriculum® group and the control group are not statisti-
cally significant or substantively important (that is, an effect size
of at least 0.25) on either of these measures. According to WWC
criteria, the study shows indeterminate effects on oral language.
PCER Consortium [Chapter 2] (2008) examined the effective-
ness of The Creative Curriculum® on oral language using the
PPVT-III and the TOLD-P:3. The authors report, and the WWC
confirms, that differences between The Creative Curriculum®
group and the control group are not statistically significant or
substantively important (that is, an effect size of at least 0.25)
Effectiveness
control group children. The study reported students’ outcomes
in the spring of the preschool year and again at the end of
kindergarten.
Henry et al. (2004) conducted a quasi-experimental design
study that compared 482 children in 69 state prekindergarten,
Head Start, and private preschool program classrooms in Georgia
that were using The Creative Curriculum® or another curriculum
(High/Scope, High Reach, or a different curriculum).6 The study
investigated effects on oral language, print knowledge, and math.
The baseline intervention and comparison groups were equivalent
on the achievement measures in the fall. The study reported
students’ outcomes in the spring of the preschool year.
Extent of evidenceThe WWC categorizes the extent of evidence in each domain as
small or medium to large (see the WWC Procedures and Standards
Handbook, Appendix G). The extent of evidence takes into account
the number of studies and the total sample size across the studies
that meet WWC evidence standards with or without reservations.7
The WWC considers the extent of evidence for The Creative
Curriculum® to be medium to large for oral language, print
knowledge, phonological processing, and math. No studies that
meet WWC evidence standards with or without reservations
examined the effectiveness of The Creative Curriculum® in the
early reading and writing or the cognition domains.
6. To calculate effects of The Creative Curriculum®, the WWC aggregated means and standard deviations across three comparison curricula: High/Scope, High Reach, and other.
7. The extent of evidence categorization was developed to tell readers how much evidence was used to determine the intervention rating, focusing on the number and size of studies. Additional factors associated with a related concept—external validity, such as the students’ demographics and the types of settings in which studies took place—are not taken into account for the categorization. Information about how the extent of evidence rating was determined for The Creative Curriculum® is in Appendix A6.
8. The level of statistical significance was reported by the study authors or, when necessary, calculated by the WWC to correct for clustering within class-rooms or schools and for multiple comparisons. For an explanation, see the WWC Tutorial on Mismatch. For the formulas the WWC used to calculate the statistical significance, see WWC Procedures and Standards Handbook, Appendix C for clustering and WWC Procedures and Standards Handbook, Appendix D for multiple comparisons. No correction for clustering was needed for the studies by the PCER Consortium (PCER Consortium [Chapters 2 and 3], 2008) because its analysis corrected for clustering by using HLM. A correction for clustering was needed for the Henry et al. (2004) study, so the significance levels in this report may differ from those reported in the original study. No corrections for multiple comparisons were needed in any of the studies because the findings were not statistically significant.

5The Creative Curriculum® for Preschool August 2009WWC Intervention Report
on either of these measures. According to WWC criteria, this
study shows indeterminate effects on oral language.
Henry et al. (2004) compared children in preschool classes
using The Creative Curriculum® to children in preschool classes
using High/Scope, High Reach, and several other curricula.
They report that at the end of preschool, no differences on
standardized measures in the oral language domain emerged
between children who were in preschool classrooms using
The Creative Curriculum® and children who were in preschool
classrooms using either the High Reach or the High/Scope
curriculum. Using data on PPVT-III and Oral and Written
Language Scale (OWLS) Oral Expression subtest scores at the
end of the preschool year supplied by the authors, the WWC
calculates that the differences between children in preschool
classes using The Creative Curriculum® and those in preschool
classes using other curricula are not statistically significant or
substantively important (that is, an effect size of at least 0.25).
According to WWC criteria, the study shows indeterminate
effects on oral language.
Print knowledge. Three studies presented findings in the print
knowledge domain. PCER Consortium [Chapter 3] (2008) ana-
lyzed the effectiveness of The Creative Curriculum® on the Test
of Early Reading Ability (TERA-3), the Woodcock-Johnson–III
(WJ-III) Letter-Word Identification subtest, and the WJ-III Spelling
subtest. The authors report, and the WWC confirms, that differ-
ences between The Creative Curriculum® and control groups are
not statistically significant or large enough to be substantively
important on any of these measures. According to WWC criteria,
this study shows indeterminate effects on print knowledge.
PCER Consortium [Chapter 2] (2008) examined the effective-
ness of The Creative Curriculum® on the TERA-3, the WJ-III
Letter-Word Identification subtest, and the WJ-III Spelling
subtest. The authors report, and the WWC confirms, that differ-
ences between The Creative Curriculum® and control groups are
not statistically significant or large enough to be substantively
important on any of these measures. According to WWC criteria,
the study shows indeterminate effects on print knowledge.
Henry et al. (2004) compared children in preschool classes
using The Creative Curriculum® to children in preschool classes
using High/Scope, High Reach, and several other curricula. They
report that at the end of preschool, no differences in the print
knowledge domain emerged between children who were in pre-
school classrooms using The Creative Curriculum® and children
who were in preschool classrooms using either the High Reach
or the High/Scope curriculum. Using data on WJ-III Letter-Word
Identification subtest scores at the end of the preschool year
supplied by the authors, the WWC calculates that the difference
between children in preschool classes using The Creative Cur-
riculum® and those in preschool classes using other curricula is
not statistically significant or substantively important (that is, an
effect size of at least 0.25). According to WWC criteria, the study
shows indeterminate effects on print knowledge.
Phonological processing. Two studies presented findings in
the phonological processing domain. PCER Consortium [Chapter
3] (2008) analyzed the effectiveness of The Creative Curriculum®
on phonological processing using the Preschool Comprehensive
Test of Phonological and Print Processing (Pre-CTOPPP) Elision
subtest. The authors report, and the WWC confirms, that differ-
ences between The Creative Curriculum® and control groups
are not statistically significant or substantively important on this
measure. According to WWC criteria, this study shows indeter-
minate effects on phonological processing.
PCER Consortium [Chapter 2] (2008) also analyzed the effec-
tiveness of The Creative Curriculum® on phonological process-
ing using the Pre-CTOPPP Elision subtest. The authors report,
and the WWC confirms, that differences between The Creative
Curriculum® and control groups are not statistically significant
or substantively important on this measure. According to WWC
criteria, this study shows indeterminate effects on phonological
processing.
Math. Three studies presented findings in the math domain.
PCER Consortium [Chapter 3] (2008) analyzed the effectiveness
of The Creative Curriculum® on math using the WJ-III Applied
Problems subtest, the Child Math Assessment–Abbreviated, and
Effectiveness (continued)

6The Creative Curriculum® for Preschool August 2009WWC Intervention Report
Effectiveness (continued) the Shape Composition task. The authors report, and the WWC
confirms, that differences between The Creative Curriculum® and
control groups are not statistically significant or large enough to
be substantively important on any of these measures. According
to WWC criteria, this study shows indeterminate effects on math.
PCER Consortium [Chapter 2] (2008) also examined the
effectiveness of The Creative Curriculum® on math using the
WJ-III Applied Problems subtest, the Child Math Assessment–
Abbreviated, and Shape Composition task. The authors report,
and the WWC confirms, that differences between The Creative
Curriculum® and control groups are not statistically significant
or large enough to be substantively important on any of these
measures. According to WWC criteria, this study shows indeter-
minate effects on math.
Henry et al. (2004) compared children in preschool classes
using The Creative Curriculum® to children in preschool classes
using High/Scope, High Reach, and several other curricula.
They report that at the end of preschool, no differences in the
math domain emerged between children who were in preschool
classrooms using The Creative Curriculum® and children who
were in preschool classrooms using either the High Reach or
the High/Scope curriculum. Using data on the WJ-III Applied
Problems subtest scores at the end of the preschool year sup-
plied by the authors, the WWC calculates that the difference
between children in preschool classes using The Creative Cur-
riculum® and those in preschool classes using other curricula is
not statistically significant or substantively important (that is, an
effect size of at least 0.25). According to WWC criteria, the study
shows indeterminate effects on math.
Rating of effectivenessThe WWC rates the effects of an intervention in a given
outcome domain as positive, potentially positive, mixed, no
discernible effects, potentially negative, or negative. The rating
of effectiveness takes into account four factors: the quality of
the research design, the statistical significance of the findings
(as calculated by the WWC), the size of the difference between
participants in the intervention and the comparison conditions,
and the consistency in findings across studies (see the WWC
Procedures and Standards Handbook, Appendix E).
Improvement indexThe WWC computes an improvement index for each individual
finding. In addition, within each outcome domain, the WWC
computes an average improvement index for each study and an
average improvement index across studies (see WWC Procedures
and Standards Handbook, Appendix F). The improvement index
represents the difference between the percentile rank of the aver-
age student in the intervention condition and the percentile rank of
the average student in the comparison condition. Unlike the rating
of effectiveness, the improvement index is entirely based on the
size of the effect, regardless of the statistical significance of the
effect, the study design, or the analysis. The improvement index
can take on values between –50 and +50, with positive numbers
denoting favorable results for the intervention group.
Based on three studies, the average improvement index for
The Creative Curriculum® for three measures of oral language
across three studies is +3 percentile points with a range of –6 to
+9 percentile points across findings. The average improvement
index for three measures of print knowledge is +3 percentile
points across three studies, with a range of –7 to +8 percentile
points across findings. Based on two studies, the average
improvement index for The Creative Curriculum® on one mea-
sure of phonological processing is –2 percentile points, with a
range of –4 to +1 percentile points across findings. The average
improvement index across three studies for three measures of
math is +4 percentile points, with a range of –5 to +8 percentile
points across findings.
The WWC found The Creative Curriculum® to have no
discernible effects on oral language, print knowledge,
phonological processing, and math

7The Creative Curriculum® for Preschool August 2009WWC Intervention Report
References
SummaryThe WWC reviewed eight studies of The Creative Curriculum®.
One of these studies meets WWC evidence standards, and two
of these studies meet WWC evidence standards with reserva-
tions. Five studies do not meet either WWC evidence standards
or eligibility screens. Based on the three studies, the WWC
found no discernible effects of The Creative Curriculum® on oral
language, print knowledge, phonological processing, and math.
The conclusions presented in this report may change as new
research emerges.
Meets WWC evidence standardsPreschool Curriculum Evaluation Research (PCER) Consortium.
(2008). Creative Curriculum: University of North Carolina at
Charlotte. In Effects of preschool curriculum programs on
school readiness (pp. 55–64). Washington, DC: National Cen-
ter for Education Research, Institute of Education Sciences,
U.S. Department of Education.
Meets WWC evidence standards with reservationsHenry, G. T., Ponder, B. D., Rickman, D. K., Mashburn, A. J.,
Henderson, L. W., & Gordon, C. S. (2004, December). An
evaluation of the implementation of Georgia’s pre-K program:
Report of the findings from the Georgia early childhood study
(2002–03). Atlanta, GA: Georgia State University, Andrew
Young School of Policy Studies.
Additional source: Henry, G. T., Henderson, L. W., Ponder, B. D., Gordon, C. S.,
Mashburn, A. J., & Rickman, D. K. (2003, August). Report
of the findings from the early childhood study: 2001–02.
Atlanta, GA: Georgia State University, Andrew Young
School of Policy Studies.
Preschool Curriculum Evaluation Research (PCER) Consortium.
(2008). Bright Beginnings and Creative Curriculum: Vanderbilt
University. In Effects of preschool curriculum programs on
school readiness (pp. 41–54). Washington, DC: National Cen-
ter for Education Research, Institute of Education Sciences,
U.S. Department of Education.
Studies that fall outside the Early Childhood Education review protocol or do not meet WWC evidence standards Abbott-Shim, M. (2000, October). Sure Start effectiveness study:
Final report. Atlanta, GA: Report for the U.S. Department of
Defense Education Activity by Quality Assist, Inc. The study is
ineligible for review because it does not use a comparison group.
Additional source: Zigler, E. F., & Bishop-Josef, S. J. (2006). The cognitive child
versus the whole child: Lessons from 40 years of Head Start.
In D. G. Singer, R. M. Golinkoff, & K. Hirsh-Pasek (Eds.),
Play = learning: How play motivates and enhances children’s
cognitive and social-emotional growth (pp. 15–35). New York:
Oxford University Press.
Gomby, D., Spiker, D., Golan, S., Zercher, C., Daniels, M., &
Quirk, K. (2005). Los Angeles County Vaughn Next Century
Learning Center. Supporting literacy: Curriculum, technology,
parents, and experts. In Case studies of the First 5 School
Readiness Initiative. Promising programs and practices: A
focus on early literacy (pp. 2-73–2-87). Santa Monica, CA:
SRI International. Retrieved from http://policyweb.sri.com/
cehs/publications/f5cslit.pdf. The study is ineligible for review
because it does not use a comparison group.
Hartford Foundation for Public Giving. (2004). Hartford children
are learning by leaps and bounds: Achievements of children
involved in Brighter Futures child care enhancement project.
Hartford, CT: Author. The study does not meet WWC evidence
standards because the measures of effect cannot be attrib-
uted solely to the intervention—the intervention was combined
with another intervention.
The WWC found The Creative Curriculum® to have no
discernible effects on oral language, print knowledge,
phonological processing, and math (continued)

8The Creative Curriculum® for Preschool August 2009WWC Intervention Report
References (continued) Lambert, R. G., Abbott-Shim, M., & Kusherman, J. The effect
of Creative Curriculum training and technical assistance on
Head Start classroom quality. Paper presented at the annual
meetings of the North Carolina Association for Research in
Education, March 30, 2006, Hickory, North Carolina, and the
American Educational Research Association, April 8, 2006,
San Francisco, California. The study is ineligible for review
because it does not include a student outcome.
Preschool Curriculum Evaluation Research (PCER) Consortium.
(2008). Creative Curriculum with Ladders to Literacy: Univer-
sity of New Hampshire. In Effects of preschool curriculum
programs on school readiness (pp. 65–73). Washington, DC:
National Center for Education Research, Institute of Education
Sciences, U.S. Department of Education. The study does not
meet WWC evidence standards because the measures of
effectiveness cannot be attributed solely to the intervention—
the intervention was combined with another intervention.

9WWC Intervention Report The Creative Curriculum® for Preschool August 2009
Appendix
Appendix A1.1 Study characteristics: Preschool Curriculum Evaluation Research Consortium, 2008 (randomized controlled trial)
Characteristic Description
Study citation Preschool Curriculum Evaluation Research (PCER) Consortium. (2008). Creative Curriculum: University of North Carolina at Charlotte. In Effects of preschool curriculum programs on school readiness (pp. 55–64). Washington, DC: National Center for Education Research, Institute of Education Sciences, U.S. Department of Education.
Participants This randomized controlled study, conducted during the 2003/04 and 2004/05 school years, included an intervention group that implemented The Creative Curriculum® and a control group that continued using the teacher-developed, nonspecific curriculum. Both teachers and children were randomized within the centers. During the pilot year, teachers were blocked on education and teacher certification status, then randomly assigned within blocks to treatment or control groups. Thus, each of the five participating Head Start centers included both The Creative Curriculum® and control classrooms. A total of 20 classrooms (10 in North Carolina and 10 in Georgia) were randomly assigned in 2002/03, the pilot year. In the following year, which was the year of the PCER study, two North Carolina classrooms were dropped because they participated in the state’s More at Four program, had degreed teachers, and had excessive teacher attrition (10% attrition at the assignment level). Children within a center were sorted into blocks based on gender, disability status, and ethnicity. They were then randomly assigned to The Creative Curriculum® or control classrooms. Participants included 18 classrooms (9 Creative Curriculum® and 9 control) and 190 children at baseline (95 Creative Curriculum® and 95 control). The spring follow-up data collection included 171 children (90 Creative Curriculum® and 81 control). Overall attrition at follow-up was 10.0%. At baseline, children in the study were 4.5 years of age on average; 46% were boys; and 85% were African-American, 8% were Hispanic, and 3% were white. Additional findings reflecting students’ outcomes at the end of kindergarten can be found in Appendices A4.1–A4.4.
Setting The Creative Curriculum® study was conducted in a total of 18 full-day Head Start preschool classrooms in five Head Start centers (three centers with 8 classrooms in North Carolina and two centers with 10 classrooms in Georgia).
Intervention The Creative Curriculum® is a comprehensive preschool curriculum for children ages 3–5. The curriculum addresses four areas of development: social/emotional, physical, cognitive, and language. The Creative Curriculum® requires the physical space of the classroom to be structured into 10 interest areas (blocks, dramatic play, toys and games, art, library, discovery, sand and water, music and movement, cooking, and computers). Curriculum content includes literacy, mathematics, science, social studies, the arts, technology, and skills such as observing, exploring, and problem solving. Teachers conduct ongoing child assessments employing a Developmental Checklist. Each classroom’s fidelity to the curriculum was rated on a four-point scale ranging from “not at all” (0) to “high” (3). The average score for The Creative Curriculum® classrooms was 2.11 on this measure.
Comparison Business-as-usual using teacher-developed, nonspecific curricula. Control teachers’ classrooms were rated with the same fidelity measure used in The Creative Curriculum® classrooms, which ranged from 0 to 3. The average score for the control classrooms using this measure was 1.5.
Primary outcomes and measurement
The outcome domains assessed were children’s oral language, print knowledge, phonological processing, and math. Oral language was assessed with the Peabody Picture Vocabulary Test–III (PPVT-III) and the Test of Language Development–Primary: III (TOLD-P:3) Grammatic Understanding subtest. Print knowledge was assessed with the Test of Early Reading Ability–III (TERA-3), the Woodcock-Johnson–III (WJ-III) Letter-Word Identification subtest, and the WJ-III Spelling subtest. Phonological processing was assessed with the Preschool Comprehensive Test of Phonological and Print Processing (Pre-CTOPPP) Elision subtest. Math was assessed with the WJ-III Applied Problems subtest, the Child Math Assessment–Abbreviated (CMA-A), and the Shape Composition task. For a more detailed description of these outcome measures, see Appendices A2.1–A2.4.
Staff/teacher training Teachers in The Creative Curriculum® treatment group were in their second year of implementing the program at the time of the evaluation. The research team provided refresher training to the treatment group teachers. Four (North Carolina) or five (Georgia) training periods were provided to teachers. Training was delivered in one half-day or one full-day session (both NC and GA teachers received the same training in total). Training topics included choosing and planning in-depth topics of study; providing materials and interactions for content learning in literacy, math, science, social studies, the arts, and technology; and observation-based assessment of children’s learning. Training included a mix of lecture, small group projects, video viewing, and hands-on practical applications. Technical assistance was provided to teachers throughout the school year.
10WWC Intervention Report The Creative Curriculum® for Preschool August 2009
Appendix A1.2 Study characteristics: Preschool Curriculum Evaluation Research Consortium, 2008 (randomized controlled trial)
Characteristic Description
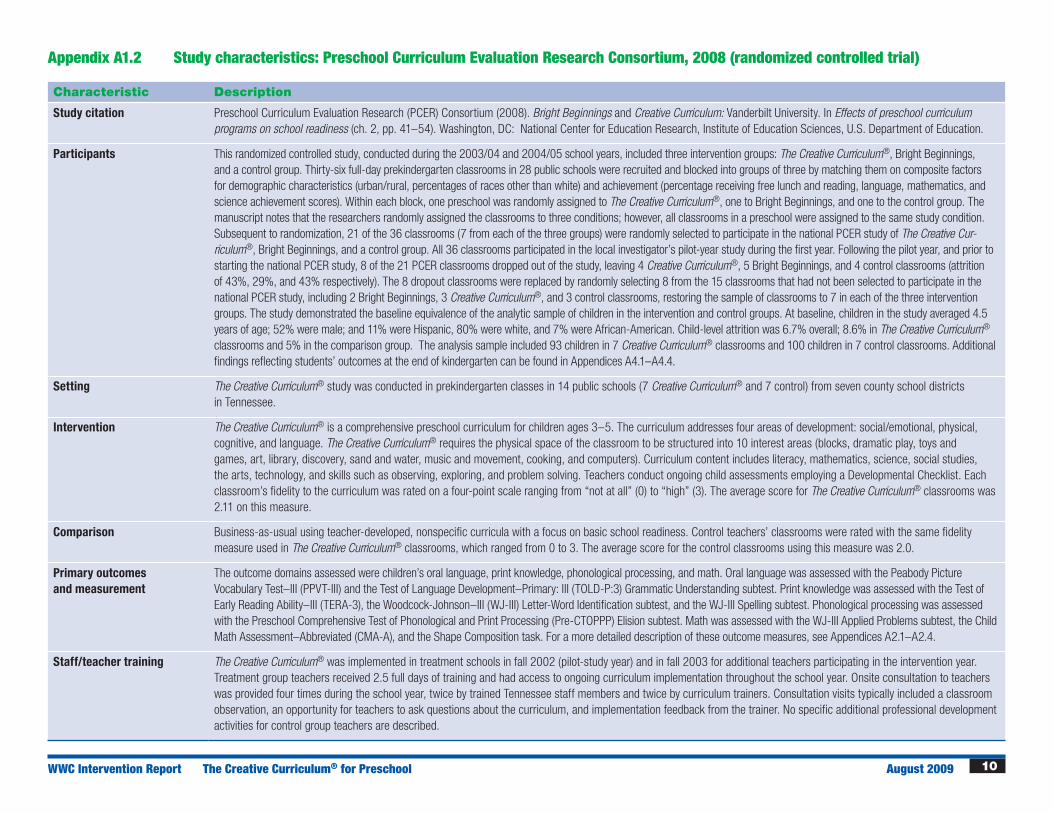
Study citation Preschool Curriculum Evaluation Research (PCER) Consortium (2008). Bright Beginnings and Creative Curriculum: Vanderbilt University. In Effects of preschool curriculum programs on school readiness (ch. 2, pp. 41–54). Washington, DC: National Center for Education Research, Institute of Education Sciences, U.S. Department of Education.
Participants This randomized controlled study, conducted during the 2003/04 and 2004/05 school years, included three intervention groups: The Creative Curriculum®, Bright Beginnings, and a control group. Thirty-six full-day prekindergarten classrooms in 28 public schools were recruited and blocked into groups of three by matching them on composite factors for demographic characteristics (urban/rural, percentages of races other than white) and achievement (percentage receiving free lunch and reading, language, mathematics, and science achievement scores). Within each block, one preschool was randomly assigned to The Creative Curriculum®, one to Bright Beginnings, and one to the control group. The manuscript notes that the researchers randomly assigned the classrooms to three conditions; however, all classrooms in a preschool were assigned to the same study condition. Subsequent to randomization, 21 of the 36 classrooms (7 from each of the three groups) were randomly selected to participate in the national PCER study of The Creative Cur-riculum®, Bright Beginnings, and a control group. All 36 classrooms participated in the local investigator’s pilot-year study during the first year. Following the pilot year, and prior to starting the national PCER study, 8 of the 21 PCER classrooms dropped out of the study, leaving 4 Creative Curriculum®, 5 Bright Beginnings, and 4 control classrooms (attrition of 43%, 29%, and 43% respectively). The 8 dropout classrooms were replaced by randomly selecting 8 from the 15 classrooms that had not been selected to participate in the national PCER study, including 2 Bright Beginnings, 3 Creative Curriculum®, and 3 control classrooms, restoring the sample of classrooms to 7 in each of the three intervention groups. The study demonstrated the baseline equivalence of the analytic sample of children in the intervention and control groups. At baseline, children in the study averaged 4.5 years of age; 52% were male; and 11% were Hispanic, 80% were white, and 7% were African-American. Child-level attrition was 6.7% overall; 8.6% in The Creative Curriculum® classrooms and 5% in the comparison group. The analysis sample included 93 children in 7 Creative Curriculum® classrooms and 100 children in 7 control classrooms. Additional findings reflecting students’ outcomes at the end of kindergarten can be found in Appendices A4.1–A4.4.
Setting The Creative Curriculum® study was conducted in prekindergarten classes in 14 public schools (7 Creative Curriculum® and 7 control) from seven county school districts in Tennessee.
Intervention The Creative Curriculum® is a comprehensive preschool curriculum for children ages 3–5. The curriculum addresses four areas of development: social/emotional, physical, cognitive, and language. The Creative Curriculum® requires the physical space of the classroom to be structured into 10 interest areas (blocks, dramatic play, toys and games, art, library, discovery, sand and water, music and movement, cooking, and computers). Curriculum content includes literacy, mathematics, science, social studies, the arts, technology, and skills such as observing, exploring, and problem solving. Teachers conduct ongoing child assessments employing a Developmental Checklist. Each classroom’s fidelity to the curriculum was rated on a four-point scale ranging from “not at all” (0) to “high” (3). The average score for The Creative Curriculum® classrooms was 2.11 on this measure.
Comparison Business-as-usual using teacher-developed, nonspecific curricula with a focus on basic school readiness. Control teachers’ classrooms were rated with the same fidelity measure used in The Creative Curriculum® classrooms, which ranged from 0 to 3. The average score for the control classrooms using this measure was 2.0.
Primary outcomes and measurement
The outcome domains assessed were children’s oral language, print knowledge, phonological processing, and math. Oral language was assessed with the Peabody Picture Vocabulary Test–III (PPVT-III) and the Test of Language Development–Primary: III (TOLD-P:3) Grammatic Understanding subtest. Print knowledge was assessed with the Test of Early Reading Ability–III (TERA-3), the Woodcock-Johnson–III (WJ-III) Letter-Word Identification subtest, and the WJ-III Spelling subtest. Phonological processing was assessed with the Preschool Comprehensive Test of Phonological and Print Processing (Pre-CTOPPP) Elision subtest. Math was assessed with the WJ-III Applied Problems subtest, the Child Math Assessment–Abbreviated (CMA-A), and the Shape Composition task. For a more detailed description of these outcome measures, see Appendices A2.1–A2.4.
Staff/teacher training The Creative Curriculum® was implemented in treatment schools in fall 2002 (pilot-study year) and in fall 2003 for additional teachers participating in the intervention year. Treatment group teachers received 2.5 full days of training and had access to ongoing curriculum implementation throughout the school year. Onsite consultation to teachers was provided four times during the school year, twice by trained Tennessee staff members and twice by curriculum trainers. Consultation visits typically included a classroom observation, an opportunity for teachers to ask questions about the curriculum, and implementation feedback from the trainer. No specific additional professional development activities for control group teachers are described.

11WWC Intervention Report The Creative Curriculum® for Preschool August 2009
Appendix A1.3 Study characteristics: Henry, Ponder, Rickman, Mashburn, Henderson, & Gordon, 2004 (quasi-experimental design)
Characteristic Description
Study citation Henry, G. T., Ponder, B. D., Rickman, D. K., Mashburn, A. J., Henderson, L. W., & Gordon, C. S. (2004). An evaluation of the implementation of Georgia’s pre-K program: Report of the findings from the Georgia early childhood study (2002–03). Atlanta, GA: Georgia State University, Andrew Young School of Policy Studies.
Participants The authors used a probability sample of children who attended prekindergarten in Georgia. To obtain a representative sample of classrooms and children, they used a four-stage sampling approach by (1) sampling counties stratified by the number of 4-year-olds; (2) sampling Georgia pre-K, Head Start, and private preschool sites within selected counties; (3) sampling classes within sites; and (4) selecting children within classes. A total of 135 sites were selected, and 126 agreed to participate. Within selected and participating classrooms, 75% of the families of children selected for the study gave consent for their children to participate. At the end of the preschool year, 482 children had both fall and spring assessments.1 The average age of children in the sample was 4.5 years; 52% were boys; and 33% were African-American, 4% were Hispanic, and 58% were white. The analysis sample included 120 children in 18 Creative Curriculum® classrooms and 362 children in 51 control classrooms.
Setting This study took place in a total of 69 full-day state preschool, Head Start, and private preschool classrooms in 69 centers or schools across Georgia.
Intervention The Creative Curriculum® is a comprehensive preschool curriculum for children ages 3–5. The curriculum addresses four areas of development: social/emotional, physical, cognitive, and language. The Creative Curriculum® requires the physical space of the classroom to be structured into 10 interest areas (blocks, dramatic play, toys and games, art, library, discovery, sand and water, music and movement, cooking, and computers). Curriculum content includes literacy, mathematics, science, social studies, the arts, technology, and skills such as observing, exploring, and problem solving. Teachers conduct ongoing child assessments employing a Developmental Checklist. Fidelity to the curriculum was not measured in this study.
Comparison Classrooms using High/Scope, High Reach, and a variety of other curricula were used as the comparison group. Fidelity to either The Creative Curriculum® or the other curricula was not measured in this study.
Primary outcomes and measurement
The outcome domains assessed at the end of preschool were children’s oral language, print knowledge, and math. Oral language was assessed with the Peabody Picture Vocabulary Test–III (PPVT-III) and the Oral and Written Language Scale (OWLS) Oral Expression subtest. Print knowledge was assessed with the Woodcock-Johnson–III (WJ-III) Letter-Word Identification subtest. Math was assessed with the WJ-III Applied Problems subtest. For a more detailed description of these outcome measures, see Appendices A2.1–A2.4.
Staff/teacher training Teachers were already using particular curricula when the study began, so they had already been trained to use them. The study provides no information on the amount of training or technical assistance teachers received in implementing particular curricula.
1. This sample size was obtained through an author query and includes children from the Georgia prekindergarten program, Head Start, and private preschools (for a discussion of this sample see Henry et al., 2003). This sample differs from that included in Henry et al. (2004), which focused solely on children from the Georgia prekindergarten program (sample size of 326 children).

12WWC Intervention Report The Creative Curriculum® for Preschool August 2009
Appendix A2.1 Outcome measures for the oral language domain
Outcome measure Description
Peabody Picture Vocabulary Test–III (PPVT-III)
A standardized measure of children’s receptive vocabulary in which children show understanding of a spoken word by pointing to a picture that best represents the meaning (as cited in PCER Consortium, 2008, and Henry et al., 2004).
Test of Language Development–Primary: III (TOLD-P:3) Gram-matic Understanding subtest
A standardized measure of children’s ability to comprehend the meaning of sentences by selecting pictures that most accurately represent the sentence (as cited in PCER Consortium, 2008).
Oral and Written Language Scales (OWLS) Oral Expression subscale
A standardized measure of children’s expressive language that requires the child to answer questions and finish sentences (as cited in Henry et al., 2004).
Appendix A2.2 Outcome measures for the print knowledge domain
Outcome measure Description
Test of Early Reading Ability–III (TERA-3)
A standardized measure of children’s developing reading skills with three subtests: Alphabet, Conventions, and Meaning (as cited in PCER Consortium, 2008).1
Woodcock Johnson–III (WJ-III) Letter-Word Identification subtest
A standardized measure of identification of letters and reading of words (as cited in PCER Consortium, 2008, and Henry et al., 2004).
Woodcock-Johnson–III (WJ-III) Spelling subtest
A standardized measure that assesses children’s prewriting skills, such as drawing lines, tracing, and writing letters (as cited in PCER Consortium, 2008).
1. By name, this measure sounds as if it should be captured under the early reading and writing domain; however, the description of the measure identifies constructs that are pertinent to print knowledge, such as knowing the alphabet, understanding print conventions, and environmental print.
Appendix A2.3 Outcome measures for the phonological domain
Outcome measure Description
Preschool Comprehensive Test of Phonological and Print Processing (Pre-CTOPPP), Elision subtest
A measure of children’s ability to identify and manipulate sounds in spoken words, using word prompts and picture plates for the first nine items and word prompts only for later items (as cited in PCER Consortium, 2008).

13WWC Intervention Report The Creative Curriculum® for Preschool August 2009
Appendix A2.4 Outcome measures for the math domain
Outcome measure Description
Woodcock-Johnson–III (WJ-III) Applied Problems subtest
A standardized measure of children’s ability to solve numerical and spatial problems, presented verbally with accompanying pictures of objects (as cited in PCER Consortium, 2008, and Henry et al., 2004).
Child Math Assessment–Abbreviated (CMA-A) composite score
The average of four subscales: (1) solving addition and subtraction problems using visible objects, (2) constructing a set of objects equal in number to a given set, (3) recognizing shapes, and (4) copying a pattern using objects that vary in color and identity from the model pattern (as cited in PCER Consortium, 2008).
Building Blocks, Shape Composition task
Modified for PCER from the Building Blocks assessment tools. Children use blocks to fill in a puzzle and are assessed on whether they fill the puzzle without gaps or hangovers (as cited in PCER Consortium, 2008).

14WWC Intervention Report The Creative Curriculum® for Preschool August 2009
Appendix A3.1 Summary of study findings included in the rating for the oral language domain1
Authors’ findings from the study
WWC calculationsMean outcome
(standard deviation)2
Outcome measureStudy
sample
Sample size (classrooms/
children)
The Creative Curriculum®
group3Comparison
group4
Mean difference5
(The Creative Curriculum®– comparison)
Effect size6
Statistical significance7
(at α = 0.05)Improvement
index8
PCER Consortium [Chapter 3], 20089
PPVT-III Preschoolers 18/165 86.64 (14.43)
85.42 (13.40)
1.22 0.08 ns +3
TOLD-P:3 Grammatic Understanding subtest
Preschoolers 18/169 7.70 (2.58)
8.44 (2.68)
–0.74 –0.16 ns –6
Average for oral language (PCER Consortium [Chapter 3], 2008)10 –0.04 na –2
PCER Consortium [Chapter 2], 20089
PPVT-III Preschoolers 14/192 98.06 (13.27)
93.93 (15.37)
4.13 0.23 ns +9
TOLD-P:3 Grammatic Understanding subtest
Preschoolers 14/193 9.44 (2.55)
9.11 (2.73)
0.33 0.07 ns +3
Average for oral language (PCER Consortium [Chapter 2], 2008)10 0.15 na +6
Henry, Ponder, Rickman, Mashburn, Henderson, and Gordon, 20049
PPVT-III Preschoolers 69/482 97.67 (14.17)
95.95 (13.78)
1.72 0.12 ns +5
OWLS Oral Expression subtest
Preschoolers 69/482 94.11 (13.96)
92.83 (13.57)
1.28 0.09 ns +4
Average for oral language (Henry et al., 2004)10 0.11 na +4
Domain average for oral language across all studies9 0.07 na +3
ns = not statistically significantna = not applicablePPVT-III = Peabody Picture Vocabulary Test–IIITOLD-P:3 = Test of Language Development–Primary-IIIOWLS = Oral and Written Language Scales
1. This appendix reports findings considered for the effectiveness rating and the average improvement indices for the oral language domain. Kindergarten follow-up findings from PCER Consortium (2008) are not included in these ratings but are reported in Appendix A4.1.
2. The standard deviation across all students in each group shows how dispersed the participants’ outcomes are: a smaller standard deviation on a given measure would indicate that participants had more similar outcomes.
(continued)

15WWC Intervention Report The Creative Curriculum® for Preschool August 2009
3. In PCER Consortium (2008), the treatment group mean equals the unadjusted control group mean and the covariate-adjusted mean difference. Standard deviations are unadjusted.4. In Henry et al. (2004), the comparison group mean equals the mean across all three alternative curriculum groups (High/Scope, High Reach, and others).5. Positive differences and effect sizes favor the intervention group; negative differences and effect sizes favor the comparison group. In the case of PCER Consortium (2008), the mean differences are covariate adjusted.6. For an explanation of the effect size calculation, see WWC Procedures and Standards Handbook, Appendix B. In the case of PCER Consortium (2008), the WWC used the effect sizes reported by the authors (Cohen’s d based on a
repeated measures analysis).7. Statistical significance is the probability that the difference between groups is a result of chance rather than a real difference between the groups. 8. The improvement index represents the difference between the percentile rank of the average student in the intervention condition and that of the average student in the comparison condition. The improvement index can take on values
between –50 and +50, with positive numbers denoting favorable results for the intervention group.9. The level of statistical significance was reported by the study authors or, when necessary, calculated by the WWC to correct for clustering within classrooms or schools and for multiple comparisons. For an explanation about the
clustering correction, see the WWC Tutorial on Mismatch. For the formulas the WWC used to calculate the statistical significance, see WWC Procedures and Standards Handbook, Appendix C for clustering and WWC Procedures and Standards Handbook, Appendix D for multiple comparisons. In the case of PCER Consortium (2008), no corrections were needed because the analysis corrected for clustering by using HLM and no impacts were statistically significant. In the case of Henry et al. (2004), the WWC corrected the mean comparisons for clustering.
10. The WWC-computed average effect sizes for each study and for the domain across studies are simple averages rounded to two decimal places. The average improvement indices are calculated from the average effect sizes.
Appendix A3.1 Summary of study findings included in the rating for the oral language domain1 (continued)
16WWC Intervention Report The Creative Curriculum® for Preschool August 2009
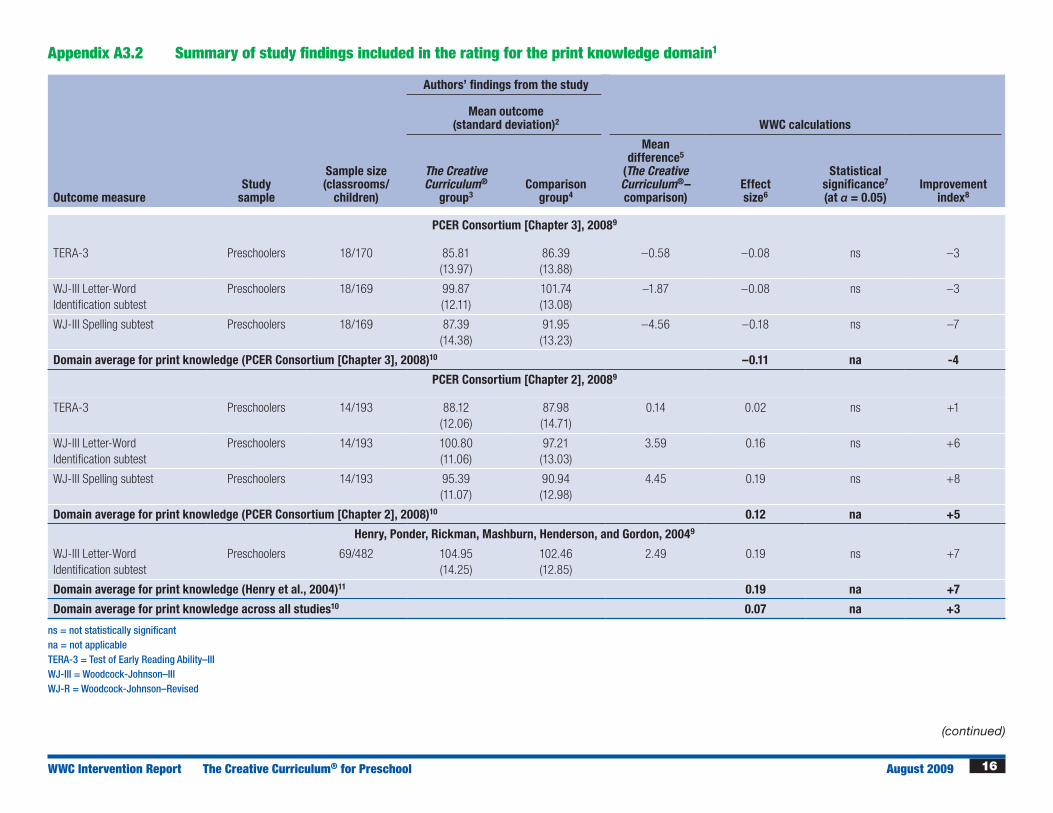
Appendix A3.2 Summary of study findings included in the rating for the print knowledge domain1
Authors’ findings from the study
WWC calculationsMean outcome
(standard deviation)2
Outcome measureStudy
sample
Sample size (classrooms/
children)
The Creative Curriculum®
group3Comparison
group4
Mean difference5
(The Creative Curriculum®–comparison)
Effect size6
Statistical significance7
(at α = 0.05)Improvement
index8
PCER Consortium [Chapter 3], 20089
TERA-3 Preschoolers 18/170 85.81 (13.97)
86.39 (13.88)
–0.58 –0.08 ns –3
WJ-III Letter-Word Identification subtest
Preschoolers 18/169 99.87 (12.11)
101.74 (13.08)
–1.87 –0.08 ns –3
WJ-III Spelling subtest Preschoolers 18/169 87.39 (14.38)
91.95 (13.23)
–4.56 –0.18 ns –7
Domain average for print knowledge (PCER Consortium [Chapter 3], 2008)10 –0.11 na -4
PCER Consortium [Chapter 2], 20089
TERA-3 Preschoolers 14/193 88.12 (12.06)
87.98 (14.71)
0.14 0.02 ns +1
WJ-III Letter-Word Identification subtest
Preschoolers 14/193 100.80 (11.06)
97.21 (13.03)
3.59 0.16 ns +6
WJ-III Spelling subtest Preschoolers 14/193 95.39 (11.07)
90.94 (12.98)
4.45 0.19 ns +8
Domain average for print knowledge (PCER Consortium [Chapter 2], 2008)10 0.12 na +5
Henry, Ponder, Rickman, Mashburn, Henderson, and Gordon, 20049
WJ-III Letter-Word Identification subtest
Preschoolers 69/482 104.95 (14.25)
102.46 (12.85)
2.49 0.19 ns +7
Domain average for print knowledge (Henry et al., 2004)11 0.19 na +7
Domain average for print knowledge across all studies10 0.07 na +3
ns = not statistically significantna = not applicableTERA-3 = Test of Early Reading Ability–IIIWJ-III = Woodcock-Johnson–IIIWJ-R = Woodcock-Johnson–Revised
(continued)

17WWC Intervention Report The Creative Curriculum® for Preschool August 2009
Appendix A3.2 Summary of study findings included in the rating for the print knowledge domain1 (continued)1. This appendix reports findings considered for the effectiveness rating and the average improvement indices for the print knowledge domain. Kindergarten follow-up findings from PCER Consortium (2008) are not included in these
ratings but are reported in Appendix A4.2. 2. The standard deviation across all students in each group shows how dispersed the participants’ outcomes are: a smaller standard deviation on a given measure would indicate that participants had more similar outcomes.3. In PCER Consortium (2008), the treatment group mean equals the unadjusted control group mean and the covariate-adjusted mean difference. Standard deviations are unadjusted.4. In Henry et al. (2004), the comparison group mean equals the mean across all three alternative curriculum groups (High/Scope, High Reach, and others).5. Positive differences and effect sizes favor the intervention group; negative differences and effect sizes favor the comparison group. In the case of PCER Consortium (2008), the mean differences are covariate adjusted.6. For an explanation of the effect size calculation, see WWC Procedures and Standards Handbook, Appendix B. In the case of PCER Consortium (2008), the WWC used the effect sizes reported by the authors (Cohen’s d based on a
repeated measures analysis).7. Statistical significance is the probability that the difference between groups is a result of chance rather than a real difference between the groups. 8. The improvement index represents the difference between the percentile rank of the average student in the intervention condition and that of the average student in the comparison condition. The improvement index can take on values
between –50 and +50, with positive numbers denoting favorable results for the intervention group.9. The level of statistical significance was reported by the study authors or, when necessary, calculated by the WWC to correct for clustering within classrooms or schools and for multiple comparisons. For an explanation about the
clustering correction, see the WWC Tutorial on Mismatch. For the formulas the WWC used to calculate the statistical significance, see WWC Procedures and Standards Handbook, Appendix C for clustering and WWC Procedures and Standards Handbook, Appendix D for multiple comparisons. In the case of PCER Consortium (2008), no corrections were needed because the analysis corrected for clustering by using HLM and no impacts were statistically significant. In the case of Henry et al. (2004), the WWC corrected the mean comparisons for clustering.
10. The WWC-computed average effect sizes for each study and for the domain across studies are simple averages rounded to two decimal places. The average improvement indices are calculated from the average effect sizes.11. This row provides the study average, which, in this instance, is also the domain average. The WWC-computed domain average effect size is a simple average rounded to two decimal places. The domain improvement index is calculated
from the average effect size.

18WWC Intervention Report The Creative Curriculum® for Preschool August 2009
Appendix A3.3 Summary of study findings included in the rating for the phonological processing domain1
Authors’ findings from the study
WWC calculationsMean outcome
(standard deviation)2
Outcome measureStudy
sample
Sample size (classrooms/
children)
The Creative Curriculum®
group3Comparison
group
Mean difference4
(The Creative Curriculum®– comparison)
Effect size5
Statistical significance6
(at α = 0.05)Improvement
index7
PCER Consortium [Chapter 3], 2008
Pre-CTOPPP Elision subtest Preschoolers 18/171 8.38 (4.08)
8.19 (4.03)
0.19 0.02 ns +1
Domain average for phonological processing (PCER Consortium [Chapter 3], 2008)8 0.02 na +1
PCER Consortium [Chapter 2], 20089
Pre-CTOPPP Elision subtest Preschoolers 14/193 10.34 (3.60)
10.38 (4.78)
–0.04 –0.10 ns –4
Domain average for phonological processing (PCER Consortium [Chapter 2], 2008) –0.10 na –4
Domain average for phonological processing across all studies8 –0.04 na –2
ns = not statistically significantna = not applicablePre-CTOPPP = Preschool Comprehensive Test of Phonological and Print Processing
1. This appendix reports findings considered for the effectiveness rating and the average improvement indices for the phonological processing domain. Kindergarten follow-up findings from PCER Consortium (2008) are not included in these ratings but are reported in Appendix A4.3.
2. The standard deviation across all students in each group shows how dispersed the participants’ outcomes are: a smaller standard deviation on a given measure would indicate that participants had more similar outcomes.3. In PCER Consortium (2008), the treatment group mean equals the unadjusted control group mean and the covariate-adjusted mean difference. Standard deviations are unadjusted.4. Positive differences and effect sizes favor the intervention group; negative differences and effect sizes favor the comparison group. In the case of PCER Consortium (2008), the mean differences are covariate adjusted.5. For an explanation of the effect size calculation, see WWC Procedures and Standards Handbook, Appendix B. In the case of PCER Consortium (2008), the WWC used the effect sizes reported by the study authors (Cohen’s d based on a
repeated measures analysis).6. Statistical significance is the probability that the difference between groups is a result of chance rather than a real difference between the groups. 7. The improvement index represents the difference between the percentile rank of the average student in the intervention condition and that of the average student in the comparison condition. The improvement index can take on values
between –50 and +50, with positive numbers denoting favorable results for the intervention group.8. This row provides the study average, which, in this instance, is also the domain average. The WWC-computed domain average effect size is a simple average rounded to two decimal places. The domain improvement index is calculated
from the average effect size.9. The level of statistical significance was reported by the study authors or, when necessary, calculated by the WWC to correct for clustering within classrooms or schools and for multiple comparisons. For an explanation about the
clustering correction, see the WWC Tutorial on Mismatch. For the formulas the WWC used to calculate the statistical significance, see WWC Procedures and Standards Handbook, Appendix C for clustering and WWC Procedures and Standards Handbook, Appendix D for multiple comparisons. In the case of PCER Consortium (2008), no corrections were needed because the analysis corrected for clustering by using HLM and no impacts were statistically significant.

19WWC Intervention Report The Creative Curriculum® for Preschool August 2009
Appendix A3.4 Summary of study findings included in the rating for the math domain1
Authors’ findings from the study
WWC calculationsMean outcome
(standard deviation)2
Outcome measureStudy
sample
Sample size (classrooms/
children)
The Creative Curriculum®
group3Comparison
group4
Mean difference5
(The Creative Curriculum®–
comparison)Effect size6
Statistical significance7
(at α = 0.05)Improvement
index8
PCER Consortium [Chapter 3], 20089
WJ-III Applied Problems subtest
Preschoolers 18/169 94.07 (12.26)
89.45 (13.75)
4.62 0.20 ns +8
CMA-A composite Preschoolers 18/170 0.42 (0.27)
0.44 (0.29)
–0.02 –0.10 ns –4
Shape Composition Preschoolers 18/169 1.42 (0.89)
1.25 (0.83)
0.17 0.19 ns +8
Domain average for math (PCER Consortium [Chapter 3], 2008)10 0.10 na +4
PCER Consortium [Chapter 2], 20089
WJ-III Applied Problems subtest
Preschoolers 14/193 100.45 (12.03)
96.48 (16.69)
3.97 0.17 ns +7
CMA-A Composite Preschoolers 14/193 0.55 (0.23)
0.53 (0.27)
0.02 0.10 ns +4
Shape Composition Preschoolers 14/193 1.74 (0.95)
1.85 (0.91)
–0.11 –0.12 ns –5
Domain average for math (PCER Consortium [Chapter 2], 2008)10 0.05 na +2
Henry, Ponder, Rickman, Mashburn, Henderson, and Gordon, 20049
WJ-III Applied Problems subtest
Preschoolers 69/482 99.48 (14.73)
96.94 (12.68)
2.54 0.19 ns +8
Domain average for math (Henry et al., 2004)11 0.19 na +8
Domain average for math across all studies10 0.11 na +4
ns = not statistically significant na = not applicable WJ-III = Woodcock-Johnson–IIICMA-A = Child Math Assessment–Abbreviated
(continued)

20WWC Intervention Report The Creative Curriculum® for Preschool August 2009
1. This appendix reports findings considered for the effectiveness rating and the average improvement indices for the math domain. Kindergarten follow-up findings from PCER Consortium (2008) are not included in these ratings but are reported in Appendix A4.4.
2. The standard deviation across all students in each group shows how dispersed the participants’ outcomes are: a smaller standard deviation on a given measure would indicate that participants had more similar outcomes.3. In PCER Consortium (2008), the treatment group mean equals the unadjusted control group mean and the covariate-adjusted mean difference. Standard deviations are unadjusted.4. In Henry et al. (2004), the comparison group mean equals the mean across all three alternative curriculum groups (High/Scope, High Reach, and others).5. Positive differences and effect sizes favor the intervention group; negative differences and effect sizes favor the comparison group. In the case of PCER Consortium (2008), the mean differences are covariate adjusted.6. For an explanation of the effect size calculation, see WWC Procedures and Standards Handbook, Appendix B. In the case of PCER Consortium (2008), the WWC used the effect sizes reported by the study authors (Cohen’s d based on a
repeated measures analysis).7. Statistical significance is the probability that the difference between groups is a result of chance rather than a real difference between the groups. 8. The improvement index represents the difference between the percentile rank of the average student in the intervention condition and that of the average student in the comparison condition. The improvement index can take on values
between –50 and +50, with positive numbers denoting favorable results for the intervention group.9. The level of statistical significance was reported by the study authors or, when necessary, calculated by the WWC to correct for clustering within classrooms or schools and for multiple comparisons. For an explanation about the
clustering correction, see the WWC Tutorial on Mismatch. For the formulas the WWC used to calculate the statistical significance, see WWC Procedures and Standards Handbook, Appendix C for clustering and WWC Procedures and Standards Handbook, Appendix D for multiple comparisons. In the case of PCER Consortium (2008), no corrections were needed because the analysis corrected for clustering by using HLM and no impacts were statistically significant. In the case of Henry et al. (2004), the WWC corrected the mean comparisons for clustering.
10. The WWC-computed average effect sizes for each study and for the domain across studies are simple averages rounded to two decimal places. The average improvement indices are calculated from the average effect sizes. 11. This row provides the study average, which, in this instance, is also the domain average. The WWC-computed domain average effect size is a simple average rounded to two decimal places. The domain improvement index is calculated
from the average effect size.
Appendix A3.4 Summary of study findings included in the rating for the math domain1 (continued)
21WWC Intervention Report The Creative Curriculum® for Preschool August 2009
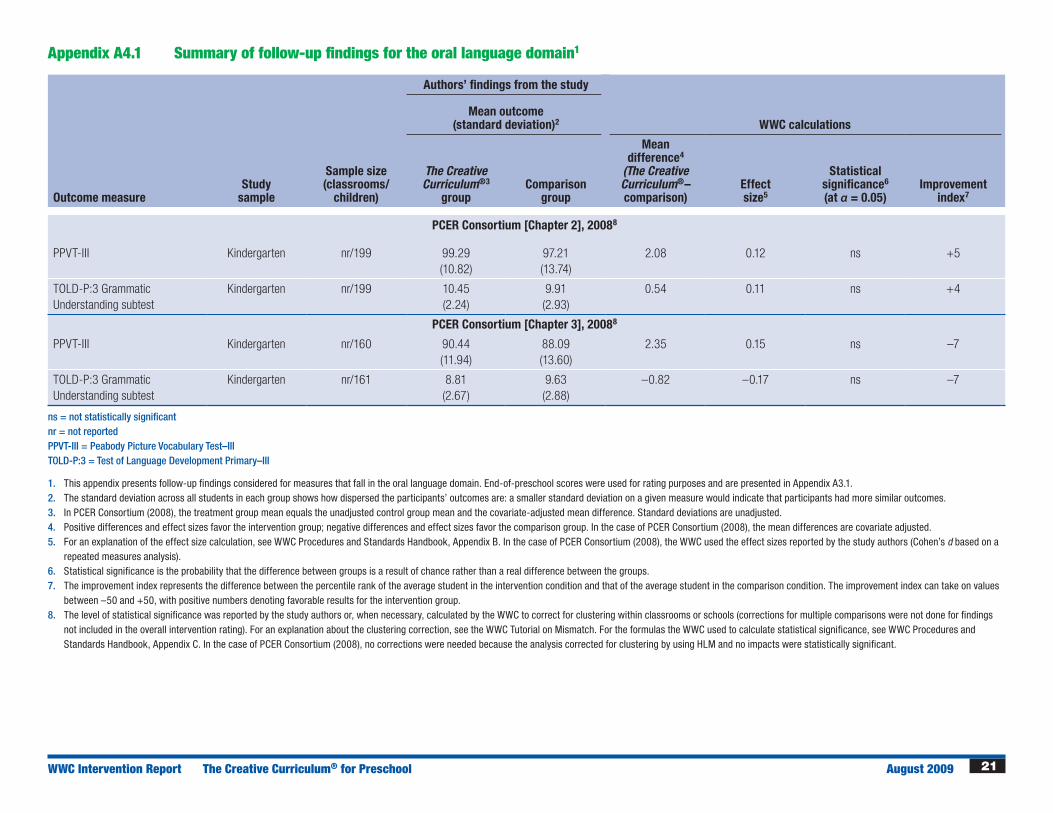
Appendix A4.1 Summary of follow-up findings for the oral language domain1
Authors’ findings from the study
WWC calculationsMean outcome
(standard deviation)2
Outcome measureStudy
sample
Sample size (classrooms/
children)
The Creative Curriculum®3
groupComparison
group
Mean difference4
(The Creative Curriculum®–comparison)
Effect size5
Statistical significance6
(at α = 0.05)Improvement
index7
PCER Consortium [Chapter 2], 20088
PPVT-III Kindergarten nr/199 99.29 (10.82)
97.21 (13.74)
2.08 0.12 ns +5
TOLD-P:3 Grammatic Understanding subtest
Kindergarten nr/199 10.45 (2.24)
9.91 (2.93)
0.54 0.11 ns +4
PCER Consortium [Chapter 3], 20088
PPVT-III Kindergarten nr/160 90.44 (11.94)
88.09 (13.60)
2.35 0.15 ns –7
TOLD-P:3 Grammatic Understanding subtest
Kindergarten nr/161 8.81 (2.67)
9.63 (2.88)
–0.82 –0.17 ns –7
ns = not statistically significantnr = not reportedPPVT-III = Peabody Picture Vocabulary Test–III TOLD-P:3 = Test of Language Development Primary–III
1. This appendix presents follow-up findings considered for measures that fall in the oral language domain. End-of-preschool scores were used for rating purposes and are presented in Appendix A3.1.2. The standard deviation across all students in each group shows how dispersed the participants’ outcomes are: a smaller standard deviation on a given measure would indicate that participants had more similar outcomes.3. In PCER Consortium (2008), the treatment group mean equals the unadjusted control group mean and the covariate-adjusted mean difference. Standard deviations are unadjusted.4. Positive differences and effect sizes favor the intervention group; negative differences and effect sizes favor the comparison group. In the case of PCER Consortium (2008), the mean differences are covariate adjusted.5. For an explanation of the effect size calculation, see WWC Procedures and Standards Handbook, Appendix B. In the case of PCER Consortium (2008), the WWC used the effect sizes reported by the study authors (Cohen’s d based on a
repeated measures analysis).6. Statistical significance is the probability that the difference between groups is a result of chance rather than a real difference between the groups. 7. The improvement index represents the difference between the percentile rank of the average student in the intervention condition and that of the average student in the comparison condition. The improvement index can take on values
between –50 and +50, with positive numbers denoting favorable results for the intervention group.8. The level of statistical significance was reported by the study authors or, when necessary, calculated by the WWC to correct for clustering within classrooms or schools (corrections for multiple comparisons were not done for findings
not included in the overall intervention rating). For an explanation about the clustering correction, see the WWC Tutorial on Mismatch. For the formulas the WWC used to calculate statistical significance, see WWC Procedures and Standards Handbook, Appendix C. In the case of PCER Consortium (2008), no corrections were needed because the analysis corrected for clustering by using HLM and no impacts were statistically significant.
22WWC Intervention Report The Creative Curriculum® for Preschool August 2009
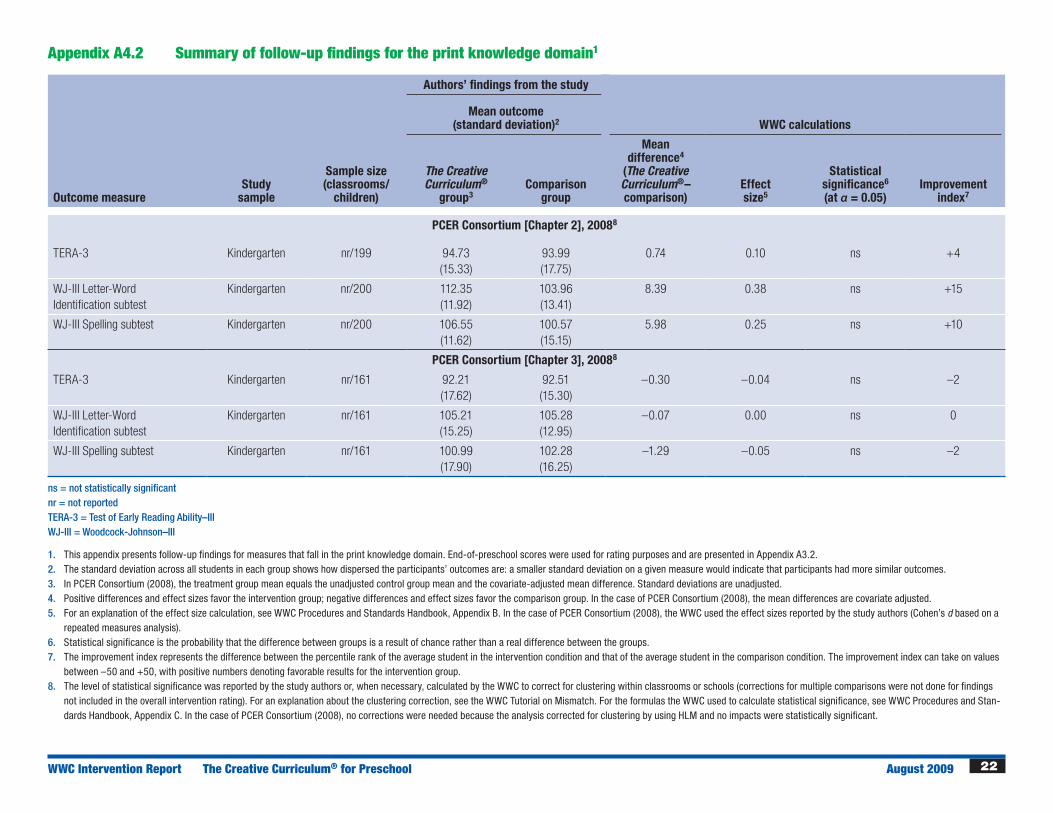
Appendix A4.2 Summary of follow-up findings for the print knowledge domain1
Authors’ findings from the study
WWC calculationsMean outcome
(standard deviation)2
Outcome measureStudy
sample
Sample size (classrooms/
children)
The Creative Curriculum®
group3Comparison
group
Mean difference4
(The Creative Curriculum®– comparison)
Effect size5
Statistical significance6
(at α = 0.05)Improvement
index7
PCER Consortium [Chapter 2], 20088
TERA-3 Kindergarten nr/199 94.73 (15.33)
93.99 (17.75)
0.74 0.10 ns +4
WJ-III Letter-Word Identification subtest
Kindergarten nr/200 112.35 (11.92)
103.96 (13.41)
8.39 0.38 ns +15
WJ-III Spelling subtest Kindergarten nr/200 106.55 (11.62)
100.57 (15.15)
5.98 0.25 ns +10
PCER Consortium [Chapter 3], 20088
TERA-3 Kindergarten nr/161 92.21 (17.62)
92.51 (15.30)
–0.30 –0.04 ns –2
WJ-III Letter-Word Identification subtest
Kindergarten nr/161 105.21 (15.25)
105.28 (12.95)
–0.07 0.00 ns 0
WJ-III Spelling subtest Kindergarten nr/161 100.99 (17.90)
102.28 (16.25)
–1.29 –0.05 ns –2
ns = not statistically significant nr = not reportedTERA-3 = Test of Early Reading Ability–III WJ-III = Woodcock-Johnson–III
1. This appendix presents follow-up findings for measures that fall in the print knowledge domain. End-of-preschool scores were used for rating purposes and are presented in Appendix A3.2.2. The standard deviation across all students in each group shows how dispersed the participants’ outcomes are: a smaller standard deviation on a given measure would indicate that participants had more similar outcomes.3. In PCER Consortium (2008), the treatment group mean equals the unadjusted control group mean and the covariate-adjusted mean difference. Standard deviations are unadjusted.4. Positive differences and effect sizes favor the intervention group; negative differences and effect sizes favor the comparison group. In the case of PCER Consortium (2008), the mean differences are covariate adjusted.5. For an explanation of the effect size calculation, see WWC Procedures and Standards Handbook, Appendix B. In the case of PCER Consortium (2008), the WWC used the effect sizes reported by the study authors (Cohen’s d based on a
repeated measures analysis).6. Statistical significance is the probability that the difference between groups is a result of chance rather than a real difference between the groups. 7. The improvement index represents the difference between the percentile rank of the average student in the intervention condition and that of the average student in the comparison condition. The improvement index can take on values
between –50 and +50, with positive numbers denoting favorable results for the intervention group.8. The level of statistical significance was reported by the study authors or, when necessary, calculated by the WWC to correct for clustering within classrooms or schools (corrections for multiple comparisons were not done for findings
not included in the overall intervention rating). For an explanation about the clustering correction, see the WWC Tutorial on Mismatch. For the formulas the WWC used to calculate statistical significance, see WWC Procedures and Stan-dards Handbook, Appendix C. In the case of PCER Consortium (2008), no corrections were needed because the analysis corrected for clustering by using HLM and no impacts were statistically significant.

23WWC Intervention Report The Creative Curriculum® for Preschool August 2009
Appendix A4.3 Summary of follow-up findings for the phonological processing domain1
Authors’ findings from the study
WWC calculationsMean outcome
(standard deviation)2
Outcome measureStudy
sample
Sample size (classrooms/
children)
The Creative Curriculum®
group3Comparison
group
Mean difference4
(The Creative Curriculum®– comparison)
Effect size5
Statistical significance6
(at α = 0.05)Improvement
index7
PCER Consortium [Chapter 2], 20088
CTOPP Elision subtest Kindergarten nr/199 4.50 (3.41)
4.30 (3.27)
0.20 0.06 ns +2
PCER Consortium [Chapter 3], 20088
CTOPP Elision subtest Kindergarten nr/161 2.68 (3.03)
2.51 (2.83)
0.17 0.06 ns +2
ns = not statistically significantnr = not reportedCTOPP = Comprehensive Test of Phonological Processing
1. This appendix presents follow-up findings for measures that fall in the phonological processing domain. End-of-preschool scores were used for rating purposes and are presented in Appendix A3.3.2. The standard deviation across all students in each group shows how dispersed the participants’ outcomes are: a smaller standard deviation on a given measure would indicate that participants had more similar outcomes.3. In PCER Consortium (2008), the treatment group mean equals the unadjusted control group mean and the covariate-adjusted mean difference. Standard deviations are unadjusted.4. Positive differences and effect sizes favor the intervention group; negative differences and effect sizes favor the comparison group. In the case of PCER Consortium (2008), the mean differences are covariate adjusted.5. For an explanation of the effect size calculation, see WWC Procedures and Standards Handbook, Appendix B. In the case of PCER Consortium (2008), the WWC used the effect sizes reported by the study authors (Cohen’s d based on
ANCOVA).6. Statistical significance is the probability that the difference between groups is a result of chance rather than a real difference between the groups. 7. The improvement index represents the difference between the percentile rank of the average student in the intervention condition and that of the average student in the comparison condition. The improvement index can take on values
between –50 and +50, with positive numbers denoting favorable results for the intervention group.8. The level of statistical significance was reported by the study authors or, when necessary, calculated by the WWC to correct for clustering within classrooms or schools (corrections for multiple comparisons were not done for findings
not included in the overall intervention rating). For an explanation about the clustering correction, see the WWC Tutorial on Mismatch. For the formulas the WWC used to calculate statistical significance, see WWC Procedures and Standards Handbook, Appendix C. In the case of PCER Consortium (2008), no corrections were needed because the analysis corrected for clustering by using HLM and no impacts were statistically significant.
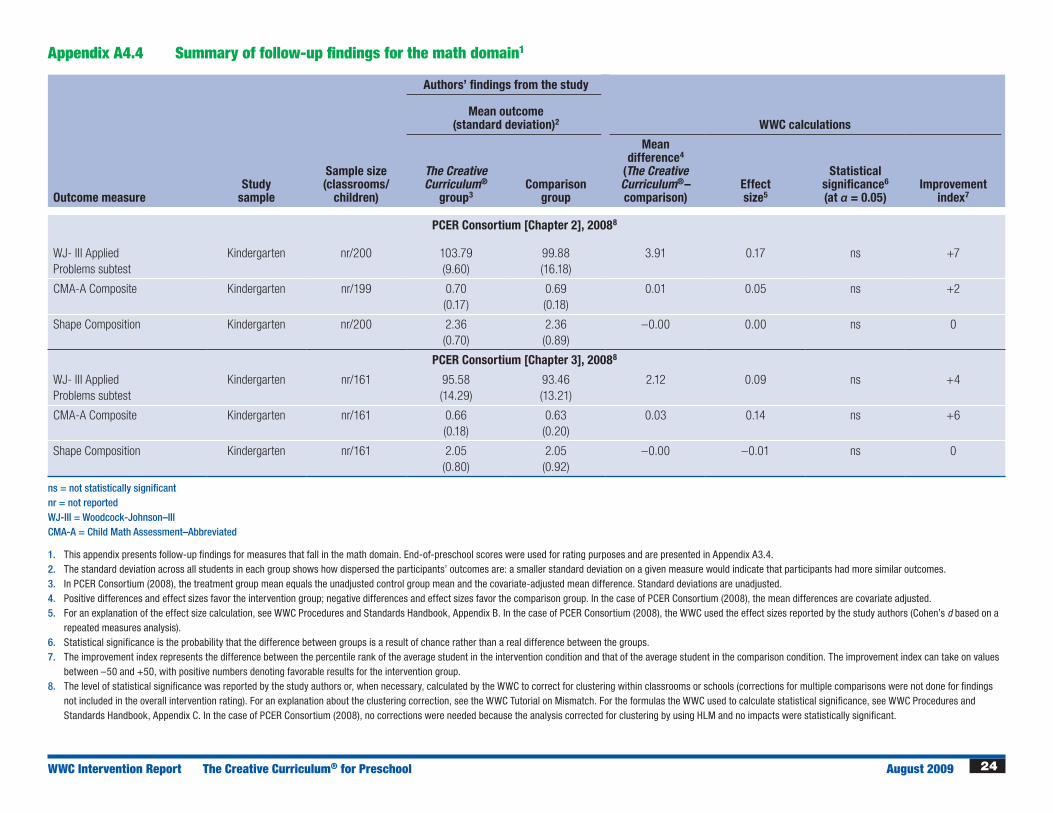
24WWC Intervention Report The Creative Curriculum® for Preschool August 2009
Appendix A4.4 Summary of follow-up findings for the math domain1
Authors’ findings from the study
WWC calculationsMean outcome
(standard deviation)2
Outcome measureStudy
sample
Sample size (classrooms/
children)
The Creative Curriculum®
group3Comparison
group
Mean difference4
(The Creative Curriculum®– comparison)
Effect size5
Statistical significance6
(at α = 0.05)Improvement
index7
PCER Consortium [Chapter 2], 20088
WJ- III Applied Problems subtest
Kindergarten nr/200 103.79 (9.60)
99.88 (16.18)
3.91 0.17 ns +7
CMA-A Composite Kindergarten nr/199 0.70 (0.17)
0.69 (0.18)
0.01 0.05 ns +2
Shape Composition Kindergarten nr/200 2.36 (0.70)
2.36 (0.89)
–0.00 0.00 ns 0
PCER Consortium [Chapter 3], 20088
WJ- III Applied Problems subtest
Kindergarten nr/161 95.58 (14.29)
93.46 (13.21)
2.12 0.09 ns +4
CMA-A Composite Kindergarten nr/161 0.66 (0.18)
0.63 (0.20)
0.03 0.14 ns +6
Shape Composition Kindergarten nr/161 2.05 (0.80)
2.05 (0.92)
–0.00 –0.01 ns 0
ns = not statistically significant nr = not reported WJ-III = Woodcock-Johnson–IIICMA-A = Child Math Assessment–Abbreviated
1. This appendix presents follow-up findings for measures that fall in the math domain. End-of-preschool scores were used for rating purposes and are presented in Appendix A3.4.2. The standard deviation across all students in each group shows how dispersed the participants’ outcomes are: a smaller standard deviation on a given measure would indicate that participants had more similar outcomes.3. In PCER Consortium (2008), the treatment group mean equals the unadjusted control group mean and the covariate-adjusted mean difference. Standard deviations are unadjusted.4. Positive differences and effect sizes favor the intervention group; negative differences and effect sizes favor the comparison group. In the case of PCER Consortium (2008), the mean differences are covariate adjusted.5. For an explanation of the effect size calculation, see WWC Procedures and Standards Handbook, Appendix B. In the case of PCER Consortium (2008), the WWC used the effect sizes reported by the study authors (Cohen’s d based on a
repeated measures analysis).6. Statistical significance is the probability that the difference between groups is a result of chance rather than a real difference between the groups. 7. The improvement index represents the difference between the percentile rank of the average student in the intervention condition and that of the average student in the comparison condition. The improvement index can take on values
between –50 and +50, with positive numbers denoting favorable results for the intervention group.8. The level of statistical significance was reported by the study authors or, when necessary, calculated by the WWC to correct for clustering within classrooms or schools (corrections for multiple comparisons were not done for findings
not included in the overall intervention rating). For an explanation about the clustering correction, see the WWC Tutorial on Mismatch. For the formulas the WWC used to calculate statistical significance, see WWC Procedures and Standards Handbook, Appendix C. In the case of PCER Consortium (2008), no corrections were needed because the analysis corrected for clustering by using HLM and no impacts were statistically significant.
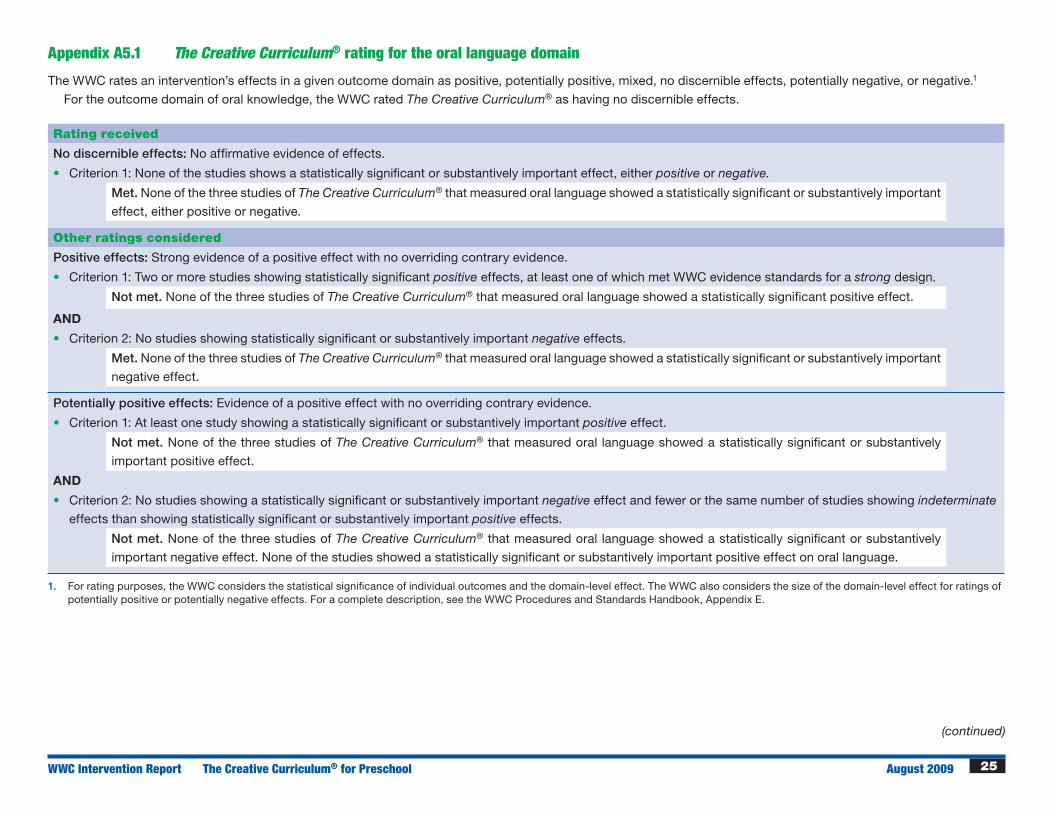
25WWC Intervention Report The Creative Curriculum® for Preschool August 2009
Appendix A5.1 The Creative Curriculum® rating for the oral language domain
The WWC rates an intervention’s effects in a given outcome domain as positive, potentially positive, mixed, no discernible effects, potentially negative, or negative.1
For the outcome domain of oral knowledge, the WWC rated The Creative Curriculum® as having no discernible effects.
Rating received
No discernible effects: No affirmative evidence of effects.
• Criterion 1: None of the studies shows a statistically significant or substantively important effect, either positive or negative.
Met. None of the three studies of The Creative Curriculum® that measured oral language showed a statistically significant or substantively important
effect, either positive or negative.
Other ratings considered
Positive effects: Strong evidence of a positive effect with no overriding contrary evidence.
• Criterion 1: Two or more studies showing statistically significant positive effects, at least one of which met WWC evidence standards for a strong design.
Not met. None of the three studies of The Creative Curriculum® that measured oral language showed a statistically significant positive effect.
anD
• Criterion 2: No studies showing statistically significant or substantively important negative effects.
Met. None of the three studies of The Creative Curriculum® that measured oral language showed a statistically significant or substantively important
negative effect.
Potentially positive effects: Evidence of a positive effect with no overriding contrary evidence.
• Criterion 1: At least one study showing a statistically significant or substantively important positive effect.
Not met. None of the three studies of The Creative Curriculum® that measured oral language showed a statistically significant or substantively
important positive effect.
anD
• Criterion 2: No studies showing a statistically significant or substantively important negative effect and fewer or the same number of studies showing indeterminate
effects than showing statistically significant or substantively important positive effects.
Not met. None of the three studies of The Creative Curriculum® that measured oral language showed a statistically significant or substantively
important negative effect. None of the studies showed a statistically significant or substantively important positive effect on oral language.
1. For rating purposes, the WWC considers the statistical significance of individual outcomes and the domain-level effect. The WWC also considers the size of the domain-level effect for ratings of potentially positive or potentially negative effects. For a complete description, see the WWC Procedures and Standards Handbook, Appendix E.
(continued)

26WWC Intervention Report The Creative Curriculum® for Preschool August 2009
Mixed effects: Evidence of inconsistent effects as demonstrated through either of the following criteria.
• Criterion 1: At least one study showing a statistically significant or substantively important positive effect, and at least one study showing a statistically significant
or substantively important negative effect, but no more such studies than the number showing a statistically significant or substantively important positive effect.
Not met. None of the three studies of The Creative Curriculum® that measured oral language showed a statistically significant or substantively
important positive effect.
oR
• Criterion 2: At least one study showing a statistically significant or substantively important effect, and more studies showing an indeterminate effect than showing
a statistically significant or substantively important effect.
Not met. None of the three studies of The Creative Curriculum® that measured oral language showed a statistically significant or substantively
important positive or negative effect.
Potentially negative effects: Evidence of a negative effect with no overriding contrary evidence.
• Criterion 1: At least one study showing a statistically significant or substantively important negative effect.
Not met. None of the three studies of The Creative Curriculum® that measured oral language showed a statistically significant or substantively
important negative effect.
anD
• Criterion 2: No studies showing a statistically significant or substantively important positive effect, or more studies showing statistically significant or substantively
important negative effects than showing statistically significant or substantively important positive effects.
Met. None of the three studies of The Creative Curriculum® that measured oral language showed a statistically significant or substantively
important positive effect. None of the three studies showed a statistically significant or substantively important negative effect on oral language.
Negative effects: Strong evidence of a negative effect with no overriding contrary evidence.
• Criterion 1: Two or more studies showing statistically significant negative effects, at least one of which met WWC evidence standards for a strong design.
Not met. None of the three studies of The Creative Curriculum® that measured oral language showed a statistically significant negative effect.
anD
• Criterion 2: No studies showing statistically significant or substantively important positive effects.
Met. None of the three studies of The Creative Curriculum® that measured oral language showed a statistically significant or substantively
important positive effect.
Appendix A5.1 The Creative Curriculum® rating for the oral language domain (continued)
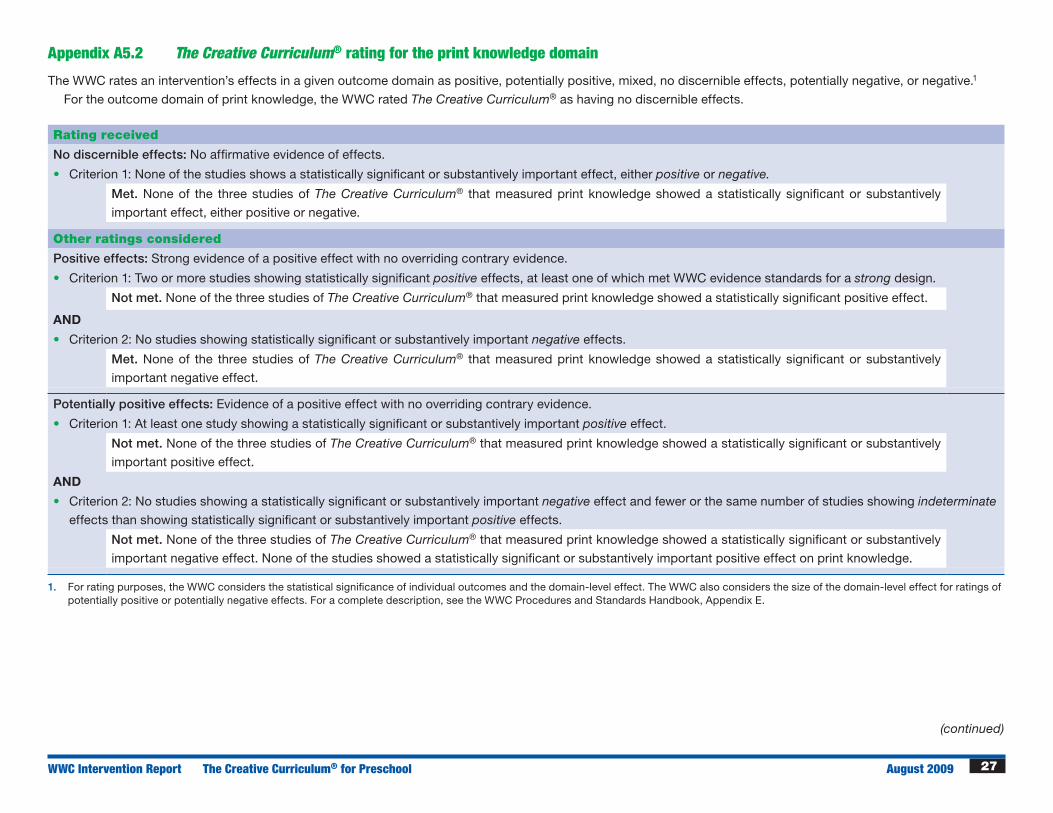
27WWC Intervention Report The Creative Curriculum® for Preschool August 2009
Rating received
No discernible effects: No affirmative evidence of effects.
• Criterion 1: None of the studies shows a statistically significant or substantively important effect, either positive or negative.
Met. None of the three studies of The Creative Curriculum® that measured print knowledge showed a statistically significant or substantively
important effect, either positive or negative.
Other ratings considered
Positive effects: Strong evidence of a positive effect with no overriding contrary evidence.
• Criterion 1: Two or more studies showing statistically significant positive effects, at least one of which met WWC evidence standards for a strong design.
Not met. None of the three studies of The Creative Curriculum® that measured print knowledge showed a statistically significant positive effect.
anD
• Criterion 2: No studies showing statistically significant or substantively important negative effects.
Met. None of the three studies of The Creative Curriculum® that measured print knowledge showed a statistically significant or substantively
important negative effect.
Potentially positive effects: Evidence of a positive effect with no overriding contrary evidence.
• Criterion 1: At least one study showing a statistically significant or substantively important positive effect.
Not met. None of the three studies of The Creative Curriculum® that measured print knowledge showed a statistically significant or substantively
important positive effect.
anD
• Criterion 2: No studies showing a statistically significant or substantively important negative effect and fewer or the same number of studies showing indeterminate
effects than showing statistically significant or substantively important positive effects.
Not met. None of the three studies of The Creative Curriculum® that measured print knowledge showed a statistically significant or substantively
important negative effect. None of the studies showed a statistically significant or substantively important positive effect on print knowledge.
Appendix A5.2 The Creative Curriculum® rating for the print knowledge domain
The WWC rates an intervention’s effects in a given outcome domain as positive, potentially positive, mixed, no discernible effects, potentially negative, or negative.1
For the outcome domain of print knowledge, the WWC rated The Creative Curriculum® as having no discernible effects.
1. For rating purposes, the WWC considers the statistical significance of individual outcomes and the domain-level effect. The WWC also considers the size of the domain-level effect for ratings of potentially positive or potentially negative effects. For a complete description, see the WWC Procedures and Standards Handbook, Appendix E.
(continued)

28WWC Intervention Report The Creative Curriculum® for Preschool August 2009
Mixed effects: Evidence of inconsistent effects as demonstrated through either of the following criteria.
• Criterion 1: At least one study showing a statistically significant or substantively important positive effect, and at least one study showing a statistically significant
or substantively important negative effect, but no more such studies than the number showing a statistically significant or substantively important positive effect.
Not met. None of the three studies of The Creative Curriculum® that measured print knowledge showed a statistically significant or substantively
important positive effect.
oR
• Criterion 2: At least one study showing a statistically significant or substantively important effect, and more studies showing an indeterminate effect than showing
a statistically significant or substantively important effect.
Not met. None of the three studies of The Creative Curriculum® that measured print knowledge showed a statistically significant or substantively
important positive or negative effect.
Potentially negative effects: Evidence of a negative effect with no overriding contrary evidence.
• Criterion 1: At least one study showing a statistically significant or substantively important negative effect.
Not met. None of the three studies of The Creative Curriculum® that measured print knowledge showed a statistically significant or substantively
important negative effect.
anD
• Criterion 2: No studies showing a statistically significant or substantively important positive effect, or more studies showing statistically significant or substantively
important negative effects than showing statistically significant or substantively important positive effects.
Met. None of the three studies of The Creative Curriculum® that measured print knowledge showed a statistically significant or substantively
important positive effect. None of the studies showed a statistically significant or substantively important negative effect on print knowledge.
Negative effects: Strong evidence of a negative effect with no overriding contrary evidence.
• Criterion 1: Two or more studies showing statistically significant negative effects, at least one of which met WWC evidence standards for a strong design.
Not met. None of the three studies of The Creative Curriculum® that measured print knowledge showed a statistically significant negative effect.
anD
• Criterion 2: No studies showing statistically significant or substantively important positive effects.
Met. None of the three studies of The Creative Curriculum® that measured print knowledge showed a statistically significant or substantively
important positive effect.
Appendix A5.2 The Creative Curriculum® rating for the print knowledge domain (continued)

29WWC Intervention Report The Creative Curriculum® for Preschool August 2009
Rating received
No discernible effects: No affirmative evidence of effects.
• Criterion 1: None of the studies shows a statistically significant or substantively important effect, either positive or negative.
Met. Neither of the two studies of The Creative Curriculum® that measured phonological processing showed a statistically significant or substan-
tively important effect, either positive or negative. No other studies measured phonological processing.
Other ratings considered
Positive effects: Strong evidence of a positive effect with no overriding contrary evidence.
• Criterion 1: Two or more studies showing statistically significant positive effects, at least one of which met WWC evidence standards for a strong design.
Not met. Neither of the two studies of The Creative Curriculum® that measured phonological processing showed a statistically significant positive
effect. No other studies measured phonololgical processing.
anD
• Criterion 2: No studies showing statistically significant or substantively important negative effects.
Met. Neither of the two studies of The Creative Curriculum® that measured phonological processing showed a statistically significant or substan-
tively important negative effect. No other studies measured phonololgical processing.
Potentially positive effects: Evidence of a positive effect with no overriding contrary evidence.
• Criterion 1: At least one study showing a statistically significant or substantively important positive effect.
Not met. Neither of the two studies of The Creative Curriculum® that measured phonological processing showed a statistically significant or
substantively important positive effect. No other studies measured phonololgical processing.
anD
• Criterion 2: No studies showing a statistically significant or substantively important negative effect and fewer or the same number of studies showing indeterminate
effects than showing statistically significant or substantively important positive effects.
Not met. Neither of the two studies of The Creative Curriculum® that measured phonological processing showed a statistically significant or
substantively important negative effect. No other studies measured phonological processing.
Appendix A5.3 The Creative Curriculum® rating for the phonological processing domain
The WWC rates an intervention’s effects in a given outcome domain as positive, potentially positive, mixed, no discernible effects, potentially negative, or negative.1
For the outcome domain of phonological processing, the WWC rated The Creative Curriculum® as having no discernible effects.
(continued)
1. For rating purposes, the WWC considers the statistical significance of individual outcomes and the domain-level effect. The WWC also considers the size of the domain-level effect for ratings of potentially positive or potentially negative effects. For a complete description, see the WWC Procedures and Standards Handbook, Appendix E.

30WWC Intervention Report The Creative Curriculum® for Preschool August 2009
Mixed effects: Evidence of inconsistent effects as demonstrated through either of the following criteria.
• Criterion 1: At least one study showing a statistically significant or substantively important positive effect, and at least one study showing a statistically significant
or substantively important negative effect, but no more such studies than the number showing a statistically significant or substantively important positive effect.
Not met. Neither of the two studies of The Creative Curriculum® that measured phonological processing showed a statistically significant or
substantively important positive or negative effect. No other studies measured phonological processing.
oR
• Criterion 2: At least one study showing a statistically significant or substantively important effect, and more studies showing an indeterminate effect than showing
a statistically significant or substantively important effect.
Not met. Neither of the two studies of The Creative Curriculum® that measured phonological processing showed a statistically significant or
substantively important positive or negative effect. No other studies measured phonological processing.
Potentially negative effects: Evidence of a negative effect with no overriding contrary evidence.
• Criterion 1: At least one study showing a statistically significant or substantively important negative effect.
Not met. Neither of the two studies of The Creative Curriculum® that measured phonological processing showed a statistically significant or
substantively important negative effect. No other studies measured phonological processing.
anD
• Criterion 2: No studies showing a statistically significant or substantively important positive effect, or more studies showing statistically significant or substantively
important negative effects than showing statistically significant or substantively important positive effects.
Met. Neither of the two studies of The Creative Curriculum® that measured phonological processing showed a statistically significant or substan-
tively important positive effect. No other studies measured phonological processing.
Negative effects: Strong evidence of a negative effect with no overriding contrary evidence.
• Criterion 1: Two or more studies showing statistically significant negative effects, at least one of which met WWC evidence standards for a strong design.
Not met. Neither of the two studies of The Creative Curriculum® that measured phonological processing showed a statistically significant negative
effect. No other studies measured phonological processing.
anD
• Criterion 2: No studies showing statistically significant or substantively important positive effects.
Met. Neither of the two studies of The Creative Curriculum® that measured phonological processing showed a statistically significant or substan-
tively important positive effect. No other studies measured phonological processing.
Appendix A5.3 The Creative Curriculum® rating for the phonological processing domain (continued)
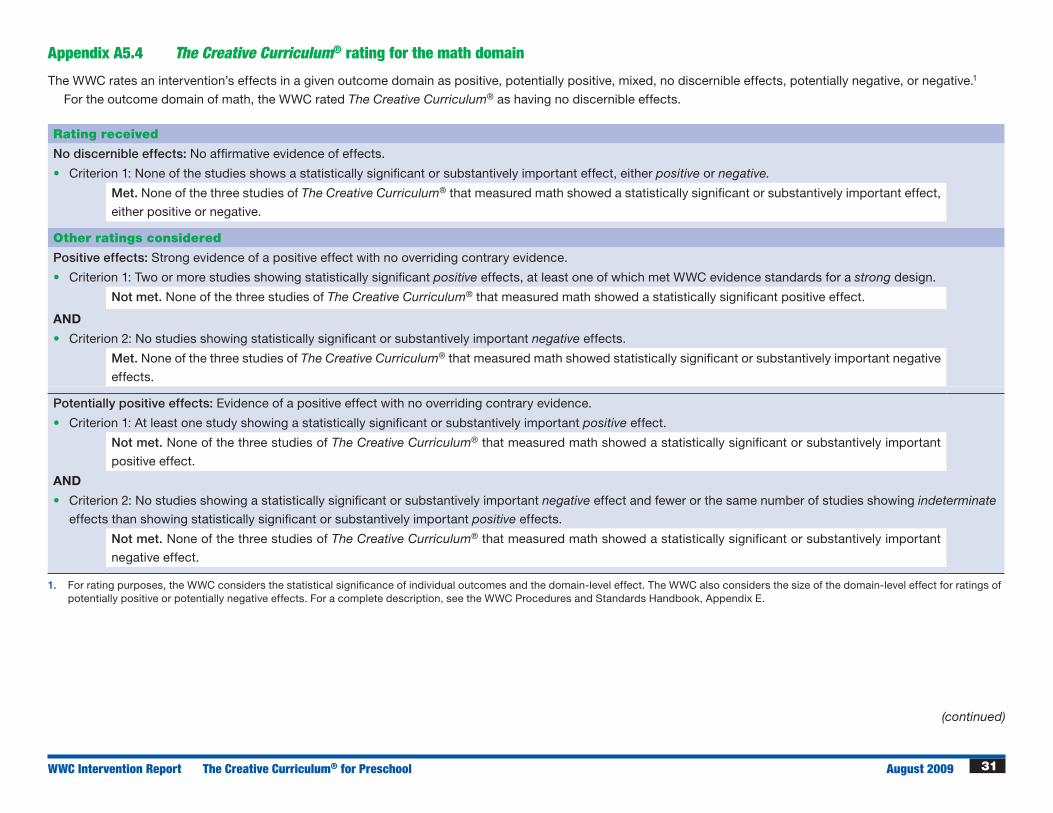
31WWC Intervention Report The Creative Curriculum® for Preschool August 2009
Rating received
No discernible effects: No affirmative evidence of effects.
• Criterion 1: None of the studies shows a statistically significant or substantively important effect, either positive or negative.
Met. None of the three studies of The Creative Curriculum® that measured math showed a statistically significant or substantively important effect,
either positive or negative.
Other ratings considered
Positive effects: Strong evidence of a positive effect with no overriding contrary evidence.
• Criterion 1: Two or more studies showing statistically significant positive effects, at least one of which met WWC evidence standards for a strong design.
Not met. None of the three studies of The Creative Curriculum® that measured math showed a statistically significant positive effect.
anD
• Criterion 2: No studies showing statistically significant or substantively important negative effects.
Met. None of the three studies of The Creative Curriculum® that measured math showed statistically significant or substantively important negative
effects.
Potentially positive effects: Evidence of a positive effect with no overriding contrary evidence.
• Criterion 1: At least one study showing a statistically significant or substantively important positive effect.
Not met. None of the three studies of The Creative Curriculum® that measured math showed a statistically significant or substantively important
positive effect.
anD
• Criterion 2: No studies showing a statistically significant or substantively important negative effect and fewer or the same number of studies showing indeterminate
effects than showing statistically significant or substantively important positive effects.
Not met. None of the three studies of The Creative Curriculum® that measured math showed a statistically significant or substantively important
negative effect.
Appendix A5.4 The Creative Curriculum® rating for the math domain
The WWC rates an intervention’s effects in a given outcome domain as positive, potentially positive, mixed, no discernible effects, potentially negative, or negative.1
For the outcome domain of math, the WWC rated The Creative Curriculum® as having no discernible effects.
(continued)
1. For rating purposes, the WWC considers the statistical significance of individual outcomes and the domain-level effect. The WWC also considers the size of the domain-level effect for ratings of potentially positive or potentially negative effects. For a complete description, see the WWC Procedures and Standards Handbook, Appendix E.

32WWC Intervention Report The Creative Curriculum® for Preschool August 2009
Mixed effects: Evidence of inconsistent effects as demonstrated through either of the following criteria.
• Criterion 1: At least one study showing a statistically significant or substantively important positive effect, and at least one study showing a statistically significant
or substantively important negative effect, but no more such studies than the number showing a statistically significant or substantively important positive effect.
Not met. None of the three studies of The Creative Curriculum® that measured math showed a statistically significant or substantively important
positive or negative effect.
oR
• Criterion 2: At least one study showing a statistically significant or substantively important effect, and more studies showing an indeterminate effect than showing
a statistically significant or substantively important effect.
Not met. None of the three studies of The Creative Curriculum® that measured math showed a statistically significant or substantively important
positive or negative effect.
Potentially negative effects: Evidence of a negative effect with no overriding contrary evidence.
• Criterion 1: At least one study showing a statistically significant or substantively important negative effect.
Not met. None of the three studies of The Creative Curriculum® that measured math showed a statistically significant or substantively important
negative effect.
anD
• Criterion 2: No studies showing a statistically significant or substantively important positive effect, or more studies showing statistically significant or substantively
important negative effects than showing statistically significant or substantively important positive effects.
Met. None of the three studies of The Creative Curriculum® that measured math showed a statistically significant or substantively important positive
effect.
Negative effects: Strong evidence of a negative effect with no overriding contrary evidence.
• Criterion 1: Two or more studies showing statistically significant negative effects, at least one of which met WWC evidence standards for a strong design.
Not met. None of the three studies of The Creative Curriculum® that measured math showed a statistically significant negative effect.
anD
• Criterion 2: No studies showing statistically significant or substantively important positive effects.
Met. None of the three studies of The Creative Curriculum® that measured math showed a statistically significant or substantively important positive
effect.
Appendix A5.4 The Creative Curriculum® rating for the math domain (continued)

33WWC Intervention Report The Creative Curriculum® for Preschool August 2009
Appendix A6 Extent of evidence by domain
Sample size
Outcome domain Number of studies Schools Students1 Extent of evidence2
Oral language 3 101 839 Medium to large
Print knowledge 3 101 844 Medium to large
Phonological processing 2 32 364 Medium to large
Early reading or writing 0 0 0 na
Cognition 0 0 0 na
Math 3 101 844 Medium to large
na = not applicable/not studied
1. The sample size of students shown in this table is based on the smallest number of children with valid posttest measurements within a domain. Posttest responses for the PCER [Chapter 2] (2008) study ranged from 192 to 193. Posttest responses for the PCER [Chapter 3] (2008) study ranged from 165 to 171. Posttest responses for the Henry et al. (2004) study totaled 482 children.
2. A rating of “medium to large” requires at least two studies and two schools across studies in one domain and a total sample size across studies of at least 350 students or 14 classrooms. Other-wise, the rating is “small.” For more details on the extent of evidence categorization, see the WWC Procedures and Standards Handbook, Appendix G.
Related Documents