Creating Livable Communities Complete Street Designs for Seniors Commissioner Janette Sadik-Khan - NYCDOT Office of Research, Implementation and Safety - April 28, 2011

Welcome message from author
This document is posted to help you gain knowledge. Please leave a comment to let me know what you think about it! Share it to your friends and learn new things together.
Transcript

Creating Livable Communities Complete Street Designs for Seniors
Commissioner Janette Sadik-Khan - NYCDOTOffice of Research, Implementation and Safety - April 28, 2011

2
Traffic Fatalities in PerspectiveIntroduction
Fatalities for 100,000 Population2008 data
New York City’s traffic fatality rate is lower than Copenhagen’s and nearly equal to Amsterdam’s
3
DOT Safety GoalStrategic Plan:
Reduce Fatalities by 50% by 2030
From 274 (2007) to 137 (2030)
Introduction
NYC Actual & Target Traffic Fatalities 1990-2030
4
Introduction
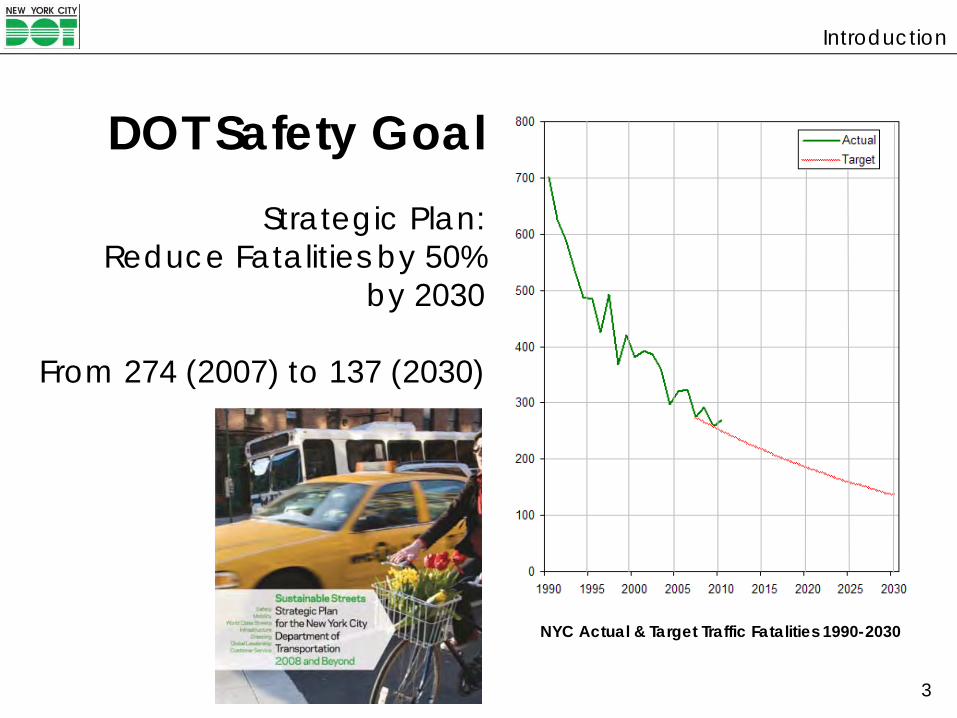
New York City Pedestrian Safety Study and Action PlanMost comprehensive pedestrian study undertaken by a major city in the U.S.
• Focus on Vulnerable Road Users(Pedestrians, Bicyclists, Motorcyclists)
• Vulnerable Road Users:71% of all fatalities (2005-2009)
• Pedestrians:52% of all fatalities (2005-2009)
• Seniors:38% of all fatalities(2008)

5
Vulnerable Road Users:• Seniors are 12% of NYC’s population but account for 38% of
fatalities
Introduction
Children (0-14) Seniors (65+) Young Adults (15-24) Adults (25-65)
Source: 2008 - NYCDOT-NYPD Fatality Database, Population Division, U.S. Census Bureau
Children 20%
Young Adults 12%
Adults 56%
Seniors 12%
Seniors38%
Adults46%
Children7%
Young Adults
8%
6
Vulnerable Road Users:Introduction
Source: Population Division, U.S. Census Bureau
Source: New York City Population Projections by Age/Sex & Borough 2000–2030 – NYC Department of City Planning
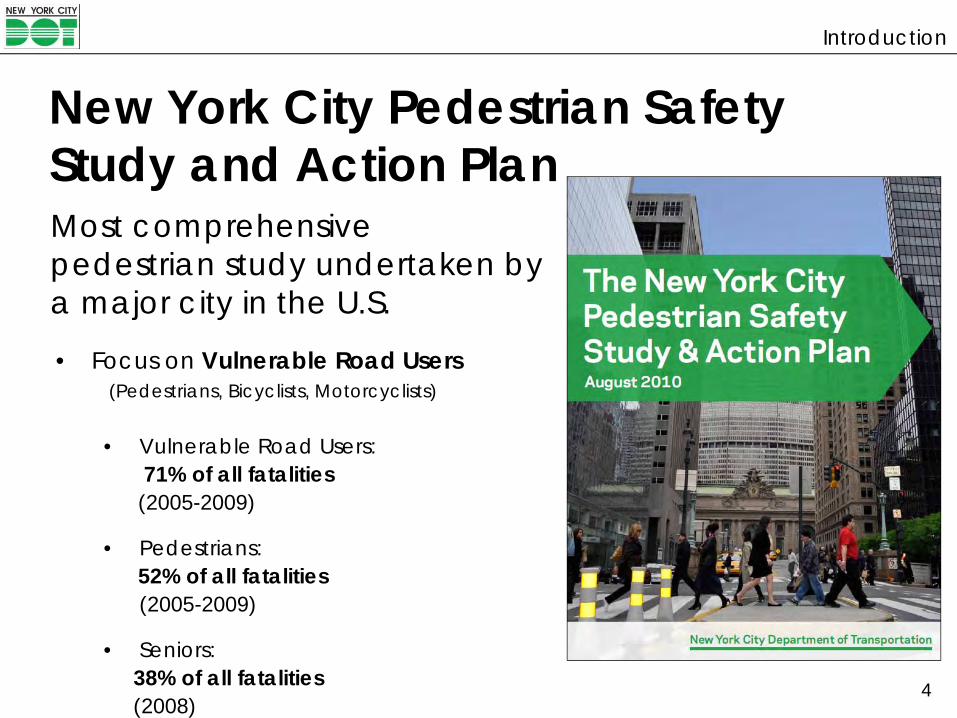
• Over the next 25 years, NYC’s population of adults over age 65 is expected to increase by nearly 50%
931K 1.05M 1.35M
7
Engineering
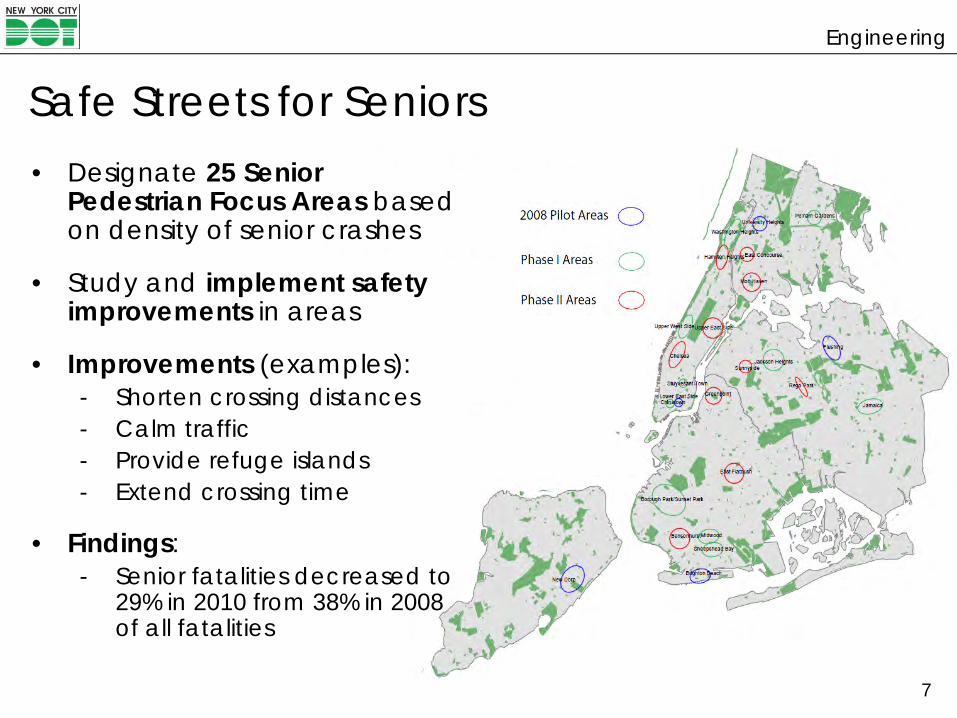
Safe Streets for Seniors• Designate 25 Senior
Pedestrian Focus Areas based on density of senior crashes
• Study and implement safety improvements in areas
• Improvements (examples):- Shorten crossing distances- Calm traffic- Provide refuge islands- Extend crossing time
• Findings: - Senior fatalities decreased to
29% in 2010 from 38% in 2008 of all fatalities
8
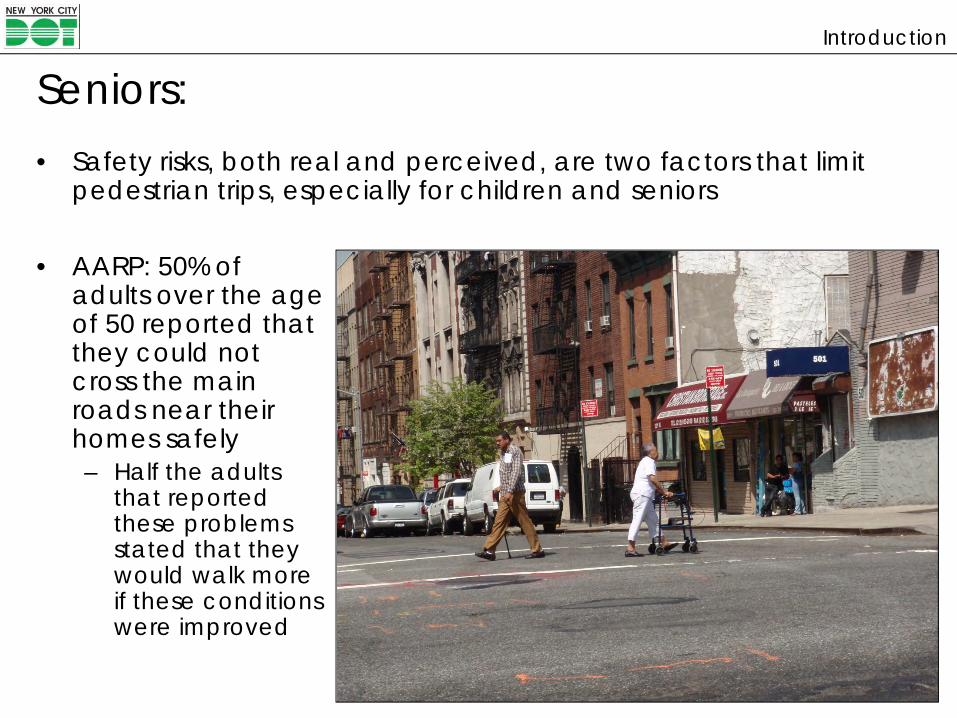
Seniors:• Safety risks, both real and perceived, are two factors that limit
pedestrian trips, especially for children and seniors
Introduction
• AARP: 50% of adults over the age of 50 reported that they could not cross the main roads near their homes safely – Half the adults
that reported these problems stated that they would walk more if these conditions were improved

52’
17’
8’
10’
70’
Motor Vehicles 60-74%
Pedestrians 11-24%
Cyclists 14%
9th Avenue, Manhattan
Proportion of Road:
Complete Streets Design PhilosophyComplete Street Design
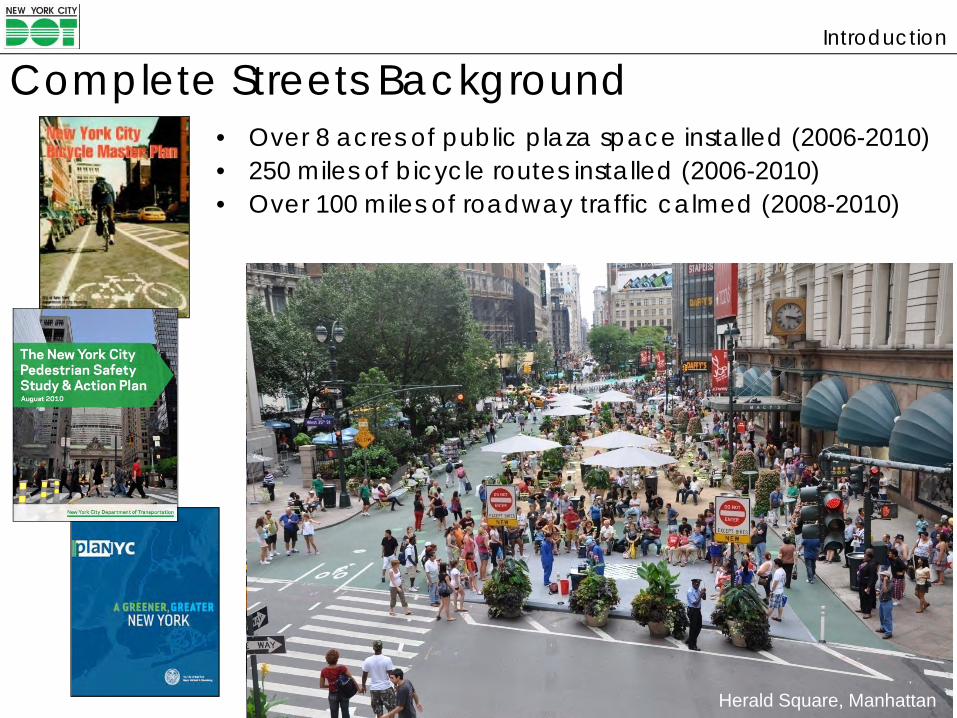
Herald Square, Manhattan
Introduction
• Over 8 acres of public plaza space installed (2006-2010)• 250 miles of bicycle routes installed (2006-2010)• Over 100 miles of roadway traffic calmed (2008-2010)
Complete Streets Background

1. Increase Public Space• Active Living Research: Safer, pedestrian-friendly streets
encourage everyday walking, an important part of a healthy lifestyle– People that reside in areas with more high quality sidewalks and bike
lanes are more likely to be active and less likely to be overweight
11
• Major two-way streets account for 47% of pedestrian fatalities but only 12% of the roadway network
Complete Street Design
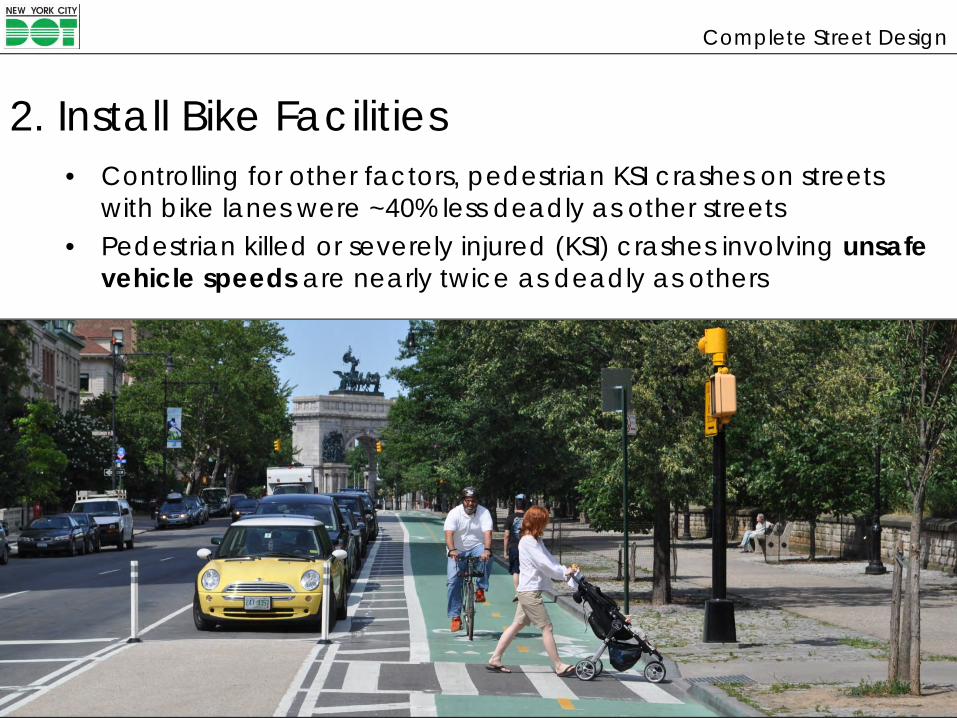
2. Install Bike Facilities• Controlling for other factors, pedestrian KSI crashes on streets
with bike lanes were ~40% less deadly as other streets• Pedestrian killed or severely injured (KSI) crashes involving unsafe
vehicle speeds are nearly twice as deadly as others
13
Complete Street Design
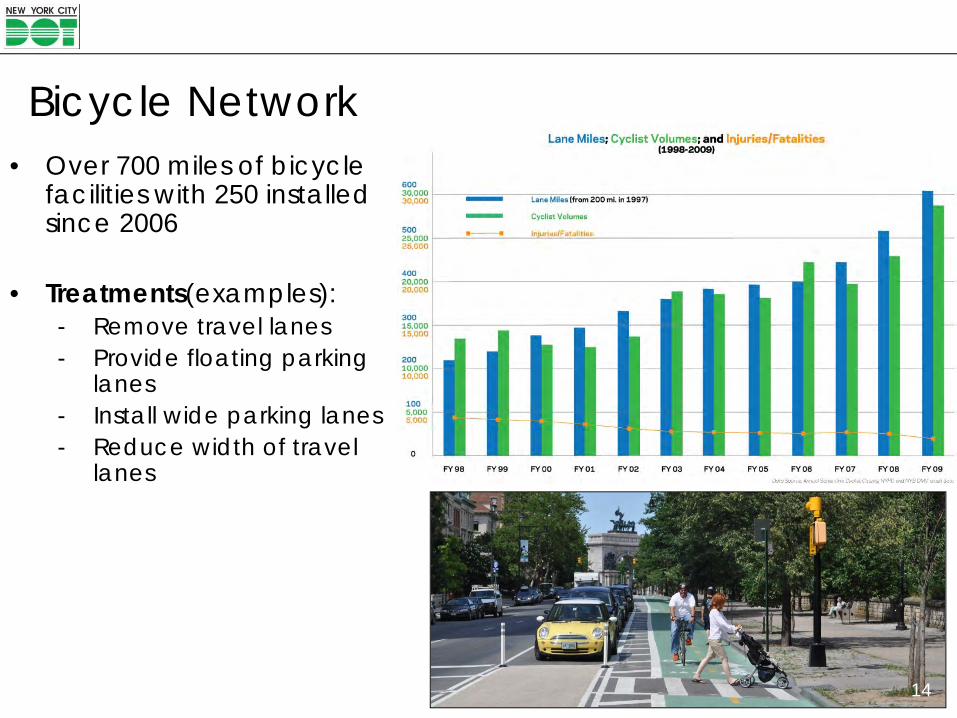
Bicycle Network• Over 700 miles of bicycle
facilities with 250 installed since 2006
• Treatments(examples):- Remove travel lanes- Provide floating parking
lanes- Install wide parking lanes- Reduce width of travel
lanes
14
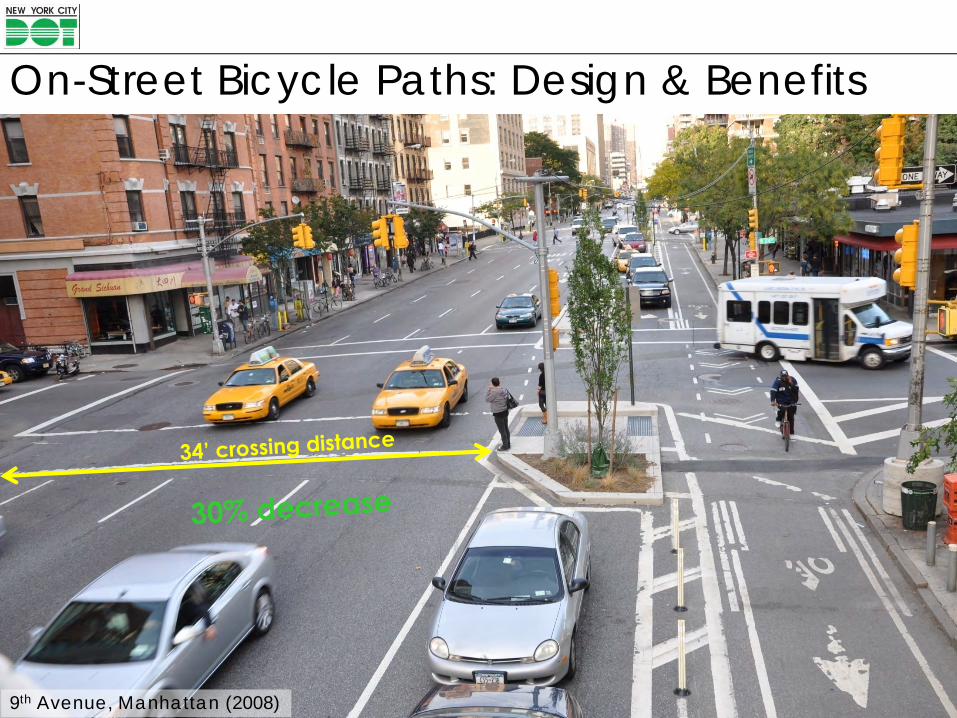
9th Avenue, Manhattan (2008)
On-Street Bicycle Paths: Design & Benefits
16
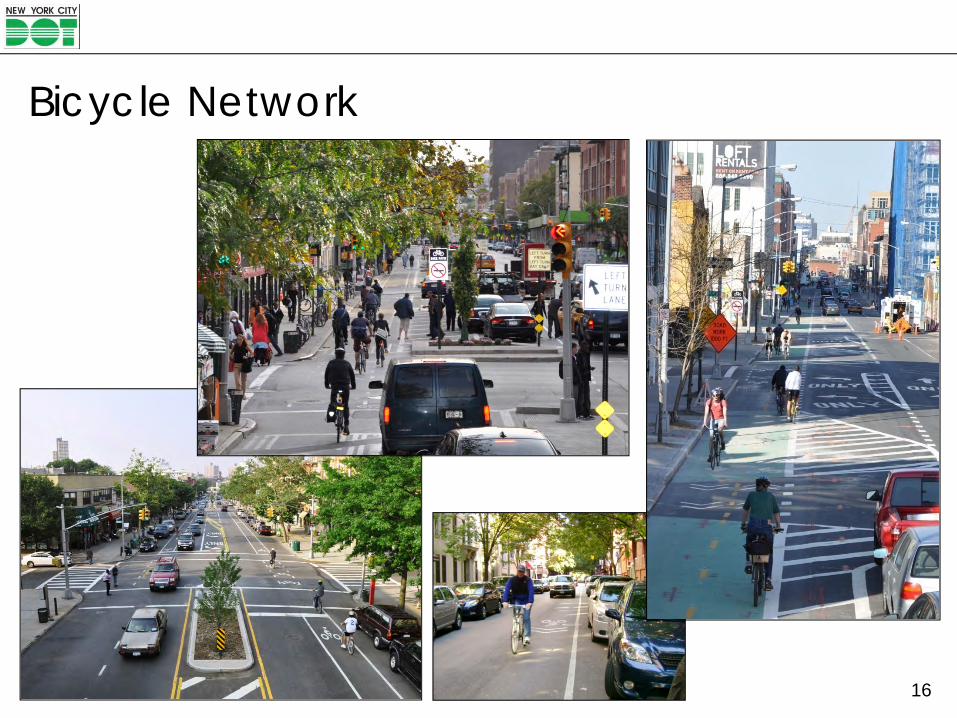
Bicycle Network

3. Traffic Calming – reducing vehicle speeds
• Arterial streets account for ~60% of pedestrian fatalities but only 15% of the road network
• Pedestrian KSI crashes on arterial streets are ~2/3 more deadly than crashes on non-arterial streets
17
Complete Street Design

Traffic Calming: High Crash Corridors
• Rank corridors by borough based on number and severity of crashes
• Redesign 60 miles of corridors each year
• Treatments(examples):- Remove travel lanes- Install wide parking lanes- Reduce width of travel lanes- Install center medians
• Findings:- Reduce speeding- Improve pedestrian safety- Enhance streetscape - Create walkable streets
18
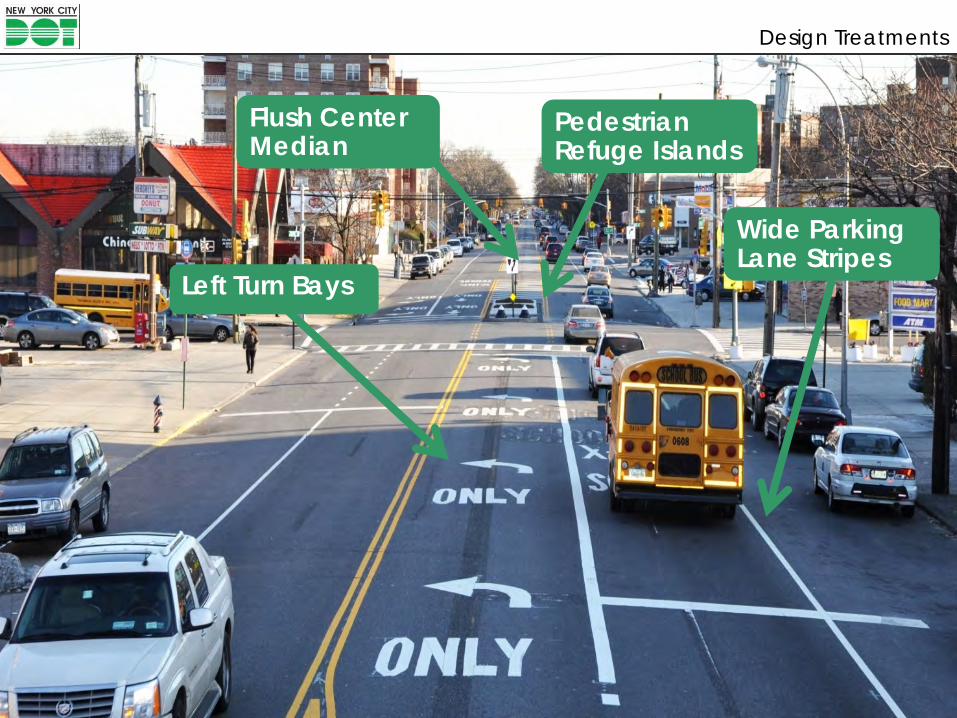
Design Treatments
19
Wide Parking Lane Stripes
Left Turn Bays
Pedestrian Refuge Islands
Flush CenterMedian

20
Design Treatments
Traffic Calming: Safe Streets for Seniors
Related Documents