Creating Great Infographics & Visual Content + + + + + + + + +

Creating Great Infographics & Visual Content
Aug 20, 2015
Welcome message from author
This document is posted to help you gain knowledge. Please leave a comment to let me know what you think about it! Share it to your friends and learn new things together.
Transcript
Creating Great Infographics & Visual Content
+
+ +
+
+
+
+
+
+

+
+ WHY VISUAL CONTENT?+
+
+
+
+
+
KEYS TO SUCCESSFUL VISUALIZATION
+
WHAT CAN YOU VISUALIZE?+
THE VISUALLY MODEL +

Who is Visually?
+
++
+
+
+ Community + Marketplace
+ Project Center
+
+
+
+
“The world’s leader in scaled content creation”

Why visuals?
+
++
+
+
+
+

There's a lot of noise out there.!
Trillions of messages.
+
++
+
+
+
+

+
++
+
+
+
+
And we can only process a fraction of them.

12 secondsAVERAGE ATTENTION SPAN OF AN ADULT IN 2000
8 secondsAVERAGE ATTENTION SPAN OF AN ADULT IN 2012
9 secondsAVERAGE ATTENTION SPAN OF A GOLDFISH
Source: http://www.statisticbrain.com/attention-span-statistics/
+
++
+
+
++
+
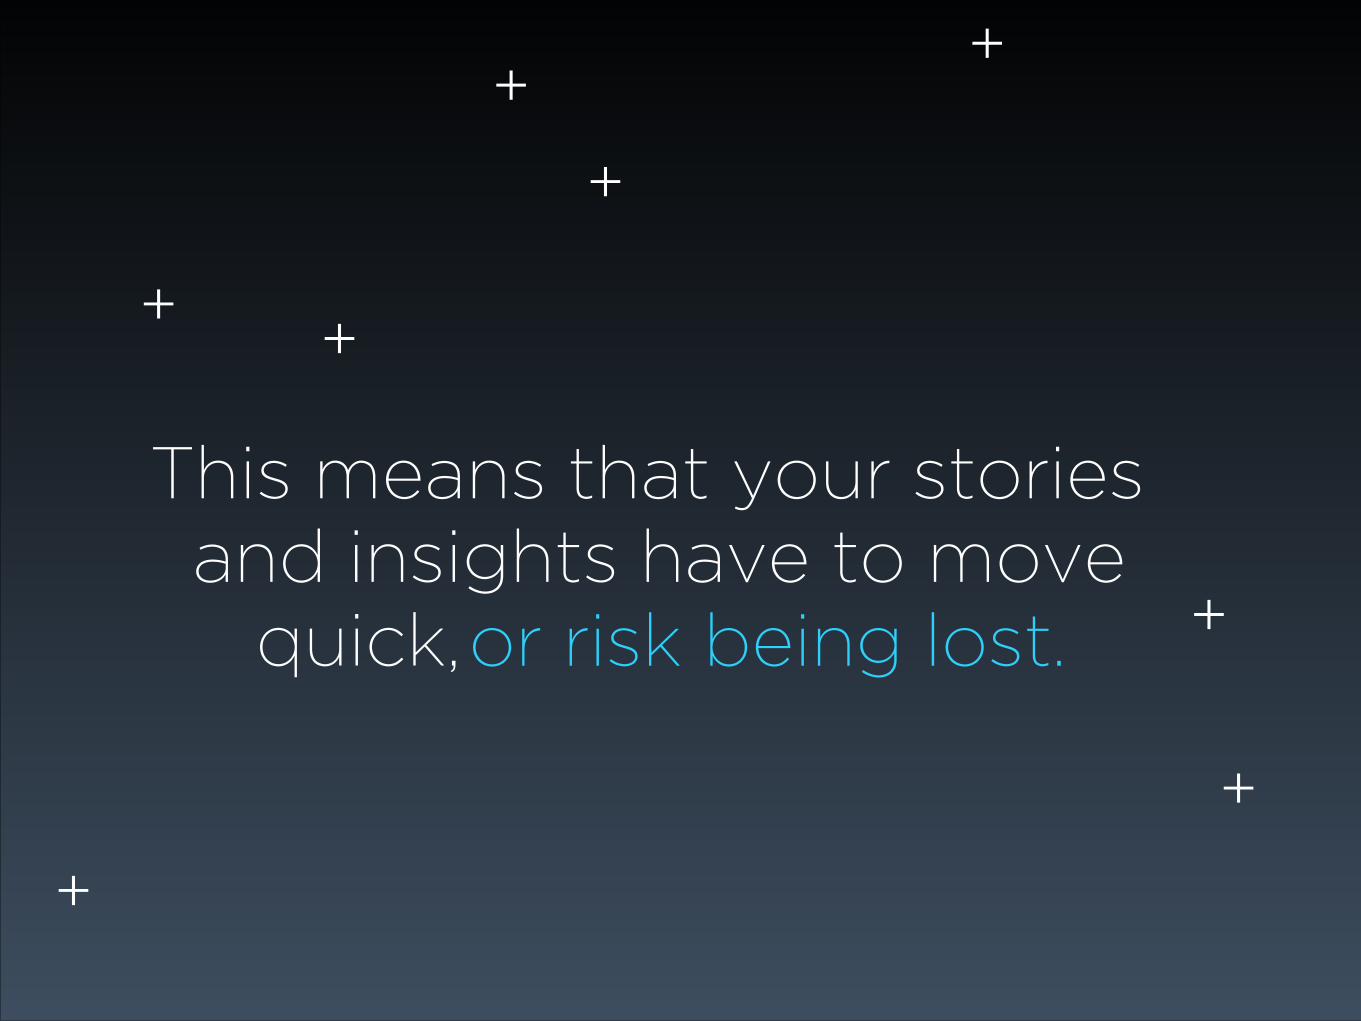
This means that your stories and insights have to move quick, or risk being lost.
+
++
+
+
+
+
+

That’s where visuals come in.
+
++
+
+
+
+
+

Source: Eric Jensen, Brain-Based Learning: The New Paradigm of Teaching, 1996
90%90% of all information that comes to our brain is visual.
visual messages per hour may be received by the brain !
36,000Up to
+
++
+
+
+
+
+

+
++
+
+
+
+
A picture is worth a thousand words.

+
++
+
+
+
+
THIS IS A PICTURE OF A BLUE BIRD SITTING IN A TREE.
THE BIRD IS LOOKING TO THE RIGHT.
THE LEAVES OF THE TREE ARE ORANGE, RED, YELLOW AND GREEN.
IT IS AUTUMN.

Infographics & visual content can help make sure your audiences
+
+
+
+
+
+
with you and your brand. SEE, HEAR, AND ENGAGE
+
+
+
+
+
+
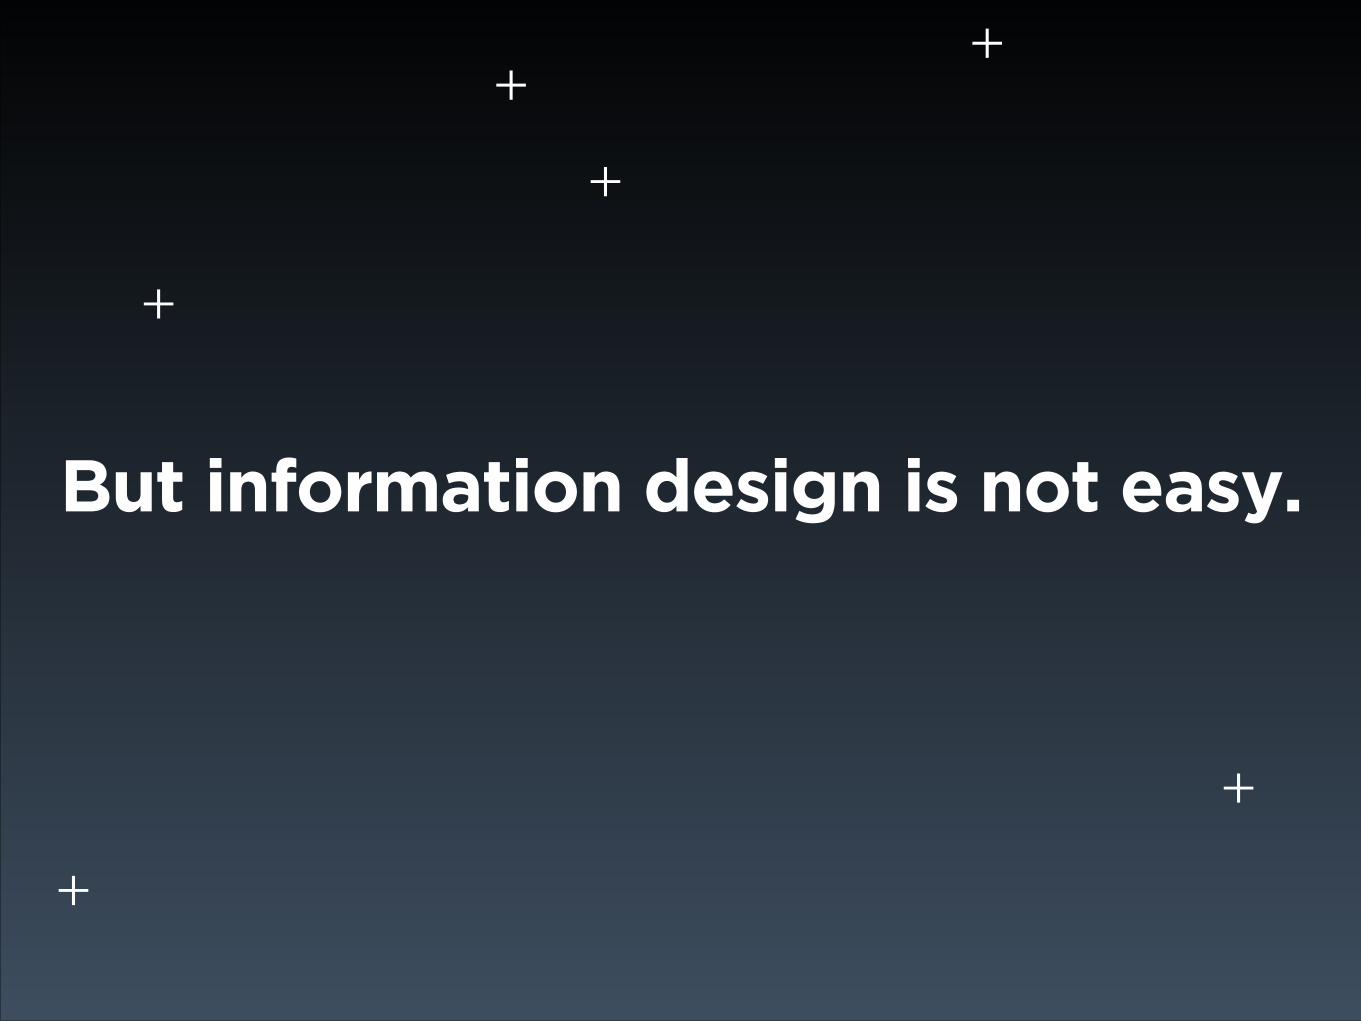
But information design is not easy.

+
+
+
+
+
+
Common ProblemsPRETTY DESIGN BUT LACKS NARRATIVE / STORYTELLING+
NOT ENOUGH RESEARCH AND/OR NOT THE RIGHT DATA+NO EXPERTISE IN INFORMATION DESIGN+GOAL OF GRAPHIC IS UNCLEAR+
+
+
+
+
+
+
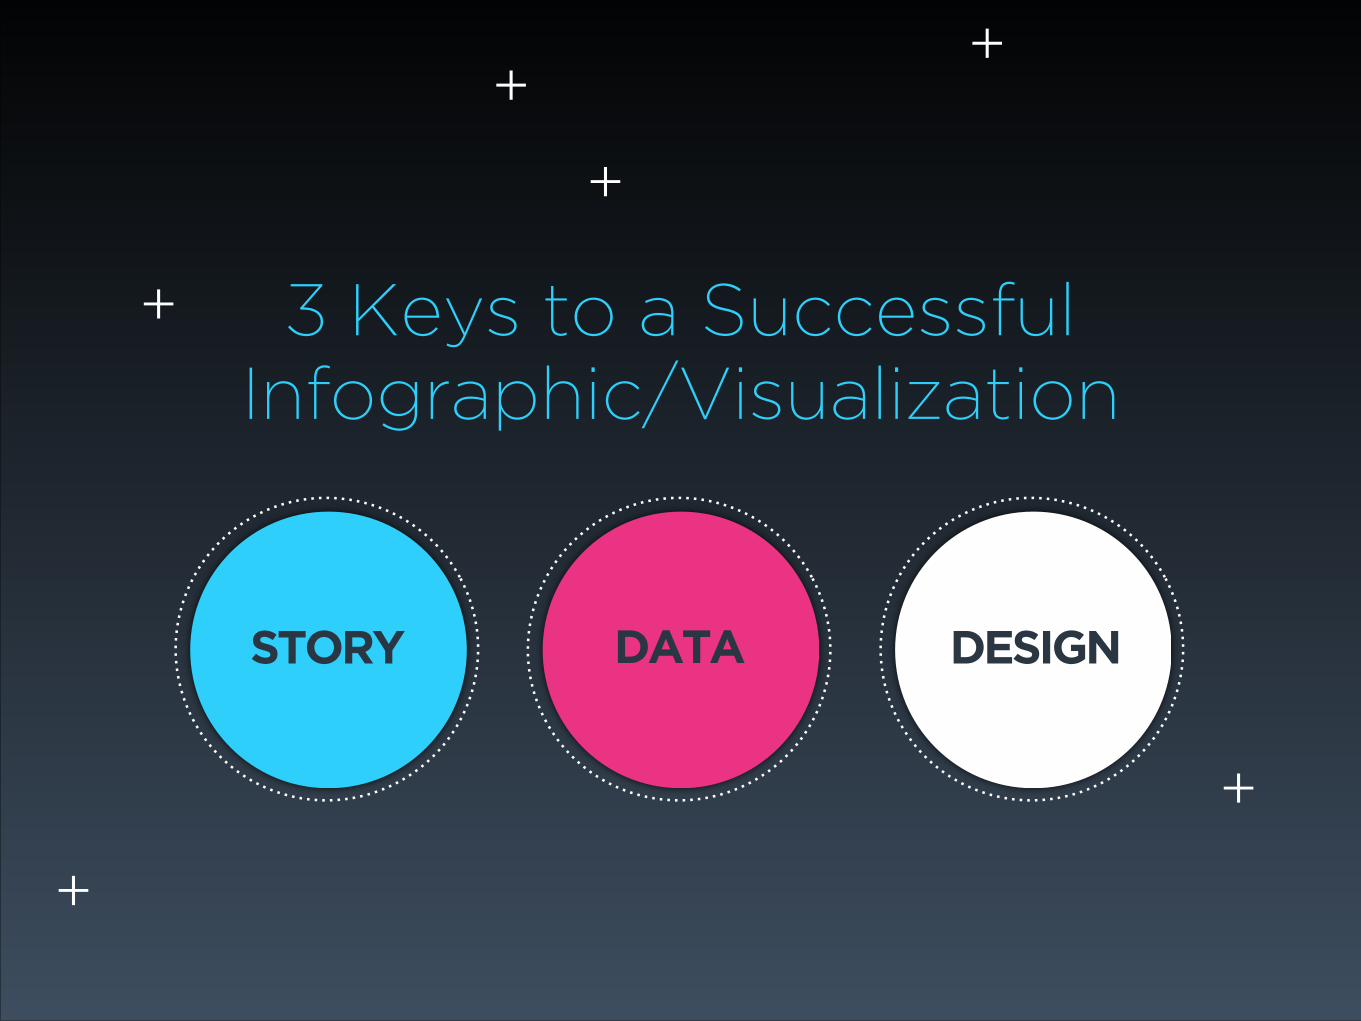
3 Keys to a Successful Infographic/Visualization
STORY DATA DESIGN

+
+
+
+
+
+
It’s all about the story.
STORY
visual.ly/what-are-odds visual.ly/food-waste-story-excess

+
+
+
+
+
DATA
Good data + analysis.
Source: http://blog.visual.ly/source-code-the-5-rules-of-researching-and-sourcing-infographics/

+
+
+
+
+
DESIGN

+
+
+
+
+
THERE’S ONE MORE KEY TO A GOOD VISUALIZATION…

+
+
+
+
+
THOUGHT LEADERSHIP, EXPLORING STORIES/DATA !
VISUAL.LY/INNOVATION-TIMELINE/
SOCIAL, VIRAL, SEO !VISUAL.LY/TIE-DIY
FINDING NEW STORIES IN DATA, SOCIAL/VIRAL !
VISUAL.LY/STARTUP-UNIVERSE
THE STRATEGY IT FITS INTO.

+
+
+
+
+
+
What can YOU visualize?
ANALYZED DATA ON CLIENTS (CORRELATE THE EFFECT)+CASE STUDIES, WHITEPAPERS, BLOG POSTS, TRAINING DOCS, FACT SHEETS+
“THE JOURNEY OF” !HTTP://BLOG.VISUAL.LY/VISUALIZING-THE-VALUE-OF-A-TWITTER-FOLLOWER/

+
+
+
+
+
+
For example:
startupweekend.org/wp-content/blogs.dir/1/files/2013/04/Impact-Report-Guide-TEST-42C-4_11.pdf

+
+ +
+
+
+
INDUSTRY FORUMS, BULLETIN BOARDS, SOCIAL CONVERSATION+
QUORA+
Find conversations, and research
USE SEO/SEM RESOURCES INTERNALLY, OR BUILD USING GOOGLE TRENDS, VISUAL.LY TRENDS+

TextThousands of the world's best designers, journalists, developers, and other creatives,
all carefully curated and on one easy to use, on-demand marketplace/project
platform.
+
+
+
+
+
+
The model
+

Text
+
+ +
+
+
+
+
Working together, better.

Text
Data Journalism Handbook starting point for storytelling/insights
!
Content Marketing Institute (CMI) starting point for content strategy
+
+
+
+
++
RESOURCES
blog.visual.ly (inspiration, ideas, best practices)

Text
+
+
+
+
+
+
+
Joe Cardillo Product / Marketing / Content
@joecardillo
Related Documents