Rev. Integr. Bus. Econ. Res. Vol 2(1) 292 Copyright 2013 Society of Interdisciplinary Business Research (www.sibresearch.org) Creating Entrepreneurial Spirit in Indonesia: Role of Educators? Samuel PD Anantadjaya School of Accounting, Faculty of Business Administration & Humanities Swiss German University, Serpong, Tangerang, Indonesia Email: [email protected] Irma M Nawangwulan School of Management Studies Universitas Pembangunan Jaya, Bintaro Jaya, Tangerang, Indonesia Email: [email protected] F. Nugro Hardianto School of Business Harapan Bangsa Business School, Bandung, Indonesia Email: [email protected] B. Agus Finardi Bafardi Group, Jakarta, Indonesia Email: [email protected] ABSTRACT Educational institutions have flooded the market with various classes, subjects, and curriculums. There are institutions that may have established ventures with other educational institutions overseas. This is mainly done to attract prospective students and parents toward particular educational institutions. The most common avenue to increase the competitiveness is to put-forth the classroom study methodology. It has become common practice that educators may have to change the teaching method to ensure that the actual delivery of teaching materials are in accordance with the needs of advanced education and marketplaces. This should have been conducted, not only as a mere of specific knowledge transfers, but also to transfer general knowledge, practical knowledge, emotional stability, and maturity. Undoubtedly, a teaching method aims toward boosting entrepreneurial spirit may have to enhance the individual creativity in playing his/her role in organizations, either as entrepreneurs, or intrapreneurs. The Coasean theory of the firm (Coase, 1937) and the Penrosean theory of the firm (Penrose, 1959) are used as a foundation on the thinking process, including its development, particularly the entrepreneurial theory of the firm (Stam, et al, 2006). In addition, thinking process and concepts from entrepreneurial studies from Hisrich, et al (2005) are also used in this study, besides the synergy references and performance measurements. Studies on quality of educators are used as an approximation on teaching method toward shaping the entrepreneurial spirit. Group synergy is used to proxy group interaction as a supporting cushion to leverage the entrepreneurial spirit even more. Performance measurements are used to note the outcomes of quality of educators and group synergy. Using the combination of the theory of the firm, entrepreneurial studies, synergy references, and performance measurements, it is expected that this study is able to reveal the theoretical foundation on building arguments toward changes in teaching method from childhood education to university level. It is expected that this study is able to evaluate the critical role of creative education toward building entrepreneurial spirit in Indonesia. Keywords: education, creative, entrepreneurs, intrapreneurs, entrepreneurial spirit, creative

Welcome message from author
This document is posted to help you gain knowledge. Please leave a comment to let me know what you think about it! Share it to your friends and learn new things together.
Transcript
Rev. Integr. Bus. Econ. Res. Vol 2(1) 292
Copyright 2013 Society of Interdisciplinary Business Research (www.sibresearch.org)
Creating Entrepreneurial Spirit in Indonesia: Role of Educators? Samuel PD Anantadjaya School of Accounting, Faculty of Business Administration & Humanities Swiss German University, Serpong, Tangerang, Indonesia Email: [email protected] Irma M Nawangwulan School of Management Studies Universitas Pembangunan Jaya, Bintaro Jaya, Tangerang, Indonesia Email: [email protected] F. Nugro Hardianto School of Business Harapan Bangsa Business School, Bandung, Indonesia Email: [email protected] B. Agus Finardi Bafardi Group, Jakarta, Indonesia Email: [email protected]
ABSTRACT Educational institutions have flooded the market with various classes, subjects, and curriculums. There are institutions that may have established ventures with other educational institutions overseas. This is mainly done to attract prospective students and parents toward particular educational institutions. The most common avenue to increase the competitiveness is to put-forth the classroom study methodology. It has become common practice that educators may have to change the teaching method to ensure that the actual delivery of teaching materials are in accordance with the needs of advanced education and marketplaces. This should have been conducted, not only as a mere of specific knowledge transfers, but also to transfer general knowledge, practical knowledge, emotional stability, and maturity. Undoubtedly, a teaching method aims toward boosting entrepreneurial spirit may have to enhance the individual creativity in playing his/her role in organizations, either as entrepreneurs, or intrapreneurs. The Coasean theory of the firm (Coase, 1937) and the Penrosean theory of the firm (Penrose, 1959) are used as a foundation on the thinking process, including its development, particularly the entrepreneurial theory of the firm (Stam, et al, 2006). In addition, thinking process and concepts from entrepreneurial studies from Hisrich, et al (2005) are also used in this study, besides the synergy references and performance measurements. Studies on quality of educators are used as an approximation on teaching method toward shaping the entrepreneurial spirit. Group synergy is used to proxy group interaction as a supporting cushion to leverage the entrepreneurial spirit even more. Performance measurements are used to note the outcomes of quality of educators and group synergy. Using the combination of the theory of the firm, entrepreneurial studies, synergy references, and performance measurements, it is expected that this study is able to reveal the theoretical foundation on building arguments toward changes in teaching method from childhood education to university level. It is expected that this study is able to evaluate the critical role of creative education toward building entrepreneurial spirit in Indonesia. Keywords: education, creative, entrepreneurs, intrapreneurs, entrepreneurial spirit, creative
Rev. Integr. Bus. Econ. Res. Vol 2(1) 293
Copyright 2013 Society of Interdisciplinary Business Research (www.sibresearch.org)
education, entrepreneurial theory of the firm 1. INTRODUCTION Students are the backbone of a nation. Although every country in the world is confident that students are important asset for the country’s future economy, but not all countries have given maximum attention to the education sector. Given that Indonesia is still considered as a third world country or a developing country, Indonesia has not given maximum attention to the education sector to date (Yogaswara, et al, 2006). In comparison, China is an example of a country which is very concerned to the importance of education for its people (Yogaswara, et al, 2006). Results of human development in China have been relatively known to the world. For example, China has succeeded in some sports. In China, education processes for athletes have begun since the early age. In a relatively short time, Chinese athletes are able to be the world champions. This reflects that the attention to the early age educational process could not only improve the economic conditions of the country in the future, but also could reduce poverty (Anantadjaya and Nawangwulan, 2006b). To establish a solid platform and direct Indonesia to better economic conditions, various efforts should be directed to education, such as students tutoring process (Bell and Gersbach, 2001). Bell and Gersbach (2001) further mentioned that the role of parents is crucial in the early age education process, as a way to prepare children enter formal education. The uses of multiple languages, ranging from daily conversations to the bedtime story, or simply just read a book together, have affected the language and intellectual capabilities (Santosa and Setiawan, 2004). Ability to read and understand the numbers is the basis of an individual's intellectual ability (Anantadjaya and Nawangwulan, 2007; Bell and Gersbach, 2001). In terms of strategic thinking, and goals achieving, Barton (2006) states that the government should give priority to the education sector. The attention from government is expected to create competitive advantage and thus it is expected to bring prosperity to that country in the future. A country’s budget could not only show how much the government should spend on education sector but also whether the public has already shifted to knowledge-based society. Tobin (2004) says that when a country experienced a decline in foreign investment, the future of students and country's economic stability would likely be threatened. At the same time, though there is a decline in foreign investment, the government still should give a priority to education industry. As it was previously mentioned, attention to the education sector is not only a way of a country to rise from poverty, but also a way to develop exposures, build networking, and improve technical, conceptual and human relations skills. As studied by Anantadjaya and Nawangwulan (2006a; 2006b), and further supported by Bell and Gersbach (2001), students from lower income family relatively face difficulty in acquiring experiences and human relations skill, while students from wealthier family do not relatively face those difficulties (Tobin, 2004; Yogaswara, et al, 2006). Learning process at university level is relatively different from previous education level. This does not mean that the learning process in university level is more difficult than in high school. Further, this does not imply that learning process in play group or kindergarten is simple or least complex. Teaching and learning process at every level has its own degree of difficulty (Anantadjaya and Nawangwulan, 2006a; 2006b). Just like leadership style, teaching style practiced in an educational institution plays a crucial role. Teaching method is a key success of educational process. Variety teaching methods have been studied from different perspectives (Tomlinson, 1999; Silver, et al, 2000; Bell and Gersbach, 2001; Brown, 2001; Chaudhury, 2002; Early and Mosakowski, 2004; Tobin, 2004; Anantadjaya, 2005; Dailey, 2005; Barton, 2006; Yogaswara, et al, 2006). Classroom teaching method classroom in majority of educational institutions in Indonesia, is generally based on the control

Rev. Integr. Bus. Econ. Res. Vol 2(1) 294
Copyright 2013 Society of Interdisciplinary Business Research (www.sibresearch.org)
and higher authority from the teaching team. Only few teachers, lecturers or instructors are willing to accommodate the students’ needs during the education process. By accommodating different needs to different students, every teacher/lecturer must be ready to give modification at any time, thus this sounds like facing customer with customized order (Anantadjaya and Nawangwulan, 2006a; 2006b; Yogaswara, et al, 2006). Educational institution should able to influence the use of technology for students in the learning process. But for some institutions, this can not be done maximally. Even though the use of black or white board and overhead projector in class s can still accommodate learning process, but adoption of using other technologies is also important (Anantadjaya and Nawangwulan, 2006a; Yogaswara, et al, 2006). Perhaps, the use of technology in classroom setting can improve learning process. Barton (2006) had studied the relations between the effectiveness of learning process with experiences and the effect of academic atmosphere that teachers/lecturers could transpose to the students in classroom setting. The result of this empirical study showed that there was a positive correlation between the effectiveness of teaching-learning process with the experiences and the effect of academic atmosphere. Silver, et al (2000) had previously studied the effectiveness level of teaching-learning process. As a further study, Barton (2006) stated that an example of an academic effect that could be transferred to students is the teaching method. Different teaching method gave positive impact to the effectiveness of classroom learning process (Silver, et al, 2000). Examples of the effect of academic atmosphere that could be transferred to students include the use whiteboard as compared to blackboard or the use of LCD (using computer with Power Point) projector than Overhead (using transparency sheet) projector. Empirically, Yogaswara et al (2006) stated that the use of whiteboard or blackboard could influence understanding level of students. Therefore, the use of whiteboards or blackboard is directly influence the effectiveness level of learning process. Further, Yogaswara, et al (2006) concluded that the use of OHP or LCD projector also influence understanding level of students. Both off-line and on-line simulations had been done to measure the students’ understanding level. Off-line simulation could be conducted using OHP while on-line simulation could only be conducted using LCD projector and internet. Moreover, educational institutions should use good strategic thinking. By giving positive value to the students, the students will directly experience that value. This value could benefit the shareholders, organization members and other stakeholders. From the financial report perspective, it is clearly indicated that there is a gap between book value and market value in organization, for example in educational institution. Saleh, et al (2006) mentioned that the gap existed because there was a shift in economic source used by organization as way to create organization value, for example, moves from tangible assets to intangible assets. In educational industry, some institutions do not pay attention only to tangible assets such as the condition of building, facilities offered, but also to intangible assets such accreditation level, teacher’s skills and knowledge, and social responsibility. From economic view, it is clearly shown that there is an increase in intense competition among organizations, such as; market penetration, diversification and networking (Bridoux, 2004; Cardy and Selvarajan, 2006; Carroll and Hunter, 2005; Sangkala, 2006). Education industry also experiences similar case, at which the institution needs to do diversification and build network with other institutions. Building networking can be commencing from individual level within organization (Sutter, 2008). This individual then forms a group synergy among people within organization to do daily job activities together (Geisinger, 2004). Forming a group synergy in organization could make daily operational activities goes smooth, especially in the learning process (Yolles, 2008).

Rev. Integr. Bus. Econ. Res. Vol 2(1) 295
Copyright 2013 Society of Interdisciplinary Business Research (www.sibresearch.org)
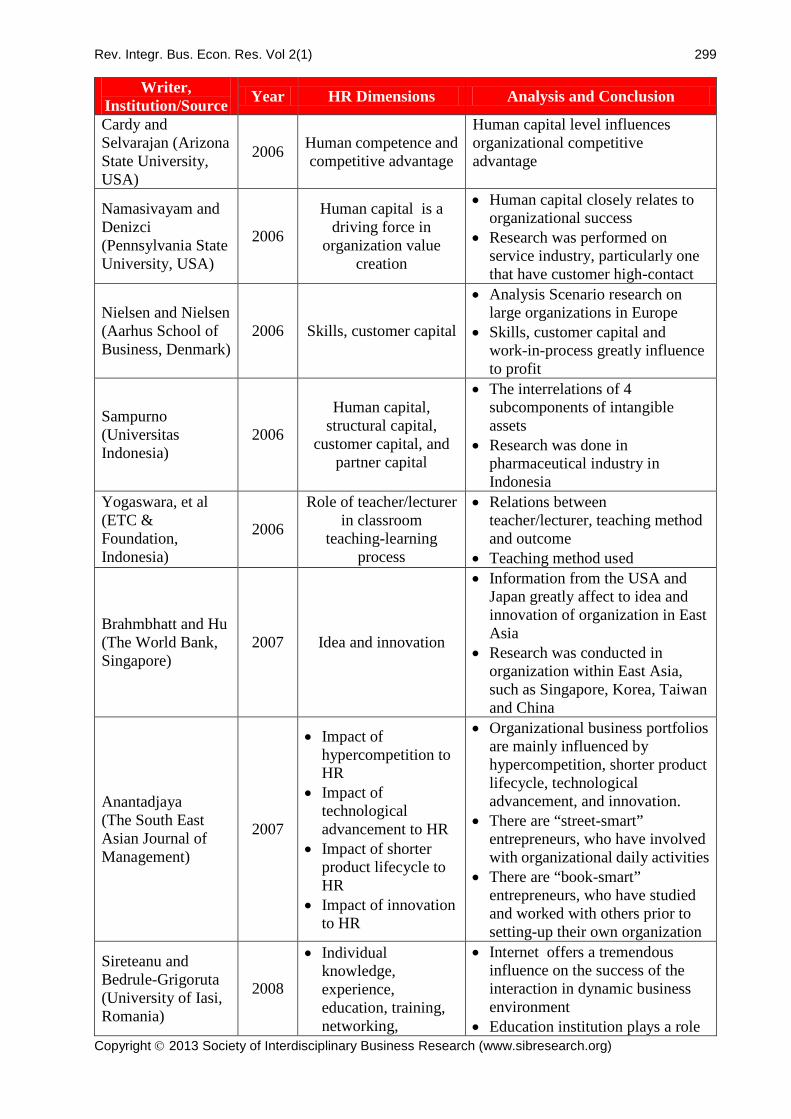
Human resources are expected to create a group synergy within organization. It is expected that the teacher/lecturer is able to transfer the learning process well. Thus, this can support the output process and create an organization value so that organization performance is better than before (Bridoux, 2004; Namasivayam dan Denizci, 2006; Richieri, et al, 2008; Saleh, et al, 2006). This research also aims to study factors effecting the teacher/lecturer quality in teaching method. Factors creating organization value can be studied through organization performance which can be measured by dimensions such as institution accrediation grade, number of students in institution and institution’s reputation. These factors are deeply analyzed to see how much every factors influence organization’s performance (Bridoux, 2004). Topics related to human resources quality, group synergy and value creation in education indusrty would be used for further study. 2. LITERATURE REVIEW The following table shows that American researchers have dominated the research on human resources development since 2000, though, some countries, such as; Canada, Australia, and some parts of Asia and Europe, have also researched similar topics. Some notable points are as follows; 1. The financial condition of organization still remains the parameter used for the research
(Anantadjaya, 2007a). The focus on human resources remains integrated with a large industrial scale. Market value or market capitalization has been used to measure the impact from human resources.
2. Since the year 2000, researches on human resources have not only been focused on employees
at organization, but on areas such as: a. SC (capital structure) consists of system, procedure, and rules of organization, b. CC (customer capital) refers to organization needs to maintain good relations with
customers, c. PC (partner capital) represents involvement of people and other organizations from which
a particular organization has a joint-cooperation with, d. IC (information capital) oversees the availability of information system, knowledge
management application and other necessary infrastructures to support the execution of organization strategy, and
e. OC (organization capital), which involves vision and mission of organization, the availability of capable leaders in every management level, in order to achieve organization’s strategic plan. The leaders must be able to direct the organization to achieve its goals, motivate the employees by providing incentive, sharing knowledge with the team and third party.
2. Additional factors discussed on the previous studies, include; commitment, talent, diversity,
wisdom, idea, innovation, brainpower, networking, internal corporate governance, competitive advantage, organization structure, organization culture, collaboration and knowledge management. These additional factors aim to create organizational value.
The table supports the argument that human resources play an important role as a prime source of strategic competence of organization. Strategic competence is major driving force of organization to survive (Cardy and Selvarajan, 2006; Colombo and Grilli, 2005; Sales, et al, 2006). The following table shows some previous research. It illustrates how those researches were conducted after the year 2000. From the managerial view, Kaplan and Norton (2004) mentioned that the use of Balance Score Card (BSC) could support the role of managers in organization. Strategic managerial role could only be shaped if organization focused on intangible assets that were categorized into human

Rev. Integr. Bus. Econ. Res. Vol 2(1) 296
Copyright 2013 Society of Interdisciplinary Business Research (www.sibresearch.org)
capital, information capital and organizational capital (Buckingham and Coffman, 1999). A country that did not invest in human resources would receive less output. The company growth would also be slower than other countries which make enormous human resources investment (Penrose, 1959; Stam, et al, 2006). At macro and micro level, intangible assets are proven to encourage long run value creation, including the growth of organization (Mansi and Reeb, 2002; Stam, et al, 2006). Intangible assets clarify how individual, technology and climate within organization enhance organization’s strategy (Kaplan and Norton, 2004). Yolles (2008), in the theory of social psychology of collectives, added that every individual will try to interact with others to form networking within inside or outside organization (Sutter, 2008).
Table 2.1: Previous Research after year 2000 Writer,
Institution/Source Year HR Dimensions Analysis and Conclusion
Dzinkowski (Accounting Management )
2000
Human Capital Measurement and
Management
Combination between human capital, organizational (structural) capital, customer (relational) capital greatly influenced to the intellectual capital measurement in organization
Silver, et al (Association for Supervision and Curriculum Development, Virginia, USA)
2000
Important role of multiple intelligence
(verbal-linguistic, logical-mathematical,
spatial, bodily-kinesthetic,
intrapersonal, musical, interpersonal, and
naturalist) for teacher/lecturer
• Studied various intellectuals owned by individuals
• Teacher/lecturer must be able to exercise various classroom teaching methods
Tanaszi and Duffi (Institute of Management Accountants, Canada)
2000 Knowledge assets
Showed the importance of knowledge for organization
Bell and Gersbach (Universitat Heidelberg, Germany)
2001 Young worker and education role in
society
Relation between your worker quality and education quality to support economic condition.
Brinker (Institute of Certified Public Accountants, USA)
2001 Competence, ability,
knowledge and commitment
• HR Ability and competence is the main key of knowledge, innovation.
• HR ability and competence level influenced employee commitment level to customer
Brown (Addison Wesley, USA) 2001
Teaching principles which lead to
interactive learning process
Relations between interactive methods with the success of classroom learning process.
Kalafut and Low (Strategic Leadership)
2001
Human capital quality, talent, diversity, Management and
employee relation, and
• Index is useful to calculate accurately organization value creation
• Key main success: quality,

Rev. Integr. Bus. Econ. Res. Vol 2(1) 297
Copyright 2013 Society of Interdisciplinary Business Research (www.sibresearch.org)
Writer, Institution/Source Year HR Dimensions Analysis and Conclusion
intangible value index employee talent, relations between management and employee and diversity
Malhotra (BizTech Network, USA) 2001 Ability, Skills, wisdom
• Ability and Skills influenced to organization performance
• Wisdom was additional factor which influenced to the improvement of organization performance
Marti (Journal of Intellectual Capital) 2001 Idea and innovation
• Human capital reflects how an organization shapes its intellectual capital
• Human capital is the prime source of organization value
• Human capital is a power tool of innovation
• Structural capital is needed (procedure, technology and system)
Peppard and Rylander (European Management Journal)
2001 Competence and intellectual intelligence
• Employee competence level illustrates intellectual intelligence level of an organization
• The existence of capital structure (system, structure, brand and intellectual property) encourages intellectual intelligence level
Seetharaman, et al (Journal of Intellectual Capital)
2001 Ability and brainpower The ability the employees perform their job is concentrated on their brainpower
Bontis and Fitz-enz (Journal of Intellectual Capital)
2002
Compensation, training and development cost, employee turnover and return on investment (ROI) gained from intellectual capital
• Human capital is a combination of compensation received by employees, training and development cost which could impinge on employee turnover
• Employee turnover enhancement reveals ROI reduction
• Intellectual capital impacts on organization’s ROI
Campbell, et al (Harvard Business School, USA)
2002 BSC, control system and organizational
change strategy
• Research was conducted in an organization which has 82 retail stores in the USA
• BSC is beneficial to implement a control system of organization activities
• The success of controlling and organizational change strategies relies on the employees’ ability to maintain their efficiency level
Goleman, et al 2002 Leadership and • Leaders of organization require

Rev. Integr. Bus. Econ. Res. Vol 2(1) 298
Copyright 2013 Society of Interdisciplinary Business Research (www.sibresearch.org)
Writer, Institution/Source Year HR Dimensions Analysis and Conclusion
(Harvard Graduate School of Business, USA)
emotional intelligence emotional maturity to lead • Emotional maturity of leaders and
employees shapes organization’s success
Edvinson (The Unic-Concepts) 2003 Brain, ability, and
networking
• Human brain affects employee’s skills and knowledge
• Human brain shapes execution process in organization to increase customer satisfaction
Engstrom, et al (Journal of Intellectual Capital)
2003 Intellectual capital at hotel industry
Employee’s intellectual capital influences hotel industry performance
Meritum (www.kunne.no) 2003 Knowledge, skills,
experience and ability
Human capital is the knowledge acquired by employee after leaving the organization
Marr and Adams (Measuring Business Excellence)
2004 BSC and intangible assets
Implementation of BSC is relatively unclear in measuring organization’s intangible assets
Tobin (University of Cincinnati, USA) 2004
Role of human investment, especially
students
Relations between investment amount and economic condition and performance
Colombo and Grilli (Research Policy, Politecnico di Milano, Italy)
2005 Human capital quality of owners/founders of
organization
• Human capital quality of owners/founders impacts on organization growth and development
• Research was performed on information-technology organizations in Italy
Carroll and Hunter (MIT Sloan School of Management, USA)
2005
Competence is necessary to give an influence to market
value
Learning process and market value escalation of organization depend on the ability of human capital within organization
Florackis (Applied Financial Economics Letters)
2005 Competence for
influencing internal corporate governance
• Human capital capabilities greatly influence controlling process continually so that organization could better organize and attract potential investor
• This relates to the overall performance improvement
• Research was done in large organizations in England
Stewart (University of Bath, UK) 2005 Component sections of
intellectual capital • Organization measurement of
intellectual capital
Barton (American University, USA) 2006
Scholarly productivity, scholarly influence and teaching effectiveness
in class
• Correlations between dimension, productivity, effect and effectiveness level
• Research was conducted for Faculty of Law in the USA
Rev. Integr. Bus. Econ. Res. Vol 2(1) 299
Copyright 2013 Society of Interdisciplinary Business Research (www.sibresearch.org)
Writer, Institution/Source Year HR Dimensions Analysis and Conclusion
Cardy and Selvarajan (Arizona State University, USA)
2006 Human competence and competitive advantage
Human capital level influences organizational competitive advantage
Namasivayam and Denizci (Pennsylvania State University, USA)
2006
Human capital is a driving force in
organization value creation
• Human capital closely relates to organizational success
• Research was performed on service industry, particularly one that have customer high-contact
Nielsen and Nielsen (Aarhus School of Business, Denmark)
2006 Skills, customer capital
• Analysis Scenario research on large organizations in Europe
• Skills, customer capital and work-in-process greatly influence to profit
Sampurno (Universitas Indonesia)
2006
Human capital, structural capital,
customer capital, and partner capital
• The interrelations of 4 subcomponents of intangible assets
• Research was done in pharmaceutical industry in Indonesia
Yogaswara, et al (ETC & Foundation, Indonesia)
2006
Role of teacher/lecturer in classroom
teaching-learning process
• Relations between teacher/lecturer, teaching method and outcome
• Teaching method used
Brahmbhatt and Hu (The World Bank, Singapore)
2007 Idea and innovation
• Information from the USA and Japan greatly affect to idea and innovation of organization in East Asia
• Research was conducted in organization within East Asia, such as Singapore, Korea, Taiwan and China
Anantadjaya (The South East Asian Journal of Management)
2007
• Impact of hypercompetition to HR
• Impact of technological advancement to HR
• Impact of shorter product lifecycle to HR
• Impact of innovation to HR
• Organizational business portfolios are mainly influenced by hypercompetition, shorter product lifecycle, technological advancement, and innovation.
• There are “street-smart” entrepreneurs, who have involved with organizational daily activities
• There are “book-smart” entrepreneurs, who have studied and worked with others prior to setting-up their own organization
Sireteanu and Bedrule-Grigoruta (University of Iasi, Romania)
2008
• Individual knowledge, experience, education, training, networking,
• Internet offers a tremendous influence on the success of the interaction in dynamic business environment
• Education institution plays a role
Rev. Integr. Bus. Econ. Res. Vol 2(1) 300
Copyright 2013 Society of Interdisciplinary Business Research (www.sibresearch.org)
Writer, Institution/Source Year HR Dimensions Analysis and Conclusion
collaboration and innovation
• Knowledge goods, intellectual capital, human capital, customer capital, and market capital
to disseminate information and learning in knowledge management
Bejar (Institut Telecom & Management SudParis, France)
2008
Intellectual capital helps technology
oriented organization survive
• Intellectual capital level of human resources greatly affect the organization lifecycle
• Research was performed to technology-oriented organizations in France
Datta and Chaudhuri (ICFAI Business School, India)
2008
Knowledge Management,
organization structure and culture
• Role of capital structure in organization development
• Organization structure shapes organization culture and influences the success of utilizing knowledge management
Richieri, et al (Escola Superior de Propaganda e Marketing, Brazil)
2008 Intellectual capital and value creation
• Intellectual capital affects the organization’s financial condition
• The effect of intellectual capital cannot be separated from capital structure of organization
• Research was done to 1,000 large organizations in Brazil
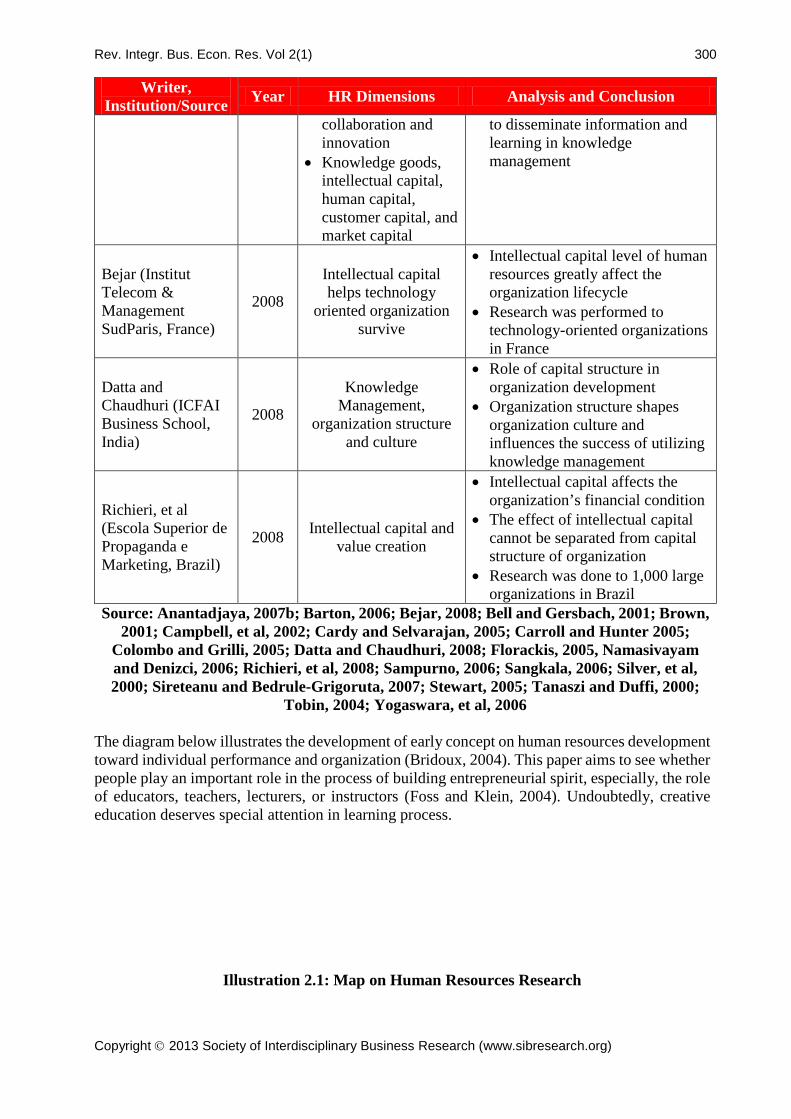
Source: Anantadjaya, 2007b; Barton, 2006; Bejar, 2008; Bell and Gersbach, 2001; Brown, 2001; Campbell, et al, 2002; Cardy and Selvarajan, 2005; Carroll and Hunter 2005;
Colombo and Grilli, 2005; Datta and Chaudhuri, 2008; Florackis, 2005, Namasivayam and Denizci, 2006; Richieri, et al, 2008; Sampurno, 2006; Sangkala, 2006; Silver, et al, 2000; Sireteanu and Bedrule-Grigoruta, 2007; Stewart, 2005; Tanaszi and Duffi, 2000;
Tobin, 2004; Yogaswara, et al, 2006 The diagram below illustrates the development of early concept on human resources development toward individual performance and organization (Bridoux, 2004). This paper aims to see whether people play an important role in the process of building entrepreneurial spirit, especially, the role of educators, teachers, lecturers, or instructors (Foss and Klein, 2004). Undoubtedly, creative education deserves special attention in learning process.
Illustration 2.1: Map on Human Resources Research

Rev. Integr. Bus. Econ. Res. Vol 2(1) 301
Copyright 2013 Society of Interdisciplinary Business Research (www.sibresearch.org)
Ability, behaviors, efforts, time(Davenport, 1999)
Ability to formulate solutions & alternatives(Hubert Saint-Onge, 1998)
Changing the status
quo
(Buckingham & Coffman,
1999)
Teaching Principles(Brown, 2001)
Human capital as the driver for value
creation(Namasivayam & Denizci,
2006)
Idea & innovation (Marti, 2001; Brahmbhatt
& Hu, 2007)
Ability, education, experience, value & social relationships(Sveiby, 1998)
Organizational Value(Jensen, et al, 1997)
Emotional Intelligence(Goleman, 1995)
Employees Attitude (Mirvis & Lawlwer, 1997)
Employees influence productivity
(Dertouzos, et al, 1989)
Changes via human resources
(Tucker, 1991)
Information sharing in SCM to reduce waste
(Womack, et al, 1990)
Job design, organizational structure,
systems, leadership(Hammer & Stanton, 1995)
Investment toward human capital
(Black & Lynch, 1996)
Competence & experience
(Skyrme, 1997)
Learning organization(Lazonick, 1997)
Intellectual capital(Bontis, 1998, 1999)
Human capital management
(Dzinkowski, 2000)
Ability, skills & wisdom
(Malhotra, 2001)Competence, ability,
pengetahuan & commitment(Brinker, 2001)
Ability & brainpower(Seetharaman, et al, 2001)
ROI of intellectual capital
(Bontis & Fitz-enz, 2002)
Kno
wle
dg
e as
sets
(Tan
aszi
& D
uffi,
200
0)
Quality of human capital, talent diversity, and
intangible value(Kalafut & Low, 2001)
BSC, monitoring & changes in organizational strategy
(Campbell, et al, 2002)
Leadership & emotional
intelligence (Goleman, et al, 2002)
Ability, brain & networking
(Edvinson, 2003)
BSC & intangible
assets
(Marr & Adams, 2004)
Quality of human capital as founders &
owners(Colombo & Grilli, 2005)
Competence & market value
(Carroll & Hunter, 2005)
Competence & internal corporate
governance(Malhotra, 2001)
Knowledge, competence, experience, value,
culture & philosophy(Edvinson & Malone, 1997)
Sub-component of intellectual capital
(Stewart, 2005)
Competence & competitive advantage
(Cardy & Selvarajan, 2006)
Skills & customer capital
(Nielsen & Nielsen, 2006)
Human capital, structural capital, customer capital,
partner capital (Sampurno, 2006)
Knowledge, experience,
education, training, networking & collaboration
(Sireteanu & Bedrule-Grigoruta, 2008)
Intellectual capital for hoteliers
(Engstrom, et al, 2003) & TI (Bejar, 2008) Intellectual capital &
value-added creation(Richieri, et al, 2008)
Mul
tip
le In
telli
gen
ce(S
ilver
, et a
l, 19
99)
Differentiated Classrooms
(Tomlinson, 1999)
Education Society(Clive & Gersbach, 2001)
Cultural Intelligence
(Early & Mosakowski,
2002)
Free education & country’s economic
condition (Chaudhury, 2002)
Investment toward
education
(Tobin, 2004)
Teaching Pedagogy(Yogaswara, et al, 2006)
BSC, information management &
judgmental effect(Lipe & Salterio, 1998)
Knowledge Management &
culture(Datta & Chaudhuri, 2008)
Competence & intellectual intelligence
(Peppard & Rylander, 2001)
Education & training(Nasseri, 1996; Azua &
Azua, 1998)
Training, competence &
ability
(Skandia Intellectual Capital,
1998)
Knowledge, ability & experience
(Cevendish, et al, 1999; Soros, 1999)
Source: various references
The following table shows market value and government spending on education industry in some countries. These tables illustrate the condition and development of a country depends on its people. For instance, Indonesian GDP, from 2008-2011, declined. The allocation for education budget was cut from 3.6% to a mere 2.8%. On the other hand, stock market value in Indonesia had increased dramatically from US$99 billion to US$390 billion, during the same period of 2008-2011.
Table 2.2 (a): Data Comparison Among Countries Data per 2008 Indonesia Singapore Malaysia India
GDP US$916.7 billion US$237.9 billion US$385.2 billion US$3,304 billion GDP per Capita US$3,900 US$52,600 US$15,200 US$2,900 Market share
value US$98.76 billion US$268.6 billion US$187.1 billion US$645.5 billion
Inflation 9.9% 6.5% 5.4% 3.5%
Education budget 3.6% of GDP (US$33 billion)
3.7% of GDP (US$8.8 billion)
6.2% of GDP (US$23.8 billion
3.2% of GDP (US$105 trilion)
Source: www.cia.gov, 2010 Since the education budget was calculated as a percentage of GDP, unsurprisingly, education budget allocation in Indonesia was higher than Malaysia. However, as a percentage of GDP, Malaysian educational budget remained higher than Indonesian percentage of GDP, 6.2% in 2008 for Malaysia as compared to 3.6% in 2008 for Indonesia, and 4.1% in 2011 for Malaysia as
Rev. Integr. Bus. Econ. Res. Vol 2(1) 302
Copyright 2013 Society of Interdisciplinary Business Research (www.sibresearch.org)
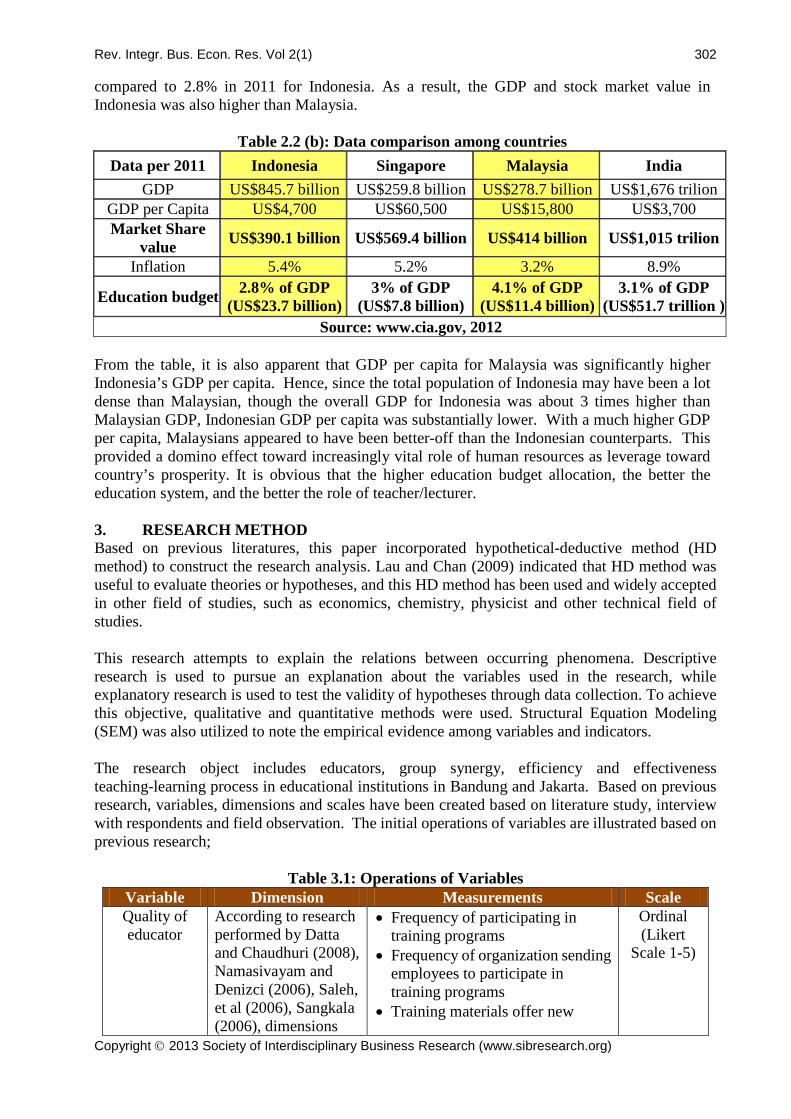
compared to 2.8% in 2011 for Indonesia. As a result, the GDP and stock market value in Indonesia was also higher than Malaysia.
Table 2.2 (b): Data comparison among countries Data per 2011 Indonesia Singapore Malaysia India
GDP US$845.7 billion US$259.8 billion US$278.7 billion US$1,676 trilion GDP per Capita US$4,700 US$60,500 US$15,800 US$3,700 Market Share
value US$390.1 billion US$569.4 billion US$414 billion US$1,015 trilion
Inflation 5.4% 5.2% 3.2% 8.9%
Education budget 2.8% of GDP (US$23.7 billion)
3% of GDP (US$7.8 billion)
4.1% of GDP (US$11.4 billion)
3.1% of GDP (US$51.7 trillion )
Source: www.cia.gov, 2012 From the table, it is also apparent that GDP per capita for Malaysia was significantly higher Indonesia’s GDP per capita. Hence, since the total population of Indonesia may have been a lot dense than Malaysian, though the overall GDP for Indonesia was about 3 times higher than Malaysian GDP, Indonesian GDP per capita was substantially lower. With a much higher GDP per capita, Malaysians appeared to have been better-off than the Indonesian counterparts. This provided a domino effect toward increasingly vital role of human resources as leverage toward country’s prosperity. It is obvious that the higher education budget allocation, the better the education system, and the better the role of teacher/lecturer. 3. RESEARCH METHOD Based on previous literatures, this paper incorporated hypothetical-deductive method (HD method) to construct the research analysis. Lau and Chan (2009) indicated that HD method was useful to evaluate theories or hypotheses, and this HD method has been used and widely accepted in other field of studies, such as economics, chemistry, physicist and other technical field of studies. This research attempts to explain the relations between occurring phenomena. Descriptive research is used to pursue an explanation about the variables used in the research, while explanatory research is used to test the validity of hypotheses through data collection. To achieve this objective, qualitative and quantitative methods were used. Structural Equation Modeling (SEM) was also utilized to note the empirical evidence among variables and indicators. The research object includes educators, group synergy, efficiency and effectiveness teaching-learning process in educational institutions in Bandung and Jakarta. Based on previous research, variables, dimensions and scales have been created based on literature study, interview with respondents and field observation. The initial operations of variables are illustrated based on previous research;
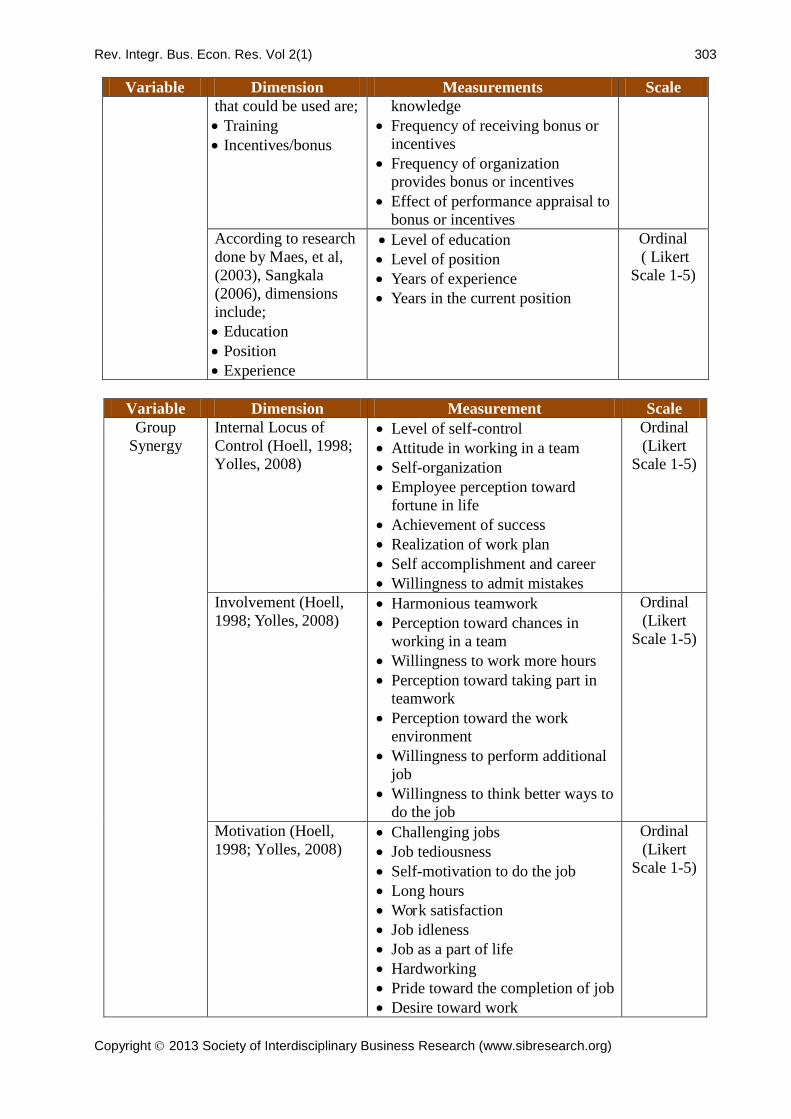
Table 3.1: Operations of Variables Variable Dimension Measurements Scale Quality of educator
According to research performed by Datta and Chaudhuri (2008), Namasivayam and Denizci (2006), Saleh, et al (2006), Sangkala (2006), dimensions
• Frequency of participating in training programs
• Frequency of organization sending employees to participate in training programs
• Training materials offer new
Ordinal (Likert
Scale 1-5)
Rev. Integr. Bus. Econ. Res. Vol 2(1) 303
Copyright 2013 Society of Interdisciplinary Business Research (www.sibresearch.org)
Variable Dimension Measurements Scale that could be used are; • Training • Incentives/bonus
knowledge • Frequency of receiving bonus or
incentives • Frequency of organization
provides bonus or incentives • Effect of performance appraisal to
bonus or incentives According to research done by Maes, et al, (2003), Sangkala (2006), dimensions include; • Education • Position • Experience
• Level of education • Level of position • Years of experience • Years in the current position
Ordinal ( Likert
Scale 1-5)
Variable Dimension Measurement Scale
Group Synergy
Internal Locus of Control (Hoell, 1998; Yolles, 2008)
• Level of self-control • Attitude in working in a team • Self-organization • Employee perception toward
fortune in life • Achievement of success • Realization of work plan • Self accomplishment and career • Willingness to admit mistakes
Ordinal (Likert
Scale 1-5)
Involvement (Hoell, 1998; Yolles, 2008)
• Harmonious teamwork • Perception toward chances in
working in a team • Willingness to work more hours • Perception toward taking part in
teamwork • Perception toward the work
environment • Willingness to perform additional
job • Willingness to think better ways to
do the job
Ordinal (Likert
Scale 1-5)
Motivation (Hoell, 1998; Yolles, 2008)
• Challenging jobs • Job tediousness • Self-motivation to do the job • Long hours • Work satisfaction • Job idleness • Job as a part of life • Hardworking • Pride toward the completion of job • Desire toward work
Ordinal (Likert
Scale 1-5)

Rev. Integr. Bus. Econ. Res. Vol 2(1) 304
Copyright 2013 Society of Interdisciplinary Business Research (www.sibresearch.org)
Variable Dimension Measurement Scale Quality of Students
Knowledge, idea/concept development (Anantadjaya, 2007a; Istijanto, 2006)
• General knowledge • Special knowledge about particular
industry • Knowledge/concept on business
sense/economic reasons
Ordinal (Likert
Scale 1-5)
Risk tolerance (Anantadjaya, 2007a; Istijanto, 2006)
• Risk tolerance toward learning process
• Risk tolerance toward doing business
Ordinal (Likert
Scale 1-5)
Variable Dimension Measurement Scale Efficiency • Delivery process
• Timeframe • Assignment • Multi-tasking
• Material discussion turnover • On-time submission of work/tasks • The impact to students • Ability to do multitasking
activities • Time to finish assignments • Quality of work
Ordinal ( Likert
scale 1-5)
Effectiveness
• Level of understanding
• Knowledge development
• Skill development • Target
achievement
• Value • Better work performance quality
than previous work • Better work process than previous
period
Ordinal (Likert
Scale 1-5)
Since these operations of variables are merely based on previous researches, those sets of variables and indicators need to be verified accordingly. 3.1. POPULATION & SAMPLE Since this study concentrates on the role of educators, the population for this study includes all teachers, lecturers, facilitators, trainers, parents, entrepreneurs/business owners, and business practitioners/managers in Indonesia. However, since the comprehensive coverage may require an enormous time, efforts and resources, this study may have to limit the areas into two cities of Jakarta and Bandung, including their neighboring regions. This was particularly true for the intended offline questionnaire distribution, interview sessions, classroom observations, and research model verifications.
Table 3.2: Sample Size Determination Data
Estimate of True Proportion 0.5 Sampling Error 0.1 Confidence Level 95%
Intermediate Calculations Z Value -1.95996398 Calculated Sample Size 96.03647052
Result Sample Size Needed 97
Source: PHStat
Rev. Integr. Bus. Econ. Res. Vol 2(1) 305
Copyright 2013 Society of Interdisciplinary Business Research (www.sibresearch.org)
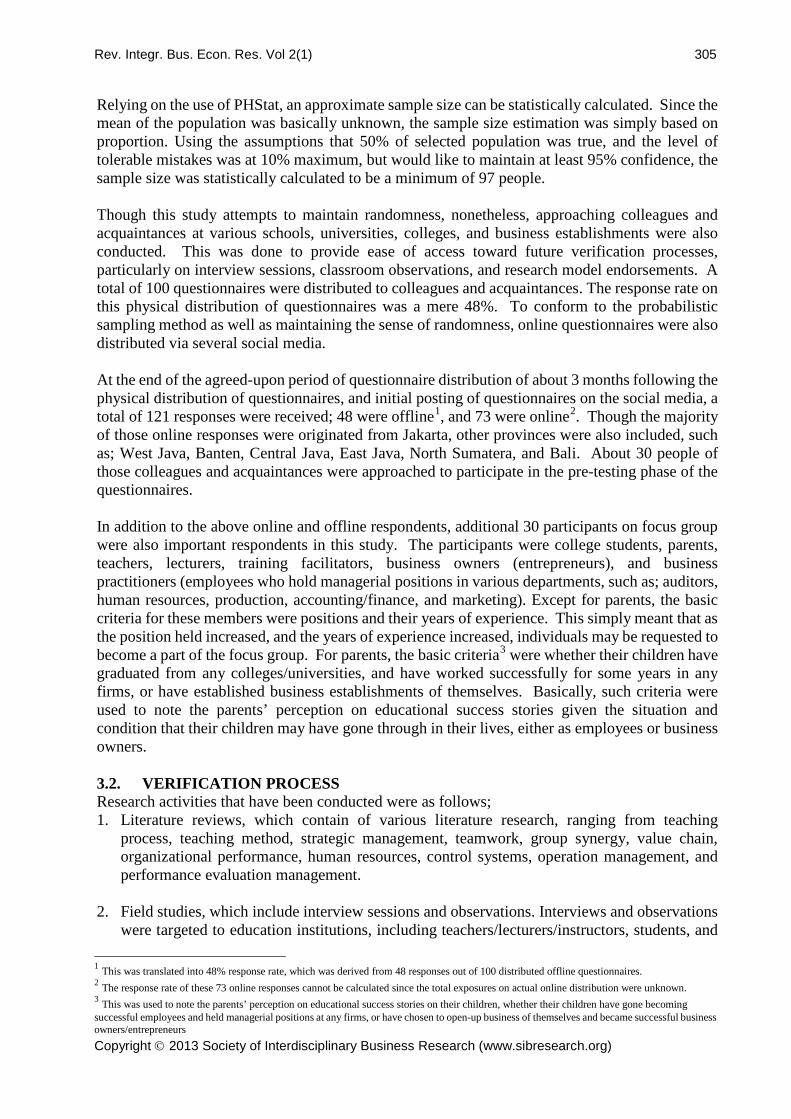
Relying on the use of PHStat, an approximate sample size can be statistically calculated. Since the mean of the population was basically unknown, the sample size estimation was simply based on proportion. Using the assumptions that 50% of selected population was true, and the level of tolerable mistakes was at 10% maximum, but would like to maintain at least 95% confidence, the sample size was statistically calculated to be a minimum of 97 people. Though this study attempts to maintain randomness, nonetheless, approaching colleagues and acquaintances at various schools, universities, colleges, and business establishments were also conducted. This was done to provide ease of access toward future verification processes, particularly on interview sessions, classroom observations, and research model endorsements. A total of 100 questionnaires were distributed to colleagues and acquaintances. The response rate on this physical distribution of questionnaires was a mere 48%. To conform to the probabilistic sampling method as well as maintaining the sense of randomness, online questionnaires were also distributed via several social media. At the end of the agreed-upon period of questionnaire distribution of about 3 months following the physical distribution of questionnaires, and initial posting of questionnaires on the social media, a total of 121 responses were received; 48 were offline1, and 73 were online2
In addition to the above online and offline respondents, additional 30 participants on focus group were also important respondents in this study. The participants were college students, parents, teachers, lecturers, training facilitators, business owners (entrepreneurs), and business practitioners (employees who hold managerial positions in various departments, such as; auditors, human resources, production, accounting/finance, and marketing). Except for parents, the basic criteria for these members were positions and their years of experience. This simply meant that as the position held increased, and the years of experience increased, individuals may be requested to become a part of the focus group. For parents, the basic criteria
. Though the majority of those online responses were originated from Jakarta, other provinces were also included, such as; West Java, Banten, Central Java, East Java, North Sumatera, and Bali. About 30 people of those colleagues and acquaintances were approached to participate in the pre-testing phase of the questionnaires.
3
1. Literature reviews, which contain of various literature research, ranging from teaching process, teaching method, strategic management, teamwork, group synergy, value chain, organizational performance, human resources, control systems, operation management, and performance evaluation management.
were whether their children have graduated from any colleges/universities, and have worked successfully for some years in any firms, or have established business establishments of themselves. Basically, such criteria were used to note the parents’ perception on educational success stories given the situation and condition that their children may have gone through in their lives, either as employees or business owners. 3.2. VERIFICATION PROCESS Research activities that have been conducted were as follows;
2. Field studies, which include interview sessions and observations. Interviews and observations
were targeted to education institutions, including teachers/lecturers/instructors, students, and 1 This was translated into 48% response rate, which was derived from 48 responses out of 100 distributed offline questionnaires. 2 The response rate of these 73 online responses cannot be calculated since the total exposures on actual online distribution were unknown. 3 This was used to note the parents’ perception on educational success stories on their children, whether their children have gone becoming successful employees and held managerial positions at any firms, or have chosen to open-up business of themselves and became successful business owners/entrepreneurs
Rev. Integr. Bus. Econ. Res. Vol 2(1) 306
Copyright 2013 Society of Interdisciplinary Business Research (www.sibresearch.org)
parents of the students, and profit-oriented organizations4
. These interviews and observations aim to discover the creativity/innovation and perception about education method that should be performed at educational institutions in Indonesia.
3. Classification of research method, research model and variables that will be used in this research. During this process, dimensions/factors, and scales were also identified. Then, verification process would be made within educational institutions and profit-oriented organization to ensure the equivalency among the theory and the actual process in the field. At this stage, involvement of the participants of the focus group was crucial.
4. The next step is data gathering and analysis. Such activities involve constructing
questionnaires, distributing questionnaires, pre-testing questionnaires 5
, data entry using pre-testing questionnaires, final distribution of questionnaires at targeted time, and data analyzing process.
5. A further step involved data verification, research model verification 6
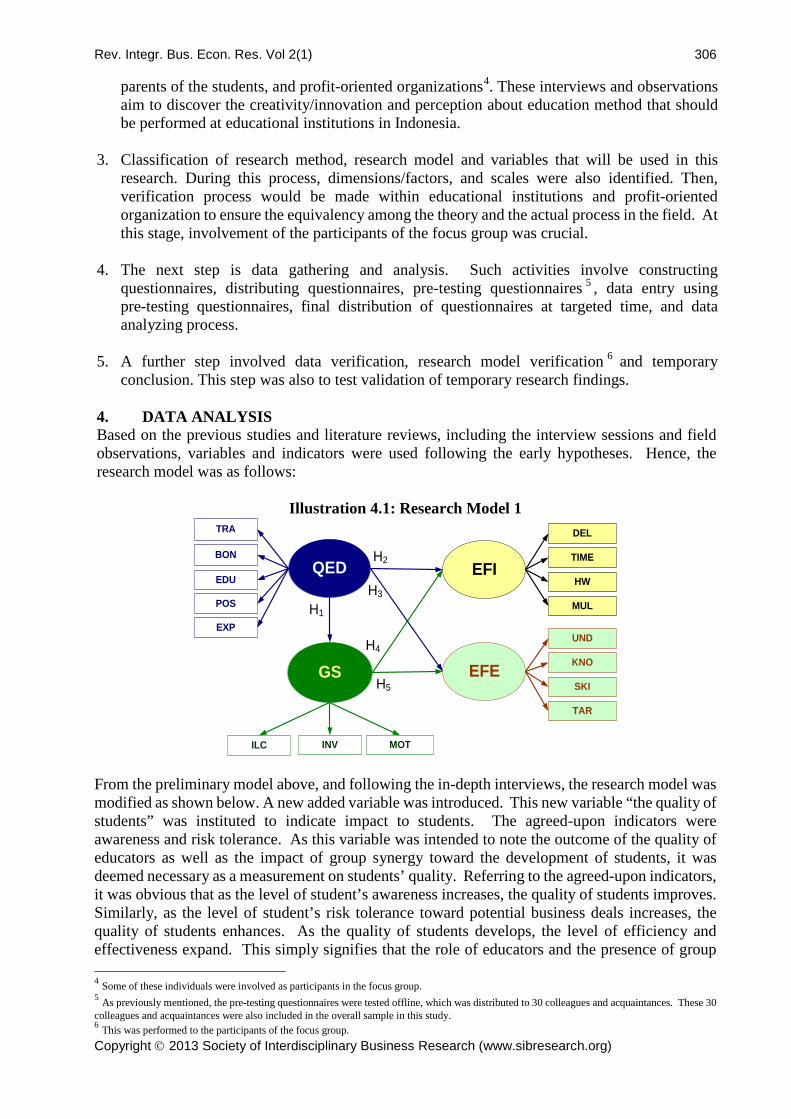
4. DATA ANALYSIS Based on the previous studies and literature reviews, including the interview sessions and field observations, variables and indicators were used following the early hypotheses. Hence, the research model was as follows:
Illustration 4.1: Research Model 1
and temporary conclusion. This step was also to test validation of temporary research findings.
TRA
BONQED
POS
EXP
EDU
GS
ILC INV MOT
H1
H4
H5
H2
H3
EFI
EFE
DEL
TIME
HW
MUL
UND
KNO
SKI
TAR
From the preliminary model above, and following the in-depth interviews, the research model was modified as shown below. A new added variable was introduced. This new variable “the quality of students” was instituted to indicate impact to students. The agreed-upon indicators were awareness and risk tolerance. As this variable was intended to note the outcome of the quality of educators as well as the impact of group synergy toward the development of students, it was deemed necessary as a measurement on students’ quality. Referring to the agreed-upon indicators, it was obvious that as the level of student’s awareness increases, the quality of students improves. Similarly, as the level of student’s risk tolerance toward potential business deals increases, the quality of students enhances. As the quality of students develops, the level of efficiency and effectiveness expand. This simply signifies that the role of educators and the presence of group 4 Some of these individuals were involved as participants in the focus group. 5 As previously mentioned, the pre-testing questionnaires were tested offline, which was distributed to 30 colleagues and acquaintances. These 30 colleagues and acquaintances were also included in the overall sample in this study. 6 This was performed to the participants of the focus group.

Rev. Integr. Bus. Econ. Res. Vol 2(1) 307
Copyright 2013 Society of Interdisciplinary Business Research (www.sibresearch.org)
synergy among educators within the educational institutions have influenced the quality of students, which are able to be approximated by efficiency and effectiveness.
Illustration 4.2: Research Model 2 TRA
BONQED
POS
EXP
EDU
GS
ILC INV MOT
H1
H4
H5
H2
H3
EFI
EFE
DEL
TIME
HW
MUL
UND
KNO
SKI
TAR
QST
AWA
RIS
The second model above was modified after further expanded literature reviews, as shown below. Logically, the efficiency and effective measurements were supposed to be influenced by the quality of educators and the existence of group synergy in organizations. The quality of students should be the ultimate output of the overall learning process (Lazonick, 1997). Hence, the combination of quality of teachers/lecturers and group synergy influenced the level of efficiency and effectiveness of educational processes. Depending on the level of efficiency and effectiveness, the quality of students may be influenced, particularly their entrepreneurial spirit. This third research model was confirmed with the “offline” respondents, including the focus group participants. The third research model appeared to be the most relevant, as confirmed by respondents.
Illustration 4.3: Research Model 3
TRA
BONQED
POS
EXP
EDU
GS
ILC
INV
MOT
H1
H4
H5
H2
H3
EFI
EFE
DEL
TIM
E
HW MUL
UND
KNO
SKI
TAR
QSTAWA
RIS
H6
H7
4.1. RELIABILITY TEST Reliability test is used to measure consistency level of variables used in questionnaires. The following tables show reliability statistics of the data gathered in this study.
Rev. Integr. Bus. Econ. Res. Vol 2(1) 308
Copyright 2013 Society of Interdisciplinary Business Research (www.sibresearch.org)
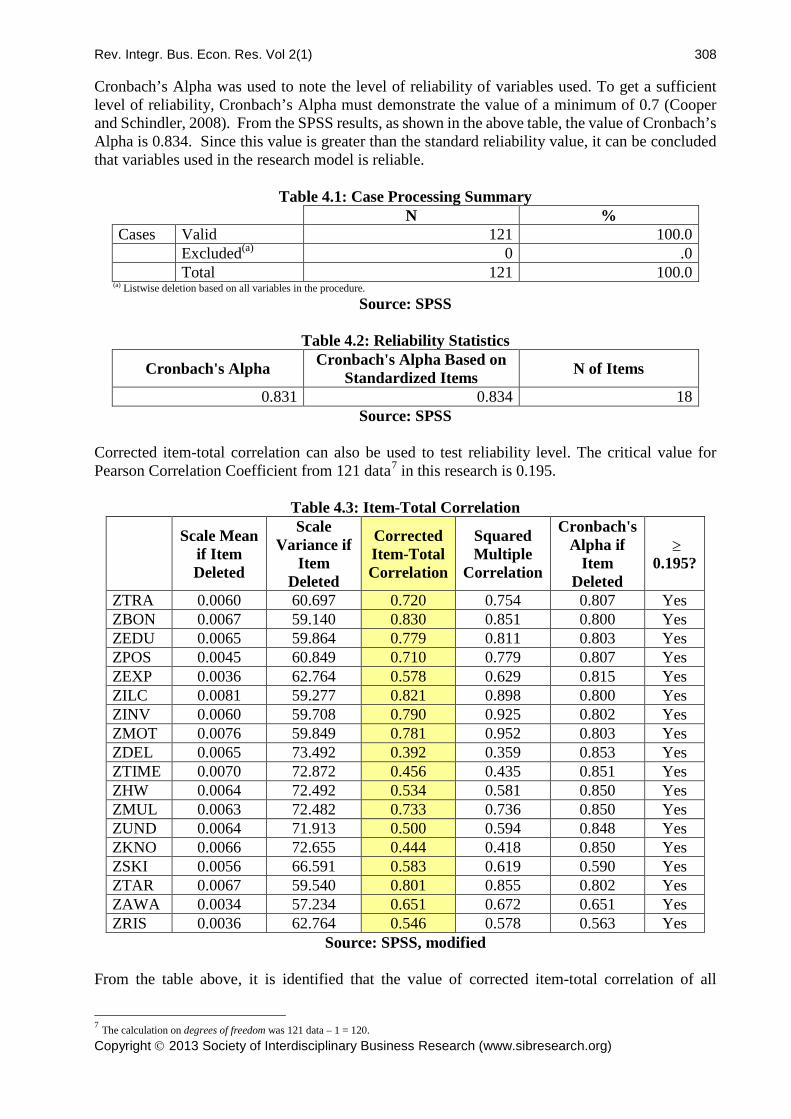
Cronbach’s Alpha was used to note the level of reliability of variables used. To get a sufficient level of reliability, Cronbach’s Alpha must demonstrate the value of a minimum of 0.7 (Cooper and Schindler, 2008). From the SPSS results, as shown in the above table, the value of Cronbach’s Alpha is 0.834. Since this value is greater than the standard reliability value, it can be concluded that variables used in the research model is reliable.
Table 4.1: Case Processing Summary N % Cases Valid 121 100.0 Excluded(a) 0 .0 Total 121 100.0
(a) Listwise deletion based on all variables in the procedure. Source: SPSS
Table 4.2: Reliability Statistics
Cronbach's Alpha Cronbach's Alpha Based on Standardized Items N of Items
0.831 0.834 18 Source: SPSS
Corrected item-total correlation can also be used to test reliability level. The critical value for Pearson Correlation Coefficient from 121 data7 in this research is 0.195.
Table 4.3: Item-Total Correlation
Scale Mean
if Item Deleted
Scale Variance if
Item Deleted
Corrected Item-Total Correlation
Squared Multiple
Correlation
Cronbach's Alpha if
Item Deleted
≥ 0.195?
ZTRA 0.0060 60.697 0.720 0.754 0.807 Yes ZBON 0.0067 59.140 0.830 0.851 0.800 Yes ZEDU 0.0065 59.864 0.779 0.811 0.803 Yes ZPOS 0.0045 60.849 0.710 0.779 0.807 Yes ZEXP 0.0036 62.764 0.578 0.629 0.815 Yes ZILC 0.0081 59.277 0.821 0.898 0.800 Yes ZINV 0.0060 59.708 0.790 0.925 0.802 Yes ZMOT 0.0076 59.849 0.781 0.952 0.803 Yes ZDEL 0.0065 73.492 0.392 0.359 0.853 Yes ZTIME 0.0070 72.872 0.456 0.435 0.851 Yes ZHW 0.0064 72.492 0.534 0.581 0.850 Yes ZMUL 0.0063 72.482 0.733 0.736 0.850 Yes ZUND 0.0064 71.913 0.500 0.594 0.848 Yes ZKNO 0.0066 72.655 0.444 0.418 0.850 Yes ZSKI 0.0056 66.591 0.583 0.619 0.590 Yes ZTAR 0.0067 59.540 0.801 0.855 0.802 Yes ZAWA 0.0034 57.234 0.651 0.672 0.651 Yes ZRIS 0.0036 62.764 0.546 0.578 0.563 Yes
Source: SPSS, modified From the table above, it is identified that the value of corrected item-total correlation of all
7 The calculation on degrees of freedom was 121 data – 1 = 120.

Rev. Integr. Bus. Econ. Res. Vol 2(1) 309
Copyright 2013 Society of Interdisciplinary Business Research (www.sibresearch.org)
indicators used is greater than critical value, 0.195. Therefore, all indicators are statistically reliable on this study. 4.2. VALIDITY TEST Model fit test is used for validity testing of the research model. Using AMOS, all variables can be tested for best-fit simultaneously to address the hypothesis testing. The following table shows the result of validity testing.
Table 4.4: Model Fit Test
Model RMSEA CFI TLI NFI PNFI Default model 0.119 0.872 0.781 0.822 0.634 Saturated model 1.000 1.000 0.000 Independence model 0.213 0.000 0.000 0.000 0.000
Source: SPSS Data results from AMOS show that Root Mean Square Error of Approximation (RMSEA) is 0.119. If the value of RMSEA is less than 1, the model is considered valid (Ghozali, 2004). In addition, at the value of Comparative Fix Index (“CFI”) of 0.872, the value of Tucker-Lewis Index (“TLI”) of 0.781, value of Normed Fit Index (“NFI”) of 0.822, and the value of Parsimonious Goodness of Fit Index (“PGFI”) of 0.634, the model can also be said to have satisfactory met the criteria on validity testing (Ghozali, 2004). Thus, since the model has met the criteria of validity testing, the model is considered valid.
Table 4.5: Tests of Normality
Kolmogorov-Smirnov Shapiro-Wilk Normally
distributed?
Sig. Sig. Sig ≥ α (α = 0.05)
ZTRA 0.072 0.065 Yes ZBON 0.200 0.378 Yes ZEDU 0.156 0.168 Yes ZPOS 0.253 0.265 Yes ZEXP 0.261 0.274 Yes ZILC 0.200 0.236 Yes ZINV 0.200 0.371 Yes ZMOT 0.141 0.178 Yes ZDEL 0.120 0.148 Yes ZTIME 0.200 0.186 Yes ZHW 0.055 0.059 Yes (marginal)
ZMUL 0.050 0.061 Yes (marginal) ZUND 0.254 0.266 Yes ZKNO 0.052 0.063 Yes (marginal) ZSKI 0.135 0.145 Yes ZTAR 0.056 0.071 Yes (marginal) ZAWA 0.351 0.369 Yes ZRIS 0.349 0.321 Yes
Source: SPSS, modified From test of normality table above, it can be inferred that though there were some variables that
Rev. Integr. Bus. Econ. Res. Vol 2(1) 310
Copyright 2013 Society of Interdisciplinary Business Research (www.sibresearch.org)
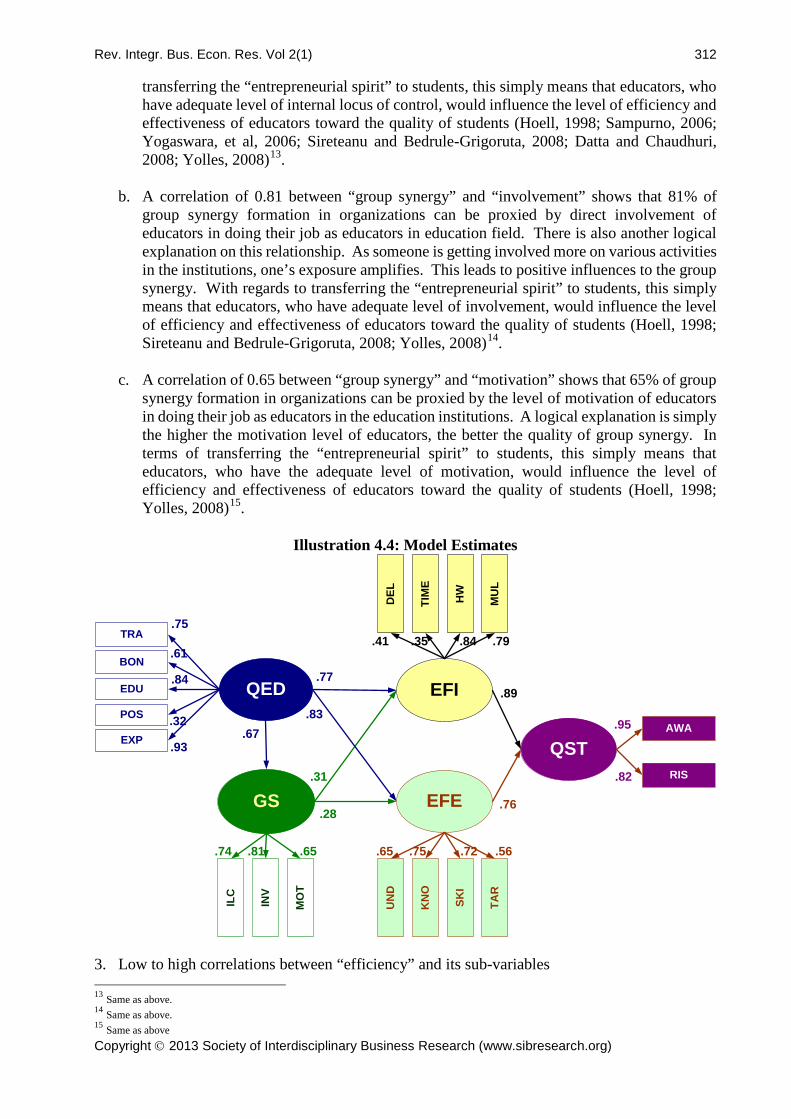
only marginally satisfied the criteria, all variables used in this study could be considered fulfilling the normal distribution criteria. Therefore, further analysis can be performed. 4.3. MODEL TESTING After model is considered valid and normal, the next step is to test model structure. This test measures causal relations between variables used in this study, particularly, exogenous and endogenous variables. Further, this test is useful to discover whether variables used are relevant with the initial expectations and successfully reflect the underlying theoretical discussion. From path analysis, it can be implied that the quality of teachers/lecturers/instructors, is latent exogenous variable; while group synergy, efficiency, effectiveness, and the quality of students are latent endogenous variables. From AMOS structural model, as shown in the following illustration, it can be inferred that: 1. There are strong correlations between “quality of educators” and its sub-variables, though
there are also weak correlations. a. A correlation of 0.75 between “quality of educators” and “training” means that 75% of
quality of educators can be measured with training programs offered by organization, particularly the soft-skill training. In terms of transferring the “entrepreneurial spirit” to students, this simply means that educators should have adequate training as entrepreneurs (hands-on training, or apprenticeship), or training to become entrepreneurs (hard and soft-skills). The more training that educators have on their belts, the better the quality. At a glance, this conforms to the old saying, “practice makes perfect”. The more practice one has, the better one would become. This would lead to become the “street-smart” entrepreneurs or “book-smart” entrepreneurs (Anantadjaya, 2007b). This finding is relevant to what Bontis and Fitz-enz (Sangkala, 2006) and Sireteanu and Bedrule-Grigoruta (2008) have stated in their researches that human capital must be taken care of to minimize the likelihood of employee turnover, which in turns, improving the organizational performance as organizational time and efforts are targeted to operational activities, rather than constant recruitment and selection processes. As employees are trained and developed further, their brain expands. This pushes up the brain power and level of ability, which influences idea and innovation (Namasivayam and Denizci, 2006; Sangkala, 2006; Datta and Chaudhuri, 2008)8
.
b. A correlation of 0.61 between “quality of educators” and “bonus” illustrates that 61% of quality of educators can be measured by amount of bonus/incentives (Namasivayam and Denizci, 2006; Sangkala, 2006; Datta and Chaudhuri, 2008)9
. Though this may appear ironic, bonuses/incentives are based on the classical theory of motivation. This finding is relevant to what Bontis and Fitz-enz (Sangkala, 2006) have mentioned in their research, which was, the cost of training and development should be perceived as the total investment toward human resources. As human resources were trained and developed further, they would likely contribute to the organizational pool of intellectual capital (Istijanto, 2006; Noe, et al, 2006; Sangkala, 2006). The level of intellectual capital mirrored the organizational ROI. Likewise, Tobin (2004) had also found out that there were relationships among investment in human resources, economic condition of certain regions/countries, and individual/organizational performance.
c. A correlation of 0.84 between “quality of educators” and “education” indicates that 84% of quality of educators can be measured by the level of education of those educators
8 These references are listed chronologically based on the years of research. 9 Same as above.

Rev. Integr. Bus. Econ. Res. Vol 2(1) 311
Copyright 2013 Society of Interdisciplinary Business Research (www.sibresearch.org)
themselves. This seems logically accepted. The higher the level of education, the better the quality of educators, in terms of knowledge transfer to students. With regards to transferring the “entrepreneurial spirit” to students, this simply means that educators should have adequate education (Bell and Gersbach, 2001; Brown, 2001; Maes, et al, 2003; Colombo and Grilli, 2005; Sangkala, 2006) 10
. As knowledge has become increasingly important, organizations may push for more education on their employees (Sangkala, 2006). As the level of education increases, quality of employees jumps (Bell and Gersbach, 2001). This supports the organizational financial condition as well as the surrounding economy (Bell and Gersbach, 2001; Chaudhury, 2002). Also, Brown (2001) indicated that the ability to conduct interactive learning processes may have been influenced by previous encounters during school years. This interaction may lead to the improvement of quality of educators in their attempts in transferring the “entrepreneurial spirit” to students. Successful transfers, eventually, may influence the quality of owners, which then, brings about impact to organizational growth and development (Colombo and Grilli, 2005; Garnsey, et al, 2004).
d. A correlation of 0.32 between “quality of educators” and “position” implies that 32% quality of educators can be measured by the position held by teachers/lecturers. Though it may not be fully applicable in education industry, at least in the Indonesian educational systems, the higher positions may represent the higher comprehensive level of competence and capability. In terms of transferring the “entrepreneurial spirit” to students, this simply means that educators should have held managerial positions (Maes, et al, 2003; Carroll and Hunter, 2005; Cardy and Selvarajan, 2006; Sangkala, 2006; Datta and Chaudhuri, 2008)11
. Logically, the higher the level of managerial positions held, the better the level of competence and capability of such individuals. At least this is true in terms of maintaining/keeping the same position for some time. Hence, to keep the same position for some time, one must have entrepreneurial spirit, which may likely treating one’s job and position as one’s own business. Goleman, et al (Sangkala, 2001) indicated that the basic ingredient for one’s leading position was emotional intelligence. One key success factor for those who hold posts as leaders is a relatively high level of emotional maturity. Such an emotionally maturity shapes organizational success. As people have held managerial positions for some time, their emotional maturity rises, competence jumps, and capability swells. These combinations push-up quality of educators.
e. A correlation of 0.93 between “quality of educators” and “experiences” shows that 93% of quality of teachers can be measured by the years of experiences of educators at non-educational organizations. This is undoubtedly widely-accepted as the length of experience increases, particularly in various organizations/industries, one’s exposure amplifies. This influences the quality of educators. With regards to transferring the “entrepreneurial spirit” to students, this simply means that educators should have adequate length of experience (Maes, et al, 2003; Sangkala, 2006; Sireteanu and Bedrule-Grigoruta, 2008)12
.
2. Strong correlations occur between “group synergy” and its sub-variables a. A correlation of 0.74 between “group synergy” and “internal locus of control” shows that
74% of group synergy formation in organizations can be proxied by internal locus of control of educators. This is logically accepted as one’s internal drive pushes forward, particularly in various organizations/industries, one’s exposure amplifies. This leads to positive influences to the quality of synergy within organizations. With regards to
10 Same as above. 11 Same as above. 12 Same as above.
Rev. Integr. Bus. Econ. Res. Vol 2(1) 312
Copyright 2013 Society of Interdisciplinary Business Research (www.sibresearch.org)
transferring the “entrepreneurial spirit” to students, this simply means that educators, who have adequate level of internal locus of control, would influence the level of efficiency and effectiveness of educators toward the quality of students (Hoell, 1998; Sampurno, 2006; Yogaswara, et al, 2006; Sireteanu and Bedrule-Grigoruta, 2008; Datta and Chaudhuri, 2008; Yolles, 2008)13
.
b. A correlation of 0.81 between “group synergy” and “involvement” shows that 81% of group synergy formation in organizations can be proxied by direct involvement of educators in doing their job as educators in education field. There is also another logical explanation on this relationship. As someone is getting involved more on various activities in the institutions, one’s exposure amplifies. This leads to positive influences to the group synergy. With regards to transferring the “entrepreneurial spirit” to students, this simply means that educators, who have adequate level of involvement, would influence the level of efficiency and effectiveness of educators toward the quality of students (Hoell, 1998; Sireteanu and Bedrule-Grigoruta, 2008; Yolles, 2008)14
.
c. A correlation of 0.65 between “group synergy” and “motivation” shows that 65% of group synergy formation in organizations can be proxied by the level of motivation of educators in doing their job as educators in the education institutions. A logical explanation is simply the higher the motivation level of educators, the better the quality of group synergy. In terms of transferring the “entrepreneurial spirit” to students, this simply means that educators, who have the adequate level of motivation, would influence the level of efficiency and effectiveness of educators toward the quality of students (Hoell, 1998; Yolles, 2008)15
Illustration 4.4: Model Estimates
.
TRA
BON
QEDPOS
EXP
EDU
GS
ILC
INV
MO
T
.67
.31
.28
.77
.83
EFI
EFE
DEL
TIM
E
HW
MU
L
UN
D
KN
O
SKI
TAR
QSTAWA
RIS
.89
.76
.75
.61
.84
.32
.93
.74 .81 .65 .65 .75 .72 .56
.41 .35 .84 .79
.95
.82
3. Low to high correlations between “efficiency” and its sub-variables 13 Same as above. 14 Same as above. 15 Same as above
Rev. Integr. Bus. Econ. Res. Vol 2(1) 313
Copyright 2013 Society of Interdisciplinary Business Research (www.sibresearch.org)
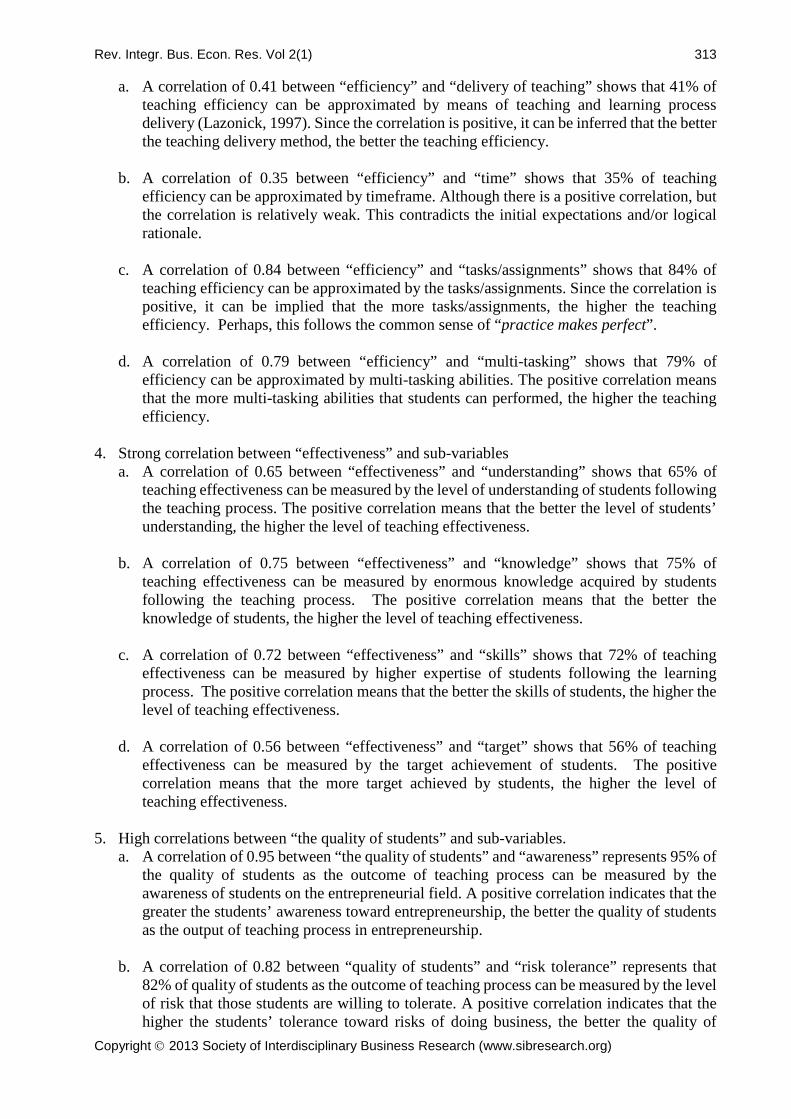
a. A correlation of 0.41 between “efficiency” and “delivery of teaching” shows that 41% of teaching efficiency can be approximated by means of teaching and learning process delivery (Lazonick, 1997). Since the correlation is positive, it can be inferred that the better the teaching delivery method, the better the teaching efficiency.
b. A correlation of 0.35 between “efficiency” and “time” shows that 35% of teaching
efficiency can be approximated by timeframe. Although there is a positive correlation, but the correlation is relatively weak. This contradicts the initial expectations and/or logical rationale.
c. A correlation of 0.84 between “efficiency” and “tasks/assignments” shows that 84% of
teaching efficiency can be approximated by the tasks/assignments. Since the correlation is positive, it can be implied that the more tasks/assignments, the higher the teaching efficiency. Perhaps, this follows the common sense of “practice makes perfect”.
d. A correlation of 0.79 between “efficiency” and “multi-tasking” shows that 79% of
efficiency can be approximated by multi-tasking abilities. The positive correlation means that the more multi-tasking abilities that students can performed, the higher the teaching efficiency.
4. Strong correlation between “effectiveness” and sub-variables
a. A correlation of 0.65 between “effectiveness” and “understanding” shows that 65% of teaching effectiveness can be measured by the level of understanding of students following the teaching process. The positive correlation means that the better the level of students’ understanding, the higher the level of teaching effectiveness.
b. A correlation of 0.75 between “effectiveness” and “knowledge” shows that 75% of
teaching effectiveness can be measured by enormous knowledge acquired by students following the teaching process. The positive correlation means that the better the knowledge of students, the higher the level of teaching effectiveness.
c. A correlation of 0.72 between “effectiveness” and “skills” shows that 72% of teaching
effectiveness can be measured by higher expertise of students following the learning process. The positive correlation means that the better the skills of students, the higher the level of teaching effectiveness.
d. A correlation of 0.56 between “effectiveness” and “target” shows that 56% of teaching
effectiveness can be measured by the target achievement of students. The positive correlation means that the more target achieved by students, the higher the level of teaching effectiveness.
5. High correlations between “the quality of students” and sub-variables.
a. A correlation of 0.95 between “the quality of students” and “awareness” represents 95% of the quality of students as the outcome of teaching process can be measured by the awareness of students on the entrepreneurial field. A positive correlation indicates that the greater the students’ awareness toward entrepreneurship, the better the quality of students as the output of teaching process in entrepreneurship.
b. A correlation of 0.82 between “quality of students” and “risk tolerance” represents that
82% of quality of students as the outcome of teaching process can be measured by the level of risk that those students are willing to tolerate. A positive correlation indicates that the higher the students’ tolerance toward risks of doing business, the better the quality of
Rev. Integr. Bus. Econ. Res. Vol 2(1) 314
Copyright 2013 Society of Interdisciplinary Business Research (www.sibresearch.org)
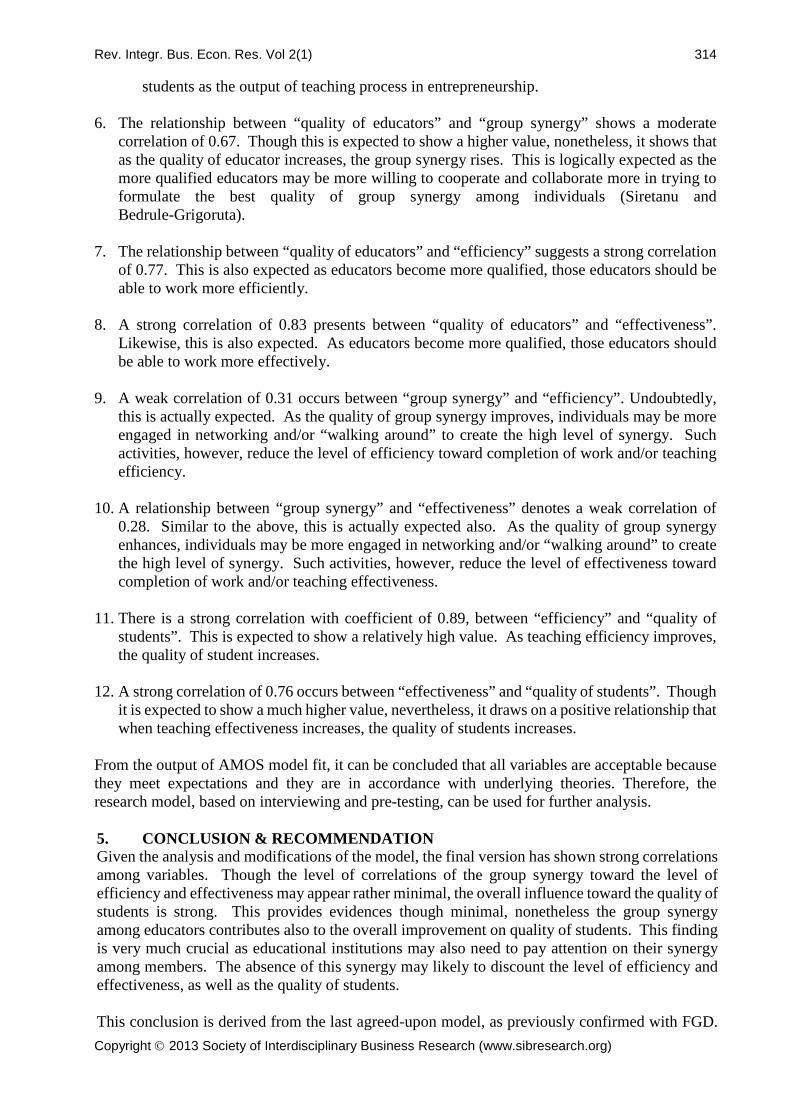
students as the output of teaching process in entrepreneurship. 6. The relationship between “quality of educators” and “group synergy” shows a moderate
correlation of 0.67. Though this is expected to show a higher value, nonetheless, it shows that as the quality of educator increases, the group synergy rises. This is logically expected as the more qualified educators may be more willing to cooperate and collaborate more in trying to formulate the best quality of group synergy among individuals (Siretanu and Bedrule-Grigoruta).
7. The relationship between “quality of educators” and “efficiency” suggests a strong correlation
of 0.77. This is also expected as educators become more qualified, those educators should be able to work more efficiently.
8. A strong correlation of 0.83 presents between “quality of educators” and “effectiveness”.
Likewise, this is also expected. As educators become more qualified, those educators should be able to work more effectively.
9. A weak correlation of 0.31 occurs between “group synergy” and “efficiency”. Undoubtedly,
this is actually expected. As the quality of group synergy improves, individuals may be more engaged in networking and/or “walking around” to create the high level of synergy. Such activities, however, reduce the level of efficiency toward completion of work and/or teaching efficiency.
10. A relationship between “group synergy” and “effectiveness” denotes a weak correlation of
0.28. Similar to the above, this is actually expected also. As the quality of group synergy enhances, individuals may be more engaged in networking and/or “walking around” to create the high level of synergy. Such activities, however, reduce the level of effectiveness toward completion of work and/or teaching effectiveness.
11. There is a strong correlation with coefficient of 0.89, between “efficiency” and “quality of
students”. This is expected to show a relatively high value. As teaching efficiency improves, the quality of student increases.
12. A strong correlation of 0.76 occurs between “effectiveness” and “quality of students”. Though
it is expected to show a much higher value, nevertheless, it draws on a positive relationship that when teaching effectiveness increases, the quality of students increases.
From the output of AMOS model fit, it can be concluded that all variables are acceptable because they meet expectations and they are in accordance with underlying theories. Therefore, the research model, based on interviewing and pre-testing, can be used for further analysis. 5. CONCLUSION & RECOMMENDATION Given the analysis and modifications of the model, the final version has shown strong correlations among variables. Though the level of correlations of the group synergy toward the level of efficiency and effectiveness may appear rather minimal, the overall influence toward the quality of students is strong. This provides evidences though minimal, nonetheless the group synergy among educators contributes also to the overall improvement on quality of students. This finding is very much crucial as educational institutions may also need to pay attention on their synergy among members. The absence of this synergy may likely to discount the level of efficiency and effectiveness, as well as the quality of students. This conclusion is derived from the last agreed-upon model, as previously confirmed with FGD.
Rev. Integr. Bus. Econ. Res. Vol 2(1) 315
Copyright 2013 Society of Interdisciplinary Business Research (www.sibresearch.org)
Nevertheless, this becomes apparent that the research model may become the focal point in the near future. Future research may choose to focus on the variability of synergy, parameters of success, parameters of quality of students, personal diversity of educators, as well as possible modifications on research model. REFERENCES
[1] Anantadjaya, Sam PD (2009), “Measuring Human Resources: A Case Study in Small and Medium Enterprises”, proceeding, Seminar Nasional Industrial Services 2009, Jurusan Teknik Industri, Universitas Sultan Ageng Tirtayasa, Cilegon, April 29-30, 2009, Banten: Indonesia, p. III-101-114, ISBN # 978-979-19280-0-7. Available online at www.ssrn.com
[2] Anantadjaya, Sam PD (2007a), “Financial Aspects of HR Scorecard & Business Process Evaluation: An Empirical Study in Retail & Service Industries”, proceeding, International Management Symposium Universitas Surabaya, Surabaya: Indonesia. Available online at www.ssrn.com
[3] Anantadjaya, Sam PD (2007b), “Entrepreneurs vs. Business Plans: A Study of Practicality and Usefulness”, South East Asian Journal of Management, Vol. 1, No. 2, pp. 143-168. Available online at www.ssrn.com
[4] Anantadjaya, Sam PD, and Irma M. Nawangwulan (2006a), “Lecturers’ Competencies: A Case Study in International Universities”, prosiding, Semiloka Nasional, Institut Pertanian Bogor, Departemen Manajemen, Fakultas Ekonomi and Manajemen, Bogor: Indonesia. Available online at www.ssrn.com
[5] Anantadjaya, Sam PD, and Irma M. Nawangwulan (2006b), “A Different Approach on Early Child Education: Profitable?”, International Finance Corporation, 1st Annual Private Sector Development Research Competition, Washington, DC: USA.
[6] Anantadjaya, Samuel PD (2005), “Teaching in Higher Education: The Needs for Improvement Analysis”, working papers, The 5th Conference on South East Asian Associations for Institutional Research, Bali: Indonesia.
[7] Barton, Benjamin (2006), “Is There a Correlation Between Scholarly Productivity, Scholarly Influence and Teaching Effectiveness in American Law Schools? An Empirical Study”. Available online at www.ssrn.com/abstract=913421, July 1, 2006.
[8] Bejar, Yosra (2008), “The Impact of Intellectual Capital on French Technology Firms Survival”, working papers, Institut Telecom & Management SudParis, Paris: France. Available online at www.ssrn.com
[9] Bell, Clive, and Hans Gersbach (2001), “Child Labor and the Education of Society”, discussion paper no. 338, The Institute for the Study of Labor, Universitat Heidelberg, Germany, August 2001.
[10] Bridoux, F (2004), A Resource-Base Approach to Performance and Competition: An Overview of The Connections Between Resources and Competition, Luvain, Belgium Institut et de Gestion, Universite Catholique de Louvain. Available online at www.ssrn.com
[11] Brown, H. Douglas (2001), Teaching by Principles: An Interactive Approach to Language Pedagogy, 2nd Edition, New York, USA, Addison Wesley Longman, Inc.
[12] Buckingham, Marcus and Curt Coffman (1999), First, Break All The Rules: What The World’s Greatest Managers Do Differently, Simon & Schuster, New York: USA.
[13] Campbell, Dennis, Srikant Datar, Susan Cohen Kulp, and V.G. Narayanan (2002), “Using the Balanced Scorecard as a Control System for Monitoring and Revising Corporate Strategy”, working papers, Harvard Negotiation, Organizations, and Market Research Paper, no. 02-35, Harvard Business School, Massachusetts: USA. Available online at www.ssrn.com

Rev. Integr. Bus. Econ. Res. Vol 2(1) 316
Copyright 2013 Society of Interdisciplinary Business Research (www.sibresearch.org)
[14] Cardy, Robert L., and T.T. Selvarajan (2005), Competencies: Alternative Frameworks for Competitive Advantage, Business Horizon, no. 49, p. 235-245, Kelly School of Business, Indiana University, USA. Available online at www.sciencedirect.com
[15] Carroll, Tim and Starling D. Hunter (2005), "Organizational Design, Organizational Learning, and the Market Value of the Firm", MIT Sloan Research Paper No. 4563-05. Available online at www.ssrn.com
[16] Chaudhury, Sarbajit (2002), “Incident of Child Labor, Free Education Policy and Trade Liberalization in A Developing Economy”, working papers, University of Calcutta, India. Available online at www.ssrn.com/abstract=31179.
[17] Coase, Richard H (1937), “The Nature of the Firm”, Economica, New Series, vol. 4, no. 16, November 1937, p. 386-405.
[18] Colombo, Massimo G, and Luca Grilli (2005), “Founders’ Human Capital and The Growth of New Technology-based Firms: A Competence-based View”, Research Policy 34, Politecnico di Milano, Department of Economics, Management, and Industrial Engineering, Pza Leonardo da Vinci, Milan, Italy, p. 795-816. Available online at www.sciencedirect.com.
[19] Cooper, Donald R., and Pamela S. Schindler (2008), Business Research Methods, 10th Edition, International Edition, McGraw-Hill/Irwin, New York: USA.
[20] Dailey, Anne (2005), “Developing Citizens”, Iowa Law Review. Available online at www.ssrn.com/abstract=713843.
[21] Datta, Avimanyu, and Sukumar Ray Chaudhuri (2008), “Role of Organizational Structure and Culture in Introducing an Effective Knowledge Setup”, Journal of Knowledge Management, vol. 2, no. 4, p. 63-77. Available online at www.ssrn.com
[22] Early, P. Christopher, and Elaine Mosakowski (2004), “Cultural Intelligence”, Harvard Business Review, vol. 82, no. 10, Harvard Business School Publishing Corporation, Massachusetts: USA, October 2004, p. 139-146.
[23] Florackis, Chrisostomos (2005), “Internal Corporate Governance Mechanism and Corporate Performance: Evidence from UK Firms”, Applied Financial Economics Letters, vol. 1, p. 211-216, Taylor & Francis Group, Ltd, UK. Available online at www.ssrn.com
[24] Foss, Nicolai, and Peter G. Klein (2004), “Entrepreneurship and the Economic Theory of the Firm: Any Gains from Trade?”, CORI Working Papers no. 2004-09, University of Missouri – Columbia, August 2004, Missouri: USA. Available online at www.ssrn.com
[25] Garnsey, Elizabeth W., Erik Stam, Paul Heffernan, and Oliver Hugo (2004), "New Firm Growth: Exploring Processes and Paths", January 16, 2004, ERIM Report Series Reference No. ERS-2003-096-ORG, Erasmus Research Institute of Management, Rotterdam: The Netherlands. Available online at www.ssrn.com
[26] Geisinger, Alex (2004), “A Group Identity Theory of Social Norms and Its Implications”, Tulane Law Review, Vol. 78, p. 605-652.
[27] Ghozali, Imam (2004), Model Persamaan Struktural: Konsep and Aplikasi dengan Program AMOS ver. 5.0, Badan Penerbit Universitas Diponegoro, Semarang: Indonesia.
[28] Hisrich, Robert D., Michael P. Peters, and Dean A. Sheperd (2005), Entrepreneurship, 6th Edition, International Edition, McGraw-Hill/Irwin, New York: USA.
[29] Hoell, Robert Craig (1998), “Determinants of Union Member Attitudes Towards Employee Involvement Programs”, dissertation, Doctor of Philosophy in Management, Virginia Polytechnic Institute, Blacksburg, Virginia: USA.
[30] Istijanto (2006), Riset Sumber Daya Manusia: Cara Praktis Mendeteksi Dimensi-Dimensi Kerja Karyawan, PT Gramedia Pustaka Utama, Jakarta: Indonesia.
[31] Kaplan, Robert S., and David P. Norton (2004), Strategy Maps: Converting Intangible Assets into Tangible Outcomes, Harvard Business School Publishing Corporation, Massachusetts: USA.
[32] Lau, Joe, and Jonathan Chan (2009), “Tutorial S01: The Hypothetical Deductive

Rev. Integr. Bus. Econ. Res. Vol 2(1) 317
Copyright 2013 Society of Interdisciplinary Business Research (www.sibresearch.org)
Reasoning”, Module: Scientific Reasoning, free online learning resources on critical thinking, Department of Philosophy, University of Hong Kong. Available online at http://philosophy.hku.hk/think/sci
[33] Lazonick, William (1997), "Organizational Learning and International Competition: The Skill-Base Hypothesis". Levy Economics Institute WP #201. Available online at www.ssrn.com
[34] Maes, Johan, Luc Sels, and Sophie De Winne (2003), “Innovation as a Corporate Entrepreneurial Outcome in Newly Established Firms: A Human Resource-Based View”, working paper, Department of Applied Economics, Katholieke Universiteit Leuven, Leuven: Belgium. Available online at www.ssrn.com
[35] Mansi, Sattar A., and David M. Reeb (2002), Corporate Diversification: What Gets Discounted?, The Journal of Finance, Vol. LVII, no. 5, p. 2167-2183.
[36] Namasivayam, Karthik, and Basak Denizci (2006), “Human Capital in Service Organizations: Identifying Value Drivers”, Journal of Intellectual Capital, vol. 7, no. 3, p. 381-393.
[37] Noe, Raymond A., John R. Hollenbeck, Barry Gerhart, and Patrick M. Wright (2006), Human Resources Management: Gaining A Competitive Advantage, 5th Edition, International Edition, McGraw-Hill/Irwin, New York: USA.
[38] Penrose, Edith T (1959), “The Growth of the Firm”, New York and Oxford, New York: USA.
[39] Richieri, Flavio L., Leonardo Fernando Cruz Basso, and Diogenes De Leiva Martin (2008), “Intellectual Capital and The Creation of Value in Brazilian Companies”, working papers, Escola Superior de Propaganda e Marketing, Sao Paulo: Brazil. Available online at www.ssrn.com
[40] Saleh, Norman Mohd, Mara Ridhuan Che Abdul Rahman, and Mohamat Sabri Hassan (2006), “Ownership Structure and Intellectual Capital Performance in Malaysian Companies Listed on MESDAQ”, working papers # UKM-EP-04-FRGS-0005-2006, School of Accounting, Faculty of Economics and Business, Universiti Kebangsaan Malaysia. Available online at www.ssrn.com
[41] Sampurno (2006), “Peran Aktiva Nirwujud Pada Kinerja Perusahaan: Studi Industri Farmasi di Indonesia”, proceeding, The 1st Doctoral Journey in Management, Management Research Center, Fakultas Ekonomi, Universitas Indonesia, Jakarta: Indonesia.
[42] Sangkala (2006), Intellectual Capital Management: Strategi Baru Membangun Daya Saing Perusahaan, Penerbit Yapensi, Jakarta: Indonesia.
[43] Santosa, T. Elisabeth Chintya, and Rony Setiawan (2004), “Modal Intelektual Sebagai Strategi Organisasi Dalam Memenangkan Keunggulan Bersaing di Era Informasi”, Jurnal Manajemen, vol. 4, no. 1, Program Studi Manajemen, Fakultas Ekonomi, Universitas Kristen Maranatha, Bandung: Indonesia, November 2004, p. 61-78.
[44] Silver, Harvey F, Richard W. Strong, and Matthew J. Perini (2000), So Each May Learn: Integrating Learning Styles and Multiple Intelligences, Association for Supervision and Curriculum Development, Virginia: USA
[45] Sireteanu, Napoleon Alexandru, and Maria Viorica Bedrule-Grigoruta (2007), “Perspective of Knowledge Management in University”, working papers, University of Iasi, Iasi: Romania. Available online at www.ssrn.com
[46] Stam, Erik, Elizabeth Garnsey, and Paul Heffernan (2006), “A Penrosean Theory of the Firm: Implications and Applications for the Study of the Growth of Young Firms”, Economics of the Firm: Analysis, Evolution, and History, Routledge Studies in Global Competition. Available online at www.ssrn.com
[47] Stewart, J. (2005), “Identifying the Sub-Components of Intellectual Capital: A Literature Review and Development of Measure”, Working Paper Series # 2005.05, University of Bath, Claverton: UK.

Rev. Integr. Bus. Econ. Res. Vol 2(1) 318
Copyright 2013 Society of Interdisciplinary Business Research (www.sibresearch.org)
[48] Sutter, Matthias (2008), “Individual Behavior and Group Membership: Comment”, working papers in Economics and Statistics no. 2008-23, University of Innsbruck, Austria. Available online at www.ssrn.com
[49] Tanaszi, M., and J. Duffi. (2000). Measuring Knowledge Assets. CMA, Canada. [50] Tobin, Donald B. (2004), “Investing in Our Children: A Not So Radical Proposal”,
University of Cincinnati Law Review, vol. 73, 2004. [51] Tomlinson, Carol Ann (1999), The Differentiated Classroom: Responding to the Needs
of All Learners, Association for Supervision and Curriculum Development, Virginia, USA.
[52] www.cia.gov, accessed on November 1, 2012, at 9:45 AM [53] Yogaswara, Prasetya, Sam PD Anantadjaya, and Irma M. Nawangwulan (2006),
“Education Research”, working papers, ETC & Foundation, Bandung: Indonesia. [54] Yolles, Maurice (2008), “The Social Psychology of Collectives and Their Pathologies”,
Economic Corruption: Detection, Costs, and Prevention, F. N. In De Luca (ed), Nova Science Publishers, Inc., New York: USA
[55] ------ (2006), “The Strategic Blue Print on Planning and Developing The ICT Literate Human Resource in Indonesia”, working papers of the Center of Research of Development, Ministry of Communication and Information Technology, Republic of Indonesia, version 1.0, Jakarta: Indonesia.
Related Documents