Cradle to Gate Life Cycle Assessment of North American Cellulosic Fiberboard Production Prepared for: AWC – The American Wood Council By: Maureen Puettmann, WoodLife Environmental Consultants, LLC Richard Bergman, Forest Products Laboratory, USDA Forest Service Elaine Oneil, CORRIM, University of Washington Version 1 December 2015 Version 2 January 2016

Welcome message from author
This document is posted to help you gain knowledge. Please leave a comment to let me know what you think about it! Share it to your friends and learn new things together.
Transcript
Cradle to Gate Life Cycle Assessment of North American Cellulosic Fiberboard Production
Prepared for:
AWC – The American Wood Council
By: Maureen Puettmann, WoodLife Environmental Consultants, LLC
Richard Bergman, Forest Products Laboratory, USDA Forest Service
Elaine Oneil, CORRIM, University of Washington
Version 1 December 2015
Version 2 January 2016
2
Table of Contents List of Tables ................................................................................................................................................ 3
List of figures ................................................................................................................................................ 4
1 Introduction ........................................................................................................................................... 5
2 Description of Product .......................................................................................................................... 5
2.1 Study goals and scope ................................................................................................................... 7
2.2 Intended audience ......................................................................................................................... 7
2.3 Comparative assertions ................................................................................................................. 7
2.4 Functional and declared unit ......................................................................................................... 8
2.5 System boundaries ........................................................................................................................ 8
2.6 Description of data/Process descriptions .................................................................................... 10
2.6.1 Feedstock resources ............................................................................................................ 10
2.6.2 Woody Feedstock Inputs ..................................................................................................... 11
2.6.3 Cellulosic fiberboard manufacturing................................................................................... 13
3 Cut off rules ........................................................................................................................................ 18
4 Data sourcing and averaging ............................................................................................................... 19
4.1 Primary and secondary data sources ........................................................................................... 19
4.2 Data quality requirements ........................................................................................................... 20
4.3 Assumptions and limitations ....................................................................................................... 21
5 Life-cycle inventory analysis .............................................................................................................. 21
5.1 Data collection and calculations methods ................................................................................... 21
5.2 Allocation rules ........................................................................................................................... 23
5.3 Gate-to-gate LCI of cellulosic fiberboard manufacturing system ............................................... 23
5.4 Cradle-to-gate LCI results ........................................................................................................... 25
6 Life-cycle impact assessment results .................................................................................................. 28
7 Carbon ................................................................................................................................................. 31
8 Life Cycle Interpretation ..................................................................................................................... 31
8.1 Identification of the significant issues ........................................................................................ 31
8.2 Life cycle phase contribution analysis ........................................................................................ 32
8.3 Substance contribution analysis .................................................................................................. 32
8.4 Completeness, sensitivity and consistency checks ...................................................................... 33
9 Conclusions, limitations, and recommendations ................................................................................. 35
10 Critical review ................................................................................................................................. 36
10.1 Internal review ............................................................................................................................ 36
10.2 External review ........................................................................................................................... 36
11 References ....................................................................................................................................... 37
3
Appendix A – Economic allocation ............................................................................................................ 40
12 Economic Allocation ...................................................................................................................... 40
12.1 Cradle-to-gate LCI results – Economic Allocation ..................................................................... 40
12.2 Life-cycle impact assessment ...................................................................................................... 44
12.3 Carbon ......................................................................................................................................... 45
Appendix B - Life cycle inventory, Full Results ........................................................................................ 46
Air Emissions – Mass Allocation ............................................................................................................ 46
Water Emissions – Mass Allocation ....................................................................................................... 51
Air Emissions – Economic Allocation .................................................................................................... 56
Water Emissions – Economic Allocation ............................................................................................... 61
Appendix C – Substance Contribution Analysis ......................................................................................... 66
List of Tables
Table 1 Typical production dimensions of cellulosic fiberboard (www.fiberboard.org). ............................ 6 Table 2 Fuel consumption for regional forest resource management processes (regeneration, thinning, and
harvest). ....................................................................................................................................................... 10 Table 3 Wood feedstock types and source for input for cellulosic fiberboard production, North American
average. ....................................................................................................................................................... 12 Table 4 Weighted average delivery distance (one-way) for materials to cellulosic fiberboard mill, North
American average. ...................................................................................................................................... 14 Table 5 Percentage of energy source for electricity for producing North American cellulosic fiberboard. 16 Table 6 On-site heat inputs per 1 m3 cellulosic fiberboard, North American average (unallocated). ......... 16 Table 7 CORRIM Wood Boiler used in the production of cellulosic fiberboard (Puettmann and Milota
2015). .......................................................................................................................................................... 17 Table 8 Materials used in packaging and shipping per m3 cellulosic fiberboard, North American average
(unallocated). .............................................................................................................................................. 18 Table 9 Secondary LCI data sources used. ................................................................................................. 20 Table 10 Mass balance of cellulosic fiberboard manufacturing per m3, North America (unallocated). ..... 22 Table 11 Unit process inputs/outputs to produce 1 m3 of cellulosic fiberboard, North American average
(unallocated). .............................................................................................................................................. 23 Table 12 Raw material consumption for energy production per 1 m3 of cellulosic fiberboard, North
American average (mass allocation). .......................................................................................................... 25 Table 13 Air emissions released per 1 m3 of cellulosic fiberboard, North American average (mass
allocation). .................................................................................................................................................. 26 Table 14 Emissions to water released per 1 m3 of cellulosic fiberboard, North American average (mass
allocation). .................................................................................................................................................. 27 Table 15 Waste to treatment per 1 m3 of cellulosic fiberboard, North American average (mass allocation).
.................................................................................................................................................................... 28 Table 16 Selected impact indicators, characterization models, and impact categories. .............................. 29 Table 17 Environmental performance of 1 m3 cellulosic fiberboard, North American average (mass
allocation). .................................................................................................................................................. 30 Table 18 Carbon per 1 m3 cellulosic fiberboard, North American average (mass allocation). ................... 31

4
Table 19 Life cycle stages contribution analysis of 1 cubic meter (m3) of cellulosic fiberboard (mass and
economic allocation) ................................................................................................................................... 32 Table 20. Substance contribution1/ analysis to Global Warming Potential (kg CO2 eq.) by life cycle stage
total percent basis and values are displayed per 1.0 m3. ............................................................................. 33 Table 21 Raw material consumption for energy production per 1 m3 of cellulosic fiberboard, North
American average (economic allocation). .................................................................................................. 40 Table 22 Air emissions released per 1 m3 of cellulosic fiberboard, North American average (economic
allocation). .................................................................................................................................................. 40 Table 23 Emissions to water released per 1 m3 of cellulosic fiberboard, North American average
(economic allocation). ................................................................................................................................. 42 Table 24 Waste to treatment per 1 m3 of cellulosic fiberboard, North American average (economic
allocation). .................................................................................................................................................. 43 Table 25 Environmental performance of 1 m3 cellulosic fiberboard, North American average (economic
allocation). .................................................................................................................................................. 44 Table 26 Carbon per 1 m3 cellulosic fiberboard, North American average (economic allocation). ........... 45 Table 27 Air emissions released per 1 m3 of uncoated cellulosic fiberboard, North American average
(mass allocation). ........................................................................................................................................ 46 Table 28 Water emissions released per 1 m3 of uncoated cellulosic fiberboard, North American average
(mass allocation). ........................................................................................................................................ 51 Table 29Air emissions released per 1 m3 of uncoated cellulosic fiberboard, North American average
(economic allocation). ................................................................................................................................. 56 Table 30 Water emissions released per 1 m3 of uncoated cellulosic fiberboard, North American average
(economic allocation). ................................................................................................................................. 61 Table 31. Substance contribution analysis to Global Warming Potential (kg CO2 eq.) by life cycle stage
total percent basis and values are displayed. ............................................................................................... 66 Table 32. Substance contribution1/ analysis to Acidification (kg SO2 eq.) by life cycle stage total percent
basis and values are displayed. ................................................................................................................... 66 Table 33. Substance contribution analysis to Eutrophication (kg N eq.) by life cycle stage total percent
basis and values are displayed. ................................................................................................................... 66
List of figures Figure 1 Uncoated cellulosic fiberboard (top view). .................................................................................... 6 Figure 2 Uncoated cellulosic fiberboard (side view). ................................................................................... 6 Figure 3 Classification of wood composite panels by particle size, density, and process (Suchsland and
Woodson 1986). ............................................................................................................................................ 7 Figure 4 Cradle to gate system boundary for production of cellulosic fiberboard, North America.............. 9 Figure 5 Process flow for the production of cellulosic fiberboard .............................................................. 13 Figure 6 Sensitivity analysis for the gate-to-gate cellulosic fiberboard life cycle stage comparison between
mass and economic allocation methods. ..................................................................................................... 34 Figure 7 Sensitivity analysis for the gate-to-gate wood residue life cycle stage comparison between mass
and economic allocation methods ............................................................................................................... 35
5
1 Introduction All consumer products have an environmental footprint. Quantifying that footprint has become more
common with the advent of Environmental Preferential Purchasing (EPP), an emergent world-wide
phenomenon. The forest products industry in particular has been challenged regarding its environmental
sustainability. The greatest challenges with respect to practices center on the extraction of forest resources
with questions about product environmental performance focused on uses, longevity and final disposal. In
addition forest land owners and product manufacturers are facing increased environmental regulations and
competition in the marketplace. The forest sector as a whole is challenged with re-thinking how they
grow, manage, and manufacture products to efficiently meet expectations set forth by environmental
regulations, government policies, and the public.
To meet the challenges of the EPP framework, the American Wood Council (AWC) commissioned the
Consortium for Research on Renewable Industrial Materials (CORRIM) to produce a cradle to gate (CtG)
life-cycle assessment of North American cellulosic fiberboard and an Environmental Product Declaration
(EPD) based on the LCA. CORRIM (www.corrim.org) has derived life-cycle inventory (LCI) data for
major wood products and wood production regions in the United States (US). The LCI data covers forest
regeneration through to final product at the mill gate. Research has covered nine major forest products
including both structural and nonstructural uses and four major US regions including the Pacific
Northwest (PNW), Southeast (SE), Inland West, and Northeast/North Central (NE-NC). Comparable data
for Canadian wood products and regions has been produced by the ATHENA Sustainable Materials
Institute (www.athenasmi.org) and FPInnovations (www.fpinnovations.ca).
This report focuses on the average North American production of cellulosic fiberboard and utilizes
underlying data from both CORRIM and ATHENA. This document is based on the life cycle inventory
(LCI) report for cellulosic fiberboard by Bergman (2015). It uses the Bergman (2015) LCI data as the
basis for conducting a life-cycle impact assessment (LCIA) using the TRACI method (Bare et al. 2011).
This report follows data and reporting requirements as outlined in the Product Category Rules (PCR) for
North American Structural and Architectural Wood Products (FPInnovations 2015) that will provide the
guidance for preparation of North American Environmental Product Declarations (EPD) for cellulosic
fiberboard. This report does not include comparative assertions. Some processes have been updated since
the publication the original LCI report (Bergman 2015) and they are noted by date in Table 9 of this
report. This reports LCIA results for both mass and economic allocation for the production of 1 cubic of
meter of uncoated cellulosic fiberboard.
2 Description of Product North American cellulosic fiberboard used in residential and commercial construction is classified by the
following standards: 1) ASTM C208 (2012), Standard Specification for Cellulosic Fiber Insulating Board
and 2) CAN/ULC-S706 (2009), Standard for Wood Fiber Insulating Boards for Building. Various uses
and applications for fiberboard include: 1) Sound-deadening board, 2) Structural sheathing, and 3)
Roofing substrate (i.e., roof fiberboard). Cellulosic fiberboard can be coated with asphalt. Coating of
cellulosic fiberboard is not part of this LCA study.
Cellulosic fiberboard is a panel product developed to utilize industrial wood residue (Figure 1 and Figure
2). Woody biomass residues not utilized for fuel were sent to landfills to disposal. Over the last several
decades, the product has evolved into a highly engineered product designed to meet specific end-use
requirements. The production of cellulosic fiberboard falls into the Standard Industrial Classification
(SIC) Code 321219, reconstituted wood products, which include other wood composite products such as
hardboard, medium density fiberboard, particleboard, and oriented strandboard (USCB 2012). Cellulosic
fiberboard panels are either 0.5 inch (12.7 mm) or 0.781 in (19.8 mm) thick, 4.0 feet (1.22 m) wide, and
8.0 (2.44 m), 9 (2.74 m), or 10 feet (3.05 m) long (Table 1).

6
Figure 1 Uncoated cellulosic fiberboard (top
view).
Figure 2 Uncoated cellulosic fiberboard (side
view).
Table 1 Typical production dimensions of cellulosic fiberboard (www.fiberboard.org).
Sound-Deadening/
Insulation Board Sheathing Roofing
Units English
Widths feet 4 4
Custom
Lengths feet 8 8, 9, 10
Thickness inch 0.50 0.50, 0.78
SI
Widths meter 1.219 1.219
Lengths meter 2.438 2.438, 2.743, 3.048
Thickness millimeter 12.70 12.70, 19.837
Cellulosic fiberboard is produced from industrial wood residues such as shavings, sawdust, and chips that
come from primary log breakdown or chipping whole-trees (roundwood), from mixed paper, and from
construction waste. Manufacturing cellulosic fiberboard uses a wet process that produces a low-density
wood composition panel which is often referred to as insulation board (Figure 3). Density for the final
products ranges from 12 to 24 lb/ft3 (190 to 380 kg/m3) (Suchsland and Woodson 1986; US EPA 2002;
Stark et al. 2010; ASTM International 2012). A thermo-mechanical process reduces the wood raw
material to fibers and binds the fibers with a starch to form cellulosic fiberboard. Other additives may
include alum, clay, and wax. Asphalt can be added in the mix as a binder to improve strength properties
and as an external coating. Adding water to the fiber creates a slurry (similar to the paper-making process)
that is then transformed into a fiber mat. Presses and large dryers are used to remove water. Historically,
water usage has been of particular concern. Production plants without any water conservation in place
can use 170 gal/ft3 (22,700 L/m3) of cellulosic fiberboard (Suchsland and Woodson 1986).

7
Figure 3 Classification of wood composite panels by particle size, density, and process (Suchsland
and Woodson 1986).
2.1 Study goals and scope The goal of this study was to determine energy and material inputs and outputs associated with the
production of cellulosic fiberboard in North America (U.S. and Canada). The data were obtained by
surveying manufacturers in the U.S. and Canada. Surveys were consistent with CORRIM protocols for
performing LCI’s of wood products, follow ISO14040/140444 standards for conducting LCA (ISO
2006b, ISO 2006c), and meet the requirements of the PCR for North American Structural and
Architectural Wood Products (FPInnovations 2015).
The scope of this study was to develop a cradle-to-gate LCA for the production of cellulosic fiberboard
common to practices and technology common to North America for cellulosic fiberboard feedstock and
manufacturing sectors. It covers the impact in terms of material flow, energy type and use, emissions to
air and water, solid waste production, and water impacts for the cellulosic fiberboard manufacturing
process on a per unit volume basis of 1.0 cubic meter (m3). Data for the LCA are based on gate to gate
inputs and outputs obtained directly from the survey of cellulosic fiberboard mills, previously published
data for gate to gate wood residue production (Milota 2015) and cradle to gate forest resources LCI’s
(Johnson et al. 2005, Oneil et al. 2010).
2.2 Intended audience The primary audience for the LCA report includes the American Wood Council, Canadian Wood Council,
North American cellulosic fiberboard manufacturers, and other LCA practitioners.
2.3 Comparative assertions The report does not include product use and end of life phases which are required for comparative
assertions relative to substitute products. If future comparative studies are intended and disclosed to the
public, the LCA boundary would need to be expanded to include the use and end of life phases consistent

8
with the ISO 14040/44:2006 (ISO 2006a) guidelines and principles and compliance with the Wood
Products PCR (FPInnovations 2015).1
2.4 Functional and declared unit In accordance with the PCR, the declared unit for cellulosic fiberboard is one cubic meter (1.0 m3). A
declared unit is used in instances where the function and the reference scenario for the whole life cycle of
a wood building product cannot be stated (FPInnovations 2015). For conversion of units from the U.S.
industry measure, 1.0 MSF (1,000 square feet) at 0.5-in basis is equal to 1.18 m3. All input and output
data were allocated to the declared unit of product based on the mass of products and co-products in
accordance with standards for conducting LCA’s (ISO 2006b, ISO2006c). As the analysis does not take
the declared unit to the stage of being an installed building product, no service life is assigned.
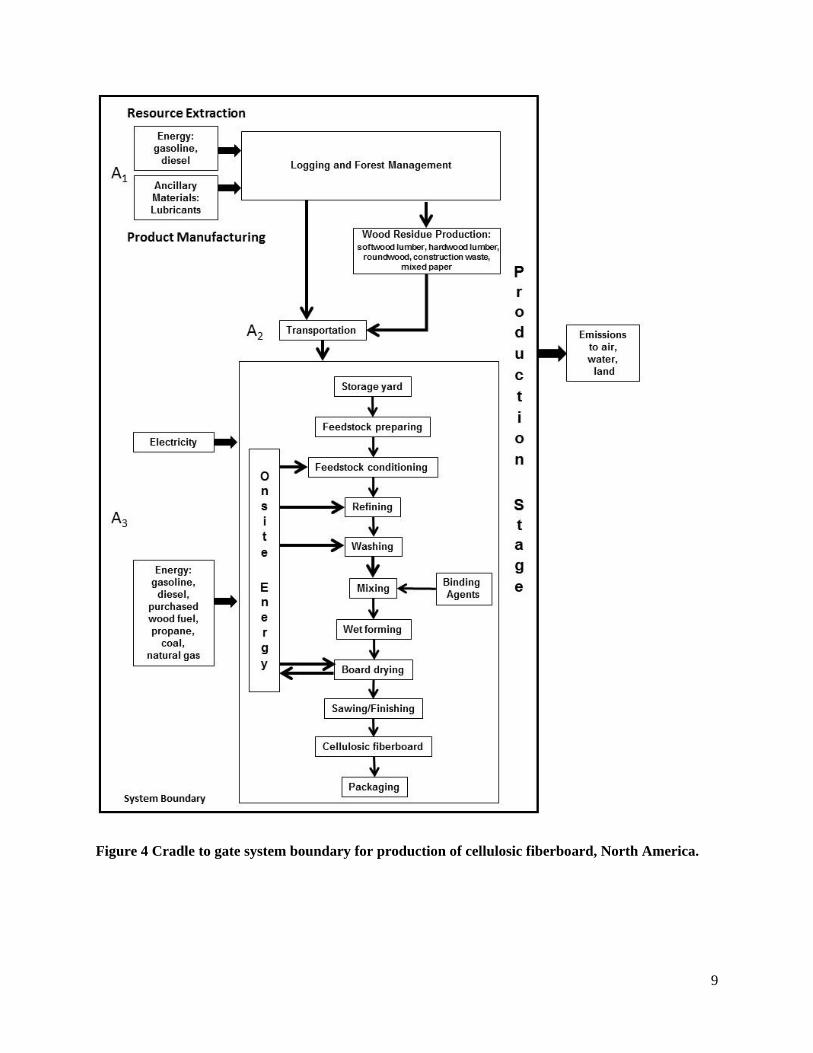
2.5 System boundaries The system boundary begins with regeneration in the forest and ends with cellulosic fiberboard product
(Figure 4). The system boundary includes forest operations (A1), which may include site preparation and
planting seedlings, fertilization and thinning, final harvest with the transportation of logs (A2) to the
primary breakdown facility, wood residue production during lumber manufacturing processes,
transportation of residues (A2) to the cellulosic fiberboard mills, and onsite production of cellulosic
fiberboard (A3) (Figure 4). Seedlings and the fertilizer and electricity it took to grow trees were
considered as inputs to the system boundary. The cellulosic fiberboard production complex was modeled
as a single unit process. The study recognized ten steps (A3) necessary to make cellulosic fiberboard with
energy generation considered as an auxiliary process. On-site energy generation can come from a boiler
or direct fire. A single unit process was used to model the cellulosic fiberboard process since the
percentage of co-product was small (3.9%) and the approach does not affect the accuracy of assigning the
burdens.
1 If the LCA is used to develop an Environmental Product Declaration (EPD), internal and/or external critical review
would be required.
9
Figure 4 Cradle to gate system boundary for production of cellulosic fiberboard, North America.
10
2.6 Description of data/Process descriptions
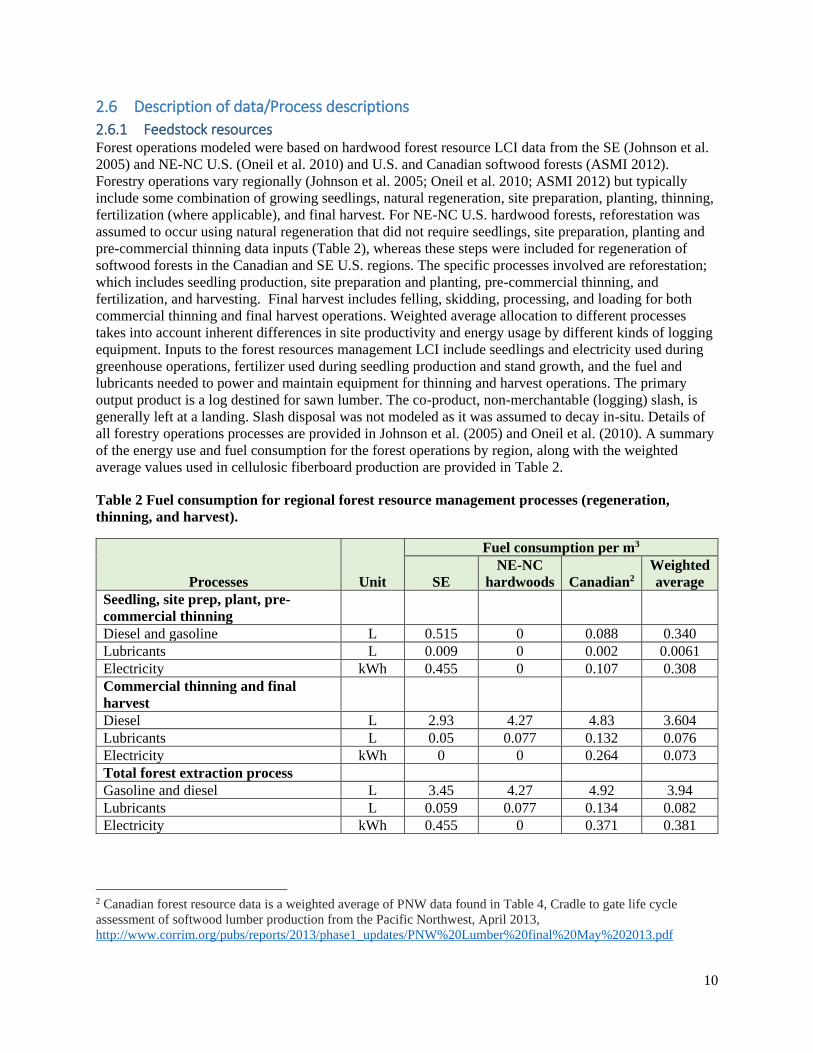
2.6.1 Feedstock resources Forest operations modeled were based on hardwood forest resource LCI data from the SE (Johnson et al.
2005) and NE-NC U.S. (Oneil et al. 2010) and U.S. and Canadian softwood forests (ASMI 2012).
Forestry operations vary regionally (Johnson et al. 2005; Oneil et al. 2010; ASMI 2012) but typically
include some combination of growing seedlings, natural regeneration, site preparation, planting, thinning,
fertilization (where applicable), and final harvest. For NE-NC U.S. hardwood forests, reforestation was
assumed to occur using natural regeneration that did not require seedlings, site preparation, planting and
pre-commercial thinning data inputs (Table 2), whereas these steps were included for regeneration of
softwood forests in the Canadian and SE U.S. regions. The specific processes involved are reforestation;
which includes seedling production, site preparation and planting, pre-commercial thinning, and
fertilization, and harvesting. Final harvest includes felling, skidding, processing, and loading for both
commercial thinning and final harvest operations. Weighted average allocation to different processes
takes into account inherent differences in site productivity and energy usage by different kinds of logging
equipment. Inputs to the forest resources management LCI include seedlings and electricity used during
greenhouse operations, fertilizer used during seedling production and stand growth, and the fuel and
lubricants needed to power and maintain equipment for thinning and harvest operations. The primary
output product is a log destined for sawn lumber. The co-product, non-merchantable (logging) slash, is
generally left at a landing. Slash disposal was not modeled as it was assumed to decay in-situ. Details of
all forestry operations processes are provided in Johnson et al. (2005) and Oneil et al. (2010). A summary
of the energy use and fuel consumption for the forest operations by region, along with the weighted
average values used in cellulosic fiberboard production are provided in Table 2.
Table 2 Fuel consumption for regional forest resource management processes (regeneration,
thinning, and harvest).
Processes Unit
Fuel consumption per m3
SE
NE-NC
hardwoods Canadian2
Weighted
average
Seedling, site prep, plant, pre-
commercial thinning
Diesel and gasoline L 0.515 0 0.088 0.340
Lubricants L 0.009 0 0.002 0.0061
Electricity kWh 0.455 0 0.107 0.308
Commercial thinning and final
harvest
Diesel L 2.93 4.27 4.83 3.604
Lubricants L 0.05 0.077 0.132 0.076
Electricity kWh 0 0 0.264 0.073
Total forest extraction process
Gasoline and diesel L 3.45 4.27 4.92 3.94
Lubricants L 0.059 0.077 0.134 0.082
Electricity kWh 0.455 0 0.371 0.381
2 Canadian forest resource data is a weighted average of PNW data found in Table 4, Cradle to gate life cycle
assessment of softwood lumber production from the Pacific Northwest, April 2013,
http://www.corrim.org/pubs/reports/2013/phase1_updates/PNW%20Lumber%20final%20May%202013.pdf
11
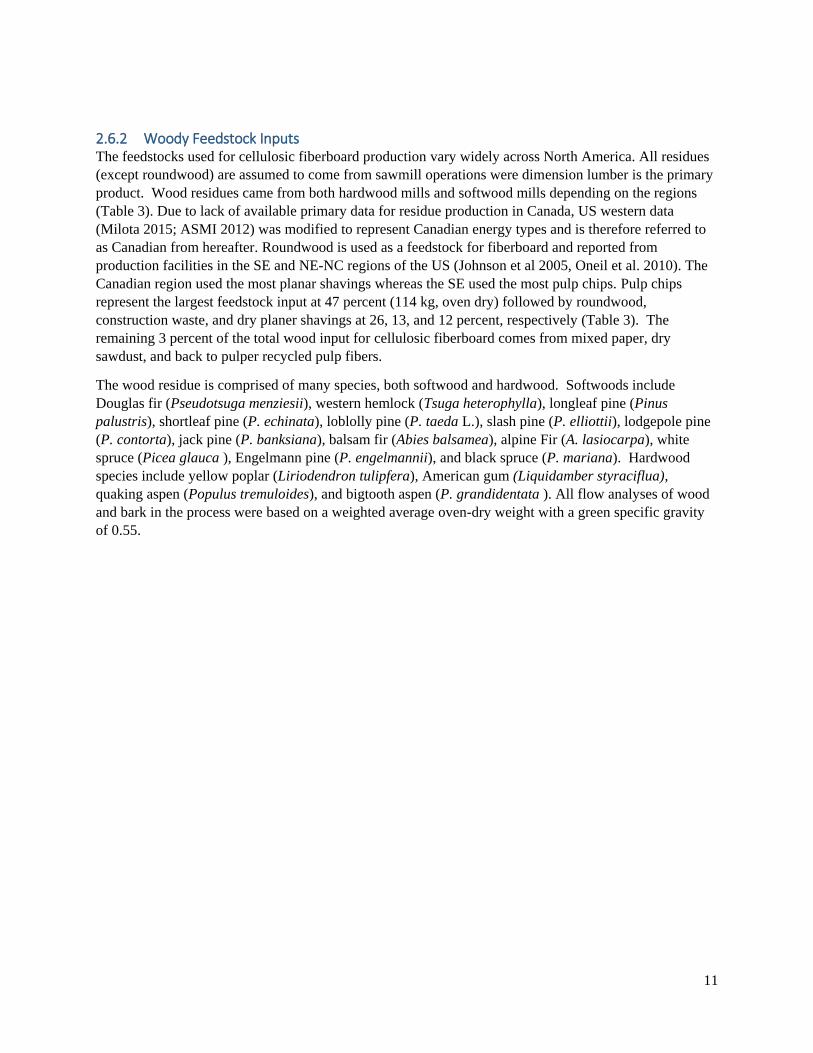
2.6.2 Woody Feedstock Inputs The feedstocks used for cellulosic fiberboard production vary widely across North America. All residues
(except roundwood) are assumed to come from sawmill operations were dimension lumber is the primary
product. Wood residues came from both hardwood mills and softwood mills depending on the regions
(Table 3). Due to lack of available primary data for residue production in Canada, US western data
(Milota 2015; ASMI 2012) was modified to represent Canadian energy types and is therefore referred to
as Canadian from hereafter. Roundwood is used as a feedstock for fiberboard and reported from
production facilities in the SE and NE-NC regions of the US (Johnson et al 2005, Oneil et al. 2010). The
Canadian region used the most planar shavings whereas the SE used the most pulp chips. Pulp chips
represent the largest feedstock input at 47 percent (114 kg, oven dry) followed by roundwood,
construction waste, and dry planer shavings at 26, 13, and 12 percent, respectively (Table 3). The
remaining 3 percent of the total wood input for cellulosic fiberboard comes from mixed paper, dry
sawdust, and back to pulper recycled pulp fibers.
The wood residue is comprised of many species, both softwood and hardwood. Softwoods include
Douglas fir (Pseudotsuga menziesii), western hemlock (Tsuga heterophylla), longleaf pine (Pinus
palustris), shortleaf pine (P. echinata), loblolly pine (P. taeda L.), slash pine (P. elliottii), lodgepole pine
(P. contorta), jack pine (P. banksiana), balsam fir (Abies balsamea), alpine Fir (A. lasiocarpa), white
spruce (Picea glauca ), Engelmann pine (P. engelmannii), and black spruce (P. mariana). Hardwood
species include yellow poplar (Liriodendron tulipfera), American gum (Liquidamber styraciflua),
quaking aspen (Populus tremuloides), and bigtooth aspen (P. grandidentata ). All flow analyses of wood
and bark in the process were based on a weighted average oven-dry weight with a green specific gravity
of 0.55.

12
Table 3 Wood feedstock types and source for input for cellulosic fiberboard production, North
American average.
Wood residue type by Region kg/m3
Percent
(%)
Canada3
Pulp chips, softwood, dry 26.48 46
Sawdust, softwood, dry 0.59 1
Planer shavings, softwood, dry 29.99 53
TOTAL 57.06 100
Southeast region (US SE)
Pulp chips, hardwood, green 5.98 5
Pulp chips, softwood, green 81.08 64
Roundwood chips, softwood, green 39.59 31
TOTAL 126.65 100
Northeast-North central regions (US NE-NC)
Roundwood, hardwood, green 23.17 100
TOTAL 23.17 100
Recycled waste
Construction Waste 31.22 85
Mixed Office Paper 4.97 13
Backed to pulper, Fiberboard production coproduct 0.79 2
TOTAL 36.98 100
Canada – Region 57.06 23
Southeast, US – Region 126.65 52
Northeast–North central, US – Region 23.17 10
Recycled waste, North America 36.98 15
TOTAL North American average 243.85 100
3 Modified from Cradle to gate life cycle assessment of softwood lumber production from the Pacific Northwest,
April 2013,
http://www.corrim.org/pubs/reports/2013/phase1_updates/PNW%20Lumber%20final%20May%202013.pdf
13
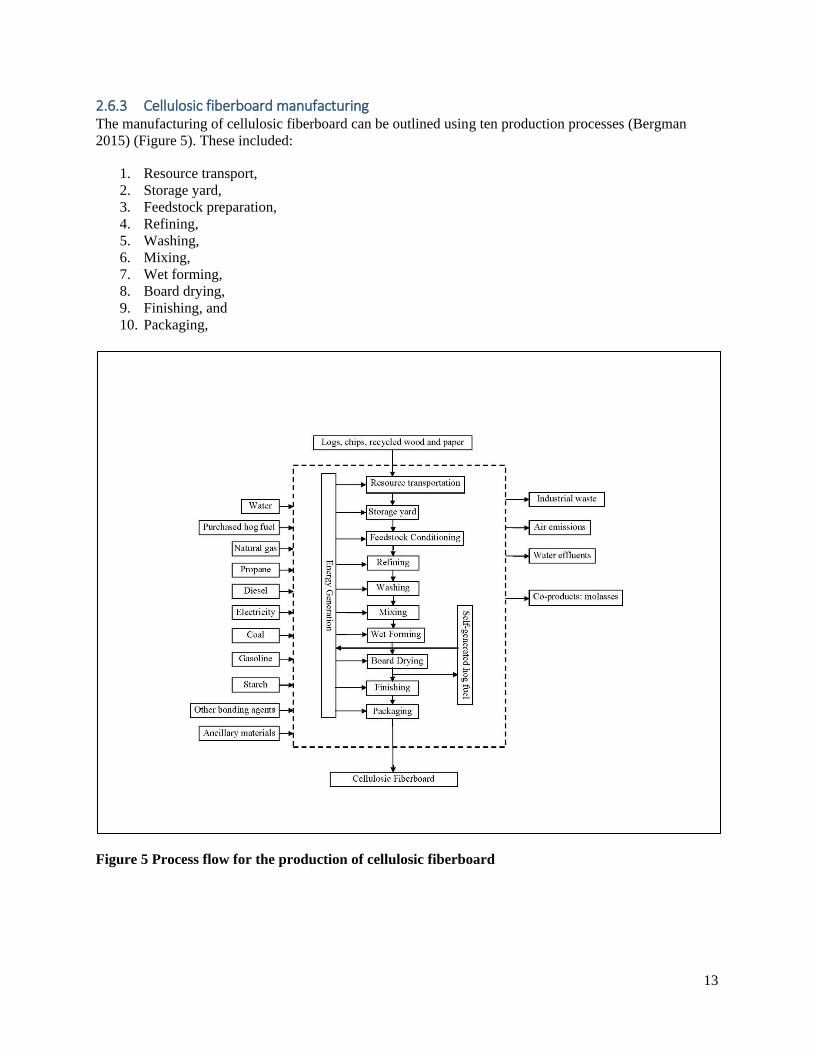
2.6.3 Cellulosic fiberboard manufacturing The manufacturing of cellulosic fiberboard can be outlined using ten production processes (Bergman
2015) (Figure 5). These included:
1. Resource transport,
2. Storage yard,
3. Feedstock preparation,
4. Refining,
5. Washing,
6. Mixing,
7. Wet forming,
8. Board drying,
9. Finishing, and
10. Packaging,
Figure 5 Process flow for the production of cellulosic fiberboard

14
2.6.3.1 Resource and material transport Woody feedstocks are delivered to the mill by truck. Cellulosic fiberboard feedstock can consists of
whole logs, dry shavings and sawdust, wood chips, construction waste, and/or mixed paper, depending on
regional sources. The moisture content of the residues can range from 10 to 100% on an oven-dry weight-
basis. Based on mill surveys, the average haul distance for feedstock along with other materials used in
the manufacturing process are shown in Table 4. Inputs to the transportation process include diesel fuel
and outputs include emission to air and water and solid waste generated from the production and
combustion of the fuel.
Table 4 Weighted average delivery distance (one-way) for materials to cellulosic fiberboard mill,
North American average.
Material delivered to mill Mode of Transport Delivery Distance
kilometer mile
Roundwood Truck 6.8 4.2
Chips, green Truck 62.8 39.0
Chip, dry Truck 62.8 39.0
Sawdust, dry Truck 2.7 1.7
Mixed paper Truck 9.7 6.0
Construction waste Truck 29.0 18.0
Shavings, dry Truck 33.8 21.0
Additive: Starch Truck 675.9 420.0
Additive: Asphalt flake Truck 273.6 170.0
Additive: Alum Truck 133.6 83.0
Additive: Wax Truck 354.1 220.0
Additive: Clay Truck 1,303.6 810.0
Purchased wood fuel Truck 0.8 0.5
Coal Rail 17.4 10.8
2.6.3.2 Storage yard Upon arrival at the storage yard (Figure 5) all feedstock were weight-scaled and moisture contents were
determined. Log stackers or front-end loaders are used to transport logs and chips from the storage yard to
the mill for chipping. Additional mobile equipment is used to move all feedstock for further processing.
Inputs included woody feedstocks, electricity, fuel, and lubricants. Outputs are feedstock and emissions
from fuel use.
2.6.3.3 Feedstock conditioning The feedstock arrives in various forms that require further processing before refining in order to produce
homogeneous residues. Logs and construction waste are chipped and combined with incoming chips.
Chips are screened to remove over-sized chips, re-chipped, and then washed to remove dirt and other
foreign substances. Steam digesters and steaming screws are typically used for conditioning chip and
other wood raw material. Inputs include prepared feedstock, water, steam, and electricity and outputs
include chips and emissions.
2.6.3.4 Refining The purpose of this process is to pulp the prepared residues. The prepared residue is refined by
mechanically reducing and thermally softening the material into fibers (pulp fiber) by shearing the wood
between two rotating metal disks that separate the fibers at the lignin binder. This process is referred to as
mechanical pulping because no chemicals are added. Refining is an energy-intensive process with an

15
average specific energy ranging from 20 to 30 hp-d/ton residue output (250 to 380 kWh/tonne)
(Suchsland and Woodson 1986). Inputs include chips, dry wood residues, mixed paper, electricity, and
heat (Figure 5). Outputs include pulp fiber and water vapor.
2.6.3.5 Washing The pulp fibers are washed to remove natural wood sugars (i.e., molasses) that can reduce board quality
(Figure 5). In addition, washing removes dirt and other foreign material that might still remain in the pulp
fibers. Inputs are pulp fibers and water. Outputs are clean pulp fibers, water, molasses, and solid waste.
2.6.3.6 Mixing During this step water is added to the pulp fibers along with additives (alum, asphalt, starch, and wax) for
bonding the pulp fibers in stock chests to create a slurry to await further processing (Figure 5). No resins
are added to produce cellulosic fiberboards. Lignin, a natural component of wood, aids the additives in
bonding the pulp fibers. Inputs include water and additives (Figure 5) and output include a pulp/water
low-consistency slurry along with additives.
2.6.3.7 Wet forming The slurry with approximately 2% pulp fiber is sent to forming machines (Fourdrinier machines) where it
is metered unto a wire screen. Two percent consistency provides for the highest bonding strength of the
final board (Lampert 1967). Gravity and a vacuum applied gradually to the bottom of the wire removes
the water from the slurry mix to produce a fiber mat. Once the slurry reaches about 25% solid fiber, the
mat is cut to length and trimmed by high-pressure water jets (Figure 5). Then the mat is wet-pressed using
continuous rollers at room temperature to remove additional water until it forms the board at its final
thickness while allowing for a shrinkage allowance when dried. Most of the collected water is recycled.
Inputs include pulp, water, and electricity and outputs include a fiber mat, trim residue, water, and steam.
2.6.3.8 Board drying Board drying is a continuous energy-intensive process (Figure 5). The fiber mats which are around 65-75
percent moisture content (dry basis) move along a conveyor into a heated enclosure where their moisture
content is reduced to approximately 4 percent. In total, approximately two tonnes of water are removed
per tonne of dry board. Roller dryers operate with inlet temperatures of approximately 230°C (450°F) and
outlet temperatures of approximately 160°C (320°F). Inputs include wet boards, electricity, and
combustion gases from burning natural gas and outputs include dry boards, steam, and air emissions.
2.6.3.9 Finishing Trimming reduces the dry board to final standard dimensions (Figure 5). Input includes untrimmed dry
board and electricity and output includes final product, culled boards, and wood dust. Finished fiberboard
density ranges from 190 to 380 kg/m3 (12 to 24 lb/ft3). Coating of the finished boards is not included in
the LCA.
2.6.3.10 Packaging Finished uncoated cellulosic fiberboard is packaged for transport. Inputs include final product (uncoated
cellulosic fiberboard), electricity, and packaging material. Outputs include packaged uncoated cellulosic
fiberboard.
2.6.3.11 Energy generation Energy for the production of cellulosic fiberboard comes from electricity, coal, natural gas, and wood
fuel. Natural gas, coal, and wood fuels are used to heat refiners and dryers. Electricity is used throughout
the process. It is used to operate equipment within the plant, including conveyors, refiners, fan motors,
hydraulic press motors, high-pressure water jets, rollers, and emission control systems. Emission control

16
devices such as baghouses, cyclones, electrostatic precipitators, and wet scrubbers are used throughout the
mills. Electricity was produced off-site. Emission resulting from the production of electricity were based
on the weighted average allocation of the electrical grid composition for regions that produce North
American cellulosic fiberboard (Table 5). Coal (35.3%) and hydro (34.3%) power comprise most of the
energy source inputs to the grid used for manufacturing cellulosic fiberboard.
Other fuels such as diesel, liquid propane gas (LPG), and gasoline are used to operate transport equipment
within the mill.
Table 5 Percentage of energy source for electricity for producing North American cellulosic
fiberboard.
Energy source
Canada-
Alberta
(%)
Canada-
Quebec1
(%)
MRO2
(%)
SERC3
(%)
North American
composite grid
(%)
Natural gas 43.5 0.0 3.3 19.1 11.7
Coal 42.0 0.0 65.8 50.7 35.4
Oil 0.1 0.0 0.4 0.6 0.4
Nuclear 0.0 1.9 14.4 24.7 15.6
Hydro 8.1 97.1 5.5 2.8 34.3
Wind 2.1 0.8 8.8 0.1 1.3
Biomass 4.2 0.2 1.5 1.7 1.2
Miscellaneous 0.0 0.0 0.3 0.3 0.2
Total 100 100 100 100 100 1 Grid composition was developed from Ecoinvent high-voltage grid for Quebec. 2 MRO is the electrical grid comprised of Manitoba, Minnesota, Nebraska, North Dakota, Saskatchewan and parts of
Illinois, Michigan, South Dakota and Wisconsin. 3 SERC is the electric grid comprised of Alabama, Georgia, Mississippi, North Carolina, South Carolina and parts of
Arkansas, Florida, Illinois, Iowa, Kentucky, Louisiana, Missouri, Tennessee, Texas and Virginia.
Process heat requirements are 3.80 million Btu/MSF (3,400 GJ/m3) of which 74.7 percent is generated
through the combustion of natural gas, 15.3 percent from wood fuel, and 10.0 percent from coal (Table 6).
Natural gas is the primary fuel used for providing direct heat for digesting, refining, drying wood residues
and heating steam or oil for hot rolling. Steam is produced by burning wood fuel along with coal in a
boiler to generate thermal energy. Wood fuel is primarily purchased bark (96%) as very little on-site
wood residue (4% from culled boards) is available for use as fuel.
Table 6 On-site heat inputs per 1 m3 cellulosic fiberboard, North American average (unallocated).
Fuel Unit
Value
(Unit/m3)
HHV
(MJ/kg)
MJ/m3 of
product
Percent of total
energy (%)
Natural gas1 m3 46.7 54.45 1,637 74.7
Wood fuel – purchased kg 23.7 20.93 495 14.6
Coal kg 13.0 26.19 342 10.0
Wood fuel – self-generated kg 1.1 20.93 24 0.7
TOTAL MJ – – 3,400 100 1/ Density of natural gas 0.70 kg/m3.

17
CORRIM recently gathered U.S. boiler data from major wood producing facilities for on-site energy
generation (Table 7) (Puettmann and Milota 2015). Regional differences in the United States were minor
and therefore did not warrant developing separate boilers based on geographical regions. The CORRIM
wood boiler process was used to model steam production from wood fuel. Both self-generated wood fuel
(culled boards) and purchased wood fuel were used as inputs into the boiler for cellulosic fiberboard
manufacturing.
Table 7 CORRIM Wood Boiler used in the production of cellulosic fiberboard (Puettmann and
Milota 2015).
INPUTS/OUTPUTS
Inputs – Materials and Fuels Value Unit/m3
Culled boards, wood fuel, at cellulosic fiberboard plant,
North America 4.00E-02
kg
Wood fuel, unspecified/RNA 9.60E-01 kg
Transport, combination truck, diesel powered/US, Athena 1.38E-03 tkm
Diesel, combusted in industrial equipment/US 8.05E-04 L
Gasoline, combusted in equipment/US 3.96E-05 L
Liquefied petroleum gas, combusted in industrial boiler/US 1.21E-05 L
Lubricants 1.91E-05 L
Engine oil 2.22E-05 L
Hydraulic oil 0.00E+00 L
Antifreeze 4.81E-07 L
Ethylene glycol, at plant/RNA 1.07E-06 kg
Solvents4 7.17E-07 kg
Water Treatment 1.23E-04 kg
Boiler streamline treatment 3.67E-06 kg
Urea, as N, at regional storehouse/RER U AWC 3.15E-03 kg
Disposal, ash, to unspecified landfill/kg/RNA 7.59E-03 kg
Disposal, solid waste, unspecified, to unspecified
landfill/kg/RNA 7.26E-06
kg
Disposal, metal, to recycling/kg/RNA 3.96E-08 kg
Composite grid, North American cellulosic fiberboard 8.20E-02 kWh
Natural gas, combusted in industrial boiler/US 1.38E-03 m3
Inputs - Water Value Unit/m3
Water, process, surface 3.10E-01 kg
Water, process, well 2.40E-01 kg
Water, municipal, process, surface 7.90E-01 kg
Water, municipal, process, well 2.40E-01 kg
Outputs – Products and Co-Products Value Unit/m3
CORRIM Wood Combusted, at boiler, at mill, kg, RNA 1.00E+00 kg
CORRIM Wood ash, at boiler, at mill, kg, RNA 2.00E-02 kg
Outputs - Emissions to air Value Unit/m3
Acetaldehyde 1.05E-06 kg
Acrolein 8.07E-07 kg
4 Solvents may contain substances listed on the US Environmental Agency (EPA) Toxics Release Inventory. US
Environmental Protection Agency, Toxics Release Inventory. http://www.epa.gov/toxics-release-inventory-tri-
program/tri-listed-chemicals. Accessed January 2016

18
Benzene 1.69E-07 kg
Carbon monoxide, biogenic 3.23E-03 kg
Carbon dioxide, biogenic 1.76E+00 kg
Wood (dust) 5.62E-04 kg
Formaldehyde 1.26E-05 kg
HAPs 6.27E-06 kg
Hydrogen chloride 1.17E-06 kg
Lead 1.75E-07 kg
Mercury 1.83E-09 kg
Methane, biogenic 2.23E-05 kg
Methanol 7.95E-06 kg
Nitrogen oxides 1.10E-03 kg
Particulates, < 10 um 4.71E-04 kg
Particulates, < 2.5 um 1.39E-04 kg
Phenol 6.21E-07 kg
Propanal 5.14E-08 kg
Sulfur dioxide 7.71E-05 kg
VOC, volatile organic compounds 8.76E-04 kg
Dinitrogen monoxide 2.93E-06 kg
Naphthalene 5.77E-08 kg
Other Organic 2.11E-07 kg
Outputs - Emissions to water Value Unit/m3
Suspended solids, unspecified 8.35E-07 kg
BOD5, Biological Oxygen Demand 2.10E-06 kg
2.6.3.12 Packaging Packing materials represent less than 1.0 percent of the cumulative mass of the model flow. The material
list was from mill survey data. The wooden spacers make up the bulk of this mass, representing 88.9
percent of the total packaging material (Table 8). The wrapping material, plastic strapping, strap
protectors, and steel strapping made up, 5.2, 4.8, 0.7, and 0.3 percent of the packaging by mass,
respectively.
Table 8 Materials used in packaging and shipping per m3 cellulosic fiberboard, North American
average (unallocated).
Material Value kg/m3
Wrapping material – HDPE and LDPE laminated paper 0.0824
PET Strapping 0.0763
Cardboard strap protectors 0.0118
Steel strapping 0.0043
Wooden spacers 1.3942
Total 1.5690
3 Cut off rules According to the PCR, if the mass/energy of a flow is less 1% of the cumulative mass/energy of the
model flow it may be excluded, provided its environmental relevance is minor. This analysis included all
energy and mass flows for primary data.
19
In the primary surveys, manufacturers were asked to report total hazardous air pollutants (HAPS) specific
to their wood products manufacturing process. Under Title III of the Clean Air Act Amendments of 1990,
the EPA has designated HAPs that wood products facilities are required to report as surrogates for all
HAPs. These are methanol, acetaldehyde, formaldehyde, propionaldehyde (propanal), acrolein, and
phenol. All HAPS are included in the LCI, no cut off rules apply. If applicable to the wood product,
HAPS are reported in Table 13 and would be included in the impact assessment. Table 13 shows all air
emission to the 10-4 to simplify and report on the dominant releases by mass. There were no cut-offs used
in the impact assessment therefore a complete list of all air emissions (smaller than 10-4) is located in
Appendix B of this report.
4 Data sourcing and averaging The LCA for cellulosic fiberboard contains three life cycle stages: 1) Forest management and harvesting,
2) Wood residue production, and 3) Cellulosic fiberboard production. Primary and secondary data were
used in all life cycle stages. This section provides a brief description of the primary and secondary data
sources used to complete the LCA.
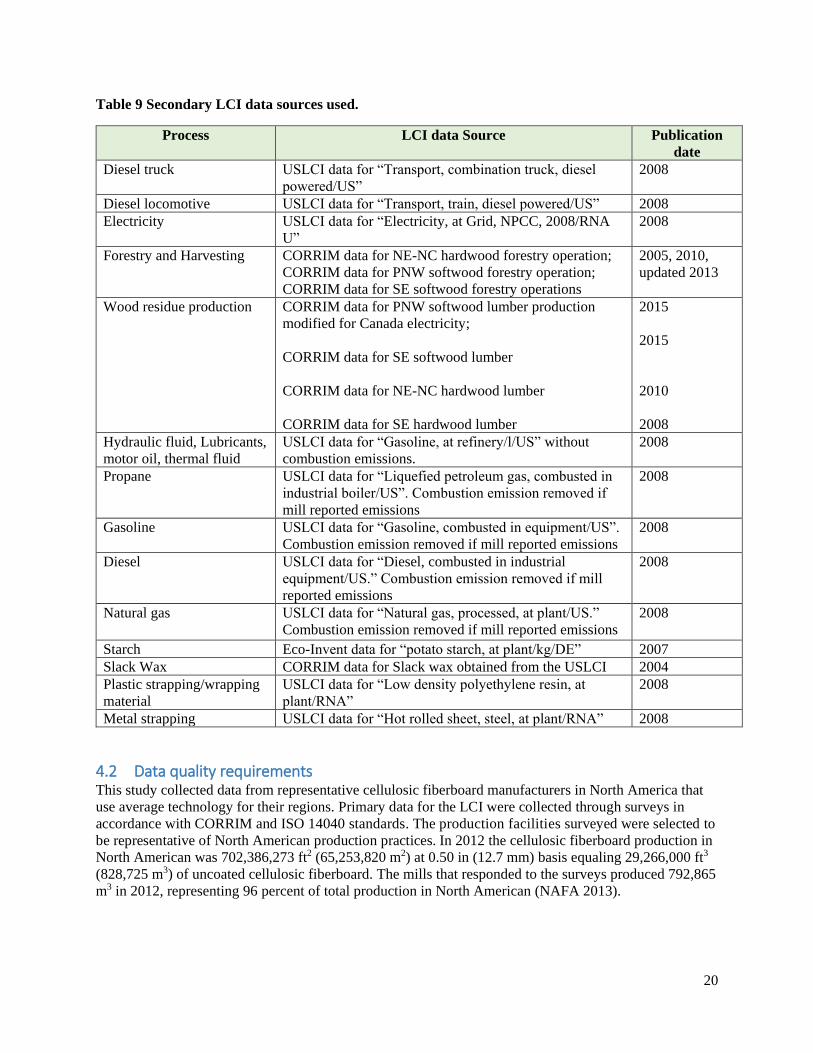
4.1 Primary and secondary data sources Forest management and harvesting LCI data used in this study were derived from earlier studies on forest
operations in the PNW, SE, and NE-NC U.S. regions and Canada (Johnson et al. 2005, Oneil et al. 2010,
ASMI 2012). The data included a weighted average of various harvesting and forest management
methods used in each forest types. The forestry systems from each of these regions were a weighted to
represent a common forestry system for cellulosic fiberboard production (Table 9).
Wood residue production data used in this study were derived from CORRIM data using SE softwood
lumber (Milota 2015), PNW softwood lumber production modified for Canadian electricity (Milota
2015), NE-NC hardwood lumber (Bergman and Bowe 2008a, 2008b) and SE hardwood lumber (Bergman
and Bowe 2010, 2011) (Table 9).
Feedstock transportation for cellulosic fiberboard mills was by primary by road with some transportation
by rail. The LCA incorporated an appropriate diesel tractor-trailer and diesel locomotive LCI from the US
LCI database (https://www.lcacommons.gov/nrel/) based on transportation distances and mass of logs for
each mill location. Table 9 list the secondary LCI data sources used in this LCA study.
Primary data on cellulosic fiberboard manufacturing was collected from mills in North America. The
mills provided data for the 2012 production year. The participating facilities also provided information
and data on the use of fuels, additives, energy consumption, electricity use, and ancillary inputs (e.g.
lubricants, oils, greases, packaging, paints, etc.).
20
Table 9 Secondary LCI data sources used.
Process LCI data Source Publication
date
Diesel truck USLCI data for “Transport, combination truck, diesel
powered/US”
2008
Diesel locomotive USLCI data for “Transport, train, diesel powered/US” 2008
Electricity USLCI data for “Electricity, at Grid, NPCC, 2008/RNA
U”
2008
Forestry and Harvesting CORRIM data for NE-NC hardwood forestry operation;
CORRIM data for PNW softwood forestry operation;
CORRIM data for SE softwood forestry operations
2005, 2010,
updated 2013
Wood residue production CORRIM data for PNW softwood lumber production
modified for Canada electricity;
CORRIM data for SE softwood lumber
CORRIM data for NE-NC hardwood lumber
CORRIM data for SE hardwood lumber
2015
2015
2010
2008
Hydraulic fluid, Lubricants,
motor oil, thermal fluid
USLCI data for “Gasoline, at refinery/l/US” without
combustion emissions.
2008
Propane USLCI data for “Liquefied petroleum gas, combusted in
industrial boiler/US”. Combustion emission removed if
mill reported emissions
2008
Gasoline USLCI data for “Gasoline, combusted in equipment/US”.
Combustion emission removed if mill reported emissions
2008
Diesel USLCI data for “Diesel, combusted in industrial
equipment/US.” Combustion emission removed if mill
reported emissions
2008
Natural gas USLCI data for “Natural gas, processed, at plant/US.”
Combustion emission removed if mill reported emissions
2008
Starch Eco-Invent data for “potato starch, at plant/kg/DE” 2007
Slack Wax CORRIM data for Slack wax obtained from the USLCI 2004
Plastic strapping/wrapping
material
USLCI data for “Low density polyethylene resin, at
plant/RNA”
2008
Metal strapping USLCI data for “Hot rolled sheet, steel, at plant/RNA” 2008
4.2 Data quality requirements This study collected data from representative cellulosic fiberboard manufacturers in North America that
use average technology for their regions. Primary data for the LCI were collected through surveys in
accordance with CORRIM and ISO 14040 standards. The production facilities surveyed were selected to
be representative of North American production practices. In 2012 the cellulosic fiberboard production in
North American was 702,386,273 ft2 (65,253,820 m2) at 0.50 in (12.7 mm) basis equaling 29,266,000 ft3
(828,725 m3) of uncoated cellulosic fiberboard. The mills that responded to the surveys produced 792,865
m3 in 2012, representing 96 percent of total production in North American (NAFA 2013).

21
4.3 Assumptions and limitations For recycled waste used as feedstock, including construction waste and mixed paper, no embodied energy
from the first life was included in the analysis because if the material was not used it would have been
landfilled. However transportation of the waste from its production site to the cellulosic fiberboard
facility was included to reflect the additional energy footprint that belongs to fiberboard production.
5 Life-cycle inventory analysis 5.1 Data collection and calculations methods A statistically significant sampling frame is required to attain valid results that can be generalized to the
cellulosic fiberboard industry. CORRIM (2014) protocol targets a minimum of 20 to 50 percent of total
production. Because there are only a few cellulosic fiberboard manufacturers, this study could
realistically attain these levels by requesting participation and cooperation from the eight plants operated
by North American Fiberboard Association (NAFA) members. In 2012, three of the eight North
American mills are located in Canada and the other five in the United States. There were no operating
cellulosic fiberboard plants in Mexico at the time of data collection, 2012–2013.
Cellulosic fiberboard is most commonly reported in a thousand square foot (MSF) of 0.5-inch basis,
which is equivalent to 1.18 m3. The survey results were converted to a unit production basis, 1 MSF (0.5-
inch basis) and a weighted average of input data was calculated based on production of the seven surveyed
production plants. This approach resulted in a cellulosic fiberboard complex that represents a composite of
the North American mills surveyed, but may not represent any mill in particular. The U.S. LCI database
was used to assess off-site impacts associated with the materials and energy used. SimaPro, version
8.0.4.30 (Pré Consultants 2014) was used as the accounting program to track all of the materials and fuels.
Questionnaires were used to collect primary data on cellulosic fiberboard manufacturing (Bergman 2015).
The primary data obtained from the surveys were weight-averaged using the formula shown below
(Milota 2015):
�̅�𝑤=
∑ 𝑃𝑖𝑥𝑖𝑛𝑖=1∑ 𝑥𝑖
𝑛𝑖=1
Where �̅�𝑤 the weighted average of the values reported by the mills, 𝑃𝑖is the reported mill value, and 𝑥𝑖 is
the fraction of the mill’s value to total production of the surveyed mills for that specific value.
Because the surveyed mill data varied between facilities, a statistical analysis was conducted. In the
present study, the coefficient of variation (CoV) was calculated (NIST ITL 1996). The coefficient of
variation (CoV) is the standard deviation (sd) divided by the weighted mean (�̅�𝑤):
𝑠𝑑 = √∑ (𝑃𝑖 − �̅�)2𝑁
𝑖=1
𝑁 − 1
𝐶𝑜𝑉 =𝑠𝑑
�̅�𝑤
Where N is the number of non-zero weights, 𝑃𝑖 is the value of the individual observation, and 𝑃w is the
weighted mean of the observations.
22
Missing data is defined as data not reported in surveys by the cellulosic fiberboard facilities. Whenever
missing data occurred for survey items, they were checked with facility personnel to determine whether it
was an unknown value or zero. Missing data were carefully noted so they were not averaged as zeros.
Any outliers were resolved by contacting mill personnel.
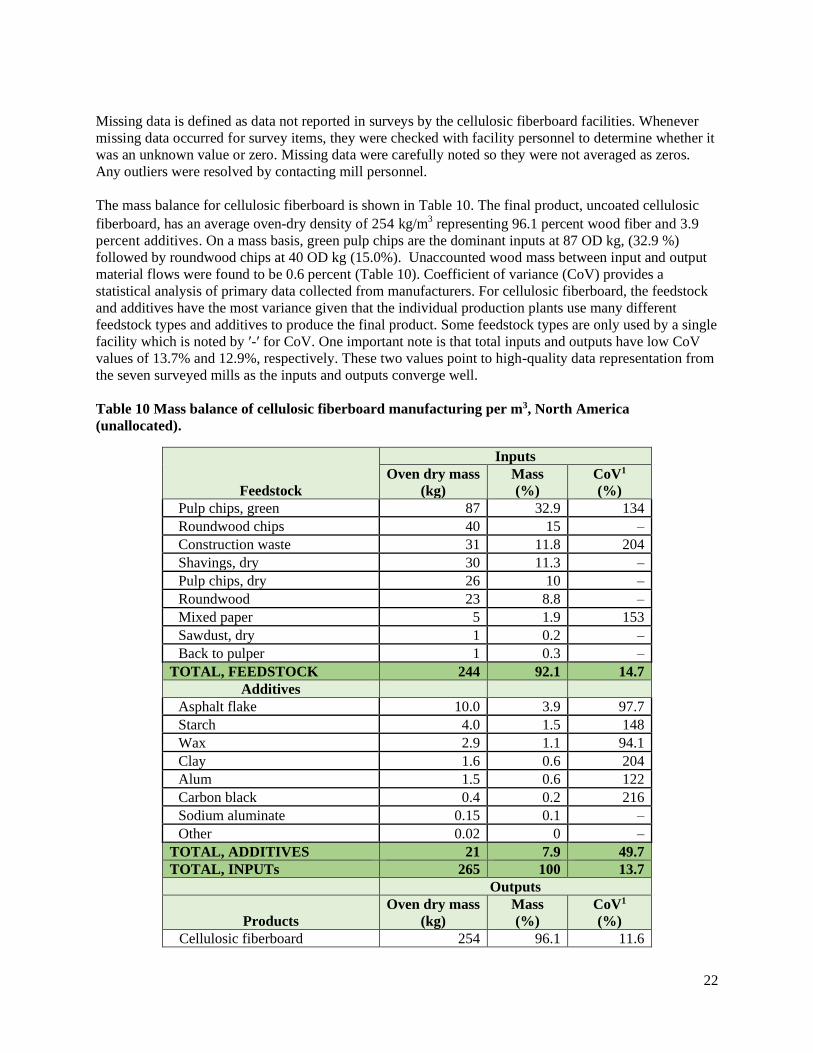
The mass balance for cellulosic fiberboard is shown in Table 10. The final product, uncoated cellulosic
fiberboard, has an average oven-dry density of 254 kg/m3 representing 96.1 percent wood fiber and 3.9
percent additives. On a mass basis, green pulp chips are the dominant inputs at 87 OD kg, (32.9 %)
followed by roundwood chips at 40 OD kg (15.0%). Unaccounted wood mass between input and output
material flows were found to be 0.6 percent (Table 10). Coefficient of variance (CoV) provides a
statistical analysis of primary data collected from manufacturers. For cellulosic fiberboard, the feedstock
and additives have the most variance given that the individual production plants use many different
feedstock types and additives to produce the final product. Some feedstock types are only used by a single
facility which is noted by ′-′ for CoV. One important note is that total inputs and outputs have low CoV
values of 13.7% and 12.9%, respectively. These two values point to high-quality data representation from
the seven surveyed mills as the inputs and outputs converge well.
Table 10 Mass balance of cellulosic fiberboard manufacturing per m3, North America
(unallocated).
Feedstock
Inputs
Oven dry mass
(kg)
Mass
(%)
CoV1
(%)
Pulp chips, green 87 32.9 134
Roundwood chips 40 15 –
Construction waste 31 11.8 204
Shavings, dry 30 11.3 –
Pulp chips, dry 26 10 –
Roundwood 23 8.8 –
Mixed paper 5 1.9 153
Sawdust, dry 1 0.2 –
Back to pulper 1 0.3 –
TOTAL, FEEDSTOCK 244 92.1 14.7
Additives
Asphalt flake 10.0 3.9 97.7
Starch 4.0 1.5 148
Wax 2.9 1.1 94.1
Clay 1.6 0.6 204
Alum 1.5 0.6 122
Carbon black 0.4 0.2 216
Sodium aluminate 0.15 0.1 –
Other 0.02 0 –
TOTAL, ADDITIVES 21 7.9 49.7
TOTAL, INPUTs 265 100 13.7
Outputs
Products
Oven dry mass
(kg)
Mass
(%)
CoV1
(%)
Cellulosic fiberboard 254 96.1 11.6
23
Co-products
Culled boards, wood fuel 1.1 0.4 –
Molasses 5.8 2.2 –
Pins and fines 1.9 0.7 –
Other, not specified 1.5 0.6 –
TOTAL, CO-PRODUCTS 11 3.9 205
TOTAL, OUTPUTS 265 100 12.9 1 Coefficient of variation.
5.2 Allocation rules If one or more co-products are generated during the production process, it is necessary to allocate the
inputs and outputs using a standardized approach. The LCA on cellulosic fiberboard follows the
allocation rules in the PCR (FPInnovations 2015) which states that when the total revenues between the
main product and co-products is more than 10%, allocation shall be based on the revenue [economic]
allocation. The 10% rule is applied based on a per unit basis, in this case per m3 of cellulosic fiberboard.
To ensure comparability with previous CORRIM wood product LCAs
(http://www.corrim.org/pubs/reports.asp), this report also presents results based on mass allocation. Mass
allocation results can be found in the subsequent sections of this report, while economic allocation results
are located in Appendix A- Section 12 of this report.
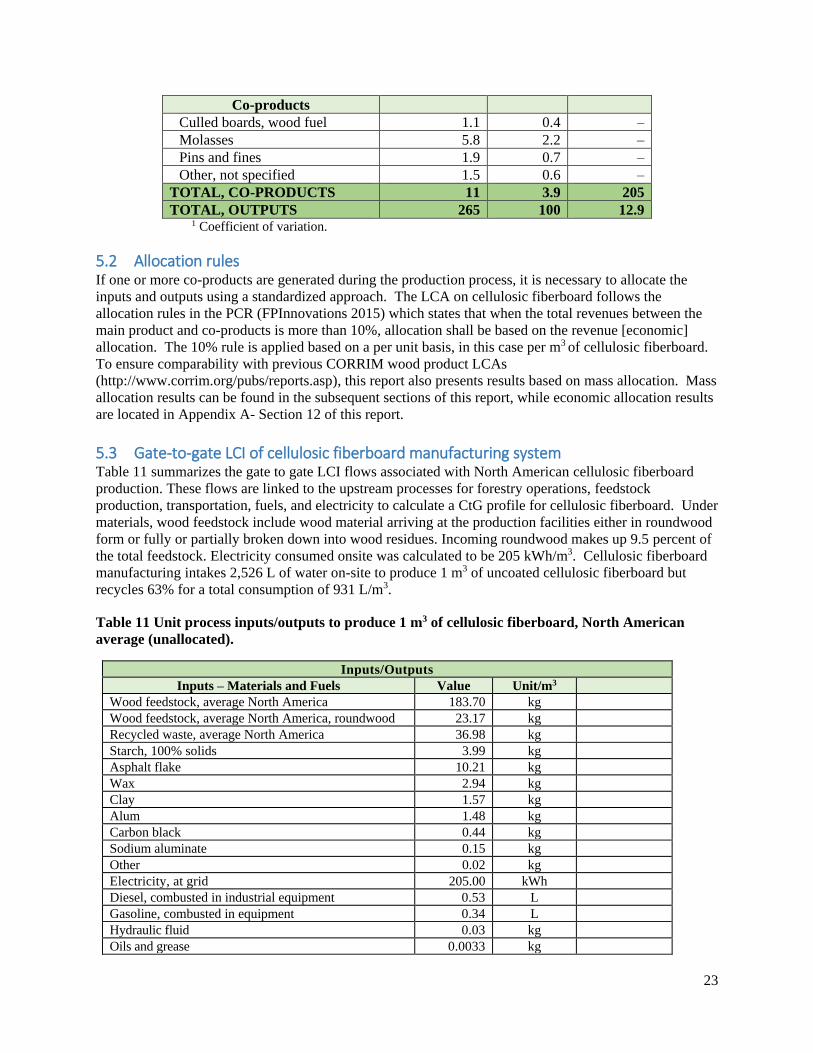
5.3 Gate-to-gate LCI of cellulosic fiberboard manufacturing system Table 11 summarizes the gate to gate LCI flows associated with North American cellulosic fiberboard
production. These flows are linked to the upstream processes for forestry operations, feedstock
production, transportation, fuels, and electricity to calculate a CtG profile for cellulosic fiberboard. Under
materials, wood feedstock include wood material arriving at the production facilities either in roundwood
form or fully or partially broken down into wood residues. Incoming roundwood makes up 9.5 percent of
the total feedstock. Electricity consumed onsite was calculated to be 205 kWh/m3. Cellulosic fiberboard
manufacturing intakes 2,526 L of water on-site to produce 1 m3 of uncoated cellulosic fiberboard but
recycles 63% for a total consumption of 931 L/m3.
Table 11 Unit process inputs/outputs to produce 1 m3 of cellulosic fiberboard, North American
average (unallocated).
Inputs/Outputs
Inputs – Materials and Fuels Value Unit/m3
Wood feedstock, average North America 183.70 kg
Wood feedstock, average North America, roundwood 23.17 kg
Recycled waste, average North America 36.98 kg
Starch, 100% solids 3.99 kg
Asphalt flake 10.21 kg
Wax 2.94 kg
Clay 1.57 kg
Alum 1.48 kg
Carbon black 0.44 kg
Sodium aluminate 0.15 kg
Other 0.02 kg
Electricity, at grid 205.00 kWh
Diesel, combusted in industrial equipment 0.53 L
Gasoline, combusted in equipment 0.34 L
Hydraulic fluid 0.03 kg
Oils and grease 0.0033 kg

24
Lubricant and oil 0.03 kg
Marking paint and ink 0.03 kg
LPG, combusted in industrial equipment 1.09 L
Natural gas, combusted in industrial boiler, direct-fired 46.66 m3
CORRIM Wood Boiler 24.84 kg
Anthracite coal, combusted in industrial boiler 13.04 kg
Transport, combination truck, diesel power, wood
feedstock 16.66 tkm
Transport, combination truck, diesel powered, starch 2.66 tkm
Transport, combination truck, diesel powered, asphalt
flake 2.76 tkm
Transport, combination truck, diesel powered, wax 1.05 tkm
Transport, combination truck, diesel powered, clay 2.04 tkm
Transport, combination truck, diesel powered, alum 0.20 tkm
Transport, train, diesel powered, coal 0.23 tkm
Wrapping material – packaging 0.46 kg
Strap protectors – packaging 0.20 kg
Strapping – packaging 0.08 kg
Spacers – packaging 1.39 kg
Inputs - Water Value Unit/m3
Water, well, in ground 1,230.00 L
Water, cooling, surface 943.00 L
Water, process, surface 353.00 L
Outputs – Products and Co-Products Value Unit/m3 Mass
Allocation %
Cellulosic fiberboard 1.00 m3 96.1
Culled boards, wood fuel 1.10 kg 0.4
Molasses 5.80 kg 2.2
Pins and fines 1.90 kg 0.7
Other, not specified 1.50 kg 0.6
Outputs - Emissions to air Value Unit/m3
VOC, volatile organic compounds 0.21000 kg
Acetaldehyde 0.01990 kg
Acetone 0.00964 kg
Acrolein 0.00705 kg
Alpha-Pinene 0.11000 kg
Benzene 0.00088 kg
Carbon monoxide 0.04090 kg
Cumene 0.00519 kg
Formaldehyde 0.01640 kg
Lead 0.00003 kg
Limonene 0.00763 kg
Methanol 0.06240 kg
Methyl ethyl ketone 0.00202 kg
Dinitrogen monoxide (N2O) 0.04870 kg
Particulates, < 2.5 um 0.04460 kg
Particulates, > 2.5 um, and < 10um 0.12800 kg
Particulates, < 10 um 0.17200 kg
Particulates, unspecified 0.15100 kg
Phenol 0.00393 kg
Propanal 0.01400 kg
Sulfur dioxide 0.00028 kg
Toluene 0.00111 kg
25
Outputs - Emissions to water Value Unit/m3
BOD5, Biological Oxygen Demand 0.2712 kg
COD, Chemical Oxygen Demand 0.2029 kg
Oils, unspecified 0.0152 kg
Solved solids 1.1130 kg
Suspended solids, unspecified 0.223 kg
Outputs - Waste to treatment Value Unit/m3
Waste to inert landfill 5.63 kg
Waste to recycling 8.83 kg
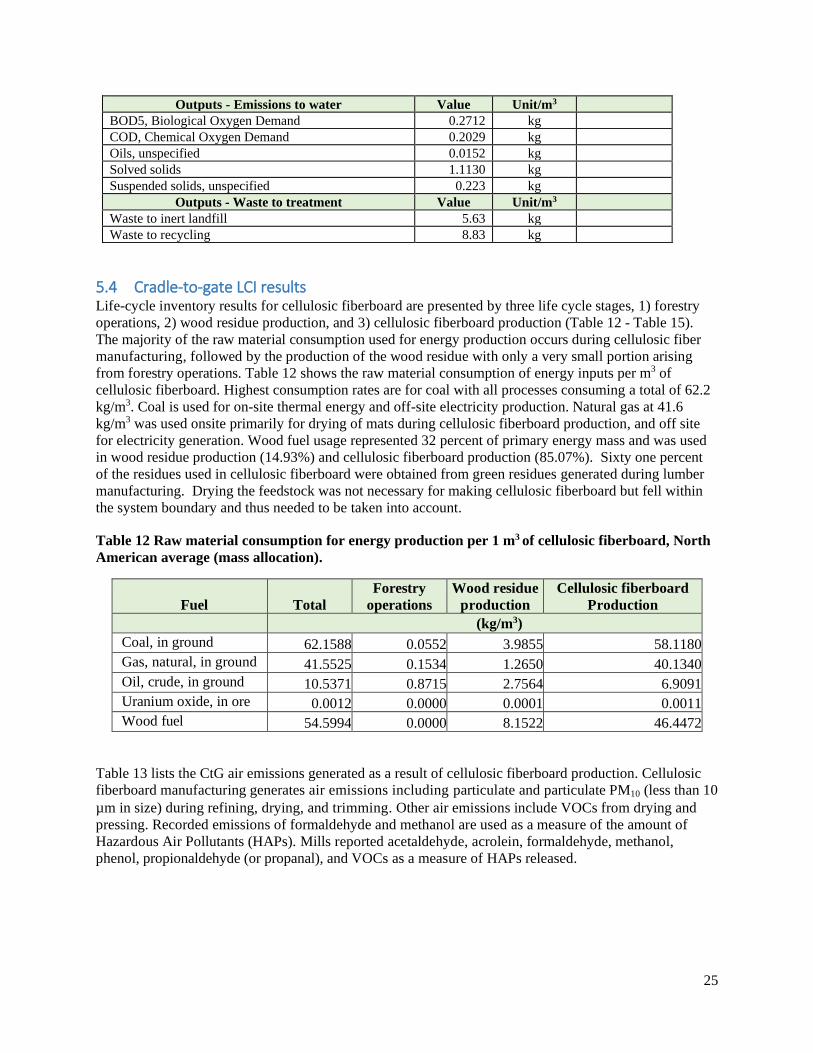
5.4 Cradle-to-gate LCI results Life-cycle inventory results for cellulosic fiberboard are presented by three life cycle stages, 1) forestry
operations, 2) wood residue production, and 3) cellulosic fiberboard production (Table 12 - Table 15).
The majority of the raw material consumption used for energy production occurs during cellulosic fiber
manufacturing, followed by the production of the wood residue with only a very small portion arising
from forestry operations. Table 12 shows the raw material consumption of energy inputs per m3 of
cellulosic fiberboard. Highest consumption rates are for coal with all processes consuming a total of 62.2
kg/m3. Coal is used for on-site thermal energy and off-site electricity production. Natural gas at 41.6
kg/m3 was used onsite primarily for drying of mats during cellulosic fiberboard production, and off site
for electricity generation. Wood fuel usage represented 32 percent of primary energy mass and was used
in wood residue production (14.93%) and cellulosic fiberboard production (85.07%). Sixty one percent
of the residues used in cellulosic fiberboard were obtained from green residues generated during lumber
manufacturing. Drying the feedstock was not necessary for making cellulosic fiberboard but fell within
the system boundary and thus needed to be taken into account.
Table 12 Raw material consumption for energy production per 1 m3 of cellulosic fiberboard, North
American average (mass allocation).
Fuel Total
Forestry
operations
Wood residue
production
Cellulosic fiberboard
Production
(kg/m3)
Coal, in ground 62.1588 0.0552 3.9855 58.1180
Gas, natural, in ground 41.5525 0.1534 1.2650 40.1340
Oil, crude, in ground 10.5371 0.8715 2.7564 6.9091
Uranium oxide, in ore 0.0012 0.0000 0.0001 0.0011
Wood fuel 54.5994 0.0000 8.1522 46.4472
Table 13 lists the CtG air emissions generated as a result of cellulosic fiberboard production. Cellulosic
fiberboard manufacturing generates air emissions including particulate and particulate PM10 (less than 10
µm in size) during refining, drying, and trimming. Other air emissions include VOCs from drying and
pressing. Recorded emissions of formaldehyde and methanol are used as a measure of the amount of
Hazardous Air Pollutants (HAPs). Mills reported acetaldehyde, acrolein, formaldehyde, methanol,
phenol, propionaldehyde (or propanal), and VOCs as a measure of HAPs released.

26
Table 13 Air emissions released per 1 m3 of cellulosic fiberboard, North American average (mass
allocation).
Air Emissions1
Total
Forestry
operations
Wood
residue
production
Cellulosic fiberboard
production
kg/m3
Acetaldehyde 0.0207 0.0000 0.0015 0.0192
Acetone 0.0093 0.0000 0.0000 0.0093
Acrolein 0.0069 0.0000 0.0001 0.0068
Aldehydes, unspecified 0.0003 0.0000 0.0001 0.0001
alpha-Pinene 0.1064 0.0000 0.0003 0.1061
Ammonia 0.0064 0.0001 0.0002 0.0060
Benzene 0.0024 0.0000 0.0000 0.0023
Biphenyl 0.0002 0.0000 0.0000 0.0002
BTEX (Benzene, Toluene, Ethylbenzene,
and Xylene), unspecified ratio
0.0146 0.0001 0.0004 0.0141
Carbon dioxide 2.1979 0.0866 0.0664 2.0449
Carbon dioxide, biogenic 58.3915 0.0024 14.4408 43.9483
Carbon dioxide, fossil 257.6714 2.8573 19.7007 235.1134
Carbon monoxide 0.0489 0.0000 0.0042 0.0447
Carbon monoxide, biogenic 0.1025 0.0000 0.0258 0.0767
Carbon monoxide, fossil 0.3062 0.0260 0.0611 0.2190
Chlorothalonil 0.0006 0.0000 0.0000 0.0006
Chromium 0.0001 0.0000 0.0000 0.0001
Cumene 0.0050 0.0000 0.0000 0.0050
Dinitrogen monoxide 0.0523 0.0005 0.0007 0.0511
Dipropylthiocarbamic acid S-ethyl ester 0.0002 0.0000 0.0000 0.0002
Formaldehyde 0.0166 0.0000 0.0002 0.0163
HAPs 0.0002 0.0000 0.0001 0.0001
Hydrocarbons, unspecified 0.0124 0.0000 0.0001 0.0123
Hydrogen chloride 0.0218 0.0000 0.0020 0.0197
Hydrogen fluoride 0.0103 0.0000 0.0003 0.0100
Isoprene 0.0593 0.0001 0.0066 0.0526
Limonene 0.0074 0.0000 0.0000 0.0074
Magnesium 0.0002 0.0000 0.0000 0.0002
Mancozeb 0.0005 0.0000 0.0000 0.0005
Metam-sodium dihydrate 0.0028 0.0000 0.0000 0.0028
Methane 0.7157 0.0052 0.0390 0.6716
Methane, biogenic 0.0007 0.0000 0.0002 0.0005
Methane, fossil 0.0846 0.0005 0.0030 0.0811
Methanol 0.0617 0.0000 0.0013 0.0604
Methyl ethyl ketone 0.0020 0.0000 0.0000 0.0019
Naphthalene 0.0010 0.0000 0.0000 0.0010
Nickel 0.0001 0.0000 0.0000 0.0001
Nitrogen oxides 0.7561 0.0513 0.1242 0.5806
NMVOC, non-methane volatile organic
compounds, unspecified origin
0.0181 0.0017 0.0064 0.0100
N-Nitrodimethylamine 0.0014 0.0000 0.0000 0.0014
Organic substances, unspecified 0.0006 0.0000 0.0004 0.0002
Particulates, < 10 um 0.1817 0.0000 0.0046 0.1771
Particulates, < 2.5 um 0.0496 0.0000 0.0028 0.0468
Particulates, > 10 um 0.0050 0.0000 0.0049 0.0001
Particulates, > 2.5 um, and < 10um 0.1473 0.0016 0.0031 0.1426
Particulates, unspecified 0.2916 0.0003 0.0071 0.2842
Phenol 0.0038 0.0000 0.0000 0.0038
Phorate 0.0001 0.0000 0.0000 0.0001
Propanal 0.0136 0.0000 0.0001 0.0135
Propene 0.0001 0.0000 0.0000 0.0000

27
Air Emissions1
Total
Forestry
operations
Wood
residue
production
Cellulosic fiberboard
production
Propene, 1,3-dichloro- 0.0014 0.0000 0.0000 0.0014
Radionuclides (Including Radon) 0.0017 0.0000 0.0001 0.0015
Sulfur dioxide 2.3130 0.0050 0.0867 2.2214
Sulfur monoxide 0.0231 0.0029 0.0066 0.0136
Sulfur oxides 0.0035 0.0000 0.0031 0.0004
Toluene 0.0011 0.0000 0.0000 0.0011
VOC, volatile organic compounds 0.2924 0.0015 0.0241 0.2668
Wood (dust) 0.0208 0.0000 0.0074 0.0134 1 Due to large amount of air emissions, total emissions less than 10-4 are not shown. A complete list of all air emissions can be found in
Appendix B of this report 2 Non-methane volatile organic compounds, unspecified origin.
Most of the waterborne emissions reported by cellulosic fiberboard manufacturers are produced on-site as
shown in Table 14. For unspecified suspended solids to water, a value of 13.7 kg/m3 of cellulosic
fiberboard was estimated. Most of unspecified suspended solids emissions were from the process of
extracting natural gas from the ground and thus did not occur at the production facilities.
Table 14 Emissions to water released per 1 m3 of cellulosic fiberboard, North American average
(mass allocation).
Water emissions Total
Forestry
operations
Wood residue
production
Cellulosic
fiberboard
production
kg/m3
Aluminium 0.0063 0.0003 0.0010 0.0050
Ammonia 0.0028 0.0001 0.0003 0.0025
Barium 0.0852 0.0040 0.0134 0.0677
Benzene 0.0004 0.0000 0.0000 0.0003
Benzoic acid 0.0002 0.0000 0.0000 0.0002
BOD5, Biological Oxygen Demand 0.3012 0.0007 0.0042 0.2962
Boron 0.0007 0.0000 0.0000 0.0006
Bromide 0.0458 0.0008 0.0033 0.0417
Calcium 0.6824 0.0122 0.0452 0.6250
Calcium, ion 0.0041 0.0000 0.0041 0.0000
Chloride 7.7158 0.1370 0.5541 7.0248
COD, Chemical Oxygen Demand 0.2615 0.0013 0.0060 0.2542
Detergent, oil 0.0002 0.0000 0.0000 0.0002
Fluoride 0.0044 0.0025 0.0016 0.0002
Iron 0.0169 0.0006 0.0021 0.0142
Lithium 0.2003 0.0007 0.0049 0.1947
Lithium, ion 0.0013 0.0000 0.0013 0.0000
Magnesium 0.1342 0.0024 0.0096 0.1222
Manganese 0.0008 0.0000 0.0000 0.0007
Metam-sodium dihydrate 0.0002 0.0000 0.0000 0.0002
Nitrogen, total 0.0112 0.0000 0.0000 0.0111
Oils, unspecified 0.0191 0.0001 0.0004 0.0186
Phosphate 0.0031 0.0019 0.0012 0.0000
Phosphorus compounds, unspecified 0.0004 0.0000 0.0000 0.0004
Silver 0.0004 0.0000 0.0000 0.0004
Sodium 2.1630 0.0386 0.1432 1.9812
Sodium, ion 0.0131 0.0000 0.0131 0.0000
Solved solids 0.0574 0.0000 0.0574 0.0000
Strontium 0.0116 0.0002 0.0008 0.0106

28
Water emissions Total
Forestry
operations
Wood residue
production
Cellulosic
fiberboard
production
Sulfate 0.0426 0.0003 0.0033 0.0390
Sulfur 0.0006 0.0000 0.0000 0.0005
Suspended solids, unspecified 13.7123 0.1779 0.6704 12.8640
Toluene 0.0003 0.0000 0.0000 0.0003
Waste water/m3 0.0008 0.0000 0.0001 0.0007
Xylene 0.0002 0.0000 0.0000 0.0002
Zinc 0.0002 0.0000 0.0000 0.0001
Due to large amount of air emissions, total emissions less than 10-4 are not shown. A complete list of all air emissions can be found in Appendix
B of this report.
Solid emissions generated onsite during cellulosic fiberboard manufacturing includes ash generated at the
boiler. Other waste generated is a result of upstream processes, primarily fuels and resins, used in
cellulosic fiberboard production (Table 15). A total of 13.93 kg/m3 waste was generated onsite with 55
percent going to the landfill and the remaining portion being recycled (Bergman 2015). A total of 55.90 kg
of solid waste was generated from cradle-to-gate for the production of 1 m3 cellulosic fiberboard, includes
all upstream and secondary LCI processes, of that 97 percent was generated during the cellulosic
fiberboard production or generated by an upstream processes used during the production process.
Table 15 Waste to treatment per 1 m3 of cellulosic fiberboard, North American average (mass
allocation).
Waste to treatment
Total
Forestry
operations
Wood residue
production
Cellulosic
fiberboard
production
kg/m3
Waste generated onsite 13.93 0.00 0.00 13.93
Waste disposal 41.97 0.05 1.57 40.35
Total waste 55.90 0.05 1.57 54.28
6 Life-cycle impact assessment results The life cycle impact assessment (LCIA) phase establishes links between the life cycle inventory results
and potential environmental impacts. The LCIA calculates impact indicators, such as global warming
potential and smog. These impact indicators provide general, but quantifiable, indications of potential
environmental impacts. The target impact indicator, the impact category, and means of characterizing the
impacts are summarized in Table 16. Environmental impacts are determined using the TRACI method
(Bare et al. 2011). These five impact categories are reported consistent with the requirement of the wood
products PCR (FPInnovations 2015).

29
Table 16 Selected impact indicators, characterization models, and impact categories.
Impact Indicator Characterization Model Impact
Category
Greenhouse gas (GHG)
emissions
Calculate total emissions in the reference unit of
CO2 equivalents for CO2, methane, and nitrous
oxide.
Global
warming
Releases to air decreasing or
thinning of ozone layer
Calculate the total ozone forming chemicals in the
stratosphere including CFC’s HCFC’s, chlorine, and
bromine. Ozone depletion values are measured in
the reference units of CFC equivalents.
Ozone
depletion
Releases to air potentially
resulting in acid rain
(acidification)
Calculate total hydrogen ion (SO2) equivalent for
released sulfur oxides, nitrogen oxides, hydrochloric
acid, and ammonia. Acidification value of SO2
mole-eq. is used as a reference unit.
Acidification
Releases to air potentially
resulting in smog
Calculate total substances that can be photo-
chemically oxidized. Smog forming potential of O3
is used as a reference unit.
Photochemical
smog
Releases to air potentially
resulting in eutrophication
of water bodies
Calculate total substances that contain available
nitrogen or phosphorus. Eutrophication potential of
N-eq. is used as a reference unit.
Eutrophication
Each impact indicator is a measure of an aspect of a potential impact. This LCIA does not make value
judgments about the impact indicators, meaning that no single indicator is given more or less value than
any of the others. All are presented as equals. Additionally, each impact indicator value is stated in units
that are not comparable to others. For the same reasons, indicators should not be combined or added.
Table 17 provides the environmental impact by category for cellulosic fiberboard. In addition, energy and
material resource consumption values and the waste generated are also provided.

30
Table 17 Environmental performance of 1 m3 cellulosic fiberboard, North American average (mass
allocation).
Impact category Unit Total
Forestry
operations
Wood residue
production
Cellulosic
fiberboard
production
Global warming potential (GWP) kg CO2 eq 295.49 3.24 21.03 271.22
Acidification Potential kg SO2 eq 2.92 0.04 0.19 2.69
Eutrophication Potential kg N eq 0.08 0.01 0.01 0.06
Ozone depletion Potential
kg CFC-11
eq 0.000 0.0000 0.0000 0.0000
Smog Potential kg O3 eq 21.44 1.28 3.25 16.91
Total Primary Energy MJ 6,273.84 50.08 534.2 5,689.56
Non-renewable fossil MJ 4,398.52 49.53 312.13 4,036.86
Non-renewable nuclear MJ 445.65 0.49 36.11 409.05
Renewable (solar, wind,
hydroelectric, and geothermal) MJ 286.64 0.06 15.28 271.30
Renewable, biomass MJ 1143.03 0.00 170.68 972.35
Material resources
consumption
(Non-fuel resources) Unit Total
Forestry
Operations
Wood residue
production
Cellulosic
fiberboard
production
Non-renewable materials kg 0.3165 0.0000 0.0114 0.3051
Renewable materials kg 343.46 186.19 155.90 1.37
Fresh water L 3707.33 0.63 53.04 3653.66
Waste generated Unit Total
Forestry
Operations
Wood residue
production
Cellulosic
fiberboard
production
Solid waste kg 55.9 0.05 1.57 54.28
Environmental performance results for global warming potential (GWP), acidification, eutrophication,
ozone depletion and smog, energy consumption from non-renewables, renewables, wind, hydro, solar,
and nuclear fuels, renewable and nonrenewable resources, and solid waste are shown in Table 17. For
GWP, 92 percent of the CO2 eq. emissions come from producing cellulosic fiberboard. Similar results are
presented for acidification, eutrophication, and smog, representing 92, 78, and 79 percent contributed
from cellulosic fiberboard production, respectively.
Non-renewable fuels represented the greatest proportion of energy consumed (77%) for total CtG primary
energy use. Renewable biomass fuels and non-renewable nuclear represented 18 and 7 percent of the total
primary energy, respectively. Of the three life cycle stages considered in this study, cellulosic fiberboard
production consumes 91 percent of the total primary energy consumption. Overall, the manufacture of
cellulosic fiberboard in North America is 18 percent energy self-sufficient with its use of renewable
biomass. By the nature of the production process, self-producing wood fuel would be difficult to obtain
onsite; therefore, to increase the use of renewable biomass onsite would be limited to purchasing wood
fuel from other wood production industries or utilization of whole logs not suitable for lumber or
plywood production.
Water intake is high for the cradle-to-gate production of cellulosic fiberboard at 3,707 L/m3 but much
more lower than a previous reported value, 22,700 L/m3 (Suchsland and Woodson 1986). In addition, the
water intake value did not consider the water recycling efforts that now are at 63% at the cellulosic
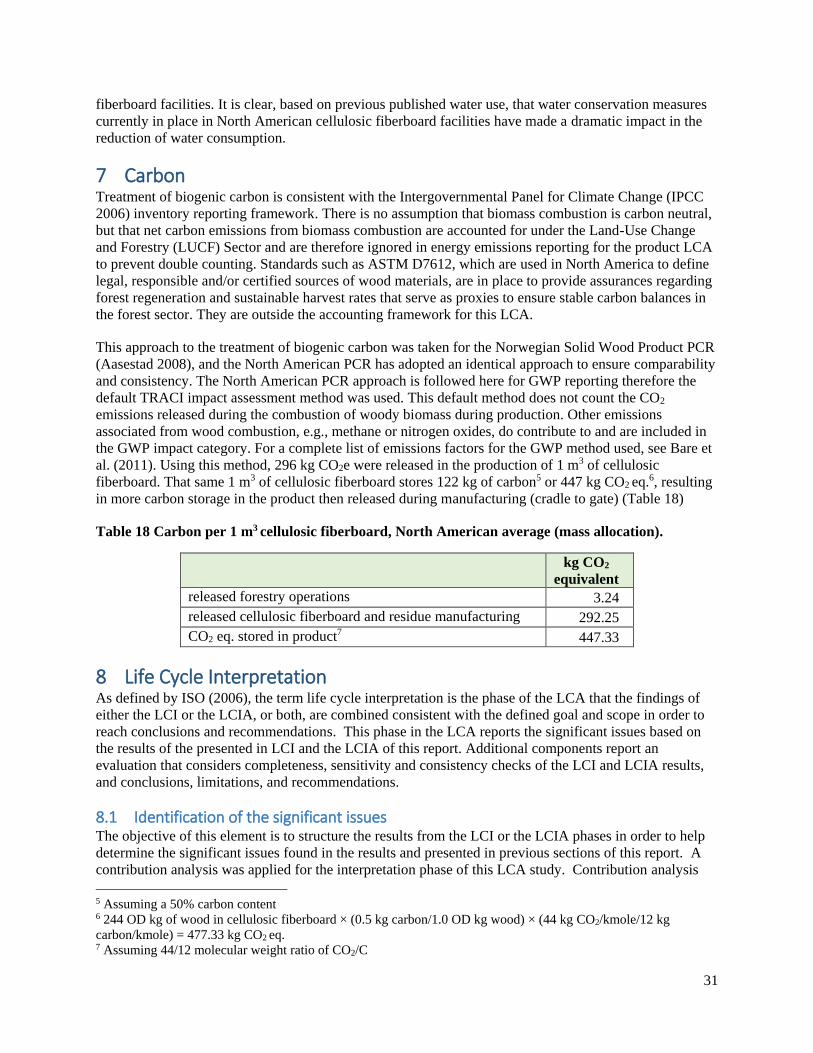
31
fiberboard facilities. It is clear, based on previous published water use, that water conservation measures
currently in place in North American cellulosic fiberboard facilities have made a dramatic impact in the
reduction of water consumption.
7 Carbon Treatment of biogenic carbon is consistent with the Intergovernmental Panel for Climate Change (IPCC
2006) inventory reporting framework. There is no assumption that biomass combustion is carbon neutral,
but that net carbon emissions from biomass combustion are accounted for under the Land-Use Change
and Forestry (LUCF) Sector and are therefore ignored in energy emissions reporting for the product LCA
to prevent double counting. Standards such as ASTM D7612, which are used in North America to define
legal, responsible and/or certified sources of wood materials, are in place to provide assurances regarding
forest regeneration and sustainable harvest rates that serve as proxies to ensure stable carbon balances in
the forest sector. They are outside the accounting framework for this LCA.
This approach to the treatment of biogenic carbon was taken for the Norwegian Solid Wood Product PCR
(Aasestad 2008), and the North American PCR has adopted an identical approach to ensure comparability
and consistency. The North American PCR approach is followed here for GWP reporting therefore the
default TRACI impact assessment method was used. This default method does not count the CO2
emissions released during the combustion of woody biomass during production. Other emissions
associated from wood combustion, e.g., methane or nitrogen oxides, do contribute to and are included in
the GWP impact category. For a complete list of emissions factors for the GWP method used, see Bare et
al. (2011). Using this method, 296 kg CO2e were released in the production of 1 m3 of cellulosic
fiberboard. That same 1 m3 of cellulosic fiberboard stores 122 kg of carbon5 or 447 kg CO2 eq.6, resulting
in more carbon storage in the product then released during manufacturing (cradle to gate) (Table 18)
Table 18 Carbon per 1 m3 cellulosic fiberboard, North American average (mass allocation).
kg CO2
equivalent
released forestry operations 3.24
released cellulosic fiberboard and residue manufacturing 292.25
CO2 eq. stored in product7 447.33
8 Life Cycle Interpretation As defined by ISO (2006), the term life cycle interpretation is the phase of the LCA that the findings of
either the LCI or the LCIA, or both, are combined consistent with the defined goal and scope in order to
reach conclusions and recommendations. This phase in the LCA reports the significant issues based on
the results of the presented in LCI and the LCIA of this report. Additional components report an
evaluation that considers completeness, sensitivity and consistency checks of the LCI and LCIA results,
and conclusions, limitations, and recommendations.
8.1 Identification of the significant issues The objective of this element is to structure the results from the LCI or the LCIA phases in order to help
determine the significant issues found in the results and presented in previous sections of this report. A
contribution analysis was applied for the interpretation phase of this LCA study. Contribution analysis
5 Assuming a 50% carbon content 6 244 OD kg of wood in cellulosic fiberboard × (0.5 kg carbon/1.0 OD kg wood) × (44 kg CO2/kmole/12 kg
carbon/kmole) = 477.33 kg CO2 eq. 7 Assuming 44/12 molecular weight ratio of CO2/C
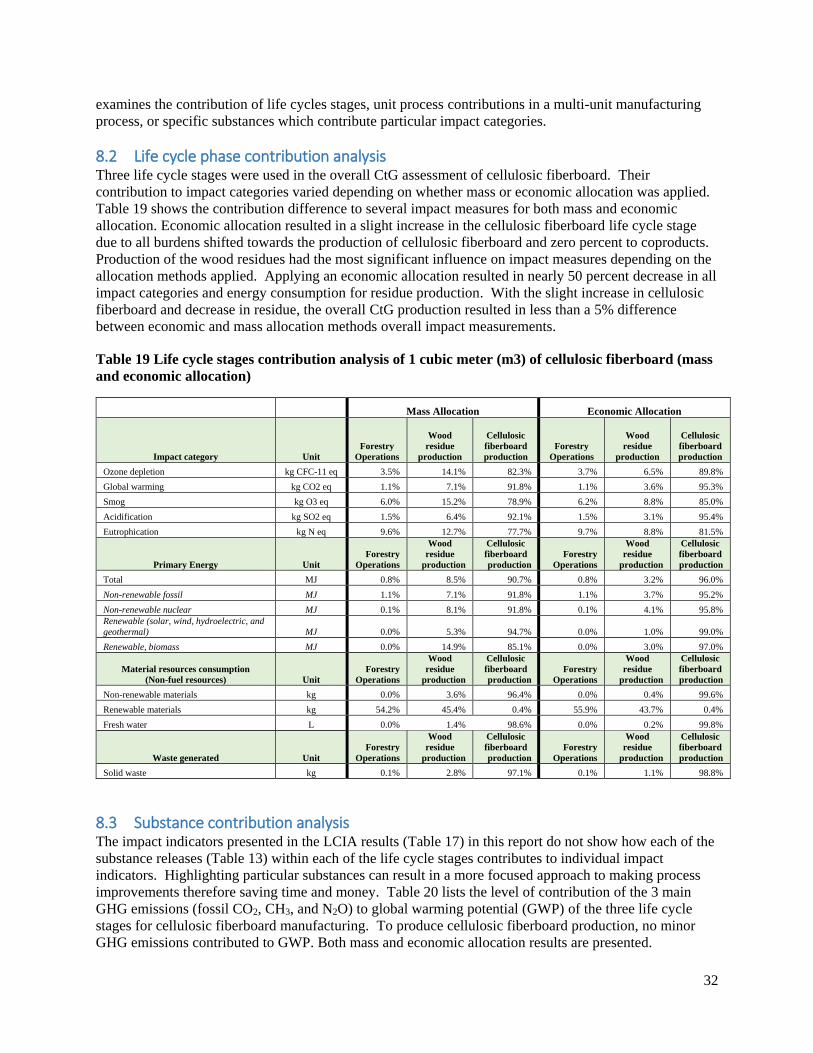
32
examines the contribution of life cycles stages, unit process contributions in a multi-unit manufacturing
process, or specific substances which contribute particular impact categories.
8.2 Life cycle phase contribution analysis Three life cycle stages were used in the overall CtG assessment of cellulosic fiberboard. Their
contribution to impact categories varied depending on whether mass or economic allocation was applied.
Table 19 shows the contribution difference to several impact measures for both mass and economic
allocation. Economic allocation resulted in a slight increase in the cellulosic fiberboard life cycle stage
due to all burdens shifted towards the production of cellulosic fiberboard and zero percent to coproducts.
Production of the wood residues had the most significant influence on impact measures depending on the
allocation methods applied. Applying an economic allocation resulted in nearly 50 percent decrease in all
impact categories and energy consumption for residue production. With the slight increase in cellulosic
fiberboard and decrease in residue, the overall CtG production resulted in less than a 5% difference
between economic and mass allocation methods overall impact measurements.
Table 19 Life cycle stages contribution analysis of 1 cubic meter (m3) of cellulosic fiberboard (mass
and economic allocation)
Mass Allocation Economic Allocation
Impact category Unit
Forestry
Operations
Wood
residue
production
Cellulosic
fiberboard
production
Forestry
Operations
Wood
residue
production
Cellulosic
fiberboard
production
Ozone depletion kg CFC-11 eq 3.5% 14.1% 82.3% 3.7% 6.5% 89.8%
Global warming kg CO2 eq 1.1% 7.1% 91.8% 1.1% 3.6% 95.3%
Smog kg O3 eq 6.0% 15.2% 78.9% 6.2% 8.8% 85.0%
Acidification kg SO2 eq 1.5% 6.4% 92.1% 1.5% 3.1% 95.4%
Eutrophication kg N eq 9.6% 12.7% 77.7% 9.7% 8.8% 81.5%
Primary Energy Unit
Forestry
Operations
Wood
residue
production
Cellulosic
fiberboard
production
Forestry
Operations
Wood
residue
production
Cellulosic
fiberboard
production
Total MJ 0.8% 8.5% 90.7% 0.8% 3.2% 96.0%
Non-renewable fossil MJ 1.1% 7.1% 91.8% 1.1% 3.7% 95.2%
Non-renewable nuclear MJ 0.1% 8.1% 91.8% 0.1% 4.1% 95.8%
Renewable (solar, wind, hydroelectric, and
geothermal) MJ 0.0% 5.3% 94.7% 0.0% 1.0% 99.0%
Renewable, biomass MJ 0.0% 14.9% 85.1% 0.0% 3.0% 97.0%
Material resources consumption
(Non-fuel resources) Unit
Forestry
Operations
Wood
residue
production
Cellulosic
fiberboard
production
Forestry
Operations
Wood
residue
production
Cellulosic
fiberboard
production
Non-renewable materials kg 0.0% 3.6% 96.4% 0.0% 0.4% 99.6%
Renewable materials kg 54.2% 45.4% 0.4% 55.9% 43.7% 0.4%
Fresh water L 0.0% 1.4% 98.6% 0.0% 0.2% 99.8%
Waste generated Unit
Forestry
Operations
Wood
residue
production
Cellulosic
fiberboard
production
Forestry
Operations
Wood
residue
production
Cellulosic
fiberboard
production
Solid waste kg 0.1% 2.8% 97.1% 0.1% 1.1% 98.8%
8.3 Substance contribution analysis The impact indicators presented in the LCIA results (Table 17) in this report do not show how each of the
substance releases (Table 13) within each of the life cycle stages contributes to individual impact
indicators. Highlighting particular substances can result in a more focused approach to making process
improvements therefore saving time and money. Table 20 lists the level of contribution of the 3 main
GHG emissions (fossil CO2, CH3, and N2O) to global warming potential (GWP) of the three life cycle
stages for cellulosic fiberboard manufacturing. To produce cellulosic fiberboard production, no minor
GHG emissions contributed to GWP. Both mass and economic allocation results are presented.

33
Table 20. Substance contribution1/ analysis to Global Warming Potential (kg CO2 eq.) by life cycle
stage total percent basis and values are displayed per 1.0 m3.
Mass Allocation Economic Allocation
GWP substances
Compartment
type TOTAL
Forestry
Operations
Wood
residue
production
Cellulosic
fiberboard
production TOTAL
Forestry
Operations
Wood
residue
production
Cellulosic
fiberboard
production
Total of all compartments 100.00% 3.24 21.03 271.22 100.00% 3.24 10.63 281.23
Carbon dioxide, fossil (CO2 ) Air 87.94% 2.94 19.77 237.16 87.73% 2.94 10.04 245.91
Methane (CH4) Air 6.78% 0.14 1.05 18.83 6.82% 0.14 0.47 19.52
Dinitrogen monoxide (N2O) Air 5.28% 0.15 0.21 15.23 5.45% 0.15 0.12 15.80
Remaining substances Air 0.00% 0.00 0.00 0.00 0.00% 0.00 0.00 0.00
1/ additional substance contributions for other impact categories can be found in Appendix C of this report
8.4 Completeness, sensitivity and consistency checks Evaluating the LCA’s completeness, sensitivity, and consistency offers confidence in and the reliability of
the LCA results. The completeness check process verifies whether information from the life cycle phases
of a LCA are sufficient for reaching the goals and scope and conclusions of the study and making sound
interpretations of the results. Three life cycle stages (forestry operations, wood residue production, and
cellulosic fiberboard production) were checked for data completeness including all input elements such as
raw and ancillary materials input, energy input, transportation scenarios, water consumption, and outputs
such as products and coproducts, emissions to air, water, land, and final waste disposals. All input and
output data were found to be complete and no data gaps were identified.
Consistency check process verifies that the assumptions, methods and data are consistently applied
throughout the study and are in accordance with the goal and scope of the LCA. A comprehensive review
process was completed to this LCA to make certain consistency was applied to the assumptions made,
methods used, models, data quality including data sources, and data accuracy, age, time-related coverage,
technology, and geographical coverage.
Sensitivity analysis can be applied to the LCA to determine changes in results due to variations in
assumptions, methods, and data. A sensitivity check was performed on this LCA contrasting the mass
and economic allocation methods. This LCA used mass allocation method, similar to previous LCA’s on
wood products. To stay within conformance with the updated PCR (2015), an economic allocation was
required on the data. Cellulosic fiberboard is primarily a single-output product (96.1% by mass) with
approximately 3.2% coproduct leaving the system, and the remaining 0.6% re-entering the system as a
fuel source. For the economic allocation methods, no allocation was applied to the cellulosic fiberboard
production process. Most of the wood residue inputs to cellulosic fiberboard production, however, are the
coproducts of hardwood and softwood lumber manufacturing. Lumber production results in multiple
valuable products, such as green rough lumber, planed green and dry lumber and several variety of co-
products (i.e. pulp chips, sawdust, shavings). When either mass or economic allocation is applied, the
total environmental burden is “shared” between the primary product (lumber) and the co-products (chips,
etc.) based on total mass or total value (sales) respectively. In this LCA, wood residue values were based
on prices published in Random Lengths (2012) for the year data were collected from cellulosic fiberboard
manufacturers. Figures 6 and 7 graphically display the two allocation methods side by side across impact
indicators for cellulosic fiberboard and wood residue production, respectively. It is apparent that the
allocation method does have an influence on certain impact indicators and is highly dependent on the life
cycle stage. Overall differences in indicator totals had little influence on final results (Figure 6), while
economic allocation significantly decreased the contribution of wood residue production over mass
allocation for 5 of the 9 impact indicators (Figure 7). This decrease in contribution from wood residue
production occurred because when economic allocation was assigned lumber contributed far more of the
environmental impacts than the coproducts did versus mass allocation. Table 25 (Appendix A, Section
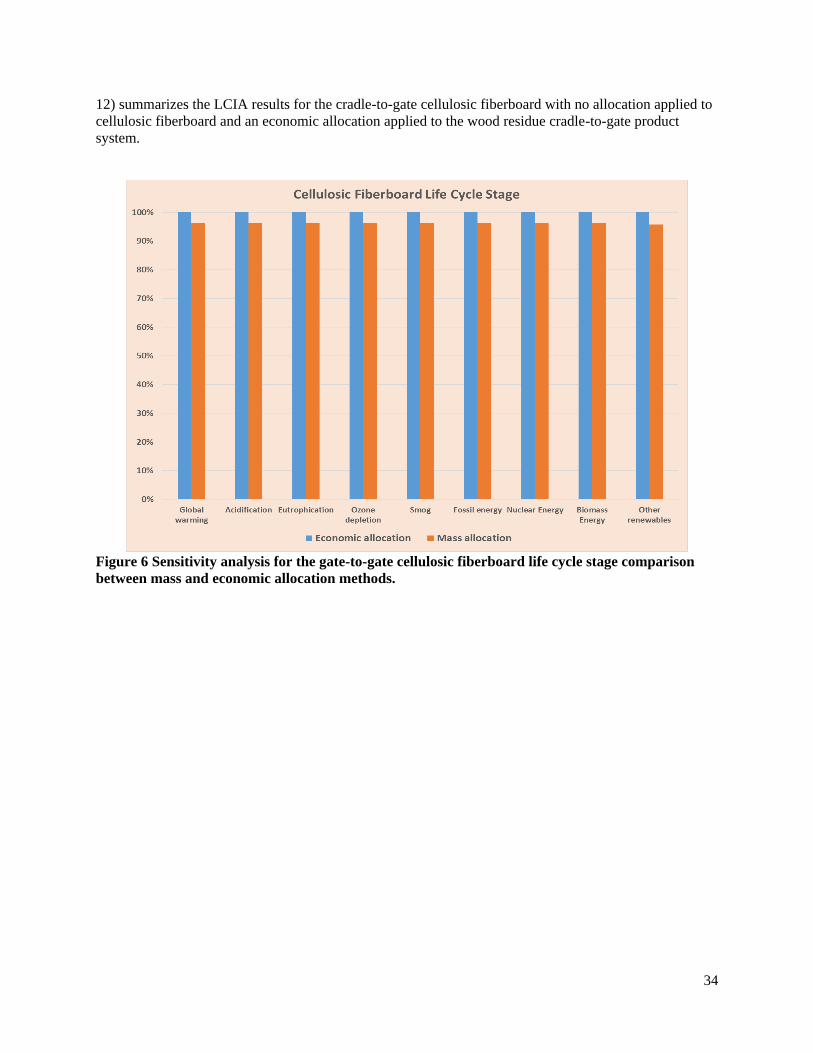
34
12) summarizes the LCIA results for the cradle-to-gate cellulosic fiberboard with no allocation applied to
cellulosic fiberboard and an economic allocation applied to the wood residue cradle-to-gate product
system.
Figure 6 Sensitivity analysis for the gate-to-gate cellulosic fiberboard life cycle stage comparison
between mass and economic allocation methods.

35
Figure 7 Sensitivity analysis for the gate-to-gate wood residue life cycle stage comparison between
mass and economic allocation methods
9 Conclusions, limitations, and recommendations This study provides a comprehensive cradle-to-gate LCA of North American cellulosic fiberboard
production. The goal of this study was to develop a LCIA from a previous published LCI report
(Bergman 2015) on cellulosic fiberboard that could be used to develop an EPD in accordance with the
Wood PCR standards (FPInnovations 2015). In additions to the previous published LCI (Bergman 2015),
this report used updated data for residue production originating from the PNW (modified for Canadian
electricity) and SE. This LCA incorporates the necessary scope to develop a “business-to-business” EPD
in accordance with the Wood PCR (FPInnovations 2015).
This report is all inclusive in that it reports both the CtG LCI and the LCIA cellulosic fiberboard. Three
life cycle stages were considered in the LCA: 1) forestry operations, 2) wood residue production and, 3)
cellulosic fiberboard. The CtG LCA for cellulosic fiberboard is representative of North American
average for all wood and energy inputs. Both mass and economic (product value) allocation methods
were applied.
The cellulosic fiberboard manufacturing stage clearly drives the environmental profile from cradle to
gate. The wood residue production environmental profile changes based on allocation method applied.
Applying an economic allocation method to wood residue production resulting in significantly lower
environmental burdens as compared to mass allocation. When no allocation was applied to cellulosic

36
fiberboard production there was only a slight increase compared to mass allocation methods, over all
impact indicators. Cradle to Gate results are similar between mass and economic allocation.
The life cycle impact categories are driven by the type of fuel used. The majority of the biomass fuel is
used during cellulosic fiberboard production, but fossil fuels remain the main energy source. By the
nature of the production process, very little wood waste is generated during cellulosic fiberboard
production therefore there is little wood waste available for use as a fuel source. The cellulosic fiberboard
production life cycle stage represents the greatest contribution to any individual impact category. Direct
fossil fuels consumption and upstream processes used during manufacturing are the main contributors to
each category.
Carbon is released as CO2 during all life cycle stages. The majority of the emission are released during
the production of cellulosic fiberboard. This is consistent with most wood product manufacturing life
cycles. In summary, cellulosic fiberboard attains a positive carbon balance in its production – a finding
worthy of communicating to users of this product.
Recommendations for continuing LCA coverage of cellulosic fiber include, but not limited to, 1)
modeling use and end-of-life life cycle phases, 2) evaluate coated cellulosic fiberboard, 3) investigate the
influence of substituting the use of renewable biomass fuel on fossil fuels and how this may effect
coproduct supply to other wood products (e.g. particleboard, medium density fiberboard).
10 Critical review 10.1 Internal review An internal review of the LCA product was provided by the other two authors, Dr. Bergman and Dr.
Oneil; both of which are knowledgeable and experienced LCA and wood products reviewers. The LCI
report (Bergman 2015) also had undergone a peer-review process before publishing. The purpose of the
LCA report internal review is to check for errors and conformance with the PCR prior to submittal for
external review. The technical and editorial comments of the reviewers were carefully considered and in
most instances incorporated into the final document.
10.2 External review The external review process is intended to ensure consistency between the completed LCA and the
principals and requirements of the International Standards on LCA (ISO 2006a) and the Product Category
Rules (PCR) for North American Structural and Architectural Wood Products (FPInnovations 2015).
Following CORRIM’s internal review, documents were submitted to UL Environment (ULE) for
independent external review. The independent external review performed by ULE was conducted by:
Wade Stout EPD Project Manager
UL Environment
UL LLC
2211 Newmarket Parkway, Suite 106
Marietta, GA 30067 USA
Mobile: 678.469.3598; Office: 678.444.4046
The external review process is intended to ensure consistency between the completed LCA and the
principals and requirements of the International Standards on LCA (ISO 2006a) and the Product Category
Rules (PCR) for North American Structural and Architectural Wood Products (FPInnovations 2015).

37
11 References Aasestad, K. 2008. The Norwegian Emission Inventory 2008. Documentation of methodologies for
estimating emissions of greenhouse gases and long-range trans-boundary air pollutants. Statistisk
sentralbyrå. Reports 2008/48 252 pp.
ASMI. 2012. A cradle-to-gate life cycle assessment of Canadian oriented strand board: An update.
Athena Sustainable Materials Institute. 43 pp.
ASTM International. 2012. Standard specification for cellulosic fiber insulating board. American Society
for Testing and Materials. ASTM C208-12. West Conshohocken, PA. 58-61.
Bare, J. C. 2011. TRACI 2.0: the tool for the reduction and assessment of chemical and other
environmental impacts 2.0. Clean Techn. Environ Policy. 21 January 2011.
Bergman R.D. 2015. Cradle-to-gate life-cycle inventory of cellulosic fiberboard produced in North
America. CORRIM Final Report. University of Washington. Seattle, WA. Revised May 2015. 57 pp.
Bergman R.D and Bowe S.A. 2011. Life-Cycle Inventory of Manufacturing Hardwood Lumber in
Southeastern US. Wood and Fiber Science, 44(1), 2012, pp. 71-84.
Bergman R.D and Bowe S.A. 2010. Life-Cycle Inventory of Hardwood Lumber Manufacturing in the
Southeastern United States. CORRIM Phase II Report Module L. Seattle, WA. 50 pp.
http://www.corrim.org/pubs/reports/2010/phase2/Module_L.pdf. Accessed Nov. 2015.
Bergman R.D and Bowe S.A. (2008a) Environmental impact of producing hardwood lumber using life-
cycle inventory. Wood Fiber Sci 40(3):448-458.
Bergman RD and Bowe S.A. (2008b) Life-cycle inventory of hardwood lumber manufacturing in the
Northeast and North central United States, CORRIM Phase II Report Module C. Environmental
performance measures for renewable building materials with alternatives for improved performance.
Seattle, WA. 48 pp. http://www.corrim.org/pubs/reports/2010/phase2/Module_C.pdf. Accessed Nov.
2015.
CAN/ULC-S706. 2009. Standard for Wood Fibre Insulating Boards for Building. Second Edition.
Underwriters Laboratories of Canada.
FPInnovations. 2015. Product Category Rules (PCR) for preparing and environmental Product
Declaration (EPD) for North American Structural and Architectural Wood Products.
https://fpinnovations.ca/ResearchProgram/environment-sustainability/epd-program/Documents/pcr-
v2.pdf. Accessed September 2015.
ISO. 2006a. Environmental labels and declarations—Type III environmental declarations—Principles and
procedures. ISO 14025. International Organization for Standardization, Geneva, Switzerland. 25 pp.
ISO. 2006b. Environmental management—life-cycle assessment—requirements and guidelines. ISO
14044. International Organization for Standardization, Geneva, Switzerland. 46 pp.
ISO. 2006c. Environmental management—life-cycle assessment—principles and framework. ISO 14040.
International Organization for Standardization, Geneva, Switzerland. 20 pp.
Jessen H.C. 1952. Drying of insulating board. TAPPI 35(10):455-467.

38
Johnson, L.R. B. Lippke, J.D. Marshall, and J. Comnick. 2005. Life-cycle impacts of forest resource
activities in the Pacific Northwest and southeast United States. Wood and Fiber Sci. 37 CORRIM
Special Issue. pp. 30-46.
Lampert H. 1967. Fibre-boards: raw materials, manufacturing processes, properties. Faserplatten:
Rohstoffe, Herstellungsverfahren, Eigenschaften (German). Leipzig, Germany. 453 pp.
Milota, M.R. 2015. CORRIM REPORT: Life Cycle assessment for the production of Pacific Northwest
softwood lumber. In review. November 2015. 58 pp.
Milota, M.R. 2015. CORRIM REPORT: Life Cycle assessment for the production of southeastern
softwood lumber. In review. November 2015. 57 pp.
NAFA (2013) Fiberboard total shipments through 2012. North American Fiberboard Association. Rolling
Meadows, IL. 1 pp.
NIST ITL. 1996. Weighted standard deviation. National Institute of Standards and Technology
Information Technology Laboratory.
www.itl.nist.gov/div898/software/dataplot/refman2/ch2/weightsd.pdf. Accessed July 2015.
NREL. 2012. Life-cycle inventory database project. National Renewable Energy Laboratory.
www.lcacommons.gov/nrel/search. Accessed July 2015.
Oneil, E.E., L.R. Johnson, B.R. Lippke, J.B. McCarter, M.E. McDill, P.A. Roth, and J.C. Finley. 2010.
Life-cycle impacts of inland northwest and northeast/north central forest resources. Wood and Fiber
Sci., 42(CORRIM Special Issue) pp. 15-28.
Pré Consultants, B.V. 2014. Simapro 8.0.4.30 Life-Cycle Assessment Software Package. Plotter 12, 3821
BB Amersfoort, the Netherlands. Http://www.pre.nl/. Accessed July 2015.
Puettmann, M.E., and M. Milota. 2015. Development of wood boiler data for use in life cycle assessment
modeling. CORRIM report. Draft.
Puettmann, M.E., A. Taylor, and E. Oneil. 2014. CORRIM Research guidelines for life-cycle inventories
(working document). Consortium for Research on Renewable Industrial Materials (CORRIM), Inc.,
University of Washington, Seattle, WA. 40 pp.
Stark N.M., Z. Cai, and C. Carll. 2010. Wood-based composite materials: Panel products, glued-
laminated timber, structural composite lumber, and wood–nonwood composite materials. In: Wood
handbook—wood as an engineering material. Gen Tech Rep FPL–GTR–113. U.S. Department of
Agriculture, Forest Service, Forest Products Laboratory. Madison, WI pp. 11-1–11-28.
Suchsland O. and G.E. Woodson. 1986. Fiberboard manufacturing practices in the United States.
Agriculture Handbook No. 640. Washington, DC: U.S. Department of Agriculture, Forest Service. 263
pp.
USCB. 2012. 2012 North American Industry Classification System Definitions. 321219 Reconstituted
Wood Product Manufacturing. United States Census Bureau. www.census.gov/eos/www/naics/
accessed July 2015.

39
US EPA. 2002. AP 42 Section 10.6.4 Hardboard and fiberboard manufacturing. United States
Environmental Protection Agency. pp. 10.6.4-1-38.
www.epa.gov/ttn/chief/ap42/ch10/final/c10s0604.pdf accessed July 2015.

40
Appendix A – Economic allocation
12 Economic Allocation 12.1 Cradle-to-gate LCI results – Economic Allocation Life-cycle inventory results for cellulosic fiberboard are presented by three life cycle stages, 1) forestry
operations, 2) wood residue production, and 3) cellulosic fiberboard production (Table 21 – Table 23).
The majority of the raw material consumption used for energy production occurs during cellulosic fiber
manufacturing, followed by the production of the wood residue with only a very small portion arising
from forestry operations. Table 21 lists the raw material consumption of energy inputs per m3 of
cellulosic fiberboard. Highest consumption rates are for coal with all processes consuming a total of 62
kg/m3. Coal is used for on-site thermal energy and off-site electricity production. Natural gas at 42 kg/m3
was used onsite primarily for drying of mats during cellulosic fiberboard production and off site for
electricity generation. Wood fuel usage represented 34 percent of primary energy mass and was used in
wood residue production (17%) and cellulosic fiberboard production (83%). Most of the residues used in
cellulosic fiberboard were obtained from green residues generated during lumber manufacturing. Drying
the feedstock was not necessary for making cellulosic fiberboard but fell within the system boundary and
thus needed to be taken into account.
Table 21 Raw material consumption for energy production per 1 m3 of cellulosic fiberboard, North
American average (economic allocation).
Fuel Total
Forestry
operations
Wood residue
production
Cellulosic fiberboard
Production
(kg/m3)
Coal, in ground 62.1042 0.0552 1.7865 60.2625
Gas, natural, in ground 42.1534 0.1534 0.3850 41.6150
Oil, crude, in ground 9.7971 0.8715 1.7616 7.1640
Uranium oxide, in ore 0.0011 0.0000 0.0000 0.0011
Wood fuel 48.642 0.0000 0.4809 48.1611
Table 22 lists the CtG air emissions generated as a result of cellulosic fiberboard production. Cellulosic
fiberboard manufacturing generates air emissions including particulate and particulate PM10 (less than 10
µm in size) during refining, drying, and trimming. Other air emissions include VOCs from drying and
pressing. Recorded emissions of formaldehyde and methanol are used as a measure of the amount of
Hazardous Air Pollutants (HAPs). Mills reported acetaldehyde, acrolein, formaldehyde, methanol,
phenol, propionaldehyde (or propanal), and VOCs as a measure of HAPs released.
Table 22 Air emissions released per 1 m3 of cellulosic fiberboard, North American average
(economic allocation).
Air Emissions1
Total
Forestry
operations
Wood
residue
production
Cellulosic fiberboard
production
kg/m3
Acetaldehyde 0.0200 0.0000 0.0001 0.0199
Acetone 0.0096 0.0000 0.0000 0.0096
Acrolein 0.0071 0.0000 0.0000 0.0071
Aldehydes, unspecified 0.0002 0.0000 0.0001 0.0001
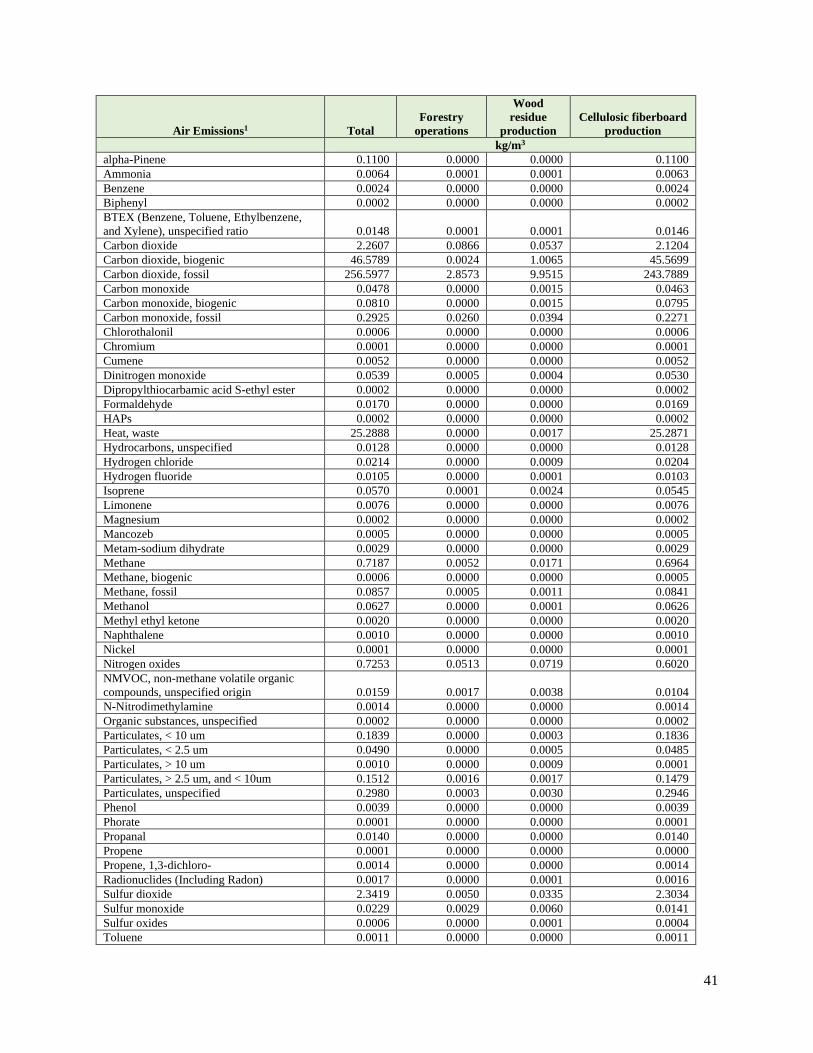
41
Air Emissions1
Total
Forestry
operations
Wood
residue
production
Cellulosic fiberboard
production
kg/m3
alpha-Pinene 0.1100 0.0000 0.0000 0.1100
Ammonia 0.0064 0.0001 0.0001 0.0063
Benzene 0.0024 0.0000 0.0000 0.0024
Biphenyl 0.0002 0.0000 0.0000 0.0002
BTEX (Benzene, Toluene, Ethylbenzene,
and Xylene), unspecified ratio 0.0148 0.0001 0.0001 0.0146
Carbon dioxide 2.2607 0.0866 0.0537 2.1204
Carbon dioxide, biogenic 46.5789 0.0024 1.0065 45.5699
Carbon dioxide, fossil 256.5977 2.8573 9.9515 243.7889
Carbon monoxide 0.0478 0.0000 0.0015 0.0463
Carbon monoxide, biogenic 0.0810 0.0000 0.0015 0.0795
Carbon monoxide, fossil 0.2925 0.0260 0.0394 0.2271
Chlorothalonil 0.0006 0.0000 0.0000 0.0006
Chromium 0.0001 0.0000 0.0000 0.0001
Cumene 0.0052 0.0000 0.0000 0.0052
Dinitrogen monoxide 0.0539 0.0005 0.0004 0.0530
Dipropylthiocarbamic acid S-ethyl ester 0.0002 0.0000 0.0000 0.0002
Formaldehyde 0.0170 0.0000 0.0000 0.0169
HAPs 0.0002 0.0000 0.0000 0.0002
Heat, waste 25.2888 0.0000 0.0017 25.2871
Hydrocarbons, unspecified 0.0128 0.0000 0.0000 0.0128
Hydrogen chloride 0.0214 0.0000 0.0009 0.0204
Hydrogen fluoride 0.0105 0.0000 0.0001 0.0103
Isoprene 0.0570 0.0001 0.0024 0.0545
Limonene 0.0076 0.0000 0.0000 0.0076
Magnesium 0.0002 0.0000 0.0000 0.0002
Mancozeb 0.0005 0.0000 0.0000 0.0005
Metam-sodium dihydrate 0.0029 0.0000 0.0000 0.0029
Methane 0.7187 0.0052 0.0171 0.6964
Methane, biogenic 0.0006 0.0000 0.0000 0.0005
Methane, fossil 0.0857 0.0005 0.0011 0.0841
Methanol 0.0627 0.0000 0.0001 0.0626
Methyl ethyl ketone 0.0020 0.0000 0.0000 0.0020
Naphthalene 0.0010 0.0000 0.0000 0.0010
Nickel 0.0001 0.0000 0.0000 0.0001
Nitrogen oxides 0.7253 0.0513 0.0719 0.6020
NMVOC, non-methane volatile organic
compounds, unspecified origin 0.0159 0.0017 0.0038 0.0104
N-Nitrodimethylamine 0.0014 0.0000 0.0000 0.0014
Organic substances, unspecified 0.0002 0.0000 0.0000 0.0002
Particulates, < 10 um 0.1839 0.0000 0.0003 0.1836
Particulates, < 2.5 um 0.0490 0.0000 0.0005 0.0485
Particulates, > 10 um 0.0010 0.0000 0.0009 0.0001
Particulates, > 2.5 um, and < 10um 0.1512 0.0016 0.0017 0.1479
Particulates, unspecified 0.2980 0.0003 0.0030 0.2946
Phenol 0.0039 0.0000 0.0000 0.0039
Phorate 0.0001 0.0000 0.0000 0.0001
Propanal 0.0140 0.0000 0.0000 0.0140
Propene 0.0001 0.0000 0.0000 0.0000
Propene, 1,3-dichloro- 0.0014 0.0000 0.0000 0.0014
Radionuclides (Including Radon) 0.0017 0.0000 0.0001 0.0016
Sulfur dioxide 2.3419 0.0050 0.0335 2.3034
Sulfur monoxide 0.0229 0.0029 0.0060 0.0141
Sulfur oxides 0.0006 0.0000 0.0001 0.0004
Toluene 0.0011 0.0000 0.0000 0.0011

42
Air Emissions1
Total
Forestry
operations
Wood
residue
production
Cellulosic fiberboard
production
kg/m3
VOC, volatile organic compounds 0.2825 0.0015 0.0043 0.2767
Wood (dust) 0.0144 0.0000 0.0005 0.0139
1 Due to large amount of air emissions, total emissions less than 10-4 are not shown. A complete list of all air emissions can be found in
Appendix B in this report 2 Non-methane volatile organic compounds, unspecified origin.
Most of the waterborne emissions reported by cellulosic fiberboard manufacturers are produced on-site as
shown in Table 23. For unspecified suspended solids to water, a value of 13.9 kg/m3 of cellulosic
fiberboard is listed. Most of unspecified suspended solids emissions was from the process of extracting
natural gas from the ground and thus did not occur at the production facilities.
Table 23 Emissions to water released per 1 m3 of cellulosic fiberboard, North American average
(economic allocation).
Water emissions Total
Forestry
operations
Wood residue
production
Cellulosic
fiberboard
production
kg/m3
Aluminium 0.0061 0.0003 0.0006 0.0052
Ammonia 0.0028 0.0001 0.0001 0.0026
Barium 0.0824 0.0040 0.0082 0.0702
Benzene 0.0004 0.0000 0.0000 0.0003
Benzoic acid 0.0002 0.0000 0.0000 0.0002
BOD5, Biological Oxygen Demand 0.3093 0.0007 0.0015 0.3071
Boron 0.0007 0.0000 0.0000 0.0006
Bromide 0.0457 0.0008 0.0017 0.0432
Calcium 0.6859 0.0122 0.0257 0.6481
Chloride 7.7093 0.1370 0.2884 7.2840
COD, Chemical Oxygen Demand 0.2676 0.0013 0.0027 0.2636
Detergent, oil 0.0002 0.0000 0.0000 0.0002
Fluoride 0.0043 0.0025 0.0015 0.0002
Iron 0.0166 0.0006 0.0013 0.0147
Lithium 0.2045 0.0007 0.0019 0.2018
Magnesium 0.1341 0.0024 0.0050 0.1267
Manganese 0.0008 0.0000 0.0000 0.0008
Metam-sodium dihydrate 0.0002 0.0000 0.0000 0.0002
Nitrogen, total 0.0115 0.0000 0.0000 0.0115
Oils, unspecified 0.0195 0.0001 0.0002 0.0192
Phosphate 0.0031 0.0019 0.0012 0.0000
Phosphorus compounds, unspecified 0.0004 0.0000 0.0000 0.0004
Silver 0.0004 0.0000 0.0000 0.0004
Sodium 2.1743 0.0386 0.0813 2.0543
Strontium 0.0116 0.0002 0.0004 0.0110
Sulfate 0.0424 0.0003 0.0017 0.0404
Sulfur 0.0006 0.0000 0.0000 0.0005
Suspended solids, unspecified 13.8908 0.1779 0.3742 13.3387
Toluene 0.0003 0.0000 0.0000 0.0003
Xylene 0.0002 0.0000 0.0000 0.0002
Zinc 0.0002 0.0000 0.0000 0.0001
Aluminium 0.0061 0.0003 0.0006 0.0052

43
Water emissions Total
Forestry
operations
Wood residue
production
Cellulosic
fiberboard
production
kg/m3
Ammonia 0.0028 0.0001 0.0001 0.0026
Barium 0.0824 0.0040 0.0082 0.0702
Benzene 0.0004 0.0000 0.0000 0.0003
Benzoic acid 0.0002 0.0000 0.0000 0.0002
BOD5, Biological Oxygen Demand 0.3093 0.0007 0.0015 0.3071
Boron 0.0007 0.0000 0.0000 0.0006
Bromide 0.0457 0.0008 0.0017 0.0432
Calcium 0.6859 0.0122 0.0257 0.6481
Chloride 7.7093 0.1370 0.2884 7.2840
COD, Chemical Oxygen Demand 0.2676 0.0013 0.0027 0.2636
Detergent, oil 0.0002 0.0000 0.0000 0.0002
Fluoride 0.0043 0.0025 0.0015 0.0002
Iron 0.0166 0.0006 0.0013 0.0147
Lithium 0.2045 0.0007 0.0019 0.2018
Magnesium 0.1341 0.0024 0.0050 0.1267
Manganese 0.0008 0.0000 0.0000 0.0008
Metam-sodium dihydrate 0.0002 0.0000 0.0000 0.0002
Nitrogen, total 0.0115 0.0000 0.0000 0.0115
Oils, unspecified 0.0195 0.0001 0.0002 0.0192
Phosphate 0.0031 0.0019 0.0012 0.0000
Phosphorus compounds, unspecified 0.0004 0.0000 0.0000 0.0004
Silver 0.0004 0.0000 0.0000 0.0004
Sodium 2.1743 0.0386 0.0813 2.0543
Strontium 0.0116 0.0002 0.0004 0.0110
Sulfate 0.0424 0.0003 0.0017 0.0404
Sulfur 0.0006 0.0000 0.0000 0.0005
Suspended solids, unspecified 13.8908 0.1779 0.3742 13.3387
Toluene 0.0003 0.0000 0.0000 0.0003
Xylene 0.0002 0.0000 0.0000 0.0002
Zinc 0.0002 0.0000 0.0000 0.0001 Due to large amount of air emissions, total emissions less than 10-4 are not shown. A complete list of all air emissions can be found in Appendix
B of this report.
Solid emissions generated onsite during cellulosic fiberboard manufacturing includes ash generated at the
boiler. Other waste generated is a result of upstream processes, primarily fuels and additives, used in
cellulosic fiberboard production (Table 15). A total of 14.47 kg/m3 solid waste was generated onsite with 55
percent going to the landfill and the remaining portion being recycled (6.46 kg) (Bergman 2015). A total of
56.98 kg of solid waste was generated from cradle-to-gate for the production of 1 m3 cellulosic
fiberboard, of that 99 percent was generated during the cellulosic fiberboard production or generated by
processes used during the production process.
Table 24 Waste to treatment per 1 m3 of cellulosic fiberboard, North American average (economic
allocation).
Waste to treatment
Total
Forestry
operations
Wood residue
production
Cellulosic
fiberboard
production
kg/m3
Waste generated onsite 14.47 0.00 0.00 14.47
Waste disposal 42.51 0.05 0.65 41.82
Total waste 56.98 0.05 0.65 56.29

44
12.2 Life-cycle impact assessment Each impact indicator is a measure of an aspect of a potential impact. This LCIA does not make value
judgments about the impact indicators, meaning that no single indicator is given more or less value than
any of the others. All are presented as equals. Additionally, each impact indicator value is stated in units
that are not comparable to others. For the same reasons, indicators should not be combined or added.
Table 25 provides the environmental impact by category for cellulosic fiberboard. In addition, energy and
material resource consumption values and the waste generated are also provided.
Environmental performance results for global warming potential (GWP), acidification, eutrophication,
ozone depletion and smog, energy consumption from non-renewables, renewables, wind, hydro, solar,
and nuclear fuels, renewable and nonrenewable resources, and solid waste are shown in Table 25. For
GWP, 95 percent of the CO2 eq. emissions come from producing cellulosic fiberboard. Similar results are
presented for acidification, eutrophication, and smog, representing 95, 82, and 85 percent contributed
from cellulosic fiberboard production, respectively.
Non-renewable fuels represented the greatest proportion of energy consumed (71%) for total CtG primary
energy use. Renewable biomass fuels and non-renewable nuclear represented 17 and 7 percent of the total
primary energy, respectively. Of the three life cycle stages considered in this study, cellulosic fiberboard
production consumes 96 percent of the total primary energy consumption. Overall, the manufacture of
cellulosic fiberboard in North America is 17 percent energy self-sufficient with its use of renewable
biomass. By the nature of the production process, self-producing wood fuel would be difficult to obtain
onsite; therefore, to increase the use of renewable biomass onsite would be limited to purchasing wood
fuel from other wood production industries or utilization of whole logs not suitable for lumber or
plywood production.
Water intake is high for the cradle-to-gate production of cellulosic fiberboard at 3,796 L/m3 but much
more lower than a previous reported value, 22,700 L/m3 (Suchsland and Woodson 1986). In addition, the
water intake value did not consider the water recycling efforts that now are at 63% at the cellulosic
fiberboard facilities. It is clear, based on previous published water use, that water conservation measures
currently in place in North American cellulosic fiberboard facilities have made a dramatic impact in the
reduction of water consumption.
Table 25 Environmental performance of 1 m3 cellulosic fiberboard, North American average
(economic allocation).
Impact category Unit Total
Forestry
operations
Wood residue
production
Cellulosic
fiberboard
production
Global warming potential (GWP) kg CO2 eq 295.0548 3.2387 10.5869 281.2292
Acidification Potential kg SO2 eq 2.9207 0.0439 0.0912 2.7856
Eutrophication Potential kg N eq 0.0712 0.0069 0.0063 0.0580
Ozone depletion Potential
kg CFC-11
eq 0.0 0.0000 0.0000 0.0000
Smog Potential kg O3 eq 20.6424 1.2793 1.8262 17.5369
Total Primary Energy MJ 6,148.23 50.04 198.75 5,899.44
Non-renewable fossil MJ 4,395.48 49.49 161.71 4,184.28
Non-renewable nuclear MJ 442.95 0.49 18.32 424.14
Renewable (solar, wind,
hydroelectric, and geothermal) MJ 291.51 0.06 8.65 282.80
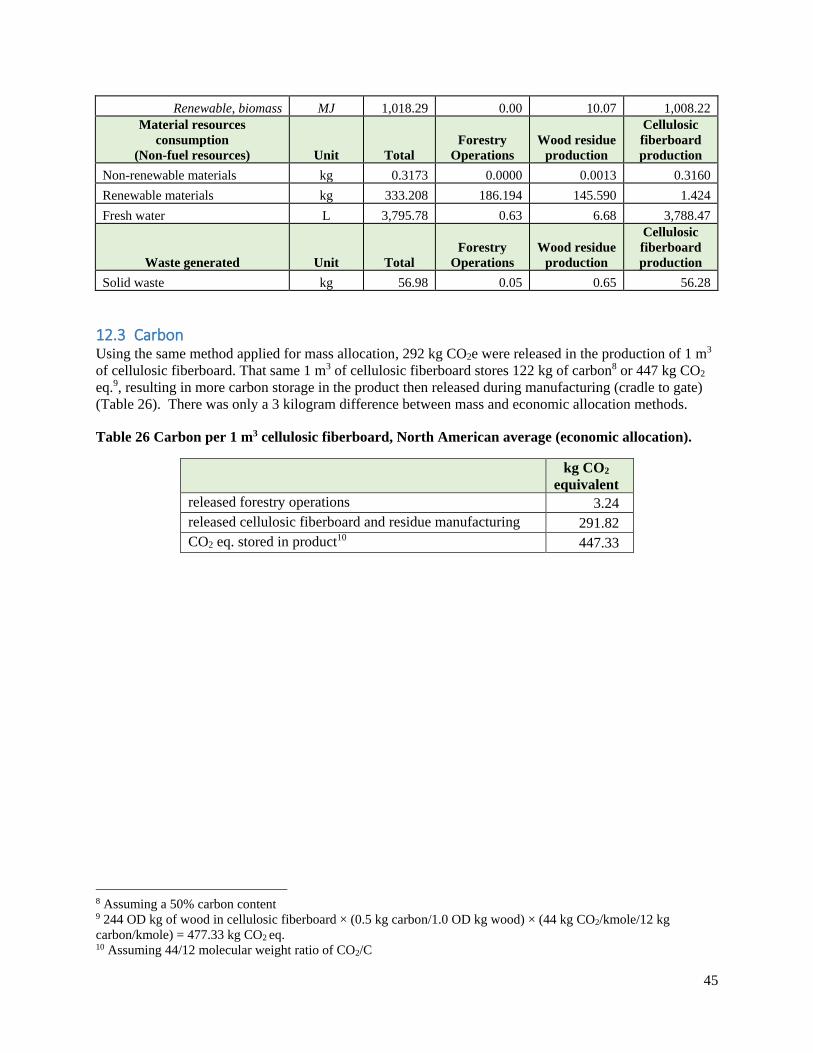
45
Renewable, biomass MJ 1,018.29 0.00 10.07 1,008.22
Material resources
consumption
(Non-fuel resources) Unit Total
Forestry
Operations
Wood residue
production
Cellulosic
fiberboard
production
Non-renewable materials kg 0.3173 0.0000 0.0013 0.3160
Renewable materials kg 333.208 186.194 145.590 1.424
Fresh water L 3,795.78 0.63 6.68 3,788.47
Waste generated Unit Total
Forestry
Operations
Wood residue
production
Cellulosic
fiberboard
production
Solid waste kg 56.98 0.05 0.65 56.28
12.3 Carbon Using the same method applied for mass allocation, 292 kg CO2e were released in the production of 1 m3
of cellulosic fiberboard. That same 1 m3 of cellulosic fiberboard stores 122 kg of carbon8 or 447 kg CO2
eq.9, resulting in more carbon storage in the product then released during manufacturing (cradle to gate)
(Table 26). There was only a 3 kilogram difference between mass and economic allocation methods.
Table 26 Carbon per 1 m3 cellulosic fiberboard, North American average (economic allocation).
kg CO2
equivalent
released forestry operations 3.24
released cellulosic fiberboard and residue manufacturing 291.82
CO2 eq. stored in product10 447.33
8 Assuming a 50% carbon content 9 244 OD kg of wood in cellulosic fiberboard × (0.5 kg carbon/1.0 OD kg wood) × (44 kg CO2/kmole/12 kg
carbon/kmole) = 477.33 kg CO2 eq. 10 Assuming 44/12 molecular weight ratio of CO2/C

46
Appendix B - Life cycle inventory, Full Results Air Emissions – Mass Allocation Table 27 Air emissions released per 1 m3 of uncoated cellulosic fiberboard, North American
average (mass allocation).
Substance Unit
Forestry
Operations
Wood residue
Production
Cellulosic
fiberboard
Production TOTAL
2-Chloroacetophenone kg 4.71E-12 1.83E-11 1.87E-10 2.10E-10
2-Methyl-4-chlorophenoxyacetic acid kg x 5.74E-14 1.11E-11 1.12E-11
2,4-D kg x 3.10E-11 9.09E-09 9.12E-09
5-methyl Chrysene kg 5.32E-13 3.72E-11 3.60E-10 3.98E-10
Acenaphthene kg 1.23E-11 8.63E-10 8.34E-09 9.22E-09
Acenaphthylene kg 6.04E-12 4.23E-10 4.09E-09 4.52E-09
Acetaldehyde kg 1.18E-05 1.49E-03 1.92E-02 2.07E-02
Acetochlor kg x 4.27E-11 8.26E-09 8.30E-09
Acetone kg x 3.06E-05 9.30E-03 9.33E-03
Acetophenone kg 1.01E-11 3.93E-11 4.01E-10 4.51E-10
Acrolein kg 1.43E-06 8.92E-05 6.82E-03 6.92E-03
Alachlor kg x 4.20E-12 8.13E-10 8.17E-10
Aldehydes, unspecified kg 3.54E-05 1.31E-04 1.35E-04 3.02E-04
Aldicarb kg x 9.47E-08 2.88E-05 2.89E-05
alpha-Pinene kg x 3.49E-04 1.06E-01 1.06E-01
Ammonia kg 8.39E-05 2.48E-04 6.03E-03 6.36E-03
Ammonium chloride kg 6.77E-08 5.03E-06 5.69E-05 6.20E-05
Anthracene kg 5.08E-12 3.55E-10 3.43E-09 3.79E-09
Antimony kg 4.35E-10 3.07E-08 2.94E-07 3.26E-07
Arsenic kg 1.35E-08 7.25E-07 8.58E-06 9.32E-06
Ash kg x 8.62E-08 2.62E-05 2.63E-05
Atrazine kg x 8.32E-11 1.61E-08 1.62E-08
Azinphos-methyl kg x 2.21E-08 6.73E-06 6.75E-06
Barium kg x 2.05E-07 x 2.05E-07
Bentazone kg x 3.39E-13 6.57E-11 6.60E-11
Benzene kg 1.44E-05 2.40E-05 2.33E-03 2.37E-03
Benzene, chloro- kg 1.48E-11 5.76E-11 5.89E-10 6.61E-10
Benzene, ethyl- kg 6.32E-11 1.58E-08 3.34E-09 1.92E-08
Benzo(a)anthracene kg 1.93E-12 1.35E-10 1.31E-09 1.45E-09
Benzo(a)pyrene kg 9.18E-13 6.43E-11 6.22E-10 6.87E-10
Benzo(b,j,k)fluoranthene kg 2.66E-12 1.86E-10 1.80E-09 1.99E-09
Benzo(g,h,i)perylene kg 6.53E-13 2.50E-11 4.42E-10 4.67E-10
Benzo(ghi)perylene kg x 2.06E-11 x 2.06E-11

47
Substance Unit
Forestry
Operations
Wood residue
Production
Cellulosic
fiberboard
Production TOTAL
Benzyl chloride kg 4.71E-10 1.83E-09 1.87E-08 2.10E-08
Beryllium kg 6.74E-10 4.19E-08 1.59E-06 1.63E-06
Biphenyl kg 4.11E-11 6.26E-07 1.89E-04 1.90E-04
Bromoform kg 2.62E-11 1.02E-10 1.04E-09 1.17E-09
Bromoxynil kg x 7.44E-13 1.44E-10 1.45E-10
BTEX (Benzene, Toluene, Ethylbenzene,
and Xylene), unspecified ratio kg 5.40E-05 4.44E-04 1.41E-02 1.46E-02
Butadiene kg 6.00E-07 4.96E-07 7.02E-07 1.80E-06
Cadmium kg 3.40E-09 1.24E-07 2.63E-06 2.75E-06
Carbaryl kg x 2.59E-08 7.87E-06 7.89E-06
Carbofuran kg x 6.35E-08 1.93E-05 1.94E-05
Carbon dioxide kg 8.66E-02 6.64E-02 2.04E+00 2.20E+00
Carbon dioxide, biogenic kg 2.40E-03 1.44E+01 4.39E+01 5.84E+01
Carbon dioxide, fossil kg 2.86E+00 1.97E+01 2.35E+02 2.58E+02
Carbon disulfide kg 8.74E-11 3.40E-10 3.48E-09 3.91E-09
Carbon monoxide kg 6.27E-06 4.20E-03 4.47E-02 4.89E-02
Carbon monoxide, biogenic kg x 2.58E-02 7.67E-02 1.03E-01
Carbon monoxide, fossil kg 2.60E-02 6.11E-02 2.19E-01 3.06E-01
Chloride kg 1.84E-12 2.03E-10 1.60E-09 1.81E-09
Chlorinated fluorocarbons and
hydrochlorinated fluorocarbons,
unspecified kg x 2.91E-09 9.85E-09 1.28E-08
Chlorine kg x 3.73E-07 6.51E-09 3.80E-07
Chloroform kg 3.97E-11 1.55E-10 1.58E-09 1.77E-09
Chlorothalonil kg x 2.04E-06 6.22E-04 6.24E-04
Chlorpyrifos kg x 4.89E-12 9.47E-10 9.52E-10
Chromium kg 9.80E-09 8.40E-07 1.12E-04 1.13E-04
Chromium VI kg 1.91E-09 1.34E-07 1.29E-06 1.43E-06
Chrysene kg 2.42E-12 1.69E-10 1.64E-09 1.81E-09
Cobalt kg 1.78E-08 2.39E-07 2.00E-06 2.26E-06
Copper kg 1.75E-10 3.54E-09 4.08E-08 4.45E-08
Cumene kg 3.56E-12 1.73E-05 5.01E-03 5.02E-03
Cyanazine kg x 7.33E-13 1.42E-10 1.43E-10
Cyanide kg 1.68E-09 6.55E-09 6.69E-08 7.51E-08
Diazinon kg x 1.21E-09 3.66E-07 3.68E-07
Dicamba kg x 4.32E-12 8.36E-10 8.41E-10
Dimethenamid kg x 1.02E-11 1.98E-09 1.99E-09
Dimethyl ether kg x 6.25E-09 x 6.25E-09
Dinitrogen monoxide kg 5.09E-04 7.18E-04 5.11E-02 5.23E-02
Dioxin, 2,3,7,8 Tetrachlorodibenzo-p- kg 5.79E-14 2.73E-12 1.42E-11 1.70E-11

48
Substance Unit
Forestry
Operations
Wood residue
Production
Cellulosic
fiberboard
Production TOTAL
Dioxins, measured as 2,3,7,8-
tetrachlorodibenzo-p-dioxin kg x 1.80E-16 x 1.80E-16
Dipropylthiocarbamic acid S-ethyl ester kg x 6.30E-07 1.91E-04 1.92E-04
Disulfoton kg x 1.02E-07 3.11E-05 3.12E-05
Endosulfan kg x 4.89E-08 1.49E-05 1.49E-05
Ethane, 1,1,1-trichloro-, HCFC-140 kg 9.52E-11 3.06E-10 8.10E-10 1.21E-09
Ethane, 1,2-dibromo- kg 8.07E-13 3.27E-12 3.21E-11 3.62E-11
Ethane, 1,2-dichloro- kg 2.69E-11 1.05E-10 1.07E-09 1.20E-09
Ethane, chloro- kg 2.82E-11 1.10E-10 1.12E-09 1.26E-09
Ethene, tetrachloro- kg 1.24E-09 7.39E-08 7.11E-07 7.86E-07
Ethene, trichloro- kg x 3.41E-11 1.66E-11 5.06E-11
Ethoprop kg x 2.36E-07 7.18E-05 7.21E-05
Ethylene oxide kg x 8.56E-09 1.91E-09 1.05E-08
Fluoranthene kg 1.72E-11 1.20E-09 1.16E-08 1.28E-08
Fluorene kg 2.20E-11 1.54E-09 1.49E-08 1.64E-08
Fluoride kg 1.01E-06 8.71E-07 2.50E-06 4.38E-06
Formaldehyde kg 1.83E-05 2.37E-04 1.63E-02 1.66E-02
Furan kg 1.07E-13 8.33E-12 8.10E-11 8.94E-11
Glyphosate kg x 1.49E-08 4.53E-06 4.54E-06
HAPs kg x 5.02E-05 1.49E-04 1.99E-04
HAPS, unspecified kg x 1.40E-05 x 1.40E-05
Heat, waste MJ x 1.10E-01 2.44E+01 2.45E+01
Hexane kg 4.50E-11 1.75E-10 1.79E-09 2.01E-09
Hydrazine, methyl- kg 1.14E-10 4.45E-10 4.55E-09 5.11E-09
Hydrocarbons, unspecified kg 3.91E-07 6.84E-05 1.23E-02 1.24E-02
Hydrogen kg x 1.53E-08 4.87E-08 6.40E-08
Hydrogen chloride kg 3.05E-05 2.05E-03 1.97E-02 2.18E-02
Hydrogen fluoride kg 3.59E-06 2.78E-04 9.98E-03 1.03E-02
Hydrogen sulfide kg 5.95E-14 6.55E-12 5.18E-11 5.84E-11
Indeno(1,2,3-cd)pyrene kg 1.47E-12 1.03E-10 9.98E-10 1.10E-09
Iron kg x 2.05E-07 x 2.05E-07
Isophorone kg 3.90E-10 1.52E-09 1.55E-08 1.74E-08
Isoprene kg 6.04E-05 6.64E-03 5.26E-02 5.93E-02
Kerosene kg 3.24E-08 2.41E-06 2.73E-05 2.97E-05
Lead kg 1.69E-08 2.44E-06 8.09E-05 8.33E-05
Limonene kg x 2.42E-05 7.36E-03 7.38E-03
Linuron kg x 2.75E-08 8.35E-06 8.38E-06
Magnesium kg 2.66E-07 1.86E-05 1.80E-04 1.99E-04
Mancozeb kg x 1.58E-06 4.80E-04 4.82E-04

49
Substance Unit
Forestry
Operations
Wood residue
Production
Cellulosic
fiberboard
Production TOTAL
Manganese kg 1.99E-08 1.34E-06 2.30E-05 2.44E-05
Mercaptans, unspecified kg 1.46E-07 5.67E-07 5.80E-06 6.51E-06
Mercury kg 3.45E-09 2.02E-07 1.18E-05 1.20E-05
Metals, unspecified kg 6.83E-15 4.25E-08 3.09E-10 4.28E-08
Metam-sodium dihydrate kg x 9.33E-06 2.84E-03 2.85E-03
Methane kg 5.22E-03 3.90E-02 6.72E-01 7.16E-01
Methane, biogenic kg x 1.78E-04 5.29E-04 7.07E-04
Methane, bromo-, Halon 1001 kg 1.08E-10 4.19E-10 4.28E-09 4.81E-09
Methane, chlorodifluoro-, HCFC-22 kg x 7.12E-14 1.59E-14 8.71E-14
Methane, chlorotrifluoro-, CFC-13 kg x 6.76E-13 1.51E-13 8.26E-13
Methane, dichloro-, HCC-30 kg 2.02E-08 5.64E-07 5.20E-06 5.78E-06
Methane, dichlorodifluoro-, CFC-12 kg 1.01E-10 3.14E-10 3.40E-10 7.55E-10
Methane, fossil kg 5.02E-04 3.03E-03 8.11E-02 8.46E-02
Methane, monochloro-, R-40 kg 3.56E-10 1.39E-09 1.42E-08 1.59E-08
Methane, tetrachloro-, CFC-10 kg 1.01E-11 1.89E-10 3.44E-10 5.43E-10
Methanol kg x 1.35E-03 6.04E-02 6.17E-02
Methyl ethyl ketone kg 2.62E-10 6.41E-06 1.95E-03 1.95E-03
Methyl methacrylate kg 1.34E-11 5.24E-11 5.35E-10 6.01E-10
Metolachlor kg x 9.27E-08 2.82E-05 2.83E-05
Metribuzin kg x 1.11E-07 3.38E-05 3.39E-05
N-Nitrodimethylamine kg x 4.51E-06 1.37E-03 1.38E-03
Naphthalene kg 3.77E-09 3.86E-06 9.87E-04 9.91E-04
Nickel kg 2.24E-07 1.84E-06 1.11E-04 1.13E-04
Nitrogen oxides kg 5.13E-02 1.24E-01 5.81E-01 7.56E-01
Nitrogen, total kg 1.96E-05 1.28E-05 1.11E-05 4.35E-05
NMVOC, non-methane volatile organic
compounds, unspecified origin kg 1.72E-03 6.39E-03 1.00E-02 1.81E-02
Organic acids kg 2.49E-10 1.85E-08 2.09E-07 2.28E-07
Organic substances, unspecified kg 1.50E-07 4.19E-04 1.95E-04 6.13E-04
Other Organic kg x 1.69E-06 5.02E-06 6.71E-06
Oxamyl kg x 2.60E-08 7.90E-06 7.92E-06
PAH, polycyclic aromatic hydrocarbons kg 2.58E-06 2.13E-06 3.44E-06 8.15E-06
Paraquat kg x 1.05E-08 3.18E-06 3.19E-06
Parathion, methyl kg x 6.78E-09 2.06E-06 2.07E-06
Particulates kg x 3.05E-09 x 3.05E-09
Particulates, < 10 um kg x 4.61E-03 1.77E-01 1.82E-01
Particulates, < 2.5 um kg x 2.84E-03 4.68E-02 4.96E-02
Particulates, > 10 um kg x 4.95E-03 6.05E-05 5.01E-03
Particulates, > 2.5 um, and < 10um kg 1.57E-03 3.08E-03 1.43E-01 1.47E-01
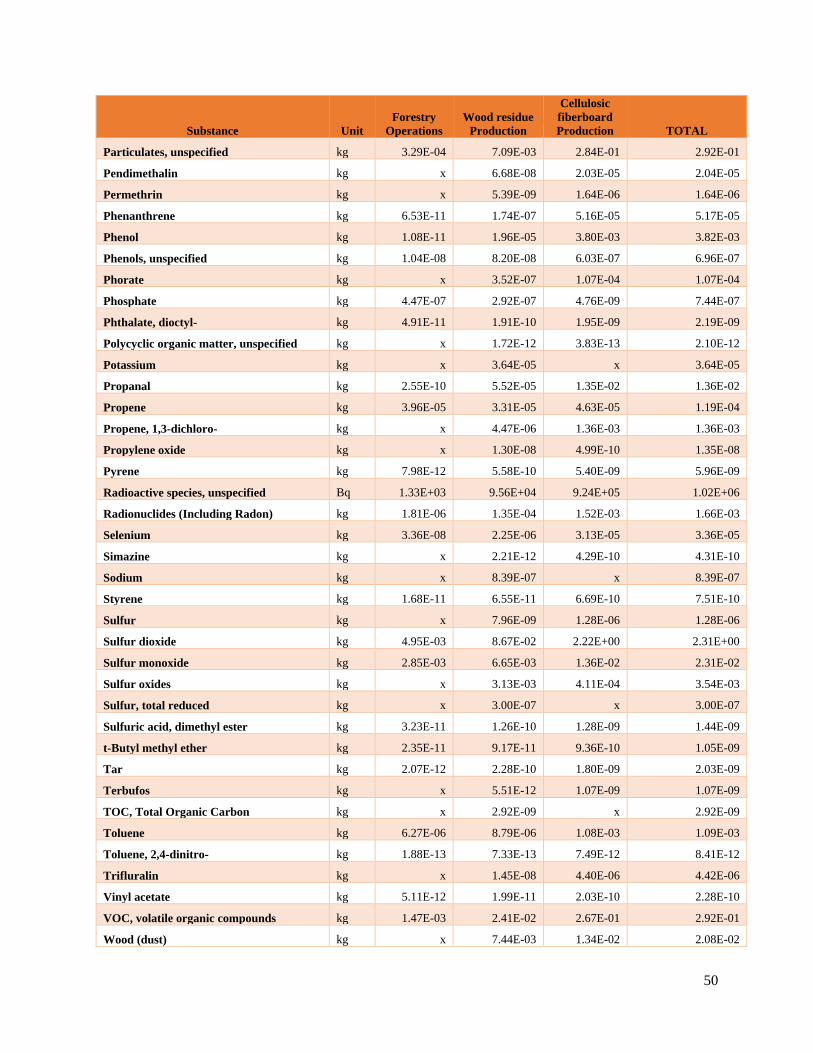
50
Substance Unit
Forestry
Operations
Wood residue
Production
Cellulosic
fiberboard
Production TOTAL
Particulates, unspecified kg 3.29E-04 7.09E-03 2.84E-01 2.92E-01
Pendimethalin kg x 6.68E-08 2.03E-05 2.04E-05
Permethrin kg x 5.39E-09 1.64E-06 1.64E-06
Phenanthrene kg 6.53E-11 1.74E-07 5.16E-05 5.17E-05
Phenol kg 1.08E-11 1.96E-05 3.80E-03 3.82E-03
Phenols, unspecified kg 1.04E-08 8.20E-08 6.03E-07 6.96E-07
Phorate kg x 3.52E-07 1.07E-04 1.07E-04
Phosphate kg 4.47E-07 2.92E-07 4.76E-09 7.44E-07
Phthalate, dioctyl- kg 4.91E-11 1.91E-10 1.95E-09 2.19E-09
Polycyclic organic matter, unspecified kg x 1.72E-12 3.83E-13 2.10E-12
Potassium kg x 3.64E-05 x 3.64E-05
Propanal kg 2.55E-10 5.52E-05 1.35E-02 1.36E-02
Propene kg 3.96E-05 3.31E-05 4.63E-05 1.19E-04
Propene, 1,3-dichloro- kg x 4.47E-06 1.36E-03 1.36E-03
Propylene oxide kg x 1.30E-08 4.99E-10 1.35E-08
Pyrene kg 7.98E-12 5.58E-10 5.40E-09 5.96E-09
Radioactive species, unspecified Bq 1.33E+03 9.56E+04 9.24E+05 1.02E+06
Radionuclides (Including Radon) kg 1.81E-06 1.35E-04 1.52E-03 1.66E-03
Selenium kg 3.36E-08 2.25E-06 3.13E-05 3.36E-05
Simazine kg x 2.21E-12 4.29E-10 4.31E-10
Sodium kg x 8.39E-07 x 8.39E-07
Styrene kg 1.68E-11 6.55E-11 6.69E-10 7.51E-10
Sulfur kg x 7.96E-09 1.28E-06 1.28E-06
Sulfur dioxide kg 4.95E-03 8.67E-02 2.22E+00 2.31E+00
Sulfur monoxide kg 2.85E-03 6.65E-03 1.36E-02 2.31E-02
Sulfur oxides kg x 3.13E-03 4.11E-04 3.54E-03
Sulfur, total reduced kg x 3.00E-07 x 3.00E-07
Sulfuric acid, dimethyl ester kg 3.23E-11 1.26E-10 1.28E-09 1.44E-09
t-Butyl methyl ether kg 2.35E-11 9.17E-11 9.36E-10 1.05E-09
Tar kg 2.07E-12 2.28E-10 1.80E-09 2.03E-09
Terbufos kg x 5.51E-12 1.07E-09 1.07E-09
TOC, Total Organic Carbon kg x 2.92E-09 x 2.92E-09
Toluene kg 6.27E-06 8.79E-06 1.08E-03 1.09E-03
Toluene, 2,4-dinitro- kg 1.88E-13 7.33E-13 7.49E-12 8.41E-12
Trifluralin kg x 1.45E-08 4.40E-06 4.42E-06
Vinyl acetate kg 5.11E-12 1.99E-11 2.03E-10 2.28E-10
VOC, volatile organic compounds kg 1.47E-03 2.41E-02 2.67E-01 2.92E-01
Wood (dust) kg x 7.44E-03 1.34E-02 2.08E-02
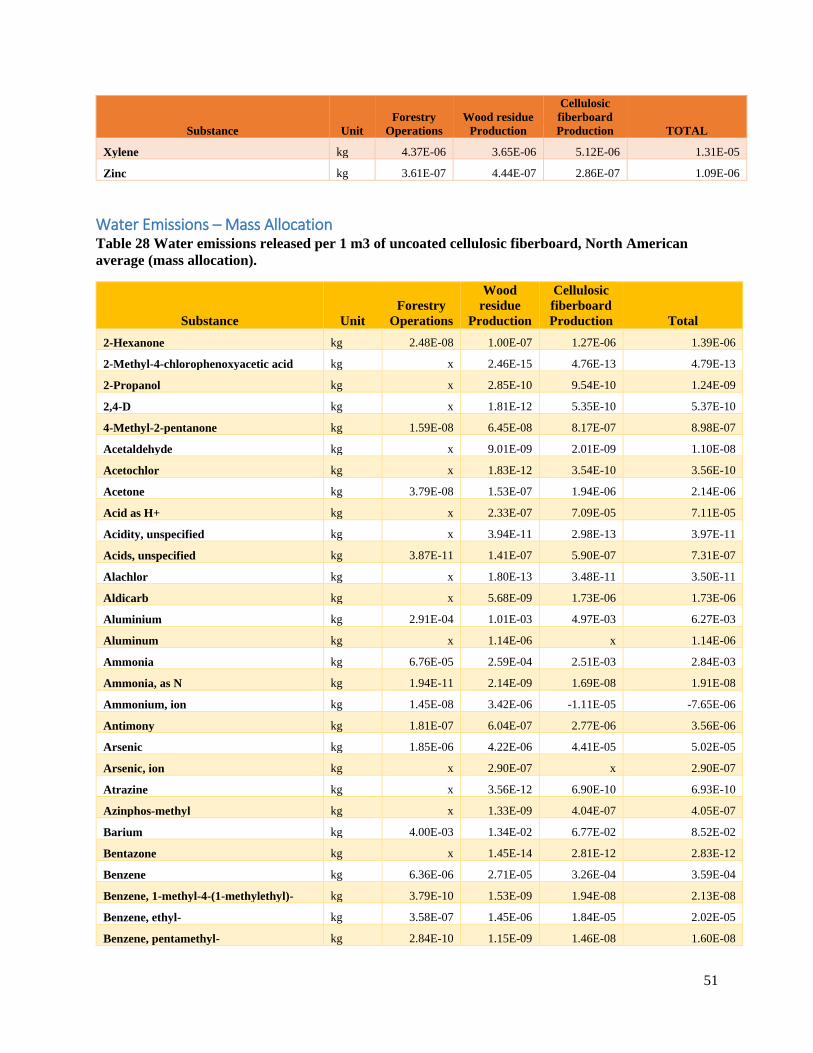
51
Substance Unit
Forestry
Operations
Wood residue
Production
Cellulosic
fiberboard
Production TOTAL
Xylene kg 4.37E-06 3.65E-06 5.12E-06 1.31E-05
Zinc kg 3.61E-07 4.44E-07 2.86E-07 1.09E-06
Water Emissions – Mass Allocation Table 28 Water emissions released per 1 m3 of uncoated cellulosic fiberboard, North American
average (mass allocation).
Substance Unit
Forestry
Operations
Wood
residue
Production
Cellulosic
fiberboard
Production Total
2-Hexanone kg 2.48E-08 1.00E-07 1.27E-06 1.39E-06
2-Methyl-4-chlorophenoxyacetic acid kg x 2.46E-15 4.76E-13 4.79E-13
2-Propanol kg x 2.85E-10 9.54E-10 1.24E-09
2,4-D kg x 1.81E-12 5.35E-10 5.37E-10
4-Methyl-2-pentanone kg 1.59E-08 6.45E-08 8.17E-07 8.98E-07
Acetaldehyde kg x 9.01E-09 2.01E-09 1.10E-08
Acetochlor kg x 1.83E-12 3.54E-10 3.56E-10
Acetone kg 3.79E-08 1.53E-07 1.94E-06 2.14E-06
Acid as H+ kg x 2.33E-07 7.09E-05 7.11E-05
Acidity, unspecified kg x 3.94E-11 2.98E-13 3.97E-11
Acids, unspecified kg 3.87E-11 1.41E-07 5.90E-07 7.31E-07
Alachlor kg x 1.80E-13 3.48E-11 3.50E-11
Aldicarb kg x 5.68E-09 1.73E-06 1.73E-06
Aluminium kg 2.91E-04 1.01E-03 4.97E-03 6.27E-03
Aluminum kg x 1.14E-06 x 1.14E-06
Ammonia kg 6.76E-05 2.59E-04 2.51E-03 2.84E-03
Ammonia, as N kg 1.94E-11 2.14E-09 1.69E-08 1.91E-08
Ammonium, ion kg 1.45E-08 3.42E-06 -1.11E-05 -7.65E-06
Antimony kg 1.81E-07 6.04E-07 2.77E-06 3.56E-06
Arsenic kg 1.85E-06 4.22E-06 4.41E-05 5.02E-05
Arsenic, ion kg x 2.90E-07 x 2.90E-07
Atrazine kg x 3.56E-12 6.90E-10 6.93E-10
Azinphos-methyl kg x 1.33E-09 4.04E-07 4.05E-07
Barium kg 4.00E-03 1.34E-02 6.77E-02 8.52E-02
Bentazone kg x 1.45E-14 2.81E-12 2.83E-12
Benzene kg 6.36E-06 2.71E-05 3.26E-04 3.59E-04
Benzene, 1-methyl-4-(1-methylethyl)- kg 3.79E-10 1.53E-09 1.94E-08 2.13E-08
Benzene, ethyl- kg 3.58E-07 1.45E-06 1.84E-05 2.02E-05
Benzene, pentamethyl- kg 2.84E-10 1.15E-09 1.46E-08 1.60E-08
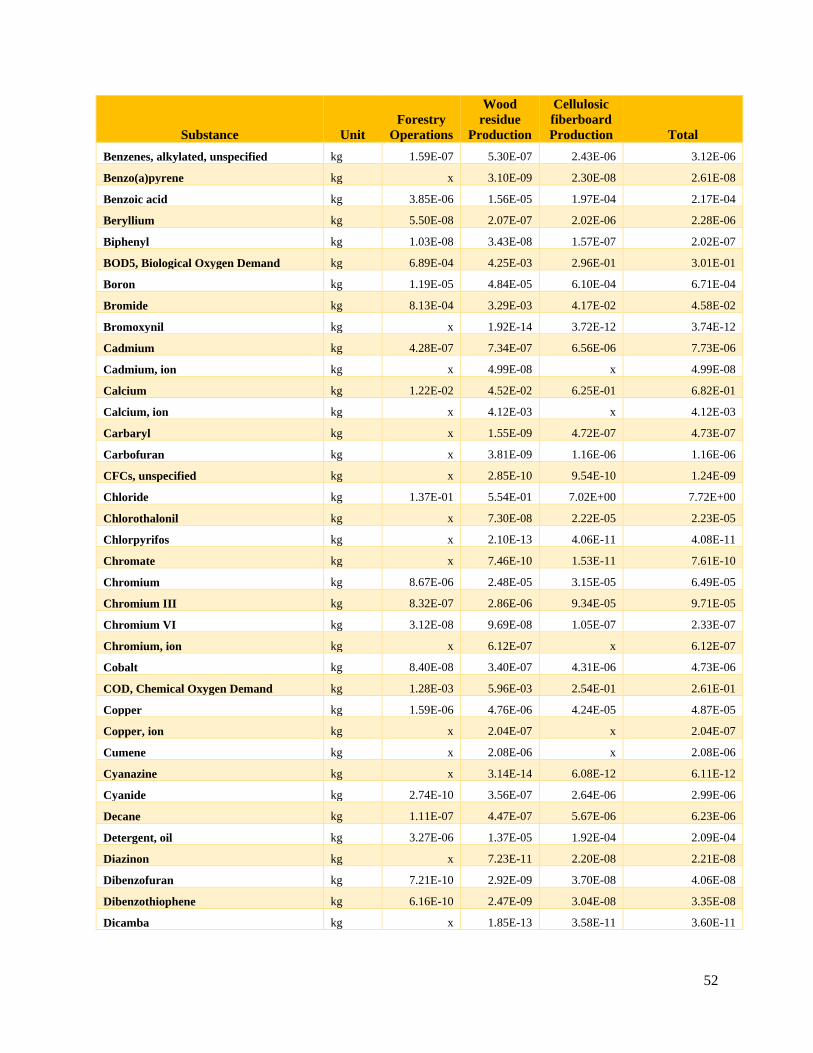
52
Substance Unit
Forestry
Operations
Wood
residue
Production
Cellulosic
fiberboard
Production Total
Benzenes, alkylated, unspecified kg 1.59E-07 5.30E-07 2.43E-06 3.12E-06
Benzo(a)pyrene kg x 3.10E-09 2.30E-08 2.61E-08
Benzoic acid kg 3.85E-06 1.56E-05 1.97E-04 2.17E-04
Beryllium kg 5.50E-08 2.07E-07 2.02E-06 2.28E-06
Biphenyl kg 1.03E-08 3.43E-08 1.57E-07 2.02E-07
BOD5, Biological Oxygen Demand kg 6.89E-04 4.25E-03 2.96E-01 3.01E-01
Boron kg 1.19E-05 4.84E-05 6.10E-04 6.71E-04
Bromide kg 8.13E-04 3.29E-03 4.17E-02 4.58E-02
Bromoxynil kg x 1.92E-14 3.72E-12 3.74E-12
Cadmium kg 4.28E-07 7.34E-07 6.56E-06 7.73E-06
Cadmium, ion kg x 4.99E-08 x 4.99E-08
Calcium kg 1.22E-02 4.52E-02 6.25E-01 6.82E-01
Calcium, ion kg x 4.12E-03 x 4.12E-03
Carbaryl kg x 1.55E-09 4.72E-07 4.73E-07
Carbofuran kg x 3.81E-09 1.16E-06 1.16E-06
CFCs, unspecified kg x 2.85E-10 9.54E-10 1.24E-09
Chloride kg 1.37E-01 5.54E-01 7.02E+00 7.72E+00
Chlorothalonil kg x 7.30E-08 2.22E-05 2.23E-05
Chlorpyrifos kg x 2.10E-13 4.06E-11 4.08E-11
Chromate kg x 7.46E-10 1.53E-11 7.61E-10
Chromium kg 8.67E-06 2.48E-05 3.15E-05 6.49E-05
Chromium III kg 8.32E-07 2.86E-06 9.34E-05 9.71E-05
Chromium VI kg 3.12E-08 9.69E-08 1.05E-07 2.33E-07
Chromium, ion kg x 6.12E-07 x 6.12E-07
Cobalt kg 8.40E-08 3.40E-07 4.31E-06 4.73E-06
COD, Chemical Oxygen Demand kg 1.28E-03 5.96E-03 2.54E-01 2.61E-01
Copper kg 1.59E-06 4.76E-06 4.24E-05 4.87E-05
Copper, ion kg x 2.04E-07 x 2.04E-07
Cumene kg x 2.08E-06 x 2.08E-06
Cyanazine kg x 3.14E-14 6.08E-12 6.11E-12
Cyanide kg 2.74E-10 3.56E-07 2.64E-06 2.99E-06
Decane kg 1.11E-07 4.47E-07 5.67E-06 6.23E-06
Detergent, oil kg 3.27E-06 1.37E-05 1.92E-04 2.09E-04
Diazinon kg x 7.23E-11 2.20E-08 2.21E-08
Dibenzofuran kg 7.21E-10 2.92E-09 3.70E-08 4.06E-08
Dibenzothiophene kg 6.16E-10 2.47E-09 3.04E-08 3.35E-08
Dicamba kg x 1.85E-13 3.58E-11 3.60E-11
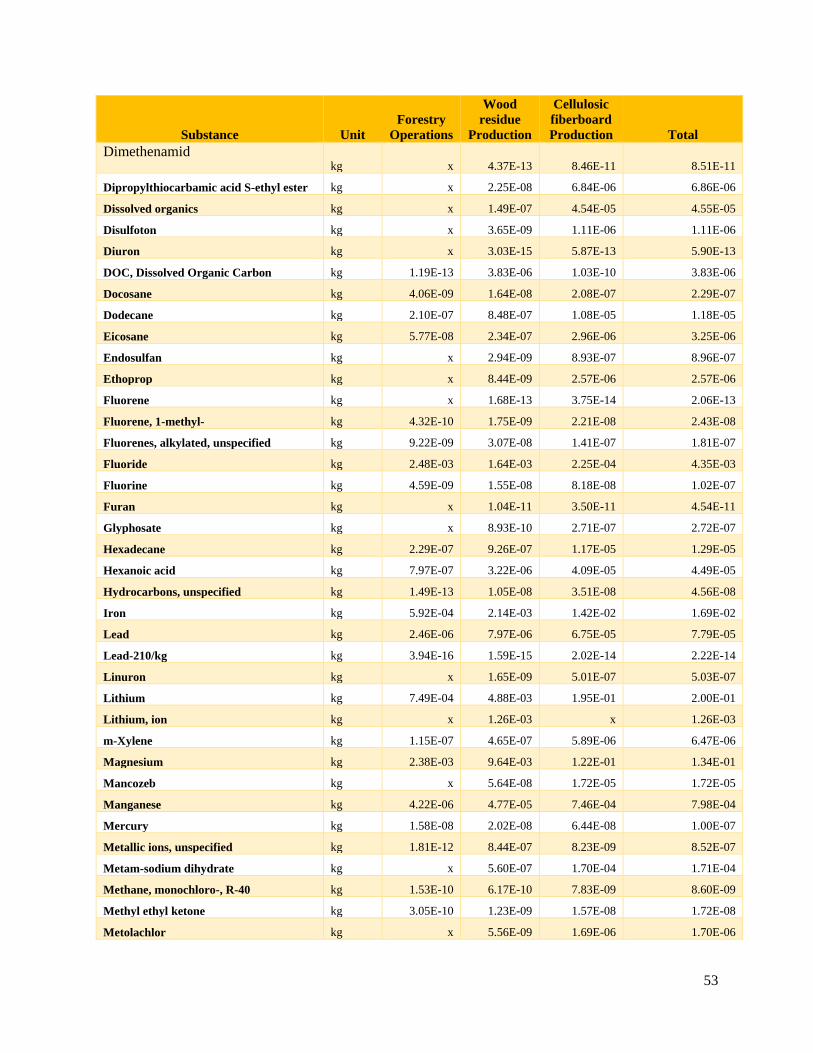
53
Substance Unit
Forestry
Operations
Wood
residue
Production
Cellulosic
fiberboard
Production Total
Dimethenamid kg x 4.37E-13 8.46E-11 8.51E-11
Dipropylthiocarbamic acid S-ethyl ester kg x 2.25E-08 6.84E-06 6.86E-06
Dissolved organics kg x 1.49E-07 4.54E-05 4.55E-05
Disulfoton kg x 3.65E-09 1.11E-06 1.11E-06
Diuron kg x 3.03E-15 5.87E-13 5.90E-13
DOC, Dissolved Organic Carbon kg 1.19E-13 3.83E-06 1.03E-10 3.83E-06
Docosane kg 4.06E-09 1.64E-08 2.08E-07 2.29E-07
Dodecane kg 2.10E-07 8.48E-07 1.08E-05 1.18E-05
Eicosane kg 5.77E-08 2.34E-07 2.96E-06 3.25E-06
Endosulfan kg x 2.94E-09 8.93E-07 8.96E-07
Ethoprop kg x 8.44E-09 2.57E-06 2.57E-06
Fluorene kg x 1.68E-13 3.75E-14 2.06E-13
Fluorene, 1-methyl- kg 4.32E-10 1.75E-09 2.21E-08 2.43E-08
Fluorenes, alkylated, unspecified kg 9.22E-09 3.07E-08 1.41E-07 1.81E-07
Fluoride kg 2.48E-03 1.64E-03 2.25E-04 4.35E-03
Fluorine kg 4.59E-09 1.55E-08 8.18E-08 1.02E-07
Furan kg x 1.04E-11 3.50E-11 4.54E-11
Glyphosate kg x 8.93E-10 2.71E-07 2.72E-07
Hexadecane kg 2.29E-07 9.26E-07 1.17E-05 1.29E-05
Hexanoic acid kg 7.97E-07 3.22E-06 4.09E-05 4.49E-05
Hydrocarbons, unspecified kg 1.49E-13 1.05E-08 3.51E-08 4.56E-08
Iron kg 5.92E-04 2.14E-03 1.42E-02 1.69E-02
Lead kg 2.46E-06 7.97E-06 6.75E-05 7.79E-05
Lead-210/kg kg 3.94E-16 1.59E-15 2.02E-14 2.22E-14
Linuron kg x 1.65E-09 5.01E-07 5.03E-07
Lithium kg 7.49E-04 4.88E-03 1.95E-01 2.00E-01
Lithium, ion kg x 1.26E-03 x 1.26E-03
m-Xylene kg 1.15E-07 4.65E-07 5.89E-06 6.47E-06
Magnesium kg 2.38E-03 9.64E-03 1.22E-01 1.34E-01
Mancozeb kg x 5.64E-08 1.72E-05 1.72E-05
Manganese kg 4.22E-06 4.77E-05 7.46E-04 7.98E-04
Mercury kg 1.58E-08 2.02E-08 6.44E-08 1.00E-07
Metallic ions, unspecified kg 1.81E-12 8.44E-07 8.23E-09 8.52E-07
Metam-sodium dihydrate kg x 5.60E-07 1.70E-04 1.71E-04
Methane, monochloro-, R-40 kg 1.53E-10 6.17E-10 7.83E-09 8.60E-09
Methyl ethyl ketone kg 3.05E-10 1.23E-09 1.57E-08 1.72E-08
Metolachlor kg x 5.56E-09 1.69E-06 1.70E-06
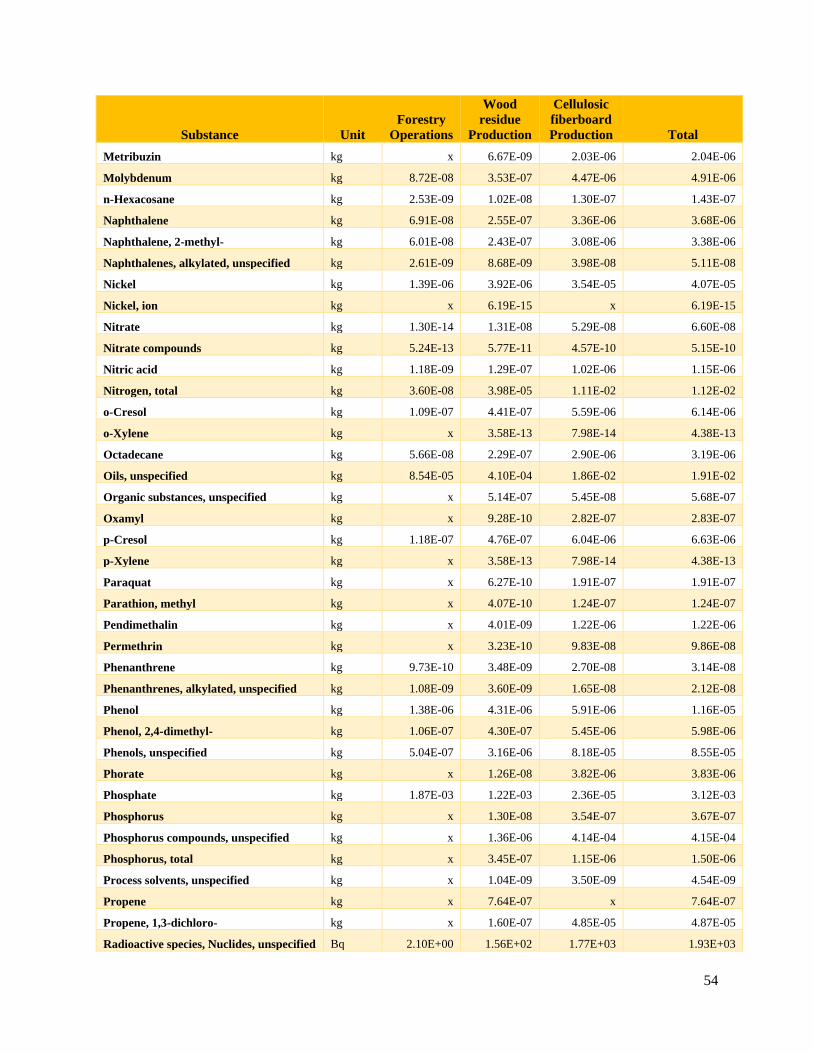
54
Substance Unit
Forestry
Operations
Wood
residue
Production
Cellulosic
fiberboard
Production Total
Metribuzin kg x 6.67E-09 2.03E-06 2.04E-06
Molybdenum kg 8.72E-08 3.53E-07 4.47E-06 4.91E-06
n-Hexacosane kg 2.53E-09 1.02E-08 1.30E-07 1.43E-07
Naphthalene kg 6.91E-08 2.55E-07 3.36E-06 3.68E-06
Naphthalene, 2-methyl- kg 6.01E-08 2.43E-07 3.08E-06 3.38E-06
Naphthalenes, alkylated, unspecified kg 2.61E-09 8.68E-09 3.98E-08 5.11E-08
Nickel kg 1.39E-06 3.92E-06 3.54E-05 4.07E-05
Nickel, ion kg x 6.19E-15 x 6.19E-15
Nitrate kg 1.30E-14 1.31E-08 5.29E-08 6.60E-08
Nitrate compounds kg 5.24E-13 5.77E-11 4.57E-10 5.15E-10
Nitric acid kg 1.18E-09 1.29E-07 1.02E-06 1.15E-06
Nitrogen, total kg 3.60E-08 3.98E-05 1.11E-02 1.12E-02
o-Cresol kg 1.09E-07 4.41E-07 5.59E-06 6.14E-06
o-Xylene kg x 3.58E-13 7.98E-14 4.38E-13
Octadecane kg 5.66E-08 2.29E-07 2.90E-06 3.19E-06
Oils, unspecified kg 8.54E-05 4.10E-04 1.86E-02 1.91E-02
Organic substances, unspecified kg x 5.14E-07 5.45E-08 5.68E-07
Oxamyl kg x 9.28E-10 2.82E-07 2.83E-07
p-Cresol kg 1.18E-07 4.76E-07 6.04E-06 6.63E-06
p-Xylene kg x 3.58E-13 7.98E-14 4.38E-13
Paraquat kg x 6.27E-10 1.91E-07 1.91E-07
Parathion, methyl kg x 4.07E-10 1.24E-07 1.24E-07
Pendimethalin kg x 4.01E-09 1.22E-06 1.22E-06
Permethrin kg x 3.23E-10 9.83E-08 9.86E-08
Phenanthrene kg 9.73E-10 3.48E-09 2.70E-08 3.14E-08
Phenanthrenes, alkylated, unspecified kg 1.08E-09 3.60E-09 1.65E-08 2.12E-08
Phenol kg 1.38E-06 4.31E-06 5.91E-06 1.16E-05
Phenol, 2,4-dimethyl- kg 1.06E-07 4.30E-07 5.45E-06 5.98E-06
Phenols, unspecified kg 5.04E-07 3.16E-06 8.18E-05 8.55E-05
Phorate kg x 1.26E-08 3.82E-06 3.83E-06
Phosphate kg 1.87E-03 1.22E-03 2.36E-05 3.12E-03
Phosphorus kg x 1.30E-08 3.54E-07 3.67E-07
Phosphorus compounds, unspecified kg x 1.36E-06 4.14E-04 4.15E-04
Phosphorus, total kg x 3.45E-07 1.15E-06 1.50E-06
Process solvents, unspecified kg x 1.04E-09 3.50E-09 4.54E-09
Propene kg x 7.64E-07 x 7.64E-07
Propene, 1,3-dichloro- kg x 1.60E-07 4.85E-05 4.87E-05
Radioactive species, Nuclides, unspecified Bq 2.10E+00 1.56E+02 1.77E+03 1.93E+03
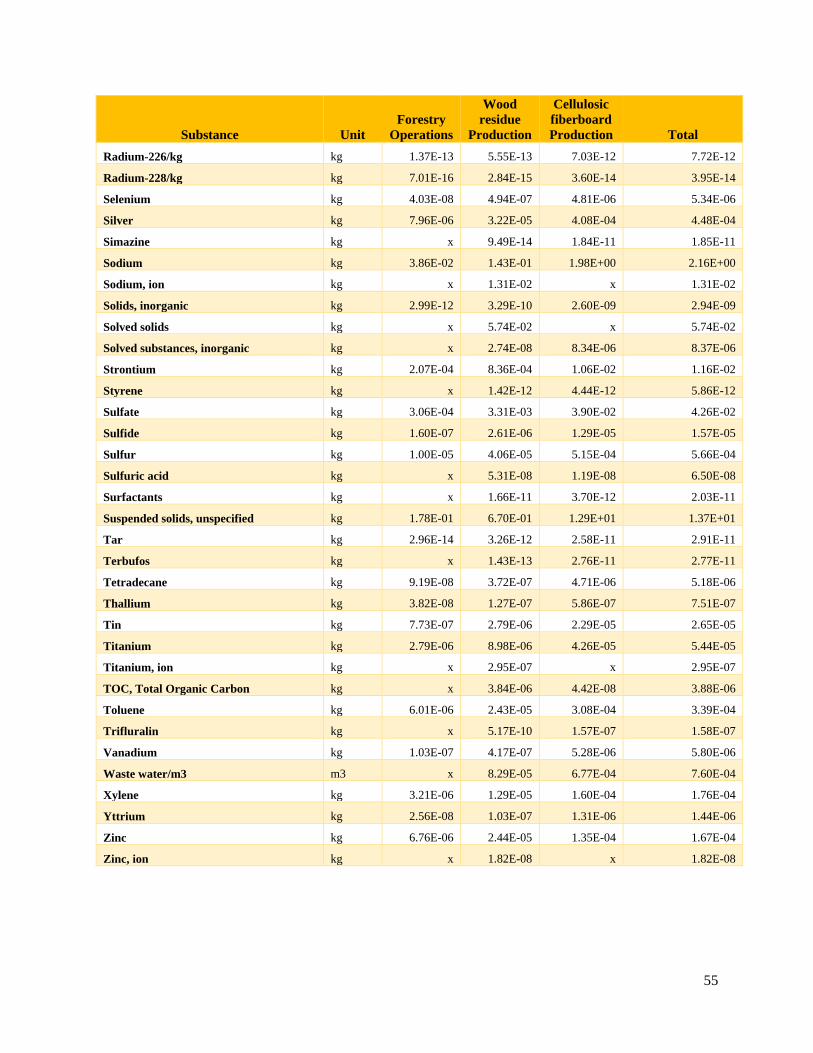
55
Substance Unit
Forestry
Operations
Wood
residue
Production
Cellulosic
fiberboard
Production Total
Radium-226/kg kg 1.37E-13 5.55E-13 7.03E-12 7.72E-12
Radium-228/kg kg 7.01E-16 2.84E-15 3.60E-14 3.95E-14
Selenium kg 4.03E-08 4.94E-07 4.81E-06 5.34E-06
Silver kg 7.96E-06 3.22E-05 4.08E-04 4.48E-04
Simazine kg x 9.49E-14 1.84E-11 1.85E-11
Sodium kg 3.86E-02 1.43E-01 1.98E+00 2.16E+00
Sodium, ion kg x 1.31E-02 x 1.31E-02
Solids, inorganic kg 2.99E-12 3.29E-10 2.60E-09 2.94E-09
Solved solids kg x 5.74E-02 x 5.74E-02
Solved substances, inorganic kg x 2.74E-08 8.34E-06 8.37E-06
Strontium kg 2.07E-04 8.36E-04 1.06E-02 1.16E-02
Styrene kg x 1.42E-12 4.44E-12 5.86E-12
Sulfate kg 3.06E-04 3.31E-03 3.90E-02 4.26E-02
Sulfide kg 1.60E-07 2.61E-06 1.29E-05 1.57E-05
Sulfur kg 1.00E-05 4.06E-05 5.15E-04 5.66E-04
Sulfuric acid kg x 5.31E-08 1.19E-08 6.50E-08
Surfactants kg x 1.66E-11 3.70E-12 2.03E-11
Suspended solids, unspecified kg 1.78E-01 6.70E-01 1.29E+01 1.37E+01
Tar kg 2.96E-14 3.26E-12 2.58E-11 2.91E-11
Terbufos kg x 1.43E-13 2.76E-11 2.77E-11
Tetradecane kg 9.19E-08 3.72E-07 4.71E-06 5.18E-06
Thallium kg 3.82E-08 1.27E-07 5.86E-07 7.51E-07
Tin kg 7.73E-07 2.79E-06 2.29E-05 2.65E-05
Titanium kg 2.79E-06 8.98E-06 4.26E-05 5.44E-05
Titanium, ion kg x 2.95E-07 x 2.95E-07
TOC, Total Organic Carbon kg x 3.84E-06 4.42E-08 3.88E-06
Toluene kg 6.01E-06 2.43E-05 3.08E-04 3.39E-04
Trifluralin kg x 5.17E-10 1.57E-07 1.58E-07
Vanadium kg 1.03E-07 4.17E-07 5.28E-06 5.80E-06
Waste water/m3 m3 x 8.29E-05 6.77E-04 7.60E-04
Xylene kg 3.21E-06 1.29E-05 1.60E-04 1.76E-04
Yttrium kg 2.56E-08 1.03E-07 1.31E-06 1.44E-06
Zinc kg 6.76E-06 2.44E-05 1.35E-04 1.67E-04
Zinc, ion kg x 1.82E-08 x 1.82E-08
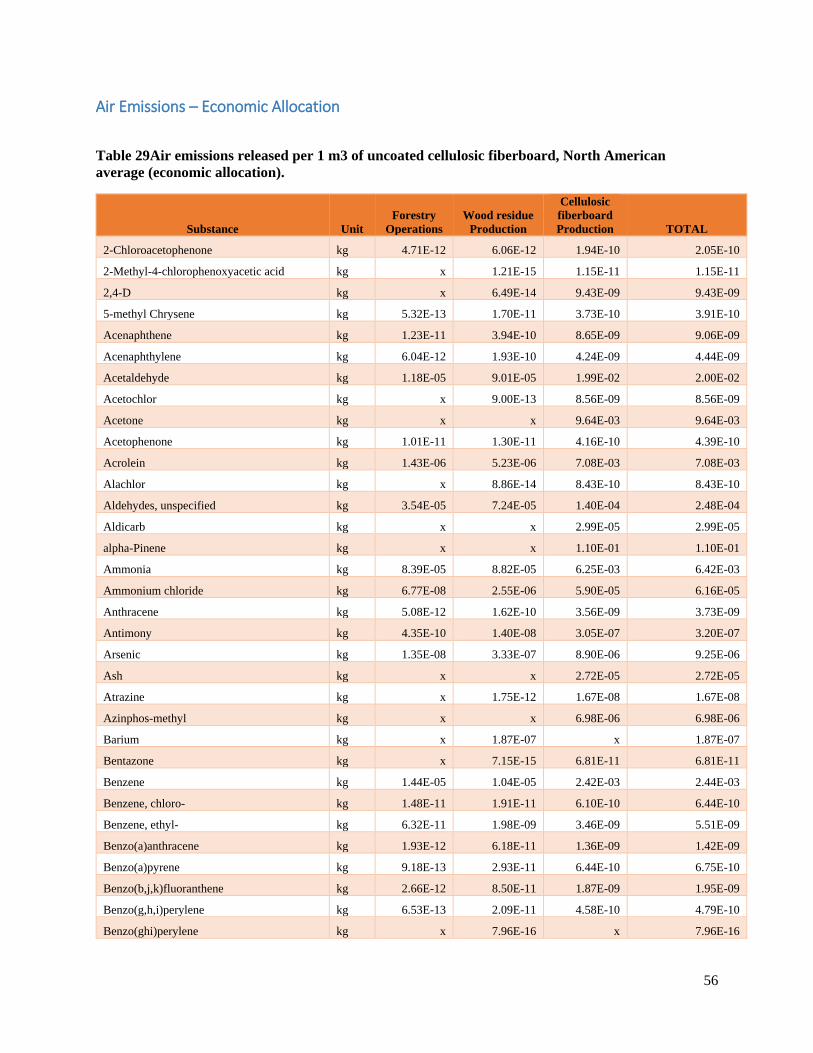
56
Air Emissions – Economic Allocation
Table 29Air emissions released per 1 m3 of uncoated cellulosic fiberboard, North American
average (economic allocation).
Substance Unit
Forestry
Operations
Wood residue
Production
Cellulosic
fiberboard
Production TOTAL
2-Chloroacetophenone kg 4.71E-12 6.06E-12 1.94E-10 2.05E-10
2-Methyl-4-chlorophenoxyacetic acid kg x 1.21E-15 1.15E-11 1.15E-11
2,4-D kg x 6.49E-14 9.43E-09 9.43E-09
5-methyl Chrysene kg 5.32E-13 1.70E-11 3.73E-10 3.91E-10
Acenaphthene kg 1.23E-11 3.94E-10 8.65E-09 9.06E-09
Acenaphthylene kg 6.04E-12 1.93E-10 4.24E-09 4.44E-09
Acetaldehyde kg 1.18E-05 9.01E-05 1.99E-02 2.00E-02
Acetochlor kg x 9.00E-13 8.56E-09 8.56E-09
Acetone kg x x 9.64E-03 9.64E-03
Acetophenone kg 1.01E-11 1.30E-11 4.16E-10 4.39E-10
Acrolein kg 1.43E-06 5.23E-06 7.08E-03 7.08E-03
Alachlor kg x 8.86E-14 8.43E-10 8.43E-10
Aldehydes, unspecified kg 3.54E-05 7.24E-05 1.40E-04 2.48E-04
Aldicarb kg x x 2.99E-05 2.99E-05
alpha-Pinene kg x x 1.10E-01 1.10E-01
Ammonia kg 8.39E-05 8.82E-05 6.25E-03 6.42E-03
Ammonium chloride kg 6.77E-08 2.55E-06 5.90E-05 6.16E-05
Anthracene kg 5.08E-12 1.62E-10 3.56E-09 3.73E-09
Antimony kg 4.35E-10 1.40E-08 3.05E-07 3.20E-07
Arsenic kg 1.35E-08 3.33E-07 8.90E-06 9.25E-06
Ash kg x x 2.72E-05 2.72E-05
Atrazine kg x 1.75E-12 1.67E-08 1.67E-08
Azinphos-methyl kg x x 6.98E-06 6.98E-06
Barium kg x 1.87E-07 x 1.87E-07
Bentazone kg x 7.15E-15 6.81E-11 6.81E-11
Benzene kg 1.44E-05 1.04E-05 2.42E-03 2.44E-03
Benzene, chloro- kg 1.48E-11 1.91E-11 6.10E-10 6.44E-10
Benzene, ethyl- kg 6.32E-11 1.98E-09 3.46E-09 5.51E-09
Benzo(a)anthracene kg 1.93E-12 6.18E-11 1.36E-09 1.42E-09
Benzo(a)pyrene kg 9.18E-13 2.93E-11 6.44E-10 6.75E-10
Benzo(b,j,k)fluoranthene kg 2.66E-12 8.50E-11 1.87E-09 1.95E-09
Benzo(g,h,i)perylene kg 6.53E-13 2.09E-11 4.58E-10 4.79E-10
Benzo(ghi)perylene kg x 7.96E-16 x 7.96E-16
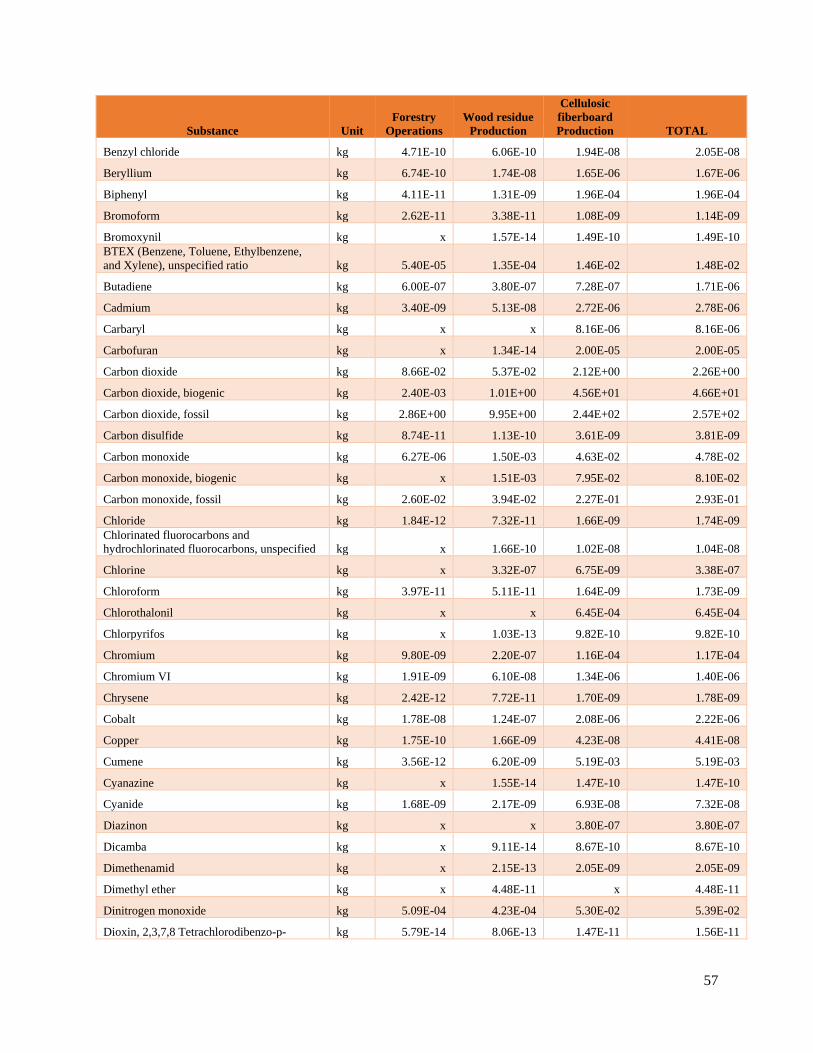
57
Substance Unit
Forestry
Operations
Wood residue
Production
Cellulosic
fiberboard
Production TOTAL
Benzyl chloride kg 4.71E-10 6.06E-10 1.94E-08 2.05E-08
Beryllium kg 6.74E-10 1.74E-08 1.65E-06 1.67E-06
Biphenyl kg 4.11E-11 1.31E-09 1.96E-04 1.96E-04
Bromoform kg 2.62E-11 3.38E-11 1.08E-09 1.14E-09
Bromoxynil kg x 1.57E-14 1.49E-10 1.49E-10
BTEX (Benzene, Toluene, Ethylbenzene,
and Xylene), unspecified ratio kg 5.40E-05 1.35E-04 1.46E-02 1.48E-02
Butadiene kg 6.00E-07 3.80E-07 7.28E-07 1.71E-06
Cadmium kg 3.40E-09 5.13E-08 2.72E-06 2.78E-06
Carbaryl kg x x 8.16E-06 8.16E-06
Carbofuran kg x 1.34E-14 2.00E-05 2.00E-05
Carbon dioxide kg 8.66E-02 5.37E-02 2.12E+00 2.26E+00
Carbon dioxide, biogenic kg 2.40E-03 1.01E+00 4.56E+01 4.66E+01
Carbon dioxide, fossil kg 2.86E+00 9.95E+00 2.44E+02 2.57E+02
Carbon disulfide kg 8.74E-11 1.13E-10 3.61E-09 3.81E-09
Carbon monoxide kg 6.27E-06 1.50E-03 4.63E-02 4.78E-02
Carbon monoxide, biogenic kg x 1.51E-03 7.95E-02 8.10E-02
Carbon monoxide, fossil kg 2.60E-02 3.94E-02 2.27E-01 2.93E-01
Chloride kg 1.84E-12 7.32E-11 1.66E-09 1.74E-09
Chlorinated fluorocarbons and
hydrochlorinated fluorocarbons, unspecified kg x 1.66E-10 1.02E-08 1.04E-08
Chlorine kg x 3.32E-07 6.75E-09 3.38E-07
Chloroform kg 3.97E-11 5.11E-11 1.64E-09 1.73E-09
Chlorothalonil kg x x 6.45E-04 6.45E-04
Chlorpyrifos kg x 1.03E-13 9.82E-10 9.82E-10
Chromium kg 9.80E-09 2.20E-07 1.16E-04 1.17E-04
Chromium VI kg 1.91E-09 6.10E-08 1.34E-06 1.40E-06
Chrysene kg 2.42E-12 7.72E-11 1.70E-09 1.78E-09
Cobalt kg 1.78E-08 1.24E-07 2.08E-06 2.22E-06
Copper kg 1.75E-10 1.66E-09 4.23E-08 4.41E-08
Cumene kg 3.56E-12 6.20E-09 5.19E-03 5.19E-03
Cyanazine kg x 1.55E-14 1.47E-10 1.47E-10
Cyanide kg 1.68E-09 2.17E-09 6.93E-08 7.32E-08
Diazinon kg x x 3.80E-07 3.80E-07
Dicamba kg x 9.11E-14 8.67E-10 8.67E-10
Dimethenamid kg x 2.15E-13 2.05E-09 2.05E-09
Dimethyl ether kg x 4.48E-11 x 4.48E-11
Dinitrogen monoxide kg 5.09E-04 4.23E-04 5.30E-02 5.39E-02
Dioxin, 2,3,7,8 Tetrachlorodibenzo-p- kg 5.79E-14 8.06E-13 1.47E-11 1.56E-11

58
Substance Unit
Forestry
Operations
Wood residue
Production
Cellulosic
fiberboard
Production TOTAL
Dioxins, measured as 2,3,7,8-
tetrachlorodibenzo-p-dioxin kg x 7.75E-17 x 7.75E-17
Dipropylthiocarbamic acid S-ethyl ester kg x 1.47E-13 1.98E-04 1.98E-04
Disulfoton kg x x 3.22E-05 3.22E-05
Endosulfan kg x x 1.54E-05 1.54E-05
Ethane, 1,1,1-trichloro-, HCFC-140 kg 9.52E-11 1.82E-10 8.40E-10 1.12E-09
Ethane, 1,2-dibromo- kg 8.07E-13 1.05E-12 3.33E-11 3.52E-11
Ethane, 1,2-dichloro- kg 2.69E-11 3.46E-11 1.11E-09 1.17E-09
Ethane, chloro- kg 2.82E-11 3.64E-11 1.16E-09 1.23E-09
Ethene, tetrachloro- kg 1.24E-09 3.39E-08 7.37E-07 7.72E-07
Ethene, trichloro- kg x 1.39E-11 1.72E-11 3.11E-11
Ethoprop kg x x 7.45E-05 7.45E-05
Ethylene oxide kg x 6.73E-10 1.98E-09 2.65E-09
Fluoranthene kg 1.72E-11 5.48E-10 1.20E-08 1.26E-08
Fluorene kg 2.20E-11 7.03E-10 1.54E-08 1.62E-08
Fluoride kg 1.01E-06 7.01E-07 2.59E-06 4.30E-06
Formaldehyde kg 1.83E-05 3.43E-05 1.69E-02 1.70E-02
Furan kg 1.07E-13 3.77E-12 8.40E-11 8.79E-11
Glyphosate kg x 1.93E-13 4.69E-06 4.69E-06
HAPs kg x 2.93E-06 1.55E-04 1.57E-04
HAPS, unspecified kg x 8.14E-07 x 8.14E-07
Heat, waste MJ x 1.70E-03 2.53E+01 2.53E+01
Hexane kg 4.50E-11 5.80E-11 1.86E-09 1.96E-09
Hydrazine, methyl- kg 1.14E-10 1.47E-10 4.72E-09 4.98E-09
Hydrocarbons, unspecified kg 3.91E-07 1.47E-05 1.28E-02 1.28E-02
Hydrogen kg x 8.59E-10 5.05E-08 5.14E-08
Hydrogen chloride kg 3.05E-05 9.34E-04 2.04E-02 2.14E-02
Hydrogen fluoride kg 3.59E-06 1.16E-04 1.03E-02 1.05E-02
Hydrogen sulfide kg 5.95E-14 2.37E-12 5.38E-11 5.62E-11
Indeno(1,2,3-cd)pyrene kg 1.47E-12 4.71E-11 1.03E-09 1.08E-09
Iron kg x 1.87E-07 x 1.87E-07
Isophorone kg 3.90E-10 5.02E-10 1.61E-08 1.70E-08
Isoprene kg 6.04E-05 2.40E-03 5.45E-02 5.70E-02
Kerosene kg 3.24E-08 1.22E-06 2.83E-05 2.95E-05
Lead kg 1.69E-08 4.87E-07 8.39E-05 8.44E-05
Limonene kg x x 7.63E-03 7.63E-03
Linuron kg x x 8.66E-06 8.66E-06
Magnesium kg 2.66E-07 8.50E-06 1.87E-04 1.95E-04
Mancozeb kg x x 4.98E-04 4.98E-04
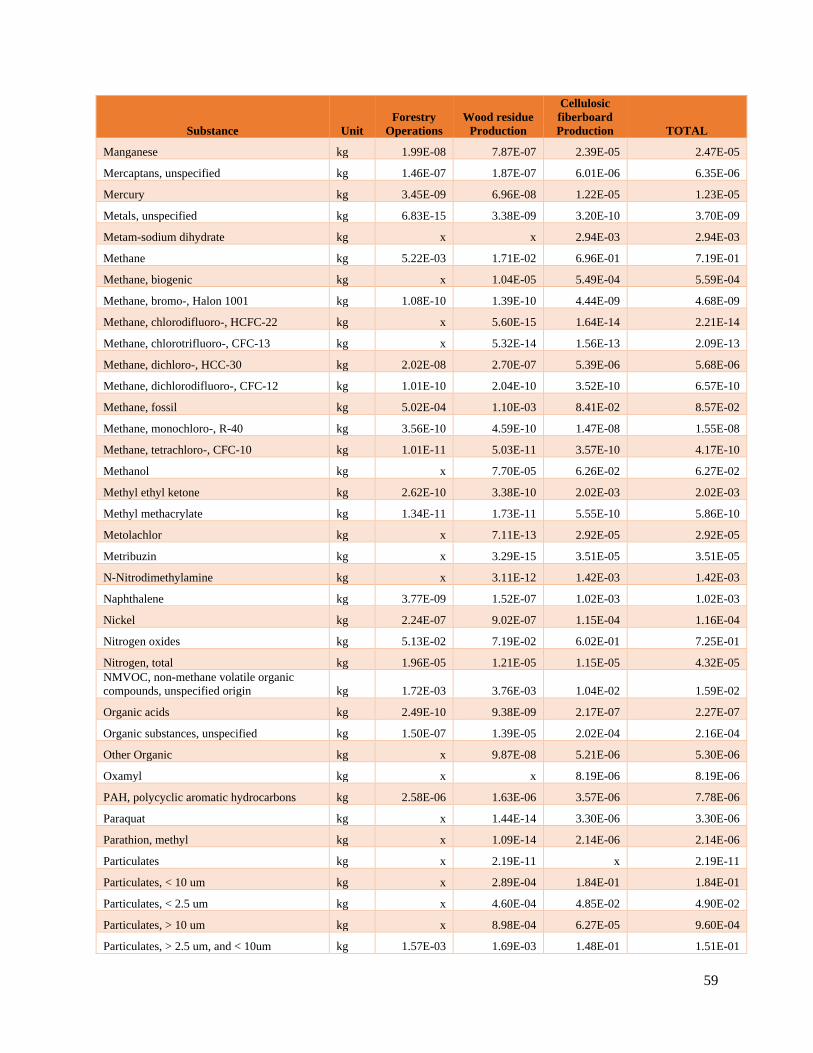
59
Substance Unit
Forestry
Operations
Wood residue
Production
Cellulosic
fiberboard
Production TOTAL
Manganese kg 1.99E-08 7.87E-07 2.39E-05 2.47E-05
Mercaptans, unspecified kg 1.46E-07 1.87E-07 6.01E-06 6.35E-06
Mercury kg 3.45E-09 6.96E-08 1.22E-05 1.23E-05
Metals, unspecified kg 6.83E-15 3.38E-09 3.20E-10 3.70E-09
Metam-sodium dihydrate kg x x 2.94E-03 2.94E-03
Methane kg 5.22E-03 1.71E-02 6.96E-01 7.19E-01
Methane, biogenic kg x 1.04E-05 5.49E-04 5.59E-04
Methane, bromo-, Halon 1001 kg 1.08E-10 1.39E-10 4.44E-09 4.68E-09
Methane, chlorodifluoro-, HCFC-22 kg x 5.60E-15 1.64E-14 2.21E-14
Methane, chlorotrifluoro-, CFC-13 kg x 5.32E-14 1.56E-13 2.09E-13
Methane, dichloro-, HCC-30 kg 2.02E-08 2.70E-07 5.39E-06 5.68E-06
Methane, dichlorodifluoro-, CFC-12 kg 1.01E-10 2.04E-10 3.52E-10 6.57E-10
Methane, fossil kg 5.02E-04 1.10E-03 8.41E-02 8.57E-02
Methane, monochloro-, R-40 kg 3.56E-10 4.59E-10 1.47E-08 1.55E-08
Methane, tetrachloro-, CFC-10 kg 1.01E-11 5.03E-11 3.57E-10 4.17E-10
Methanol kg x 7.70E-05 6.26E-02 6.27E-02
Methyl ethyl ketone kg 2.62E-10 3.38E-10 2.02E-03 2.02E-03
Methyl methacrylate kg 1.34E-11 1.73E-11 5.55E-10 5.86E-10
Metolachlor kg x 7.11E-13 2.92E-05 2.92E-05
Metribuzin kg x 3.29E-15 3.51E-05 3.51E-05
N-Nitrodimethylamine kg x 3.11E-12 1.42E-03 1.42E-03
Naphthalene kg 3.77E-09 1.52E-07 1.02E-03 1.02E-03
Nickel kg 2.24E-07 9.02E-07 1.15E-04 1.16E-04
Nitrogen oxides kg 5.13E-02 7.19E-02 6.02E-01 7.25E-01
Nitrogen, total kg 1.96E-05 1.21E-05 1.15E-05 4.32E-05
NMVOC, non-methane volatile organic
compounds, unspecified origin kg 1.72E-03 3.76E-03 1.04E-02 1.59E-02
Organic acids kg 2.49E-10 9.38E-09 2.17E-07 2.27E-07
Organic substances, unspecified kg 1.50E-07 1.39E-05 2.02E-04 2.16E-04
Other Organic kg x 9.87E-08 5.21E-06 5.30E-06
Oxamyl kg x x 8.19E-06 8.19E-06
PAH, polycyclic aromatic hydrocarbons kg 2.58E-06 1.63E-06 3.57E-06 7.78E-06
Paraquat kg x 1.44E-14 3.30E-06 3.30E-06
Parathion, methyl kg x 1.09E-14 2.14E-06 2.14E-06
Particulates kg x 2.19E-11 x 2.19E-11
Particulates, < 10 um kg x 2.89E-04 1.84E-01 1.84E-01
Particulates, < 2.5 um kg x 4.60E-04 4.85E-02 4.90E-02
Particulates, > 10 um kg x 8.98E-04 6.27E-05 9.60E-04
Particulates, > 2.5 um, and < 10um kg 1.57E-03 1.69E-03 1.48E-01 1.51E-01
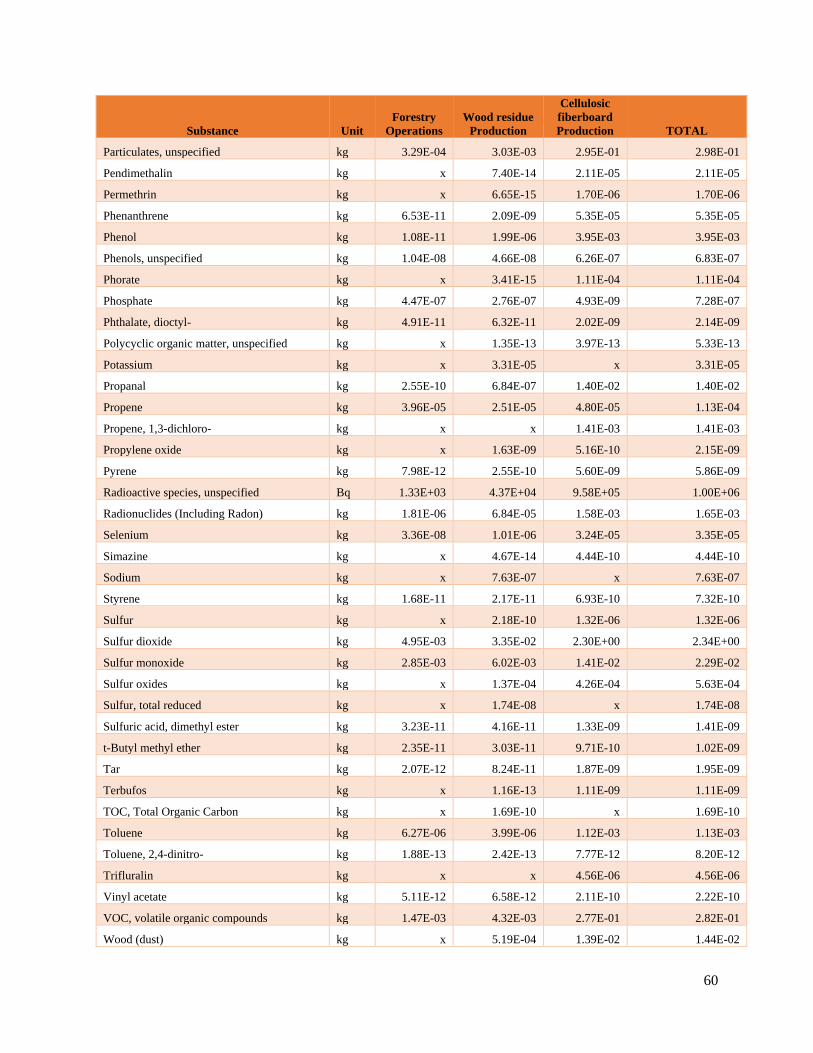
60
Substance Unit
Forestry
Operations
Wood residue
Production
Cellulosic
fiberboard
Production TOTAL
Particulates, unspecified kg 3.29E-04 3.03E-03 2.95E-01 2.98E-01
Pendimethalin kg x 7.40E-14 2.11E-05 2.11E-05
Permethrin kg x 6.65E-15 1.70E-06 1.70E-06
Phenanthrene kg 6.53E-11 2.09E-09 5.35E-05 5.35E-05
Phenol kg 1.08E-11 1.99E-06 3.95E-03 3.95E-03
Phenols, unspecified kg 1.04E-08 4.66E-08 6.26E-07 6.83E-07
Phorate kg x 3.41E-15 1.11E-04 1.11E-04
Phosphate kg 4.47E-07 2.76E-07 4.93E-09 7.28E-07
Phthalate, dioctyl- kg 4.91E-11 6.32E-11 2.02E-09 2.14E-09
Polycyclic organic matter, unspecified kg x 1.35E-13 3.97E-13 5.33E-13
Potassium kg x 3.31E-05 x 3.31E-05
Propanal kg 2.55E-10 6.84E-07 1.40E-02 1.40E-02
Propene kg 3.96E-05 2.51E-05 4.80E-05 1.13E-04
Propene, 1,3-dichloro- kg x x 1.41E-03 1.41E-03
Propylene oxide kg x 1.63E-09 5.16E-10 2.15E-09
Pyrene kg 7.98E-12 2.55E-10 5.60E-09 5.86E-09
Radioactive species, unspecified Bq 1.33E+03 4.37E+04 9.58E+05 1.00E+06
Radionuclides (Including Radon) kg 1.81E-06 6.84E-05 1.58E-03 1.65E-03
Selenium kg 3.36E-08 1.01E-06 3.24E-05 3.35E-05
Simazine kg x 4.67E-14 4.44E-10 4.44E-10
Sodium kg x 7.63E-07 x 7.63E-07
Styrene kg 1.68E-11 2.17E-11 6.93E-10 7.32E-10
Sulfur kg x 2.18E-10 1.32E-06 1.32E-06
Sulfur dioxide kg 4.95E-03 3.35E-02 2.30E+00 2.34E+00
Sulfur monoxide kg 2.85E-03 6.02E-03 1.41E-02 2.29E-02
Sulfur oxides kg x 1.37E-04 4.26E-04 5.63E-04
Sulfur, total reduced kg x 1.74E-08 x 1.74E-08
Sulfuric acid, dimethyl ester kg 3.23E-11 4.16E-11 1.33E-09 1.41E-09
t-Butyl methyl ether kg 2.35E-11 3.03E-11 9.71E-10 1.02E-09
Tar kg 2.07E-12 8.24E-11 1.87E-09 1.95E-09
Terbufos kg x 1.16E-13 1.11E-09 1.11E-09
TOC, Total Organic Carbon kg x 1.69E-10 x 1.69E-10
Toluene kg 6.27E-06 3.99E-06 1.12E-03 1.13E-03
Toluene, 2,4-dinitro- kg 1.88E-13 2.42E-13 7.77E-12 8.20E-12
Trifluralin kg x x 4.56E-06 4.56E-06
Vinyl acetate kg 5.11E-12 6.58E-12 2.11E-10 2.22E-10
VOC, volatile organic compounds kg 1.47E-03 4.32E-03 2.77E-01 2.82E-01
Wood (dust) kg x 5.19E-04 1.39E-02 1.44E-02

61
Substance Unit
Forestry
Operations
Wood residue
Production
Cellulosic
fiberboard
Production TOTAL
Xylene kg 4.37E-06 2.78E-06 5.31E-06 1.25E-05
Zinc kg 3.61E-07 4.11E-07 2.96E-07 1.07E-06
Water Emissions – Economic Allocation
Table 30 Water emissions released per 1 m3 of uncoated cellulosic fiberboard, North American
average (economic allocation).
Substance Unit
Forestry
Operations
Wood
Residue
Production
Cellulosic
Fiberboard
Production Total
2-Hexanone kg 2.48E-08 5.21E-08 1.32E-06 1.39E-06
2-Methyl-4-chlorophenoxyacetic acid kg x 5.19E-17 4.94E-13 4.94E-13
2-Propanol kg x 1.63E-11 9.89E-10 1.01E-09
2,4-D kg x 2.78E-15 5.55E-10 5.55E-10
4-Methyl-2-pentanone kg 1.59E-08 3.36E-08 8.47E-07 8.97E-07
Acetaldehyde kg x 7.09E-10 2.08E-09 2.79E-09
Acetochlor kg x 3.86E-14 3.67E-10 3.67E-10
Acetone kg 3.79E-08 7.98E-08 2.02E-06 2.13E-06
Acid as H+ kg x x 7.35E-05 7.35E-05
Acidity, unspecified kg x 4.54E-12 3.09E-13 4.84E-12
Acids, unspecified kg 3.87E-11 9.38E-09 6.12E-07 6.21E-07
Alachlor kg x 3.80E-15 3.61E-11 3.61E-11
Aldicarb kg x x 1.79E-06 1.79E-06
Aluminium kg 2.91E-04 6.12E-04 5.15E-03 6.06E-03
Aluminum kg x 6.59E-08 x 6.59E-08
Ammonia kg 6.76E-05 1.42E-04 2.60E-03 2.81E-03
Ammonia, as N kg 1.94E-11 7.73E-10 1.75E-08 1.83E-08
Ammonium, ion kg 1.45E-08 7.62E-07 -1.15E-05 -1.07E-05
Antimony kg 1.81E-07 3.70E-07 2.88E-06 3.43E-06
Arsenic kg 1.85E-06 2.65E-06 4.57E-05 5.02E-05
Arsenic, ion kg x 1.54E-11 x 1.54E-11
Atrazine kg x 7.51E-14 7.15E-10 7.15E-10
Azinphos-methyl kg x x 4.19E-07 4.19E-07
Barium kg 4.00E-03 8.16E-03 7.02E-02 8.24E-02
Bentazone kg x 3.07E-16 2.92E-12 2.92E-12
Benzene kg 6.36E-06 1.34E-05 3.38E-04 3.58E-04
Benzene, 1-methyl-4-(1-methylethyl)- kg 3.79E-10 7.98E-10 2.01E-08 2.13E-08
Benzene, ethyl- kg 3.58E-07 7.54E-07 1.90E-05 2.01E-05
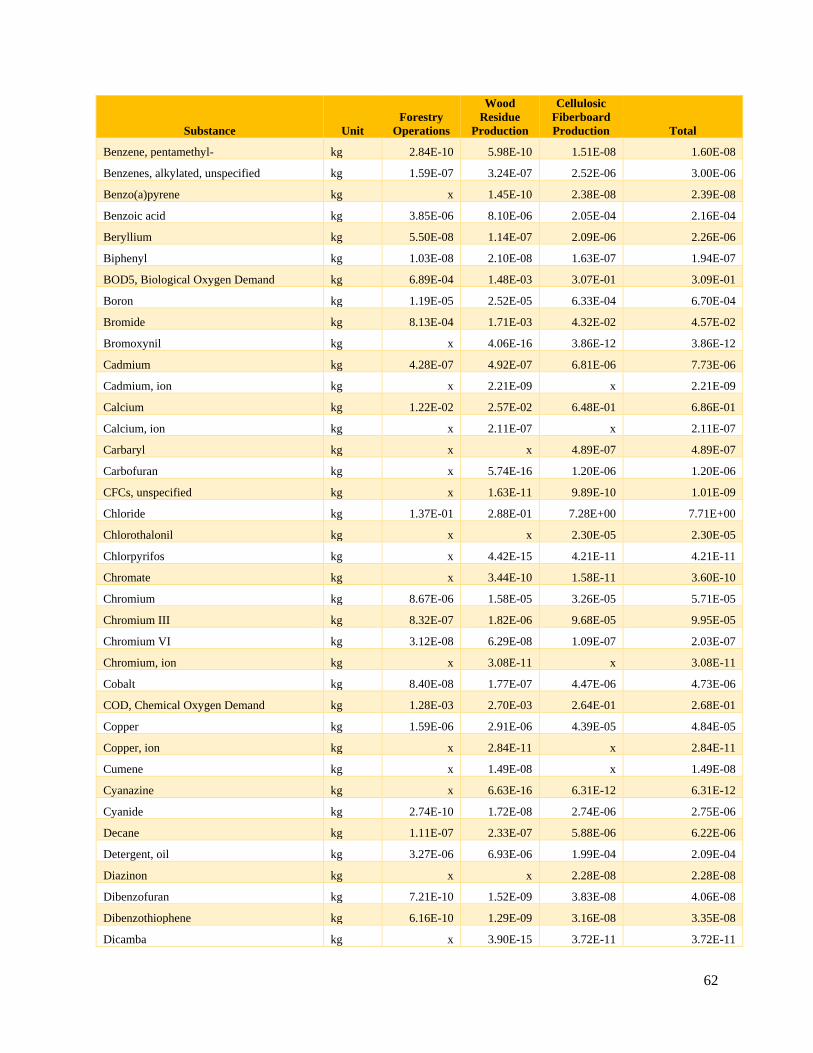
62
Substance Unit
Forestry
Operations
Wood
Residue
Production
Cellulosic
Fiberboard
Production Total
Benzene, pentamethyl- kg 2.84E-10 5.98E-10 1.51E-08 1.60E-08
Benzenes, alkylated, unspecified kg 1.59E-07 3.24E-07 2.52E-06 3.00E-06
Benzo(a)pyrene kg x 1.45E-10 2.38E-08 2.39E-08
Benzoic acid kg 3.85E-06 8.10E-06 2.05E-04 2.16E-04
Beryllium kg 5.50E-08 1.14E-07 2.09E-06 2.26E-06
Biphenyl kg 1.03E-08 2.10E-08 1.63E-07 1.94E-07
BOD5, Biological Oxygen Demand kg 6.89E-04 1.48E-03 3.07E-01 3.09E-01
Boron kg 1.19E-05 2.52E-05 6.33E-04 6.70E-04
Bromide kg 8.13E-04 1.71E-03 4.32E-02 4.57E-02
Bromoxynil kg x 4.06E-16 3.86E-12 3.86E-12
Cadmium kg 4.28E-07 4.92E-07 6.81E-06 7.73E-06
Cadmium, ion kg x 2.21E-09 x 2.21E-09
Calcium kg 1.22E-02 2.57E-02 6.48E-01 6.86E-01
Calcium, ion kg x 2.11E-07 x 2.11E-07
Carbaryl kg x x 4.89E-07 4.89E-07
Carbofuran kg x 5.74E-16 1.20E-06 1.20E-06
CFCs, unspecified kg x 1.63E-11 9.89E-10 1.01E-09
Chloride kg 1.37E-01 2.88E-01 7.28E+00 7.71E+00
Chlorothalonil kg x x 2.30E-05 2.30E-05
Chlorpyrifos kg x 4.42E-15 4.21E-11 4.21E-11
Chromate kg x 3.44E-10 1.58E-11 3.60E-10
Chromium kg 8.67E-06 1.58E-05 3.26E-05 5.71E-05
Chromium III kg 8.32E-07 1.82E-06 9.68E-05 9.95E-05
Chromium VI kg 3.12E-08 6.29E-08 1.09E-07 2.03E-07
Chromium, ion kg x 3.08E-11 x 3.08E-11
Cobalt kg 8.40E-08 1.77E-07 4.47E-06 4.73E-06
COD, Chemical Oxygen Demand kg 1.28E-03 2.70E-03 2.64E-01 2.68E-01
Copper kg 1.59E-06 2.91E-06 4.39E-05 4.84E-05
Copper, ion kg x 2.84E-11 x 2.84E-11
Cumene kg x 1.49E-08 x 1.49E-08
Cyanazine kg x 6.63E-16 6.31E-12 6.31E-12
Cyanide kg 2.74E-10 1.72E-08 2.74E-06 2.75E-06
Decane kg 1.11E-07 2.33E-07 5.88E-06 6.22E-06
Detergent, oil kg 3.27E-06 6.93E-06 1.99E-04 2.09E-04
Diazinon kg x x 2.28E-08 2.28E-08
Dibenzofuran kg 7.21E-10 1.52E-09 3.83E-08 4.06E-08
Dibenzothiophene kg 6.16E-10 1.29E-09 3.16E-08 3.35E-08
Dicamba kg x 3.90E-15 3.72E-11 3.72E-11

63
Substance Unit
Forestry
Operations
Wood
Residue
Production
Cellulosic
Fiberboard
Production Total
Dimethenamid kg x 9.22E-15 8.78E-11 8.78E-11
Dipropylthiocarbamic acid S-ethyl ester kg x 3.81E-15 7.09E-06 7.09E-06
Dissolved organics kg x x 4.70E-05 4.70E-05
Disulfoton kg x 2.28E-16 1.15E-06 1.15E-06
Diuron kg x 6.39E-17 6.08E-13 6.08E-13
DOC, Dissolved Organic Carbon kg 1.19E-13 2.74E-08 1.07E-10 2.75E-08
Docosane kg 4.06E-09 8.54E-09 2.16E-07 2.28E-07
Dodecane kg 2.10E-07 4.42E-07 1.12E-05 1.18E-05
Eicosane kg 5.77E-08 1.22E-07 3.07E-06 3.25E-06
Endosulfan kg x x 9.26E-07 9.26E-07
Ethoprop kg x x 2.66E-06 2.66E-06
Fluorene kg x 1.33E-14 3.89E-14 5.22E-14
Fluorene, 1-methyl- kg 4.32E-10 9.09E-10 2.29E-08 2.43E-08
Fluorenes, alkylated, unspecified kg 9.22E-09 1.88E-08 1.46E-07 1.74E-07
Fluoride kg 2.48E-03 1.55E-03 2.34E-04 4.26E-03
Fluorine kg 4.59E-09 9.37E-09 8.48E-08 9.87E-08
Furan kg x 5.99E-13 3.63E-11 3.69E-11
Glyphosate kg x 8.29E-15 2.81E-07 2.81E-07
Hexadecane kg 2.29E-07 4.82E-07 1.22E-05 1.29E-05
Hexanoic acid kg 7.97E-07 1.68E-06 4.24E-05 4.48E-05
Hydrocarbons, unspecified kg 1.49E-13 6.05E-10 3.64E-08 3.70E-08
Iron kg 5.92E-04 1.26E-03 1.47E-02 1.66E-02
Lead kg 2.46E-06 4.56E-06 6.99E-05 7.70E-05
Lead-210/kg kg 3.94E-16 8.30E-16 2.10E-14 2.22E-14
Linuron kg x x 5.20E-07 5.20E-07
Lithium kg 7.49E-04 1.87E-03 2.02E-01 2.04E-01
Lithium, ion kg x 6.32E-08 x 6.32E-08
m-Xylene kg 1.15E-07 2.42E-07 6.11E-06 6.47E-06
Magnesium kg 2.38E-03 5.02E-03 1.27E-01 1.34E-01
Mancozeb kg x x 1.78E-05 1.78E-05
Manganese kg 4.22E-06 2.29E-05 7.74E-04 8.01E-04
Mercury kg 1.58E-08 1.50E-08 6.68E-08 9.75E-08
Metallic ions, unspecified kg 1.81E-12 9.71E-08 8.53E-09 1.06E-07
Metam-sodium dihydrate kg x x 1.76E-04 1.76E-04
Methane, monochloro-, R-40 kg 1.53E-10 3.21E-10 8.12E-09 8.59E-09
Methyl ethyl ketone kg 3.05E-10 6.43E-10 1.62E-08 1.72E-08
Metolachlor kg x 3.05E-14 1.75E-06 1.75E-06
Metribuzin kg x 1.41E-16 2.10E-06 2.10E-06

64
Substance Unit
Forestry
Operations
Wood
Residue
Production
Cellulosic
Fiberboard
Production Total
Molybdenum kg 8.72E-08 1.84E-07 4.64E-06 4.91E-06
n-Hexacosane kg 2.53E-09 5.33E-09 1.35E-07 1.42E-07
Naphthalene kg 6.91E-08 1.44E-07 3.48E-06 3.69E-06
Naphthalene, 2-methyl- kg 6.01E-08 1.26E-07 3.19E-06 3.38E-06
Naphthalenes, alkylated, unspecified kg 2.61E-09 5.31E-09 4.13E-08 4.92E-08
Nickel kg 1.39E-06 2.28E-06 3.67E-05 4.03E-05
Nickel, ion kg x 3.59E-16 x 3.59E-16
Nitrate kg 1.30E-14 9.15E-10 5.49E-08 5.58E-08
Nitrate compounds kg 5.24E-13 2.08E-11 4.73E-10 4.95E-10
Nitric acid kg 1.18E-09 4.68E-08 1.06E-06 1.11E-06
Nitrogen, total kg 3.60E-08 1.39E-06 1.15E-02 1.15E-02
o-Cresol kg 1.09E-07 2.30E-07 5.80E-06 6.14E-06
o-Xylene kg x 2.82E-14 8.28E-14 1.11E-13
Octadecane kg 5.66E-08 1.19E-07 3.01E-06 3.18E-06
Oils, unspecified kg 8.54E-05 1.83E-04 1.92E-02 1.95E-02
Organic substances, unspecified kg x 1.56E-07 5.65E-08 2.13E-07
Oxamyl kg x x 2.92E-07 2.92E-07
p-Cresol kg 1.18E-07 2.48E-07 6.26E-06 6.62E-06
p-Xylene kg x 2.82E-14 8.28E-14 1.11E-13
Paraquat kg x 6.17E-16 1.98E-07 1.98E-07
Parathion, methyl kg x 4.66E-16 1.28E-07 1.28E-07
Pendimethalin kg x 3.17E-15 1.26E-06 1.26E-06
Permethrin kg x 2.85E-16 1.02E-07 1.02E-07
Phenanthrene kg 9.73E-10 2.00E-09 2.80E-08 3.10E-08
Phenanthrenes, alkylated, unspecified kg 1.08E-09 2.20E-09 1.71E-08 2.04E-08
Phenol kg 1.38E-06 2.78E-06 6.13E-06 1.03E-05
Phenol, 2,4-dimethyl- kg 1.06E-07 2.24E-07 5.65E-06 5.98E-06
Phenols, unspecified kg 5.04E-07 1.17E-06 8.48E-05 8.65E-05
Phorate kg x 8.81E-17 3.96E-06 3.96E-06
Phosphate kg 1.87E-03 1.16E-03 2.44E-05 3.05E-03
Phosphorus kg x 6.12E-10 3.67E-07 3.67E-07
Phosphorus compounds, unspecified kg x 1.63E-12 4.29E-04 4.29E-04
Phosphorus, total kg x 1.98E-08 1.20E-06 1.22E-06
Process solvents, unspecified kg x 5.99E-11 3.63E-09 3.69E-09
Propene kg x 5.48E-09 x 5.48E-09
Propene, 1,3-dichloro- kg x x 5.03E-05 5.03E-05
Radioactive species, Nuclides, unspecified Bq 2.10E+00 7.93E+01 1.83E+03 1.91E+03
Radium-226/kg kg 1.37E-13 2.89E-13 7.29E-12 7.71E-12

65
Substance Unit
Forestry
Operations
Wood
Residue
Production
Cellulosic
Fiberboard
Production Total
Radium-228/kg kg 7.01E-16 1.48E-15 3.73E-14 3.95E-14
Selenium kg 4.03E-08 2.63E-07 4.98E-06 5.29E-06
Silver kg 7.96E-06 1.68E-05 4.23E-04 4.47E-04
Simazine kg x 2.00E-15 1.90E-11 1.90E-11
Sodium kg 3.86E-02 8.13E-02 2.05E+00 2.17E+00
Sodium, ion kg x 6.68E-07 x 6.68E-07
Solids, inorganic kg 2.99E-12 1.19E-10 2.70E-09 2.82E-09
Solved solids kg x 5.46E-05 x 5.46E-05
Solved substances, inorganic kg x x 8.65E-06 8.65E-06
Strontium kg 2.07E-04 4.35E-04 1.10E-02 1.16E-02
Styrene kg x 8.16E-14 4.60E-12 4.68E-12
Sulfate kg 3.06E-04 1.69E-03 4.04E-02 4.24E-02
Sulfide kg 1.60E-07 4.33E-07 1.34E-05 1.40E-05
Sulfur kg 1.00E-05 2.12E-05 5.34E-04 5.65E-04
Sulfuric acid kg x 2.33E-08 1.23E-08 3.56E-08
Surfactants kg x 1.30E-12 3.83E-12 5.14E-12
Suspended solids, unspecified kg 1.78E-01 3.74E-01 1.33E+01 1.39E+01
Tar kg 2.96E-14 1.18E-12 2.68E-11 2.80E-11
Terbufos kg x 3.01E-15 2.86E-11 2.86E-11
Tetradecane kg 9.19E-08 1.94E-07 4.89E-06 5.17E-06
Thallium kg 3.82E-08 7.79E-08 6.08E-07 7.24E-07
Tin kg 7.73E-07 1.60E-06 2.38E-05 2.61E-05
Titanium kg 2.79E-06 5.68E-06 4.42E-05 5.27E-05
Titanium, ion kg x 1.59E-11 x 1.59E-11
TOC, Total Organic Carbon kg x 2.82E-08 4.59E-08 7.41E-08
Toluene kg 6.01E-06 1.27E-05 3.20E-04 3.38E-04
Trifluralin kg x x 1.63E-07 1.63E-07
Vanadium kg 1.03E-07 2.17E-07 5.48E-06 5.80E-06
Waste water/m3 m3 x 4.67E-06 7.02E-04 7.07E-04
Xylene kg 3.21E-06 6.75E-06 1.66E-04 1.76E-04
Yttrium kg 2.56E-08 5.38E-08 1.36E-06 1.44E-06
Zinc kg 6.76E-06 1.46E-05 1.40E-04 1.62E-04
Zinc, ion kg x 1.72E-09 x 1.72E-09

66
Appendix C – Substance Contribution Analysis
Table 31. Substance contribution analysis to Global Warming Potential (kg CO2 eq.) by life cycle
stage total percent basis and values are displayed.
Mass Allocation Economic Allocation
Substances
Compartment
type TOTAL
Forestry
Operations
Wood
residue
production
Cellulosic
fiberboard
production TOTAL
Forestry
Operations
Wood
residue
production
Cellulosic
fiberboard
production
Total of all compartments 100.00% 3.24 21.03 271.22 100.00% 3.24 10.63 281.23
Carbon dioxide, fossil (CO2 ) Air 87.94% 2.94 19.77 237.16 87.73% 2.94 10.04 245.91
Methane (CH4) Air 6.78% 0.14 1.05 18.83 6.82% 0.14 0.47 19.52
Dinitrogen monoxide (N2O) Air 5.28% 0.15 0.21 15.23 5.45% 0.15 0.12 15.80
Remaining substances Air 0.00% 0.00 0.00 0.00 0.00% 0.00 0.00 0.00
Table 32. Substance contribution1/ analysis to Acidification (kg SO2 eq.) by life cycle stage total
percent basis and values are displayed.
Mass Allocation Economic Allocation
Substances
Compartment
type TOTAL
Forestry
Operations
Wood
residue
production
Cellulosic
fiberboard
production TOTAL
Forestry
Operations
Wood
residue
production
Cellulosic
fiberboard
production
Total of all compartments 100.00% 0.0420 0.1782 2.6554 100.00% 0.044 0.092 2.786
Sulfur dioxide Air 79.31% 0.0050 0.0867 2.2214 80.22% 0.005 0.035 2.303
Nitrogen oxides Air 18.15% 0.0359 0.0869 0.4064 17.35% 0.036 0.049 0.421
Ammonia Air 0.41% 0.0002 0.0005 0.0113 0.41% 0.000 0.000 0.01
Remaining substances Air 2.13% 0.0010 0.0041 0.0162 2.02% 0.003 0.007 0.05
Table 33. Substance contribution analysis to Eutrophication (kg N eq.) by life cycle stage total
percent basis and values are displayed.
Mass Allocation Economic Allocation
Substances
Compartment
type TOTAL
Forestry
Operations
Wood
residue
production
Cellulosic
fiberboard
production TOTAL
Forestry
Operations
Wood
residue
production
Cellulosic
fiberboard
production
Total of all compartments 100.00% 0.011 0.013 0.086 100.00% 0.007 0.006 0.058
Nitrogen oxides air 46.51% 0.007 0.009 0.056 45.16% 0.002 0.003 0.027
Ammonia air 1.05% 0.000 0.000 0.001 1.07% 0.000 0.000 0.001
BOD5, Biological Oxygen
Demand water 20.91% 0.000 0.000 0.015 21.78% 0.000 0.000 0.015
COD, Chemical Oxygen
Demand water 18.16% 0.000 0.000 0.013 18.84% 0.000 0.000 0.013
Phosphate water 10.31% 0.004 0.003 0.000 10.05% 0.004 0.003 0.000
Ammonia water 3.07% 0.000 0.000 0.002 3.09% 0.000 0.000 0.002
Other substances 0.00% 0.000 0.000 0.000 0.01% 0.000 0.000 0.000
Puettmann M, Bergman R, Oneil E. 2016a. Cradle-to-gate life-cycle assessment of cellulosic fiberboard produced in North America. CORRIM Final Report. University of Washington. Seattle, WA. January 2016. 66 p.
Related Documents